the Creative Commons Attribution 4.0 License.
the Creative Commons Attribution 4.0 License.
 | 03 Feb 2023
Chemical and dynamical identification of emission outflows during the HALO campaign EMeRGe in Europe and Asia
Eric Förster
Marco Neumaier
Florian Obersteiner
Andreas Zahn
Andreas Hilboll
Anna B. Kalisz Hedegaard
Nikos Daskalakis
Alexandros Panagiotis Poulidis
Mihalis Vrekoussis
Michael Lichtenstern
Peter Braesicke
The number of large urban agglomerations is steadily increasing worldwide. At a local scale, their emissions lead to air pollution, directly affecting people's health. On a global scale, their emissions lead to an increase of greenhouse gases, affecting climate. In this context, in 2017 and 2018, the airborne campaign EMeRGe (Effect of Megacities on the transport and transformation of pollutants on the Regional to Global scales) investigated emissions of European and Asian major population centres (MPCs) to improve the understanding and predictability of pollution outflows. Here, we present two methods to identify and characterise pollution outflows probed during EMeRGe. First, we use a set of volatile organic compounds (VOCs) as chemical tracers to characterise air masses by specific source signals, i.e. benzene from anthropogenic pollution of targeted regions, acetonitrile from biomass burning (BB, primarily during EMeRGe-Asia), and isoprene from fresh biogenic signals (primarily during EMeRGe-Europe. Second, we attribute probed air masses to source regions and estimate their individual contribution by constructing and applying a simple emission uptake scheme for the boundary layer which combines FLEXTRA back trajectories and EDGAR carbon monoxide (CO) emission rates (acronyms are provided in the Appendix). During EMeRGe-Europe, we identified anthropogenic pollution outflows from northern Italy, southern Great Britain, the Belgium–Netherlands–Ruhr (BNR) area and the Iberian Peninsula. Additionally, our uptake scheme indicates significant long-range transport of pollution from the USA and Canada. During EMeRGe-Asia, the pollution outflow is dominated by sources in China and Taiwan, but BB signals from Southeast Asia and India contribute as well. Outflows of pre-selected MPC targets are identified in less than 20 % of the sampling time, due to restrictions in flight planning and constraints of the measurement platform itself. Still, EMeRGe combines in a unique way near- and far-field measurements, which show signatures of local and distant sources, transport and conversion fingerprints, and complex air mass compositions. Our approach provides a valuable classification and characterisation of the EMeRGe dataset, e.g. for BB and anthropogenic influence of potential source regions and paves the way for a more comprehensive analysis and various model studies.
- Article
(7056 KB) - Full-text XML
-
Supplement
(1503 KB) - BibTeX
- EndNote


Since the industrial revolution, the human population has strongly increased from ∼1 to ∼7.7 billion people in 2019 and is predicted to increase to around 10 billion by 2050 (Klein Goldewijk et al., 2017; United Nations, 2019). Cities have always been centres of attraction, and since 2007 more people live in urban than in rural areas (United Nations, 2018). Today, the largest urban agglomerations exceed more than 10 million inhabitants and are often referred to as megacities (Baklanov et al., 2016; Folberth et al., 2015; Molina and Molina, 2004). The majority of megacities are still growing in population and dimension (United Nations, 2018) and have even started merging to form gigacities (Kulmala et al., 2021). According to a study by Folberth et al. (2012), 26 existing megacities (status 2012) alone were responsible for 12 % of the world's total annual CO2 emissions (7 % for CH4 emissions). In addition, significant fractions of global emissions of air pollutants like NOx (4.6 %), SO2 (5.3 %), black carbon (3.8 %) and VOCs (4.8 %) are emitted from these 26 megacities.
In general, large urban agglomerations are considerable sources of long-lived greenhouse gases and short-lived pollutants and influence the atmosphere from local to global scales, strongly affecting air quality and climate (Baklanov et al., 2016; Zhu et al., 2012). Monitoring of emissions (and thus better quantifying pollution outflows of those areas) is required for environmental policies and strategies to improve air quality and also to refine and assess future climate projections. Previous megacity projects focused e.g. on emissions of Mexico City in 2006 (MILAGRO, Molina et al., 2010) and Paris in 2009–2010 (MEGAPOLI, Baklanov et al., 2010), as well as urban agglomerations in the eastern Mediterranean, the Po Valley, the Benelux area and the Pearl River Delta from 2008–2011 (CityZen, https://cordis.europa.eu/project/id/212095, last access: 13 January 2023).
Existing knowledge gaps regarding megacity impacts on atmospheric composition involve inadequate characterisation and prediction of pollution events and associated spatial patterns and their extent. In this respect, especially the interaction of anthropogenic emissions with natural and biogenic emissions around urban agglomerations and further downwind is poorly understood (Andrés Hernández et al., 2022 and references therein).
The international megacity campaign EMeRGe (Andrés Hernández et al. (2022), http://www.iup.uni-bremen.de/emerge/home/home.html, last access: 13 January 2023) investigates local, regional and inter-regional pollution transport originating from major population centres (MPCs) and their effect on atmospheric chemistry and dynamics in Europe and Asia. During EMeRGe, dedicated airborne measurements with an extensive set of instruments were performed with the German High Altitude and LOng Range Research Aircraft (HALO, http://www.halo-spp.de/, last access: 13 January 2023) in July 2017 in Europe and in March and April 2018 in Asia. Compared to previous campaigns, the HALO flights cover large areas with the goal to probe pollution outflows from multiple MPCs and to study their fate (transport, chemical processing) in the sparsely in situ probed domain between local and global scales. For a detailed description and the aims of the EMeRGe campaign, we refer to Andrés Hernández et al. (2022). Hereafter, we will use the term MPC to describe not only megacities with more than 10 million inhabitants but also metropolitan areas or converging urban conurbations with more than four million inhabitants (e.g. the metropolitan area of Rome or Madrid).
Within the long-range/large-scale measurement approach of EMeRGe, not all detected trace gas enhancements necessarily originate from a single target MPC; other source regions could have contributed partly or even exclusively. These contributions may come from nearby or have been transported over long distances and are likely already chemically processed or diluted with background air. Thus, the challenge is to identify and subsequently to attribute pollution signatures in outflows, their contributing source regions and specific emission sources, as well as the assessment of their transport and chemical processing.
Here, we present a straightforward chemical and dynamical identification of probed pollution outflows in terms of (potential) sources and source regions. For the chemical identification of source signatures, we apply a multi-tracer approach that is based on the detection of different volatile organic compounds (VOCs) with a variety of atmospheric lifetimes (Atkinson, 2000) that are emitted by different anthropogenic and biogenic sources (de Gouw and Warneke, 2007). This “multi-tracer multi-lifetime approach” enables us to characterise air masses in relation to source contributions and the stage of processing. Such an analysis is advantageous compared to the conventional approach of using a single tracer like carbon monoxide (CO) with its rather long lifetime (∼2 months) and multiple sources (anthropogenic and biomass burning).
This multi-tracer approach allows us to identify and distinguish source signatures of biomass burning (BB), as well as anthropogenic and biogenic origin. This is done based on concentration enhancements of different VOCs relative to their concentrations in background air. For the dynamical identification of source regions, we link back trajectories of the Lagrangian FLEXible TRAjectory model FLEXTRA (Stohl et al., 1995, 2005; Stohl and Seibert, 1998) and the Emissions Database for Global Atmospheric Research (EDGAR, https://data.jrc.ec.europa.eu/collection/edgar, last access: 13 January 2023) to attribute anthropogenic CO emissions to (likely) source regions and estimate their contribution to the probed air masses.
The joint use of both identification methods (measured VOC enhancements and inventory-based back trajectories) allows the analysis and characterisation of pollution fingerprints of the target MPCs and adjacent source regions. Within our work, we focus on the following open questions:
- a.
Which MPCs and regions have contributed with their emissions to the EMeRGe measurements?
- b.
Which VOC-specific source signatures are characteristic for the sampled target regions; in particular, what are the differences between Europe and Asia?
- c.
How well does our multi-tracer approach work, and what are its limitations?
- d.
Which recommendations for future megacity campaigns can we derive from the results?
In Sect. 2, we briefly describe the general observation strategy of EMeRGe. Section 3 explains our analysis methods, that is, the identification of (a) source signatures by chemical VOC tracers and (b) air mass origins with the use of a model-based approach where we inject specific amounts of CO into modelled air masses (based on the EDGAR emission inventory and FLEXTRA back trajectories) that arrive at our measurement locations. In Sect. 4, we present our results and close in Sect. 5 with a summary and conclusions.
EMeRGe comprises 21 research flights (for detailed flight information, see Table S1 in the Supplement) conducted with the German research aircraft HALO to probe polluted and photochemically processed air masses at different altitudes and different distances downwind of European and Asian urban areas, with additional local ground-based and global satellite measurements (Hernández et al., 2022). In general, localised (intensive) trace gas emissions of urban areas rapidly increase corresponding volume mixing ratios (VMRs) in affected air masses. Chemical conversion and dilution can attenuate such emission-driven enhancements of tracer volume mixing ratios in a given air mass. However, in most cases emission impacts can be clearly detected by measuring relative enhancements of volume mixing ratios, and here we will refer to such enhancements as pollution (events).
To cover different types of areas with respect to population size, density and state of economic development, EMeRGe consists of two parts. In the first part, HALO performed seven research flights with 52 flight hours over Europe in July 2017 (EMeRGe-Europe) to investigate the urban area outflows of Madrid, Barcelona, London, Paris, Belgium–Netherlands–Ruhr (BNR), Po Valley, Rome and the region of Munich (where HALO is stationed). Favourable meteorological conditions for photochemical processing under strong solar insolation influence prevailed in southern Europe during the campaign period. Thus, heatwaves and fire events occurred there, whereas the passage of frontal systems accompanied by thunderstorms influenced only the northernmost flights. For more details, see Hernández et al. (2022).
In the second part of EMeRGe, HALO performed 12 research flights (plus two European transfer flights) with 110 flight hours in March and April 2018 over Asia (EMeRGe-Asia) with its growing number of large megacities. HALO was stationed at Tainan airport (Taiwan) to investigate the outflows of Taipei, Taiwan, Manila, mainland China, and south Japan. Spring is an inter-monsoon period with (a) elevated levels of dust and biomass burning (BB) and thus characterised by mixing of different emission sources and their photochemical processing and (b) storm and frontal systems which lead to a maximal outflow of the Asian continent to the Pacific Ocean (Cheng et al., 2014; Liu et al., 2003).
The overarching measurement approach of EMeRGe was to sample various kinds of air mass compositions on different scales, that is, recently emitted pollution in the near field (some 100 km downstream) of targeted source regions, as well as processed, transported, and aged pollution compositions in their far field (>500 km downstream). This concept is reflected by the chosen flight altitudes shown in Fig. 1a, indicating that 65 % of measurements are performed below altitudes of 3000 m with expected near-field pollution source signatures and 35 % at higher altitudes with expected far-field signatures. The last contact of sampled air masses to the planetary boundary layer (PBL, retrieved from ERA5 (fifth-generation ECMWF reanalysis)) in Fig. 1b shows that 20 % of the measurements took place inside the PBL, 35 % had last contact with the PBL within 10 d and 45 % more than 10 d, both in Europe and in Asia.
Inside the PBL, enhanced levels of pollutants originate mostly from recent emissions of distinct sources. In this early stage, pollution plumes are still attributable to point sources. Here it should be noted that we use the term “plume” only for small-scale trace gas enhancements (e.g. from a factory or a local fire); for enhancements of larger spatial extent (comprising e.g. various pollution plumes) we use the term polluted air mass. Polluted air masses leaving the PBL quickly start to mix with free tropospheric air of different origin and chemical age, i.e. chemically old or clean background air and air that is rich in decayed or diluted pollution of other sources. During further transport, short-lived trace species will degrade (chemical transformation of timescales of up to days), whereas long-lived species may be distributed on large scales (transported, stirred and mixed on timescales starting from hours to many days) and finally “become” background air.
The EMeRGe measurements cover these different transport, chemical ageing and mixing stages. Appropriate tools are necessary to disentangle, characterise and attribute probed air masses to source regions and identify relevant factors that determined the resulting composition. At this point, we want to emphasise that due to the explicit pollution hunting of specific source regions, there is an inherent sampling bias towards air masses of those regions.
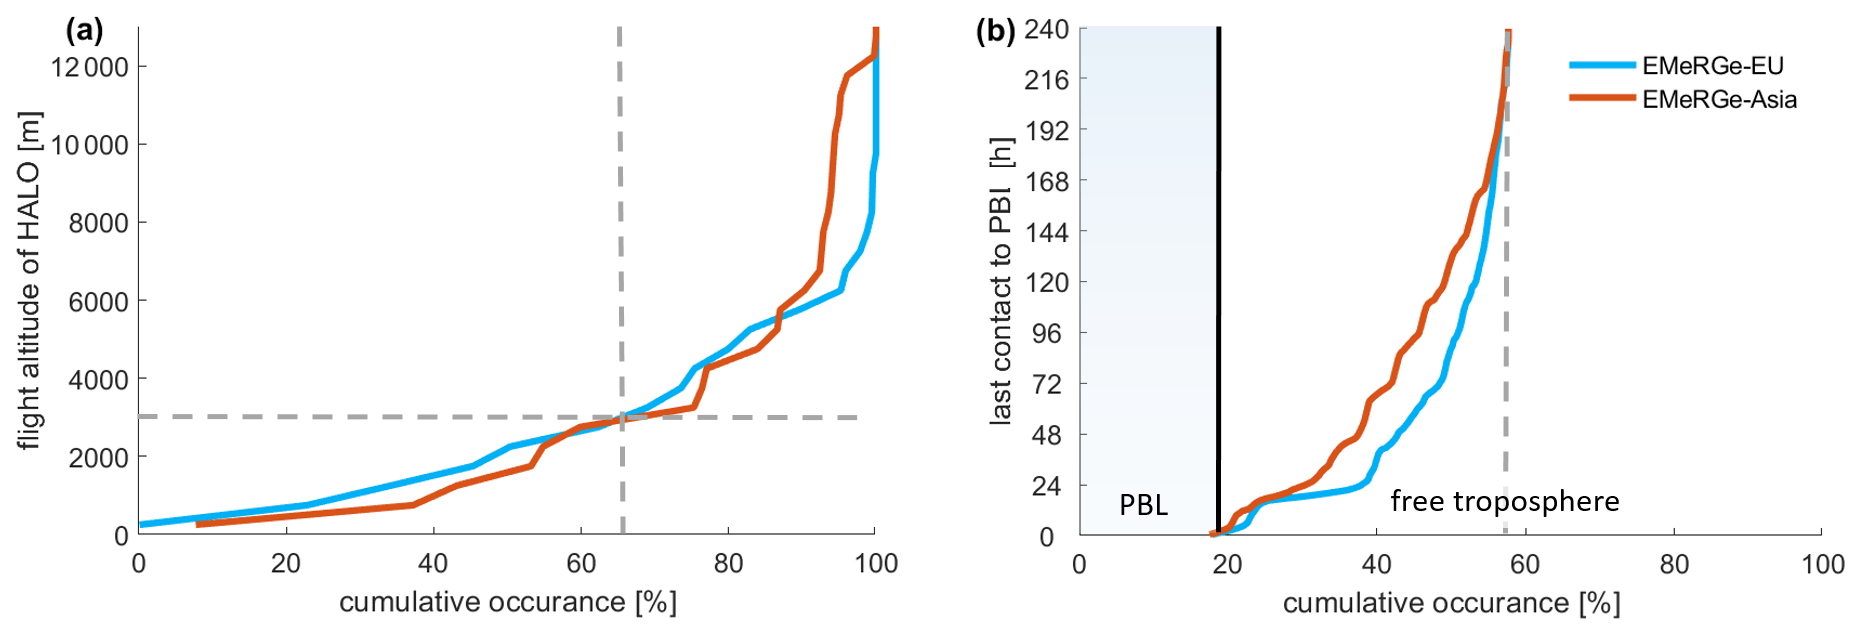
Figure 1(a) Cumulative occurrences of HALO flight altitudes during EMeRGe and (b) last contact of probed air masses to planetary boundary layer (PBL) air, based on 10 d FLEXTRA back trajectories and ERA5 meteorological data.
3.1 Identification of source signatures by chemical tracers
For source signature identification, we use source-specific chemical tracers from our set of VOC measurements. First, we outline the measurement technique and the identification method by concentration enhancements above defined thresholds.
3.1.1 VOC measurements by PTR-MS
The technique of proton-transfer-reaction mass spectrometry (PTR-MS) was developed by Werner Lindinger and co-workers (Lindinger et al., 1998; Lindinger and Jordan, 1998) at the University of Innsbruck (Austria). In brief, an ion source produces hydronium (H3O+) reagent ions from pure water vapour in a hollow cathode discharge. The H3O+ ions react with trace gases in the sample air within a drift tube (reaction chamber). Proton transfer takes place if the proton affinity of the target VOC is higher than that of H2O (691 kJ mol−1, NIST Chemistry WebBook, 2022). VOCH+ and reagent ions are analysed in a quadrupole mass spectrometer (QMS) or via time-of-flight measurements (ToF). Normalised VOCH+ H3O+ signals are converted to VMRs by calibration with external gas standards or estimated based on known proton transfer reaction rate constants. The instrumental background (e.g. from impurities in the system) is usually determined by a catalytic converter and subtracted from measurement signals (de Gouw et al., 2003a). For a comprehensive description of the technique the reader is referred to de Gouw and Warneke (2007) and Yuan et al. (2017).
Globally, the vast majority of VOCs in the atmosphere are emitted by biogenic sources (Guenther et al., 1995; Sindelarova et al., 2014), thus from vegetation or biomass fires (Ciccioli et al., 2014). However, the regions with the largest biogenic emissions are the rain forests in South America and Africa. In the Northern Hemisphere, biogenic VOCs are only emitted during the vegetation phase with overall smaller emission rates (Guenther et al., 1995). Accordingly, recent urban measurements indicate that anthropogenic emissions account for about half of the VOC flux into the atmosphere of the Northern Hemisphere (Karl et al., 2018). Inside urban agglomerations, anthropogenic VOC emissions will even dominate (Amodio et al., 2013). Additionally, the degradation of VOCs and other trace gases leads to secondary production of further VOCs, e.g. formaldehyde (de Gouw et al., 2009). Degradation of VOCs is mostly due to the reaction with hydroxyl radicals (OH) and by photolysis (both occur during daytime), as well as the reaction with NO3 radicals (in nighttime). The combination and reactivity of these photochemical oxidation processes depend on the atmospheric conditions and on the chemical properties of the VOCs itself, which is why they possess a variety of lifetimes from hours to months (Atkinson, 2000).
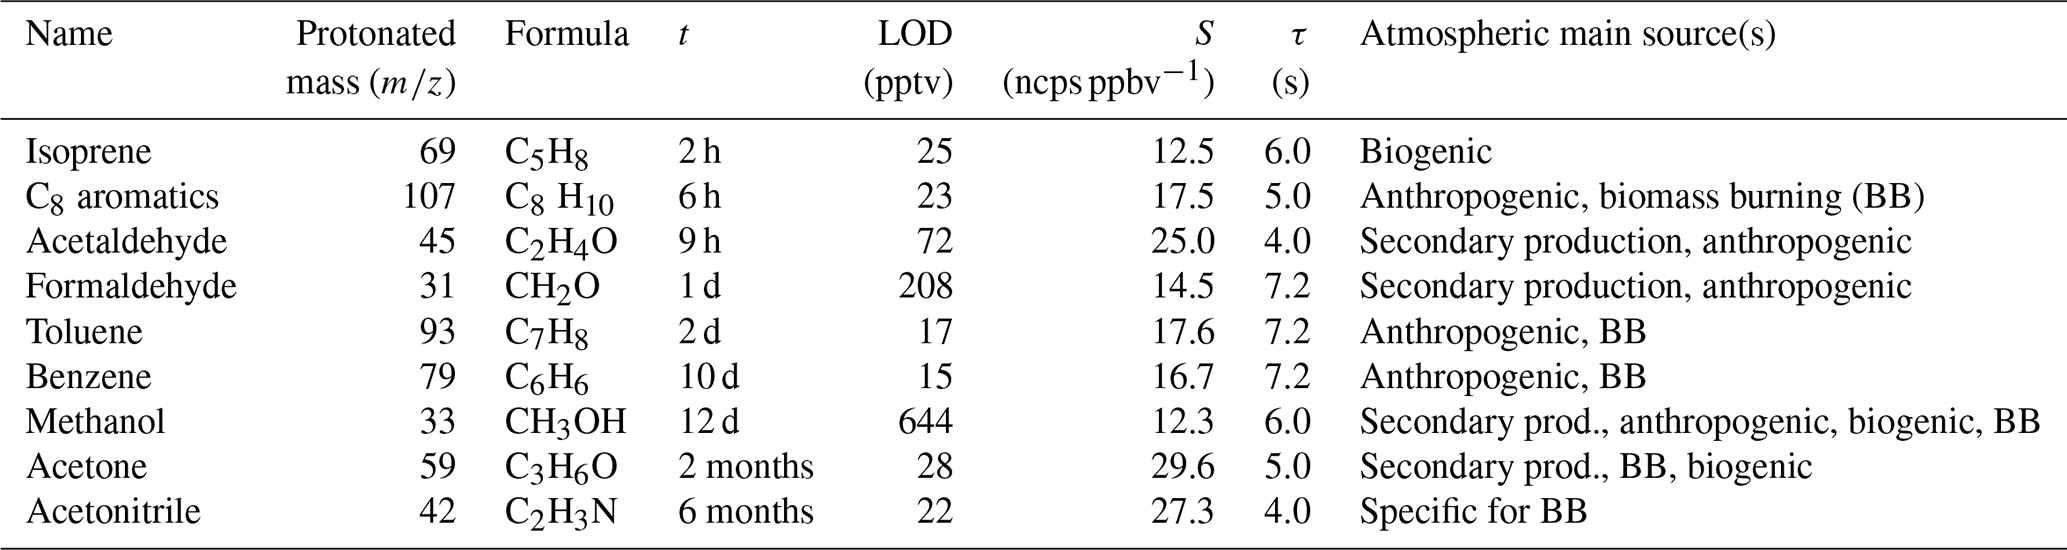
VOC measurements during EMeRGe were performed with the HALO Karlsruhe Mass Spectrometer (HKMS) (Brito and Zahn, 2011), a custom-built PTR-MS (equipped with a QMS) which has been continuously improved over the years (Fischbeck, 2017). Amongst its aircraft certification, the advantages compared to commercial instruments are its compactness, its low weight of 55 kg, as well as its custom electronics and control software (Fischbeck, 2017) that allow adaptations and modifications to the scientific needs, e.g. customisable duty cycle of measurements/background detection due to meteorological conditions/conditions of aircraft campaign and full access to all operating parameters. In the configuration for EMeRGe, the HKMS measured nine selected VOCs (Table 1) consecutively in a duty cycle of ∼60 s (integration times of ∼6 s per species) with a limit of detection (LOD) in the lower pptv (parts per trillion by volume) range. The instrumental background is determined every 30 min for 5 min. The average H3O+ signal was 6×10⁶ cps; the instrument was operated at a drift tube pressure of 2.3 mbar and an value of ∼142 Td. The sensitivities were determined in regular gas standard measurements. Data availability for EMeRGe is 95 % due to an instrument failure during flight EU-05.
Table 1VOCs measured during EMeRGe-Europe and EMeRGe-Asia, with tropospheric lifetime t (as defined for a 12 h daytime average OH radical concentration of 2.0×10⁶ molec. cm−3; Atkinson, 2000), lower limit of detection (LOD, for EMeRGe-Asia), maximal sensitivities S (ncps – normalised counts per second), mass spectrometric integrations times τ and the up to four main atmospheric sources.
3.1.2 VOC-based identification of source signatures
As indicated in Table 1, isoprene and acetonitrile are ideal tracers for fresh biogenic and BB sources, respectively, and benzene is a tracer marking anthropogenic signals when acetonitrile-identified BB signals are filtered out. However, it should be noted that the magnitude of acetonitrile emissions depends on the nitrogen content of the burned fuel, showing lower concentrations in residential wood burning, and hence acetonitrile may not be a suitable tracer for domestic burning in urban areas (Coggon et al., 2016). Furthermore, the mass of benzene () can potentially experience signals from the fragmentation of higher aromatics, e.g. from C8 aromatics like ethylbenzene (), due to the operation of the HKMS with a relatively high value (de Gouw and Warneke, 2007). Nevertheless, higher aromatics originate mostly from anthropogenic sources as well, thus why we still consider the signal of as a suitable tracer for anthropogenic activities.
In general, specific source signals can be identified whenever certain tracer VMRs significantly exceed their atmospheric background levels. On that basis, we can identify sources that have significantly contributed to measured air mass composition when the respective VOC VMRs exceed the atmospheric background plus 3 times the (compound-specific) observational noise σ, as explained below.
We assess this observational noise σ by smoothing the measured VOC VMRs with a Savitzky–Golay filter (Savitzky and Golay, 1964) and taking the standard deviation of the residuals (for details, see Sect. S2). The atmospheric background levels generally depend on the species' lifetime (Junge, 1974). Isoprene (emitted by forests and vegetation) is oxidised within some hours after emission and hence has a negligible atmospheric background. Benzene (emitted by gas-related traffic and petroleum processing industries) has a longer tropospheric lifetime of about 10 d but still shows very small free tropospheric background levels in the lowermost pptv range. For both VOCs, we therefore use the instrumental LOD as lower limit. In contrast, acetonitrile has a much longer tropospheric lifetime of about 6 months and is thus distributed worldwide and hence shows a non-negligible tropospheric background. We infer the acetonitrile background level with the help of the most extensive in situ data set collected with IAGOS-CARIBIC (In-Service Aircraft for a Global Observing System – Civil Aircraft for the Regular Investigation of the Atmosphere Based on an Instrument Container) at altitudes of up to 12 km (https://www.iagos.org/iagos-caribic/, last access: 13 January 2023, Brenninkmeijer et al., 2007). Due to small BB emissions in winter, we select northern hemispheric winter seasons (DJFM, here for the 4 years 2012 to 2016) and determine a mean acetonitrile background level of 145 pptv (please see details in Sect. S3).
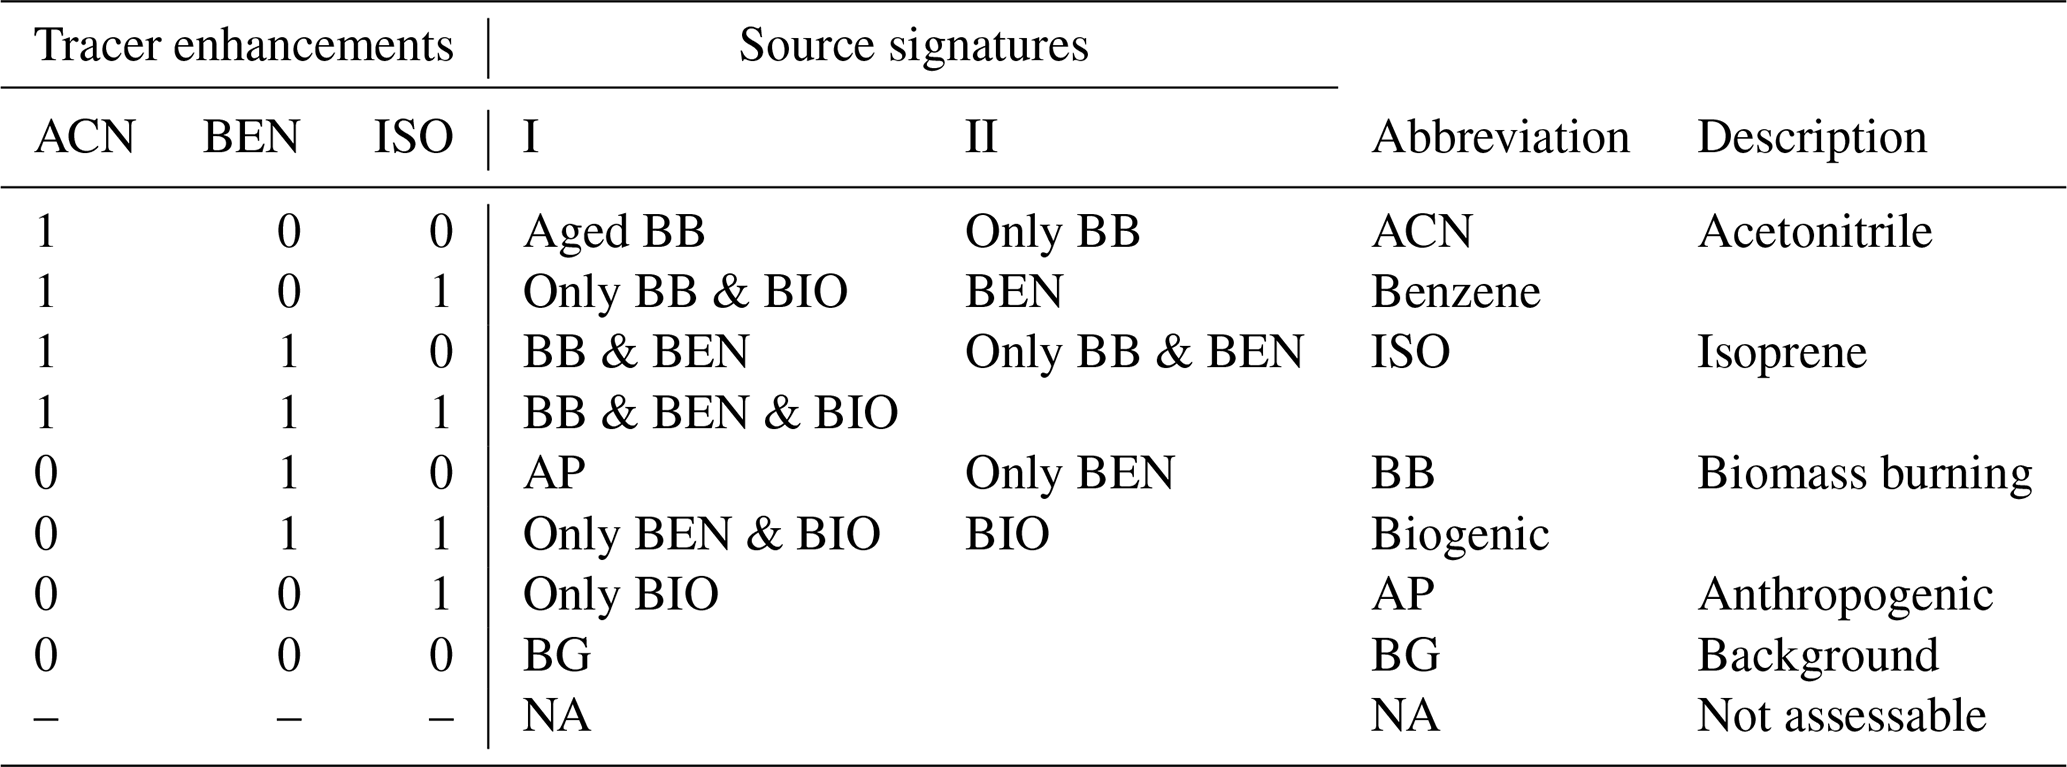
Finally, we use the relevant background and threshold levels of acetonitrile, benzene and isoprene (listed in Table 2) to identify different source signatures (summarised in Table 3). Overall, a quite complex and multi-faceted mix of chemical fingerprints characterising different source contributions emerges, with the following source signatures:
-
Aged biomass burning (aged BB). Elevated acetonitrile signals cannot only arise from recent burning events (together with BB benzene signals; see next), but distant events and long-range transport of air masses with strongly reduced levels of short-lived benzene can contribute as well.
-
Biomass burning & benzene (BB & BEN). An unambiguous source identification is challenging if both acetonitrile and benzene are enhanced. Such air masses may originate exclusively from fresh BB events or may contain a mixture of anthropogenic and BB pollutants of varying ages.
-
Anthropogenic (AP). Elevated benzene signals alone arise from fresh, some days old, anthropogenic sources.
-
Only biogenic (only BIO). Observed isoprene signals must originate from very recent biogenic emissions (due to the short lifetime of isoprene) and therefore denote recent contact to the PBL. This source signature denotes only a biogenic signal without enhancements of benzene and acetonitrile (filtering out BB-induced isoprene emissions, e.g. Müller et al., 2016). The above-mentioned three signatures are further partitioned into signals with and without biogenic influence (source signatures II, Table 3).
-
Background (BG). If none of the three VOC tracers are elevated, we consider the air mass as background.
Table 2Upper tropospheric background levels of acetonitrile, benzene, isoprene (determined for ∼11 km), limit of detection (LOD) and observational noise σ used for inferring threshold levels to identify source signatures during EMeRGe-Europe and EMeRGe-Asia. Threshold limits are determined differently: background + 3σ for acetonitrile and LOD + 3σ for benzene and isoprene. Due to slightly changed sensitivities and instrumental backgrounds between 2017 and 2018, the LOD (depending on both) changed as well.
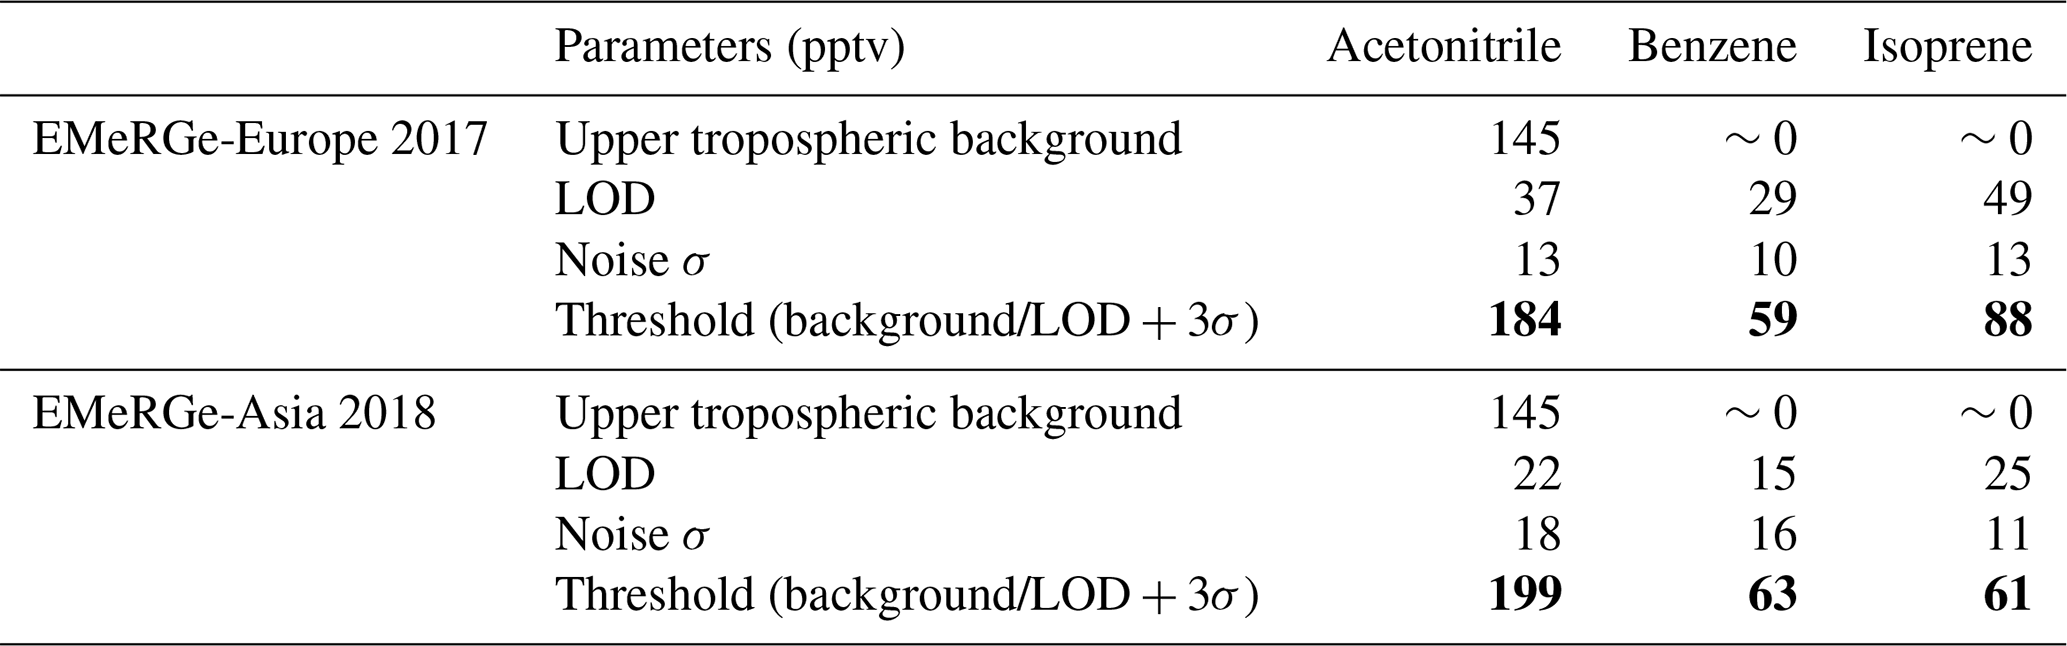
Table 3Definition of source signatures that can be derived from measured enhancements of acetonitrile (ACN), benzene (BEN) and isoprene (ISO) above (1) or below (0) specified threshold levels (listed in Table 2). The source signatures aged BB, BB & BEN and AP are defined only based on the combination of ACN and BEN. Other signatures are based on the combination of ACN, BEN and ISO. Periods of instrumental background detection (see Sect. 3.1.1) and when tracers change between 1 and 0 (or vice versa) are excluded and indicated with NA (last line).
Hence, lifetimes of the selected VOCs do not only determine their atmospheric background levels but also define the time ranges during which certain signatures are unambiguously attributable to their sources. Considered together, we can roughly assess the stage of processing.
Based on the three selected VOCs, various source signatures as described exemplarily above can be defined, which allow for investigating and characterising source contributions during EMeRGe. Due to the PTR-MS duty cycle (consecutive integration of nine VOCs with ∼6 s each), we assign the identified source signatures to the general measurement frequency of 1 s to enlarge the data coverage (see Sect. S4 for a detailed description). Note that the assignment scheme can lead to gaps in source signatures when VMRs vary around the threshold and during instrumental background detection. The identified signatures can i.a. be used to filter other trace gas measurements of EMeRGe in order to analyse the chemical properties of air masses of different origin.
3.2 Identification of source regions using back trajectories and model analyses
To attribute sampled trace gas enhancements to certain source regions and to estimate their contribution, we combine two tools:
-
Tool 1, back trajectories calculated with the FLEXible TRAjectory (FLEXTRA) model (Stohl et al., 1995, 2005; Stohl and Seibert, 1998) and PBL heights from the ERA5 reanalysis (Hersbach et al., 2020);
-
Tool 2, mapping of CO emission rates based on the widely used inventory Emissions Database for Global Atmospheric Research (EDGAR, https://data.jrc.ec.europa.eu/collection/edgar, last access: 13 January 2023).
3.2.1 Tool 1: FLEXTRA back trajectories and ERA5 PBL height
Using FLEXTRA, 10 d back trajectories with release steps of 1 min are calculated along the HALO flight tracks. The time step along each trajectory is 10 min. For our analysis we use only simple mean wind Lagrangian trajectories instead of a dispersion model like FLEXPART (FLEXible PARTicle dispersion model), because most of our measurements (80 %) are outside the PBL and nearly half of the probed air masses (45 %) have not been in the PBL during the last 10 d (Fig. 1b). In the free troposphere above the PBL “simple trajectories” are sufficient to identify the mean transport pathways, mainly due to less turbulence/shear compared to the PBL. This is an efficient way to identify and characterise all air masses probed during EMeRGe in a first step and allows further analysis later on, e.g. looking at aerosol properties for BB air masses, dispersion modelling for specific cases or model-measurement intercomparisons.
Additionally, we use the ERA5 PBL height which is diagnosed as the height where the bulk Richardson number reaches the critical value of 0.25 (ECMWF, 2020). PBL height uncertainties can exceed 50 % for shallow boundary layers (<1 km, e.g. at night). However, for deeper boundary layers the uncertainty is below 20 %, e.g. at daytime (Seidel et al., 2012). Many emissions emanate from daytime activities in transportation and traffic, as well as energy use, where PBL height uncertainties might mostly stay below 20 %. However, emissions from the residential, commercial and public (RCP), as well as industrial sector, can also arise during the night, where larger PBL height uncertainties might have an influence on our analysis.
3.2.2 Tool 2: mapping of CO emissions based on the EDGAR emission inventory
The EDGAR emission inventory contains a variety of trace and greenhouse gas emission rates from different source categories on a worldwide grid (). For our analysis, we use the most recent version EDGAR v6.1 Global Air Pollutant Emissions (https://edgar.jrc.ec.europa.eu/dataset_ap61, last access: 13 January 2023, Crippa et al., 2022), which is based on a variety of regional emission inventories. From this data set, we selected anthropogenically emitted CO on a monthly basis for the year 2018 and considered a tropospheric lifetime of 2 months (Khalil and Rasmussen, 1990) to identify source regions contributing with recent and aged pollution (advected by long-range transport, LRT).
Figure 2a shows anthropogenic EDGAR CO emission rates for Europe in July. It indicates that emissions of the selected target areas are high and overall regionally well confined. In contrast, CO emission rates for March in Asia show coherently high values in east and northeast China (see red colours in Fig. 2b). The triangle Xian–Beijing–Shanghai is already described as a gigacity, consisting of megacity agglomerations (Kulmala et al., 2021) which challenge the identification of boundaries of distinct target megacities there.
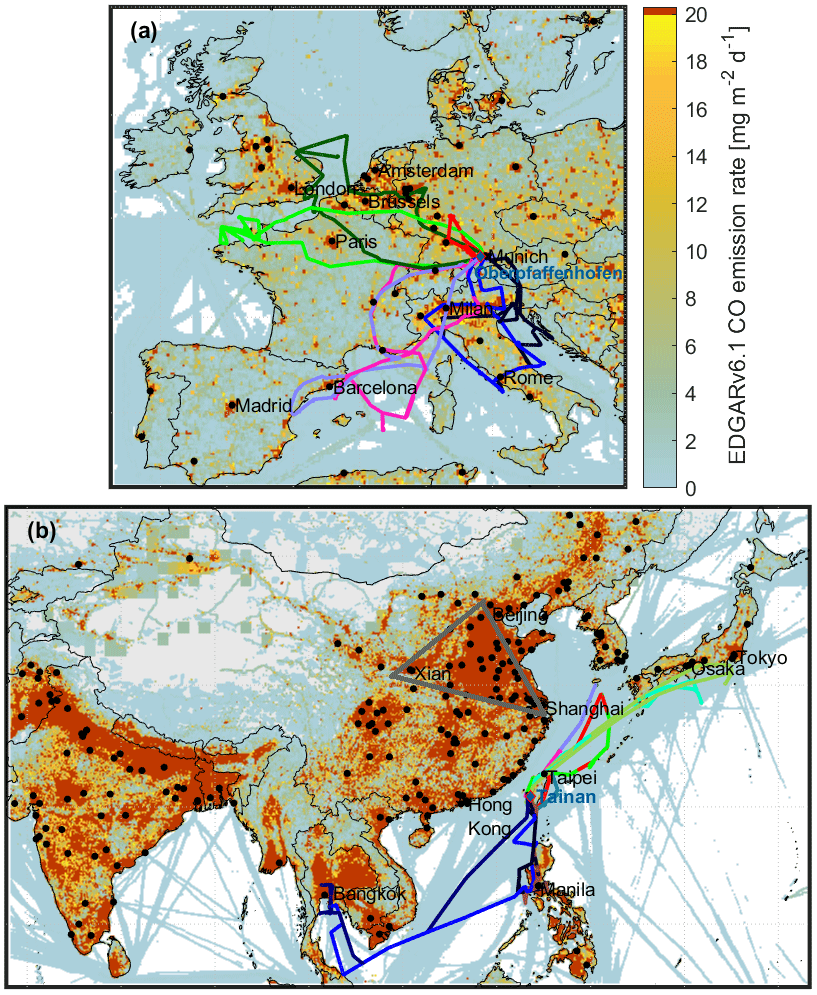
Figure 2CO emission rates from anthropogenic sources (EDGAR v6.1 Global Air Pollutant Emissions, year 2018, monthly means), (a) Europe: July (EMeRGe-Europe), (b) Asia: March (EMeRGe-Asia) and EMeRGe flight tracks (blue lines). Black dots mark cities with more than one million inhabitants. Grey triangle in (b) marks the megacity agglomeration between the cities Xian, Beijing and Shanghai. For clarity, emission rates below 0.01 mg m−2 d−1 are not shown.
3.2.3 Modelled anthropogenic CO uptake from the PBL
To quantify the contribution of certain anthropogenic source regions during EMeRGe, we consider the anthropogenic CO emission rates provided by EDGAR and try to estimate the uptake of a certain amount of these CO emissions by back trajectories passing by (see explanation in Fig. 3). We did not consider BB emissions in our modelling approach, since EMeRGe focuses on anthropogenic pollution. By far, most emissions occur at or near the ground and are therefore emitted into the earth's PBL. These emissions are transported to the free and upper troposphere either by low-level advective processes or through deep convection. In the mid to high latitudes, long-range low-level advection is the dominant export mechanism, whereas deep convective transport seems to be more important in the tropics (Folberth et al., 2015). Since (i) most of the probed pollution emanate from mid-latitude source regions, and (ii) we wanted to use only a simple model approach, the pollution transport by convection is neglected. Thus, at first order, the CO uptake of a trajectory air parcel will be determined by the PBL residence time and the strength of emission rates at that location. While in the PBL, the horizontal advection by prevailing winds is still important. In compact regions with continuous emissions (or with one strong source and only slow horizontal advection), the volume mixing ratios in an air mass are increased due to the accumulation of emissions. Other processes, like heterogeneous mixing with other air masses and oxidation, act as well and modify volume mixing ratios.
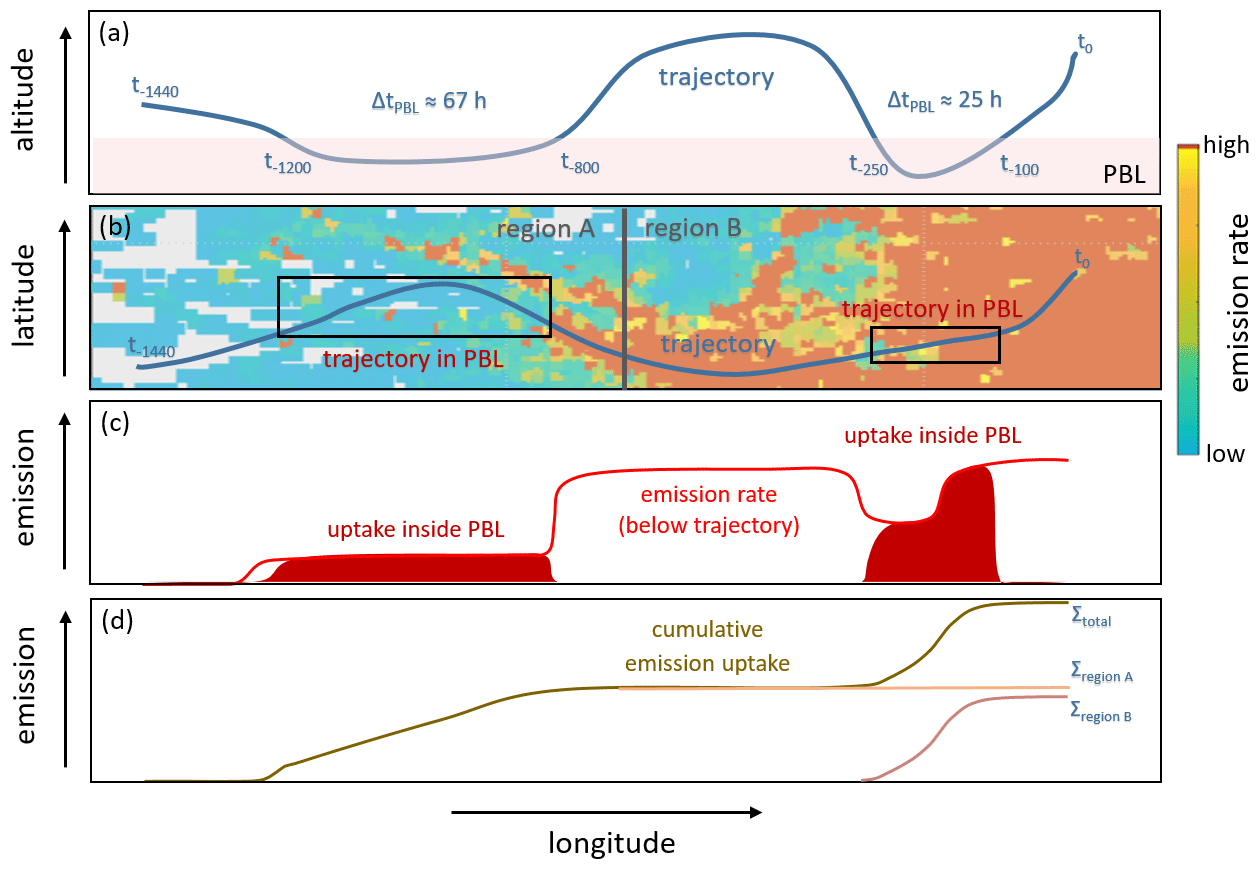
Figure 3Graphical representation (simplified example) of our Lagrangian CO uptake model based on the PBL height and trajectory pathways, with longitude as x axis. (a) Trajectory altitude. An example trajectory (sampled by the aircraft at time t0) enters the PBL for two different periods, between t−1200 and t−800, as well as between t−250 and t−100 (t−100 means 100 backward calculation steps = 1000 min = 16.7 h). During these periods, CO is taken up, that is, the trajectory is loaded with CO emitted on the ground. (b) Geographic map. CO emission rates from EDGAR (shaded) with a trajectory (blue line) and rectangles in which the trajectory descends into the PBL. Exemplary, two example regions A and B are defined. (c) Time series. Emission rate along the trajectory (red line) and CO uptake periods (filled red regions) along the trajectory. (d) Total and subtotal (region A and B) cumulative CO uptake (dark yellow line) along the trajectory.
Based on this approach, we amalgamate the PBL residence time from FLEXTRA back trajectories with the CO emission rates (kg m−2 s−1) from the EDGAR inventory to estimate the potential contribution of certain regions to our observations. To derive an uptake for a back trajectory inside the PBL at a certain time tx, we calculate emissions (based on the emission rate of the corresponding grid box) for the area defined by the covered distance from trajectory point tx to tx−1 multiplied by a “standard” width of 1 m and for the fixed time step of the trajectory from point tx to tx−1 (10 min). These emission uptakes (given as mass) are calculated for all trajectory points inside the PBL and are summed up for all single grid boxes. This allows the identification of regions where emissions have a high potential to contribute to the probed air masses during EMeRGe. Subsequently, summing up the amount of pollutants (here anthropogenic CO) taken up along trajectories in the PBL (at or near major source regions) prior to sampling should help to identify source regions that caused pollution sampled during EMeRGe and, in turn, should allow assessing the validity of our approach. Note that such a straightforward Lagrangian approach is only indicative, because it neglects the loss of CO by oxidation and dilution processes during transport, and thus the inferred CO uptake should be interpreted as a maximal CO emission contribution potential.
3.3 AMTEX CO measurements
We use in situ CO measurements of the AtMospheric Trace EXperiment (AMTEX) instrument on board HALO to qualitatively compare with the modelled CO emission uptakes. The instrument is an AeroLaser 5002 vacuum UV resonance fluorescence spectrometer, installed on HALO, detecting the resonance fluorescence in the fourth positive band of CO (Gerbig et al., 1996, 1999). Measurements are performed at 1 Hz with a precision of 1.5 ppbv. The total uncertainty is 1.5 ppbv ± 2.4 % (Gerbig et al., 1999).
First, we present the chemical characterisation of sampled air masses based on our VOC measurements. Afterwards we use FLEXTRA trajectories and the EDGAR CO inventory to identify source regions and to assess their contributions to the modelled CO uptakes per flight and for the campaigns (EMeRGe-Europe, EMeRGe-Asia) in total. Finally, we link significant CO uptakes of source regions to the VOC measurements in order to characterise their chemical fingerprints.
4.1 VOC-based characterisation of sampled air masses
As introduced in Sect. 3.1.2, the three VOCs, acetonitrile, benzene and isoprene, allow us to identify source signatures in sampled air masses. Figure 4 illustrates the fractions of source signatures observed during all 21 EMeRGe flights in Europe and Asia (values are listed in Table S2 in Sect. S5).
The most striking difference is the more frequent enhancements in acetonitrile and benzene during EMeRGe-Asia (18 % and 51 %, respectively) compared to EMeRGe-Europe (2.5 % and 22 %, respectively); see Fig. 4a. In contrast, enhancements of isoprene (of biogenic origin) were more often observed in EMeRGe-Europe (7.5 % versus 4 %). Here, the short lifetime of isoprene (only some hours) might be the reason for the smaller percentages. However, all fractions differ considerably from flight to flight. Figure 4b and c show the partitioning of inferred source signatures (defined in Table 3), with the following overarching features.
4.1.1 EMeRGe-Europe
Around 21 % of the flight time, polluted air has been sampled (EM-EU, Fig. 4b), with ∼18 % of anthropogenic, 2 % of BB & BEN and ∼1 % of pure biogenic origin. Around 40 % of sampled air masses comprise no VOC tracer enhancement. The remaining 39 % cannot be attributed due to data gaps (see Sect. 3.1.2).
In detail, benzene originates mainly from anthropogenic sources (4.5 % together with biogenic signals, ∼10 % without), relevant BB sources play a minor role. Nonetheless, the small fraction of BB & BEN indicates either fresh BB or mixing of BB and anthropogenic sources. Aged BB contributions are negligible. In most cases, biogenic isoprene signals are detected together with anthropogenic benzene signals (only BEN & BIO, Fig. 4c), indicating a mixture of both with recent sources from the PBL. A special feature is seen on flight EU-04, where pure biogenic signatures (∼8 %) and aged BB (1.3 %) show the largest fraction besides BG. During this flight no MPC was targeted, but a direct flight-to-flight comparison of HALO with the British aircraft Facility for Airborne Atmospheric Measurements (FAAM) was conducted (Schumann, 2021).
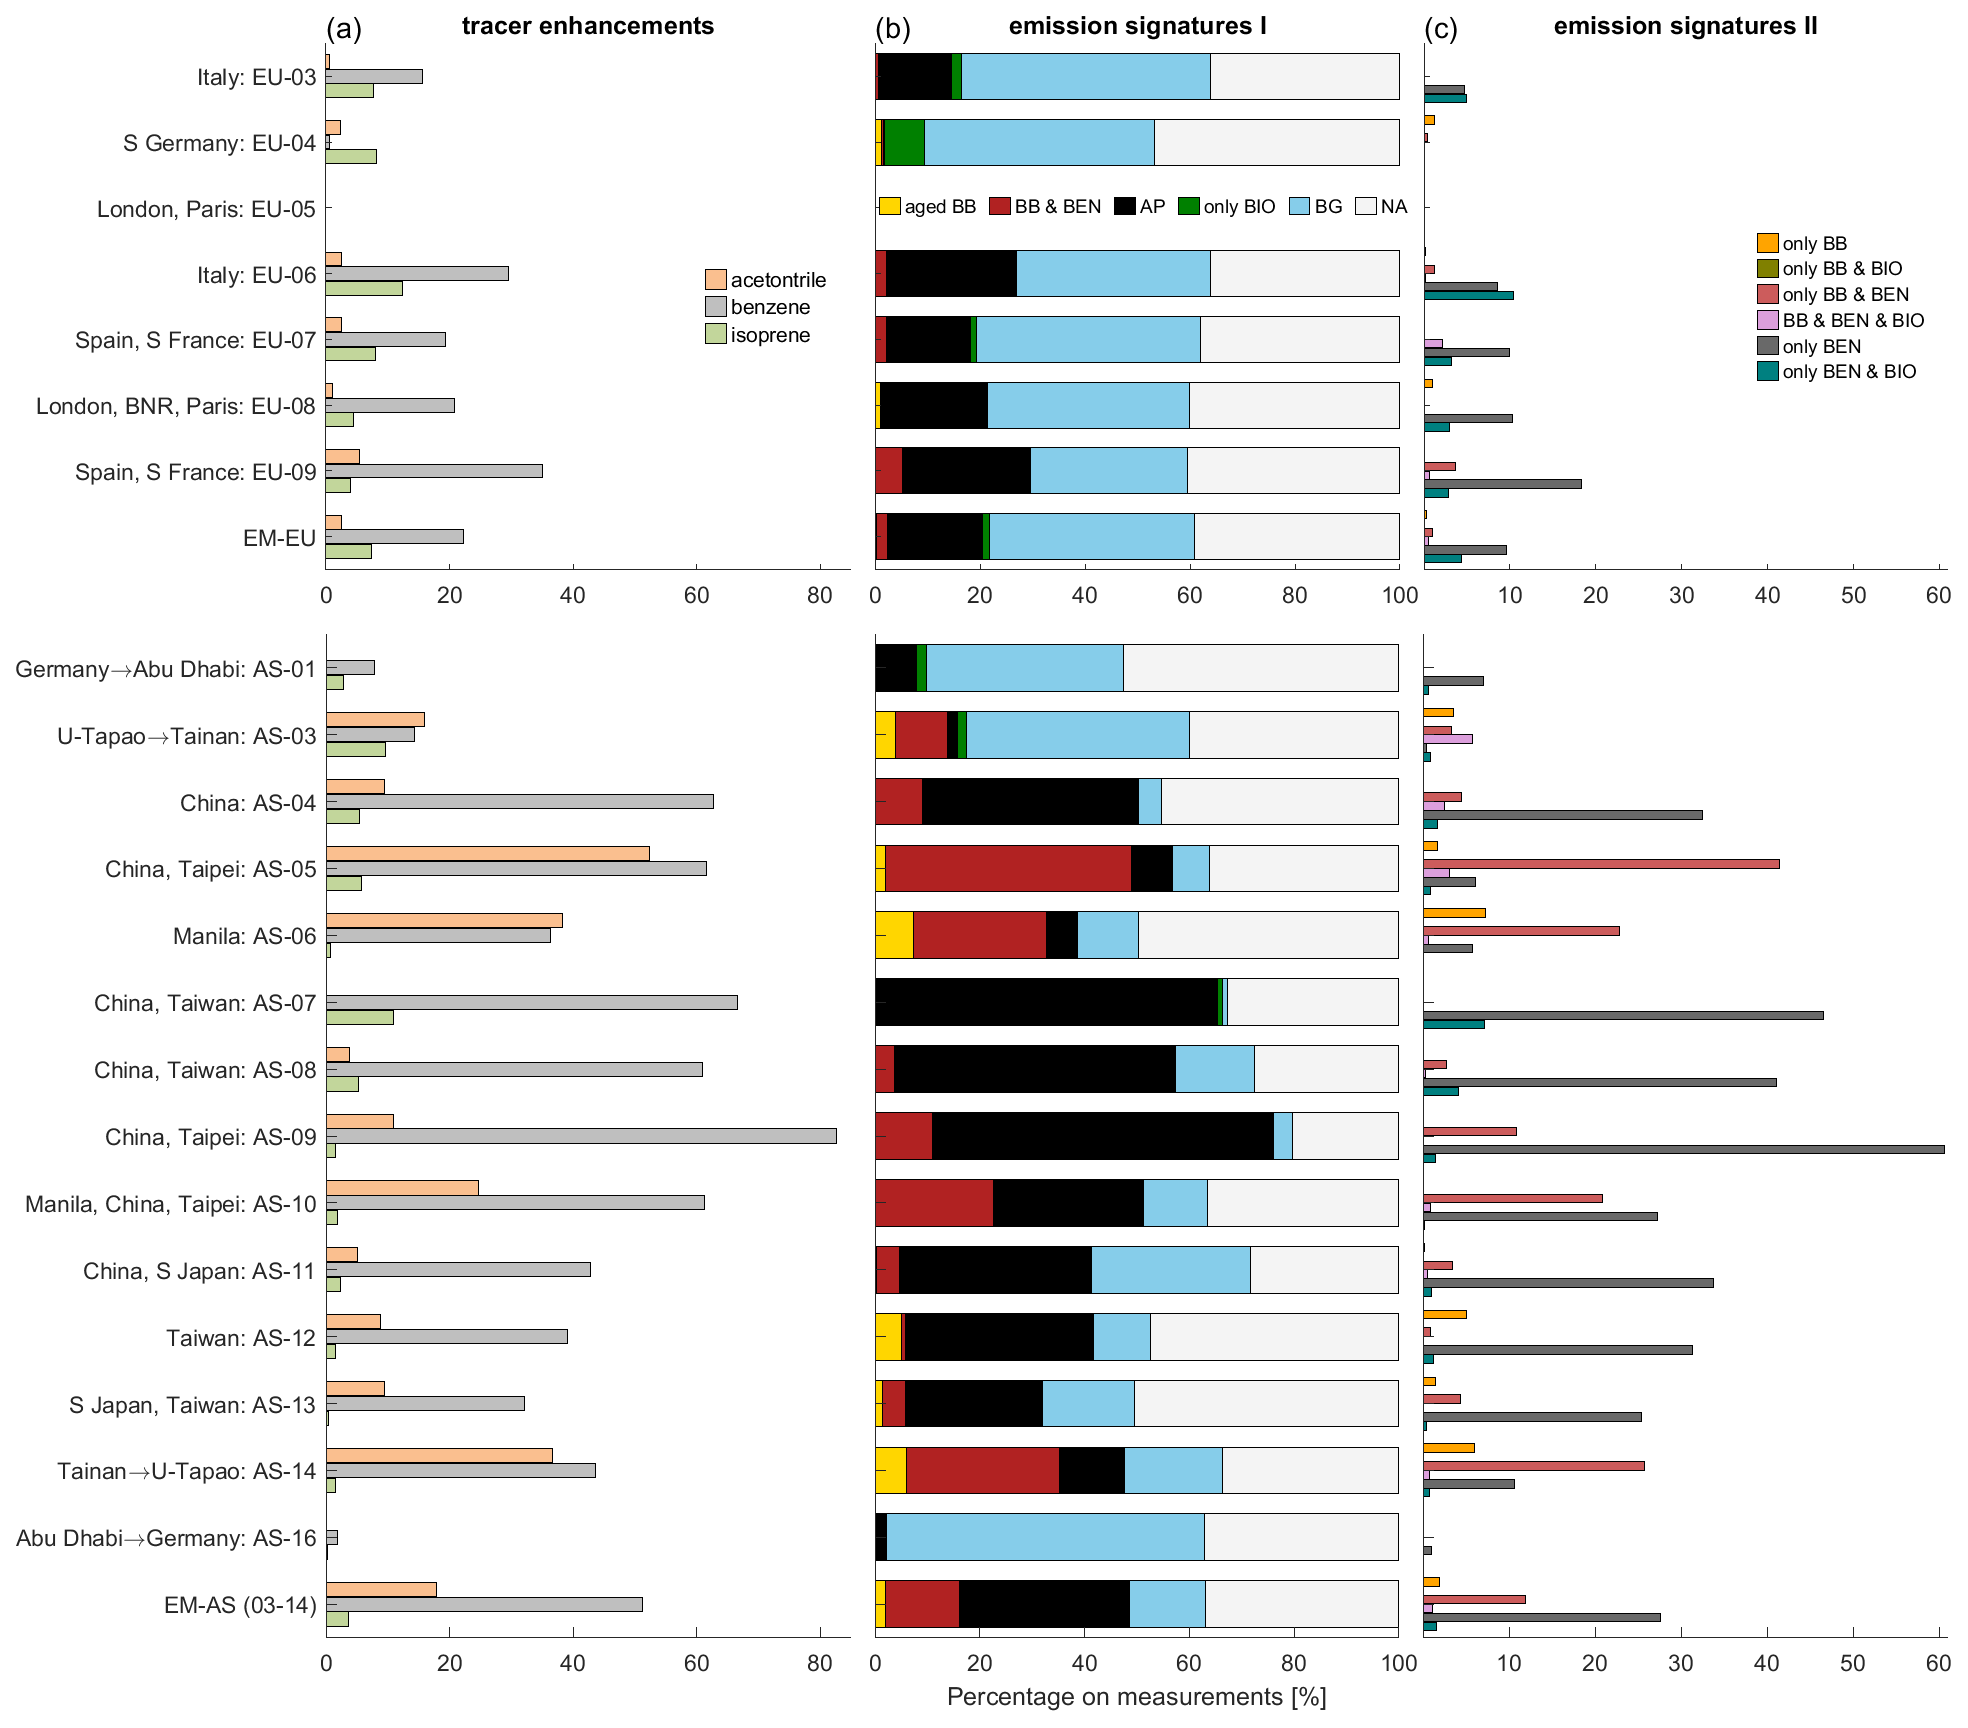
Figure 4Fractions (%) of (a) enhancements over thresholds observed in acetonitrile, benzene and isoprene; (b) source signatures I (aged BB, BB & BEN and AP∗ inferred from observed enhancements only in acetonitrile and benzene and only BIO and BG∗ inferred with additional isoprene); and (c) source signatures II (inferred from observed enhancements in acetonitrile, benzene and isoprene). Top: EMeRGe-Europe, bottom: EMeRGe-Asia. EU-05 is not available due to instrument failure. The summary of EMeRGe-Asia excludes the non-Asian transfer flights AS-01 and AS-16. ∗AP – anthropogenic signatures, BB – biomass burning signatures, BEN – benzene enhancements, BIO – fresh biogenic signatures, BG – background, NA – not assessable during instrumental background detection and threshold transitions (due to PTR-MS measurement resolution of 1 min per tracer).
4.1.2 EMeRGe-Asia
Around 50 % of the flight time, polluted air has been sampled (EM-AS, Fig. 4b), with ∼32 % of anthropogenic, ∼14 % of BB & BEN and ∼2 % aged BB origin. Around 15 % of sampled air masses comprise no VOC tracer enhancement. The remaining ∼37 % cannot be attributed.
In detail, benzene enhancements originate on average to two-thirds from anthropogenic signals and are detected to one-third together with BB (BB & BEN). However, the variation is large from flight to flight. Several flights (e.g. AS-07, AS-08 and AS-09) show predominantly AP signatures. When BB influence is strong (e.g. AS-05, AS-06, AS-10 and AS-14), BB & BEN predominate. We assume that in these cases not only fresh BB contributes to BB & BEN but also anthropogenic sources, because the anthropogenic signature AP is significantly smaller in these flights compared to other flights with less BB. During several EMeRGe-Asia flights (e.g. AS-03, AS-06, AS-12 and AS-14), we also detected aged BB signals showing the long-range transport of BB events.
In comparison, EMeRGe-Europe possesses only minor BB contributions identified mostly on flights in southern Europe, whereas measurements during EMeRGe-Asia are more regularly and strongly influenced by BB events due to the active BB season in Asia. The fraction of benzene enhancements (percentage of measurements over the benzene threshold) is in EMeRGe-Asia more than double that of EMeRGe-Europe and primarily of anthropogenic origin. The fraction of measurements with no tracer signals (BG) is considerably higher in EMeRGe-Europe than in EMeRGe-Asia, which means that more “clean” background air was probed during EMeRGe-Europe.
With such a use of tracer combinations, 50 %–70 % of the EMeRGe observations can be attributed to certain source signatures. As shown by the white bars (representing not assessable (NA) measurements) in Fig. 4b, the attribution capacity differs from flight to flight and depends on the availability of tracer combinations (either two or three tracers and on the assignment scheme mentioned in Sect. 3.1.2).
Overall, the consideration of different chemical tracers enables a sophisticated characterisation of airborne composition measurements.
4.2 Source regions
4.2.1 Trajectory- and inventory-based identification of source regions
In order to identify air mass origins of observed pollution events, we use the CO uptake approach outlined in Sect. 3.2.3 (combining the EDGAR emission inventory with FLEXTRA back trajectories) to assess the potential contribution of certain source regions to the probed air masses.
Figures 5 and 6 show (a) the EDGAR CO emission rates of anthropogenic sources for the EMeRGe campaign periods, (b) the cumulative residence time of back trajectories inside the PBL for every EDGAR grid box and (c) the modelled CO uptake from certain source regions.
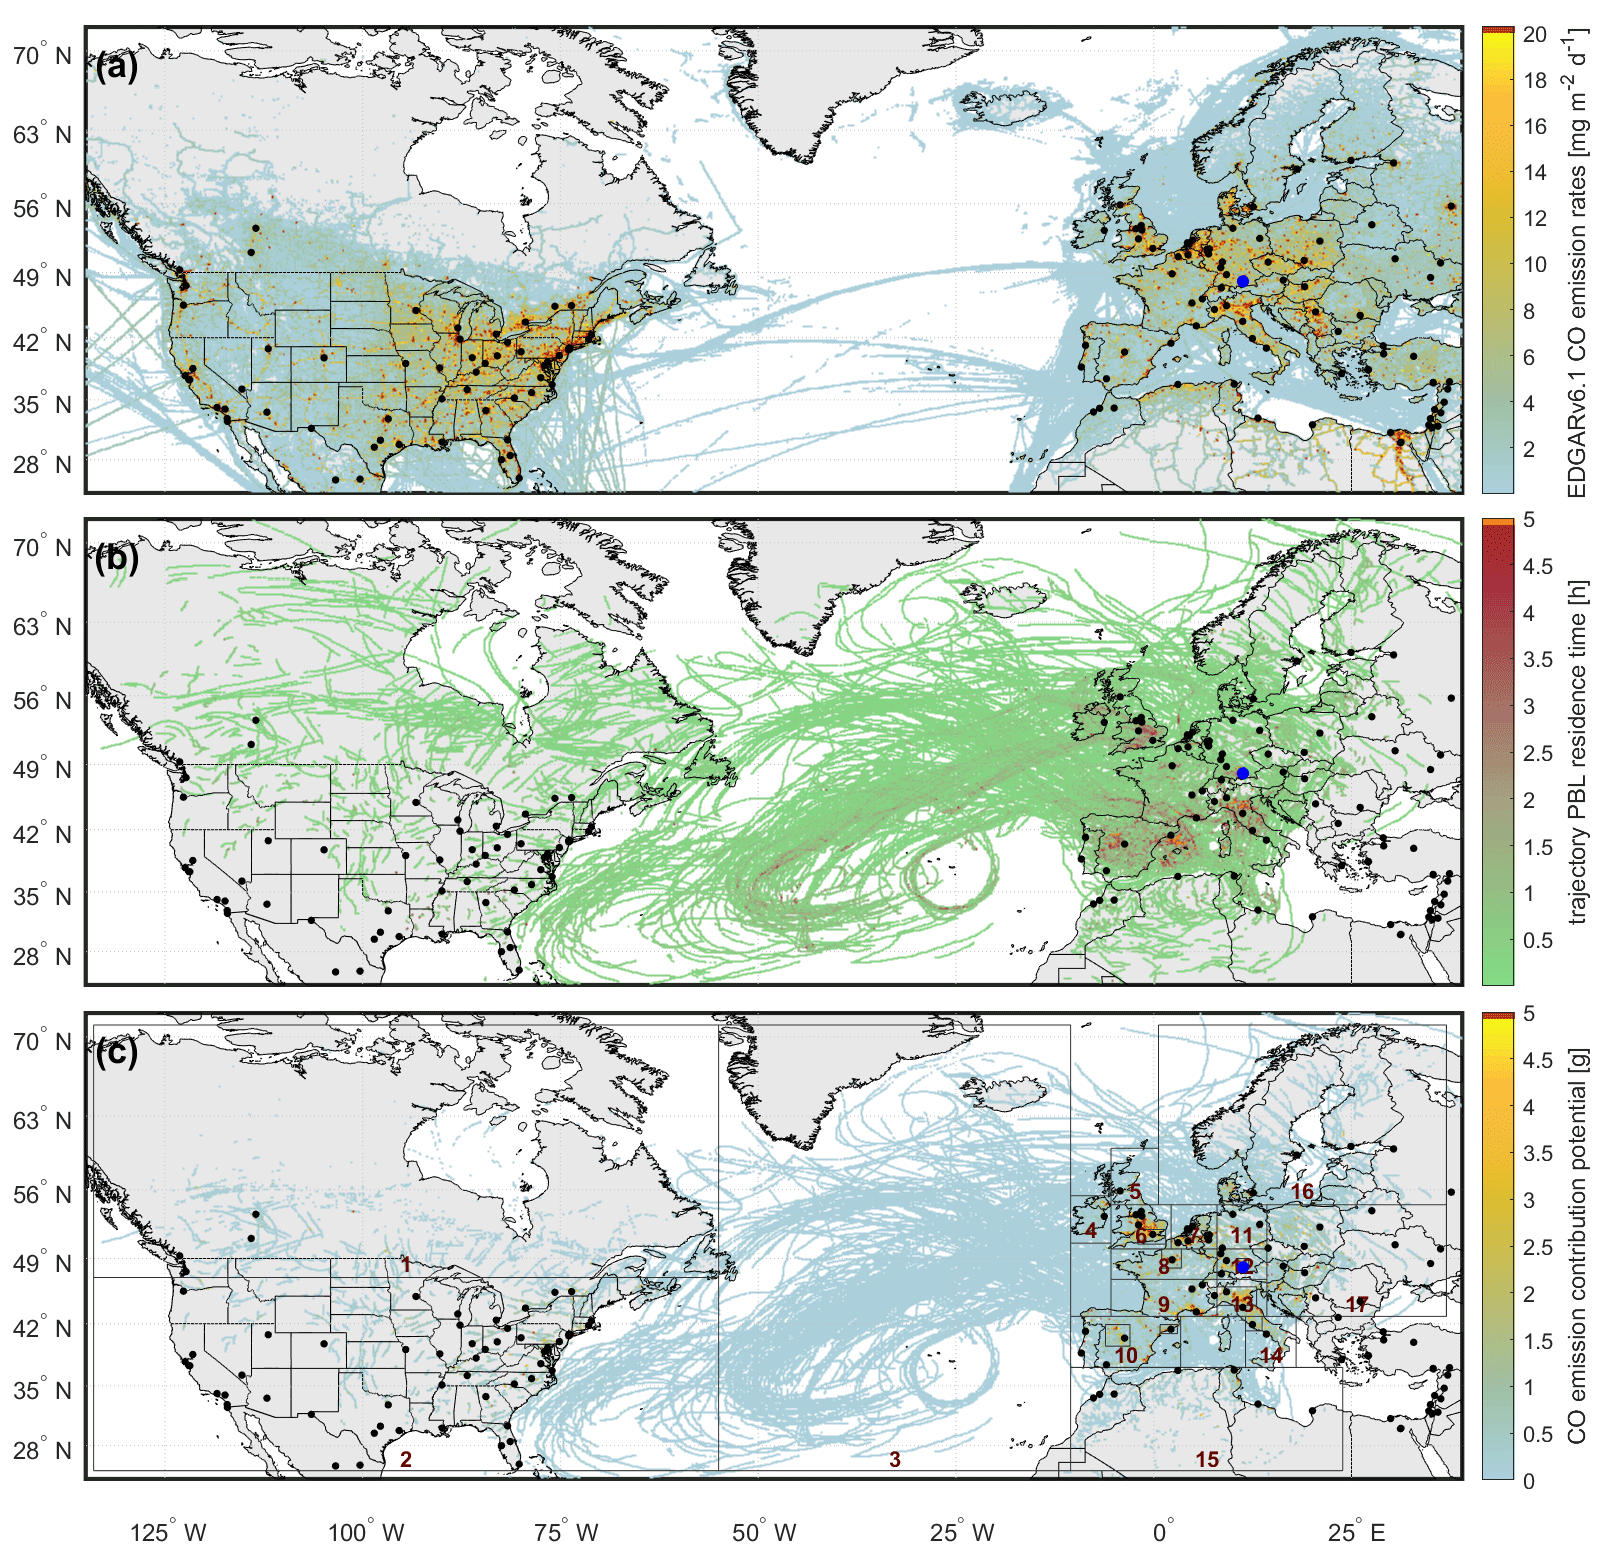
Figure 5(a) EDGAR v6.1 CO emission rates from anthropogenic sources (July 2018), for clarity, not colour-coded below 0.01 mg m−2 d−1; (b) PBL residence time of air parcels cumulated for a grid resolution of ; and (c) modelled CO emission uptake from the PBL interpreted as emission contribution potential during EMeRGe-Europe. Boxes in (c) mark selected study areas (summarised in Table 4, left). Black dots mark cities with more than one million inhabitants; the blue dot denotes the home base of HALO (Oberpfaffenhofen Airport near Munich, Germany) during EMeRGe-Europe.
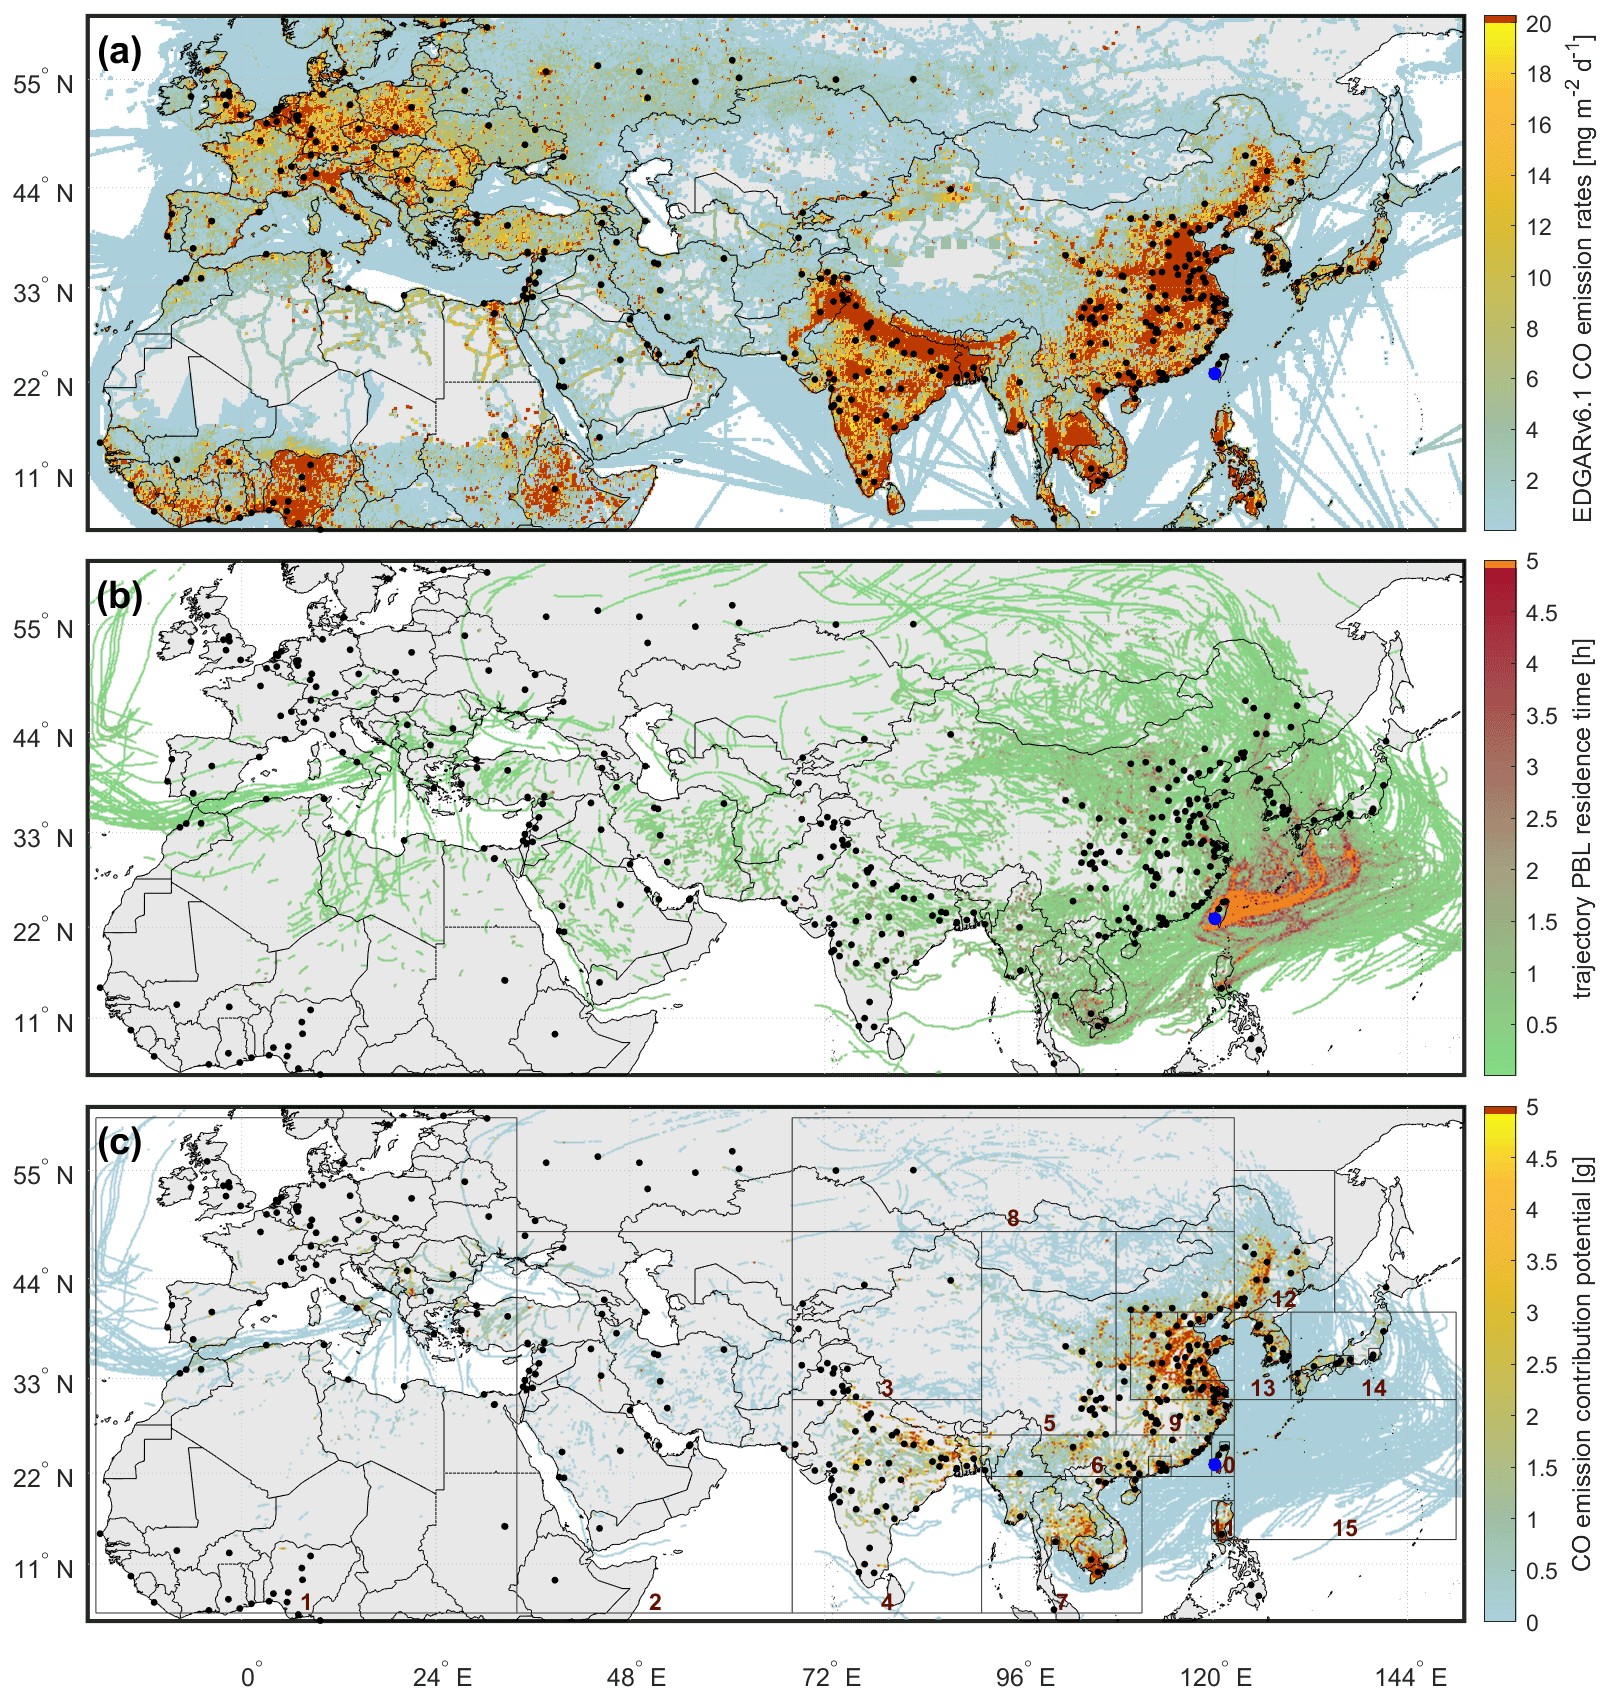
Figure 6(a) EDGAR v6.1 CO emission rates from anthropogenic sources (March 2018), for clarity, not colour-coded below 0.01 mg m−2 d−1; (b) PBL residence time of air parcels (for flights AS-03 to AS-14) cumulated for a grid resolution of ; and (c) calculated CO emission uptake from PBL interpreted as emission contribution potential during EMeRGe-Asia. Boxes in (c) mark selected study areas (summarised in Table 4, right-hand side). Black dots mark cities with more than one million inhabitants; the blue dot denotes the home base of HALO (Tainan Airport, Taiwan) during EMeRGe-Asia.
4.2.2 EMeRGe-Europe
In general, strong anthropogenic emission hot spots are located in Central Europe and the eastern United States (Fig. 5a). We found most frequent PBL contact of air masses probed during EMeRGe-Europe (Fig. 5b) near target regions of Spain/southern France, northern Italy and southern Great Britain. Due to the west wind drift, PBL contact of air parcels also occurred over the Atlantic Ocean, as well as over the USA and Canada, indicating the influence of long-range transport (LRT).
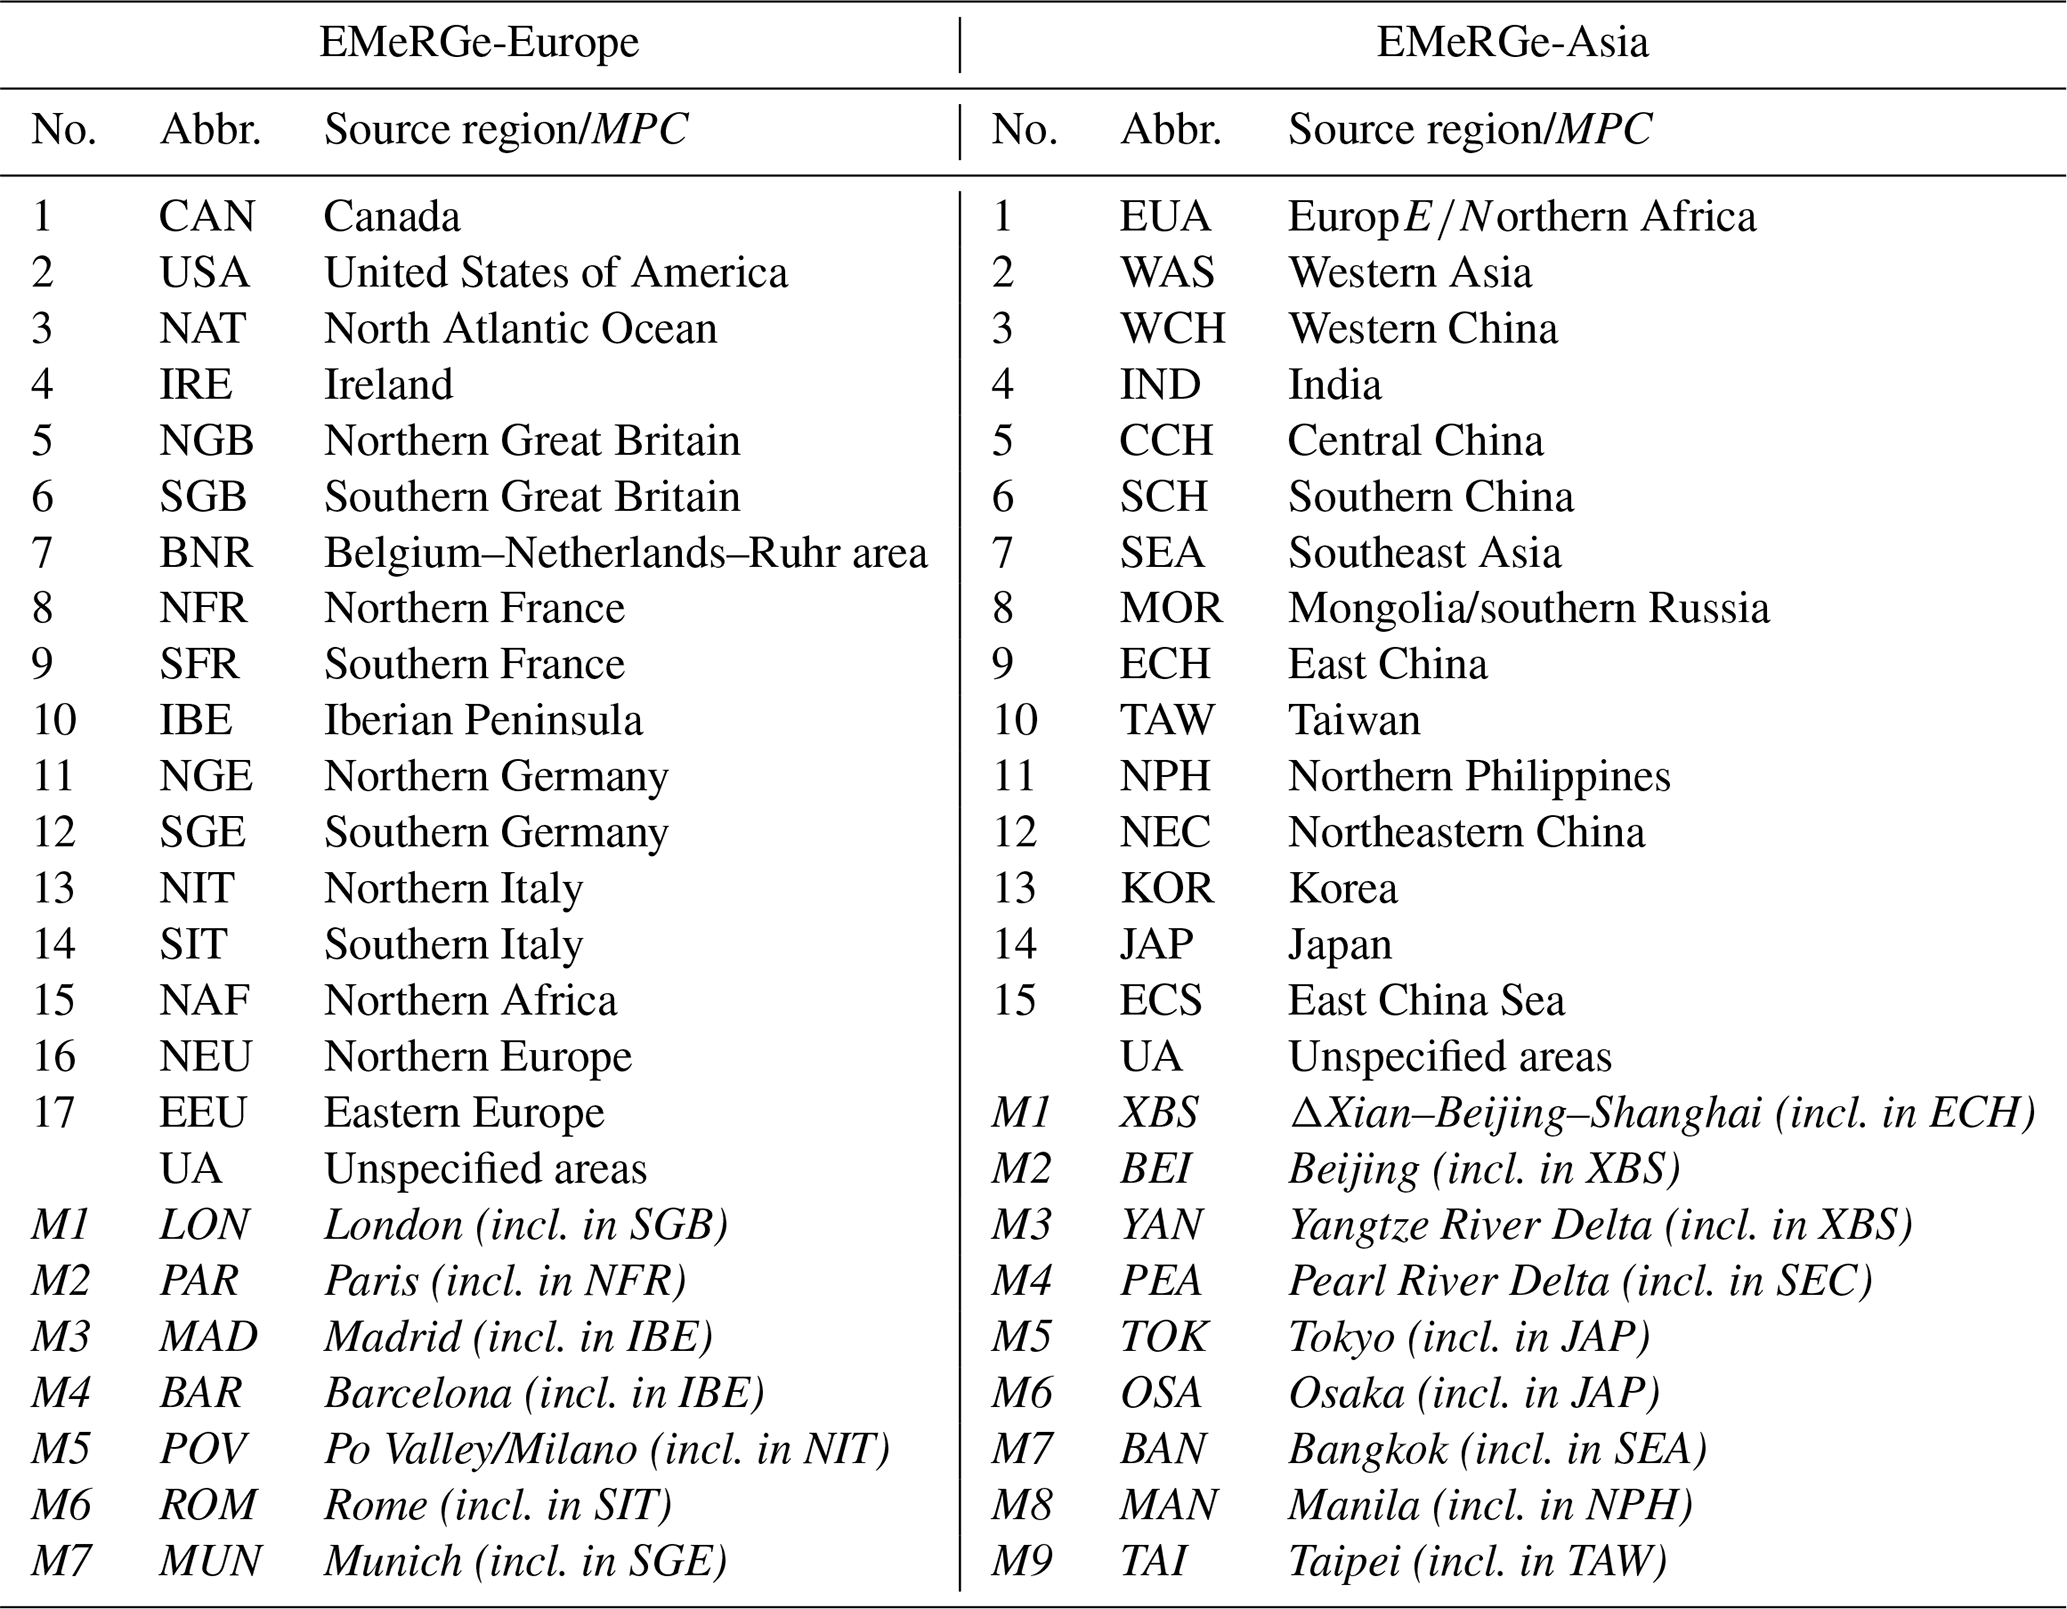
We identified the largest contribution potentials of anthropogenic CO emissions (Fig. 5c) in London in southern Great Britain, northern Italy, the eastern USA, as well as some hot spots such as the Ruhr area, Madrid and parts of southern France. Besides the seven target MPCs in Europe, we also selected 17 additional geographical areas with enhanced contribution potentials, with smaller (better resolved) emission grids around the target MPCs. All not-categorised regions are combined as unspecified areas. Table 4 (left) gives a summary of all selected source regions.
4.2.3 EMeRGe-Asia
Compared to EMeRGe-Europe, more regions have likely contributed to the observed composition during EMeRGe-Asia which occurred in the outflow of the entire Eurasian continent with some LRT even originating from Europe. However, the coherently highest CO emission rates (≥20 mg m−2 d−1) emanate from India and east China (Fig. 6a).
We found PBL contact of probed air masses (Fig. 6b) over Southeast Asia, China, India, as well as over southern Europe, northern Africa and western Asia. However, probed air masses had the most prolonged PBL contact over the East China Sea close to the sampling region.
We identified the largest contribution potentials (Fig. 6c) in China, especially in the gigacity triangle Xian–Beijing–Shanghai and in northeastern and southern parts of China. Furthermore, Taiwan, Japan, Thailand, India and parts of Vietnam show enhanced contribution potentials. We also found widespread uptakes in south and southeast Europe, as well as northern Africa and western Asia, indicating that measurements during EMeRGe-Asia are partly influenced by LRT as well. Although the East China Sea has the most prolonged PBL contact, contribution potentials are small, most likely due to much smaller ship emissions compared to emissions on shore. The selected source regions are summarised in Table 4 (right).
Table 4Source regions and MPCs (italic) selected for EMeRGe-Europe and EMeRGe-Asia. Coordinates are listed in Table S3, Sect. S6.
4.3 Contribution potentials of source regions
After we identified potential source regions, we analyse in this section to which degree their emissions have contributed to EMeRGe flights and on which days prior to the HALO measurements the uptakes occurred. Figures 7 and 8 summarise relative (colour-coded) and absolute modelled CO contribution potentials during EMeRGe-Europe (7 flights, 17 source regions and 7 target MPCs) and EMeRGe-Asia (12 flights, 15 source regions and 9 MPCs), respectively, as listed in Table 4. Note that absolute CO contribution potentials in Figs. 7 and 8 should be interpreted with care, since the magnitude depends on the assumptions and weighting of the emission uptake. Nonetheless, a relative representation is useful to assess individual source region contributions. Note furthermore that they reflect only the sampling (in space and time) of the atmosphere by the flights and the emission rates/climatology of the specific month.
4.3.1 EMeRGe-Europe
Most of the flights have successfully probed pollution from target regions (Fig. 7a and c). However, some target regions apparently had only small contributions, whereas some non-target regions contributed considerably more. In general, EU-08 with the targets London and BNR has the largest modelled CO emission uptake and EU-04, targeting southern Germany near the Alps (no MPC target and shortest flight), the smallest.
Figure 7b indicates further that around 50 % of the modelled total CO uptake sum ∑EM-EU has been emitted in the last 3 d prior to the measurement, that is, from southern Great Britain, BNR, southern/northern France, the Iberian Peninsula, southern Germany and northern Italy. Emission uptakes of 4 to 8 d prior to the HALO measurements originate mainly from BNR, northern France, the Iberian Peninsula and eastern Europe. Earlier uptakes (8 to 10 d prior to HALO measurements) have arisen mainly from the USA and Canada but with overall small cumulative contribution potentials. In total, freshly polluted air masses from the last 72 h, as well as transported pollution, contributed to probed air masses during EMeRGe-Europe. In total, Belgium–Netherlands–Ruhr (14 %), southern Great Britain (13 %) and southern France (12 %) had the largest CO emission contribution potentials during EMeRGe-Europe, accounting for around 40 % of the uptake sum ∑EM-EU. All target MPCs together contributed up to 16.5 %.
In the following, we analyse the contribution potentials of specific target regions and MPCs in more detail. Flights EU-03 and EU-06 investigated the outflow of the Po Valley and Rome. The Po Valley contributed 10 % and 15 % (Fig. 7c) and dominates the total uptake over northern Italy (17 % and 23 %, respectively, Fig. 7a). The outflow of Rome and southern Italy was only occasionally probed, with contributions of 4 % and 3 %. The largest contributors of non-target areas during EU-03 are the Iberian Peninsula (22 %) and northern Africa (17 %). During EU-06, emission uptakes of eastern Europe dominated with 32 %.
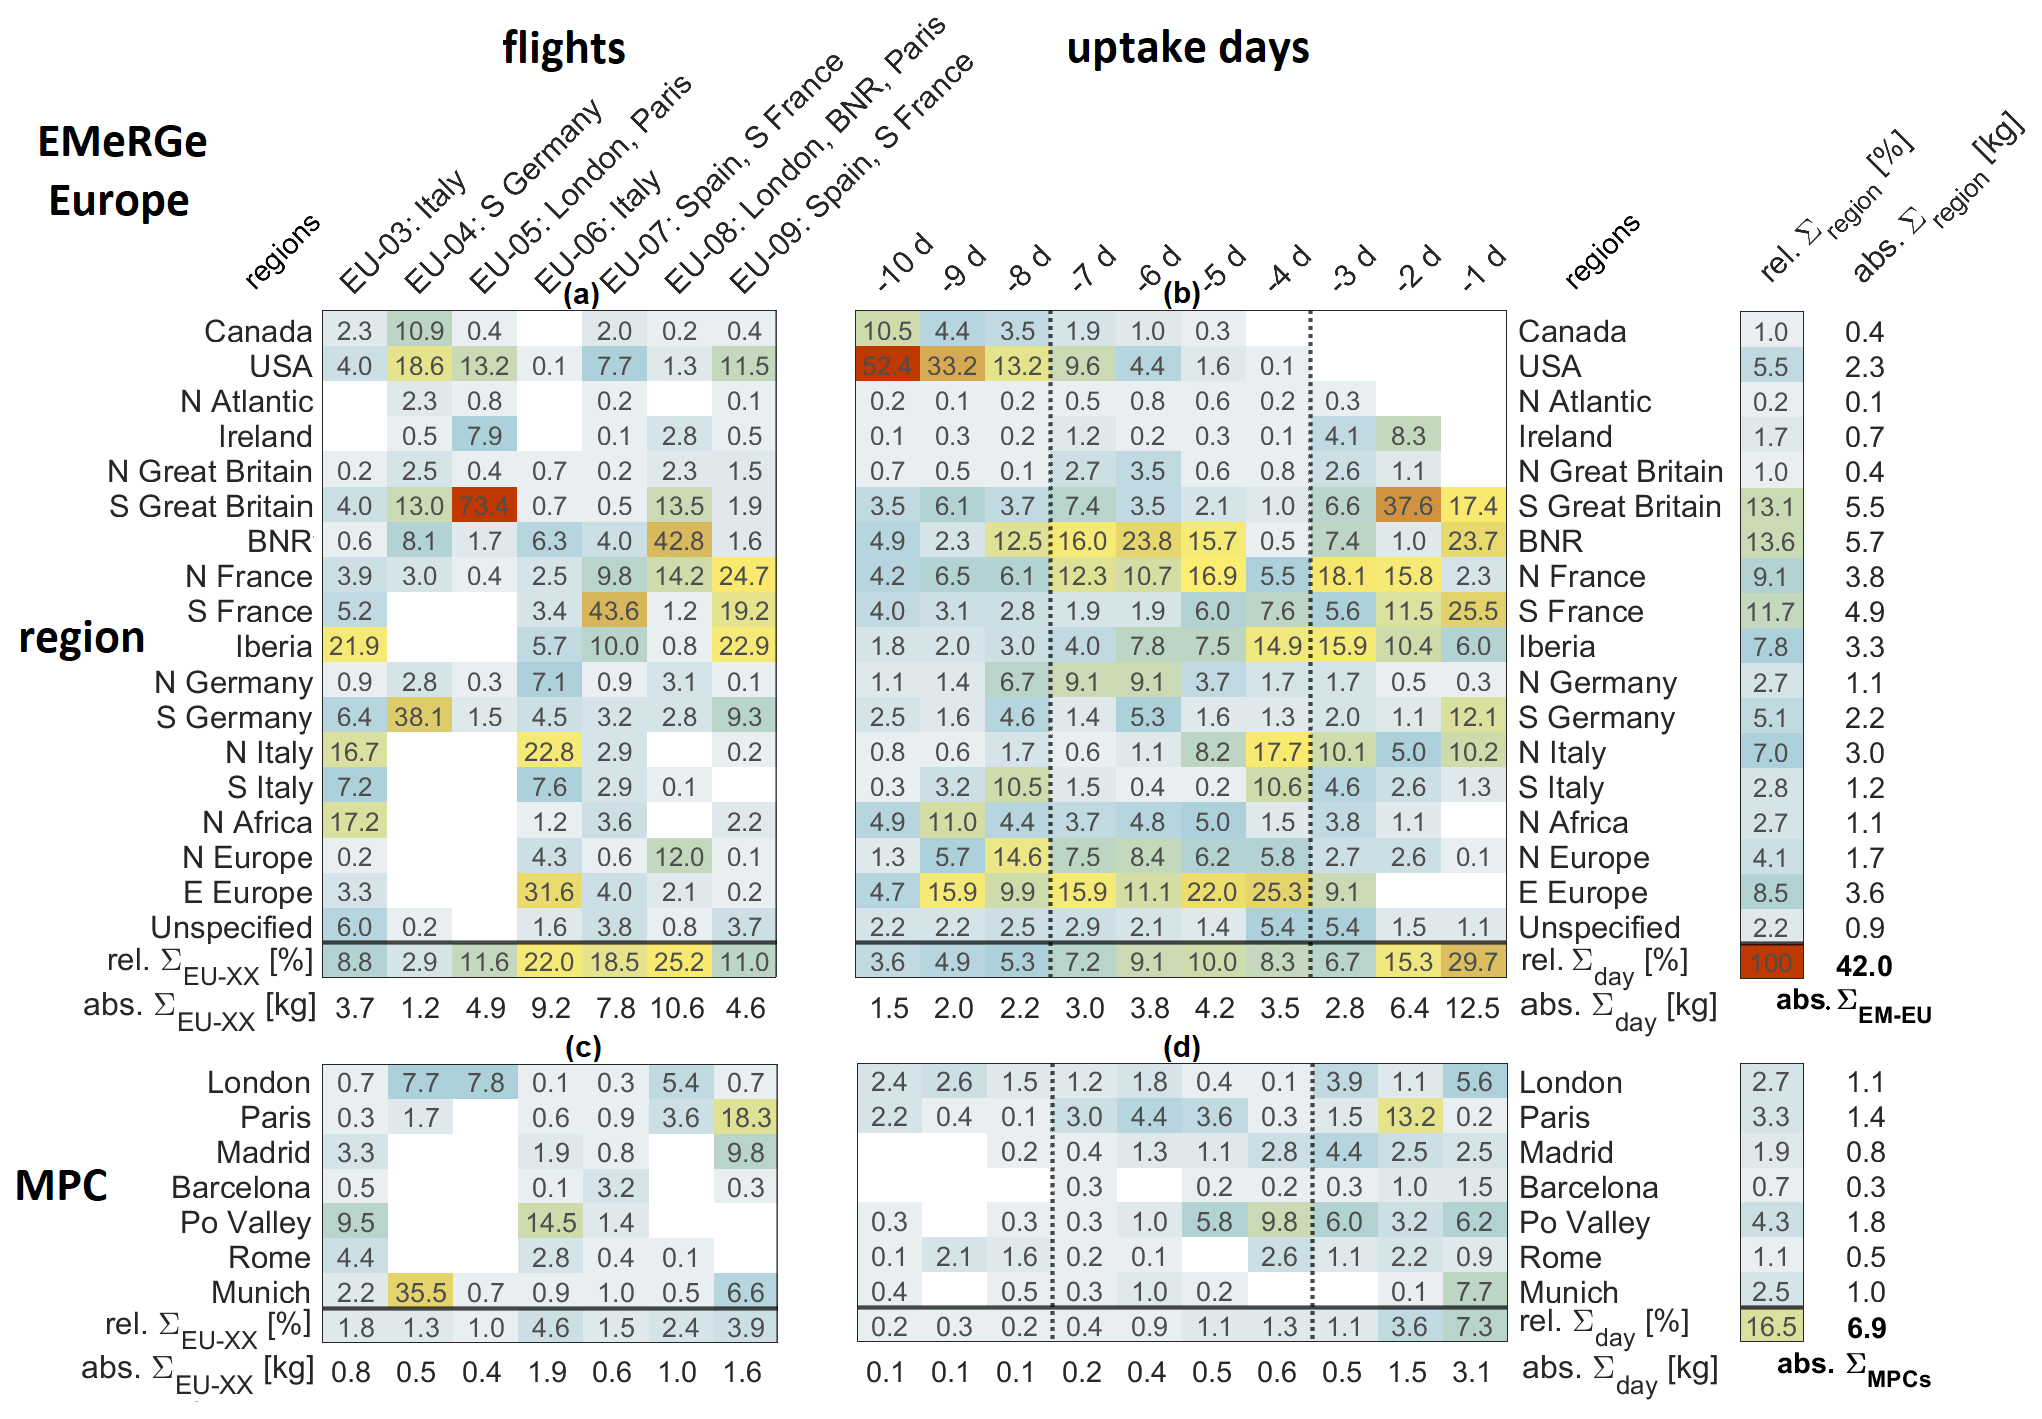
Figure 7Absolute and relative CO contribution potentials of 17 source regions and seven MPCs (listed in Table 4) during EMeRGe-Europe. Absolute values (uncoloured rows) give the sum of contribution potentials for single flights (abs.∑EU-XX), uptake days (abs. ∑day), as well as for source regions and MPCs (abs.∑region). For EMeRGe-Europe, the total uptake sum is 42.0 kg (abs.∑EM-EU) and for the selected MPCs 6.9 kg (abs. ∑MPC). Small deviations between absolute value sums and the total uptake sum are caused by rounding. Relative contribution potentials (colour-coded) of individual source regions are separated into contributing emission uptakes per flight (a, c), normalised to the absolute uptake sum per flight (regionEU-XX/abs.∑EU-XX), as well as separated into contributing emissions for the 10 particular uptake days prior to sampling with HALO (b, d), normalised to the absolute uptake sum per uptake day (regionday/abs. ∑day). Relative uptake sums rel.∑x are normalised to the total uptake sum (rel.abs. , with x=EU-XX, day and region). Target regions are given in the column label after flight labels. Regions are sorted by location from west (top) to east (bottom). Unspecified includes all areas outside the selected regions.
During flight EU-04, HALO conducted an inter-comparison flight with the British FAAM research aircraft (Schumann, 2021) in southern Germany (Allgäu), as mentioned before. We identified contributions from southern Germany (38 %, primarily by Munich with 35.5 %) and southern Great Britain (13 %) but also LRT contributions from the USA (19 %) and Canada (11 %). However, the modelled total CO uptake for flight EU-04 is small compared to other flights.
Flights EU-05 and EU-08 investigated the London area. However, the actual emission uptake modelled was small (∼5 %–8 %) for both flights. During EU-05, emission uptakes mostly arose from southern Great Britain (73 %). Around 13 % originated from the USA by LRT. Flight EU-08 investigated the Belgium–Netherlands–Ruhr area as well, which contributed up to 43 %, whereas southern Great Britain showed only a contribution of 13.5 %.
The flights EU-07 and EU-09 investigated the outflow of Madrid and Barcelona, where Madrid contributed during EU-09 with 9 %. During EU-07 contributions from Madrid and Barcelona are negligible. Emissions of the surrounding Iberian Peninsula contribute 10 % and 23 %. Non-target contributions originate from northern and southern France, where Paris dominates emission uptakes of northern France during EU-09. Additionally, LRT emissions from the USA contribute with 8 % and 11.5 %.
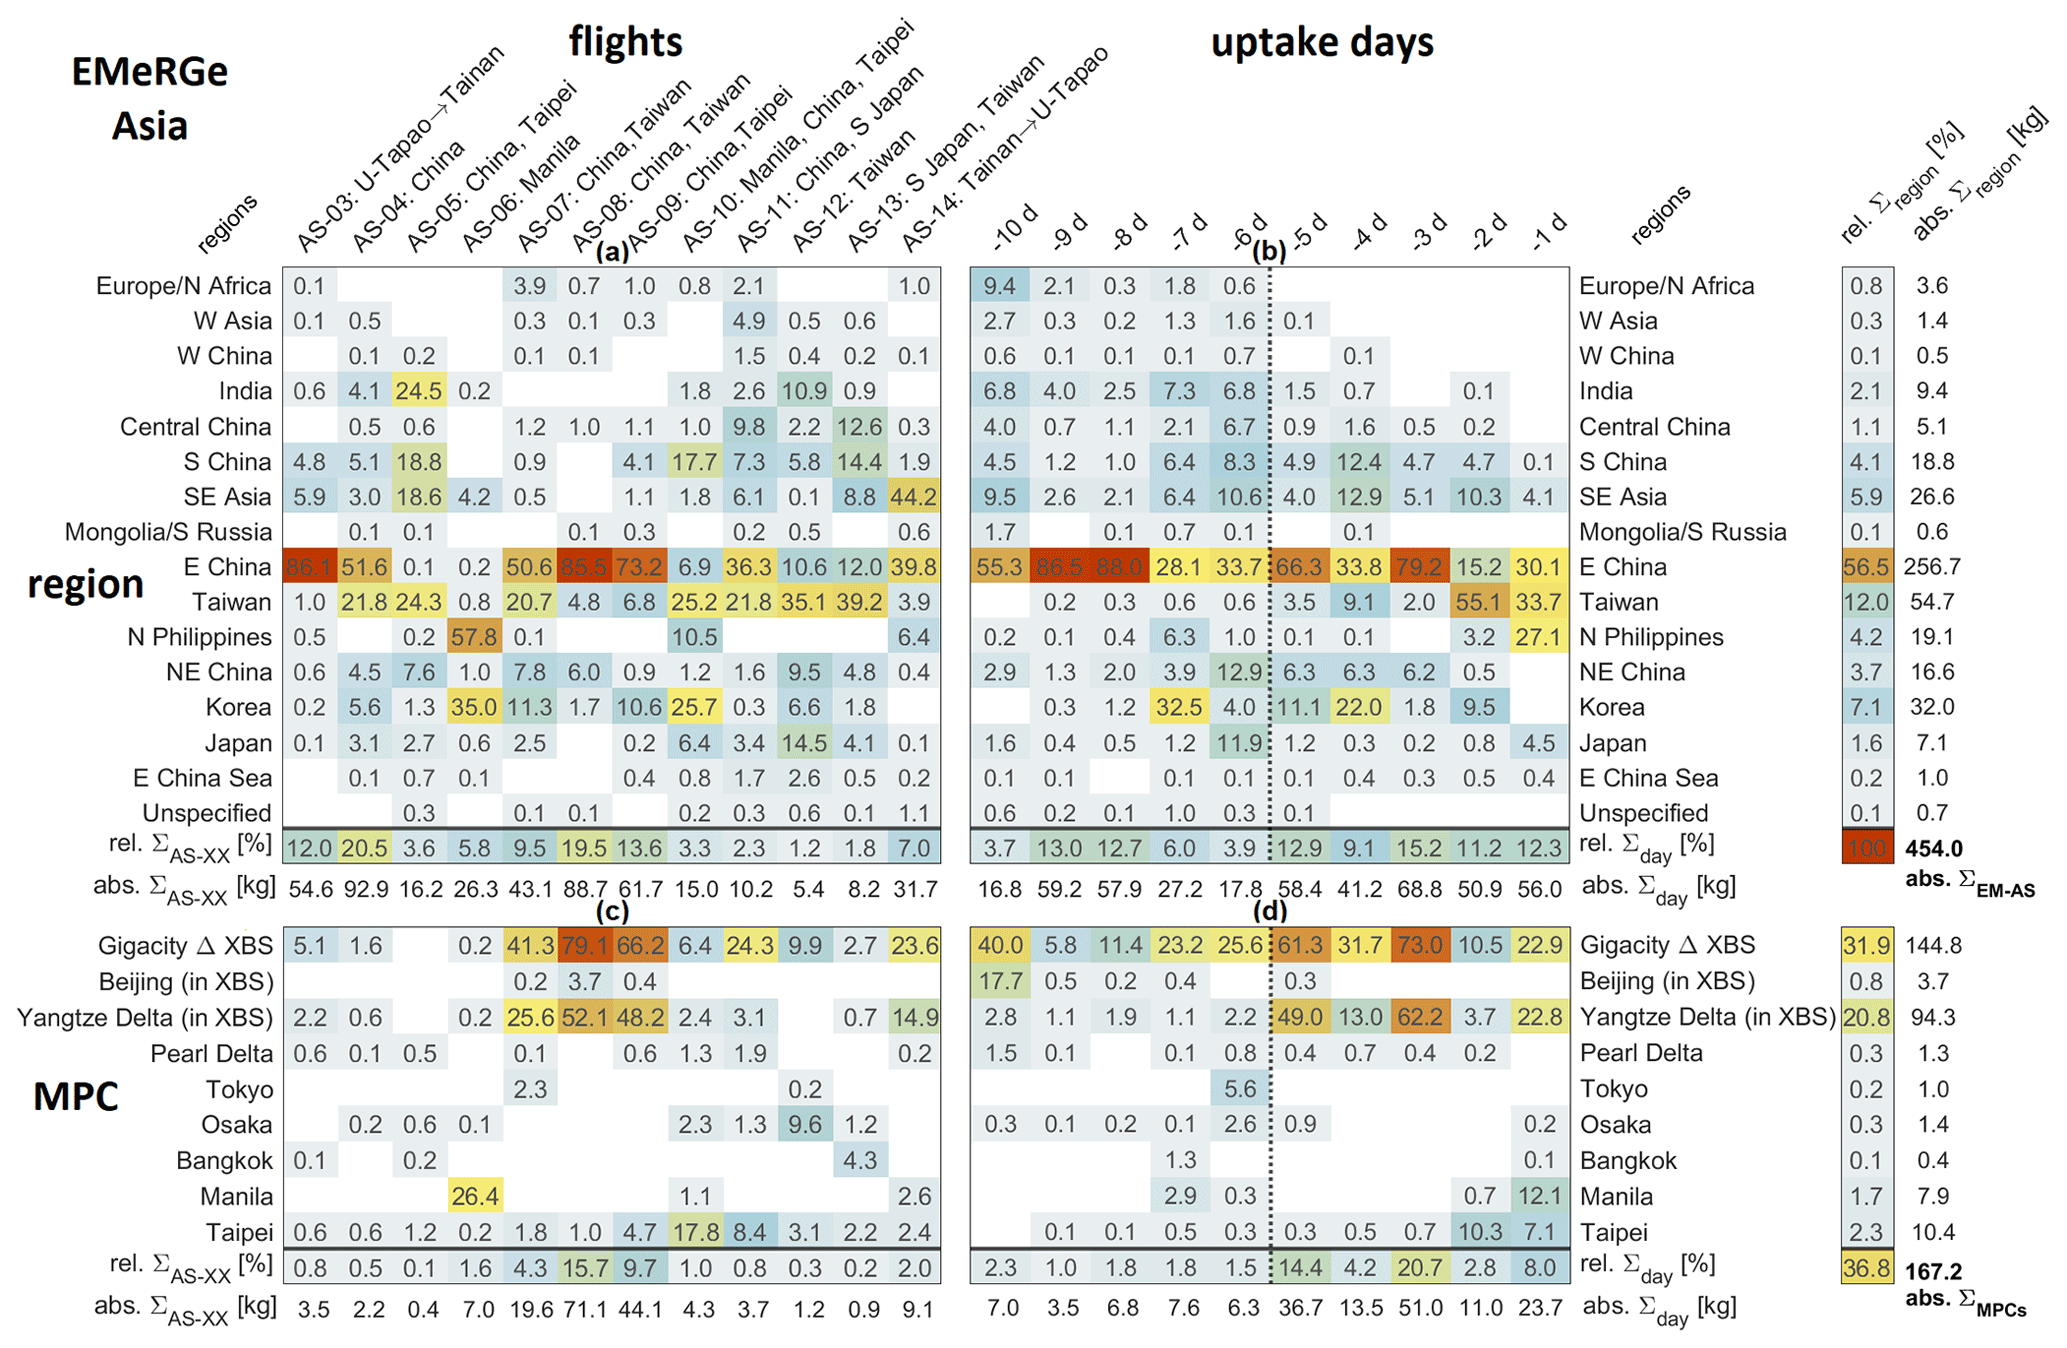
Figure 8Absolute and relative CO contribution potentials of 15 source regions and nine MPCs (listed in Table 4) during EMeRGe-Asia. Absolute values (uncoloured rows) give the sum of contribution potentials for single flights (abs., uptake days (abs.∑day), as well as for source regions and MPCs (abs.∑region). For EMeRGe-Asia, the total uptake sum is 454.0 kg (abs.∑EM-AS) and for the selected MPCs 167.2 kg (abs.∑MPC). Small deviations between absolute value sums and the total uptake sum are caused by rounding. Relative contribution potentials (colour-coded) of individual source regions are separated into contributing emission uptakes per flight (a, c), normalised to the absolute uptake sum per flight (regionAS-XX/abs.∑AS-XX), as well as separated into contributing emissions for the 10 particular uptake days prior to sampling with HALO (b, d), normalised to the absolute uptake sum per uptake day (regionday/abs.∑day). Relative uptake sums rel.∑x are normalised to the total uptake sum (rel., with x=AS-XX, day and region). Target regions are given in the column label after flight labels. Regions are sorted by location from west (top) to east (bottom). Unspecified includes all areas outside the selected regions. XBS – Xian–Beijing–Shanghai.
4.3.2 EMeRGe-Asia
Compared to EMeRGe-Europe, modelled emission uptakes are much larger and vary more from flight to flight (Fig. 8a and c). AS-12 shows the smallest uptake (targeting Taiwan) comparable with the EMeRGe-Europe flights. AS-04 has the largest uptake (targeting Chinese outflows), 17 times larger than that of AS-12. Furthermore, in relation to the completed flight hours (for comparable flight characteristics, see Fig. 1), the uptakes during EMeRGe-Asia are ∼6 times larger than during EMeRGe-Europe, representing the overall large pollution sources probed during EMeRGe-Asia.
As indicated in Fig. 8b and d, large contributions are from uptakes on the first 5 d prior to probing (61 % of ∑EM-AS). As expected, air masses from Taiwan (Taipei), east China and northern Philippines (Manila) comprise mostly signatures of fresh pollution due to probing in their proximity. East China has the largest contribution for nearly all uptake days, showing a constant large pollution outflow. The small contributions of Europe/northern Africa, western Asia and India are mostly taken up 6 and more days prior to probing with HALO, indicating LRT. As one of its main targets, EMeRGe-Asia successfully probed the outflow of Mainland China (contribution of ∼66 %), which is unambiguously represented by the large contribution from the source region east China with ∼57 %. Emission uptakes of other source regions thus appear much smaller, on average, e.g. Taiwan (12 %), Korea (7 %), Southeast Asia (6 %), northern Philippines, and south and northeast China (each ∼4 %). However, much stronger contributions have been sampled during individual flights.
A further aim was the probing of recent and transported outflows of Asian MPCs. Uptakes over the Yangtze Delta show an overall contribution of ∼21 % and Taipei and Manila of 2 %. The MPC agglomeration in between the triangle Xian–Beijing–Shanghai (including the MPCs Beijing and Yangtze Delta) shows the largest contribution during EMeRGe-Asia with ∼32 % and is mostly dominated by uptakes of the Yangtze Delta in the first 5 d prior to probing. The MPC emissions are taken up mainly during flights AS-07 to AS-09 (Fig. 8c). Uptakes from Taipei contributed in small fractions during most of the flights and mainly as recent emissions (Fig. 8d) due to the close location to the flight base Tainan. Emission uptakes of the other listed MPCs are negligible. All uptakes of MPCs contribute to ∼37 %.
In summary, the measurement approach of EMeRGe covered large regions during each flight, and “jumping” from MPC to MPC resulted in a large spectrum of sampled air masses. During each flight different source signatures have been observed, that is, from MPCs (the initial target areas) but also from surrounding regions, as well as from polluted air masses transported over longer distances. Likewise, the degree of chemical processing and mixing varied. A more detailed inspection of MPC outflows is difficult and would require more close proximity flights. However, due to flight restrictions close to MPC airspaces this is not easily realised. In contrast, the regional-scale measurement approach nicely enabled us to cover the full range and thus fate of air masses, from fresh pollution close to MPCs to chemically processed and already mixed air masses to background air. The results of EMeRGe thus allow us to provide some general recommendations on the observation strategy of future aircraft campaigns (see Sect. 5).
4.4 Linking and partitioning modelled source region emissions to observations
To analyse source-region-specific fingerprints, we link the trajectory- and inventory-based, anthropogenic CO uptakes with the EMeRGe observations. First, we outline our systematic approach (comprising the following three steps), and secondly, we will present the analyses. The aim is to distinguish observation periods that are significantly influenced by pollution events of our EMeRGe target regions from other source region pollution.
4.4.1 Step 1
We sum up the modelled source-region-specific CO uptakes along the trajectory pathway (their release points have a 1 min time resolution along the HALO flight track, as explained in Sect. 3.2.3 and Fig. 3) and assign and distribute these uptake sums equally to 60 s centred at the trajectory release point (assuming that the trajectory is representative for the minute). This is done for every trajectory to cover the complete measurement time resolution (1 s) of HALO. Figure 9 illustrates this first step for flight EU-06, linking the modelled CO uptake sums with observations.
4.4.2 Step 2
Next, we analyse the contribution of the individual source regions to the CO uptakes per trajectory. To consider only significant CO uptakes, we omit small ones, which in sum add up to 5 % of the total CO uptake sum of the respective campaign part, that is, ∼2.6 g individual CO uptake per region for EMeRGe-Europe and ∼20.6 g CO for EMeRGe-Asia. Afterwards, the source region partitioning of every trajectory uptake is examined. Hence, a CO uptake sum can comprise emissions of a single or of a few source regions. In the following, we refer to CO uptake sums consisting of single source region emissions as “non-mixed” and CO uptake sums consisting of emissions from various regions as “mixed”.
4.4.3 Step 3
Summarising all individual contribution patterns derived in step 2, again assigned to the corresponding observations (in time and space) as mentioned in step 1, results in frequency distributions of source regions that contribute with non-mixed or with mixed emission uptakes to the EMeRGe observations. Table 5 lists these contributing source regions and MPCs. We additionally provide an equivalent list in the Supplement (Table S4 in Sect. S7), where we also consider the small CO uptakes, omitted in step 2. This shows that even more source regions contribute to the “mixed emissions”. These additional regions are often large and have small emission rates and thus small uptakes, like the North Atlantic during EMeRGe-Europe or the East China Sea during EMeRGe-Asia.
As mentioned above, Fig. 9 illustrates step 1 for the flight EU-06. Note that the modelled CO uptakes are not directly comparable to the measured CO, because chemical decay and dilution processes are missing in the simple uptake approach. Therefore, they are not able to reflect temporal variations or amplitudes comprehensively. However, large and small CO uptake sums (Fig. 9b) show a reasonable coincidence to observed CO enhancements (above a background of 80–90 ppbv). Contributions from different source regions (Fig. 9c) also depend on sampling altitudes. At altitudes below 1500 m, nearby emission uptakes of eastern Europe (pink), Po Valley (dark purple), northern Italy (light purple), southern Italy (dark green) and Rome (sea green) dominate, accompanied by enhanced benzene concentrations from recent anthropogenic pollution.
However and as expected, BB signatures also emerge in air masses not linked to CO uptakes (e.g. around 13:30 UTC), which indicate local events not covered by the emission inventory (identified from MODIS (https://firms.modaps.eosdis.nasa.gov/, last access: 13 January 2023) as a local fire near Rome), as well as in the air mass mixture of Rome, northern Italy and eastern Europe between 14:45 and 15:30 UTC. Air masses at higher altitudes above 2000 m originate mainly from the Iberian Peninsula (reddish colours) and northern Africa (yellow), showing very small CO uptakes and correspondingly low measured CO concentrations between 70 and 90 ppbv.
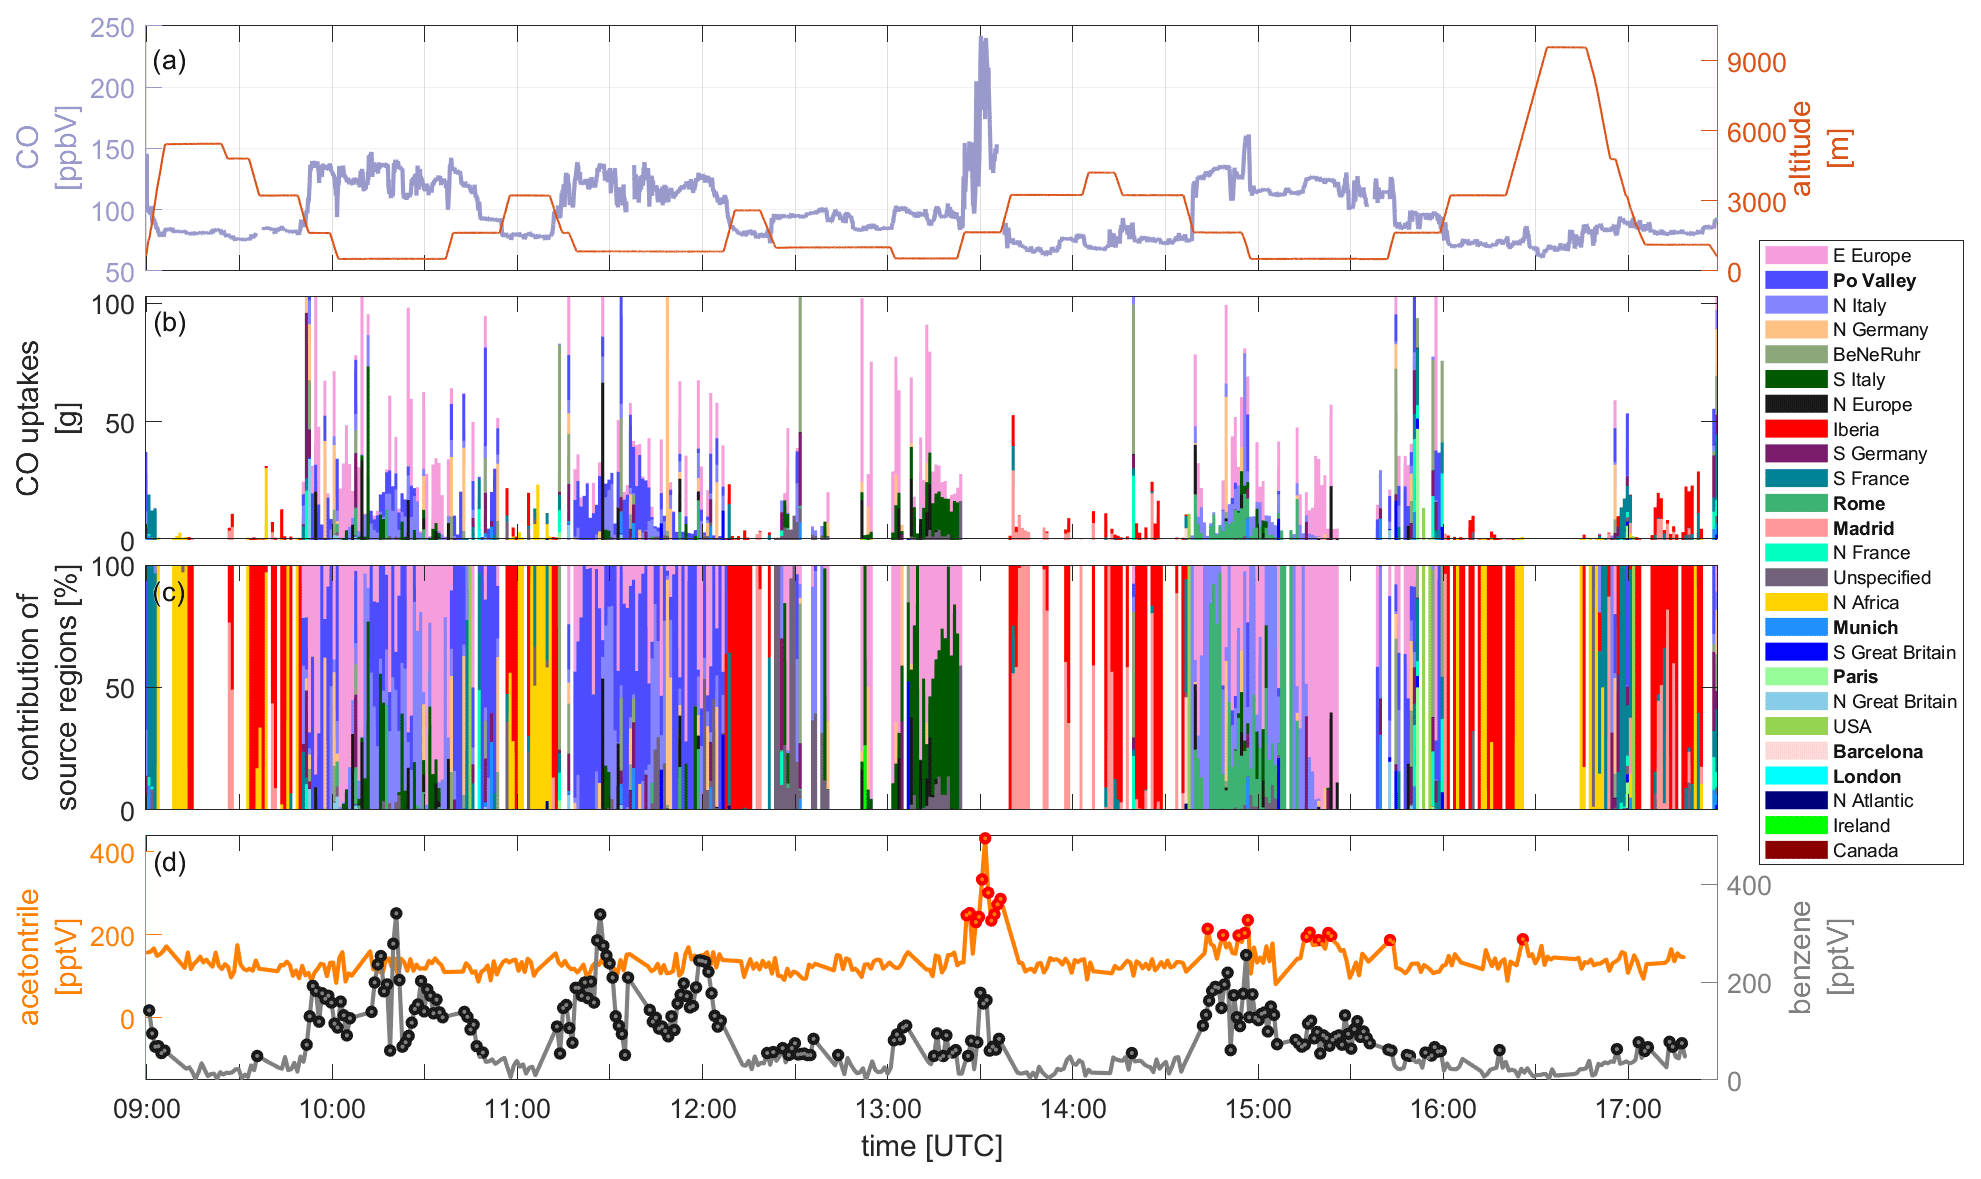
Figure 9Time series of modelled source-region-specific CO uptakes and measured CO, acetonitrile and benzene for the EMeRGe-Europe flight EU-06, 20 July 2017, targeting Italian outflows. (a) CO measurements and flight altitude, (b) modelled CO uptake sums along 10 d back trajectories colour-coded by originating source regions (sorted by total flight uptake sums – top to bottom, MPCs in bold), (c) relative contribution of source regions on CO uptake sums, and (d) acetonitrile and benzene measurements with colour-coded tracer enhancements over defined threshold (red and black dots, respectively).
Overall, Table 5 shows that during EMeRGe-Europe ∼46 % of significant CO uptakes are linked to the observation period and 26 % during EMeRGe-Asia. The reason behind the smaller fraction during EMeRGe-Asia might be the larger absolute uptake value in step 2 (20.6 g CO uptake versus 2.6 g) for considering significant uptakes.
4.4.4 EMeRGe-Europe
Table 5 (left) indicates that the major temporal contributions are from southern France, the Iberian Peninsula, the USA, Madrid and southern Great Britain, that is, they are from LRT within the west wind drift zone, as well as from southwestern and northwestern target regions in Europe. Often, these outflows dispersed during transport and were also sampled as “mixed emissions”. Besides Madrid, also the MPCs London, Munich (flight base), Po Valley and Paris contribute as significant sources. Emission uptakes of London are mostly identified in conjunction with uptakes from southern Great Britain and Ireland (SGB–LON, IRE–SGB–LON), since HALO sampled predominately over the English Channel where pollution of these regions has already mixed. The temporal contribution of Po Valley is rather small, although probed during two flights, similar to northern Italy, most likely indicating more confined air masses due to probing in closer proximity. The Paris outflow is most frequently identified in conjunction with emission uptakes from Munich, probed close to the flight base (not shown), indicating advection of the Paris outflow to southern Germany. Altogether, we can obtain individual chemical fingerprints of the MPCs Madrid, Munich, Po Valley and London.
Table 5Trajectory-based emission contributions from different source regions (left from EMeRGe-Europe, right EMeRGe-Asia), listed according to temporal frequency and magnitude (contribution in percentage, flight time in minutes, uptake sum in kilogram). Mixtures (of significant uptakes) from different source regions are indicated by en dashes, e.g. “IRE–SGB”. MPCs are highlighted with bold letters. Small uptakes, in sum 5 % of the total modelled uptake sum of the respective campaign part, and contributions of less than 10 min flight time are omitted. The upper part indicates the overview (sums) of both campaigns. Residual uptakes are divided into non-mixed and mixed, indicated by italics. MPC contributions are given in brackets. For full names of source regions see Table 4.
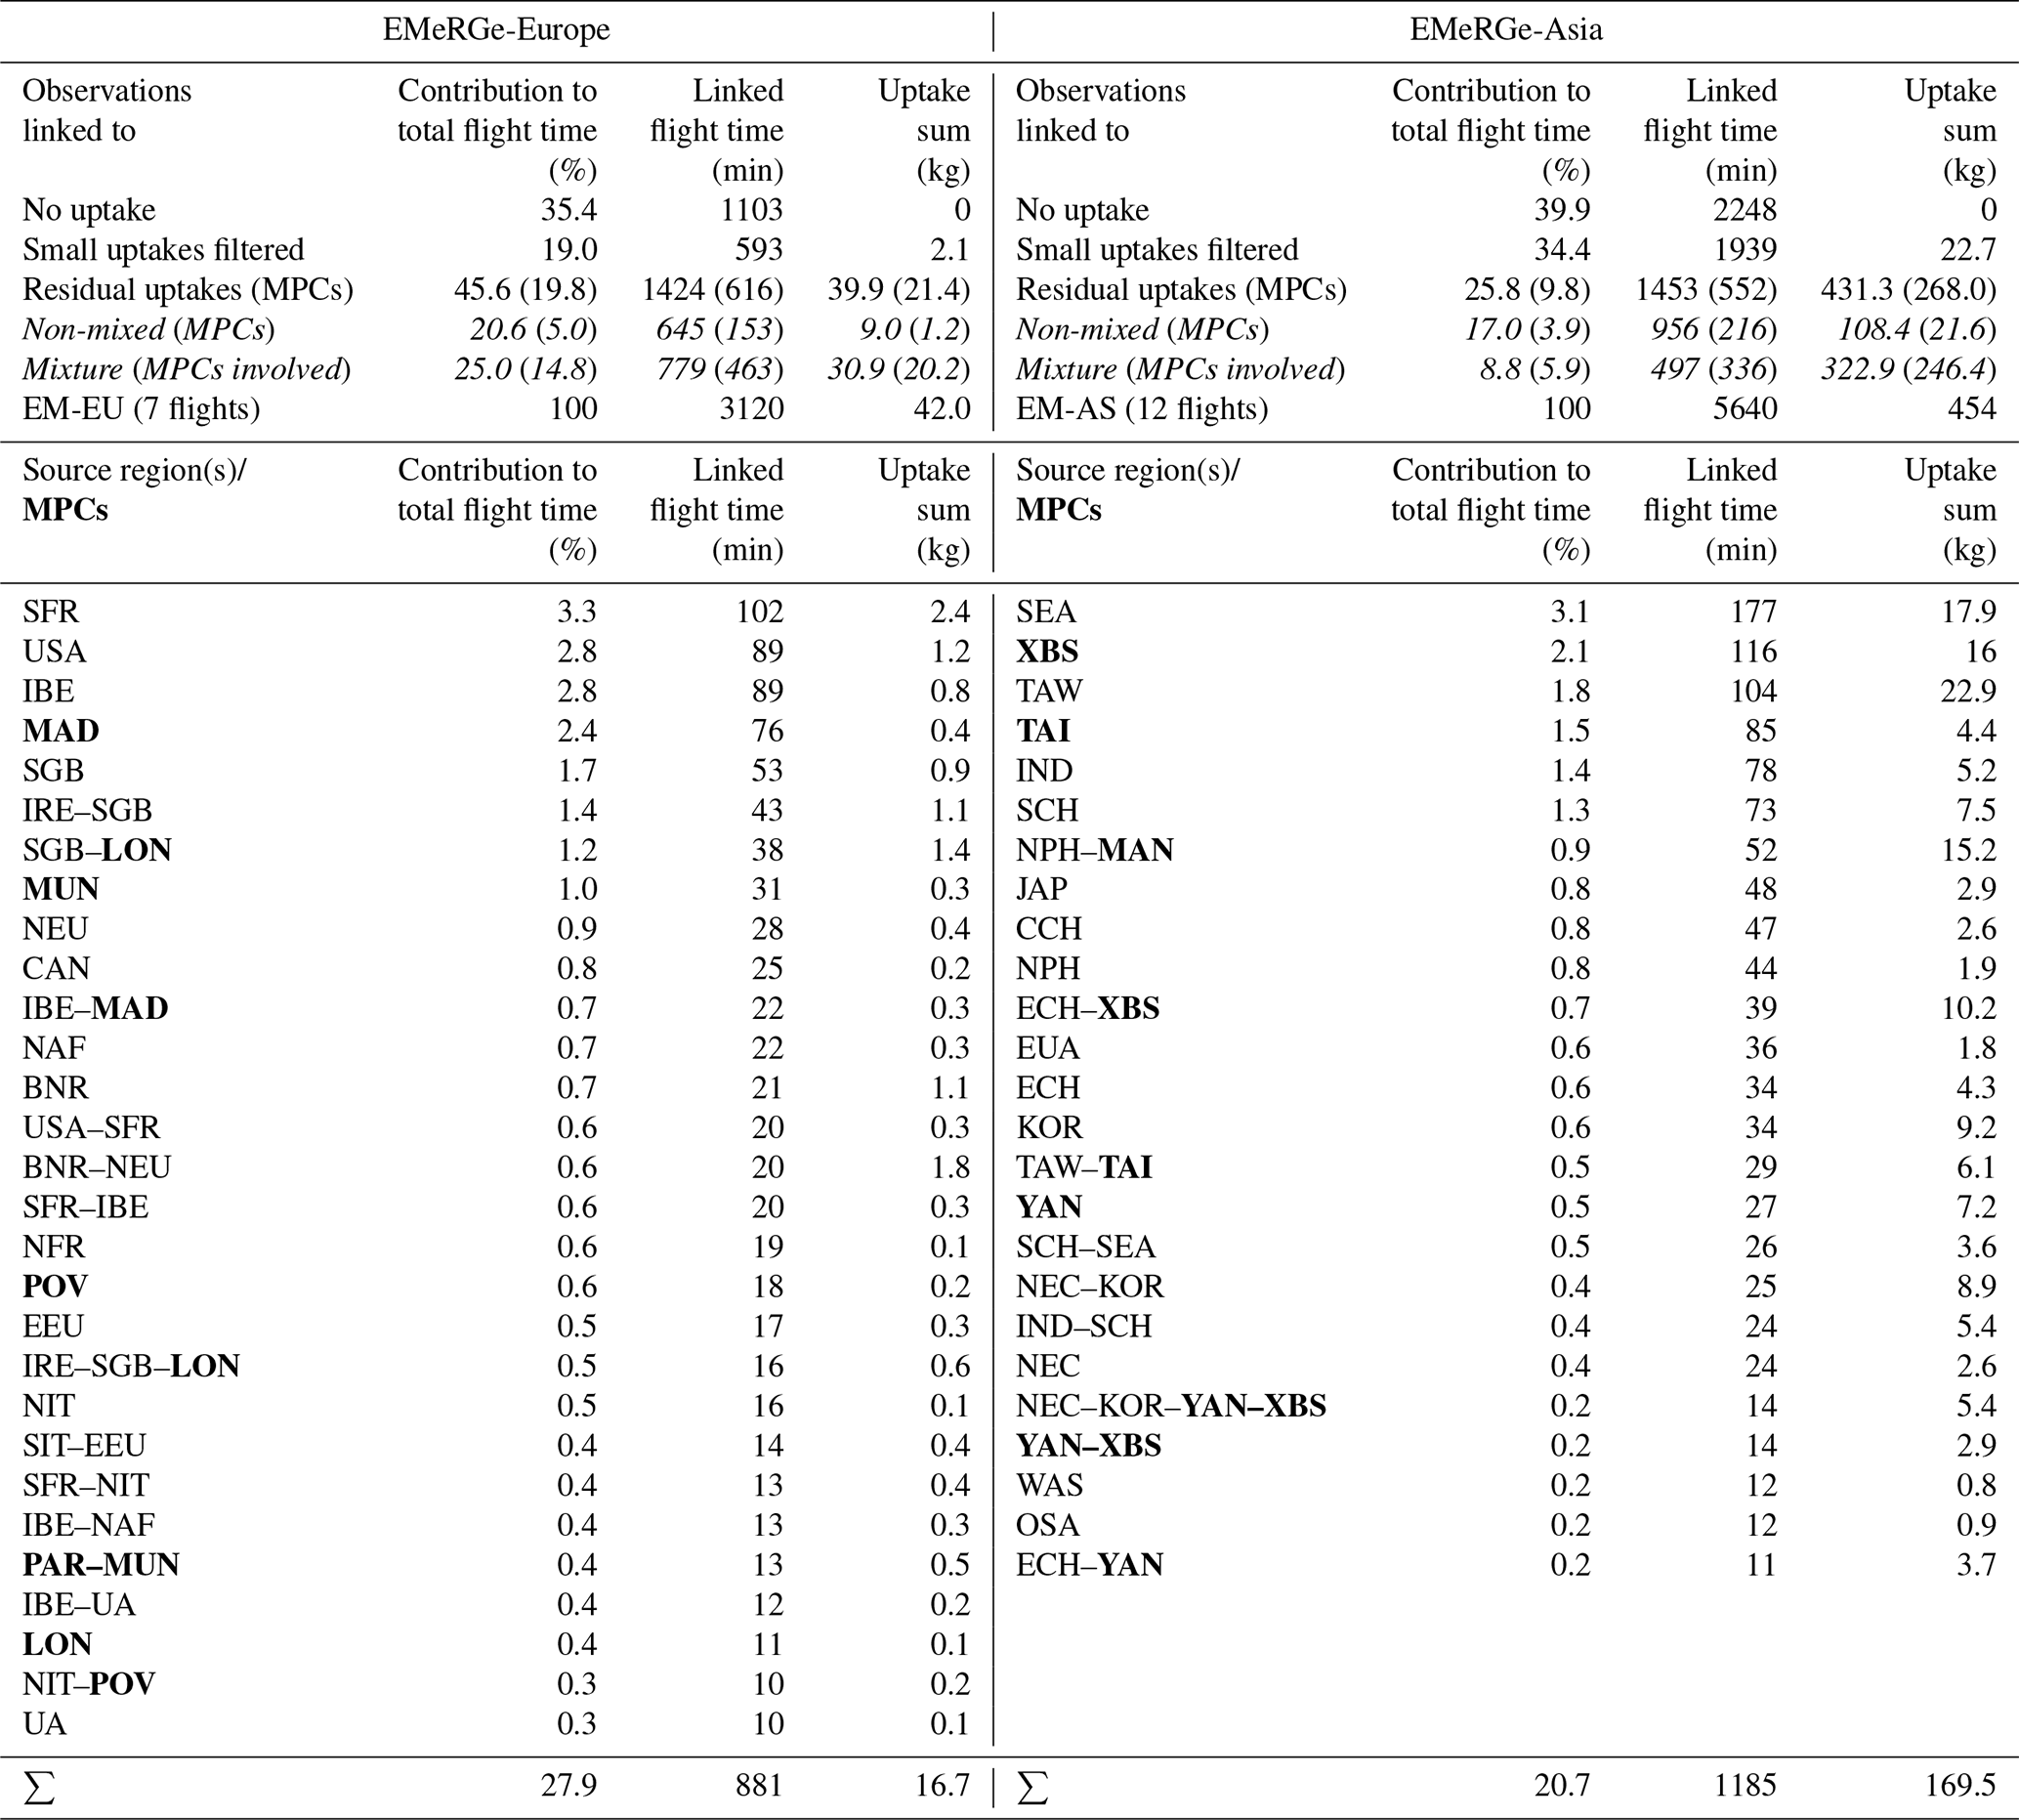
4.4.5 EMeRGe-Asia
The source regions Southeast Asia, the gigacity Xian–Beijing–Shanghai, as well as Taiwan, Taipei, India and south China contributed most to the sampled pollution events (Table 5, right), showing extensive probing of local pollution (Taiwan and Taipei) and of short-range (Chinese outflow) and long-range transport (Southeast Asia and India). For EMeRGe-Asia, we can obtain fingerprints of individual MPC air masses of Xian–Beijing–Shanghai, Taipei, Yangtze Delta and Osaka.
The summary in the header of Table 5 shows that our trajectory-based source identification did not show CO uptakes (in the last 10 d) for 35 % (EMeRGe-Europe) and 40 % (EMeRGe-Asia) of the total flight time. However, these air masses can also comprise signals, either of aged pollution or from sources not covered by the inventory. Moreover, in 19 % (EMeRGe-Europe) and 34 % (EMeRGe-Asia) of the total flight time small/negligible contributions are inferred and not considered. Thus, the remaining flight time of 46 % (EMeRGe-Europe) and 26 % (EMeRGe-Asia) was characterised as significantly polluted and attributed to certain source regions as outlined below.
The temporal contribution of emission mixtures linked to observations is half as small during EMeRGe-Asia (11 %) compared to EMeRGe-Europe (25 %). However, uptake totals of mixtures relative to the total uptakes of both campaigns are comparable (∼70 %), indicating that during EMeRGe-Asia especially emission mixtures of multiple source regions are involved in more compact but strongly polluted air masses. MPC linkages are likewise comparable. Together, the linkage of significant MPC emissions involved in uptakes is ∼20 % during EMeRGe-Europe and ∼10 % during EMeRGe-Asia. These numbers again confirm that EMeRGe not only probed pollution of distinct regions and mixtures of several regions but also air masses with no recent contact to emission sources in the PBL. However, mixtures account for most of the emission uptakes (∼31 of 42 kg during EMeRGe-Europe and ∼323 of ∼454 kg during EMeRGe-Asia), and hence we can assume that they will dominate measured trace gas enhancements.
4.5 Chemical fingerprints of source region emissions
By linking the modelled trajectory- and inventory-based partitioning of source regions and MPCs (Table 5, based on the approach explained in Fig. 3) and the observed VOC-based source signatures (see Sect. 4.1), we aim to characterise air masses of sampled source region pollution and MPC pollution. The approach is simple. We used the identified source region contributions (Table 5) as a filter for our observed VOC-based signatures (Fig. 4b, c) to generate composites of the source region source signatures.
4.5.1 EMeRGe-Europe
Figure 10 shows the fractions of chemical fingerprints (source signatures I and II, for a detailed explanation see Table 3) for the 28 source regions and MPCs listed in Table 5 (left). The main features of the EMeRGe-Europe source regions are anthropogenic (AP, black) and background (BG, blue) signatures, whose fractions differ from source region to source region. The fraction of present background air reaches e.g. more than 50 % in LRT air masses from the USA and Canada (CAN), as well as in the mixture of the Iberian Peninsula (IBE) and northern Africa (NAF). Here, VOCs are already decayed. Due to the CO uptake approach, measured CO might be decayed or diluted as well in these air masses. When fractions of background air are small, anthropogenic signals dominate.
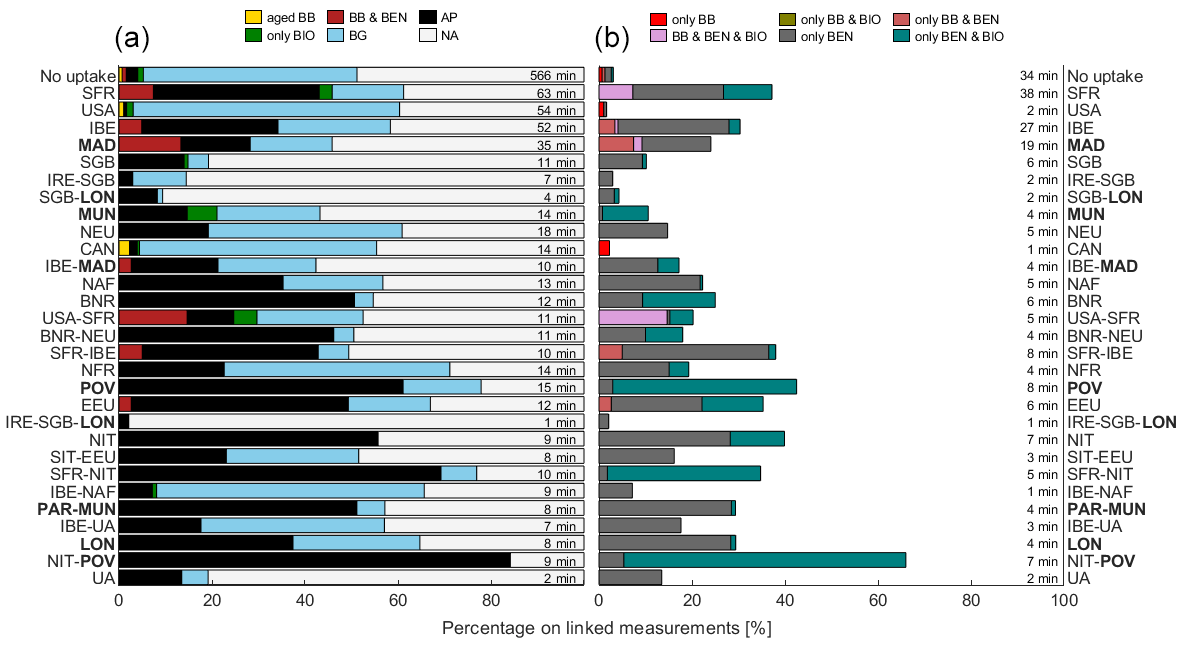
Figure 10Source signatures (I – left and II – right, using the tracers acetonitrile, benzene and isoprene) of contributing regions as chemical fingerprints during EMeRGe-Europe. The temporal contribution of identified signatures to the measurements is shown on the right-hand side of the bars and differ from signatures I to II due to the usage of two and three tracers, respectively. For full names of source regions see Table 4. For abbreviations of source signatures see caption in Fig. 4.
The largest anthropogenic fractions (50 %–80 %) show Po Valley (POV), northern Italy (NIT), eastern Europe (EEU), as well as the Belgium–Netherlands–Ruhr area (BNR) and some mixtures that comprise emissions of these regions. Anthropogenic signals also occur together with biogenic signatures (only BEN & BIO, Fig. 10, right), especially in air masses originating from Po Valley and northern Italy, indicating the mixture of recent anthropogenic and biogenic emissions. Separate biogenic signals (only BIO) are sparse and only present in Munich (MUN), southern France (SFR), as well as the mixture USA–SFR. Minor biogenic signals are surprisingly also present in air masses from the source region USA and air masses with no uptakes, probably due to contributions of fresh local biogenic emissions not covered by the CO uptake scheme.
We could also identify BB signals in outflows of southern France, the Iberian Peninsula, Madrid (MAD) and eastern Europe (EEU), as well as in some mixtures of regions (e.g. USA–SFR and SFR–IBE). These BB events (identified by enhanced acetonitrile) were mostly rich in benzene too, indicating fresh fires and/or mixtures with anthropogenic sources. A minor signal of aged BB is present in air masses originating in Canada.
All three tracers show partly simultaneous enhancements in air masses originating from southern France and in the mix of southern France/USA, which can be attributed to a local BB event near Marseille that was directly visible from the aircraft during flight EU-07.
Due to (i) instrumental background detection, (ii) the PTR-MS duty cycle gaps (as described in Sects. 3.1.2 and S4) and (iii) no available VOC data during flight EU-05 (targeting London), the possible assessment of source signatures differs largely in the different source region composites, represented by the white bars in Fig. 10 (left).
4.5.2 EMeRGe-Asia
During this campaign part, we obtain chemical fingerprints of 25 source region composites (Fig. 11). In contrast to EMeRGe-Europe, the source regions show much larger fractions of anthropogenic signatures (black) and BB signatures (dark red and yellow). The largest anthropogenic fractions (60 %–90 %) are present in air masses originating from northeastern China (NEC), Yangtze Delta (YAN), eastern China (ECH), Taipei (TAI), the area Xian–Beijing–Shanghai (XBS) and mixtures of those regions. The pure anthropogenic signatures occur mainly without other signatures. Only in some cases are they accompanied by biogenic signals, e.g. in Taiwan mixtures, most likely due to the sampling of local fresh pollution from the PBL.
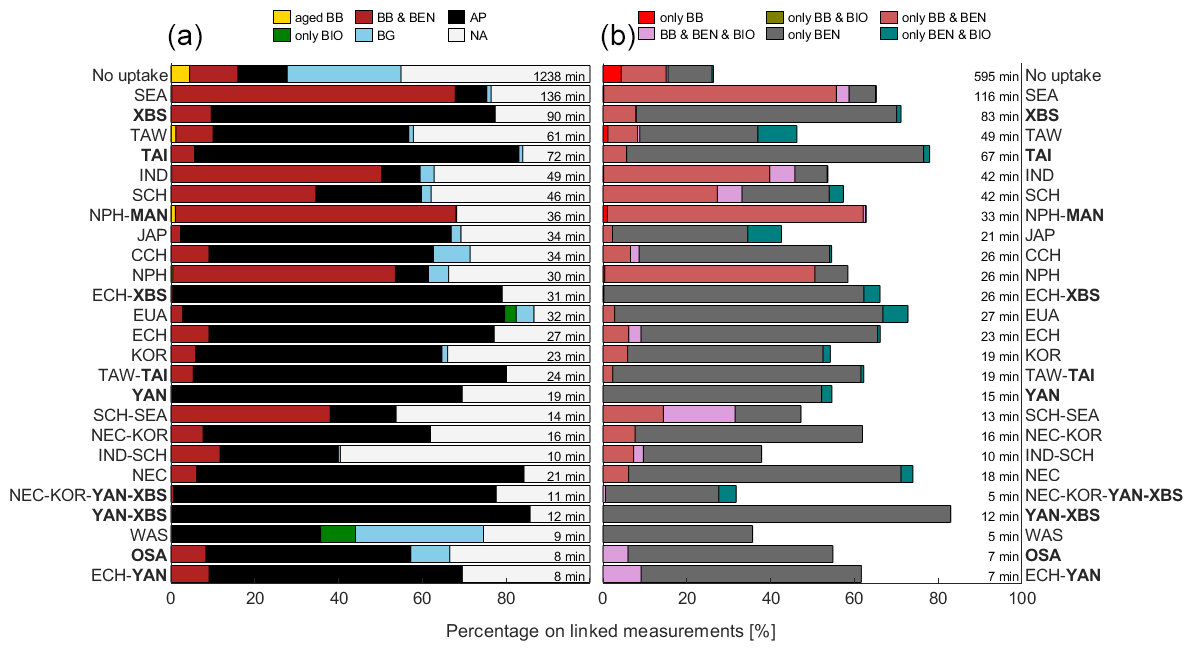
We identified BB signals in nearly all outflows, besides western Asia (WAS) and the Yangtze Delta (YAN) mixtures. However, Southeast Asia (SEA), the northern Philippines (NPH), as well as the mixture with Manila (NPH–MAN), India (IND) and southern China (SCH) show the largest BB influence (30 %–70 %). In air masses without uptake, we also identified aged BB signals and hence processed air. Source signatures II (Fig. 11, right) show that BB occurs mainly together with benzene enhancements, indicating fresh BB events and/or mixtures with anthropogenic pollution.
The enhancement of all three tracers (pink bar, e.g. in Southeast Asian mixtures and India) may indicate fresh BB. However, why short-lived isoprene is still present in air masses transported from India requires further investigation. The same applies for air masses from western Asia (WAS) and Europe/Africa (EUA).
Unambiguously, the fraction of background air (BG) is quite small in the source region composites of EMeRGe-Asia (less than 10 %); only air masses with no uptake and from western Asia show a larger fraction (∼30 %) of no present VOC-based source signatures.
In light of increasing urban agglomerations and global warming, the airborne campaign EMeRGe (2017 and 2018) investigated transport patterns and transformation processes of European and Asian megacity outflows. Using observed VOCs as chemical tracers, back trajectories and the EDGAR emission inventory, we characterise the air masses probed during EMeRGe-Europe (July 2017) and EMeRGe-Asia (March and April 2018) and identify their origins, attribute source properties and discuss the fate of the polluted air masses while being transported towards our sampling region.
We measured up to nine different VOCs simultaneously (see Table 1), which allowed the identification and characterisation of polluted air masses by the exceedance of certain VOC thresholds. During EMeRGe-Europe, air masses with no enhancements, that is, background air, dominated. However, anthropogenic signals (identified using benzene) were encountered frequently, but BB events (identified using acetonitrile) played a minor role. Furthermore, we identified minor fresh biogenic signatures during EMeRGe-Europe, partly coinciding with anthropogenic signals. During EMeRGe-Asia, fresh anthropogenic signals dominated, followed by frequent BB events but rare encounters of fresh biogenic signals.
To attribute sampled pollutants to their source regions, we seeded back trajectories along the flight path (using FLEXTRA, driven by ERA5 winds) with anthropogenic CO emissions derived from the EDGAR emission inventory (see Sect. 3.2). With this Lagrangian approach, we modelled the CO emission uptake when trajectories traverse the planetary boundary layer. For simplicity and due to the short back trajectory duration of 10 d, we neglected loss of CO by oxidation and dilution processes during transport. The majority of all emission uptakes (∼40 %) during EMeRGe-Europe originated from southern Great Britain, the Belgium–Netherlands–Ruhr area and southern France (see Sect. 4.2.2. and Fig. 7). The seven target MPCs (listed in Table 4) contributed to about 16.5 % of the modelled emissions. During EMeRGe-Asia, HALO probed 66 % of the outflow of Mainland China (see Fig. 8), with further contributions of ∼25 % from Taiwan (12 %), Korea (7 %) and Southeast Asia (6 %). Specifically, emission uptakes of target MPCs (Table 4) contributed to ∼37 %, mainly from the megacity agglomeration inside the triangle Xian–Beijing–Shanghai and from some recent uptakes of Taipei and Manila. During both campaigns, both fresh and chemically processed pollution were sampled, in which ∼50 % of the probed air masses had contact with pollution sources in the last 3 to 4 d prior to the measurement. Overall, our emission-inventory-based approach indicated ∼6-times-higher amounts of pollutants at sampling altitudes during EMeRGe-Asia than during EMeRGe-Europe (both have comparable flight characteristics; see Fig. 1), with respect to the completed flight hours.
To analyse source region specific fingerprints, we linked the modelled anthropogenic CO uptakes with the EMeRGe observations. Since air parcels (represented by the trajectories) can traverse through PBLs of multiple source regions, the resulting air masses sampled on board HALO may not only comprise traces of pollution from a single source region (referred to as non-mixed) but also of different regions (referred to as mixed emission). To consider only “significant contributions” for all uptake events, we omitted source regions with small uptake contributions (in sum 5 % of the total uptake sum of the respective campaign part; see Sect. 4.2.3). In sum, we could link ∼50 % (EMeRGe-Europe) and ∼30 % (EMeRGe-Asia) of all sampled air masses to the pollution outflow of certain regions and MPCs. The chemical fingerprints differ from region to region. During EMeRGe-Europe, we found the largest fractions of anthropogenic signals in outflows of Po Valley, northern Italy, London and the Belgium–Netherlands–Ruhr area, during EMeRGe-Asia of northeast and east China, as well as of Taipei. During EMeRGe-Europe, the anthropogenic signals coincide partly with biogenic signatures, indicating recent contact to the PBL. We identified BB signals in outflows of southern France, the Iberian Peninsula, Madrid and eastern Europe (EMeRGe-Europe), as well as of Southeast Asia, the northern Philippines (including Manila), India and southern China (EMeRGe-Asia). The BB signals are almost exclusively accompanied by benzene enhancements, indicating fresh burning events and/or mixtures with anthropogenic sources, since benzene can originate from both BB and anthropogenic sources.
Overall, our “source attribution approach” showed (i) that during most flights anthropogenic pollution of target regions has been successfully probed, and (ii) that this approach in conjunction with the measured VOC-based (chemical) fingerprints provides reasonable findings. However, the majority of polluted air masses could not be attributed to the target MPCs because of the large-scale measurement approach of EMeRGe. Closer sampling in altitude and location to the MPCs was unfortunately not possible due to the strict flight restrictions near the target population hotspots. Nonetheless, the identified source signatures and regions enable subsequent studies either to analyse other trace gas measurements in the different source regimes or to help refine the dynamical identification of individual MPC outflows. A more detailed characterisation of MPC outflows regarding chemical transformation is difficult, because chemical and microphysical transformations will lower concentrations such that relative enhancements become hard to detect. In addition, the dispersion and mixing of pollution plumes at different processing stages make it very challenging to investigate the chemical transformations of individual MPCs in the measurements. Here, PFC tracer experiments conducted during EMeRGe can further support a comprehensive analysis.
In conclusion, EMeRGe provides unique near- and far-field trace gas data from urban hotspots to study the transport and chemical processing of pollution outflows and to validate atmospheric models. To quantitatively capture a more robust picture of megacity emissions, a network of different measurement platforms with strong model support is required, which covers a range of spatial and temporal scales: local ground-based and local airborne measurements are necessary to understand the structure of pollution outflows; large-scale airborne measurements provide information on the transport and mixture of multiple pollution outflows, and satellite measurements are essential to monitor global distributions, the evolution of outflows and their processing into background air. Finally, model simulations enable the linkage of these versatile measurements.
With FLEXTRA back trajectories based on ERA5 wind fields and the EDGAR emission inventory, we utilised state-of-the-art model data together with an extensive set of VOC tracers, enabling the study of elaborated chemical fingerprints. Hence, our work demonstrates the strength of combining the complementarity of a trajectory-based method to cross-reference regions of air mass origin and direct measurements to highlight different pollution sources/categories in describing MPC outflows measured along flight routes, i.e. during EMeRGe. Finally, our approach provides an opportunity to test inventories and to improve underlying models.
| AMTEX | AtMospheric Trace EXperiment |
| AP | Anthropogenic signatures |
| BB | Biomass burning signatures |
| BIO | Biogenic signatures |
| CityZen | megaCITY – Zoom for the ENvironment, https://cordis.europa.eu/project/id/212095 (last access: 13 January 2023) |
| Parameter used in ion mobility studies. E: electric field in the drift tube, N: number density of the gas in the drift tube, de Gouw et al. (2003b) | |
| ECMWF | European Centre for Medium-Range Weather Forecasts |
| EDGAR | Emissions Database for Global Atmospheric Research |
| EMeRGe | Effect of MEgacities on the transport and transformation of pollutants on the Regional to Global scales |
| ERA5 | Fifth-generation ECMWF reanalysis |
| FAAM | Facility for Airborne Atmospheric Measurements |
| FLEXPART | FLEXible PARTicle dispersion model |
| FLEXTRA | FLEXible TRAjectory model |
| HALO | High Altitude and LOng Range Research Aircraft |
| HKMS | HALO Karlsruhe Mass Spectrometer |
| IAGOS-CARIBIC | In-Service Aircraft for a Global Observing System – Civil Aircraft for the Regular Investigation of the Atmosphere Based on an Instrument Container |
| LOD | Limit of detection |
| LRT | Long-range transport |
| MEGAPOLI | Megacities: Emissions, urban, regional and Global Atmospheric POLlution and climate effects, and Integrated tools for assessment and mitigation, Baklanov et al. (2010) |
| MILAGRO | Megacity Initiative: Local And Global Research Observations, Molina et al. (2010) |
| miniDOAS | Compact differential optical absorption spectrometer, Hüneke et al. (2017) |
| MPC | Major population centre |
| PBL | Planetary boundary layer |
| PTR-MS | Proton-transfer-reaction mass spectrometry |
| QMS | Quadrupole mass spectrometer |
| Td | Townsend (1 Td = 10−17 V cm2), unit of , de Gouw et al. (2003b) |
| VMR | Volume mixing ratio |
| VOC | Volatile organic compound |
VOC data of the HKMS are stored in the HALO database (https://doi.org/10.17616/R39Q0T, re3data.org, 2020) and can be accessed upon signing a data protocol. EDGAR CO emission rates are available at https://edgar.jrc.ec.europa.eu/dataset_ap61 (last access: 13 January 2023, Crippa et al., 2022). FLEXTRA back trajectories merged with selected ERA5 parameters can be obtained upon request from Alexandros Panagiotis Poulidis (alepou@uni-bremen.de).
The supplement related to this article is available online at: https://doi.org/10.5194/acp-23-1893-2023-supplement.
EF operated the PTR-MS; processed the VOC raw data; analysed the data; and prepared the manuscript with contributions and revisions by HB, MN, FO, AZ, APP, MV and PB. ML provided the CO measurements. AH, ABKH, ND, APP and MV calculated the FLEXTRA trajectories and merged them with ERA5 meteorological data. All authors have read and agreed to the published version of the manuscript.
The contact author has declared that neither of the authors has any competing interests.
Publisher's note: Copernicus Publications remains neutral with regard to jurisdictional claims in published maps and institutional affiliations.
This article is part of the special issue “Effect of Megacities on the Transport and Transformation of Pollutants at Regional and Global Scales (EMeRGe) (ACP/AMT inter-journal SI)”. It is not associated with a conference.
The authors thank all EMeRGe colleagues for their collaboration, helpful discussions, and support during the HALO flight campaigns and numerous workshops. The FLEXTRA simulations were performed on the HPC cluster Aether at the University of Bremen, financed by the Deutsche Forschungsgemeinschaft (DFG) within the scope of the Excellence Initiative. Hersbach et al. (2018) was downloaded from the Copernicus Climate Change Service (C3S) Climate Data Store. The results contain modified Copernicus Climate Change Service information 2020. Neither the European Commission nor ECMWF are responsible for any use that may be made of the Copernicus information or data it contains.
This work was funded by the Deutsche Forschungsgemeinschaft (DFG) within the project Chemical composition and transformation of VOCs in the
outflow of large population centers in Europe and Asia during
EMeRGe (ChoColate, grant no. NE 2150/1-1) and by the Karlsruhe Institute of Technology. Nikos Daskalakis, Alexandros Panagiotis Poulidis and Mihalis Vrekoussis acknowledge financial support by the Deutsche Forschungsgemeinschaft (DFG,
German Research Foundation) under Germany's Excellence Strategy (university allowance, EXC 2077, University of Bremen) and the University of Bremen.
The article processing charges for this open-access publication were covered by the Karlsruhe Institute of Technology (KIT).
This paper was edited by Anne Perring and reviewed by two anonymous referees.
Amodio, M., de Gennaro, G., Marzocca, A., Trizio, L., and Tutino, M.: Assessment of Impacts Produced by Anthropogenic Sources in a Little City near an Important Industrial Area (Modugno, Southern Italy), Sci. World J., 2013, 1–10, https://doi.org/10.1155/2013/150397, 2013.
Andrés Hernández, M. D., Hilboll, A., Ziereis, H., Förster, E., Krüger, O. O., Kaiser, K., Schneider, J., Barnaba, F., Vrekoussis, M., Schmidt, J., Huntrieser, H., Blechschmidt, A.-M., George, M., Nenakhov, V., Harlass, T., Holanda, B. A., Wolf, J., Eirenschmalz, L., Krebsbach, M., Pöhlker, M. L., Kalisz Hedegaard, A. B., Mei, L., Pfeilsticker, K., Liu, Y., Koppmann, R., Schlager, H., Bohn, B., Schumann, U., Richter, A., Schreiner, B., Sauer, D., Baumann, R., Mertens, M., Jöckel, P., Kilian, M., Stratmann, G., Pöhlker, C., Campanelli, M., Pandolfi, M., Sicard, M., Gómez-Amo, J. L., Pujadas, M., Bigge, K., Kluge, F., Schwarz, A., Daskalakis, N., Walter, D., Zahn, A., Pöschl, U., Bönisch, H., Borrmann, S., Platt, U., and Burrows, J. P.: Overview: On the transport and transformation of pollutants in the outflow of major population centres – observational data from the EMeRGe European intensive operational period in summer 2017, Atmos. Chem. Phys., 22, 5877–5924, https://doi.org/10.5194/acp-22-5877-2022, 2022.
Atkinson, R.: Atmospheric chemistry of VOCs and NOx, Atmos. Environ., 34, 2063–2101, https://doi.org/10.1016/S1352-2310(99)00460-4, 2000.
Baklanov, A., Lawrence, M., Pandis, S., Mahura, A., Finardi, S., Moussiopoulos, N., Beekmann, M., Laj, P., Gomes, L., Jaffrezo, J.-L., Borbon, A., Coll, I., Gros, V., Sciare, J., Kukkonen, J., Galmarini, S., Giorgi, F., Grimmond, S., Esau, I., Stohl, A., Denby, B., Wagner, T., Butler, T., Baltensperger, U., Builtjes, P., van den Hout, D., van der Gon, H. D., Collins, B., Schluenzen, H., Kulmala, M., Zilitinkevich, S., Sokhi, R., Friedrich, R., Theloke, J., Kummer, U., Jalkinen, L., Halenka, T., Wiedensholer, A., Pyle, J., and Rossow, W. B.: MEGAPOLI: concept of multi-scale modelling of megacity impact on air quality and climate, Adv. Sci. Res., 4, 115–120, doi:10.5194/asr-4-115-2010, 2010.
Baklanov, A., Molina, L. T., and Gauss, M.: Megacities, air quality and climate, Atmos. Environ., 126, 235–249, https://doi.org/10.1016/j.atmosenv.2015.11.059, 2016.
Brenninkmeijer, C. A. M., Crutzen, P., Boumard, F., Dauer, T., Dix, B., Ebinghaus, R., Filippi, D., Fischer, H., Franke, H., Frieβ, U., Heintzenberg, J., Helleis, F., Hermann, M., Kock, H. H., Koeppel, C., Lelieveld, J., Leuenberger, M., Martinsson, B. G., Miemczyk, S., Moret, H. P., Nguyen, H. N., Nyfeler, P., Oram, D., O'Sullivan, D., Penkett, S., Platt, U., Pupek, M., Ramonet, M., Randa, B., Reichelt, M., Rhee, T. S., Rohwer, J., Rosenfeld, K., Scharffe, D., Schlager, H., Schumann, U., Slemr, F., Sprung, D., Stock, P., Thaler, R., Valentino, F., van Velthoven, P., Waibel, A., Wandel, A., Waschitschek, K., Wiedensohler, A., Xueref-Remy, I., Zahn, A., Zech, U., and Ziereis, H.: Civil Aircraft for the regular investigation of the atmosphere based on an instrumented container: The new CARIBIC system, Atmos. Chem. Phys., 7, 4953–4976, https://doi.org/10.5194/acp-7-4953-2007, 2007.
Brito, J. and Zahn, A.: An unheated permeation device for calibrating atmospheric VOC measurements, Atmos. Meas. Tech., 4, 2143–2152, https://doi.org/10.5194/amt-4-2143-2011, 2011.
Cheng, Y., Lee, S. C., Huang, Y., Ho, K. F., Ho, S. S. H., Yau, P. S., Louie, P. K. K., and Zhang, R. J.: Diurnal and seasonal trends of carbonyl compounds in roadside, urban, and suburban environment of Hong Kong, Atmos. Environ., 89, 43–51, https://doi.org/10.1016/j.atmosenv.2014.02.014, 2014.
Ciccioli, P., Centritto, M., and Loreto, F.: Biogenic volatile organic compound emissions from vegetation fires, Plant. Cell Environ., 37, 1810–1825, https://doi.org/10.1111/pce.12336, 2014.
Coggon, M. M., Veres, P. R., Yuan, B., Koss, A., Warneke, C., Gilman, J. B., Lerner, B. M., Peischl, J., Aikin, K. C., Stockwell, C. E., Hatch, L. E., Ryerson, T. B., Roberts, J. M., Yokelson, R. J., and de Gouw, J. A.: Emissions of nitrogen-containing organic compounds from the burning of herbaceous and arboraceous biomass: Fuel composition dependence and the variability of commonly used nitrile tracers, Geophys. Res. Lett., 43, 9903–9912, https://doi.org/10.1002/2016GL070562, 2016.
Crippa, M., Guizzardi, D., Muntean, M., Schaaf, E., Monforti-Ferrario, F., Banja, M., Pagani, F., and Solazzo, E.: EDGAR v6.1 Global Air Pollutant Emissions, Eur. Comm. Jt. Res. Cent., [data set], https://data.jrc.ec.europa.eu/dataset/df521e05-6a3b-461c-965a-b703fb62313e (last access: 13 January 2023), 2022.
de Gouw, J. A. and Warneke, C.: Measurements of volatile organic compounds in the earth's atmosphere using proton-transfer-reaction mass spectrometry, Mass Spectrom. Rev., 26, 223–257, https://doi.org/10.1002/mas.20119, 2007.
de Gouw, J. A., Goldan, P. D., Warneke, C., Kuster, W. C., Roberts, J. M., Marchewka, M., Bertman, S. B., Pszenny, A. A. P., and Keene, W. C.: Validation of proton transfer reaction-mass spectrometry (PTR-MS) measurements of gas-phase organic compounds in the atmosphere during the New England Air Quality Study (NEAQS) in 2002, J. Geophys. Res.-Atmos., 108, 1–18, https://doi.org/10.1029/2003JD003863, 2003a.
de Gouw, J. A., Warneke, C., Karl, T., Eerdekens, G., Van der Veen, C., and Fall, R.: Sensitivity and specificity of atmospheric trace gas detection by proton-transfer-reaction mass spectrometry, Int. J. Mass Spectrom., 223, 365–382, https://doi.org/10.1016/S1387-3806(02)00926-0, 2003b.
de Gouw, J. A., Welsh-Bon, D., Warneke, C., Kuster, W. C., Alexander, L., Baker, A. K., Beyersdorf, A. J., Blake, D. R., Canagaratna, M., Celada, A. T., Huey, L. G., Junkermann, W., Onasch, T. B., Salcido, A., Sjostedt, S. J., Sullivan, A. P., Tanner, D. J., Vargas, O., Weber, R. J., Worsnop, D. R., Yu, X. Y., and Zaveri, R.: Emission and chemistry of organic carbon in the gas and aerosol phase at a sub-urban site near Mexico City in March 2006 during the MILAGRO study, Atmos. Chem. Phys., 9, 3425–3442, https://doi.org/10.5194/acp-9-3425-2009, 2009.
ECMWF: Part IV: Physical Processes IFS Documentation – Cy47r1 Operational implementation 30 June 2020 Part IV: Physical processes, June, https://doi.org/10.21957/eyrpir4vj, 2020.
Fischbeck, G.: Mass-spectrometric in-situ measurements of atmospheric volatile organic compounds onboard passenger and research aircraft, PhD, https://doi.org/10.5445/IR/1000085857, 2017.
Folberth, G. A., Rumbold, S. T., Collins, W. J., and Butler, T. M.: Global radiative forcing and megacities, Urban Clim., 1, 4–19, https://doi.org/10.1016/j.uclim.2012.08.001, 2012.
Folberth, G. A., Butler, T. M., Collins, W. J., and Rumbold, S. T.: Megacities and climate change – A brief overview, Environ. Pollut., 203, 235–242, https://doi.org/10.1016/j.envpol.2014.09.004, 2015.
Gerbig, C., Kley, D., Volz-Thomas, A., Kent, J., Dewey, K., and McKenna, D. S.: Fast response resonance fluorescence CO measurements aboard the C-130: Instrument characterization and measurements made during North Atlantic Regional Experiment 1993, J. Geophys. Res.-Atmos., 101, 29229–29238, https://doi.org/10.1029/95jd03272, 1996.
Gerbig, C., Schmitgen, S., Kley, D., Volz-Thomas, A., Dewey, K., and Haaks, D.: An improved fast-response vacuum-UV resonance fluorescence CO instrument, J. Geophys. Res.-Atmos., 104, 1699–1704, https://doi.org/10.1029/1998JD100031, 1999.
Guenther, A., Hewitt, C. N., Erickson, D., Fall, R., Geron, C., Graedel, T., Harley, P., Klinger, L., Lerdau, M., Mckay, W. A., Pierce, T., Scholes, B., Steinbrecher, R., Tallamraju, R., Taylor, J., and Zimmerman, P.: A global model of natural volatile organic compound emissions, J. Geophys. Res., 100, 8873, https://doi.org/10.1029/94JD02950, 1995.
Hersbach, H., Bell, B., Berrisford, P., Hirahara, S., Horányi, A., Muñoz-Sabater, J., Nicolas, J., Peubey, C., Radu, R., Schepers, D., Simmons, A., Soci, C., Abdalla, S., Abellan, X., Balsamo, G., Bechtold, P., Biavati, G., Bidlot, J., Bonavita, M., Chiara, G., Dahlgren, P., Dee, D., Diamantakis, M., Dragani, R., Flemming, J., Forbes, R., Fuentes, M., Geer, A., Haimberger, L., Healy, S., Hogan, R. J., Hólm, E., Janisková, M., Keeley, S., Laloyaux, P., Lopez, P., Lupu, C., Radnoti, G., Rosnay, P., Rozum, I., Vamborg, F., Villaume, S., and Thépaut, J.: The ERA5 global reanalysis, Q. J. R. Meteorol. Soc., 146, 1999–2049, https://doi.org/10.1002/qj.3803, 2020.
Hüneke, T., Aderhold, O.-A., Bounin, J., Dorf, M., Gentry, E., Grossmann, K., Grooß, J.-U., Hoor, P., Jöckel, P., Kenntner, M., Knapp, M., Knecht, M., Lörks, D., Ludmann, S., Matthes, S., Raecke, R., Reichert, M., Weimar, J., Werner, B., Zahn, A., Ziereis, H., and Pfeilsticker, K.: The novel HALO mini-DOAS instrument: inferring trace gas concentrations from airborne UV/visible limb spectroscopy under all skies using the scaling method, Atmos. Meas. Tech., 10, 4209–4234, https://doi.org/10.5194/amt-10-4209-2017, 2017.
Junge, C. E.: Residence time and variability of tropospheric trace gases, Tellus, 26, 477–488, https://doi.org/10.3402/tellusa.v26i4.9853, 1974.
Karl, T., Striednig, M., Graus, M., Hammerle, A., and Wohlfahrt, G.: Urban flux measurements reveal a large pool of oxygenated volatile organic compound emissions, P. Natl. Acad. Sci. USA, 115, 1186–1191, https://doi.org/10.1073/pnas.1714715115, 2018.
Khalil, M. A. K. and Rasmussen, R. A.: The global cycle of carbon monoxide: Trends and mass balance, Chemosphere, 20, 227–242, https://doi.org/10.1016/0045-6535(90)90098-E, 1990.
Klein Goldewijk, K., Beusen, A., Doelman, J., and Stehfest, E.: Anthropogenic land use estimates for the Holocene – HYDE 3.2, Earth Syst. Sci. Data, 9, 927–953, https://doi.org/10.5194/essd-9-927-2017, 2017.
Kulmala, M., Kokkonen, T. V., Pekkanen, J., Paatero, S., Petäjä, T., Kerminen, V.-M., and Ding, A.: Opinion: Gigacity – a source of problems or the new way to sustainable development, Atmos. Chem. Phys., 21, 8313–8322, https://doi.org/10.5194/acp-21-8313-2021, 2021.
Lindinger, W. and Jordan, A.: Proton-transfer-reaction mass spectrometry (PTR–MS): on-line monitoring of volatile organic compounds at pptv levels, Chem. Soc. Rev., 27, 347, doi:10.1039/a827347z, 1998.
Lindinger, W., Hansel, A., and Jordan, A.: On-line monitoring of volatile organic compounds at pptv levels by means of Proton-Transfer-Reaction Mass Spectrometry (PTR-MS) Medical applications, food control and environmental research, Int. J. Mass Spectrom. Ion Process., 173, 191–241, https://doi.org/10.1016/s0168-1176(97)00281-4, 1998.
Liu, H., Jacob, D. J., Bey, I., Yantosca, R. M., Duncan, B. N., and Sachse, G. W.: Transport pathways for Asian pollution outflow over the Pacific: Interannual and seasonal variations, J. Geophys. Res.-Atmos., 108, https://doi.org/10.1029/2002jd003102, 2003.
Molina, M. J. and Molina, L. T.: Megacities and atmospheric pollution, J. Air Waste Manag. Assoc., 54, 644–680, https://doi.org/10.1080/10473289.2004.10470936, 2004.
Molina, L. T., Madronich, S., Gaffney, J. S., Apel, E., de Foy, B., Fast, J., Ferrare, R., Herndon, S., Jimenez, J. L., Lamb, B., Osornio-Vargas, A. R., Russell, P., Schauer, J. J., Stevens, P. S., Volkamer, R., and Zavala, M.: An overview of the MILAGRO 2006 Campaign: Mexico City emissions and their transport and transformation, Atmos. Chem. Phys., 10, 8697–8760, https://doi.org/10.5194/acp-10-8697-2010, 2010.
Müller, M., Anderson, B. E., Beyersdorf, A. J., Crawford, J. H., Diskin, G. S., Eichler, P., Fried, A., Keutsch, F. N., Mikoviny, T., Thornhill, K. L., Walega, J. G., Weinheimer, A. J., Yang, M., Yokelson, R. J., and Wisthaler, A.: In situ measurements and modeling of reactive trace gases in a small biomass burning plume, Atmos. Chem. Phys., 16, 3813–3824, https://doi.org/10.5194/acp-16-3813-2016, 2016.
NIST Chemistry WebBook: Experimental Proton Affinities, https://doi.org/10.18434/T4D303, 2022.
re3data.org: HALO database, editing status 2021-11-17, re3data.org – Registry of Research Data Repositories, [data set], https://doi.org/10.17616/R39Q0T, 2021.
Savitzky, A. and Golay, M. J. E.: Smoothing and Differentiation of Data by Simplified Least Squares Procedures., Anal. Chem., 36, 1627–1639, https://doi.org/10.1021/ac60214a047, 1964.
Schumann, U.: Measurement and model data comparisons for the HALO-FAAM formation flight during EMeRGe on 17 July 2017, https://doi.org/10.5281/zenodo.4427965, 2021.
Seidel, D. J., Zhang, Y., Beljaars, A., Golaz, J. C., Jacobson, A. R., and Medeiros, B.: Climatology of the planetary boundary layer over the continental United States and Europe, J. Geophys. Res.-Atmos., 117, 1–15, https://doi.org/10.1029/2012JD018143, 2012.
Sindelarova, K., Granier, C., Bouarar, I., Guenther, A., Tilmes, S., Stavrakou, T., Müller, J.-F., Kuhn, U., Stefani, P., and Knorr, W.: Global data set of biogenic VOC emissions calculated by the MEGAN model over the last 30 years, Atmos. Chem. Phys., 14, 9317–9341, https://doi.org/10.5194/acp-14-9317-2014, 2014.
Stohl, A., Forster, C., Frank, A., Seibert, P., and Wotawa, G.: Technical note: The Lagrangian particle dispersion model FLEXPART version 6.2, Atmos. Chem. Phys., 5, 2461–2474, https://doi.org/10.5194/acp-5-2461-2005, 2005.
Stohl, A. and Seibert, P.: Accuracy of trajectories as determined from the conservation of meteorological tracers, Q. J. Roy. Meteor. Soc., 124, 1465–1484, https://doi.org/10.1256/smsqj.54906, 1998.
Stohl, A., Wotawa, G., Seibert, P., and Kromp-Kolb, H.: Interpolation Errors in Wind Fields as a Function of Spatial and Temporal Resolution and Their Impact on Different Types of Kinematic Trajectories, J. Appl. Meteorol., 34, 2149–2165, https://doi.org/10.1175/1520-0450(1995)034<2149:IEIWFA>2.0.CO;2, 1995.
United Nations: Department of Economic and Social Affairs, Population Division: The World's Cities in 2018, World's Cities 2018 – Data Bookl. (ST/ESA/SER.A/417), 34 pp., 2018.
United Nations: Department of Economic and Social Affairs, Population Division: World Population Prospects 2019, Volume II: Demographic Profiles (ST/ESA/SER.A/427), II, 1–5, https://www.un.org/development/desa/publications/2018-revision-of-world-urbanization-prospects.html (last access: 13 January 2023), 2019.
Yuan, B., Koss, A. R., Warneke, C., Coggon, M., Sekimoto, K., and De Gouw, J. A.: Proton-Transfer-Reaction Mass Spectrometry: Applications in Atmospheric Sciences, Chem. Rev., 117, 13187–13229, https://doi.org/10.1021/acs.chemrev.7b00325, 2017.
Zhu, T., Melamed, M., Parrish, D., Gauss, M., Klenner, L. G., Lawrence, M., Konare, A., and Liousse, C.: WMO/IGAC Impacts of Megacities on Air Pollution and Climate, GAW Report., World Meteorological Organization, https://library.wmo.int/index.php?lvl=notice_display&id=13474 (last access: 13 January 2023), 2012.