the Creative Commons Attribution 4.0 License.
the Creative Commons Attribution 4.0 License.
 | 31 Jan 2023
Meteorological export and deposition fluxes of black carbon on glaciers of the central Chilean Andes
Rémy Lapere
Nicolás Huneeus
Sylvain Mailler
Laurent Menut
Florian Couvidat
Air pollution in the central zone of Chile is not only a public health concern but also threatens water resources and climate, in connection with the transport and deposition of black carbon (BC) from urban centers onto the glaciers of the Andes. Chemistry-transport simulations reveal a seasonal dichotomy in the flux and latitudinal pattern of BC deposition on glaciers of the central Chilean Andes. The average deposition flux of BC on glaciers between 30 and 37∘ S is 4 times larger in winter, affecting mostly low-elevation glaciers, whereas the smaller summertime flux affects glaciers evenly, irrespective of their elevation. The contribution of emissions from the city of Santiago is dominant in summertime with more than 50 % along the Andes but minor in wintertime with less than 20 % even close to the capital city. Transport at larger scales and more local sources likely account for the remaining flux. The superimposition of synoptic-scale circulation and local mountain-valley circulation along the Andes drives the differences between summertime and wintertime deposition fluxes and generates a greater meteorological export potential during summer months. Future emissions and climate projections suggest that under the RCP8.5 scenario the gap between summertime and wintertime BC export and deposition flux could decrease, thereby pointing to summertime emission control gaining relevance. The chemistry-transport modeling approach for BC deposition on the Andes sheds light on the importance of the often disregarded summertime emissions on the radiative balance of its glaciers, particularly in the vicinity of Santiago.
- Article
(10674 KB) - Full-text XML
- BibTeX
- EndNote


Urban areas in the central region of Chile (extending roughly between 30 and 37∘ S) face concerning air pollution issues, especially regarding fine particulate matter (PM2.5) (e.g., Saide et al., 2016; Barraza et al., 2017; Lapere et al., 2021b). Strong anthropogenic emissions of primary particulate matter and precursors mostly stem from dense road traffic and industrial activities all year round and a large additional contribution from wood burning for residential heating in wintertime, particularly in the metropolitan region of Santiago (Barraza et al., 2017; Marín et al., 2017; Mazzeo et al., 2018; Álamos et al., 2022). Among these emissions, black carbon (BC) particles constitute a large fraction, in relation to incomplete combustion of fossil fuel and biomass (Shrestha et al., 2010; Villalobos et al., 2015).
Besides the health issues associated with air pollution (Ilabaca et al., 1999), light-absorbing particles such as BC have a strong radiative impact once deposited on snow and ice, reducing their albedo and hence accelerating their melting (Hadley and Kirchstetter, 2012; Hodson, 2014; Kang et al., 2020; Niu et al., 2020). For example, Réveillet et al. (2022) found that BC and dust in snow in the French Alps and the Pyrenees advance the peak meltwater runoff by as much as 2 weeks. Similarly, Ménégoz et al. (2013, 2014) found that BC on snow can reduce the snow cover season duration by up to 10 d in boreal and temperate regions and up to 8 d in the Himalayas. The evolution of the snow cover with climate change is therefore strongly modulated by the deposition of BC and dust (Réveillet et al., 2022), and BC deposition on Andean glaciers is of great concern, although it has received little attention so far compared to other mountain areas in the world (Vuille et al., 2018).
Glaciers in South America have been evidently retreating in the last 30 years (Rabatel et al., 2013), with impacts on local population and economy (Barnett et al., 2005). Complex climatic mechanisms are related to this melting in the Andes mountain range, including a combination of atmospheric temperature and precipitation pattern changes (Barnett et al., 2005). In addition to these forcings, Magalhães et al. (2019) showed that BC from Amazonian biomass burning and dust deposited on a glacier of the tropical Andes significantly increase its runoff. In the central Chilean Andes too, BC was found in significant amounts in snow, creating an estimated additional radiative forcing of 1.4 W m−2 in the region of Santiago for winter months (Rowe et al., 2019), which can go up to 10 W m−2 for the most impacted sites (Cordero et al., 2022). Dust emitted by mining activities (Barandun et al., 2022) and mineral dust from the Atacama desert lifted by winds are also found to affect glaciers and snow in northern Chile (Rowe et al., 2019), although the albedo effect for visible wavelengths is scaled down by a factor of about 200 compared to an equivalent mass of BC (Dang et al., 2015).
The central region of Chile has been facing a hydrological deficit since the last decade in relation to the recent mega-drought (Garreaud et al., 2017) so that the additional accelerated melting of glaciers and snowpack triggered by impurities leads to an even higher stress on water resources at the end of summer. In a short-term perspective an accelerated melting increases river runoff and therefore freshwater availability (Vuille et al., 2018). In the long-term however, peak water is reached and river runoff starts decreasing and eventually stops when glaciers have sufficiently retreated (Hock et al., 2019). Ayala et al. (2020) suggest that glaciers of central Chile may have already passed peak water, making accelerated melting even more concerning. In this context it is paramount to expand the knowledge on BC transport towards and deposition on glaciers of the Chilean Andes.
Central Chile is a narrow strip of land surrounded by the Pacific Ocean in the west and the Andes in the east. As a result, the atmospheric circulation is driven both by synoptic-scale conditions related to the position of the South Pacific High (SPH) over the Pacific Ocean and by local mountain-valley circulation dynamics. Mountain-valley circulation is related to the differential heating and cooling between narrow canyons and wide basins under radiative forcing, which generate up-slope and up-valley winds during the daytime and a reversal at night (e.g., Whiteman, 2000). A direct corollary is a strong seasonality in wind regimes, particularly inland in the Santiago Basin, in connection with the latitudinal displacement of the SPH and contrasts in solar radiation between winter and summer affecting the mountain-valley circulation (Lapere et al., 2021b).
Several atmospheric measurement campaigns have been conducted in the vicinity of Santiago aiming to investigate the transport of urban BC into the adjacent Andean valleys, each focusing on a different canyon and/or time period (Cordova et al., 2016; Gramsch et al., 2020; Huneeus et al., 2021). Modeling studies also provided insight on this topic, again focusing on specific periods and/or canyons (Gramsch et al., 2020; Lapere et al., 2021a). Although the aforementioned studies complement each other to refine the knowledge on BC transport near Santiago, a more holistic approach both temporally and spatially, with a regional and climatological relevance, is missing to the best of our knowledge.
It is now well established that particulate matter emitted in Santiago has the ability to reach high-elevation areas in the nearby Andes both in summer and winter periods, with a transport time of a few hours (Gramsch et al., 2020; Huneeus et al., 2021). Nevertheless, the aforementioned works focus on atmospheric concentrations and do not investigate deposition on snow- or ice-covered terrain, which is ultimately the issue at stake. Rowe et al. (2019) and Cordero et al. (2022) measured wintertime BC deposition rates in the high Andes but could not conclude on source attribution. Symmetrically, Lapere et al. (2021a) used a model-based approach enabling them to trace back the origin of deposited BC on the Andean cryosphere but only for winter conditions and over a limited area.
The objective of this work is to provide a more complete picture in terms of space, time and drivers of urban BC export towards the Andes. We use chemistry-transport modeling with WRF-CHIMERE to compute BC deposition rates on glaciers of the central Chilean Andes for a given year and highlight differences between summertime and wintertime. Then, based on local observations and reanalysis data, the meteorological processes driving these differences are identified. Finally, future trends in wind speeds in the Santiago area are extracted from the COordinated Regional Climate Downscaling EXperiment-COmmon Regional Experiment (CORDEX-CORE) simulations under the Representative Concentration Pathway (RCP) 2.6 and 8.5 scenarios. BC emission rates associated with these two pathways are also considered to assess a possible evolution in the seasonal asymmetry in BC transport from Santiago to the Andes.

2.1 Modeling setup
The chemistry-transport simulations performed in this work use the same modeling setup as the one adopted in Lapere et al. (2021b) and are recalled in Table 1. The same set of simulations is used, despite a different perspective. Hereafter are presented only the most important features of the model. For full details and validation of meteorology and pollutant concentrations, the interested reader is invited to refer to Lapere et al. (2021b). Simulations are performed with the CHIMERE chemistry-transport model (Mailler et al., 2017), forced by meteorological fields simulated with the Weather Research and Forecasting (WRF) mesoscale numerical weather model (Skamarock et al., 2008), version 3.9.1.1. The set of WRF and CHIMERE parameterizations used in this work (Table 1) has been extensively tested for this region of Chile at several spatial resolutions and show good performance in reproducing meteorology and atmospheric composition over the region of Santiago (Mazzeo et al., 2018; Lapere et al., 2020, 2021a, b). A spin-up period of 15 d is included before the simulation periods considered here. Anthropogenic emissions only are considered for BC (i.e., wildfire events, which can be a large BC source, are not included in the emission inventory) and are adapted from the Hemispheric Transport of Air Pollution (HTAP) V2 inventory (Janssens-Maenhout et al., 2015) using the methodology from Menut et al. (2013). The simulation domain as shown in Fig. 2 comprises the central zone of Chile, at a 5 km spatial resolution. A set of four simulations is performed: 1 month in January 2015 with and without emissions from the city of Santiago (as defined by the black boxes in Fig. 2) and 1 month in July 2015 considering the same sensitivity analysis. Based on this set of simulations, typical deposition fluxes of BC, including the contribution of emissions from Santiago, for summertime and wintertime can be derived.
The aerosol dry-deposition scheme used in CHIMERE for this work is based on Zhang et al. (2001), which relies on a resistance analogy where the deposition velocity vd can be written as in Eq. (1).
where vs is the settling velocity related to the particle mass upon which gravity acts to bring it back to ground level, ra is the aerodynamic resistance that accounts for turbulence and surface friction and roughness, and rs the surface resistance including Brownian diffusion, impaction and interception terms. More details and formulas for the different components of Eq. (1) can be found in the CHIMERE model documentation (LMD et al., 2021). Another dry-deposition scheme is available in CHIMERE based on Wesely (1989). The choice to use only one scheme rather than performing a sensitivity analysis with both schemes is discussed in Sect. 4. Regarding wet deposition, CHIMERE distinguishes between below-cloud scavenging by rain and by snow. The former uses the raindrop size distribution from Willis and Tattelman (1989) to compute the impaction of particles by falling droplets. The latter is based on the parameterization from Wang et al. (2014). Furthermore, aerosols are distributed into 10 size bins with mass median diameters (10, 30, 70, 160, 350, 760 nm, 1.7, 3.5, 7, 20 µm), following a log-normal distribution.
2.2 Observations, reanalysis and future scenario data
Local observational data of wind speed and direction at surface level in the Santiago area are extracted from the Chilean automated meteorological and air quality monitoring network (Ministerio del Medio Ambiente, 2015), which will be abbreviated as SINCA in the rest of this work, and the Chilean weather service stations (Dirección Meteorológica de Chile, 2019), referred to as DMC hereafter. Wind vertical profiles at an hourly frequency in Santiago, for the years 2017 to 2019, are extracted from the Aircraft Meteorological Data Relay (AMDAR) data available for Santiago airport (SCEL), as presented and analyzed in Muñoz et al. (2022). More information on the measurement stations (location, variables used, frequency, source) considered in this work can be found in Table 2. The main observation sites and the configuration of the Santiago Basin and its main canyons are shown in Fig. 1.
Table 2Weather and air quality stations used in this work and their available measurements and periods.
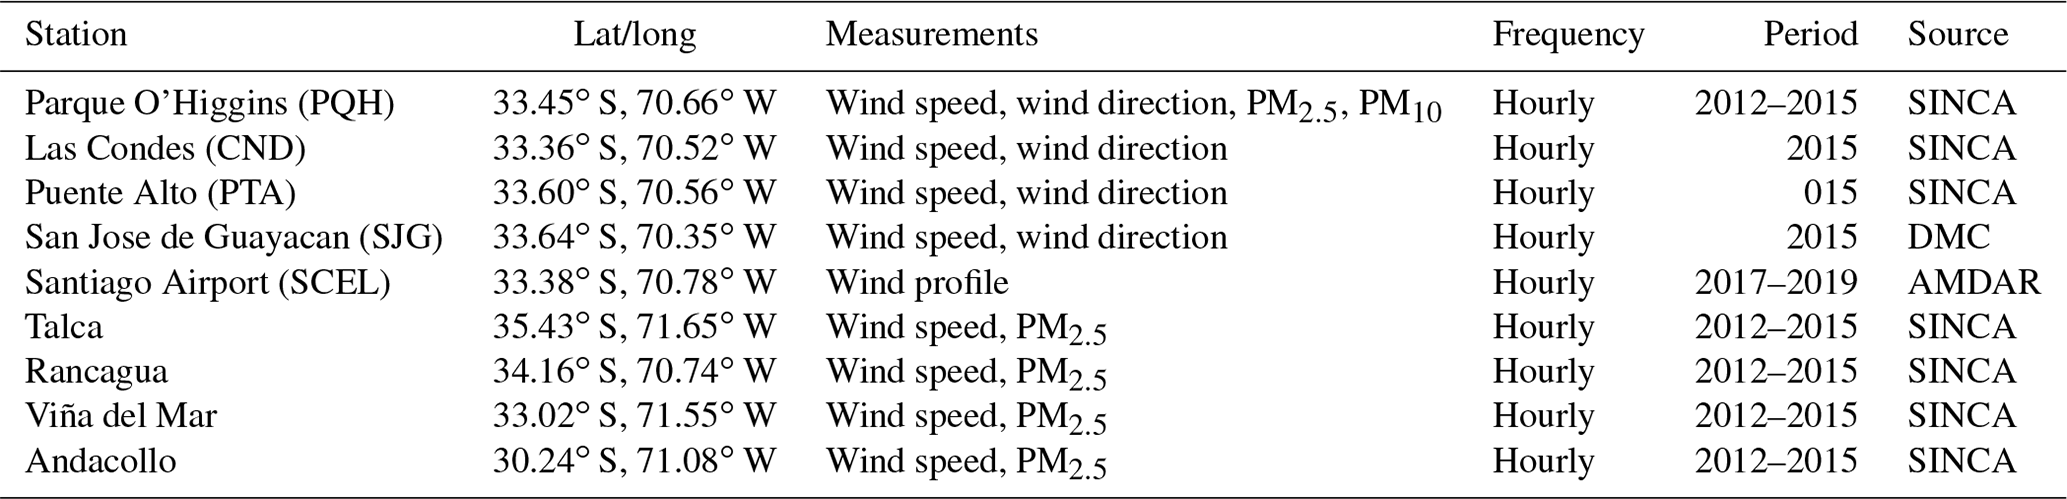
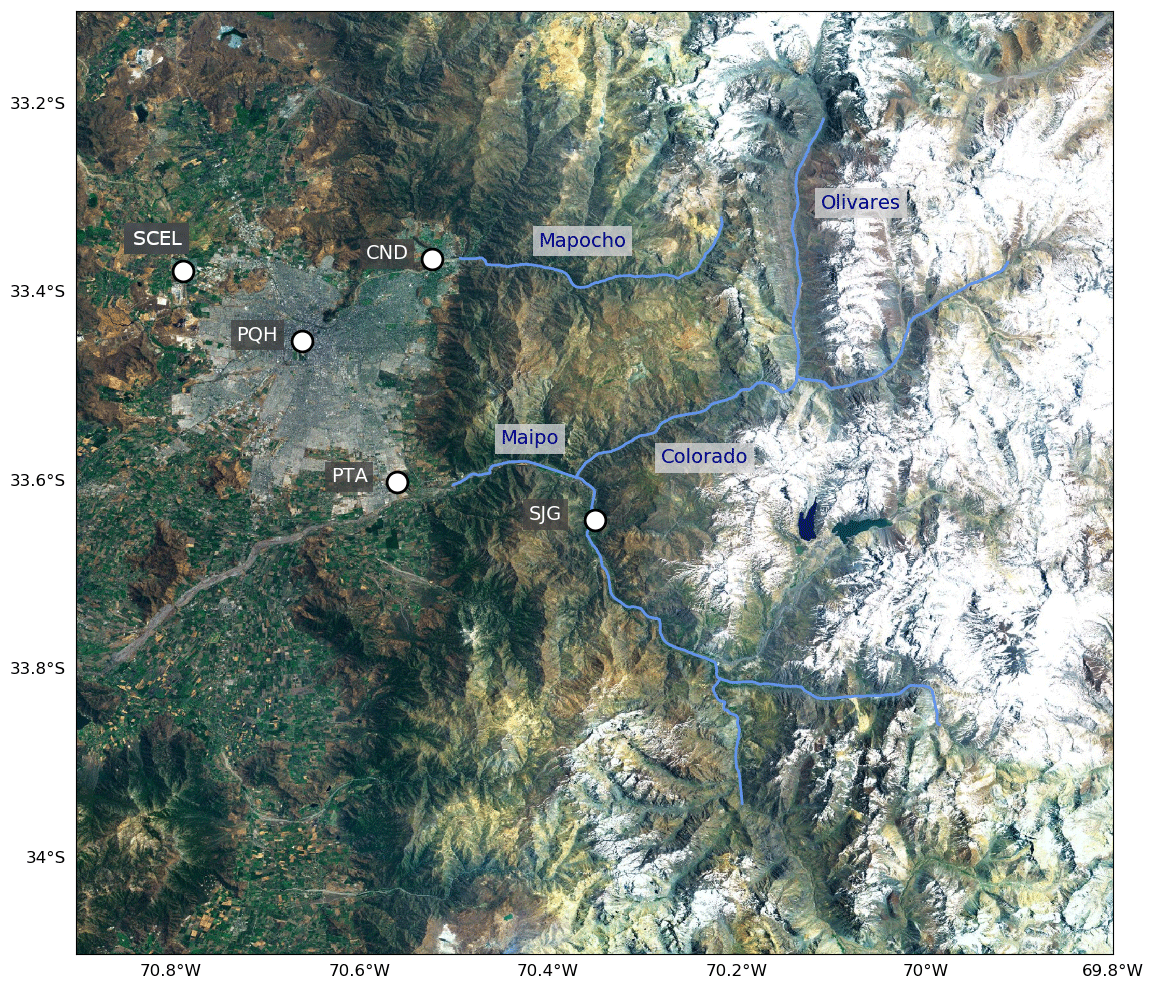
Figure 1Localities and canyons of interest in the vicinity of Santiago. Measurement stations are designated with white circles. Canyons of interest are evidenced with blue lines. Map background layer source: Imagery World 2D, © 2009 Esri.
To analyze the large-scale circulation and vertical wind profiles, reanalysis data from ERA5 at a 0.25∘ resolution for the year 2015 are used (Copernicus Climate Change Service, 2017). In particular, monthly averaged reanalyses of zonal and meridional winds on pressure levels, together with mean sea-level pressure, cloud cover, and 10 m zonal and meridional winds are incorporated into the analysis.
The analysis of future trends in surface winds in Santiago is based on outputs from the CORDEX-CORE project (Gutowski et al., 2016; Giorgi et al., 2021) in the South America domain at a 22 km resolution (SAM-22), for two regional climate models (REMO2015 and RegCM4-7) driven by three different general circulation models (MOHC-HadGEM2-ES, MPI-M-MPI-ESM and NCC-NorESM1) under two future scenarios (RCP2.6 and RCP8.5). The variables of interest were downloaded through the Earth System Grid Federation (ESGF) data platform (ESGF, 2014). Wind speeds are regarded as the ensemble mean of the six realizations of each scenario. These trends in the regional climate are put into perspective with regard to the associated changes in BC emissions in the Santiago area. To do this, RCP2.6 (van Vuuren et al., 2007) and RCP8.5 (Riahi et al., 2007) emission scenarios are considered. The data were downloaded from the RCP Database (2009).

Figure 2Simulated emissions of BC and accumulated deposition on glaciers of the central Chilean Andes in (a) January and (b) July 2015. Color map shows BC emission rates. The black box represents the Santiago city area. Two different zones are considered: 30–37∘ S (pink color code) and 33–34∘ S (green color code). Pie charts show the share of deposition attributable to emissions from Santiago (lighter color) and other regions (darker color). Pie chart sizes are proportional to total deposition. The white shaded area corresponds to snow-covered grid points in the simulations.
2.3 Analysis methodology
The methodological approach adopted in this study follows three steps. First, using chemistry-transport modeling for a summer month and a winter month in 2015, an estimate of the deposition flux of BC on the glaciers of the Andes of central Chile is derived, as is the share attributable to emissions from the city of Santiago. These time-limited simulations are designed to provide insight into the seasonality, magnitude and areas most affected by BC deposition. The seasonality in atmospheric circulation is then analyzed using data from reanalysis and local observation, and its role in driving the deposition seasonality is discussed. Finally, future projections of this circulation are analyzed using CORDEX-CORE data under RCP scenarios.
Throughout this work, the locations of glaciers are defined based on WGMS and National Snow and Ice Data Center (2012). The nearest grid point in the CHIMERE domain is used to compute the corresponding deposition flux on each individual glacier. Rock glaciers are excluded from the analysis as the main concern regarding BC deposition on glaciers is the impact on their albedo.
3.1 Seasonal differences in BC deposition
Anthropogenic emissions of primary pollutants such as BC feature a pronounced seasonality, as shown in the HTAP inventory (color map in Fig. 2). In particular, this inventory evidences that in summer (January) BC emissions are concentrated in large urban centers such as the Santiago Basin (black square in Fig. 2) and the Valparaíso (33∘ S, 71.5∘ W) and Concepción (37∘ S, 73∘ W) regions. In contrast, wintertime (July) emissions of BC are more evenly scattered across the domain, in relation to the widespread use of wood burning for residential heating purposes during that season, all throughout central Chile (e.g., Saide et al., 2016). This additional emission source in wintertime leads to a monthly total flux of BC over the domain of 163 % more in winter compared to summer, with 123 t per month for January and 324 t per month for July.
As a result of the combination of the seasonality both in emissions and circulation, total deposition fluxes of BC (dry+wet) differ greatly between January and July 2015 on the scale of central Chile. In particular, the glacier-averaged BC deposition flux between 30 and 37∘ S (pink lines in Fig. 2) is 4 times larger in winter, at 634 µg m−2 per month, compared to summer with 158 µg m−2 per month. In the direct vicinity of the city of Santiago, as defined by the glaciers located between latitudes 33 and 34∘ S (green lines in Fig. 2), the seasonality is less pronounced with a monthly total deposition flux of 292 µg m−2 per month in summer and 322 µg m−2 per month in winter.
In these absolute totals, the contribution of Santiago emissions is larger in summertime with 50 % of the BC particles deposited coming from the capital city, while it accounts for only 15 % in wintertime on the scale of central Chile (pink pie charts in Fig. 2). The seasonality in spatial patterns of BC emissions mentioned above, with emissions found mostly in large urban centers in summer but more scattered in winter accounts for this observation. This seasonal difference is even greater close to the Santiago Basin, with 74 % of deposition in summer related to Santiago emissions but only 19 % in winter between 33 and 34∘ S (green pie charts in Fig. 2). Summertime total BC emissions are 50 % smaller than in wintertime in this area, according to the inventory used in this work. This decrease does not translate into a decrease in deposition. In fact, when considering dry deposition alone, the deposition flux on glaciers in the vicinity of Santiago (33–34∘ S) even increases by 40 % in summertime compared to wintertime, despite emissions being halved. In this case, seasonal variations in regional emissions only cannot explain this change. The additional factors explaining these variations are investigated in Sect. 3.2.
To further investigate the large difference in the contribution of Santiago emissions to BC deposition on Andean glaciers in the vicinity of the capital city, Fig. 3 provides a more detailed picture with glacier-by-glacier simulated BC deposition rates and relative contribution for that region. In absolute value, deposition rates feature a large spatial heterogeneity in both seasons, with affected areas varying between summer and winter (Fig. 3a and b). In summertime, deposition is larger on glaciers closer to Santiago and decreases further away, with a smooth gradient both in the west–east and north–south directions. It reaches a maximum slightly north of the city, along the Olivares River canyon and near the tip of the Mapocho River canyon, at more than 1 mg m−2 per month for the month of January (red circles in Fig. 3a). In winter, the BC deposition flux is spatially more erratic (Fig. 3b), in line with the previous comment on emissions being scattered across the region. Maximum values are obtained near the south of Santiago, particularly near the tip of the Maipo River canyon, where deposition rates rise up to 1 mg m−2 per month. Deposition hotspots are also found further south in connection with the presence of other large urban areas along the Andes.
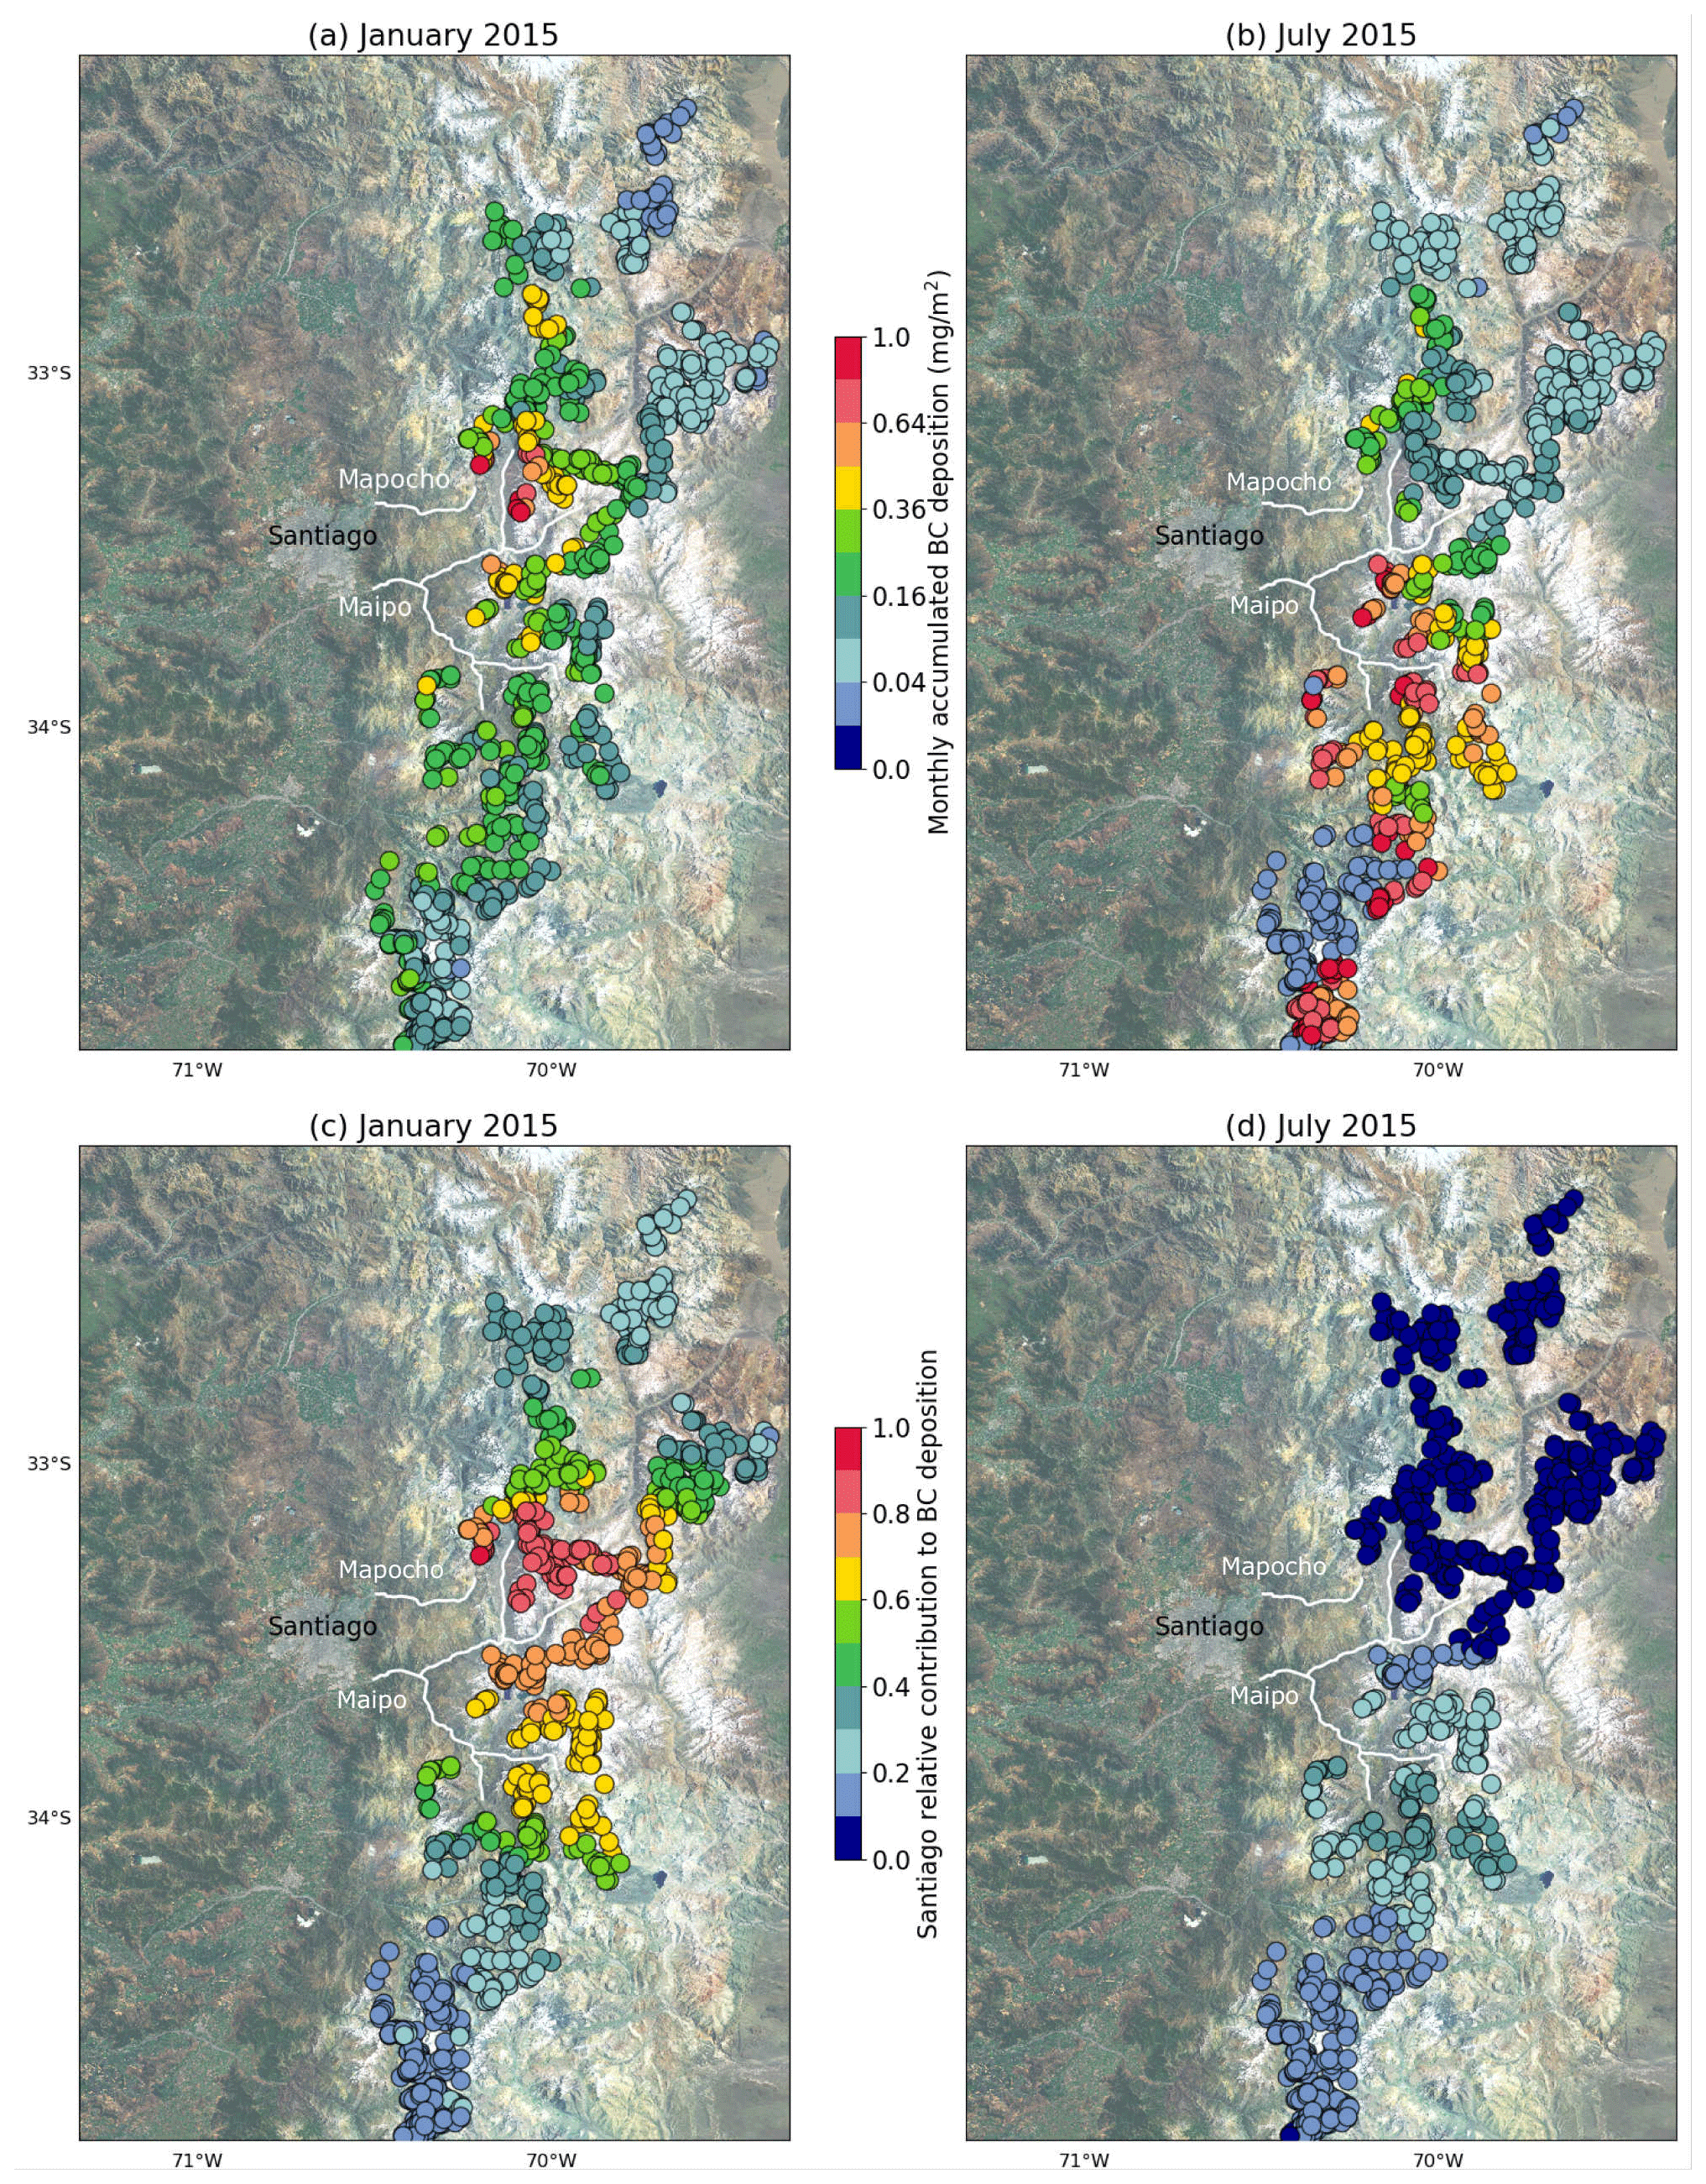
Figure 3(a) Monthly accumulated BC deposition on glaciers (colored circles) for January 2015. Panel (b) same as (a) for July 2015. (c) Relative contribution of emissions from Santiago to accumulated BC deposition on glaciers for January 2015. Panel (d) same as (c) for July 2015. White lines indicate the main canyons connecting Santiago to the glaciers. Map background layer: Imagery World 2D, © 2009 Esri.
The more heterogeneous picture in wintertime is consistent with the underlying time dynamics of deposition. In summer, the glacier-averaged BC deposition time series features a pronounced, smooth diurnal cycle, with a steady daily deposition rate varying between 2 and 7 for the month of January, associated with a relative standard deviation of 17 % (Fig. 4). In contrast, the same time series for July is more chaotic, featuring no clear variability mode and daily deposition rates between 4 and 68 with a relative standard deviation of 88 %. The associated time series of deposition velocity (vd in Eq. 1) shows similar patterns (dashed lines in Fig. 4) and suggests that particulate matter found in air parcels above glaciers have a similar probability of being deposited in summer and winter, given that vd has the same magnitude in both seasons (2.30 µm s−1 on average in July and 2.18 µm s−1 in January). The winter time series also includes a wet-deposition component that exacerbates its erratic behavior due to sporadic precipitation episodes inducing spikes in deposition. Wet deposition is an important contributor for wintertime BC deposition and accounts for 34 % of deposition on glaciers in the simulation domain. This component is absent in summertime due to essentially dry conditions in the region for that season.

Figure 4Time series of dry (solid black line) and wet (solid blue line) deposition flux and deposition velocity (dashed gray line) in (a) January and (b) July. Average over glacier-containing grid points within the area considered in Fig. 3.
Regarding the relative contribution of emissions from Santiago, Fig. 3c and d also reveal contrasting patterns between January and July. In the direct vicinity of the capital city (between 33 and 34∘ S), the contribution ranges from 50 % to 100 %, with a northward gradient in summertime. North of 33∘ S and south of 34∘ S the contribution decreases to around 30 %. Contrarily, in July the contribution from Santiago emissions does not exceed 40 % and is concentrated in the south, near the Maipo River canyon (southernmost white line connecting Santiago to the Andes in Fig. 3d). This finding is consistent with Lapere et al. (2021a) that evidenced the transport mechanism of pollutants from Santiago to the Andes in wintertime and revealed the critical role of mountain-valley circulation in the Maipo River canyon. In comparison, all of the major canyons seem to significantly channel BC higher up in large amounts in summer (at least 50 % in the vicinity of the white lines in Fig. 3c). In particular, in the area of the Mapocho River canyon, moderate BC deposition fluxes are found in July, originating mostly from outside Santiago, whereas they are larger in January and mostly attributable to Santiago emissions. This finding is consistent with Gramsch et al. (2020) that observed more transport of BC inside this canyon in summer than in winter.
Variations in emissions alone do not account for the differences in summertime and wintertime deposition patterns. The mountain-valley circulation being radiatively driven, it is theoretically more intense in summer, thus implying more channeling of BC into the canyons, which provides a first additional driver for these differences. Nonetheless, this phenomenon does not account for the reversed gradient in the contribution of Santiago emissions (northward in summer, southward in winter, as observed in Fig. 3c and d) given that the magnitude of emissions changes between seasons in our modeling experiment, but the location of the largest sources within the Santiago Basin remains consistent. Besides, based on the findings of Lapere et al. (2021a), mountain-valley-circulation-driven transport of BC should primarily affect lower-elevation glaciers. However, Fig. 5a shows that, between 30 and 37∘ S, deposition strongly decreases with glacier elevation in wintertime (blue line), whereas in summertime the vertical profile is more homogeneous (orange line – note that the x axis has a different scale). In summertime, a maximum in the deposition rate is obtained near 4000 m elevation, more than twice as large as compared with the lowest glaciers, showing that BC has the ability to deposit on higher-elevation glaciers in that season unlike in wintertime. Theses differences in the vertical profile do not stem from a statistical bias, since many glaciers are found both in altitude zones of high and low deposition rates in both seasons as shown in Fig. 5b.
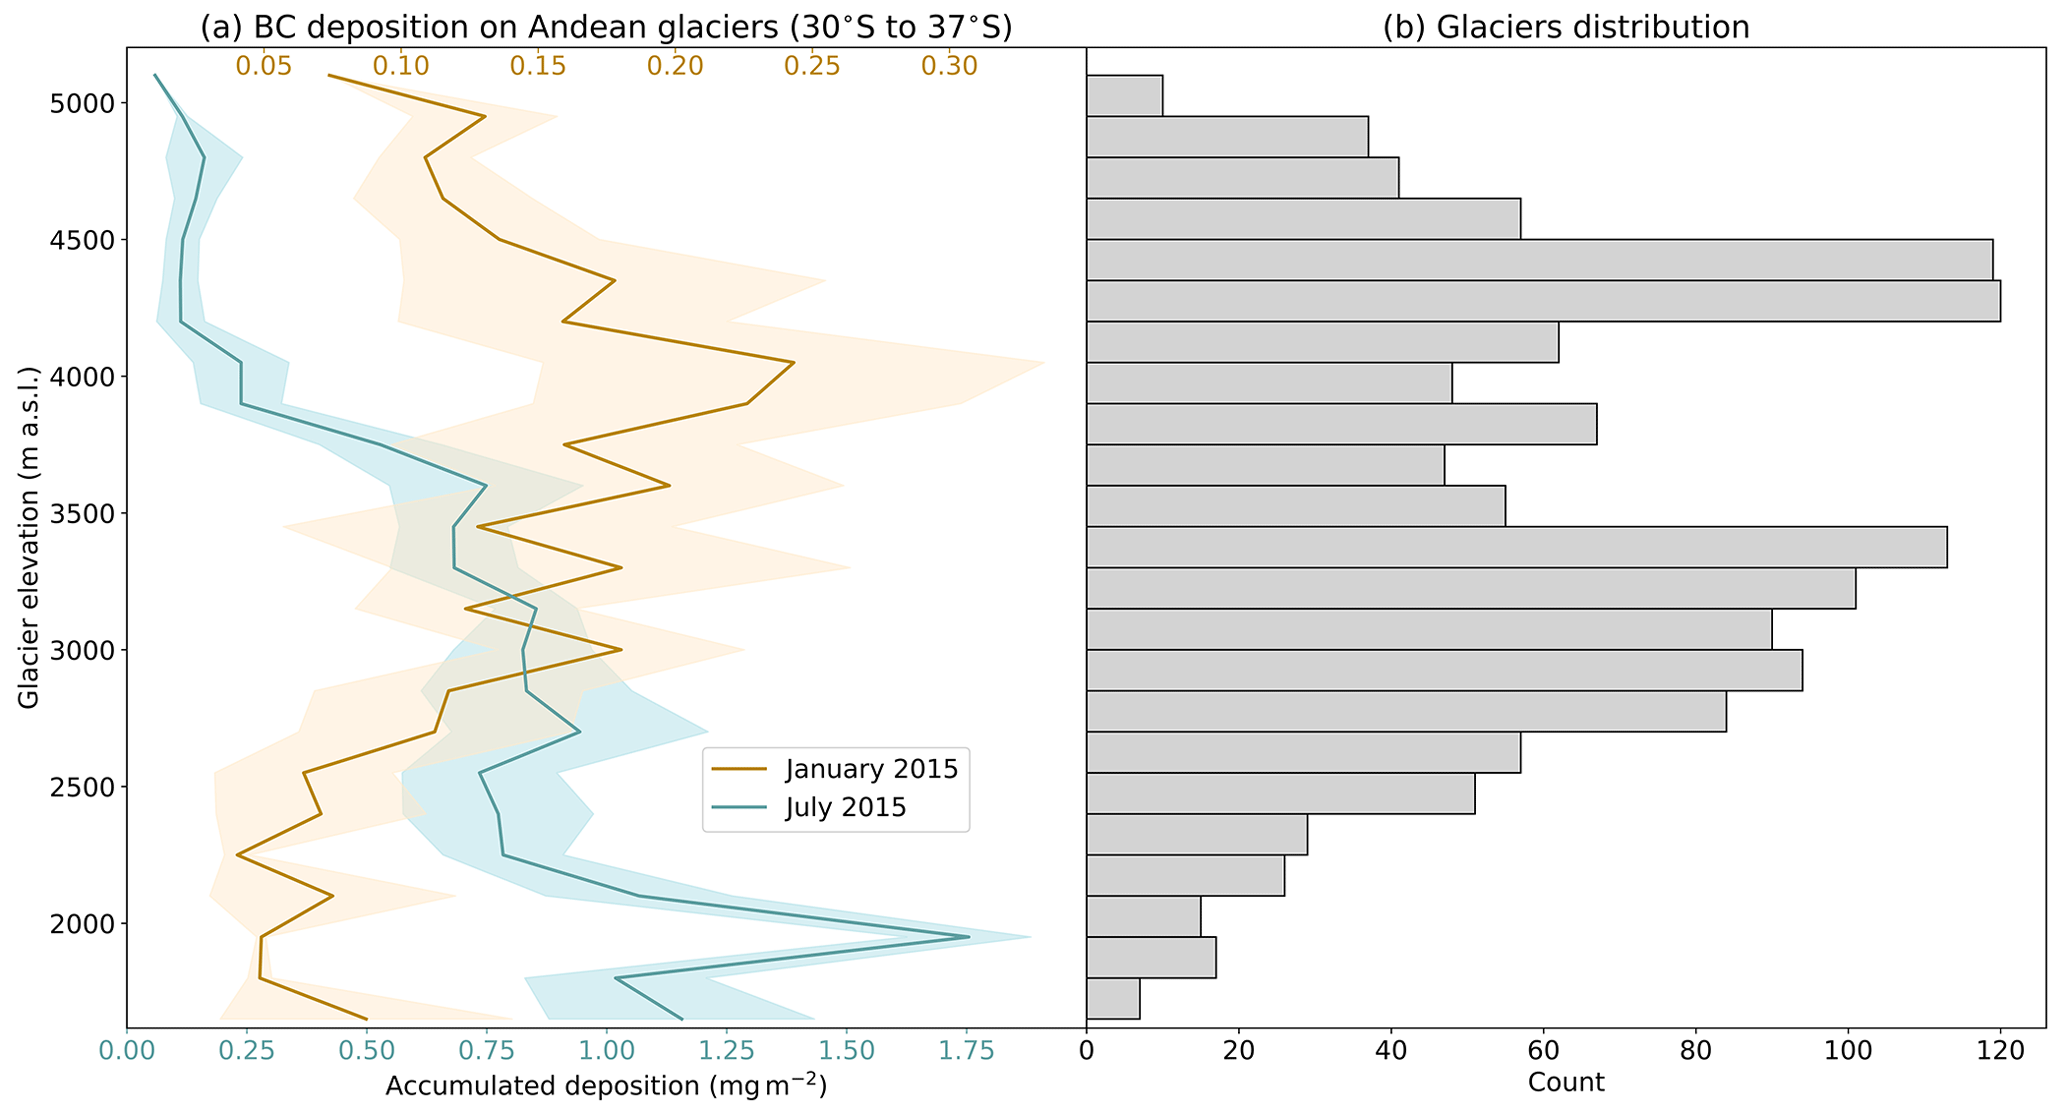
Figure 5(a) BC accumulated deposition on glaciers between 30 and 37∘ S depending on their mean elevation. Average for January 2015 (orange line) and July 2015 (blue line). Colored shades show 1 standard deviation. Glaciers are clustered every 250 m of elevation. (b) Number of glaciers for each model elevation bin (gray bars). In both panels, glacier elevation corresponds to the elevation of the model grid point where the latitude–longitude coordinate of the glacier is found, according to WGMS and National Snow and Ice Data Center (2012).
The homogeneity of the summer vertical profile deposition (Fig. 5a) and the more homogeneous horizontal spatial distribution in summer than in winter (Fig. 3a) suggest that for summer months, larger-scale atmospheric transport phenomena are likely at play compared to winter, when erratically occurring mountain-valley-circulation-driven export dominates the deposition flux. This idea is further investigated in Sect. 3.2.
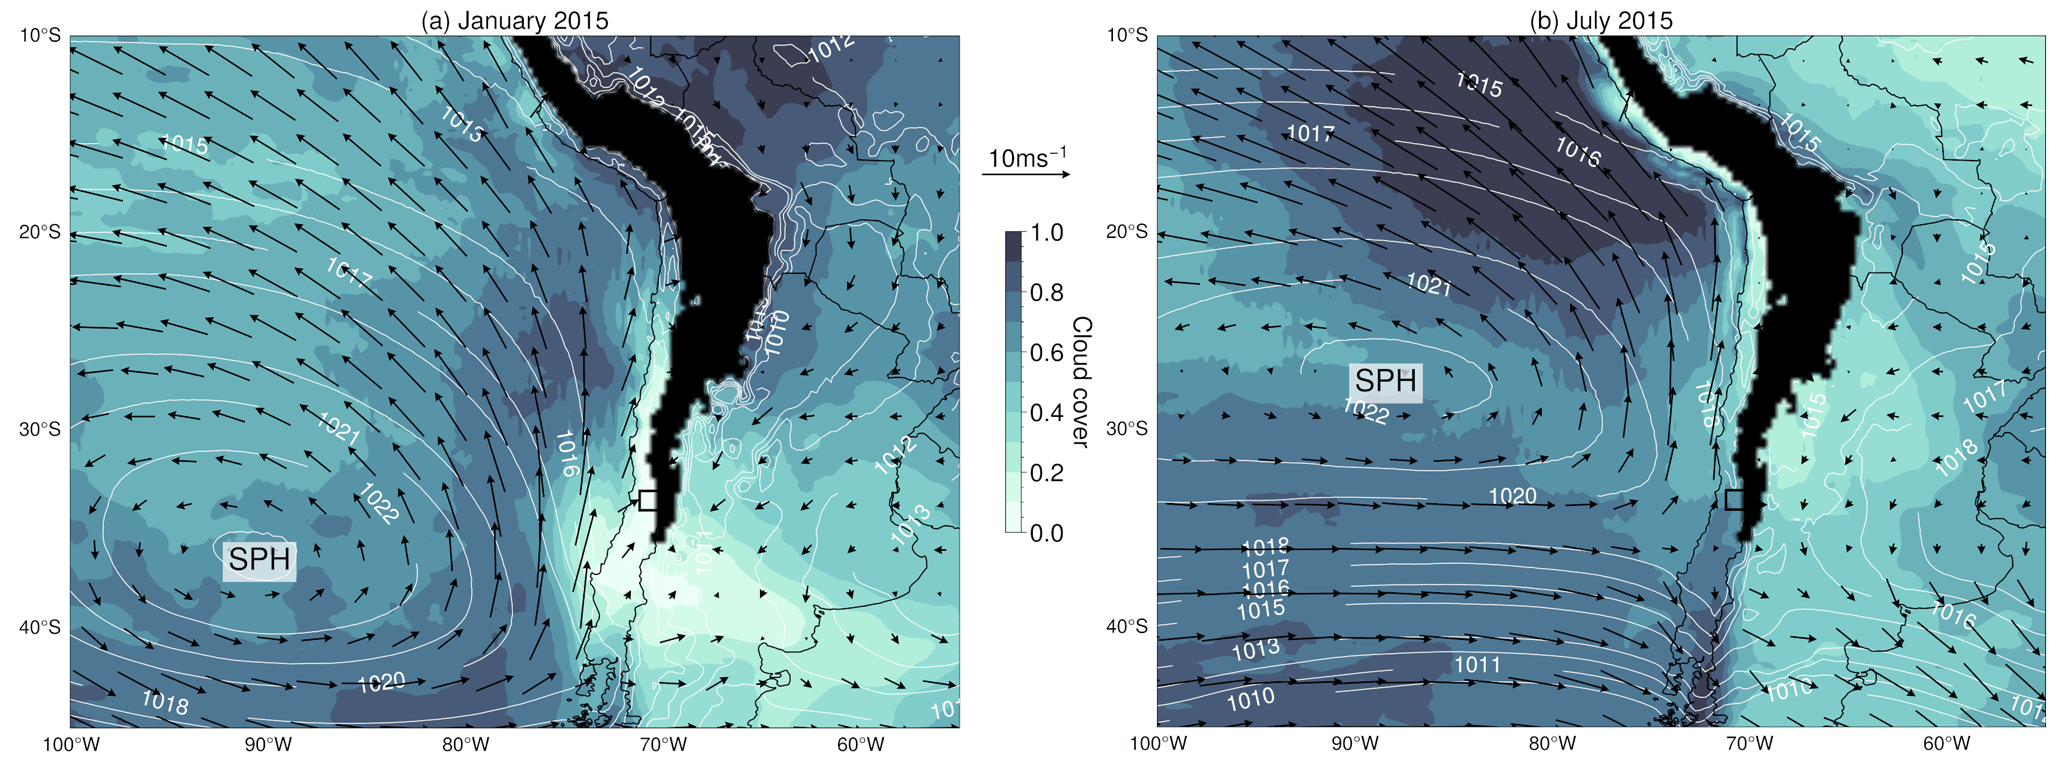
Figure 6Synoptic-scale circulation for (a) January and (b) July 2015. Contours indicate mean sea-level pressure (hPa), the color map corresponds to cloud cover, and arrows show 10 m wind speed. The black area represents the Andes where elevation is higher than 2500 m. The black box indicates the location of Santiago. Data from ERA5 single-level reanalysis (Copernicus Climate Change Service, 2017).
3.2 Role of local and synoptic-scale circulation
Synoptic-scale circulation in the central zone of Chile is driven by the position of the SPH, in conjunction with the passage of migratory anticyclones regularly leading to the formation of coastal lows disrupting circulation for a few days (e.g., Garreaud et al., 2002). In particular, the contours in Fig. 6 show that the SPH is located near 37∘ S, 90∘ W in January 2015 and 10∘ northward, near 27∘ S, 90∘ W, in July 2015. As a result, strong southwesterlies (at 10 m above ground) along the Chilean coast blow at the latitude of Santiago in January, whereas no dominant winds are observed in July in this area. This synoptic forcing leads to dominant southwesterlies inland as far as Santiago (black box in Fig. 6) in January. The summertime synoptic wind direction is thus consistent with the orientation of the Mapocho and Olivares canyons (Fig. 1) neighboring the glaciers where maximum deposition and contribution from Santiago are observed in the chemistry-transport simulations at that period. These average circulation conditions can be perturbed, especially in winter, by the passage of cold fronts and cut-off lows. These perturbations usually bring northwest–west winds to central Chile, along with precipitation (Falvey and Garreaud, 2007) and therefore result in even less intense southwesterly winds in winter. The aforementioned elements point to synoptic winds playing a key role in the transport of BC from the urban basin towards the Andes.
Simultaneously, cloud cover is mostly nonexistent above Santiago in January with less than 10 % cloud cover on average, while July exhibits around 60 % cloud cover (color map in Fig. 6). Consequently, solar radiation fully reaches the ground in summertime, resulting in very active mountain-valley circulation. In contrast, surface radiation is smaller and more variable in wintertime, leading to a comparatively weaker and more erratic mountain-valley circulation and by extension less BC export through this process. Therefore, in addition to synoptic winds, mountain-valley circulation also governs BC transport in summertime and superimposes on large-scale motions. Otherwise, the large deposition rates obtained in the chemistry-transport simulations along the Maipo River canyon (Fig. 3a), which has a NW–SE orientation perpendicular to the synoptic wind direction, would not be observed if only the synoptic-scale played a role. This synoptic–local-scale interaction is consistent with Zängl (2009), for instance, who observed an influence of synoptic forcing on valley-wind circulation when the associated direction matches the direction of the considered valley. Mountain-valley circulation is naturally stronger in summertime regardless of cloud cover considerations, due to longer days and smaller solar zenith angles. The difference in cloud cover evidenced here thus exacerbates this phenomenon.
Vertical wind profiles also advocate in favor of a strong contribution of synoptic forcing to wind conditions in Santiago, thereby influencing the export of BC. Based on ERA5 data, Fig. 7a reveals that the aforementioned SPH-generated southwesterlies not only dominate near the surface but also throughout the mixing layer up to around 1500 m a.g.l. in summertime, with average wind speeds between 2 and 3 m s−1. Above the mixing layer, a smooth transition towards stronger northerly– northwesterly winds of 6 to 8 m s−1 is observed. The picture is different in wintertime: average wind speeds in the mixing layer up to 1000 m a.g.l. do not exceed 1 m s−1 and do not feature a dominant direction. Winds aloft, however, are much stronger, well above 10 m s−1, with a similar direction as in summertime, and they create a strong wind shear at the interface between the mixing layer and the free troposphere.
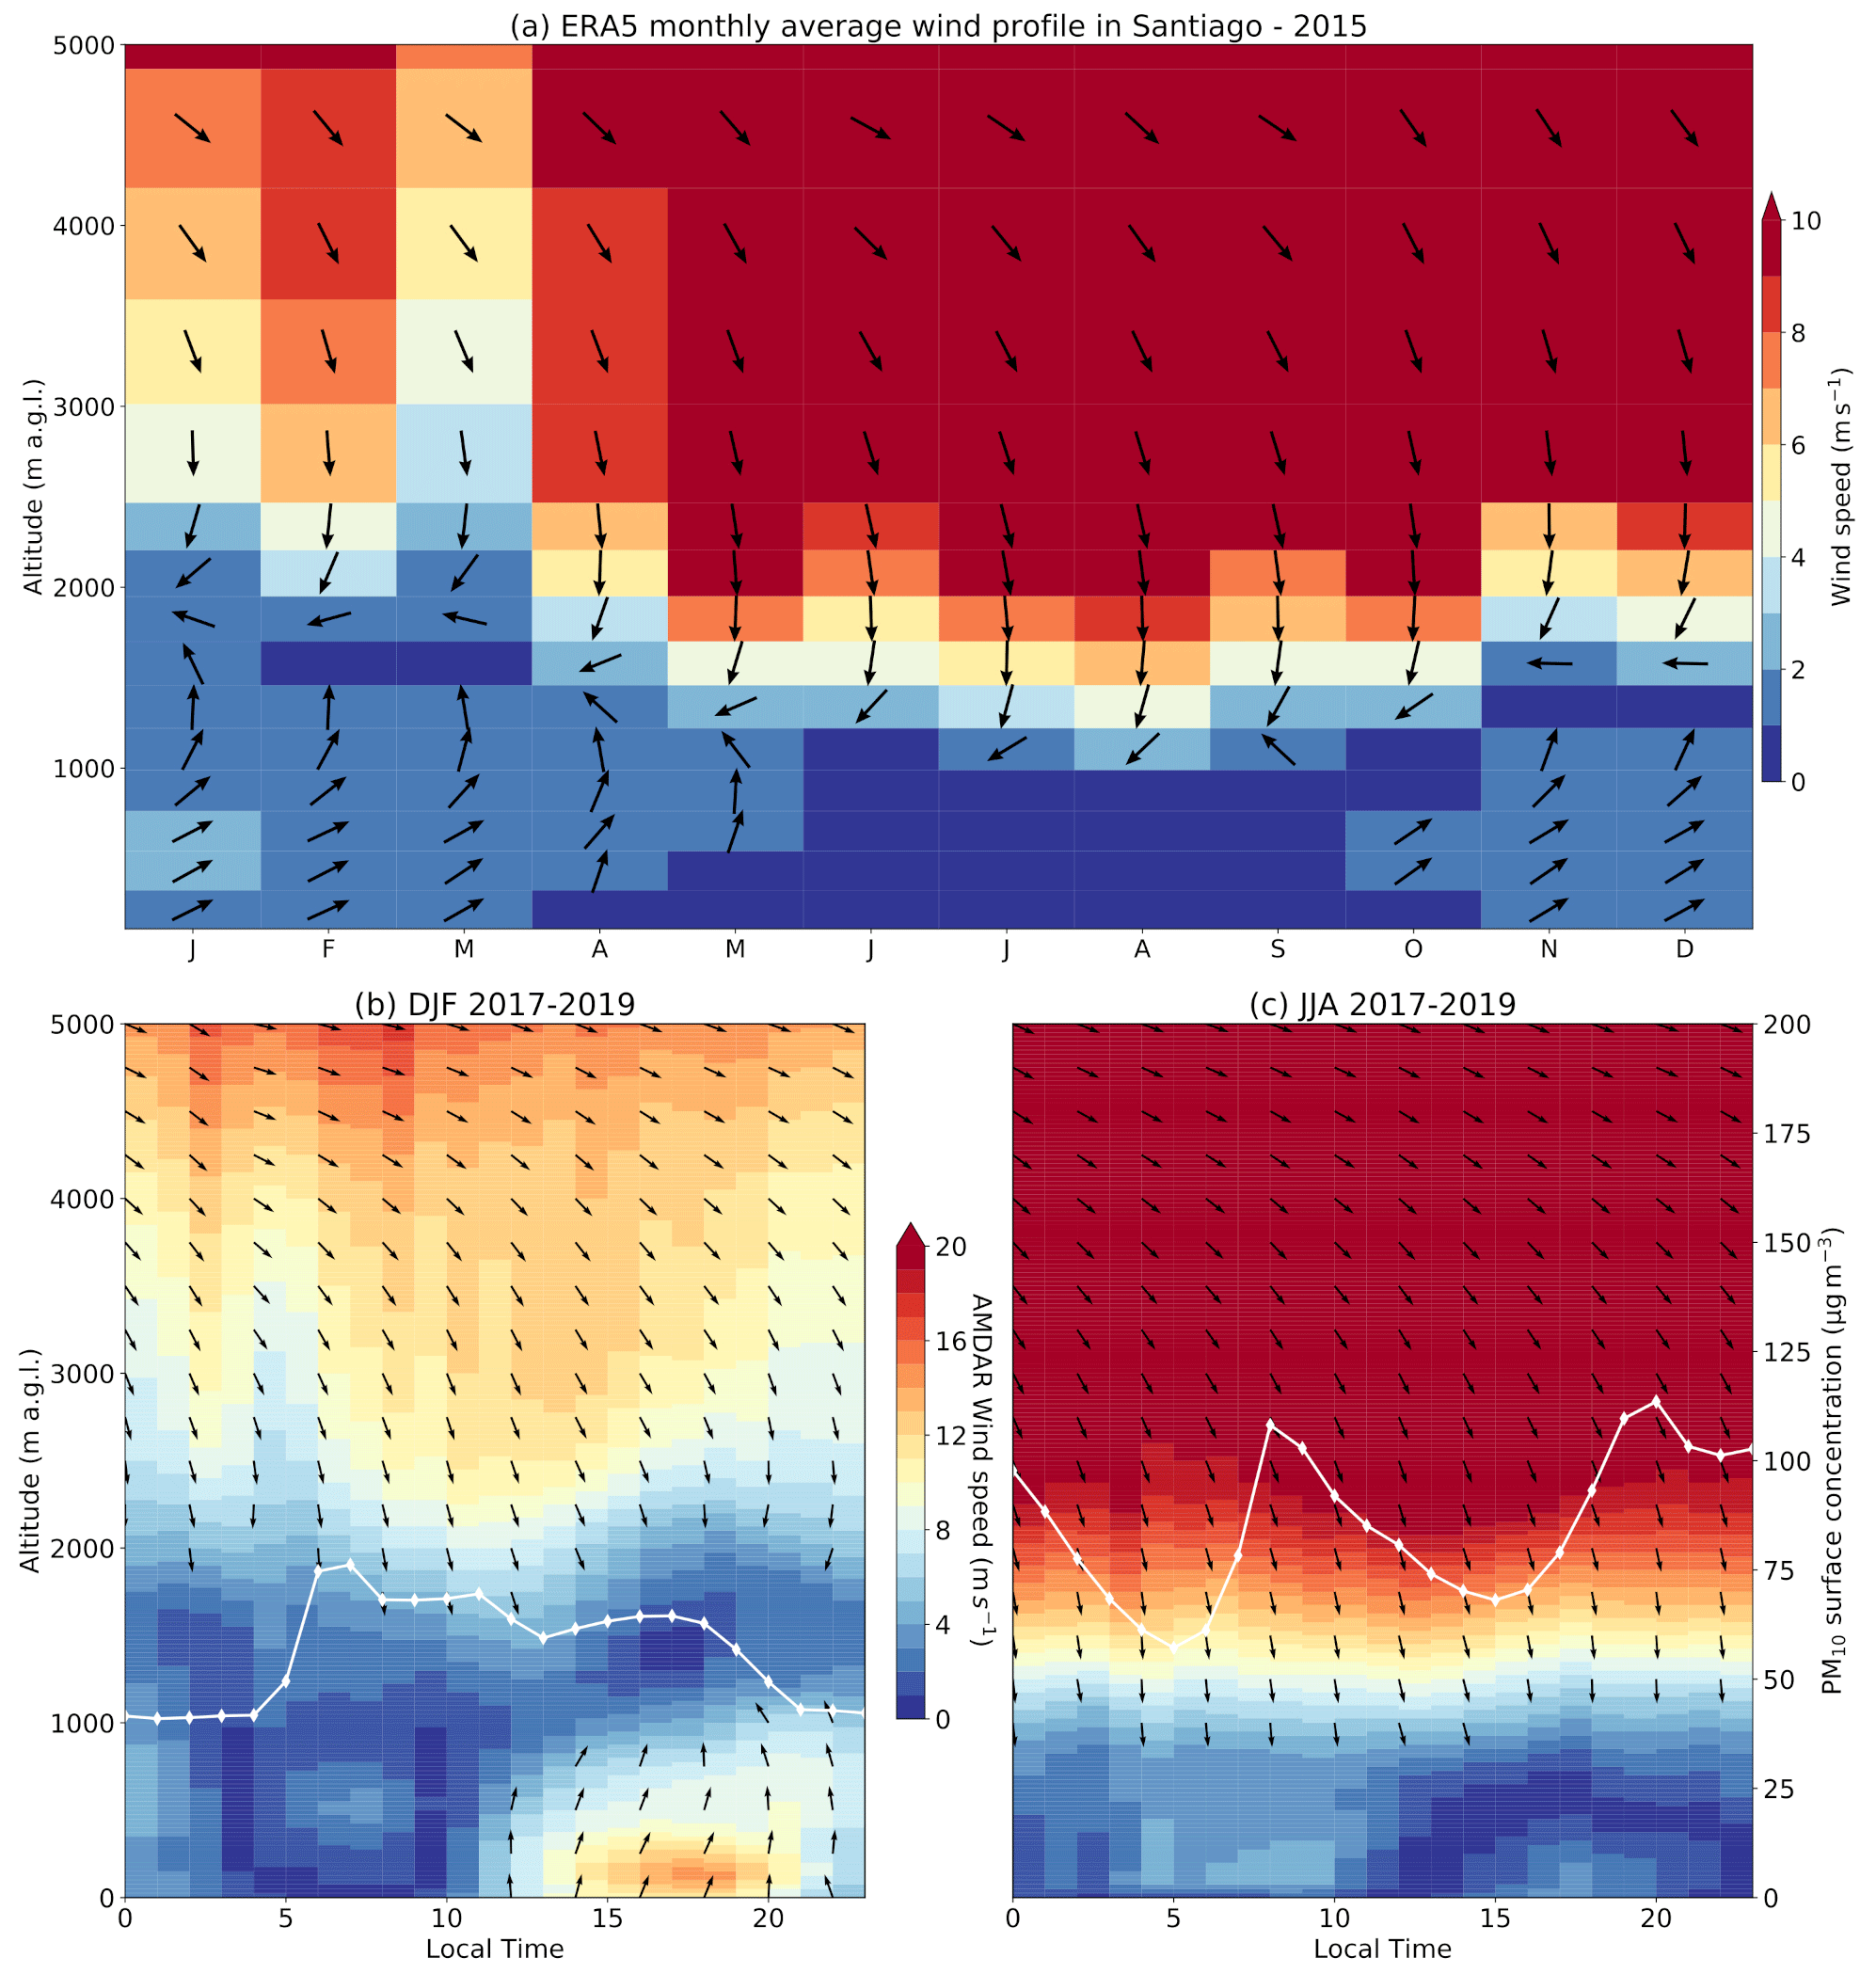
Figure 7(a) Monthly wind vertical profile in Santiago for 2010–2020. Colors indicate horizontal wind speed; arrows indicate the meteorological direction of horizontal winds (i.e., upwards is southerly, rightward is westerly). Directions are displayed for average wind speeds above 1 m s−1 only. Average of monthly means from ERA5 pressure-level reanalysis for the grid point located at 33.5∘ S, 70.75∘ W. (b) Average daily cycle of wind vertical profiles in Santiago from AMDAR for DJF 2017–2019 (color map) and corresponding PM10 surface concentration daily cycle (white line) at Parque O'Higgins (PQH) station (data from SINCA). Panel (c) same as (b) for JJA.
Local measurements of wind profiles at the airport of Santiago (SCEL) from the AMDAR program for the period 2017–2019 reveal a picture consistent with ERA5 data and provide an additional dimension in terms of the evolution of the wind profile during the day. Figure 7b and c show the average daily cycle of wind speed (color map) and direction (arrows) profile in Santiago, averaged over DJF and JJA, respectively. Although the comparison with ERA5 data is not straightforward, similar patterns emerge with generally lower wind speeds near the surface and a shallower boundary layer in JJA. During the nighttime, DJF and JJA both exhibit moderate to no wind near the ground up until 10:00 LT, but in summertime wind speed starts to increase when solar radiation develops (up to more than 15 m s−1) in the afternoon, whereas in wintertime, wind speed decreases in the daytime compared to the nighttime, reaching values between 2 to 4 m s−1 on average. For summertime, wind speeds peaking in the afternoon are critical when it comes to the export of pollutants, given that it is also a moment when the load of pollutants in the urban atmosphere is high due to the accumulation of emissions during the day (white line in Fig. 7b). This synchronicity signals an important export potential for contaminants, especially given the direction of these afternoon winds, which are southwesterlies, i.e., directed towards the Andes and its glaciers. Concentrations of PM10 are comparatively higher throughout the whole day in winter (white line in Fig. 7c) but with weaker winds leading to less export.
Consistent with the conclusions drawn from ERA5 data, these local measurements also suggest that in wintertime (JJA), there is no established wind within the boundary layer, which does not exceed 1000 m on average, thereby strengthening the accumulation and concentration of pollutants (white line in Fig. 7c) and preventing their transport. Contrarily, in summertime (DJF) afternoon winds are well established, blowing towards the Andes, and the deeper and more convective boundary layer also leads to a better ventilation of pollutants outside the urban area.
These observations reinforce the idea that the summertime BC export is governed by synoptic winds and mountain-valley circulation combined, while only mountain-valley circulation drives the export in wintertime, with no synoptic component.
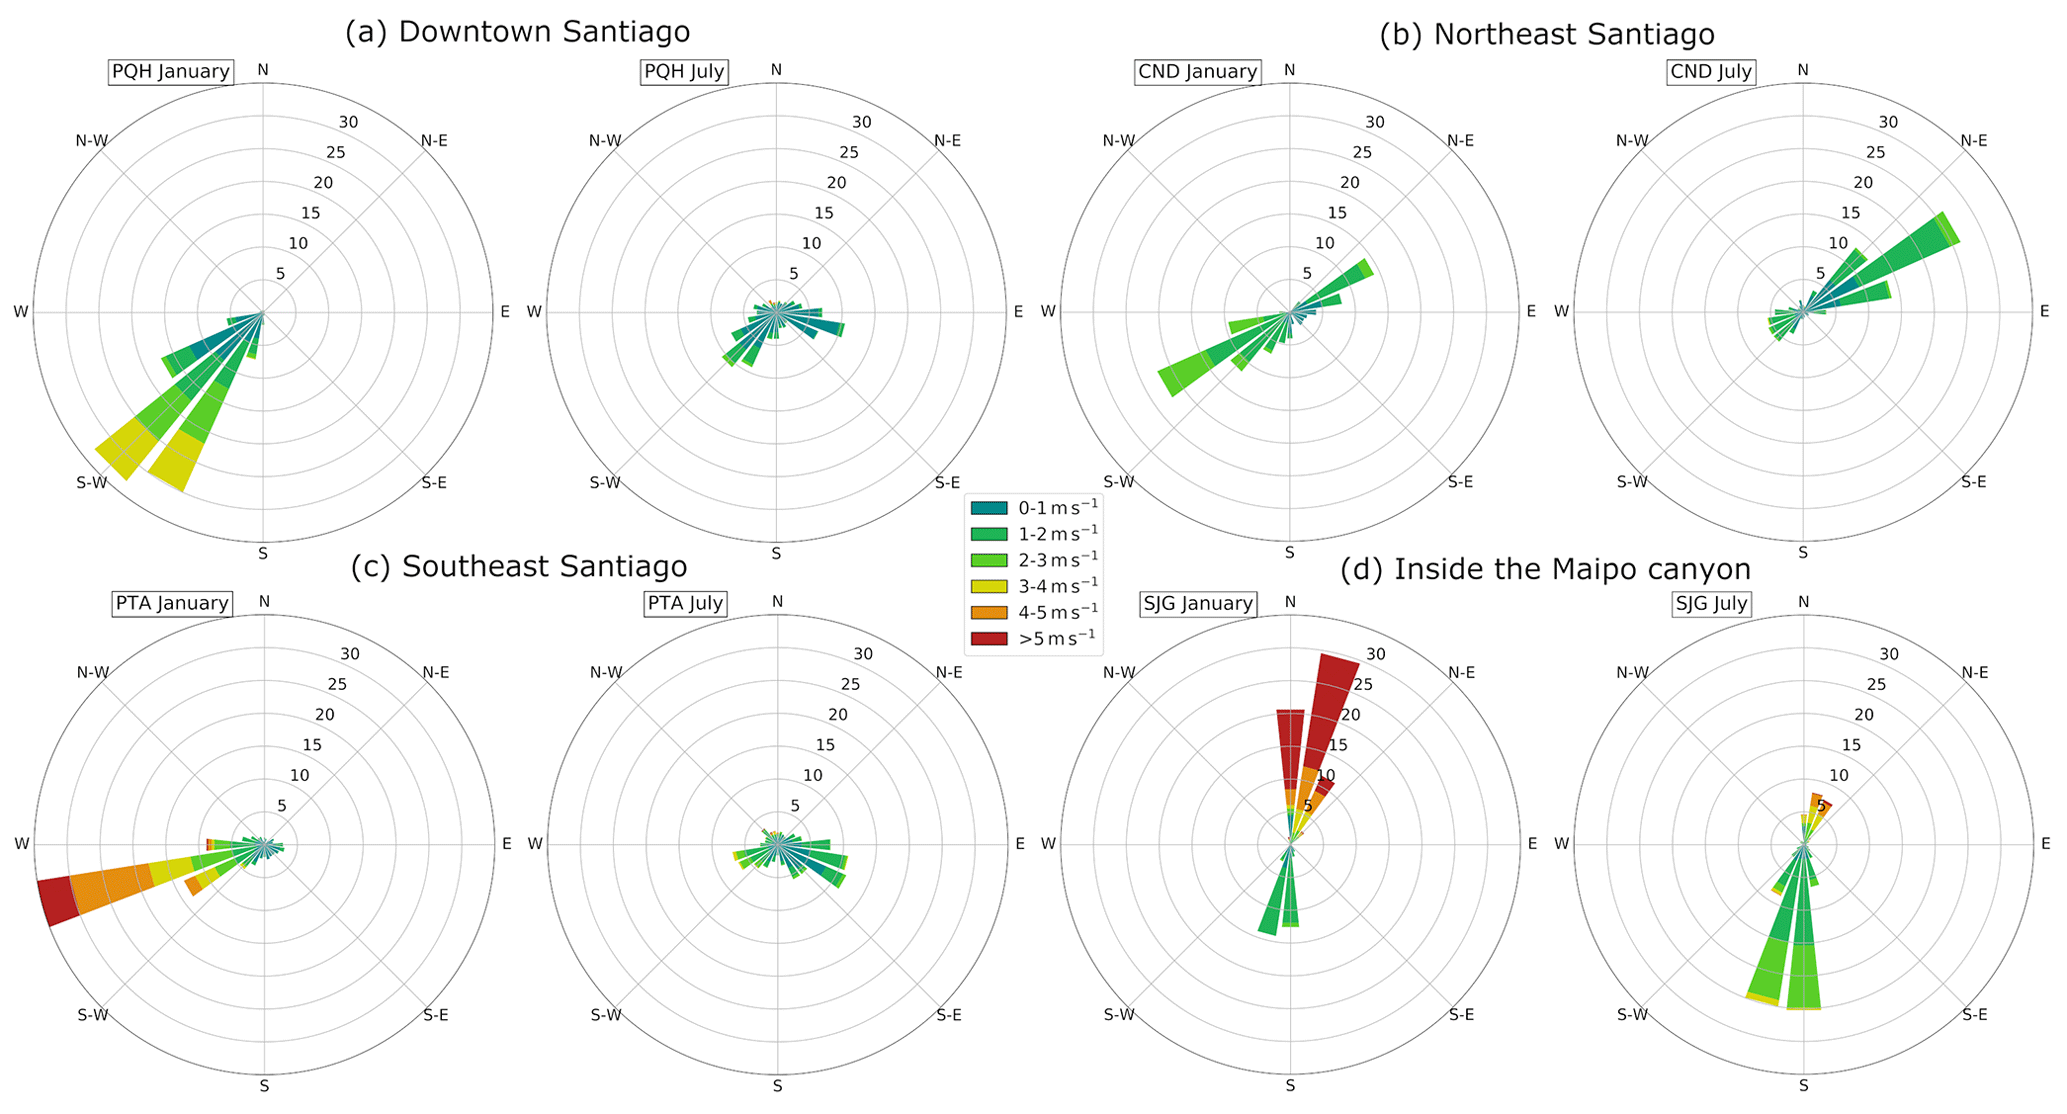
Figure 8Wind speed and direction distribution at (a) Parque O'Higgins (PQH – downtown Santiago), (b) Las Condes (CND – northeast Santiago, near the entrance of the Mapocho canyon), (c) Puente Alto (PTA – southeast Santiago, near the entrance of the Maipo canyon), and (d) San Jose de Guayacan (SJG – deep into the Maipo canyon). Wind roses display the distribution of hourly data for January and July 2015. Source SINCA for (a–c); source DMC for (d).
Although the previous analysis is conducted on a single data point, surface wind observations from the SINCA and DMC networks at different sites in the Santiago Basin and inside nearby canyons show good agreement with the proposed rationale for seasonal change in BC export. Figure 8 compares wind roses in January and July 2015 for four sites (see Fig. 1): Parque O'Higgins (PQH) in the center of the city (Fig. 8a), Las Condes (CND) in the northeast near the Mapocho River canyon entrance (Fig. 8b), Puente Alto (PTA) in the southeast near the Maipo River canyon entrance (Fig. 8c), and San Jose de Guayacan (SJG) inside the meridional branch of the Maipo River canyon (Fig. 8d).
In downtown Santiago (Fig. 8a), there is a clear dichotomy between January and July winds. January features a predominant southwesterly component in wind direction, and wind speeds frequently above 3 m s−1. This is consistent with the synoptic forcing observed in Figs. 6 and 7. Wind speeds are comparatively lower in July, rarely exceeding 2 m s−1, and wind directions exhibit a clear southwesterly–easterly dipole consistent with mountain-valley circulation patterns of winds blowing towards the Andes during the day (westerlies) and back towards the urban basin during the night (easterlies). For this location however, there is no easterly component in January, meaning that mountain-valley circulation is inhibited by the strong synoptic winds.
The observation at the PTA site near the Maipo River canyon entrance (Fig. 8c) is similar: strong westerlies well above 4 m s−1 dominate in January, and weaker winds forming a mountain-valley dipole are recorded in July. Nonetheless, for this location a summertime easterly component indicative of down-valley winds is observed contrary to downtown, thus evidencing the occurrence of mountain-valley exchanges despite the dominance of synoptic westerlies.
The records show a different situation at PTA's counterpart site, CND, near the entrance of the Mapocho River canyon (Fig. 8b). The mountain-valley dipole is observed both in January and July, with a shift from more frequent occurrences of southwesterlies in January to more frequent northeasterlies in July. This is consistent with the summertime synoptic forcing being aligned with the axis of the canyon. Nevertheless, both components of the dipole remain significant and wind speeds are in the same range for both seasons. The shift in the dominant wind direction explains the limited deposition flux in absolute and relative value observed in July compared to January in the area of the Mapocho River canyon (Fig. 3). In July, mostly down-valley winds (northeasterlies) are observed with consequent wind speeds, thus preventing the intrusion of BC into the canyon for a majority of the time. In January, wind conditions are the other way around, thus favoring the transport of BC from Santiago into the canyon.
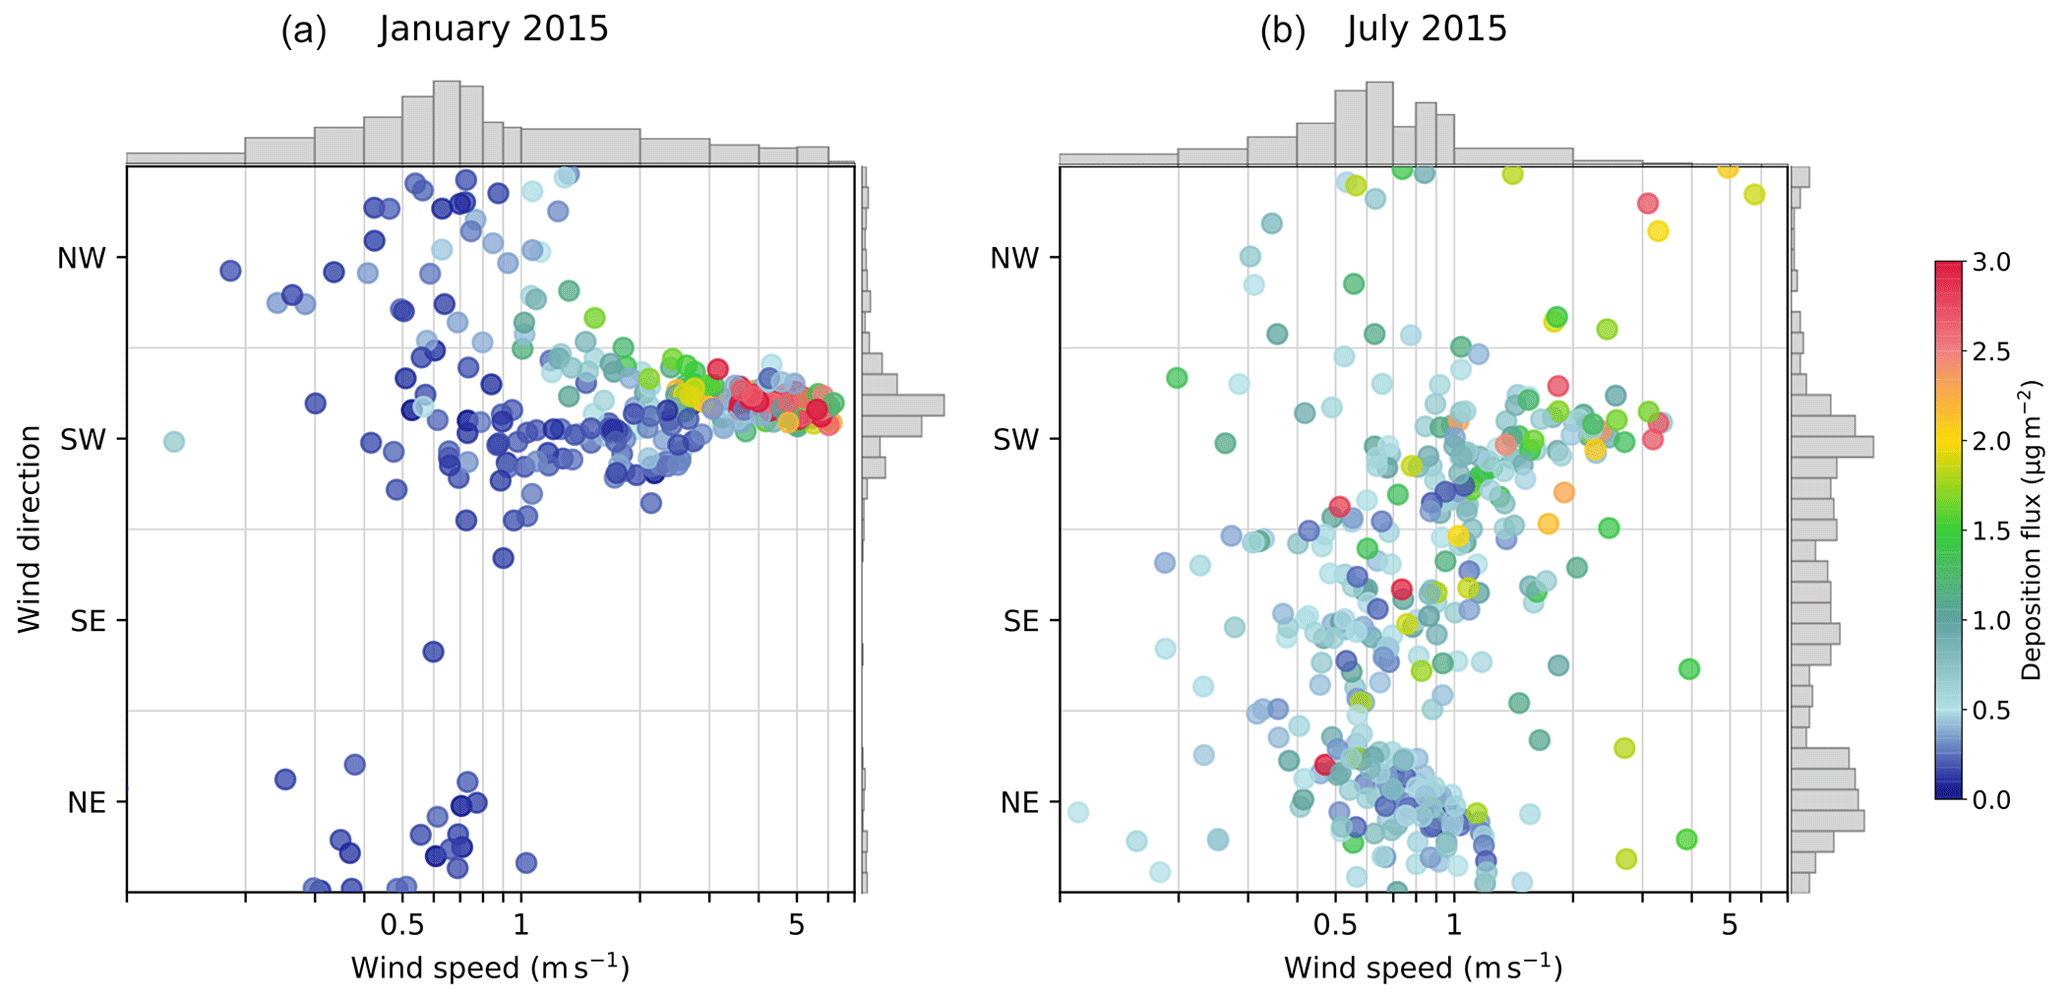
Figure 9Modeled 2-hourly BC deposition flux (colors) averaged on glaciers between 33 and 34∘ S as a function of modeled 10 m wind speed (x axis) and wind direction (y axis) in downtown Santiago (33.5∘ S, 70.65∘ W) for (a) January and (b) July 2015. Gray histograms indicate the density distribution of wind speed and direction on an arbitrary scale.
Wind speed data inside the canyons are available for only one site, SJG, located in the meridional branch of the Maipo River canyon (Fig. 8d) so that a comparison with what occurs in other canyons is not possible. Nonetheless, it is interesting to observe that at the SJG site, northerlies greater than 5 m s−1 dominate the summertime winds, still with a significant component from the south but related to moderate wind speeds. In wintertime, northerlies are still the strongest winds in terms of speed, but they are less frequent than southerlies that occur the majority of hours, again associated with moderate wind speeds. Given the configuration of the canyon, northerlies are associated with air masses coming from the urban basin, thus bringing BC deep into the canyon as evidenced in Huneeus et al. (2021). These winds are the counterpart of westerlies at PTA. As a result, Fig. 8d accounts very well for the larger contribution of Santiago emissions to BC deposition fluxes in summertime compared to wintertime near the Maipo River canyon observed in Fig. 3c and d: the westerly-at-PTA–northerly-at-SJG combination is the most favorable for urban BC intrusions into the canyons and is recorded more frequently in January than in July. Absolute deposition fluxes in that area are still larger in winter than in summer on average, except near the Mapocho canyon (Fig. 3a and b). Advection conditions are more favorable in summer, but emissions are significantly larger in winter, thus explaining the larger share from Santiago but generally smaller absolute total in summer.
These observed winds and PM concentrations in Santiago and their relation with deposition on glaciers can be further described using the modeled winds and BC deposition fluxes in our simulations. On average for glaciers located between 33 and 34∘ S, Fig. 9 shows the dependency of the BC deposition flux on surface wind speed and direction in Santiago. From this, it clearly appears that in summer maximum deposition occurs concurrently with strong southwesterlies in Santiago, which dominate the circulation (gray histogram in Fig. 9). In winter, no clear predominant wind direction is associated with deposition, consistent with more spread-out wind directions and a more erratic advection. The contribution of the mountain-valley circulation is harder to illustrate, given the diversity of orientations of canyon axes, causing very diverse mountain-valley-associated wind directions.
In summary, chemistry-transport simulations, reanalysis and local observations consistently evidence and explain that (i) summertime conditions are more favorable for the export of urban BC, explaining that despite lower emissions, deposition rates on individual glaciers can be larger than in wintertime, and (ii) synoptic winds influence the summertime transport throughout the mixing layer, combining with mountain-valley circulation dynamics, while only the latter drives wintertime deposition. Synoptic-scale southwesterlies in summer enable the transport of the BC-containing, more convective mixing layer air masses up to higher elevations. In parallel, mountain-valley circulation also favors the transport of BC through the canyon networks, in both summer and winter, although with a different intensity. The next section briefly explores whether and how this summertime–wintertime dichotomy could evolve under climate change and emission scenarios.

Figure 10(a) Times series of future monthly surface wind speed in Santiago under scenarios RCP8.5 (blue/green) and RCP2.6 (black/gray) for the months of July/January. Ensemble mean of six model realizations. Trends significant at the 99 % level based on a Mann–Kendall test are shown as a dashed line. Data from CORDEX-CORE taken at the grid point 33.5∘ S, 70.65∘ W. (b) BC emission scenarios for Santiago under the RCP8.5 (blue) and RCP2.6 (gray) scenarios. Data from the RCP database, averaged over the grid points between 33.25 and 33.75∘ S and 70.25 and 71.25∘ W.
3.3 A glimpse at future trends
Figure 10a shows the time series of future wind speed in Santiago under the RCP2.6 and RCP8.5 scenarios, as downscaled within the CORDEX-CORE framework (see Sect. 2.2 for details on the data and models used). In the context of the RCP2.6 scenario, the ensemble mean does not reveal a significant trend (in the sense of a Mann–Kendall test) for either season (gray and black lines in Fig. 10a). Alternatively, the RCP8.5 scenario leads to significant trends (at the 99 % level) in wind speed in January (+0.02 m s−1 per decade) and July (−0.03 m s−1 per decade). Although they are significant, these computed trends are small and much smaller than the ensemble standard deviation. As a result, the following analysis is by far uncertain but serves as an illustration of possible futures.
In the present-day climate, wind speeds in the Santiago area in CORDEX-CORE ensemble are higher in July (2.6 m s−1) than in January (2.2 m s−1). In scenario RCP8.5, at the end of the century, average wind speeds become equivalent in January and July (2.4 m s−1). In other words, based on the findings of Sect. 3.2, the summertime–wintertime dichotomy in BC export potential could be exacerbated in the future, with even more favorable conditions for export in summer and even less favorable export conditions in winter, assuming that, at the first order, BC transport is driven by surface wind in Santiago (as illustrated in Fig. 9). However this can be moderated by changes in precipitation patterns, which can lead to changes in scavenging and wet deposition, so that the previous inference is an idealized one. Nevertheless, this illustrates that summertime emissions could matter even more in the coming decades when it comes to BC deposition on Chilean glaciers.
Along with climate, anthropogenic emissions of greenhouse gases and pollutants also evolve in RCP scenarios. Interestingly, the scenario in which climate change is limited (RCP2.6) is associated with a lesser reduction in BC emissions compared to the business-as-usual scenario (RCP8.5) for Santiago, with almost no emissions at the end of the 21st century in RCP8.5 but still more than 200 t yr−1 in RCP2.6 at that time (Fig. 10b). This comparison is reversed at the global scale where BC emissions remain higher in RCP8.5 (not shown here). The reason for the RCP8.5 featuring fewer BC emissions than RCP2.6 is that the latter is a climate-focused scenario where BC emission reductions are mostly a co-product benefiting from policies on greenhouse gas emissions, while the former assumes that in regions of the world with high exposure to atmospheric pollution, the effort is focused on designing stringent air quality policies (van Vuuren et al., 2011). This category of regions comprises Santiago, therefore accounting for comparative trends in emissions in both RCP scenarios.
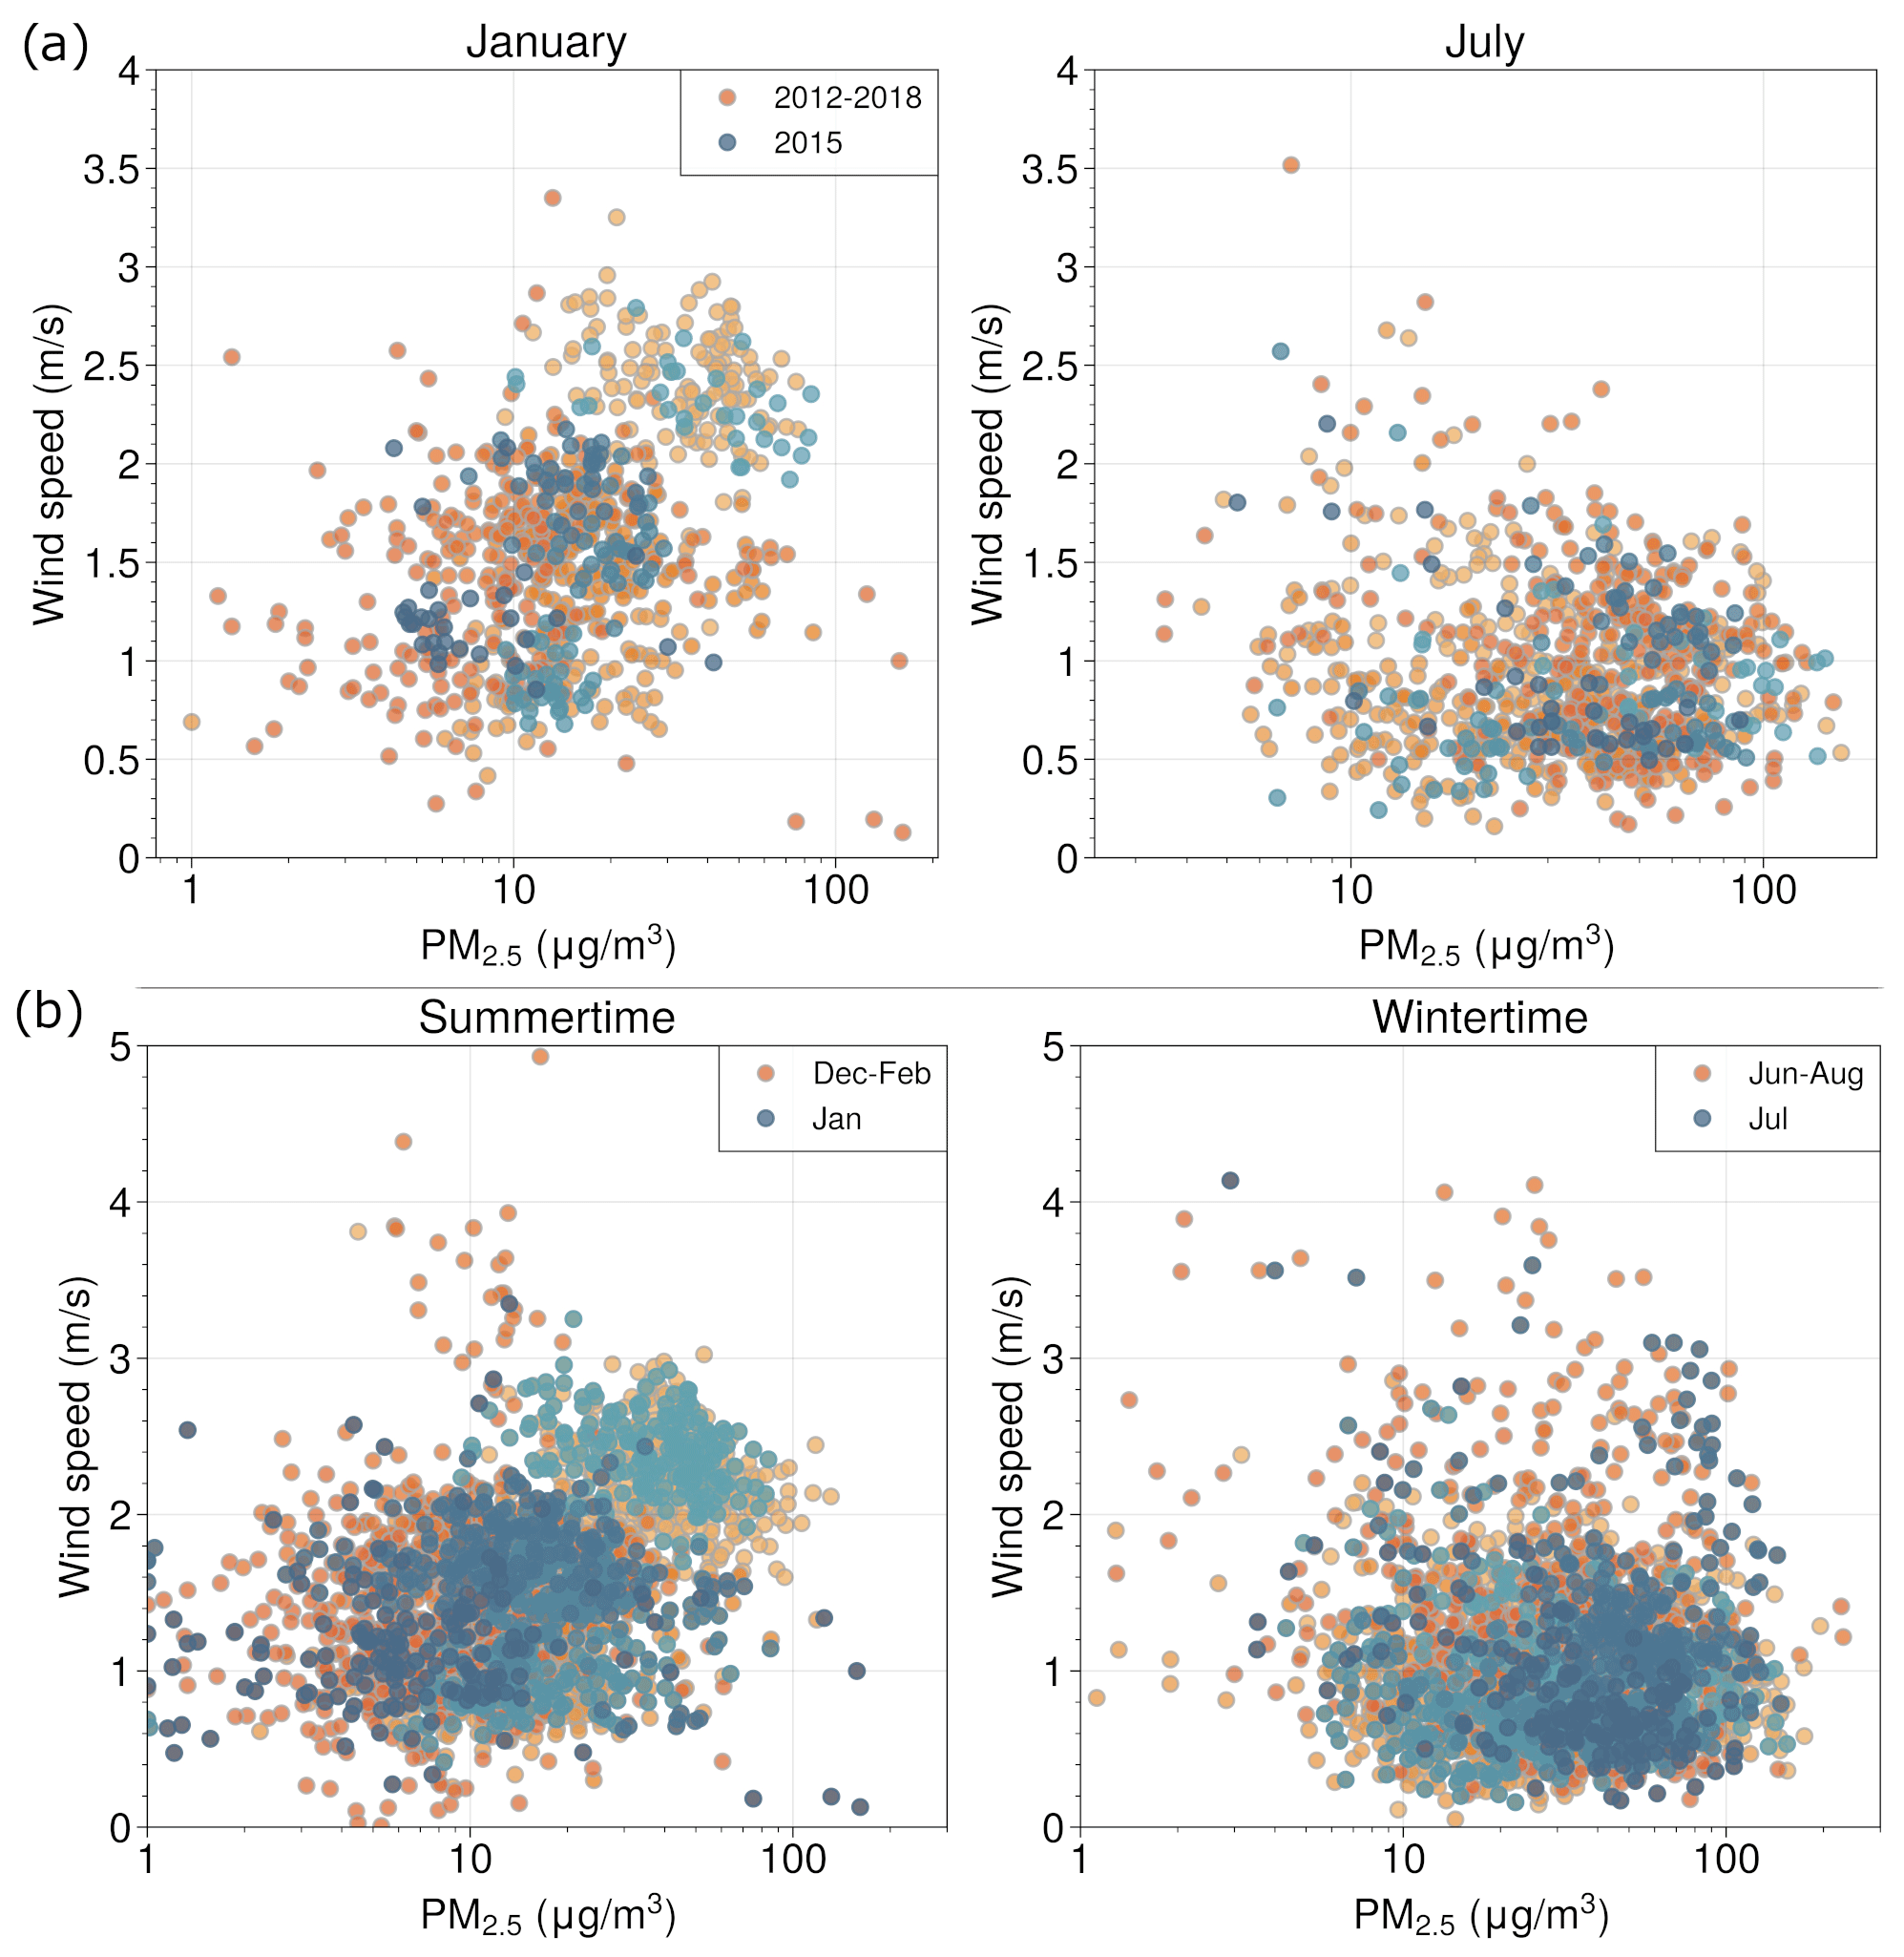
Figure 11(a) Relevance of the year 2015 for wind speed and PM2.5 in January (left) and July (right). Daily mean from hourly data from the SINCA network, for five stations throughout central Chile (Andacollo, Viña del Mar, Parque O'Higgins, Rancagua and Talca – see Table 2 for their location). Each color shade corresponds to a different station. Data from 2015 (blue) is compared to data for the period 2012–2018 (orange) excluding 2015. (b) Relevance of January and July as representative of summertime and wintertime. Same data as (a), but orange is now DJF (left) and JJA (right) and blue is January (left) and July (right).
RCP emission scenarios do not provide intra-yearly detail. No information is available on whether the seasonal cycle of emissions would change under such scenarios. Nevertheless, the RCP8.5 climate scenario leads to increasing average temperatures in the Santiago area, especially in winter months (e.g., Cabré et al., 2016). In that case, one could guess that the need for residential heating would either slightly decrease or at most remain constant and therefore increase BC emissions, given the sensitivity to temperature of wood burning for heating in Chile (Saide et al., 2016). Since the difference in BC emissions between summer and winter mostly stems from the contribution of this source, it is likely that under the RCP8.5 scenario, the seasonality in BC emissions remains similar or marginally decreases.
Consequently, despite currently larger regional BC deposition fluxes on glaciers in wintertime, summer could likely become an equally important season in the future in this respect.
In this work, the year 2015 only was considered for the simulation of BC deposition fluxes. Figure 11 illustrates the relevance of choosing January and July 2015 as representative of pollution and transport conditions in summertime and wintertime, respectively. Figure 11a shows the mean daily surface PM2.5 concentrations and wind speeds observed at five stations throughout central Chile for the period 2012–2018 in January (left) and July (right) and distinguishes between 2015 (blue) and other years (orange). The envelope of wind speed and PM2.5 for 2015 is well contained within the envelope of the other years for both months. Similarly, Fig. 11b shows that the PM2.5 concentrations and wind speeds in January and July, for the period 2012–2018, are not different from DJF and JJA conditions, respectively. Therefore, January and July 2015 are typical months, representative of summertime and wintertime conditions, respectively.
The El Niño–Southern Oscillation (ENSO) can affect atmospheric circulation in central Chile. In particular, El Niño and La Niña phases are related to above-average and below-average rainfall, respectively, in winter (Montecinos and Aceituno, 2003). ENSO also modulates wind speeds in coastal central Chile by affecting the position of the southeastern Pacific anticyclone, leading to generally decreased alongshore winds during El Niño and increased ones during La Niña (Rahn and Garreaud, 2014). However, this teleconnection between ENSO and atmospheric circulation in central Chile seems to have weakened during the particular context of the 2010–2018 mega-drought (Garreaud et al., 2020). Therefore, it is difficult to discuss whether the recorded onset of a strong El Niño phase around April–May 2015 affects the relevance of the July 2015 results presented here on longer timescales. However, the previous discussion on observed wind speeds and PM2.5 concentrations (Fig. 11) supports the hypothesis that 2015 conditions were not exceptional with respect to the surrounding years in terms of the transport of aerosols.
The chemistry-transport simulations used in this work were performed with a 5 km resolution domain. Given the steep topography of the region, the subgrid variability in elevation is large at that scale. The altitude of the glaciers as represented in the model might thus be too low compared to reality due to the grid-point averaging. This may result in excessive deposition fluxes, especially in wintertime when deposition is found to be altitude-dependent. Over the 845 glaciers found in the simulation domain, the comparison with data from WGMS and National Snow and Ice Data Center (2012) yields a mean bias of −287 m in the model, associated with a normalized root-mean-square error (NRMSE) of 11 % and a Pearson correlation coefficient of 0.85. Thus, the glaciers' altitudes are reasonably well reproduced by the model, and the bias induced by the representation of the topography is not expected to affect the results.
Another large source of uncertainty in the simulations stems from the BC emission fluxes. The HTAP inventory is static as of 2010 and with a relatively coarse resolution compared to the processes studied in this work. Simulated PM2.5 concentrations could not be extensively validated across the domain except for a few cities where automated air quality monitoring networks are present, and no validation on the BC fraction of PM2.5 could be performed either (see Lapere et al., 2021b, for more detail on the validation). As a result, BC deposition fluxes presented in this work are to be understood as indicative of the order of magnitude rather than precise estimates of the actual fluxes.
Deposition is among the most uncertain processes in chemistry-transport models. Consequently, there is a significant margin for error in the deposition fluxes obtained and presented in Sect. 3.1. However, a comparison of dry-deposition rates simulated by the model and measured by Rowe et al. (2019) for one snowy site in the Andes near Santiago in winter results in good agreement between both (Lapere et al., 2021a). Although this is only for one site due to lack of more available data, this comparison gives confidence in the model's ability to represent deposition in this topographically complex area. Conducting multiple simulations, using different deposition parameterizations, could help estimate the variability of our results related to this choice. However, Beegum et al. (2020) for example showed that the compared performance of both deposition schemes available in CHIMERE depends on the season and location considered. Thus, including a second set of simulations with the other deposition scheme would not result in more confident results. Only extensive comparisons with observations, which are not available, could constrain the uncertainty of the model.
The accuracy of dry-deposition fluxes relies on a proper representation of surface properties such as slope, albedo or roughness. The areas of interest are located in steep terrain, with large subgrid-scale variability in terms of these three properties. We acknowledge that biases may thus arise in the model, but the nonexistence of measurements of such parameters in the region prevents validation, although their magnitudes appear to be realistic. The roughness length of glaciers in our simulations is taken around a few millimeters, consistent with the usual magnitudes for ice- and snow-covered ground (e.g., Fitzpatrick et al., 2019). The end-of-summer albedo of glaciers of the central Chilean Andes is between 0.2 and 0.6 (Shaw et al., 2021), consistent with the mean 0.33 in our WRF-CHIMERE runs. In wintertime this average reasonably increases to 0.72 due to additional snow cover, consistent with Malmros et al. (2018). Finally, the slope of the largest glaciers in central Chile is comprised between 15 and 25∘ (Shaw et al., 2021), which is likely reasonably captured by the large subgrid-scale orography variance in WRF over the Andes. Also, wet-deposition processes are highly dependent on the proper representation of precipitation in WRF over complex terrain in our simulations. This is known to have relatively poor performance, although at sufficiently high resolution, it is possible to capture the main characteristics of seasonal precipitation over the Central Andes (Schumacher et al., 2020).
It is worth noting that deposition fluxes of BC obtained with CHIMERE are in line with or above modeled fluxes in the Tibetan Plateau (Ji, 2016) and comparable to the results of measurement campaigns on specific glaciers in that same region (Wang et al., 2017; Yan et al., 2019). However, this region receives comparatively greater attention from the research community. The deposition fluxes in Ji (2016) over the Tibetan Plateau, lower than what we found for the Chilean Andes, were estimated to correspond to a radiative forcing of 3 to 6 W m−2. A quantitative comparison between the two very different regions cannot be carried out here and only 2 months are considered so that the cumulative effect of BC deposition cannot be assessed. Also, there is a lack of information on snow properties in the model for the proper evaluation of BC radiative effect in snow and ice. Nevertheless, qualitatively this might point to possibly larger impacts on glaciers of the Central Andes than the 1.4 W m−2 first estimated in Rowe et al. (2019). The radiative impact of BC on snow and ice, however, strongly depends on several characteristics of the snowpack, which are not available in our model, and might greatly change between the two regions of the world compared here. Therefore, it would be interesting in future works to couple the chemistry-transport simulations with a snowpack model in order to estimate directly the radiative forcing implied by BC deposition.
Section 3.1 reveals BC deposition fluxes in summertime which are smaller than in wintertime but of comparable magnitude. Despite a less extended snow cover in summertime, the impact of the presence of BC in snow and ice is greater at that period compared to wintertime. Indeed, solar radiation being more intense, the difference in heat absorption between pristine and darkened snow is more noticeable during the melting season (Kang et al., 2020). Consequently, not only is the winter-accumulated BC accelerating the melting, but additional summertime fluxes of BC contribute to worsening this effect. As a result, although the topic of BC in snow is often investigated in wintertime because of larger emission fluxes and snow extent, this finding suggests that summertime should not be overlooked and should be more closely considered when assessing the modification of the radiative budget by BC on snow and ice.
This work presented comparative estimates of typical BC deposition fluxes on glaciers of the central Chilean Andes for a summer month and winter month, using chemistry-transport modeling. At the regional scale, this flux is found to be 4 times larger in winter (634 µg m−2 per month) than in summer (158 µg m−2 per month), in connection with the use of wood burning for residential heating purposes.
While deposition is strongly elevation-dependent in winter with glaciers below 3500 m featuring the largest fluxes, it is vertically less variable in summer although its maximum is found near 4000 m elevation. The summertime flux is proportionally larger than in winter assuming equal emissions, pointing to more favorable export conditions. This can be critical since glaciers melting in summertime provides freshwater to valleys down the way.
Based on a sensitivity analysis, the share of deposition attributable to emissions from the Santiago Basin was estimated at 50 % in summer and 14 % in winter, related to more scattered BC sources across central Chile in winter. In the vicinity of the capital city (33 to 34∘ S), the areas primarily affected by deposition vary significantly from one season to the other, with the north of the city most affected in summer and the south most affected in winter. The rationale for this difference comes from divergent transport mechanisms. Reanalysis and local observation data revealed that synoptic southwesterly winds and mountain-valley circulation combine in summertime to create ventilation conditions conducive to the transport of BC emissions from urban centers in central Chile towards the Andes in a homogeneous manner, reaching even the highest elevations. In contrast, wintertime only features a more moderate mountain-valley-circulation-driven export but no synoptic forcing, which concentrates deposition close to networks of canyons.
In summary, large emissions and moderate mountain-valley circulation lead to large but localized BC deposition fluxes in winter, while lower emissions but suitable export conditions lead to more widespread BC deposition in summer. Air pollution in the region is mostly investigated in wintertime due to larger emissions and concentrations, but our findings imply that when it comes to the feedback of BC pollution on the albedo of glaciers, and in turn on climate and water resources, summertime is also a season of interest and should not be overlooked.
In the future, according to CORDEX-CORE simulations and emission pathways, under the RCP8.5 scenario, this dichotomy in BC deposition where fluxes are larger in winter could possibly fade however. First, wintertime emissions could potentially drop down and become closer to summertime ones. Second, the favorable summertime export conditions could become slightly more favorable. Third, the bad ventilation conditions in wintertime could worsen and therefore be more unfavorable for export.
The CHIMERE model can be found at https://www.lmd.polytechnique.fr/chimere/ (CHIMERE, 2023), and the model documentation is available in LMD et al. (2021) (https://www.lmd.polytechnique.fr/chimere/docs/CHIMEREdoc_v2020r1.pdf). Data from this work are available from the corresponding author upon reasonable request.
RL: conceptualization, data curation, investigation, formal analysis, visualization, writing – original draft. NH: formal analysis, writing – review and editing. SM: conceptualization, writing – review and editing. LM: conceptualization, writing – review and editing. FC: formal analysis.
The contact author has declared that none of the authors has any competing interests.
Publisher's note: Copernicus Publications remains neutral with regard to jurisdictional claims in published maps and institutional affiliations.
The collaboration between Chilean and French researchers received support from the ECOS-ANID program action no. C19U02. The collaboration leading to this research has received funding from the European Union H2020 program PAPILA (GA 777544). The chemistry-transport simulations used in this work were performed using the high-performance computing resources of TGCC (Trés Grand Centre de Calcul du CEA) under the allocation GEN10274 provided by GENCI (Grand Équipement National de Calcul Intensif). The authors acknowledge the editor, the two anonymous reviewers and Julio C. Marín for their valuable comments and feedback.
This research has been supported by the Agence de l'Innovation de Défense (grant no. NETDESA 2018600074).
This paper was edited by Graciela Raga and reviewed by two anonymous referees.
Álamos, N., Huneeus, N., Opazo, M., Osses, M., Puja, S., Pantoja, N., Denier van der Gon, H., Schueftan, A., Reyes, R., and Calvo, R.: High-resolution inventory of atmospheric emissions from transport, industrial, energy, mining and residential activities in Chile, Earth Syst. Sci. Data, 14, 361–379, https://doi.org/10.5194/essd-14-361-2022, 2022. a
Ayala, Á., Farías-Barahona, D., Huss, M., Pellicciotti, F., McPhee, J., and Farinotti, D.: Glacier runoff variations since 1955 in the Maipo River basin, in the semiarid Andes of central Chile, The Cryosphere, 14, 2005–2027, https://doi.org/10.5194/tc-14-2005-2020, 2020. a
Barandun, M., Bravo, C., Grobety, B., Jenka, T., Fang, L., Naegeli, K., Rivera, A., Cisternas, S., Münster, T., and Schwikowski, M.: Anthropogenic influence on surface changes at the Olivares glaciers; Central Chile, Sci. Total Environ., 833, 155068, https://doi.org/10.1016/j.scitotenv.2022.155068, 2022. a
Barnett, T. P., Adam, J. C., and Lettenmaier, D. P.: Potential impacts of a warming climate on water availability in snow-dominated regions, Nature, 438, 303–309, https://doi.org/10.1038/nature04141, 2005. a, b
Barraza, F., Lambert, F., Jorquera, H., Villalobos, A. M., and Gallardo, L.: Temporal evolution of main ambient PM2.5 sources in Santiago, Chile, from 1998 to 2012, Atmos. Chem. Phys., 17, 10093–10107, https://doi.org/10.5194/acp-17-10093-2017, 2017. a, b
Beegum, S. N., Tuomiranta, A., Gherboudj, I., Flemming, J., and Ghedira, H.: Simulation of aerosol deposition flux over the Arabian Peninsula with CHIMERE-2017: Sensitivity to different dry deposition schemes, Atmos. Res., 241, 104949, https://doi.org/10.1016/j.atmosres.2020.104949, 2020. a
Cabré, M. F., Solman, S., and Núñez, M.: Regional climate change scenarios over southern South America for future climate (2080–2099) using the MM5 Model. Mean, interannual variability and uncertainties, Atmósfera, 29, 35–60, https://doi.org/10.20937/ATM.2016.29.01.04, 2016. a
CHIMERE: A multi-scale chemistry-transport model for atmospheric composition analysis and forecast, Current version: CHIMERE v2020r3, https://www.lmd.polytechnique.fr/chimere/, last access: 31 January 2023. a
Copernicus Climate Change Service: ERA5: Fifth generation of ECMWF atmospheric reanalyses of the global climate, Copernicus Climate Change Service Climate Data Store (CDS), https://doi.org/10.24381/cds.adbb2d47, 2017. a, b
Cordero, R. R., Sepúlveda, E., Feron, S., Wang, C., Damiani, A., Fernandoy, F., Neshyba, S., Rowe, P. M., Asencio, V., Carrasco, J., Alfonso, J. A., MacDonell, S., Seckmeyer, G., Carrera, J. M., Jorquera, J., Llanillo, P., Dana, J., Khan, A. L., and Casassa, G.: Black carbon in the Southern Andean snowpack, Environ. Res. Lett., 17, 044042, https://doi.org/10.1088/1748-9326/ac5df0, 2022. a, b
Cordova, A. M., Arévalo, J., Marín, J. C., Baumgardner, D., Raga, G. B., Pozo, D., Ochoa, C. A., and Rondanelli, R.: On the Transport of Urban Pollution in an Andean Mountain Valley, Aerosol Air Qual. Res., 16, 593–605, https://doi.org/10.4209/aaqr.2015.05.0371, 2016. a
Dang, C., Brandt, R. E., and Warren, S. G.: Parameterizations for narrowband and broadband albedo of pure snow and snow containing mineral dust and black carbon, J. Geophys. Res.-Atmos., 120, 5446–5468, https://doi.org/10.1002/2014JD022646, 2015. a
Dirección Meteorológica de Chile: Portal de Servicios Climáticos, https://climatologia.meteochile.gob.cl/ (last access: 11 May 2021), 2019. a
ESGF: The Earth System Grid Federation: An open infrastructure for access to distributed geospatial data, Future Gener. Comp. Sy., 36, 400–417, https://doi.org/10.1016/j.future.2013.07.002, 2014. a
Falvey, M. and Garreaud, R.: Wintertime Precipitation Episodes in Central Chile: Associated Meteorological Conditions and Orographic Influences, J. Hydrometeorol., 8, 171–193, https://doi.org/10.1175/JHM562.1, 2007. a
Fitzpatrick, N., Radić, V., and Menounos, B.: A multi-season investigation of glacier surface roughness lengths through in situ and remote observation, The Cryosphere, 13, 1051–1071, https://doi.org/10.5194/tc-13-1051-2019, 2019. a
Garreaud, R. D., Ruttlant, J. A., and Fuenzalida, H.: Coastal Lows along the Subtropical West Coast of South America: Mean Structure and Evolution, Mon. Weather Rev., 130, 75–88, https://doi.org/10.1175/1520-0493(2002)130<0075:CLATSW>2.0.CO;2, 2002. a
Garreaud, R. D., Alvarez-Garreton, C., Barichivich, J., Boisier, J. P., Christie, D., Galleguillos, M., LeQuesne, C., McPhee, J., and Zambrano-Bigiarini, M.: The 2010–2015 megadrought in central Chile: impacts on regional hydroclimate and vegetation, Hydrol. Earth Syst. Sci., 21, 6307–6327, https://doi.org/10.5194/hess-21-6307-2017, 2017. a
Garreaud, R. D., Boisier, J. P., Rondanelli, R., Montecinos, A., Sepúlveda, H. H., and Veloso-Aguila, D.: The Central Chile Mega Drought (2010–2018): A climate dynamics perspective, Int. J. Climatol., 40, 421–439, https://doi.org/10.1002/joc.6219, 2020. a
Giorgi, F., Coppola, E., Jacob, D., Teichmann, C., Omar, S. A., Ashfaq, M., Ban, N., Bülow, K., Bukovsky, M., Buntemeyer, L., Cavazos, T., Ciarló, J., Rocha, R. P. D., Das, S., di Sante, F., Evans, J. P., Gao, X., Giuliani, G., Glazer, R. H., Hoffmann, P., Im, E.-S., Langendijk, G., Lierhammer, L., Llopart, M., Mueller, S., Luna-Nino, R., Nogherotto, R., Pichelli, E., Raffaele, F., Reboita, M., Rechid, D., Remedio, A., Remke, T., Sawadogo, W., Sieck, K., Torres-Alavez, J. A., and Weber, T.: The CORDEX-CORE EXP-I initiative: Description and highlight results from the initial analysis, B. Am. Meteorol. Soc., 103, E293–E310, https://doi.org/10.1175/BAMS-D-21-0119.1, 2021. a
Gramsch, E., Muñoz, A., Langner, J., Morales, L., Soto, C., Pérez, P., and Rubio, M. A.: Black carbon transport between Santiago de Chile and glaciers in the Andes Mountains, Atmos. Environ., 232, 117546, https://doi.org/10.1016/j.atmosenv.2020.117546, 2020. a, b, c, d
Gutowski Jr., W. J., Giorgi, F., Timbal, B., Frigon, A., Jacob, D., Kang, H.-S., Raghavan, K., Lee, B., Lennard, C., Nikulin, G., O'Rourke, E., Rixen, M., Solman, S., Stephenson, T., and Tangang, F.: WCRP COordinated Regional Downscaling EXperiment (CORDEX): a diagnostic MIP for CMIP6, Geosci. Model Dev., 9, 4087–4095, https://doi.org/10.5194/gmd-9-4087-2016, 2016. a
Hadley, O. L. and Kirchstetter, T. W.: Black-carbon reduction of snow albedo, Nat. Clim. Change, 2, 437–440, https://doi.org/10.1038/nclimate1433, 2012. a
Hock, R., Rasul, G., Adler, C., Cáceres, B., Gruber, S., Hirabayashi, Y., Jackson, M., Kääb, A., Kang, S., Kutuzov, S., Milner, A., Molau, U., Morin, S., Orlove, B., and Steltzer, H.: High Mountain Areas, in: IPCC Special Report on the Ocean and Cryosphere in a Changing Climate, edited by: Pörtner, H.-O., Roberts, D. C., Masson-Delmotte, V., Zhai, P., Tignor, M., Poloczanska, E., Mintenbeck, K., Alegría, A., Nicolai, M., Okem, A., Petzold, J., Rama, B., and Weyer, N. M., Cambridge University Press, Cambridge, UK and New York, NY, USA, 131–202, https://doi.org/10.1017/9781009157964.004, 2019. a
Hodson, A. J.: Understanding the dynamics of black carbon and associated contaminants in glacial systems, WIREs Water, 1, 141–149, https://doi.org/10.1002/wat2.1016, 2014. a
Huneeus, N., Lapere, R., Mazzeo, A., Ordoñez, C., Donoso, N., Muñoz, R., and Rutllant, J. A.: Deep intrusions of urban black carbon into a canyon near Santiago, Chile: a pathway towards Andean glaciers, Environ. Pollut., 291, 118124, https://doi.org/10.1016/j.envpol.2021.118124, 2021. a, b, c
Ilabaca, M., Olaeta, I., Campos, E., Villaire, J., Tellez-Rojo, M. M., and Romieu, I.: Association between Levels of Fine Particulate and Emergency Visits for Pneumonia and other Respiratory Illnesses among Children in Santiago, Chile, J. Air Waste Manage., 49, 154–163, https://doi.org/10.1080/10473289.1999.10463879, 1999. a
Janssens-Maenhout, G., Crippa, M., Guizzardi, D., Dentener, F., Muntean, M., Pouliot, G., Keating, T., Zhang, Q., Kurokawa, J., Wankmüller, R., Denier van der Gon, H., Kuenen, J. J. P., Klimont, Z., Frost, G., Darras, S., Koffi, B., and Li, M.: HTAP_v2.2: a mosaic of regional and global emission grid maps for 2008 and 2010 to study hemispheric transport of air pollution, Atmos. Chem. Phys., 15, 11411–11432, https://doi.org/10.5194/acp-15-11411-2015, 2015. a
Ji, Z.-M.: Modeling black carbon and its potential radiative effects over the Tibetan Plateau, Adv. Clim. Change Res., 7, 139–144, https://doi.org/10.1016/j.accre.2016.10.002, 2016. a, b
Kang, S., Zhang, Y., Qian, Y., and Wang, H.: A review of black carbon in snow and ice and its impact on the cryosphere, Earth-Sci. Rev., 210, 103346, https://doi.org/10.1016/j.earscirev.2020.103346, 2020. a, b
Lapere, R., Menut, L., Mailler, S., and Huneeus, N.: Soccer games and record-breaking PM2.5 pollution events in Santiago, Chile, Atmos. Chem. Phys., 20, 4681–4694, https://doi.org/10.5194/acp-20-4681-2020, 2020. a
Lapere, R., Mailler, S., Menut, L., and Huneeus, N.: Pathways for wintertime deposition of anthropogenic light-absorbing particles on the Central Andes cryosphere, Environ. Pollut., 272, 115901, https://doi.org/10.1016/j.envpol.2020.115901, 2021a. a, b, c, d, e, f
Lapere, R., Menut, L., Mailler, S., and Huneeus, N.: Seasonal variation in atmospheric pollutants transport in central Chile: dynamics and consequences, Atmos. Chem. Phys., 21, 6431–6454, https://doi.org/10.5194/acp-21-6431-2021, 2021b. a, b, c, d, e, f
LMD, INERIS, and LISA: CHIMERE Chemistry-transport model v2020r1, https://www.lmd.polytechnique.fr/chimere/docs/CHIMEREdoc_v2020r1.pdf (last access: 1 March 2022), 2021. a, b
Magalhães, N., Evangelista, H., Condom, T., Rabatel, A., and Ginot, P.: Amazonian Biomass Burning Enhances Tropical Andean Glaciers Melting, Sci. Rep.-UK, 9, 16914, https://doi.org/10.1038/s41598-019-53284-1, 2019. a
Mailler, S., Menut, L., Khvorostyanov, D., Valari, M., Couvidat, F., Siour, G., Turquety, S., Briant, R., Tuccella, P., Bessagnet, B., Colette, A., Létinois, L., Markakis, K., and Meleux, F.: CHIMERE-2017: from urban to hemispheric chemistry-transport modeling, Geosci. Model Dev., 10, 2397–2423, https://doi.org/10.5194/gmd-10-2397-2017, 2017. a
Malmros, J. K., Mernild, S. H., Wilson, R., Tagesson, T., and Fensholt, R.: Snow cover and snow albedo changes in the central Andes of Chile and Argentina from daily MODIS observations (2000–2016), Remote Sens. Environ., 209, 240–252, https://doi.org/10.1016/j.rse.2018.02.072, 2018. a
Marín, J. C., Raga, G. B., Arévalo, J., Baumgardner, D., Córdova, A. M., Pozo, D., Calvo, A., Castro, A., Fraile, R., and Sorribas, M.: Properties of particulate pollution in the port city of Valparaiso, Chile, Atmos. Environ., 171, 301–316, https://doi.org/10.1016/j.atmosenv.2017.09.044, 2017. a
Mazzeo, A., Huneeus, N., Ordoñez, C., Orfanoz-Cheuquelaf, A., Menut, L., Mailler, S., Valari, M., van der Gon, H. D., Gallardo, L., Muñoz, R., Donoso, R., Galleguillos, M., Ossesa, M., and Tolvett, S.: Impact of residential combustion and transport emissions on air pollution in Santiago during winter, Atmos. Environ., 190, 195–208, https://doi.org/10.1016/j.atmosenv.2018.06.043, 2018. a, b
Ménégoz, M., Krinner, G., Balkanski, Y., Cozic, A., Boucher, O., and Ciais, P.: Boreal and temperate snow cover variations induced by black carbon emissions in the middle of the 21st century, The Cryosphere, 7, 537–554, https://doi.org/10.5194/tc-7-537-2013, 2013. a
Ménégoz, M., Krinner, G., Balkanski, Y., Boucher, O., Cozic, A., Lim, S., Ginot, P., Laj, P., Gallée, H., Wagnon, P., Marinoni, A., and Jacobi, H. W.: Snow cover sensitivity to black carbon deposition in the Himalayas: from atmospheric and ice core measurements to regional climate simulations, Atmos. Chem. Phys., 14, 4237–4249, https://doi.org/10.5194/acp-14-4237-2014, 2014. a
Menut, L., Bessagnet, B., Khvorostyanov, D., Beekmann, M., Blond, N., Colette, A., Coll, I., Curci, G., Foret, G., Hodzic, A., Mailler, S., Meleux, F., Monge, J.-L., Pison, I., Siour, G., Turquety, S., Valari, M., Vautard, R., and Vivanco, M. G.: CHIMERE 2013: a model for regional atmospheric composition modelling, Geosci. Model Dev., 6, 981–1028, https://doi.org/10.5194/gmd-6-981-2013, 2013. a
Ministerio del Medio Ambiente: Sistema de Información Nacional de Calidad del Aire, https://sinca.mma.gob.cl/ (last access: 11 May 2021), 2015. a
Montecinos, A. and Aceituno, P.: Seasonality of the ENSO-Related Rainfall Variability in Central Chile and Associated Circulation Anomalies, J. Climate, 16, 281–296, https://doi.org/10.1175/1520-0442(2003)016<0281:SOTERR>2.0.CO;2, 2003. a
Muñoz, R. C., Whiteman, C. D., Garreaud, R. D., Rutllant, J. A., and Hidalgo, J.: Using Commercial Aircraft Meteorological Data to Assess the Heat Budget of the Convective Boundary Layer Over the Santiago Valley in Central Chile, Bound.-Lay. Meteorol., 183, 295–319, https://doi.org/10.1007/s10546-021-00685-3, 2022. a
Niu, H., Kang, S., Wang, H., Du, J., Pu, T., Zhang, G., Lu, X., Yan, X., Wang, S., and Shi, X.: Light-absorbing impurities accelerating glacial melting in southeastern Tibetan Plateau, Environ. Pollut., 257, 113541, https://doi.org/10.1016/j.envpol.2019.113541, 2020. a
Rabatel, A., Francou, B., Soruco, A., Gomez, J., Cáceres, B., Ceballos, J. L., Basantes, R., Vuille, M., Sicart, J.-E., Huggel, C., Scheel, M., Lejeune, Y., Arnaud, Y., Collet, M., Condom, T., Consoli, G., Favier, V., Jomelli, V., Galarraga, R., Ginot, P., Maisincho, L., Mendoza, J., Ménégoz, M., Ramirez, E., Ribstein, P., Suarez, W., Villacis, M., and Wagnon, P.: Current state of glaciers in the tropical Andes: a multi-century perspective on glacier evolution and climate change, The Cryosphere, 7, 81–102, https://doi.org/10.5194/tc-7-81-2013, 2013. a
Rahn, D. A. and Garreaud, R. D.: A synoptic climatology of the near-surface wind along the west coast of South America, Int. J. Climatol., 34, 780–792, https://doi.org/10.1002/joc.3724, 2014. a
RCP Database: RCP Database, https://tntcat.iiasa.ac.at/RcpDb/ (last access: 1 March 2022), 2009. a
Réveillet, M., Dumont, M., Gascoin, S., Lafaysse, M., Nabat, P., Ribes, A., Nheili, R., Tuzet, F., Ménégoz, M., Morin, S., Picard, G., and Ginoux, P.: Black carbon and dust alter the response of mountain snow cover under climate change, Nat. Commun., 13, 5279, https://doi.org/10.1038/s41467-022-32501-y, 2022. a, b
Riahi, K., Grübler, A., and Nakicenovic, N.: Scenarios of long-term socio-economic and environmental development under climate stabilization, Technol. Forecast. Soc., 74, 887–935, https://doi.org/10.1016/j.techfore.2006.05.026, 2007. a
Rowe, P. M., Cordero, R. R., Warren, S. G., Stewart, E., Doherty, S. J., Pankow, A., Schrempf, M., Casassa, G., Carrasco, J., Pizarro, J., MacDonell, S., Damiani, A., Lambert, F., Rondanelli, R., Huneeus, N., Fernandoy, F., and Neshyba, S.: Black carbon and other light-absorbing impurities in snow in the Chilean Andes, Sci. Rep.-UK, 9, 4008, https://doi.org/10.1038/s41598-019-39312-0, 2019. a, b, c, d, e
Saide, P. E., Mena-Carrasco, M., Tolvett, S., Hernandez, P., and Carmichael, G. R.: Air quality forecasting for winter-time PM2.5 episodes occurring in multiple cities in central and southern Chile, J. Geophys. Res.-Atmos., 121, 558–575, https://doi.org/10.1002/2015JD023949, 2016. a, b, c
Schumacher, V., Fernández, A., Justino, F., and Comin, A.: WRF High Resolution Dynamical Downscaling of Precipitation for the Central Andes of Chile and Argentina, Front. Earth Sci., 8, 328, https://doi.org/10.3389/feart.2020.00328, 2020. a
Shaw, T. E., Ulloa, G., Farías-Barahona, D., Fernandez, R., Lattus, J. M., and McPhee, J.: Glacier albedo reduction and drought effects in the extratropical Andes, 1986–2020, J. Glaciol., 67, 158–169, https://doi.org/10.1017/jog.2020.102, 2021. a, b
Shrestha, G., Traina, S. J., and Swanston, C. W.: Black Carbon's Properties and Role in the Environment: A Comprehensive Review, Sustainability, 2, 294–320, https://doi.org/10.3390/su2010294, 2010. a
Skamarock, W. C., Klemp, J. B., Dudhia, J., Gill, D. O., Barker, D. M., Duda, M. G., Huang, X.-Y., Wang, W., and Powers, J. G.: A Description of the Advanced Research WRF Version 3, NCAR Technical Note 27, NCAR, https://doi.org/10.5065/D68S4MVH, 2008. a
van Vuuren, D. P., den Elzen, M. G. J., Lucas, P. L., Eickhout, B., Strengers, B. J., van Ruijven, B., Wonink, S., and van Houdt, R.: Stabilizing greenhouse gas concentrations at low levels: an assessment of reduction strategies and costs, Climatic Change, 81, 119–159, https://doi.org/10.1007/s10584-006-9172-9, 2007. a
van Vuuren, D. P., Edmonds, J., Kainuma, M., Riahi, K., Thomson, A., Hibbard, K., Hurtt, G. C., Kram, T., Krey, V., Lamarque, J.-F., Masui, T., Meinshausen, M., Nakicenovic, N., Smith, S. J., and Rose, S. K.: The representative concentration pathways: an overview, Climatic Change, 109, 5, https://doi.org/10.1007/s10584-011-0148-z, 2011. a
Villalobos, A. M., Barraza, F., Jorquera, H., and Schauer, J. J.: Chemical speciation and source apportionment of fine particulate matter in Santiago, Chile, 2013, Sci. Total Environ., 512–513, 133–142, https://doi.org/10.1016/j.scitotenv.2015.01.006, 2015. a
Vuille, M., Carey, M., Huggel, C., Buytaert, W., Rabatel, A., Jacobsen, D., Soruco, A., Villacis, M., Yarleque, C., Timm, O. E., Condom, T., Salzmann, N., and Sicart, J.-E.: Rapid decline of snow and ice in the tropical Andes – Impacts, uncertainties and challenges ahead, Earth-Sci. Rev., 176, 195–213, https://doi.org/10.1016/j.earscirev.2017.09.019, 2018. a, b
Wang, Q., Zhao, Z., Tian, J., Zhu, C., Ni, H., Zhang, Y., Zhang, N., Shan, Z., Han, Y., and Cao, J.: Seasonal Transport and Dry Deposition of Black Carbon Aerosol in the Southeastern Tibetan Plateau, Aerosol Sci. Eng., 1, 160–168, https://doi.org/10.1007/s41810-017-0016-y, 2017. a
Wang, X., Zhang, L., and Moran, M. D.: Development of a new semi-empirical parameterization for below-cloud scavenging of size-resolved aerosol particles by both rain and snow, Geosci. Model Dev., 7, 799–819, https://doi.org/10.5194/gmd-7-799-2014, 2014. a
Wesely, M. L.: Parameterization of surface resistances to gaseous dry deposition in regional-scale numerical models, Atmos. Environ., 23, 1293–1304, https://doi.org/10.1016/0004-6981(89)90153-4, 1989. a
WGMS and National Snow and Ice Data Center: World Glacier Inventory, Version 1, NSIDC: National Snow and Ice Data Center, Boulder, Colorado, USA, https://doi.org/10.7265/N5/NSIDC-WGI-2012-02, 2012. a, b, c
Whiteman, D. C.: Mountain Meteorology: Fundamentals and Applications, Oxford University Press, https://doi.org/10.1093/oso/9780195132717.001.0001, 2000. a
Willis, P. and Tattelman, P.: Drop-size distributions associated with intense rainfall, J. Appl. Meteorol., 28, 3–15, https://doi.org/10.1175/1520-0450(1989)028<0003:DSDAWI>2.0.CO;2, 1989. a
Yan, F., He, C., Kang, S., Chen, P., Hu, Z., Han, X., Gautam, S., Yan, C., Zhang, M., Sillanpää, M., Raymond, P. A., and Li, C.: Deposition of Organic and Black Carbon: Direct Measurements at Three Remote Stations in the Himalayas and Tibetan Plateau, J. Geophys. Res., 124, 9702–9715, https://doi.org/10.1029/2019JD031018, 2019. a
Zängl, G.: The impact of weak synoptic forcing on the valley-wind circulation in the Alpine Inn Valley, Meteorol. Atmos. Phys., 105, 37–53, https://doi.org/10.1007/s00703-009-0030-y, 2009. a
Zhang, L., Gong, S., Padro, J., and Barrie, L.: A size-segregated particle dry deposition scheme for an atmospheric aerosol module, Atmos. Environ., 35, 549–560, https://doi.org/10.1016/S1352-2310(00)00326-5, 2001. a