the Creative Commons Attribution 4.0 License.
the Creative Commons Attribution 4.0 License.
 | 27 Jan 2023
Modeling the influence of chain length on secondary organic aerosol (SOA) formation via multiphase reactions of alkanes
Azad Madhu
David Deacon
Secondary organic aerosol (SOA) from diesel fuel is known to be significantly sourced from the atmospheric oxidation of aliphatic hydrocarbons. In this study, the formation of linear alkane SOA was predicted using the Unified Partitioning Aerosol Phase Reaction (UNIPAR) model that simulated multiphase reactions of hydrocarbons. In the model, the formation of oxygenated products from the photooxidation of linear alkanes was simulated using a nearly explicit gas kinetic mechanism. Autoxidation paths integrated with alkyl peroxy radicals were added to the Master Chemical Mechanism v3.3.1 to improve the prediction of low-volatility products in the gas phase and SOA mass. The resulting gas products were then lumped into volatility- and reactivity-based groups that are linked to mass-based stoichiometric coefficients. The SOA mass in the UNIPAR model is produced via three major pathways: partitioning of gaseous oxidized products onto both the organic and wet inorganic phases, oligomerization in the organic phase, and reactions in the wet inorganic phase (acid-catalyzed oligomerization and organosulfate formation). The model performance was demonstrated for SOA data that were produced through the photooxidation of a homologous series of linear alkanes ranging from C9–C15 under varying environments (NOx levels and inorganic seed conditions) in a large outdoor photochemical smog chamber. The product distributions of linear alkanes were mathematically predicted as a function of carbon number using an incremental volatility coefficient (IVC) to cover a wide range of alkane lengths. The prediction of alkane SOA using the incremental volatility-based product distributions, which were obtained with C9–C12 alkanes, was evaluated for C13 and C15 chamber data and further extrapolated to predict the SOA from longer-chain alkanes (≥ C15) that can be found in diesel. The model simulation of linear alkanes in diesel fuel suggests that SOA mass is mainly produced by alkanes C15 and higher. Alkane SOA is insignificantly impacted by the reactions of organic species in the wet inorganic phase due to the hydrophobicity of products but significantly influenced by gas–particle partitioning.
- Article
(1402 KB) - Full-text XML
-
Supplement
(883 KB) - BibTeX
- EndNote


Secondary organic aerosol (SOA) represents a significant proportion (20 %–90 %) of fine particulate matter in ambient air (Kanakidou et al., 2005). SOA is formed from the atmospheric photooxidation of hydrocarbon (HC) species and can have significant impacts on climate and human health (US EPA, 2019; Nel, 2005; Shrivastava et al., 2017; World Health, 2016).
To properly assess SOA burdens, especially in urban areas, precursor alkane species must be accounted for. Alkanes are released into the atmosphere primarily through varying anthropogenic sources such as fossil fuels and volatile chemical products (i.e., personal care products, paints, pesticides) (Li et al., 2022; Wu et al., 2019). Alkanes have been shown to be significant components of gasoline exhaust (6 %–18 %) and diesel exhaust (18 %–31 %), and vehicle emissions are the main source in urban areas (Caplain et al., 2006). Whereas the majority of SOA produced from gasoline sources is from its aromatic content, about half of the SOA produced from diesel can be attributed to aliphatic compounds (Gentner et al., 2012). Currently, long-chain alkanes are recognized to be important precursors of SOA production, with increasing carbon numbers in linear alkanes leading to higher SOA yields (Aumont et al., 2012). Branched and cyclic alkanes will tend to have different yields compared to linear alkanes with the same carbon number. This is partially because branched alkanes tend to produce more volatile products and cyclic alkanes produce less volatile products relative to linear alkanes (Lim and Ziemann, 2009).
Previous studies modeling SOA formation have often had a discrepancy between predicted SOA formation and field observations (Shrivastava et al., 2017; Volkamer et al., 2006). This discrepancy can be explained by several factors. Firstly, the contribution of intermediate-volatility organic compounds (IVOCs) has often been ignored during model simulations (Robinson et al., 2007). Multiple studies in recent years have attempted to correct this discrepancy by including IVOCs. Using the CHIMERE regional air quality model, Hodzic et al. (2010) found that the inclusion of IVOCs led to a substantial improvement in predictions of SOA compared to data collected from the MILAGRO field experiment. Alkanes are important IVOCs in urban environments. Lee-Taylor et al. (2011) attempted to simulate the same MILAGRO field data using a nearly explicit gas mechanism (GECKO-A) to determine SOA mass based on gas–particle partitioning of possible intermediate products. They reproduced the field data well, and they found that more that 75 % of SOA produced in their model was from products of larger linear alkane species, which were used as surrogates for larger precursors.
Secondly, currently existing gas mechanisms for precursor hydrocarbons have a large level of uncertainty due to unidentified oxidation paths. For example, Xavier et al. (2019) found that the formation of terpene SOA simulated by exclusively using the Master Chemical Mechanism (MCM) consistently underpredicted experimental values but the inclusion of peroxy radical autoxidation mechanisms (PRAMs) improved predictions by increasing the formation of low-volatility products. Like terpenes, autoxidation occurring on the products of alkane species can produce low-volatility products that readily partition to the particle phase, but it has not been included in the current MCM. The addition of those reaction pathways can improve currently existing mechanisms and consequently SOA predictions.
Thirdly, relying on an improvement of the gas mechanism alone is not sufficient for improving predictions of SOA production. Lee-Taylor et al. (2011) note that their reasonable agreement for SOA predictions with field data is not necessarily realistic as they do not include alternative pathways for SOA formation such as particle-phase reactions. Whereas the particle-phase reactions of alkane SOA are limited, the organic matter produced by aerosol-phase reactions of reactive organic compounds, originating from other precursors, can increase the partitioning of alkane oxidation products. Yang et al. (2019) simulated SOA formation in China using the nested air quality prediction modeling system (NAQPMS) but have a similar issue as Hodzic et al. (2010) as they also exclusively use volatility-based lumping and do not consider particle-phase reactions. Pye and Pouliot (2012) consider particle-phase reactions in their simulation of regional SOA formation using the Community Multiscale Air Quality (CMAQ) model. However, the complexity of particle-phase reactions in their model is limited as they use a uniform reaction rate constant for the particle-phase reactions of semi-volatile SOA. Alkane SOA may not be significantly influenced by particle-phase reactions compared to other precursors, but some studies have attempted to account for particle-phase reactions to form alkane SOA. For example, Cappa et al. (2013), using the Statistical Oxidation Model (SOM), attempt to implicitly capture particle-phase reactions through fitting model parameters to alkane SOA experimental measurements instead of explicitly modeled particle-phase reactions. Similarly, in the Functional Group Oxidation Model (FGOM) derived by Zhang and Seinfeld (2013), the reactions are controlled by rate constants that are fit to experimental measurements rather than derived from the properties of explicit or lumped compounds from alkane oxidation.
The UNIPAR model was previously developed to improve predictions by considering particle-phase reactions as well as gas–particle partitioning as mechanisms for SOA production (Beardsley and Jang, 2016; Im et al., 2014; Zhou et al., 2019). In this study, autoxidation pathways of alkyl peroxy radicals are added to currently existing alkane MCM oxidation mechanisms to include low-volatility oxidation products and applied to the UNIPAR model for SOA prediction. The simulation results are compared to data collected in the UF Atmospheric PHotochemical Outdoor Reactor (UF-APHOR) chamber under controlled environments (NOx levels and seed conditions). In order to simulate SOA formation from a wide range of alkane length, a mathematical equation to construct product distributions was equipped in the UNIPAR model by using explicit products of C9–C12 linear alkanes. This equation is extrapolated to predict product distributions from larger alkanes (C13 and C15), for which explicit mechanisms are unavailable in MCM, and applied to SOA prediction. These predictions are also compared to chamber data obtained for C13 and C15. Extrapolation to alkanes larger than C15 is explored and used to project SOA formation from linear alkane species found in diesel fuel. In order to increase the feasibility of the model, UNIPAR was also integrated with the carbon bond mechanism (Emery et al., 2015).
Alkane SOA was produced from photooxidation of a homologous series of linear alkanes (C9–C13, C15) using the UF-APHOR dual chamber (52 m3 each) located at the University of Florida. The detailed description of the operation of the large outdoor smog chamber can be found in a previous study (Im et al., 2014). The detailed experimental conditions of outdoor chamber experiments are summarized in Table 1. Generally, the precursor alkane HCs were evaporated through heating to introduce them into the chamber. A non-reactive gas, CCl4 (Sigma-Aldrich; ≥ 99.5 %), was introduced into the chamber as an indicator for chamber dilution. HONO was added to the chamber as a source of hydroxyl radicals. HCs, HONO, and NO (2 % in N2, Airgas Inc., USA) were introduced into the smog chamber before sunrise. The HCs were studied under two different NOx levels (high NOx : HC NOx < 5 ppbC ppb−1; low NOx : HC NOx > 10 ppbC ppb−1) and two different seed conditions (without seed and sulfuric acid, SA).
Table 1Summary of experimental conditions and observed data for experiments performed in the UF-APHOR outdoor chamber.
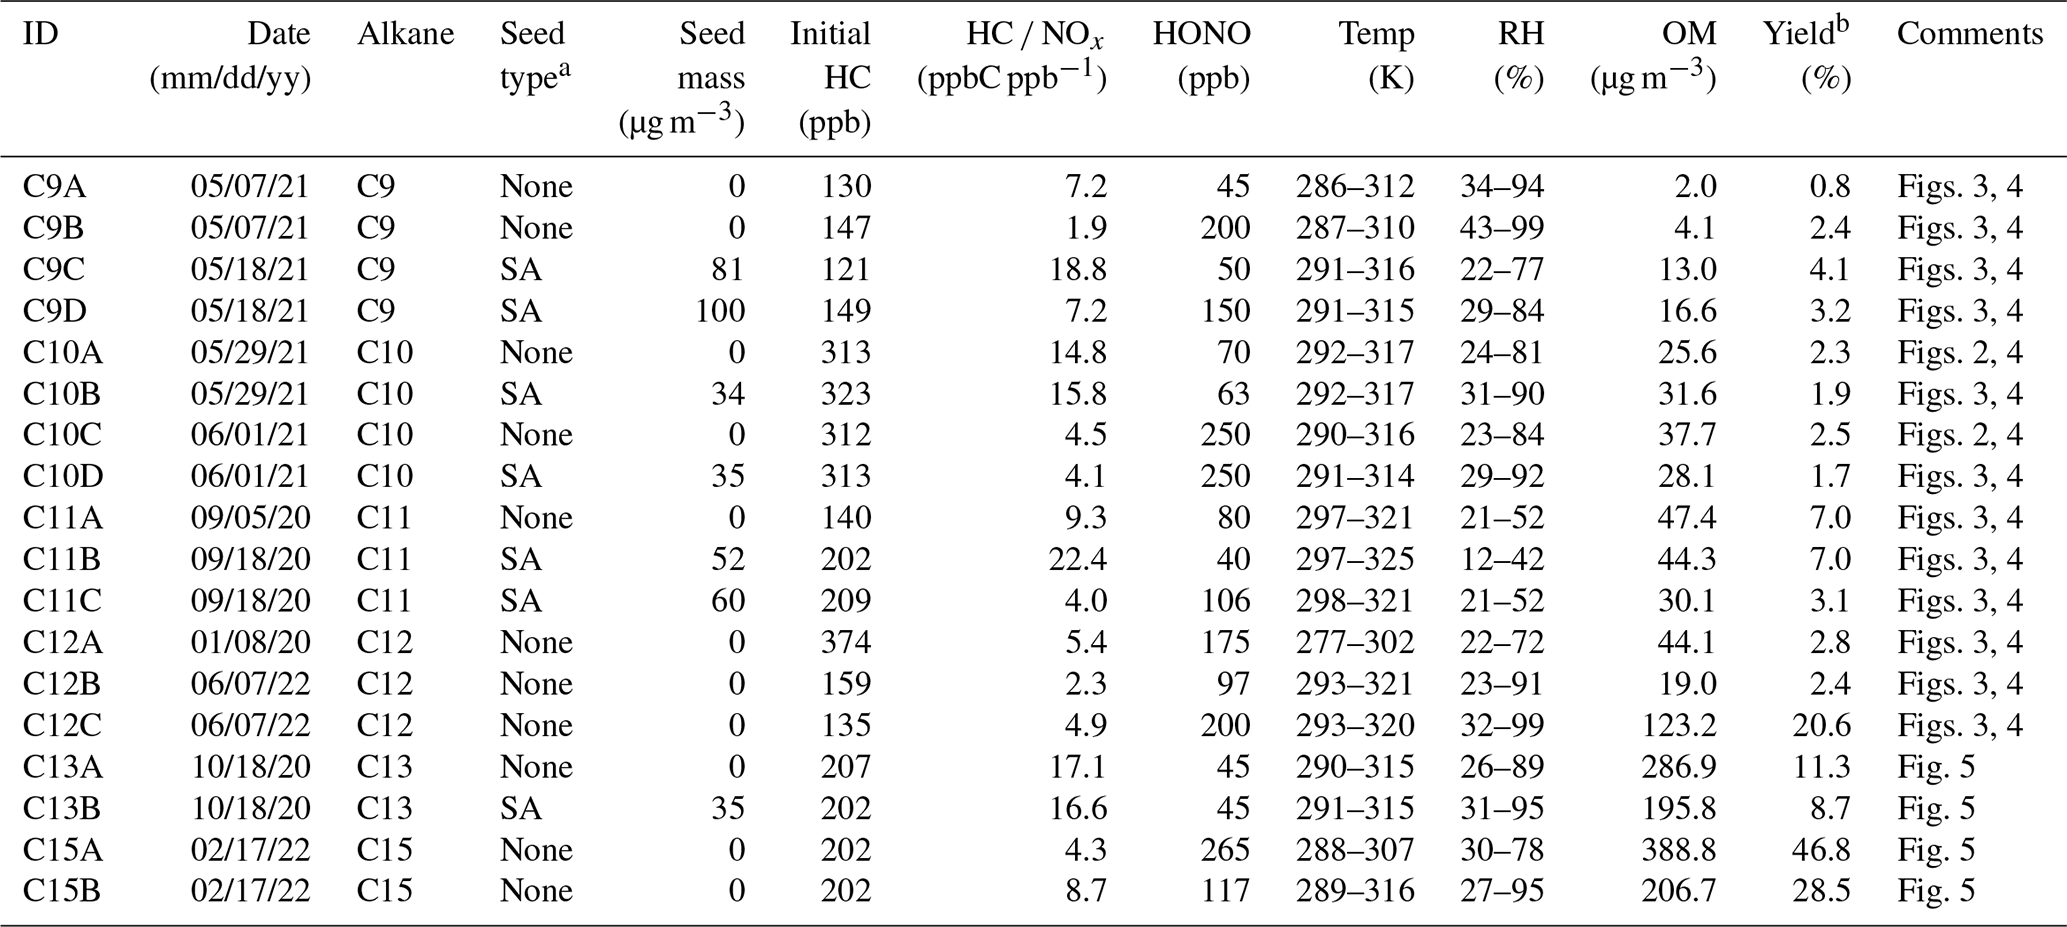
a Experiments were performed with no seed (none) and sulfuric acid seed (SA). b Yield was calculated as the ratio between the concentration of the final measured SOA mass (µg m−3) and the concentration of precursor alkane consumed (µg m−3).
A gas chromatography flame ionization detector (GC-FID; 7820A, Agilent Technologies, Inc., USA) was used to measure the concentration of gas-phase HCs and CCl4. A photometric ozone analyzer (400E, Teledyne Technologies, Inc., USA) and a chemiluminescence NO NOx analyzer (T201, Teledyne Technologies, Inc., USA) were used to measure the concentrations of ozone and NOx within the chamber, respectively. A particle-into-liquid sampler (ADISO 2081, Applikon Inc., USA) integrated with ion chromatography (Compact IC 761, Metrohm Inc., Switzerland) (PILS-IC) was used in experiments performed with inorganic seed to measure the inorganic ion concentration within the chamber. A scanning mobility particle sizer (SMPS 3080, TSI Inc., USA) was used to measure the size distribution of particles within the chamber. Previous studies that have measured the density of alkane SOA have found a range from 1 to 1.4 g cm−3 (Li et al., 2020, 2022; Lim and Ziemann, 2009; Loza et al., 2014). Aerosols from each alkane experiment in this study were assumed to have a density of 1.2 g cm−3. A hygrometer (CR1000 measurement and control system, Campbell Scientific Inc., USA) was used to measure meteorological factors (temperature, relative humidity – RH), and an ultraviolet radiometer (TUVR, Eppley Laboratory Inc., USA) was used to measure sunlight intensity. An organic carbon and elemental carbon analyzer (OC/EC model 4, Sunset Laboratory Inc., USA) was used to measure the concentration of organic carbon in aerosol every 50 min. The concentration of organic matter in aerosol (OM, µg m−3) was then calculated based on the OC concentration predicted by the UNIPAR model and an OM to OC ratio. The OM to OC ratio of SOA from alkane species decreased as the chain length increased. The concentrations of OM measured from the chamber were corrected for chamber dilution using a dilution factor and for particle wall loss to the chamber wall using a particle loss factor. An aerosol chemical speciation monitor (ACSM, Aerodyne Research Inc., USA) was used to measure the aerosol composition (sulfate, nitrate, ammonium, and OM). The compositions obtained from the ACSM were compared with measurements from the OC/EC and the PILS-IC. SOA yields (Y) were then calculated as the final measured concentration of OM divided by the total consumption of HC precursors.
The UNIPAR model's ability to accurately simulate SOA formation from various aromatic HCs (Im et al., 2014; Zhou et al., 2019; Han and Jang, 2022a), monoterpenes (Yu et al., 2021), and isoprene (Beardsley and Jang, 2016) has been previously demonstrated. In this study, the UNIPAR model was extended to simulate the formation of SOA from multiphase reactions of linear alkanes including gas (g), organic (org), and inorganic (inorg) phases. The model utilizes a nearly explicit gas-phase mechanism for the photooxidation of each alkane. The model employed the Master Chemical Mechanism (MCM v3.3.1) and gas autoxidation pathways to yield highly oxidized molecules at given alkane and meteorological conditions under various NOx levels (HC ppbC NOx ppb = 2–50). The resulting products were then classified into an array of 51 different lumping species based on their volatility and reactivity. Previous studies have a detailed description of the lumping criteria and the mass-based stoichiometric coefficient (αi) of lumping group i as a function of NOx levels as well as the degree of aging (Zhou et al., 2019). To cover alkanes in a variety of carbon lengths, the product distributions of linear alkanes were represented as a function of carbon number using an incremental volatility coefficient (IVC). The SOA mass in the model forms via three pathways: OM produced via multiphase partitioning of organic products (OMP), aerosol-phase reactions of organic species to form OMAR via oligomerization in the org phase, and reactions in the wet inorg phase, which also form OMAR (acid-catalyzed oligomerization and organosulfate – OS – formation). The inputs to the UNIPAR model include the equations for αi, physicochemical parameters of lumping species, the consumption of HC (ΔHC), the concentrations of the alkyl peroxide radical (RO2) and hydroperoxyl radical (HO2), concentrations of ionic species (sulfate and ammonium ions), and temperature and humidity. Figure 1 illustrates the UNIPAR model framework.
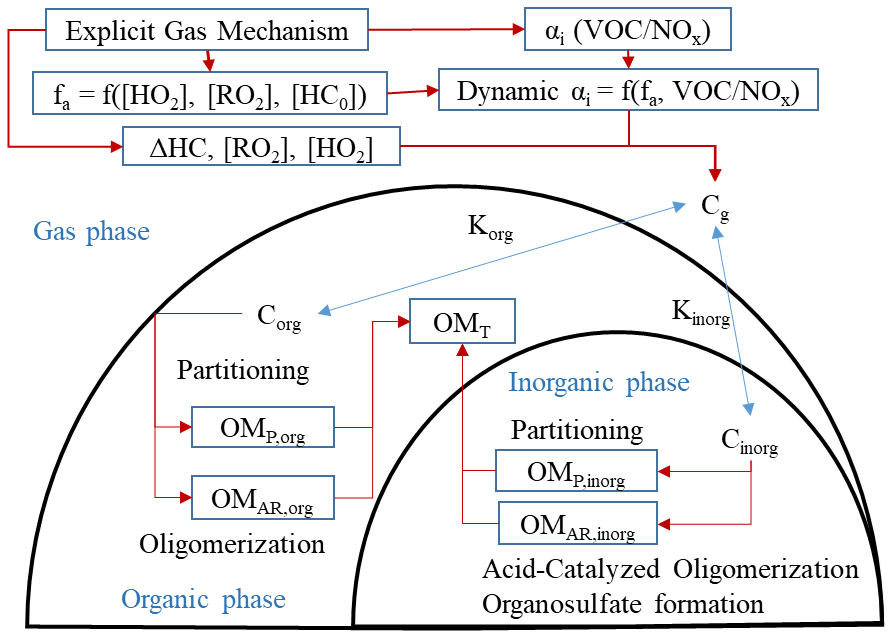
Figure 1A simplified scheme of the UNIPAR model. [HC]0 represents the initial hydrocarbon (HC) concentration. A gas kinetic mechanism (MCM v3.3.1 + autoxidation of alkyl peroxy radicals) is used to simulate the consumption of HC (ΔHC) as well as the concentrations of the hydroperoxide radical ([HO2]) and organic peroxyl radical ([RO2]). The explicit gas mechanism of each alkane is used to derive the dynamic mass-based stoichiometric coefficient (dynamic αi) of lumping species i as a function of HC NOx and the aging factor fa. fa is represented as a function of [HO2], [RO2], and [HC]0 (Zhou et al., 2019). Subscripts g, org, and inorg denote the gas, organic, and inorganic phases, respectively. Korg and Kinorg represent the partitioning coefficients of lumping species to the org phase and inorg phase, respectively. Corg and Cinorg represent the concentrations of lumping species in the org and inorg phases, respectively. OMP,org and OMP,inorg represent the mass of organic matter (OM) present in org and inorg phases, respectively, due to partitioning. OMAr,org and OMAR,inorg represent the OM formed in the org phase due to in-particle chemistry, such as oligomerization, and inorg phase due to acid-catalyzed oligomerization and organosulfate formation (Beardsley and Jang, 2016; Im et al., 2014; Zhou et al., 2019). OMT represents the total SOA mass formed due to partitioning and aerosol-phase reactions in both the inorg and org phases.
3.1 Gas mechanisms
The atmospheric oxidation of alkanes begins with reaction with an OH radical, followed by the addition of O2 to form peroxyl radicals. This oxidative addition can create specific structures in some compounds which have been identified in previous literature to be capable of undergoing autoxidation reactions (Crounse et al., 2013; Bianchi et al., 2019; Roldin et al., 2019). These reactions have been previously modeled (Pye et al., 2019; Xavier et al., 2019). An example of an autoxidation pathway added to the MCM for a linear alkane is shown in Fig. S1. Most autoxidation products from alkanes higher than C9 belong to the low-volatility group of the UNIPAR model, and these products can increase SOA mass via gas–particle partitioning. As the size of the linear alkane increases, there is an increased likelihood that some of the precursor HC is lost to the chamber wall. The rate at which alkane species partition to the wall of the UF-APHOR chamber was measured using a nighttime experiment (Table S1).
3.2 Lumping and aging
The lumping structure of the UNIPAR model, along with a dynamic αi array which considers aging, has been developed in previous studies (Zhou et al., 2019; Han and Jang, 2020; Yu et al., 2021). According to this structure, the alkane oxidation products, originating from simulations at various NOx levels (HC ppbC NOx ppb = 2–50) using the MCM and alkyl peroxy radical autoxidation mechanisms, were lumped. A standard meteorological profile (14 June 2018) of a day with a clear sky near summer solstice was used, and all simulations began before sunrise. The αi array consists of six different reactivity levels (very fast, fast, medium, slow, partitioning only, and multi-alcohol) and eight different volatility levels based on vapor pressure, which represent 48 species, along with three explicit species that are lumped separately (glyoxal, methylglyoxal, and epoxydiols). As gas products originating from the precursor HC are atmospherically aged, they become more oxidized, which leads to the addition of functional groups. This atmospheric aging can augment the product distribution, forming more reactive and less volatile products via oxidation, or photolysis products which are more volatile but may be more reactive. To incorporate the impact of aging on SOA formation, the dynamic αi is reconstructed using two different gas-phase oxidation compositions: fresh and highly oxidized. A weighted aging factor is used to dynamically change αi values based on these two compositions. The aging factor (fa) at a time t, as detailed in Zhou et al. (2019), is defined as
where [HO2], [RO2], and [HC]0 are the concentrations of the hydroperoxide radical, organic peroxyl radical, and initial HC, respectively. Both fresh and highly oxidized compositions are calculated for each NOx level as well as the respective aging factors. fa(t) is also converted into an aging scale that ranges from 0 (fresh composition) to 1 (highly oxidized composition) as follows (Zhou et al., 2019).
fa(t) is calculated for a given NOx level and used to dynamically calculate the αi values for that same NOx level as follows (Zhou et al., 2019).
The dynamic updates of physicochemical parameters (molecular weight – MW, O : C ratio, and hydrogen bonding – HB) of lumping species are also performed in a similar way. Further details about lumping criteria and dynamic updates of physicochemical parameters can be found in the study by Zhou et al. (2019).
3.3 Unification and extrapolation of lumping species
To predict the SOA formation from linear alkanes larger than C12, for which MCMs do not exist, the product distributions of C9–C12 are parameterized using an incremental volatility coefficient (IVC) as a function of the carbon length and then extrapolated. As the carbon number of linear alkanes increases, the vapor pressure of both the precursor HC and the resulting oxidation products will decrease, causing a shift in the product distribution. The IVC is meant to generalize this shift by describing the drop in vapor pressure caused by the addition of a carbon atom. The IVC (I(n)), which is used to calculate the product distribution for a linear alkane with carbon number n using the product distribution of a linear alkane with carbon number n−1, is as follows:
where coefficients a and b are obtained by fitting the predicted αi values using Eq. (4) to those constructed from the individual HC by using explicit gas mechanisms in Sect. 3.1. In this study, a and b were calculated to be 0.79 and 1.83, respectively. The α value () with carbon number n at a given volatility (j) and reactivity (k) is predicted by using the α value with carbon number n−1 as follows.
The term represents the stoichiometric coefficient of volatility group j+1 adjacent to volatility group j at a given reactivity k with carbon number n−1. The term represents the stoichiometric coefficient of volatility group j at a given reactivity k with carbon number n−1. Volatility group j is less volatile than volatility group j+1. Notably, the shifts in composition are only within the vapor pressure groups (j) at a given reactivity group (k).
Using this IVC, the product distribution of C9 is the base (Eq. 4) to predict the product distribution of C10. This process is sequentially repeated for higher carbon numbers. Each repetition will yield the product distribution of a linear alkane with one carbon number larger than the last. Figure S2 illustrates the construction of product distribution based on the incremental volatility approach.
3.4 SOA formation by partitioning
Partitioning coefficients for each lumping species, i, between g and the org phase (Korg,i) or between g and the wet inorg phase (Kin,i) are calculated using the typical gas–particle partitioning model (Pankow, 1994):
where R is the gas constant (8.314 J mol−1 K−1), and T is temperature (K). MWorg and MWinorg are the average molecular weights (g mol−1) of the organic and inorganic phases of the aerosol, respectively. is the subcooled liquid vapor pressure of a species, i. The activity coefficient in the organic phase for each lumping species, γorg,i, is assumed to be unity (Jang and Kamens, 1998). The activity coefficient in the inorganic phase for each lumping species, γinorg,i, is predicted by a semi-empirical regression equation which was fit to the activity coefficients of various organic compounds as a function of physicochemical parameters (MW, O : C ratio, and HB) and sulfate fraction (FS). FS is an indicator for aerosol acidity which is defined as follows:
where and are the concentration of sulfate and ammonium ions, respectively. The semi-empirical equation, derived from activity coefficients estimated using the Aerosol Inorganic–Organic Mixtures Functional Groups Activity Coefficients (AIOMFAC) model (Zuend et al., 2011) at a given RH, is as follows.
Further information on the derivation and statistical properties of Eq. (9) can be found in Zhou et al. (2019). The partitioning coefficients are used to calculate the concentration of each lumping species in the three phases (Cg,i, Corg,i, and Cinorg,i) from the total concentration of each lumping species (CT,i). The total SOA mass formed by partitioning in both org and inorg phases (OMP) is predicted by the following equation, which was developed by Schell et al. (2001) and reconstructed to consider mass formed by particle-phase reactions (OMAR) by Cao and Jang (2010):
where () and OM0 (mol m−3) represent the effective saturation concentration and pre-existing OM, respectively. MWoli,i and MWi represent the molecular weights of oligomeric products and lumping species, respectively. Equation (10) is solved using the Newton–Raphson method, which iterates until convergence is reached (Press et al., 1992).
3.5 SOA formation by particle-phase reactions
OMAR is attributed to both the org and inorg phases. In the org phase, SOA formation is attributed to oligomerization as organic compounds undergo self-dimerization reactions (Im et al., 2014; Zhou et al., 2019). In the inorg phase, oligomerization of organic compounds can be acid-catalyzed (Jang et al., 2002). Oligomerization reactions are expressed as second-order reactions (Odian, 2004) with rate constants and (L mol−1 s−1) in the org and inorg phases, respectively. A semi-empirical model developed by Jang et al. (2005) is used to estimate as follows:
where Ri represents species reactivity, represents the protonation equilibrium constant, aw represents the activity of water, X represents excess acidity (Cox and Yates, 1979), and [H+] represents the concentrations of protons which are estimated using the extended aerosol inorganic model (E-AIM, Clegg et al., 1998). is determined as follows.
For the oligomerization in the org phase, the terms related to acidity (X, and aw[H+]) are excluded. Studies have previously demonstrated that aerosol viscosity can influence the mobility of chemical species and thus apparent reaction rates, which can be limited by slow bulk diffusion in the particle phase (De Schrijver and Smets, 1966; Reid et al., 2018). The molecular weight of species in the organic phase (MWorg) and the O : C ratio, which are important predictors for viscosity, are considered to calculate (Han and Jang, 2022b).
In the wet inorg phase of the aerosol, sulfuric acid can react with reactive organic compounds to form dialkyl sulfate (diOS). This formation of diOS can contribute to SOA mass production but can also lead to a reduction in [H+], which decreases the rate of SOA mass produced by acid-catalyzed oligomerization in the inorg phase. The formation of diOS is predicted in the UNIPAR model and applied to reduce [H+] in the inorg phase as previously reported (Im et al., 2014; Beardsley and Jang, 2016; Zhou et al., 2019).
3.6 Correction of intermediate organic vapor deposition to walls
In addition to wall loss of precursor HC, intermediate oxidized products derived from the precursor HC can deposit to the wall. The organic vapor deposition to the wall is kinetically described with the deposition (kon,i) and desorption (koff,i) rate constants of each lumping species, i, to the UF-APHOR wall by using the method detailed by Han and Jang (2020) and Han and Jang (2022b). kon,i is expressed as a fractional loss rate (McMurry and Grosjean, 1985):
where D ( m2 s−1) and Ke (0.12 s−1) are the diffusion coefficient and coefficient of eddy diffusion applied as a fixed number, respectively. represents the surface area to volume ratio of the chamber. and αw,i represent the mean thermal speed of the gas molecules and accommodation coefficient of i to the wall, respectively. Equations for the calculation of and αw,i can be found in Sect. S4. Kw,i () is calculated as follows:
where (mmHg) is the liquid vapor pressure of each lumping group, i. R (8.314 J mol−1 K−1) is the ideal gas constant and T (K) is temperature. OMwall (mg m−3) and MWOM are the concentration of organic matter on the wall and the molecular weight of organic matter on the wall, respectively. The activity coefficient, γw,i, is calculated using the quantitative structure–activity relationship (QSAR) approach with the physicochemical properties Hd,i, Ha,i, and Pi, which represent hydrogen bond acidity, hydrogen bond basicity, and polarizability of each lumping group i, respectively (Abraham et al., 1991; Abraham and Mcgowan, 1987; Leahy et al., 1992; Platts et al., 1999; Puzyn et al., 2010). Equation (14) can be rewritten as
The values of Hd,i, Ha,i, and Pi (Table S2) were calculated using the PaDEL-Descriptor, (Yap, 2011). The value of Kw,i is used along with the kon,i to predict intermediate product wall loss using an analytical equation from the study by Han and Jang (2020) as follows:
where Cg,i (µg m−3) is the gas-phase concentration of a lumping species, i, after time step t (360 s). CT,i (µg m−3) is the sum of Cg,i and the concentration of lumping species i on the chamber wall (Cw,i (µg m−3)).
3.7 UNIPAR procedure for SOA mass production each time step
At each step, CT,i is estimated by using the newly introduced ΔHC and αi and is combined with the previous step's concentration of lumping species except those used for the formation of OMAR and organic vapor deposition to walls for the simulation of chamber data. Then, the updated CT,i is split into Cg,i, Corg,i, and Cinorg,i based on multiphase partitioning coefficients as seen in Eqs. (6) and (7). Cinorg and Corg are then used to form OMAR via oligomerization in both the inorg and org phases with the rate constants calculated in Eqs. (11) and (12), respectively. In the model, the quantity of the sulfate associated with the esterification of sulfuric acid to form organosulfates in the inorg phase is also estimated. Following the process to form OMAR, the remaining concentration of lumping species is used to estimate the organic vapor deposition to the wall using Eq. (16). OMP is calculated using a Newtonian approach (Eq. 10) in the presence of OMAR and the pre-existing OM0 at the end of each time step. For the total SOA mass, OMAR, OMP, and OM0 are combined.
4.1 Chamber data vs. model prediction
UNIPAR model predictions were compared to data collected under various environmental conditions in the UF-APHOR chamber. As seen in Fig. 2, the C10 SOA mass prediction based on the product distributions created using the pre-existing MCM was almost negligible and significantly underestimated from observation. The addition of the alkyl peroxy radical autoxidation mechanism (Sect. 3.1) was able to considerably improve the prediction of alkane SOA formation. Figure 2 indicates that alkane SOA mass is mainly attributed to low-volatility products produced from alkyl peroxy radical autoxidation.
Figure 3, together with Fig. 2, shows that UNIPAR, equipped with product distributions derived from the MCMs with alkyl peroxy radical autoxidation reactions, can reasonably predict final SOA mass produced under various environmental conditions for alkanes C9, C10, C11, and C12. The HC NOx (ppbC ppb−1) levels in chamber studies range from 1.8 to 22.4 (Table 1). Most experiments in this study were performed with initial HONO concentrations that were about of the total NOx concentration. Thus, higher NOx experiments had higher concentrations of HONO, and this experimental condition apparently skewed the impact of NOx levels on SOA formation. However, the model is noticeably able to predict SOA mass for a variety of NOx levels of this study while also considering various HONO concentrations. Under a controlled environment, the impact of NOx levels on SOA yields is discussed in Sect. 4.4 below.

Figure 2Comparison of SOA mass produced between simulations using a product distribution for C10 derived from the MCM (dashed line) and one from the MCM with alkyl peroxy radical autoxidation reactions added (solid line). The blue dots represent observed SOA data that are corrected for particle wall loss to the chamber. Error bars represent 9 % uncertainty associated with the OC/EC and particle wall loss correction.
In addition to NOx levels, the influence of seed conditions on alkane SOA was demonstrated as seen in C9C, C9D, C10B, C10D, C11B, and C11C. No significant impact of acidic seed on SOA formation appeared under similar experimental conditions. For example, non-seeded SOA growth is similar to SA-seeded SOA for theC10 alkane (i.e., C10A vs. C10B and C10C vs. C10D, respectively), suggesting that most alkane oxidation products are inert and less polar compared to other oxygenated products from biogenic (Yu et al., 2021; Beardsley and Jang, 2016; Han and Jang, 2022a) and aromatic HCs (Im et al., 2014; Zhou et al., 2019; Han and Jang, 2022a).
4.2 SOA prediction via product distributions with IVC
To predict the SOA formation from a wide range of alkane lengths, the product distributions of linear alkanes were mathematically predicted as a function of carbon number using an IVC as discussed in Sect. 3.3. The resulting product distributions were applied to the UNIPAR model (Fig. 4). Compared to the prediction from the product distribution with MCM and alkyl peroxy radical autoxidation (Fig. 3), the unified simulation of C10 degraded model performance, causing a slight underprediction for the lower NOx conditions and an overprediction for the higher NOx conditions. The unification did not cause significant changes to predictions for C11A and C11C but somewhat improved model performance in the case of C11B. C12C was somewhat improved in the simulation with the unified stoichiometric coefficient array, but C12A was overpredicted. It is possible that the cold temperature for experiment C12A (Table 1) caused significant organic vapor wall loss that was unaccounted for in this simulation.
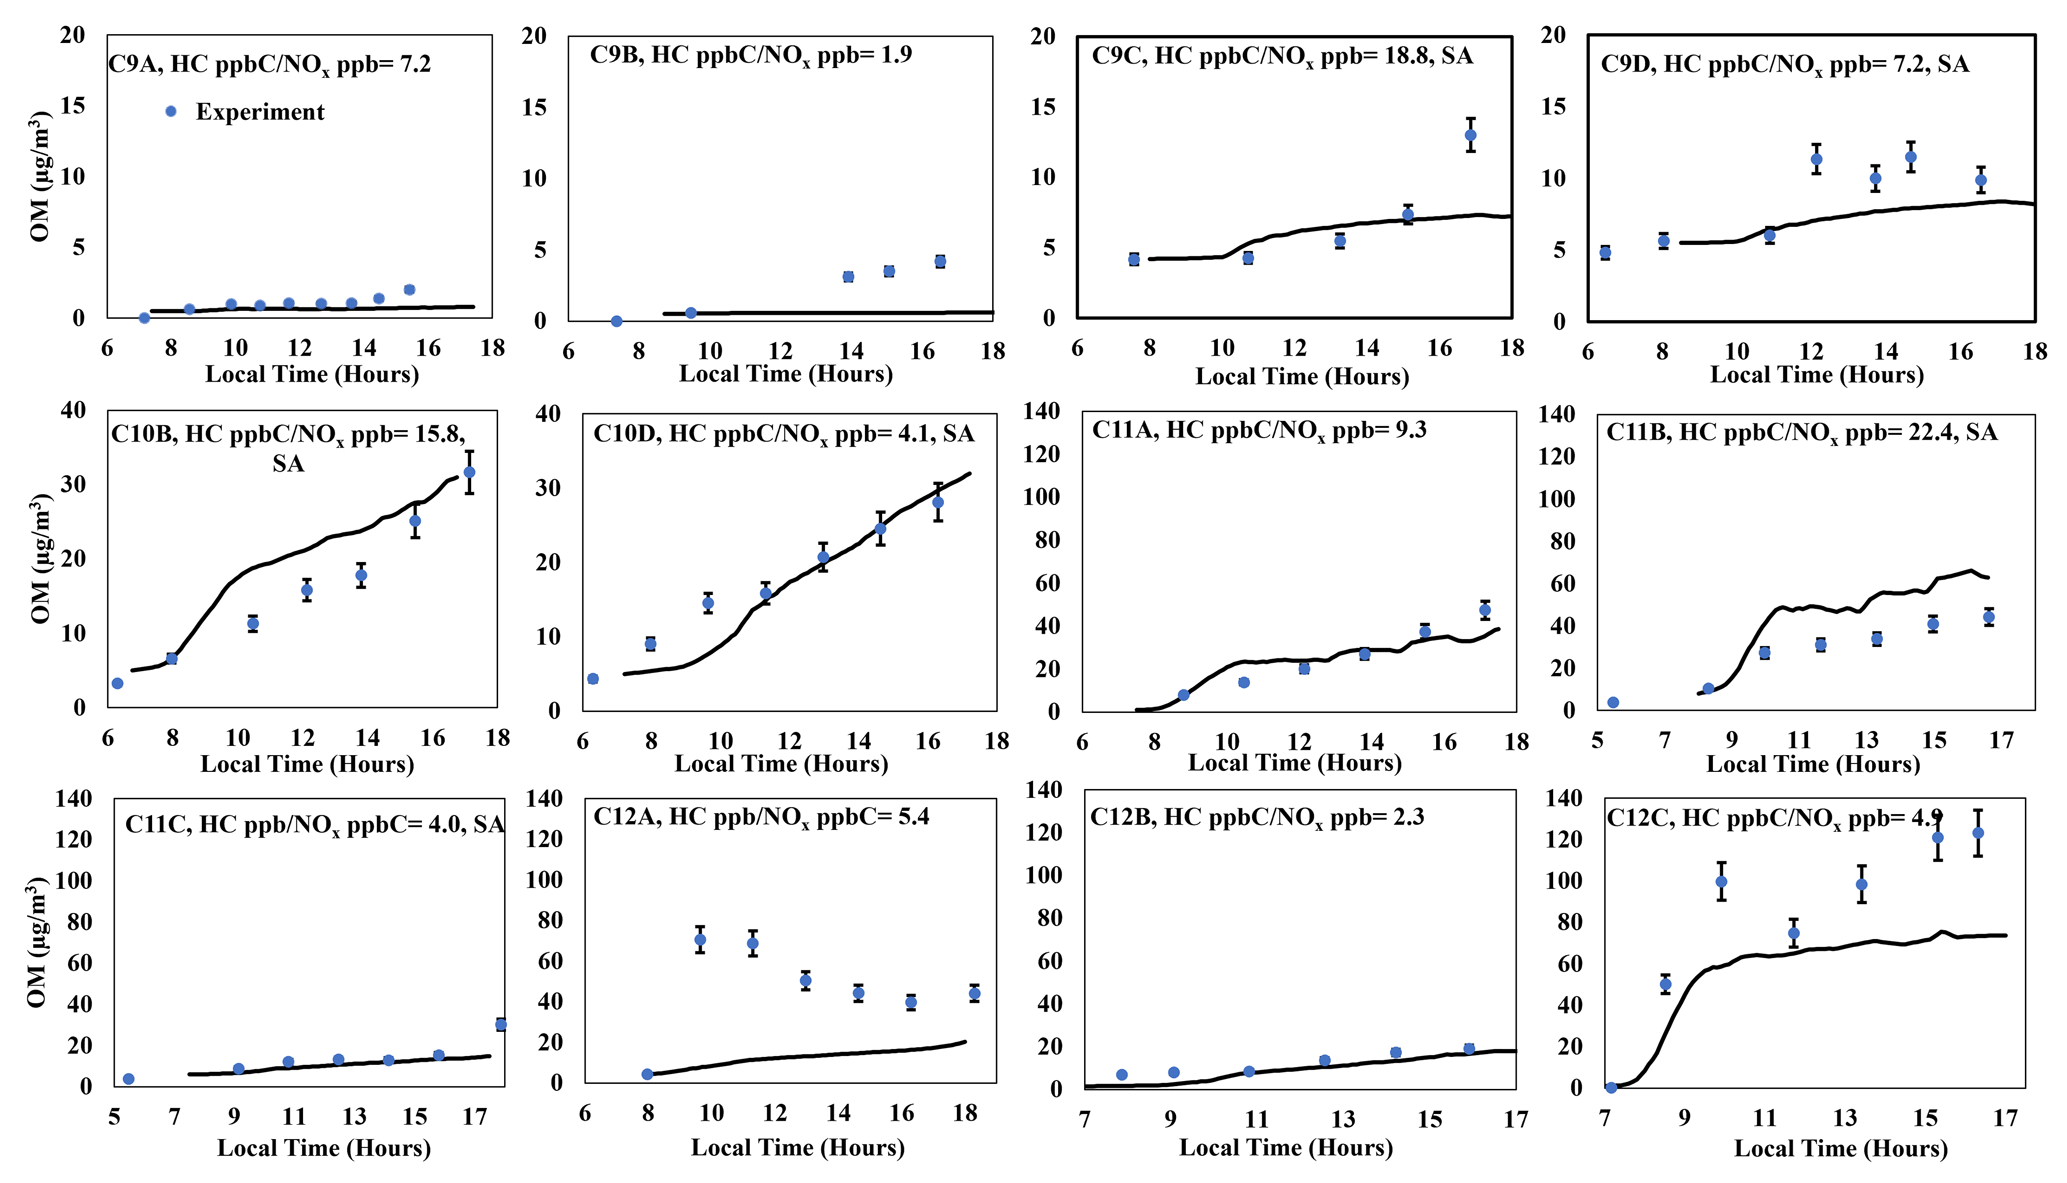
Figure 3Simulated SOA mass for alkanes C9, C10, and C12 using a product distribution derived from the MCMs with alkyl peroxy radical autoxidation reactions added. The blue dots represent observed SOA data that are corrected for particle wall loss to the chamber. Error bars represent 9 % uncertainty associated with the OC/EC measurement and particle wall loss correction.
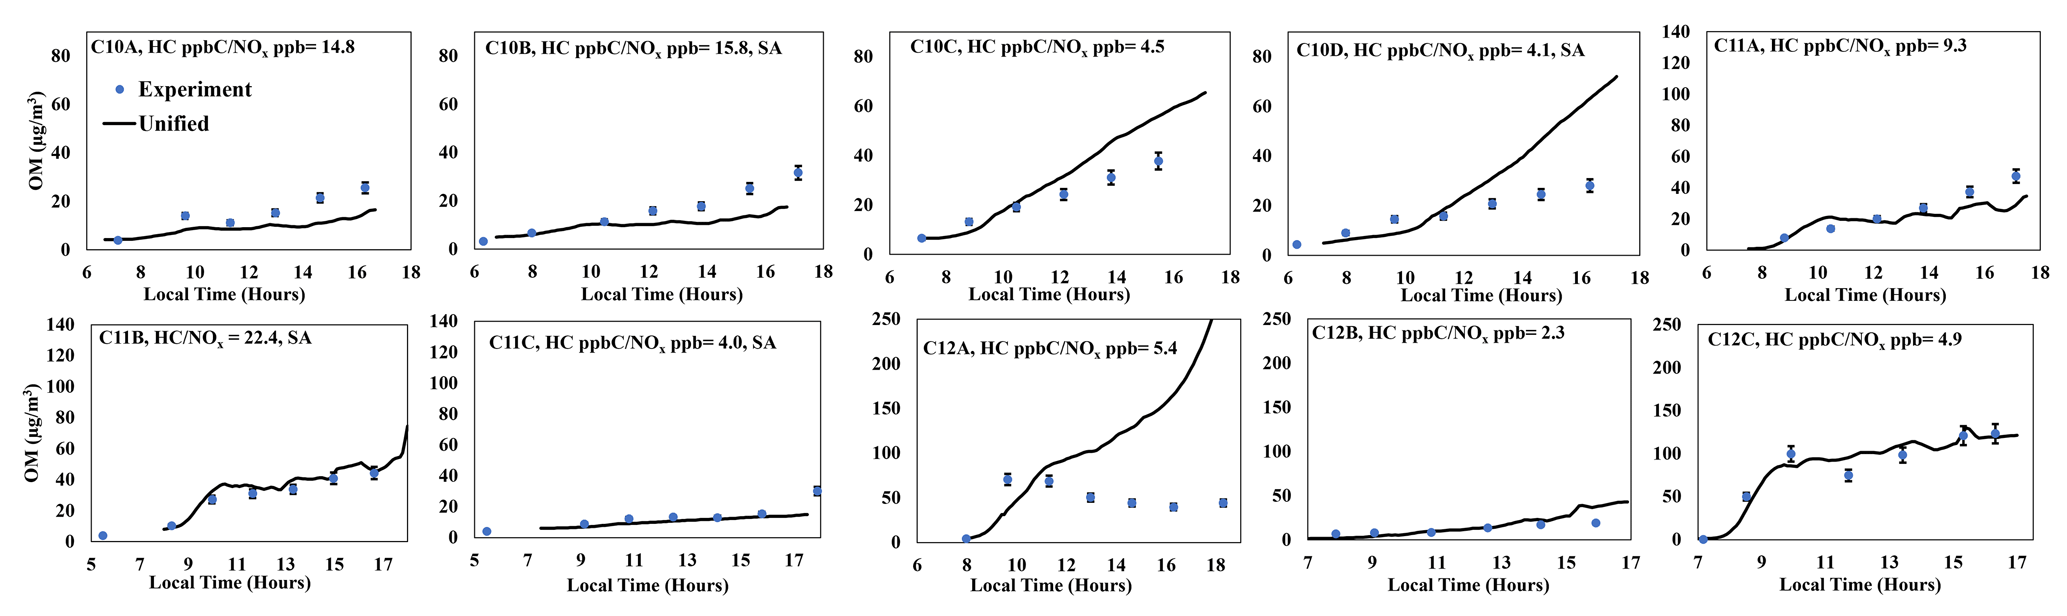
Figure 4Comparison of SOA mass produced between simulations for C10, C11, and C12 using the unified product distributions based on the IVC (black line) to chamber data. The blue dots represent observed SOA data that are corrected for particle wall loss to the chamber. Error bars represent 9 % uncertainty associated with the OC/EC and particle wall loss correction.
As discussed in Sect. 3.3, Eq. (4) for the IVC was fitted to the product distributions of C10, C11, and C12 using unified coefficients a and b to account for the vapor pressure drop in products that results from the increase in the carbon number of the precursor. The vapor pressure drop is not linear as the addition of a carbon to a longer carbon chain causes a smaller decrease in volatility (i.e., the reduction of volatility from adding a carbon to C11 will be smaller compared to the reduction in volatility from adding a carbon to C10). Equation (4) is nonlinear but may not be the ideal equation to model the vapor pressure drop within the product array. Thus, as a consequence of the fitting process, the model performance of the C10 array may have been sacrificed to improve model performance in the case of C11 and C12. Furthermore, the current explicit gas mechanism cannot include every possible product, which can be associated with the oxidation on all carbons in each alkane chain. The products of this study are obtained from oxidation at a given carbon position, which is representative of the whole set of gas oxidation. This can cause some deviation of prediction from the true atmospheric oxidation process. Thus, the product distribution originating from these explicit mechanisms can also cause variation in prediction of SOA mass.
4.3 Extrapolation of UNIPAR to longer-chain alkanes
The simulation of alkane SOA using the IVC-based product distributions, which were demonstrated with C10–C12 alkanes in Sect. 4.2, was evaluated for prediction of C13 and C15 SOA. Because the explicit mechanisms for the alkanes higher than C12 are not currently available in MCM, the CB6 ozone model (Emery et al., 2015) was implemented to predict the consumption of alkane as well as the concentrations of HO2 and RO2 and used with the UNIPAR model integrated with the IVC-based product distributions. In Fig. 5, the simulated C13 and C15 SOA masses were compared to chamber data. Overall, SOA mass was reasonably predicted by using the UNIPAR model integrated with the IVC-based product distribution. Furthermore, SOA simulation was improved when considering the organic-product vapor deposition to the chamber wall. The impact of the chamber wall artifact is generally greater with the longer-chain alkanes. For example, the gap between the simulations of SOA mass with and without the wall artifact is larger for C15 compared to C13 as seen in Fig. 5. Notably, the UNIPAR model is unable to predict the early peak in SOA formation that is seen in the chamber data for C12 (Fig. 4) as well as C13 and C15 alkanes (Fig. 5). This initial spike in observed SOA mass is likely because of the fast SOA formation due to the reaction with a high concentration of hydroxyl radicals, which is produced via photolysis of the high concentration of HONO introduced into chamber. This initial spike is generally larger with the longer alkane. The low- and middle-volatility products that are formed in the morning will be rapidly condensed via nucleation and non-equilibrium partitioning. The viscosity of the oxidized products tends to be very high, especially for larger alkanes, due to the high molecular weight and the low O : C ratios. The redistribution of organic products between the gas and particle phase to reach equilibrium is achieved via their slow evaporation. This will typically not occur in the ambient atmosphere as the hydroxyl radical is gradually produced via the small amount of HONO in the morning or the ozone mechanism in daytime. A similar trend of rapid SOA formation early in the morning has been previously observed in chamber studies for highly concentrated d-limonene (Yu et al., 2021), which can be rapidly oxidized and form low-volatility products. When the concentrations of both HONO and the long-chain alkane are reduced, this spike can be suppressed as seen in Fig. S3.
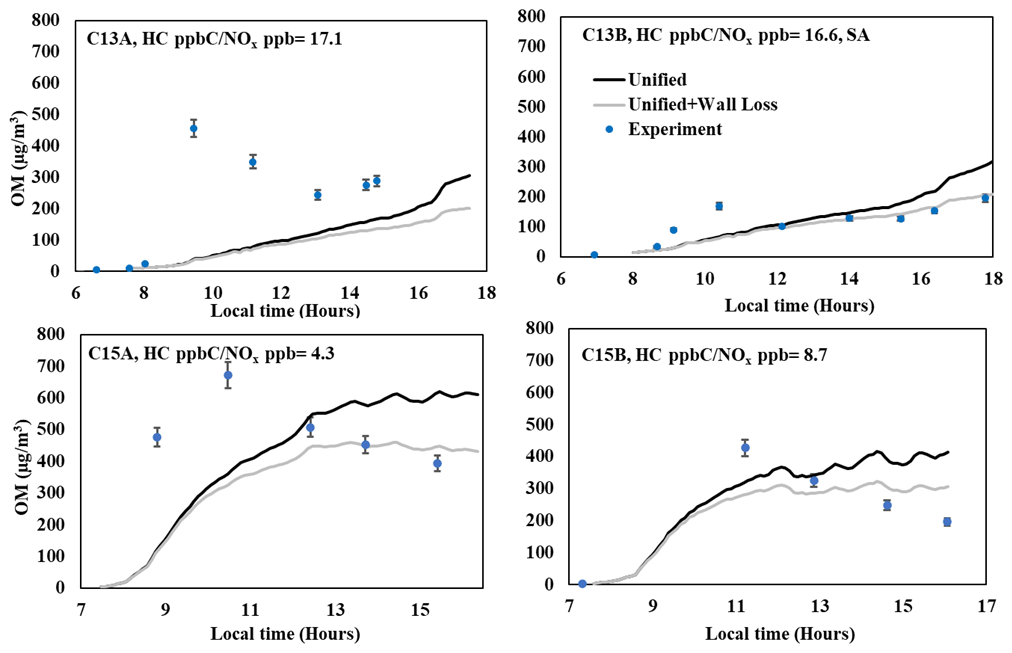
Figure 5Comparison of the observed and predicted SOA mass produced from the photooxidation of C13 and C15 alkanes under different experimental conditions. The SOA simulation was performed by using the unified product distributions constructed with the IVC approach in the presence of precursor vapor deposition to the chamber wall. In addition, SOA simulation was performed in the presence (gray line) and absence (black line) of organic product loss to the wall. The observed SOA mass (dots) was corrected for gas dilution and the particle loss to the chamber wall. ASCM was used to measure SOA mass concentrations for C13 and C15 instead of OC/EC data as the artifacts via off-gassing of semi-volatiles to the denuder upstream of OC for C13 and C15 oxidation products. The collection efficiency of organic alkane aerosol for the ACSM was assumed to be 66 % for C13 and 63 % for C15. The collection efficiency was determined by comparison of SMPS data with ACSM data, with the aerosol originating from non-volatile organics. The collection efficiency of C13B aerosol, which was produced in the presence of acidic seed, was assumed to be 100 %. The error associated with OM (6 %) is calculated with ACSM data.
4.4 Sensitivity of SOA formation to NOx levels, temperature, OM0, and seed condition
Figure 6 illustrates the sensitivity of six different alkane SOA yields to six HC NOx levels at a given temperature (298 K) under the same sunlight profile (Fig. S4) obtained on 20 January 2020 and 30 % RH. All sensitivity simulations for a series of alkanes (C10, C12, C14, C16, C18, and C20) were performed with the CB6-UNIPAR model (Table S3) integrated with the IVC-based unified product distribution. The impact of NOx conditions on linear alkane SOA formation has not been extensively studied in the past. In general, aromatic SOA yields rapidly increase with a decreasing NOx level up to HC ppbC NOx ppb ≈ 5, reaching a plateau (Im et al., 2014), while SOA yields for each alkane generally increased as the HC NOx level increased over a broad range of the HC ppbC NOx ppb ratio. Zhang and Seinfeld (2013) found that SOA yields for dodecane (C12) were higher in lower NOx conditions (<6 ppb). Cappa et al. (2013) found significant differences in SOA yields between high and low NOx conditions after 10 h of oxidation, with higher yields for the low NOx condition (<1 ppb).
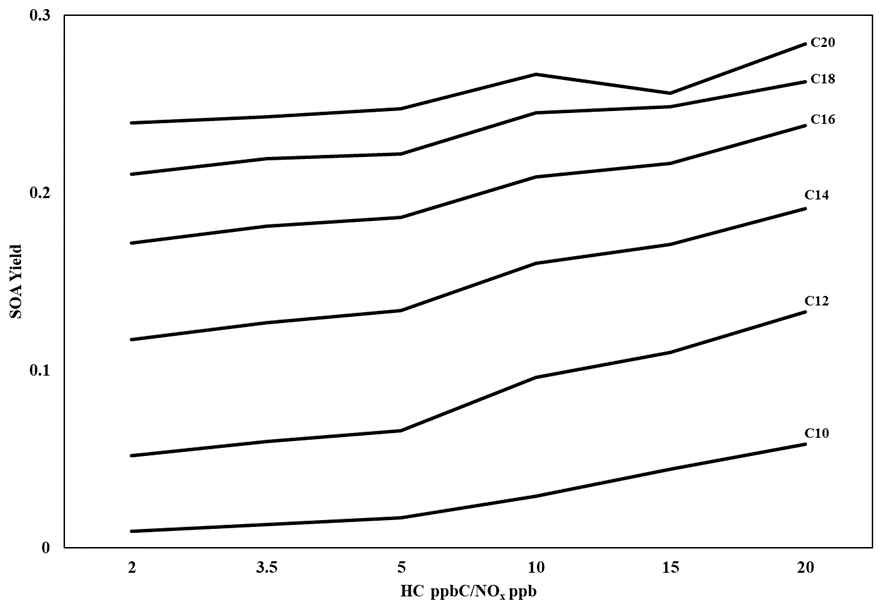
Figure 6Simulated SOA yields for a series of linear alkanes at six different HC NOx conditions using the IVC-based product distributions. OM0 = 5 µg m−3, 298 K, RH = 30 %.
As discussed in Sect. 4.1, a significant part of alkane SOA is comprised of the low-volatility products originating from autoxidation mechanisms. The fraction of autoxidation products to the total SOA mass generally increases with decreasing carbon number or decreasing NOx level due to gas–particle partitioning of non-autoxidation low-volatility products as seen in Fig. S45. Additionally, the impact of the autoxidation reactions on RO2 chemistry is examined using the integrated reaction rates in Fig. S6. Generally, the autoxidation reactions of selected RO2 species displayed (HO3C106O2 and HO3C126O2 from the MCMs of C10 and C12, respectively) were insignificant compared to reactions with NO. Additionally, the autoxidation reaction rate was slightly increased under low NOx conditions compared to high NOx conditions, which is consistent with Fig. S5.
Figure 7 shows the simulated SOA yields, using UNIPAR with IVC-based product distributions, for a series of alkanes at three different temperatures (278, 288, 298 K) and two different NOx levels (HC ppbC NOx ppb = 15, 3) at OM0=5. For both high and low NOx levels, each alkane produces a higher SOA yield at a lower temperature. The volatility of non-autoxidation products from a larger alkane such as eicosane (C20) is low enough to exist primarily in the particle phase, causing the lower sensitivity to temperature compared to smaller alkanes. This result agrees with other studies that have shown a significant impact of temperature on the SOA formation of n-dodecane and n-undecane under low NOx conditions (Li et al., 2020; Takekawa et al., 2003). For high NOx conditions, the result also agrees with past work that has found a decent impact of temperature on the SOA formation from n-dodecane at low OM0, which is relevant to ambient aerosol (Lamkaddam et al., 2017). Figure 7 also includes the contribution of OMP and OMAR to SOA in the absence of inorganic seed at atmospherically relevant conditions (OM0=5 µg m−3). Overall, the relative contribution of OMAR is higher with lower temperatures and higher carbon numbers. Notably, the levels of SOA loading found in the chamber experiments which were used to validate model performance are much greater than those observed in the ambient environment (up to 32 times higher than the annual PM air quality standard set by the EPA of 12 µg m−3, US EPA, 2012).
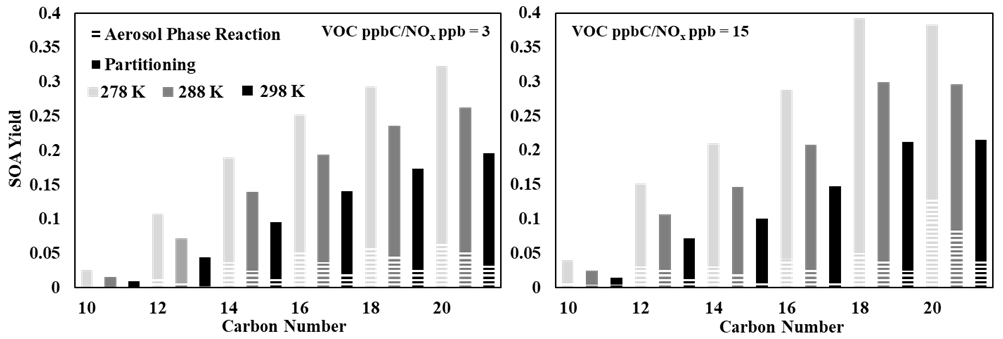
Figure 7Simulated SOA yields, separated by OMP and OMAR, for a series of linear alkanes at three different temperatures and two different HC ppbC NOx ppb conditions using the IVC-based product distributions. OM0=5 µg m−3, RH = 30 %.
Figures S7 and S8 illustrate the sensitivity of alkane SOA to various pre-existing aerosol mass (OM0) values ranging from 2.5 to 10 µg m−3 and aerosol acidity (no seed, wet-AS, and wet-AHS at 60 % RH), respectively. SOA yields are significantly increased for each linear alkane as the initial organic matter in the simulation increases. Overall, smaller alkanes have greater sensitivity to OM0. Alkane oxidation products are generally hydrophobic with a low O : C ratio and very weakly soluble in the wet inorg phase. For example, the simulated O : C ratios of alkane SOA in this study range from 0.48 and 0.55. Thus, alkane SOA is insignificantly impacted by reactions in the wet inorg phase, as seen in Fig. S8, but significantly influenced by gas–aerosol partitioning.
4.5 Uncertainty of model rate constants
In the autoxidation mechanism for C12, three products originating from autoxidation of an alkyl peroxy radical (SR1) dominate the formation of low-volatility products to form SOA mass as seen in Table S4: SR3, SR34, and SR40. Previous studies have reported that calculated rate constants for autoxidation reactions have an uncertainty of a factor of 5 (Møller et al., 2016; Praske et al., 2018). To evaluate the uncertainty in SOA formation via autoxidation, the rate constant for the first step of autoxidation of an alkyl peroxy radical (SR1) was increased or decreased by a factor of 5. Figure S9 illustrates the resulting mass changes due to the change in this rate constant (SR1): 37.7 % increase and 12.4 % decrease in SOA mass formed by increasing or decreasing by a factor of 5, respectively, for 100 µg m−3 C12 consumption at HC ppbC NOx ppb = 3 and RH = 30 %. The rate constant () of acid-catalyzed oligomerization of organic species i in inorganic phase was increased or decreased by a factor of 2, but the resulting SOA mass shows no significant change for 100 µg m−3 of C10, C12, C14, C16, C18, and C20 consumption under high NOx conditions (HC ppbC NOx ppb = 3). This is expected as alkane oxidation products are lowly soluble in the salted inorg phase with low reactivity.
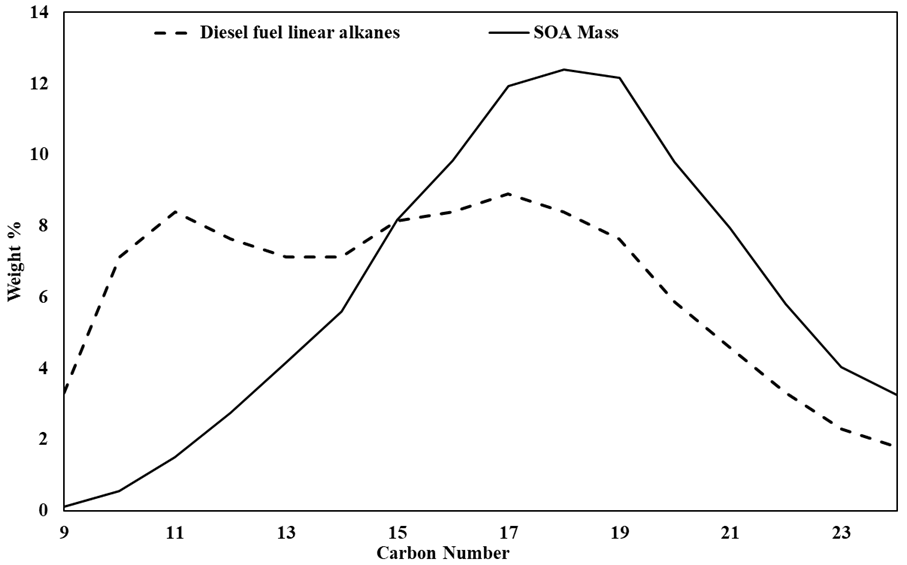
Figure 8The predicted relative SOA mass formation from the composition of linear alkanes in diesel fuel. The simulation was performed using the CB6-UNIPAR model equipped with IVC-based product distributions. The relative composition of linear alkanes in diesel fuel used is from Gentner et al. (2012). HC ppbC NOx ppb = 3, RH = 60 %, OM0=5 µg m−3.
4.6 Application of IVC-based product distributions to SOA simulation from diesel–linear alkanes
Diesel fuel is comprised of various lengths of linear alkanes ranging from C9 to C24. In order to simulate diesel SOA formation, the composition of mass-weighted linear alkanes (Gentner et al., 2012) in diesel fuel is applied to the UNIPAR model in Fig. 8. About 80 % SOA mass from diesel linear alkanes is produced from long-chain alkanes (≥ C15), with the highest percentage (≈ 11.8 %) from C18, while long-chain gaseous alkanes comprise only about 60 % of the linear alkane mass. Thus, we conclude that long-chain alkanes are an important source of SOA formation in air parcels originating from diesel fuel combustions. Gentner et al. (2012) also predicted SOA formation from various alkanes in diesel and found that long-chain alkanes make up the vast majority of the SOA mass. Notably, Gentner et al. (2012) found that the peak of SOA mass production from linear alkanes in diesel appears between C19 and C22, which is a slightly higher carbon number compared to our prediction.
Several studies using regional-scale simulations have considered alkanes to be an important source of SOA (Hodzic et al., 2010; Lee-Taylor et al., 2011; Pye and Pouliot, 2012; Yang et al., 2019). In this study, the UNIPAR model was employed to predict SOA formation from linear alkanes originating from both gas–particle partitioning and particle-phase reactions. Unlike the SOA formation from other precursors (aromatics and biogenics) in which both OMP and OMAR are significant, alkane SOA is predominantly produced via gas–particle partitioning of organic products. The inclusion of alkyl peroxy radical autoxidation reactions in the gas mechanism was found to significantly improve SOA mass predictions as seen in Fig. 3. Furthermore, the product distributions created using the MCMs with alkyl peroxy radical autoxidation reactions were extended to larger alkanes using the IVC approach (Fig. S2). Then, these product distributions were coupled with organic vapor deposition to walls to predict chamber data for C13 and C15 (Fig. 6).
NOx levels and temperature were found to be the two most influential factors for alkane SOA production (Figs. 6 and 7). At lower NOx levels, the SOA yields from C10, C12, C14, C16, C18, and C20 were found to be higher compared to higher NOx levels. The impact of temperature was found to be more significant for smaller alkane species as they were more likely to have intermediate-volatility products, which have partitioning processes that are sensitive to changes in temperature.
No significant seed impact appeared regardless of any acidity (Fig. S8). Thus, the reduction of SO2 emissions would not have a significant impact on linear alkane SOA formation. Furthermore, the reduction of NOx emissions would serve to increase the alkane SOA yields in ambient air. Although the impact of aerosol-phase reactions on the SOA mass created by linear alkane precursors is insignificant, the SOA mass produced by aerosol-phase reactions from products of other precursors (aromatics and biogenics) in the ambient environment can serve to increase partitioning of the products derived from alkanes. Accordingly, each series of linear alkanes, ranging from C10–C20, was sensitive to concentrations of pre-existing OM0 (Fig. S7).
IVC-based product distributions were extended to C24 in order to simulate the relative SOA formation from the various linear alkanes in diesel fuels. The UNIPAR model predicted that about 80 % SOA mass from diesel linear alkanes is produced from long-chain alkanes (≥ C15). In addition to linear alkanes, branched and cyclic alkanes are important components of diesel fuel (Gentner et al., 2012) and must be considered when predicting SOA formation in urban environments. Improvements can also be made to oxidized product distributions originating from linear alkanes. The MCMs used for linear alkanes in this study are simplified in such a way that if a specific reaction (i.e., reaction with hydroxyl radical) can occur on multiple locations on a specific compound, only one instance of this reaction pathway is included. The inclusion of each of these different reaction pathways can possibly modulate the product distribution and ultimately increase or decrease the predicted SOA production from the UNIPAR model.
Code to run the SOA model in this study is available upon request.
The chamber data and simulated results used in this study are available upon request.
The supplement related to this article is available online at: https://doi.org/10.5194/acp-23-1661-2023-supplement.
MJ designed the experiments, and AM, DD, and MJ carried them out. AM prepared the paper with contributions from MJ.
The contact author has declared that none of the authors has any competing interests.
Publisher's note: Copernicus Publications remains neutral with regard to jurisdictional claims in published maps and institutional affiliations.
This research was supported by the National Institute of Environmental Research (grant no. NIER2021), the National Science Foundation (grant no. AGS1923651), and the Fine Particle Research Initiative in East Asia Considering National Differences (FRIEND) project through the National Research Foundation of Korea (NRF) funded by the Ministry of Science and ICT (grant no. 2020M3G1A1114556).
This paper was edited by Barbara Ervens and reviewed by two anonymous referees.
Abraham, M. H. and McGowan, J. C.: The Use of Characteristic Volumes to Measure Cavity Terms in Reversed Phase Liquid Chromatography, Chromatographia, 23, 243–246, 1987.
Abraham, M. H., Whiting, G. S., Doherty, R. M., and Shuely, W. J.: Hydrogen bonding: XVI, A new solute salvation parameter, π2H, from gas chromatographic data, J. Chromatogr. A, 587, 213–228, https://doi.org/10.1016/0021-9673(91)85158-C, 1991.
Aumont, B., Valorso, R., Mouchel-Vallon, C., Camredon, M., Lee-Taylor, J., and Madronich, S.: Modeling SOA formation from the oxidation of intermediate volatility n-alkanes, Atmos. Chem. Phys., 12, 7577–7589, https://doi.org/10.5194/acp-12-7577-2012, 2012.
Beardsley, R. L. and Jang, M.: Simulating the SOA formation of isoprene from partitioning and aerosol phase reactions in the presence of inorganics, Atmos. Chem. Phys., 16, 5993–6009, https://doi.org/10.5194/acp-16-5993-2016, 2016.
Bianchi, F., Kurtén, T., Riva, M., Mohr, C., Rissanen, M. P., Roldin, P., Berndt, T., Crounse, J. D., Wennberg, P. O., Mentel, T. F., Wildt, J., Junninen, H., Jokinen, T., Kulmala, M., Worsnop, D. R., Thornton, J. A., Donahue, N., Kjaergaard, H. G., and Ehn, M.: Highly Oxygenated Organic Molecules (HOM) from Gas-Phase Autoxidation Involving Peroxy Radicals: A Key Contributor to Atmospheric Aerosol, Chem. Rev., 119, 3472–3509, https://doi.org/10.1021/acs.chemrev.8b00395, 2019.
Cao, G. and Jang, M.: An SOA Model for Toluene Oxidation in the Presence of Inorganic Aerosols, Environ. Sci. Technol., 44, 727–733, https://doi.org/10.1021/es901682r, 2010.
Caplain, I., Cazier, F., Nouali, H., Mercier, A., Déchaux, J.-C., Nollet, V., Joumard, R., André, J.-M., and Vidon, R.: Emissions of unregulated pollutants from European gasoline and diesel passenger cars, Atmos. Environ., 40, 5954–5966, https://doi.org/10.1016/j.atmosenv.2005.12.049, 2006.
Cappa, C. D., Zhang, X., Loza, C. L., Craven, J. S., Yee, L. D., and Seinfeld, J. H.: Application of the Statistical Oxidation Model (SOM) to Secondary Organic Aerosol formation from photooxidation of C12 alkanes, Atmos. Chem. Phys., 13, 1591–1606, https://doi.org/10.5194/acp-13-1591-2013, 2013.
Clegg, S. L., Brimblecombe, P., and Wexler, A. S.: Thermodynamic Model of the System H+-NH-SO-NO-H2O at Tropospheric Temperatures, J. Phys. Chem. A, 102, 2137–2154, https://doi.org/10.1021/jp973042r, 1998.
Cox, R. A. and Yates, K.: Kinetic equations for reactions in concentrated aqueous acids based on the concept of “excess acidity”, Can. J. Chem., 57, 2944–2951, https://doi.org/10.1139/v79-479, 1979.
Crounse, J. D., Nielsen, L. B., Jørgensen, S., Kjaergaard, H. G., and Wennberg, P. O.: Autoxidation of Organic Compounds in the Atmosphere, J. Phys. Chem. Lett., 4, 3513–3520, https://doi.org/10.1021/jz4019207, 2013.
De Schrijver, F. and Smets, G.: Polymerization kinetics in highly viscous media, J. Polym. Sci. A1, 4, 2201–2210, https://doi.org/10.1002/pol.1966.150040914, 1966.
Emery, C., Jung, J., Koo, B., and Yarwood, G.: Improvements to CAMx Snow Cover Treatments and Carbon Bond Chemical Mechanism for Winter Ozone, Ramboll Environ, 2015.
Gentner Drew, R., Isaacman, G., Worton David, R., Chan Arthur, W. H., Dallmann Timothy, R., Davis, L., Liu, S., Day Douglas, A., Russell Lynn, M., Wilson Kevin, R., Weber, R., Guha, A., Harley Robert, A., and Goldstein Allen, H.: Elucidating secondary organic aerosol from diesel and gasoline vehicles through detailed characterization of organic carbon emissions, P. Natl. Acad. Sci. USA, 109, 18318–18323, https://doi.org/10.1073/pnas.1212272109, 2012.
Han, S. and Jang, M.: Simulating the impact of gas-wall partitioning on SOA formation using the explicit gas mechanism integrated with aqueous reactions containing electrolytes, Sci. Total Environ., 748, 141360, https://doi.org/10.1016/j.scitotenv.2020.141360, 2020.
Han, S. and Jang, M.: Modeling Diurnal Variation of SOA Formation via Multiphase Reactions of Biogenic Hydrocarbons, Atmos. Chem. Phys. Discuss. [preprint], https://doi.org/10.5194/acp-2022-327, in review, 2022a.
Han, S. and Jang, M.: Prediction of secondary organic aerosol from the multiphase reaction of gasoline vapor by using volatility–reactivity base lumping, Atmos. Chem. Phys., 22, 625–639, https://doi.org/10.5194/acp-22-625-2022, 2022b.
Hodzic, A., Jimenez, J. L., Madronich, S., Canagaratna, M. R., DeCarlo, P. F., Kleinman, L., and Fast, J.: Modeling organic aerosols in a megacity: potential contribution of semi-volatile and intermediate volatility primary organic compounds to secondary organic aerosol formation, Atmos. Chem. Phys., 10, 5491–5514, https://doi.org/10.5194/acp-10-5491-2010, 2010.
Im, Y., Jang, M., and Beardsley, R. L.: Simulation of aromatic SOA formation using the lumping model integrated with explicit gas-phase kinetic mechanisms and aerosol-phase reactions, Atmos. Chem. Phys., 14, 4013–4027, https://doi.org/10.5194/acp-14-4013-2014, 2014.
Jang, M. and Kamens, R. M.: A Thermodynamic Approach for Modeling Partitioning of Semivolatile Organic Compounds on Atmospheric Particulate Matter: Humidity Effects, Environ. Sci. Technol., 32, 1237–1243, https://doi.org/10.1021/es970773w, 1998.
Jang, M., Czoschke, N. M., Lee, S., and Kamens, R. M.: Heterogeneous Atmospheric Aerosol Production by Acid-Catalyzed Particle-Phase Reactions, Science, 298, 814–817, https://doi.org/10.1126/science.1075798, 2002.
Jang, M., Czoschke, N. M., and Northcross, A. L.: Semiempirical Model for Organic Aerosol Growth by Acid-Catalyzed Heterogeneous Reactions of Organic Carbonyls, Environ. Sci. Technol., 39, 164–174, https://doi.org/10.1021/es048977h, 2005.
Kanakidou, M., Seinfeld, J. H., Pandis, S. N., Barnes, I., Dentener, F. J., Facchini, M. C., Van Dingenen, R., Ervens, B., Nenes, A., Nielsen, C. J., Swietlicki, E., Putaud, J. P., Balkanski, Y., Fuzzi, S., Horth, J., Moortgat, G. K., Winterhalter, R., Myhre, C. E. L., Tsigaridis, K., Vignati, E., Stephanou, E. G., and Wilson, J.: Organic aerosol and global climate modelling: a review, Atmos. Chem. Phys., 5, 1053–1123, https://doi.org/10.5194/acp-5-1053-2005, 2005.
Lamkaddam, H., Gratien, A., Pangui, E., Cazaunau, M., Picquet-Varrault, B., and Doussin, J.-F.: High-NOx Photooxidation of n-Dodecane: Temperature Dependence of SOA Formation, Environ. Sci. Technol., 51, 192–201, https://doi.org/10.1021/acs.est.6b03821, 2017.
Leahy, D. E., Morris, J. J., Taylor, P. J., and Wait, A. R.: Model solvent systems for QSAR, Part 3. An LSER analysis of the “critical quartet”, New light on hydrogen bond strength and directionality, J. Chem. Soc., 2, 705–722, https://doi.org/10.1039/p29920000705, 1992.
Lee-Taylor, J., Madronich, S., Aumont, B., Baker, A., Camredon, M., Hodzic, A., Tyndall, G. S., Apel, E., and Zaveri, R. A.: Explicit modeling of organic chemistry and secondary organic aerosol partitioning for Mexico City and its outflow plume, Atmos. Chem. Phys., 11, 13219–13241, https://doi.org/10.5194/acp-11-13219-2011, 2011.
Li, J., Wang, W., Li, K., Zhang, W., Peng, C., Zhou, L., Shi, B., Chen, Y., Liu, M., Li, H., and Ge, M.: Temperature effects on optical properties and chemical composition of secondary organic aerosol derived from n-dodecane, Atmos. Chem. Phys., 20, 8123–8137, https://doi.org/10.5194/acp-20-8123-2020, 2020.
Li, J., Li, K., Li, H., Wang, X., Wang, W., Wang, K., and Ge, M.: Long-chain alkanes in the atmosphere: A review, J. Environ. Sci., 114, 37–52, https://doi.org/10.1016/j.jes.2021.07.021, 2022.
Lim, Y. B. and Ziemann, P. J.: Effects of Molecular Structure on Aerosol Yields from OH Radical-Initiated Reactions of Linear, Branched, and Cyclic Alkanes in the Presence of NOx, Environ. Sci. Technol., 43, 2328–2334, https://doi.org/10.1021/es803389s, 2009.
Loza, C. L., Craven, J. S., Yee, L. D., Coggon, M. M., Schwantes, R. H., Shiraiwa, M., Zhang, X., Schilling, K. A., Ng, N. L., Canagaratna, M. R., Ziemann, P. J., Flagan, R. C., and Seinfeld, J. H.: Secondary organic aerosol yields of 12-carbon alkanes, Atmos. Chem. Phys., 14, 1423–1439, https://doi.org/10.5194/acp-14-1423-2014, 2014.
McMurry, P. H. and Grosjean, D.: Gas and aerosol wall losses in Teflon film smog chambers, Environ. Sci. Technol., 19, 1176–1182, 1985.
Møller, K. H., Otkjær, R. V., Hyttinen, N., Kurtén, T., and Kjaergaard, H. G.: Cost-Effective Implementation of Multiconformer Transition State Theory for Peroxy Radical Hydrogen Shift Reactions, J. Phys. Chem. A, 120, 10072–10087, https://doi.org/10.1021/acs.jpca.6b09370, 2016.
Nel, A.: Air Pollution-Related Illness: Effects of Particles, Science, 308, 804–806, https://doi.org/10.1126/science.1108752, 2005.
Odian, G.: Principles of polymerization, John Wiley & Sons, ISBN: 9780471478751, 2004.
Pankow, J. F.: An absorption model of gas/particle partitioning of organic compounds in the atmosphere, Atmos. Environ., 28, 185–188, https://doi.org/10.1016/1352-2310(94)90093-0, 1994.
Platts, J. A., Butina, D., Abraham, M. H., and Hersey, A.: Estimation of Molecular Linear Free Energy Relation Descriptors Using a Group Contribution Approach, J. Chem. Inf. Comp. Sci., 39, 835–845, https://doi.org/10.1021/ci980339t, 1999.
Praske, E., Otkjær, R. V., Crounse, J. D., Hethcox, J. C., Stoltz, B. M., Kjaergaard, H. G., and Wennberg, P. O.: Atmospheric autoxidation is increasingly important in urban and suburban North America, P. Natl. Acad. Sci. USA, 115, 64–69, https://doi.org/10.1073/pnas.1715540115, 2018.
Press, W. H., Teukolsky, S. A., Vetterling, W. T., and Flannery, B. P.: Numerical recipes in Fortran 77: the art of scientific computing, Cambridge University Press, Cambridge, 1992.
Puzyn, T., Leszczynski, J., and Cronin, M. T.: Recent advances in QSAR studies: methods and applications, 1st Edn., Springer Dordrecht, ISBN: 978-1-4020-9783-6, 2010.
Pye, H. O. T. and Pouliot, G. A.: Modeling the Role of Alkanes, Polycyclic Aromatic Hydrocarbons, and Their Oligomers in Secondary Organic Aerosol Formation, Environ. Sci. Technol., 46, 6041–6047, https://doi.org/10.1021/es300409w, 2012.
Pye Havala, O. T., D'Ambro Emma, L., Lee Ben, H., Schobesberger, S., Takeuchi, M., Zhao, Y., Lopez-Hilfiker, F., Liu, J., Shilling John, E., Xing, J., Mathur, R., Middlebrook Ann, M., Liao, J., Welti, A., Graus, M., Warneke, C., de Gouw Joost, A., Holloway John, S., Ryerson Thomas, B., Pollack Ilana, B., and Thornton Joel, A.: Anthropogenic enhancements to production of highly oxygenated molecules from autoxidation, P. Natl. Acad. Sci. USA, 116, 6641–6646, https://doi.org/10.1073/pnas.1810774116, 2019.
Reid, J. P., Bertram, A. K., Topping, D. O., Laskin, A., Martin, S. T., Petters, M. D., Pope, F. D., and Rovelli, G.: The viscosity of atmospherically relevant organic particles, Nat. Commun., 9, 956, https://doi.org/10.1038/s41467-018-03027-z, 2018.
Robinson Allen, L., Donahue Neil, M., Shrivastava Manish, K., Weitkamp Emily, A., Sage Amy, M., Grieshop Andrew, P., Lane Timothy, E., Pierce Jeffrey, R., and Pandis Spyros, N.: Rethinking Organic Aerosols: Semivolatile Emissions and Photochemical Aging, Science, 315, 1259–1262, https://doi.org/10.1126/science.1133061, 2007.
Roldin, P., Ehn, M., Kurtén, T., Olenius, T., Rissanen, M. P., Sarnela, N., Elm, J., Rantala, P., Hao, L., Hyttinen, N., Heikkinen, L., Worsnop, D. R., Pichelstorfer, L., Xavier, C., Clusius, P., Öström, E., Petäjä, T., Kulmala, M., Vehkamäki, H., Virtanen, A., Riipinen, I., and Boy, M.: The role of highly oxygenated organic molecules in the Boreal aerosol-cloud-climate system, Nat. Commun., 10, 4370, https://doi.org/10.1038/s41467-019-12338-8, 2019.
Schell, B., Ackermann, I. J., Hass, H., Binkowski, F. S., and Ebel, A.: Modeling the formation of secondary organic aerosol within a comprehensive air quality model system, J. Geophys. Res.-Atmos., 106, 28275–28293, https://doi.org/10.1029/2001JD000384, 2001.
Shrivastava, M., Cappa, C. D., Fan, J., Goldstein, A. H., Guenther, A. B., Jimenez, J. L., Kuang, C., Laskin, A., Martin, S. T., Ng, N. L., Petaja, T., Pierce, J. R., Rasch, P. J., Roldin, P., Seinfeld, J. H., Shilling, J., Smith, J. N., Thornton, J. A., Volkamer, R., Wang, J., Worsnop, D. R., Zaveri, R. A., Zelenyuk, A., and Zhang, Q.: Recent advances in understanding secondary organic aerosol: Implications for global climate forcing, Rev. Geophys., 55, 509–559, https://doi.org/10.1002/2016RG000540, 2017.
Takekawa, H., Minoura, H., and Yamazaki, S.: Temperature dependence of secondary organic aerosol formation by photo-oxidation of hydrocarbons, Atmos. Environ., 37, 3413–3424, https://doi.org/10.1016/S1352-2310(03)00359-5, 2003.
US EPA: National Ambient Air Quality Standards (NAAQS) for Particulate Matter (PM), https://www.epa.gov/pm-pollution/national-ambient-air-quality-standards-naaqs-pm (last access: 12 December 2021), 2012.
US EPA: Integrated Science Assessment (ISA) for Particulate Matter, https://cfpub.epa.gov/ncea/isa/recordisplay.cfm?deid=347534 (last access: 12 December 2021), 2019.
Volkamer, R., Jimenez, J. L., San Martini, F., Dzepina, K., Zhang, Q., Salcedo, D., Molina, L. T., Worsnop, D. R., and Molina, M. J.: Secondary organic aerosol formation from anthropogenic air pollution: Rapid and higher than expected, Geophys. Res. Lett., 33, L17811, https://doi.org/10.1029/2006GL026899, 2006.
World Health, O.: Ambient air pollution: a global assessment of exposure and burden of disease, World Health Organization, Geneva, World Health organization, ISBN: 9789241511353, 2016.
Wu, L., Wang, X., Lu, S., Shao, M., and Ling, Z.: Emission inventory of semi-volatile and intermediate-volatility organic compounds and their effects on secondary organic aerosol over the Pearl River Delta region, Atmos. Chem. Phys., 19, 8141–8161, https://doi.org/10.5194/acp-19-8141-2019, 2019.
Xavier, C., Rusanen, A., Zhou, P., Dean, C., Pichelstorfer, L., Roldin, P., and Boy, M.: Aerosol mass yields of selected biogenic volatile organic compounds – a theoretical study with nearly explicit gas-phase chemistry, Atmos. Chem. Phys., 19, 13741–13758, https://doi.org/10.5194/acp-19-13741-2019, 2019.
Yang, W., Li, J., Wang, W., Li, J., Ge, M., Sun, Y., Chen, X., Ge, B., Tong, S., Wang, Q., and Wang, Z.: Investigating secondary organic aerosol formation pathways in China during 2014, Atmos. Environ., 213, 133–147, https://doi.org/10.1016/j.atmosenv.2019.05.057, 2019.
Yap, C. W.: PaDEL-descriptor: An open source software to calculate molecular descriptors and fingerprints, J. Comput. Chem., 32, 1466–1474, https://doi.org/10.1002/jcc.21707, 2011.
Yu, Z., Jang, M., Zhang, T., Madhu, A., and Han, S.: Simulation of Monoterpene SOA Formation by Multiphase Reactions Using Explicit Mechanisms, ACS Earth and Space Chemistry, ACS Earth and Space Chemistry, Vol. 5, 1455–1467, 2021.
Zhang, X. and Seinfeld, J. H.: A functional group oxidation model (FGOM) for SOA formation and aging, Atmos. Chem. Phys., 13, 5907–5926, https://doi.org/10.5194/acp-13-5907-2013, 2013.
Zhou, C., Jang, M., and Yu, Z.: Simulation of SOA formation from the photooxidation of monoalkylbenzenes in the presence of aqueous aerosols containing electrolytes under various NOx levels, Atmos. Chem. Phys., 19, 5719–5735, https://doi.org/10.5194/acp-19-5719-2019, 2019.
Zuend, A., Marcolli, C., Booth, A. M., Lienhard, D. M., Soonsin, V., Krieger, U. K., Topping, D. O., McFiggans, G., Peter, T., and Seinfeld, J. H.: New and extended parameterization of the thermodynamic model AIOMFAC: calculation of activity coefficients for organic-inorganic mixtures containing carboxyl, hydroxyl, carbonyl, ether, ester, alkenyl, alkyl, and aromatic functional groups, Atmos. Chem. Phys., 11, 9155–9206, https://doi.org/10.5194/acp-11-9155-2011, 2011.