the Creative Commons Attribution 4.0 License.
the Creative Commons Attribution 4.0 License.
 | 21 Dec 2023
Source apportionment of methane emissions from the Upper Silesian Coal Basin using isotopic signatures
Maximilian Eckl
Julian Kostinek
Michał Gałkowski
Christoph Gerbig
Michael Rothe
Thomas Röckmann
Malika Menoud
Hossein Maazallahi
Martina Schmidt
Piotr Korbeń
Jarosław Neçki
Mila Stanisavljević
Justyna Swolkień
Andreas Fix
Anke Roiger
Anthropogenic emissions are the primary source of the increase in atmospheric methane (CH4) levels. However, estimates of anthropogenic CH4 emissions still show large uncertainties at global and regional scales. Differences in CH4 isotopic source signatures δ13C and δ2H can help to constrain different source contributions (e.g., fossil, waste, agriculture). The Upper Silesian Coal Basin (USCB) represents one of the largest European CH4 emission regions, with more than 500 Gg CH4 yr−1 released from more than 50 coal mine ventilation shafts, landfills, and wastewater treatment plants. During the CoMet (Carbon Dioxide and Methane Mission) campaign in June 2018 methane observations were conducted from a variety of platforms including aircraft and cars to quantify these emissions. Besides the continuous sampling of atmospheric methane concentration, numerous air samples were taken from inside and around the ventilation shafts (1–2 km distance) and aboard the High Altitude and Long Range Research Aircraft (HALO) and DLR Cessna Caravan aircraft, and they were analyzed in the laboratory for the isotopic composition of CH4.
The airborne samples downwind of the USCB contained methane from the entire region and thus enabled determining the mean signature of the USCB accurately. This mean isotopic signature of methane emissions was ‰ for δ13C and ‰ for δ2H. This is in the range of previous USCB studies based on samples taken within the mines for δ13C but more depleted in δ2H than reported before. Signatures of methane enhancements sampled upwind of the mines and in the free troposphere clearly showed the influence of biogenic sources. We determined the source signatures of individual coal mine ventilation shafts using ground-based samples. These signatures displayed a considerable range between different mines and also varied for individual shafts from day to day. Different layers of the USCB coal contain thermogenic methane, isotopically similar to natural gas, and methane formed through biogenic carbonate reduction. The signatures vary depending on what layer of coal is mined at the time of sampling. Mean shaft signatures range from −60 ‰ to −42 ‰ for δ13C and from −200 ‰ to −160 ‰ for δ2H. A gradient in the signatures of subregions of the USCB is reflected both in the aircraft data and in the ground samples, with emissions from the southwest being most depleted in δ2H and emissions from the south being most depleted in δ13C, which is probably associated with the structural and lithostratigraphic history of the USCB and generation and migration processes of methane in the coal. The average signature of ‰ in δ13C and ‰ in δ2H from the ventilation shafts clearly differs from the USCB regional signature in δ2H. This makes a source attribution using δ2H signatures possible, which would not be possible with only the δ13C isotopic signatures. We assume that the USCB plume mainly contains fossil coal mine methane and biogenic methane from waste treatment, because the USCB is a highly industrialized region with few other possible methane sources. Assuming a biogenic methane signature between and −320 ‰ and −280 ‰ for δ2H, the biogenic methane emissions from the USCB account for 15 %–50 % of total emissions. The uncertainty range shows the need of comprehensive and extensive sampling from all possible source sectors for source apportionment. The share of anthropogenic–biogenic emissions of 0.4 %–14 % from this densely populated industrial region is underestimated in commonly used emission inventories. Generally, this study demonstrates the importance of δ2H-CH4 observations for methane source apportionment in regions with a mix of thermogenic and biogenic sources and, especially in our case, where the δ13C signature of the coal mine gas has a large variability.
- Article
(3140 KB) - Full-text XML
- BibTeX
- EndNote


The 2015 Paris Agreement of the United Nations Framework Convention on Climate Change (UNFCCC) aims to limit the rise in global mean temperature to 2 ∘C. Additionally, the Global Methane Pledge has been signed by over 100 countries to reduce methane emissions (European Commission and United States of America, 2021). To achieve this, we need to locate, quantify, and mitigate emissions of greenhouse gases (GHGs) due to anthropogenic activities (Ganesan et al., 2019; Nisbet et al., 2019, 2020). Methane (CH4) is the second most important anthropogenic greenhouse gas after carbon dioxide (CO2), and the increase in its atmospheric abundance since pre-industrial times has caused 23 % of the radiative forcing of long-lived GHGs (Etminan et al., 2016). Reduction of methane emissions is attractive because of the relatively short lifetime of around 10 years, enabling relatively short-term results for mitigation policies (Dlugokencky et al., 2011; Nisbet et al., 2016). This has been recognized by policy makers, and the European Commission has passed a regulation to reduce methane emissions from the energy sector, which puts the union on a path to climate neutrality by 2050 (European Commission, 2021). A better understanding of methane emission sources helps to optimize potential mitigation pathways. While the total emissions can be constrained relatively well through top–down observations, there is still considerable uncertainty as to the contribution of individual source sectors (Saunois et al., 2020). Methane emissions can be of natural origin, like from wetlands in tropical and boreal areas or from termites and wildfires. The anthropogenic sources include fossil fuel production and consumption, agriculture and waste management, biomass burning, and biofuels.
The mean atmospheric CH4 concentration has been rising since pre-industrial times with a short period of stagnation between 2000 and 2007, an accelerated growth rate especially after 2014 (Dlugokencky et al., 2011; Nisbet et al., 2014, 2016, 2019; Saunois et al., 2020), and an even stronger surge since 2020 (Dlugokencky, 2022). This increase is caused by the imbalance of the methane sources and the tropospheric sinks, i.e., mainly the oxidation via its reaction with OH, but also to a much lesser extent transport to the stratosphere and uptake by soils. Which source or sink mainly causes the observed increase is still under debate (Saunois et al., 2017; Nisbet et al., 2019; Lan et al., 2021).
The isotopic signatures of individual methane sources could help to understand the cause of the changes in emissions. The global mean ratio of the methane isotopologues in the atmosphere has been changing towards lighter carbon isotopic composition along with the rising concentration since 2007 (Nisbet et al., 2016). The ratio between 12C and 13C in the methane molecules and the ratio between 2H (= D, deuterium) and 1H atoms both differ for individual source categories of methane. The atmospheric isotopic composition change is caused by changes in emissions from different sources. The debate on which sources caused the global increase in atmospheric concentration and decrease in 13C methane isotopes is still ongoing (Nisbet et al., 2019). The isotopic information from different sources can be used in global inverse models to constrain the contribution of individual sources (e.g., Nisbet et al., 2016; Rice et al., 2016; Schwietzke et al., 2016; Rigby et al., 2017; Turner et al., 2017; Lan et al., 2021; Basu et al., 2022). To improve these model estimates, many studies collected and determined the isotopic composition of various methane sources (Brownlow et al., 2017; Fisher et al., 2017; Sherwood et al., 2017; Menoud et al., 2021, 2022b). The source signature observations were compiled into several databases to be readily available (Sherwood et al., 2017, 2020; Lan et al., 2021; Menoud et al., 2022a).
The isotopic composition accompanied by concentration observations can also be used to determine the relative strength of emissions from different sources in the same area. This has been done, for example, by Lu et al. (2021) for overlapping emissions from gas production and cattle farming in Australia. Here we use the same approach for fossil coal mine and biogenic waste sector methane emissions – two sectors with great potential for emission mitigation. Waste sector emissions comprise about 18 % of estimated global anthropogenic methane emissions of 366 Tg yr−1 for the 2008–2017 decade (Saunois et al., 2020). This sector includes landfills and wastewater handling. In some countries the contribution of waste methane emissions to total anthropogenic emissions is much larger; i.e., in the US 26 % of anthropogenic emissions are from waste treatment (USEPA, 2016). Coal mine methane emissions constitute about 42 (range 29–61) Tg yr−1. This is a fraction of 11 % of total global anthropogenic methane emissions for the 2008–2017 decade (Saunois et al., 2020). Most of the coal methane originates from underground hard coal exploitation. During mining methane is ventilated from the mines to keep the underground concentrations of methane below 2 % to avoid explosions (Tchórzewski, 2017). Global emissions from coal mining are expected to keep increasing in the future because of the increasing mining depths and importance of abandoned coal mines (Kholod et al., 2020). Poland is a country heavily depending on coal for its energy supply and industrial processes. Although it has reduced the fraction of energy from coal from 75 % in 1990, still 40 % of energy was produced from coal in 2020 (International Energy Agency, 2022). This coal is predominantly mined in underground mines in the Upper Silesian Coal Basin (USCB) and also in the Lublin basin.
The isotopic composition of methane depends on the methane origin pathway (Whiticar, 1996). Thermogenic methane is isotopically enriched ( ‰, ‰) compared to biogenic methane ( ‰, ‰), as methanogens preferentially use the lightest isotopes due to the lower bond energy (Rice, 1993). The isotopic signatures of methane from one coal mining area can vary significantly, which is connected with the fractionation of coalbed gases during secondary, chemical, and physical processes occurring during migration and/or mixing. The isotopic signatures of coal mine methane from the USCB have been investigated in previous studies (Kotarba, 2001, 2002; Kotarba and Lewan, 2004; Zazzeri et al., 2016; Menoud et al., 2021). The isotopic fractionation shows a difference between the northern and southern part of the USCB and in the south also a depth relation, with isotopically lighter δ13C methane at the top, which has resulted from physical (e.g., diffusion and adsorption/desorption) processes during gas migration (Kotarba, 2001). The methane emissions of the USCB originate mainly from the coal mines. A biogenic contribution to the USCB methane emissions probably originates from the waste sector (landfills and waste water treatment), since the region is heavily industrialized with a sizeable population of around 5 million people, whereas agriculture only plays a minor role. Additionally, the emission strength of the USCB coal mines has been thoroughly assessed with different methods during the CoMet (Carbon Dioxide and Methane Mission) 1.0 campaign in 2018 (e.g., Fiehn et al., 2020; Kostinek et al., 2021; Krautwurst et al., 2021; Andersen et al., 2023). During the campaign, the isotopic signature of the well-mixed methane emissions from the USCB was determined from samples aboard the German research aircraft HALO (Gałkowski et al., 2021b). Additionally, ground-based samples of the coal mine ventilation shafts were taken and analyzed for isotopic methane composition in the framework of the “Methane goes Mobile – Measurements and Modelling” (MEMO2) project. This project determined numerous isotopic source signatures of emission sources across Europe with different techniques. The combined MEMO2 data have been published in the European methane isotope database (EMID), which includes all ground-based samples from the USCB coal mine ventilation methane (Menoud et al., 2022a).
In this study, we present isotopic methane sample analysis for the USCB. We analyze new samples taken on a small aircraft and compare to already published ground samples to determine the contributions of coal mining and waste treatment to the total USCB methane emissions. In Sect. 2 we present the observational data from airborne and ground-based sampling and the method used to derive methane isotopic source signatures. Section 3 contains the results of the isotopic analysis for the airborne samples, a comparison with ground samples, and the source attribution to the source sectors. A summary and conclusions are given in Sect. 4.
2.1 Airborne observational data
During the CoMet 1.0 campaign in early summer (May–June) 2018, several aircraft and ground-based instruments were deployed to extensively investigate methane emissions of the USCB (Fix et al., 2018). Observations of methane dry air concentrations and other trace species were conducted from several different airborne platforms, i.e., the German research aircraft HALO (Gałkowski et al., 2021b), the DLR Cessna Caravan (Fiehn et al., 2020; Kostinek et al., 2021), and the Freie Universität Berlin Cessna (Krautwurst et al., 2021). Additionally, the campaign was supported by observations of methane concentrations from drones (Andersen et al., 2018, 2023) and mobile in situ systems deployed in cars (Wietzel, 2018; Korbeń, 2021; Stanisavljević, 2021).
During CoMet 1.0, a total of 10 flights were conducted with the DLR Cessna Caravan (Fig. 1 and Table 1). Flight days were chosen according to the weather situation. Fair weather with as few clouds as possible and steady wind conditions were preferred to simplify mass balance analysis and to increase the temporal overlap with observations conducted with sunlight-dependent instruments. Depending on the wind direction, different parts of the USCB were targeted, with the objective to determine emission estimates not only for the entire USCB, but also its parts. A focus region for sampling was the southwestern part of the USCB (Fig. 2), since it contains some of the strongest emitting mines (e.g., Pniówek). The flights were designed as mass balance flights with an upwind track within the planetary boundary layer (PBL) and several legs downwind of the sources with the highest one just above the PBL. The optimal flight time for a mass balance is in the afternoon, when the PBL has reached its maximum extent and was vertically well mixed. Four out of the 10 flights were conducted on cloud-free mornings in order to perform simultaneous observations with the MAMAP (Methane Airborne Mapper) instrument on the Freie Universität Berlin Cessna. The airborne mass balance emission estimate for the entire USCB has been published in a previous study (Fiehn et al., 2020). Emission estimates of clusters of ventilation shafts were covered by the MAMAP instrument (Krautwurst et al., 2021). Using airborne in situ observations and dispersion modeling, Kostinek et al. (2021) were also able to estimate emissions of individual ventilation shafts during the CoMet 1.0 campaign. Andersen et al. (2023) determined the emissions of five individual ventilation shafts and developed three upscaling methods to derive regional emission estimates. During the campaign period the wind direction varied considerably and all wind directions occurred. Flights were mostly conducted under easterly wind conditions.
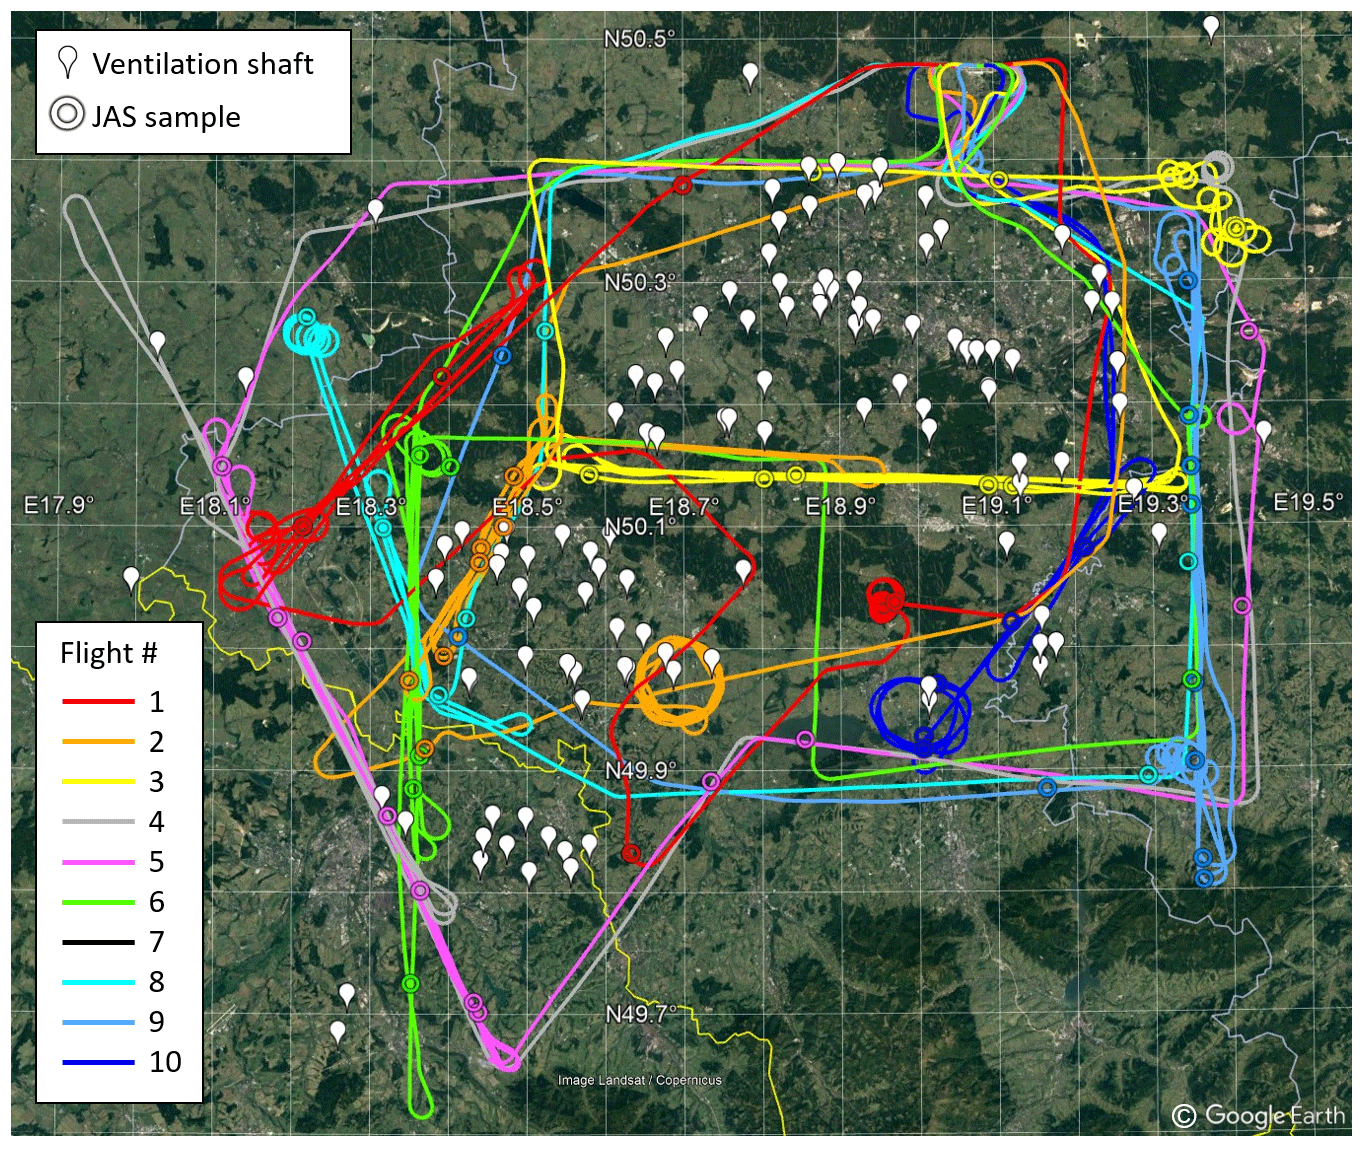
Figure 1Flight tracks of the 10 CoMet 1.0 flights with the DLR Cessna Caravan in the USCB. Coal mine ventilation shafts from CoMet v4 emission dataset (Gałkowski et al., 2021a) and JAS sample locations are marked. © Google Earth.
Table 1Isotopic source signatures and their standard error (SE) of CH4 emissions for each flight alone and for all flights combined. These source signatures are calculated from flask samples taken in the PBL. WD: wind direction.
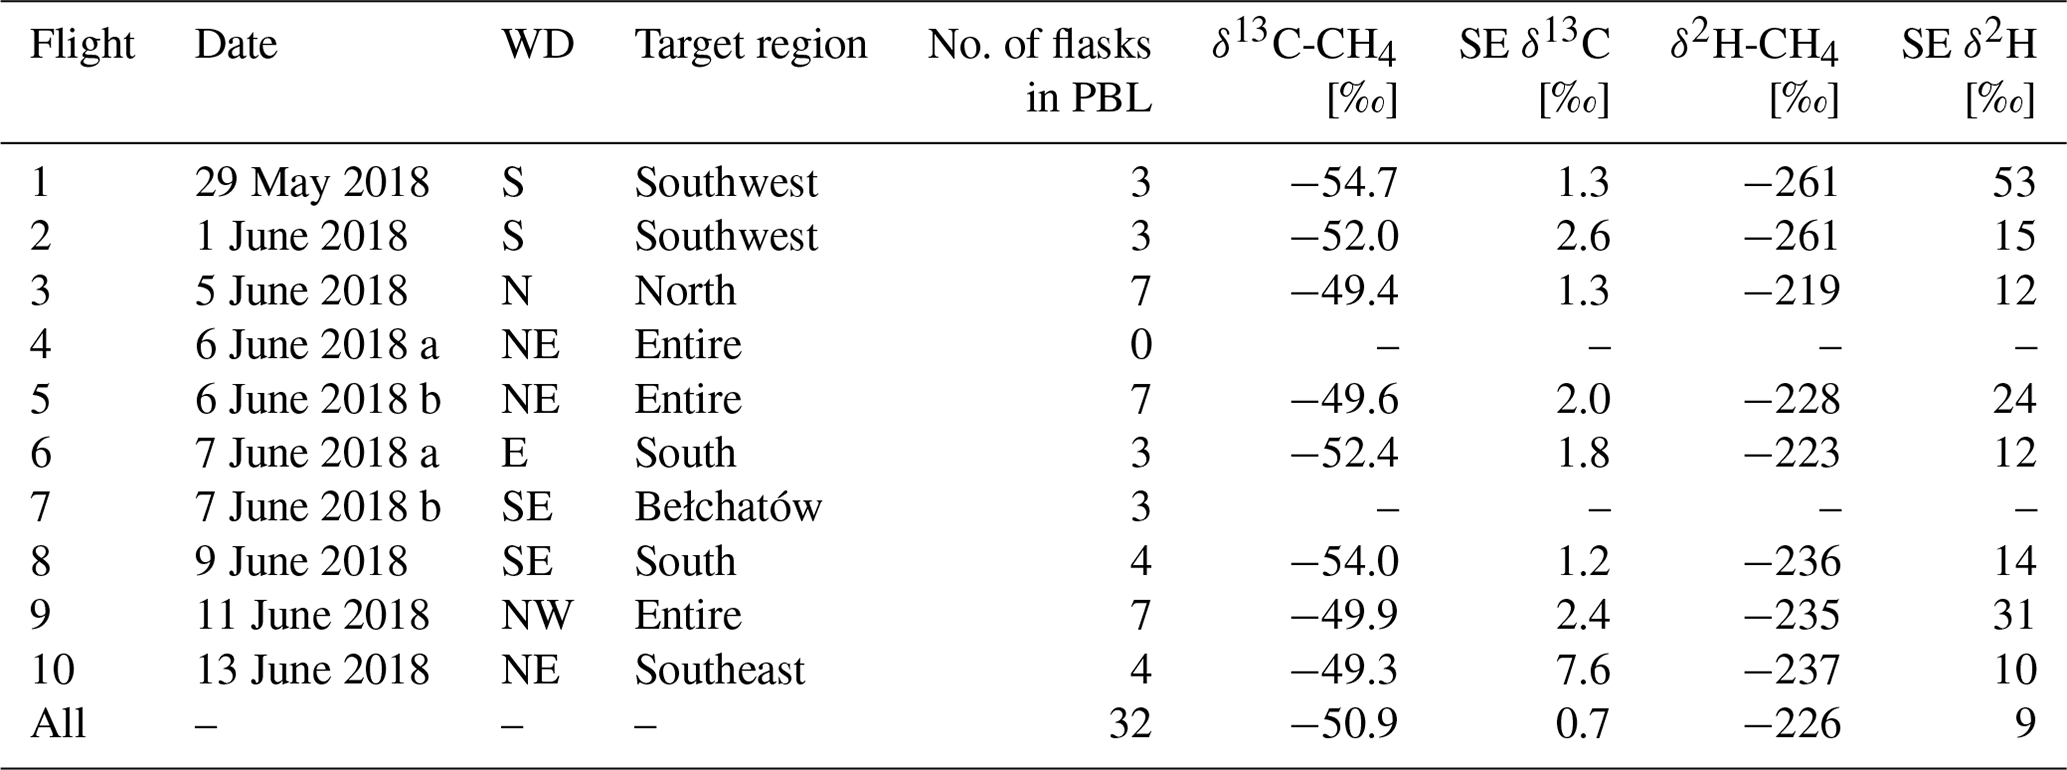
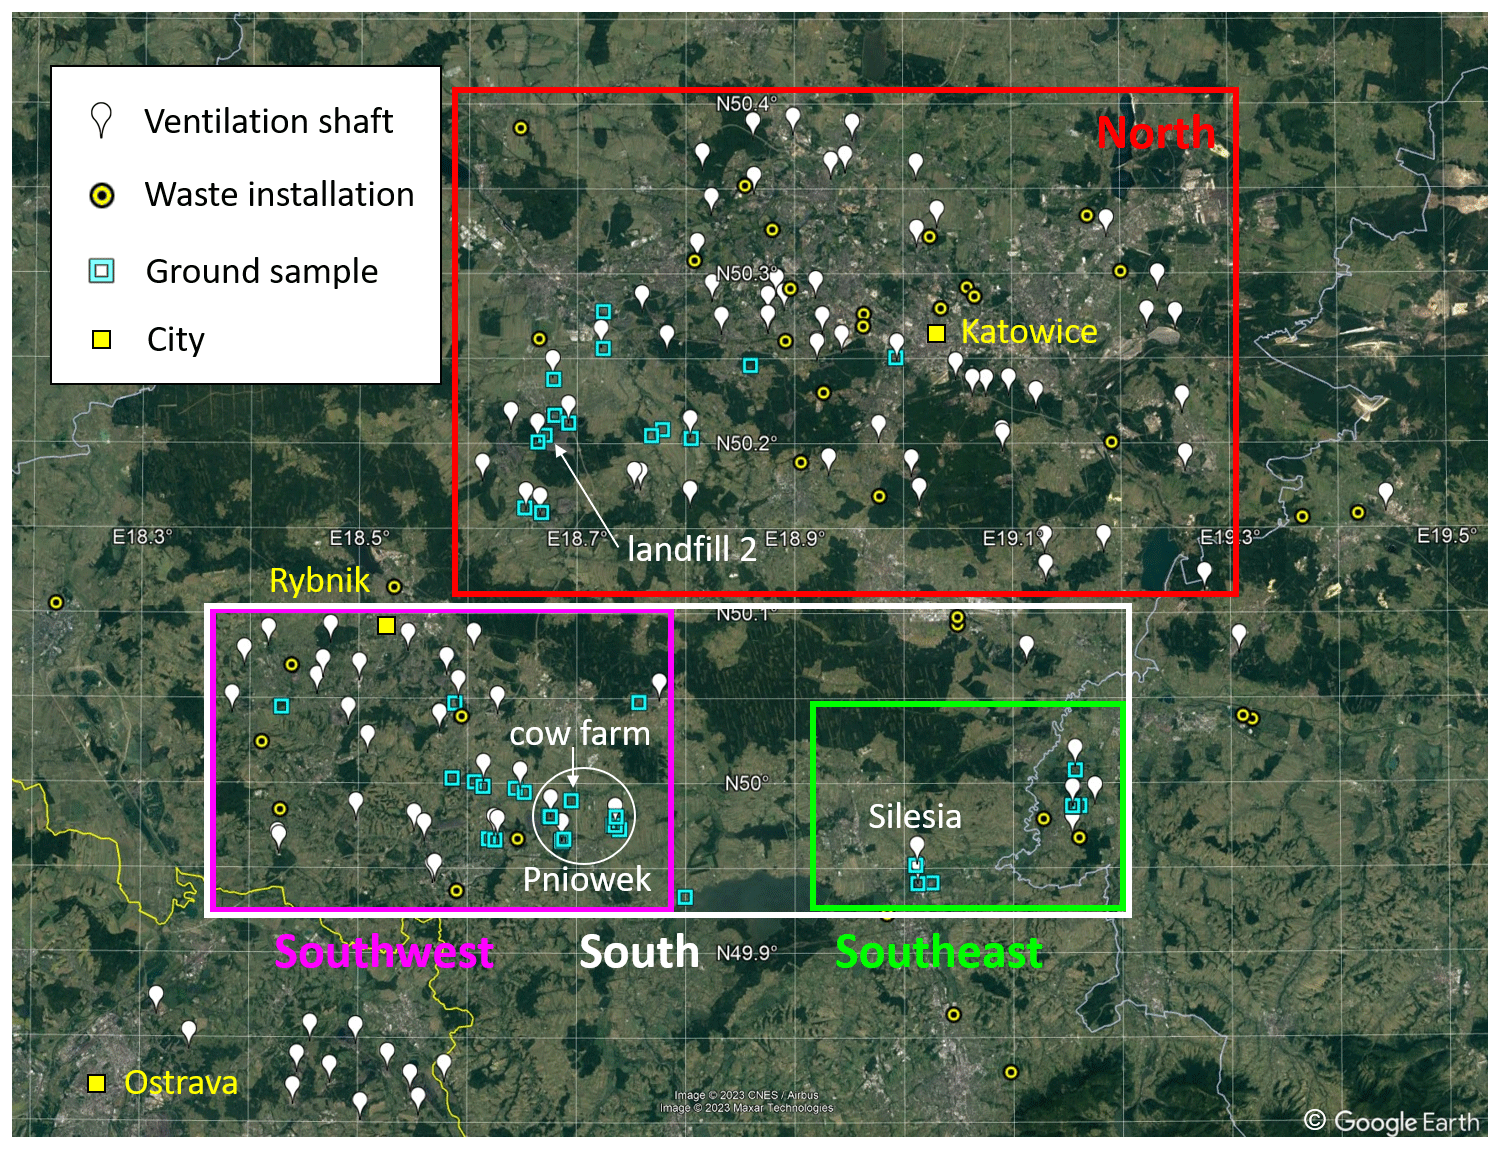
Figure 2USCB map with ventilation shafts, waste installations including waste disposal and waste water treatment (CoMet v4 database), and locations of ground samples for individual ventilation shafts and biogenic source signature determination (Menoud et al., 2022a). Landfill 1, the manholes, and the waste water plant (listed in Fig. 5) are located 100 km to the east in the city of Kraków and not shown on this map. The boxes mark the approximate target regions of different flights. © Google Earth.
Aboard the DLR Cessna Caravan a twin instrument to the Jena Air Sampler (JAS) from HALO (Gałkowski et al., 2021b) was installed. It is an air sampler with drying unit and 12 glass flasks having a volume of 1 L. Samples collected with both samplers were analyzed for trace gas concentrations (CH4, CO2, CO, N2O, H2, SF6) and the isotopic composition of CH4 and CO2 (δ13C-CO2, δ18O-CO2, δ13C-CH4, δ2H-CH4) at the Max Planck Institute for Biogeochemistry (MPI-BGC) in Jena, Germany. Details of the sampling method and analyzed parameters and uncertainties are documented by Sperlich et al. (2016) and Gałkowski et al. (2021b), but the data from the DLR Cessna Caravan have not been published previously. We report isotope ratios in the conventional δ notation as and , where 13Ri and 2Ri are the and ratios of a sample (i = SA) and an international standard (i = ST), respectively. The international standards are Vienna Pee Dee Belemnite (VPDB) for δ13C measurements and Vienna Standard Mean Ocean Water (VSMOW) for δ2H measurements of CH4. A total number of 62 flask samples were successfully collected during nine flights in the USCB. We divided the samples according to the sampling location into three categories: free troposphere (FT), inflow (IN), and outflow/plumes (PL). PBL extent was estimated based on the location of the sharp vertical gradient of water vapor observed in the in situ Cessna Caravan measurement data. Samples taken above the PBL are classified as free troposphere. Inflow and outflow samples were taken within the PBL and are classified either as inflow if they were taken upwind of the USCB coal mines or as outflow if they were sampled downwind of them. For each of these categories we determined the mean isotopic signature for the entire campaign. Using PL samples from each flight individually, we calculated the isotopic signatures of the individual target regions. In total, our dataset consists of 15 FT samples, 8 IN samples, and 32 PL samples and is published here for the first time.
2.2 Ground samples
On the ground, teams sampled from several mobile platforms. Air samples from inside and around the mine ventilation shafts were taken in Supelco Flexfoil bags. The trace gas concentrations and isotopic composition of CH4 was then analyzed by continuous flow isotopic ratio mass spectrometry at the Institute for Marine and Atmospheric Research Utrecht (IMAU). The analysis is described in Röckmann et al. (2016). Measurements at IMAU and MPI-BGC are referenced to the JRAS-M16 reference gases (Sperlich et al., 2016).
Additionally, a Picarro G2201-i cavity ring-down spectrometer (CRDS) with an active air core system attached was used to determine δ13C from some CH4 plumes observed by a measurement car (Wietzel, 2018; Hoheisel et al., 2019; Korbeń, 2021). Finally, the active air core samples from drones were also filled into sampling bags and analyzed for isotopic composition of CH4 (Andersen et al., 2021). The data were synchronized and are published in the EMID (Menoud et al., 2022b, a). More information on the sampling and measurement methods and all ground-based isotopic signatures can be found therein.
2.3 Calculation of isotopic source signatures
The characteristic isotopic ratio of a specific methane source is also called the isotopic signature. The CH4 from point sources mixes with the surrounding air in the atmosphere after it is released. The observed concentration of CH4 around this source cobs is a combination of the background concentration cbg and the concentration of the emissions from the source cs.
Likewise, the isotopic ratio of sampled CH4 is a combination of the isotopic signatures of background and source CH4, weighed with the respective concentrations.
In the equation, δobs, expressed using relative delta notation, is the observed isotopic signature; δbg is the background signature; and δs is the emission source signature. The relationship between the isotopic ratio and the concentration of methane during the two-component dilution process is linear. To find the source isotopic signatures of methane emitters, the Keeling method makes use of this linear relationship (Eq. 3).
δobs and cobs are analyzed from the samples, and the source signature δs is determined as the intercept of the linear regression (Keeling, 1958; Pataki et al., 2003). The slope k of the regression line contains the background characteristics, which need not be known for the Keeling method. The linear regression method chosen is the orthogonal distance regression (ODR), because it considers uncertainties in δobs as well as in cobs. The regression was calculated with the Python scipy.odr package, which calculates the intercept as well as its uncertainty as standard deviation from the uncertainties of the input data. This method was used for all air samples taken in glass flasks in the aircraft. The isotopic signatures from ground samples collected were derived using the same methodology. Comparison of these estimates to ones obtained from a more robust Miller–Tans (Miller and Tans, 2003) method showed no significant differences (Menoud et al., 2022b).
3.1 Flight isotopic signatures
For the three categories (FT, IN, and PL) we determined the mean isotopic signature from all flights combined (Fig. 3) and for PL samples also for individual flights (Fig. 4).
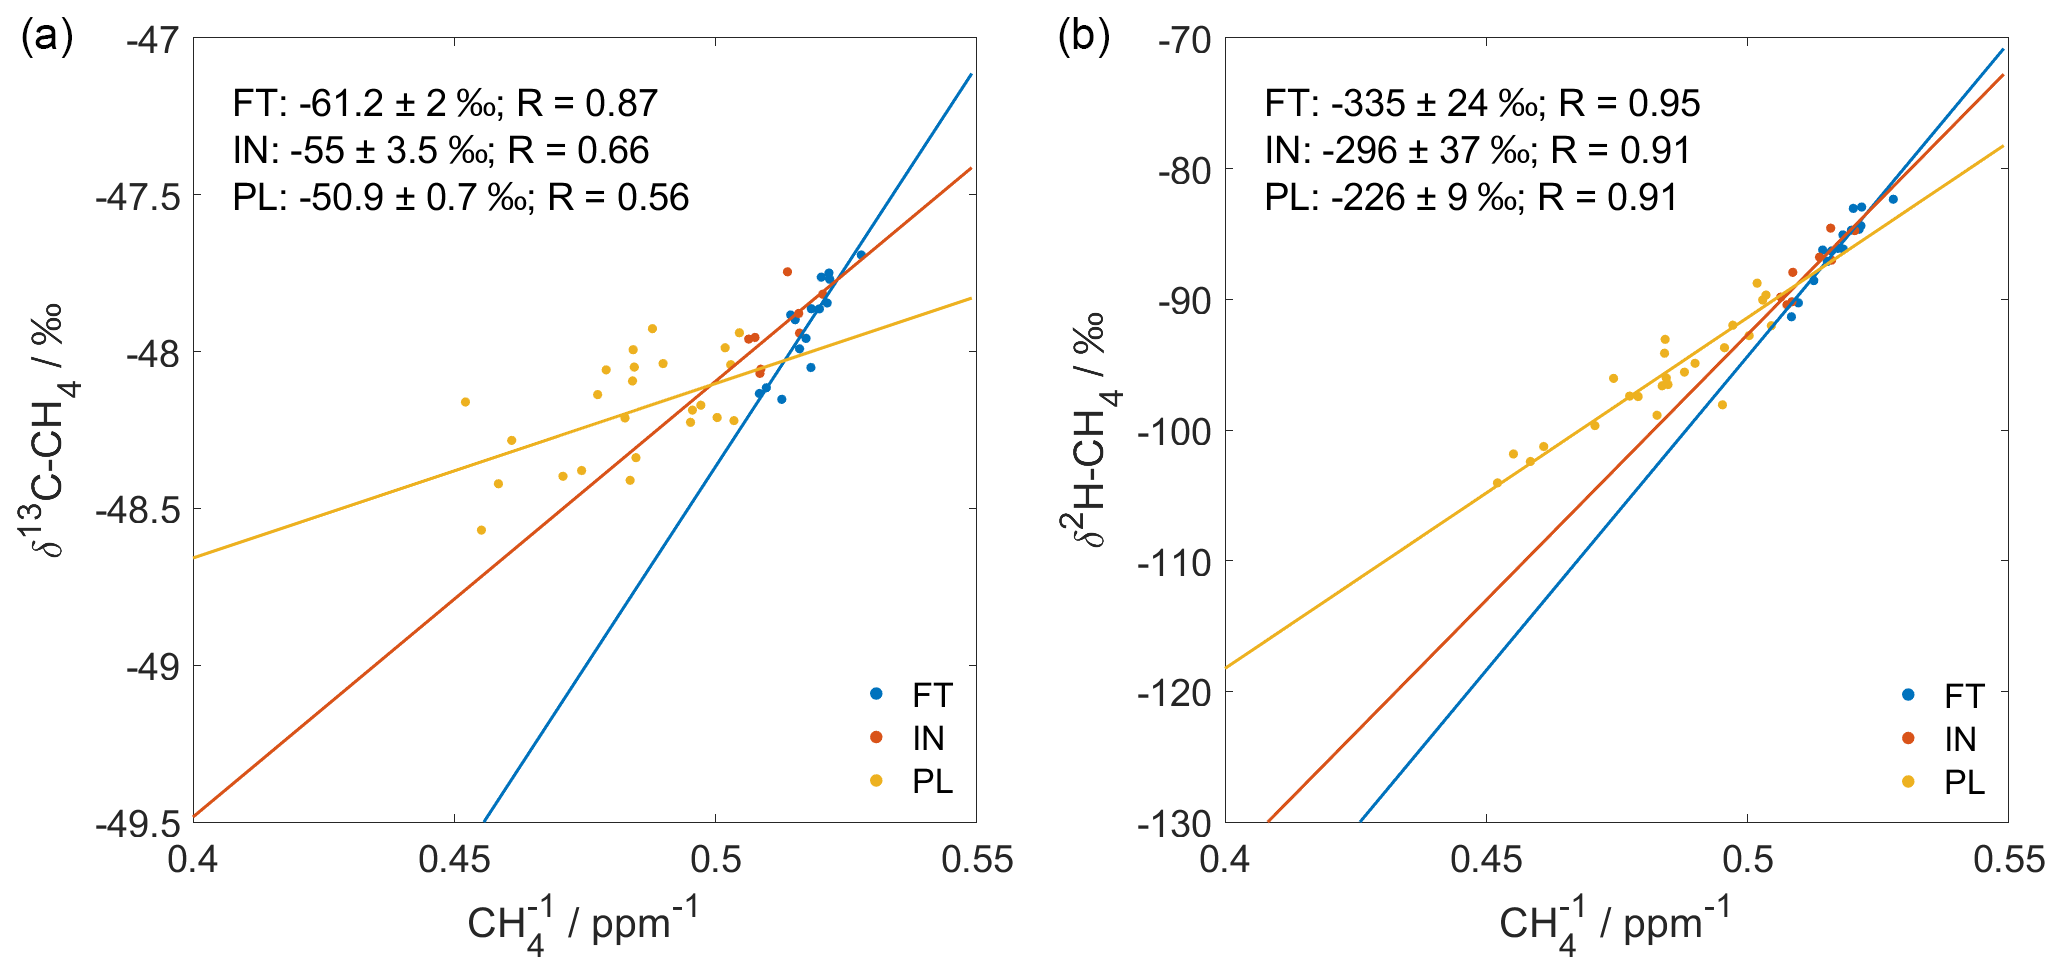
Figure 3Keeling plots for aircraft samples for δ13C (a) and δ2H (b) including source signature and Pearson correlation coefficients (R) for the three regimes – free troposphere (FT), inflow (IN), and outflow/plumes (PL).
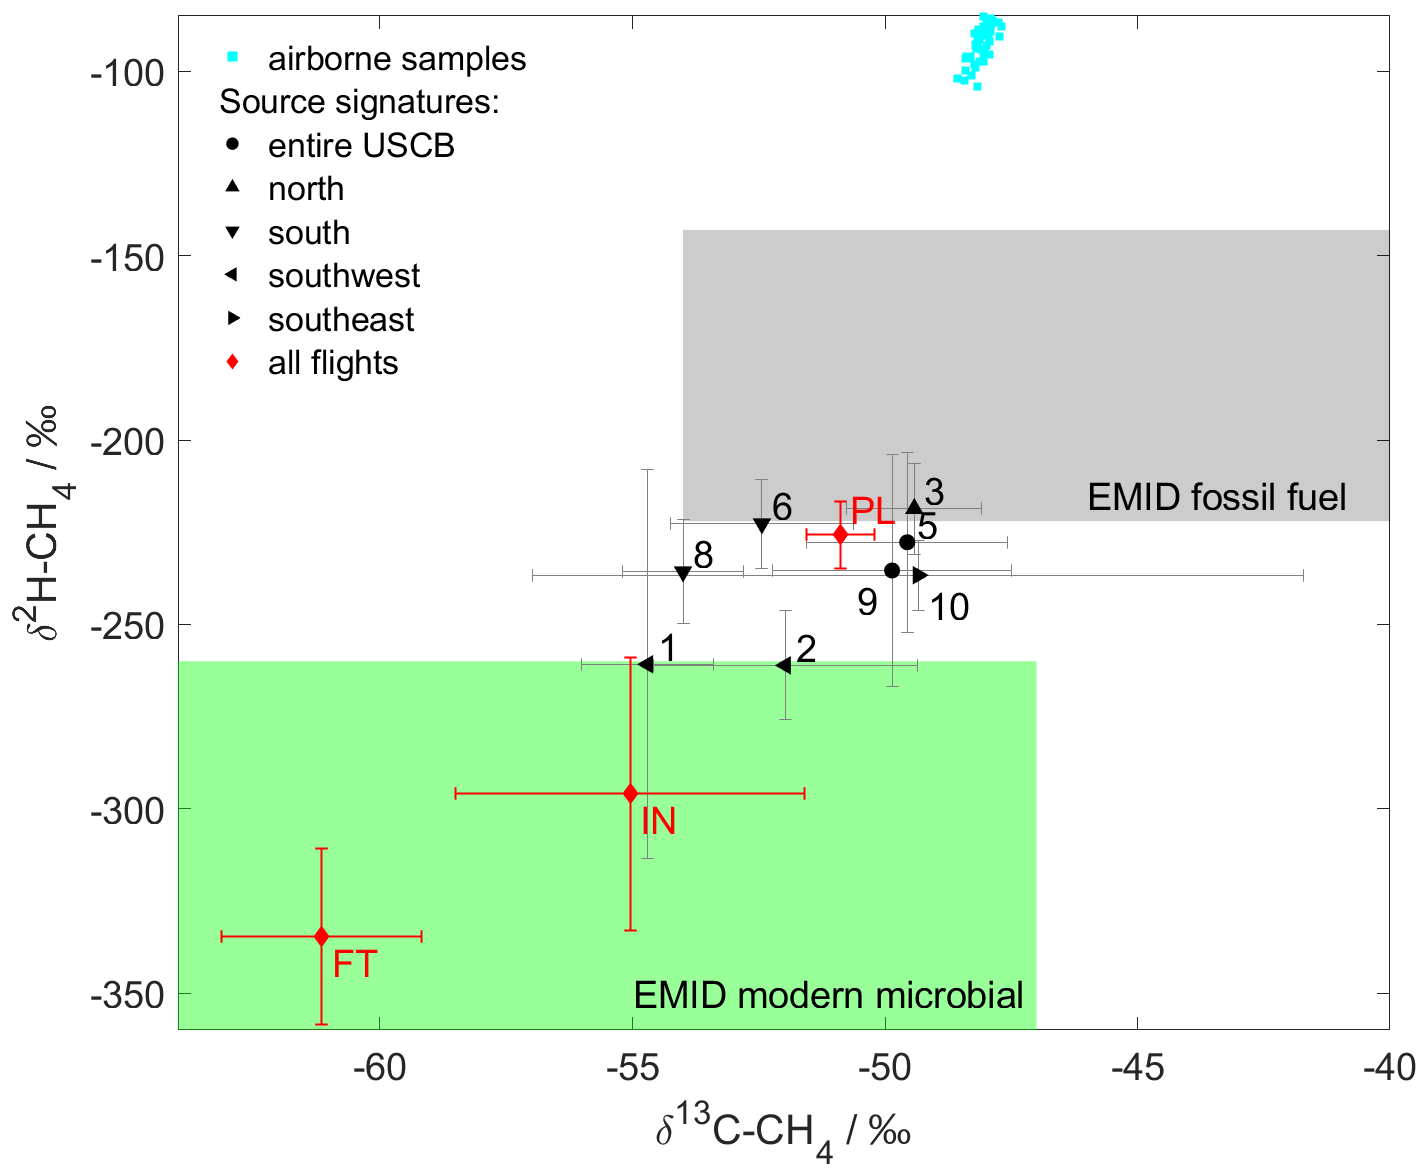
Figure 4Airborne samples and derived isotopic source signatures of CH4 for the three regimes – free troposphere (FT), inflow (IN), and outflow/plumes (PL) – and for PBL samples of each flight. Numbers indicate the flight number, and the symbol indicates the target area. The colored areas indicate typical source signature ranges for fossil fuel (gray) and modern microbial (green) as the mean with 1 standard deviation from all EMID signatures (Menoud et al., 2022b).
The mean isotopic signature of the USCB is derived from all 32 samples collected inside the boundary layer downwind of the emission sources (Fig. 3, PL). This average USCB signature is well constrained ( ‰ δ13C and ‰ δ2H) with only small uncertainties due to the large range of concentrations in the samples contributing to the analysis. The samples from the inflow tracks and the free troposphere also showed a clear correlation between inverse methane concentration and isotopic ratios, and the Keeling method could be applied for these samples as well, albeit with higher uncertainties. The observed CH4 variability in the free troposphere originates from biogenic sources with a clear signature of ‰ δ13C and ‰ δ2H (Fig. 4). In the free troposphere we encountered small variations in the CH4 concentration from sources probably faraway, and most of them were biogenic (agriculture, ruminants, and wetlands). The signature of all inflow samples of ‰ δ13C and ‰ δ2H indicates that the CH4 enhancements in the upwind boundary layer are also biogenic but shifted toward more positive fossil fuel signatures. This means that the inflow methane is either mainly biogenic with a fossil influence or from a different type of biogenic sources. It could be that inflow sources are rather from waste management, which has more positive signatures, than agriculture, wetlands, or ruminants, which are more negative. In the PBL emissions upstream cause slightly larger CH4 peaks that have more anthropogenic addition, as around Silesia there is industry and fossil fuel CH4 emissions in all directions. The inflow samples might also be influenced by emissions from leaks in the natural gas networks in the area, which at that time also had a δ13C signature close to −55 ‰ (Jarosław Neçki, personal communication, 2023). The higher standard errors of this signature result from smaller concentration variations.
From the flasks taken within the boundary layer we also determined source signatures for individual flights. No samples were collected in the study area during flights 4 and 7. During all other flights at least three flask samples within the PBL could be used to determine the source signatures using the Keeling method as described above. As mentioned previously, each flight had a designated target region, which was either the entire USCB or a part of it. Table 1 lists all flights including wind direction, target region, number of samples, and isotopic source signature with standard errors. Figure 4 shows the location of the source signatures on a δ13C versus δ2H chart.
Flights 1 and 2 both covered the southwestern part of the USCB, where many deep and strongly emitting mines are located. These flights show the lowest δ2H signature of about −260 ‰. Flight 3 covered only the northern part of the USCB. Northerly winds provided a clean inflow. The wind was strong with a mean of 7 m s−1, which caused a sampling of CH4 plumes that were vertically not mixed from the ground to the PBL. The isotopic signature of flight 3 shows the highest value of −219 ‰ of all flights in δ2H. During flights 5 and 9 the conditions to sample the entire USCB were optimal, and the plume was sampled with sufficient distance to the sources of the plume to be well mixed. The signatures of these two flights are very similar around −50 ‰ in δ13C and −230 ‰ in δ2H and probably represent the mean signature of the USCB CH4 emissions. Flights 6 and 8 sampled emissions from the southern part of the USCB. These signatures are lighter in δ13C than those of the entire USCB. Flight 10 targeted two mines in the southeastern part of the USCB, called Brzeszcze and Silesia. The flight strategy followed a mass balance methodology, executed through circling around the mines. The four flask samples taken within the PBL caught enhanced CH4 from these two combined mines and enabled us to determine their signature, albeit with a large uncertainty for δ13C. Overall, Fig. 4 shows that signatures from the southern and southwestern regions have notably lower δ13C values. Also, the two flights covering the southwest of the USCB have reduced δ2H values. These gradients are compared to individual shaft signatures in the following.
3.2 Comparison with ground isotopic signatures
The ground-based team performed extensive CH4 isotope sampling in the USCB in 2018 and 2019. Signatures were derived for individual sources within the USCB from samples in the vicinity (1–2 km) and also from within the shafts. Biogenic emissions from a cow farm, two landfills, some manholes, and a wastewater facility were also investigated. Although some biogenic samples were collected in Kraków, some 100 km to the east of main study area, we expect them to also be representative for similar types of sources in the USCB. Coal mine methane signatures derived from samples taken on different days vary mostly within 50 ‰ for δ2H and up to 10 ‰ for δ13C (Fig. 5). Within one mine the isotopic signatures differ due to the geographical structure. The signature of the ventilated methane then also varies with time, because longwalls at different depths of the mine are opened up or shut down during excavation. At the Pniówek mine some δ13C samples were taken inside the ventilation shafts in addition to the samples taken in the vicinity. The signatures from all samples are in the same range (Fig. A1). Thus, the signature variability of the outside samples is reliable. For each shaft a mean signature is calculated from results on individual days. δ2H signatures of ventilation shafts are mostly within a range from −200 ‰ to −160 ‰. The mean δ13C values cover a range from −60 ‰ to −42 ‰, with one outlier signature at −38 ‰.
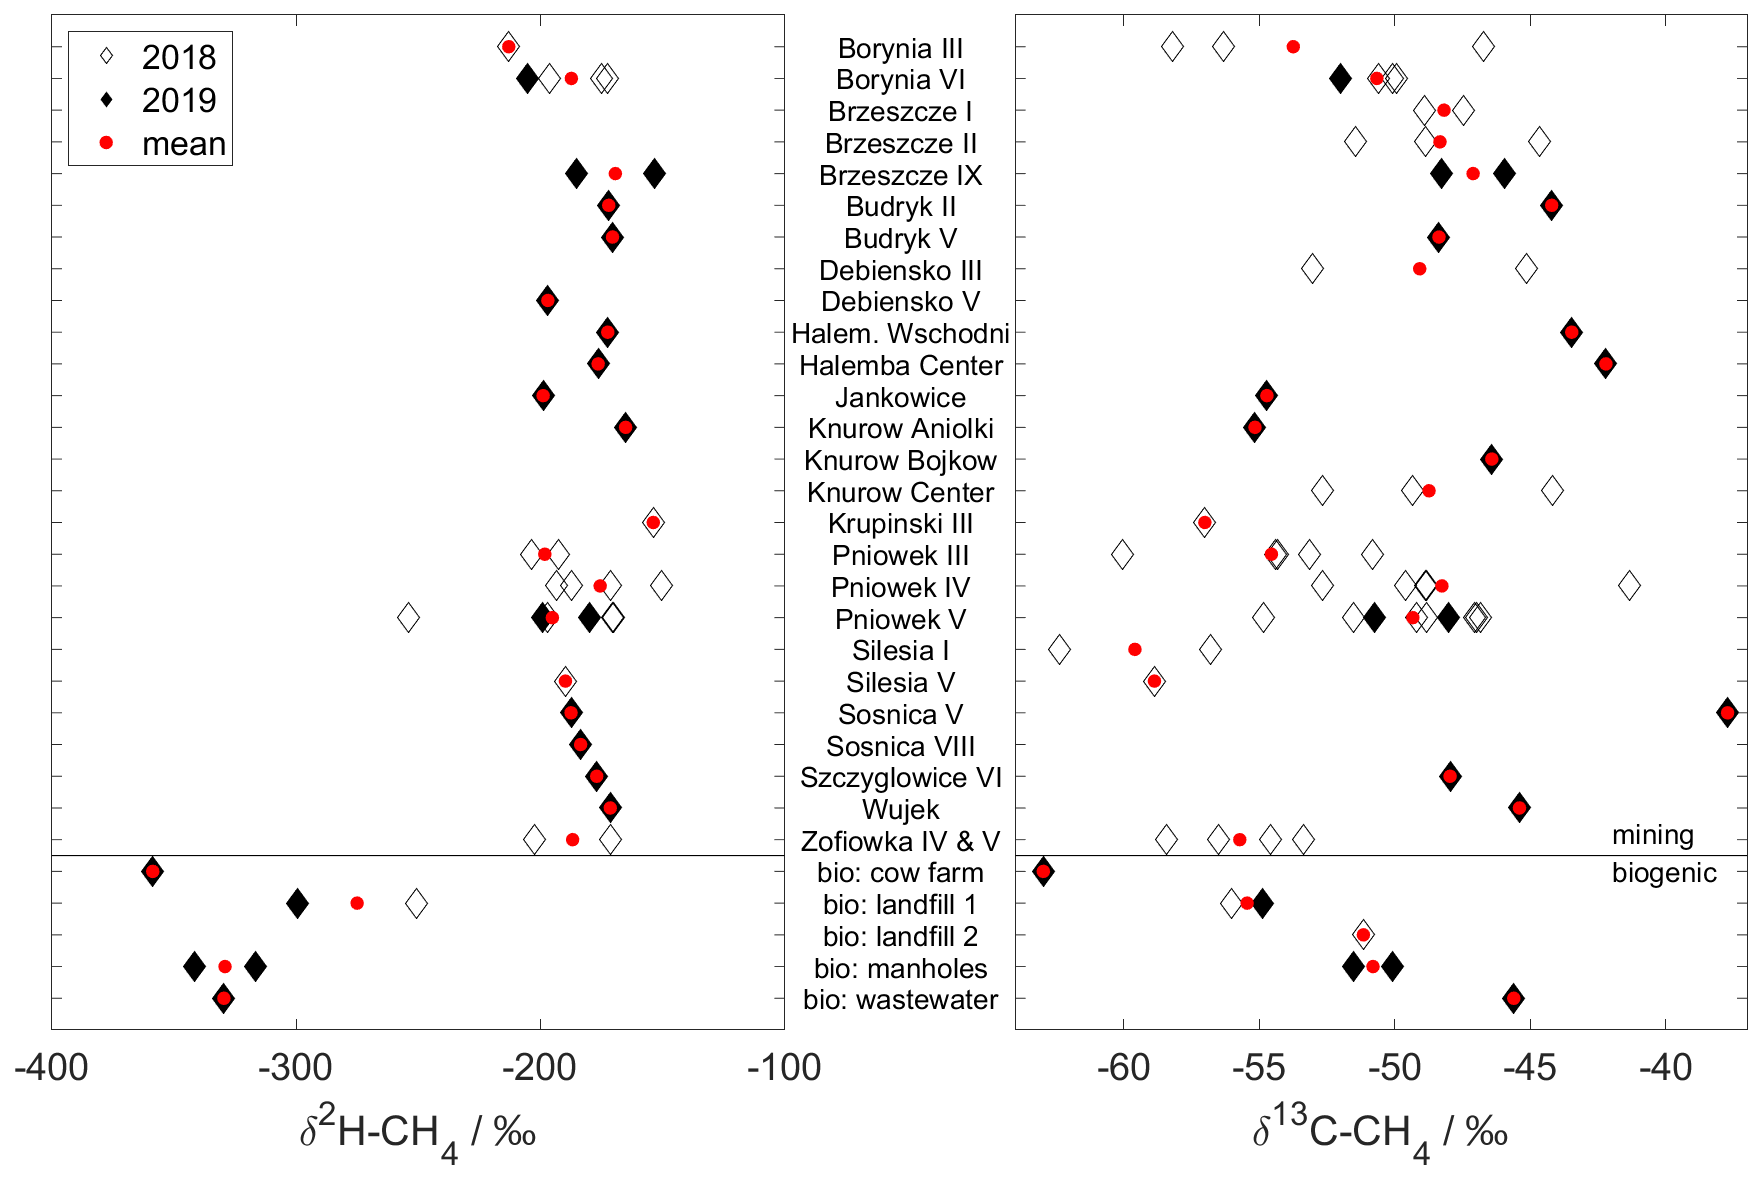
Figure 5Signatures of individual coal mine ventilation shafts from ground samples published in the EMID (Menoud et al., 2022a). Samples were taken on different days during two campaigns in 2018 and 2019. Diamonds show signatures on individual days and circles the mean signature from all days combined.
Coal mine methane isotopic signatures are partly determined by coal attributes like deposition depth or physical parameters of the coal bed. With the comprehensive ground-based dataset, we get a chance to investigate the variability within the USCB. Looking at spatial gradients (Fig. 6) a strong correlation (R=0.66) is found for δ13C along latitude, with southern mines' emissions being more depleted in δ13C. This tendency is also visible in the samples collected on the aircraft (Fig. 4). There is no correlation detectable between δ13C and longitude in ground or aircraft samples. The correlation between δ2H of ground samples and latitude/longitude is moderate and shows the lowest signatures in the south and west. The δ2H source signatures in the PBL derived from aircraft samples also showed that the southwestern region had the lowest δ2H signatures (Fig. 4). In summary, both ground-based individual shaft samples and the airborne sampling of subregions indicate emissions from the south are more depleted in δ13C and those from the southwest are more depleted in δ2H.
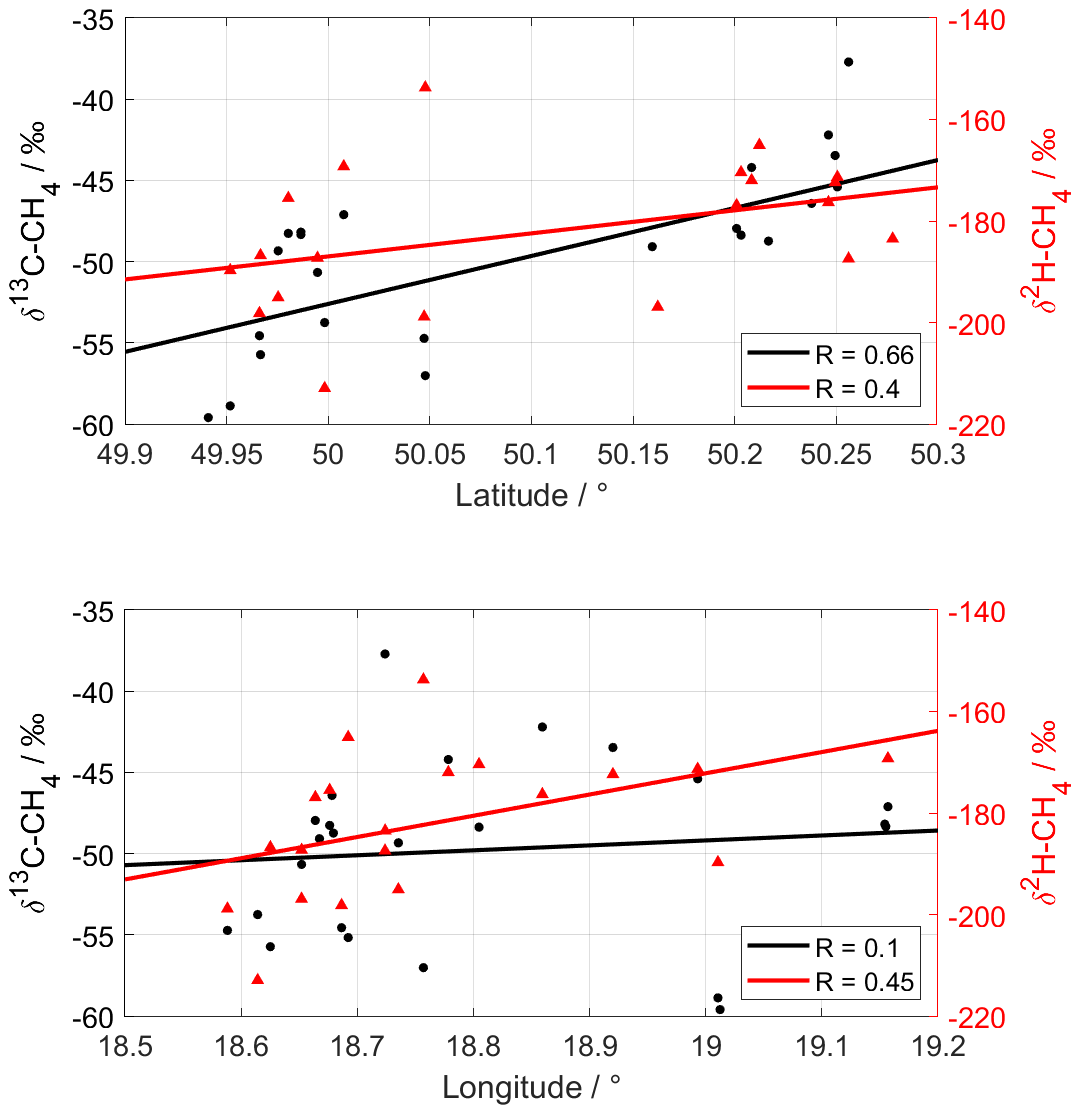
Figure 6Mean coal mine ventilation shaft signatures from the ground-based samples versus latitude and longitude to detect spatial gradients in the signatures within the USCB. In the legend the correlation coefficient is given.
The latitudinal δ13C gradient of the USCB is probably associated with its structural and lithostratigraphic history and generation and migration processes of coalbed gases, mainly methane (Kotarba, 2001; Kotarba and Lewan, 2004). The indigenous coalbed gases in the USCB were generated during the Variscan thermogenic coalification process and subject to intensive degassing to the surface in the following millions of years. In the central and northern parts of the USCB the Mississippian and Pennsylvanian coalbed series are covered only by permeable strata, and degassing continues to the present day, explaining the low methane content of the coals in this region. The conditions in this region are not favorable for recent generation of microbial methane, and the thermogenic component of indigenous gases dominates. In the southern part of the USCB, the coal-bearing strata were sealed with a clayey-sandstone cover during the Miocene. This practically impermeable cover prevented the methane escaping to the surface, and the gas accumulated below this layer, causing the emissions in the mines still to be high. This accumulation shows a lighter δ13C signature probably resulting both from additional gas created through microbial CO2-reduction processes and from fractionation of the indigenous gas during migration (diffusion and adsorption/desorption) to the upper levels (Kotarba, 2001). This explains well the higher, more thermogenic δ13C values in the northern part of the USCB than in the south.
The coal mine methane emissions from the USCB have been isotopically characterized previously (Table 2).
Table 2Overview of literature values of USCB methane emission isotopic signatures with ranges or standard deviations.
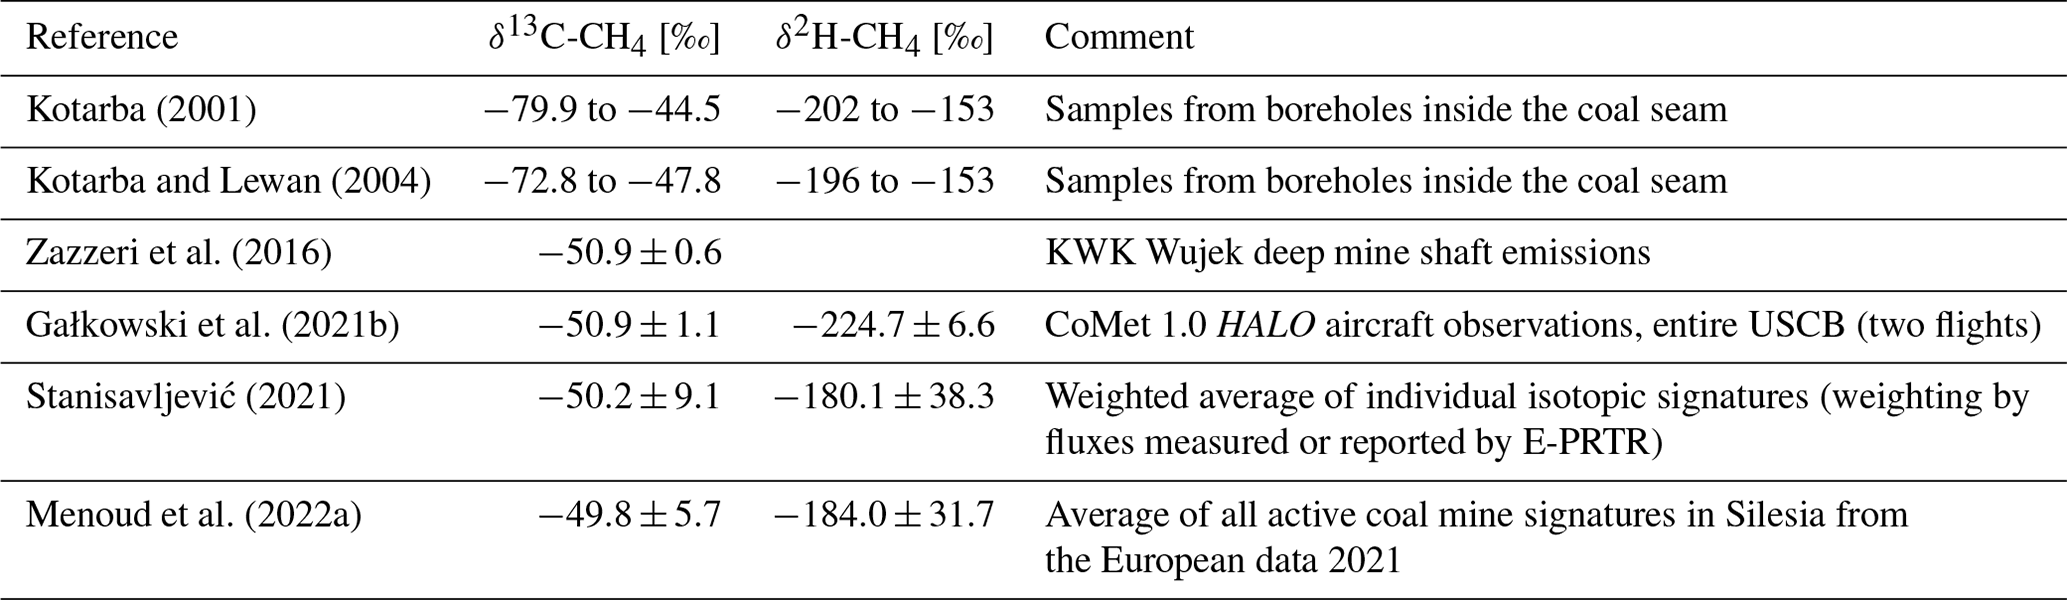
The δ13C signatures of individual shafts presented here are in the upper range and higher than previous signatures found by Kotarba (2001) and Kotarba and Lewan (2004), while δ2H signatures are in the range of previous signatures with some outliers with lower signatures. The ground-based data have an average isotopic signature for all active coal mines of ‰ in δ13C and ‰ in δ2H (Menoud et al., 2022a). This is well centered on the mean shaft signatures but differs from the well-mixed entire USCB methane plume observed on the Cessna aircraft and also the HALO aircraft (Gałkowski et al., 2021b). The two aircraft-derived signatures match very well (Fig. 7) and are shifted towards lower values with respect to the average coal mining signature from the ground observations. This hints at an additional biogenic methane source within the USCB that mixes with the coal mine methane and produces a different signature in the aircraft observations. This source will be evaluated in the next section.
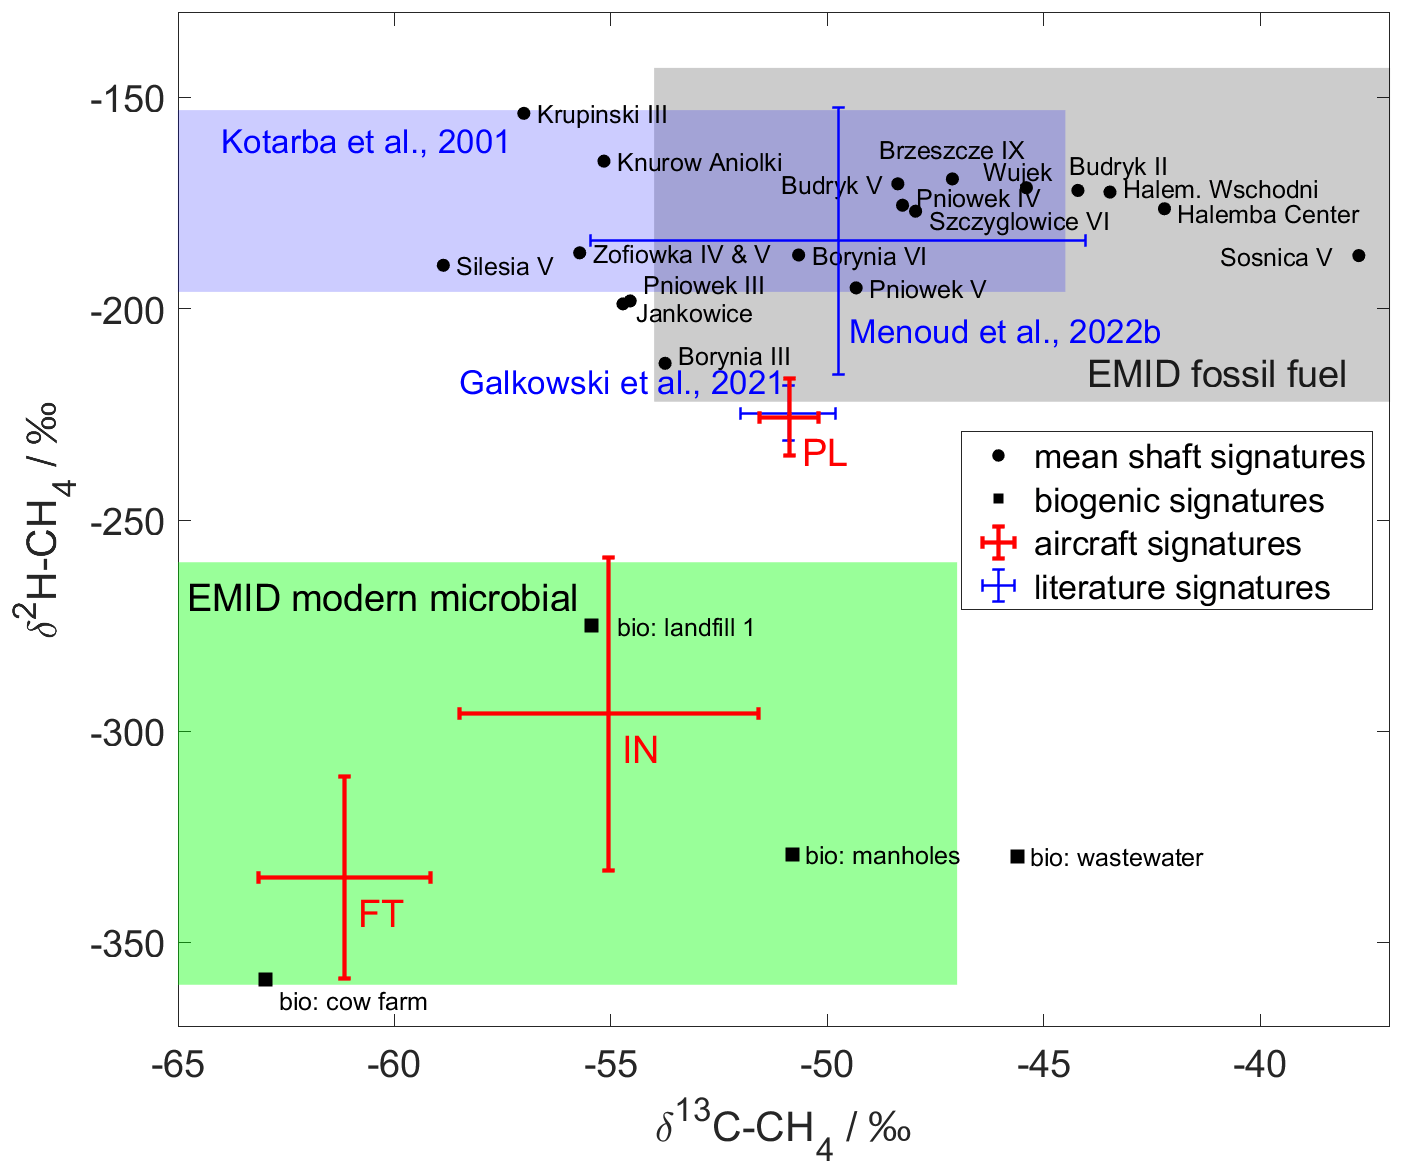
Figure 7Dual isotope plot for signatures of individual facilities together with USCB signatures derived from aircraft for the three regimes – free troposphere (FT), inflow (IN), and outflow/plumes (PL) – and other USCB literature signatures. Error bars denote standard deviations. The blue area shows the range of signatures from free gas inside the coal seam (Kotarba, 2001; Kotarba and Lewan, 2004). Shaded gray and green areas show the range of mean signatures with 1 standard deviation for EMID fossil fuel and modern microbial methane sources, respectively (Menoud et al., 2022b).
3.3 Emission attribution for the USCB
As depicted in Fig. 7, the δ2H signatures of ground samples and airborne samples for methane emissions from the USCB differ significantly. This means that the well-mixed plume sampled in the aircraft has another contributor with a different isotopic signature than the coal mine methane. Considering the location of the two signatures in Fig. 7, this additional source is very likely a biogenic source with a potential contribution from natural gas leakage. Since the USCB is a heavily industrialized region with a sizeable population of around 5 million people and agriculture only plays a minor role in this region, most of the biogenic methane emissions probably originate from the waste sector. This sector includes landfills and wastewater treatment facilities. There is not a lot of information available on the waste sector in the region. There are the Industrial Reporting (IR) (European Energy Agency, 2019) emission database (ED) (formerly E-PRTR), the CoMet v4.01 ED (Gałkowski et al., 2021a), and scientific gridded ED like EDGAR (Crippa et al., 2021; EDGARv6.0, 2021; Monforti Ferrario et al., 2021) and CAMS-REG-GHG (Granier et al., 2019). Within CoMet v4.01 ED, 32 landfill locations are listed. Most of them do not report emissions of CH4 to IR, maybe because they are small and emissions fall below the reporting threshold. Additionally, 24 individual wastewater treatment plants are identified within CoMet v4.01 ED. None was reporting CH4 emissions in 2018. The emissions of the USCB waste sector are not to be considered negligible based on the population size of around 5 million people. The share of this biogenic methane source in the USCB might be determined using the isotopic observations from ground and aircraft using the same approach as in Lu et al. (2021).
Assuming that only biogenic and coal mine emissions contribute to the total methane emission of the USCB, the emissions Fi and the isotopic signatures δi fulfill Eqs. (4) and (5). From their combination follows Eq. (6), which describes the ratio of coal mining and biogenic emissions based on the isotopic signatures.
For our study we apply Eq. (6) to the δ2H signatures, since these allow for higher discrimination than in the case of δ13C (Fig. 7). The observed signatures are ‰ and ‰ (Menoud et al., 2022a). The δ2H signature of biogenic emissions in the USCB is poorly constrained by measurements, because there are only very few observations. The δ2H in methane emitted at one cow farm (−358.7 ‰) is in the typical range of biogenic sources. The one landfill, for which δ2H observations ( ‰) are available, is not in the USCB directly but located close to the city of Kraków. There are no observations from waste water treatment in the USCB; the listed manholes and waste water facility (both −329 ‰) in Fig. 5 are also located in Kraków. For comparison, the EMID includes δ2H signatures from seven landfills ( ‰) and from six wastewater facilities ( ‰) across Europe. The weighted average of the signatures of the two sectors is ‰. The uncertainty was calculated using error propagation. The mean δ2H value used for waste emissions in global modeling is around −300 ‰. Frank (2018) used a value of ‰ for landfill emissions considering signatures from several previous studies.
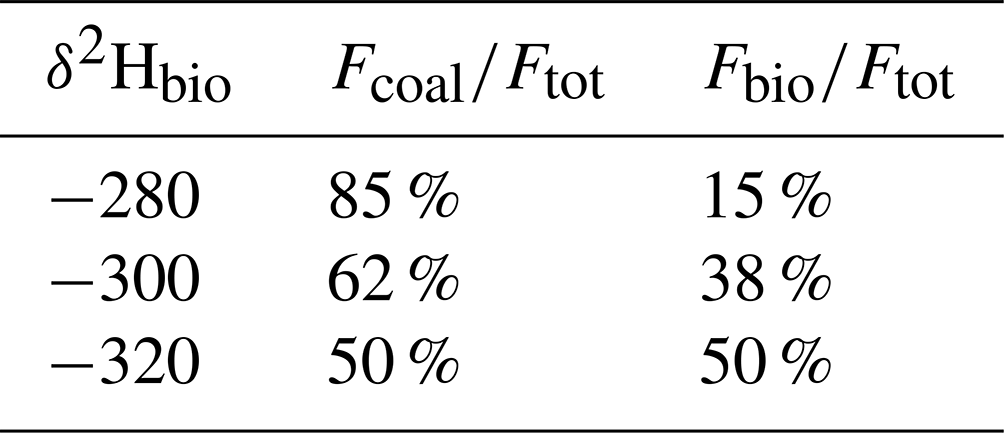
Considering these values, we assume that the USCB signature for waste emissions is ‰ for our study. This is in between the total values from EMID and modeling and considers the uncertainty range from EMID. The total biogenic signature depends on the ratio of emission strengths between the landfills and the wastewater plants. Stronger contribution from the landfills is suspected but cannot be confirmed because of absent reporting or measurements, which would shift the signature towards more positive values. Using Eq. (6), the fraction of coal emissions is 50 %–85 %, and that of biogenic emissions in the USCB is 15 %–50 % (Table 3). Stronger landfill emissions than wastewater plant emissions would shift the ratio toward more coal emissions and less biogenic contribution. The emissions of methane in the USCB are mainly caused by coal mining, but biogenic emissions seem to account for a non-negligible part, too.
Table 3Ratio of coal and biogenic emissions for different assumptions of the signature of biogenic emissions from the USCB.
The gridded emission inventories EDGAR v6.0 and CAMS-REG-GHG v3.1 also provide estimates per sector for anthropogenic emissions. There are uncertainties in the emission inventories of up to 57 % for methane emissions in Europe (Janssens-Maenhout et al., 2019), and, thus, also the sectorial attribution is uncertain. According to these two inventories the methane emissions in the USCB consist of 85 % (CAMS) and 90 % (EDGAR) emissions from fuel exploitation, mainly coal mining, with the remainder split between the waste sector, agriculture, and residential combustion (Fig. 8). For CAMS the estimate of the share of biogenic emissions is at the lower end of the result of our isotopic analysis or would be consistent with a signature of around −280 ‰. EDGAR clearly seems to underestimate biogenic emissions with only a 6 % share. This underestimation has also been noted for the Berlin metropolitan area (Klausner et al., 2020). Interestingly though, EDGAR does discriminate between landfill and wastewater emissions and gives a ratio of roughly 1:1 for the USCB. The CoMet v4.01 emission inventory (Gałkowski et al., 2021a) contains the locations of 32 landfills and 24 waste water treatment plants in the USCB. Only 11 of these landfills listed emissions in the Industrial Reporting database (European Energy Agency, 2019) in 2018. Their emission sum for 2018 is 2.8 kt CH4 yr−1, about 0.4 % of the total USCB emissions from inventory data. The other 12 landfills were visually detected via Google Earth and are not listed in the E-PRTR. Landfills with cogeneration power units do not report data to E-PRTR and assume that they emit less than the reporting threshold. Similarly, the 24 detected waste water treatment plants in the USCB do not report to the E-PRTR either.
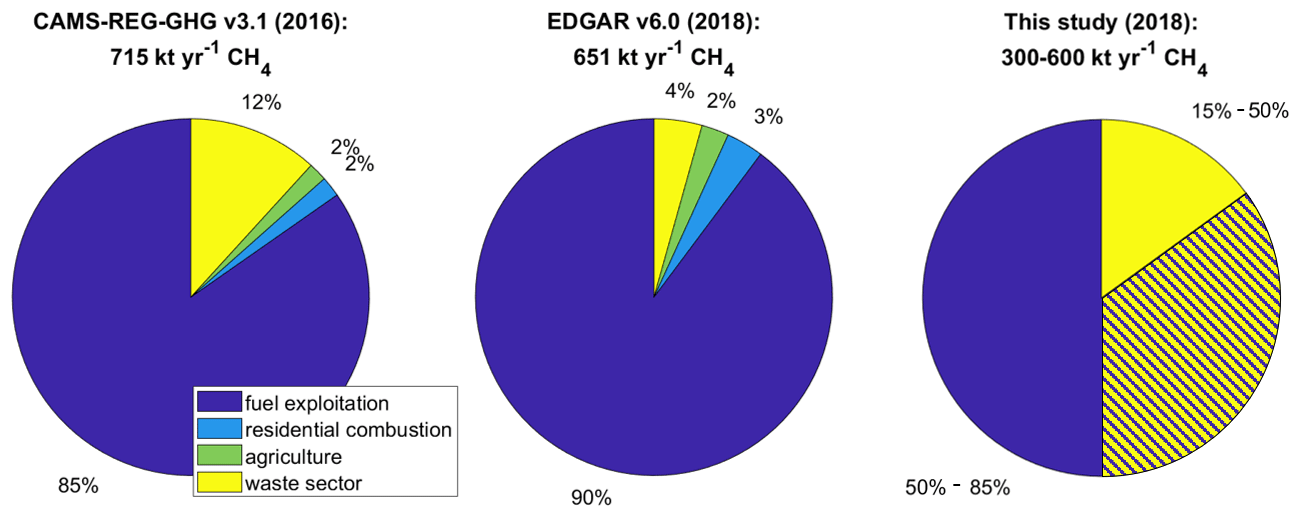
Figure 8Sectorial partitioning of methane emissions from the USCB according to CAMS-REG-GHG v3.1 (2016) and EDGAR v6.0 (2018) emission inventories. Emissions were averaged over an area from 18.0–19.6∘ E and 49.6–50.5∘ N. The total emissions for our study are derived via airborne mass balance during the CoMet 1.0 campaign (Fiehn et al., 2020). The yellow–blue-shaded area indicates the uncertainty of the present data.
From the isotopic partitioning analysis, assuming a signature between −320 ‰ and −280 ‰, anthropogenic biogenic emission in the USCB is 15 %–50 % of CH4 emissions and, thus, seems to be underestimated in heavily populated industrial regions in gridded and point source emission inventories.
In times of rising atmospheric concentrations of greenhouse gases and with countries trying to reduce their associated emissions, it is important to locate, quantify, and mitigate emissions of greenhouse gases due to anthropogenic activities. Differences in CH4 isotopic source signatures δ13C and δ2H can help to constrain different source contributions (e.g., fossil, thermogenic, or biogenic). In the Upper Silesian Coal Basin, which represents one of the largest European CH4 source regions, methane is emitted from more than 50 ventilation shafts of the underground mines. But as a heavily industrialized area with around 5 million inhabitants, there is probably also a considerable contribution from the waste sector.
During the CoMet (Carbon Dioxide and Methane Mission) campaign in June 2018, methane observations were conducted from a variety of platforms including aircraft and cars. Besides the continuous sampling of atmospheric methane concentration, numerous spot air samples were taken from inside the ventilation shafts, in their vicinity (1–2 km distance) and aboard the DLR Cessna Caravan aircraft, and analyzed in the laboratory for the isotopic composition of CH4. Isotopic source signatures of δ13C and δ2H were determined using the Keeling method.
The airborne samples were divided into three categories according to the sampling location: free troposphere and inflow and outflow/plumes within the boundary layer. Mean isotopic source signatures were determined for all three categories. The free-troposphere methane originates from biogenic sources with a clear signature of ‰ δ13C and ‰ δ2H. The signature of all inflow samples of ‰ δ13C and ‰ δ2H shows that the methane enhancements in the upwind boundary layer are mostly biogenic, but with an additional fossil influence. Due to prevailing easterly winds during the campaign, this result applies to sources to the east of the USCB. Samples collected in the boundary layer from a well-mixed plume downwind of the USCB enabled the accurate determination of the signature of the entire USCB region, equal to ‰ δ13C and ‰ δ2H. This is in between the range of typical microbial and thermogenic coal reservoirs but more depleted in δ2H than previous USCB studies reported based on samples taken within the mines. Source signatures could also be determined for the individual flights of the campaign, which focused on emissions from individual subregions. From the ground-based samples we determined the source signatures of individual ventilation shafts. Their signatures vary strongly from mine to mine and even shaft to shaft and over time. A regional gradient in the signatures of subregions of the USCB is reflected both in the aircraft data and in the ground samples, with emissions from the southwest being most depleted in δ13C and δ2H. The high variability of signatures and the regional gradient reflect the geographical structure of the USCB and the generation and migration processes of CH4. Different layers of the USCB coal contain thermogenic methane, with is isotopically similar to natural gas, and methane formed through biogenic carbonate reduction. The signatures vary depending on the location of the mine and what layer of coal is mined at the time of sampling. The average signature from the ventilation shafts of ‰ in δ13C and ‰ in δ2H clearly differs from the total regional signature in δ2H and makes a source apportionment between coal mine and other emissions possible. This would not be possible with only the δ13C-CH4 signatures, because the coal methane signatures vary considerably in δ13C and are both above and below the isotopic composition of air. We assume that the regional plume mainly contains coal mine methane and biogenic methane from waste treatment and a signature between −320 ‰ and −280 ‰. Emissions from agriculture were assumed to be negligible and excluded from the estimate. The differences in δ2H signatures from airborne and ground-based averages then imply that the emissions of methane in the USCB are mainly caused by coal mining, but biogenic emissions seem to account for a significant part of 15 %–50 % as well. The large uncertainty range of this result is caused by the uncertainty of the exact isotopic signature of the biogenic source, which in turn results from the small number of biogenic samples and the uncertainty of emission distributions between landfills and wastewater treatment facilities. The contribution of biogenic methane is underestimated in the point source and gridded emissions inventories E-PRTR, CAMS-REG, and EDGAR, which give biogenic fractions of 0.4 %–14 % for this region. The inventories seem to generally underestimate emissions from the waste sector in heavily populated industrial regions.
This study confirms the importance of δ2H-CH4 observations for methane source apportionment, as reported in previous recent studies (e.g., Townsend-Small et al., 2016; Fernandez et al., 2022). This is especially true in regions with a mix of thermogenic and biogenic sources and large variations in the δ13C signature of one sector. These results should be corroborated with more observations of signatures in the USCB and other population centers.
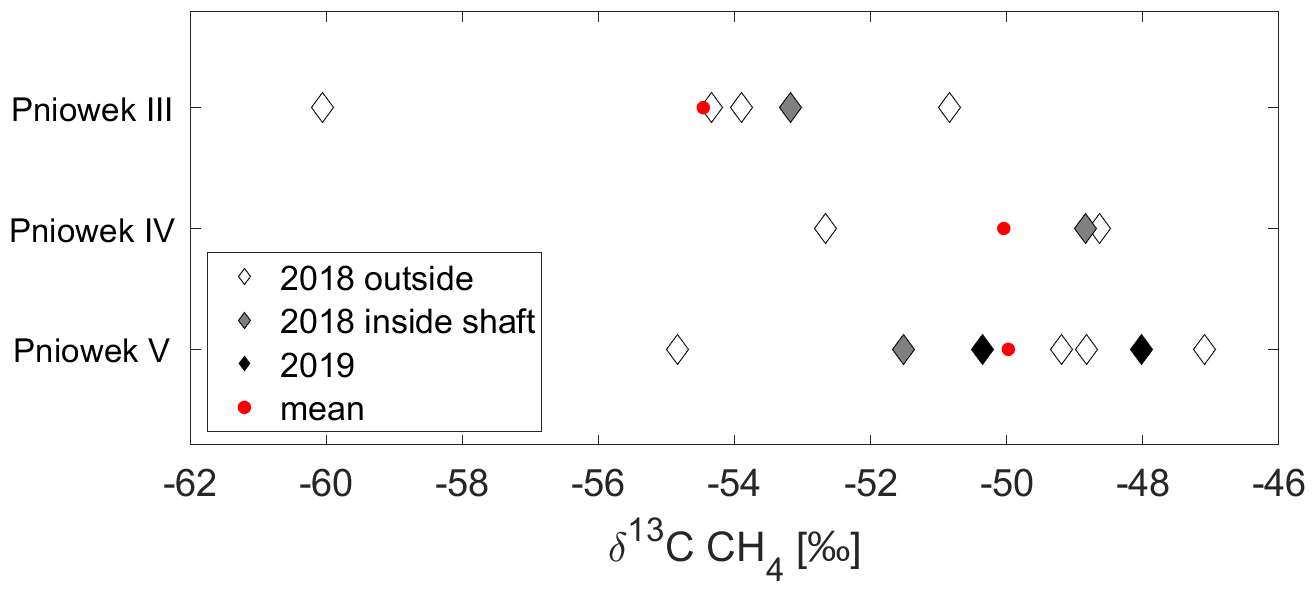
Figure A1Comparison of coal mine signatures from samples taken outside and inside the ventilation shafts.
The data are stored on the HALO database (Fiehn et al., 2023a) and are publicly available on Zenodo: https://doi.org/10.5281/zenodo.10046132 (Fiehn et al., 2023b).
AlF, ME, and JK collected the air samples on the Cessna Caravan. MG and CG measured and analyzed the airborne samples. AlF interpreted the data and wrote the manuscript. TR coordinated the deployment of ground-based measurements and helped with data evaluation and interpretation. MM, HM, MaS, PK, JN, MiS, and JS conducted ground-based in situ measurements in the field during the campaign and collected and shared the data. AnF coordinated all CoMet campaign contributions. AR developed the research idea and coordinated the CoMet Cessna campaign operations. All authors contributed to the interpretation of the results and the improvement of the manuscript.
At least one of the (co-)authors is a member of the editorial board of Atmospheric Chemistry and Physics. The peer-review process was guided by an independent editor, and the authors also have no other competing interests to declare.
Publisher's note: Copernicus Publications remains neutral with regard to jurisdictional claims made in the text, published maps, institutional affiliations, or any other geographical representation in this paper. While Copernicus Publications makes every effort to include appropriate place names, the final responsibility lies with the authors.
This article is part of the special issue “CoMet: a mission to improve our understanding and to better quantify the carbon dioxide and methane cycles”. It is not associated with a conference.
The authors especially thank DLR Flight Experiments (DLR-FX) for the campaign cooperation, especially the pilots Thomas van Marwick and Philipp Weber and the group of Ralph Helmes, Andreas Giez, Martin Zöger, and Martin Sedlmeir. We would also like to kindly thank all members of IsoLab and GasLab at MPI-BGC in Jena for their work in analyses of CoMet airborne samples, especially Armin Jordan and Heiko Moossen. We thank Maciej Kotarba for valuable help with the discussion of USCB geography and coalbed gases. CAMS-REG-GHG v3.1 was provided through Emissions of atmospheric Compounds and Compilation of Ancillary Data (ECCAD).
The young investigator research group Greenhouse Gases has been funded by the DLR Board of Directors for Space Research and Technology (DLR VO-R). The CoMet campaign was funded by the Bundesministerium für Bildung und Forschung through AIRSPACE and co-sponsored by the Deutsche Forschungsgemeinschaft within DFG Priority Program SPP 1294 “Atmospheric and Earth System Research with the Research Aircraft HALO” (High Altitude and Long Range Research Aircraft). The ground-based measurements on vehicles were funded by the European Union's Horizon 2020 research and innovation program under the Marie Skłodowska-Curie ITN project “Methane goes Mobile – Measurements and Modelling” (MEMO2; https://h2020-memo2.eu/, last access: 8 December 2023). A part of the research results presented in this paper have been developed with the use of equipment also financed from the funds of the “Excellence Initiative – Research University” program at AGH University of Kraków.
The article processing charges for this open-access publication were covered by the German Aerospace Center (DLR).
This paper was edited by Farahnaz Khosrawi and reviewed by Amy Townsend-Small and two anonymous referees.
Andersen, T., Scheeren, B., Peters, W., and Chen, H.: A UAV-based active AirCore system for measurements of greenhouse gases, Atmos. Meas. Tech., 11, 2683–2699, https://doi.org/10.5194/amt-11-2683-2018, 2018.
Andersen, T., Vinkovic, K., de Vries, M., Kers, B., Necki, J., Swolkien, J., Roiger, A., Peters, W., and Chen, H.: Quantifying methane emissions from coal mining ventilation shafts using an unmanned aerial vehicle (UAV)-based active AirCore system, Atmospheric Environment: X, 12, 100135, https://doi.org/10.1016/j.aeaoa.2021.100135, 2021.
Andersen, T., Zhao, Z., de Vries, M., Necki, J., Swolkien, J., Menoud, M., Röckmann, T., Roiger, A., Fix, A., Peters, W., and Chen, H.: Local-to-regional methane emissions from the Upper Silesian Coal Basin (USCB) quantified using UAV-based atmospheric measurements, Atmos. Chem. Phys., 23, 5191–5216, https://doi.org/10.5194/acp-23-5191-2023, 2023.
Basu, S., Lan, X., Dlugokencky, E., Michel, S., Schwietzke, S., Miller, J. B., Bruhwiler, L., Oh, Y., Tans, P. P., Apadula, F., Gatti, L. V., Jordan, A., Necki, J., Sasakawa, M., Morimoto, S., Di Iorio, T., Lee, H., Arduini, J., and Manca, G.: Estimating emissions of methane consistent with atmospheric measurements of methane and δ13C of methane, Atmos. Chem. Phys., 22, 15351–15377, https://doi.org/10.5194/acp-22-15351-2022, 2022.
Brownlow, R., Lowry, D., Fisher, R. E., France, J. L., Lanoisellé, M., White, B., Wooster, M. J., Zhang, T., and Nisbet, E. G.: Isotopic Ratios of Tropical Methane Emissions by Atmospheric Measurement, Global Biogeochem. Cy., 31, 1408–1419, https://doi.org/10.1002/2017GB005689, 2017.
Crippa, M., Guizzardi, D., Solazzo, E., Muntean, M., Schaaf, E., Monforti-Ferrario, F., Banja, M., Olivier, J. G. J., Grassi, G., Rossi, S., and Vignati, E.: GHG emissions of all world countries – 2021 Report, Publications Office of the European Union, Luxembourg, EUR 30831 EN, https://doi.org/10.2760/173513, 2021.
DLR (German Aerospace Center): HALO database, https://halo-db.pa.op.dlr.de/, last access: 26 October 2023.
Dlugokencky, E.: Trends in Atmospheric Methane, Global CH4 Monthly Means, NOAA/GML, https://gml.noaa.gov/ccgg/trends_ch4/, last access: 10 August 2022.
Dlugokencky, E. J., Nisbet, E. G., Fisher, R., and Lowry, D.: Global atmospheric methane: budget, changes and dangers, Philos. T. Roy. Soc. A, 369, 2058–2072, https://doi.org/10.1098/rsta.2010.0341, 2011.
EDGARv6.0: Emissions Database for Global Atmospheric Research, Global Greenhouse Gas Emissions, EDGAR v6.0, https://edgar.jrc.ec.europa.eu/index.php/dataset_ghg60 (last access: 8 December 2023), 2021.
Etminan, M., Myhre, G., Highwood, E. J., and Shine, K. P.: Radiative forcing of carbon dioxide, methane, and nitrous oxide: A significant revision of the methane radiative forcing, Geophys. Res. Lett., 43, 12614–12623, https://doi.org/10.1002/2016gl071930, 2016.
European Commission and Directorate-General for Energy: Proposal for a regulation of the European parliament and of the council on methane emissions reduction in the energy sector and amending Regulation (EU) 2019/942, Brussels, https://eur-lex.europa.eu/legal-content/en/ALL/?uri=CELEX:52021PC0805 (last access: 11 December 2023), 2021.
European Commission and United States of America: Global Methan Pledge, Glasgow, Scotland, https://www.globalmethanepledge.org/ (last access: 8 December 2023), 2021.
European Energy Agency (EEA): European Pollutant Release and Transfer Register (E-PRTR), https://www.eea.europa.eu/ds_resolveuid/c4cfc578a7cc42f38a513e04f7ee0c59, last access: 20 September 2019.
Fernandez, J. M., Maazallahi, H., France, J. L., Menoud, M., Corbu, M., Ardelean, M., Calcan, A., Townsend-Small, A., van der Veen, C., Fisher, R. E., Lowry, D., Nisbet, E. G., and Röckmann, T.: Street-level methane emissions of Bucharest, Romania and the dominance of urban wastewater, Atmospheric Environment: X, 13, 100153, https://doi.org/10.1016/j.aeaoa.2022.100153, 2022.
Fiehn, A., Kostinek, J., Eckl, M., Klausner, T., Gałkowski, M., Chen, J., Gerbig, C., Röckmann, T., Maazallahi, H., Schmidt, M., Korbeń, P., Neçki, J., Jagoda, P., Wildmann, N., Mallaun, C., Bun, R., Nickl, A.-L., Jöckel, P., Fix, A., and Roiger, A.: Estimating CH4, CO2 and CO emissions from coal mining and industrial activities in the Upper Silesian Coal Basin using an aircraft-based mass balance approach, Atmos. Chem. Phys., 20, 12675–12695, https://doi.org/10.5194/acp-20-12675-2020, 2020.
Fiehn, A., Galkowski, M., Rothe, M., Jordan, A., Moossen, H., and Gerbig, C.: #9614 | FDLR_FLASKS_CoMet_2018.ames, Release 1, HALO database [data set], https://doi.org/10.17616/R39Q0T, 2023a.
Fiehn, A., Gałkowski, M., Rothe, M., Jordan, A., Moossen, H., and Gerbig, C.: Flask sampling data obtained during the CoMet campaign in summer 2018 over Silesia on DLR Cessna, Zenodo [data set], https://doi.org/10.5281/zenodo.10046132, 2023b.
Fisher, R. E., France, J. L., Lowry, D., Lanoisellé, M., Brownlow, R., Pyle, J. A., Cain, M., Warwick, N., Skiba, U. M., Drewer, J., Dinsmore, K. J., Leeson, S. R., Bauguitte, S. J.-B., Wellpott, A., O'Shea, S. J., Allen, G., Gallagher, M. W., Pitt, J., Percival, C. J., Bower, K., George, C., Hayman, G. D., Aalto, T., Lohila, A., Aurela, M., Laurila, T., Crill, P. M., McCalley, C. K., and Nisbet, E. G.: Measurement of the 13C isotopic signature of methane emissions from northern European wetlands, Global Biogeochem. Cy., 31, 605–623, https://doi.org/10.1002/2016gb005504, 2017.
Fix, A., Amediek, A., Bovensmann, H., Ehret, G., Gerbig, C., Gerilowski, K., Pfeilsticker, K., Roiger, A., and Zöger, M.: CoMet: an airborne mission to simultaneously measure CO2 and CH4 using lidar, passive remote sensing, and in-situ techniques, EPJ Web Conf., 176, 02003, https://doi.org/10.1051/epjconf/201817602003, 2018.
Frank, F.: Atmospheric methane and its isotopic composition in a changing climate: A modeling study, PhD thesis, Fakultät für Physik, Ludwig-Maximilians-Universität München, München, 204 pp., ISSN 1434-8454, ISRN DLR-FB–2018-20, 2018.
Gałkowski, M., Fiehn, A., Swolkien, J., Stanisavljevic, M., Korben, P., Menoud, M., Necki, J., Roiger, A., Röckmann, T., Gerbig, C., and Fix, A.: Emissions of CH4 and CO2 over the Upper Silesian Coal Basin (Poland) and its vicinity, ICOS ERIC – Carbon Portal [data set], https://doi.org/10.18160/3K6Z-4H73, 2021a.
Gałkowski, M., Jordan, A., Rothe, M., Marshall, J., Koch, F.-T., Chen, J., Agusti-Panareda, A., Fix, A., and Gerbig, C.: In situ observations of greenhouse gases over Europe during the CoMet 1.0 campaign aboard the HALO aircraft, Atmos. Meas. Tech., 14, 1525–1544, https://doi.org/10.5194/amt-14-1525-2021, 2021b.
Ganesan, A. L., Schwietzke, S., Poulter, B., Arnold, T., Lan, X., Rigby, M., Vogel, F. R., van der Werf, G. R., Janssens-Maenhout, G., Boesch, H., Pandey, S., Manning, A. J., Jackson, R. B., Nisbet, E. G., and Manning, M. R.: Advancing Scientific Understanding of the Global Methane Budget in Support of the Paris Agreement, Global Biogeochem. Cy., 33, 1475–1512, https://doi.org/10.1029/2018gb006065, 2019.
Granier, C., Darras, S., Denier van der Gon, H., Doubalova, J., Elguindi, N., Galle, B., Gauss, M., Guevara, M., Jalkanen, J.-P., Kuenen, J., Liousse, C., Quack, B., Simpson, D., and Sindelarova, K.: The Copernicus Atmosphere Monitoring Service global and regional emissions (April 2019 version), Research Report, hal-02322431, https://doi.org/10.24380/d0bn-kx16, 2019.
Hoheisel, A., Yeman, C., Dinger, F., Eckhardt, H., and Schmidt, M.: An improved method for mobile characterisation of δ13CH4 source signatures and its application in Germany, Atmos. Meas. Tech., 12, 1123–1139, https://doi.org/10.5194/amt-12-1123-2019, 2019.
International Energy Agency: Poland, https://www.iea.org/countries/poland, last access: 9 June 2022.
Janssens-Maenhout, G., Crippa, M., Guizzardi, D., Muntean, M., Schaaf, E., Dentener, F., Bergamaschi, P., Pagliari, V., Olivier, J. G. J., Peters, J. A. H. W., van Aardenne, J. A., Monni, S., Doering, U., Petrescu, A. M. R., Solazzo, E., and Oreggioni, G. D.: EDGAR v4.3.2 Global Atlas of the three major greenhouse gas emissions for the period 1970–2012, Earth Syst. Sci. Data, 11, 959–1002, https://doi.org/10.5194/essd-11-959-2019, 2019.
Keeling, C. D.: The concentration and isotopic abundances of atmospheric carbon dioxide in rural areas, Geochim. Cosmochim. Ac., 13, 322–334, 1958.
Kholod, N., Evans, M., Pilcher, R. C., Roshchanka, V., Ruiz, F., Coté, M., and Collings, R.: Global methane emissions from coal mining to continue growing even with declining coal production, J. Clean. Prod., 256, 120489, https://doi.org/10.1016/j.jclepro.2020.120489, 2020.
Klausner, T., Mertens, M., Huntrieser, H., Baumann, R., Galkowski, M., Kuhlmann, G., Fiehn, A., Jöckel, P., Pühl, M., and Roiger, A.: Urban greenhouse gas emissions from the Berlin area: A case study on aircraft-based CO2 and CH4 in situ observations in summer 2018, Elem. Sci. Anth., 8, 15, https://doi.org/10.1525/elementa.411, 2020.
Korbeń, P.: Estimation of methane emissions and investigation of isotopic composition of methane from selected sources in Germany, Poland and Romania, Doctor of Natural Sciences, Combined Faculty of Natural Sciences and Mathematics, Heidelberg University, Heidelberg, Germany, 157 pp., https://doi.org/10.11588/heidok.00030547, 2021.
Kostinek, J., Roiger, A., Eckl, M., Fiehn, A., Luther, A., Wildmann, N., Klausner, T., Fix, A., Knote, C., Stohl, A., and Butz, A.: Estimating Upper Silesian coal mine methane emissions from airborne in situ observations and dispersion modeling, Atmos. Chem. Phys., 21, 8791–8807, https://doi.org/10.5194/acp-21-8791-2021, 2021.
Kotarba, M. J.: Composition and origin of coalbed gases in the Upper Silesian and Lublin basins, Poland, Org. Geochem., 32, 163–180, https://doi.org/10.1016/S0146-6380(00)00134-0, 2001.
Kotarba, M. J. and Lewan, M. D.: Characterizing thermogenic coalbed gas from Polish coals of different ranks by hydrous pyrolysis, Org. Geochem., 35, 615–646, https://doi.org/10.1016/j.orggeochem.2003.12.001, 2004.
Kotarba, M. J., Clayton, J. L., Rice, D. D., and Wagner, M.: Assessment of hydrocarbon source rock potential of Polish bituminous coals and carbonaceous shales, Chem. Geol., 184, 11–35, https://doi.org/10.1016/S0009-2541(01)00350-3, 2002.
Krautwurst, S., Gerilowski, K., Borchardt, J., Wildmann, N., Gałkowski, M., Swolkień, J., Marshall, J., Fiehn, A., Roiger, A., Ruhtz, T., Gerbig, C., Necki, J., Burrows, J. P., Fix, A., and Bovensmann, H.: Quantification of CH4 coal mining emissions in Upper Silesia by passive airborne remote sensing observations with the Methane Airborne MAPper (MAMAP) instrument during the CO2 and Methane (CoMet) campaign, Atmos. Chem. Phys., 21, 17345–17371, https://doi.org/10.5194/acp-21-17345-2021, 2021.
Lan, X., Basu, S., Schwietzke, S., Bruhwiler, L. M. P., Dlugokencky, E. J., Michel, S. E., Sherwood, O. A., Tans, P. P., Thoning, K., Etiope, G., Zhuang, Q., Liu, L., Oh, Y., Miller, J. B., Pétron, G., Vaughn, B. H., and Crippa, M.: Improved Constraints on Global Methane Emissions and Sinks Using δ13C-CH4, Global Biogeochem. Cy., 35, e2021GB007000, https://doi.org/10.1029/2021GB007000, 2021.
Lu, X., Harris, S. J., Fisher, R. E., France, J. L., Nisbet, E. G., Lowry, D., Röckmann, T., van der Veen, C., Menoud, M., Schwietzke, S., and Kelly, B. F. J.: Isotopic signatures of major methane sources in the coal seam gas fields and adjacent agricultural districts, Queensland, Australia, Atmos. Chem. Phys., 21, 10527–10555, https://doi.org/10.5194/acp-21-10527-2021, 2021.
Menoud, M., van der Veen, C., Necki, J., Bartyzel, J., Szénási, B., Stanisavljević, M., Pison, I., Bousquet, P., and Röckmann, T.: Methane (CH4) sources in Krakow, Poland: insights from isotope analysis, Atmos. Chem. Phys., 21, 13167–13185, https://doi.org/10.5194/acp-21-13167-2021, 2021.
Menoud, M., van der Veen, C., Lowry, D., Fernandez, J. M., Bakkaloglu, S., France, J. L., Fisher, R. E., Maazallahi, H., Stanisavljević, M., Nęcki, J., Vinkovic, K., Łakomiec, P., Rinne, J., Korbeń, P., Schmidt, M., Defratyka, S., Yver-Kwok, C., Andersen, T., Chen, H., and Röckmann, T.: European Methane Isotope Database Coupled with a Global Inventory of Fossil and Non-Fossil δ13C- and δ2H-CH4 Source Signature Measurements: V2.0.0, Data publication platform of Utrecht University [data set], https://doi.org/10.24416/UU01-YP43IN, 2022a.
Menoud, M., van der Veen, C., Lowry, D., Fernandez, J. M., Bakkaloglu, S., France, J. L., Fisher, R. E., Maazallahi, H., Stanisavljević, M., Nȩcki, J., Vinkovic, K., Łakomiec, P., Rinne, J., Korbeń, P., Schmidt, M., Defratyka, S., Yver-Kwok, C., Andersen, T., Chen, H., and Röckmann, T.: New contributions of measurements in Europe to the global inventory of the stable isotopic composition of methane, Earth Syst. Sci. Data, 14, 4365–4386, https://doi.org/10.5194/essd-14-4365-2022, 2022b.
Miller, J. B. and Tans, P. P.: Calculating isotopic fractionation from atmospheric measurements at various scales, Tellus B, 55, 207–214, https://doi.org/10.3402/tellusb.v55i2.16697, 2003.
Monforti Ferrario, F., Crippa, M., Guizzardi, D., Muntean, M., Schaaf, E., Lo Vullo, E., Solazzo, E., Olivier, J., and Vignati, E.: EDGAR v6.0 Greenhouse Gas Emissions, European Commission, Joint Research Centre (JRC) [data set], PID: http://data.europa.eu/89h/97a67d67-c62e-4826-b873-9d972c4f670b (last access: 8 December 2023), 2021.
Nisbet, E. G., Dlugokencky, E. J., and Bousquet, P.: Methane on the Rise – Again, Science, 343, 493–495, https://doi.org/10.1126/science.1247828, 2014.
Nisbet, E. G., Dlugokencky, E. J., Manning, M. R., Lowry, D., Fisher, R. E., France, J. L., Michel, S. E., Miller, J. B., White, J. W. C., Vaughn, B., Bousquet, P., Pyle, J. A., Warwick, N. J., Cain, M., Brownlow, R., Zazzeri, G., Lanoisellé, M., Manning, A. C., Gloor, E., Worthy, D. E. J., Brunke, E.-G., Labuschagne, C., Wolff, E. W., and Ganesan, A. L.: Rising atmospheric methane: 2007–2014 growth and isotopic shift, Global Biogeochem. Cy., 30, 1356–1370, https://doi.org/10.1002/2016gb005406, 2016.
Nisbet, E. G., Manning, M. R., Dlugokencky, E. J., Fisher, R. E., Lowry, D., Michel, S. E., Myhre, C. L., Platt, S. M., Allen, G., Bousquet, P., Brownlow, R., Cain, M., France, J. L., Hermansen, O., Hossaini, R., Jones, A. E., Levin, I., Manning, A. C., Myhre, G., Pyle, J. A., Vaughn, B. H., Warwick, N. J., and White, J. W. C.: Very Strong Atmospheric Methane Growth in the 4 Years 2014–2017: Implications for the Paris Agreement, Global Biogeochem. Cy., 33, 318–342, https://doi.org/10.1029/2018GB006009, 2019.
Nisbet, E. G., Fisher, R. E., Lowry, D., France, J. L., Allen, G., Bakkaloglu, S., Broderick, T. J., Cain, M., Coleman, M., Fernandez, J., Forster, G., Griffiths, P. T., Iverach, C. P., Kelly, B. F. J., Manning, M. R., Nisbet-Jones, P. B. R., Pyle, J. A., Townsend-Small, A., al-Shalaan, A., Warwick, N., and Zazzeri, G.: Methane Mitigation: Methods to Reduce Emissions, on the Path to the Paris Agreement, Rev. Geophys., 58, e2019RG000675, https://doi.org/10.1029/2019RG000675, 2020.
Pataki, D. E., Ehleringer, J. R., Flanagan, L. B., Yakir, D., Bowling, D. R., Still, C. J., Buchmann, N., Kaplan, J. O., and Berry, J. A.: The application and interpretation of Keeling plots in terrestrial carbon cycle research, Global Biogeochem. Cy., 17, 1022, https://doi.org/10.1029/2001GB001850, 2003.
Rice, A. L., Butenhoff, C. L., Teama, D. G., Röger, F. H., Khalil, M. A. K., and Rasmussen, R. A.: Atmospheric methane isotopic record favors fossil sources flat in 1980s and 1990s with recent increase, P. Natl. Acad. Sci. USA, 113, 10791–10796, https://doi.org/10.1073/pnas.1522923113, 2016.
Rice, D. D.: Composition and Origins of Coalbed Gas, in: SG 38: Hydrocarbons from Coal, American Association of Petroleum Geologists, Tulsa, OK, United States, 159–184, https://doi.org/10.1306/St38577, 1993.
Rigby, M., Montzka, S. A., Prinn, R. G., White, J. W. C., Young, D., O'Doherty, S., Lunt, M. F., Ganesan, A. L., Manning, A. J., Simmonds, P. G., Salameh, P. K., Harth, C. M., Mühle, J., Weiss, R. F., Fraser, P. J., Steele, L. P., Krummel, P. B., McCulloch, A., and Park, S.: Role of atmospheric oxidation in recent methane growth, P. Natl. Acad. Sci. USA, 114, 5373–5377, https://doi.org/10.1073/pnas.1616426114, 2017.
Röckmann, T., Eyer, S., van der Veen, C., Popa, M. E., Tuzson, B., Monteil, G., Houweling, S., Harris, E., Brunner, D., Fischer, H., Zazzeri, G., Lowry, D., Nisbet, E. G., Brand, W. A., Necki, J. M., Emmenegger, L., and Mohn, J.: In situ observations of the isotopic composition of methane at the Cabauw tall tower site, Atmos. Chem. Phys., 16, 10469–10487, https://doi.org/10.5194/acp-16-10469-2016, 2016.
Saunois, M., Bousquet, P., Poulter, B., Peregon, A., Ciais, P., Canadell, J. G., Dlugokencky, E. J., Etiope, G., Bastviken, D., Houweling, S., Janssens-Maenhout, G., Tubiello, F. N., Castaldi, S., Jackson, R. B., Alexe, M., Arora, V. K., Beerling, D. J., Bergamaschi, P., Blake, D. R., Brailsford, G., Bruhwiler, L., Crevoisier, C., Crill, P., Covey, K., Frankenberg, C., Gedney, N., Höglund-Isaksson, L., Ishizawa, M., Ito, A., Joos, F., Kim, H.-S., Kleinen, T., Krummel, P., Lamarque, J.-F., Langenfelds, R., Locatelli, R., Machida, T., Maksyutov, S., Melton, J. R., Morino, I., Naik, V., O'Doherty, S., Parmentier, F.-J. W., Patra, P. K., Peng, C., Peng, S., Peters, G. P., Pison, I., Prinn, R., Ramonet, M., Riley, W. J., Saito, M., Santini, M., Schroeder, R., Simpson, I. J., Spahni, R., Takizawa, A., Thornton, B. F., Tian, H., Tohjima, Y., Viovy, N., Voulgarakis, A., Weiss, R., Wilton, D. J., Wiltshire, A., Worthy, D., Wunch, D., Xu, X., Yoshida, Y., Zhang, B., Zhang, Z., and Zhu, Q.: Variability and quasi-decadal changes in the methane budget over the period 2000–2012, Atmos. Chem. Phys., 17, 11135–11161, https://doi.org/10.5194/acp-17-11135-2017, 2017.
Saunois, M., Stavert, A. R., Poulter, B., Bousquet, P., Canadell, J. G., Jackson, R. B., Raymond, P. A., Dlugokencky, E. J., Houweling, S., Patra, P. K., Ciais, P., Arora, V. K., Bastviken, D., Bergamaschi, P., Blake, D. R., Brailsford, G., Bruhwiler, L., Carlson, K. M., Carrol, M., Castaldi, S., Chandra, N., Crevoisier, C., Crill, P. M., Covey, K., Curry, C. L., Etiope, G., Frankenberg, C., Gedney, N., Hegglin, M. I., Höglund-Isaksson, L., Hugelius, G., Ishizawa, M., Ito, A., Janssens-Maenhout, G., Jensen, K. M., Joos, F., Kleinen, T., Krummel, P. B., Langenfelds, R. L., Laruelle, G. G., Liu, L., Machida, T., Maksyutov, S., McDonald, K. C., McNorton, J., Miller, P. A., Melton, J. R., Morino, I., Müller, J., Murguia-Flores, F., Naik, V., Niwa, Y., Noce, S., O'Doherty, S., Parker, R. J., Peng, C., Peng, S., Peters, G. P., Prigent, C., Prinn, R., Ramonet, M., Regnier, P., Riley, W. J., Rosentreter, J. A., Segers, A., Simpson, I. J., Shi, H., Smith, S. J., Steele, L. P., Thornton, B. F., Tian, H., Tohjima, Y., Tubiello, F. N., Tsuruta, A., Viovy, N., Voulgarakis, A., Weber, T. S., van Weele, M., van der Werf, G. R., Weiss, R. F., Worthy, D., Wunch, D., Yin, Y., Yoshida, Y., Zhang, W., Zhang, Z., Zhao, Y., Zheng, B., Zhu, Q., Zhu, Q., and Zhuang, Q.: The Global Methane Budget 2000–2017, Earth Syst. Sci. Data, 12, 1561–1623, https://doi.org/10.5194/essd-12-1561-2020, 2020.
Schwietzke, S., Sherwood, O. A., Bruhwiler, L. M. P., Miller, J. B., Etiope, G., Dlugokencky, E. J., Michel, S. E., Arling, V. A., Vaughn, B. H., White, J. W. C., and Tans, P. P.: Upward revision of global fossil fuel methane emissions based on isotope database, Nature, 538, 88–91, 2016.
Sherwood, O. A., Schwietzke, S., Arling, V. A., and Etiope, G.: Global Inventory of Gas Geochemistry Data from Fossil Fuel, Microbial and Burning Sources, version 2017, Earth Syst. Sci. Data, 9, 639–656, https://doi.org/10.5194/essd-9-639-2017, 2017.
Sherwood, O. A., Schwietzke, S., and Lan, X.: Global Inventory of Fossil and Non-fossil δ13C-CH4 Source Signature Measurements for Improved Atmospheric Modeling, NOAA Global Monitoring Laboratory Data Repository [data set], https://doi.org/10.15138/qn55-e011, 2020.
Sperlich, P., Uitslag, N. A. M., Richter, J. M., Rothe, M., Geilmann, H., van der Veen, C., Röckmann, T., Blunier, T., and Brand, W. A.: Development and evaluation of a suite of isotope reference gases for methane in air, Atmos. Meas. Tech., 9, 3717–3737, https://doi.org/10.5194/amt-9-3717-2016, 2016.
Stanisavljević, M.: Determination of methane (CH4) emission rates and its origin from selected areas of mining exploitation in Poland and Germany, PhD thesis, Faculty of Physics and Applied Computer Science, AGH University of Science and Technology, Krakow, Poland, https://stopnienaukowe.archiwum.agh.edu.pl/fileadmin/default/templates/images/BIP%20 -%20stopnie_naukowe/doktoraty/2022/Mila_Stanisavljevic/Mila_Stanisavljevic_Rozprawa_doktorska.pdf (last access: 8 December 2023), 2021.
Tchórzewski, K.: Regulation of the Minister of Energy on detailed requirements for the operation of underground mining plants of 23 November 2016, Journal of Laws, 1118, 18, 2017.
Townsend-Small, A., Botner, E. C., Jimenez, K. L., Schroeder, J. R., Blake, N. J., Meinardi, S., Blake, D. R., Sive, B. C., Bon, D., Crawford, J. H., Pfister, G., and Flocke, F. M.: Using stable isotopes of hydrogen to quantify biogenic and thermogenic atmospheric methane sources: A case study from the Colorado Front Range, Geophys. Res. Lett., 43, 11462–11471, https://doi.org/10.1002/2016GL071438, 2016.
Turner, A. J., Frankenberg, C., Wennberg, P. O., and Jacob, D. J.: Ambiguity in the causes for decadal trends in atmospheric methane and hydroxyl, P. Natl. Acad. Sci. USA, 114, 5367–5372, https://doi.org/10.1073/pnas.1616020114, 2017.
USEPA: Inventory of U. S. Greenhouse Gas Emissions and Sinks: 1990–2014, https://www.epa.gov/sites/default/files/2017-04/documents/us-ghg-inventory-2016-main-text.pdf (last access: 8 December 2023), 2016.
Whiticar, M. J.: Stable isotope geochemistry of coals, humic kerogens and related natural gases, Int. J. Coal Geol., 32, 191–215, https://doi.org/10.1016/S0166-5162(96)00042-0, 1996.
Wietzel, J.: Carbon isotopic source signature of CH4-emissions of mines in the upper silesian basin, Bachelor of Science, Department of Physics and Astronomy, University of Heidelberg, Heidelberg, Germany, 85 pp., 2018.
Zazzeri, G., Lowry, D., Fisher, R. E., France, J. L., Lanoisellé, M., Kelly, B. F. J., Necki, J. M., Iverach, C. P., Ginty, E., Zimnoch, M., Jasek, A., and Nisbet, E. G.: Carbon isotopic signature of coal-derived methane emissions to the atmosphere: from coalification to alteration, Atmos. Chem. Phys., 16, 13669–13680, https://doi.org/10.5194/acp-16-13669-2016, 2016.