the Creative Commons Attribution 4.0 License.
the Creative Commons Attribution 4.0 License.
 | 20 Dec 2023
Examining the vertical heterogeneity of aerosols over the Southern Great Plains
Chanakya Bagya Ramesh
Scott E. Giangrande
Jerome Fast
Xianda Gong
Jiaoshi Zhang
Ahmet Tolga Odabasi
Marcus Vinicius Batista Oliveira
Alyssa Matthews
John E. Shilling
Jason Tomlinson
Jian Wang
Atmospheric aerosols affect the global energy budget by scattering and absorbing sunlight (direct effects) and by changing the microphysical structure, lifetime, and coverage of clouds (indirect effects). Both aerosol direct and indirect effects are affected by the vertical distribution of aerosols in the atmosphere, which is further influenced by a range of processes, such as aerosol dynamics, long-range transport, and entrainment. However, many observations of these processes are based on ground measurements, limiting our ability to understand the vertical distribution of aerosols and simulate their impact on clouds and climate. In this work, we examined the vertical heterogeneity of aerosols over the Atmospheric Radiation Measurement (ARM) Southern Great Plains (SGP) using data collected from the Holistic Interactions of Shallow Clouds, Aerosols and Land Ecosystems (HI-SCALE) campaign. The vertical profiles of meteorological and aerosol physiochemical properties up to 2500 m above are examined based on the 38 flights conducted during the HI-SCALE campaign.
The aerosol properties over the SGP show strong vertical heterogeneity and seasonal variabilities. The aerosol concentrations at the surface are the highest due to strong emissions at ground level. In general, the mode diameter of aerosols during summer (∼ 100 nm) is larger than that during spring (∼ 30 nm), a result of enhanced condensational growth due to enriched volatile organic compounds in summer. The concentration of aerosols below 30 nm in the boundary layer (BL) (e.g., below 1000 m) during spring is higher than that during summer, a result of the stronger new particle formation (NPF) events due to the reduced condensation sink in spring. In the BL, the size of the aerosols gradually increases with altitude due to condensational growth and cloud processing. However, the chemical composition of the aerosols remained similar, with organics and sulfates representing 59.8 ± 2.2 % and 22.7 ± 2.1 %, respectively, of the total mass in the BL. Through the vertical profiles of aerosol properties, we observed NPF events in the upper BL during 7 out of 38 research flights, where the newly formed particles continue to grow as they are mixed down to the surface. There is also an indication that deep convection brings aerosols from the free troposphere (FT) to the surface, where they grow to contribute to the cloud condensation nuclei (CCN). Overall, the vertical heterogeneity of aerosols over the SGP is influenced by aerosol dynamics (new particle formation, growth, and cloud processing) and transport processes (mixing in the BL, long-range transport, entrainment, and convective downward transport). Case studies showing the influence of these factors are discussed.
- Article
(6522 KB) - Full-text XML
-
Supplement
(3359 KB) - BibTeX
- EndNote


Aerosol particles play a substantial role in Earth's atmosphere system by impacting cloud properties, solar and terrestrial radiation budgets, as well as human and environmental health. These impacts depend strongly on the size, concentration, and chemical composition of aerosols. Atmospheric aerosols undergo dynamic processes, including formation (gas-to-particle conversion), growth, removal, and transport, leading to high spatial and temporal variability. Vertical profiles of aerosol properties are needed to understand some of the key processes influencing aerosol–cloud interactions at cloud levels. However, most observations of aerosols have been conducted at ground or sea level.
The U.S. Department of Energy (DOE) Atmospheric Radiation Measurement (ARM) Southern Great Plains (SGP) observatory is one of the world's largest and most extensive climate research facilities (Ackerman and Stokes, 2003; Mather and Voyles, 2013). The SGP is located in a rural environment with the nearest population centers approximately 40 km away and is influenced by a mixture of anthropogenic, biogenic, and biomass burning sources of aerosols and their precursors, which could contribute to large horizontal and vertical variations of aerosol properties across the area. Ground observation at the SGP showed that new particle formation (NPF), the process where stable particles of around 1 nm are formed from gas-phase sulfuric acid molecules and stabilizing vapors (such as water, ammonia, amine, and oxidized organic molecules), is commonly observed throughout the year (Marinescu et al., 2019). High particle concentrations, observed mostly during the daytime, were well correlated with the elevated sulfur dioxide (SO2) mixing ratios, suggesting that sulfate is among the main nucleating species at the SGP (Wang et al., 2006). The growth law analysis showed that the overall particle growth at the SGP was dominated by volume-controlled reactions (e.g., aqueous reaction and gas–particle partitioning) and not by surface-area-driven processes (e.g., condensation) (Wang et al., 2006). Chemical analyses with an aerosol mass spectrometer showed that organics and sulfate dominate the aerosol composition at the SGP (Liu et al., 2021). Oxygenated organic aerosols are identified as the dominant factor of organic aerosols for both the spring and summer but are more aged in spring.
Previous studies at the SGP also showed interesting features regarding the vertical heterogeneity of aerosols. During the DOE New Particle Formation Study 2013 (NPFS2013) (Smith and Mcmurry, 2015), measurements on board a tethered balloon show that NPF usually occurs in the upper boundary layer (BL), and then the newly formed particles rapidly mixed throughout the BL (Chen et al., 2018). These observations suggest that NPF may originate from the upper BL instead of near the surface. A recent study examined the vertical profile of NPF and aerosol growth in the SGP BL with models and observations from the Holistic Interactions of Shallow Clouds, Aerosols and Land Ecosystems (HI-SCALE) campaign data (O'Donnell et al., 2023). This study used a column aerosol chemistry and microphysics model to study factors that influence the vertical profile of NPF and found enhanced NPF rates in the upper mixed layer. This enhancement is primarily due to the temperature dependence in the NPF schemes in the model but is also dependent on the vertical profile of gas-phase precursors (O'Donnell et al., 2023). Apart from newly formed particles, vertically compact aerosol layers, which were traced back to forest fires in East Asia, were observed at altitudes over 3000 m at the SGP (Wang et al., 2006). Wildfire plumes can also be transported through the free troposphere (FT) and eventually be observed at the SGP. Currently, these measurements relating to the vertical distribution of aerosols are either analyzed at lower altitudes (below 1200 m) or for a short period of time, limiting our understanding of how these aerosols are affected by the dynamics in the BL and lower FT and how these aerosols may impact the cloud properties.
The DOE–ARM HI-SCALE campaign was conducted in 2016 at the SGP to understand shallow convective clouds in terms of their coupling to land–atmosphere interactions, boundary layer turbulence, and the aerosol life cycle (Fast et al., 2019; Fast et al., 2022; Kulkarni et al., 2023). One goal of the HI-SCALE campaign was to provide a detailed set of aircraft and surface measurements in order to improve the understanding and parameterizations of the life cycle of aerosols and their impact on shallow clouds. A total of 38 flights (17 in spring and 21 in summer) were conducted during the HI-SCALE campaign with a wide vertical and horizontal spatial coverage, enabling a statistically robust analysis of aerosol–cloud interactions under different atmospheric conditions. In this study, we analyzed these aircraft measurements and characterized the vertical profiles of aerosol physical and chemical properties. Key aerosol dynamic processes and transport phenomena that control the aerosol population are investigated, together with their seasonal variability.
The HI-SCALE campaign consisted of two 4-week intensive observational periods (IOPs), one occurring from 24 April to 21 May 2016 (denoted as the “spring” campaign) and one running from 28 August to 24 September 2016 (denoted as the “summer” campaign) to take advantage of different stages and distributions of the “greenness” of cultivated crop, pasture, herbaceous, and forest vegetation types (Fast et al., 2019). The Gulfstream-1 (G-1) aircraft (Schmid et al., 2014) was deployed to examine the spatial and temporal variation of aerosol properties over the SGP observatory (36∘36′26′′ N, 97∘29′16′′ W), with a horizontal coverage of around 100 km (Fast et al., 2022) and an altitude range of 200 to 3000 m above ground level (a.g.l.). G-1 was stationed at the airport in Bartlesville, which is approximately 130 km east of the SGP observatory. Figure 1 shows the dates and durations of the flights. Same-day flights were conducted during summer to examine the diurnal variation of aerosols over the SGP. Each flight consisted of four to six vertical profiles (in addition to those leaving and arriving at the airport), providing the aerosol and corresponding meteorological properties as a function of altitude. The flight tracks used during the HI-SCALE campaign and the flight track of an example research flight are shown in Fig. 2. The aerosol properties presented here are based on the measurements in the BL and lower FT (< 3 km) over the SGP.
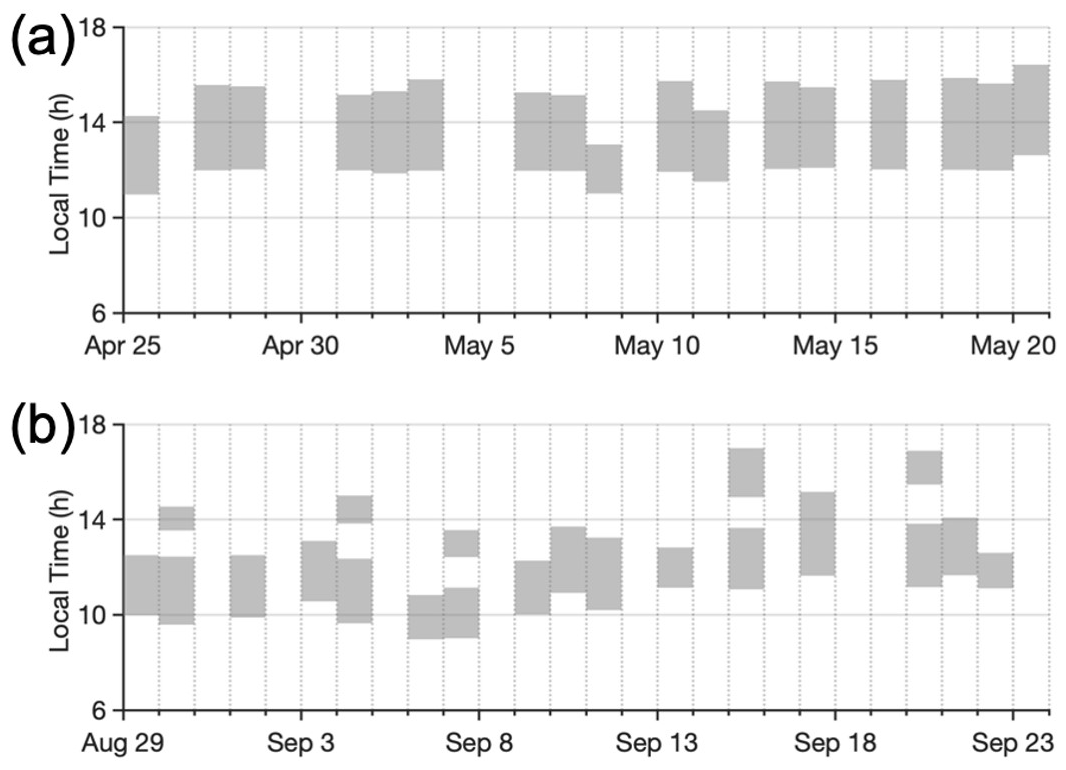
Figure 1Date and local time of the flights conducted during the HI-SCALE campaign: (a) spring campaign and (b) summer campaign. During the summer campaign, same-day flights were conducted to examine the temporal variation of aerosols over the SGP.
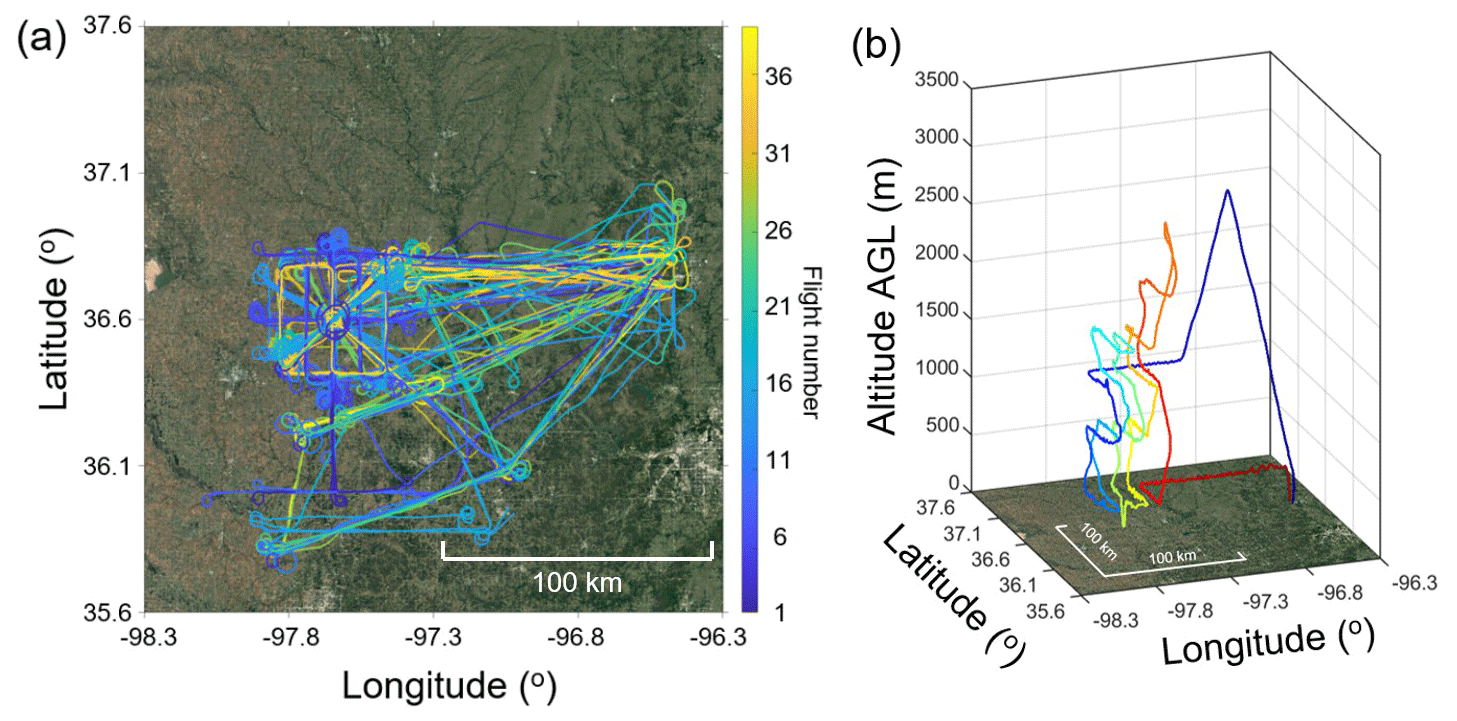
Figure 2(a) Flight patterns used during the HI-SCALE campaign. A total number of 38 flights were conducted over the SGP observatory. Different colors of the flight patterns represent different flight numbers. (b) An example of the flight pattern on 3 May 2016. The color represents the local time in hours. The maps are obtained from © Google Maps.
Measurements on board G-1 included meteorological parameters, concentrations of gaseous species and aerosols, and cloud properties (Fast et al., 2019). The structure of the BL was derived from the measured vertical potential temperature profile, from which the boundary between the BL and FT is defined by temperature inversion. When the inversion is not obvious, liquid water content (LWC) and water vapor mixing ratio (w) profiles are used to help identify the cloud top and define the BL height (a rapid increase in LWC or a decrease in w). w is calculated from the ambient temperature and dew point measured on board G-1. The mixing ratios of CO, O3, and SO2 were measured by trace gas monitors (Los Gatos Research, Inc., N2O/COR-23r, Thermo Scientific model 49i, and Thermo Scientific model 43i-TLE, respectively).
The aerosol particles were sampled using an isokinetic inlet that has a 50 % upper cut-off size of 5 µm (Schmid et al., 2014) and were subsequently dried with a Nafion tube. Aerosol size distributions from 10 to ∼ 600 nm were measured by a fast-integrated mobility spectrometer (FIMS) (Wang et al., 2018; Kulkarni and Wang, 2006). The total number concentration of particles larger than 3 nm (N>3) and larger than 10 nm in diameter (N>10) were measured by two condensation particle counters (CPCs) with different cut-off sizes (CPC 3025A and CPC 3010, TSI Inc.). The difference in concentrations measured by the two CPCs can represent the concentration of aerosols with sizes between 3 and 10 nm (N3–10). A high-resolution time-of-flight aerosol mass spectrometer (HR-ToF-AMS) (Canagaratna et al., 2007) was deployed to characterize submicrometer non-refractory aerosol composition (species that evaporate rapidly at 600 ∘C under vacuum conditions). For this study, we present the measurement of organics, sulfate, ammonium, and nitrate (chloride is refractory, has a very low concentration, and therefore is not reported). Cloud LWC is calculated by integrating the droplet size distribution measured by a fast cloud droplet probe (FCDP, SPEC Inc., Boulder, CO). To minimize artifacts due to droplet shattering on the aerosol sampling inlet, we exclude aerosol measurements inside clouds (i.e., LWC > 10−3 g m−3) from our analysis. In addition, to reduce the potential impact of airport emissions and to account for differences in aerosol properties over Bartlesville, the analysis only considers measurements collected at least 12 min after taking off and before landing at the airport.
3.1 Air mass back-trajectory analysis
The SGP is located within a rural setting and experiences the influence of a diverse array of aerosol sources and their precursors, which lead to significant fluctuations in aerosol characteristics, both horizontally and vertically, throughout the region. Figure S1 in the Supplement is a satellite image showing the terrain and vegetation surrounding the SGP observatory. The northern plains of the SGP are mainly grassland and cropland (Trishchenko et al., 2004) and therefore could generate weak emissions from biogenic processes and wildfires. There are no major cities west of the SGP towards the Rocky Mountains, suggesting that aerosols observed at the SGP may be impacted by biogenic emissions or wildfires from the west. Air mass passing from the south generally travels over more populated regions and metropolitan areas such as Houston, Dallas, and Oklahoma City and is largely influenced by anthropogenic emissions. Air mass transported from the east likely brings emissions from deciduous and mixed forests in northern Arkansas, Missouri, and southern Illinois (Parworth et al., 2015). Apart from air mass transport, the aerosol properties at the SGP are also influenced by local agricultural emission from the surrounding cropland and pasture and industrial emissions from coal-fired power plants (Liu et al., 2021; Wang et al., 2006). To understand the air mass transport and its impact on the vertical profiles of aerosols, we conducted an air mass back-trajectory analysis for the flight days during the HI-SCALE campaign. Using the vertical aircraft profiles of potential temperature and LWC, we calculated the BL heights during the spring and summer campaigns, and they have mean values of 1190 ± 390 and 1110 ± 570 , respectively. Figure S2 shows the vertical profiles of potential temperature and LWC during the spring and summer campaigns. Note that, overall, there is minimal LWC at altitudes above 1500 m (Fig. S2b). However, the inversion of the potential temperature may occur even when there is no LWC, meaning that the profile of LWC in Fig. S2b could only qualitatively show the BL height. We calculated the 10 d back-trajectories of air masses arriving at three altitudes (200, 1000, and 1800 m, representing the lower BL, upper BL, and lower FT) above the SGP during the G-1 flight days using the Hybrid Single-Particle Lagrangian Integrated Trajectory (HYSPLIT) version 4 model following the method in Wang et al. (2021). A cluster analysis of the trajectories was then performed (Abdalmogith and Harrison, 2005) for each campaign and arriving altitude (Fig. 3). The trajectories associated with each cluster in Fig. 3 are also included in Figs. S3 and S4.
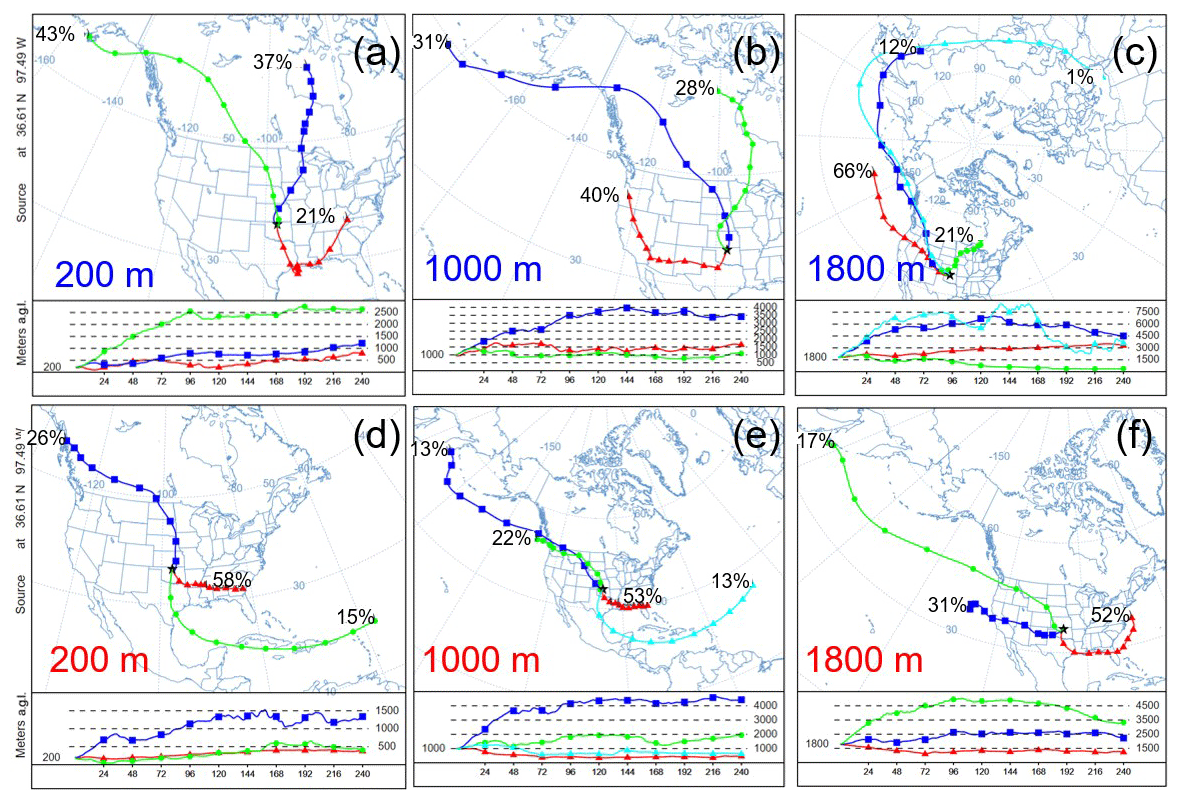
Figure 3Cluster analysis of 10 d back-trajectories arriving at 200, 1000, and 1800 m above the SGP site during the spring (first row) and summer (second row) campaigns. The average trajectories of the clusters are represented by different colors, and the associated numbers denote the occurrence percentages of the clusters.
Similar to previous ground-based observations (Liu et al., 2021; Parworth et al., 2015), the air mass arriving at the surface of the SGP (200 m) mainly passes from north during the spring and from the southern and eastern parts during the summer (Fig. 3a and d). Also, the short trajectory from the east reflects slower wind speeds from the forests during the summertime. The longer residence time of air mass and the more abundant fresh volatile organic compounds in the forest region can lead to a higher mass of aerosols and less-oxidized organic aerosols during the summer (Parworth et al., 2015; Liu et al., 2021). The back-trajectories arriving at the upper BL (1000 m) are similar to those arriving at the surface during the summer (Fig. 3d and e), indicating a similar ground-level emission source of aerosols in the BL. However, during spring, the upper BL showed a stronger influence of air mass arriving from the south and west (50 %, Fig. 3b) compared to the surface (21 % from the south, Fig. 3a). This can potentially lead to different aerosol dynamic processes in the upper BL. The air mass arriving at the lower FT (1800 m) for the spring campaign mostly comes from the north to the west (Fig. 3c), while that for the summer campaign still showed a strong influence of air mass coming from south and east (52 %, Fig. 3f). The wildfire-generated biomass burning aerosols in the north and west of the SGP may be injected into the FT and further transported and aged before they arrive at the SGP. Regarding the vertical motion of the air mass, the air mass arriving at 200 m above the SGP is influenced by the air mass traveling at higher altitudes (> 1000 m) due to synoptic-scale subsidence over many days (NWCG, 2007). Long-range transport of aerosols may impact ground observations in such situations (Wang et al., 2006), but the influence of this air mass on ground observations is also largely subject to the coupling between the BL and FT.
Overall, during the spring HI-SCALE campaign, the prevailing air mass at the SGP passes from the north and west, while during the summer campaign, it is predominantly from the south and east. Fire season climatology shows that, in general, there are stronger fire activities in late spring and summer to the north and west of the SGP. The stronger fire activities coincide with the warmest and driest conditions, together with wind events and dry lightning potential. There is a much weaker fire activity to the southeast of the SGP in late summer, especially from August to September (NWCG, 2021). Therefore, the difference in the back-trajectories during spring and summer can explain the higher CO concentration during the springtime (Fig. S5a), which is an indicator of biomass burning (Liu et al., 2021). Biomass burning also generates precursors for the formation of O3, leading to a higher springtime O3 concentration (Fig. S5b). SO2 profiles show higher concentrations during summer (Fig. S5c), which may be caused by the air mass influenced by anthropogenic emissions from the south. The power plants located east, south, and southeast of the SGP (within 45 km of the SGP observatory) may also contribute to the SO2 concentrations (Wang et al., 2006). SO2 can contribute to the occurrence of NPF. At the same time, NPF depends on the concentration of pre-existing aerosols and other meteorological parameters (Sect. 3.3.1).
3.2 Aerosol properties over the SGP
3.2.1 Vertical profiles of aerosol size distributions
The vertical profiles of aerosol size distributions measured during the spring and summer campaigns are shown in Fig. 4. Note that the size distributions between 3 and 10 nm are calculated based on the difference in concentrations monitored by the two CPCs, and the size distributions above 10 nm are measured by the FIMS. The size distributions show strong vertical heterogeneity and strong seasonal variability. For both seasons, the aerosol concentrations at the surface are the highest due to surface emissions. However, the dominant size of these aerosols during summer (∼ 100 nm) is larger than that during spring (∼ 30 nm), which is likely a result of enhanced condensational growth due to stronger volatile organic compound (VOC) emissions and secondary organic aerosol (SOA) formation in summer (Liu et al., 2021). Additionally, the more abundant gaseous precursors can promote aqueous chemistry in cloud droplets, which accumulates the mass and increases the size of the accumulation-mode aerosols (Wang et al., 2007). The larger size of the aerosols in the summer also leads to a larger condensation and coagulation sink for nucleating vapors and newly formed particles, suppressing the occurrence of NPF in the summer. As a result, the concentration of aerosols below 30 nm in the BL (e.g., below 1000 m) during spring is higher than that during summer. In the summer BL, the mode size of the aerosols gradually increases with altitude due to aerosol dynamics such as cloud processing (aqueous reaction and coalescence scavenging) and condensational growth (Wang et al., 2006). Due to the larger size of the aerosols that facilitates cloud droplet activation, the summertime size distributions show a Hoppel minimum, which is the average particle size at which particles become cloud condensation nuclei (CCN) of around 90 nm in the upper BL (600 to 1500 m) because of cloud processing (Fig. 4b). The in-cloud scavenging also removes aerosols and smaller cloud droplets, leading to a lower aerosol concentration at the higher altitudes of the BL. In the FT, aerosols are distributed in layers through long-range transport events. However, the concentration of the transported aerosols is higher in spring, likely due to the more dominant air mass arriving from the west that is associated with wildfires, as also indicated by the higher CO mixing ratio in Fig. S5a. The influence of long-range transport aerosols is also discussed in the case study in Sect. 3.4.4.
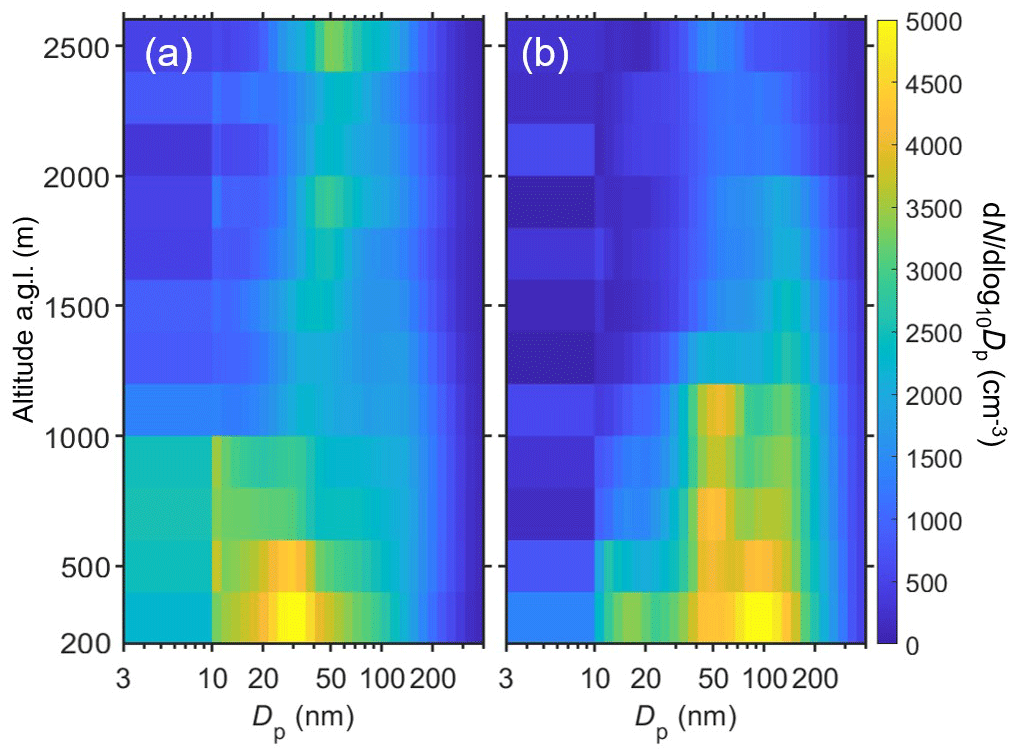
Figure 4Vertical profiles of the mean aerosol size distributions during the (a) spring campaign and (b) summer campaign. Note that the size distributions between 3 and 10 nm are calculated based on the difference in concentrations monitored by the two CPCs, and the size distributions above 10 nm are obtained by the FIMS. The size distributions are normalized to standard temperature and pressure (273.15 K and 101.325 kPa; STP).
To quantify the vertical heterogeneity of the aerosols, we integrated the FIMS-measured aerosol size distributions in different size ranges. We calculated the concentrations of aerosols in size ranges from 10 to 20, 20 to 100, and above 100 nm to qualitatively study the properties of nucleation-, Aitken-, and accumulation-mode aerosols. Strictly speaking, the Aitken- and accumulation-mode aerosols are separated by the Hoppel minimum (not 100 nm), which is dependent on aerosol properties and meteorological conditions. However, due to the high concentration of aerosols at the surface, a clear Hoppel minimum could not be observed for most of the flights. The nucleation mode should also contain aerosols with sizes below 10 nm. Since the FIMS is limited to the measurement of particles above 10 nm, we also analyzed N3–10 derived by the CPC measurements. For simplicity, we use N10–20, N20–100, and N>100 interchangeably with nucleation-mode, Aitken-mode, and accumulation-mode aerosols. We also use N>3 to represent the total particle concentration.
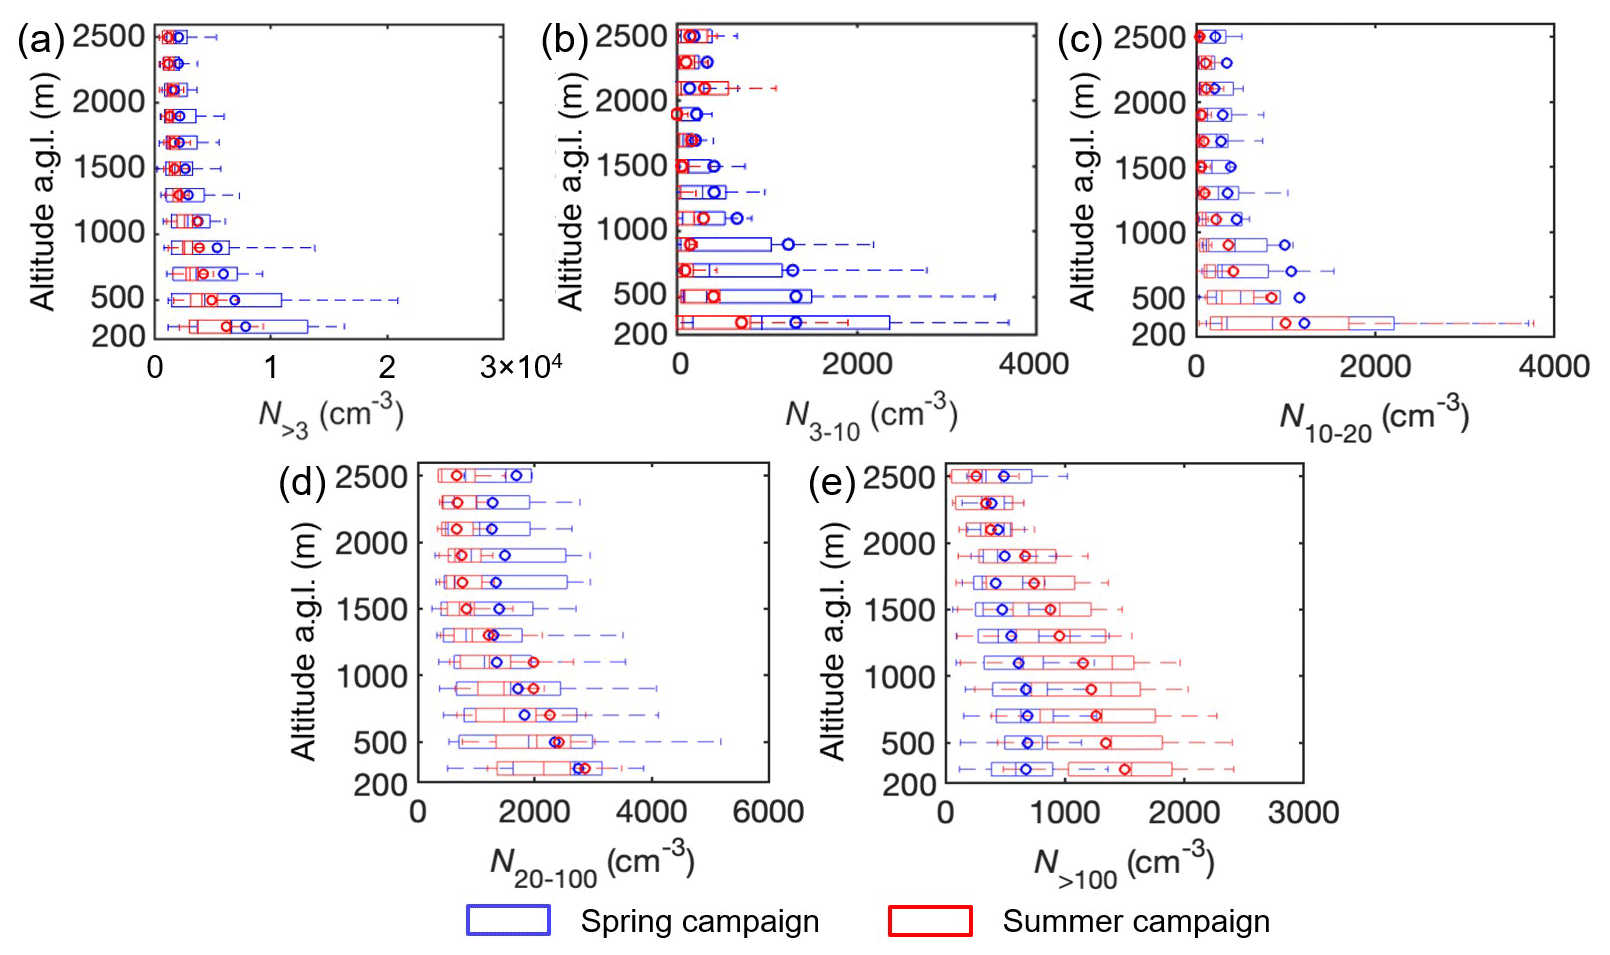
Figure 5Vertical profiles showing the concentrations of particles (a) larger than 3 nm (N>3), (b) with sizes between 3 and 10 nm (N3–10), (c) with sizes between 10 and 20 nm (N10–20), (d) with sizes between 20 and 100 nm (N20–100), and (e) with sizes above 100 nm (N>100) over the SGP site during the spring campaign (blue) and summer campaign (red). The line and circle markers represent the median and mean of the data, and the edges of the box indicate the 25th and 75th percentiles, respectively. The concentrations are normalized to STP (273.15 K and 101.325 kPa).
Figure 5 shows the vertical profiles of particle number concentrations under normalized conditions (STP, 273.15 K and 101.325 kPa). Overall, a higher total aerosol concentration (N>3) can be observed in the spring campaign at all the altitudes (Fig. 5a), and the difference in concentrations between the spring and summer is larger in the BL. Moreover, the variation of N>3 in the same altitude bin during spring is larger compared to summer, resulting from the intense but sporadic NPF events during spring, especially in the upper BL. This can also be indicated by the mean values of N3–10 and N10–20 being outside the 25th to 75th percentile box in the altitude range between 500 and 1000 m (Fig. 5b and c). In the spring campaign, there were three NPF events where N3–10 and N10–20 values were above 2000 cm−3 in the altitude range of 500 and 1000 m, which is significantly higher than the median values below 600 cm−3.
During summer, there is a larger variation of N>100 in the same altitude bin compared to that of spring (Fig. 5e); however, the influence of this variation on the variation of N>3 is small due to the relatively small contribution of N>100 to N>3. At the same time, the relatively small variation of N>3 during summer is caused by the weaker NPF during summer. The more consistent source of the air mass from southeast (Fig. 3) during summer also leads to a more consistent background aerosol condition. A study at the SGP shows that the summertime air mass pathways were primarily from the same direction (southerly), potentially resulting in lower variability in observed aerosol properties (Andrews et al., 2011). Moreover, a number of studies documented episodically high concentrations of aerosols at the SGP during the spring season due to agricultural and wildfire sources in the area as well as the influx of biomass burning aerosols from different regions across North America (Peppler et al., 2000; Wang et al., 2006). Therefore, these results also suggest the importance of seasonal synoptic-scale variability for aerosol properties and potential aerosol–cloud interactions by influencing the CCN activity. A recent study analyzing the long-term CCN activity at the SGP shows that aerosols associated with air masses passing over various locations (e.g., Central America, the Gulf of Mexico, and the west) have very different accumulation-mode aerosol concentrations and hygroscopicity (Patel and Jiang, 2021). However, as indicated by the study, particle size is still the most critical factor influencing the ability of aerosols to activate, whereas the effect of chemical composition was secondary.
The breakdown of the total aerosol concentration into different size modes shows that, in the BL, N3–10 and N10–20 are higher during the spring (Fig. 5b and c), while N>100 is higher during the summer (Fig. 5d). Springtime and summertime N20–100 are comparable in the BL, but springtime N20–100 in the FT is higher than that in the summer, most likely resulting from long-range transport events (Sect. 3.3.4). Therefore, the larger BL total aerosol concentration in spring mainly results from higher values of N3–10 and N10–20 caused by the NPF events. The high N3–10 and N10–20 extend to the upper BL (∼ 1000 m), which could be explained by the upward mixing of the surface air but at the same time suggesting that NPF events may occur directly in the upper BL. Indeed, NPF events at different altitudes were observed in multiple research flights, and a few example cases are discussed in Sect. 3.3.1. The higher N>100 in summer is partly due to growth by condensable vapors transported from anthropogenic sources in the south and biogenic sources east of the SGP (Liu et al., 2021). At the same time, because the summertime size distribution shows a Hoppel minimum (Fig. 4b) and most particles above 100 nm are in the accumulation mode, the aqueous-phase chemistry plays a role in increasing N>100 as well. These accumulation-mode aerosols also serve as condensation and coagulation sinks for nucleating vapors and newly formed particles, reducing the concentration of nucleation-mode aerosols.
The aerosol concentrations in different modes show a vertical gradient where the concentration at the surface is highest. This may be due to the stronger emission at the surface, but the low BL heights observed during several research flights can also contribute to a higher average concentration of aerosols near the surface. To exclude the influence of BL height in analyzing the vertical gradient of aerosol concentrations, we examined the particle concentrations as a function of normalized altitude, , where z is the altitude and z0 is the BL height. The particle concentrations are first binned and averaged using the specific BL height for each flight and are then combined for the entire campaign (Fig. S6). Comparing Fig. S6 against Fig. 5, we can find that the vertical gradient of aerosol concentrations, especially near the surface, is greatly reduced when concentrations are plotted against normalized altitude, suggesting that BL height and atmospheric stability strongly influence the vertical distribution of aerosols. Overall, N>3 and N20–100 are relatively constant in the lower BL ( < 0.75), while N>100 is higher near the surface, potentially due to the faster growth by the more available condensing vapors at the surface or more efficient removal by clouds at lower altitudes in the BL. Aerosol concentration in all size ranges decreased with increasing altitude in the upper BL ( > 0.75) due to cloud scavenging. N3–10 and N10–20 have larger values in the middle to upper BL, especially near , again highlighting the occurrence of NPF in the upper BL and their potential contribution to the aerosol population over the SGP.
3.2.2 Vertical profiles of aerosol chemical composition
The chemical composition of the non-refractory aerosols measured by the HR-ToF-MS is shown in Fig. 6. The aerosol mass is dominated by organics and sulfates for both seasons (> 75 %). Except for nitrate, all other components have higher concentrations during summer. Since nitrate aerosols are more stable under low temperatures, the higher nitrate concentrations during spring are likely driven by the lower temperature in the spring (Liu et al., 2021; Parworth et al., 2015). Ammonium is likely associated with agricultural emissions. The increased levels of organics during the summer season can be attributed to biogenic emissions originating from the east of the SGP, while the higher sulfate concentration is a result of the transportation of anthropogenic emissions from the south of the SGP (Figs. 3 and S1). Moreover, the previous study by Xu et al. (2015) showed that the formation of isoprene SOA is mediated by the abundance of sulfate through chemical reactions among sulfate, organics, and water, which allows the increase in both organics and sulfates in the summer. Although the organics and sulfate aerosol mass ratios are similar in spring and summer at the SGP, the detailed chemical compositions are different. The study by Liu et al. (2021) showed that, despite the higher organic aerosol mass in summer, these organics are less oxidized than in spring, as indicated by the O:C and H:C ratios. These summertime organics are not generated by biomass burning plumes as the study by Liu et al. (2021) analyzing the aerosol mass spectrometer data showed that the biomass burning organic aerosol (BBOA) factor was not identified during the summer season. This result is also consistent with the low concentrations of BBOA observed in summer at the SGP in a previous study (Parworth et al., 2015). According to Liu et al. (2021), the different oxidation levels in the spring and summer are likely due to (1) aerosols in the spring being more aged due to a longer residence time in the atmosphere, potentially different oxidant concentrations, or a combination of both; (2) different VOC species potentially contributing to aerosol formation in spring and summer (e.g., higher monoterpene and isoprene concentrations were observed in the summer); and (3) the more abundant biogenic VOCs in the summer not being transformed into a higher-oxygenated form in the aerosol phase, due either to radical chemistry, oxidants, or their residence time in the atmosphere. The chemical composition analysis also showed that the impact of biomass burning on the organic aerosols is low during summer. The higher oxidation level in spring may also explain the stronger NPF events since highly oxygenated molecules can contribute to NPF due to their low volatility (Liu et al., 2021). The more abundant fresh less-oxidized VOCs (such as isoprene) in the summer are reported to suppress NPF (Lee et al., 2016; Heinritzi et al., 2020), which agrees with our observations in this study (Fig. 5b).
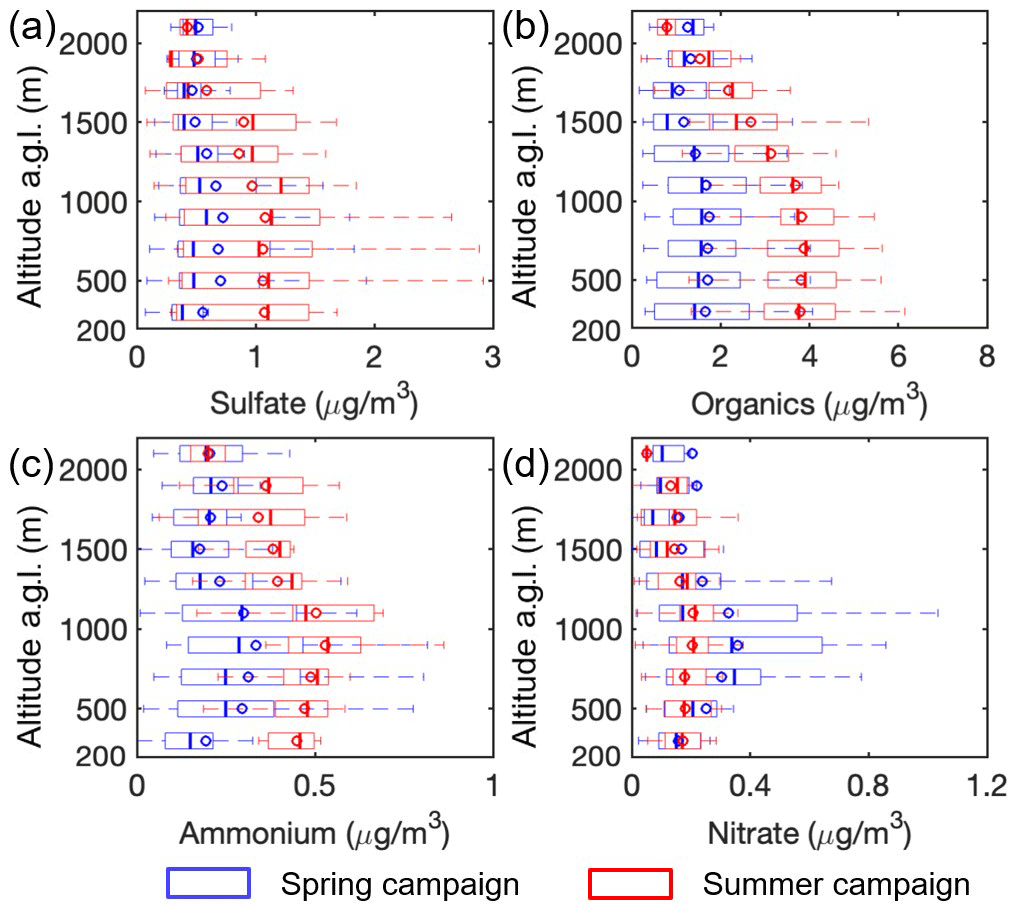
Figure 6Vertical profiles of the mass concentrations of (a) sulfate, (b) organics, (c) ammonium, and (d) nitrate over the SGP during the spring campaign (blue) and summer campaign (red). The compositions are measured by the HR-ToF-AMS. The concentration of chloride is too low and therefore is not shown in the figure. The line and circle markers represent the median and mean of the data, and the edges of the box indicate the 25th and 75th percentiles, respectively. The concentrations are normalized to STP (273.15 K and 101.325 kPa).
Regarding the vertical distribution of the aerosol chemical composition, all species show lower concentrations at altitudes above 2000 m due to the weaker impact from surface emission and reactions. Similarly to the analysis of aerosol concentrations (Figs. 5 and S6), we plotted the aerosol chemical composition against normalized altitude in Fig. S7, which shows a relatively uniform distribution of aerosol mass in the lower BL ( < 0.75). The in-cloud scavenging and the subsequent precipitation or drizzle process can reduce aerosol mass concentrations in the upper BL. In spring, sulfate and organic concentrations are moderately elevated at higher altitudes, likely due to long-range transport events. Both ammonium and nitrate concentrations increase from the surface to ∼ 1000 m, likely resulting from the lower temperature that stabilizes the ammonium nitrate aerosols. At the same time, NOx is more abundant farther from the surface because there are few ground-level sources at the SGP, and NOx are mostly transported from other regions.
As discussed above, the aerosol properties at the SGP are largely influenced by aerosol dynamics and transport processes. Aerosol dynamics include NPF (Sect. 3.3.1), particle growth (Sect. 3.3.2), and cloud processing (Sect. 3.3.3), which alter the aerosol size distributions within the BL. Vertical and horizontal transport affects the vertical profiles of aerosols. The vertical profile of aerosols is affected by the boundary layer stability (Sect. 3.4.1), where the mixing of the residual layer and the nocturnal boundary layer results in the change in aerosol properties. At the same time, entrainment (Sect. 3.4.2) is a slow process that exchanges aerosols between the upper BL and the lower FT. During the HI-SCALE campaign, we also observed more rapid vertical transport due to deep-convection downdrafts (Sect. 3.4.3), which bring high concentrations of ultrafine particles from the FT to the surface. Long-range transport (Sect. 3.4.4) is an example of horizontal transport that can bring aged aerosol layers to specific altitudes of the atmosphere. Examples of these aerosol dynamics and transport processes are introduced and discussed as follows.
3.3 Aerosol dynamic processes influencing the vertical distributions of aerosols
3.3.1 New particle formation
Similar to previous studies at the SGP (Marinescu et al., 2019; Wang et al., 2006; Chen et al., 2018), several NPF events were observed on board G-1 during the HI-SCALE campaign. These newly formed particles and their subsequent growth may be a significant contributor to CCN. Generally, the occurrence of NPF requires sufficient gaseous precursors, a high actinic flux for photo-oxidation reactions, a low temperature to stabilize the newly formed particles, and a low concentration of pre-existing aerosols (i.e., a low condensation and coagulation sink) (Kuang et al., 2009; Kuang et al., 2008; Cai and Jiang, 2017; Zheng et al., 2021; Corral et al., 2022). There is a weak positive correlation between the SO2 mixing ratio and the concentration of nucleation-mode aerosols (N10–20) for most of the flights, showing that the NPF events at the SGP are possibly linked to sulfuric acid (Fig. S8a). However, the total surface area concentration (Stot, which is approximately equivalent to the condensation sink Fig. S8b), and ambient temperature (Tamb, Fig. S8c) also play roles in promoting NPF. Since all the HI-SCALE campaign flight measurements were conducted during the daytime, we could not directly compare the NPF occurrence as a function of actinic flux. However, ground observations during the HI-SCALE campaign show that NPF occurrence is a strong function of solar radiation and has a clear diurnal cycle (Marinescu et al., 2019).
Although the concentration of the nucleation-mode aerosols is highest near the surface of the SGP (Fig. 5), NPF does not necessarily occur only near the surface. By measuring the vertical profiles of the aerosol concentration and size distributions, we found that, out of the 38 research flights, 9 flights observed NPF near the surface (below 600 m a.g.l., 1 flight in the spring campaign and 8 flights in the summer campaign), 7 flights observed NPF in the upper BL (above 600 m a.g.l., 4 flights in the spring campaign and 3 flights in the summer campaign), and 2 flights observed NPF in the lower FT (above the BL, 1 flight in the spring campaign and 1 flight in the summer campaign) over the SGP. Since these NPF events generate high concentrations of nucleation-mode aerosols on a short timescale (sometimes shorter than the mixing time in the BL), they can significantly influence the vertical distribution of aerosol properties. For example, Chen et al. (2018) found that it took ∼ 0.5 to 1.0 h to vertically mix newly formed particles from ∼ 400 m above the ground to the surface. This mixing time will be longer for NPF events in the upper BL, and it also depends on the stability of the BL (Marinescu et al., 2019). In this study, we used the criteria of N>3/N>10 > 1.2 (monitored by the two CPCs with different cut-off sizes) and N10–20 > 500 cm−3 (monitored by the FIMS) to identify NPF events within each altitude bin. Note that here we included the criterion regarding N10–20 to show the NPF's influence on the measured aerosol size distributions and their evolution in the vertical profiles. However, in some NPF cases, the newly formed particles may not grow sufficiently quickly to be detected in the 10 to 20 nm range. Therefore, our criteria may be relatively strict for identifying NPF events. Cases of NPF events occurring at different locations of the atmosphere are discussed below.
NPF near the surface of the SGP
An example of a NPF event near the surface of the SGP on 11 September 2016 is shown in Fig. 7. A relatively stable BL with a height of ∼ 900 m is indicated by the LWC and the change in aerosol concentration (Fig. 7a). The potential temperature profile also shows a gradual temperature inversion below 800 m, limiting the transport of aerosols in the BL. Elevated levels of N3–10 and N10–20 are observed at an altitude below 400 m (Fig. 7b). In the NPF altitude range, there is a higher mixing ratio of SO2 near the surface (∼ 0.3 ppb) compared to the higher altitudes (< 0.1 ppb), suggesting that the NPF events may be initiated by sulfuric acid. However, a relatively high concentration of pre-existing accumulation-mode aerosols is observed (∼ 600 cm−3 in the BL), which led to a high total surface area concentration of the aerosols (Stot) reaching around 75 µm2 cm−3. A low surface area of pre-existing aerosols is generally required for NPF in clean environments. For example, over the eastern North Atlantic, NPF does not occur when Stot is above 10 µm2 cm−3 (Zheng et al., 2021). The NPF occurrence under a high Stot is likely a result of the abundance of nucleating precursors. We further examined the spatial scale of this NPF event and compared flight measurements to ground observations at the SGP (Fig. S9). As shown in Fig. S9a, this NPF event covered a horizontal scale of approximately 20 km × 20 km. The SGP observatory also detected this NPF event, where aerosols below 20 nm emerged at a local time of ∼ 12:00 and the size of the nucleation-mode aerosols continued to grow into the Aitken mode. However, the concentration of the nucleation-mode aerosols below 20 nm is lower than that of the Aitken mode. This is likely because the NPF event did not occur directly at the SGP observatory, and many of the newly formed particles grew to sizes above 20 nm before they were transported to the SGP observatory.
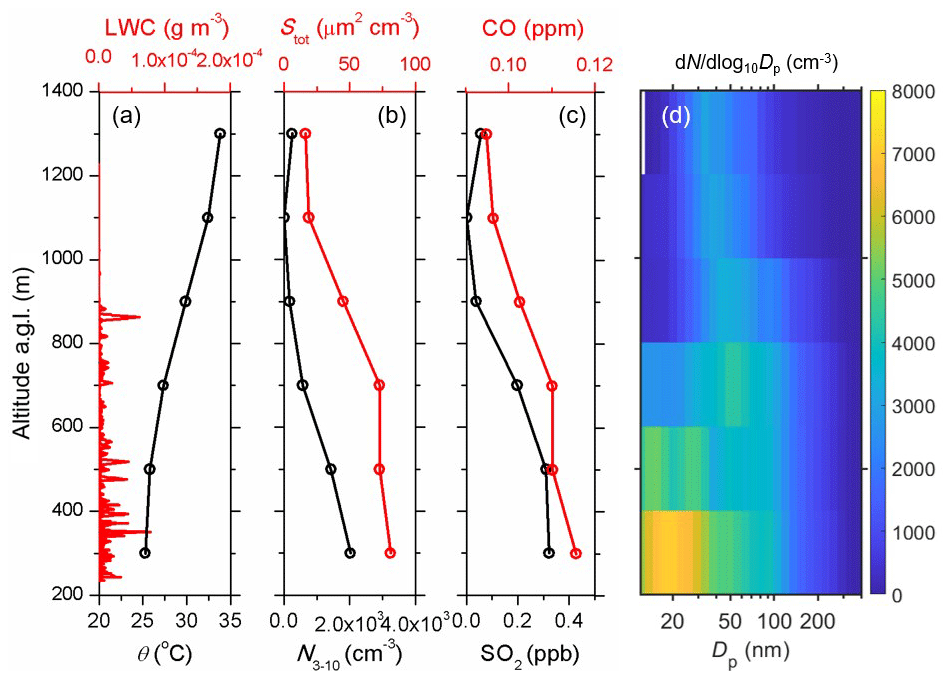
Figure 7Vertical profiles of parameters during a NPF event occurring at the surface of the SGP site on 11 September 2016. (a) Potential temperature (θ) and liquid water content (LWC). (b) Concentration of particles between 3 and 10 nm (N3–10) and total aerosol surface area concentration. (c) Mixing ratios of carbon monoxide (CO) and sulfur dioxide (SO2). (d) Vertical profile of aerosol size distributions as a function of altitude. The particle concentrations, surface area concentrations, and size distributions are normalized to STP (273.15 K and 101.325 kPa). Note that the SO2 mixing ratio is corrected by a constant offset so that the minimum mixing ratio value is set to 0.
NPF in the upper BL
During the HI-SCALE campaign, several NPF events occurred in the upper BL, which could not be captured by the ground-based measurements. An example case on 14 May 2016 is shown in Fig. 8. The vertical profiles of the potential temperature, LWC (Fig. 8a), and CO mixing ratio (Fig. 8c) show a relatively well-mixed BL with a height of ∼ 1000 m. Strong NPF occurred in the upper BL between 600 and 1000 m, as shown by the high concentration of nucleation-mode aerosols (Fig. 8d) and N3–10 (Fig. 8b). The NPF occurred in the upper BL, where the pre-existing aerosols may be removed through cloud processing and precipitation (which occurred at 19:20 LT on the previous day), where a Stot of around 50 µm2 cm−3 is observed. The spatial scale of this NPF event is shown in Fig. S10a, where NPF occurred in the upper BL, while the N>3/N>10 near the surface is relatively low. This is indicated by the surface measurements of aerosol size distributions, which did not observe the formation of particles below 30 nm. Instead, particles of ∼ 30 nm appeared at 16:00 LT (the flight measurement was conducted between 12:40 and 15:30 LT), suggesting that 30 nm particles were transported vertically due to the mixing of the upper BL air with the surface.
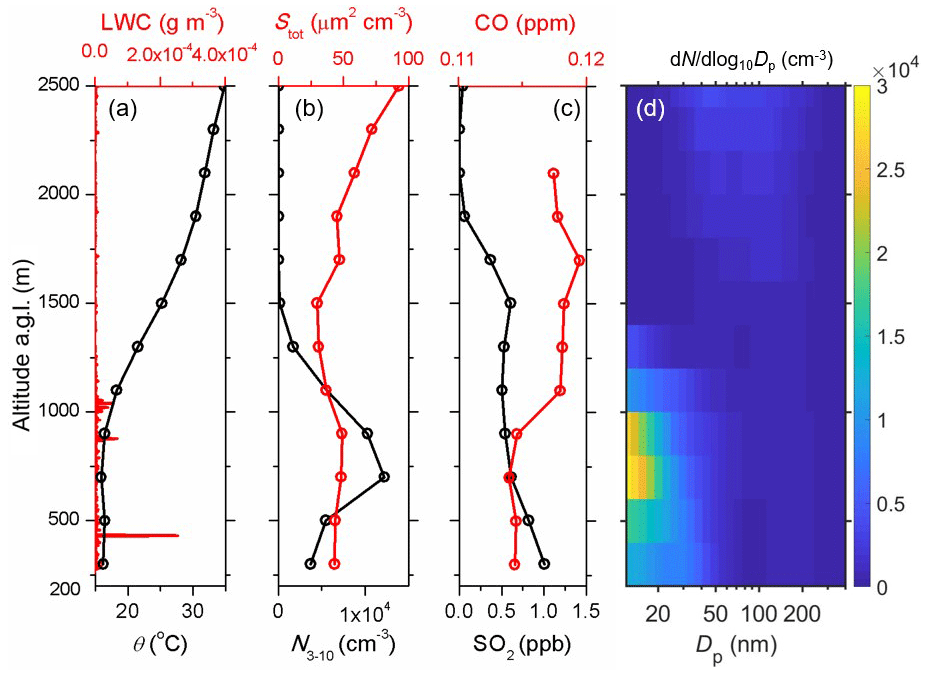
Figure 8Vertical profiles of parameters during an NPF event occurring at the upper boundary layer over the SGP site on 14 May 2016. (a) θ and LWC. (b) Concentration of particles between 3 and 10 nm (N3–10) and total aerosol surface area concentration. (c) Mixing ratios of carbon monoxide (CO) and sulfur dioxide (SO2). (d) Vertical profile of aerosol size distributions as a function of altitude. The particle concentrations, surface area concentrations, and size distributions are normalized to STP (273.15 K and 101.325 kPa). Note that the SO2 mixing ratio is corrected by a constant offset so that the minimum mixing ratio value is set to 0.
Since NPF events generally occur during the daytime, the upper BL may be the residual layer that developed above the nocturnal boundary layer. Due to the formation of the stable nocturnal boundary layer, the emission from the surface, including the gaseous precursors for NPF, will have less impact on the residual layer. As the BL gradually mixes, the gaseous precursors are transported to the upper BL, where the lower temperature and the higher actinic flux at the cloud level may promote the NPF, similar to the findings in the recent work modeling the vertical profile of NPF at the SGP (O'Donnell et al., 2023). However, it should be noted that, in this case, the SO2 concentration at the cloud level is lower than that near the surface. This may be for the following reasons: (1) the low Stot plays a dominating role in promoting NPF, and a SO2 mixing ratio of 0.5 ppb is already sufficient for initiating NPF; (2) NPF events that occurred in the residual layer above the BL and the newly formed particles were further mixed down to the upper BL (Lampilahti et al., 2021; Beck et al., 2022), where the SO2 in the upper BL is not related to the NPF events; (3) SO2 was depleted in the upper BL due to its oxidation to sulfate that promoted the NPF event in the upper BL; (4) different nucleating precursors, such as amines and extremely low volatility organic compounds (ELVOCs), were involved in this NPF event.
As shown in Fig. 8d, after the particles are formed in the upper BL, they grow to larger sizes as they are transported to the surface. These newly formed particles can grow to sizes capable of acting as CCN and contributing to cloud formation. Previous balloon-borne measurements over the SGP observed similar NPF events in the upper BL, reaching an altitude of around 400 m (Chen et al., 2018). Our measurements show that NPF events may occur at even higher altitudes in the BL and influence the measurement at the surface. Depending on the atmospheric stability, these newly formed particles may take 0.5 h to several hours to be transported to the surface (Chen et al., 2018). The study on the long-term monitoring of aerosol size distributions at the SGP site examined the correlation between the BL height and the occurrence of high concentrations of particles between 7 and 30 nm (N7–30 nm), which is an indicator of NPF (Marinescu et al., 2019). The study found that weekly periods with more consistent diurnal cycles in N7–30 nm were associated with deeper BLs that extended into the late afternoon and evening hours, suggesting that BL development may play an important role in NPF events observed at the surface. These results concerning the NPF and BL structure highlight the importance of directly measuring the vertical profiles of aerosols and trace gas properties for a better understanding of NPF mechanisms. Since most climate simulations use data collected from ground observation, NPF occurring in the upper atmosphere and its influence on the surface measurements need to be examined in more detail.
NPF in the lower FT
NPF occurs regularly in the FT due to the low surface area of pre-existing aerosols, colder temperatures, and higher actinic flux (Bianchi et al., 2016; Williamson et al., 2019). During the HI-SCALE campaign, limited by the altitude of G-1 (generally below 2500 m), observations were made in the lower FT, where NPF was not as frequent as that in the BL. The intensity of the NPF was also lower, as shown in the example case on 13 May 2016 (Fig. 9). In this event, NPF was observed between 1800 and 2200 m (Fig. 9b and d), which is above the BL with a height of around 1000 m determined based on the potential temperature profile (Fig. 9a). The NPF event coincided with a minor increase in the SO2 mixing ratio (∼ 0.3 ppb, Fig. 9c), showing that the NPF may be initiated by sulfuric acid. Stot at the NPF layer (∼ 55 µm2 cm−3) was of a similar order of magnitude compared to the surface (∼ 80 µm2 cm−3), suggesting that the colder temperature and the higher actinic flux may play a more significant role in this NPF event. In addition, compared to the NPF events in the BL (Figs. 7 and 8), the concentration of the newly formed particles in the lower FT is lower. The spatial scale of this NPF event can be shown in Fig. S11a, where the region of NPF is relatively localized above the BL. Surface measurement of aerosol size distributions also shows good agreement with the flight measurement (Fig. S11b). In order to have an impact on cloud formation, these newly formed aerosols in the lower FT need to be first transported into the BL via entrainment or convective downdraft (Sect. 3.4.2 and 3.4.3) and further grow to CCN-relevant sizes, which are more complex compared to the processes involving newly formed particles in the BL that can readily grow and contribute to CCN. Therefore, the climate impact of these particles formed in the lower FT over the SGP may be small. We should note that it is also possible that these newly formed particles may be generated from NPF in the residual layer developed overnight (a mechanism similar to the discussion regarding NPF in the upper BL), as the BL height reached 1700 m on the previous day before the development of the nocturnal boundary layer. If so, the NPF cases shown in Figs. 8 and 9 may both occur in the residual layer but are observed before (Fig. 9) and after (Fig. 8) entrainment into the BL. Given that these NPF events occur at the higher altitudes and that there are limited observations regarding NPF in these locations, the mechanisms associated with NPF events require more investigation.
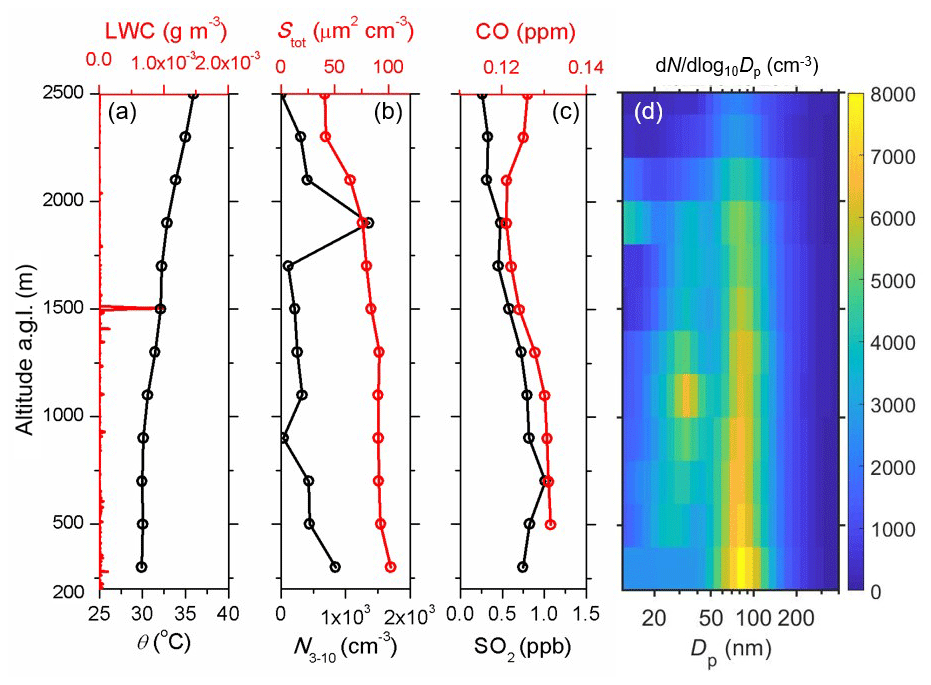
Figure 9Vertical profiles of parameters during an NPF event occurring in the free troposphere over the SGP site on 13 May 2016. (a) θ and LWC. (b) Concentration of particles between 3 and 10 nm (N3–10) and total aerosol surface area concentration. (c) Mixing ratios of CO and SO2. (d) Vertical profile of aerosol size distributions as a function of altitude. The particle concentrations, surface area concentrations, and size distributions are normalized to STP (273.15 K and 101.325 kPa). Note that the SO2 mixing ratio is corrected by a constant offset so that the minimum mixing ratio value is set to 0.
3.3.2 Condensational growth
The growth of nucleation- and Aitken-mode aerosols is commonly observed at the SGP (Hodshire et al., 2016; Marinescu et al., 2019; Wang et al., 2006). The growth of these aerosols is also shown in Fig. 8d, where recently formed particles in the upper BL of below 10 nm grow to ∼ 20 nm as they are transported to the surface of the SGP. The particles can grow through different dynamic approaches, including coagulation, condensation, and volume-controlled processes. The growth of these particles by coagulation is unlikely since the characteristic coagulation time (τ = ; β is the coagulation coefficient, and N is the total aerosol concentration) is more than 80 h (Friedlander, 2000), much longer than the mixing time in the BL. A previous study at the SGP using size-dependent growth law analysis shows that volume-controlled processes dominated the aerosol growth above 60 nm, and sulfate accounts for 50 % to 72 % of the increase in aerosol volume concentration, with the rest likely due to secondary organic species (Wang et al., 2006). The size-dependent growth rate analysis shows that particle growth below 60 nm is likely influenced by condensation (Wang et al., 2006). A more recent study by Hodshire et al. (2016) measured the gas and particle compositions during NPF events at the SGP in spring 2013 and suggested that the growth of the newly formed particles from 10 to 20 nm can be explained by either sulfuric-acid-forming salts with atmospheric bases (either ammonia or amines), the condensation of primarily nonreactive organics, or a combination of these two. The study highlights that, in addition to sulfuric acid, ELVOCs are very important for growth in the rural setting of the SGP. The aerosol measurement in a southern African grazed savannah grassland environment showed that, depending on the gaseous precursors and the size of the newly formed particles, the aerosol growth can be dominated by either sulfuric acid accompanied by ammonium or by organic compounds originating in either biogenic emissions or savannah fires (Vakkari et al., 2015). The contribution of sulfuric acid was larger during the early phases of the growth, but under clean conditions, organic compounds dominated the growth from 1.5 nm up to climatically relevant sizes.
3.3.3 Cloud processing
Cloud processing converts CCN to cloud droplets, reducing the number of aerosols through scavenging and enlarging the size of aerosols after cloud droplets are evaporated. At the same time, aqueous reactions in the cloud droplets accumulate mass in the droplet, also enlarging aerosol size upon evaporation (Wang et al., 2007). An example of how cloud processing influences the vertical profiles of aerosols is shown in Fig. 10. The research flight on 1 May 2016 observed a decoupled BL structure with a lower surface layer up to 800 m and an upper layer reaching 1500 m. Inside the surface layer, the aerosol size distribution is bimodal and independent of altitude. Inside the upper layer, cumulus clouds are distributed between the altitudes of 1000 and 1500 m, and the concentration of accumulation-mode aerosols is significantly reduced because of coalescence scavenging by the cumulus clouds. The lower concentration of accumulation-mode aerosol indicates that surface measurements may overestimate the concentrations of CCN that are relevant for cumulus cloud formation when the BL is decoupled. The concentration of Aitken-mode aerosols also exhibits a decreasing trend with altitude due to interstitial coagulation with cloud droplets. We notice that the size of the accumulation-mode aerosols increased inside the upper BL (165 nm) compared to that near the surface (150 nm), as shown by the black line in Fig. 10b. This increase in the accumulation-mode aerosol size is likely due to the aqueous-phase reaction (sulfate production) in cloud droplets, which was also observed in a flight measurement campaign at the SGP site in 2003 (Wang et al., 2007). Measurements and model calculations in that study show that the aqueous-phase reaction is sufficiently fast to overcome the homogenization resulting from turbulent mixing, leading to a vertical heterogeneity in aerosol size distributions. Coalescence scavenging of aerosols in the cloud layer also contributes to particle mass accumulation and particle size increase upon evaporation of the cloud droplets. The accumulation-mode aerosol size increase is shown in the mean size distribution over summer but not in spring (Fig. 4), which could be due to the higher SO2 concentration (Fig. S5c) and stronger aqueous-phase oxidation in summer. Note that the cloud droplet measurement during the HI-SCALE campaign also shows that droplet size during summer is approximately 2 µm larger than that during spring, although the cloud frequency was less during summer (Fast et al., 2019). Therefore, it is likely that the difference in the type of clouds can also lead to different properties of the accumulation-mode aerosols.
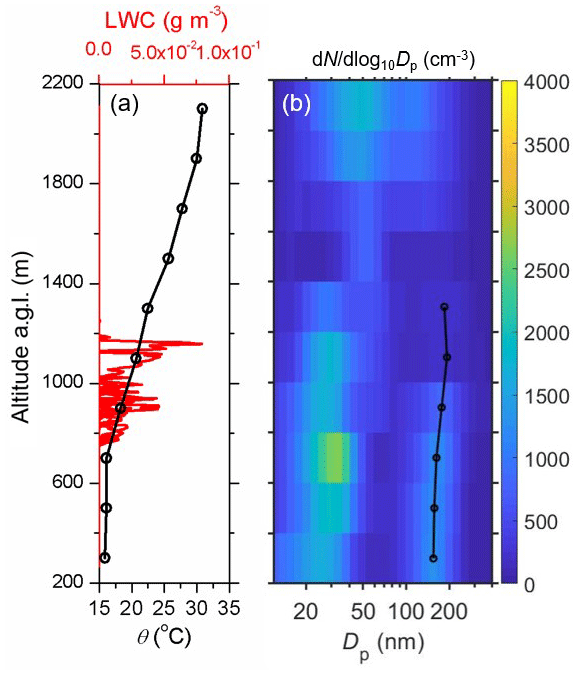
Figure 10Vertical profiles of parameters during a cloud processing event over the SGP site on 1 May 2016. (a) θ and LWC. (b) Vertical profile of aerosol size distributions as a function of altitude. The black line shows the mode diameter of the accumulation-mode aerosols. The particle concentrations, surface area concentrations, and size distributions are normalized to STP (273.15 K and 101.325 kPa).
3.4 Transport processes influencing the vertical distributions of aerosols
3.4.1 Mixing in the boundary layer
Since the aerosols travel with the air mass, the vertical distribution of aerosols is largely dependent on atmospheric stability. The HI-SCALE campaign contains several same-day flights during summer to examine the temporal variation of aerosols over the SGP, where the influence of the BL structure on the vertical distribution of aerosols can be examined. Figure 11 shows the measurement on 4 September 2016 conducted from 09:00 to 12:00 LT (Fig. 11a) and then from 14:00 to 15:00 LT (Fig. 11b). A stable BL can be observed during the morning measurements, as indicated by the inversion of the potential temperature (Fig. 11a). Cumulus clouds can be observed at the altitudes of 1700 to 2100 m, which separates the BL and FT. At this time, the nocturnal boundary layer that developed overnight has not been affected significantly by surface warming, and therefore the surface emission is largely constrained near the ground, leading to a high concentration of aerosols at around 100 nm (∼ 5100 cm−3, Fig. 11b). The upper BL (1000 to 2000 m), which corresponds to the altitude range of the residual layer that developed overnight, has a significantly lower concentration of aerosols (∼ 1500 cm−3) and a larger accumulation-mode aerosol size compared to the surface, likely due to the lack of an emission source and cloud processing that removes and conditions pre-existing aerosols. This difference in concentration leads to a large gradient in aerosol concentration.
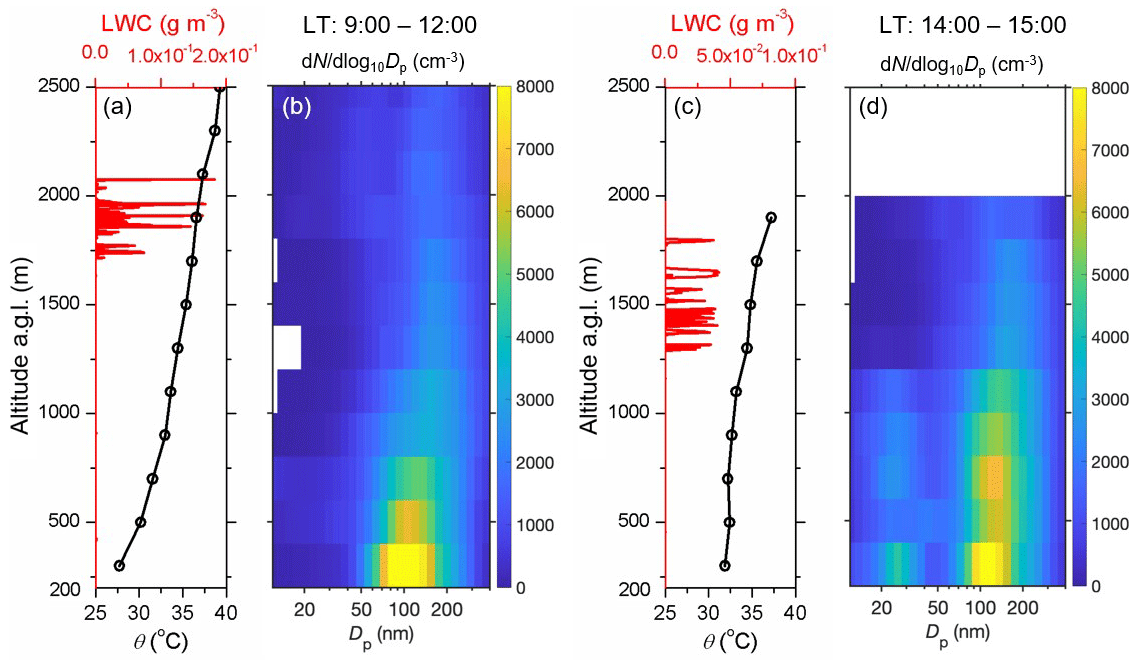
Figure 11Vertical profiles of parameters over the SGP site on 4 September 2016. Panels (a) and (b) correspond to a local time of 09:00 to 12:00, and panels (c) and (d) correspond to a local time of 14:00 to 15:00. Panels (a) and (c) show θ and LWC. (b, d) Vertical profile of aerosol size distributions as a function of altitude. The size distributions are normalized to STP (273.15 K and 101.325 kPa).
The flight measurement in the afternoon shows an evolved BL structure where the air below an altitude of 1000 m is relatively well mixed, as indicated by the relatively constant potential temperature (Fig. 11c). This mixing in the BL led to a more uniform distribution of the aerosol size distribution in the lower BL, and the total concentration of aerosols varied between 4000 and 5200 cm−3 within the BL at different altitudes. In addition to the accumulation-mode aerosols, nucleation-mode and Aitken-mode aerosols emerge in the lower BL, likely due to NPF events or air mixing from another location. The mode size of the accumulation-mode aerosols changed from 110 nm in the morning to 130 nm in the afternoon, potentially due to particle growth in the BL, although the influence of air-mass change cannot be ruled out. The slow growth of the accumulation-mode aerosols compared to the nucleation-mode and Aitken-mode aerosols is caused by their larger surface area, which requires a larger mass of condensing vapors to grow the particle size. Surface measurements conducted on the same day agreed in general with the flight observations (Fig. S12), showing a gradual growth in the size of the accumulation-mode aerosols during the day and the emergence of aerosols below 30 nm between 14:00 and 15:00 LT. In the upper BL, where cumulus clouds are located (> 1200 m), the aerosol size distributions measured in the afternoon are similar to those measured in the morning (Fig. 11b and d), indicating that the BL is still not completely well mixed at this time. The results show that, due to the daily evolution of the BL structure, the aerosols at the cloud level over the SGP may not be strongly related to the aerosols monitored at the surface. This time-dependent mixing of aerosols may further complicate our understanding of aerosol–cloud interactions.
3.4.2 Entrainment transport
Entrainment at the top of the BL is a slow process that exchanges the air between the BL and FT, affecting the vertical distribution of aerosols in the upper BL and lower FT. Generally, due to the higher concentration of aerosols in the BL at the SGP (especially in summer, as shown in Fig. 4b), entrainment brings cleaner FT air to the BL and dilutes the aerosols in the BL. Such an entrainment process can be observed in Fig. 11a and b (case also shown as an example of mixing in the BL), where the higher concentration of accumulation-mode aerosols emitted from the surface was transported across the cloud top into the lower FT. The continuous-mode sizes of the accumulation-mode aerosols through 1250 to 2500 m show that the aerosols in the upper BL and lower FT are related. The aerosols transported into the FT are less influenced by cloud scavenging and other sinks and, therefore, have a longer lifetime in the atmosphere and may influence other locations through long-range transport. During the HI-SCALE campaign, there are also events where high concentrations of FT aerosols are entrained into the cleaner BL, and an example case on 25 April 2016 is shown in Fig. 12a and b. In this event, the aerosols at around 50 nm in the lower FT above 1200 m are entrained into the cleaner upper BL, and the entrained aerosols grow further as they are transported to the surface.
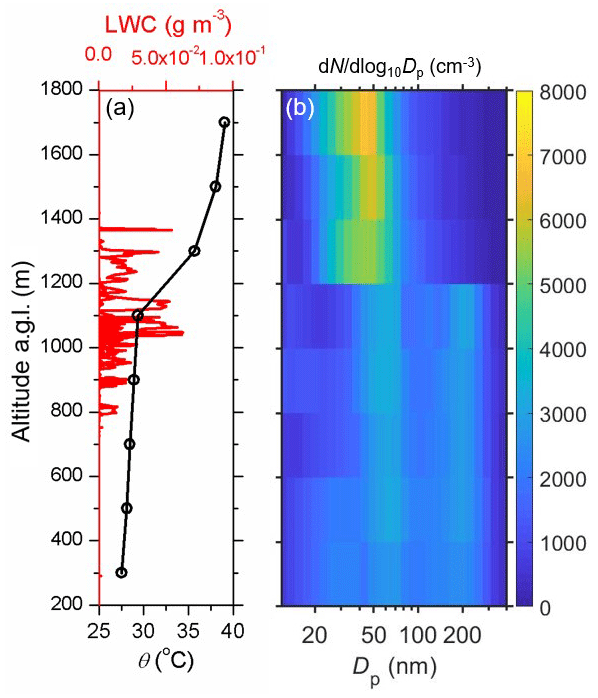
Figure 12Vertical profiles of parameters during an entrainment event over the SGP site on 25 April 2016. (a) θ and LWC. (b) Vertical profile of aerosol size distributions as a function of altitude. The particle concentrations, surface area concentrations, and size distributions are normalized to STP (273.15 K and 101.325 kPa).
The flux of aerosols transported through entrainment can be estimated based on the concentration gradient built between the lower FT and upper BL and the entrainment velocity. The entrainment flux Fx,ent can be estimated as
where we is the entrainment velocity, and NFT and NBL are the average concentrations of aerosols in the lower FT and upper BL, respectively (Wang et al., 2021). The value of we largely varies by location, and a recent study at the SGP reported a mean entrainment velocity of 0.74 ± 0.15 cm s−1 (Albrecht et al., 2016). Taking into account the seasonal variation of the average BL height (Sect. 3.1), we further calculated the NFT and NBL based on the average aerosol concentration 200 m above and below the top of the BL. The influx of N>10 from the FT to the BL due to entrainment is estimated as −3.25 ± 0.66 × 10⁷ and −7.56 ± 1.53 × 10⁷ for the spring campaign and summer campaign, respectively, based on the entrainment velocity determined by Albrecht et al. (2016). Overall, entrainment serves as a sink of aerosols in the BL, which dilutes the aerosols in the BL of the SGP. Entrainment dilutes BL aerosols more effectively in the summer G-1 sampling periods than in the spring G-1 sampling periods due to the larger difference in aerosol concentrations across the top of the BL.
3.4.3 Convective transport
Mid-latitude mesoscale convective systems (MCSs) are often associated with frontal intrusions that can transport air mass horizontally. Transport within convective clouds can also exchange aerosols between the FT and BL locally and episodically, in contrast to more prevalent entrainment. Data collected from the HI-SCALE campaign show that deep-convection events affected aerosol properties at the SGP, potentially through both horizontal and vertical transport processes. Here, deep convection is characterized by a strong equivalent radar reflectivity factor (Z > 50 dBZ) and intense mean Doppler velocity values that are indicative of strong vertical air velocities (> 5 m s−1) in the convective core, as estimated by the ARM Radar Wind Profiler (RWP). A recent study on the characteristics of midlatitude MCSs suggested that the squall lines associated with mature convection over the SGP are often characterized by strong precipitation-driven downdrafts originating at altitudes higher than 6 km (Wang et al., 2019). An example MCS from 9 September to 10 September 2016 is shown in Figs. 13 and 14. On this day, a squall line passage with cloud (echo) top heights exceeding 12 km is observed between 21:30 and 22:00 LT on 9 September, followed by stratiform precipitation from 22:30 local time (LT; the time zone for all instances in the text is LT) on 9 September to 02:00 on 10 September (Fig. 13a). Figure 13b shows the mean Doppler velocity during this MCS, where a positive value indicates downward motion and a negative value indicates upward motion. These velocity estimates combine contributions from the air motions and hydrometeor fall speeds. For this example, one marker of the intensity of drafts in these core regions is evident in mean Doppler velocity values near and above the melting layer that exceed 10 m s−1, well beyond expected hydrometeor fall speeds for those altitudes and indicative of coherent downdrafts.
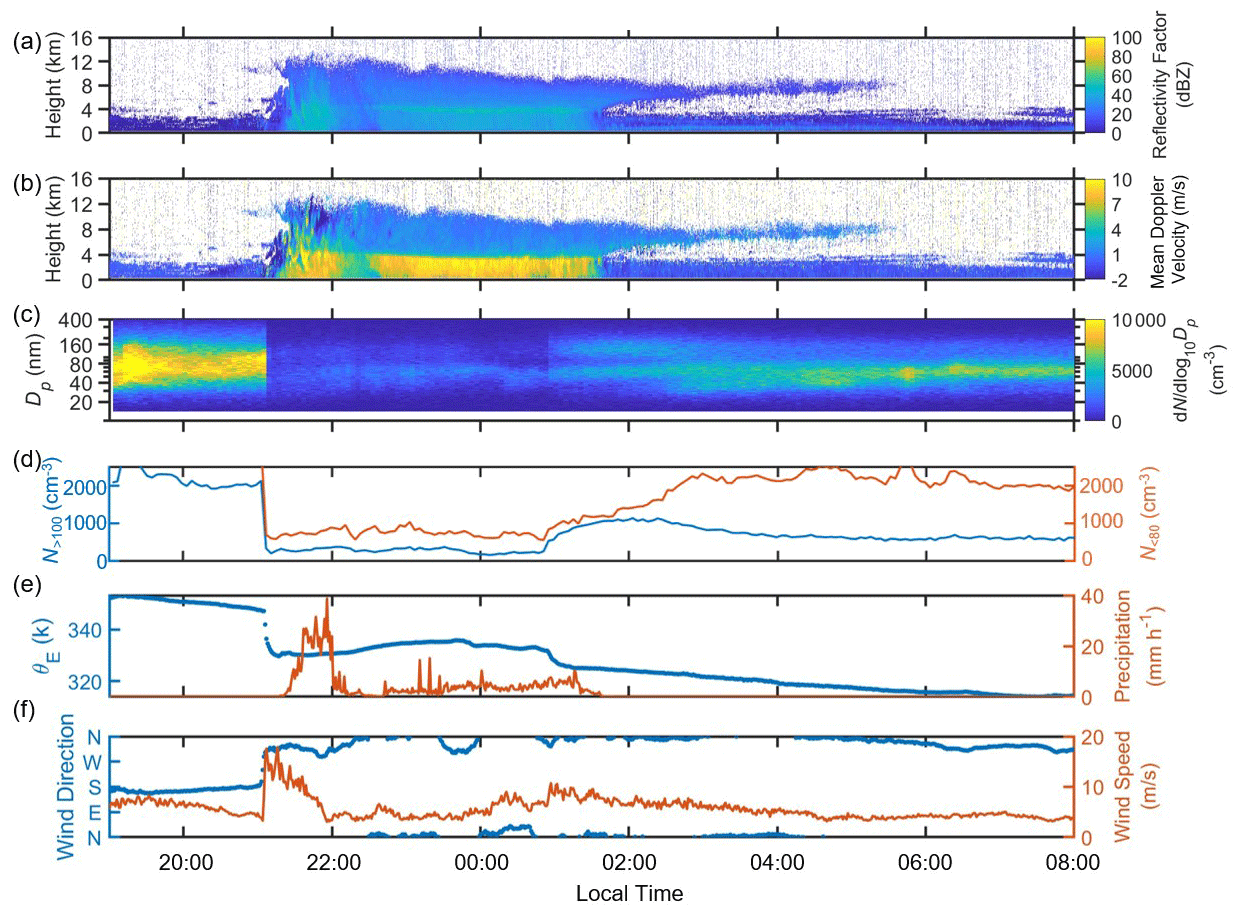
Figure 13Ground measurements of aerosol, cloud, and meteorological properties during the convective downward transport event from 9 to 10 September 2016. (a) Cloud reflectivity measured by the RWP. (b) Mean Doppler velocities measured by the RWP. A positive value indicates downward motion. (c) Aerosol size distributions measured by a scanning mobility particle sizer (SMPS). (d) Concentration of aerosols with sizes above 100 nm (N>100) and below 80 nm (N<80). (e) Equivalent potential temperature and precipitation rate measured by the weather station. (f) Wind direction and wind speed measured by the weather station.
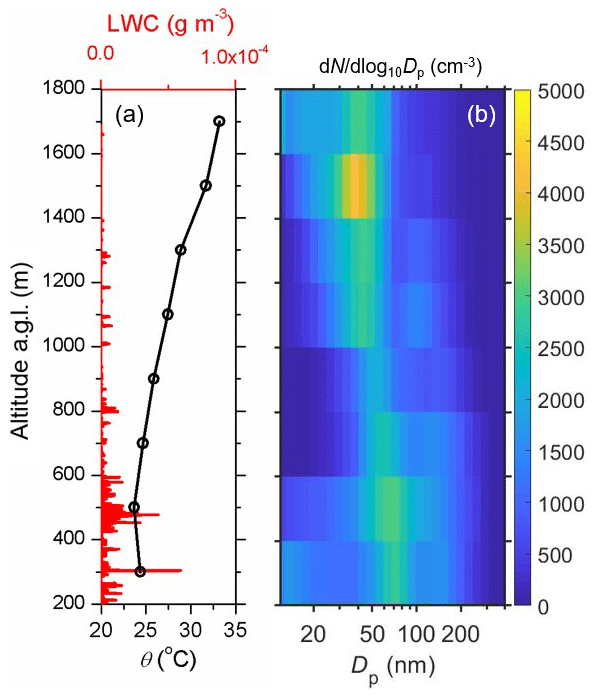
Figure 14Vertical profiles of parameters during a convective downward transport event over the SGP site on 10 September 2016. (a) θ and LWC. (b) Vertical profile of aerosol size distributions as a function of altitude. The particle concentrations, surface area concentrations, and size distributions are normalized to STP (273.15 K and 101.325 kPa).
This deep-convection event is accompanied by significant decreases in aerosol concentrations (Fig. 13c and d) and equivalent potential temperature (θE, Fig. 13e) and changes in surface wind speed and direction (Fig. 13f). The decrease in θE is a separate indicator of the convective downdraft, which vertically transports air mass from the FT to the BL. Its decrease by 15 K takes place ∼ 15 min before precipitation, which is associated with the advancing cold pool–downdraft outflow developed with this squall line and precedes its arrival at the SGP site. Similarly, the change in the wind direction (from south to northwest and then to the north) and wind speed (from ∼ 5 to ∼ 15 m s−1) also indicates the horizontal transport of the air mass associated with the cold pool. This combined transport process potentially leads to a change in aerosol size distributions. Before the deep-convection event (10 min before the decrease in θE), the aerosols have an average total concentration of ∼ 1.4 × 104 cm−3 and a mode diameter of ∼ 91 nm. Aerosols during the deep convection (between 22:10 and 02:00) had a reduced average total concentration of ∼ 2600 cm−3 and a smaller mode diameter of ∼ 45 nm. We further calculated the concentrations of aerosols above 100 nm (N>100) and below 80 nm (N<80) during this event. There was an increase in N<80 between 21:10 and 23:00 (increasing from ∼ 600 to ∼ 1000 cm−3, Fig. 13d), while N>100 remained relatively constant during this period. This change in aerosol properties may be explained by the horizontal transport of air mass, but at the same time the vertical transport of FT air to the BL may also contribute to the change in aerosol properties. Generally, the FT is a source of ultrafine particles in the nucleation mode and Aitken mode due to the prevalent NPF events (Bianchi et al., 2016; Williamson et al., 2019). A study conducted in the Amazon rainforest showed that strong convective downdrafts and subsequent weaker downward motions in the trailing stratiform regions of MCSs are capable of transporting ultrafine aerosols from the FT to the BL (Wang et al., 2016). These vertically transported ultrafine aerosols can grow to CCN sizes and may affect subsequent cloud formation.
In this deep-convection event at the SGP site, a phenomenon similar to that of the Amazon rainforest is observed, where the Aitken mode at ∼ 45 nm emerged during the deep convection (Fig. 13c). The change in aerosol size distribution between 22:00 and 01:00 may be due to the weaker air downward transport in the stratiform regions from different altitudes, but at the same time it may be a result of condensational growth in the BL, where precipitation removed larger particles serving a condensation sink. Since no flights were conducted closely before and after the deep-convection event, we examined the research flight conducted between 11:00 and 13:00 on 10 September, around 10 h after the deep-convection event. Back-trajectory analysis shows that the air masses arriving at 500, 1000, and 1500 m over the SGP site during the flight sampling period agree well with the path of the MCS (Fig. S13) and wind direction (Fig. 13f), suggesting that the air mass sampled during the research flight represents the air mass impacted by the deep convection. Moreover, the back-trajectories indicate vertical air motion from the FT to the BL. The vertical profile of aerosol size distributions (Fig. 14) shows the impacts of the downward transport of aerosols, where the lower FT (1000 to 1800 m) and BL (below 1000 m) aerosols are dominated by the Aitken-mode aerosols and the aerosol size distributions from the surface to the lower FT are continuous, suggesting that the aerosols in the BL are transported from the FT.
Assuming the vertical profile of aerosol size distributions measured on 10 September is the same as that during the deep-convection event, we can estimate the influx of aerosols from the FT to the BL between 21:30 and 22:00 by
and wd is the downdraft velocity measured by the RWP. We use the mean concentration of aerosols between 1000 and 1800 m to represent the FT aerosol concentration (NFT), which is 1790 ± 280 cm−3. The concentrations of aerosols below 1000 m are used to calculate the BL aerosol concentration (NBL), which is 1540 ± 540 cm−3. wd can be estimated from the mean Doppler velocity in Fig. 13b, which is a summation of hydrometeor fall speed and downdraft velocity. In general, hydrometeor fall speed is between 6 and 8 m s−1. Considering this effect, since the mean Doppler velocity at the altitude of 1000 m (through the boundary between FT and BL) between 21:30 and 22:00 is approximately 8.4 m s−1, wd is on the order of 1 m s−1. Therefore, the influx of N>10 from the FT to the BL due to the convective downdraft is approximately 2.50 × 10⁴ for this event. Considering that the period of strong convective downdraft lasted 0.5 h (21:30 to 22:00), the total exchange of N>10 from the FT to the BL during this period is approximately 4.50 × 107 cm−2, which is comparable to the absolute exchange of N>10 due to entrainment for a single day. Note that, here, we ignored the subsequent weaker downward motions in the trailing stratiform regions of MCS between 22:00 and 02:00, which may further contribute to the flux of aerosols. Assuming that the BL is well mixed and that there are no other sources or sinks of aerosols, we could estimate the impact of this event on the total aerosol concentration measured at the surface. This can be done by dividing the total exchange (4.50 × 107 cm−2) by the BL height (assumed to be 1 km), which yields an increase in the aerosol concentration of 450 cm−3. Note that this value is similar to that observed in the increase in N<80 between 21:10 and 23:00 (from ∼ 600 to 1000 cm−3), suggesting that the increase in the Aitken-mode aerosols during MCSs may be related to the convective downdraft.
Compared to the vertical transport of these particles by entrainment mixing, which is slower but more prevalent, the deep-convection downdraft process is more rapid and efficient in the vertical transport of aerosols, replenishing the BL with aerosols after wet deposition. However, most current climate models do not include this vertical transport as a source of CCN, as climate models use convective transport parameterization that does not reflect cloud-resolved properties at a high resolution. Moreover, there are not many direct measurements of these processes to confirm the impact of convective downdraft on aerosols. The frequency of deep-convection events varies significantly with geographic location, and thus their contributions to CCN are unpredictable. Future work is needed to investigate further this mechanism's importance under wide geographical and seasonal conditions. Also, as shown in this studied case, it is challenging to differentiate between horizontal and vertical transport of aerosols. Research flights conducted adjacent to deep-convection events or flux towers monitoring aerosol and trace gas properties may help isolate the influences of these two processes.
3.4.4 Long-range transport
As shown in the vertical profiles of aerosol size distribution, the aerosol concentrations are generally higher in the BL than in the FT due to the strong emission from the surface at the SGP. However, we observed unusually high aerosol concentrations in the FT in several flight observations, which are due to the long-range transport events. Such events are more prevalent in the spring due to the dominant air mass from north to west potentially influenced by wildfire emissions which injected aerosols into the FT. An example event of long-range transport on 28 April 2016 is shown in Fig. 15. The BL height is around 1000 m, based on the vertical profile of CO, and it is not fully mixed, as indicated by the gradual increase in the potential temperature. Due to the insufficient mixing in the BL, a high concentration of Aitken-mode aerosols near the surface of the SGP is observed.
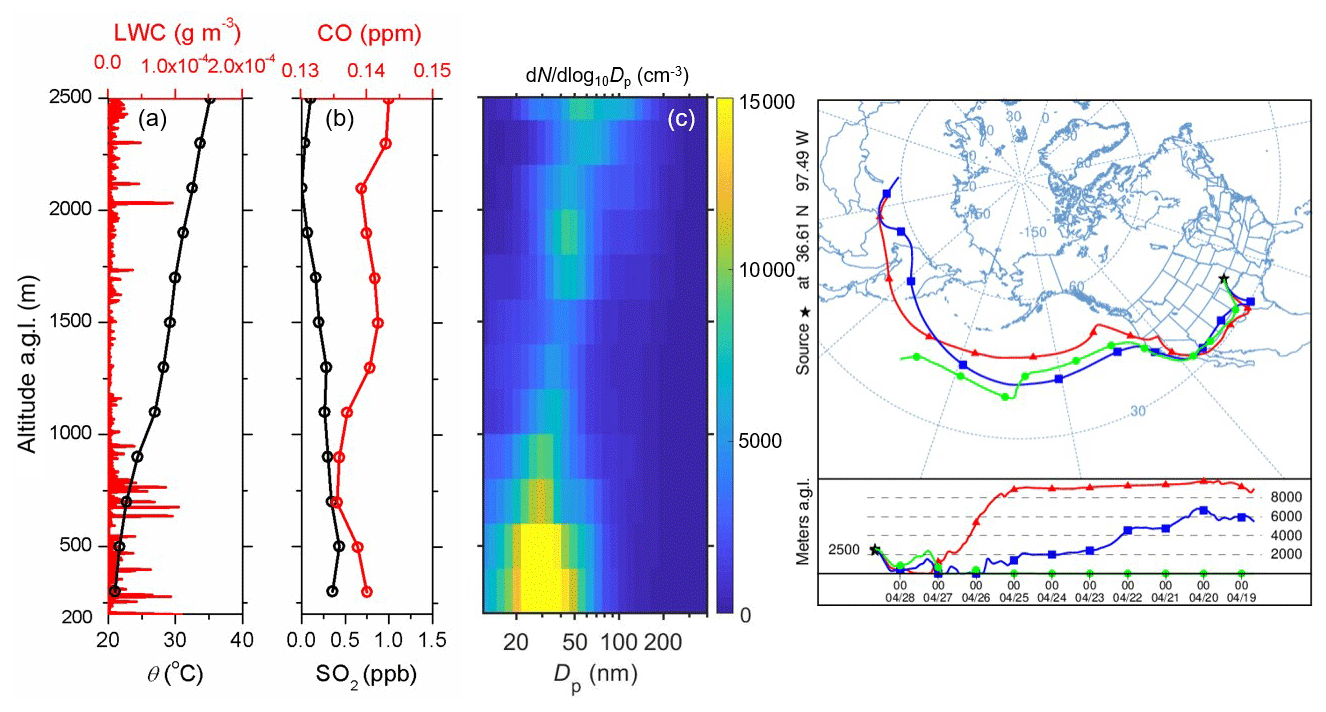
Figure 15A long-range transport event observed during the research flight on 28 April 2016. (a) Vertical profiles of θ and LWC. (b) Mixing ratios of CO and SO2. (c) Vertical profile of aerosol size distributions as a function of altitude. (d) Ten-day back-trajectories reaching an altitude of 2400 to 2600 m above the SGP on 28 April 2016. The particle concentrations, surface area concentrations, and size distributions are normalized to STP (273.15 K and 101.325 kPa). Note that the SO2 mixing ratio is corrected by a constant offset so that the minimum mixing ratio value is set to 0.
In the FT, the air is stratified, as indicated by the monotonic increase in potential temperature. We could observe elevated concentrations of aerosols at an altitude of 1600 to 2500 m (∼ 3500 cm−3) compared to the upper BL (∼ 2500 cm−3). It also appears that two layers of aerosols are observed, one at an altitude of 1600 to 2200 m and the other at 2200 to 2500 m. The lower layer is characterized by aerosols with a mode size of ∼ 40 nm, and the upper layer has a mode size of ∼ 60 nm (Fig. 15c). The two air layers also show distinct mixing ratios in CO (0.140 ppm in the lower layer and 0.144 ppm in the upper layer, Fig. 15b), as opposed to that in the boundary layer (0.135 to 0.140 ppm). We carried out back-trajectory calculations using the HYSPLIT model (Fig. 15d), and the back-trajectories indicate aerosol layers observed to have originated 10 d earlier from northeastern Asia, where fire activities were reported (Fig. S14). Note that the upper layer between 2200 and 2500 m showed a broad aerosol size distribution with larger sizes, likely caused by the particle coagulation and condensation of gas-phase species during the long-range transport (Mattis et al., 2003). Overall, both the vertical profiles of aerosol size distributions (Fig. 4a) and the back-trajectory analyses (Fig. 3) show that long-range-transported aerosols in spring play a more important role in affecting the vertical distribution of aerosols than in summer. If these transported aerosols are located near the top of the BL (unlike the aerosol layer in Fig. 15), they can be entrained into the BL and further influence the CCN activities over the SGP.
In this study, we present aerosol properties and meteorological parameters characterized on board G-1 during the spring and summer HI-SCALE campaign. The key processes that drive the aerosol population in the BL are investigated by examining the vertical variation of aerosol properties. On average, the total concentrations of aerosols (N>3) are higher in spring than in summer at all altitudes below 2500 m a.g.l. N>3 decreases significantly with altitude due to the strong surface emission sources at the SGP. Cloud processing in the upper BL removes aerosols by coalescence scavenging but at the same time grows the size of the accumulation-mode aerosols through aqueous chemistry in the cloud droplets. Aerosol concentrations in the FT are higher during spring due to the long-range transport events as the dominant air masses originating from north to west were potentially influenced by wildfire emissions.
A breakdown of the aerosol concentration based on their size ranges shows that the concentration of newly formed particles (N3–10 and N10–20) is higher in the spring, and the accumulation-mode aerosol concentration (N>100) is higher in the summer. The higher N>100 in summer is likely due to growth by aqueous chemistry in the cloud droplets and condensation of vapors transported from anthropogenic sources south and biogenic sources east of the SGP. The higher N3–10 and N10–20 in the spring are a result of stronger NPF under a lower concentration of pre-existing aerosols, especially accumulation-mode aerosols, which serve as a stronger sink of nucleating vapors and newly formed particles due to their larger surface area. The sizes of the Aitken-mode aerosols are very different (∼ 30 nm in spring and ∼ 50 nm in summer), despite their similar concentrations in the BL. The larger size of these aerosols is likely a result of enhanced condensational growth due to enriched condensable organic compounds in summer. The larger size and higher concentrations of accumulation-mode aerosols during summer correspond to higher mass concentrations of sulfate, organics, and ammonium. A lower concentration of nitrate in summer is likely driven by the temperature.
The vertical heterogeneity of aerosols over the SGP is affected by aerosol dynamics, including new particle formation, condensational growth, and cloud processing. It is also influenced by transport processes, including mixing in the BL, entrainment of FT air, convective transport, and long-range transport. A considerable number of NPF events were observed in the upper BL, and these newly formed particles can mix down to the surface as they grow larger and further contribute to the CCN population. The fluxes of aerosols transported by entrainment and convective downdraft are also estimated; however, more work is needed to differentiate between the influences of horizontal and vertical transport processes on aerosol properties. We should note that the horizontal heterogeneity could influence the analysis in this study, as indicated in Fast et al. (2022), who characterized the subgrid variability of aerosol properties using grid spacings of 3, 9, 27, and 81 km. However, as indicated by that study, the averaged aircraft-measured aerosol properties within the 81 km cell were similar to many aerosol properties measured at the SGP observatory, suggesting that averaging aircraft measurements over large spatial scales could reduce the influence of horizontal heterogeneity on aerosol properties. Since this study analyzed the averaged aerosol properties collected during the entire campaign, we believe that horizontal heterogeneity is reduced. However, we could not rule out the influence of horizontal heterogeneity when analyzing the vertical profiles in a case-by-case manner. Nonetheless, analyzing the vertical profiles of aerosols could significantly improve our understanding of the sources and sinks of aerosols in the atmosphere and greatly complements ground observations. Future work on quantifying the roles of each process in more detail is needed to understand better the aerosol life cycle, including aerosol–cloud interactions and their impact on climate.
Data from the HI-SCALE campaign are accessible via the ARM's Data Discovery upon free registration (Atmospheric Radiation Measurement User Facility, 2023, https://www.arm.gov/research/campaigns/sgp2016hiscale, last access: 1 November 2023).
The supplement related to this article is available online at: https://doi.org/10.5194/acp-23-15671-2023-supplement.
YW, CBR, MVBO, XG, JZ, JF, AM, FM, ATO, JES, JT, and JW collected and analyzed the aerosol and trace gas data aboard G-1. SEG, DW, and YW analyzed the cloud and radar data. YW and CBR prepared the manuscript with contributions from all the co-authors.
The contact author has declared that none of the authors has any competing interests.
Publisher's note: Copernicus Publications remains neutral with regard to jurisdictional claims made in the text, published maps, institutional affiliations, or any other geographical representation in this paper. While Copernicus Publications makes every effort to include appropriate place names, the final responsibility lies with the authors.
The HI-SCALE campaign was supported by the ARM Climate Research Facility and the Environmental Molecular Sciences Laboratory (EMSL) through grant nos. 48804 and 49297, both of which are U.S. DOE Office of Science User Facilities sponsored by the Office of Biological and Environmental Research. We thank Tamara Pinterich for her help in the preparation and operation of the FIMS during the campaigns. This research was supported by the Atmospheric System Research (ASR) program as part of the DOE Office of Biological and Environmental Research under grant no. DE-SC0021256. The authors thank the G-1 flight and ground crews (Mike Hubbell, Clayton Eveland, Michael Crocker, Peter Carroll, Jonathan Ray, and Dick Hone) for supporting the HI-SCALE mission. We acknowledge the use of data and/or imagery from NASA's Fire Information for Resource Management System (FIRMS) (https://earthdata.nasa.gov/firms, last access: 1 November 2023), which is part of NASA's Earth Observing System Data and Information System (EOSDIS).
This research has been supported by the Office of Biological and Environmental Research (grant nos. DE-SC0021256, 49297, and 48804).
This paper was edited by Tuukka Petäjä and reviewed by two anonymous referees.
Abdalmogith, S. S. and Harrison, R. M.: The use of trajectory cluster analysis to examine the long-range transport of secondary inorganic aerosol in the UK, Atmos. Environ., 39, 6686–6695, 2005.
Ackerman, T. and Stokes, G.: The Atmospheric Radiation Measurement program, Phys. Today, 56, 1–14, 2003.
Albrecht, B., Fang, M., and Ghate, V.: Exploring stratocumulus cloud-top entrainment processes and parameterizations by using Doppler cloud radar observations, J. Atmos. Sci., 73, 729–742, 2016.
Andrews, E., Sheridan, P. J., and Ogren, J. A.: Seasonal differences in the vertical profiles of aerosol optical properties over rural Oklahoma, Atmos. Chem. Phys., 11, 10661–10676, https://doi.org/10.5194/acp-11-10661-2011, 2011.
Atmospheric Radiation Measurement (ARM) User Facility: Holistic interactions of shallow clouds, aerosols, and land-ecosystems (HI-SCALE), Atmospheric Radiation Measurement User Facility [data set], https://www.arm.gov/research/campaigns/sgp2016hiscale, last access: 1 November 2023.
Beck, L. J., Schobesberger, S., Junninen, H., Lampilahti, J., Manninen, A., Dada, L., Leino, K., He, X.-C., Pullinen, I., Quéléver, L. L. J., Franck, A., Poutanen, P., Wimmer, D., Korhonen, F., Sipilä, M., Ehn, M., Worsnop, D. R., Kerminen, V.-M., Petäjä, T., Kulmala, M., and Duplissy, J.: Diurnal evolution of negative atmospheric ions above the boreal forest: from ground level to the free troposphere, Atmos. Chem. Phys., 22, 8547–8577, https://doi.org/10.5194/acp-22-8547-2022, 2022.
Bianchi, F., Tröstl, J., Junninen, H., Frege, C., Henne, S., Hoyle, C. R., Molteni, U., Herrmann, E., Adamov, A., and Bukowiecki, N.: New particle formation in the free troposphere: A question of chemistry and timing, Science, 352, 1109–1112, 2016.
Cai, R. and Jiang, J.: A new balance formula to estimate new particle formation rate: reevaluating the effect of coagulation scavenging, Atmos. Chem. Phys., 17, 12659–12675, https://doi.org/10.5194/acp-17-12659-2017, 2017.
Canagaratna, M., Jayne, J., Jimenez, J., Allan, J., Alfarra, M., Zhang, Q., Onasch, T., Drewnick, F., Coe, H., and Middlebrook, A.: Chemical and microphysical characterization of ambient aerosols with the aerodyne aerosol mass spectrometer, Mass Spectrom. Rev., 26, 185–222, 2007.
Chen, H., Hodshire, A. L., Ortega, J., Greenberg, J., McMurry, P. H., Carlton, A. G., Pierce, J. R., Hanson, D. R., and Smith, J. N.: Vertically resolved concentration and liquid water content of atmospheric nanoparticles at the US DOE Southern Great Plains site, Atmos. Chem. Phys., 18, 311–326, https://doi.org/10.5194/acp-18-311-2018, 2018.
Corral, A. F., Choi, Y., Crosbie, E., Dadashazar, H., DiGangi, J. P., Diskin, G. S., Fenn, M., Harper, D. B., Kirschler, S., and Liu, H.: Cold Air Outbreaks Promote New Particle Formation Off the US East Coast, Geophys. Res. Lett.-Atmos., 49, e2021GL096073, https://doi.org/10.1029/2021GL096073, 2022.
Fast, J. D., Berg, L. K., Alexander, L., Bell, D., D'Ambro, E., Hubbe, J., Kuang, C., Liu, J., Long, C., and Matthews, A.: Overview of the HI-SCALE field campaign: A new perspective on shallow convective clouds, B. Am. Meteorol. Soc., 100, 821–840, 2019.
Fast, J. D., Bell, D. M., Kulkarni, G., Liu, J., Mei, F., Saliba, G., Shilling, J. E., Suski, K., Tomlinson, J., Wang, J., Zaveri, R., and Zelenyuk, A.: Using aircraft measurements to characterize subgrid-scale variability of aerosol properties near the Atmospheric Radiation Measurement Southern Great Plains site, Atmos. Chem. Phys., 22, 11217–11238, https://doi.org/10.5194/acp-22-11217-2022, 2022.
Friedlander, S. K.: Smoke, dust, and haze: fundamentals of aerosol behavior, Oxford University Press, New York, USA, ISBN-10: 0195129997, ISBN-13: 978-0195129991, 2000.
Heinritzi, M., Dada, L., Simon, M., Stolzenburg, D., Wagner, A. C., Fischer, L., Ahonen, L. R., Amanatidis, S., Baalbaki, R., Baccarini, A., Bauer, P. S., Baumgartner, B., Bianchi, F., Brilke, S., Chen, D., Chiu, R., Dias, A., Dommen, J., Duplissy, J., Finkenzeller, H., Frege, C., Fuchs, C., Garmash, O., Gordon, H., Granzin, M., El Haddad, I., He, X., Helm, J., Hofbauer, V., Hoyle, C. R., Kangasluoma, J., Keber, T., Kim, C., Kürten, A., Lamkaddam, H., Laurila, T. M., Lampilahti, J., Lee, C. P., Lehtipalo, K., Leiminger, M., Mai, H., Makhmutov, V., Manninen, H. E., Marten, R., Mathot, S., Mauldin, R. L., Mentler, B., Molteni, U., Müller, T., Nie, W., Nieminen, T., Onnela, A., Partoll, E., Passananti, M., Petäjä, T., Pfeifer, J., Pospisilova, V., Quéléver, L. L. J., Rissanen, M. P., Rose, C., Schobesberger, S., Scholz, W., Scholze, K., Sipilä, M., Steiner, G., Stozhkov, Y., Tauber, C., Tham, Y. J., Vazquez-Pufleau, M., Virtanen, A., Vogel, A. L., Volkamer, R., Wagner, R., Wang, M., Weitz, L., Wimmer, D., Xiao, M., Yan, C., Ye, P., Zha, Q., Zhou, X., Amorim, A., Baltensperger, U., Hansel, A., Kulmala, M., Tomé, A., Winkler, P. M., Worsnop, D. R., Donahue, N. M., Kirkby, J., and Curtius, J.: Molecular understanding of the suppression of new-particle formation by isoprene, Atmos. Chem. Phys., 20, 11809–11821, https://doi.org/10.5194/acp-20-11809-2020, 2020.
Hodshire, A. L., Lawler, M. J., Zhao, J., Ortega, J., Jen, C., Yli-Juuti, T., Brewer, J. F., Kodros, J. K., Barsanti, K. C., Hanson, D. R., McMurry, P. H., Smith, J. N., and Pierce, J. R.: Multiple new-particle growth pathways observed at the US DOE Southern Great Plains field site, Atmos. Chem. Phys., 16, 9321–9348, https://doi.org/10.5194/acp-16-9321-2016, 2016.
Kuang, C., McMurry, P. H., McCormick, A. V., and Eisele, F.: Dependence of nucleation rates on sulfuric acid vapor concentration in diverse atmospheric locations, J. Geophys. Res.-Atmos., 113, D10209, https://doi.org/10.1029/2007JD009253, 2008.
Kuang, C., McMurry, P. H., and McCormick, A. V.: Determination of cloud condensation nuclei production from measured new particle formation events, Geophys. Res. Lett., 36, L09822, https://doi.org/10.1029/2009GL037584, 2009.
Kulkarni, G., Mei, F., Shilling, J. E., Wang, J., Reveggino, R. P., Flynn, C., Zelenyuk, A., and Fast, J.: Cloud Condensation Nuclei Closure Study Using Airborne Measurements over the Southern Great Plains, J. Geophys. Res.-Atmos., 128, e2022JD037964, https://doi.org/10.1029/2022JD037964, 2023.
Kulkarni, P. and Wang, J.: New fast integrated mobility spectrometer for real-time measurement of aerosol size distribution – I: Concept and theory, J. Aerosol Sci., 37, 1303–1325, 2006.
Lampilahti, J., Leino, K., Manninen, A., Poutanen, P., Franck, A., Peltola, M., Hietala, P., Beck, L., Dada, L., Quéléver, L., Öhrnberg, R., Zhou, Y., Ekblom, M., Vakkari, V., Zilitinkevich, S., Kerminen, V.-M., Petäjä, T., and Kulmala, M.: Aerosol particle formation in the upper residual layer, Atmos. Chem. Phys., 21, 7901–7915, https://doi.org/10.5194/acp-21-7901-2021, 2021.
Lee, S. H., Uin, J., Guenther, A. B., de Gouw, J. A., Yu, F., Nadykto, A. B., Herb, J., Ng, N. L., Koss, A., and Brune, W. H.: Isoprene suppression of new particle formation: Potential mechanisms and implications, J. Geophys. Res.-Atmos., 121, 14621–14635, 2016.
Liu, J., Alexander, L., Fast, J. D., Lindenmaier, R., and Shilling, J. E.: Aerosol characteristics at the Southern Great Plains site during the HI-SCALE campaign, Atmos. Chem. Phys., 21, 5101–5116, https://doi.org/10.5194/acp-21-5101-2021, 2021.
Marinescu, P. J., Levin, E. J. T., Collins, D., Kreidenweis, S. M., and van den Heever, S. C.: Quantifying aerosol size distributions and their temporal variability in the Southern Great Plains, USA, Atmos. Chem. Phys., 19, 11985–12006, https://doi.org/10.5194/acp-19-11985-2019, 2019.
Mather, J. H. and Voyles, J. W.: The ARM Climate Research Facility: A review of structure and capabilities, B. Am. Meteorol. Soc., 94, 377–392, 2013.
Mattis, I., Ansmann, A., Wandinger, U., and Müller, D.: Unexpectedly high aerosol load in the free troposphere over central Europe in spring/summer, Geophys. Res. Lett., 30, 2178, https://doi.org/10.1029/2003GL018442, 2003.
NWCG: Intermediate Wildland Fire Behavior, S-290, National Wildfire Coordinating Group, Washington DC, USA, 2007.
NWCG: Fire Behavior Field Reference Guide, Fire season climatoloty, PMS 437, National Wildfire Coordinating Group, Washington DC, USA, https://www.nwcg.gov/publications/pms437/weather/fire-season-climatology (last access: 1 November 2023), 2021.
O'Donnell, S. E., Akherati, A., He, Y., Hodshire, A. L., Shilling, J. E., Kuang, C., Fast, J. D., Mei, F., Schobesberger, S., and Thornton, J. A.: Look Up: Probing the Vertical Profile of New Particle Formation and Growth in the Planetary Boundary Layer With Models and Observations, J. Geophys. Res.-Atmos., 128, e2022JD037525, https://doi.org/10.1029/2022JD037525, 2023.
Parworth, C., Fast, J., Mei, F., Shippert, T., Sivaraman, C., Tilp, A., Watson, T., and Zhang, Q.: Long-term measurements of submicrometer aerosol chemistry at the Southern Great Plains (SGP) using an Aerosol Chemical Speciation Monitor (ACSM), Atmos. Environ., 106, 43–55, 2015.
Patel, P. N. and Jiang, J. H.: Cloud condensation nuclei characteristics at the Southern Great Plains site: role of particle size distribution and aerosol hygroscopicity, Environmental Research Communications, 3, 075002, https://doi.org/10.1088/2515-7620/ac0e0b, 2021.
Peppler, R. A., Bahrmann, C., Barnard, J. C., Campbell, J., Cheng, M.-D., Ferrare, R., Halthore, R., HeiIman, L., Hlavka, D., and Laulainen, N.: ARM Southern Great Plains site observations of the smoke pall associated with the 1998 Central American fires, B. Am. Meteorol. Soc., 81, 2563–2592, 2000.
Schmid, B., Tomlinson, J. M., Hubbe, J. M., Comstock, J. M., Mei, F., Chand, D., Pekour, M. S., Kluzek, C. D., Andrews, E., and Biraud, S.: The DOE ARM aerial facility, B. Am. Meteorol. Soc., 95, 723–742, 2014.
Smith, J. and McMurry, P.: New Particle Formation Study Final Campaign Report, edited by: Stafford, R., DOE ARM Climate Research Facility, DOE/SC-ARM-15-011, 2015.
Trishchenko, A., Luo, Y., Latifovic, R., and Li, Z.: Land cover type distribution over the ARM SGP area for atmospheric radiation and environmental research, ARM Science Team Meeting, 22–26 March 2004, Albuquerque, New Mexico, US Department of Energy, https://www.arm.gov/news/events/post/50972 (last access: 1 November 2023), 2004.
Vakkari, V., Tiitta, P., Jaars, K., Croteau, P., Beukes, J. P., Josipovic, M., Kerminen, V. M., Kulmala, M., Venter, A. D., van Zyl, P. G., and Worsnop, D. R.: Reevaluating the contribution of sulfuric acid and the origin of organic compounds in atmospheric nanoparticle growth, Geophys. Res. Lett., 42, 10–486, 2015.
Wang, D., Giangrande, S. E., Schiro, K. A., Jensen, M. P., and Houze Jr, R. A.: The characteristics of tropical and midlatitude mesoscale convective systems as revealed by radar wind profilers, J. Geophys. Res.-Atmos., 124, 4601–4619, 2019.
Wang, J., Collins, D., Covert, D., Elleman, R., Ferrare, R. A., Gasparini, R., Jonsson, H., Ogren, J., Sheridan, P., and Tsay, S. C.: Temporal variation of aerosol properties at a rural continental site and study of aerosol evolution through growth law analysis, J. Geophys. Res.-Atmos., 111, D18203, https://doi.org/10.1029/2005JD006704, 2006.
Wang, J., Daum, P. H., Kleinman, L. I., Lee, Y. N., Schwartz, S. E., Springston, S. R., Jonsson, H., Covert, D., and Elleman, R.: Observation of ambient aerosol particle growth due to in-cloud processes within boundary layers, J. Geophys. Res.-Atmos., 112, D14207, https://doi.org/10.1029/2006JD007989, 2007.
Wang, J., Krejci, R., Giangrande, S., Kuang, C., Barbosa, H. M., Brito, J., Carbone, S., Chi, X., Comstock, J., and Ditas, F. J. N.: Amazon boundary layer aerosol concentration sustained by vertical transport during rainfall, Nature, 539, 416–419, 2016.
Wang, Y., Pinterich, T., and Wang, J.: Rapid measurement of sub-micrometer aerosol size distribution using a fast integrated mobility spectrometer, J. Aerosol Sci., 121, 12–20, 2018.
Wang, Y., Zheng, G., Jensen, M. P., Knopf, D. A., Laskin, A., Matthews, A. A., Mechem, D., Mei, F., Moffet, R., Sedlacek, A. J., Shilling, J. E., Springston, S., Sullivan, A., Tomlinson, J., Veghte, D., Weber, R., Wood, R., Zawadowicz, M. A., and Wang, J.: Vertical profiles of trace gas and aerosol properties over the eastern North Atlantic: variations with season and synoptic condition, Atmos. Chem. Phys., 21, 11079–11098, https://doi.org/10.5194/acp-21-11079-2021, 2021.
Williamson, C. J., Kupc, A., Axisa, D., Bilsback, K. R., Bui, T., Campuzano-Jost, P., Dollner, M., Froyd, K. D., Hodshire, A. L., and Jimenez, J. L.: A large source of cloud condensation nuclei from new particle formation in the tropics, Nature, 574, 399–403, 2019.
Xu, L., Guo, H., Boyd, C. M., Klein, M., Bougiatioti, A., Cerully, K.M., Hite, J. R., Isaacman-VanWertz, G., Kreisberg, N. M., Knote, C., Olson, K., Koss, A., Goldstein, A. H., Hering, S. V., de Gouw, J., Baumann, K., Lee, S., Nenes, A., Weber, R. J., and Ng, N. L.: Effects of anthropogenic emissions on aerosol formation from isoprene and monoterpenes in the southeastern United States, P. Natl. Acad. Sci. USA, 112, 37–42, 2015.
Zheng, G., Wang, Y., Wood, R., Jensen, M. P., Kuang, C., McCoy, I. L., Matthews, A. A., Mei, F., Tomlinson, J. M., Shilling, J. E., Zawadowicz, M. M., Crosbie, E. C., Moore, R. H., Ziemba, L. D., Andreae, M. O., and Wang, J.: New particle formation in the remote marine boundary layer, Nat. Commun., 12, 1–10, 2021.