the Creative Commons Attribution 4.0 License.
the Creative Commons Attribution 4.0 License.
 | 20 Dec 2023
Associations of interannual variation in summer tropospheric ozone with the Western Pacific Subtropical High in China from 1999 to 2017
Xiaodong Zhang
Ruiyu Zhugu
Xiaohu Jian
Xinrui Liu
Kaijie Chen
Shu Tao
Junfeng Liu
Hong Gao
Tao Huang
Associations between tropospheric ozone (O3) and climate variations have been extensively investigated worldwide. However, given the lack of historical O3 monitoring data, the knowledge gaps regarding the influences of climate variations on long-term O3 trends in China remain. The present study used a tropospheric O3 dataset from the summers of 1999 to 2017 simulated by an atmospheric chemistry model to explore the linkage between summer O3 and a dominant atmospheric circulation system – the Western Pacific Subtropical High (WPSH) pressure – on an interannual basis in China. During this period, both WPSH strength and O3 concentrations in eastern and central China illustrated a growing trend. An EOF analysis was conducted to examine significant summer O3 characteristics and patterns and their potential connections with the WPSH. We find that the correlation between the first principal component of summer ozone concentration in the EOF analysis and the WPSH reached 0.56 (P≤0.01) in China from 1999 to 2017. We show that the WPSH determines interannual fluctuations of summer O3, whereas O3 precursor emissions contribute primarily to the O3 long-term trend. Our results reveal that the WPSH plays a vital role in O3 perturbation in the eastern seaboard regions and inland China. Precursor emissions made more significant contributions of up to 60 % to increasing O3 trends in the inland urban agglomerations than coastal regions in eastern and southern China. The strongest contribution of meteorological conditions associated with the WPSH to summer O3 occurred in the Yangtze River Delta (YRD), accounting for over 9 % to ozone perturbations from 1999 to 2017. We find that the effect of the WPSH on regional O3 depends on the spatial proximity to the WPSH. We attributed the effects of the WPSH on O3 interannual variations to the changes in air temperature, precipitation, and winds associated with the WPSH's intensity and positions.
- Article
(7336 KB) - Full-text XML
-
Supplement
(2424 KB) - BibTeX
- EndNote


Tropospheric (or surface) ozone is one of the most important components of atmospheric chemistry and has also been a prominent atmospheric pollutant in China in recent years (Ma et al., 2021). Ground-level ozone pollution has overtaken PM2.5 as the leading pollutant in many of China's urban and industrial regions (Lu et al., 2018). Surface ozone is produced through the photochemical oxidation of carbon monoxide (CO) and volatile organic compounds (VOCs) in the presence of nitrogen oxides (NOx) and sunlight (Akimoto et al., 2015; Liu and Wang, 2020; Lu et al., 2018; Ma et al., 2021). Unlike stratospheric ozone, which absorbs harmful UV radiation that could otherwise reach the Earth's surface and cause adverse health impacts on humans, surface ozone has detrimental effects on both human health and terrestrial vegetation (Brauer et al., 2012; Fleming et al., 2018; Lefohn et al., 2017; Liu et al., 2018; Liu and Wang, 2020; Monks et al., 2015; Silva et al., 2013). In the past decade, partly due to rapid economic growth and urbanization in China, surface O3 has increased dramatically (Maji et al., 2019; Zhan et al., 2018). Many urban areas across China have experienced growing ozone pollution, despite implementation of various stringent emission reduction measures since 2013 (Bell et al., 2014; Liu and Wang, 2020; Ma et al., 2016; Xu et al., 2016; Yan et al., 2013).
Surface ozone formation and evolution rely on meteorology, atmospheric chemistry, and the emissions of O3 precursors, such as VOCs and NOx emitted from fuel combustion (Li et al., 2020; Ma et al., 2021). Meteorological parameters affecting surface O3 evolution include but are not limited to winds, air temperature, relative humidity, and solar radiation (Ma et al., 2021). While anthropogenic factors play vital roles in ozone formation, meteorological factors determine, to a significant extent, the changes and evolution in O3 concentrations (Ding et al., 2019; Li et al., 2019, 2020; Lin et al., 2021, 2022). Meteorological conditions modulate O3 concentrations through atmospheric transport and affect natural emissions from biological sources and chemical reaction rates (Fu et al., 2019; Li et al., 2020; Lu et al., 2019). Extensive investigations have been devoted to the short term, such as hourly and diurnal changes in O3 levels and their associations with meteorological conditions (Dang et al., 2021; Han et al., 2020). Given the strong connections between O3 concentration and air temperature, atmospheric humidity, and winds, interannual and longer-term variations in O3 are also elucidated in China and worldwide (Chen et al., 2020; Li et al., 2020). Daily and interannual variations in summertime surface O3 have been linked to atmospheric teleconnection patterns, such as the ENSO (El Niño–Southern Oscillation), East Asian summer monsoon, and Western Pacific Subtropical High (WPSH) (Q. Liu et al., 2019; Wang et al., 2016; Yang et al., 2022; Yihui and Chan, 2005; Yin et al., 2019; Zhao and Wang, 2017; Zhou et al., 2009). These climate teleconnection patterns provide dynamic and thermodynamic backgrounds of regional and large-scale weather systems that could markedly affect the atmospheric pressure, temperature, and winds. Using modeled summer O3 time series across China from 1999 to 2017, we have examined the response of gridded summer O3 concentrations to the East Asian Summer Monsoon Index (EASMI), Niño indices, and western North Pacific subtropical high index (WPSH-I), the three climate modes influencing significantly the summer weather and climate in China, on an annual basis in the six major urban agglomerations (UAs) in China (Zhang et al., 2022). The correlation coefficients between the summer O3 concentrations and the three climate modes from 1999 to 2017 are 0.54 (WPSH-I, p = 0.016), 0.38 (Nino indices, p = 0.105), and 0.27 (EASMI, p = 0.267), respectively. The results revealed that interannual changes in summer O3 averaged over these UAs were more significantly associated with WPSH-I among the three atmospheric teleconnection patterns. The finding motivates us to carry out broader and deeper investigations of the associations between the long-term change in summer O3 and the WPSH, aiming to shed new light on the extent of the impact of climate variation on O3 trends in urban China.
Limited studies have been carried out to examine the linkage of summer O3 in China with the WPSH (Jiang et al., 2021; Yin et al., 2019; Zhao and Wang, 2017; Q. Liu et al., 2019). These studies all focused on the response of daily and short-term summer O3 variation to the WPSH in eastern China using measured O3 concentrations within a short period (e.g., 2015–2018; Yin et al., 2019). The common conclusions of these studies were that a stronger WPSH tended to increase daily surface ozone concentration over northern China but reduce it over southern China, which was partly attributed to a stronger southwesterly transport of moisture into southern China that was not conducive to ozone formation. However, the associations between interannual or longer-term variations in the WPSH and interannual or longer ozone trends in mainland China are almost unknown. To fill this knowledge gap, we performed multiple atmospheric chemistry model simulations of summer (June, July, and August) O3 concentrations across China from 1999 to 2017. This O3 dataset enables us to explore the responses of the long-term trend and interannual variation in O3 concentrations to climate variations and to take a broader look at the associations between ozone evolution and the Western Pacific Subtropical High in China (Zhang et al., 2022).
2.1 The Weather Research and Forecasting model coupled with Chemistry (WRF-Chem) model configuration
WRF-Chem v3.7 (http://www2.mmm.ucar.edu/wrf/users/wrf_files/wrfv3.7/updates-3.7.html, last access: 7 December 2023) was employed to quantify the influences of the WPSH on O3 variation in China. The model covers mainland China with a 20 km × 20 km grid resolution extending from the ground surface to 50 hPa with 30 non-uniformly distributed vertical layers (Zhang et al., 2022). Anthropogenic emission data of atmospheric pollutants from 1998 to 2017 were collected from EDGAR (Emissions Database for Global Atmospheric Research) v4.3 (https://edgar.jrc.ec.europa.eu/, last access: 7 December 2023), including gridded annual emission data for CH4, BC, OC, NH3, NMVOC, NOx, CO, SO2, and primary PM10 and PM2.5. The biogenic emissions were estimated by MEGAN v2.1 (Model of Emissions of Gases and Aerosols from Nature) (Guenther et al., 2012). Detailed WRF-Chem configuration, modeling setup, and precursor emissions are referred to by Zhang et al. (2022). The WRF-Chem model was integrated to predict daily O3 concentrations in summer (June to August) from 1998 to 2017. After excluding the model spinup time, the O3 time series from 1999 to 2017 was used in the present study. The daily concentrations were summed and averaged over the summer season to obtain mean O3 concentrations. The modeled O3 concentrations were verified by measured daily O3 concentration data in several major UAs across China from 2016 to 2017. The results show better agreements between modeled and sampled O3 air concentrations. Details are referred to in Text 1 and Fig. S1 in the Supplement and in Zhang et al. (2022).
2.2 WPSH index
The WPSH is an anticyclonic system hovering over the middle and lower troposphere of the northwestern Pacific Ocean. The WPSH forms during the summer months and dissipates in winter. As a high-pressure system, the WPSH is associated with stable weather conditions featuring high temperature and low rainfall. These weather conditions, in turn, perturb O3 variation significantly. While varying year from year, the WPSH in summer generally covers much of East Asia, including parts of China, Japan, and the Korean Peninsula. It can also extend westward, affecting Southeast Asia, including Vietnam, Thailand, and the Philippines (Jiang et al., 2021; Yang et al., 2022). Although the summer WPSH determines primarily the weather and climate conditions in eastern and southern China, it may also influence the weather systems in western and northern China. For example, the westward and northward movements of the WPSH might lead to a weak high-pressure system in northern Xinjiang extending to central–northern China, resulting in higher temperatures and lower rainfall in this region, whereas a low-pressure system could prevail in northern and northeastern China, enhancing precipitation in this part of China. However, given lower O3 levels in westernmost China (Tibet and Xinjiang), the present study did not attempt to elucidate the associations between O3 evolution and the WPSH in this part of China but focused on central and eastern China, where significantly higher O3 levels were observed.
The WPSH indices were collected from the National Climate Center of China (NCCC; the WPSH index is available at http://cmdp.ncc-cma.net/download/precipitation/diagnosis/NWP_high/wpsh_idx.txt, last access: 7 December 2023). The NCCC reports four WPSH indices, including the WPSH area index, the intensity index, the westernmost point, and the ridgeline index of the WPSH. These indices define and quantify the changes in the WPSH via its size, intensity, east–west expansion, and north–south movement (Y. Liu et al., 2019). These WPSH activities significantly affect China's daily, seasonal, interannual, and longer-term meteorological fields and climate variations. Among the four WPSH indices, we found that the WPSH area index (hereafter referred to as WPSH-I1) exhibited the most significant positive correlations with modeled summer ozone concentrations in most regions of China. Since summer rainfall in China was reported to be more sensitive to the western ridge point of the WPSH (Jiang et al., 2021; Yang et al., 2022; Zhao and Wang, 2017), which might affect the O3 wet deposition, we also considered the westernmost point of the WPSH (hereafter referred to as WPSH-I2) in the present study. We found the strongest negative correlations between O3 concentrations and WPSH-I2, which are likely associated with O3 washout by precipitation. In light of this, we chose WPSH-I1 and WPSH-I2 to elucidate the potential influences of the WPSH on the interannual variations in WRF-Chem-simulated summer O3 concentrations for the last 2 decades. As shown in Fig. S2, the WPSH strength characterized by the WPSH-I1 index illustrates a growing trend after 1999, suggesting the reinforcement of the WPSH on a decadal scale in the last 2 decades, the period coincident with the most rapidly growing O3 pollution in China. This growth trend of the WPSH possibly overwhelms interannual changes in the WPSH.
2.3 O3 and meteorological data
Surface O3 concentration data on a daily basis used the WRF-Chem simulated concentration data (Sect. 2.1). Meteorological data used the WRF-predicted gridded air temperature (∘C), 500 hPa geopotential height (GH, ghm), winds (m s−1), sea surface pressure (SSP, hPa), and incoming solar radiation flux (W m−2). To reduce uncertainties from WRF-predicted meteorological data in the composite analysis to examine the responses of interannual variation in summer ozone to the WPSH, we also collected NCEP reanalysis data based on meteorological observations, including geopotential height at the 500 hPa, the surface air temperature (SAT, ∘C), and precipitation from NCEP reanalysis (https://psl.noaa.gov/data/reanalysis/reanalysis.shtml, last access: 7 December 2023). These data were used to illustrate the characteristics of meteorological fields during the positive and negative phases of WPSH indices and in the first EOF loadings, which will be elaborated on below.
2.4 Empirical orthogonal function (EOF) analysis
To extract the potential influences of the interannual changes in the WPSH on O3 variations, we conducted the EOF analysis and examined associations between meteorological fields and surface O3 from 1999 to 2017. The EOF analysis as a multivariate statistical technique has been extensively used in atmospheric science to explore the spatiotemporal variations in a meteorological variable or air pollutant (Fiore et al., 2003; Pu et al., 2016; Shen et al., 2015; Yin et al., 2019; Zhao and Wang, 2017). In the present study, we used the EOF analysis in WRF-Chem-simulated gridded (20 km × 20 km) seasonal O3 concentrations across China to extract annual O3 change features from 1999 to 2017. The EOF analysis of the O3 concentration time series from modeled data was designed to investigate potential associations between the summer O3 time series and WPSH and to explore the response of the O3 time series to increasing WPSH strength since 1999. The orthogonal modes included spatial and temporal coefficients and contained information on some proportion (variance contributions) from the original fields.
2.5 Model scenario setup
We quantify the contribution of meteorology and precursor emissions to O3 evolution subject to the WPSH by setting up three model scenarios. Considering the increasing trend of the WPSH from 1999 onward, we integrated WRF-Chem from 1998 to 2017 subject to three model runs. The first model scenario run took the variable meteorological field and annual O3 precursor emissions from 1998 to 2017, with 1998 as the model spinup period, referred to as the base scenario (scenario 1). The second scenario run adopted fixed precursor emissions in 1998 but variable meteorology throughout 1998 to 2017, referred to as model scenario 2, and the third scenario implemented fixed meteorology in 1998 but variable precursor emissions, referred to as model scenario 3. The simulated O3 concentrations from these three scenarios were compared to identify the relative significance of meteorology and precursor emissions in the changes in O3 concentrations.
3.1 EOF analysis
Figure 1a and b show modeled summer mean O3 concentrations and standard deviations (SDs) averaged from 1999 to 2017. Higher concentrations are observed in Sichuan and the region extending from central China to the North China Plain (NCP) rather than the southern and southeastern seaboard areas, where O3 pollution has been receiving extensive concerns (Fig. 1a). This spatial distribution pattern agrees well with measured mean summer concentration data averaged from 2015 to 2017 in China (Fig. S3). The SD distribution does not superimpose with O3 concentrations but is centered on the Sichuan Basin and those provinces in the middle reaches of the Yangtze River, implying that O3 fluctuated more strongly by interannual variations in meteorological fields in this region.
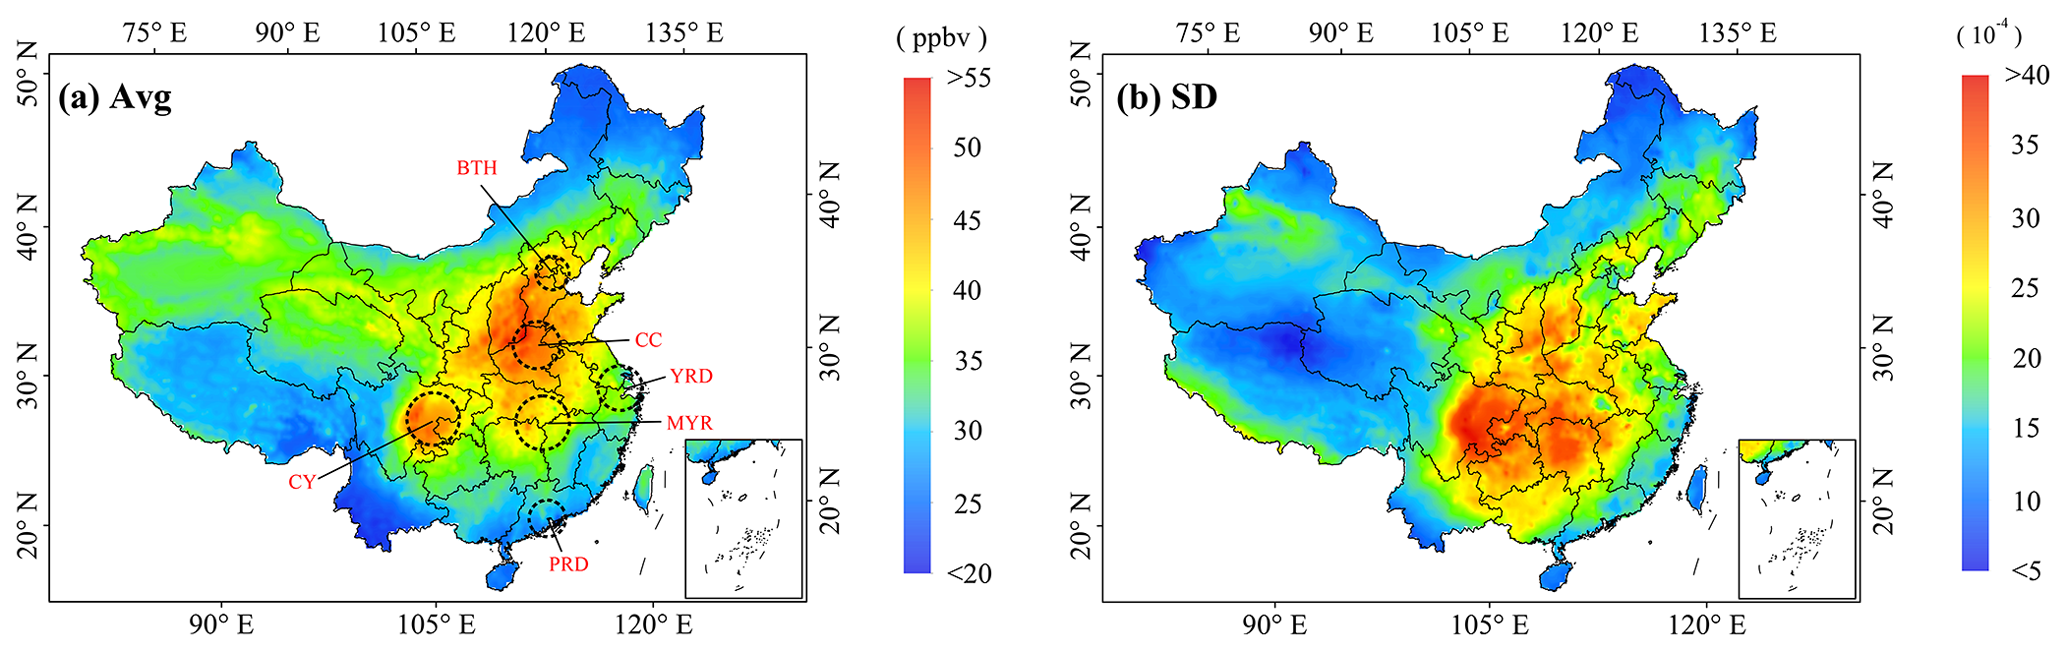
Figure 1Mean summer O3 concentrations (a) and standard deviations (b) averaged from 1999 to 2017.
We carried out an EOF analysis by using summer O3 as the original field to illustrate the spatiotemporal variation in O3 in China on an annual basis from 1999 to 2017, aiming to explore the response of summer O3 interannual (1999 to 2017) variation to the WPSH, the period matching the significantly increasing trend of WPSH-I1 (Supplement inset of Fig. S2), which may lead to a more robust response of the O3 time series to the WPSH. The results of the first and second EOF patterns for both periods are presented in Fig. 2. Each EOF spatial pattern represents a share of the total variation in surface ozone proportional to its eigenvalue. The first EOF loadings (PCA1) are associated strongly with the mean summer O3 concentrations averaged over the six UAs in China at a correlation coefficient of 0.95 (p<0.01) from 1999 to 2017. The EOF1 pattern also illustrates similarities to the mean summer O3 concentrations and its standard deviations (Fig. 1a and 1b), featuring large values in central China. Differing from the EOF1, the EOF2 patterns show a south–north contrast pattern. During this period, the first EOF pattern (EOF1) explains 67.4 % of the total variance in summer O3, and the second EOF pattern (EOF2) explains 9.7 % of the total variance. The negative and positive values in the EOF patterns are expected to represent the extent of departures from the average summer ozone. Since the EOF1 pattern is the maximum possible fraction of the variability in the original data, in our case, it explains most of the summer O3 variability, featuring the growing trends of summer O3 concentrations. The EOF1 pattern appears to agree, to a large extent, with the measured summer (June to August) and warm season (April to September) MDA8 (maximum 8 h average) O3 distribution (Lu et al., 2018; Liu, 2020). The EOF2 patterns also agree with the second EOF pattern that Yin et al. (2019) obtained, though their EOF analysis focused on daily O3 in eastern China. The result suggests that the NCP suffered from higher O3 pollution and was also subject to O3 evolution during the last decades.
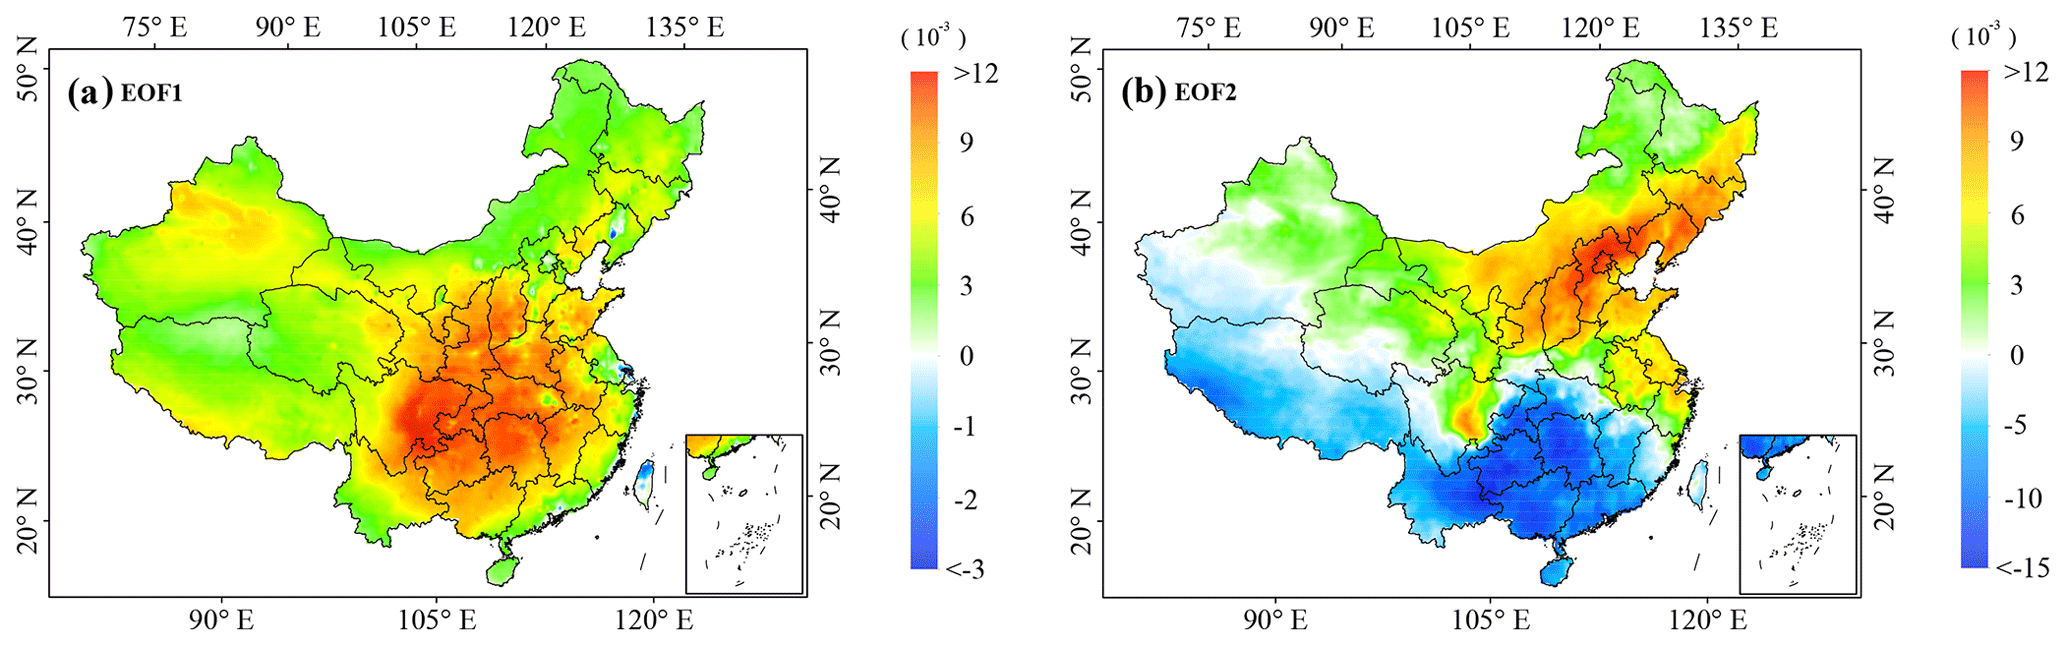
Figure 2First (a) and second (b) EOF patterns across China from 1999 to 2017.
The EOF1 shown in Fig. 2a suggests that the most significant variations in summer O3 occurred in the inland areas of China, extending from Sichuan Province to the middle and lower reaches of the Yangtze River and from Hunan to Shanxi provinces. This inland region covers several major UAs in China, including central China (CC), the middle teaches of the Yangtze River (MYR), and the Chengyu (CY, Chengdu–Chongqing) urban agglomeration (Zhang et al., 2022). We estimated the correlation coefficients between the first EOF loading (PCA1) and summer O3 concentrations in the six UAs, where 34.3 % of China's population resides. The results are presented in Fig. S4. Strong statistically significant correlations were found in CC (r=0.86, p<0.01), CY (r=0.92, p<0.01), and MYR (r=0.90, p<0.01), while in the other three UAs located near the coastal regions, i.e., the YRD, PRD, and Beijing–Tianjin–Hebei (BTH), the correlation coefficients range from 0.36 to 0.51 (Fig. S4). In particular, PCA1 exhibits a stronger association with the summer O3 anomalies averaged over the six UAs, reaching r=0.94 (p<0.01). The good correlations between O3 concentrations and PCA1 are expected because, as mentioned in Sect. 3.1, the EOF analysis was carried out by using summer O3 concentrations as the original fields that have been increasing during the last decades. However, the magnitude of the correlation coefficients helps identify the extent of O3 pollution and long-term growth trends in China and different UAs (or regions). Overall, these results confirm a more substantial interannual variation in summer O3 in the inland areas than in the coastal regions of southern and southeastern China.
Figure 3 shows annual variations in the two EOF loadings (PCA1–2, scaled on the left y axis) and WPSH-I1 (dashed brown line, scaled on the right y axis) from 1999 to 2017. The first EOF loading (PCA1) and WPSH-I1 exhibit growing trends during this period with a correlation coefficient of 0.56 (p<0.01). PCA2 shows no clear trend and hence is not associated with WPSH-I1. The increasing trend of WPSH-I1 since 1999 likely anticipates the interdecadal variation in the WPSH for the last 2 decades. Since O3 concentrations are positively correlated with WPSH-I1 (Figs. 3 and 4), a stronger WPSH intensity might elevate summer O3 levels in China on an annual basis, particularly the areas with large EOF1 values in inland China (Fig. 2a). However, this conclusion is not very applicable in the PRD region, where we observed the lowest association between the EOF1 and summer O3 concentrations (Fig. 2) and between WPSH-I1 and O3 levels among the six UAs and over China (Fig. S4). It is also worthwhile noting that, because O3 precursor emissions in China have been growing during the last 2 decades and modeled concentrations were mainly attributed to precursor emissions, the positive correlations between O3 concentrations and the WPSHI-I1 do not mean that WPSH drove elevated O3 for a long-term perspective. Further discussions are provided in the next section.
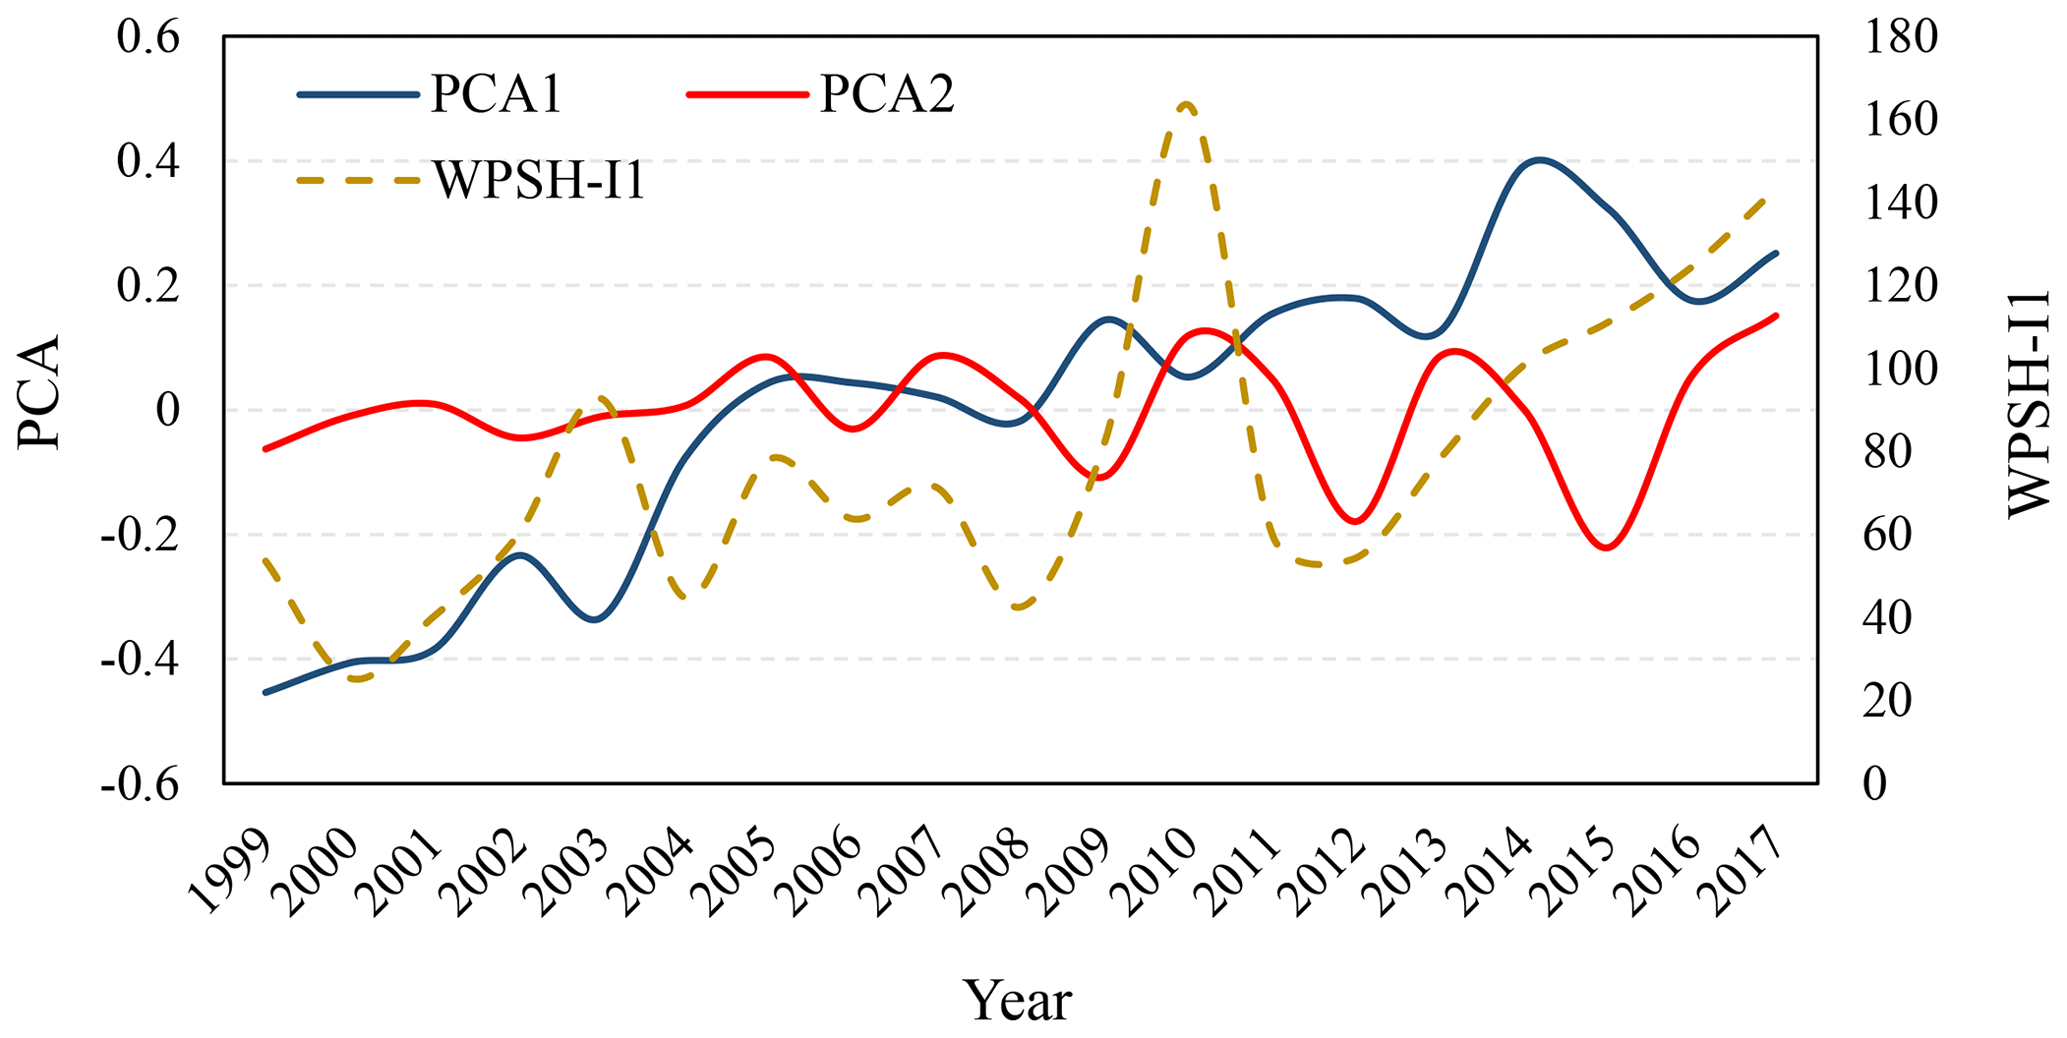
Figure 3Annual variation in two EOF loadings (PCA1 and PCA2, scaled on the left y axis) and WPSH-I1 (dashed brown line, scale on the right y axis) from 1999 to 2017.
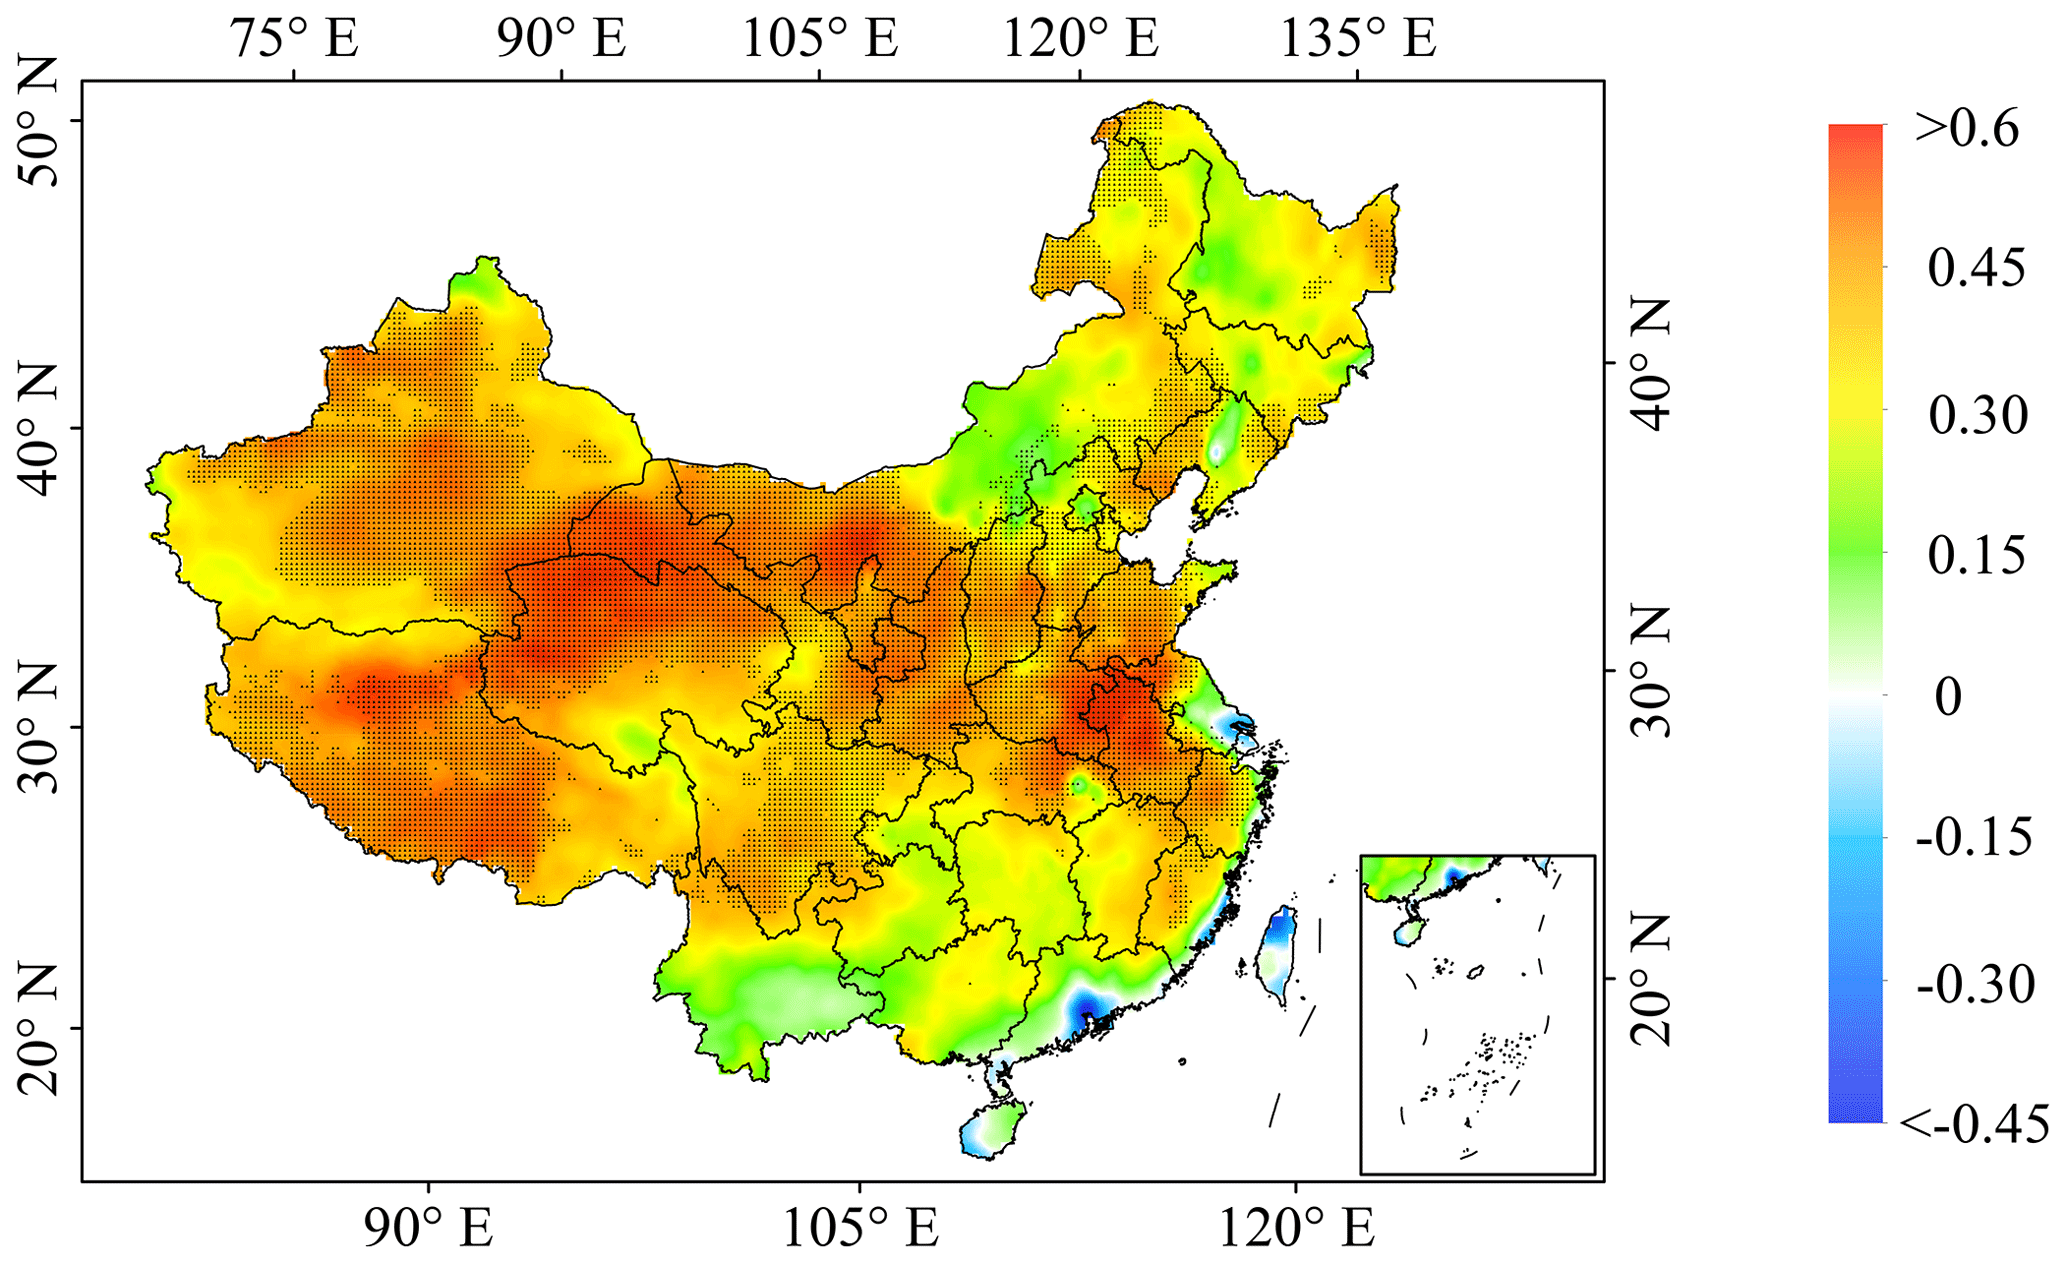
Figure 4Correlation coefficients between summer O3 concentrations and WPSH-I1 across China from 1999 to 2017 on the interdecadal scale under model scenario 1. The areas filled with black dots indicate the regions where the correlation is statistically significant (p<0.05).
We further compared the 500 hPa geopotential height (GH, gpm) anomalies in the positive and negative phases of PCA1 and WPSH-I1 as the departure from their respective means averaged from 1999 to 2017. We selected those years with the positive and negative anomalies of PCA1 and WPSH-I1 ≥ ±1 SD (referred to as the positive and negative phases hereafter) and then estimated their composite means. The results are shown in Figs. S5 and S6. It can be seen that the composite means of the 500 hPa geopotential height in the positive and negative phases of PCA1 and WPSH-I1 illustrate good spatial similarities, again demonstrating the connections between summer O3 and WPSH-I1. In the positive phase, positive geopotential height anomalies at the 500 hPa dominated China, except for the NCP regions, including the BTH urban agglomeration, where negative anomalies of the 500 hPa geopotential heights are observed. On the other hand, a south–north contrast pattern of the geopotential height composite anomalies is discerned in the negative phase of PCA1 and WPSH-I1. The spatial patterns of the GH composite anomalies in the positive and negative phases of the EOF1 also exhibit some similarities to the GH composite anomalies based on positive and negative O3 concentration anomalies as the departure from mean O3 levels averaged over the six UAs in China from 1999 to 2017 (Fig. S6).
3.2 Associations of summer O3 with the WPSH
Having established the relationships between summer O3 and the WPSH via the EOF analysis, we further explore the direct responses of summer O3 to the WPSH. Since the effects of the WPSH span vast regions and the changes in surface ozone concentrations may be influenced by the variations in meteorological factors associated with the WPSH, a spatial correlation analysis between summer surface ozone concentrations in China and the WPSH index (WPSH-I1) from 1999 to 2017 was conducted. The result is illustrated in Fig. 4. During this period, positive correlations overwhelm mainland China, except for the PRD region (Fig. 4). The summer O3 level in the PRD was the lowest among the six UAs (Figs. 1 and S3). The causes of the lack of a statistically significant O3 trend and the negative correlation between WPSH-I1 and O3 in the PRD might be complex. The stronger WPSH and its westward extension can yield high temperatures and dry weather conditions in the PRD, which is conducive to elevated O3 concentration and vice versa. Figure S7 shows a relatively strong positive correlation between SAT and WPSH-I1, which favors growing O3 concentrations, and a negative correlation between precipitation and WPSH-I1 precipitation, which removes O3 concentrations from air in the PRD region. From the early 2000s, the Hong Kong and Guangdong provincial governments jointly lunched an O3 pollution control program, which significantly reduced O3 precursor emissions and its atmospheric levels in the PRD (Wu et al., 2013). It is likely that the course of O3 reduction in the PRD coincided with the period of our modeling investigation, which interferes with the statistical correlation between the WPSH and O3 in the PRD.
Considering that summer precipitation in China is sensitive to the western ridge point of the WPSH (Jiang et al., 2021; Yang et al., 2022; Zhao and Wang, 2017), we also examined the responses of meteorological fields to the changes in the western ridge point index of the WPSH (referred to as WPSH-I2) subject to its positive and negative phases. WPSH-I2 is opposite to WPSH-I1 (Fig. S8). We estimated WPSH-I2 anomalies as the departure from its mean from 1999 to 2017. We defined the positive WHSH-I2 phase if its values are greater than 1 standard deviation and the negative phase if WHSH-I2 < 1 standard deviation. The annual summer mean meteorological variables in the positive and negative phases of WHSH-I2 are summed to obtain their respective composite means. We then calculated the anomalies of these composite means by subtracting their respective long-term means averaged from 1990 to 2022. Figure 5 shows the anomalies of composite means of 500 hPa GH, precipitation (cm mn−1), and the SAT (∘C) across China in the positive and negative phases of WPSH-I2. The results identified an evident north–south contrast for all three meteorological variables in the positive phase of WPSH-I2, of which the anomalies of GH composite means are positive in northern China, with a center in Mongolia and northeastern China (Fig. 5a). In contrast, the broad region to the south of 35∘ N is under the regime of negative GH composite anomalies (Fig. 5b). The 500 hPa GH patterns can also be confirmed by the anomalies of composite mean sea level pressure (SLP) in the positive and negative phases of WPSH-I2 (Fig. 6), showing negative SLP anomalies from the Bay of Bengal to the tropical western Pacific in the positive phase of WPSH-I2 and positive anomalies covering a vast region from southeastern to northeastern China. The south–north dipole patterns of 500 hPa GH composite anomalies in Fig. 5a and the SLP composite anomalies in Fig. 6 often accompany the termination of the rain season in southern China and the start of the rainy season in northern China (Nie et al., 2021), as shown by the negative rainfall anomaly in southern China and the positive anomaly in northern China. Figure 5a predicts the weakening WPSH or the northward movement of the WPSH, leading to a southward pressure gradient as shown in Fig. 5a. As a result, the composite anomalies of 850 hPa vector winds illustrate northerly wind components over central–southern and southern China (Fig. 6). Such northerly wind anomalies do not favor southward water vapor transport by the southwesterly Indian monsoon.
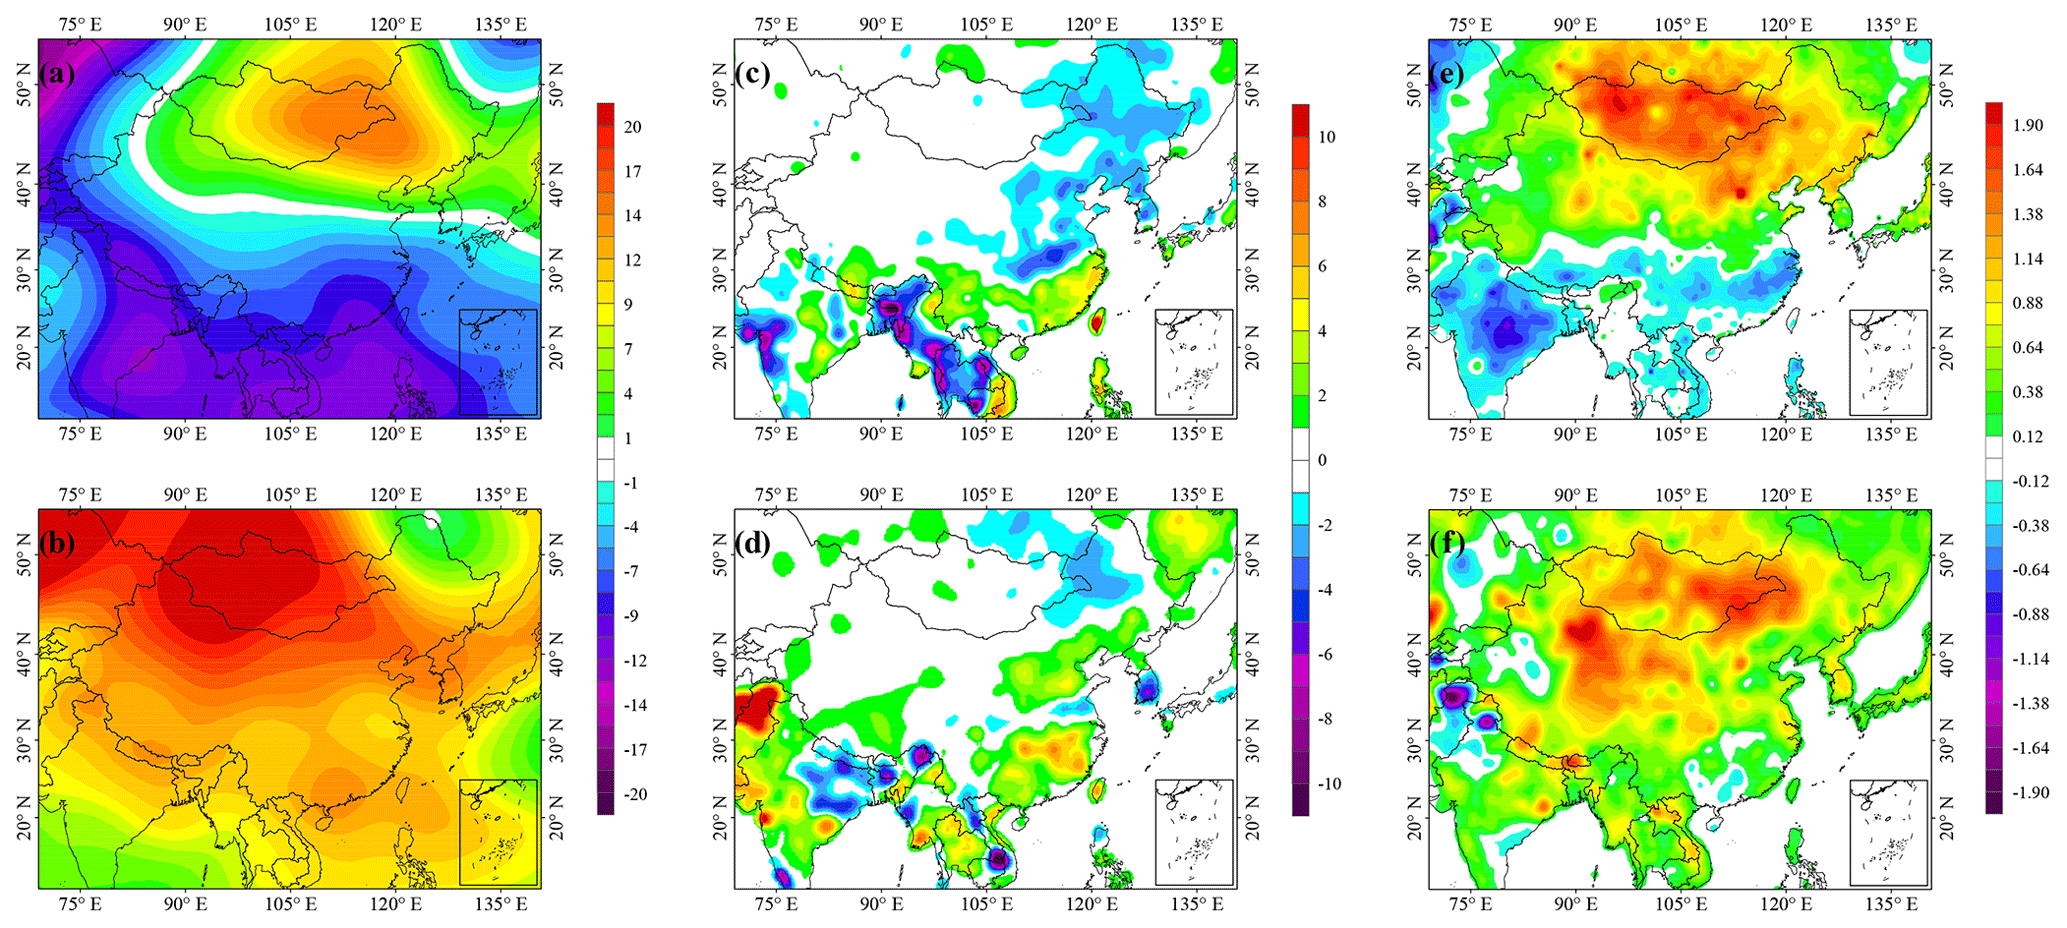
Figure 5Anomalies of composite means of 500 hPa GH (GPH) in positive (a) and negative (b) phases of WPSH-I2 from 1999 to 2017; same as panels (a) and (b) but for precipitation (cm mn−1) in positive (c) and negative (d) WPSH-I2 phases; same as panels (a) and (b) but for SAT (∘C) in positive (e) and negative (f) phases of WPSH-I2 from 1999 to 2017.
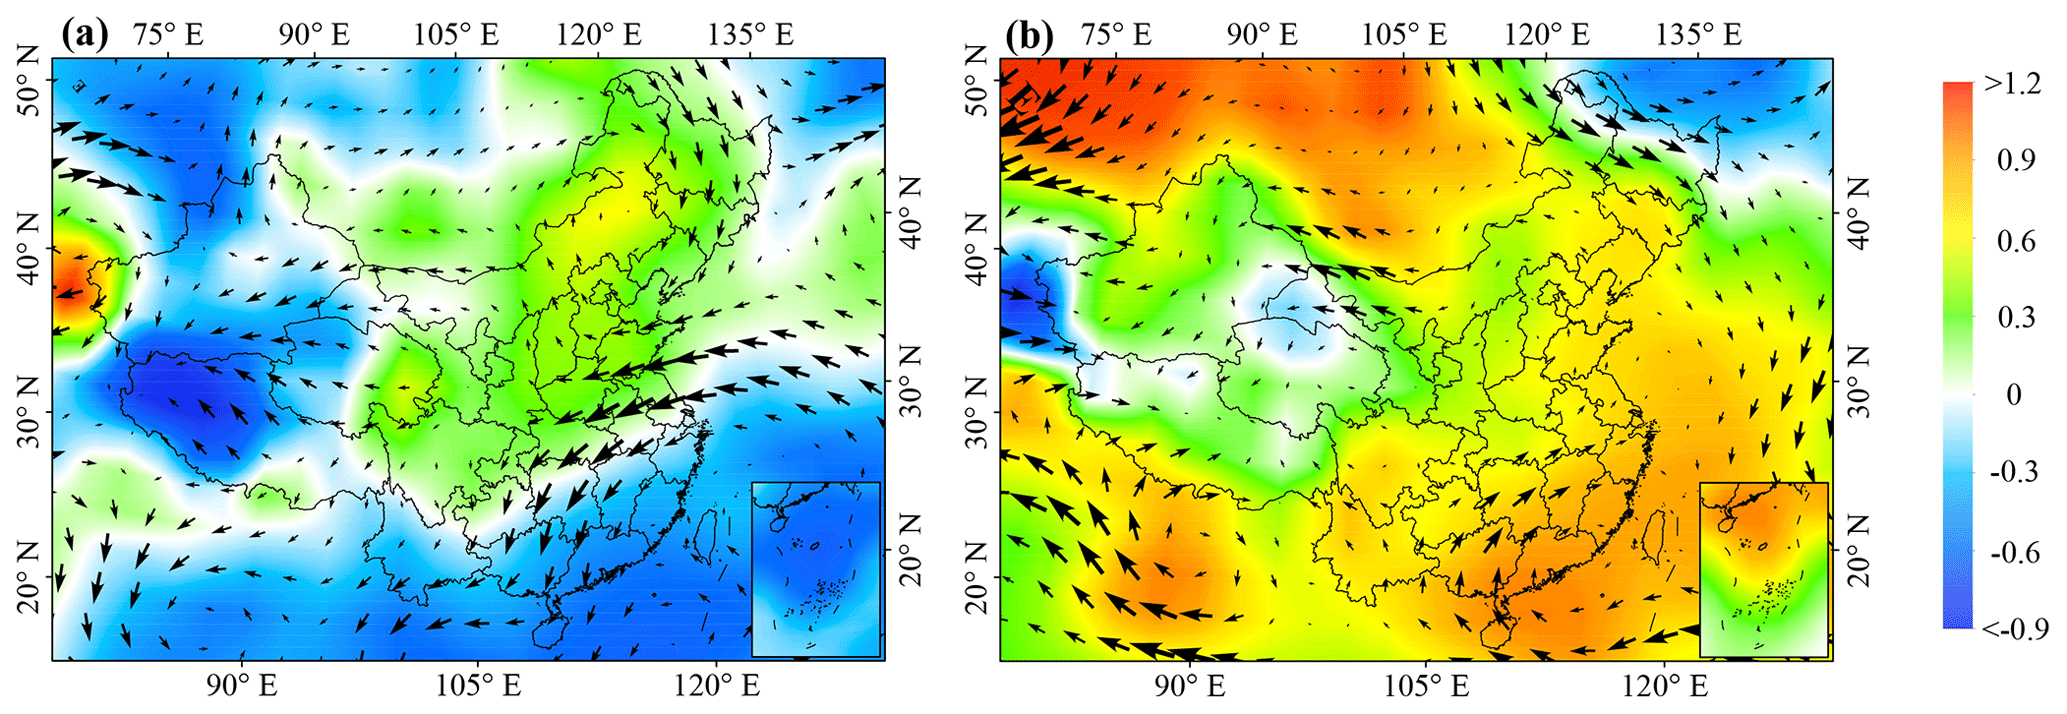
Figure 6Anomalies of composite means of sea level pressure (SLP, hPa) overlapped with the anomalies of composite mean 850 hPa vector winds across China in the positive (a) and negative (b) phases of WPSH-I2 from 1999 to 2017.
On the other hand, easterly and southeasterly wind components extend from the tropical western Pacific to central and northern China, paving a water vapor transport pathway and corresponding to the positive rainfall anomaly in this part of China (Fig. 5c). In the negative phase of WPSH-I2, positive SLP anomalies overwhelmed eastern China with a center in the coastal region of southern China, implying the enhancement of the WPSH. Accordingly, we observe negative composite anomalies of the precipitation extending from the Yangtze–Huaihe Valley from central to northeastern China, suggesting declining precipitations in these regions. Growing precipitations are seen in southern and southeastern China, characterized by the positive composite anomalies of the precipitation (Fig. 5c).
Precipitation in China has been connected strongly to WPSH-I2 from a daily perspective (Duan et al., 2008; Nie et al., 2021). Along with the westward shift of the WPSH ridge point, the major rain belt moves northward to the middle and lower reaches of the Yangtze River from June to mid-July and northern and northeastern China from late July to mid-August (Lu et al., 2017; Su et al., 2014; Zhao and Wang, 2017). In our case, with the focus on the association between summer O3 and WPSH from an interannual perspective, we show that the growing summer rainfall in southern and southeastern China is associated with stronger WPSH in an eastern position, featuring negative GH composite anomalies to the south of 35∘ N in China (Fig. 5a). Such a GH anomaly pattern does not favor atmospheric water vapor transport to northern China by the summer monsoon circulations (Nie et al., 2021), which results in low rainfall in this part of China (Fig. 5c). Accordingly, relatively higher SATs are observed in northern China (Fig. 5e), which, together with low atmospheric humidity and rainfall, favor O3 formation and evolution. On the other hand, the stronger rainfall in southern and southeastern China caused lower SATs in this region characterized by negative SAT composite anomalies (Fig. 5e). The higher atmospheric humidity, stronger rainfall or precipitation washout, and lower SATs tend to restrain O3 formation in southern China, which resulted in lower O3 levels compared to that measured in central and northern China (Lu et al., 2018; Liu, 2020). This is likely a reason for the higher O3 concentrations observed in northern and central–northern China, such as the BTH and central China urban agglomerations, than in the YRD and PRD regions. In the negative phase of WPSH-I2, the north–south contrast pattern of all three meteorological variables vanished. Instead, positive GH composite anomalies at 500 hPa are seen in China, with stronger positive anomalies in western Mongolia (Fig. 5b). Such a GH pattern suggests the reinforcement and westward shift of the WPSH. As a result, the composite anomalies of the summer precipitation in northern China became positive, meaning high rainfall in this region (Fig. 5d). However, the composite anomalies of SATs in the negative phase of WPSH-I2 (Fig. 5f) seem not to respond well to the intense rainfall, except in the PRD, where declining SATs featuring negative SAT composite anomalies (Fig. 5f) correspond well to the positive composite precipitation anomalies, meaning high rainfall in this region (Fig. 5d). This result is also in line with previous observations that the westward shift of the WPSH ridge point is often accompanied by the termination of systematic rainfall in southern China (Duan et al., 2008; Huang et al., 2018; Nie et al., 2021).
3.3 WPSH and interannual O3 fluctuations
Having identified the associations between the WPSH and O3 evolution on interannual scales, it is also interesting to know to what extent the WPSH could contribute to the interannual fluctuations in O3 concentrations in China and its major UAs. We compared modeled O3 concentrations among three model scenarios by estimating their differences (fractions). Figure 7 illustrates summer mean O3 concentrations averaged from 1999 to 2017 from the three scenarios. Identical concentration spatial patterns can be observed in scenarios 1 (base, Fig. 7a) and 3 (fixed meteorology, Fig. 7c), suggesting that precursor emissions overwhelmed the spatial–temporal distribution of summer ozone in China. Comparing Fig. 7b with Fig. 7a and c, we also notice that the low summer ozone levels simulated from model scenario 2 (fixed precursor emissions, Fig. 7b) extend over a much larger area across southern China (highlighted by a solid red circle). Considering that model scenarios 1 and 2 used the same meteorological data from 1998 to 2017, the lower O3 levels under scenario 2 can be attributed mainly to declining precursor emissions, which is partly attributable to a collaborative effort to mitigate air pollution in the PRD and Hong Kong since the early 2000s as mentioned before, which effectively slowed down growing O3 precursor emissions (Wu et al., 2013).
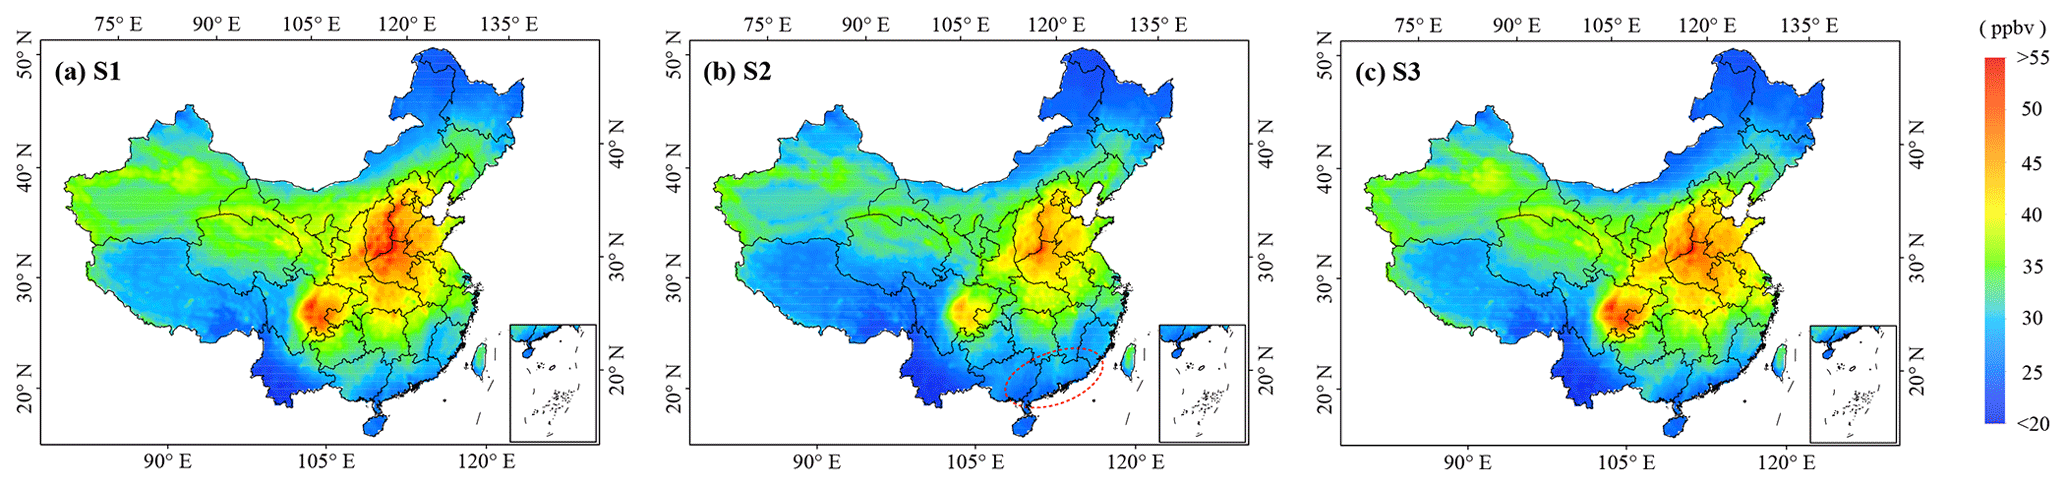
Figure 7Modeled mean summer O3 concentrations across China averaged from 1999 to 2017: (a) model scenario 1 (base scenario), (b) model scenario 2 (fixed precursor emission), and (c) model scenario 3 (fixed meteorology).
To extract signals of meteorology in modeled O3 concentrations, we calculated the percentage change in summer O3 concentrations subject to model scenarios 1 and 3, defined as %, where O3(S3) and O3(S1) represent the summer ozone concentrations for scenarios 3 and 1 between 1999 and 2017 (Fig. 8a). Since both model scenarios 1 and 3 used the same precursor emissions, their differences (fractions) can quantify the meteorological effect on O3 fluctuations. Significantly, the WPSH was at a relatively high value in 1998 compared to 1999–2017 (Fig. S2). The result shows that the fixed meteorological conditions (scenario 3) resulted in higher summer ozone concentrations in the eastern seaboard region of China than the results from the base scenario, particularly in the YRD, where the fixed meteorological conditions enhanced the summer concentration by >9 % compared to the base scenario modeling result (Fig. 8a). The second-highest O3 fraction between scenarios 1 and 3 occurred in the Sichuan Basin, where scenario 3 predicted the summer concentrations to be 3 % to 6 % higher than the base scenario 1. Figure 8b presents the correlation coefficients between the WPSH-I1 and scenario 2 modeled O3 concentrations across China from 1999 to 2017, showing relatively high positive correlation coefficients in the eastern seaboard area and the region extending from the Sichuan Basin to the Gansu–Shaanxi border, like the fractional changes shown in Fig. 8a. However, the negative correlations extended in most parts of China, indicating that the WPSH tends to reduce summer O3 levels in these regions. This spatial correlation pattern differs significantly from the correlation pattern shown in Fig. 4, in which positive correlations between the summer WPSH and modeled O3 under the base scenario almost extend over the whole of China. As mentioned before, this is because both WPSH-I1 and O3 precursor emissions in China increased from 1999 to 2017. Figure 8 shows some similarities between spatial distribution patterns of the fractional changes in summer O3 concentrations under scenarios 1 and 3 and the correlations of summer O3 concentrations from model scenario 2 and the WPSHI-I1. The result suggests that the meteorological conditions contributing to summer O3 evolution, as shown in Fig. 8a, are associated, to a large extent, with the WPSH. The positive contribution of meteorology characterized by the positive correlations with elevated O3 pollution gradually weakens in inland areas and turns into a negative contribution, meaning the reduction in summer O3 by meteorology in inland China, including most northern and northeastern regions. Although positive correlations were estimated on the Tibetan Plateau, given very low O3 pollution, the WPSH would not exert any significant influence on O3 levels on the plateau. It is worth noting that Fig. 4 shows a negative correlation between modeled summer O3 concentration from model scenario 1 and WPSH-I2 time series in the YRD, but model scenario 2 yields a positive correlation (Fig. 8b). Since model scenario 1 took annually altered O3 precursor emissions into consideration, the negative correlation suggests that declining precursor emissions from 1999 to 2017 in the YRD overwhelmed the WPSH effect. After removing the effect of precursor emissions, the meteorological conditions associated with the WPSH would help enhance O3 concentrations in this region.
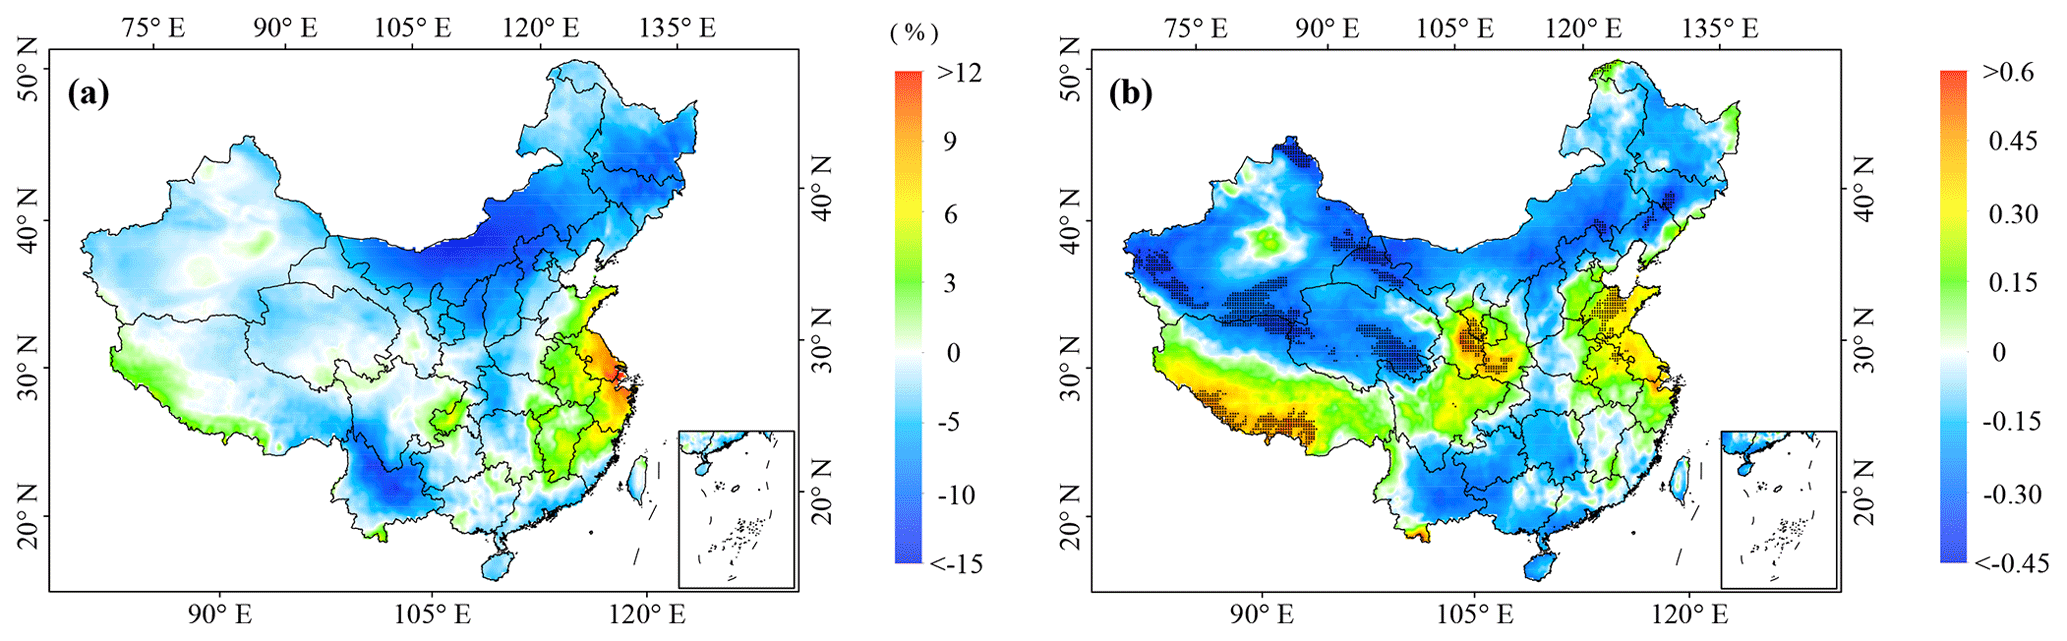
Figure 8Fractional changes between modeled O3 concentrations subject to model scenarios 3 and 1 from 1999 to 2017 estimated by % (a) and correlation coefficients between summer WPSH-I1 and modeled summer O3 concentrations under model scenario 2 (b). The areas filled with black dots in panel (b) indicate the regions where the correlation is statistically significant (p<0.05).
As shown in Fig. 5c, the positive WPSH-I1 corresponds to lower precipitation in southern and southeastern China and higher precipitation in central and northern China, which tends to enhance O3 levels in southern and southeastern China and reduce O3 concentrations in the north. Although we also observe higher SATs across northern China and lower SATs in the south, which should increase O3 levels in the north and decrease O3 levels in the south, we could not quantify the direct linkages between SATs and O3 concentrations from a national perspective. Figure S7 displays the correlation coefficients between summer WPSH-I1 and SAT (Fig. S7a) and precipitation (Fig. S7b) from 1999 to 2017 across China. We can observe stronger positive correlations between WPSH-I1 and SATs in southern China, indicating that the WPSH tends to enhance SATs in this region. This should favor elevated O3 concentrations instead of the reduction in O3 levels, as shown in Fig. 7b. This result likely anticipates that the stronger precipitation associated with WPSH in this part of China overwhelmed SATs and overall yielded lower O3 concentrations in southern China. Considering the strong association of O3 formation and solar radiation (sunlight), we also estimated the correlation coefficients between surface-incoming solar radiation flux (W m−2) and O3 concentration and WPSHI-I1 from 1999 to 2017 across China. The results are illustrated in Fig. S9. The spatial pattern of the correlation coefficients between the radiation flux and O3 concentration is similar to the correlation between SATs and WPSH-I1, with higher correlations across China's eastern and southern seaboard regions (Fig. S9a), implying that O3 should be more readily formed in these regions, though O3 levels were not higher in these regions than central China and the BTH (Fig. 1), as discussed below. However, no statistically significant positive correlations between radiation flux and WPSH-I1 were identified (Fig. S9b).
Figure S10 illustrates annual variations in summer-averaged O3 concentrations under the three model scenarios from 1998 to 2017 over the six UAs. Distinct differences between the three inland UAs (CY, CC, and MYR) and the three coastal UAs (YRD, PRD, and BTH) can be discerned from more significant fractions with increasing trends in CY, CC, and MYR as compared to YRD, PRD, and BTH, in which there were no significant trends in modeled concentrations. In the three inland UAs (CY, CC, and MYR, Fig. S10d–f), O3 concentrations under fixed precursor emissions (scenario 2, solid red line) are lower markedly than those from scenario 1 (solid green line) and exhibit no statistically significant temporal trend, suggesting that the variable meteorology does not contribute significantly to O3 levels and its long-term temporal trends. On the other hand, O3 concentrations under the scenario 1 and 3 runs are more or less similar and illustrate increasing trends, indicating that growing precursor emissions in the last 2 decades dominate the long-term O3 evolution in these inland UAs. In the three coastal UAs (PRD, YRD, and BTH), the increasing trends of modeled summer O3 under scenario 3 were less significant than in the three inland UAs, indicating slower growth of precursor emissions in these coastal UAs. No significant increasing trends of O3 concentrations from the scenario 3 run (fixed emission in 1998) are observed, suggesting that the changes in meteorological conditions in the last 2 decades contributed less to growing O3 pollution in China's major urban clusters than precursor emissions. However, we noticed from Fig. S10 that annual fluctuations of summer O3 concentrations in these UAs under scenario 2 agree, to a large extent, with the results from model scenario 1 (base scenario). This is expected because the two model scenarios shared the same meteorology. As a result, precursor emissions contributed primarily to the long-term O3 growing trends and magnitudes, whereas meteorology made more vital contributions to interannual fluctuations of O3 concentrations.
To link the interannual fluctuations of summer ozone induced by meteorology with WPSH, we estimated the rate of interannual variation (RIV) of summer O3 concentrations simulated by model scenario 2 in the six UAs and WPSH-I1, given by %, where c(n) and c(n−1) are summer O3 concentrations in the current year and previous year, respectively. The same approach also calculated the RIV of summer WPSH-I1. Figure 9a and b present the RIV of summer O3 concentrations in the three inland and coastal UAs, respectively. The RIV of WPSH-I1 is also shown in the figure (brown dashed line). Although these RIVs do not exhibit significant trends, we can observe a general agreement of the RIV between the WPSH-I1 and summer O3 concentrations in most UAs, characterized by their annual oscillations. Figure 9c shows the correlation coefficients between the RIVs of the summer WPSH-I1 and O3 concentrations. The highest correlation is found in the MYR, followed by the PRD and YRD, whereas the lowest correlation occurred in BTH. These correlations suggest that the O3 interannual fluctuations in those areas proximate to the WPSH tend to be more strongly associated with the WPSH, regardless of the positive or negative effect of the WPSH on O3 evolution. This is because, as a large-scale high-pressure system, the WPSH affects its surrounding weather conditions significantly, which in turn perturbs O3 concentrations in its nearby regions. Since the meteorology largely determined the interannual fluctuations of summer O3 and connected nicely with the WPSH, the associations of the RIVs between summer WPSH-I1 and O3 concentrations imply that the WPSH made a stronger contribution to the interannual variation in summer O3 rather than its long-term trend, though WPSH-I1 presents an increasing trend after 1998 (Fig. 3).
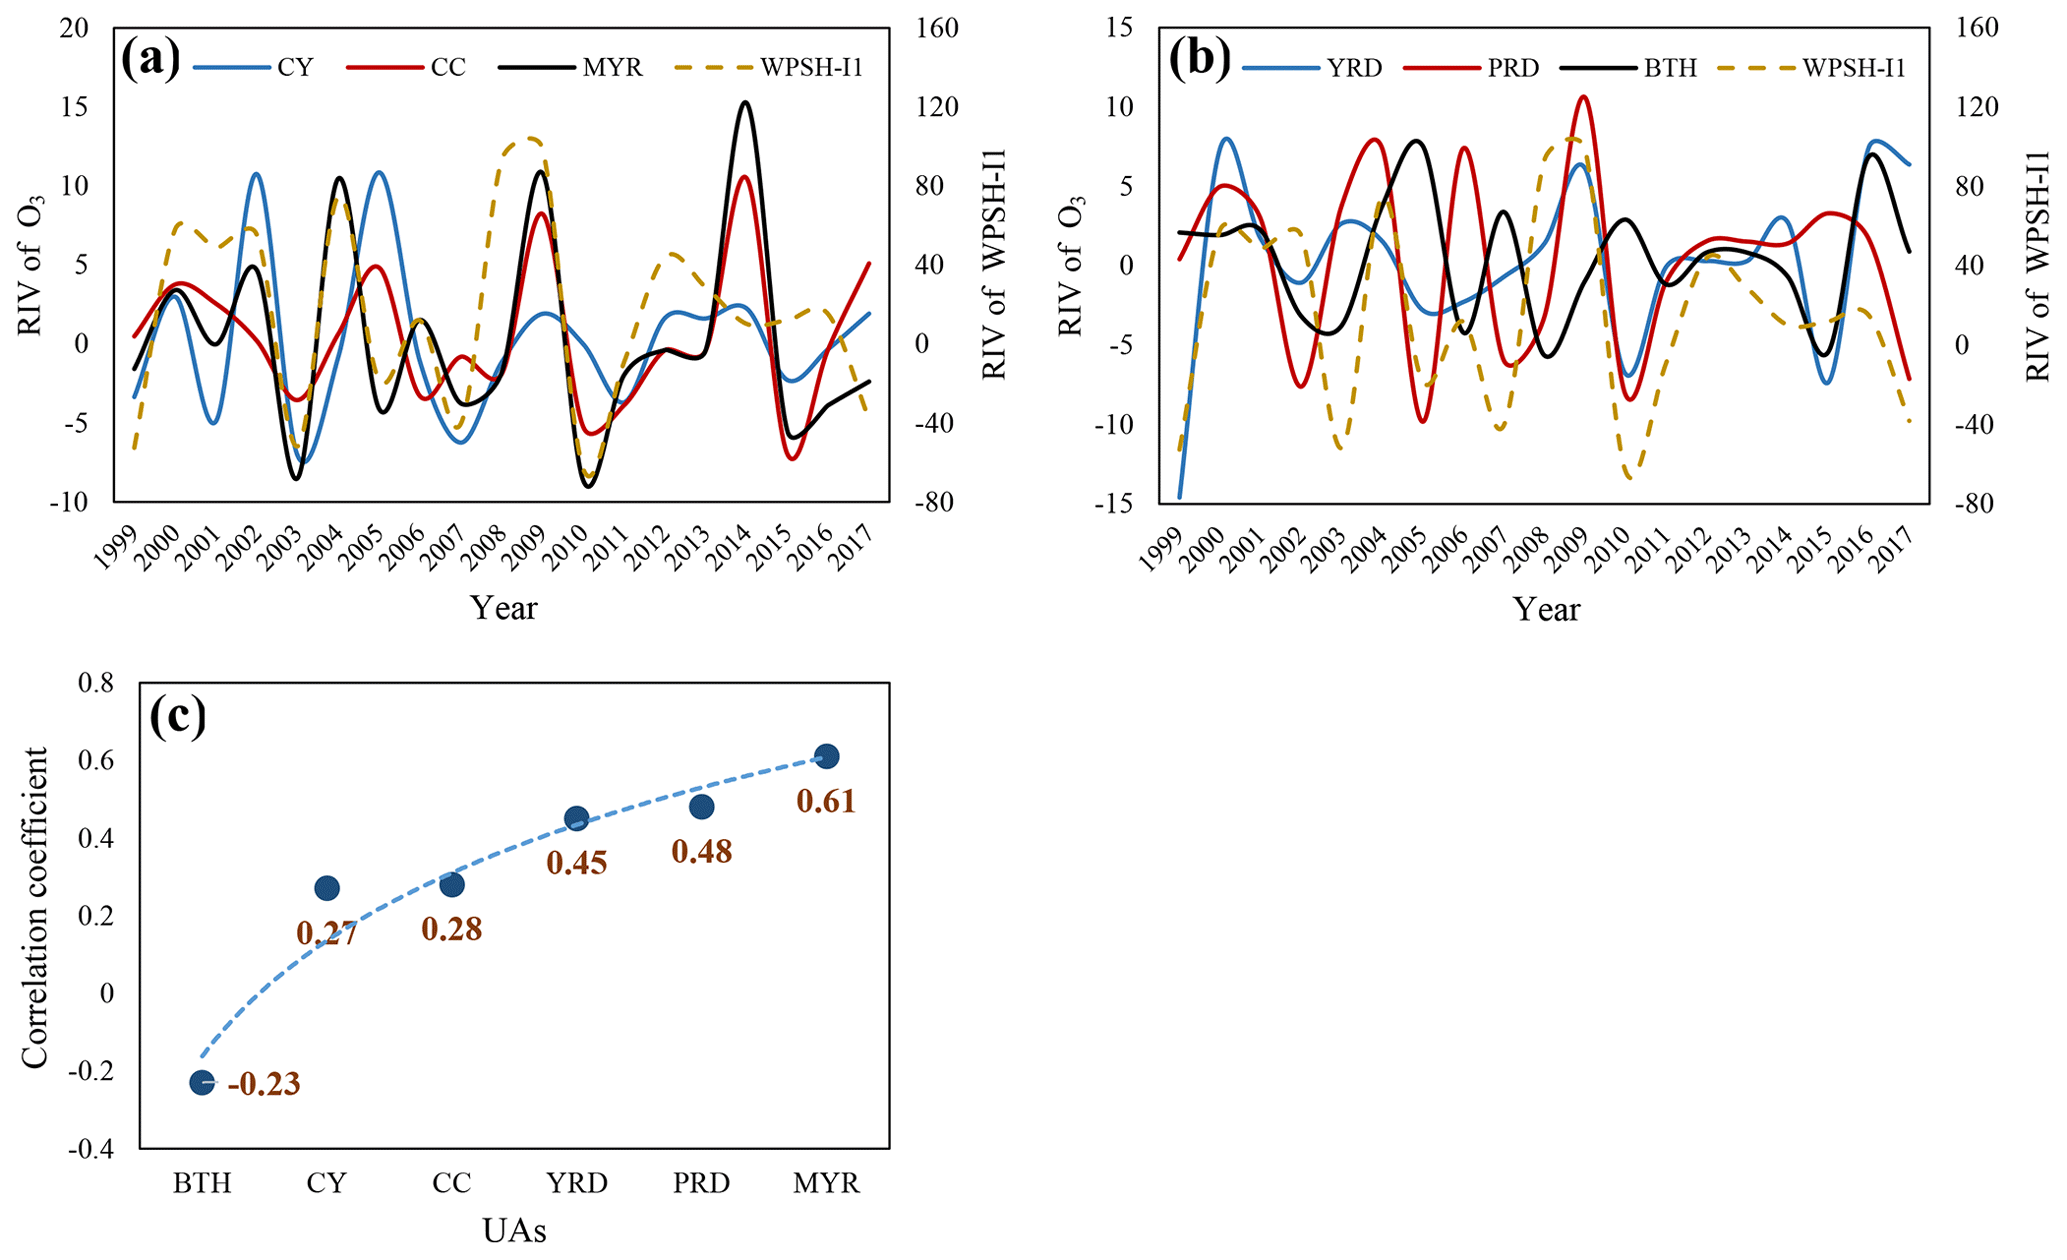
Figure 9(a) Rate of interannual variations in summer WPSH-I1 (brown dashed line) and O3 in CY, CC, and MYR from 1999 to 2017. (b) Same as panel (a) but for YRD, PRD, and BTH, and (c) correlation coefficients of the rate of interannual variations in summer WPSH-I1 and O3 in the six UAs from 1999 to 2017.
Model simulations revealed higher O3 concentrations from 1999 to 2017 in the Sichuan Basin and the region extending from central China to the NCP, agreeing with measured mean summer concentrations. The first EOF loadings (PCA1) are associated strongly with the mean summer O3 concentrations across China and its major UAs with the correlation coefficient r=0.56 (P≤0.01). We identified distinctive differences between positive and negative WPSH anomalies and elucidated their impacts on interannual variation in O3 and meteorological conditions. In some of the UAs, such as the PRD, relatively lower O3 levels were reported compared to other major UAs. The EOF and regression analysis revealed stronger responses of summer O3 simulated under model scenario 2 (fixed precursor emission) in the region extending from southeastern to central China, with the highest correlation of 0.7 in the MYR. We noted that WPSH has become stronger since the late 1990s and early 2000s, characterized by the enhanced WPSH index after 1999. As a result, stronger associations between summer O3 in China and its primary UAs and the WPSH occurred in the last 2 decades. Extensive model scenario simulations indicated that precursor emissions dominated the long-term trend and magnitude of summer ozone concentrations. However, the meteorology associated with the WPSH largely determined its interannual fluctuations from 1999 to 2017, demonstrated by the positive correlation coefficients between RIV and WPSH-I1 in China's major UAs (except for BTH), ranging from 0.27 to 0.61. Our results concluded that the influence of precursor emissions on the evolution of ozone was stronger in Chengdu–Chongqing, the middle reaches of the Yangtze River, and central China than in the coastal city clusters. However, the influence of meteorological conditions is not significant. In contrast, for the coastal city clusters of the Yangtze River Delta, the Pearl River Delta, and the BTH region, the influence of precursor emissions on the summer ozone evolution is weaker than in the inland city clusters, but the influence of meteorological conditions was greater than in the inland city clusters, particularly in those urban areas proximate to the WPSH. Considering the great efforts in China to mitigate O3 pollution by reducing anthropogenic precursor emissions, interannual and longer-term O3 evolutions associated with increasing WPSH strength might be worth paying attention to because they might influence the background O3 concentration, its long-term prediction, and its long-term O3 mitigation measures. The results from the present study might also imply that the local policy-makers in different UAs should take the WPSH's impacts into account in formulating their respective O3 reduction strategies, in addition to precursor emissions. To the end, it is worth noting that this modeling study was partly based on an increasing trend of the summer WPSH strength since 2000, which coincided with growing O3 evolution. Historically, the WPSH has fluctuated on a yearly basis. Further study needs to be conducted to discern the associations between projected WPSH and O3 concentrations subject to future climate change scenarios, such as shared socioeconomic pathways under the Coupled Model Intercomparison Project (CMIP6) and the Intergovernmental Panel on Climate Change (O'Neill et al., 2017).
Data will be made available on request.
The supplement related to this article is available online at: https://doi.org/10.5194/acp-23-15629-2023-supplement.
All the authors contributed to the manuscript and gave approval to the final version. XZ, RZ, and XJ designed the research. XZ, XL, and KC collected the data. ST, JL, HG, and TH contributed to the interpretation of the results. XZ, RZ, and JM wrote and revised the manuscript.
The contact author has declared that none of the authors has any competing interests.
Publisher's note: Copernicus Publications remains neutral with regard to jurisdictional claims made in the text, published maps, institutional affiliations, or any other geographical representation in this paper. While Copernicus Publications makes every effort to include appropriate place names, the final responsibility lies with the authors.
We wish to thank the High-performance Computing Platform of Peking University for supporting the extensive model simulations in this study.
This study is supported by the National Natural Science Foundation of China (grant nos. 41991312 and 41977357).
This paper was edited by Leiming Zhang and reviewed by three anonymous referees.
Akimoto, H., Mori, Y., Sasaki, K., Nakanishi, H., Ohizumi, T., and Itano, Y.: Analysis of monitoring data of ground-level ozone in Japan for long-term trend during 1990–2010: Causes of temporal and spatial variation, Atmos. Environ., 102, 302–310, https://doi.org/10.1016/J.ATMOSENV.2014.12.001, 2015.
Bell, M. L., Zanobetti, A., and Dominici, F.: Who is more affected by ozone pollution? A systematic review and meta-analysis, Am. J. Epidemiol., 180, 15–28, https://doi.org/10.1093/aje/kwu115, 2014.
Brauer, M., Amann, M., Burnett, R. T., Cohen, A., Dentener, F., Ezzati, M., Henderson, S. B., Krzyzanowski, M., Martin, R., van Dingenen, R., van Donkelaar, A., and Thurston, G. D.: Exposure assessment for estimation of the global burden of disease attributable to outdoor air pollution, Environ. Sci. Technol., 46, 652–660, https://doi.org/10.1021/es2025752, 2012.
Chen, Z., Li, R., Chen, D., Zhuang, Y., Gao, B., Yang, L., and Li, M.: Understanding the causal influence of major meteorological factors on ground ozone concentrations across China, J. Clean. Prod., 242, 118498, https://doi.org/10.1016/j.jclepro.2019.118498, 2020.
Dang, R., Liao, H., and Fu, Y.: Quantifying the anthropogenic and meteorological influences on summertime surface ozone in China over 2012–2017, Sci. Total Environ., 754, 142394, https://doi.org/10.1016/j.scitotenv.2020.142394, 2021.
Ding, D., Xing, J., Wang, S., Chang, X., and Hao, J.: Impacts of emissions and meteorological changes on China's ozone pollution in the warm seasons of 2013 and 2017, Front. Environ. Sci. En., 13, 76, https://doi.org/10.1007/s11783-019-1160-1, 2019.
Duan, L., Rong, Y., and Liang, P.: Effect of West Pacific Subtropical High on Summer Precipitation in North China, Met. Sci. Technol., 36, 273–276, https://en.cnki.com.cn/Article_en/CJFDTOTAL-QXKJ200803004.htm (last access: 7 December 2023), 2008.
Fiore, A. M., Jacob, D. J., Mathur, R., and Martin, R. V.: Application of empirical orthogonal functions to evaluate ozone simulations with regional and global models, J. Geophys. Res.-Atmos., 108, 4431, https://doi.org/10.1029/2002jd003151, 2003.
Fleming, Z. L., Doherty, R. M., von Schneidemesser, E., Malley, C. S., Cooper, O. R., Pinto, J. P., Colette, A., Xu, X., Simpson, D., Schultz, M. G., Lefohn, A. S., Hamad, S., Moolla, R., Solberg, S., and Feng, Z.: Tropospheric Ozone Assessment Report: Present-day ozone distribution and trends relevant to human health, Elementa, 6, 12, https://doi.org/10.1525/elementa.273, 2018.
Fu, Y., Liao, H., and Yang, Y.: Interannual and Decadal Changes in Tropospheric Ozone in China and the Associated Chemistry-Climate Interactions: A Review, Adv. Atmos. Sci., 36, 975–993, https://doi.org/10.1007/s00376-019-8216-9 2019.
Guenther, A. B., Jiang, X., Heald, C. L., Sakulyanontvittaya, T., Duhl, T., Emmons, L. K., and Wang, X.: The Model of Emissions of Gases and Aerosols from Nature version 2.1 (MEGAN2.1): an extended and updated framework for modeling biogenic emissions, Geosci. Model Dev., 5, 1471–1492, https://doi.org/10.5194/gmd-5-1471-2012, 2012.
Han, H., Liu, J., Shu, L., Wang, T., and Yuan, H.: Local and synoptic meteorological influences on daily variability in summertime surface ozone in eastern China, Atmos. Chem. Phys., 20, 203–222, https://doi.org/10.5194/acp-20-203-2020, 2020.
Huang, Y., Wang, B., Li, X., and Wang, H.: Changes in the influence of the western Pacific subtropical high on Asian summer monsoon rainfall in the late 1990s, Clim. Dynam., 51, 443–455, https://doi.org/10.1007/s00382-017-3933-1, 2018.
Jiang, Z., Li, J., Lu, X., Gong, C., Zhang, L., and Liao, H.: Impact of western Pacific subtropical high on ozone pollution over eastern China, Atmos. Chem. Phys., 21, 2601–2613, https://doi.org/10.5194/acp-21-2601-2021, 2021.
Lefohn, A. S., Malley, C. S., Simon, H., Wells, B., Xu, X., Zhang, L., and Wang, T.: Responses of human health and vegetation exposure metrics to changes in ozone concentration distributions in the European Union, United States, and China, Atmos. Environ., 152, 123–145, https://doi.org/10.1016/j.atmosenv.2016.12.025, 2017.
Li, K., Jacob, D. J., Liao, H., Shen, L., Zhang, Q., and Bates, K. H.: Anthropogenic drivers of 2013–2017 trends in summer surface ozone in China, P. Natl. Acad. Sci. USA, 116, 422–427, https://doi.org/10.1073/pnas.1812168116, 2019.
Li, K., Jacob, D. J., Shen, L., Lu, X., De Smedt, I., and Liao, H.: Increases in surface ozone pollution in China from 2013 to 2019: anthropogenic and meteorological influences, Atmos. Chem. Phys., 20, 11423–11433, https://doi.org/10.5194/acp-20-11423-2020, 2020.
Lin, C. Q., Lau, A. K. H., Fung, J. C. H., Song, Y. S., Li, Y., Tao, M. H., Lu, X. C., Ma, J., and Lao, X. Q.: Removing the effects of meteorological factors on changes in nitrogen dioxide and ozone concentrations in China from 2013 to 2020, Sci. Total Environ., 793, 148575, https://doi.org/10.1016/j.scitotenv.2021.148575, 2021.
Lin, Y., Zhang, L., Fan, Q., Meng, H., Gao, Y., Gao, H., and Yao, X.: Decoupling impacts of weather conditions on interannual variations in concentrations of criteria air pollutants in South China – constraining analysis uncertainties by using multiple analysis tools, Atmos. Chem. Phys., 22, 16073–16090, https://doi.org/10.5194/acp-22-16073-2022, 2022.
Liu, H., Liu, S., Xue, B., Lv, Z., Meng, Z., Yang, X., Xue, T., Yu, Q., and He, K.: Ground-level ozone pollution and its health impacts in China, Atmos. Environ., 173, 223–230, https://doi.org/10.1016/j.atmosenv.2017.11.014, 2018.
Liu, J.: Ozone regionalization and evolution characteristics, and meteorlogical formation mechanism in China from 2013 to 2018, PhD thesis, Nanjing University of Information Science and Technology, https://cdmd.cnki.com.cn/Article/CDMD-10300-1021778486.htm (last access: 7 December 2023), 2020.
Liu, Q., Zhou, T., Mao, H., and Fu, C.: Decadal variations in the relationship between the western Pacific subtropical high and summer heat waves in east China, J. Climate, 32, 1627–1640, https://doi.org/10.1175/JCLI-D-18-0093.1, 2019.
Liu, Y. and Wang, T.: Worsening urban ozone pollution in China from 2013 to 2017 – Part 1: The complex and varying roles of meteorology, Atmos. Chem. Phys., 20, 6305–6321, https://doi.org/10.5194/acp-20-6305-2020, 2020.
Liu, Y., Liang, P., and Sun, Y. (Eds.): Characteristics of the Western Pacific Subtropical High and Summer Rainfall Anomalies, in: The Asian Summer Monsoon, Elsevier, 85–95, https://doi.org/10.1016/B978-0-12-815881-4.00005-6, 2019.
Lu, M. H., Chen, X., Liu, W. C., Zhu, F., Lim, K. S., McInerney, C. E., and Hu, G.: Swarms of brown planthopper migrate into the lower yangtze river valley under strong western pacific subtropical highs, Ecosphere, 8, e01967, https://doi.org/10.1002/ecs2.1967, 2017.
Lu, X., Hong, J., Zhang, L., Cooper, O. R., Schultz, M. G., Xu, X., Wang, T., Gao, M., Zhao, Y., and Zhang, Y.: Severe Surface Ozone Pollution in China: A Global Perspective, Environ. Sci. Technol. Lett., 5, 487–494, https://doi.org/10.1021/acs.estlett.8b00366, 2018.
Lu, X., Zhang, L., Zhao, Y., Jacob, D. J., Hu, Y., Hu, L., Gao, M., Liu, X., Petropavlovskikh, I., McClure-Begley, A., and Querel, R.: Surface and tropospheric ozone trends in the Southern Hemisphere since 1990: possible linkages to poleward expansion of the Hadley circulation, Sci. Bull., 64, 400–409, https://doi.org/10.1016/j.scib.2018.12.021, 2019.
Ma, M., Yao, G., Guo, J., and Bai, K.: Distinct spatiotemporal variation patterns of surface ozone in China due to diverse influential factors, J. Environ. Manage., 288, 112368, https://doi.org/10.1016/j.jenvman.2021.112368, 2021.
Ma, Z., Xu, J., Quan, W., Zhang, Z., Lin, W., and Xu, X.: Significant increase of surface ozone at a rural site, north of eastern China, Atmos. Chem. Phys., 16, 3969–3977, https://doi.org/10.5194/acp-16-3969-2016, 2016.
Maji, K. J., Ye, W. F., Arora, M., and Nagendra, S. M. S.: Ozone pollution in Chinese cities: Assessment of seasonal variation, health effects and economic burden, Environ. Pollut., 247, 792–801, https://doi.org/10.1016/j.envpol.2019.01.049, 2019.
Monks, P. S., Archibald, A. T., Colette, A., Cooper, O., Coyle, M., Derwent, R., Fowler, D., Granier, C., Law, K. S., Mills, G. E., Stevenson, D. S., Tarasova, O., Thouret, V., von Schneidemesser, E., Sommariva, R., Wild, O., and Williams, M. L.: Tropospheric ozone and its precursors from the urban to the global scale from air quality to short-lived climate forcer, Atmos. Chem. Phys., 15, 8889–8973, https://doi.org/10.5194/acp-15-8889-2015, 2015.
Nie, J., Liu, P., and Zhao, C.: Research on Relationship between Various Indexes of the Western North Pacific Subtropical High and Summer Precipitation in Eastern China, Chinese Journal of Atmospheric Sciences, 45, 833–850, http://www.iapjournals.ac.cn/dqkx/en/article/doi/10.3878/j.issn.1006-9895.2009.20160, 2021.
O'Neill, B. C., Kriegler, E., Ebi, K. L., Kemp-Benedict, E., Riahi, K., Rothman, D. S., van Ruijven, B. J., van Vuuren, D. P., Birkmann, J., Kok, K., Levy, M., and Solecki, W.: The roads ahead: Narratives for shared socioeconomic pathways describing world futures in the 21st century, Global Environ. Chang., 42, 169–180, https://doi.org/10.1016/j.gloenvcha.2015.01.004, 2017.
Pu, B., Dickinson, R. E., and Fu, R.: Dynamical connection between Great Plains low-level winds and variability of central Gulf States precipitation, J. Geophys. Res., 121, 3421–3434, https://doi.org/10.1002/2015JD024045, 2016.
Shen, L., Mickley, L. J., and Tai, A. P. K.: Influence of synoptic patterns on surface ozone variability over the eastern United States from 1980 to 2012, Atmos. Chem. Phys., 15, 10925–10938, https://doi.org/10.5194/acp-15-10925-2015, 2015.
Silva, R. A., West, J. J., Zhang, Y., Anenberg, S. C., Lamarque, J. F., Shindell, D. T., Collins, W. J., Dalsoren, S., Faluvegi, G., Folberth, G., Horowitz, L. W., Nagashima, T., Naik, V., Rumbold, S., Skeie, R., Sudo, K., Takemura, T., Bergmann, D., Cameron-Smith, P., Cionni, I., Doherty, R. M., Eyring, V., Josse, B., MacKenzie, I. A., Plummer, D., Righi, M., Stevenson, D. S., Strode, S., Szopa, S., and Zeng, G.: Global premature mortality due to anthropogenic outdoor air pollution and the contribution of past climate change, Environ. Res. Lett., 8, 034005, https://doi.org/10.1088/1748-9326/8/3/034005, 2013.
Su, T., Xue, F., and Zhang, H.: Simulating the intraseasonal variation of the East Asian summer monsoon by IAP AGCM4.0, Adv. Atmos. Sci., 31, 570–580, https://doi.org/10.1007/s00376-013-3029-8, 2014.
Wang, Y., Jia, B., Wang, S.-C., Estes, M., Shen, L., and Xie, Y.: Influence of the Bermuda High on interannual variability of summertime ozone in the Houston–Galveston–Brazoria region, Atmos. Chem. Phys., 16, 15265–15276, https://doi.org/10.5194/acp-16-15265-2016, 2016.
Wu, D., Fung, J., Yao, T., and Lau, A.: A study of control policy in the Pearl River Delta region by using the particulate matter source apportionment method, Atmos. Environ., 76, 147–161, https://doi.org/10.1016/j.atmosenv.2012.11.069, 2013.
Xu, W., Lin, W., Xu, X., Tang, J., Huang, J., Wu, H., and Zhang, X.: Long-term trends of surface ozone and its influencing factors at the Mt Waliguan GAW station, China – Part 1: Overall trends and characteristics, Atmos. Chem. Phys., 16, 6191–6205, https://doi.org/10.5194/acp-16-6191-2016, 2016.
Yan, M., Liu, Z., Liu, X., Duan, H., and Li, T.: Meta-analysis of the Chinese studies of the association between ambient ozone and mortality, Chemosphere, 93, 899–905, https://doi.org/10.1016/j.chemosphere.2013.05.040, 2013.
Yang, K., Cai, W., Huang, G., Hu, K., Ng, B., and Wang, G.: Increased variability of the western Pacific subtropical high under greenhouse warming, P. Natl. Acad. Sci. USA, 119, e2120335119, https://doi.org/10.1073/pnas, 2022.
Yihui, D. and Chan, J.: The East Asian summer monsoon: An overview, Meteorol. Atmos. Phys., 89, 117–142, https://doi.org/10.1007/s00703-005-0125-z, 2005.
Yin, Z., Cao, B., and Wang, H.: Dominant patterns of summer ozone pollution in eastern China and associated atmospheric circulations, Atmos. Chem. Phys., 19, 13933–13943, https://doi.org/10.5194/acp-19-13933-2019, 2019.
Zhan, Y., Luo, Y., Deng, X., Grieneisen, M. L., Zhang, M., and Di, B.: Spatiotemporal prediction of daily ambient ozone levels across China using random forest for human exposure assessment, Environ. Pollut., 233, 464–473, https://doi.org/10.1016/j.envpol.2017.10.029, 2018.
Zhang, X., Jian, X., Zhao, Y., Liu, X., Chen, K., Wang, L., Tao, S., Liu, J., Huang, T., Gao, H., Liu, Y., Zhugu, R., and Ma, J.: Tropospheric Ozone Perturbations Induced by Urban Land Expansion in China from 1980 to 2017, Environ. Sci. Technol., 56, 6978–6987, https://doi.org/10.1021/acs.est.1c06664, 2022.
Zhao, Z. and Wang, Y.: Influence of the West Pacific subtropical high on surface ozone daily variability in summertime over eastern China, Atmos. Environ., 170, 197–204, https://doi.org/10.1016/j.atmosenv.2017.09.024, 2017.
Zhou, T., Yu, R., Zhang, J., Drange, H., Cassou, C., Deser, C., Hodson, D. L. R., Sanchez-Gomez, E., Li, J., Keenlyside, N., Xin, X., and Okumura, Y.: Why the Western Pacific subtropical high has extended westward since the late 1970s, J. Climate, 22, 2199–2215, https://doi.org/10.1175/2008JCLI2527.1, 2009.