the Creative Commons Attribution 4.0 License.
the Creative Commons Attribution 4.0 License.
 | 19 Dec 2023
Radiative impacts of the Australian bushfires 2019–2020 – Part 2: Large-scale and in-vortex radiative heating
Pasquale Sellitto
Redha Belhadji
Juan Cuesta
Aurélien Podglajen
Bernard Legras
Record-breaking wildfires ravaged south-eastern Australia during the fire season 2019–2020. The intensity of the fires reached its paroxysmal phase at the turn of the year 2019–2020, when large pyro-cumulonimbi developed. Pyro-convective activity injected biomass burning aerosols and gases in the upper-troposphere–lower-stratosphere (UTLS), producing a long-lasting perturbation to the atmospheric composition and the stratospheric aerosol layer. The large absorptivity of the biomass burning plume produced self-lofting of the plume and thus modified its vertical dynamics and horizontal dispersion. Another effect of the in-plume absorption was the generation of compact smoke-charged anticyclonic vortices which ascended up to 35 km altitude due to diabatic heating. We use observational and modelling description of this event to isolate the main vortex from the dominant Southern Hemispheric biomass burning aerosol plume. Entering this information into an offline radiative transfer model, and with hypotheses on the absorptivity and the angular scattering properties of the aerosol layer, we estimate the radiative heating rates (HRs) in the plume and the vortex. We found that the hemispheric-scale plume produced a HR of 0.08±0.05 K d−1 (from 0.01 to 0.15 K d−1, depending on the assumption on the aerosol optical properties), as a monthly average value for February 2020, which is strongly dependent on the assumptions on the aerosol optical properties and therefore on the plume ageing. We also found in-vortex HRs as large as 15–20 K d−1 in the denser sections of the main vortex (8.4±6.1 K d−1 on average in the vortex). Our results suggest that radiatively heated ascending isolated vortices are likely dominated by small-sized strongly absorbing black carbon particles. The hemispheric-scale and in-vortex HR estimates are consistent with the observed ensemble self-lofting (a few kilometres in 4 months) and the main isolated vortex rise (∼ 20 km in 2 months). Our results also show evidence of the importance of longwave emission in the net HR of biomass burning plumes.
- Article
(3523 KB) - Full-text XML
- Companion paper
- BibTeX
- EndNote


Anthropogenic climate change has likely increased the occurrence of favourable conditions for the development of high-intensity wildfires (e.g. Duane et al., 2021), especially in sensitive areas like Australia (Canadell et al., 2021). Associated with an extended period of extreme heat and drought, exceptionally large bushfires developed in Australia during the 2019–2020 wildfire season, which burnt an unprecedented area of 5.8×10⁶ ha of broadleaf forest (Boer et al., 2020). The intensity of the wildfires escalated in south-eastern Australia during late 2019, until the development of deep pyro-convection and the formation of pyro-cumulonimbus clouds (pyroCb) that injected a large amount of gaseous and particulate pollutants in the upper-troposphere–lower-stratosphere (UTLS), producing the largest perturbation on the UTLS composition by a wildfire on record (e.g. Khaykin et al., 2020; Kloss et al., 2021; Solomon et al., 2022). The injected smoke aerosol mass in the UTLS, while quite uncertain in its total amount, might have reached values larger than 2 Tg (Hirsch and Koren, 2021), thus producing the largest known wildfire-driven perturbation of the stratospheric aerosol layer, in terms of the stratospheric aerosol optical depth (SAOD) (e.g. Khaykin et al., 2020). As an example, a monthly average stratospheric AOD up to 0.014 was observed in February 2020 at Southern Hemispheric midlatitudes by the Ozone Mapping and Profiler Suite Limb Profiler (OMPS-LP; at 675 nm), which is about 10 times larger than background conditions (Sellitto et al., 2022, hereafter referred to as S22).
The large amount of solar-radiation-absorbing biomass burning aerosol injected in the stratosphere by the Australian fires in 2019–2020 produced exceptional radiative effects. A first radiative effect was the reduction of the incoming solar radiation, due to the wildfire plume, at the Southern Hemispheric scale, which induced a significant radiative forcing (RF). Different contrasting estimates, in terms of the magnitude and even the sign, were given for the RF associated with the Australian fires in 2019–2020. In S22 we reconcile these different estimates and we show that their variability can be easily attributed to two main factors: (1) the uncertainty on the optical properties of the aerosol and (2) the presence of clouds underneath the biomass burning plumes. For the first point, in S22 we argue that the optical properties of biomass burning aerosol plumes can change dramatically due to atmospheric ageing and the evolution from more to less radiation-absorbing aerosols in the shortwave (SW) spectral range, due to secondary aerosol formation and/or smoke aerosol coating/hydration. At clear-sky conditions, our best estimate, considering these evolution factors, was a global mean RF of W m−2 at the top of the atmosphere (TOA) and W m−2 at the surface. The negative RF switches to positive values if considering large black carbon (BC) particles (so with limited atmospheric ageing, as done in most atmospheric models; see Brown et al., 2021) and, to a larger extent, in case of cloud-covered scenarios or other highly reflective underlying surfaces. A second radiative effect was the generation of stable self-maintained smoke-containing anticyclonic vortices, which were observed rising well into the stratosphere, from the initial injection height at about 17 km up to about 35 km altitude (Khaykin et al., 2020; Kablick et al., 2020). The existence, persistence and ascent in the stratosphere of these vortices was attributed to the diabatic heating of the air masses due to the absorption of solar radiation in biomass burning aerosols. This very peculiar radiation–vertical-dynamics interaction, retrospectively also observed in Canadian fires in 2017 (Lestrelin et al., 2021), is not yet completely understood and is a focus of theoretical studies. Beyond localised rising effects of compact isolated plumes due to radiation absorption, it was also suggested that the large-scale (Southern Hemispheric) plume from the Australian fires in 2019–2020 rose as a whole due to radiation-absorption-driven self-lofting (Yu et al., 2021).
In this paper, we use the hybrid observations–modelling methodology described by S22 to estimate the radiative heating in the aerosol plume associated with the Australian fires in 2019–2020, which complements the RF estimates of S22, to cover both the effects at the hemispheric and in-vortex spatial scale mentioned previously. In particular, we estimate here, for the first time, the heating rates (HRs) of both the hemispheric plume and the main detached rising vortex, and we discuss, as done by S22 for the TOA and surface RF, the sensitivity of these HR estimations to the ageing of the biomass burning aerosol and resulting variability of their optical properties. We also discuss notably the concurrent role of longwave (LW) and shortwave (SW) effects, which is particularly important for HR estimations.
This paper is structured as follows. Section 2 describes the data and methods used in this work and introduces the basis of offline radiative transfer modelling applied to HR estimations. Section 3 presents the observed hemispheric and in-vortex perturbation of the UTLS aerosol layer, which is key input to our HR estimates. Section 4 presents and discusses our new HR estimates. Conclusions are drawn in Sect. 5.
2.1 Offline radiative transfer modelling driven by observations
As discussed in S22, the idea behind our radiative impact estimation approach is to describe aerosol layer perturbations associated with a specific pollution source – the Australian fires in 2019–2020, in this paper – with the best available observations and to pass this description as input to a detailed offline radiative transfer model. This approach mixes the flexibility of offline radiative transfer modelling and the realism of observation-based forcing source description. These offline radiative estimations contrast with the more widespread use of online aerosol–radiation modelling, where a point pollution source is described within an atmospheric model and its radiative impact is estimated with simplified radiative models. The scheme of the offline radiative transfer approach used in this work is outlined in Fig. 1.
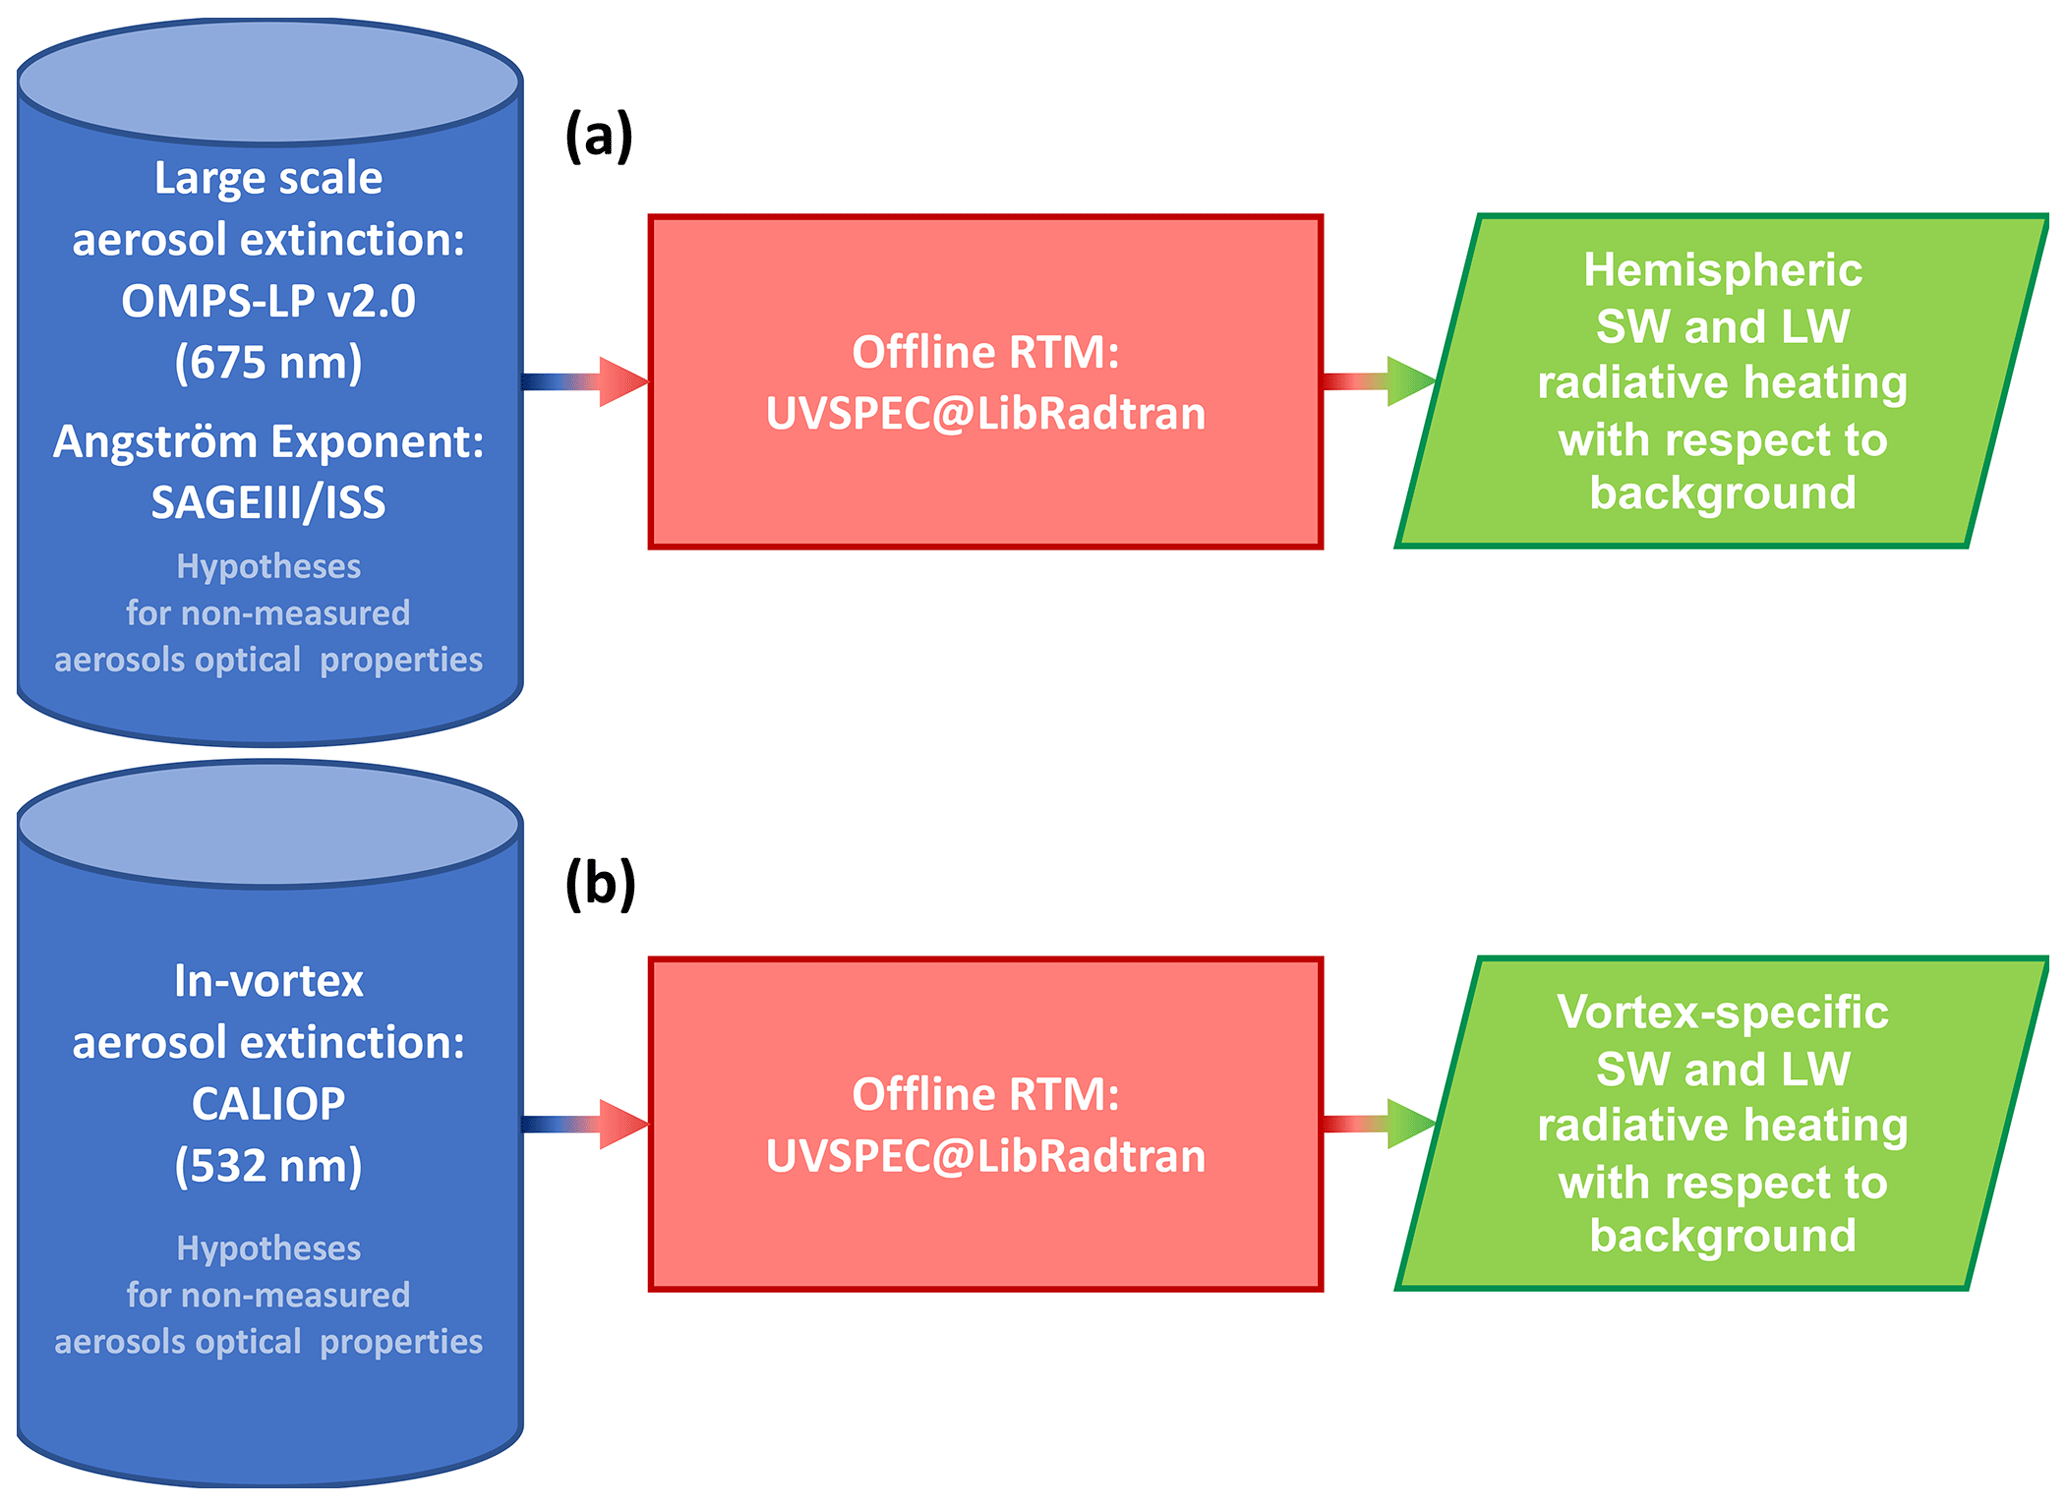
Figure 1Scheme of the offline radiative transfer modelling used in this work for both large-scale (a) and small-scale (b) studies.
As a complement to the SW radiative forcing (RF) estimations at the surface and TOA discussed in S22, in the present paper we estimate the vertically localised radiative effects associated with the radiative interactions within the Australian wildfire plume by means of the equinox-equivalent daily-average radiative diabatic heating, as heating/cooling rates (hereafter just referred to heating rates, HRs, with negative values in case of cooling). As discussed in the following sections, both the biomass burning aerosol absorption of radiation in the SW (heating rate) and emission of radiation in the LW (cooling rate) are important in the HRs, so both wavelength ranges are addressed in this work. To describe the radiative interaction at the basis of both the overall self-lofting of the plume at the hemispheric scale and the more intense localised diabatic heating of the compact anticyclonic vortices first described by Khaykin et al. (2020), we present here two studies, at both the hemispheric and the in-vortex spatial scales. These two studies require a different observation-based description of the plumes as input to the offline modelling (see panels a and b in Fig. 1).
For the description of the overall plume at the Southern Hemispheric scale, we use the same inputs as done in S22 for the estimation of the surface and SW TOA radiative forcing in clear-sky conditions, which are briefly recalled in the following. A fire-perturbed scenario is obtained using monthly average OMPS-LP aerosols extinction coefficient profiles at 675 nm, for January to April 2020, at three different latitude bands (15–25, 25–60 and 60–80∘ S). To cover the full spectrum of our HR estimations, a spectral variability of the aerosol extinction is represented using the observed monthly mean (January to April 2020) Ångström exponent from SAGE III/ISS. The OMPS/SAGE datasets are discussed in more details in S22 and are briefly recalled in Sect. 2.2. As discussed in S22, the interaction between radiation and biomass burning aerosols cannot be fully described by the spectral aerosol extinction, which integrates the absorption and scattering processes without differentiating between them and without describing the angular distribution of the scattered radiation. The absorption properties of the aerosol layer are particularly important for the estimation of the localised heating/cooling within the plume. Unfortunately, the absorptivity and the scattering angular distribution properties of aerosol are not directly accessible from observations. Thus, we have made different hypotheses on these properties of the simulated smoke plumes in our radiative transfer calculations. For the SW range, we adopted the same values of the aerosol absorptivity (in terms of single scattering albedo, SSA) and the angular distribution of the scattered radiation (in terms of the asymmetry parameter, g) as in S22. In particular, we made different radiative simulations with SSA values from 0.80 to 0.95 with 0.05 steps and with g values of 0.50 and 0.70. Typical SSA and g values for biomass burning aerosols are not available in the LW in the literature. To fill this gap in LW optical properties, we have performed dedicated Mie calculations, using the Mie routines of the Earth Observation Data Group of the Department of Physics of Oxford University (http://eodg.atm.ox.ac.uk/MIE/, last access: 8 December 2023). In the Mie calculations, we have used the refractive indices of biomass burning aerosols of Sutherland and Khanna (1991) and different mono-modal log-normal size distribution with a fixed width of 1.86 and varying mean radii from 0.2 to 0.6 µm. The average value of the SSA in the LW was found quite stable around a value of 0.20, with small variability with respect to variability in the mean radius. The average value of g in the LW varied between a minimum of about 0.30 and a maximum of about 0.50. Thus, in the LW we made different radiative simulations with an SSA value of 0.20 and with g values of 0.30 and 0.50. The SSA and g values have been considered spectrally independent in the SW and LW spectral ranges. The plume's HR is obtained by subtracting the HR results of a background atmosphere from the HR outputs of the fire-perturbed scenario, as already done for RF estimations in S22. As background, we have considered the respective monthly means OMPS/SAGE spectral extinction observations for the year 2019. Background UTLS values of SSA and g are considered for typical values of sulfate aerosol, which dominate the aerosol layer at these altitudes in the absence of fire perturbations (Kremser et al., 2016). Typical values in the SW, available in the literature, were taken as SSA =0.99 and g=0.70. In the LW, an SSA of 0.20 and a g of 0.30 were obtained with the Oxford Mie code, using sulfate aerosol refractive indices from Hummel et al. (1988) and a mono-modal log-normal size distribution with width of 1.86 and mean radius from of 0.2 µm.
For the description of the more localised smoke-charged compact anticyclonic vortices, we use high-vertical-resolution aerosol extinction profile observations with the satellite-borne lidar Cloud-Aerosol Lidar and Infrared Pathfinder Satellite Observation (CALIPSO) Cloud-Aerosol Lidar with Orthogonal Polarisation (CALIOP). The CALIOP datasets are briefly discussed in Sect. 2.3. As for the hemispheric-scale HR estimations, for the localised in-vortex calculations we have made hypotheses for the non-measured optical properties, SSA and g. Assumptions on SSA and g are aided by inference of aerosol composition supported by the CALIOP measurements of the lidar ratio (LR), colour ratio (CR) and depolarisation ratio (δ), which is discussed in Sects. 3 and 4.2. As a background atmosphere, we have taken the same background as for the hemispheric-scale runs.
As an offline radiative transfer model, we use the UVSPEC (ultraviolet spectrum) model in its libRadtran (library for radiative transfer) implementation (Emde et al., 2016), using the SDISORT (spherical DISORT) solver (Dahlback and Stamnes, 1991), in the SW and a two-stream approximation in the LW. The atmospheric state is set using the AFGL (Air Force Geophysics Laboratory) climatological standards (Anderson et al., 1986), as in S22. To represent fire plumes dispersing over the sea surface, the SW surface albedo is set to 0.07, as in S22, and the LW emissivity is set to 0.99 (e.g. Konda et al., 1994). All runs are realised in clear-sky condition; the vertically localised HR would be overwhelmingly dominated by clouds in case of simultaneous presence of aerosol and clouds at a given altitude (Liou, 2002), which is still possible at the lower upper-tropospheric altitudes investigated in this work.
We finally estimate SW and LW HRs between surface and 50 km altitude with 1 km vertical resolution. Calculations are realised at different solar elevations, i.e. different solar zenith angle (SZA); the equinox-equivalent daily-average SW and LW HRs are then calculated as the SZA-averaged HRs, assuming that the duration of day and night is equal.
2.2 Aerosol spectral extinction observations with the Ozone Mapping and Profiler Suite Limb Profiler (OMPS-LP) and the Stratospheric Aerosol and Gas Experiment III on the International Space Station (SAGE III/ISS)
The spatiotemporal variability of the average large-scale fire-perturbed and the background aerosol extinction is obtained using v2.0 aerosol extinction observations at 675 nm from the Ozone Mapping and Profiler Suite Limb Profiler (OMPS-LP) aboard the Suomi National Polar-orbiting Partnership (Suomi-NPP) satellite since January 2012 (Taha et al., 2020). The OMPS-LP instrument observes scattered solar radiation at different tangent heights (from cloud-top height to 40 km, with a 1 km vertical resolution) in the 290–1000 nm spectral range. Even if OMPS-LP v2.0 observes the aerosol extinction at different wavelengths, multi-spectral analyses with this dataset are not recommended due to inhomogeneities of the accuracy of spectral aerosol observations due to different sources of bias for each band (Taha et al., 2020). Thus, in this work, the spectral variability of the aerosol extinction is represented using the Ångström exponent (AE) estimated from multi-spectral observations of the Stratospheric Aerosol and Gas Experiment III instrument aboard the International Space Station (SAGE III/ISS) since February 2017. The SAGE III/ISS instrument observes the aerosol extinction coefficient profiles in the stratosphere with a solar-occultation geometry, thus with a much larger signal-to-noise ratio than OMPS-LP but much sparser spatial sampling, at nine individual spectral bands from 385 to 1550 nm. As in S22, the AE used in this paper is obtained using SAGE III/ISS aerosol extinction observations at 521 and 869 nm.
2.3 Aerosol extinction observations with the Cloud-Aerosol Lidar and Infrared Pathfinder Satellite Observation (CALIPSO) Cloud-Aerosol Lidar with Orthogonal Polarisation (CALIOP)
High-vertical-and-horizontal-resolution observations of the CALIOP (Cloud-Aerosol Lidar with Orthogonal Polarisation) spaceborne lidar aboard the CALIPSO (Cloud-Aerosol Lidar and Infrared Pathfinder Satellite Observation) satellite are used for the description of the smoke-charged compact anticyclonic vortices emanating from the main Australian wildfire plumes. As a main variable, we use direct measurements of attenuated aerosol backscatter profiles at 532 nm. The AOD of the vortices is estimated from the ratio of the lidar signal S at aerosol-free altitudes z1 and z2, respectively above and below the analysed aerosol layer, using the following equation:
where S(z) and βm(z) are respectively the range-corrected signal and the molecular backscatter coefficient at the altitude z. This equation is directly derived from the ratio of the classic lidar equation (Fernald, 1984) evaluated the two altitudes z1 and z2, which is very similar to Platt's equation for an aerosol-free altitude (Platt, 1973). This is the solution constrained by the two-way transmittance that was also used in previous work (Young, 1995; Omar et al., 2010; Cook et al., 1972; Prata et al., 2017). The two altitudes are manually chosen as those where the lidar signal roughly varies within radiometric noise variability along the transect. Then, aerosol lidar ratios (LRs) are roughly calculated by dividing the AOD by the vertically integrated attenuated backscatter after subtracting molecular backscatter, as follows:
This rough approximation may induce some overestimation of the LR, while multiple scattering is also neglected here (which is typically considered limited for small particles such as those emitted by wildfires). Finally, LRs are used for calculating aerosol extinction profiles using a classic lidar equation (Fernald, 1984). This is a standard method which can only be used for aerosol layers between aerosol and cloud-free altitudes such as those analysed in the present study. It presents the advantage of not needing any a priori hypothesis on the lidar ratio (LR) of the aerosol layer (also used by Sellitto et al., 2022), and it does not use any prior aerosol classification. This method is particularly suited for the current case where aerosol optical properties are very specific ones and a priori unknown while assumptions may induce significant errors. In general, the current approach is different and complementary to the standard operational products of aerosol extinction and AOD from CALIPSO data, which either rely on a priori assumptions on the LR of each aerosol layer (Young and Vaughan, 2009) or on fully automatic detections of aerosol-free altitudes of the aerosol layer boundaries (see https://www-calipso.larc.nasa.gov/, last access: 3 October 2023). The latter aspect is particularly difficult for high-altitude aerosol layers for which radiometric noise is relatively high, such as those analysed in the present study. Observations of the backscatter profiles βaer at 1064 nm are used, in combination with the channel at 532 nm, to obtain a colour ratio parameter (CR) , which is an optical proxy of the mean particle size in the aerosol layer. Information on the polarisation state of the backscatter radiation is also obtained in the channel at 532 nm as a depolarisation ratio δ, which provides critical information on particle shape.
The main detached vortex is tracked using ECMWF (European Centre for Medium-Range Weather Forecasts) IFS (Integrated Forecasting System) reanalyses, which are described in detail in Khaykin et al. (2020). As done by Khaykin et al. (2020), ECMWF-IFS-derived datasets of vorticity and ozone anomalies are used as vortex tracers. In this work, these datasets are used to identify CALIOP overpasses of the main detached vortex from Australian bushfires.
The hemispheric perturbation of the stratospheric aerosol layer by the Australian wildfires in 2019–2020 is discussed in detail in S22. Here we show further specific observations of the dual manifestation of the overall aerosol perturbation from this event, the hemispheric-scale plume and the detached compact vortices. While the large-scale plume is observable with limb observations at all latitude bands (S22), the detached vortices are more difficult to characterise with this observation geometry, due to their relatively small horizontal size and because of their relatively rapid horizontal paths across the Southern Hemisphere. Khaykin et al. (2020) provided a detailed reconstruction of the horizontal dynamics of the main vortex by means of ECMWF-IFS reanalyses and different satellite observations, showing that most of the signature of the main vortex can be found in the latitude band between approximately 35 and 50∘ S (see, for example, their Fig. 6). Figure 2a shows time series of the zonal average vertical distribution of the OMPS-LP aerosol extinction at 675 nm in the latitude band 40–45∘ S, which displays clear evidence of both the large-scale plume and the main detached vortex. Both features display a self-lofting behaviour. The overall effect of the plume rise can be seen in January and February 2020, with progressively higher altitude of the dominant aerosol optical signature, from the injection height at about 17 km up to 20–21 km. The isolated and shorter-term signature of the main vortex, when it vertically separates from the main plume, is clearly visible from February to the beginning of March, with aerosol extinction enhancements exceeding 30 km altitude. While the zonal average aerosol extinction is clearly dominated by the hemispheric plume below ∼ 22 km, values exceeding 10−3 to 10−2 km−1 are associated with the main vortex at higher altitudes. To show the latter effect, Fig. 2b shows the OMPS-LP aerosol extinction coefficient, in the latitude band 40–45∘ N, at a fixed altitude of 28 km. The presence of the vortex produced a transient (about 2 weeks) increase in the aerosol extinction at this altitude of at least 2–3 orders of magnitude with respect to background conditions. A following longer-lasting (until August 2020) perturbation of the aerosol extinction, at these altitudes, is also visible in Fig. 2b (see also the corresponding period in Fig. 2a); its origin is not yet fully understood and is a subject of future work. The dual nature of the aerosol perturbation by the Australian wildfires is also visible from the monthly average extinction profiles; see, for example, the February 2020 average in Fig. 2c. The relative magnitude of the hemispheric plume (at approximately 15 to 22 km altitudes) and the vortex (at approximately 25 to 30 km altitudes) can be appreciated from this figure.
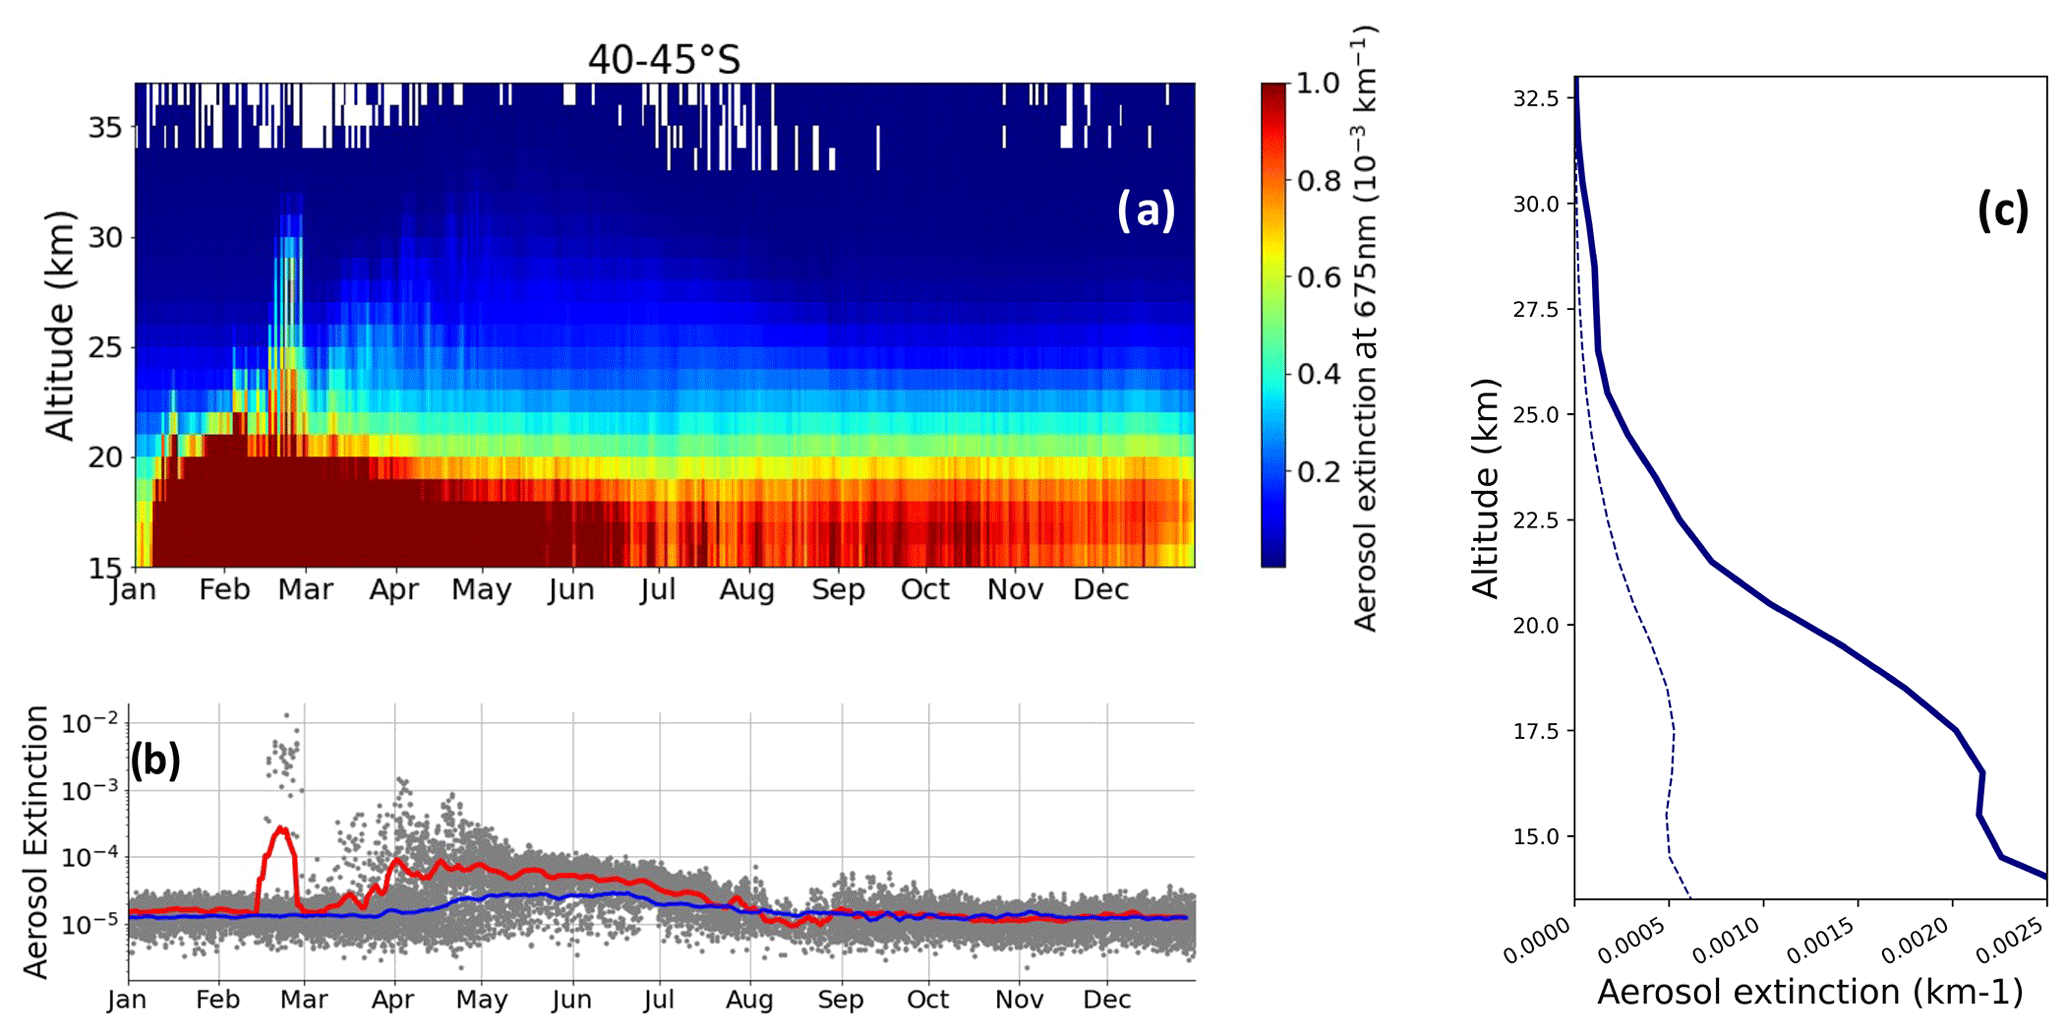
Figure 2OMPS-LP observations at 675 nm in the latitude interval 40–45∘ S: time series of the zonal average vertical profiles of the aerosol extinction in 2020 (a), individual aerosol extinction coefficient observations at 28 km altitude (b), and monthly mean aerosol extinction coefficient profiles in February 2020 (perturbed profiles, solid lines) and February 2019 (background profiles, dashed lines) (c). In panel (b), temporally smoothed time series for 2020 (red curve) and 2019 (blue curve) are also shown.
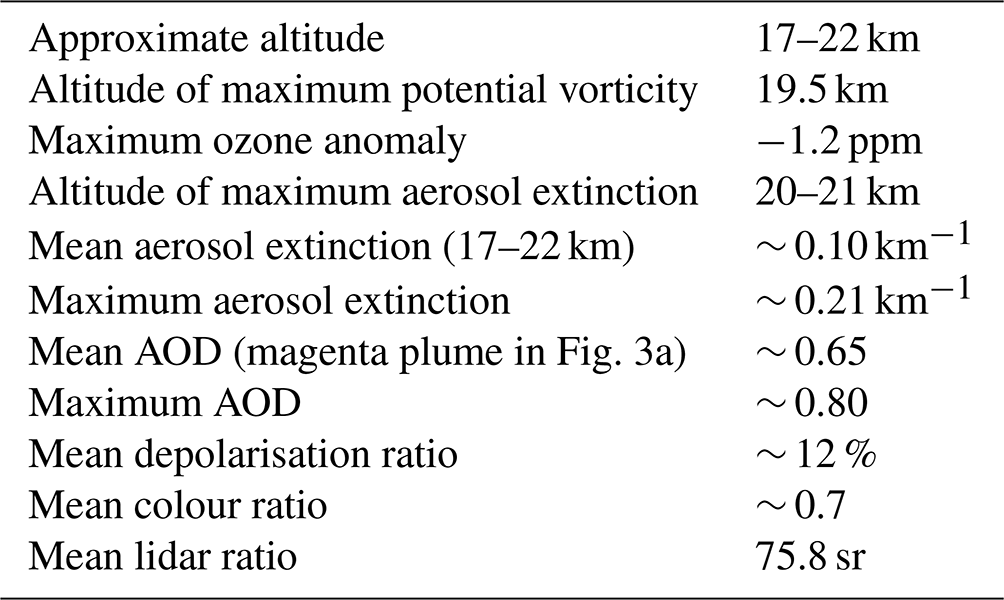
High-vertical-resolution observations of the main vortex emanating from the Australian fires in 2019–2020 are available with in-vortex CALIOP observations. In Fig. 3, an example these observations is shown for 11 January 2020. Using dynamical information taken from ECMWF-IFS vorticity, it can be seen that one CALIOP track overpassed the vortex near its centre during this day (Fig. 3c). The vortex is also accompanied by a dynamically driven ozone mini-hole, as described by Khaykin et al. (2020); thus, ozone mixing ratio anomalies can also be used to track the vortex position (see Fig. 3d). The morphology and magnitude of the aerosol signature associated with the vortex are shown in Fig. 3a–b by means of vertical profiles of the attenuated backscatter and the aerosol extinction. During this early stage of its lifetime, the vortex was located around 17–22 km altitude, with a maximum of the aerosol extinction and potential vorticity at 19–22 km, and was travelling towards the east. The compact higher-altitude frontal structure of the vortex (see magenta section in Fig. 3a–b) and the leaking of smoke aerosols at lower altitudes (see green section in Fig. 3a–b) are clearly visible for this overpass. These two aspects of the plume morphology and dynamics are described in detail by Podglajen et al. (2023). The CALIOP instrument allows further characterisation of the sampled aerosol type through different optical parameters, like the AOD and depolarisation, and colour and lidar ratios (δ, CR and LR, optical proxies of particles sphericity, mean size and type, respectively). The mean values of these optical parameters, for the core vortex (magenta section in Fig. 3a–b), together with other typical values of aerosol, ozone and dynamical parameters taken by CALIOP observations and ECMWF-IFS reanalyses, are listed in Table 1. The first thing noted is the extremely large AOD for the vortex at this early stage, with an average value in the vortex core of ∼ 0.65 and a peak value of ∼ 0.80 in the visible range. A relatively large LR, ∼ 76 sr in our case, is found, which is typical of biomass burning aerosols (e.g. Burton et al., 2013). Usually, aged biomass burning aerosols are also associated with relatively small δ and large CR (e.g. Haarig et al., 2018; Papagiannopoulos et al., 2018; Hu et al., 2019), with slightly larger δ in the stratosphere than in the troposphere (Sicard et al., 2019), which in turn points to spherical and small particles. On the contrary, during our overpass, the average value of δ is about 12 %, which can be associated with significantly aspherical particles, and CR is about 0.7, which can be associated with relatively large particles. These results point to a very dense layer of extremely fresh biomass burning particles, i.e. with large ash that has not yet sedimented and before significant hydration and secondary aerosol formation (the processes that tend to render the biomass particles more spherical). This can be associated with absorbing black-carbon-dominated aerosol layers. It is important to mention that Haarig et al. (2018) discussed on the possibility that the spectral behaviour of δ in the stratosphere has a relatively strong trend, with larger values in the visible spectral range even for spherical particles, which might provide an alternative explanation to our observed δ values. Nevertheless, in S22, we have shown evidence that the hemispheric plume for the Australian fires in 2019–2020 may have undergone atmospheric evolution towards less absorbing brown carbon particles. Thus, we expect that the optical properties of the large-scale plume and the vortices are significantly different, possibly due to the isolation of the vortices from ambient air.
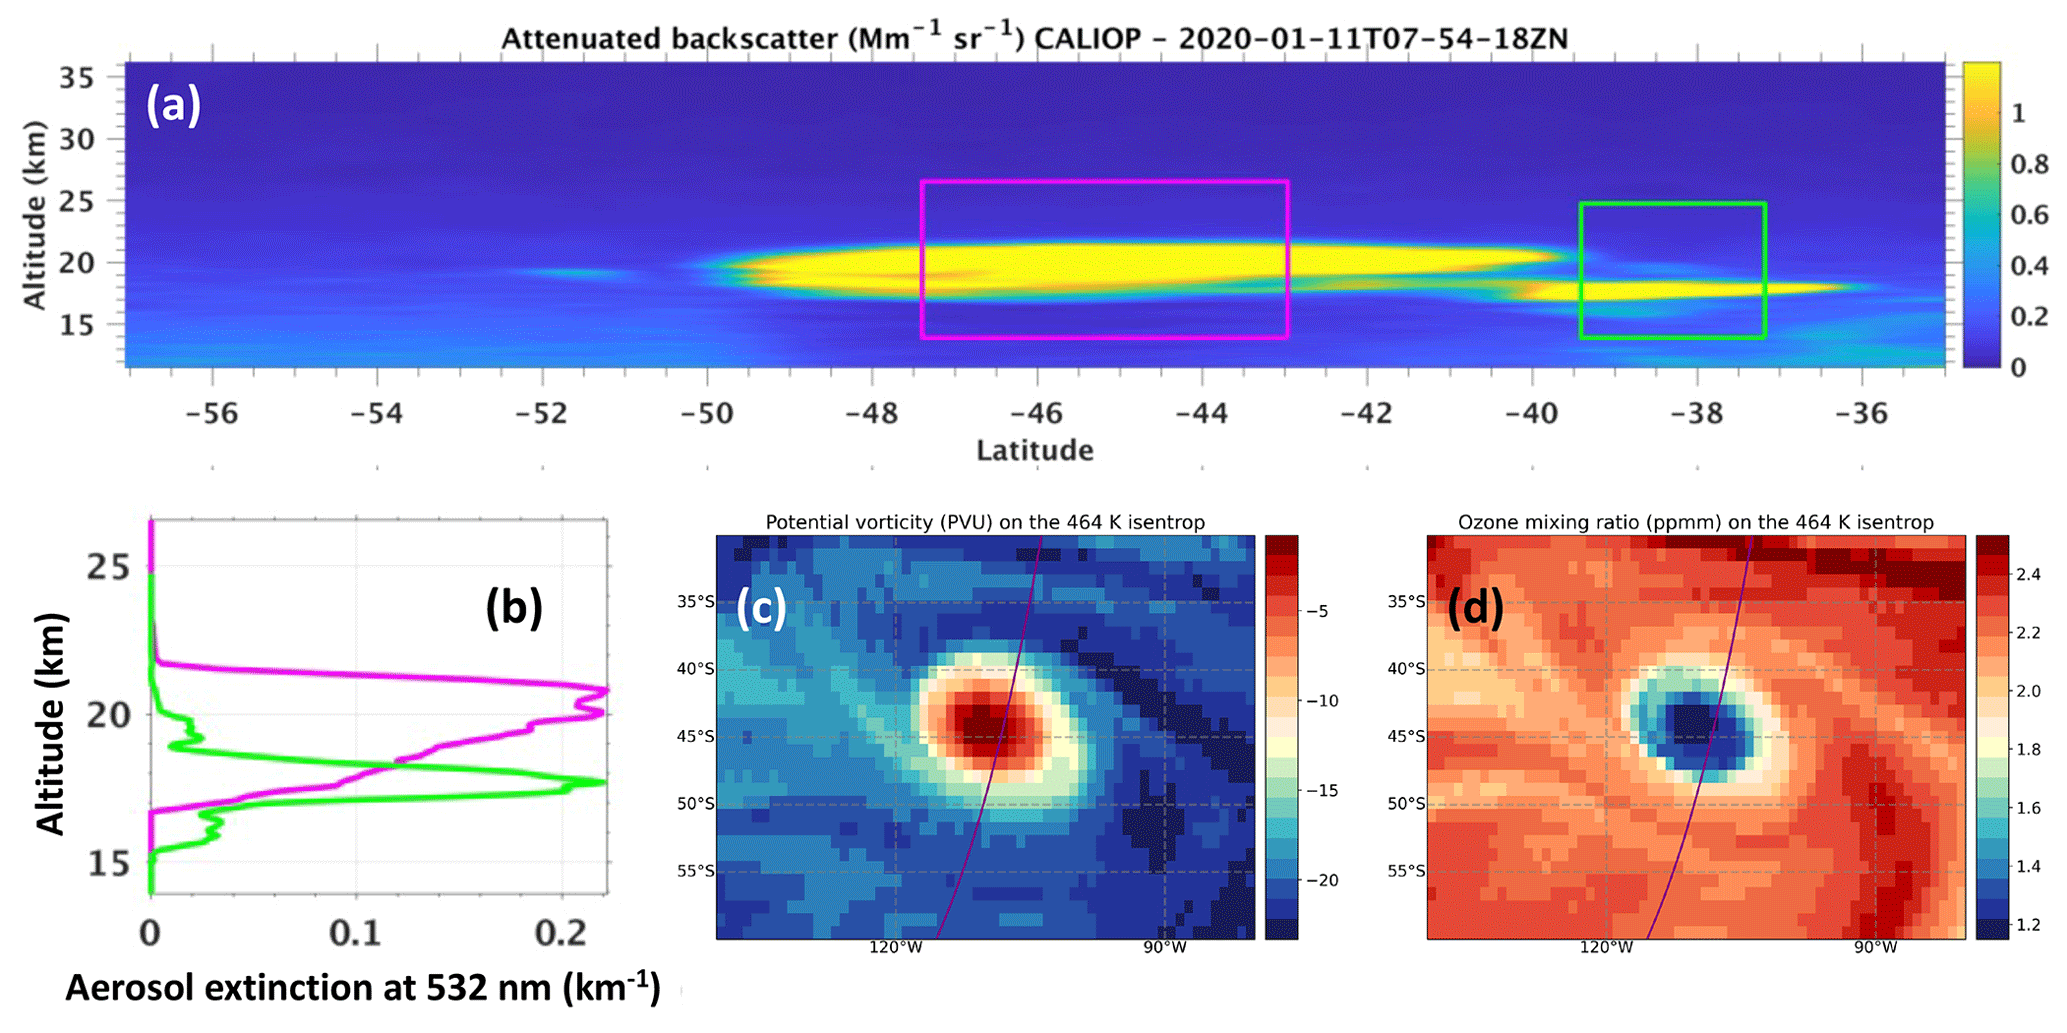
Figure 3CALIOP attenuated backscatter observations at 532 nm for the main vortex overpass of 11 January 2020 (a) and aerosol extinction profiles averaged in the magenta and green boxes individuated in panel (a) in respective colours (b). The CALIOP overpass of the vortex, identified by means of ECMWF-IFS potential vorticity and ozone mixing ratio anomalies (at 464 K isentropic level, about 18 km altitude), is shown as the violet track in panels (c) and (d), respectively. In panel (d), ppmm is parts per million in mass.
Table 1Morphological and optical properties of the vortex of Fig. 3 for 11 January 2023, from CALIOP observations and ECMWF-IFS reanalyses.
4.1 Large-scale heating rates and sensitivity to aerosol optical properties
An aerosol layer interacts with solar and terrestrial radiation, leading to modifications to the net radiation fields at the surface and TOA (the surface and TOA RF) of interest for the radiative balance and climate, depending on the optical properties of the aerosol layer. For the aerosols emitted during the Australian fires in 2019–2020, this effect is discussed in detail by S22. Besides this, an aerosol layer can also modify the local energy budget, introducing a radiatively driven diabatic heating or cooling. Temperature increases or decreases can then be generated due to the excess of absorbed or emitted radiation, which can in turn modify the vertical dynamics of the lofting or sinking air masses. This radiative impact can be quantified with radiative heating and cooling rates as a function of the altitude. In this paper, we represent cooling rates as negative HRs. Like for the surface and TOA RF, the HRs depend critically on the optical properties of the aerosol layer. These can be defined in a compact way by quantifying their overall extinction (by means of the aerosol optical depth, AOD), their absorption properties (by means of their single scattering albedo, SSA) and angular distribution of the scattered radiation (by means of their phase function, synthesised with the asymmetry parameter, g). Please see S22 for more details and discussion on these properties.
A simple expression of the HR is given in Eq. (3) (Liou, 2002). In this equation, ρ is the air density, Cp is the air heat capacity at constant pressure, and is the variation of the net radiation flux due to the presence of a specific forcing agent – the aerosol plume from the Australian fires in our case. For an aerosol layer, the net radiation flux modification ΔF(z) depends critically on its optical properties, which transmit this dependency to the HR. How the HRs depend on the optical properties of an aerosol layer is still very uncertain and subject to active research, which is particularly the case for the LW component (e.g. Liou, 2002).
Figure 4 shows sensitivity analyses of the SW, LW and net SW + LW HRs for the large-scale average aerosol plume, for the 4 months addressed in this study and for three latitude ranges, when using different assumptions on the SW and LW SSA and g optical parameters in our offline radiative transfer calculations. As discussed by S22, in the SW, the plume ageing is expected to lead towards an increase in the SSA and g due to the progressive atmospheric evolution of small and absorbing black carbon towards larger and less absorbing brown carbon particles. Less is known about typical values of the LW SSA and g. As discussed in Sect. 2.1, we estimated LW optical parameters with a Mie code and found that the LW SSA is largely insensitive to atmospheric ageing, while LW g progresses towards larger values, as in the SW range. For both the SW and the LW spectral ranges, the HR is found largely insensitive to g. The SW HRs display a marked peak of positive values in the vertical region perturbed by the large-scale plume from the Australian fires, around 12–25 km altitude. The absolute value of the HR depends critically on the SW SSA and thereby on the absorptivity of the layer in this spectral range, with values as large as 0.5 K d−1 (February average, 15–25∘ S) for the most absorbing aerosols with SSA =0.8. The SW HRs decrease steeply with increasing SSA, i.e. for more aged and less absorbing aerosol layers. The LW HR is generally a cooling in the vertical region perturbed by the large-scale plume, with a simultaneous heating at higher altitudes, around 35 km. The LW radiative cooling in the region occupied by the Australian fires aerosols is almost independent on the atmospheric ageing processes of the aerosol layer and has values comparable with the positive HR in the SW. As a result, the net SW + LW HR has reduced values with respect to the SW-only component, which demonstrates the importance of taking into account the LW HR component. Past estimates of the HR for this event neglected the LW component (e.g. Wu et al., 2022) and are thus to be considered overestimated. After a transient phase in January 2022, the net HR induced by the Australian fires is generally positive (dominated by SW) and of the order of about 0.2 K d−1 (15–25 and 25–60∘ S) and 0.1 K d−1 (60–80∘ S), at about a 12–25 km altitude range, in February–April 2020, when averaged over the different hypotheses on SSA and g.
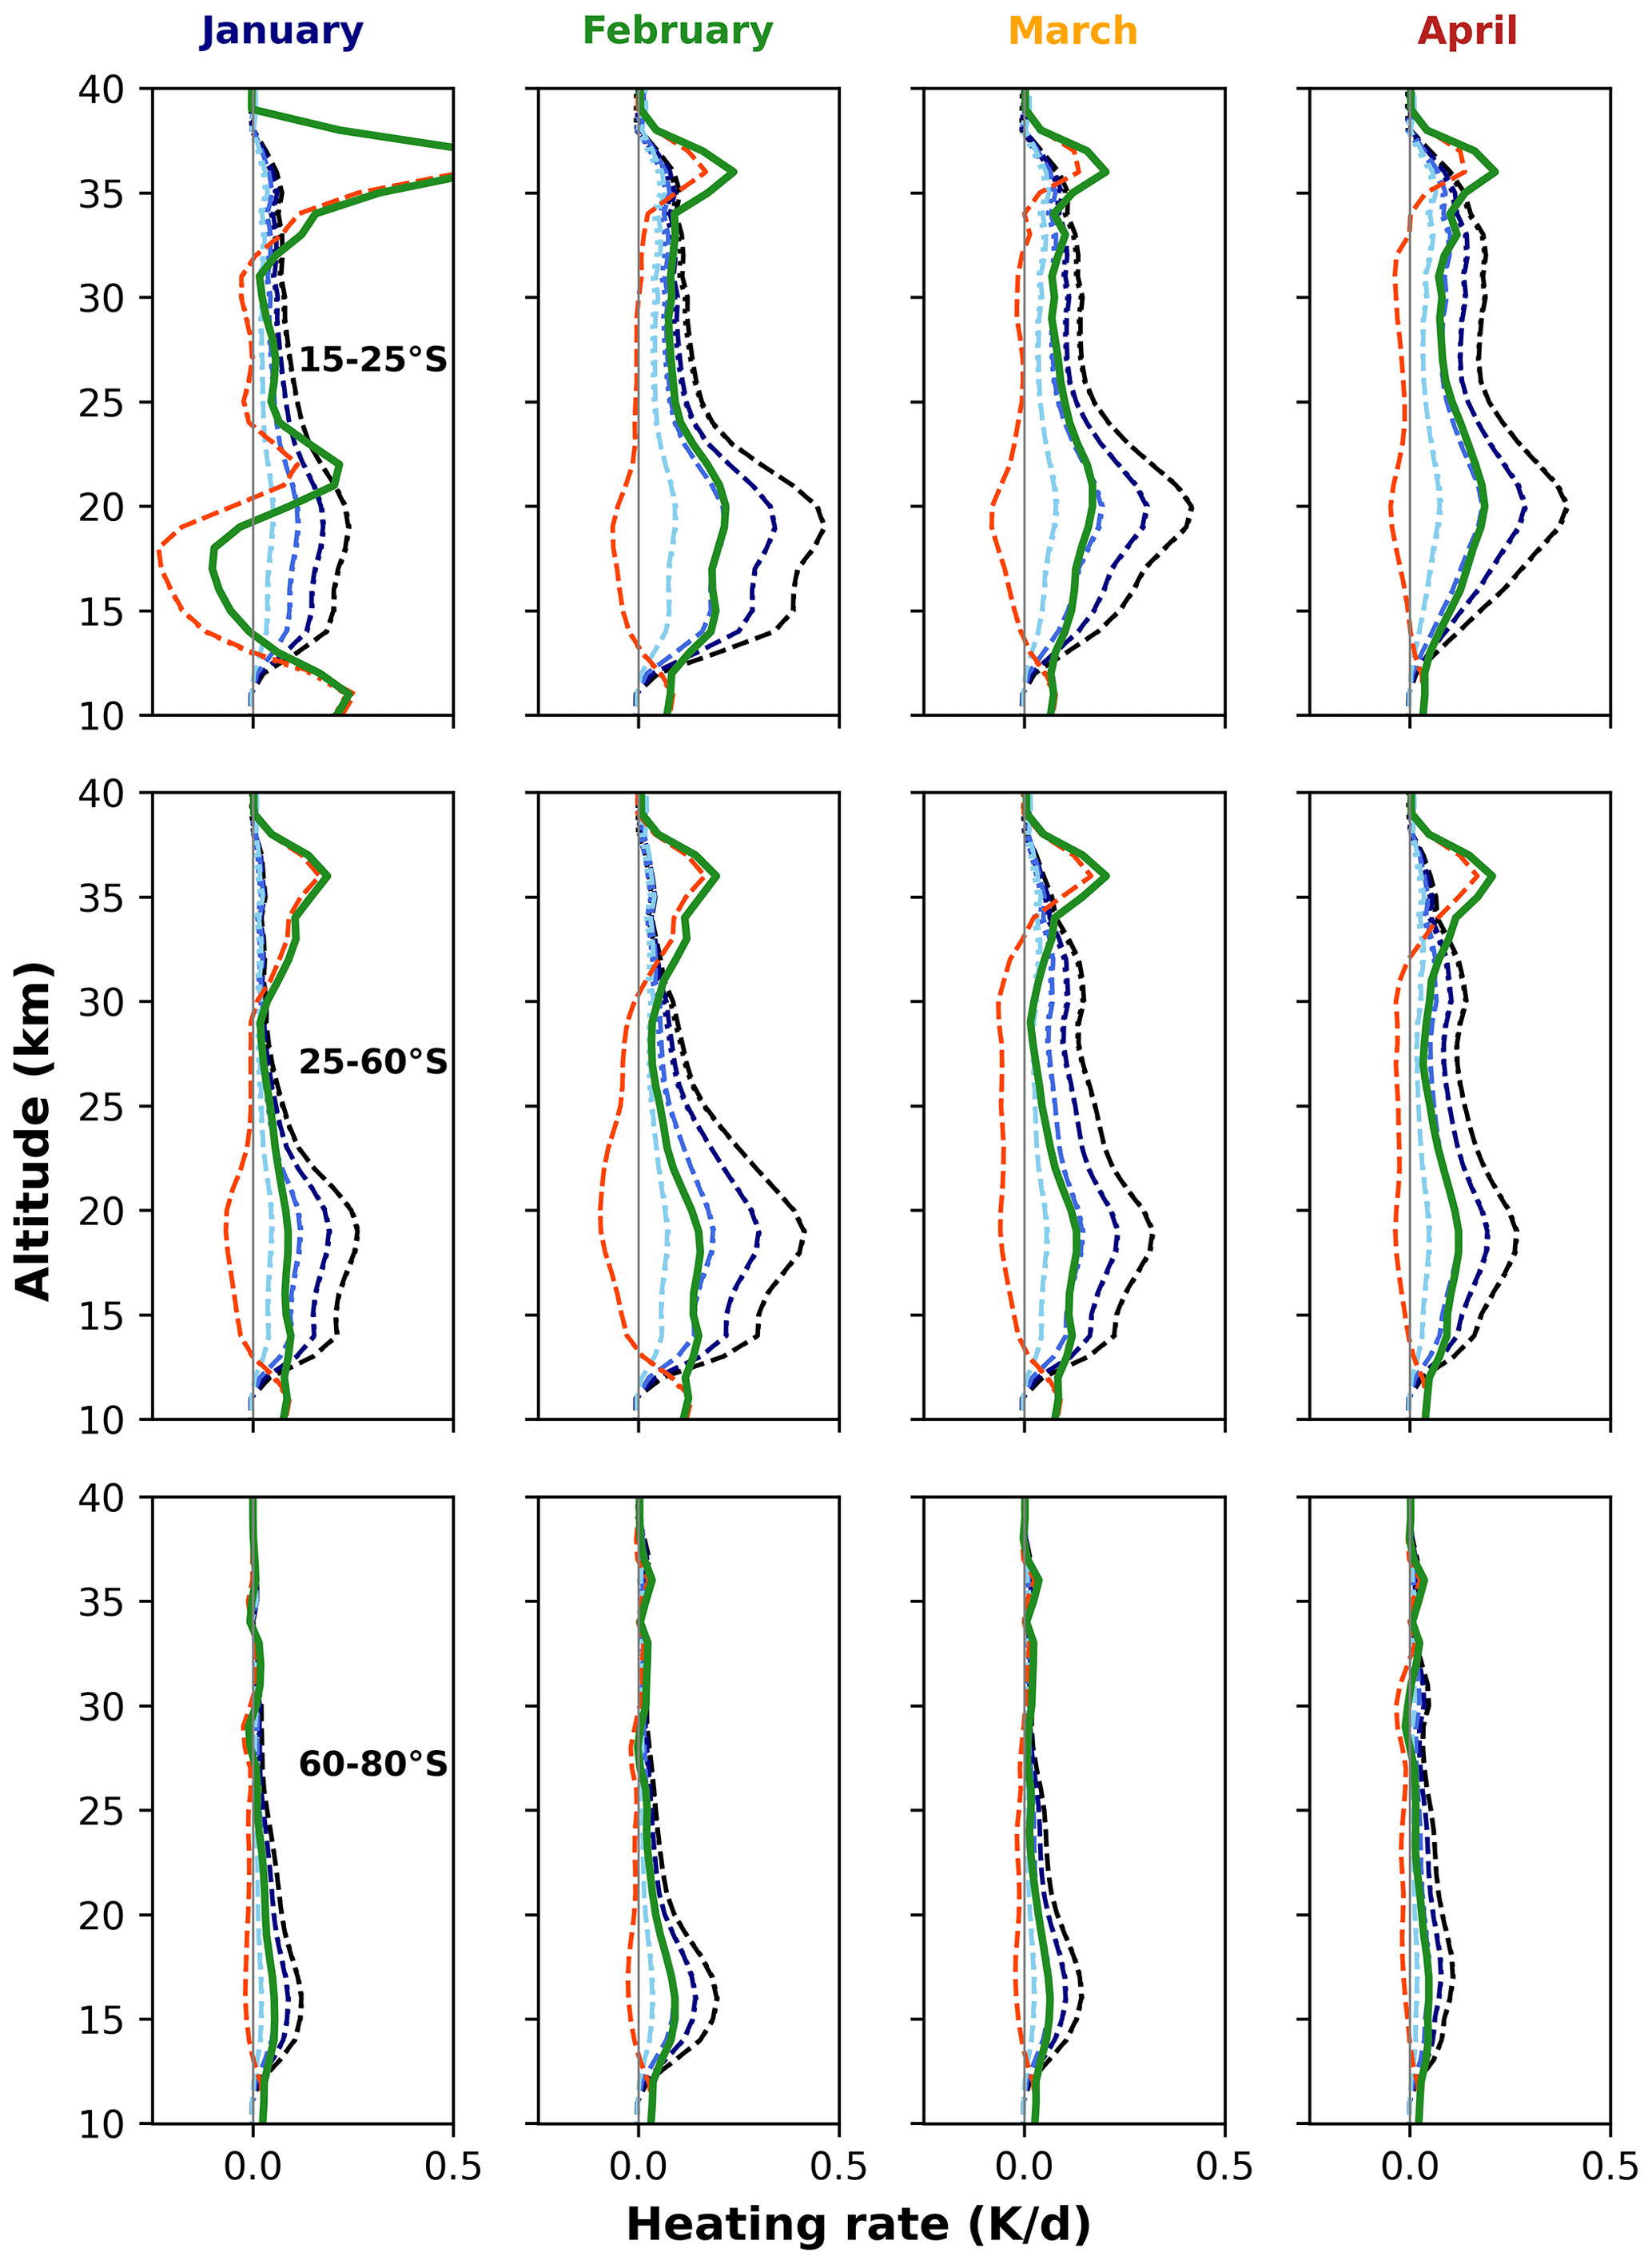
Figure 4Monthly mean regional equinox-equivalent daily average HRs, SW (shades of blue and black lines), LW (orange lines) and net SW + LW (green lines), from January to April 2020 (different columns), in three latitude ranges (15–25, 25–60 and 60–80∘ S, top to bottom lines). Following the Mie calculations discussed in the text, different assumptions are made for SSA and g. SSA (SW component): sky blue lines, 0.95; medium blue lines, 0.90; dark blue lines, 0.85; black lines, 0.80. SSA (LW component): orange lines, 0.20. G (LW component): dashed lines, 0.5; dotted lines, 0.3. G (SW component): dashed lines, 0.7; dotted lines, 0.5 (please note that dotted lines are mostly superimposed on the dashed lines, reflecting the very weak dependence of the HR on g).
Starting from the regional estimates of HRs, we estimate the Southern Hemispheric HR with an area-equivalent averaging of these values. Figure 5 shows time series of the monthly mean (January to April 2020) Southern Hemispheric HR, as a function of the different hypotheses on SSA and g, as well as an average over all scenarios. These monthly means represent averages of the HR profiles in the altitude range 12–25 km. The SW and LW HRs are consistently positive and negative, respectively, with a dominance of the SW heating, leading to a maximum net HR (averaged over all SSA and g scenarios) of 0.08±0.05 K d−1 in February 2020 (SW HR: about 0.09 K d−1; LW HR: about −0.02 K d−1). Reflecting the results of the Mie studies and the variability of the aerosol optical properties already discussed for the regional HR estimations, the LW hemispheric HR displays a very small variability (less than 1 %), and the SW hemispheric HR displays a very large variability, as a function of atmospheric ageing (see also error bars of the SW, LW and net SW + LW HRs in Fig. 5). Due to this large variability of the SW HR, the net hemispheric SW + LW HR varies in February 2020 between about 0.01 K d−1 (very reflective particles, SSA: 0.95) and 0.15 K d−1 (very absorbing particles, SSA: 0.80). A typical value of the lofting rate in the stratosphere is about 0.1 km d−1 for a 1 K d−1 HR. Thus, our net SW + LW HR estimations are consistent with an ensemble self-lofting of the overall hemispheric plume of a few kilometres in 4 months (see Fig. 2a and the discussion in Yu et al., 2021). Our hybrid observations–modelling estimations are consistent with the modelling-based estimations of Heinold et al. (2022), even if slightly larger (see Fig. 6c of that paper and the discussion therein).
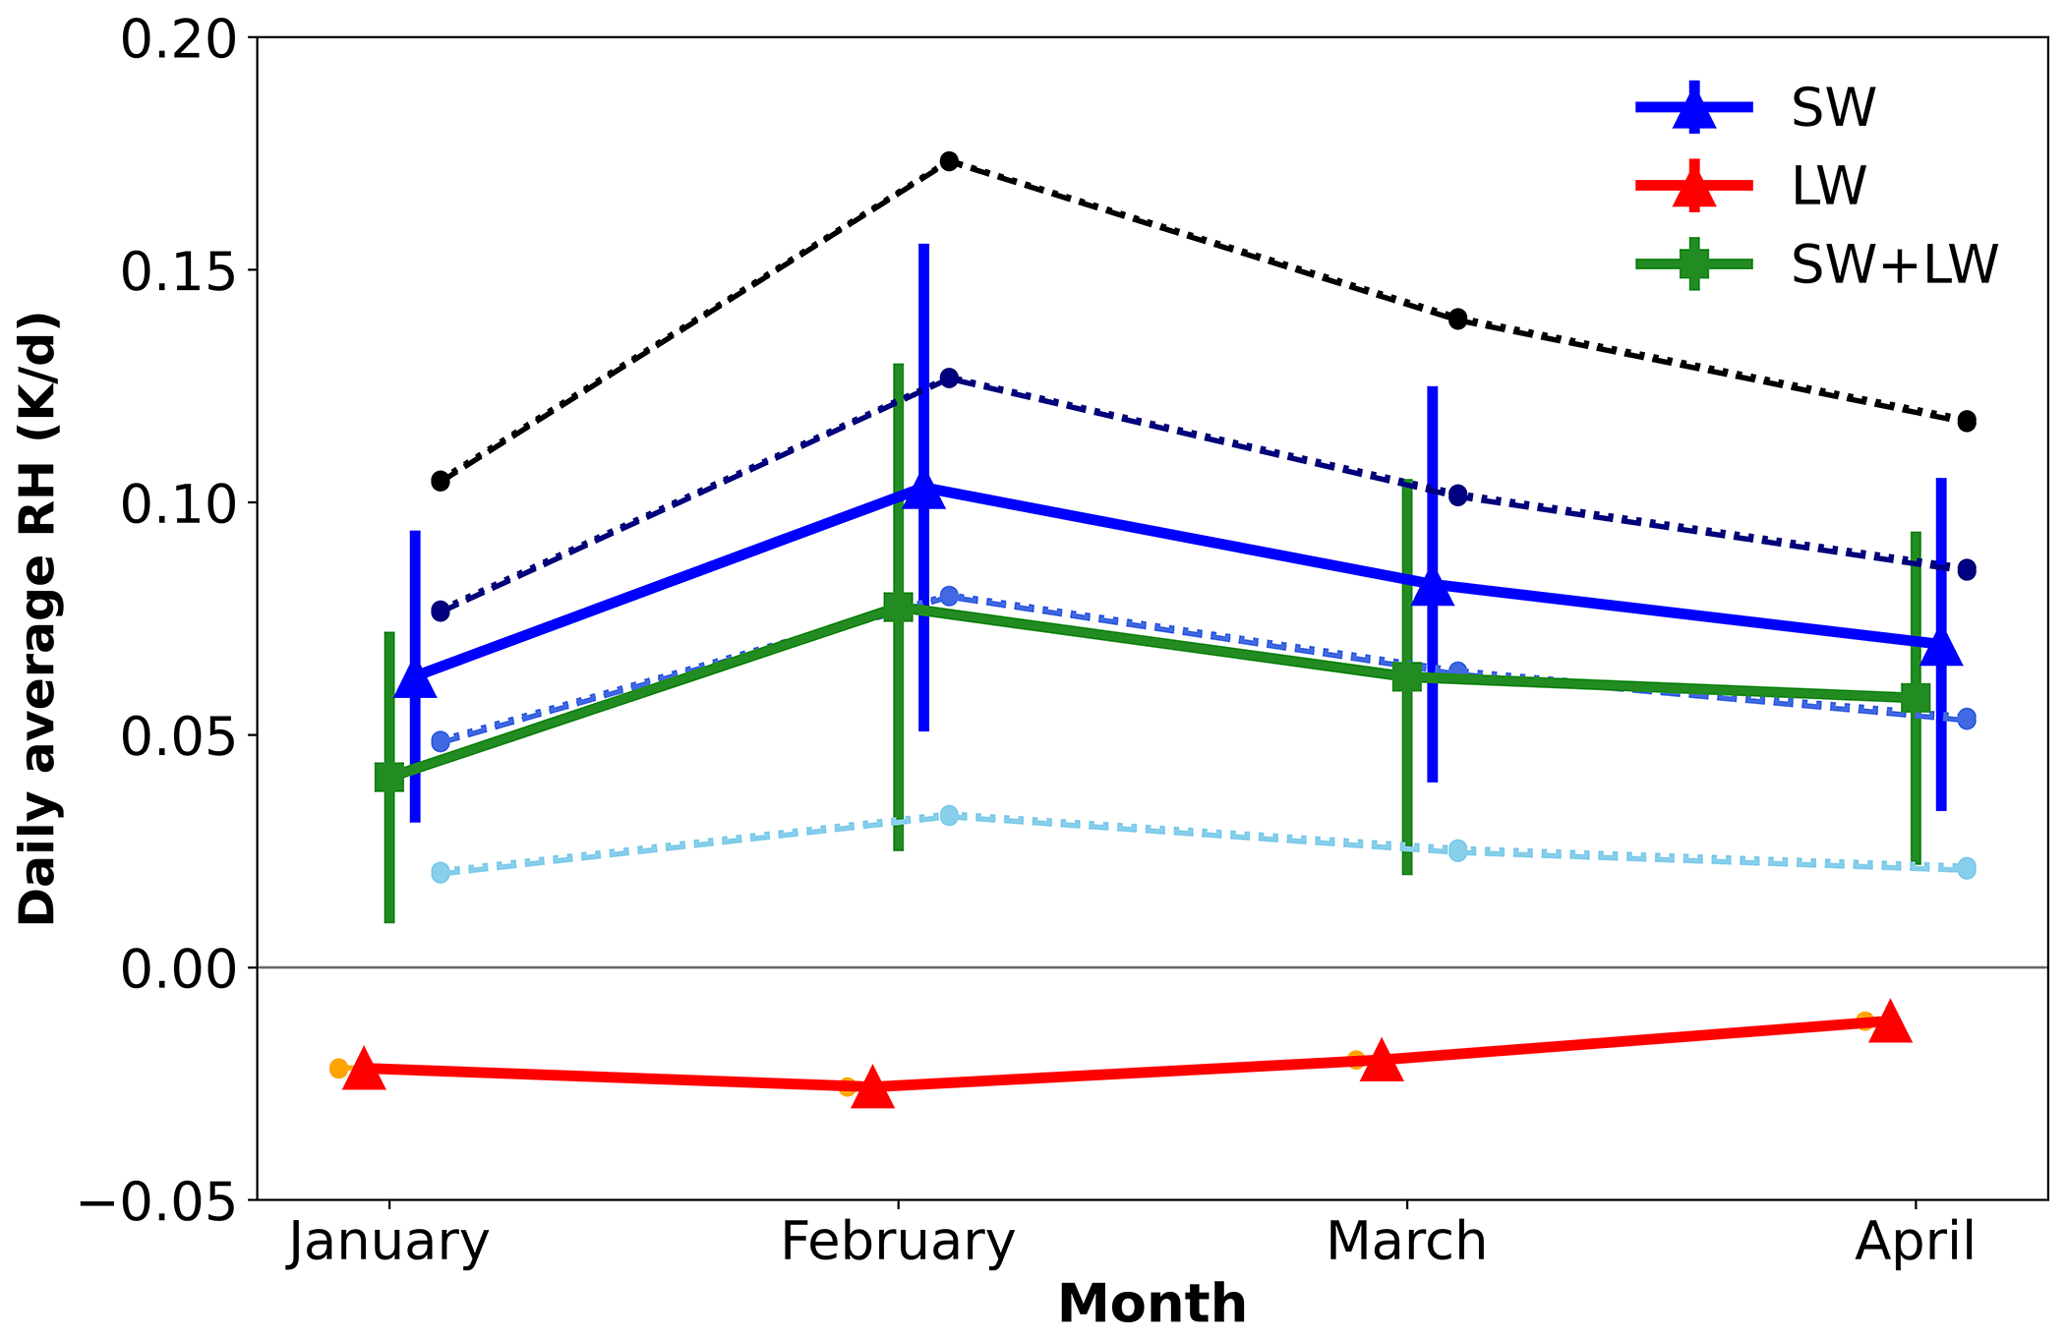
Figure 5Time series, from January to April 2020, of the monthly mean area-weighted Southern Hemispheric HR, based on equinox-equivalent daily-average HR of Fig. 4, for the UTLS perturbation of Australian fires in 2019–2020. The radiative heating profiles are averaged in the altitude range 12–25 km. Different shades/types of blue dots and lines are for different SSA and g values – the darker the shade the smaller the SSA, dashed/dotted lines for larger and smaller g; see caption of Fig. 4 for details. Different types of orange dots and lines are for different g values – dashed/dotted lines are for larger and smaller g; see caption of Fig. 4 for details. The HR values, averaged over all SSA and g scenarios, for different spectral ranges are also in different colours: SW, blue triangles with error bars and lines; LW, red triangles with error bars and lines; net SW + LW, green squares with error bars and lines. The error bars are representative of the variability of the average SW, LW and SW + LW monthly mean radiative heating due to SSA and g variability.
4.2 Diabatic heating and the vortex dynamics
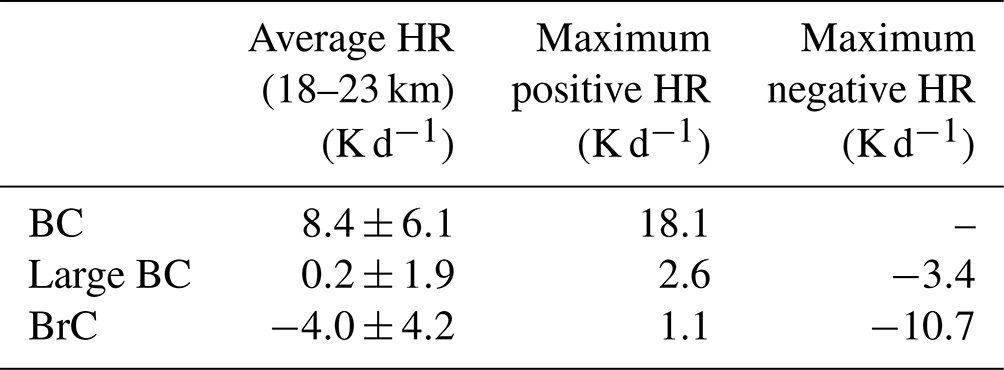
To get more insights into the radiative interactions within the isolated vortex features emanating from the larger-scale biomass burning plume from the Australian fires, we estimated the HR in the main vortex discussed in Sect. 3. As input to our offline radiative modelling, we considered the exemplary CALIOP overpass of 11 January 2020 shown in Fig. 3. Figure 6 shows the SW, LW and net SW +L W HRs for this overpass of the vortex, with three different scenarios of the unmeasured optical properties: black carbon, large black carbon and brown carbon (consistent with the definitions given by S22; see also the caption of Fig. 6). Table 2 present average values of the HR in the full vortex-occupied vertical interval between 18 and 23 km. The observed ascent of the vortices (Khaykin et al., 2020) requires a positive diabatic heating (Podglajen et al., 2023). From Fig. 6 it is evident how the only configuration which produces the required positive HR in our simulations is the one associated with fresh, small, and very absorbing BC particles. These conditions are possibly verified in the first couple months and maintained for a relatively long time due to the dynamical isolation of the vortices. Air masses mixing with ambient air might evolve more quickly towards less absorbing particles, which would not be compatible with the enhanced ascent observed for the isolated vortices. The net HR for the BC scenario (Fig. 6a) reaches values as large as 15–20 K d−1 in the core of the vortex at 20–21 km (SW HR: about 25 K d−1; LW HR: about −5 K d−1) and an average value of 8.4±6.1 K d−1 in the overall vertical region between 18 and 23 km. These values of the HRs are consistent with a vortex rise of about 20 km in 1–2 months. The large BC scenario (Fig. 6b), on the contrary, produces a close-to-zero net HR (0.2±1.9 K d−1, averaged between 18 and 23 km altitude), due to compensation of SW heating and LW cooling, while the brown carbon (BrC) scenario (Fig. 6b) produces a net cooling ( K d−1, averaged between 18 and 23 km altitude). Thus, both these scenarios are inconsistent with the observed vertical dynamics of the main vortex emanating from the Australian fires.
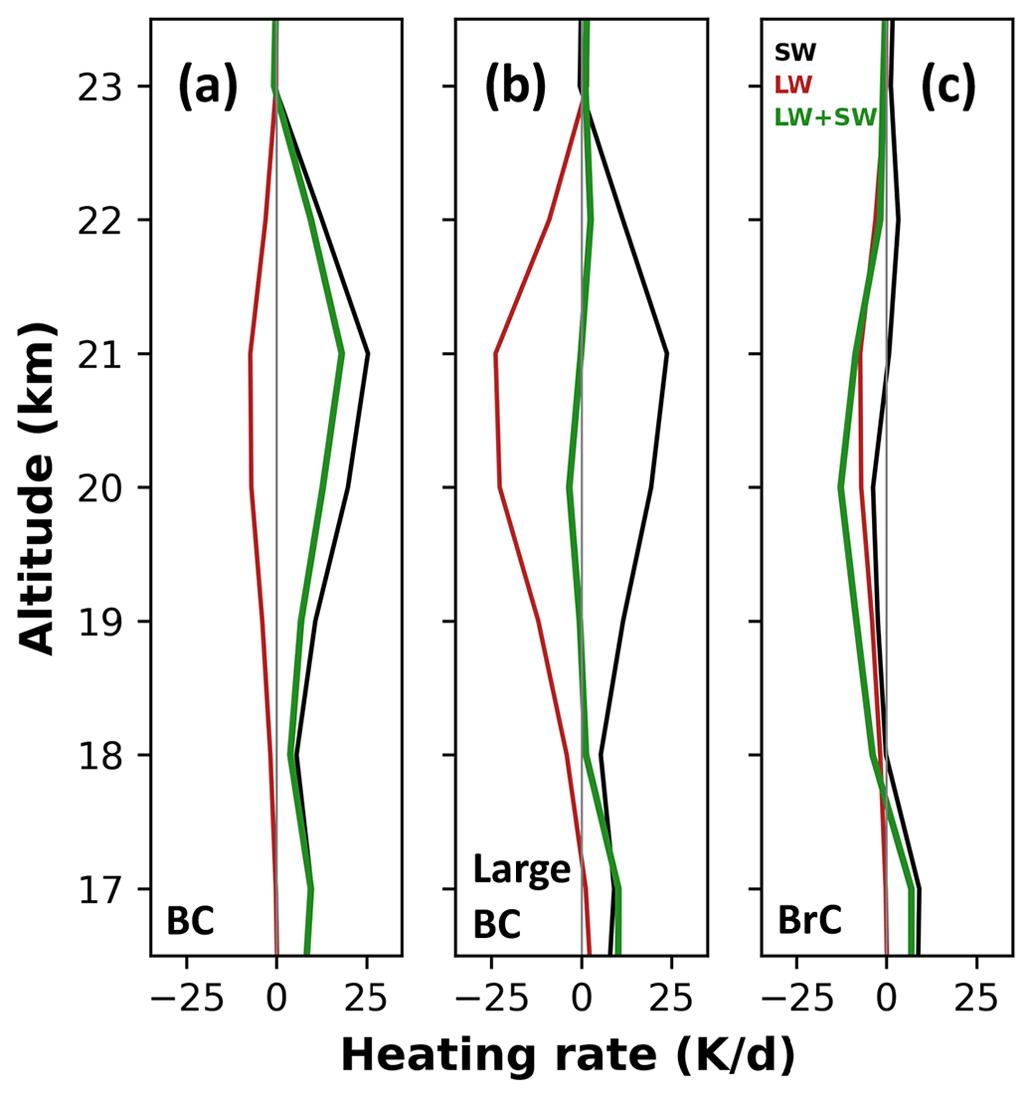
Figure 6In-vortex SW, LW and net SW+LW HRs for the CALIOP overpass of the main vortex on 11 January 2020 (CALIOP overpass shown in Fig. 3), with three assumed scenarios for the unmeasured aerosol properties: (a) black carbon (BC, SW SSA: 0.80; SW g: 0.5–0.7; LW SSA: 0.20; LW g: 0.3), (b) large black carbon (large BC, SW SSA: 0.80; SW g: 0.7; LW SSA: 0.20; LW g: 0.5) and (c) brown carbon (BrC, SW SSA: 0.90–0.95; SW g: 0.7; LW SSA: 0.20; LW g: 0.5). These three cases are defined in a consistent manner as in S22.
Table 2Average HR and maximum positive/negative HR in the altitude range 18–23 km for the three scenarios of Fig. 6.
In this paper we have presented an array of coupled observations–modelling simulations of the radiative transfer through the biomass burning aerosol plume linked to the record-breaking Australian fires in 2019–2020, complementing the work of S22, to estimate the radiative heating in terms of the HR induced in the UTLS by these fires. Descriptions of the hemispheric-scale plume and of the main smoke-charged isolated anticyclonic vortex (Khaykin et al., 2020) associated with these fires are provided using limb (large-scale plume) and lidar (in-vortex) satellite observations. Aerosol observations are used as inputs to detailed and flexible offline radiative transfer modelling to produce regional, hemispheric, and in-vortex SW and LW HR profile estimates. Different hypotheses on the plume evolution have been considered, mirrored by the evolving unmeasured optical properties of the plume, namely the SSA/absorptivity of the plume and the g/angular distribution of the scattered radiation. This paper provides, for the first time, an analysis of the variability of the HR of biomass burning plumes as a function of the aerosol optical properties and the relative importance of SW and LW contributions. As observed also for the TOA and surface RF in S22, we found that large-scale hemispheric HRs depend critically on these assumptions, in particular through the dependence of the SW HR. In addition, our results suggest the importance of LW emission in the net HR of biomass burning plumes. For the hemispheric plume, generally SW heating and LW cooling is found for each ageing scenario. The LW cooling is approximately insensitive to the plume ageing, while the SW heating has a strong dependency on the aerosol absorptivity, in terms of the SSA, and a very small dependency on the aerosol size, in terms of g. Averaging over all optical/ageing scenarios, our best estimate of the peak hemispheric and monthly average net HR is 0.08±0.05 K d−1 (from 0.01 to 0.15 K d−1, depending on the assumption on the aerosol optical properties) in February 2020. This value is consistent with the observed ensemble self-lofting of the plume at the hemispheric scale of a few kilometres in 4 months. Our in-vortex HR estimations suggest that radiatively heated ascending isolated vortices, like the ones observed for the Australian fires in 2019–2020, are likely dominated by small-sized and strongly absorbing BC particles. For this optical scenario, we obtain a very large net HR of 8.4±6.1 K d−1 in the vortex, with peaks around 15–20 K d−1 in its denser section around 20–21 km. The in-vortex net HRs are consistent with the observed rise of the vortex of about 20 km in a couple of months. Our results confirm the importance of the exceptionally intense Australian fires in 2019–2020 in terms of their radiative impacts in the UTLS. Our hybrid methodology, coupling plume's observations and radiative transfer modelling, provides a unique reference for chemistry/transport and aerosol/climate modelling, which have been proven to not be able to satisfactorily describe the biomass burning aerosol plume evolution and, then, radiative impacts (Brown at el., 2021). It is important to mention that the Australian fire plume is accompanied by other effects on the UTLS composition, including in-vortex ozone depletion and water vapour increases. The effects of these further perturbations on the radiative balance are still to be addressed and are a focus of ongoing research.
OMPS-LP v2.0 and SAGE data are freely available at https://search.earthdata.nasa.gov/search/granules?p=C1898401389-GES_DISC&pg[0][v]=f&pg[0][gsk]=-start_date&q=omps&tl=1657880000!3!! (NASA Earthdata portal, 2022) and https://doi.org/10.5067/CX2B9NW6FI27 (Taha, 2020). The CALIOP data v3.41 are freely available from the NASA LARC website at https://doi.org/10.5067/CALIOP/CALIPSO/CAL_LID_L1-VALSTAGE1-V3-41 (NASA/LARC/SD/ASDC, 2016).
PS designed the study and ran the radiative simulations. RB and JC helped with SAGE/OMPS and CALIOP input data. AP and BL helped with the interpretation of the radiative/dynamical processes in the plumes. All authors participated to the discussion of the results. PS wrote the manuscript and all authors contributed to its revision and editing.
At least one of the (co-)authors is a member of the editorial board of Atmospheric Chemistry and Physics. The peer-review process was guided by an independent editor, and the authors also have no other competing interests to declare.
Publisher’s note: Copernicus Publications remains neutral with regard to jurisdictional claims made in the text, published maps, institutional affiliations, or any other geographical representation in this paper. While Copernicus Publications makes every effort to include appropriate place names, the final responsibility lies with the authors.
The providers of the libRadtran suite (http://www.libradtran.org, last access: 8 December 2023) are gratefully acknowledged.
This research has been supported by the Agence Nationale de la Recherche (grant no. 21-CE01-0007-01, ASTuS) and the Centre National d'Etudes Spatiales (grant no. TOSCA/EECLAT).
This paper was edited by Eduardo Landulfo and reviewed by two anonymous referees.
Anderson, G. P., Clough, S. A., Kneizys, F. X., Chetwynd, J. H., and Shettle, E. P.: AFGL atmospheric constituent profiles (0–120 km), DTIC, https://apps.dtic.mil/sti/pdfs/ADA175173.pdf (last access: 2 June 2016), 1986.
Boer, M. M., Resco de Dios, V., and Bradstock, R. A.: Unprecedented burn area of Australian mega forest fires, Nat. Clim. Change, 10, 171–172, https://doi.org/10.1038/s41558-020-0716-1, 2020.
Brown, H., Liu, X., Pokhrel, R., Murphy, S., Lu, Z., Saleh, R. Mielonen, T., Kokkola, H., Bergman, T. Myhre, G., Skeie, R. B., Watson-Paris, D., Stier, P., Johnson, B., Bellouin, N., Schultz, M., Vakkari, V., Beukes, J. P., van Zyl, P. G., Liu, S., and Chand, D.: Biomass burning aerosols in most climate models are too absorbing, Nat. Commun., 12, 277, https://doi.org/10.1038/s41467-020-20482-9, 2021.
Burton, S. P., Ferrare, R. A., Vaughan, M. A., Omar, A. H., Rogers, R. R., Hostetler, C. A., and Hair, J. W.: Aerosol classification from airborne HSRL and comparisons with the CALIPSO vertical feature mask, Atmos. Meas. Tech., 6, 1397–1412, https://doi.org/10.5194/amt-6-1397-2013, 2013.
Canadell, J. G., Meyer, C. P., Cook, G. D., Dowdy, A., Briggs, P. R., Knauer, J., Pepler A., and Haverd, V.: Multi-decadal increase of forest burned area in Australia is linked to climate change, Nat. Commun., 12, 6921, https://doi.org/10.1038/s41467-021-27225-4, 2021
Cook, C. S., Bethke, G. W., and Conner, W. D.: Remote measurement of smoke plume transmittance using lidar, Appl. Optics, 11, 1742–1748, 1972.
Dahlback, A. and Stamnes, K.: A new spherical model for computing the radiation field available for photolysis and heating at twilight, Planet. Space Sci., 39, 671–683, 1991.
Duane, A., Castellnou, M., and Brotons, L.: Towards a comprehensive look at global drivers of novel extreme wildfire events, Climatic Change, 165, 43, https://doi.org/10.1007/s10584-021-03066-4, 2021
Emde, C., Buras-Schnell, R., Kylling, A., Mayer, B., Gasteiger, J., Hamann, U., Kylling, J., Richter, B., Pause, C., Dowling, T., and Bugliaro, L.: The libRadtran software package for radiative transfer calculations (version 2.0.1), Geosci. Model Dev., 9, 1647–1672, https://doi.org/10.5194/gmd-9-1647-2016, 2016.
Fernald, F. G.: Analysis of atmospheric lidar observations: some comments, Appl. Optics, 23, 652–653, 1984.
Haarig, M., Ansmann, A., Baars, H., Jimenez, C., Veselovskii, I., Engelmann, R., and Althausen, D.: Depolarization and lidar ratios at 355, 532, and 1064 nm and microphysical properties of aged tropospheric and stratospheric Canadian wildfire smoke, Atmos. Chem. Phys., 18, 11847–11861, https://doi.org/10.5194/acp-18-11847-2018, 2018.
Heinold, B., Baars, H., Barja, B., Christensen, M., Kubin, A., Ohneiser, K., Schepanski, K., Schutgens, N., Senf, F., Schrödner, R., Villanueva, D., and Tegen, I.: Important role of stratospheric injection height for the distribution and radiative forcing of smoke aerosol from the 2019–2020 Australian wildfires, Atmos. Chem. Phys., 22, 9969–9985, https://doi.org/10.5194/acp-22-9969-2022, 2022.
Hirsch, E. and Koren, I.: Record-breaking aerosol levels explained by smoke injection into the stratosphere, Science, 371, 1269–1274, https://doi.org/10.1126/science.abe1415, 2021.
Hu, Q., Goloub, P., Veselovskii, I., Bravo-Aranda, J.-A., Popovici, I. E., Podvin, T., Haeffelin, M., Lopatin, A., Dubovik, O., Pietras, C., Huang, X., Torres, B., and Chen, C.: Long-range-transported Canadian smoke plumes in the lower stratosphere over northern France, Atmos. Chem. Phys., 19, 1173–1193, https://doi.org/10.5194/acp-19-1173-2019, 2019.
Hummel, J. R., Shettle, E. P., and Longtin, D. R.: A New Background Stratospheric Aerosol Model for Use in Atmospheric Radiation Models, AFGL-TR-88-0166, Air Force Geophysics Laboratory, Hanscom AFB, MA, https://apps.dtic.mil/sti/pdfs/ADA210110.pdf (last access: 8 December 2023), 1988.
Kablick III, G. P., Allen, D. R., Fromm, M. D., and Nedoluha, G. E.: Australian pyroCb smoke generates synoptic-scale stratospheric anticyclones, Geophys. Res. Lett., 47, e2020GL088101, https://doi.org/10.1029/2020GL088101, 2020.
Khaykin, S., Legras, B., Bucci, S., Sellitto P., Isaksen, L., Tencé, F., Bekki, S., Bourassa, A., Rieger, L., Zawada, D., Jumelet, J., and Godin-Beekmann, S.: The 2019/20 Australian wildfires generated a persistent smoke-charged vortex rising up to 35 km altitude, Communications Earth & Environment, 1, 22, https://doi.org/10.1038/s43247-020-00022-5, 2020.
Kloss, C., Sellitto, P., von Hobe, M., Berthet, G., Smale, D., Krysztofiak, G., Xue, C., Qiu, C., Jégou, F., Ouerghemmi, I., and Legras, B.: Australian Fires 2019–2020: Tropospheric and Stratospheric Pollution Throughout the Whole Fire Season, Front. Environ. Sci., 9, 652024, https://doi.org/10.3389/fenvs.2021.652024, 2021.
Konda, M., Imasato, N., Nishi, K., and Toda, T.: Measurement of the sea surface emissivity, J. Oceanogr., 50, 17–30, https://doi.org/10.1007/BF02233853, 1994.
Kremser, S., Thomason, L. W., von Hobe, M., Hermann, M., Deshler, T., Timmreck, C., Toohey, M., Stenke, A., Schwarz, J. P., Weigel, R., Fueglistaler, S., Prata, F. J., Vernier, J.-P., Schlager, H., Barnes, J. E., Antuña-Marrero, J.-C., Fairlie, D., Palm, M., Mahieu, E., Notholt, J., Rex, M., Bingen, C., Vanhellemont, F., Bourassa, A., Plane, J. M. C., Klocke, D., Carn, S. A., Clarisse, L., Trickl, T., Neely, R., James, A. D., Rieger, L., Wilson, J. C., and Meland, B.: Stratospheric aerosol–Observations, processes, and impact on climate, Rev. Geophys., 54, 278–335, https://doi.org/10.1002/2015RG000511, 2016.
Lestrelin, H., Legras, B., Podglajen, A., and Salihoglu, M.: Smoke-charged vortices in the stratosphere generated by wildfires and their behaviour in both hemispheres: comparing Australia 2020 to Canada 2017, Atmos. Chem. Phys., 21, 7113–7134, https://doi.org/10.5194/acp-21-7113-2021, 2021.
Liou, K. N.: An Introduction to Atmospheric Radiation, 2nd edn., Academic Press, ISBN: 9780124514515, 2002.
NASA Earthdata portal: https://search.earthdata.nasa.gov/search/granules?p=C1898401389-GES_DISC&pg[0][v]=f&pg[0][gsk]=-start_date&q=omps&tl=1657880000!3!!, last access: 15 July 2022.
NASA/LARC/SD/ASDC: CALIPSO Lidar Level 1B Profile, Validated Stage 1 V3-41, NASA Langley Atmospheric Science Data Center DAAC [data set], https://doi.org/10.5067/CALIOP/CALIPSO/CAL_LID_L1-VALSTAGE1-V3-41, 2016.
Omar, A., Liu, Z., Vaughan, M., Thornhill, K., Kittaka, C., Ismail, S., Hu, Y., Chen, G., Powell, K., Winker, D., Trepte, C., Winstead, E., and Anderson, B.: Extinction-to-backscatter ratios of Saharan dust layers derived from in situ measurements and CALIPSO overflights during NAMMA, J. Geophys. Res., 115, D24217, https://doi.org/10.1029/2010JD014223, 2010.
Papagiannopoulos, N., Mona, L., Amodeo, A., D'Amico, G., Gumà Claramunt, P., Pappalardo, G., Alados-Arboledas, L., Guerrero-Rascado, J. L., Amiridis, V., Kokkalis, P., Apituley, A., Baars, H., Schwarz, A., Wandinger, U., Binietoglou, I., Nicolae, D., Bortoli, D., Comerón, A., Rodríguez-Gómez, A., Sicard, M., Papayannis, A., and Wiegner, M.: An automatic observation-based aerosol typing method for EARLINET, Atmos. Chem. Phys., 18, 15879–15901, https://doi.org/10.5194/acp-18-15879-2018, 2018.
Platt, C. M. R.: Lidar and Radiometric Observations of Cirrus Clouds, J. Atmos. Sci., 30, 1191–1204, https://doi.org/10.1175/1520-0469(1973)030<1191:LAROOC>2.0.CO;2, 1973.
Podglajen, A., Legras, B., Lapeyre, G., Plougonven, R., Zeitlin, V., Brémaud, V., and Sellitto, P.: Dynamics of diabatically-forced anticyclonic plumes in the stratosphere, ESS Open Archive [preprint], https://doi.org/10.22541/essoar.169603596.62706666/v1, 2023.
Prata, A. T., Young, S. A., Siems, S. T., and Manton, M. J.: Lidar ratios of stratospheric volcanic ash and sulfate aerosols retrieved from CALIOP measurements, Atmos. Chem. Phys., 17, 8599–8618, https://doi.org/10.5194/acp-17-8599-2017, 2017.
Sellitto, P., Belhadji, R., Kloss, C., and Legras, B.: Radiative impacts of the Australian bushfires 2019–2020 – Part 1: Large-scale radiative forcing, Atmos. Chem. Phys., 22, 9299–9311, https://doi.org/10.5194/acp-22-9299-2022, 2022.
Sicard, M., Granados-Muñoz, M. J., Alados-Arboledas, L., Barragán, R., Bedoya-Velásquez, A. E., Benavent-Oltra, J. A., Bortoli, D., Comerón, A., Córdoba-Jabonero, C., Costa, M. J., del Águila, A., Fernández, A. J., Guerrero-Rascado, J. L., Jorba, O., Molero, F., Muñoz-Porcar, C., Ortiz-Amezcua, P., Papagiannopoulos, N., Potes, M., Pujadas, M., Rocadenbosch, F., Rodríguez-Gómez, A., Román, R., Salgado, R., Salgueiro, V., Sola, Y., and Yela, M.: Ground/space, passive/active remote sensing observations coupled with particle dispersion modelling to understand the inter-continental transport of wildfire smoke plumes, Remote Sens Environ., 232, 111294, https://doi.org/10.1016/j.rse.2019.111294, 2019.
Solomon, S., Dube, K., Stone, K., Yu, P., Kinnison, D., Toon, O. B., Strahan, S. E., Rosenlof, K. H., Portmann, R., Davis, S., Randel, W., Bernath, P., Boone, C., Bardeen, C. G., Bourassa, A., Zawada, D., and Degenstein, D.: On the stratospheric chemistry of midlatitude wildfire smoke, P. Natl. Acad. Sci. USA, 119, e2117325119, https://doi.org/10.1073/pnas.2117325119, 2022.
Sutherland, R. A. and Khanna, R. K.: Optical Properties of Organic-based Aerosols Produced by Burning Vegetation, Aerosol Sci. Tech., 14, 331–342, https://doi.org/10.1080/02786829108959495, 1991
Taha, G.: OMPS-NPP L2 LP Aerosol Extinction Vertical Profile swath daily 3slit V2, Goddard Earth Sciences Data and Information Services Center (GES DISC) [data set], Greenbelt, MD, USA, https://doi.org/10.5067/CX2B9NW6FI27, 2020.
Young, S. A.: Analysis of lidar backscatter profiles in optically thin clouds, Appl. Optics, 34, 7019–7031, 1995.
Young, S. A. and Vaughan, M. A.: The Retrieval of Profiles of Particulate Extinction from Cloud-Aerosol Lidar Infrared Pathfinder Satellite Observations (CALIPSO) Data: Algorithm Description, J. Atmos. Ocean. Tech., 26, 1105–1119, https://doi.org/10.1175/2008JTECHA1221.1, 2009.
Yu, P., Davis, S. M., Toon, O. B., Portmann, R. W., Bardeen, C. G., Barnes, J. E., Telg, H., Maloney, C., and Rosenlof, K. H.: Persistent stratospheric warming due to 2019–2020 Australian wildfire smoke, Geophys. Res. Lett., 48, e2021GL092609, https://doi.org/10.1029/2021GL092609, 2021.
Wu, D., Niu, X., Chen, Z., Chen, Y., Xing, Y., Cao, X., Liu, J., Wang, X., and Pu., W.: Causes and effects of the long-range dispersion of carbonaceous aerosols from the 2019–2020 Australian wildfires, Geophys. Res. Lett., 49, e2022GL099840, https://doi.org/10.1029/2022GL099840, 2022.