the Creative Commons Attribution 4.0 License.
the Creative Commons Attribution 4.0 License.
 | 19 Dec 2023
Impact of the Guinea coast upwelling on atmospheric dynamics, precipitation and pollutant transport over southern West Africa
Gaëlle de Coëtlogon
Adrien Deroubaix
Cyrille Flamant
Laurent Menut
Marco Gaetani
In West Africa, the zonal band of precipitation is generally located around the southern coast in June before migrating northward towards the Sahel in late June/early July. This gives way to a relative dry season for coastal regions from Côte d'Ivoire to Benin called “little dry season”, which lasts until September–October. Previous studies have noted that the coastal rainfall cessation in early July seems to coincide with the emergence of an upwelling along the Guinea coast. The aim of this study is to investigate the mechanisms by which this upwelling impacts precipitation, using a set of numerical simulations performed with the Weather Research and Forecasting regional atmospheric model (WRF v 3.7.1). Sensitivity experiments highlight the response of the atmospheric circulation to an intensification or reduction of the strength of the coastal upwelling. They clearly show that the coastal upwelling emergence is responsible for the cessation of coastal precipitation by weakening the northward humidity transport, thus decreasing the coastal convergence of the humidity transport and inhibiting the deep atmospheric convection. In addition, the diurnal cycle of the low-level circulation plays a critical role: the land breeze controls the seaward convergence of diurnal anomaly of humidity transport, explaining the late night–early morning peak observed in coastal precipitation. The emergence of the coastal upwelling strongly attenuates this peak because of a reduced land–sea temperature gradient in the night and a weaker land breeze. The impact on the inland transport of anthropogenic pollution is also shown with numerical simulations of aerosols using the CHIMERE chemistry-transport model: warmer (colder) sea surface temperature (SST) increases (decreases) the inland transport of pollutants, especially during the night, suggesting an influence of the upwelling intensity on the coastal low-level jet. The mechanisms described have important consequences for inland humidity transport and the predictability of the West African monsoon precipitation in summer.
- Article
(3615 KB) - Full-text XML
- BibTeX
- EndNote


Precipitation in West Africa is mostly controlled by a monsoon driven by a very strong meridional temperature and humidity contrasts between the eastern tropical Atlantic and the dry continent further north (Parker et al., 2017). In response to the annual cycle of the insolation, precipitation exhibits a strong seasonal latitudinal cycle (Hagos and Cook, 2007; Thorncroft et al., 2011; Maranan et al., 2018). The location and intensity of Sahel precipitation in boreal summer are mainly controlled by the zonal tropical overturning circulation and the mid-tropospheric African easterly jet (AEJ) and high-tropospheric tropical easterly jet (TEJ), which are maintained by two diabatically forced meridional circulations, one associated with deep moist convection and a second from dry convection to the north over the Sahara (Haywood et al., 2016). In addition, aerosols play an important role, as the absorption of sunlight by dust affects not only surface temperature but also surface wind speed, vegetation and humidity transport, leading to complex interactions (Miller et al., 2014). Balkanski et al. (2021) also highlighted the potential for a stabilizing feedback loop involving dust emission, atmospheric absorption and Sahel precipitation in climate models.
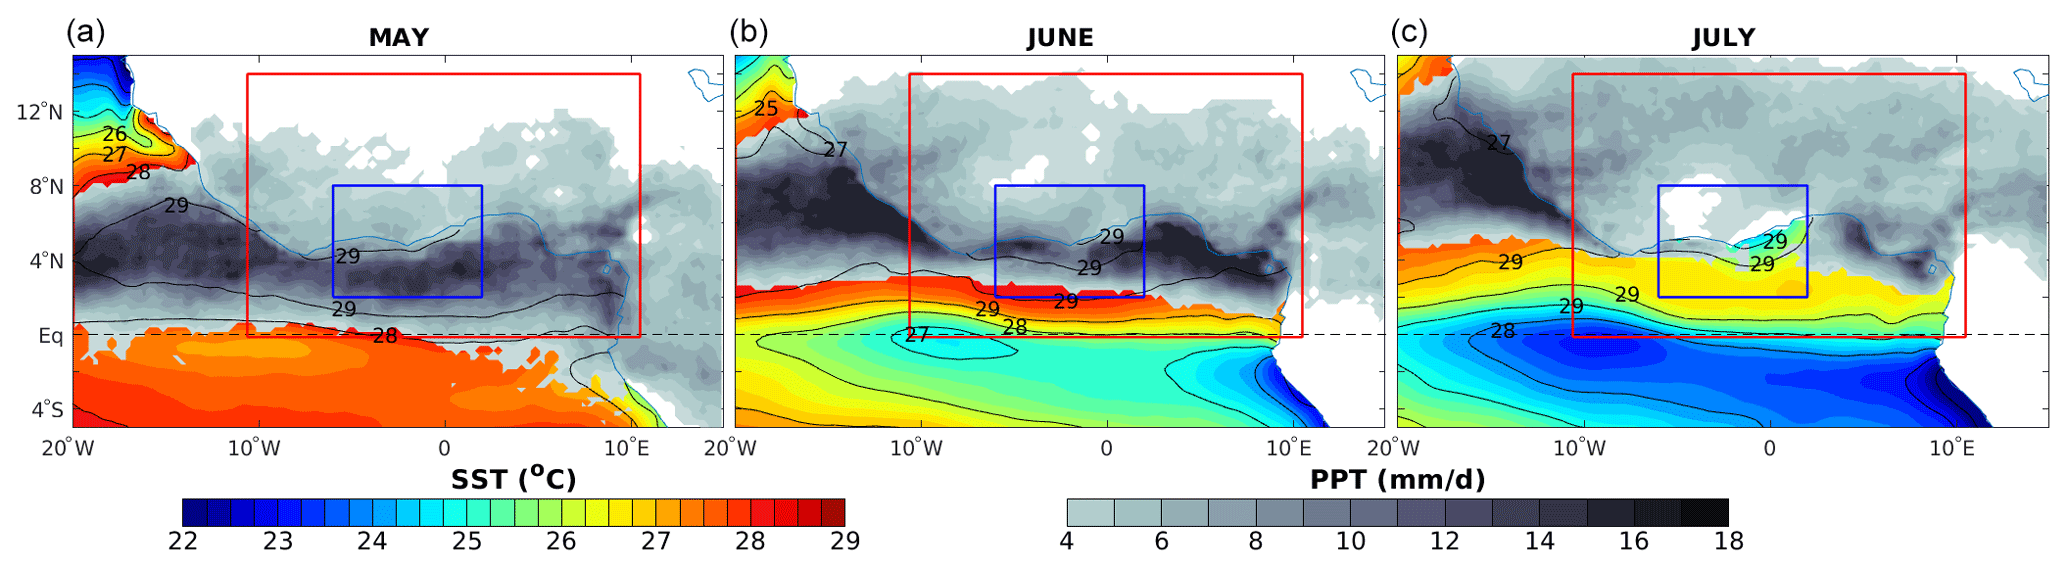
Figure 1Observations from May (a), June (b) and July (c) 2008–2017: sea surface temperature (SST; black contours with 1 ∘C intervals and red–green–blue shading) and Tropical Rainfall Measuring Mission (TRMM) precipitation exceeding 4 mm d−1 (grey shading). The red and blue frames show the simulation coverage and the subregion under scrutiny 2–8∘ N, 6∘ W–2∘ E.
Between late April and early July, the precipitation maximum is located just south of the Guinea coast (i.e. the southern coast of West Africa, located along about 5∘ N) (Fig. 1, left and middle). It shifts northward in late June/early July until September, bringing precipitation to the Sahel region and leaving the Guinea coast relatively dry, during the so-called “little dry season” (Fig. 1, right). The Guinea coast experiences a second rainfall peak in October–November when the monsoon recedes (not shown), as precipitation is mainly localized over the ocean during the rest of the year (Sultan and Janicot, 2003; Zhang and Cook, 2014). Along the coastline, the major rainy season around June is called “Guinea coast rainfall” (or GCR; Nguyen et al., 2011). Its onset is controlled by the emergence of the eastern Atlantic equatorial upwelling (also called “cold tongue”) in late May (Leduc-Leballeur et al., 2013; Meynadier et al., 2016). Its cessation in July generally coincides with the development of coastal upwelling along the Guinea coast from Côte d'Ivoire to Benin, where the sea surface temperature (SST) decreases from about 30 ∘C in May to 24–25 ∘C in August (Odekunle and Eludoyin, 2008; Ali et al., 2011; Kouadio et al., 2013). Note that the dynamics of coastal upwelling remain poorly understood, but it is likely forced by local or remote surface winds, as demonstrated, for instance, in Djakouré et al. (2017). They conducted idealized numerical experiments and found that while the coastal upwelling west of Cape Three Points is highly sensitive to inertia and Guinea Current detachment from the coast, the upwelling east of Cape Three Points is mainly induced by local winds through the divergence of Ekman transport. This is further supported by the modelling study of Da-Allada et al. (2021), which found that, west of Cape Three Points, a SST cold event in February–June 2012 was largely explained by enhanced vertical mixing caused by the strengthened Guinea Current, whereas east of Cape Three Points, a major contributor to the SST change was the zonal wind. The SST in the Guinea coast upwelling is thus significantly influenced by the Guinea Current and surface winds. The question being studied here is whether it can, in turn, influence atmospheric circulation and precipitation. Indeed, at interannual timescales, Ali et al. (2011) found strong correlations between the GCR variability and both equatorial and coastal upwellings, and Bakun (1978) observed an important rainfall reduction along the coast where the coastal upwelling is the strongest (Fig. 1, right). Other studies suggested an influence of the Guinea coast upwelling on nearby continental precipitation (Gu and Adler, 2004; Kouadio et al., 2013; Nnamchi and Li, 2011; Aman et al., 2018). Nevertheless, Tanguy et al. (2022) were the first to propose a mechanism explaining the coastal upwelling impact on GCR. Using satellite observations (of convective clouds mainly) and ERA5 reanalyses between 2008 and 2015, they suggested that the emergence of the Guinea coast upwelling weakens the low-level southerlies just before they meet the mainland, which, in turn, decreases coastal convergence and thus inhibits deep convection and precipitation. However, their results were based on composite analyses derived from an empirically determined date of the apparition of the coastal upwelling. Therefore, numerical simulations forced by coastal upwellings of varying intensities are necessary to assess the mechanisms involved unambiguously.
The Dynamics Aerosol Cloud Chemistry Interactions in West Africa (DACCIWA; Knippertz et al., 2015, 2017) project offers a database to analyse coastal upwelling, through observations and modelling. Numerical simulations of meteorology and atmospheric composition were carried out with the WRF-CHIMERE modelling system for the period 1 June–8 July 2016 (Deroubaix et al., 2019; Menut et al., 2019). In the present work, the role played by the coastal upwelling in the transition between GCR in June and the beginning of the little dry season in early July is investigated with similar numerical simulations. We seek to quantify the impact of the coastal upwelling on regional atmospheric conditions and anthropogenic pollution transport. We also want to estimate how far inland this influence is propagated by the monsoon transports of humidity and pollutants from the coastal areas northward. Two ensemble of sensitivity simulations, forced either by a weaker upwelling (resulting in warmer coastal SST) or a more intense one (resulting in colder coastal SST), are therefore tested and compared to an ensemble of reference simulations, and the impact of SST anomalies on surface winds, surface wind divergence, precipitation, humidity transport and pollutant transport is analysed. The production of the reference ensemble simulation is discussed in Sect. 2. The design of the weaker or stronger upwelling ensemble simulation is described in Sect. 3. The response of atmospheric dynamics and precipitation to changes in coastal SST is examined in Sect. 4. The impact of coastal SST on the transport of anthropogenic pollution is studied in Sect. 5. A summary and a discussion conclude this work in Sect. 6.
The modelling system couples the Weather Research and Forecasting (WRF) meteorological model (v 3.7.1) (Powers et al., 2017) and the CHIMERE chemistry-transport model (v 2017) (Mailler et al., 2017). We use a regional domain (10 km × 10 km) extending from 1∘ S to 14∘ N and from 11∘ W to 11∘ E (Fig. 2), with 32 vertical levels (up to 50 hPa) which are projected on 20 levels for CHIMERE (up to 300 hPa) without chemistry but with passive tracers, as has been done in Deroubaix et al. (2019) from which we use the same simulation set-up. Meteorological initial and boundary conditions are obtained from operational analyses generated by the US National Center for Environmental Prediction (referred to as operational analyses; for a comprehensive description, please consult Deroubaix et al., 2019).
The main simulation was conducted with this configuration from 1 June to 8 July 2016, when the surface ocean temperature drops the fastest in the coastal upwelling region (from about 28 to 25 ∘C). The National Oceanic and Atmospheric Administration National Centers for Environmental Prediction (NOAA NCEP) real-time global SST (Thiébaux et al., 2003) is used to force the SST in the WRF-CHIMERE simulations.
In order to identify significant changes in coastal atmospheric dynamics resulting from a SST modification in the sensitivity experiments described in the next sections, nine additional simulations were produced, each slightly modifying the SST forcing fields: in the second simulation, the SST on 1 June at 00:00 UTC was replaced by the SST of 06:00 UTC; in the third run, the SST at 06:00 UTC was replaced by the SST of 12:00 UTC; and the pattern continues in this way. These minor modifications do not modify the SST field that forces the reference simulations before 3 June significantly, but they are relevant in order to produce an ensemble of 10 independent simulations. Since they are all forced by a similar SST field after 3 June, their spread can be considered an indication of the physical and numerical variability of the model.
In the following, we present the average of the 10 simulations computed over their last 2 weeks (i.e. 25 June–8 July 2016), considering the previous period as time for the model to spin up before the coastal SST becomes and remains colder than 27 ∘C. It will be referred to as the “reference ensemble simulation” or RefES hereafter. RefES is then presented for spatial and vertical averages of key meteorological variables over the studied period in the coastal upwelling region. It is also the RefES that will be used with the CHIMERE model to analyse the impact of the transport on aerosol concentrations.
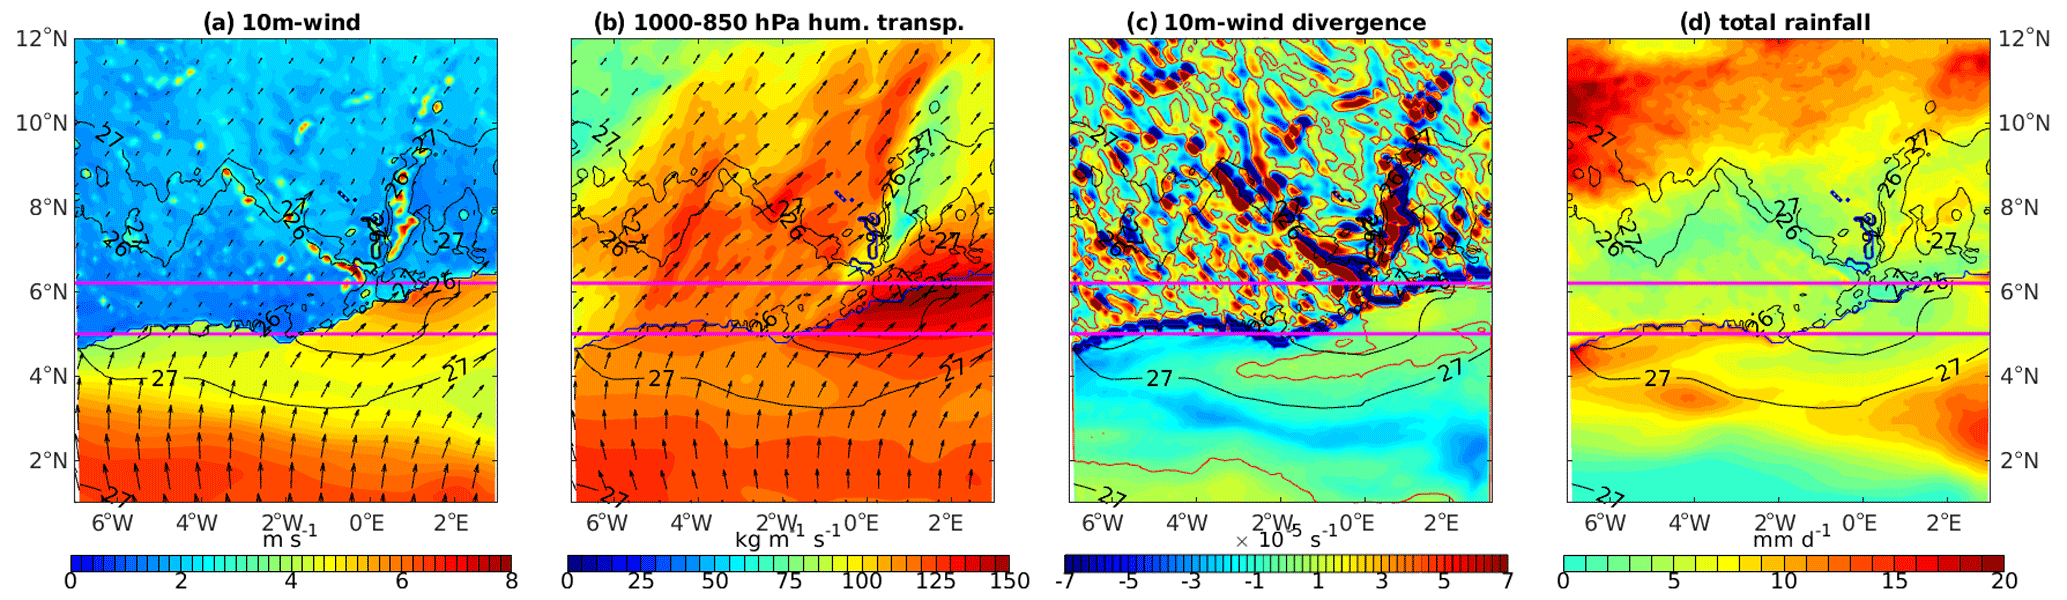
Figure 3For 25 June to 8 July 2016, reference ensemble simulation (RefES). (a) The 10 m wind speed (shading) and direction (arrows). (b) Magnitude (shading) and direction (arrows) of humidity transport integrated between 1000 and 850 hPa. (c) The 10 m wind divergence (shading, zero in red contour). (d) Precipitation (shading, mm h−1). The black contours represent the isotherms of 26 and 27 ∘C. Horizontal pink lines indicate the latitudinal extent of the coastline in the simulation domain.
Figure 3 shows skin temperature (hereafter SKT), 10 m wind speed, 10 m wind divergence, total precipitation and humidity transport integrated between 1000 and 850 hPa (i.e. within the monsoon flow; see below). Near-surface southerlies strongly weaken when encountering the continent (Fig. 3a) because surface roughness and heat fluxes are much larger over land than over sea. As a result, strong convergence is found at 10 m all along the coastline (Fig. 3c). Over the continent, the divergence pattern is dominated by dipoles of 10 m divergence/convergence associated with the topographic features in the Lake Volta region, namely the Mampong range (south of 8∘ N, ranging from 2∘ W to 0∘ E) and the Akwapim–Togo range around 1∘ E (ranging from 6 to 11∘ N).
A weaker belt of surface wind convergence (of about −2 or −3 × 10⁻⁵ s−1) is also found over the ocean, around 2–3∘ N in the east and just south of the 27 ∘C SST contour further west, resulting from a slowing down of southerlies over SST colder than 27 ∘C that surrounds the coastal upwelling (Fig. 3a, c). Indeed, surface wind speed tends to decrease when blowing over colder SST: a first mechanism to explain this is a reduction in the vertical flux of horizontal momentum, due to an increase in vertical stability above the sea surface, preventing the surface wind from mixing with the – generally stronger – upper-boundary-layer wind (Sweet et al., 1981; Wallace et al., 1989; Hayes et al., 1989). The second mechanism is an adjustment of the pressure gradient to the SST gradient via hydrostatic balance (Lindzen and Nigam, 1987). In addition, east of 2∘ W, the wind intensifies and shifts to an easterly direction along the Togo–Benin coastline. This shift is likely influenced by a positive SST gradient downwind in the northeastward direction, a meridional surface temperature gradient between land and sea, or the coastal topography (Flamant et al., 2018).
Over the ocean, the strong link between precipitation and surface wind convergence is well known: between 65 % and 90 % of global precipitation is associated with low-level lines of convergence (Weller et al., 2017). Hence, a precipitation maximum of up to 0.5 mm h−1 fits the convergence belt just south of the 27 ∘C isotherm, whereas a minimum of 0.2 mm h−1 is collocated with the weakly divergent surface winds near the coast, east of 1∘ W (Fig. 3c–d). Indeed, since the marine atmospheric boundary layer is nearly saturated in humidity, surface wind convergence often corresponds to convergence of humidity transport, which favours convection and precipitation (Meynadier et al., 2016).
Over the continent, despite much weaker surface winds, humidity transport in the monsoon flow is at least as strong as over the ocean except east of Lake Volta (Fig. 3b) because the water vapour content in the lower atmosphere is higher over the land than the ocean, as can be seen in Fig. 4b. This results in a divergence of humidity transport over the continent near the coast (not shown), which may explain the lower precipitation rates seen between the coast and 10∘ N (Fig. 3d).
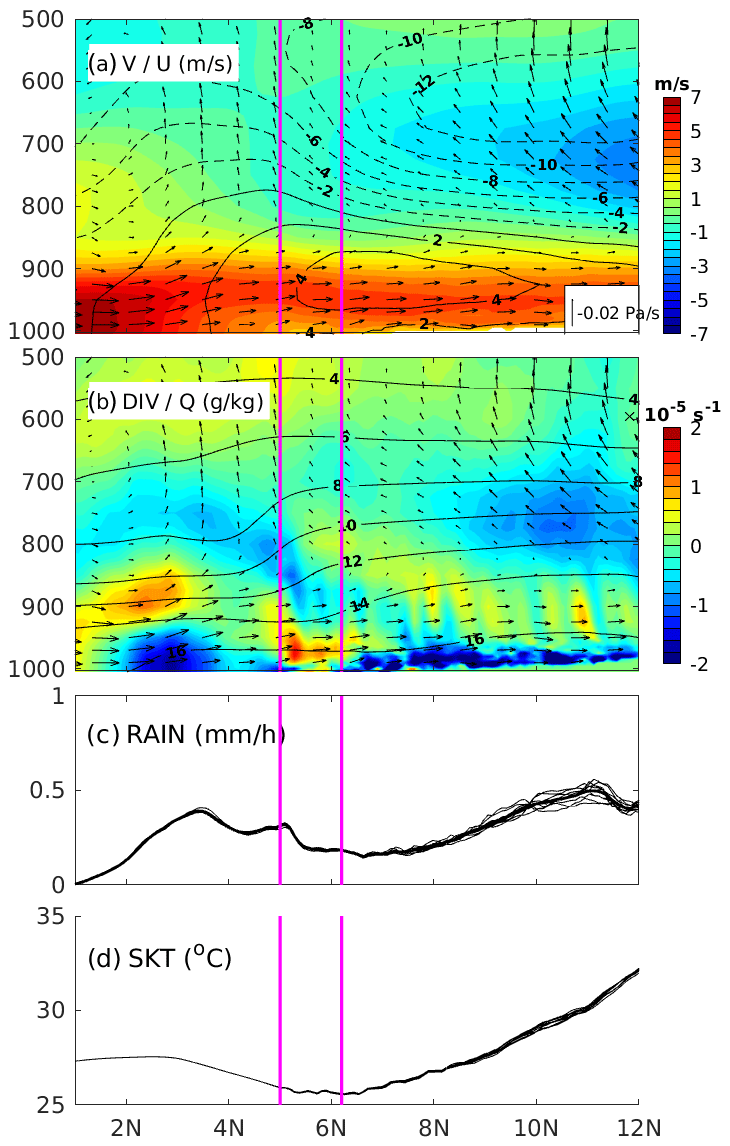
Figure 4For 25 June to 8 July 2016, RefES, within the region 6∘ W–2∘ E: (a) meridional and vertical velocity (arrows), meridional velocity (shading), and zonal velocity (black contours, plain for positive, dashed for negative, intervals of 1 m s−1, null velocity in bold black); (b) meridional and vertical velocity (arrows), horizontal divergence (shading), and specific humidity (black contours, g kg−1); (c) precipitation; and (d) surface temperature profiles (black profiles, average in thick line). The vertical pink lines frame the coastline between 6∘ W and 2∘ E. Vertical scale for arrows indicated in (a).
Figure 4 shows the vertical section of the atmosphere up to 500 hPa averaged between 6∘ W and 2∘ E, where the coastline is located between roughly 5 and 6.2∘ N, as framed in pink lines (horizontal lines in Fig. 3, vertical lines in Fig. 4). SKT and precipitation latitudinal profiles averaged between 6∘ W and 2∘ E are also plotted for comparison (Fig. 4c, d). Two important features of the West African monsoon are clearly seen in the zonal velocity: the near-surface West African westerly jet (Pu and Cook, 2010) between 5 and 10∘ N and the African easterly jet (AEJ) around 650 hPa north of 8∘ N (Fig. 4a). It also shows that the largest southerly winds are confined under 850–900 hPa and that they lie below a widespread convective circulation over the ocean evidenced by ascending motion (Fig. 4a).
Near the ocean surface, two zones of convergence (i.e. negative divergence) are found (Fig. 4b): one occurring as a response to the negative SKT gradient on the edge of the coastal upwelling between 2 and 3∘ N (already mentioned; see Fig. 3c) and one associated with the coastal convergence at 5∘ N. These two convergence areas correspond to peaks in precipitation (Fig. 4d). Divergence is observed above each convergence area over the ocean, capped with a third layer of convergence, at the top or just above the monsoon flow, probably in response to local mass conservation. This “sandwich” is confined to under 800 hPa in the coastal region and extends up to 700 hPa over the ocean (Fig. 4b).
The SKT latitudinal profile exhibits a minimum down to 26 ∘C at the coast and a SST increase of 3–4 ∘C due to the coastal upwelling within 100–200 km southward from the coast to about 3∘ N (Fig. 4d). Unlike oceanic SKT, which is very close to the forcing SST and therefore identical in the 10 reference simulations between 25 June and 8 July, the continental SKT is controlled by the surface layer scheme in the model, which leads to some variance in the different runs that constitute RefES (black profiles). While SKT latitudinal profiles are weakly dispersed (Fig. 4d), the dispersion of precipitation is important north of 7∘ N (Fig. 4c): the monsoon flow is indeed capped by a strong wind shear related to the presence of the AEJ at these latitudes, which is known to favour baroclinic instability and storm formation (Parker et al., 2017). Baroclinic instability enhances the sensitivity of the model to turbulence and hence the dispersion between the simulations at these latitudes.
In summary, RefES reproduces the transition period of the monsoon system from the GCR to the Sahel rainy season well: precipitation is still present over the ocean, and the coastal upwelling is already well developed, contributing to triggering and maintaining the belt of converging near-surface winds surrounding the 27 ∘C surface isotherm between 2 and 4∘ N (Figs. 3c, 4b) and precipitation (Figs. 3d, 4c). This configuration is therefore appropriate for conducting sensitivity experiments with different upwelling intensities and investigating the response of the atmospheric circulation to these changes.
In order to build the SST forcing fields for the sensitivity experiments, the SST pattern which forces RefES (i.e. the reference SST) is modified in a way that the coastal upwelling is either dampened (weaker upwelling meaning warmer coastal SST, hereafter “warm ensemble simulation” or WarmES) or amplified (stronger upwelling meaning colder coastal SST, hereafter “cold ensemble simulation” or ColdES).
The methodology used to modify the SST is as follows:
- i.
A linear trend is first computed by a least-squares fit between 5 June and 31 July 2016 in the reference SST time series at each oceanic grid point: large negative values emphasize the area where the coastal upwelling develops (Fig. 5, top). Note that these trends were computed after 5 June (and until 31 July, when the upwelling is maximum) because the SST experiences a strong warming episode just before, as seen for the two particular points A and B (Fig. 5, bottom, black).
- ii.
A threshold value of −0.052 ∘C d−1 has been deliberately selected to define the boundary of the region in which the SST is to undergo modification (Fig. 5, top, delineated by the black contour). This specific value has been chosen in a purposeful manner, approximately aligning with the 27 ∘C SST contour, which corresponds to the edge of the coastal colder zone (Fig. 3a). The rationale behind this choice lies in its ability to encompass areas where the average SST value remains below 27 ∘C throughout the final 2 weeks of simulation. Beyond this demarcated region, the SST time series remain unaffected.
- iii.
Inside this area where the SST is modified, at each time step and grid point, the difference between the threshold (−0.052 ∘C d−1) and the local linear trend value is added to the SST time series, thereby leading to a warmer SST time series. All time series in the upwelling area thus have a linear trend of −0.052 ∘C d−1.
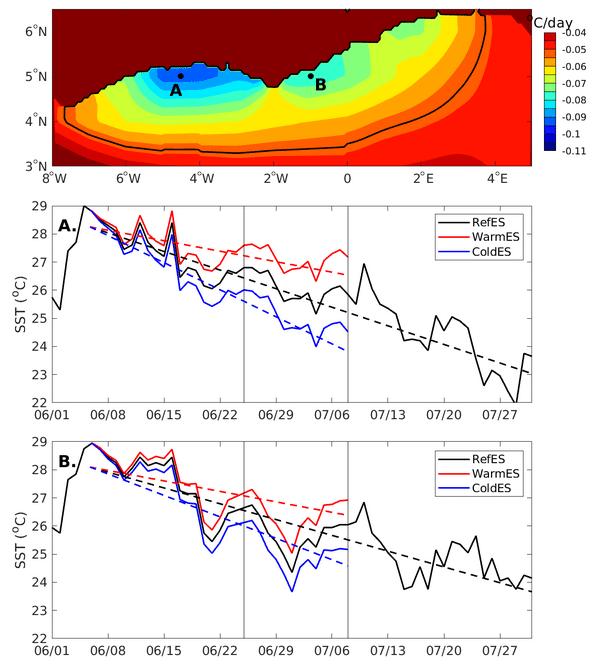
Figure 5Top: linear trend in the RefES SST time series from 5 June to 31 July 2016 (shading, ∘C d−1, with a threshold value of −0.052 ∘C d−1 shown as black contour). Bottom panels for points A and B: RefSST time series (solid black) and linear trend computed from 5 June onwards (dashed black), WarmES SST time series (red) and linear trend (dashed red), and ColdES SST time series (blue) and linear trend (dashed blue). Vertical black lines frame the period under scrutiny (25 June–8 July).
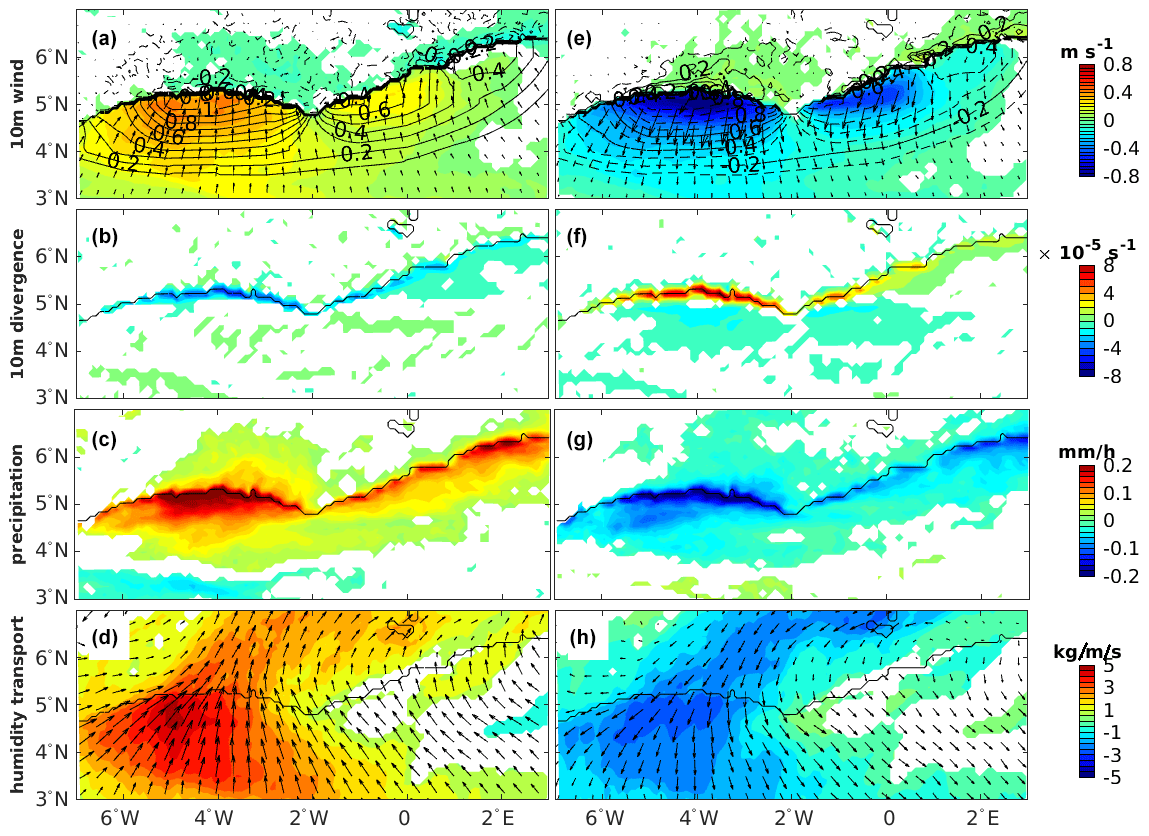
Figure 6For 25 June–8 July 2016, differences between WarmES and RefES simulations (left) and between ColdES and RefES simulations (right). (a, e) The 10 m wind (speed in shading, m s−1) and surface temperature (black contours, intervals of 0.1 ∘C). (b, f) Divergence of 10 m wind (shading, s−1). (c, g) Total precipitation (mm h−1). (d, h) Humidity transport integrated between 1000 and 850 hPa (kg m−1 s−1). Only difference values passing a two-sample t test at the 5 % confidence level are shaded.
For example, the WarmES time series at points A and B show a progressively growing warm anomaly of about 0.5 ∘C on 25 June and 1 ∘C on 7 July, while the synoptic variability is conserved (Fig. 5A and B, red vs. black time series). Note that the warm anomaly is slightly larger at point A than at point B, since the negative seasonal trend is also more pronounced in A than in B. The resulting WarmES SST anomaly, averaged over the last 2 weeks of the simulation, exceeds 1 ∘C off Côte d'Ivoire and is approximately 0.7 ∘C off Ghana (Fig. 6a, black contours). Because the reference SST decreases by about 3∘ between 5 June and 8 July at these locations, it means that the magnitude of the coastal upwelling is dampened by about one-third in WarmES.
ColdES SST was built with similar SST anomalies to WarmES but with the opposite sign (cold anomalies instead of warm): ColdES is then forced by a SST with cold anomalies, thereby simulating a coastal upwelling with a magnitude enhanced by about one-third (Fig. 5A and B, blue). The anomalies averaged over 25 June–8 July in ColdES are then identical to those in WarmES but cold instead of warm (Fig. 6e).
Finally, the same methodology as for RefES was used to produce each of the 10 WarmES or ColdES simulations (i.e. with slight changes in SST in the first 2–3 d of the simulation). All the simulations were then averaged between 25 June and 8 July 2016: for a given variable, the difference between the ensemble values in RefES and the ensemble values in WarmES (resp. ColdES) is considered significant when it passes a two-sample t test at the 5 % confidence level (i.e. with a p value less than 5 %).
The most striking effect of SST anomalies can be observed in the 10 m wind field: surface winds are stronger over warm SST anomalies (Fig. 6a) and weaker over cold SST anomalies (Fig. 6e). As already mentioned before, both vertical stability and pressure gradient mechanisms concur to reduce (strengthen) wind speed over cold (warm) SST regions (de Coëtlogon et al., 2014).
Off Côte d'Ivoire, the maximum wind speed response to positive SST anomalies larger than 1 ∘C is up to +0.4 to 0.5 m s−1 in WarmES, whereas the response to negative SST anomalies of the same amplitude is on the order −0.7 to −0.8 m s−1 in ColdES. This means that the response of surface winds to a SST anomaly is not symmetric for cold or warm anomalies: the weakening of surface winds over the cold surface is more pronounced than the strengthening over the warm surface. It may be explained by the fact that a vertical stabilization effect on the wind over a cooling SST occurs only below a threshold of about 26 ∘C (Meynadier et al., 2016; see in particular their Fig. 8), since the SST is more often colder than 26 ∘C in ColdES than in WarmES in the coastal upwelling (Fig. 5A–B).
In response to these changes in surface wind, the thin band of coastal convergence is amplified, as a consequence of stronger winds, in the warm case (Fig. 6b; negative values indicate increase in convergence) and dampened by weaker winds in the cold case (Fig. 6f; positive values indicate decrease in convergence). As explained in Sect. 2, precipitation tends to follow the convergence pattern in the marine boundary layer; therefore more coastal precipitation is found in WarmES (Fig. 6c) and less in ColdES (Fig. 6g) along the Guinea coast. The amplitude and offshore extension of precipitation anomalies are larger west of Cape Three Points than further east, reflecting the SST anomalies amplitude. In the warm case, maximal precipitation anomalies off Côte d'Ivoire can exceed +0.2 mm h−1 but are less than −0.2 mm h−1 in the cold case: contrary to surface wind, precipitation is more strongly impacted in the warm case than in the cold case. This signal is more robust west of Cape Three Points than further east, off Ghana and Togo, where anomalies are just above the significance threshold.
When the intensity of the upwelling is dampened (WarmES), humidity transport is enhanced from the ocean to the continent by up to 5 kg m−1 s−1, due to a more intense monsoon flow, especially west of Cape Three Points (Fig. 6d). When the upwelling is enhanced (ColdES), the humidity transport anomaly is, conversely, southwestward over and off Côte d'Ivoire and Ghana, indicating a reduced northward humidity transport in the monsoon flow by about 5 kg m−1 s−1 (Fig. 6h). Note that these changes in the humidity transport magnitude are small compared to its mean value (about 100–150 kg m−1 s−1, Fig. 3b), but they are nonetheless significant, except east of Cape Three Points where there are only significant changes in the direction of the transport, which tends to be oriented more north/northwestward in WarmES and more southeastward in ColdES.
The impact of the coastal upwelling is further investigated in the low and middle troposphere up to 500 hPa, with vertical meridional sections computed between 6∘ W and 2∘ E. The mean SKT and precipitation differences WarmES − RefES and ColdES − RefES are plotted (Fig. 7c–d and g–h, thick blue), as well as 10 profiles of difference arbitrarily chosen (among 100 possible time series of WarmES − RefES and ColdES − RefES differences) in order to illustrate the typical dispersion in the numerical simulations (thin black). Despite being modest (with amplitudes of slightly more than 0.5 ∘C, Fig. 7d–h), SKT anomalies in the coastal upwelling region correspond to significant changes in precipitation within 100 km of the coast, with an increase by up to 0.1 mm h−1 in WarmES (Fig. 7c) and a decrease by slightly less than 0.1 mm h−1 in ColdES (Fig. 7g): these changes represent about one-third of the mean rainfall at this latitude (i.e. 0.2–0.3 mm h−1, Fig. 4c), emphasizing how much the coastal precipitation is sensitive to the coastal SST. North of 6–7∘ N, the precipitation anomalies are too small to clearly show a response emerging above the noise. Further analysis in the following therefore only focuses on the link between SKT and precipitation south of 6∘ N.
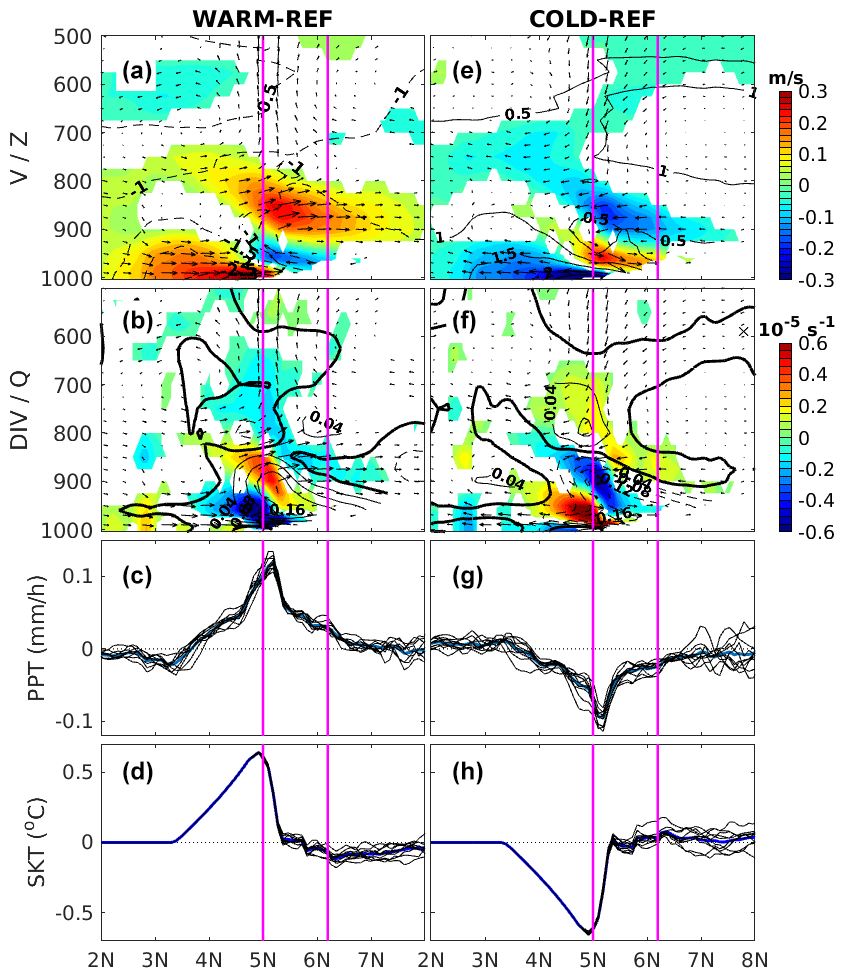
Figure 7For 25 June–8 July 2016, differences between WarmES and RefES (left column) and between ColdES and RefES (right column) within the region 6∘ W–2∘ E. (a, e) Meridional and vertical circulation (black arrows, meridional velocity (shading), and geopotential height anomalies (black contours, dashed for negative, plain for positive, intervals of 0.2 m). (b, f) Meridional and vertical circulation (black arrows), horizontal divergence (shading), and specific humidity (black contours, plain for positive, dashed for negative, intervals of 0.4 g kg−1). (c, g) Precipitation (blue, mm h−1). (d, h) SKT (blue, ∘C). In (c)–(h), 10 time series are shown (black) out of 100 possible time series from WarmES − RefES or ColdES − RefES, roughly indicating their dispersion. The coast latitude is framed by vertical pink lines. Only difference values of meridional velocity and horizontal divergence that pass a two-sample t test at the 5 % confidence level are shown as shaded areas.
In response to the warm SKT anomaly in WarmES, a negative pressure anomaly is found in the near-surface boundary layer between 3 and 5∘ N (Fig. 7a, black contours). The induced wind acceleration (Fig. 7a, shading) clearly leads to an increase in convergence below 900 hPa on the southern edge of the coast (Fig. 7b, shading), explaining an increase in low-level humidity (Fig. 7b, black contours) and coastal precipitation (Fig. 7c). Convergence at the surface is capped by divergence between 900 and 825 hPa and a convergent area located slightly further north and up to 700 hPa, indicating an overall acceleration of southwesterlies below 800 hPa and observed as far north as 8∘ N (Fig. 7b). In ColdES, opposite anomalies are found: the cold SKT anomaly creates a positive near-surface pressure gradient anomaly, forcing southward surface wind anomalies (Fig. 7e). The resulting divergent anomaly (Fig. 7f) decreases humidity under 850 hPa and inhibits the convection around 5∘ N, explaining the decreased coastal rainfall (Fig. 7g).
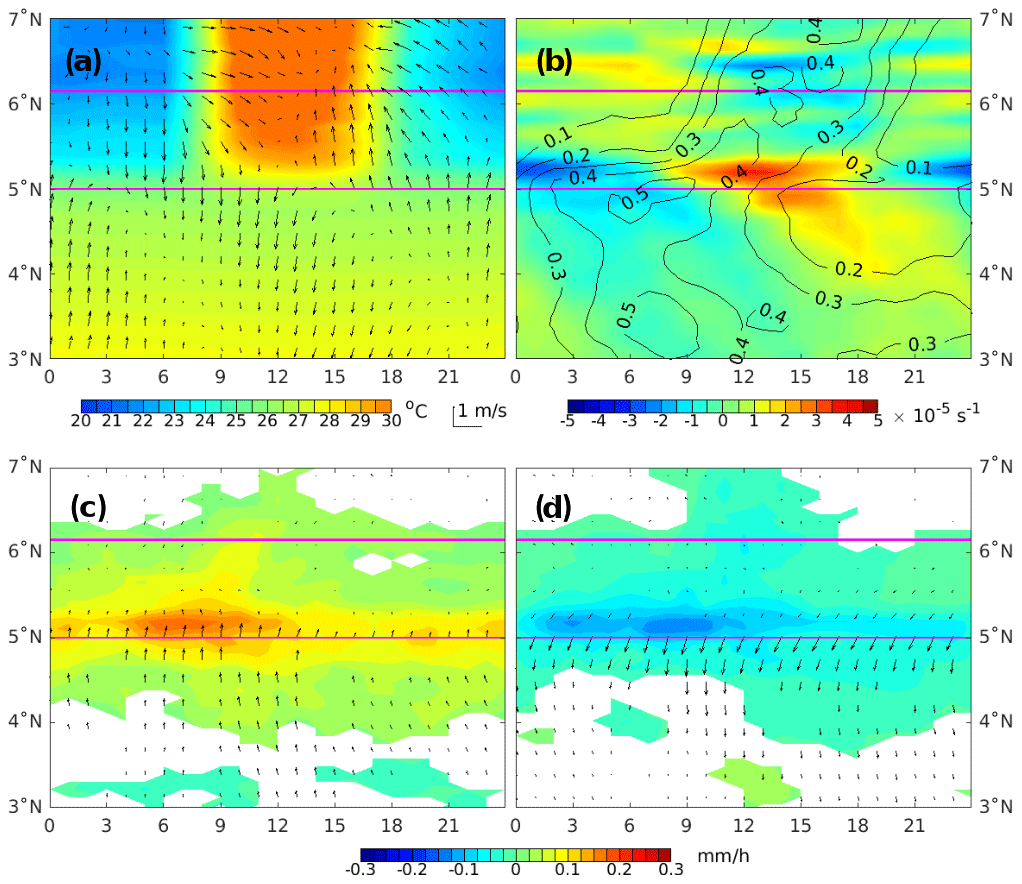
Figure 8For 25 June–8 July 2016, a time–latitude diagram (diurnal cycle) within the region 6∘ W–2∘ E. In RefES, (a) the diurnal cycle of SKT (shading) and diurnal anomalies of 10 m wind (arrows), (b) diurnal anomalies of 10 m wind divergence (shading) and the diurnal cycle of precipitation (black contours, intervals of 0.1 mm h−1). Differences between WarmES (c) or ColdES (d) and RefES of diurnal cycles of precipitation (shading) and 10 m surface wind (arrows). Only precipitation and velocity anomalies passing a two-sample t test at the 5 % confidence level are plotted. The horizontal scale of the vectors represents a velocity, despite being aligned in the direction of time.
In short, the emergence of the Guinea coast upwelling in early July clearly induces a low-level atmospheric pressure gradient anomaly, which weakens the near-coastal oceanic southerlies. It strongly dampens the coastal convergence within the monsoon flow, thereby inhibiting coastal convection and decreasing local precipitation, as well as inland humidity transport, particularly over Côte d'Ivoire and Ghana west of Cape Three Points. This mechanism was already proposed by Tanguy et al. (2022) using observations and ERA5 reanalyses, but they also suggested an impact of coastal upwelling on the diurnal timescale via the land–sea breeze mechanism, which is also found in RefES: in the night and early morning, when the land (around 22 ∘C, Fig. 8a) is colder than the sea (around 27 ∘C), a southward pressure gradient force weakens the strong southerlies that meet the continent, resulting in a low-level convergence (and thus increased precipitation) along and just south of the coast (Fig. 8b), with divergence further north. During the afternoon and evening, when the land (up to 30 ∘C) is warmer than the ocean (still around 27 ∘C), this anomaly reverses: convergence occurs on the land side and favours precipitation over the continent, while the latter is inhibited on the sea side via a low-level divergence (Fig. 8b). Note that the wind is always from the south because the amplitude of the diurnal anomalies (of about 0.5 m s−1, Fig. 8a) is only about 10 % of the average wind (4 to 6 m s−1, Fig. 3a); however, these anomalies are directed southward, with precipitation occurring over the ocean during the night and early morning, and turn progressively northward until the end of the day, with precipitation over the continent in the late afternoon. In addition to dampening low-level coastal convergence at the seasonal timescale, a more intense coastal upwelling therefore has a stronger impact during the night, since it reduces the land–sea surface temperature gradient during the night and early morning: the land breeze strength decreases, as well as low-level convergence and precipitation on the oceanic side of the coast (Fig. 8d). Reducing the coastal upwelling strength leads to the exact opposite situation (Fig. 8c).
In summary, the emergence of the coastal upwelling leads to a decrease in coastal precipitation. We quantified this impact using numerical experiments: for a coastal precipitation of 0.3–0.4 mm h−1 on average in late June/early July (Fig. 4c), a dampened (increased) coastal upwelling of about 0.5 ∘C (Fig. 7d, h) results in an increase (decrease) in coastal precipitation of about 0.1 mm h−1 (Fig. 7c, g). In addition, an examination of the diurnal cycle shows that most of the coastal precipitation occurs in the late night–early morning, with a peak of 0.5 mm h−1 around 06:00 UTC (Fig. 8b), due to the land breeze, as discussed previously: the dampening (increase) of the upwelling leads to an increase (decrease) in morning precipitation of 0.1–0.2 mm h−1 (Fig. 8c, d), following the reduction in the land–sea temperature gradient during the night, thus accounting for much of the observed 0.1 mm h−1 reduction in daily mean precipitation.
In previous sections, we have analysed the changes of atmospheric circulation due to a modification of the upwelling-related SSTs. Sensitive experiments show that wind fields are modified, thus impacting convection and precipitation patterns. Consequently, we expect that the transport of pollutants emitted from the highly urbanized Guinea coast is also impacted by coastal upwelling SST-related modifications.
To look at the impact of coastal SST anomalies on the transport of pollutants, we use passive tracers released in the CHIMERE model from five major coastal cities, namely Abidjan (5∘18′ N, 4∘00′ W; Côte d'Ivoire), Accra (5∘ 33’N, 0∘ 11’W; Ghana), Lomé (6∘08′ N, 1∘12′ E; Togo), Cotonou (6∘21′ N, 2∘25′ E; Benin) and Lagos (6∘27′ N, 3∘23′ E; Nigeria), with constant tracers' emission rates proportional to the city population. This approach allows us to analyse pollutant transport modification that are only due to atmospheric circulation because tracer emission is prescribed to be constant in time (see Deroubaix et al., 2019, for details). It also allows us to tag the emissions from a given city and compute its contribution to the overall tracer budget on each of the model grid points. We quantify the contribution at one of the DACCIWA super-sites in Savè (Benin). The pollutant simulations are performed for the three main ensembles, RefES, ColdES and WarmES, in order to extract the differences between the SST-induced atmospheric conditions as clearly as possible.
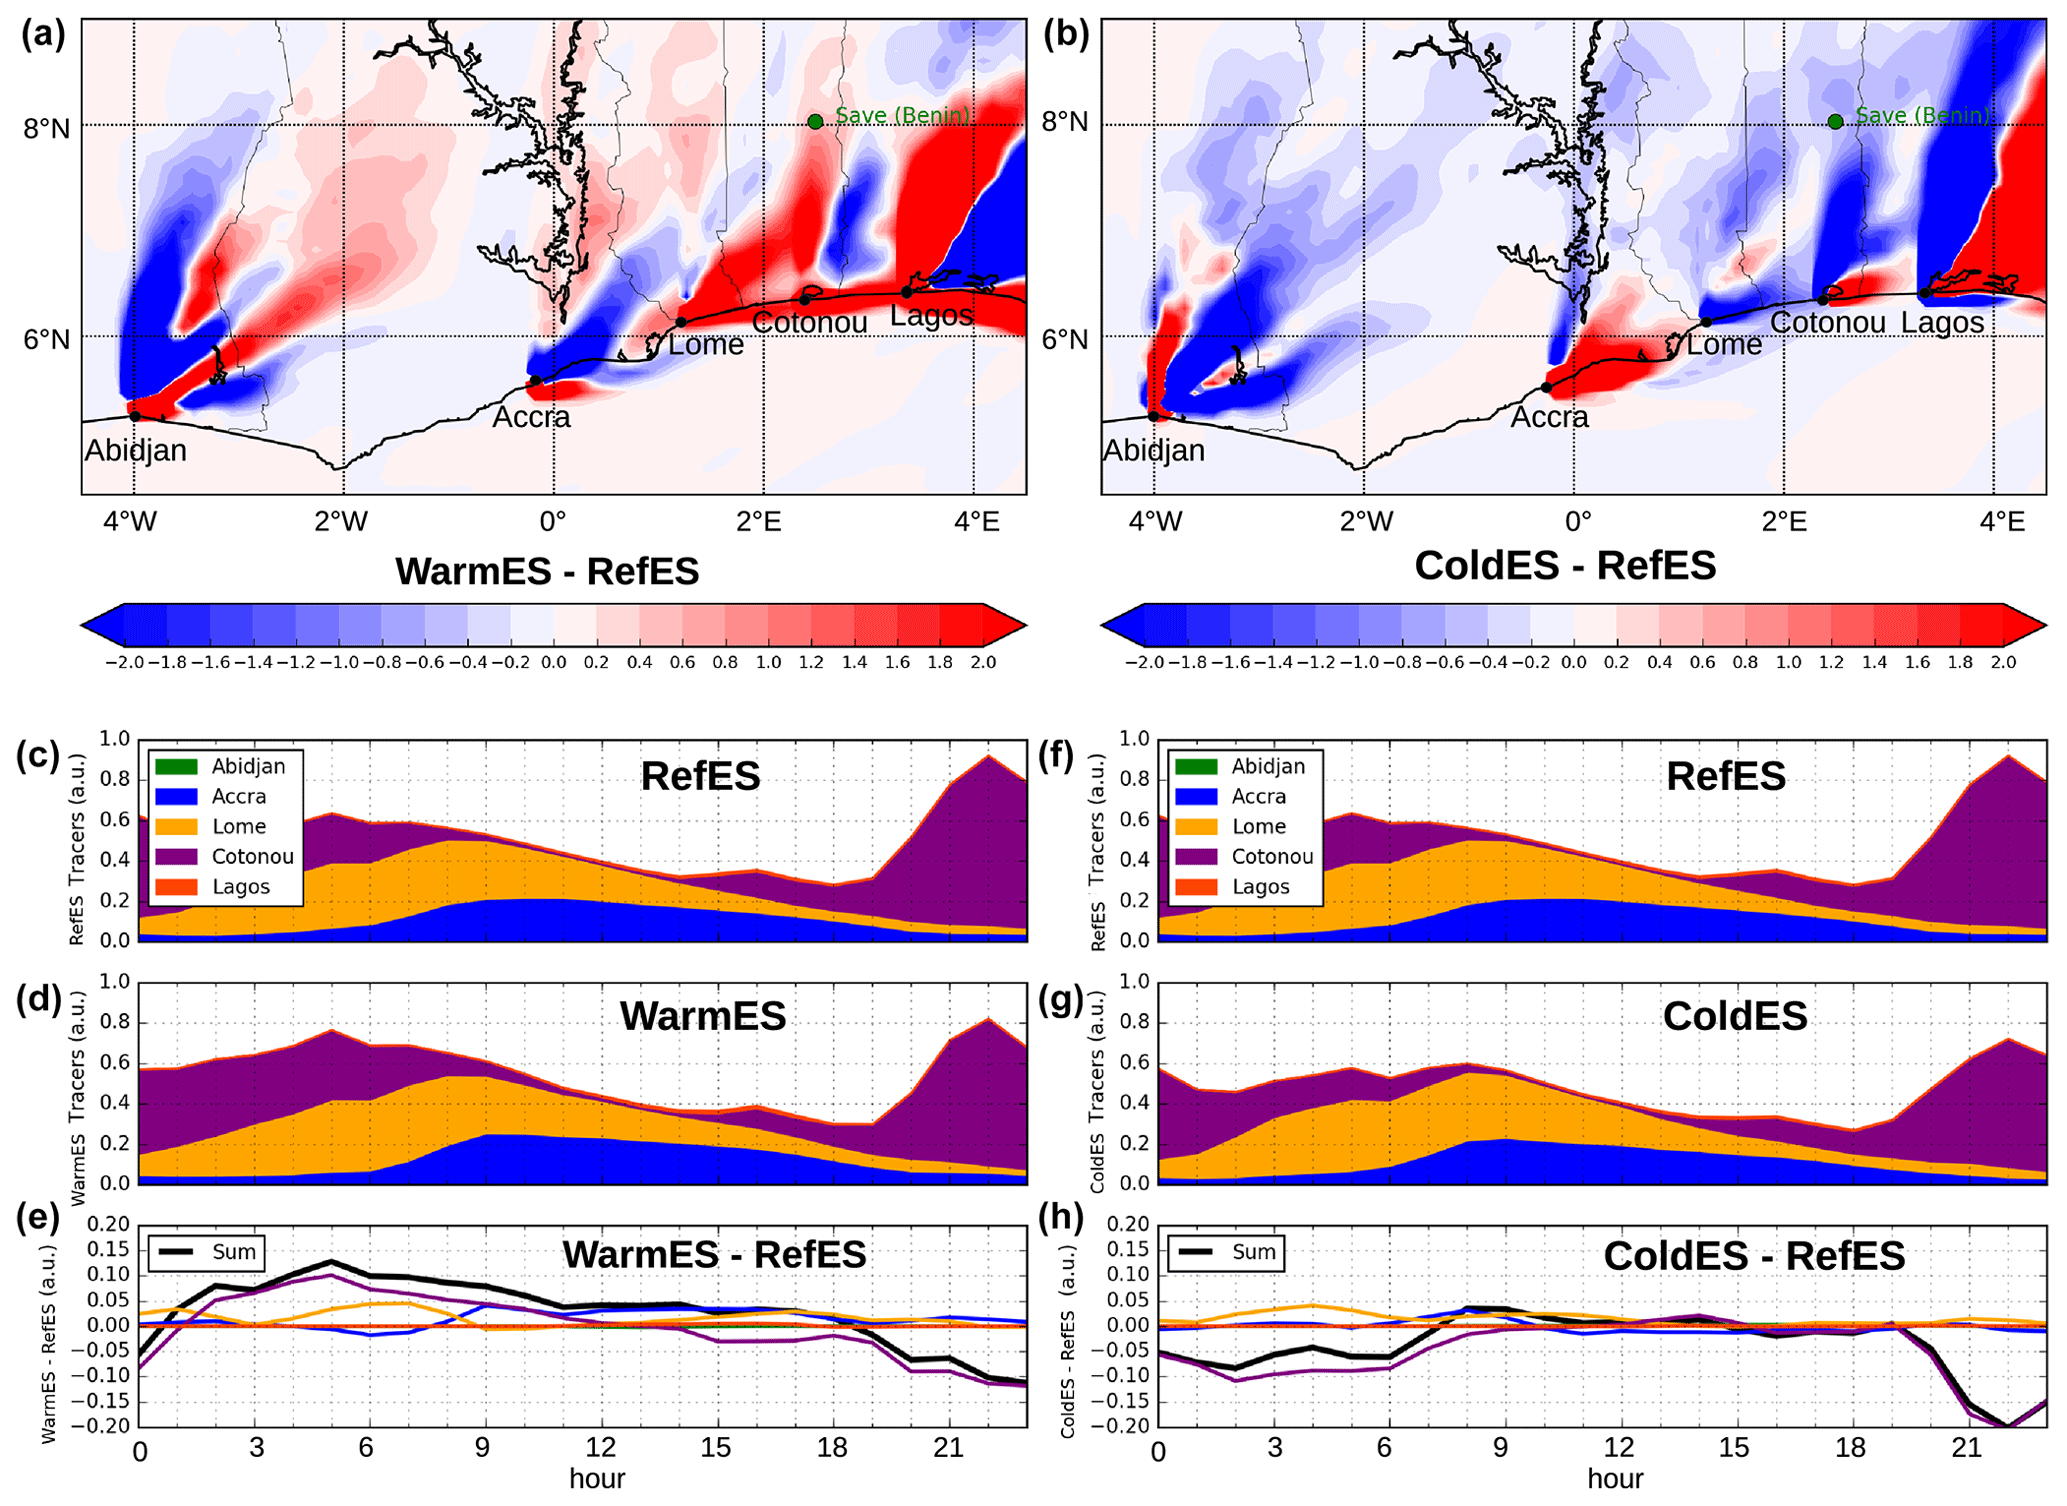
Figure 9(a, b) Difference maps of urban tracer transport modelled with (a) WarmES − RefES and with (b) ColdES − RefES using a constant release of urban tracers from five major coastal cities of the Gulf of Guinea (black dots): Abidjan (Côte d'Ivoire), Accra (Ghana), Lomé (Togo), Cotonou (Benin) and Lagos (Nigeria), taking into account the city population (see Deroubaix et al., 2019, for details). (c–h) Hourly diurnal cycle of the urban tracer concentrations at the DACCIWA super site of Savè in Benin (green dot in upper panels) averaged over the period from 25 June to 8 July modelled with (c) RefES (also in (f)), (d) WarmES or (g) ColdES. Differences: (e) WarmES − RefES and (h) ColdES − RefES. Note that the green colours associated with Abidjan are not visible because the pollution of Abidjan (studied by the tracers emitted in Abidjan) does not reach the city of Savè for any of the three ensembles.
We present the difference of tracer concentrations (in arbitrary units, a.u., summing the contribution of the five cities) averaged over the period from 25 June to 8 July between WarmES and RefES (Fig. 9a) and between ColdES and RefES (Fig. 9b). In both cases, the anomalies of coastal SST have an impact on the transport of tracers downstream of the five cities at the coast. A significant impact is also seen as far north as 8.5∘ N for all cities. The concentration anomaly fields associated with the plumes emitted from individual cities (i.e. the juxtaposition of positive and negative anomalies) are less clear for Abidjan than those from the other cities, which is related to the more complex dynamics of the monsoon flow to the west of Cape Three Points, possibly due to the fact that the near-surface monsoon winds are almost parallel to the coastline east of 2∘ W, as the monsoon winds are veering eastward inland (see Fig. 3b for RefES).
When the upwelling is dampened (WarmES), the tracer concentration anomaly field over the continent exhibits a distinct structure downstream of the four easternmost cities (east of Cape Three Point) with positive anomalies to the northeast and dominant negative anomalies to the southeast (Fig. 9a), which may be related to an anti-clockwise veering of the monsoon winds imposed by a change in the coastal SST in the upwelling area. It is also worth noting that the transport of pollution is significantly enhanced over the ocean east of Lomé along the coast of Togo, Benin and Nigeria, as opposed to the tracers emitted from Abidjan. This feature, taking the form of a narrow band parallel to the coastline, is likely associated with the amplification of the land breeze (Fig. 7). Downstream of Accra, the transport of urban pollutant tracers is seen to be enhanced close to Accra (in connection with the land breeze) but decreased further away, possibly due to the influence of the shape of the coastline.
When the upwelling is enhanced, in ColdES, the structure of the tracer concentration anomaly field over the continent is opposite to that seen in WarmES, thereby suggesting a clockwise veering of the monsoon winds imposed by the increase in the coastal SST (Fig. 9b). East of Cape Three Point, there is almost no significant tracer concentration anomalies offshore, except downstream of Accra, suggesting that the land breeze circulation is weaker than in RefES when the upwelling is strengthened, which is consistent with Tanguy et al. (2022). Overall, by comparing ColdES and RefES, the picture emerges that when the coastal upwelling is reinforced, the transport of urban pollutant tracers inland is reduced.
Even though the mean near-surface wind direction over southern West Africa was shown to be quite constant during the period of simulation, there is a marked variability of the strength of the monsoon flow at the diurnal scale in this region, as discussed in the previous section. This daily variability has an impact on the diurnal cycle of the cloud cover (Schuster et al., 2013). It also has an impact on the inland transport of humidity from the ocean (Deetz et al., 2018; Adler et al., 2019) as well as pollutants from coastal cities (Deroubaix et al., 2019).
There are three noticeable phases during the day:
- i.
From 09:00 to 15:00 UTC, there is an accumulation of pollutants at the coast due to convection and pollutants not being transported far from the emission sources. This period is defined as the “daytime drying” period.
- ii.
From 16:00 to 02:00 UTC, there is the formation of the low-level jet. Pollutants accumulated along the coastline are transported below 500 m above ground level, within the boundary layer, toward the northeast, this period being defined as the “Atlantic inflow” period.
- iii.
From 03:00 to 08:00 UTC, the intensity of the low-level jet decreases, thereby decreasing the northward transport of moisture and pollutants, this period being defined as the “moist morning” period.
CHIMERE-derived tracer simulations performed by Deroubaix et al. (2019) for the period 1–7 July 2016 have highlighted that the emissions from the above-mentioned large coastal cities are likely to affect the air quality in remote cities located inland over 200 km from the Gulf of Guinea coastline. They have shown that surface concentrations of pollutants in Savè (8∘ 2′ N, 2∘ 29′ E; Benin) are impacted by emissions from Accra, Cotonou and Lomé and exhibit a marked diurnal cycle, with a maximum between 18:00 and 22:00 UTC associated with pollution transport from Cotonou.
In the following, we analyse the influence of the coastal SST on the diurnal cycle of pollutant transport inland in Savè by comparing WarmES (Fig. 9d) and ColdES (Fig. 9g) with RefES (Fig. 9c, f). It is worth noting that, as pointed out in Deroubaix et al. (2019), only the emissions from Accra, Lomé and Cotonou contribute to the tracer budget in Savè. Furthermore, all three simulations exhibit a maximum in tracer concentration around 22:00 UTC originating mainly from Cotonou with a comparable magnitude, followed by a period of high tracer concentrations originating from Cotonou, Lomé and Accra until 09:00 UTC and a decrease in tracer concentration from 09:00 to 18:00 UTC (Fig. 9c, d, g).
When comparing the diurnal cycles from WarmES and RefES (Fig. 9e), it appears that the transport of pollution to Savè is enhanced between 01:00 and 18:00 UTC when the total concentration of tracers in WarmES is greater than in RefES (see the solid black line in Fig. 9e). From 01:00 to 12:00 UTC there is a clear enhanced contribution from Cotonou and, to a lesser extent, Lomé, to the overall transport in Savè. From 13:00 to 18:00 UTC, it appears that Accra and Lomé contribute to the excess of tracers' concentration, while the contribution from Cotonou diminishes. The transport of pollutants is higher for cities that affect Savè at night (namely Cotonou) and in the morning (namely Lomé and Accra).
When comparing the diurnal cycles from ColdES and RefES (Fig. 9h), we can see that the transport of pollution to Savè is unchanged between 07:00 and 19:00 UTC but significantly reduced between 19:00 and 07:00 UTC in ColdES compared to RefES (see the solid black line in Fig. 9h). In the latter case, there are fewer pollutants transported to Savè from Cotonou (which is the closest coastal major city) and no clear modification of the transport from the other cities.
In ColdES, the period of reduced transport extends into the moist morning period, suggesting that the strengthened coastal upwelling further decreases the intensity of the low-level jet. On the contrary, since pollutant transport is enhanced during this period in WarmES, it appears that an anomalously warm upwelling may contribute to strengthen the low-level jet in the late night and early morning. In WarmES, the tracer concentration coming from Cotonou increases by more than 10 % from 04:00 to 08:00 UTC. Conversely, in ColdES, tracer concentration coming from Cotonou decreases significantly by less than −5 % from 19:00 to 07:00 UTC.
Overall, there is an impact of SST anomalies on the inland transport of pollutants from major cities along the Guinea coast. Cooler SSTs decrease the inland transport of pollutants, while warmer SSTs increase it. These modifications of the transport occur at night, which suggests an influence on the low-level jet.
In this study, a set of numerical simulations was used to analyse the seasonal impact of the coastal upwelling that emerges along the Guinea coast in July. In addition to the reference ensemble, two additional experimental ensembles were produced by decreasing or increasing the strength of the coastal upwelling by about 30 %: a stronger (weaker) upwelling leads to a decrease (an increase) in coastal precipitation of about 20 %–30 %, thus explaining why the emergence of the Guinea coast upwelling most often coincides with the onset of the little dry season in July. These results confirm the relation between the strength of the upwelling and the humidity transport suggested by Tanguy et al. (2022). The coastal upwelling also has an impact on the distribution of atmospheric pollutants: their northeastern transport in the monsoon flow tends to weaken, reducing their continental concentration and potentially increasing this concentration on some spots along the coast. The intensity of the upwelling also affects the diurnal cycle of pollutants' transport inland, especially during the moist morning period when a weaker upwelling leads to enhanced pollutant transport inland, whereas a stronger upwelling reduces pollutant transport inland.
The mechanisms associated with the coastal upwelling feedback on atmospheric dynamics break down as follows: the cooling of the coastal SST induces a slowing of the monsoon flow near the coast; this decreases the coastal convergence of humidity transport, which inhibits deep convection and precipitation. In addition, it decreases the land–sea surface temperature gradient during the night, which weakens the land breeze strength. Since the diurnal alternation of land breeze and sea breeze forces precipitation to occur in the late night and early morning, a weakening of the land breeze leads to a strong decrease in morning coastal precipitation. This clearly shows that numerical weather models need a good representation of the SST impact on the land and sea breezes in order to produce an accurate forecast of the onset of the little dry season along the Guinea coast.
Note that our results only demonstrate the impact of the coastal upwelling on the reduction of coastal precipitation south of 6∘ N; they do not indicate any influence further north, although a reduction in precipitation is generally observed during the little dry season up to 8∘ N (Fig. 1). However, it is very interesting to note that the dampening (strengthening) of the coastal upwelling leads to a small deceleration (acceleration) of the AEJ on its southern side between 850 and 600 hPa, just above the coast (Fig. 10, black contours), probably resulting from the convective anomalies discussed in Sect. 4. Although this signal is weak, it is nonetheless significant in both experiments and induces significant relative vorticity anomalies (shading). An increase in the latter at the AEJ altitude is known to increase the likelihood of mesoscale convective system formation and precipitation (see, for example, Cook, 2015), so it seems necessary to further investigate whether a negative vorticity anomaly following the emergence of the coastal upwelling could contribute to the observed reduction in precipitation between 6 and 8∘ N during the little dry season.
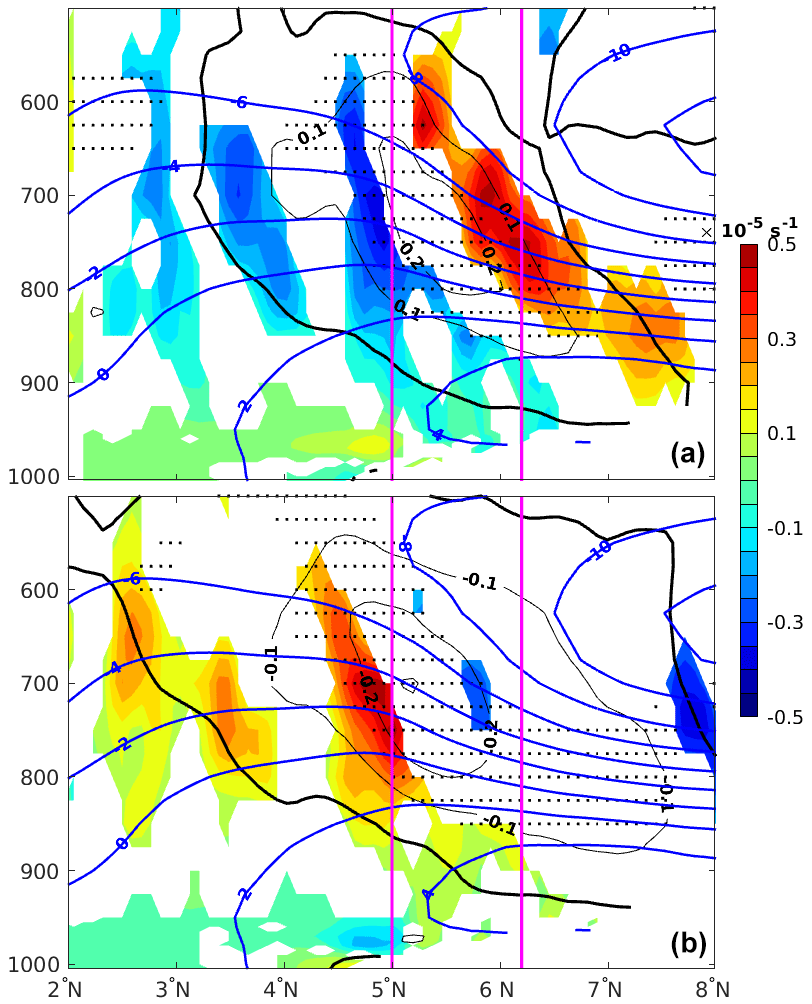
Figure 10For 25 June–8 July 2016, differences between WarmES and RefES (a) and ColdES and RefES (b) within the region between 6∘ W and 2∘ E: zonal velocity (black contours, intervals of 0.1 m s−1, zero contour as thick line), horizontal relative vorticity (shading) and RefES zonal velocity (blue contours, intervals of 2 m s−1). Shading indicates only vorticity anomalies passing a two-sample t test at the 5 % confidence level, while zonal velocity anomalies passing the test are marked with black dots.
Furthermore, the short duration of our simulations of only a few weeks for a given year limits the reach of our findings. Further studies should examine their validity for simulations spanning at least over several years. More detailed simulations should also provide clearer results over the coastal region east of Cape Three Points: the results were less significant there than further west, maybe because of a smaller amplitude of SST anomaly resulting from the methodology used to dampen the seasonal cooling of the coastal SST.
Finally, the emergence of the Guinea coast upwelling in July has been shown to oppose the inland monsoon flow. The latter remains a major contributor of humidity to summer precipitation in the Sahel, but generally in early July, it becomes weaker than the western low-level humidity transport from the tropical North Atlantic (Lele et al., 2015): the timing of this change could then be controlled by the emergence of the Guinea coast upwelling. Moreover, previous studies have suggested that the westward input of humidity is responsible for most of the interannual and decadal variability in observed summer rainfall in the Sahel (Pu and Cook, 2010; Lele et al., 2015), with September being the most variable month. This variability is also probably impacted by global teleconnections, such as the El Niño–Southern Oscillation. Hence, coastal upwelling could potentially regulate the level of interannual variability resulting from global teleconnections affecting the summer monsoon in a particular year. However, the SST of the coastal upwelling is heavily impacted by surface winds and the Guinea Current (Djakouré et al., 2017): considering that the Guinea Current is also likely influenced by surface winds but on a larger scale, there might be a possibility of better understanding the interaction system between coastal upwelling and monsoon flow. A study with a coupled ocean–atmosphere model is therefore needed to further investigate the potential influence of this interaction on intraseasonal variability in southern West Africa, which could lead to improved seasonal predictions of the summer monsoon.
All data and code are available upon request.
GdC and AD designed and implemented the numerical simulations and conducted the data analysis. LM, CF and MG provided guidance on the theoretical framework and assisted with the interpretation of the simulation results. All authors contributed to the writing and editing of the manuscript.
The contact author has declared that none of the authors has any competing interests.
Publisher's note: Copernicus Publications remains neutral with regard to jurisdictional claims made in the text, published maps, institutional affiliations, or any other geographical representation in this paper. While Copernicus Publications makes every effort to include appropriate place names, the final responsibility lies with the authors.
This work was granted access to the HPC resources of IDRIS under the allocation 2020 – A0060107454 made by GENCI. Marco Gaetani acknowledges the support of the project “Dipartimenti di Eccellenza 2023–2027”, funded by the Italian Ministry of Education, University and Research at IUSS Pavia. The authors would like to thank Tatsuo Onishi (LATMOS-IPSL) for his significant assistance in the numerical work and Elsa Mohino and an anonymous reviewer for their comments and suggestions that have greatly improved the paper.
This research has been supported by the European Union's Horizon 2020 Research and Innovation programme (Marie Skłodowska-Curie Actions, grand no. 895803, MACSECH – H2020-MSCA-IF-2019).
This paper was edited by Yves Balkanski and reviewed by Elsa Mohino and one anonymous referee.
Adler, B., Babić, K., Kalthoff, N., Lohou, F., Lothon, M., Dione, C., Pedruzo-Bagazgoitia, X., and Andersen, H.: Nocturnal low-level clouds in the atmospheric boundary layer over southern West Africa: an observation-based analysis of conditions and processes, Atmos. Chem. Phys., 19, 663–681, https://doi.org/10.5194/acp-19-663-2019, 2019. a
Ali, K., Kouadio, K., Zahiri, E.-P., Aman, A., Assamoi, A., and Bourles, B.: Influence of the Gulf of Guinea Coastal and Equatorial Upwellings on the Precipitations along its Northern Coasts during the Boreal Summer Period, Asian Journal of Applied Sciences, 4, 271–285, https://doi.org/10.3923/ajaps.2011.271.285, 2011. a, b
Aman, A., Toualy, E. and Yoroba, F.: On the Causes of the Minor Dry Season over the Coastal Region of the Northern Gulf of Guinea, Atmospheric and Climate Sciences, 8, 121–133, https://doi.org/10.4236/acs.2018.82009, 2018. a
Bakun, A.: Guinea Current upwelling, Nature, 271, 147–150, https://doi.org/10.1038/271147a0, 1978. a
Balkanski, Y., Bonnet, R., Boucher, O., Checa-Garcia, R., and Servonnat, J.: Better representation of dust can improve climate models with too weak an African monsoon, Atmos. Chem. Phys., 21, 11423–11435, https://doi.org/10.5194/acp-21-11423-2021, 2021. a
Cook, K. H.: Role of inertial instability in the West African monsoon jump, J. Geophys. Res.-Atmos., 120, 3085–3102, 2015. a
Da-Allada, C. Y., Agada, J., Baloïtcha, E., Hounkonnou, M. N., Jouanno, J., and Alory, G.: Causes of the Northern Gulf of Guinea Cold Event in 2012, J. Geophys. Res.-Oceans, 126, e2021JC017627, https://doi.org/10.1029/2021JC017627, 2021. a
de Coëtlogon, G., Leduc-Leballeur, M., Meynadier, R., Bastin, S., Diakhaté, M., Eymard, L., Giordani, H., Janicot, S., and Lazar, A.: Atmospheric response to sea-surface temperature in the eastern equatorial Atlantic at quasi-biweekly time-scales, Q. J. Roy. Meteor. Soc., 140, 1700–1714, 2014. a
Deetz, K., Vogel, H., Haslett, S., Knippertz, P., Coe, H., and Vogel, B.: Aerosol liquid water content in the moist southern West African monsoon layer and its radiative impact, Atmos. Chem. Phys., 18, 14271–14295, https://doi.org/10.5194/acp-18-14271-2018, 2018. a
Deroubaix, A., Menut, L., Flamant, C., Brito, J., Denjean, C., Dreiling, V., Fink, A., Jambert, C., Kalthoff, N., Knippertz, P., Ladkin, R., Mailler, S., Maranan, M., Pacifico, F., Piguet, B., Siour, G., and Turquety, S.: Diurnal cycle of coastal anthropogenic pollutant transport over southern West Africa during the DACCIWA campaign, Atmos. Chem. Phys., 19, 473–497, https://doi.org/10.5194/acp-19-473-2019, 2019. a, b, c, d, e, f, g, h
Djakouré, S., Penven, P., Bourlès, B., Koné, V., and Veitch, J.: Respective Roles of the Guinea Current and Local Winds on the Coastal Upwelling in the Northern Gulf of Guinea, J. Phys. Oceanogr., 47, 1367–1387, https://doi.org/10.1175/JPO-D-16-0126.1, 2017. a, b
Flamant, C., Deroubaix, A., Chazette, P., Brito, J., Gaetani, M., Knippertz, P., Fink, A. H., de Coetlogon, G., Menut, L., Colomb, A., Denjean, C., Meynadier, R., Rosenberg, P., Dupuy, R., Dominutti, P., Duplissy, J., Bourrianne, T., Schwarzenboeck, A., Ramonet, M., and Totems, J.: Aerosol distribution in the northern Gulf of Guinea: local anthropogenic sources, long-range transport, and the role of coastal shallow circulations, Atmos. Chem. Phys., 18, 12363–12389, https://doi.org/10.5194/acp-18-12363-2018, 2018. a
Gu, G. and Adler, R. F.: Seasonal Evolution and Variability Associated with the West African Monsoon System, J. Climate, 17, 3364–3377, https://doi.org/10.1175/1520-0442(2004)017<3364:SEAVAW>2.0.CO;2, 2004. a
Hagos, S. M. and Cook, K. H.: Dynamics of the West African Monsoon Jump, J. Climate, 20, 5264–5284, https://doi.org/10.1175/2007JCLI1533.1, 2007. a
Hayes, S. P., McPhaden, M. J., and Wallace, J. M.: The influence of sea surface temperature on surface wind in the eastern equatorial Pacific: weekly to monthly variability, J. Climate, 2, 1500–1506, https://doi.org/10.1175/1520-0442(1989)002<1500:TIOSST>2.0.CO;2, 1989. a
Haywood, J. M., Jones, A., Dunstone, N., Milton, S., Vellinga, M., Bodas-Salcedo, A., Hawcroft, M., Kravitz, B., Cole, J., Watanabe, S., and Stephens, G.: The impact of equilibrating hemispheric albedos on tropical performance in the HadGEM2-ES coupled climate model, Geophys. Res. Lett., 43, 395–403, https://doi.org/10.1002/2015GL066903, 2016. a
Knippertz, P., Coe, H., Chiu, J. C., Evans, M. J., Fink, A. H., Kalthoff, N., Liousse, C., Mari, C., Allan, R. P., Brooks, B., Danour, S., Flamant, C., Jegede, O. O., Lohou, F., and Marsham, J. H.: The DACCIWA Project: Dynamics-Aerosol-Chemistry-Cloud Interactions in West Africa, B. Am. Meteorol. Soc., 96, 1451–1460, https://doi.org/10.1175/BAMS-D-14-00108.1, 2015. a
Knippertz, P., Fink, A. H., Deroubaix, A., Morris, E., Tocquer, F., Evans, M. J., Flamant, C., Gaetani, M., Lavaysse, C., Mari, C., Marsham, J. H., Meynadier, R., Affo-Dogo, A., Bahaga, T., Brosse, F., Deetz, K., Guebsi, R., Latifou, I., Maranan, M., Rosenberg, P. D., and Schlueter, A.: A meteorological and chemical overview of the DACCIWA field campaign in West Africa in June–July 2016, Atmos. Chem. Phys., 17, 10893–10918, https://doi.org/10.5194/acp-17-10893-2017, 2017. a
Kouadio, Y., Djakouré, S., Aman, A., Ali, K., Koné, V., and Toualy, E.: Characterization of the Boreal Summer Upwelling at the Northern Coast of the Gulf of Guinea Based on the PROPAO In Situ Measurements Network and Satellite Data, Int. J. Oceanogr., 2013, 816561, https://doi.org/10.1155/2013/816561, 2013. a, b
Leduc-Leballeur, M., de Coëtlogon, G., and Eymard, L.: Air-sea interaction in the Gulf of Guinea at intraseasonal time-scales: wind bursts and coastal precipitation in boreal spring, Q. J. Roy. Meteor. Soc., 139, 387–400, https://doi.org/10.1002/qj.1981, 2013. a
Lele, I., Leslie, L. M., and Lamb, P.: Analysis of low-level atmospheric moisture transport associated with the West African Monsoon, J. Climate, 11, 4414–4430, https://doi.org/10.1175/JCLI-D-14-00746.1, 2015. a, b
Lindzen, R. S. and Nigam, S.: On the role of sea surface temperature gradients in convergence in the Tropics, J. Atmos. Sci., 44, 2418–2436, https://doi.org/10.1175/1520-0469(1987)044<2418:OTROSS>2.0.CO;2, 1987. a
Mailler, S., Menut, L., Khvorostyanov, D., Valari, M., Couvidat, F., Siour, G., Turquety, S., Briant, R., Tuccella, P., Bessagnet, B., Colette, A., Létinois, L., Markakis, K., and Meleux, F.: CHIMERE-2017: from urban to hemispheric chemistry-transport modeling, Geosci. Model Dev., 10, 2397–2423, https://doi.org/10.5194/gmd-10-2397-2017, 2017. a
Maranan, M., Fink, A., and Knippertz, P.: Rainfall types over southern West Africa: Objective identification, climatology and synoptic environment, Q. J. Roy. Meteor. Soc., 144, 1628–1648, https://doi.org/10.1002/qj.3345, 2018. a
Menut, L., Tuccella, P., Flamant, C., Deroubaix, A., and Gaetani, M.: The role of aerosol–radiation–cloud interactions in linking anthropogenic pollution over southern west Africa and dust emission over the Sahara, Atmos. Chem. Phys., 19, 14657–14676, https://doi.org/10.5194/acp-19-14657-2019, 2019. a
Meynadier, R., de Coëtlogon, G., Leduc-Leballeur, M., Eymard, L., and Janicot, S.: Seasonal influence of the sea surface temperature on the low atmospheric circulation and precipitation in the eastern equatorial Atlantic, Clim. Dynam., 47, 1127–1142, https://doi.org/10.1007/s00382-015-2892-7, 2016. a, b, c
Miller, R. L., Knippertz, P., Pérez García-Pando, C., Perlwitz, J. P., and Tegen, I.: Impact of Dust Radiative Forcing upon Climate, Springer Netherlands, Dordrecht, 327–357, https://doi.org/10.1007/978-94-017-8978-3_13, ISBN 978-94-017-8978-3, 2014. a
Nguyen, H., Thorncroft, C. D., and Zhang, C.: Guinean coastal rainfall of the West African Monsoon, Q. J. Roy. Meteor. Soc., 137, 1828–1840, https://doi.org/10.1002/qj.867, 2011. a
Nnamchi, H. and Li, J.: Influence of the South Atlantic Ocean Dipole on West African Summer Precipitation, J. Climate, 24, 1184–1197, https://doi.org/10.1175/2010JCLI3668.1, 2011. a
Odekunle, T. and Eludoyin, A.: Sea surface temperature patterns in the Gulf of Guinea: Their implications for the spatio-temporal variability of precipitation in West Africa, Int. J. Climatol., 28, 1507–1517, https://doi.org/10.1002/joc.1656, 2008. a
Parker, D., Kassimou, A., Orju, B. N., Osika, D. P., Hamza, I., Diop-Kane, M., Fink, A., Galvin, J., Guichard, F., Lamptey, B. L., Hamidou, H., van der Linden, R., Redl, R., and Lebel, T.: Local Weather, in: Meteorology of Tropical West Africa, the Forecaster's Handbook, Wiley Blackwell, https://doi.org/10.1002/9781118391297.ch4, 2017. a, b
Powers, J. G., Klemp, J. B., Skamarock, W. C., Davis, C. A., Dudhia, J., Gill, D. O., Coen, J. L., Gochis, D. J., Ahmadov, R., Peckham, S. E., Grell, G. A., Michalakes, J., Trahan, S., Benjamin, S. G., Alexander, C. R., Dimego, G. J., Wang, W., Schwartz, C. S., Romine, G. S., Liu, Z., Snyder, C., Chen, F., Barlage, M. J., Yu, W., and Duda, M. G.: The Weather Research and Forecasting Model: Overview, System Efforts, and Future Directions, B. Am. Meteorol. Soc., 98, 1717–1737, https://doi.org/10.1175/BAMS-D-15-00308.1, 2017. a
Pu, B. and Cook, K.: Role of the West African Westerly Jet in Sahel Rainfall variations, J. Climate, 25, 2880–2896, https://doi.org/10.1175/JCLI-D-11-00394.1, 2010. a, b
Schuster, R., Fink, A. H., and Knippertz, P.: Formation and Maintenance of Nocturnal Low-Level Stratus over the Southern West African Monsoon Region during AMMA 2006, J. Atmos. Sci., 70, 2337–2355, https://doi.org/10.1175/JAS-D-12-0241.1, 2013. a
Sultan, B. and Janicot, S.: The West African Monsoon Dynamics. Part II: The Preonset and Onset of the Summer Monsoon, J. Climate, 16, 3407–3427, https://doi.org/10.1175/1520-0442(2003)016<3407:TWAMDP>2.0.CO;2, 2003. a
Sweet, W. R., Fett, R., Kerling, J., and LaViolette, P.: Air-sea interactions effects in the lower troposphere across the north wall of the Gulf Stream, Mon. Weather Rev., 109, 1042–1052, https://doi.org/10.1175/1520-0493(1981)109<1042:ASIEIT>2.0.CO;2, 1981. a
Tanguy, M., De Coëtlogon, G., and Eymard, L.: Sea surface temperature impact on diurnal cycle and seasonal evolution of the Guinea coast rainfall in Boreal spring and summer, Mon. Weather Rev., 150, 3175–3194, https://doi.org/10.1175/MWR-D-21-0155.1, 2022. a, b, c, d
Thiébaux, J., Rogers, E., Wang, W., and Katz, B.: A new high-resolution blended real-time global sea surface temperature analysis, B. Am. Meteorol. Soc., 84, 645–656, https://doi.org/10.1175/BAMS-84-5-645, 2003. a
Thorncroft, C., Nguyen, H., Zhang, C., and Peyrillé, P.: Annual cycle of the West African monsoon: regional circulations and associated water vapour transport, Q. J. Roy. Meteor. Soc., 137, 129–147, https://doi.org/10.1002/qj.728, 2011. a
Wallace, J. M., Mitchell, T. P., and Deser, C.: The influence of sea surface temperature on surface wind in the eastern equatorial Pacific: seasonal and interannual variability, J. Climate, 2, 1492–1499, https://doi.org/10.1175/1520-0442(1989)002<1492:TIOSST>2.0.CO;2, 1989. a
Weller, E., Shelton, K., Reeder, M. J., and Jakob, C.: Precipitation Associated with Convergence Lines, J. Climate, 30, 3169–3183, https://doi.org/10.1175/JCLI-D-16-0535.1, 2017. a
Zhang, G. and Cook, K.: West African monsoon demise: Climatology, interannual variations, and relationship to seasonal rainfall, J. Geophys. Res.-Atmos., 119, 10175–10193, https://doi.org/10.1002/2014JD022043, 2014. a
- Abstract
- Introduction
- Reference ensemble simulation (RefES)
- Sensitivity experiment design
- Atmospheric responses in WarmES and ColdES
- Tracers' transport
- Conclusions and discussion
- Code and data availability
- Author contributions
- Competing interests
- Disclaimer
- Acknowledgements
- Financial support
- Review statement
- References