the Creative Commons Attribution 4.0 License.
the Creative Commons Attribution 4.0 License.
 | 19 Dec 2023
The impact of ENSO and NAO initial conditions and anomalies on the modeled response to Pinatubo-sized volcanic forcing
Helen Weierbach
Allegra N. LeGrande
Kostas Tsigaridis
Strong, strato-volcanic eruptions are a substantial, intermittent source of natural climate variability. Initial atmospheric and oceanic conditions, such as El Niño Southern Oscillation (ENSO) and the North Atlantic Oscillation (NAO), also naturally impact climate on interannual timescales. We examine how initial conditions of ENSO and NAO contribute to the evolution of climate in the period following a Pinatubo-type eruption using a large (81-member) ensemble of model simulations in GISS model E2.1-G. Simulations are initialized from sampled conditions of ENSO and NAO using the protocol of the coordinated CMIP6 Volcanic Model Intercomparison Project (VolMIP) – where aerosols are forced with respect to time, latitude, and height. We analyze paired anomalous variations (perturbed – control) to understand changes in global and regional climate responses under positive, negative, and neutral ENSO and NAO conditions. In particular, we find that for paired anomalies there is a high probability of strong (∼1.5 ∘C) warming of northern Eurasia surface air temperature in the first winter after the volcanic eruption for negative NAO ensembles coincident with decreased lower stratospheric temperature at the poles, decreased geopotential height, and strengthening of the stratospheric polar vortex. Climate anomalies (relative to average conditions across the control period), however, show no mean warming and suggest that the strength of this response is impacted by conditions present in the selected period of the control run. Again using paired anomalies, we also observe that under both +ENSO and −ENSO ensembles sea surface temperature decreases in the first post-eruptive boreal winter coinciding with surface cooling from volcanic aerosols. Neutral ENSO ensembles, on the other hand, show variability in their response with no clear trend in post-eruptive warming or cooling. In general, paired anomalies from unperturbed simulations give insight into the evolution of the climate response to volcanic forcing; however, when compared with anomalies from climatological conditions, it is clear that paired anomalies are significantly affected by sampled initial conditions occurring at the time of the volcanic eruption.
- Article
(4966 KB) - Full-text XML
-
Supplement
(2192 KB) - BibTeX
- EndNote


Strong, explosive volcanic eruptions are an intermittent, natural source of climate variability acting on both interannual and decadal scales. Explosive volcanic eruptions eject sulfur dioxide, halogens, ash, and water vapor into the stratosphere, where the particles are converted into sulfate aerosols (LeGrande et al., 2016). The loading of stratospheric aerosols increases aerosol optical depth of the atmosphere (Lacis, 2015), thus imposing a radiative forcing via scattering of shortwave radiation and absorption of longwave radiation in the stratosphere (Zanchettin et al., 2013).
The impact that a strong volcanic eruption has on the climate system depends on many factors including size, ejection height, and location of the eruption. These factors impact the amount, location, and dynamics of how aerosols are loaded in the atmosphere (Timmreck et al., 2010; LeGrande and Anchukaitis, 2015). Mount Pinatubo is an example of one such strong volcanic eruption which occurred in the Philippines in June 1991, ejecting 18 Tg of SO2 into the atmosphere at a height of 20 km (Stenchikov et al., 1998). The Pinatubo eruption is widely studied as it is one of the largest volcanic eruptions since 1991, thus providing well-constrained satellite observations to run climate model simulations (McCormick et al., 1995; Bluth et al., 1992; Stenchikov et al., 1998).
The timing of an eruption, including the time of season and initial climate conditions, also impact climate's response to a volcanic eruption by actively influencing the mechanisms involved in the post-eruption decadal climate evolution (Zanchettin et al., 2013). Climate variability, such as the El Niño Southern Oscillation System (ENSO) and North Atlantic Oscillation (NAO), continuously cause variations in earth's climate over time (Philander, 1983; Allan et al., 1996; Timmermann et al., 2018; Hurrell et al., 2003; Wanner et al., 2001). Climate modeling studies have examined how the initial state of these climate conditions impact the climate response to volcanic eruption on interannual to decadal scales: while radiative forcing impacts remained the same, different initial climate states caused substantial variability in surface atmospheric and oceanic conditions (Zanchettin et al., 2013; Pausata et al., 2020). Further climate modeling experiments have thus been designed to capture variability that may occur due to different initial states of the climate system at the time of a modeled volcanic eruption (Zanchettin et al., 2016).
In this study, we analyze the modeled response to a 1991 Pinatubo-sized eruption under the coordinated protocol of the Volcanic Model Intercomparison Project (VolMIP) (Eyring et al., 2016) aiming to understand how initial ENSO and NAO climate conditions can impact the climate response. In particular, we investigate how initial ENSO and NAO conditions, which are sampled for as part of the VolMIP protocol (Zanchettin et al., 2016), impact the response in the ENSO region and in the Northern Hemisphere for the first 3 years after the eruption. We also use this ensemble to examine the impact of initial climate conditions and initial climate sampling on the aggregate response of the climate conditions to volcanic forcing.
2.1 Impact of the Pinatubo eruption on climate
The impact of a Pinatubo-sized eruption on the earth's climate system is significant. Previous work has shown that Pinatubo-sized volcanic eruptions decrease radiative flux in the region (40∘ N–40∘ S) by around −4.3 W m−2 at their peak aerosol forcing (Minnis et al., 1993), with radiative effects lasting for about 2 years after the eruption. In comparison, anthropogenic radiative forcing is estimated to have increased global energy budget by 2.3 W m−2 over the industrial period (Myhre et al., 2013), making volcanic forcing a short-lived but substantial source of natural climate variability. The resulting impacts in the climate system, however, last years after volcanic aerosols have been depleted. The direct impacts of volcanic aerosols include cooling of the earth's surface and warming of the stratosphere (Lacis, 2015). These direct impacts initiate many other changes in the climate system including changes in atmospheric circulation, the hydrological cycle, the cryosphere, and the carbon cycle (Zanchettin et al., 2016). Below we discuss specifically two responses: the response of ENSO and the response of the climate system in the Northern Hemisphere.
2.2 ENSO response
El Niño Southern Oscillation (ENSO) is an important mode of climate variability which oscillates between positive (El Niño), neutral, and negative (La Niña) phases at timescales of about 2–7 years in the equatorial Pacific Ocean (Predybaylo et al., 2017). During positive phases, the equatorial Pacific experiences higher than average sea surface temperature, and during negative phases, the average sea surface temperature is lower. These oceanic changes are associated with changes in both regional climate and global climate connections. Both observational (direct and proxy-based) and model-based studies have been used to examine ENSO responses to large volcanic perturbations. Some proxy-based and several modeling studies suggest that large, tropical volcanic eruptions increase the likelihood of an El Niño-like, or positive, sea surface temperature anomaly following the eruption (Adams et al., 2003; Predybaylo et al., 2017; Khodri et al., 2017).
Predybaylo et al. (2017) and Zambri et al. (2019) additionally studied the robustness of the simulated El Niño anomaly under varying initial conditions at the time of volcanic eruptions. While Predybaylo et al. (2017) found enhanced El Niño-like warming for all Pinatubo simulations except those where eruptions occurred in La Niña years, Zambri et al. (2019) found a consistent warming of tropical sea surface temperature of 0.5–1.0 ∘C in the Niño 3.4 region in response to the 1783 Laki Eruption in the Whole Atmosphere Community Climate Model (WACCM). Research has also focused on understanding the dynamics of the El Niño anomaly. Suggested mechanisms for this increase in sea surface temperature includes the ocean dynamical thermostat (Clement et al., 1996), which causes advection of warm water through differential cooling, and Walker circulation cells which are caused by post-eruptive cooling over tropical Africa (Khodri et al., 2017). This mechanism was also shown to cause sustained 7-year El Niño anomalies in response to soot aerosols from simulated global nuclear war (Coupe et al., 2021). Despite several studies supporting El Niño like anomalies, other observational and modeling studies suggest that there is no statistically significant El Niño-like response after several large volcanic eruptions (Dee et al., 2020). These studies suggest that anomalies found in observational records and model simulations are not statistically significant and are rather within the range of natural climate variability (Dee et al., 2020).
2.3 Northern Hemisphere winter response
The Northern Hemisphere experiences a unique response during the first winter after large volcanic eruptions. Many observational (Graf et al., 2007; Christiansen, 2008) and modeling (Timmreck, 2012; Stenchikov et al., 2002) studies have noted a strengthening of the polar vortex the first winter after a large volcanic eruption. This increased polar vortex circulation in the lower stratosphere is closely associated with an enhanced phase of the Arctic Oscillation (AO) and North Atlantic Oscillation (NAO) – two modes of natural climate variability that are separately defined but closely related in their associated climate impacts including surface temperature patterns (Cohen and Barlow, 2005). Such increased surface air temperature patterns have commonly been observed after large volcanic eruptions such as the 1991 Pinatubo eruption (Robock and Mao, 1995; Kelly et al., 1996). Thus, the unique signature of increased surface air temperature over Eurasia termed “winter warming” has been analyzed in several volcanic modeling studies.
Modeling studies from previous climate model intercomparison projects substantiate post-eruptive winter warming. For example, Zambri and Robock (2016) analyzed an ensemble of CMIP5 simulations finding that most models produce a winter warming signature over the Northern Hemisphere corresponding with a stronger polar vortex in the lower stratosphere both over the historical 1850–2005 simulation period (Zambri and Robock, 2016) and over the past millennium (Zambri et al., 2017). Analyses from individual models have also previously supported winter warming corresponding with strengthened polar vortex circulation. For example, the NCAR CAM5 AMIP large ensemble showed consistent winter warming in response to both the 1982 El Chinchón and the 1991 Pinatubo eruptions (Coupe and Robock, 2021). This increase in surface temperature is also seen in both observational and global modeling studies (Robock and Mao, 1992; Graft et al., 1993).
Still other studies call the robustness of this modeled result into question. For example, other analyses of CMIP5 models show variation in the prevalence of this response (Timmreck et al., 2016; Driscoll et al., 2012) suggesting that large numbers of ensembles may be required to see a significant strengthening of the polar vortex (Bittner et al., 2016). One proposed cause for inconsistencies in the winter warming response is that the simulated winter warming response in a model is within the range of internal variability (Polvani et al., 2019) and thus is not a robust response to volcanic eruptions. Other studies, such as Driscoll et al. (2012) and Stenchikov et al. (2006), also find no consistent warming in the Northern Hemisphere or strengthening of the polar vortex associated with winter warming.
To better understand why a strengthening of the polar vortex circulation occurs, several studies have proposed mechanisms that link volcanic eruptions with changes in atmospheric circulation (Robock and Mao, 1995; Robock, 2000; Stenchikov et al., 2002). Despite proposed mechanisms, however, some studies suggest that the prevalence of this response may depend on aerosol forcing (Toohey et al., 2014) or may be insignificant in comparison with the range of natural variability in climate (Polvani et al., 2019).
To investigate the Pinatubo response under different initial conditions we run a large ensemble of simulations with initial conditions sampled using two different sampling schemes. Both sets of simulations are run in accordance with the VolMIP protocol with a pre-industrial atmosphere in GISS model E2.1.
3.1 The model
All model simulations are run in GISS model E2.1 (Kelley et al., 2020) (E2-1-G in CMIP6 archive): a climate model with fully coupled ocean–atmosphere dynamics and in correspondence with CMIP6 protocols. GISS model E2.1 has a horizontal resolution of 2∘ latitude by 2.5∘ longitude and 40 vertical layers (which are more densely layered close to the surface and get progressively coarser going upwards into the stratosphere). All ensembles are run with a fully dynamic mass-converting free surface Russel ocean model (Russell et al., 1995) now referred to as the GISS ocean, denoted “G” in GISS E2.1-G. The atmosphere is represented with non-interactive (NINT) aerosols. Thus, ozone and other aerosols are pre-determined by CMIP6- specified model inputs.
The representation of ENSO in GISS E2.1-G for CMIP6 has improved significantly upon E2 (CMIP5) (Schmidt et al., 2014) on correlated global changes in temperature for all ocean representations (including the GISS ocean used here). The model shows a spectral density of ENSO events peaking at a 5-year period (Kelley et al., 2020) showing a slight bias in frequency, although the relative strength of the ENSO cycle is reasonable. E2.1 also shows a higher than average standard deviation in NAO patterns when compared with observations and other models (Orbe et al., 2020) translating to larger variability in the NAO.
3.2 Model simulations and sampling
After a 6000-year control run spin-up, 400 years are sampled to select ensemble years based on initial ENSO and NAO conditions. Prior to sampling, control run simulations are run with a pre-industrial atmosphere for a total of 400 years. Simulations begin in June where the start years are determined by selecting years with specific ENSO and NAO tendencies at the time of peak forcing defined as the average conditions across December (start year), January (start year + 1), and February (start year + 1) as specified by the sampling protocol described in Zanchettin et al. (2016). More details about the sampling protocol and indices for both ENSO and NAO conditions are described by Zanchettin et al. (2016), where we use the Niño 3.4 index to represent ENSO states and a two-box 500 mb geopotential height index to represent NAO (Stephenson et al., 2006). Sampling for the VolMIP simulations is with the same sampling protocol as for other models from the multi-model ensemble shown in Zanchettin et al. (2022). While it is important to note that the sampled states are at the time of peak aerosol forcing rather than at the start of the simulation, we hereafter refer to these climate conditions as initial conditions because they represent the expected climate state in the absence of volcanic forcing. In total, we sample 9 years from each co-condition (a combined cross of three conditions of and three conditions of ) for a total of 81 VolMIP sampled simulations; each ENSO (and NAO) state thus has 27 members.
In addition to the VolMIP runs sampled from initial conditions, we also sample 50 additional runs randomly from the same control run (henceforth referred to as “random samples”). From these 50 randomly sampled years, 10 overlap with already sampled VolMIP simulation years. Thus, 40 additional simulations (identical to VolMIP simulations except for random sampling) were also run with NINT (non-interactive, specified aerosols, and atmospheric chemistry) atmosphere and the GISS ocean for a total of 121 simulations. Initial conditions in the control run are approximately randomly distributed and show some skew in ENSO states, but no correlation between ENSO and NAO states (Fig. 1).
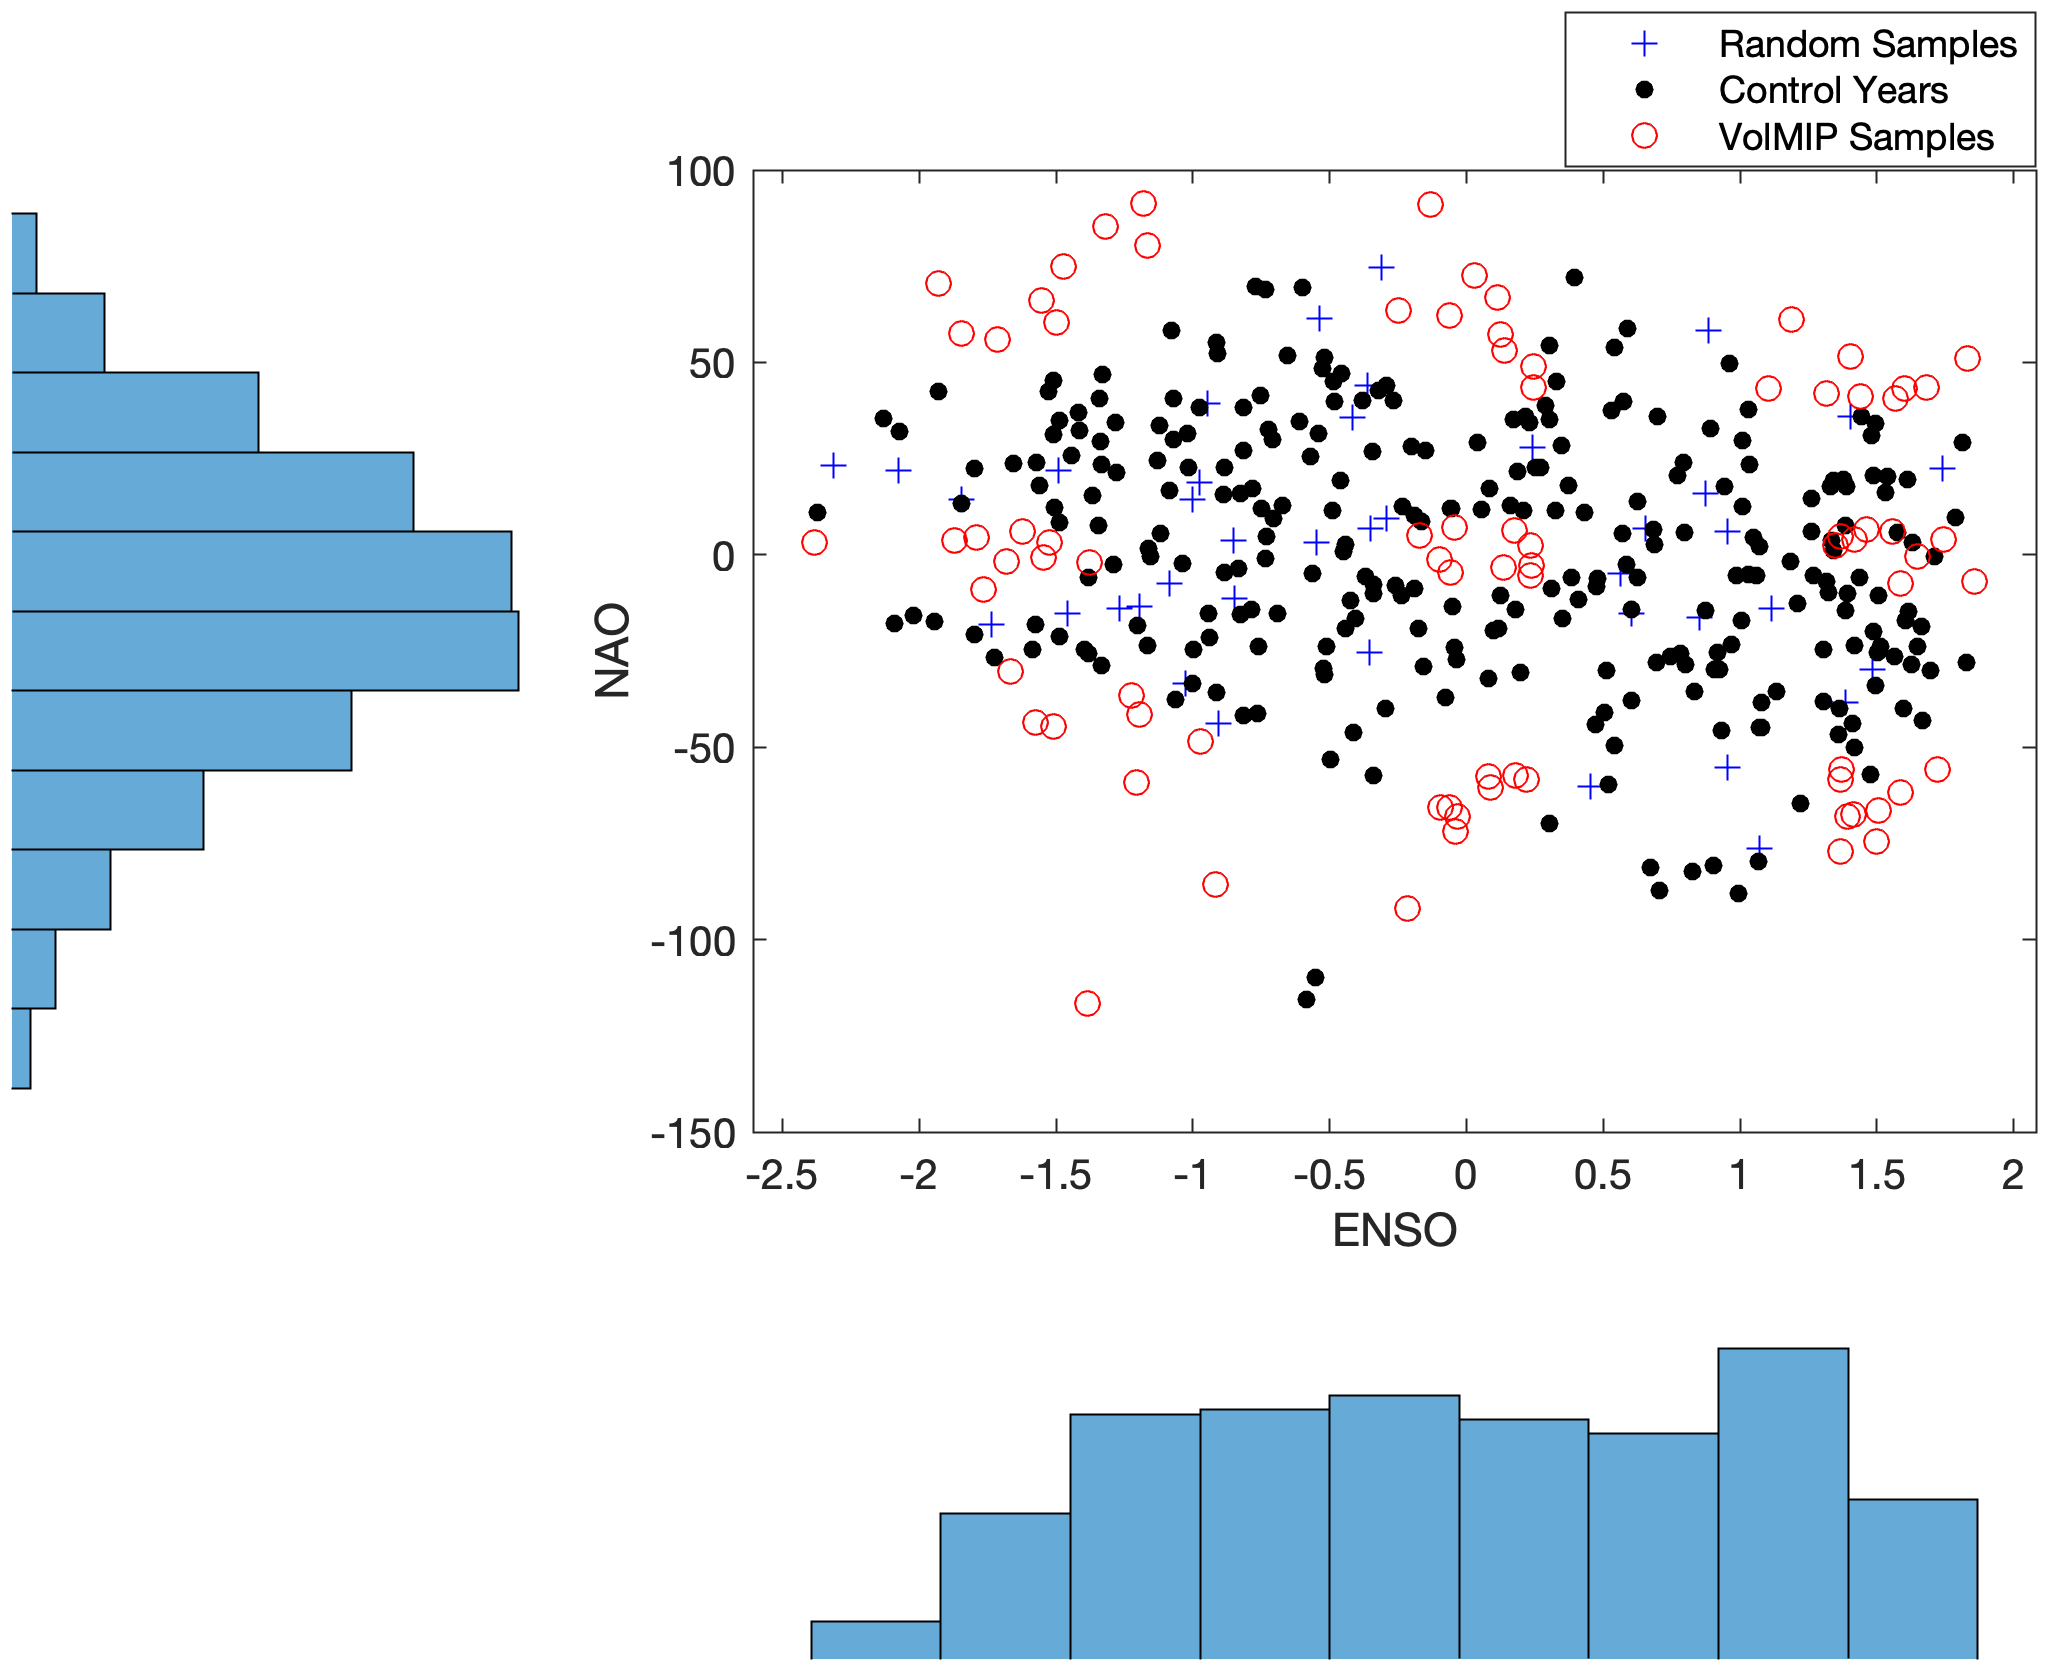
Figure 1Initial climate conditions for 400 years in the GISS control model run. Each year in the 400-year control is plotted with ENSO (Niño 3.4) index on the x axis and NAO (z-500) index on the y axis. VolMIP sampled simulations are denoted by red circles, additional randomly sampled years are blue (+), and all other years in the control run are black dots. Histograms show a distribution of initial conditions within the model control run: ENSO conditions exhibit a positive skew consistent with model biases addressed by Kelley et al. (2020).
After ensemble years are selected according to the two sampling schemes (VolMIP and random samples), volcanic simulations are run in GISS-E2-1-G in accordance with VolMIP protocol (Zanchettin et al., 2016). Volcanic aerosols are prescribed based on CMIP6 Pinatubo aerosol climatology (Thomason et al., 2018) as a function of height, latitude, and time beginning on the sixth month of the simulation (June) to emulate the 1991 Pinatubo eruption.
3.3 Data analysis and anomalies
We examine how the climate response under volcanic conditions differs from control conditions under two different widely used methods to represent the climate anomaly of this type of short-lived climate perturbation. First, we process results by computing anomalies from the equivalent control period (response = perturbed − control), hereafter referred to as “paired anomalies” as defined in Zanchettin et al. (2022). With paired anomalies each ensemble is analyzed as an anomaly from control conditions with the same initial climate condition, thereby excluding the effect of ongoing unperturbed climate variability, initial ENSO, and NAO state (Pausata et al., 2015). The second approach we examine calculates anomalies from a climatological control period (hereafter “climate anomalies”) which instead measure deviation from the control run and thus include ongoing climate variability. Specifically, we use two definitions of climatological anomalies to best contextualize our results with other studies. The first climatological anomaly takes the difference between each ensemble member and the full control including seasonality as defined by Zanchettin et al. (2022). Second, for comparison of Northern Hemisphere anomalies we additionally calculate a second climate anomaly by subtracting the average condition of the 5 years prior to the selected eruption year as used in other studies examining the climate response to volcanic forcing (Polvani et al., 2019; Stenchikov et al., 2006; Driscoll et al., 2012). However, in order to discuss responses in the absence of background conditions, we present predominately paired anomalies except where climatological anomalies produce significantly different results.
For analysis of VolMIP sampled simulations (see Sect. 1.2), we compute means not only with all 81 VolMIP ensembles but also with subsets of ensembles grouped according to their initial ENSO and NAO ensembles. For example, we look at the ensemble mean of all ensembles that were sampled with positive ENSO initial conditions (+ENSO) and compare these 27 ensemble members to the 27 sampled ensembles which show neural (0 ENSO) and negative (−ENSO) conditions. We follow this same nomenclature for analysis of differences grouped by initial NAO conditions, and thus when discussing the response of a given group (e.g., −ENSO) we refer to the mean paired anomalous response of that ensemble group unless otherwise noted.
Where applicable, we also test the statistical significance of differences between VolMIP ensemble groups of different ENSO and NAO initial conditions. In these cases, we compare the values from the 27 ensemble members using an analysis of variance (ANOVA) test and report the corresponding p value to represent the statistical difference ensemble groups. For the case of displaying spatial differences in the surface temperature response, we perform a Student's t test between positive and negative NAO ensemble groups, presenting the mean surface temperature response only at model grid cells where the p value from the t test between positive NAO and negative NAO groups is <0.05.
For all ensemble members, we find that radiative forcing impacts and surface temperature impacts are consistent with previous observations and modeled studies of 1991 Pinatubo-sized volcanic eruptions (Schmidt et al., 2018), with ensemble mean forcing peaking at −3.27 W m−2 the December after the eruption. In comparison with other models in VolMIP, we note that GISS E 2.1 does display a faster increase of radiative anomalies (Zanchettin et al., 2022). However, between our different ensemble members, there is a little variation in the evolution of the radiative response to the prescribed volcanic forcing (see Fig. S1 in the Supplement).
Changes in radiative forcing are also accompanied by a reduction in global surface temperature peaking at −0.35 ∘C the first spring after the eruption. Further analysis of surface temperature anomalies both globally and in the tropics are presented in Fig. S2.
4.1 ENSO Response
Figure 2 shows the monthly Niño 3.4 index (filtered to remove the seasonal signal) for positive, negative, and neutral VolMIP ensembles with paired anomalies. Positive, neutral, and negative ENSO ensemble groups all show negative, La Niña-like sea surface temperature anomalies in the first post-eruptive winter. Negative sea surface temperature anomalies, however, are strongest for +ENSO and 0 ENSO conditions with mean peak decreases of −0.61 and −0.67 ∘C, respectively, consistent with changes in tropical surface temperature. In +ENSO ensembles the sea surface temperature relaxes toward mean temperatures from warmer than average conditions. −ENSO ensembles show little variation between control and perturbed simulations, suggesting that a cooler-than-average tropical sea surface temperature will be affected little by volcanic perturbations. The lack of a clear ENSO response for La Niña ensembles is consistent with Predybaylo et al. (2017) where La Niña ensembles showed no significant ENSO anomaly. Unlike results of earlier studies (Pausata et al., 2020; Khodri et al., 2017; Predybaylo et al., 2017), we find no El Niño anomalies in these simulations. Our findings do, however, support the idea that ENSO response is dependent on pre-conditioning or initial conditions in the tropical Pacific (McGregor et al., 2020).
We do not differentiate here between central Pacific and eastern Pacific El Niño events as in Predybaylo et al. (2017). The small inter-ensemble spread for +ENSO simulations, however, suggests that there is little difference between the two in our model representation. We additionally perform an equivalent analysis of the relative sea surface temperature (RSST) Niño 3.4 index as proposed by Khodri et al. (2017) and presented in other studies. The RSST Niño 3.4 anomalies (Fig. S4) also show consistent cooling in the first post-eruptive winter with little difference in the strength of cooling between different initial ENSO conditions. This suggests that in the GISS model the Niño 3.4 region experiences elevated levels of cooling relative to cooling throughout the tropical region. The RSST Niño 3.4 anomalies on average also show a slight warm anomaly in the second post-eruptive year, as noted in Zanchettin et al. (2022) where a subset of these ensembles was analyzed with other VolMIP models.
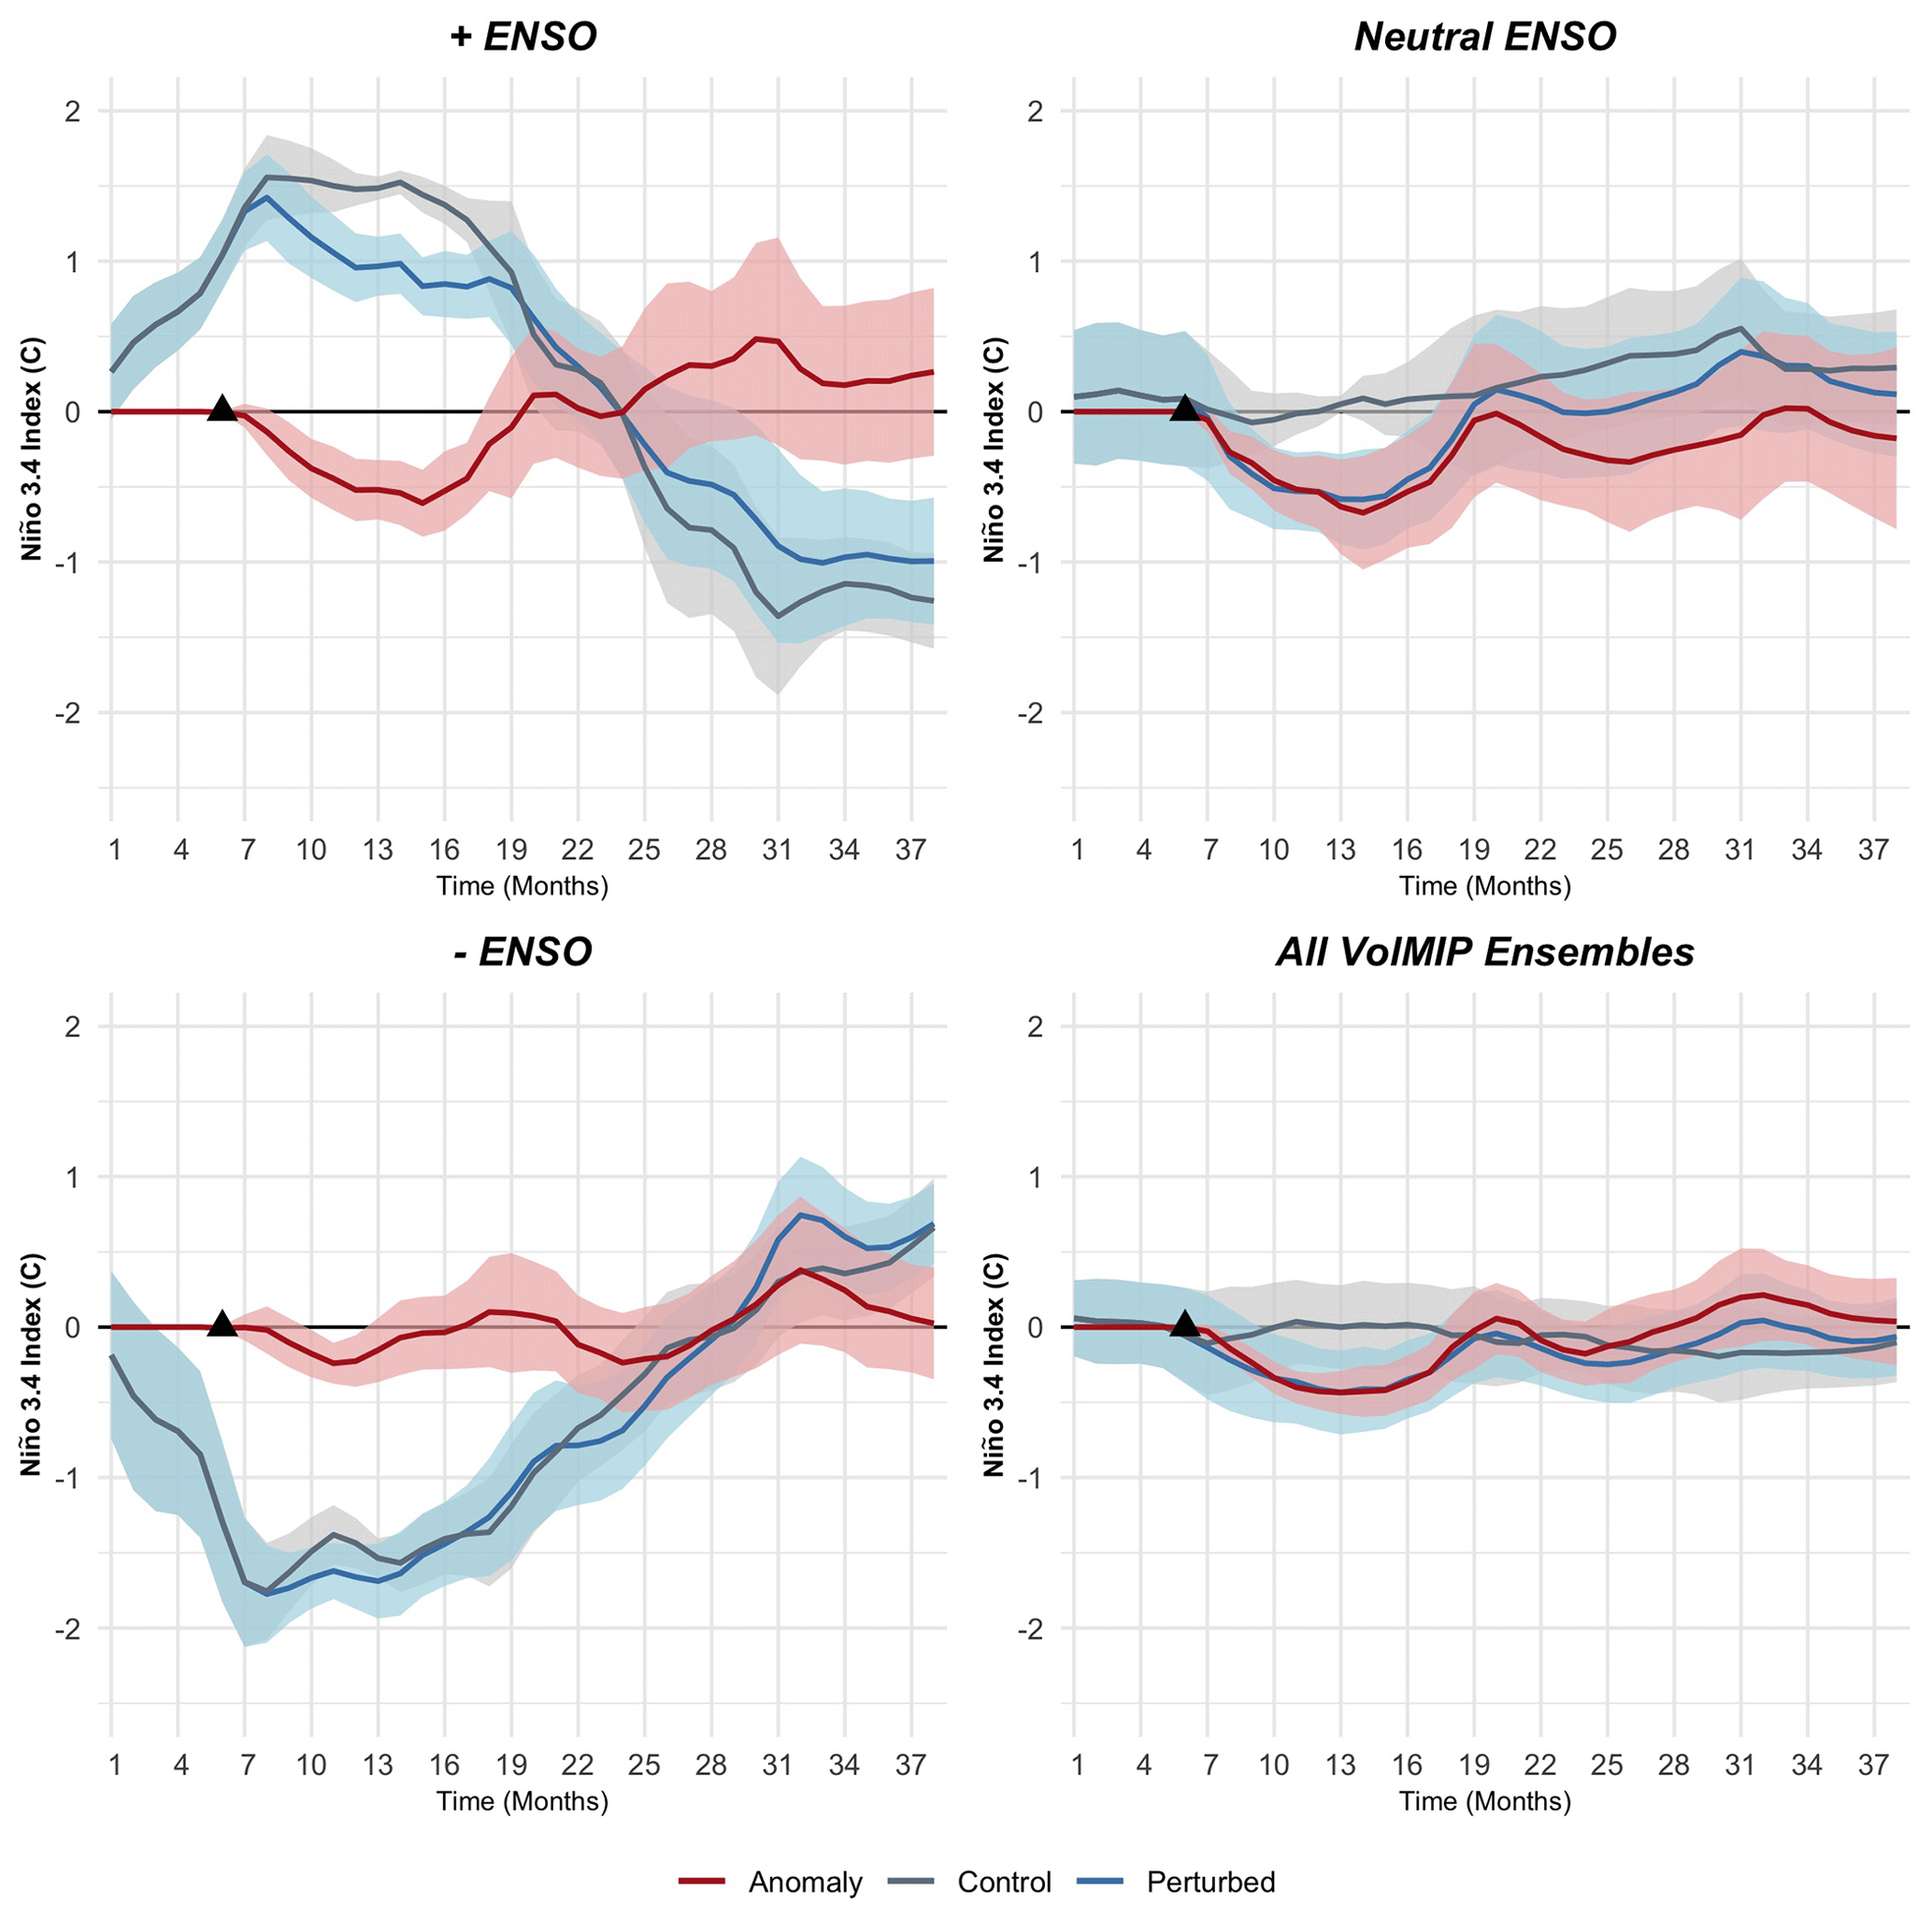
Figure 2Monthly, seasonally de-trended time series of changes in the monthly Niño 3.4 ENSO index under different ENSO initial conditions and for the full VolMIP ensemble. Positive and negative ensembles show a relaxation of the index response toward mean climatological sea surface temperature conditions. Red shading shows the 95% confidence interval for the anomalous response from control conditions.
4.2 Northern Hemisphere response
We now turn to the response in the Northern Hemisphere, which has also been widely discussed between model studies. Specifically, we consider how initial NAO conditions impact the Northern Hemisphere climate response, particularly in the first winter.
4.2.1 NAO response
Figure 3 shows the monthly NAO index (based on 500 mb geopotential height) throughout the 3-year simulation period for positive, neutral, and negative NAO groups. Regardless of the initial condition of the NAO, the NAO relaxes toward mean conditions. For +NAO ensembles, this is shown by a decrease in geopotential height, peaking at 69.7 mb in the February after the eruption. Likewise, −NAO ensembles show increased geopotential height toward mean conditions by an average of 88.5 mb peaking the first February after the eruption. Neutral NAO (0 NAO) ensembles have no statistically significant response, with the confidence interval of these ensembles showing significant variability in mean geopotential height. When looking at groups of specific initial NAO conditions, it is clear that for +NAO and −NAO conditions the geopotential height is relaxed toward mean conditions. When looking at the full 81-member ensemble (Fig. 3), however, there is a tendency toward positive NAO anomalies in the first post-eruption winter in the model as noted by Zanchettin et al. (2022).
These findings suggest that in our simulations, regardless of initial conditions, there is a relaxation of extreme positive or negative NAO conditions otherwise present in control runs. For negative NAO ensemble years, this causes an anomalous strengthening of the pressure dipole between the Azores high and Icelandic low regions when eruptions occur under negative NAO conditions. The opposite is true for +NAO simulations, where the dipole between these two pressure systems appears to weaken in comparison with control conditions the first winter after.
Given this robust change in pressure in the North Atlantic during the first winter, we continue to discuss how these changes are seen through other polar dynamic pathways.
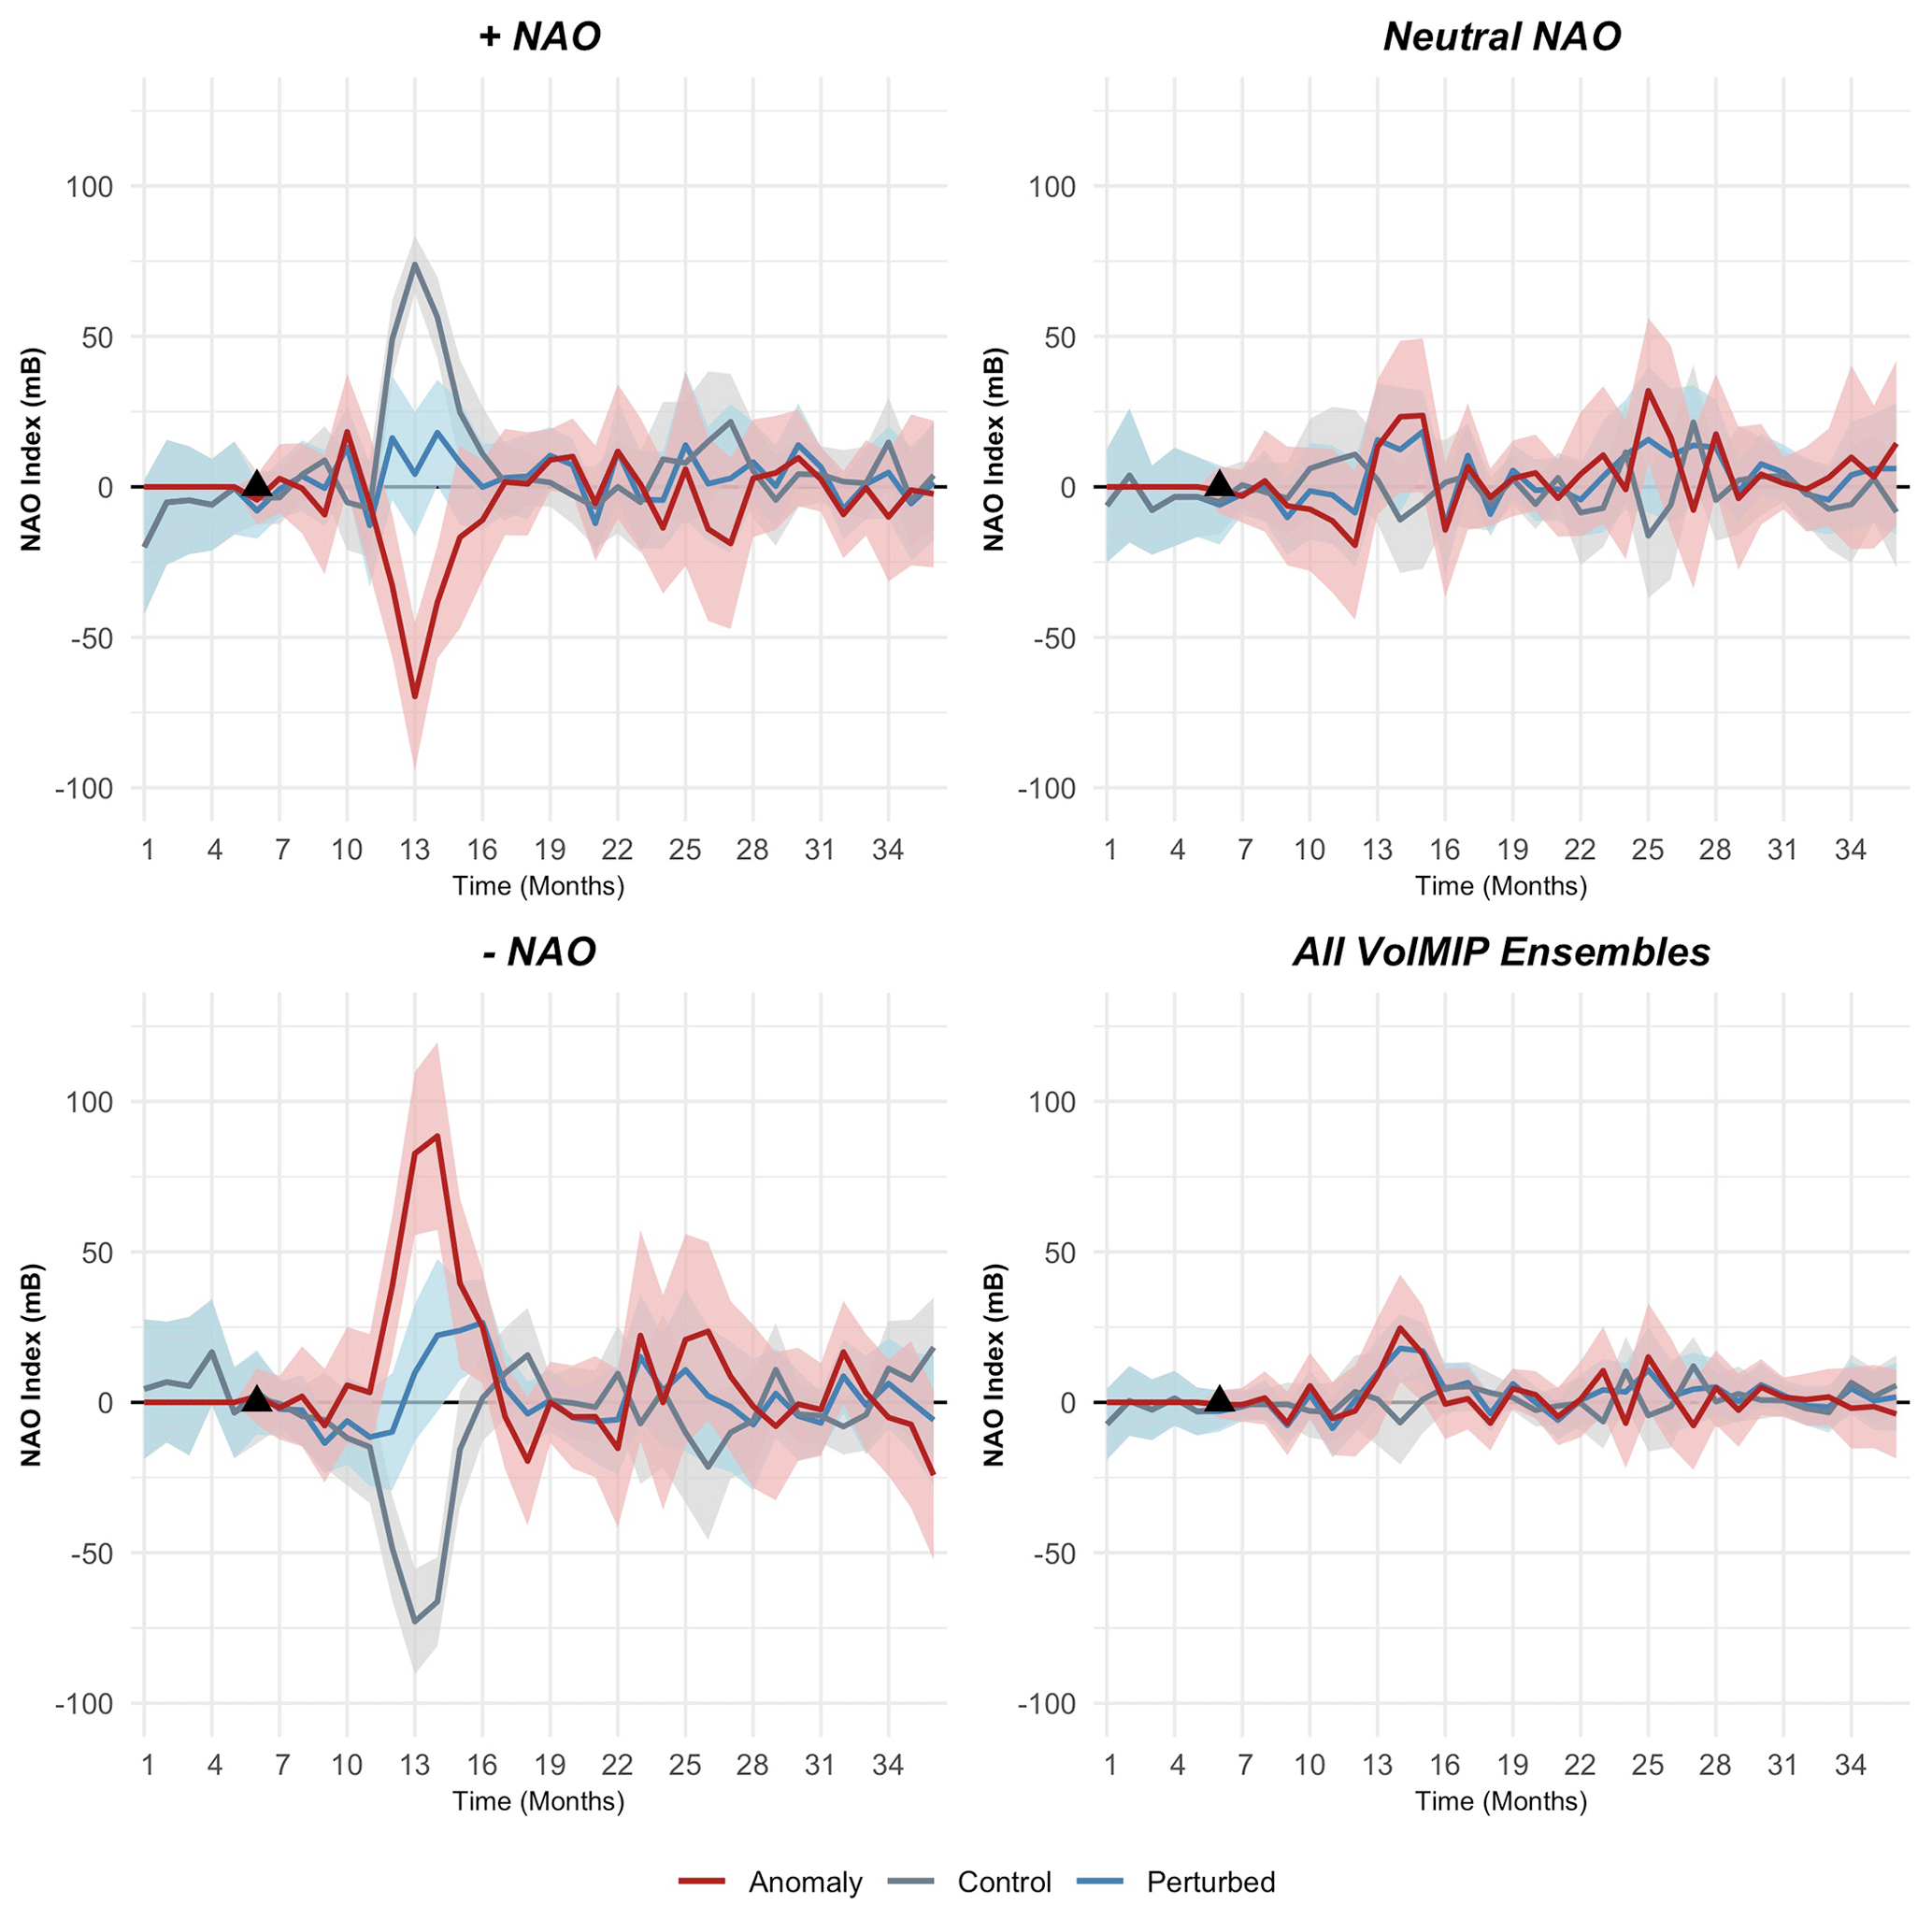
Figure 3Monthly, seasonally de-trended time series of changes in the monthly NAO index under different NAO initial conditions. Red shading shows the 95 % confidence interval for the anomalous response from control conditions. +NAO ensembles show a robust decrease in the NAO index in the first winter (), while negative NAO ensembles show a robust increase.
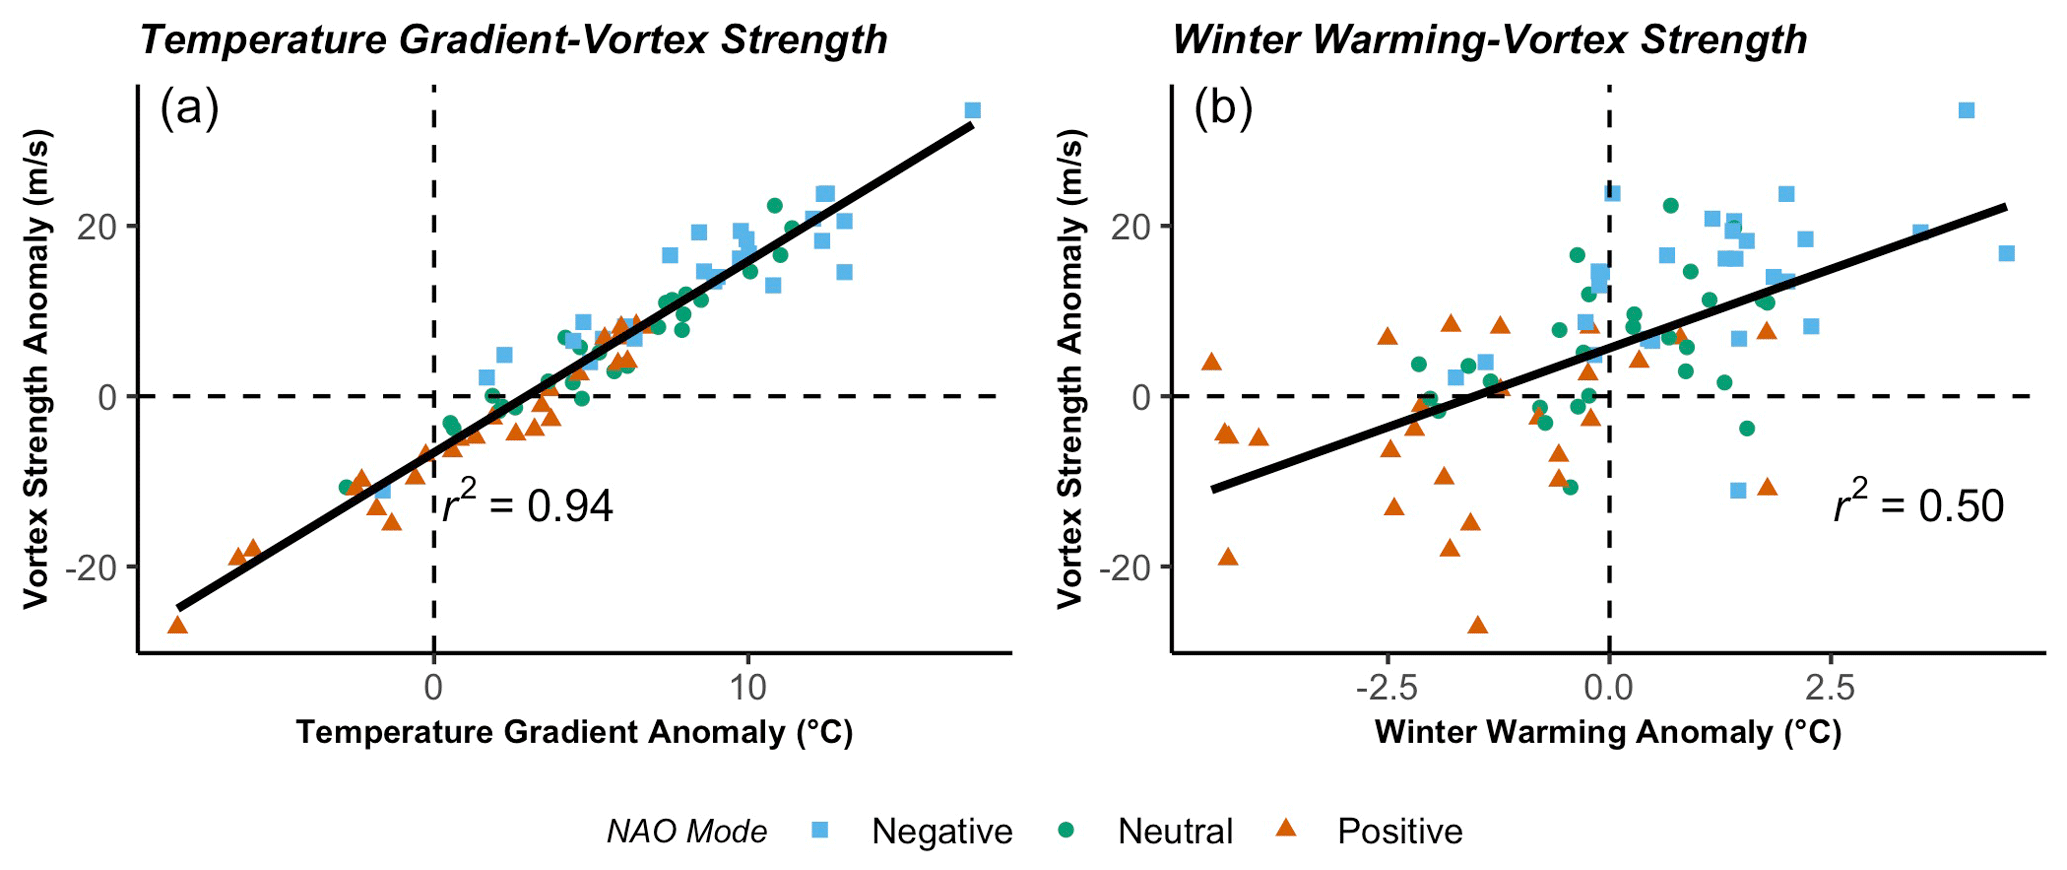
Figure 4Regressions of the (a) Equator-to-pole temperature gradient (temperature at 50 mb at the Equator; temperature at 50 mb at the pole) vs. stratospheric polar vortex strength (u50 at 61∘ N) and (b) winter warming vs. polar vortex strength, all in the first post-eruptive winter. All 81 VolMIP ensemble members are plotted with shape and color corresponding to the initial NAO phase. R2 values are displayed for each regression.
4.2.2 Polar dynamic changes
Modeled changes in the North Atlantic geopotential height dipole (quantified by the NAO index) are accompanied by other changes in zonal winds and atmospheric temperature. Specifically, we find that the polar vortex strength (defined as the zonal mean wind at 10 hPa and 60∘ N as in Polvani et al., 2019) show positive anomalies from control conditions for −NAO ensembles and negative anomalies for +NAO ensembles (Fig. 4). These variations in polar vortex strength between NAO groups are statistically significant with a p value of .
These changes in zonal winds are also accompanied changing patterns in 500 mb geopotential height (∼5.5 km) over the polar region (60–90∘ N). For negative NAO ensembles, geopotential height decreases by an ensemble average of 100 mb (∼15.5 km) in the first winter. There are also moderate increases in geopotential height in the Atlantic basin near the Azores (20–55∘ N, 90∘ W–60∘ E), averaging around 50 mb. These changes in pressure and wind are indicative of strengthening of the polar vortex and a positive phase of the NAM. The opposite occurs for +NAO ensembles, consistent with a decrease in the strength of the polar vortex and a negative phase of the NAM. Mean changes in geopotential height for each NAO group are presented in Fig. S5.
4.2.3 Atmospheric temperature
Analysis of changes in temperature in the lower stratosphere illustrate how volcanic eruptions impact atmospheric temperature under different initial conditions. Specifically, we examine temperature anomalies using the modeled microwave sounding unit temperature metrics in the lower stratosphere (MSU TLS). The MSU temperature metric is commonly used as a remotely sensed temperature data metric based on height; however, here we present an equivalent modeled metric in E2.1 (Miller et al., 2020). Figure 5 shows the anomaly in MSU temperature in the lower stratosphere for the first boreal winter across latitude and time. All ensembles exhibit robust tropical tropospheric warming peaking at 2.5 ∘C, tapering off toward the south pole.
The temperature anomaly north of 60∘ N, however, varies significantly between simulations. +NAO ensembles show an anomalous warming in the stratosphere reaching an average of 2.5∘ at the North Pole. −NAO ensembles show stratospheric cooling anomalies reaching an average of 5.8 ∘C at the North Pole. Neutral NAO ensembles again fall between these extremes falling close to the mean.
For all ensembles, volcanic forcing smooths out meridional temperature gradients in the first winter that are present in control conditions. Thus, −NAO ensemble simulations, which would normally have a weak meridional temperature gradient, increase the high northern latitude gradient in the first winter after the volcanic eruption. The opposite occurs for +NAO ensembles, where higher than average temperature gradients are decreased to mean conditions (Fig. S3).
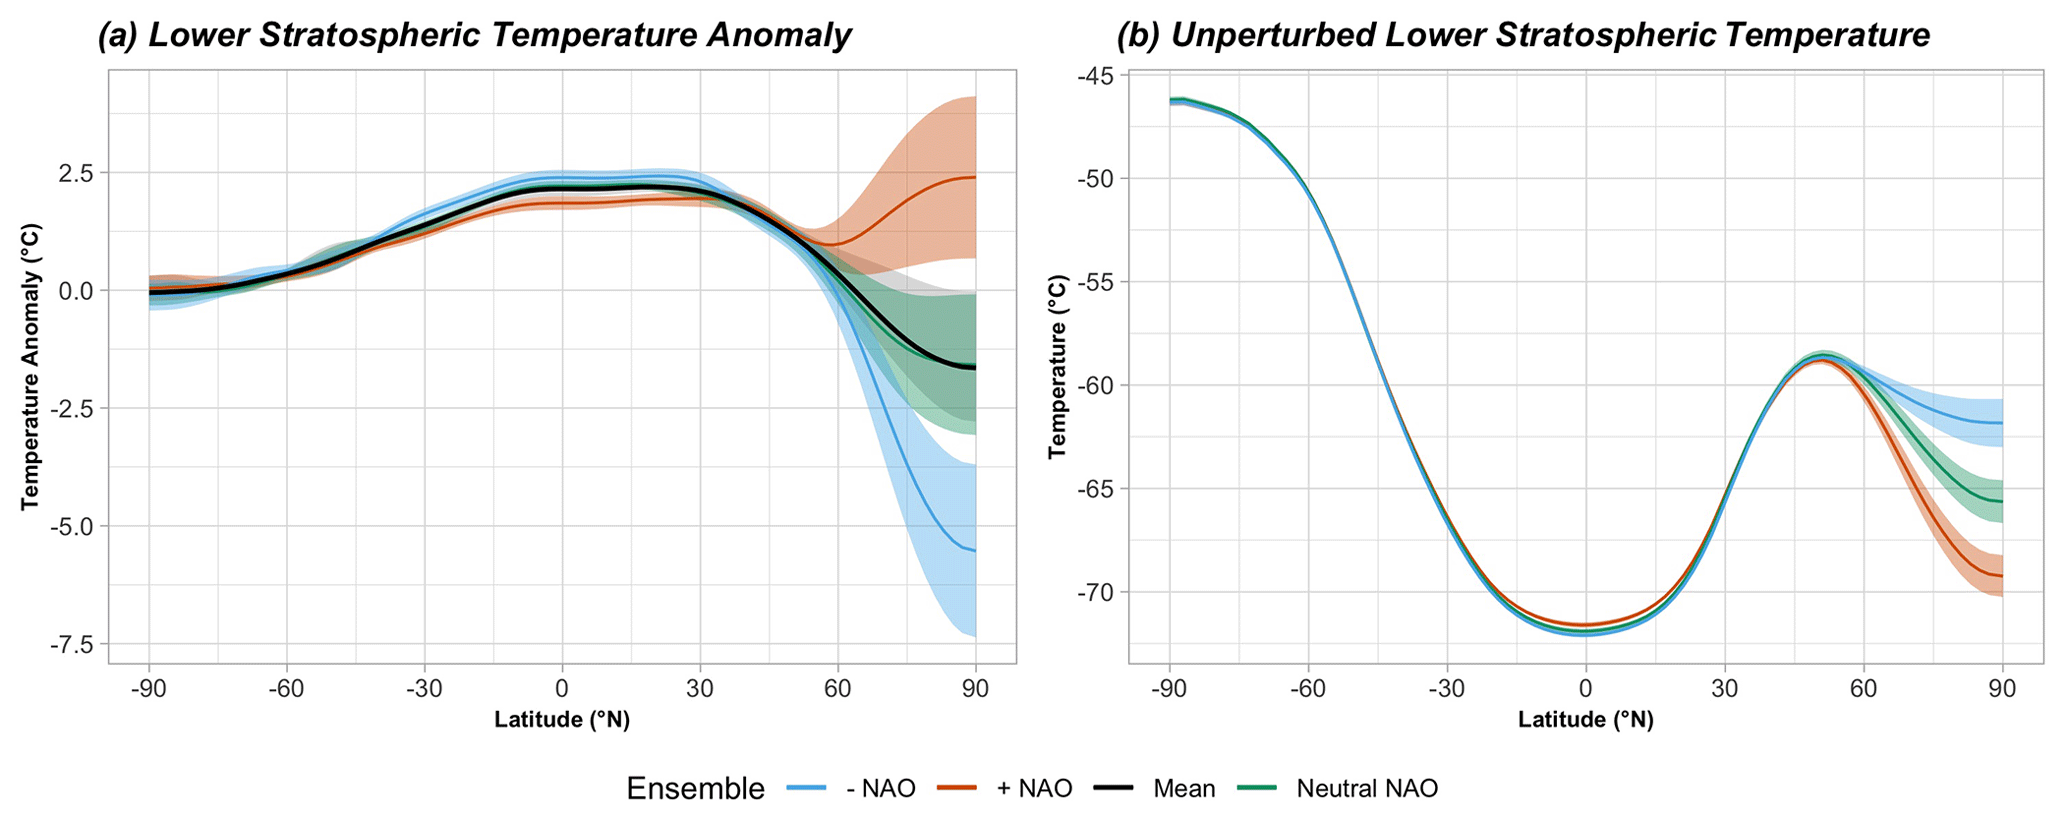
Figure 5Panel (a) shows the change in lower stratospheric temperature and (b) shows the unperturbed lower stratospheric temperature derived from microwave sounding units in the first winter (December–February) after the eruption. Shading denotes the 95 % confidence interval for each ensemble group. Tropical stratospheric warming occurs for all ensembles; however, the high northern latitude response varies greatly between different initial conditions. −NAO ensembles show cooling in the high latitude lower stratosphere while +NAO ensembles show significant warming.
Changes in the polar stratospheric temperature drive the strength of the Equator-to-pole temperature difference. −NAO ensembles drive an increase in the Equator-to-pole temperature difference driven both by warming of the equatorial lower stratosphere and cooling of the high latitude lower stratosphere. +NAO ensembles, on the other hand show little change in the Equator-to-pole temperature difference as both the equatorial and polar lower stratosphere experience warming. Neutral NAO ensembles fall somewhere in the middle with a moderate increase in the Equator-to-pole temperature difference. To further investigate if an enhanced Equator-to-pole temperature difference correlates with an increased polar vortex circulation, we use a simple regression as done by Polvani et al. (2019) with each of our 81 VolMIP ensembles. Figure 4 shows that changes in the Equator-to-pole temperature gradient in the first winter strongly correlates with increased polar vortex strength in the first winter. There is also a correlation between the observed winter warming anomaly and polar vortex strength (R2=0.40) indicating that a strengthening of the polar vortex often corresponds with winter warming. The correlation between vortex strength and winter warming is stronger than in Polvani et al. (2019), which could suggest that larger ensembles are required to find a significant signal but does not suggest that a strengthened polar vortex alone is the cause of observed winter warming. We also note that there is also a significant difference in the Equator-to-pole temperature gradient between NAO groups with a p value of .
4.2.4 Winter warming
Having discussed dynamic changes in the Northern Hemisphere, we now discuss the strength of the winter warming response across different initial conditions. Figure 6 shows the mean surface temperature anomaly in the first boreal winter (December–February) after the eruption for positive, negative, and neutral ensemble groups. Most areas (where shading is gray) do not experience any robust difference between initial NAO phases. Northern Eurasia and Greenland, however, have significantly different responses between conditions. +NAO ensembles experience cooling over Eurasia and warming over Greenland. −NAO ensembles show the opposite, with significant warming over Eurasia and cooling over Greenland. Neutral NAO ensembles show a weak warming signature similar to that of −NAO ensembles. The winter warming signature (measured as a mean of 27 ensembles) is strong only for the −NAO group; however, we note that both +NAO and −NAO ensembles under perturbed conditions have a trend toward the surface temperature displayed during 0 NAO conditions.
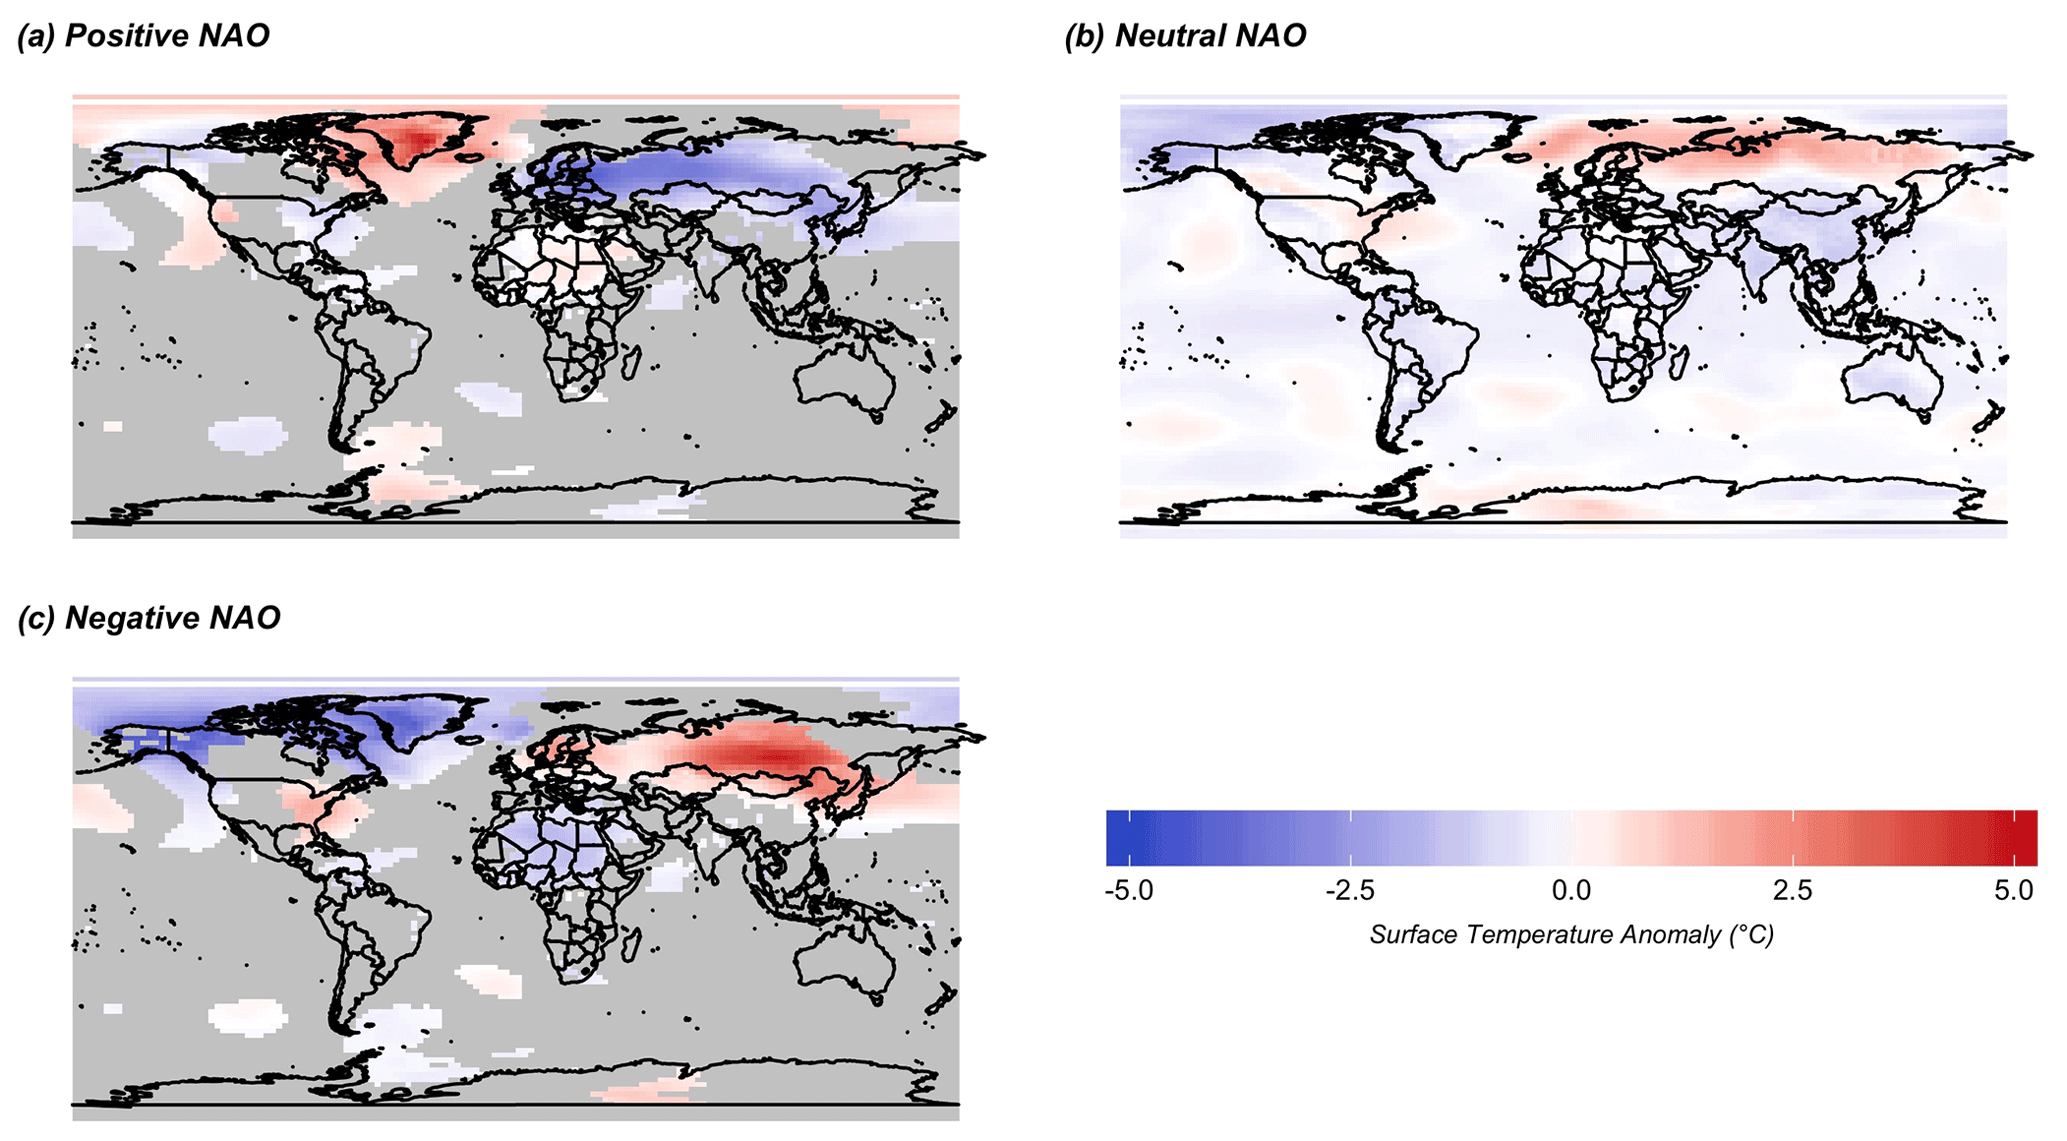
Figure 6Average surface temperature paired anomaly in the first (December–February) winter after the eruption for positive (a), neutral (b), and negative (c) NAO ensembles. Gray areas for positive and negative ensembles denote confidence below 95 % in the difference between positive and negative ensemble groups.
While −NAO ensemble group means show a significant winter warming response, now we look at variation within NAO groups. Figure 7 shows a box plot for the winter warming in Eurasia (40–70∘ N, 0–150∘ W) of simulations grouped by NAO phase, with all VolMIP ensembles, and for the 50 randomly sampled simulations for comparison. We also include anomalies from historical conditions for direct comparison with other studies (Polvani et al., 2019; Driscoll et al., 2012).
When using paired anomalies −NAO ensembles show mean warming over Eurasia, with few ensembles showing a negative anomaly. +NAO ensembles all experience a cooling temperature anomaly in Eurasia. The neutral group of ensembles has a mean around 0∘ of warming but is slightly skewed to a positive temperature anomaly. An ANOVA test shows there is a statistically significant value between paired anomaly ensemble groups with different initial NAO conditions in the VolMIP ensembles with an F statistic value of 22.78 and a p value of . Plotting all VolMIP ensembles together shows a large variation in the temperature response due to including all initial conditions together. The randomly sampled runs have a distribution similar to the neutral NAO ensemble groups, suggesting that extreme initial conditions, such as very negative NAO or positive NAO phases, are less common in the climate system than in our sample.
Climatological anomalies show no significant forced response, contrary to the paired anomalies for +NAO and −NAO groups. This suggests that paired anomalies are influenced by the sampled conditions in the unperturbed control. These sampled states of NAO are evident as paired anomalies show cooler than average conditions for −NAO ensembles and warmer than average conditions for +NAO ensembles. There is, however, no significant difference between the perturbed (with volcanic forcing) and control (with no volcanic forcing) winter warming response for all ensemble members (All VolMIP and Random Samples) or for neutral NAO ensemble members.
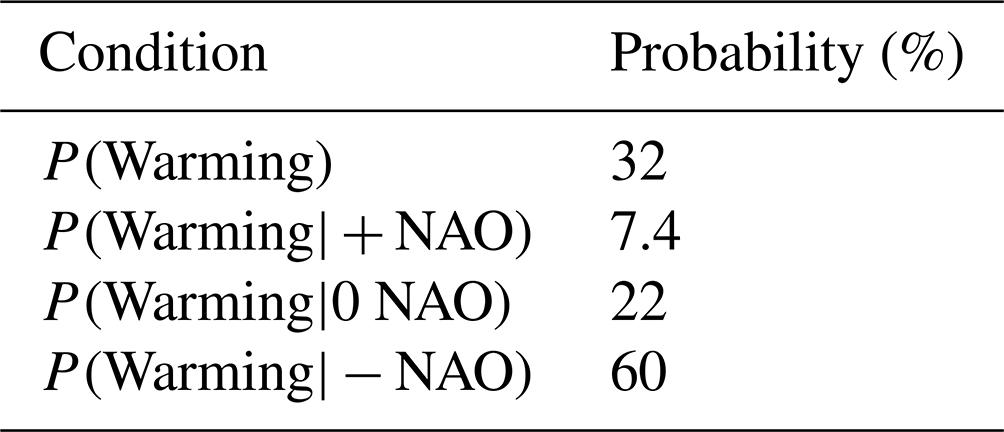
In addition to decreasing variability in the response, ensemble groupings also impact the probability of observing warming in the model (when considering anomalies taken from control conditions). Table 1 shows the probability of simulations showing winter warming (calculated using paired anomalies) for varying initial conditions calculated using the 81 VolMIP runs and the 27-member initial condition groupings. While not all −NAO ensembles show a winter warming response, the probability of observing winter warming increases greatly for negative NAO initial conditions in comparison with neutral and negative conditions when using paired anomalies. The probability for observing a significant winter warming response in any of the 81 VolMIP samples is low (32 %). The probability of warming given −NAO initial conditions, however, is higher (60 %). Thus, while these simulations still show the large variation in surface temperature responses the first winter after the eruption, initial conditions impact how likely a paired anomalous winter warming response is in a large group of ensembles.
Table 1Winter warming probabilities (computed with VolMIP-sampled simulations).
Initial ENSO conditions lead to significant differences in the Niño 3.4 sea surface temperature anomaly through the first boreal winter into the spring after the eruption. The temperature decrease is present in the ensemble mean but strongest for ensembles with positive and neutral ENSO initial conditions. In general, we find no signature of an enhanced El Niño-like anomaly in the first winter, as has been suggested in other studies (Pausata et al., 2020; Khodri et al., 2017; Predybaylo et al., 2017); however, there is a slight warm anomaly following the initial cooling after the eruption.
The response of the Northern Hemisphere varies significantly between ensembles with different initial NAO conditions both in sign and strength of responses. Winter warming anomalies occur with increased probability for ensembles with −NAO initial conditions with 60 % of ensembles showing a warming response in the first winter. This warming response corresponds with an anomalous decrease in polar lower stratospheric temperature in the first winter for −NAO ensembles, causing an increased temperature gradient between the Equator and poles. A simple regression analysis shows that positive temperature gradient anomalies are correlated with an increased strength of the stratospheric polar vortex. −NAO ensembles also exhibit decreased geopotential heights and increased westerly zonal wind circulation that are consistent with this strengthening polar vortex following the eruption. There is a weak correlation between strengthening of the stratospheric polar vortex and the winter warming response in the first winter, although this correlation does not suggest the lack of other response pathways. In general, +NAO ensembles show the opposite anomalous patterns from control conditions and neutral ensembles show some weak warming and vortex strengthening anomalies. Thus, while a −NAO phase does not guarantee winter warming resulting from the Equator-to-pole temperature difference, it does highly increase the probability that winter warming will occur. These polar dynamic changes also coincide with a smoothing of meridional temperature gradients from control conditions. This response could be model dependent or a result of the specific way that the Pinatubo forcing is prescribed in the simulation with non-interactive aerosols.
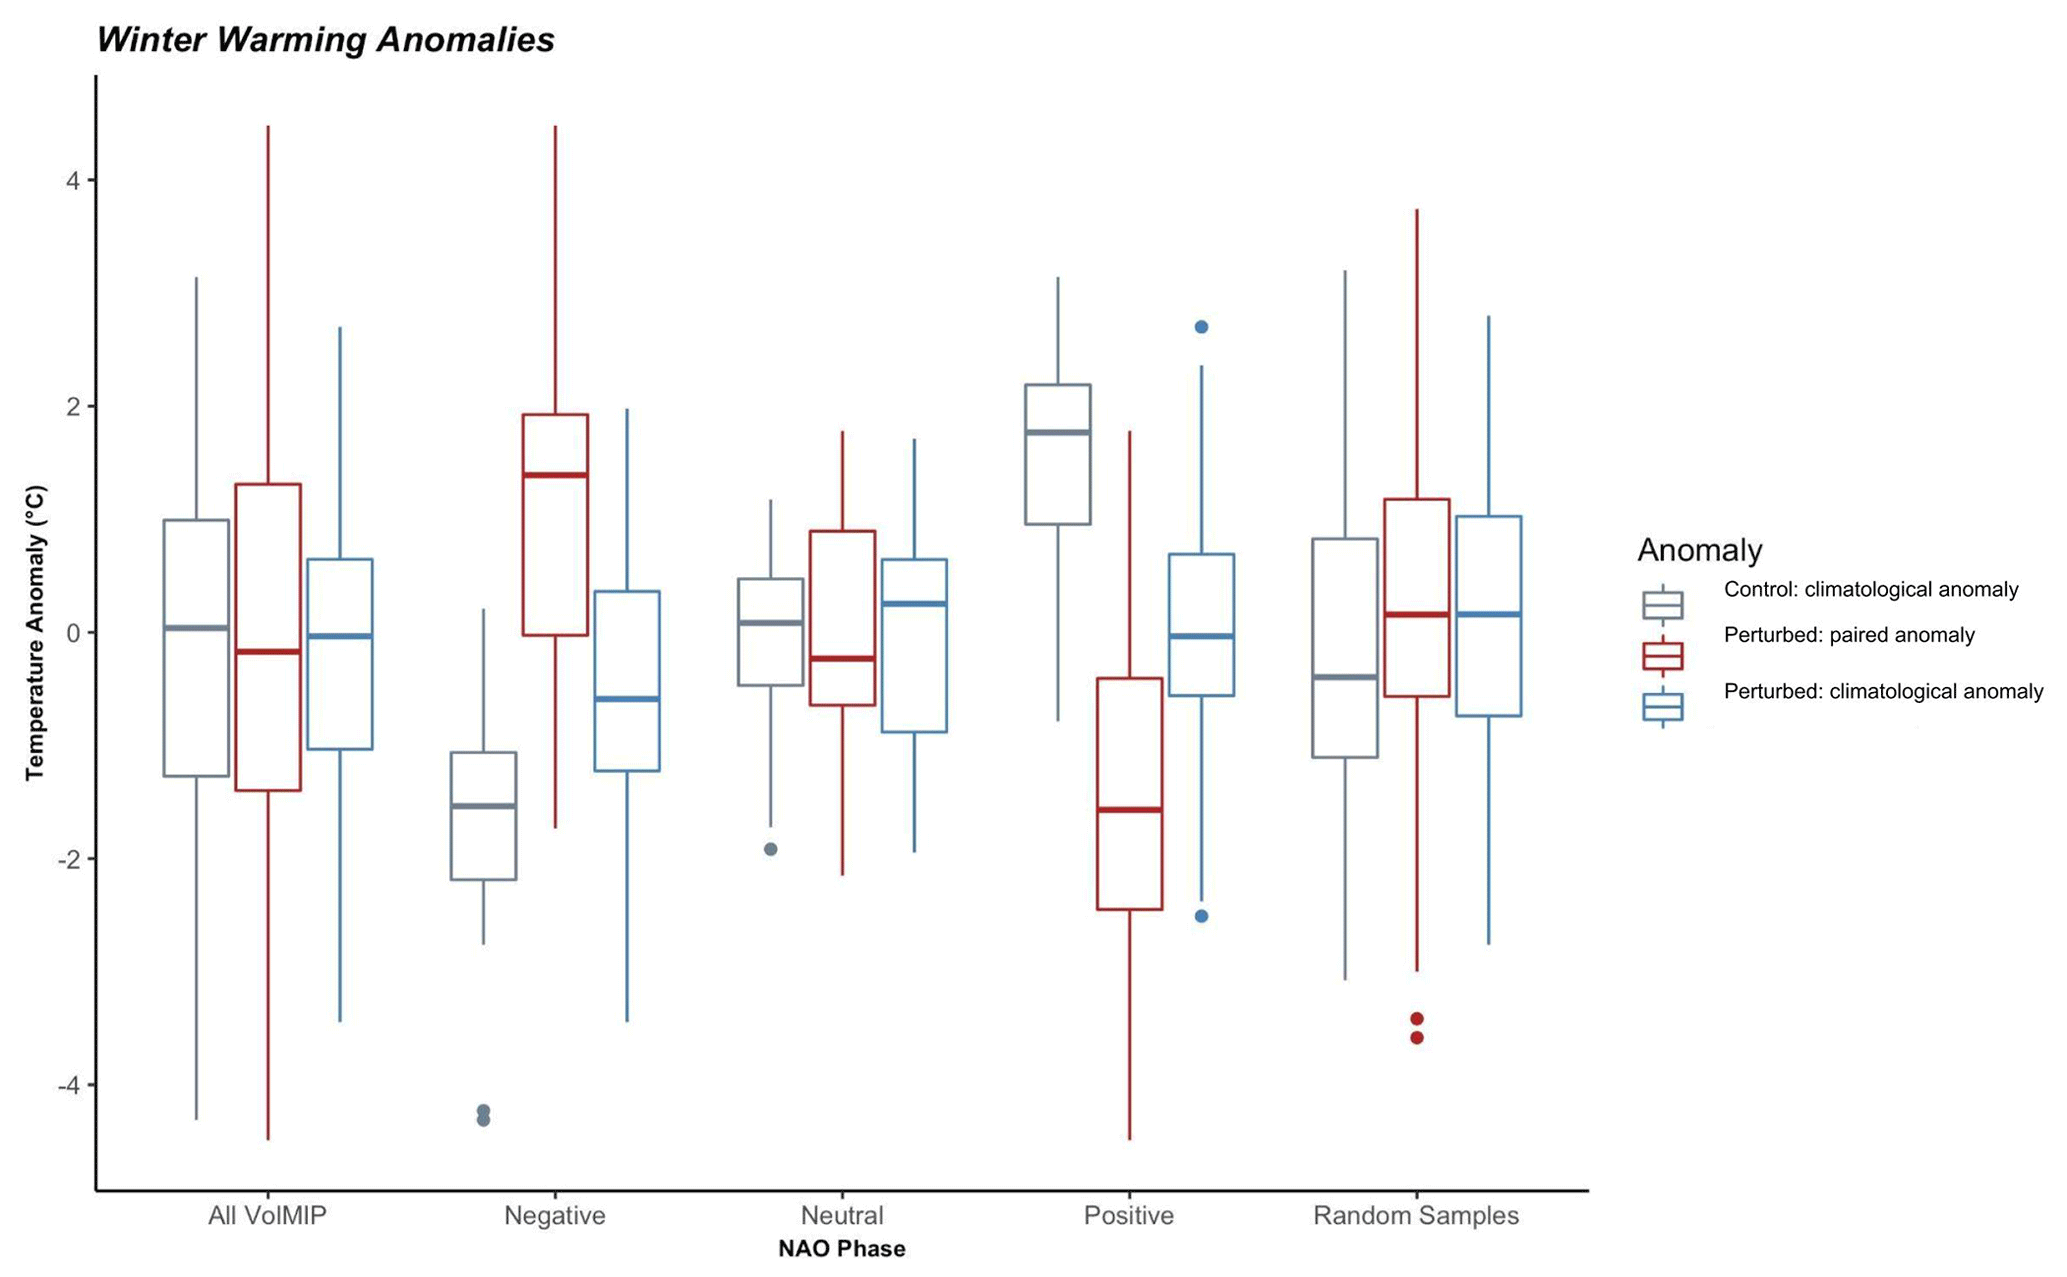
Figure 7Simulated boreal winter (December–February) warming response in Eurasia the first year after the eruption for both control (no volcanic forcing) and perturbed (with volcanic forcing) runs. Control anomalies (gray) are taken from the mean winter surface temperature for the 5 years prior to the eruption. Perturbed anomalies are shown both with anomalies from control conditions (red) and from historical conditions (blue). Box plots are shown for all 81 simulations (All VolMIP), for each initial condition group (Negative, Neutral, and Positive), each with 27 simulations and for all 50 randomly sampled runs.
For all simulations, the monthly NAO index in the first winter relaxes toward mean conditions. This means that for both +NAO and −NAO ensembles, there is a sudden anomalous change in pressure in the North Atlantic after the eruption. Thus, the anomalous strengthening of the polar vortex from control conditions could be due to the sudden relaxation of the NAO anomaly in the first winter relative to initial conditions. The strengthening of the stratospheric polar vortex resulting in winter warming thus only occurs when the model would have otherwise experienced weak vortex circulation in the absence of volcanic forcing. The anomalous response is significantly impacted by these extreme initial conditions that were sampled from our control conditions. To test this impact, we also compare our 27-member ensemble groups to a 50-member randomly sampled ensemble group. The randomly sampled ensemble group shows anomalies most similar to the neutral NAO ensemble group, suggesting that strong anomalies due to extreme NAO initial conditions are less common in a representative sample. While extremely negative phases are most likely to experience winter warming such extremes are less common in the real world, possibly explaining why warming is only sometimes observed in model simulation ensembles. These extremes in initial conditions can contribute significantly to ensemble variation, particularly with a small amount of ensemble members or when ensembles are sampled with a bias in initial conditions.
We tested the impact of using paired anomalies by comparing our analysis with climatological anomalies used in other studies (Polvani et al., 2019; Driscoll et al., 2012). These climatological anomalies, which take reference from mean climate conditions, show no statistically significant forced response for our ensemble members. The difference in responses between anomalies demonstrates how the choice of anomalies can significantly impact the modeled response, particularly when extreme initial conditions are present as initial climate conditions can significantly influence the strength of a given response. For example, when analyzing the winter warming response under varying NAO conditions, ensembles with a strong −NAO condition in the control run relaxed toward mean NAO conditions under perturbed volcanic aerosol runs. Thus, when using paired anomalies the strength of the winter warming response is biased due to lower mean air temperatures in the control simulation. When using historical anomalies, we see no significant warming response for the same perturbed runs, as air temperatures are typical of the historical-mean climate state (neutral NAO conditions). The difference between the modeled responses under paired and historical anomalies was also highlighted by Zanchettin et al. (2022), where the choice of anomaly was shown to impact some ensemble mean responses.
Here simulations have been constrained to examine the climate response with a protocol that eliminates some sources of variability. In particular, VolMIP compliant simulations used here are run with non-interactive (NINT) aerosols and represent pre-industrial conditions. Thus, they cannot be directly compared to Pinatubo simulations which have industrial greenhouse gases and other constituents in the atmosphere. These runs also do not account for changes in ozone concentration observed after eruptions which may also influence changes in stratospheric circulation (Stenchikov et al., 2002). The NINT atmospheric representation also dictates that aerosols evolve exactly as prescribed, making aerosols insensitive to states of the stratosphere and troposphere. Other runs with interactive aerosols are necessary to understand if the dynamics of these responses are dependent on the specific prescription of volcanic aerosols.
Furthermore, the current GISS model E2.1 does not have a realistic representation of some key atmospheric components such as the quasi-biennial oscillation (QBO) (Rind et al., 2020) that could also play a role in the observed circulation responses (Stenchikov et al., 2004). Changes in the QBO could also influence the strength of the polar vortex circulation as easterly phases (such as those during the Pinatubo eruption) are likely to cause a decrease in the stratospheric polar circulation (Holton and Tan, 1980). Here we have used the GISS E2.1-G CMIP6 compliant runs; however, in a future study, we hope to examine this response in the new GISS model E2.2+ which has a higher vertical resolution and a better representation of the QBO.
Overall, we find that initial ENSO conditions have a small effect on surface temperature and ENSO response as a cooling, La Niña-like, anomaly in the tropical Pacific occurs for each ensemble in the first post-eruptive winter. The initial state of the NAO, on the other hand, varies the anomalous response by relaxing initial conditions in the first winter to a neutral NAO phase. If a volcanic eruption occurs during a normally −NAO phase, these changes in turn increase the probability of observing a winter warming response from control conditions in the first post-eruptive winter. For extremes in initial NAO conditions, changes in the Northern Hemisphere are the most robust. While often these extremes are uncommon, they likely contribute to inter-ensemble variation and thus uncertainty in predicting the climate's response to volcanic eruptions. When the forced winter warming is defined as the average of a large ensemble (including all initial conditions), however, the response is insignificant (mean with an ensemble spread around zero). The prevalence and strength of this anomaly is influenced both by extremes in initial conditions and how anomalies are taken (either paired or climatological anomalies).
This study highlights the takeaway from Zanchettin et al. (2022) that initial conditions have a significant impact on post-eruptive anomalies. Specifically, our expanded 81-member ensemble shows that in GISS E2.1-G, there is a statistically significant difference in how the Northern Hemisphere responds to volcanic forcing under different initial conditions of NAO when using paired anomalies. This implies that for future studies using small ensembles, responses such as winter warming may be significantly impacted by extremes in initial NAO conditions, and climatological anomalies should also be explored to show robustness in modeled responses.
The climate response to large, Pinatubo-type volcanic eruptions is variable between models and has been discussed here in relation to GISS model E2.1-G. We focus on two responses which have been studied both with observational and modeling studies: the ENSO response and Northern Hemisphere response in the first winter. A total of 121 ensembles were run in the GISS E2.1-G model to examine how initial ENSO and NAO conditions impact the modeled climate response. Our experimental setup uses a pre-industrial model with prescribed aerosols and took anomalies from an equivalent control period run rather than an historical climate period, allowing us to filter out initial climate variability and look only at the response due to volcanic sulfate aerosols. We find that ensembles with different initial NAO conditions have significantly different anomalous climate responses in the first Northern Hemisphere winter. In particular, years which would be in +NAO or −NAO conditions are relaxed to mean NAO conditions under volcanic forcing. This creates an anomalous negative and positive winter warming response for +NAO and −NAO ensembles, respectively. Ensembles with different initial ENSO conditions, however, show similar anomalies between different initial phases. Thus, inter-ensemble variation caused by initial conditions is significant particularly when looking at the first Northern Hemisphere winter response.
All standard data from the pre-industrial control (piControl) simulations discussed here are publicly available in the CMIP6 archive through multiple nodes of the Earth System Grid Federation. Corresponding volcanic simulations used in this paper were submitted to the Volcanic Model Intercomparison Project of CMIP6 under the GISS “volc-pinatubo-full” experiment submission and will become publicly available as part of the CMIP6 archive by the time of this article's publication. Scripts use for post-processing and analysis of model runs are located in the NASA Center for Climate Simulation online repository under weierbach_et_al_2023 at https://portal.nccs.nasa.gov/datashare/giss-publish/pub/paleoclimate/weierbach_et_al_2023/ (Weierbach, 2023).
The supplement related to this article is available online at: https://doi.org/10.5194/acp-23-15491-2023-supplement.
Conceptualization and methodology were done by ANL and KT. Model runs were performed by KT. Software was developed by ANL, KT, and HW. Analysis and visualization of model runs were performed by HW. HW wrote the manuscript draft. ANL, HW, and KT reviewed and edited the manuscript.
The contact author has declared that none of the authors has any competing interests.
Publisher’s note: Copernicus Publications remains neutral with regard to jurisdictional claims made in the text, published maps, institutional affiliations, or any other geographical representation in this paper. While Copernicus Publications makes every effort to include appropriate place names, the final responsibility lies with the authors.
This article is part of the special issue “The Model Intercomparison Project on the climatic response to Volcanic forcing (VolMIP) (ESD/GMD/ACP/CP inter-journal SI)”. It does not belong to a conference.
The authors thank the reviewers and editor of this manuscript for their insights in improving the manuscript during the review process.
Helen Weierbach was supported under the NSF REU Grant number OCE 17-57602 as part of the 2019 Lamont-Doherty Earth Observatory Summer REU program. The NASA High-End Computing Program provides computations resources through the NASA Center for Climate Simulation at Goddard Space Flight Center. The development of GISS ModelE at NASA GISS is supported by the NASA Modeling, Analysis, and Prediction (MAP) Program.
This paper was edited by Farahnaz Khosrawi and reviewed by Shih-Wei Fang and one anonymous referee.
Adams, J. B., Mann, M. E., and Ammann, C. M.: Proxy evidence for an El Nino-like response to volcanic forcing, Nature, 426, 274–278, 2003. a
Allan, R., Lindesay, J., and Parker, D.: El Niño southern oscillation & climatic variability, CSIRO publishing, IBSN 9780643058033, 1996. a
Bittner, M., Timmreck, C., Schmidt, H., Toohey, M., and Krüger, K.: The impact of wave-mean flow interaction on the Northern Hemisphere polar vortex after tropical volcanic eruptions, J. Geophys. Res.-Atmos., 121, 5281–5297, 2016. a
Bluth, G. J., Doiron, S. D., Schnetzler, C. C., Krueger, A. J., and Walter, L. S.: Global tracking of the SO2 clouds from the June, 1991 Mount Pinatubo eruptions, Geophys. Res. Lett., 19, 151–154, 1992. a
Christiansen, B.: Volcanic eruptions, large-scale modes in the Northern Hemisphere, and the El Niño–Southern Oscillation, J. Climate, 21, 910–922, 2008. a
Clement, A. C., Seager, R., Cane, M. A., and Zebiak, S. E.: An ocean dynamical thermostat, J. Climate, 9, 2190–2196, 1996. a
Cohen, J. and Barlow, M.: The NAO, the AO, and global warming: How closely related?, J. Climate, 18, 4498–4513, 2005. a
Coupe, J. and Robock, A.: The influence of stratospheric soot and sulfate aerosols on the Northern Hemisphere wintertime atmospheric circulation, J. Geophys. Res.-Atmos., 126, e2020JD034513, https://doi.org/10.1029/2020JD034513, 2021. a
Coupe, J., Stevenson, S., Lovenduski, N. S., Rohr, T., Harrison, C. S., Robock, A., Olivarez, H., Bardeen, C. G., and Toon, O. B.: Nuclear Niño response observed in simulations of nuclear war scenarios, Commun. Earth Environ., 2, https://doi.org/10.1038/s43247-020-00088-1, 2021. a
Dee, S. G., Cobb, K. M., Emile-Geay, J., Ault, T. R., Edwards, R. L., Cheng, H., and Charles, C. D.: No consistent ENSO response to volcanic forcing over the last millennium, Science, 367, 1477–1481, 2020. a, b
Driscoll, S., Bozzo, A., Gray, L. J., Robock, A., and Stenchikov, G.: Coupled Model Intercomparison Project 5 (CMIP5) simulations of climate following volcanic eruptions, J. Geophys. Res.-Atmos., 117, https://doi.org/10.1029/2012JD017607, 2012. a, b, c, d, e
Eyring, V., Bony, S., Meehl, G. A., Senior, C. A., Stevens, B., Stouffer, R. J., and Taylor, K. E.: Overview of the Coupled Model Intercomparison Project Phase 6 (CMIP6) experimental design and organization, Geosci. Model Dev., 9, 1937–1958, https://doi.org/10.5194/gmd-9-1937-2016, 2016. a
Graf, H.-F., Li, Q., and Giorgetta, M. A.: Volcanic effects on climate: revisiting the mechanisms, Atmos. Chem. Phys., 7, 4503–4511, https://doi.org/10.5194/acp-7-4503-2007, 2007. a
Graft, H., Kirchner, I., Robock, A., and Schult, I.: Pinatubo eruption winter climate effects: Model versus observations, Clim. Dynam., 9, 81–93, 1993. a
Holton, J. R. and Tan, H.-C.: The influence of the equatorial quasi-biennial oscillation on the global circulation at 50 mb, J. Atmos. Sci., 37, 2200–2208, 1980. a
Hurrell, J. W., Kushnir, Y., Ottersen, G., and Visbeck, M.: An overview of the North Atlantic oscillation, Geophys. Monogr.-Am. Geophys. Un., 134, 1–36, 2003. a
Kelley, M., Schmidt, G. A., Nazarenko, L. S., Bauer, S. E., Ruedy, R., Russell, G. L., Ackerman, A. S., Aleinov, I., Bauer, M., Bleck, R., et al.: GISS-E2. 1: Configurations and climatology, J. Adv. Model. Earth Sy., 12, e2019MS002025, https://doi.org/10.1029/2019MS002025, 2020. a, b, c
Kelly, P. M., Jones, P. D., and Pengqun, J.: The spatial response of the climate system to explosive volcanic eruptions, Int. J. Climatol., 16, 537–550, 1996. a
Khodri, M., Izumo, T., Vialard, J., Janicot, S., Cassou, C., Lengaigne, M., Mignot, J., Gastineau, G., Guilyardi, E., Lebas, N., et al.: Tropical explosive volcanic eruptions can trigger El Niño by cooling tropical Africa, Nat. Commun., 8, 1–13, 2017. a, b, c, d, e
Lacis, A.: Volcanic aerosol radiative properties, PAGES Newsletter, 23, 50–51, 2015. a, b
LeGrande, A. N. and Anchukaitis, K. J.: Volcanic eruptions and climate, PAGES Magazine, 23, 46–47, 2015. a
LeGrande, A. N., Tsigaridis, K., and Bauer, S. E.: Role of atmospheric chemistry in the climate impacts of stratospheric volcanic injections, Nat. Geosci., 9, 652–655, 2016. a
McCormick, M. P., Thomason, L. W., and Trepte, C. R.: Atmospheric effects of the Mt Pinatubo eruption, Nature, 373, 399–404, 1995. a
McGregor, S., Khodri, M., Maher, N., Ohba, M., Pausata, F. S., and Stevenson, S.: The Effect of Strong Volcanic Eruptions on ENSO, El Niño Southern Oscillation in a Changing Climate, 267–287, ISBN 9781119548164, 2020. a
Miller, R. L., Schmidt, G. A., Nazarenko, L., Bauer, S. E., Kelley, M., Ruedy, R., Russell, G. L., Ackerman, A., Aleinov, I., Bauer, M., et al.: CMIP6 Historical Simulations (1850–2014) with GISS-E2. 1, J. Adv. Model. Earth Sy., 13, e2019MS002034, https://doi.org/10.1029/2019MS002034, 2020. a
Minnis, P., Harrison, E. F., Stowe, L. L., Gibson, G., Denn, F. M., Doelling, D., and Smith, W.: Radiative climate forcing by the Mount Pinatubo eruption, Science, 259, 1411–1415, 1993. a
Myhre, G., Shindell, D., Bréon, F.-M., Collins, W., Fuglestvedt, J., Huang, J., Koch, D., Lamarque, J.-F., Lee, D., Mendoza, B., Nakajima, T., Robock, A., Stephens, G., Takemura, T., and Zhang, H.: Anthropogenic and Natural Radiative Forcing, Climate Change 2013 – The Physical Science Basis Chapter 8, 659–740, https://doi.org/10.1017/CBO9781107415324.018, 2013. a
Orbe, C., Van Roekel, L., Adames, Á. F., Dezfuli, A., Fasullo, J., Gleckler, P. J., Lee, J., Li, W., Nazarenko, L., Schmidt, G. A., et al.: Representation of Modes of Variability in 6 US Climate Models, J. Climate, 33, https://doi.org/10.1175/JCLI-D-19-0956, 2020. a
Pausata, F. S., Grini, A., Caballero, R., Hannachi, A., and Seland, Ø.: High-latitude volcanic eruptions in the Norwegian Earth System Model: The effect of different initial conditions and of the ensemble size, Tellus B, 67, 26728, https://doi.org/10.3402/tellusb.v67.26728, 2015. a
Pausata, F. S., Zanchettin, D., Karamperidou, C., Caballero, R., and Battisti, D. S.: ITCZ shift and extratropical teleconnections drive ENSO response to volcanic eruptions, Sci. Adv., 6, eaaz5006, https://doi.org/10.1126/sciadv.aaz5006, 2020. a, b, c
Philander, S. G. H.: El Nino southern oscillation phenomena, Nature, 302, 295–301, 1983. a
Polvani, L. M., Banerjee, A., and Schmidt, A.: Northern Hemisphere continental winter warming following the 1991 Mt. Pinatubo eruption: reconciling models and observations, Atmos. Chem. Phys., 19, 6351–6366, https://doi.org/10.5194/acp-19-6351-2019, 2019. a, b, c, d, e, f, g, h
Predybaylo, E., Stenchikov, G. L., Wittenberg, A. T., and Zeng, F.: Impacts of a Pinatubo-size volcanic eruption on ENSO, J. Geophys. Res.-Atmos., 122, 925–947, 2017. a, b, c, d, e, f, g, h
Rind, D., Orbe, C., Jonas, J., Nazarenko, L., Zhou, T., Kelley, M., Lacis, A., Shindell, D., Faluvegi, G., Romanou, A., et al.: GISS Model E2. 2: A Climate Model Optimized for the Middle Atmosphere—Model Structure, Climatology, Variability, and Climate Sensitivity, J. Geophys. Res.-Atmos., 125, e2019JD032 204, 2020. a
Robock, A.: Volcanic eruptions and climate, Reviews of geophysics, 38, 191–219, 2000. a
Robock, A. and Mao, J.: Winter warming from large volcanic eruptions, Geophys. Res. Lett., 19, 2405–2408, 1992. a
Robock, A. and Mao, J.: The volcanic signal in surface temperature observations, J. Climate, 8, 1086–1103, 1995. a, b
Russell, G. L., Miller, J. R., and Rind, D.: A coupled atmosphere-ocean model for transient climate change studies, Atmos. Ocean, 33, 683–730, 1995. a
Schmidt, A., Mills, M. J., Ghan, S., Gregory, J. M., Allan, R. P., Andrews, T., Bardeen, C. G., Conley, A., Forster, P. M., Gettelman, A., et al.: Volcanic radiative forcing from 1979 to 2015, J. Geophys. Res.-Atmos., 123, 12491–12508, 2018. a
Schmidt, G. A., Kelley, M., Nazarenko, L., Ruedy, R., Russell, G. L., Aleinov, I., Bauer, M., Bauer, S. E., Bhat, M. K., Bleck, R., et al.: Configuration and assessment of the GISS ModelE2 contributions to the CMIP5 archive, J. Adv. Model. Earth Sy., 6, 141–184, 2014. a
Stenchikov, G., Kirchner, I., Robock, A., Graf, H.-F., Antuña, J. C., Grainger, R. G., Lambert, A., and Thomason, L.: Radiative forcing from the 1991 Mount Pinatubo volcanic eruption, J. Geophys. Res.-Atmos., 103, 13837–13857, 1998. a, b
Stenchikov, G., Robock, A., Ramaswamy, V., Schwarzkopf, M. D., Hamilton, K., and Ramachandran, S.: Arctic Oscillation response to the 1991 Mount Pinatubo eruption: Effects of volcanic aerosols and ozone depletion, J. Geophys. Res.-Atmos., 107, https://doi.org/10.1029/2002JD002090, 2002. a, b, c
Stenchikov, G., Hamilton, K., Robock, A., Ramaswamy, V., and Schwarzkopf, M. D.: Arctic oscillation response to the 1991 Pinatubo eruption in the SKYHI general circulation model with a realistic quasi-biennial oscillation, J. Geophys. Res.-Atmos., 109, https://doi.org/10.1029/2003JD003699, 2004. a
Stenchikov, G., Hamilton, K., Stouffer, R. J., Robock, A., Ramaswamy, V., Santer, B., and Graf, H.-F.: Arctic Oscillation response to volcanic eruptions in the IPCC AR4 climate models, J. Geophys. Res.- Atmospheres, 111, 2006. a, b
Stephenson, D., Pavan, V., Collins, M., Junge, M., Quadrelli, R., et al.: North Atlantic Oscillation response to transient greenhouse gas forcing and the impact on European winter climate: a CMIP2 multi-model assessment, Clim. Dynam., 27, 401–420, 2006. a
Thomason, L. W., Ernest, N., Millán, L., Rieger, L., Bourassa, A., Vernier, J.-P., Manney, G., Luo, B., Arfeuille, F., and Peter, T.: A global space-based stratospheric aerosol climatology: 1979–2016, Earth Syst. Sci. Data, 10, 469–492, https://doi.org/10.5194/essd-10-469-2018, 2018. a
Timmermann, A., An, S.-I., Kug, J.-S., Jin, F.-F., Cai, W., Capotondi, A., Cobb, K. M., Lengaigne, M., McPhaden, M. J., Stuecker, M. F., et al.: El Niño–southern oscillation complexity, Nature, 559, 535–545, 2018. a
Timmreck, C.: Modeling the climatic effects of large explosive volcanic eruptions, Wiley Interdisciplinary Reviews: Climate Change, 3, 545–564, 2012. a
Timmreck, C., Graf, H.-F., Lorenz, S. J., Niemeier, U., Zanchettin, D., Matei, D., Jungclaus, J. H., and Crowley, T. J.: Aerosol size confines climate response to volcanic super-eruptions, Geophys. Res. Lett., 37, https://doi.org/10.1029/2010GL045464, 2010. a
Timmreck, C., Pohlmann, H., Illing, S., and Kadow, C.: The impact of stratospheric volcanic aerosol on decadal-scale climate predictions, Geophys. Res. Lett., 43, 834–842, 2016. a
Toohey, M., Krüger, K., Bittner, M., Timmreck, C., and Schmidt, H.: The impact of volcanic aerosol on the Northern Hemisphere stratospheric polar vortex: mechanisms and sensitivity to forcing structure, Atmos. Chem. Phys., 14, 13063–13079, https://doi.org/10.5194/acp-14-13063-2014, 2014. a
Wanner, H., Brönnimann, S., Casty, C., Gyalistras, D., Luterbacher, J., Schmutz, C., Stephenson, D. B., and Xoplaki, E.: North Atlantic Oscillation–concepts and studies, Surv. Geophys., 22, 321–381, 2001. a
Weierbach, H.: The impact of ENSO and NAO initial conditions and anomalies on the modeled response to Pinatubo-sized forcing NASA Center for Climate Simulation [code], https://portal.nccs.nasa.gov/datashare/giss-publish/pub/paleoclimate/weierbach_et_al_2023/ (last access: 8 December 2023), 2023. a
Zambri, B. and Robock, A.: Winter warming and summer monsoon reduction after volcanic eruptions in Coupled Model Intercomparison Project 5 (CMIP5) simulations, Geophys. Res. Lett., 43, 10–920, 2016. a, b
Zambri, B., LeGrande, A. N., Robock, A., and Slawinska, J.: Northern Hemisphere winter warming and summer monsoon reduction after volcanic eruptions over the last millennium, J. Geophys. Res.-Atmos., 122, 7971–7989, 2017. a
Zambri, B., Robock, A., Mills, M. J., and Schmidt, A.: Modeling the 1783–1784 Laki eruption in Iceland: 2. Climate impacts, J. Geophys. Res.-Atmos., 124, 6770–6790, 2019. a, b
Zanchettin, D., Bothe, O., Graf, H. F., Lorenz, S. J., Luterbacher, J., Timmreck, C., and Jungclaus, J. H.: Background conditions influence the decadal climate response to strong volcanic eruptions, J. Geophys. Res.-Atmos., 118, 4090–4106, 2013. a, b, c
Zanchettin, D., Khodri, M., Timmreck, C., Toohey, M., Schmidt, A., Gerber, E. P., Hegerl, G., Robock, A., Pausata, F. S. R., Ball, W. T., Bauer, S. E., Bekki, S., Dhomse, S. S., LeGrande, A. N., Mann, G. W., Marshall, L., Mills, M., Marchand, M., Niemeier, U., Poulain, V., Rozanov, E., Rubino, A., Stenke, A., Tsigaridis, K., and Tummon, F.: The Model Intercomparison Project on the climatic response to Volcanic forcing (VolMIP): experimental design and forcing input data for CMIP6, Geosci. Model Dev., 9, 2701–2719, https://doi.org/10.5194/gmd-9-2701-2016, 2016. a, b, c, d, e, f
Zanchettin, D., Timmreck, C., Khodri, M., Schmidt, A., Toohey, M., Abe, M., Bekki, S., Cole, J., Fang, S.-W., Feng, W., Hegerl, G., Johnson, B., Lebas, N., LeGrande, A. N., Mann, G. W., Marshall, L., Rieger, L., Robock, A., Rubinetti, S., Tsigaridis, K., and Weierbach, H.: Effects of forcing differences and initial conditions on inter-model agreement in the VolMIP volc-pinatubo-full experiment, Geosci. Model Dev., 15, 2265–2292, https://doi.org/10.5194/gmd-15-2265-2022, 2022. a, b, c, d, e, f, g, h
- Abstract
- Introduction
- Relevant volcanic climate responses
- Model description and experimental setup
- Results
- Summary and discussion
- Conclusions
- Data availability
- Author contributions
- Competing interests
- Disclaimer
- Special issue statement
- Acknowledgements
- Financial support
- Review statement
- References
- Supplement