the Creative Commons Attribution 4.0 License.
the Creative Commons Attribution 4.0 License.
 | 18 Dec 2023
HONO chemistry at a suburban site during the EXPLORE-YRD campaign in 2018: formation mechanisms and impacts on O3 production
Xuefei Ma
Wanyi Qiu
Shule Li
Xinping Yang
Chaoyang Xue
Tianyu Zhai
Yuhan Liu
Xuan Li
Yang Li
Haichao Wang
Zhaofeng Tan
Xiaorui Chen
Huabin Dong
Limin Zeng
Yuanhang Zhang
HONO is an important precursor for OH radicals that impact secondary-pollutant production. However, there are still large uncertainties about different HONO sources which hinder accurate predictions of HONO concentration and hence atmospheric oxidation capacity. Here HONO was measured during the EXPLORE-YRD campaign (EXPeriment on the eLucidation of the atmospheric Oxidation capacity and aerosol foRmation and their Effects in the Yangtze River Delta), along with other important parameters, enabling us to comprehensively investigate HONO variation characteristics and evaluate the relative importance of different HONO sources by using a box model. HONO showed significant variations, ranging from several tens of parts per thousand to 4.4 ppb. The average diurnal pattern of HONO NOx showed a maximum of 0.17 around noon and resembled that of j(O1D), indicating the existence of photo-induced sources. Modeling simulations with only the default HONO source (OH + NO) largely underestimated HONO concentrations, with the modeled-averaged noontime HONO concentration an order of magnitude lower than the observed concentration. The calculated strength of the unknown HONO source (Punknown) showed a nearly symmetrical diurnal profile with a maximum of 2.5 ppb h−1 around noon. The correlation analysis and sensitivity tests showed that the photo-induced NO2 conversion on the ground was able to explain Punknown. Additional HONO sources incorporated into the box model improved the model's performance in simulating HONO concentrations. The revised box model reproduced the nighttime HONO concentration well but still underestimated the daytime HONO concentration. Further sensitivity tests indicated the underestimation of daytime HONO was not due to uncertainties of photo-induced NO2 uptake coefficients on the ground or aerosol surfaces or the enhancement factor of nitrate photolysis but was more likely due to other sources that were not considered in the model. Among the incorporated HONO sources and the default gas-phase source, photo-induced NO2 conversion on the ground dominated the modeled HONO production during the daytime, accounting for 71 % of the total, followed by NO + OH, NO2 hydrolysis on the ground surface, vehicle emissions, photo-induced NO2 conversion on the aerosol surface, nitrate photolysis and NO2 hydrolysis on the aerosol surface. NO2 hydrolysis on the ground surface was the major source of nighttime HONO, contributing 55 % of total HONO production. HONO photolysis contributed 43 % of ROx production during the daytime, followed by O3 photolysis (17 %), HCHO photolysis (14 %), ozonolysis of alkenes (12 %) and carbonyl photolysis (10 %). With observed HONO as a model constraint, the average peak of net ozone production rate increased by 88 % to 12.6 ppb h−1 compared to that without observed HONO as a model constraint, indicating HONO evidently enhanced O3 production and hence aggravated O3 pollution in summer seasons. Our study emphasized the importance of heterogeneous NO2 conversion on the ground surface in HONO production and accurate parameterization of HONO sources in predicting secondary-pollutant production.
- Article
(3241 KB) - Full-text XML
-
Supplement
(557 KB) - BibTeX
- EndNote


OH radicals are the primary oxidant in the atmosphere, accelerating the degradation of gas-phase pollutants and regulating the lifetime of trace gases. OH oxidation will lead to secondary-pollutant formation like secondary organic aerosol (SOA) and O3, which both have adverse impacts on air quality. HONO is one of the most important precursors of OH radicals by photolysis (Reaction R1), especially in polluted areas, contributing up to 92 % of primary OH production (Alicke et al., 2003; Kleffmann et al., 2005; Elshorbany et al., 2009; Hou et al., 2016; Xue et al., 2020; Tan et al., 2017). Previous studies reported that HONO was a vital OH precursor not only in the early morning but also throughout the day (Neftel et al., 1996; Ren et al., 2003, 2006; Michoud et al., 2012). Therefore, HONO is closely linked to atmospheric oxidation capacity, and the accurate representation of HONO sources in models is important for air quality predictions and control strategy development.
However, HONO sources are still controversially discussed due to the complexity of their formation mechanisms. Till now, several HONO sources, including gas-phase reactions, direct emissions, heterogeneous reactions on various surfaces and acid displacement reactions, have been proposed. The gas-phase HONO source mainly comes from the reaction between OH and NO (Reaction R2). This source is too small to explain high HONO levels frequently observed at different sites in the world (Lee et al., 2016; Michoud et al., 2014; Liu et al., 2019b; Kleffmann et al., 2003), indicating other sources still exist. Large unknown HONO sources were reported at different sites, for instance, 3 ppb h−1 in Tai'an (Xue et al., 2022), 2.58 ppb h−1 in Beijing (Spataro et al., 2013), 0.7 ppb h−1 in Paris (Michoud et al., 2014) and 1.77 ppb h−1 in Santiago (Elshorbany et al., 2009). The strength of the unknown source was 1 order of magnitude higher than the HONO production rate by the OH + NO reaction. Other gas-phase sources, like the reaction between excited NO2 and water molecules (Li et al., 2008) and the photolysis of nitro-phenols (Bejan et al., 2006), have also been proposed. However, the two gas-phase sources were verified to be of minor importance to HONO production under atmospherically relevant conditions (Yang et al., 2021a; Sorgel et al., 2011). Direct emissions include emissions from combustion sources and fertilized soil by biological processes. HONO could be directly released from vehicle exhaust and is often characterized by the HONO NOx ratio, which is typically less than 2 % of NOx emissions (Kurtenbach et al., 2001; Xu et al., 2015; Kramer et al., 2020). Hence, HONO emissions by vehicles were considered to play a minor role in HONO formation, especially in rural and remote areas. Biomass-burning episodes like wildfire also contributed to HONO emissions on a global scale (Nie et al., 2015; Cui et al., 2021). HONO emitted by wildfires was estimated to account for two-thirds of OH production in fresh wildfire plumes, which accelerated the age of plumes and O3 production (Theys et al., 2020). In addition, microbe-produced nitrite from fertilized soil can produce HONO (Su et al., 2011; Oswald et al., 2013; Weber et al., 2015; Scharko et al., 2015; Wang et al., 2021). Recent field studies revealed HONO and concurrent O3 and H2O2 enhancements after fertilization events in the North China Plain, implying the significant impact of soil-emitted HONO on regional atmospheric oxidation capacity (Xue et al., 2021).
Heterogeneous processes are believed to be important for HONO production. Heterogeneous NO2 conversion on humid surfaces (Reaction R3) has long been identified as an important source of nighttime HONO, with two NO2 molecules converting to one HONO molecule (Finlayson-Pitts et al., 2003; Stutz et al., 2004). However, Reaction (R3) could not explain HONO levels during the daytime. Field measurements revealed that the unknown HONO source was positively correlated with j(NO2), indicating a photo-induced process (Vogel et al., 2003; Lee et al., 2016). Photo-induced NO2 conversion on humic acid was proposed to explain daytime HONO (Reaction R4) (Stemmler et al., 2006, 2007). This source was found to be important to sustain high daytime HONO levels (Wong et al., 2013; Zhang et al., 2016; Xue et al., 2022). In addition, adsorbed nitrate and HNO3 photolysis on various surfaces was found to be enhanced compared to gas-phase HNO3 and also contributed to HONO formation (Zhou et al., 2011; Ye et al., 2016, 2017; Bao et al., 2018; Baergen and Donaldson, 2013). However, the importance of heterogeneous adsorbed nitrate and HNO3 photolysis on HONO production (Reactions R5–R6) is highly uncertain, with the enhancement factor (EF) for nitrate photolysis relative to gas-phase nitric acid spanning 3 orders of magnitude from 1 to 1000 (Ye et al., 2017; Bao et al., 2018; Laufs and Kleffmann, 2016; Romer et al., 2018; Shi et al., 2021). HONO deposition during the nighttime and subsequent desorption from the soil by strong acid displacement during the daytime were proposed to be a HONO source (Vandenboer et al., 2015). Although various sources have been proposed, there are still large uncertainties about many mechanisms and the relative importance of each mechanism in different environments.
O3 pollution is serious in China in the summer and becomes a major air quality issue. The observed ozone-increasing rates from 2013–2017 were 3.11, 2.29, 0.56 and 1.63 ppb yr−1 in Beijing–Tianjin–Hebei (BTH), the Yangtze River Delta (YRD), the Pearl River Delta (PRD) and the Sichuan Basin (SCB), respectively, the four megacity clusters in China (Li et al., 2019a). O3 is produced by complex photochemical chain reactions between volatile organic compounds (VOCs) and NOx in the presence of sunlight. Now the control strategy for O3 pollution mainly focuses on the reduction of VOCs and NOx, which mainly depend on the O3 formation regimes. HONO photolysis is one of the major sources of primary ROx radicals, which initiate the photochemical reactions leading to O3 formation. More and more field studies and modeling studies found that high HONO levels in China aggravated O3 pollution. For instance, the incorporation of proposed HONO sources improved the predictions of O3 by the WRF-Chem model and increased O3 concentrations by 6 %–12 % compared with cases without HONO sources (Zhang et al., 2016). Fu et al. (2019) found that newly added HONO sources increased nitrate concentrations by 17 µg m−3 and O3 by 24 ppb during a winter pollution episode in the PRD of China. Furthermore, missing representations of HONO sources in box models or chemical transport models would affect the judgment of O3 formation regimes and lead to ineffective O3 mitigation strategies (Li et al., 2018c; Liu et al., 2023b). Therefore, an accurate understanding of HONO formation mechanisms is important for the refinement of the O3 pollution control policy.
YRD is one of the most populated and polluted areas in the world. Recently, this area has witnessed an evident increase in O3 levels, with O3 pollution days more than doubling (28 to 76 d) from 2014 to 2017 (Liu et al., 2020). A large number of studies were carried out that mainly focused on the study of O3 pollution characteristics and determination of O3 sensitivity to VOCs and NOx (Ding et al., 2013; Xing et al., 2017; Wang et al., 2019), while research on HONO formation mechanisms and their effects on the ROx (OH, HO2, RO2 radicals) budget and O3 production was still limited. The EXPLORE-YRD campaign (EXPeriment on the eLucidation of the atmospheric Oxidation capacity and aerosol foRmation and their Effects in the Yangtze River Delta) was carried out with the aim of exploring the atmospheric oxidation capacity in the area and developing an effective co-control strategy for both O3 and particulate matter. As mentioned above, HONO chemistry is closely linked to atmospheric oxidation capacity and, therefore, should be comprehensively studied. In this study, HONO was measured along with other gas-phase (including OH, HO2, VOCs, NOx), aerosol-phase and meteorological parameters during the EXPLORE-YRD campaign in China, providing us with a detailed evaluation of HONO chemistry by employing an observation-based box model. We first investigate the HONO variation characteristics and the strength of the unknown source. Then correlation analysis and sensitivity tests were performed to investigate preliminarily the relative importance of different HONO sources. Then we incorporate proposed HONO sources into the box model to investigate if these sources could explain observed HONO concentration. The comparison of modeled and measured HONO provides unique information for understanding different HONO formation mechanisms and exploring their respective contributions to HONO production. Based on modeling results, the contribution of HONO photolysis to primary ROx production was calculated. In addition, the O3 formation rates calculated with and without HONO sources were also compared to investigate the effects of HONO on O3 production.
2.1 Site description
The EXPLORE-YRD campaign was performed from 14 May to 20 June 2018 at a suburban site (32.56∘ N, 119.99∘ E) in the YRD region, one of the most polluted areas in China. The measurement site is located in the park of the meteorological radar station in the city of Taizhou, which is situated 200 km northwest of the city of Shanghai (Fig. S1 in the Supplement). This location was remote from industrial centers, bordered by farmlands and fishponds, and occasionally affected by biomass-burning events. Winds from the east and southeast prevailed during the measurement periods, indicating this site is influenced by anthropogenic pollution from the YRD region. All the instruments were placed in five containers, and the sampling inlet was about 5 m above the ground.
2.2 HONO measurement
HONO was measured by a commercial HONO monitor (LOPAP, QUMA), which was based on a wet chemical technique. A detailed description of the instrument has been introduced in previous studies (Heland et al., 2001; Xue et al., 2020). Briefly, HONO was sampled by stripping solution (sulfanilamide plus HCl) in a stripping coil. Then the sampled solution reacted with a n-(1-naphthyl)ethylenediamine-dihydrochloride solution, yielding azo dye, which was detected by an optical absorption spectrometer at 550 nm. In order to minimize the effect of interfering species, two stripping coils in series were employed. In the first coil, nearly all HONO and a small fraction of interfering species were sampled. In the second coil, assuming the same number of interfering species was sampled, the difference in signals between the two coils represents the true HONO concentration in the atmosphere. Zero calibration was performed every day. The detection limit and uncertainty of the instrument were 5 ppt and 10 %, respectively.
2.3 Other measurements
A comprehensive set of gas-phase and aerosol-phase parameters has been measured in the campaign, and detailed information on parameters and instruments is listed in Table S1 in the Supplement. Here we will make a brief introduction. O3, CO, SO2 and PM2.5 were measured by Model 49i, Model 48i, Model 43i and Model 1400A from Thermo Inc, respectively. NOx was measured by a trace-level analyzer (Model 42i), which was equipped with a home-built photolytic converter for the true NO2 measurement to avoid interference from other NOy species like peroxyacetyl nitrate (PAN), HONO and organic nitrate. As NO2 was an important precursor of HONO, the true NO2 measurement was used in this study to better understand HONO formation mechanisms. VOCs were measured by an online gas chromatograph equipped with a flame ionization detector and mass spectrometer. HCHO was measured by the Hantzsch fluorescence technique. OH and HO2 radicals were measured by the PKU-LIF (Peking University Laser Induced Fluorescence) system, and detailed information about PKU-LIF equipment can be found in our previous studies (Lu et al., 2013; Tan et al., 2017; Ma et al., 2022). Photolysis frequencies were calculated using spectroradiometer-measured integrated actinic flux. RH, temperature, pressure, wind speed and wind direction were simultaneously measured by a portable weather station (MAWS301, Vaisala, Finland). The aerosol surface area (Sa) was derived from data measured by a scanning mobility particle sizer instrument (SMPS; TSI 3936) and an aerosol particle sizer instrument (APS; TSI 3321). Aerosol-phase water-soluble ions were measured by a gas and aerosol collector (GAC)-equipped ion chromatography instrument.
2.4 Observation-based box model
HONO concentration was simulated by a box model based on the RACM2-LIM1 mechanism. The model was constrained with measurements of NO, NO2, O3, CO, H2O, C2-C12 VOCs, HCHO, OH radicals, temperature and pressure with a time resolution of 5 min. Measured HONO was only constrained when trying to explore the contribution of HONO to primary ROx budget and O3 production rate. In other cases, HONO was not constrained in model simulations. In addition, j(O1D), j(HONO), j(H2O2), j(NO2) and j(HCHO) were also constrained to the model. CH4 and H2 were assumed to be 1900 and 550 ppb, respectively. In RACM2-LIM1, based on the reactivities with OH, different VOCs were assigned to different lumped species rather than treated individually. A first-order dilution loss term with a lifetime of 8 h was assigned to all species to represent deposition and advection loss. The modeled PAN and observed PAN matched well (Fig. S2), and the ratio of modeled-to-observed PAN concentration was 1.09 if this dilution term was incorporated. Detailed information on the box model can be found in our previous studies focusing on simulating OH and HO2 radicals (Tan et al., 2017, 2018; Ma et al., 2019).
2.5 Ozone production rate calculation
The total ozone production rate (F(O3)) was directly determined by the reactions between NO and peroxy radicals (Eq. 1). Due to a lack of measurements of different peroxy radical species, model-calculated peroxy radical concentrations were used in Eq. (1). O3 was mainly consumed by photolysis and reactions with alkenes, OH and HO2. In addition, the reaction between OH and NO2 forms HNO3, which constitutes a portion of the O3 loss. NO3 radicals, formed by the reaction between NO2 and O3, could subsequently form N2O5 or organic nitrate formation, contributing to O3 loss. The loss rate of O3 can be described in Eq. (2). Therefore, the net ozone production rate P(O3) can be obtained by calculating the difference between F(O3) and D(O3) (Eq. 3).
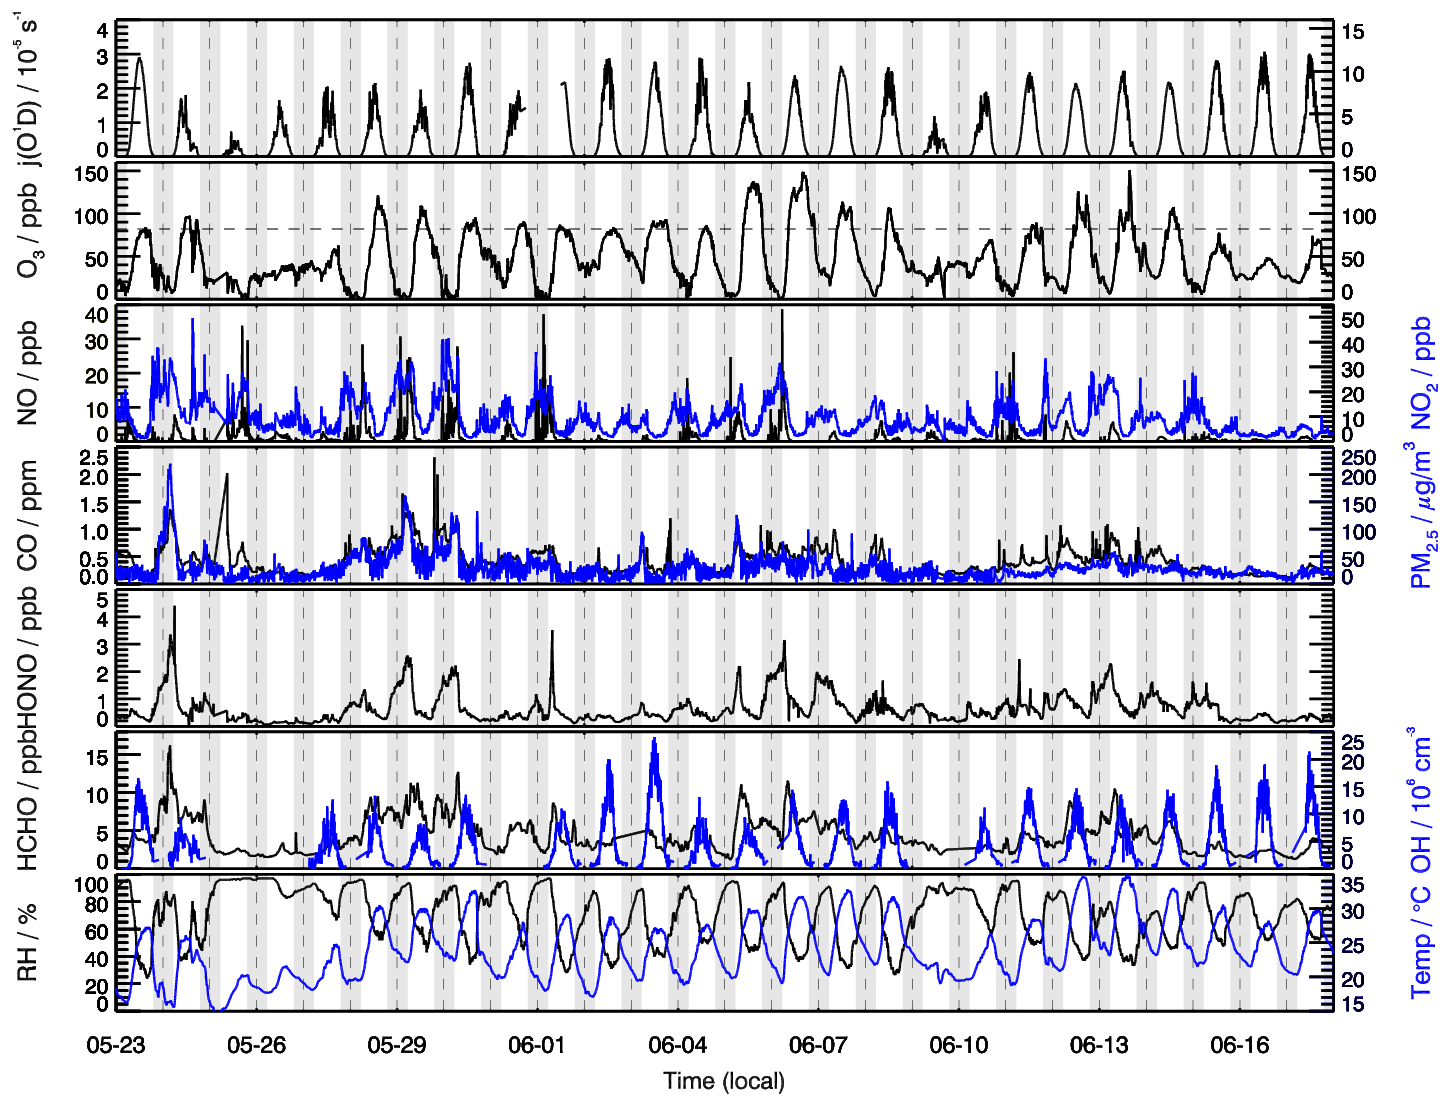
Figure 1Time series of HONO, O3, CO, PM2.5, OH, HCHO, NOx, relative humidity (RH), temperature and j(O1D) during the EXPLORE-YRD campaign.
3.1 Overview of the measurements
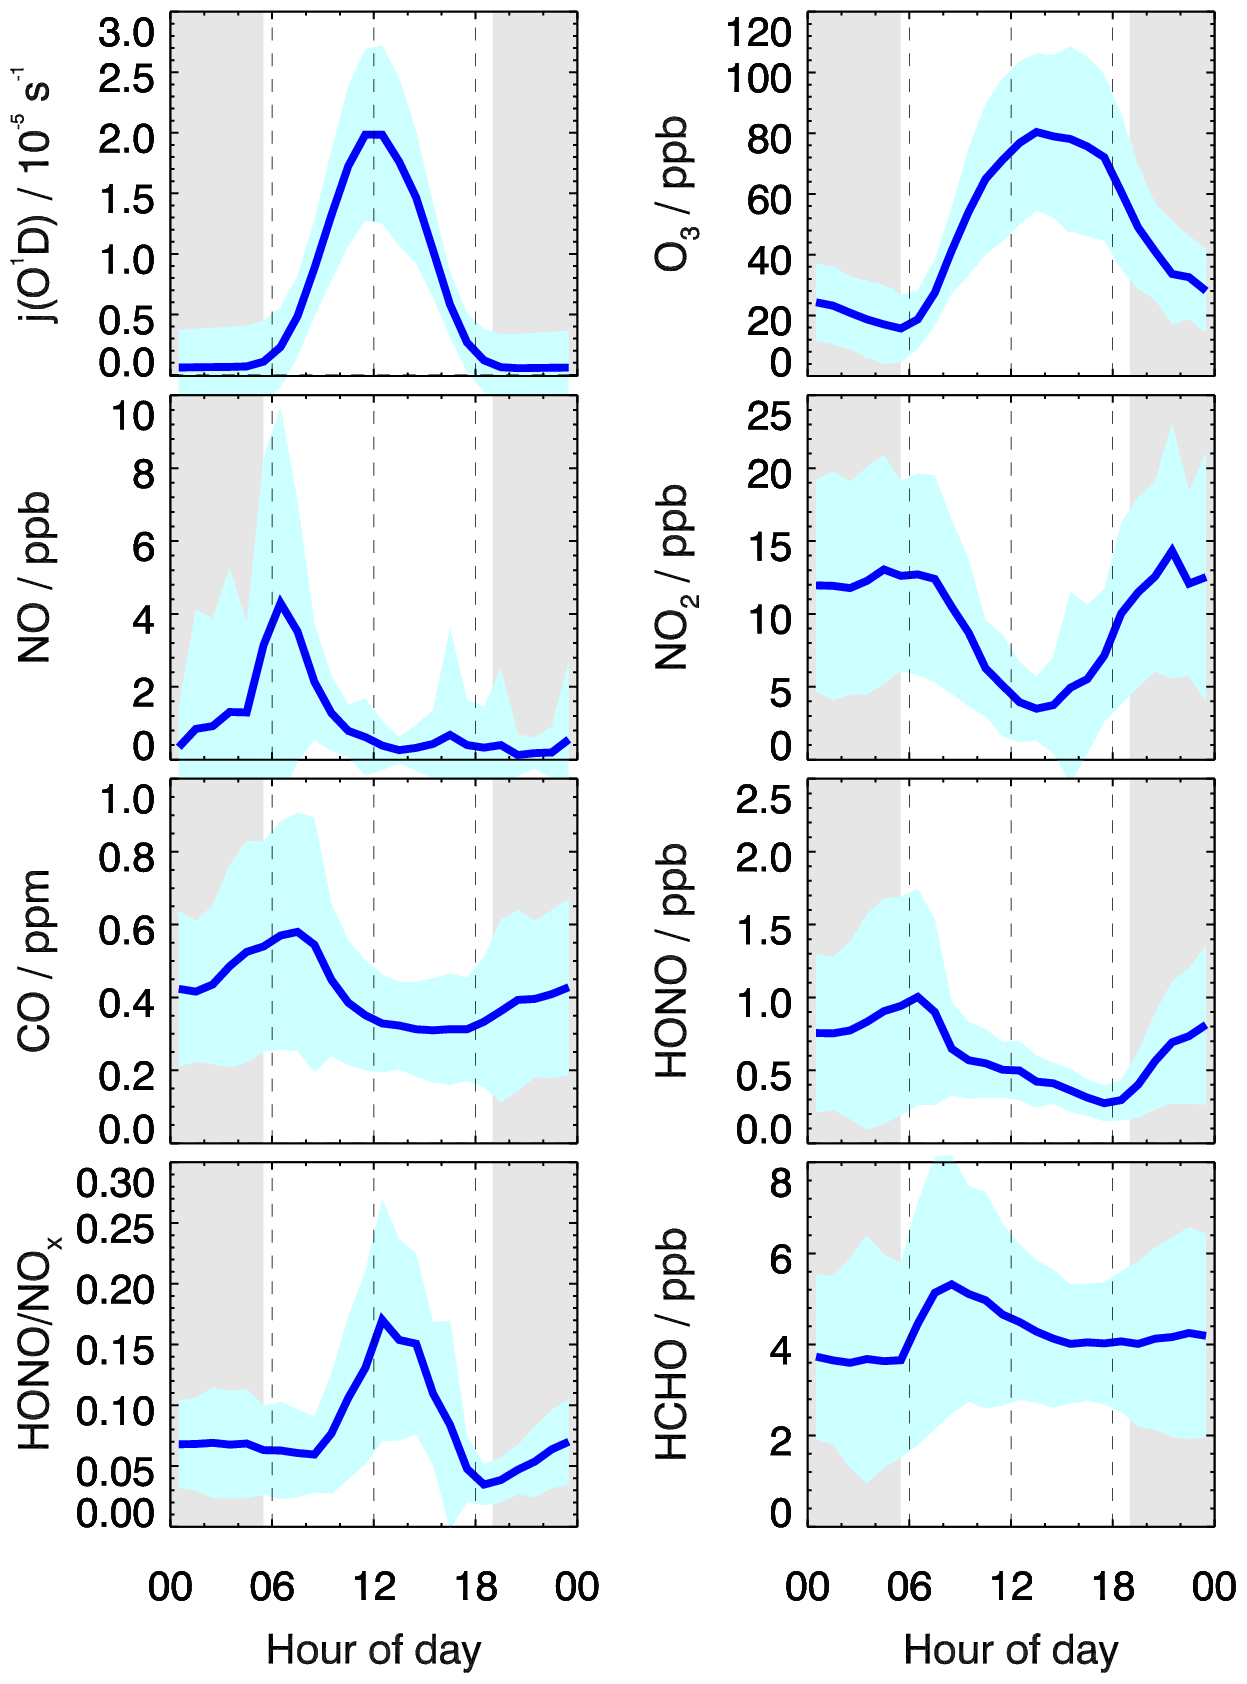
Figure 1 presents the time profiles of HONO and related chemical species as well as meteorological conditions from 23 May to 18 June 2018. The temperature ranged from 15 to 35∘C, and the RH ranged from 30 % to 100 % during the measurement period. Rainfall events occurred on 25–26 May and 10 June, and corresponding concentrations of both primary and secondary pollutants were low as a result of low solar radiation intensity and the scouring effect of rain. The daily maximum values of j(O1D) frequently exceeded s−1, indicating strong solar radiation intensity during most days of the measurement period. The mean diurnal profiles of HONO and related parameters are shown in Fig. 2. Similar with CO, HCHO peaked around 08:00 LT with a maximum of 5 ppb, indicating the effect of anthropogenic-emission-related sources. While the sampling site is located in a suburban area with no heavy traffic nearby, the maximum values of NO and NO2 during the campaign reached 38.6 and 49.6 ppb, respectively. The maximum diurnal-averaged concentrations of NO and NO2 were 4.4 and 14.8 ppb, respectively. As VOCs and NOx are important precursors of O3, relatively high NOx and VOCs are conducive to O3 production. The daily maximum 8 h average O3 concentrations frequently exceeded Class-II limit values (160 µg m−3, which is equivalent to 82 ppb at 298 K and 1013 kPa) of the National Ambient Air Quality Standard, and the highest concentration can reach as high as 150 ppb, indicating serious photochemical pollution. From 06:00 LT, O3 starts to rise rapidly with the increase in solar radiation intensity and reaches a maximum value of 85 ppb at 15:00 LT. Subsequently, O3 concentrations start to decrease rapidly due to the decrease in O3 in situ production, NO titration and dry deposition. Concurrent PM2.5 and O3 pollution occurred from 28 to 30 May, which is not unexpected as both pollutants are closely linked to the oxidation of VOCs and NOx. The co-occurrence of PM2.5 and O3 pollution in China has been frequently observed in recent years (Li et al., 2019b), especially in the spring and autumn seasons, making it a significant challenge for the next phase of air-cleaning actions in China to synergistically control both pollutants. OH radicals showed a typical diurnal pattern, with a maximum around noon and very low concentrations in the morning and night. The mean diurnal pattern shows that the average peak concentration of OH radicals is 1.0×107 cm−3. With respect to summer OH concentrations in China, the average peak OH concentrations measured in this study are higher than those measured in Wangdu (9.0×106 cm−3) (Tan et al., 2017), Heshan (3.2×106 cm−3) (Ma et al., 2022) and Yufa (4.5×106 cm−3) (Lu et al., 2013). The relatively high OH concentration implied a strong atmospheric oxidizing capacity in this region. The reaction between OH and NO is the dominant gas-phase source of HONO. Compared with most other studies aiming at investigating the HONO budget, the concurrent measurement of OH radicals in our study will enable us to more accurately assess the contribution from other sources (excluding NO + OH) to HONO production.
HONO concentrations exhibited significant day-to-day variations, with the highest concentration reaching 4.4 ppb and the lowest concentration of several tens of parts per thousand. The maximum HONO concentration was observed on the night of 24 May, with HONO increasing from 1.8 to 4.4 ppb in 3 h. Interestingly, during this period, PM2.5 increased concurrently from 112 µg m−3 to a maximum of 203 µg m−3, indicating HONO and PM2.5 might have originated from the same source. Considering HONO, PM2.5 and CO increased concurrently in such a short period, a primary source like biomass burning was the possible reason for this event.
In Fig. 2, HONO showed a typical diurnal pattern, i.e., high concentrations in the early morning and evening and low concentrations during the daytime, as typically observed at other rural, suburban and urban sites (Li et al., 2010; Michoud et al., 2014; Xu et al., 2015; Lee et al., 2016). HONO generally began to accumulate in the evening, when HONO photolysis loss ceased. High NO2 concentrations, which facilitated heterogeneous NO2 reactions on humid surfaces, together with the primary vehicle emissions, led to an increase in HONO during the nighttime. After sunrise, HONO showed a rapid decrease due to fast photolysis and reached a minimum in the later afternoon. Considering that the atmospheric lifetime of HONO is only 10–20 min (with respect to photolysis) around noon (Sörgel et al., 2011), however, the averaged noontime HONO concentration was relatively high (0.5 ppb), implying the existence of strong daytime HONO sources to counteract its rapid photolysis. Furthermore, it can be clearly seen that periods with high NO2 concentrations were typically accompanied by high HONO concentrations (29–30 May, 5–7 June), and vice versa. This phenomenon further confirmed that NO2 is an important precursor for HONO production. In addition, O3 pollution episodes also coincided with high HONO levels (e.g., 5–8 June). This phenomenon can be attributed to the following two reasons: firstly, O3 and HONO have a common precursor NOx; secondly, the photolysis of HONO will lead to the production of OH radicals, which will eventually promote the production of O3, so the higher HONO concentration will lead to the higher O3 production, which will be further confirmed later in our model analysis.
HONO NOx is an important parameter to characterize the HONO concentration and the extent of heterogeneous NO2 conversion to HONO because it is less affected by transport and up–down convection compared to the HONO concentration. As shown in Fig. 2, HONO NOx started to increase after 18:30 LT, when HONO photolysis loss ceased. However, with the fresh NOx continuing to be emitted, the ratio then remains nearly constant overnight. The atmospheric lifetime of HONO is very short compared to NOx. The main source of nocturnal HONO was generally considered to be the heterogeneous NO2 hydrolysis reaction, and if this source also dominated daytime HONO production, the rapid photolytic loss of HONO would make the daytime HONO NOx value decrease to a minimum. In contrast, a daytime HONO NOx maximum (0.17) was observed around 12:00 LT, indicating other important sources, which is much faster than the heterogeneous NO2 hydrolysis reaction, dominating daytime HONO production. Additionally, the mean diurnal pattern of HONO NOx resembled that of j(O1D), pointing to the possibility of light-promoted HONO sources being dominant during the day. In terms of mean diurnal profiles, the average peak value of HONO NOx in this study is much larger than that reported in Beijing (0.08) (Gu et al., 2022), London (0.04) (Lee et al., 2016) and Nanjing (0.055) (Liu et al., 2019a), which indicated the high efficiency of NOx-to-HONO conversion. HONO NOx measured in summer is typically higher than that measured in winter, which could be attributed to higher solar radiation intensity and hence promote the conversion of NOx to HONO by photosensitized reduction. In addition, considering that the observation period covered the fertilization period in June, the high HONO NOx in our study may be partially explained by direct soil HONO emissions around the sampling sites.
The average HONO concentration during the EXPLORE-YRD campaign is 0.62 ± 0.49 ppb, which is within the range of the summer HONO concentration reported in previous studies and is much lower than the observed concentration in winter in other sites in China, like Wangdu (1.8 ± 1.4 ppb) (Xue et al., 2020), Xianghe (2.18 ± 1.95 ppb) (Zhang et al., 2022b), Jinan (1.35 ppb) (Li et al., 2018a) and Beijing (0.98 ± 0.85 ppb) (Zhang et al., 2022c), probably due to the relatively low concentration of NOx in summer. However, the observed HONO concentration is higher than that observed in summer in some suburban sites, like Hong Kong (0.35 ± 0.30 ppb) (Xu et al., 2015) and Xi'an (0.51 ppb) (Huang et al., 2017), which also indicates the relatively high atmospheric oxidizing capacity in this region. Liu et al. (2019a) reported a comparable summer HONO concentration of 0.56 ppb at a suburban site in the YRD region. A relatively high average HONO concentration of 0.76 ppb (0.01–5.95 ppb) was reported at a suburban site in the YRD region during the biomass-burning season, which was attributed to the influence of biomass events (Nie et al., 2015).
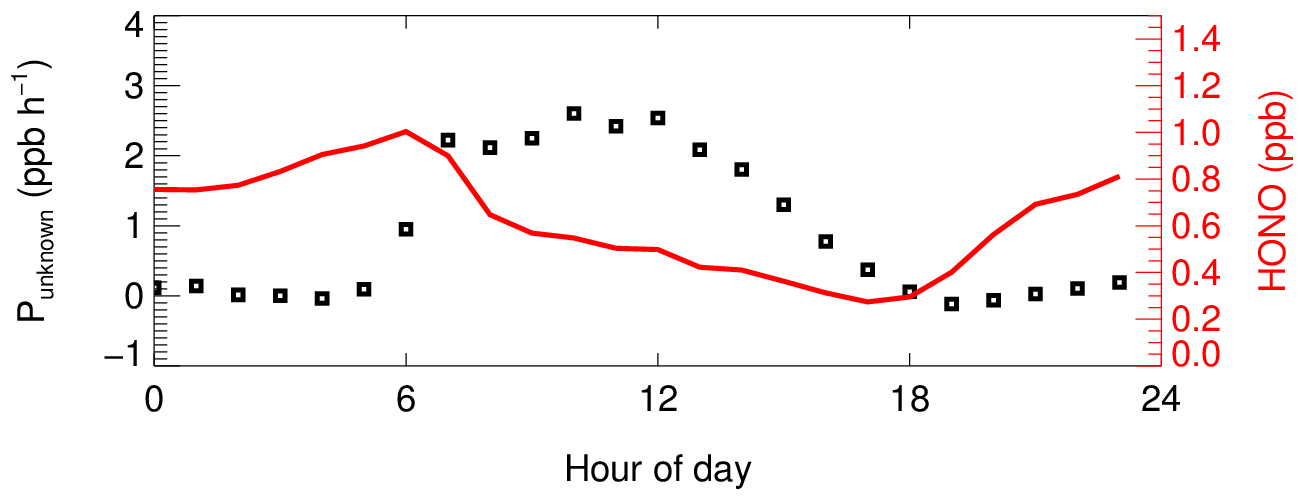
Figure 3The diurnal profiles of calculated the strength of the unknown HONO source (Punknown) and observed HONO.
3.2 Strength of the unknown HONO source
More and more studies now confirm that gas-phase reactions are far from sufficient to explain the observed HONO concentrations, and in this study we also calculated the contribution of non-gas-phase reactions to the HONO production based on the measured data (Punknown). The reaction between NO and OH is the only considered gas-phase HONO source, and the removal pathways of HONO include photolysis – the reaction with OH radicals. Thus, Punknown is calculated as follows:
where dHONO dt represents the change rate of observed HONO at 5 min intervals. OH, NO and j(HONO) were constrained by measured data. The reaction rate constants for NO + OH and HONO + OH were 9.8 × 10⁻¹² cm3 molec.−1 s−1 and 6.0 × 10⁻¹² cm3 molec.−1 s−1, respectively. The calculated mean diurnal profile of Punknown is shown in Fig. 3. Punknown showed a symmetrical diurnal trend and peaked around 10:00–12:00 LT with a maximum of 2.5 ppb h−1. The variation in Punknown tracked the profile of j(O1D), which may be a hint of a photo-induced process driving HONO production. The average peak value of Punknown was comparable to that measured in Beijing (2.58 ppb h−1) and is larger than in Guangzhou (0.65 ppb h−1), Santiago (1.77 ppb h−1), indicating the important contribution of the unknown source to HONO production. While HONO concentration is relatively low at noon, the strength of the unknown source is the largest, as a strong source is needed to compensate for the rapid photolysis loss of HONO at noon.
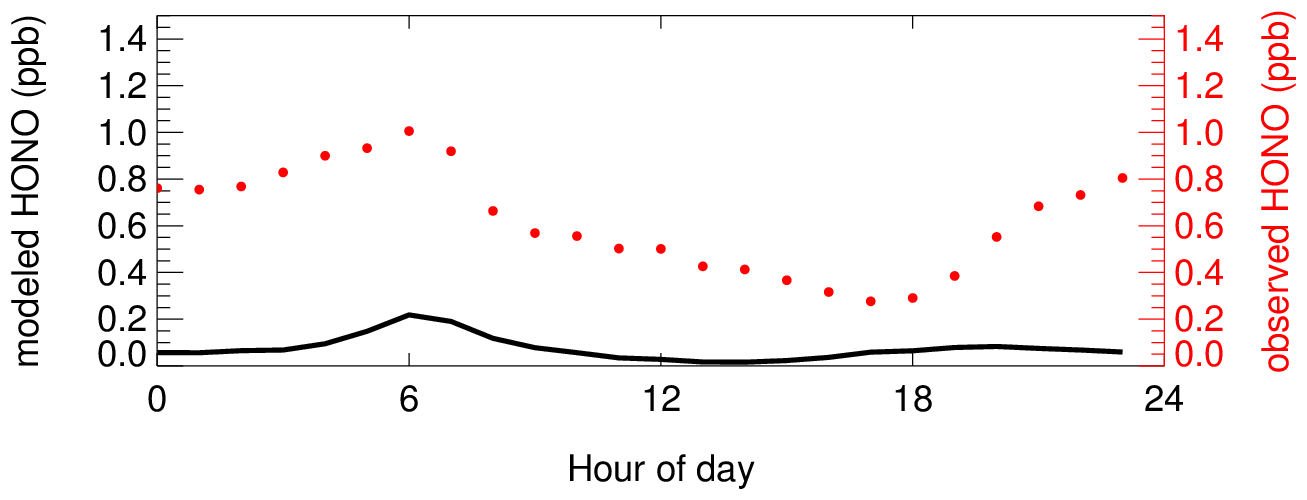
Meanwhile, a 0-D box model was employed to understand the observed HONO profiles, and only the default NO + OH reaction was considered for HONO production (scenario S0 in Table 2). Although the HONO diurnal trend was captured in the base run simulation, the simulated HONO concentration was about an order of magnitude lower than the measured concentration (Fig. 4), further confirming the crucial role of non-gas-phase sources in HONO production. The simulated HONO concentration was less than 0.05 ppb around noontime, and the average peak concentration was only 0.2 ppb.
3.3 Correlation analysis
As the strength of the unknown source of daytime HONO was much greater, we focused on analyzing the unknown source of daytime HONO in this part. According to our analysis above, photo-induced processes were likely to be the reason for the high observed HONO during the daytime. Previous studies have proposed some photo-induced heterogeneous pathways, including photo-induced NO2-to-HONO conversion on the aerosol surface, photo-induced NO2-to-HONO conversion on the ground surface and heterogeneous nitrate photolysis. However, the relative importance of these sources to HONO production is still highly controversial. The comprehensive measurements performed during the EXPLORE-YRD campaign provide us with a unique opportunity to evaluate different HONO sources.
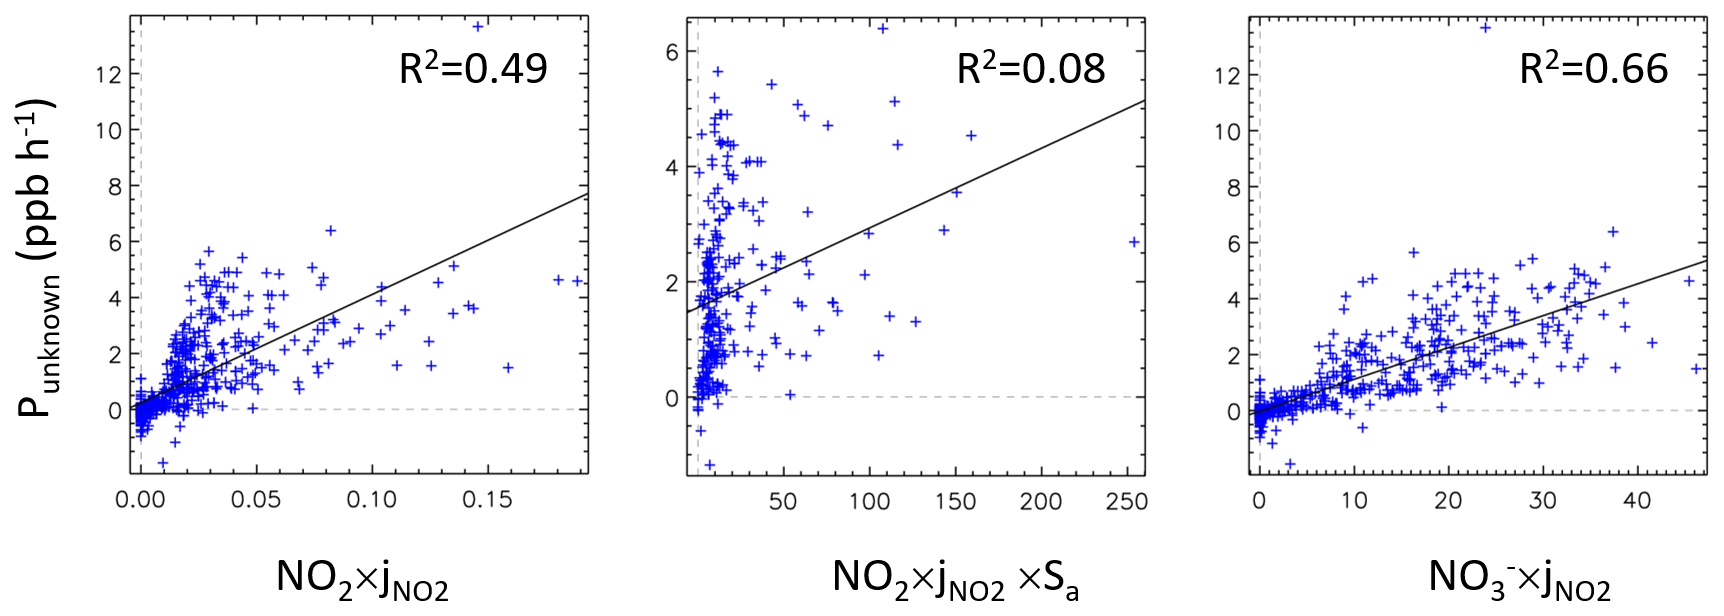
Figure 5The strength of the unknown source (Punknown; 08:00–18:00 LT) plotted against NO2×j(NO2), NO2×j(NO2)×Sa and NO(NO2).
The correlation analysis between Punknown and other potential parameters can provide us with a preliminary understanding of the potential HONO sources. NO2 concentration can be an important indicator of the heterogeneous reaction of NO2 at the ground surface because the ground surface-to-volume ratio is considered to be constant for a well-mixed boundary layer. NO2 × Sa can represent the heterogeneous NO2 reaction on the aerosol surface. The particle nitrate concentration can be used as an indicator of nitrate photolysis. Therefore, NO2 × j(NO2), NO2 × j(NO2) × Sa and NO × j(NO2) can be used as proxies for three heterogeneous HONO sources, respectively. As shown in Fig. 5, we found that the unknown source correlated weakly with NO2 × j(NO2) × Sa, indicating photo-induced NO2 conversion on the aerosol surface might play a minor role in daytime HONO production. In contrast, the correlation coefficients (R2) of Punknown with NO2 × j(NO2) and Punknown with NO × j(NO2) (R2=0.66) were significantly higher, suggesting that the photo-induced NO2 conversion on the ground surface and nitrate photolysis may have a profound impact on HONO production, which will be discussed in more detail in Sect. 3.4.
3.4 HONO formation by different heterogeneous mechanisms
In this section, sensitivity tests were performed to understand how the uncertainties of different photolytic HONO formation pathways would impact HONO production. The goal of these tests was to investigate if the potential HONO formation pathways could explain the profiles of Punknown.
3.4.1 Photo-induced NO2 conversion on the aerosol surface
The HONO production rate by photo-induced NO2 conversion on the aerosol surface (Paerosol+hν) can be expressed as follows:
where is the mean molecule speed of NO2, Sa is the aerosol surface area density, and γaeosol+hν is the photo-induced NO2 uptake coefficient on the aerosol surface which depends on the solar radiation intensity. Previous laboratory studies have reported the positive dependence of γaeosol+hν on solar radiation intensity. Accordingly, in the equation represents the promotion effect of solar radiation (Vogel et al., 2003; Wong et al., 2013).
From the equation, we can see that γaeosol+hν is the key factor affecting the HONO production rate. The laboratory-derived γaeosol+hν ranged from 10−4 to 10−7, largely depending on the components of the model aerosols used in laboratory experiments. γaeosol+hν on the soot surface was measured to be 10−4 (Ammann et al., 1998) but rapidly decreased to 10−7 due to the consumption of reactive sites (Gerecke et al., 1998; Kleffmann et al., 1999). Stemmler et al. (2007) measured γaeosol+hν on the humic acid aerosol surface up to 2 × 10⁻⁵, which was considered to be more relevant for ambient conditions. Here we used a photo-induced uptake coefficient of 2 × 10⁻⁵ and increased the value to 2 × 10⁻⁴ as an upper limit to check if the photo-induced NO2 conversion on the aerosol surface could explain Punknown. As shown in Fig. 6a, HONO production by photo-induced NO2 conversion on the aerosol surface was much lower than Punknown even with an upper limit of 2 × 10⁻⁴, indicating that the contribution of the photo-induced NO2 conversion on the aerosol surface to HONO is minor, consistent with previous correlation analysis. A recent study also revealed NO2 conversion on the aerosol surface contributed less than 5 % and 12 % of HONO production in the summer and winter seasons at a rural site, respectively (Song et al., 2022).
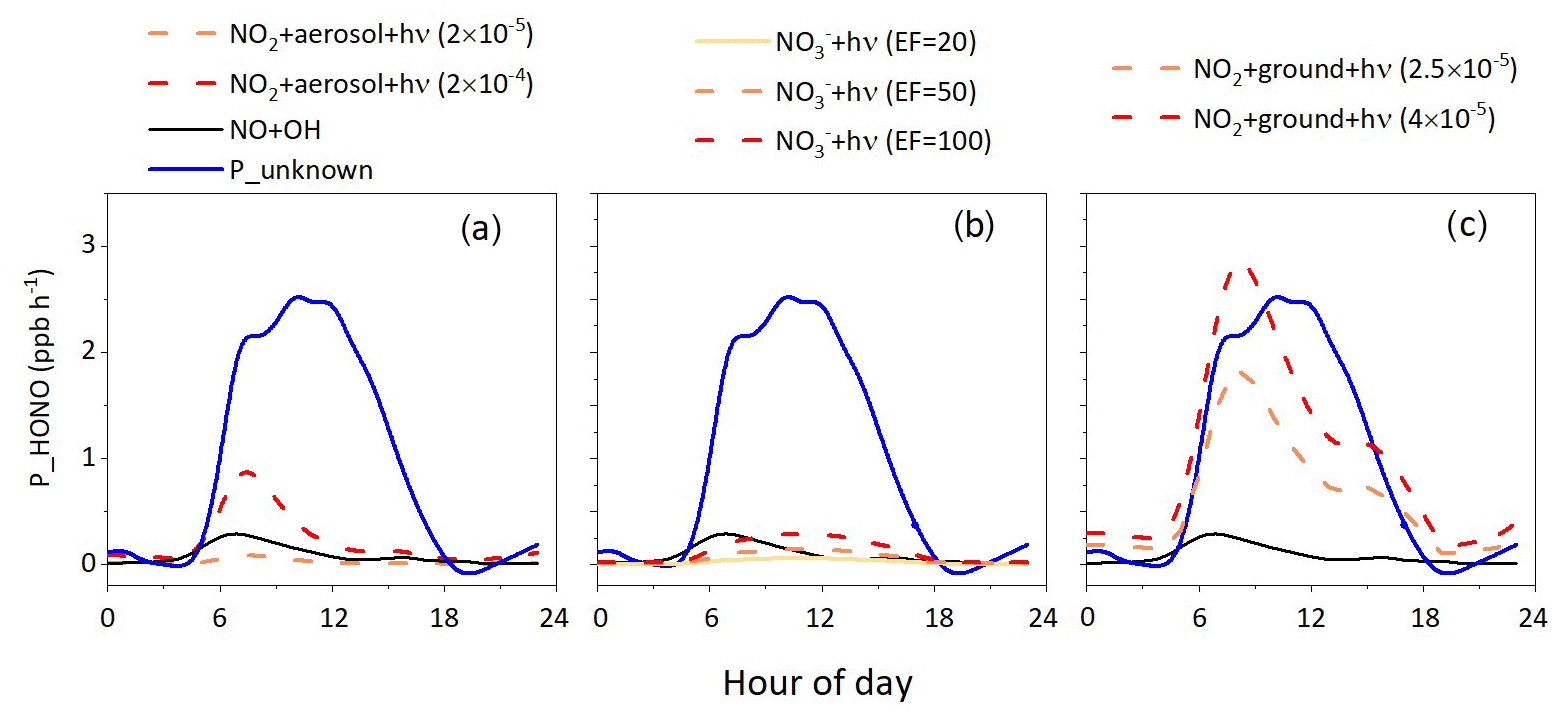
Figure 6HONO production rates by different HONO formation pathways with different parameter settings. (a) Photo-induced NO2 conversion on the aerosol surface, (b) heterogeneous particulate nitrate photolysis and (c) photo-induced NO2 conversion on the ground surface.
It should be mentioned that non-photo-induced NO2 conversion (NO2 hydrolysis) on the aerosol surface also contributed to HONO production during the daytime. However, NO2 hydrolysis is generally considered to be much slower than photo-induced NO2 conversion. Therefore, it could not be the main source of daytime HONO in our study and was not discussed here.
3.4.2 Heterogeneous nitrate photolysis
The expression for the contribution of heterogeneous nitrate photolysis to HONO production is as follows:
where [NO] is the concentration of nitrate (ppb), j(HNO3)g is the photolysis rate constant of gas-phase nitric acid, and EF is the enhancement factor (the ratio of aerosol-phase nitrate photolysis rate constant to gaseous nitrate photolysis rate constant). Recent evidence from a number of studies suggested that aerosol-phase nitrate photolyzes quickly to generate NO2 or HONO with a rate between 10 and 300 times faster than that of gas-phase HNO3 (Zhou et al., 2011; Ye et al., 2016, 2017). However, there is still great controversy about the rate constant of heterogeneous nitrate photolysis. For instance, observed NOx and HNO3 during the Korea–United States Air Quality (KORUS-AQ) campaign were best explained with a moderate EF of 1–30 by detailed box modeling (Romer et al., 2018). Modeled O3 was largely overestimated compared to observations when EF was set to 120 in a recent modeling study, indicating EF under atmospherically relevant conditions may be much lower than 120 (Zhang et al., 2022a). Laufs et al. (2016) investigated HNO3 photolysis on quartz glass surfaces and found the EF value was less than 10. A recent chamber study indicated that suspended nitrate aerosol released HONO with an EF lower than 10 (Shi et al., 2021). Andersen et al. (2023) found the EF of marine nitrate aerosol increased with RH and decreased with particulate nitrate concentrations through aircraft and ground measurements, which could partly explain the large discrepancy in EF values under different conditions.
We performed sensitivity tests with EF values of 20, 50 and 100 to understand how uncertainties in EF would impact HONO production and if particulate nitrate photolysis could explain Punknown. As shown in Fig. 6b, we calculated the HONO production rate of nitrate photolysis under different EF conditions and found that regardless of whether the EF is 20, 50 or 100, the calculated HONO production rate was about 1 order of magnitude lower than Punknown, indicating that the contribution of nitrate photolysis to HONO is minor at this site due to the relatively low concentration of particulate nitrate in summer compared to winter. Zhang et al. (2022a) pointed out that HONO production contributed by nitrate photolysis was an order of magnitude higher than that on clean days.
3.4.3 Photo-induced NO2 conversion on the ground surface
Vertical HONO measurements revealed a negative profile (Kleffmann et al., 2003; Wong et al., 2013; Tuite et al., 2021), providing evidence that a strong HONO source is likely near the ground surface. Laboratory studies confirmed the speculation and found that photo-induced reactions between NO2 and organic material (e.g., humic acids) lead to pronounced HONO production (George et al., 2005; Stemmler et al., 2006; Han et al., 2016). Since humic acids are an important component of soil and soil constitutes an important portion of the ground surface, this mechanism seems to be an important candidate for HONO sources in the lower troposphere.
HONO production by photo-induced NO2 conversion on the ground surface can be expressed as follows:
According to laboratory-derived uptake coefficients on humic acids, γground+hν is on the order of 10−5 (Stemmler et al., 2006, 2007; Han et al., 2016), and sensitivity tests were performed with γground+hν of 2.5 × 10⁻⁵ and 4 × 10⁻⁵. In addition, mixing layer height (MLH) is also a crucial factor influencing the HONO production rate on the ground surface. MLH refers to the height of the atmospheric layer where turbulent mixing occurs and pollutants are effectively mixed throughout the layer. It is worth mentioning that MLH instead of boundary layer height (BLH) was used here, as BLH would result in a significant underestimation of surface HONO source strength. Recent HONO vertical measurements revealed that the HONO concentration at 100 m was evidently lower than that near the surface, implying MLH was less than 100 m (Vogel et al., 2003; Vandenboer et al., 2013; Xing et al., 2021). Here we take the value of 50 m for the MLH based on previous studies (Lee et al., 2016; Xue et al., 2022; Zhang et al., 2022c). When the γground+hν was 4 × 10⁻⁵, the variation trend and magnitude of HONO production were similar to Punknown (Fig. 6c), indicating photo-induced NO2 conversion on the ground surface was an important HONO source. This was consistent with some studies combining field measurements and modeling simulations (Wong et al., 2013; Tuite et al., 2021).
3.5 HONO formation by vehicle emissions
It is generally accepted that HONO can be emitted by vehicle exhaust, and HONO NOx is used as a proxy to quantify primary HONO emissions from vehicles. Based on previous studies (Kurtenbach et al., 2001; Liu et al., 2019a), we used a widely applied ratio of 0.008 to calculate HONO emissions by vehicles at night. Considering the short lifetime of HONO with respect to photolysis during the daytime, the daytime HONO concentrations contributed by vehicles would be overestimated if a fixed value of HONO NOx were used. Therefore, the atmospheric lifetime of NOx and HONO should be taken into consideration to calculate vehicle emissions during the daytime (Xue et al., 2022; Zhang et al., 2022c).
Primary HONO emissions from vehicles can be expressed as follows:
where τ(HONO) and τ(NOx) denote the atmospheric lifetime of HONO and NOx, respectively. τ(HONO) can be expressed as follows:
NOx in the atmosphere is mainly removed through reaction with OH to generate HNO3 and through N2O5 hydrolysis to generate HNO3. N2O5 hydrolysis is negligible compared to NO2+OH during the daytime. Therefore, the atmospheric lifetime of NOx can be expressed as follows:
The average diurnal profile of HONO contributed by vehicle emissions is shown in Fig. S3. The calculated contribution of vehicle emissions to observed HONO ranged from 2 % to 32 %, with an average value of 15 %.
3.6 Box modeling on HONO production with the incorporation of different HONO sources
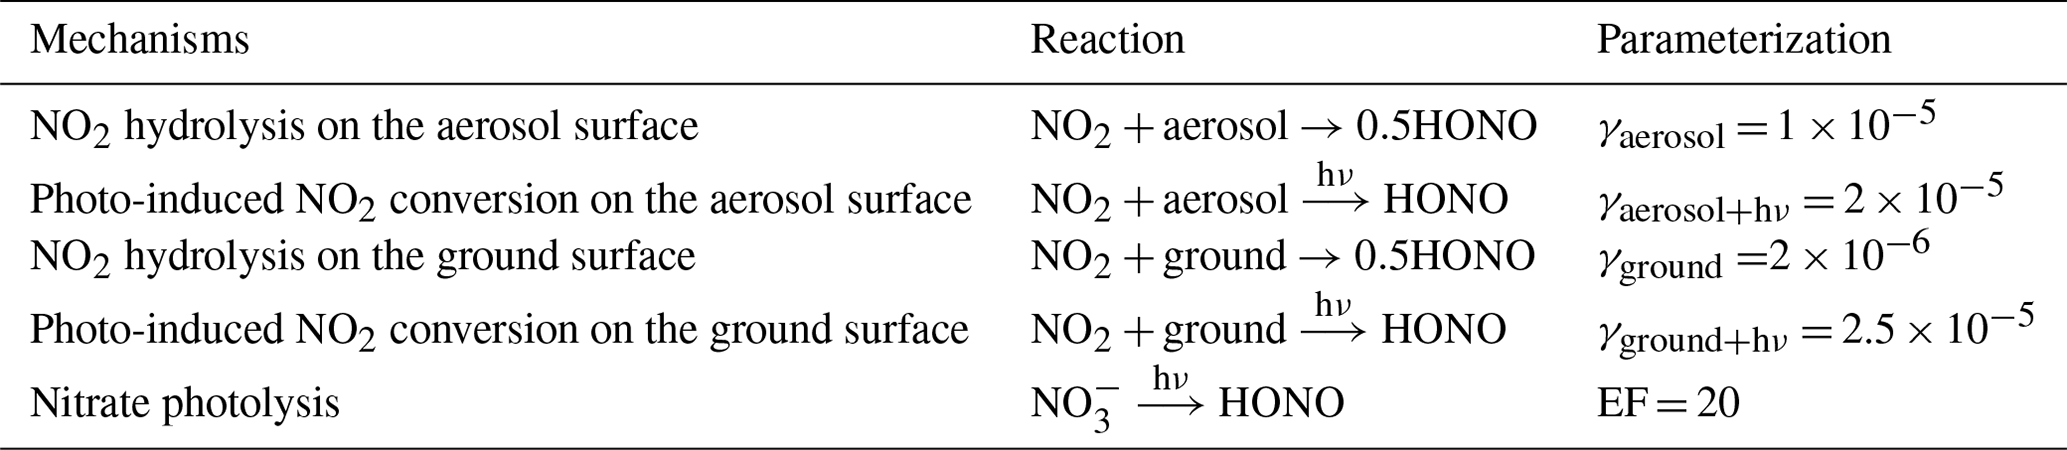
Based on the above analysis, five heterogeneous HONO formation mechanisms were parameterized into the box model. The mechanisms and corresponding parameter settings are listed in Table 1. Such parameter settings are adopted from previous laboratory and modeling studies (Stemmler et al., 2006, 2007; Han et al., 2016; Romer et al., 2018; Zhang et al., 2022a).
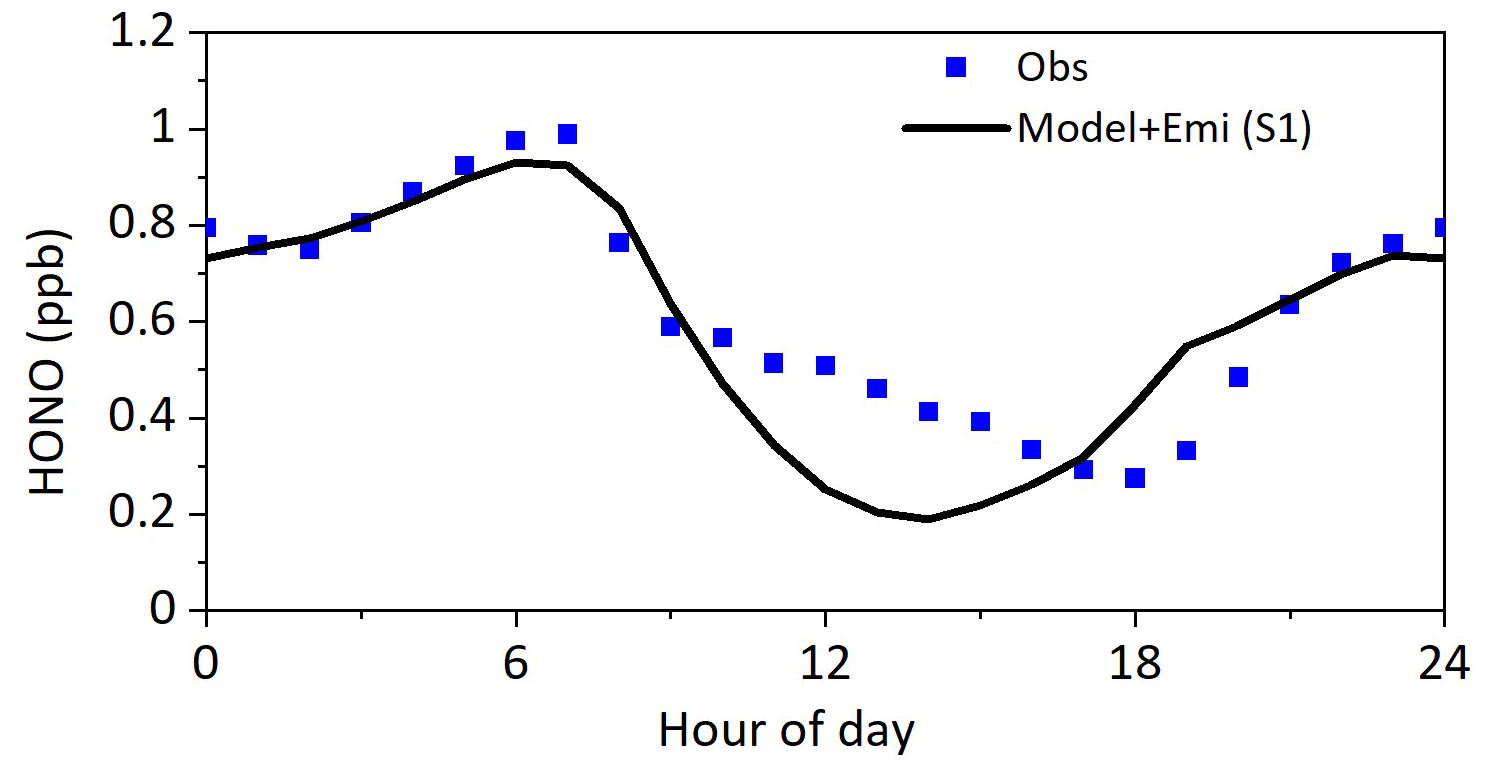
Figure 7Modeled HONO concentrations with additional HONO sources compared to the observations. Model + Emi represents the sum of modeled HONO and vehicle HONO emissions.
Table 2Different model simulation scenarios and corresponding configuration.
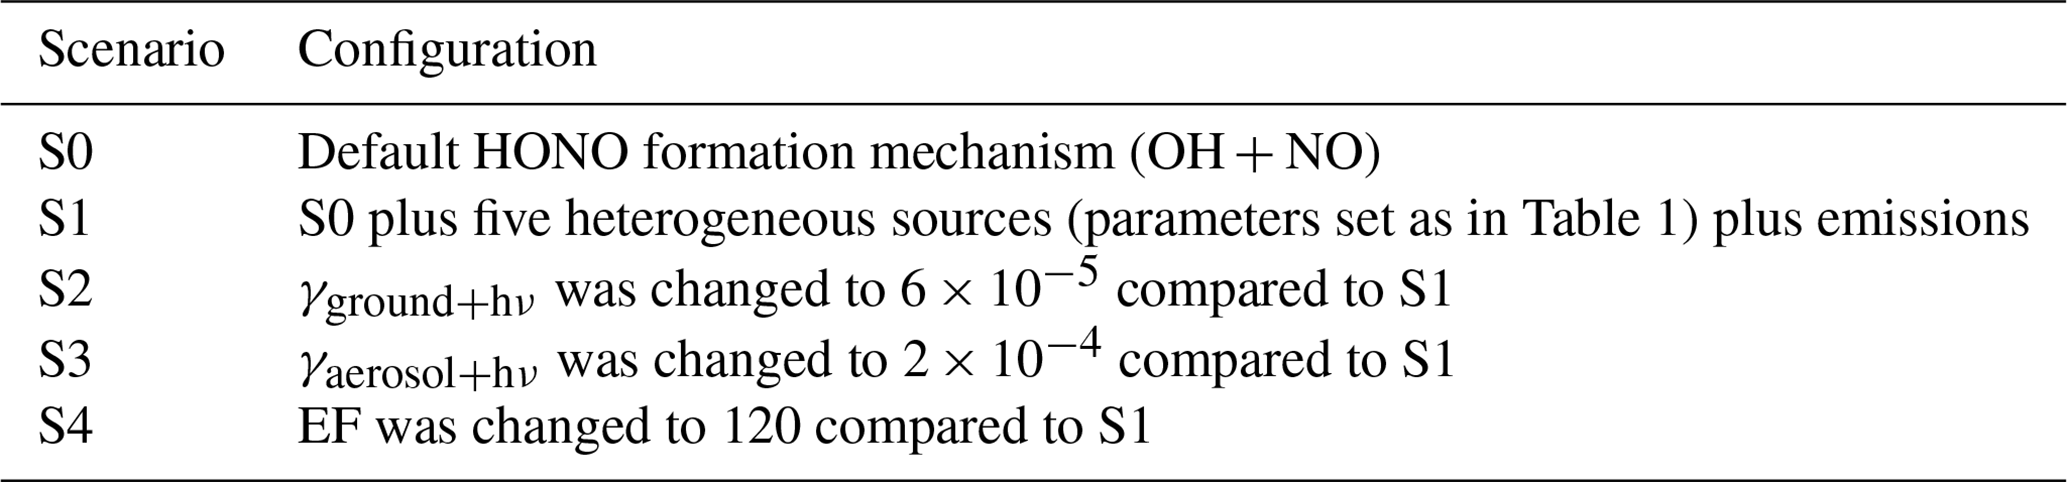
As shown in Fig. 7, including HONO sources significantly improved the model performance in HONO simulations. The box model incorporated with five heterogeneous sources (S1) reproduced observed HONO profiles during nighttime well, indicating a reasonable representation of nighttime HONO mechanisms. However, HONO concentration was still underestimated from 12:00 to 16:00 LT, which was likely caused by the following two reasons: (i) the uncertainty of and EF and (ii) other unknown daytime sources of HONO that were not included in the model. Sensitivity tests were performed to see if the uncertainties of the parameters adopted in models caused the discrepancy between modeled and observed HONO concentrations during the daytime. The results of each sensitivity run were compared to those of S1, and the description of the changes in each sensitivity test is listed in Table 2. If we increased γground+hν to 6 × 10⁻⁵, the HONO concentration from 12:00 to 15:00 LT could be explained, whereas the HONO concentration from 06:00–12:00 LT will be largely overestimated (S2 in Fig. 8); if we increased γaerosol+hν to 2 × 10⁻⁴ (S3 in Fig. 8), the modeled daytime HONO nearly kept unchanged compared to S1 due to the low aerosol surface area density; if we increased EF to 100, daytime HONO still could not be explained (S4 in Fig. 8), indicating that the underestimation of daytime HONO was not due to the uncertainties of γground+hν, γaerosol+hν and EF but was more likely due to other sources that were not considered. It should be noted that the box model cannot take vertical transport into account, which may introduce additional uncertainty. Wong et al. (2013) indicated that upward transport played an important role in distributing surface-produced HONO to the entire boundary layer. A 1D or 3D model may be an ideal tool for simulating HONO. The advantage of using the box model to explore the source of HONO was that the box model was constrained by simultaneously measured HONO precursors, which enabled a more accurate investigation of its secondary sources.
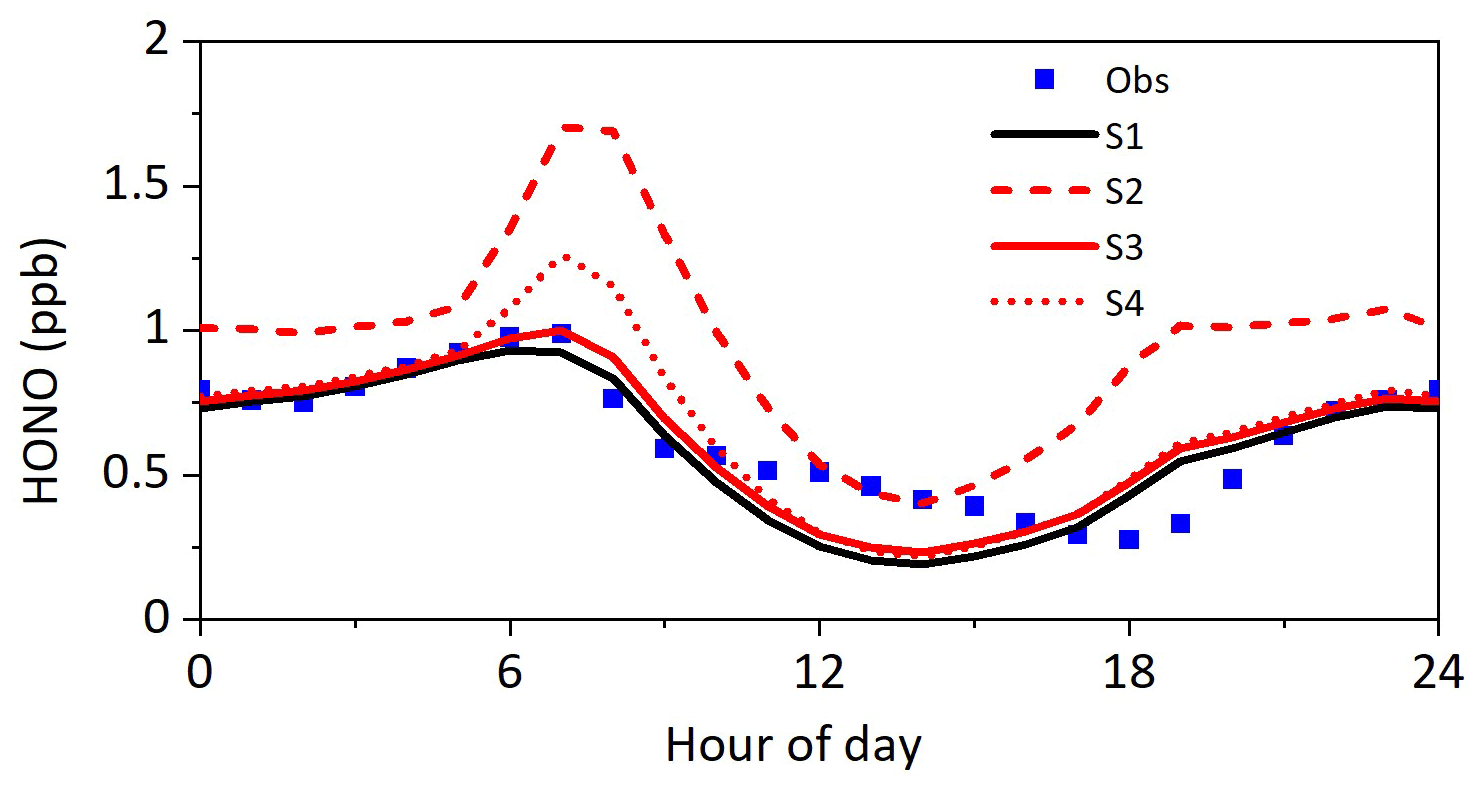
Figure 8Results from sensitivity tests compared with observed HONO concentrations. S1: parameters are listed in Table 1; S2: γground+hν was changed to compared to S1; S3: γaerosol+hν was changed to compared to S1; S4: EF was changed to 120 compared to S1.
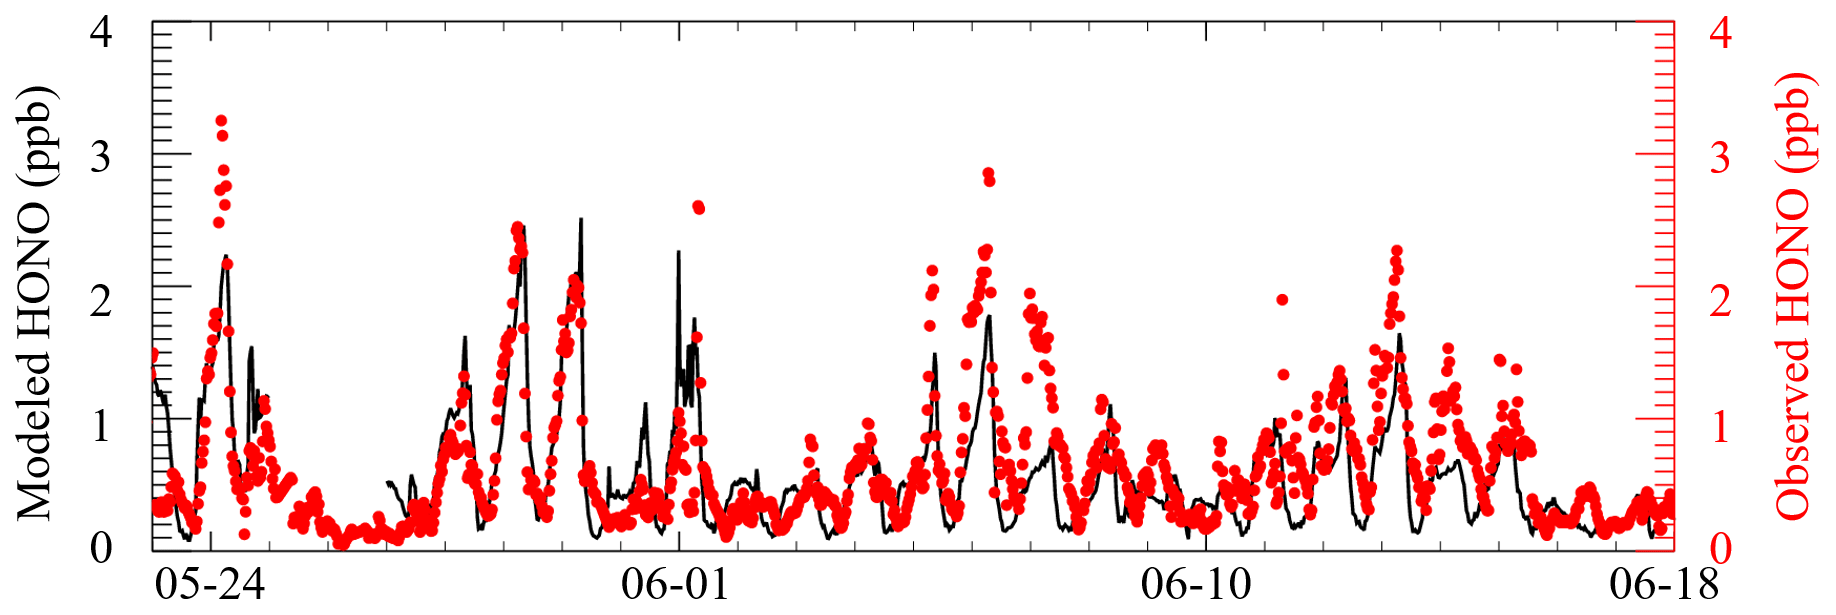
Modeled HONO profiles from 23 May to 18 June are shown in Fig. 9. Notably, simulated HONO profiles showed very good agreement with the observations from 23 May to 4 June while underestimating daytime and nighttime HONO concentrations from 5 to 16 June. Previous studies observed much higher HONO concentrations after fertilization compared to periods before fertilization (Xue et al., 2021). Given that the measurement site was surrounded by agricultural fields and the measurement period covered the fertilization event after the wheat harvest in June, fertilization-event-induced soil HONO emissions may result in high daytime HONO levels and the HONO NOx ratio. Therefore, field HONO flux measurements and laboratory investigations of corresponding mechanisms are warranted in future work to more accurately represent soil HONO emissions in models.
3.7 HONO budget
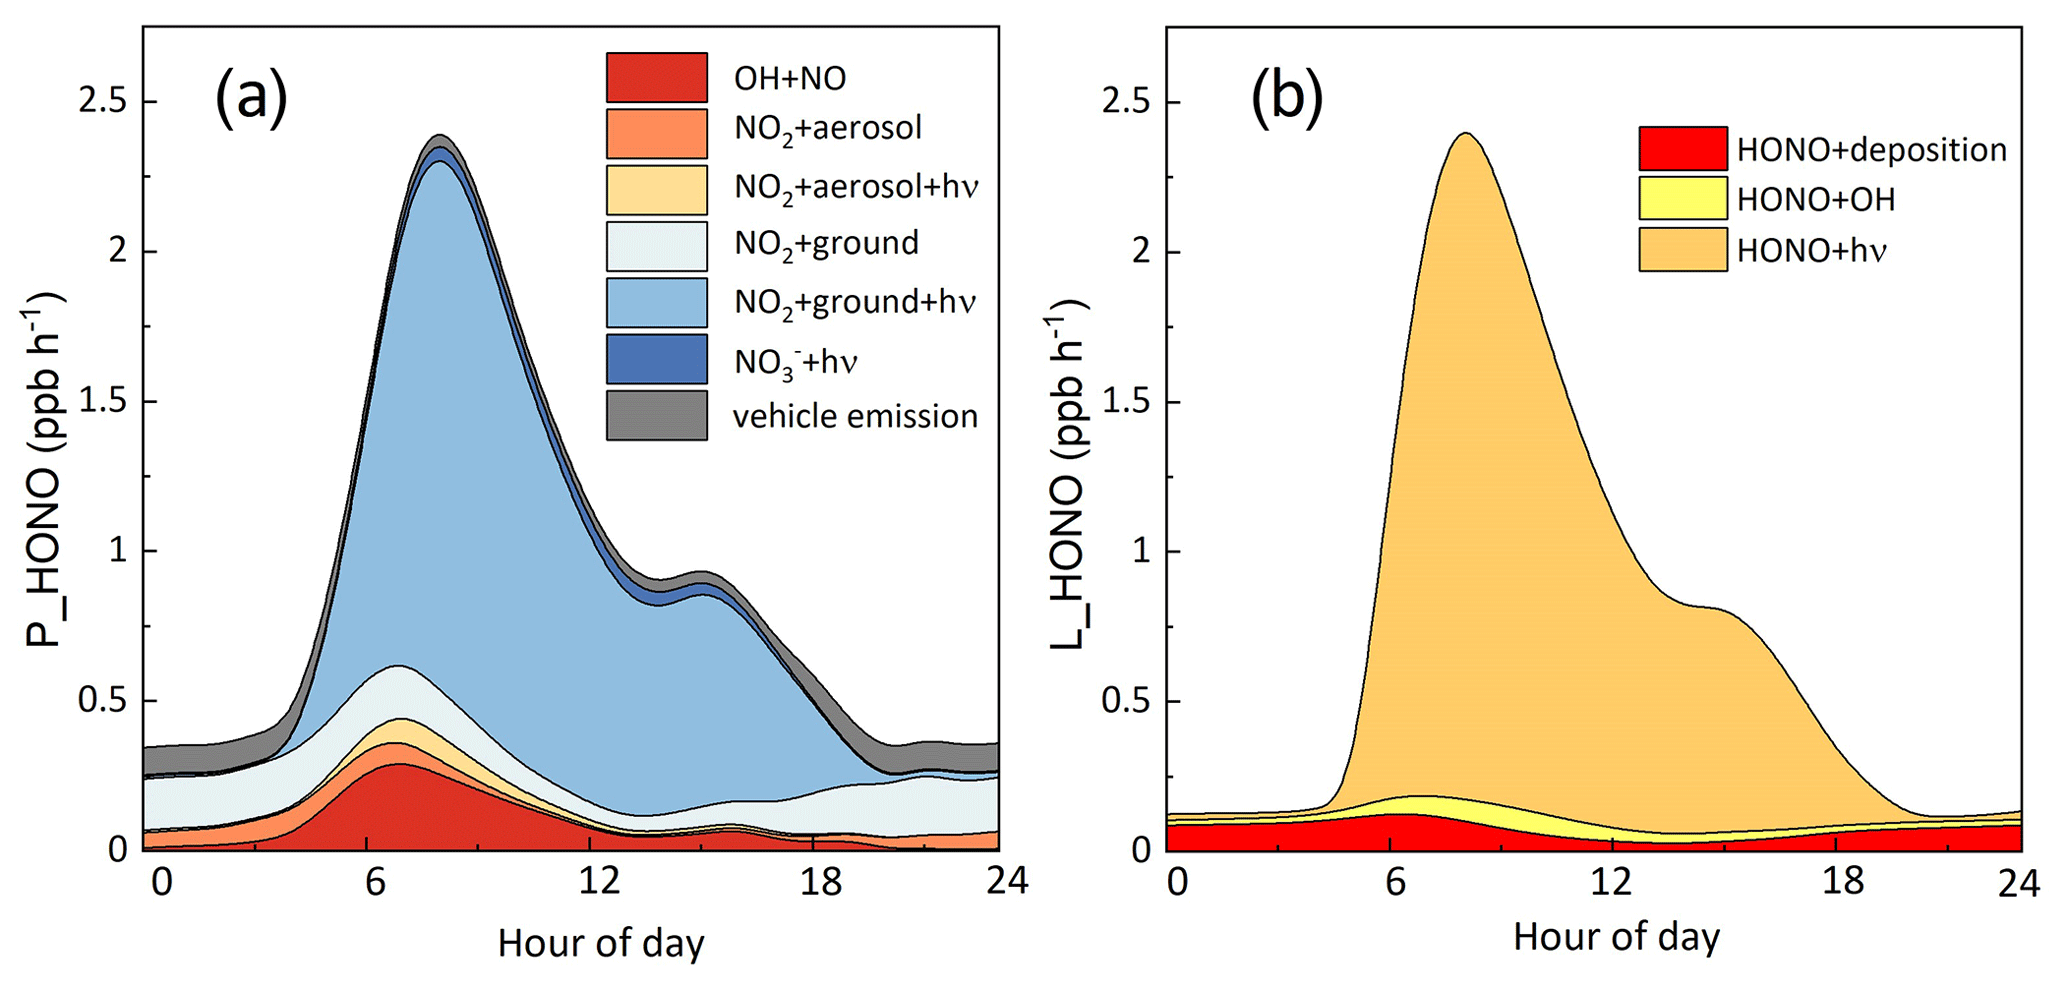
Figure 10a depicts the averaged diurnal profiles of the HONO production rates from seven HONO sources (five heterogeneous sources, gas-phase NO + OH and vehicle emissions). During daytime (06:00–19:00 LT), photo-induced NO2 conversion on the ground surface was the main contributor to simulated HONO, accounting for 71 % of the total, followed by NO + OH, NO2 hydrolysis on the ground surface, vehicle emissions, photo-induced NO2 conversion on the aerosol surface, nitrate photolysis and NO2 hydrolysis on the aerosol surface. The maximum production rate by photo-induced NO2 conversion on the ground surface was 1.85 ppb h−1, which occurred around 09:00 LT. The NO + OH reaction played a minor role in HONO production. This is consistent with recent studies, which also revealed that the NO + OH reaction was too small to explain daytime HONO (Li et al., 2018a; Michoud et al., 2014). In contrast, Liu et al. (2021) reported that daytime HONO production was dominated by the NO + OH reaction in summer in Beijing, contributing 22 % of total HONO production. Despite the uncertainties of γaerosol+hν and EF, photo-induced NO2 conversion on the aerosol surface and nitrate photolysis contributed less than 10 % of total production, implying they were not important in HONO production at this site. As suggested by previous studies, heterogeneous nitrate photolysis may be more important under low-NOx conditions (Zhou et al., 2003; Elshorbany et al., 2012). NO2 hydrolysis on the ground surface dominated HONO production during nighttime, contributing 55 % of total production, consistent with previous studies (Kleffmann et al., 2003; Vandenboer et al., 2013). HONO loss was dominated by photolysis, followed by deposition and reaction with OH (Fig. 10b). The average peak loss rate by HONO photolysis was 2.3 ppb h−1.
Despite a good match between observed and measured HONO during most days, HONO was still underestimated after fertilization events, indicating the strong influence of soil HONO emissions on the HONO budget in areas surrounded by agricultural fields. Therefore, soil HONO emissions should be well constrained, especially for rural areas during fertilization periods. In addition, while nitrate photolysis played a negligible role in HONO formation in our study, it may play a more important role in winter pollution periods with high nitrate loadings. Our study highlighted the important role of NO2 conversion on the ground surface. Previous studies found that some coexisting gas species like NH3 and CO2 may promote HONO production by the heterogeneous NO2 reaction (Li et al., 2018b; Xu et al., 2019; Liu et al., 2023a; Xia et al., 2021). Therefore, laboratory experiments investigating heterogeneous NO2 conversion on the ground surface with these species present are needed for better representation of HONO formation in models.
3.8 HONO contribution to ROx and O3 production
The primary sources of ROx radicals mainly include O3 photolysis, HONO photolysis, ozonolysis of alkenes and carbonyl photolysis. Generally, in clean regions, O3 photolysis is the main contributor to the primary source of radicals, while in polluted urban areas, HONO photolysis exceeds O3 photolysis and becomes the main primary radical source. Field measurements revealed that HONO photolysis contributed more than 40 % of primary radical sources (Tan et al., 2017; Ma et al., 2019; Ren et al., 2006). The ozonolysis of alkenes is an important source of ROx radicals at night. In addition, the ozonolysis of alkenes was the second largest radical source during the winter in urban areas (Tan et al., 2018). During the winter in oil- and natural-gas-producing basins in the United States, carbonyl photolysis was found to be the largest radical source, initiating the photochemical chain reactions and ultimately leading to exceedances of O3 concentrations (Edwards et al., 2014). Similarly, carbonyl photolysis was the major primary source of radicals in the oil extraction region in China during the winter seasons (Chen et al., 2020).
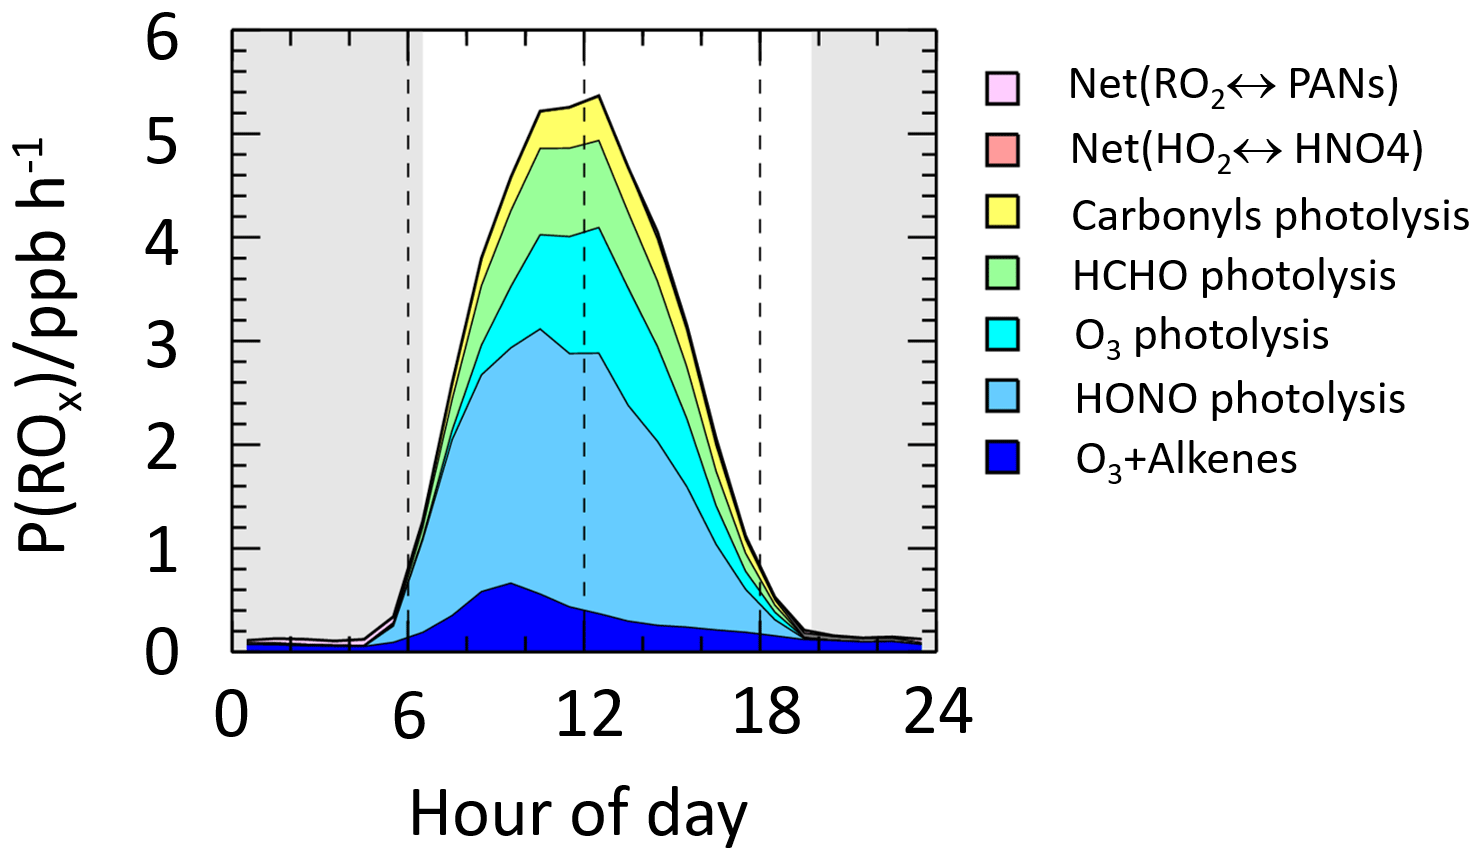
Figure 11Primary ROx production rates by different pathways during the EXPLORE-YRD campaign.
Figure 11 depicts the contribution of different channels to the primary source of ROx in the Taizhou area. We can clearly see that HONO photolysis is the dominant contributor to the primary source of ROx, not only in the early morning but also throughout the day. HONO photolysis contributed 43 % of ROx production during the daytime, followed by O3 photolysis (17 %), HCHO photolysis (14 %), ozonolysis of alkenes (12 %) and carbonyl photolysis (10 %). The maximum ROx production rate by HONO photolysis was 2.6 ppb h−1, which occurs around 11:00 LT. HONO photolysis was also identified as the major source of primary ROx production in the summer in Chengdu (34 %) and Wangdu (38 %) (Tan et al., 2017; Yang et al., 2021b). The results above indicate that HONO is closely linked to the ROx budget, and it is crucial to accurately identify HONO sources in order to fully comprehend the atmospheric oxidation capacity.
As mentioned in Sect. 3.1, O3 episodes were typically accompanied by high HONO levels. In this section, a box model was employed to quantify the contribution of HONO-to-O3 production. F(O3) and P(O3) were first calculated with observed HONO as a constraint. F(O3) showed a typical diurnal pattern with a maximum of 15.8 ppb h−1 occurring around 09:00 LT (Fig. 12). When observed HONO was not constrained in the model, the average peak of F(O3) decreased nearly 45 % to 8.8 ppb h−1 (Fig. 12), indicating HONO significantly contributed to O3 production and thereby boosted O3 pollution during the summer. P(O3) decreased from 12.6 to 6.7 ppb h−1 with a 47 % reduction, which is higher than the 20 % reduction in urban Beijing (Li et al., 2021; Zhang et al., 2023). Yang et al. (2021c) observed two O3 pollution episodes with nearly identical O3 precursor (VOC and NOx) levels. Interestingly, they found higher O3 peak concentrations coinciding with higher HONO concentrations in one of the episodes. This correlation can be attributed to the fact that higher HONO concentrations can lead to higher levels of OH radicals, which can, in turn, enhance the production of O3 by initiating the chain reactions (Yang et al., 2021c). We also modeled OH radicals with and without observed HONO as a model constraint. The modeled OH-averaged peak concentration with HONO was 8 × 106 cm−3, which was nearly twice as high as that (4.4 × 106 cm−3) without HONO as a model constraint. Our results emphasize the importance of HONO in primary radical production and O3 production. Accurately representing HONO sources in models is crucial for characterizing atmospheric oxidation capacity and quantifying secondary-pollutant production. Therefore, more field, laboratory and modeling studies are urgently needed to develop more concise HONO formation parameterizations. In addition, most studies are focusing on VOCs and NOx reduction to achieve O3 mitigation. However, O3 formation showed the nonlinear relationship of VOCs and NOx, making it difficult to decrease O3 by solely reducing VOCs or NOx. For instance, during the COVID-19 lockdown period, O3 showed an evident increase, while NOx and VOCs showed a decreasing trend, highlighting the complexity of O3 mitigation (Zhao et al., 2020; Wang et al., 2022). Our results suggest HONO contributed significantly to O3 production in China, and thereby, reducing HONO production may be an alternative way for O3 control. As heterogeneous NO2 reactions on the ground surface are important sources for HONO production, reducing NOx emissions would be beneficial for reducing HONO emissions. However, NOx reduction may also lead to more O3 production if O3 formation is in a VOC-limited regime, and hence the overall effects of NOx reduction on O3 should be evaluated by chemical transport models. Moreover, HONO emission by soil is an important HONO source in rural areas with large areas of agricultural fields. Decreasing soil HONO emissions is beneficial for O3 pollution control, especially during the fertilization period in June when the O3 pollution was severe. Therefore, more environmentally friendly fertilization amounts and fertilization modes should be investigated to decrease soil HONO emissions.
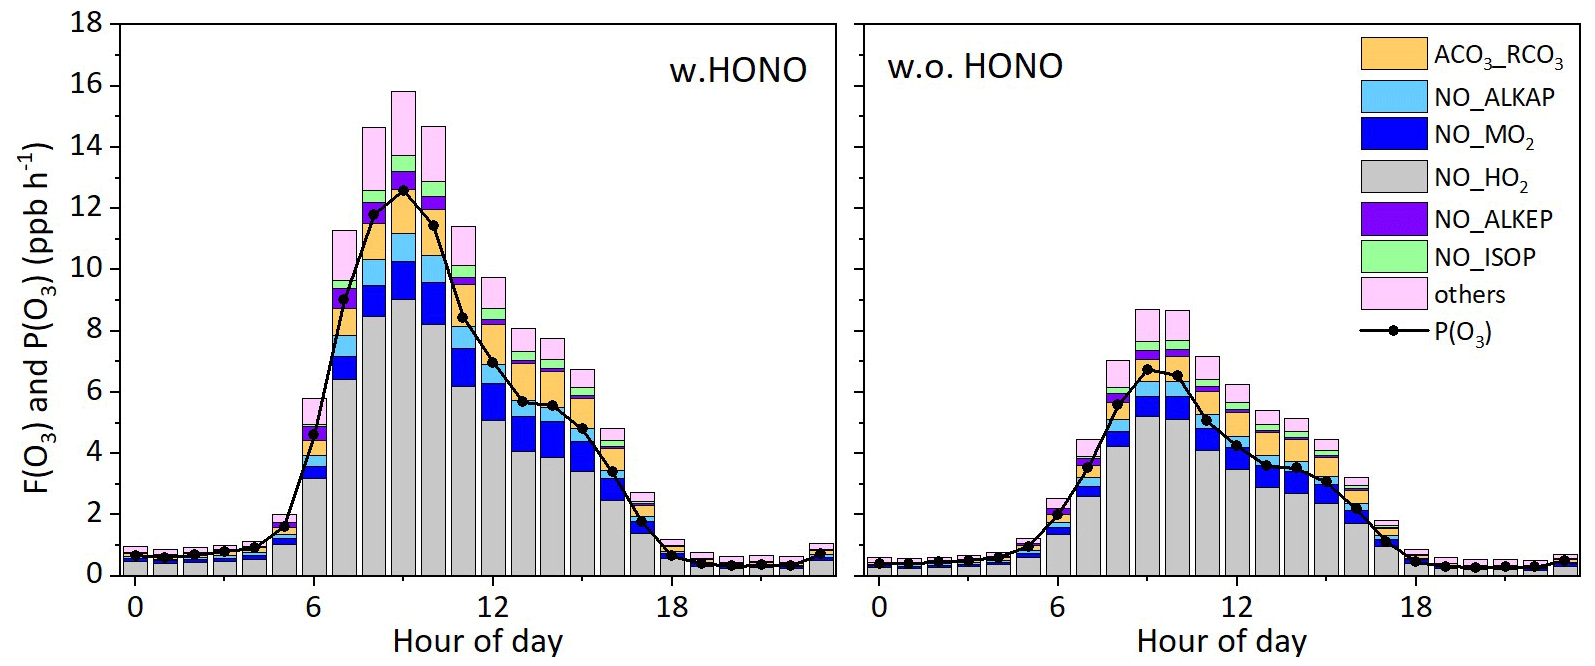
Figure 12Model-calculated total and net O3 production rate with and without observed HONO as a model constraint. According to different types of VOC precursors, organic peroxy radicals (RO2) can be classified into seven categories, including methyl peroxy radicals (MO2 = CH3O2), first-generation peroxy radicals from alkanes (ALKAP), alkenes except isoprene (ALKEP), isoprene (ISOP), aromatics (AROP), OVOC (OVOCP) and acyl peroxy radicals (ACETYLP = ACO3 + RCO3).
HONO measurements, along with a wide range of gas-phase, aerosol-phase and meteorological measurements, were conducted during the EXPLORE-YRD campaign. HONO concentrations exhibited significant day-to-day variations, with the highest concentration reaching 4.4 ppb and the lowest concentration reaching several tens of parts per thousand. The relatively higher summer HONO and OH concentrations compared to other suburban sites suggested higher atmospheric oxidation capacity. HONO NOx exhibited a diurnal pattern similar to j(O1D), with a maximum of 0.17 around noon, implying the existence of photo-induced HONO sources. The box model with the only default HONO source (OH + NO) failed to capture the observed HONO concentration. The calculated Punknown showed a diurnal pattern with a maximum of 2.5 ppb h−1 occurring around 10:00–12:00 LT. The correlation coefficients of Punknown with NO2 × j(NO2) and NO × j(NO2) were significantly higher than those of Punknown with NO2 × j(NO2) × Sa, indicating photo-induced NO2 conversion on the aerosol surface played a minor role in HONO production. Sensitivity tests suggested HONO production rate by photo-induced NO2 conversion on the ground surface was able to explain Punknown. With additional HONO sources incorporated, the box model reproduced the nighttime HONO concentration well but still underestimated the daytime HONO concentration. Further sensitivity tests implied the discrepancy between modeled and observed daytime HONO concentration was not due to uncertainties in γground+hν, γaerosol+hν and EF but was more likely due to other HONO sources that were not considered. Among the incorporated HONO sources and the default gas-phase source, photo-induced NO2 conversion on the ground surface was the main contributor to simulated daytime HONO, accounting for 71 % of the total, followed by NO + OH, NO2 hydrolysis on the ground surface, vehicle emissions, photo-induced NO2 conversion on the aerosol surface, nitrate photolysis and NO2 hydrolysis on the aerosol surface. The maximum production rate of photo-induced NO2 conversion on the ground surface was 1.85 ppb h−1 which occurred around 09:00 LT. NO2 hydrolysis on the ground surface was the major source of nighttime HONO, contributing 55 % of total HONO production. HONO loss was dominated by photolysis, followed by deposition and reaction with OH.
HONO photolysis contributed 43 % of ROx production during the daytime, followed by O3 photolysis (17 %), HCHO photolysis (14 %), ozonolysis of alkenes (12 %) and carbonyl photolysis (10 %). The maximum ROx production rate by HONO photolysis was 2.6 ppb h−1, which occurs around 11:00 LT. When the observed HONO was not constrained in the box model, the calculated P(O3) showed a typical diurnal pattern with a maximum of 6.7 ppb h−1 occurring around 09:00 LT. P(O3) would increase by 88 % to 12.6 ppb h−1 if HONO was constrained, indicating HONO significantly enhanced O3 production and hence aggravated O3 pollution during the summer season.
The data used in this study are available from the corresponding author upon request (k.lu@pku.edu.cn).
KL and YZ designed the experiments. CY analyzed the data and wrote the manuscript with input from all other authors.
The contact author has declared that none of the authors has any competing interests.
Publisher’s note: Copernicus Publications remains neutral with regard to jurisdictional claims made in the text, published maps, institutional affiliations, or any other geographical representation in this paper. While Copernicus Publications makes every effort to include appropriate place names, the final responsibility lies with the authors.
We thank the science teams of the EXPLORE-YRD campaign for their support.
This work was supported by the study of a new 3D detection method for the key atmospheric components and the formation mechanism of secondary pollution in the Jianghuai area (U19A2044), the National Natural Science Foundation of China (grant nos. 21976006), and the China Postdoctoral Science Foundation (grant nos. 2022T150011).
This paper was edited by Zhibin Wang and reviewed by three anonymous referees.
Alicke, B., Geyer, A., Hofzumahaus, A., Holland, F., Konrad, S., Pätz, H. W., Schäfer, J., Stutz, J., Volz-Thomas, A., and Platt, U.: OH formation by HONO photolysis during the BERLIOZ experiment, J. Geophys. Res.-Atmos., 108, PHO 3-1-PHO 3-17, https://doi.org/10.1029/2001JD000579, 2003.
Ammann, M., Kalberer, M., Jost, D. T., Tobler, L., Rossler, E., Piguet, D., Gaggeler, H. W., and Baltensperger, U.: Heterogeneous production of nitrous acid on soot in polluted air masses, Nature, 395, 157–160, https://doi.org/10.1038/25965, 1998.
Andersen, S. T., Carpenter, L. J., Reed, C., Lee, J. D., Chance, R., Sherwen, T., Vaughan, A. R., Stewart, J., Edwards, P. M., Bloss, W. J., Sommariva, R., Crilley, L. R., Nott, G. J., Neves, L., Read, K., Heard, D. E., Seakins, P. W., Whalley, L. K., Boustead, G. A., Fleming, L. T., Stone, D., and Fomba, K. W.: Extensive field evidence for the release of HONO from the photolysis of nitrate aerosols, Sci. Adv., 9, eadd6266, https://doi.org/10.1126/sciadv.add6266, 2023.
Baergen, A. M. and Donaldson, D. J.: Photochemical Renoxification of Nitric Acid on Real Urban Grime, Environ Sci. Technol., 47, 815–820, https://doi.org/10.1021/es3037862, 2013.
Bao, F. X., Li, M., Zhang, Y., Chen, C. C., and Zhao, J. C.: Photochemical Aging of Beijing Urban PM2.5: HONO Production, Environ Sci. Technol., 52, 6309–6316, 2018.
Bejan, I., Abd El Aal, Y., Barnes, I., Benter, T., Bohn, B., Wiesen, P., and Kleffmann, J.: The photolysis of ortho-nitrophenols: a new gas phase source of HONO, Phys. Chem. Chem. Phys., 8, 2028–2035, https://doi.org/10.1039/b516590c, 2006.
Chen, T., Xue, L., Zheng, P., Zhang, Y., Liu, Y., Sun, J., Han, G., Li, H., Zhang, X., Li, Y., Li, H., Dong, C., Xu, F., Zhang, Q., and Wang, W.: Volatile organic compounds and ozone air pollution in an oil production region in northern China, Atmos. Chem. Phys., 20, 7069–7086, https://doi.org/10.5194/acp-20-7069-2020, 2020.
Cui, L. L., Li, R., Fu, H. B., Meng, Y., Zhao, Y. L., Li, Q., and Chen, J. M.: Nitrous acid emission from open burning of major crop residues in mainland China, Atmos. Environ., 244, 10, https://doi.org/10.1016/j.atmosenv.2020.117950, 2021.
Ding, A. J., Fu, C. B., Yang, X. Q., Sun, J. N., Zheng, L. F., Xie, Y. N., Herrmann, E., Nie, W., Petäjä, T., Kerminen, V.-M., and Kulmala, M.: Ozone and fine particle in the western Yangtze River Delta: an overview of 1 yr data at the SORPES station, Atmos. Chem. Phys., 13, 5813–5830, https://doi.org/10.5194/acp-13-5813-2013, 2013.
Edwards, P. M., Brown, S. S., Roberts, J. M., Ahmadov, R., Banta, R. M., deGouw, J. A., Dube, W. P., Field, R. A., Flynn, J. H., Gilman, J. B., Graus, M., Helmig, D., Koss, A., Langford, A. O., Lefer, B. L., Lerner, B. M., Li, R., Li, S. M., McKeen, S. A., Murphy, S. M., Parrish, D. D., Senff, C. J., Soltis, J., Stutz, J., Sweeney, C., Thompson, C. R., Trainer, M. K., Tsai, C., Veres, P. R., Washenfelder, R. A., Warneke, C., Wild, R. J., Young, C. J., Yuan, B., and Zamora, R.: High winter ozone pollution from carbonyl photolysis in an oil and gas basin, Nature, 514, 351–354, https://doi.org/10.1038/nature13767, 2014.
Elshorbany, Y. F., Steil, B., Brühl, C., and Lelieveld, J.: Impact of HONO on global atmospheric chemistry calculated with an empirical parameterization in the EMAC model, Atmos. Chem. Phys., 12, 9977–10000, https://doi.org/10.5194/acp-12-9977-2012, 2012.
Elshorbany, Y. F., Kurtenbach, R., Wiesen, P., Lissi, E., Rubio, M., Villena, G., Gramsch, E., Rickard, A. R., Pilling, M. J., and Kleffmann, J.: Oxidation capacity of the city air of Santiago, Chile, Atmos. Chem. Phys., 9, 2257–2273, https://doi.org/10.5194/acp-9-2257-2009, 2009.
Finlayson-Pitts, B. J., Wingen, L. M., Sumner, A. L., Syomin, D., and Ramazan, K. A.: The heterogeneous hydrolysis of NO2 in laboratory systems and in outdoor and indoor atmospheres: An integrated mechanism, Phys Chem Chem Phys, 5, 223-242, 2003.
Fu, X., Wang, T., Zhang, L., Li, Q., Wang, Z., Xia, M., Yun, H., Wang, W., Yu, C., Yue, D., Zhou, Y., Zheng, J., and Han, R.: The significant contribution of HONO to secondary pollutants during a severe winter pollution event in southern China, Atmos. Chem. Phys., 19, 1–14, https://doi.org/10.5194/acp-19-1-2019, 2019.
George, C., Strekowski, R. S., Kleffmann, J., Stemmler, K., and Ammann, M.: Photoenhanced uptake of gaseous NO2 on solid organic compounds: a photochemical source of HONO?, Faraday Discuss., 130, 195–210, https://doi.org/10.1039/B417888M, 2005.
Gerecke, A., Thielmann, A., Gutzwiller, L., and Rossi, M. J.: The chemical kinetics of HONO formation resulting from heterogeneous interaction of NO2 with flame soot, Geophys. Res. Lett., 25, 2453–2456, https://doi.org/10.1029/98gl01796, 1998.
Gu, R. R., Shen, H. Q., Xue, L. K., Wang, T., Gao, J., Li, H., Liang, Y. T., Xia, M., Yu, C., Liu, Y. M., and Wang, W. X.: Investigating the sources of atmospheric nitrous acid (HONO) in the megacity of Beijing, China, Sci. Total Environ., 812, 10, https://doi.org/10.1016/j.scitotenv.2021.152270, 2022.
Han, C., Yang, W. J., Wu, Q. Q., Yang, H., and Xue, X. X.: Heterogeneous Photochemical Conversion of NO2 to HONO on the Humic Acid Surface under Simulated Sunlight, Environ Sci. Technol., 50, 5017–5023, https://doi.org/10.1021/acs.est.5b05101, 2016.
Heland, J., Kleffmann, J., Kurtenbach, R., and Wiesen, P.: A New Instrument To Measure Gaseous Nitrous Acid (HONO) in the Atmosphere, Environ Sci. Technol., 35, 3207–3212, https://doi.org/10.1021/es000303t, 2001.
Hou, S., Tong, S., Ge, M., and An, J.: Comparison of atmospheric nitrous acid during severe haze and clean periods in Beijing, China, Atmos Environ, 124, 199–206, https://doi.org/10.1016/j.atmosenv.2015.06.023, 2016.
Huang, R. J., Yang, L., Cao, J. J., Wang, Q. Y., Tie, X. X., Ho, K. F., Shen, Z. X., Zhang, R. J., Li, G. H., Zhu, C. S., Zhang, N. N., Dai, W. T., Zhou, J. M., Liu, S. X., Chen, Y., Chen, J., and O'Dowd, C. D.: Concentration and sources of atmospheric nitrous acid (HONO) at an urban site in Western China, Sci. Total Environ., 593, 165–172, https://doi.org/10.1016/j.scitotenv.2017.02.166, 2017.
Kleffmann, J., Becker, K. H., Lackhoff, M., and Wiesen, P.: Heterogeneous conversion of NO2 on carbonaceous surfaces, Phys. Chem. Chem. Phys., 1, 5443–5450, https://doi.org/10.1039/a905545b, 1999.
Kleffmann, J., Kurtenbach, R., Lörzer, J., Wiesen, P., Kalthoff, N., Vogel, B., and Vogel, H.: Measured and simulated vertical profiles of nitrous acid – Part I: Field measurements, Atmos. Environ., 37, 2949–2955, https://doi.org/10.1016/S1352-2310(03)00242-5, 2003.
Kleffmann, J., Gavriloaiei, T., Hofzumahaus, A., Holland, F., Koppmann, R., Rupp, L., Schlosser, E., Siese, M., and Wahner, A.: Daytime formation of nitrous acid: A major source of OH radicals in a forest, Geophys. Res. Lett., 32, L05818, https://doi.org/10.1029/2005GL022524, 2005.
Kramer, L. J., Crilley, L. R., Adams, T. J., Ball, S. M., Pope, F. D., and Bloss, W. J.: Nitrous acid (HONO) emissions under real-world driving conditions from vehicles in a UK road tunnel, Atmos. Chem. Phys., 20, 5231–5248, https://doi.org/10.5194/acp-20-5231-2020, 2020.
Kurtenbach, R., Becker, K. H., Gomes, J. A. G., Kleffmann, J., Lörzer, J. C., Spittler, M., Wiesen, P., Ackermann, R., Geyer, A., and Platt, U.: Investigations of emissions and heterogeneous formation of HONO in a road traffic tunnel, Atmos. Environ., 35, 3385–3394, https://doi.org/10.1016/S1352-2310(01)00138-8, 2001.
Laufs, S. and Kleffmann, J.: Investigations on HONO formation from photolysis of adsorbed HNO3 on quartz glass surfaces, Phys. Chem. Chem. Phys., 18, 9616–9625, https://doi.org/10.1039/C6CP00436A, 2016.
Lee, J. D., Whalley, L. K., Heard, D. E., Stone, D., Dunmore, R. E., Hamilton, J. F., Young, D. E., Allan, J. D., Laufs, S., and Kleffmann, J.: Detailed budget analysis of HONO in central London reveals a missing daytime source, Atmos. Chem. Phys., 16, 2747–2764, https://doi.org/10.5194/acp-16-2747-2016, 2016.
Li, D. D., Xue, L. K., Wen, L., Wang, X. F., Chen, T. S., Mellouki, A., Chen, J. M., and Wang, W. X.: Characteristics and sources of nitrous acid in an urban atmosphere of northern China: Results from 1-yr continuous observations, Atmos. Environ., 182, 296–306, https://doi.org/10.1016/j.atmosenv.2018.03.033, 2018a.
Li, G., Lei, W., Zavala, M., Volkamer, R., Dusanter, S., Stevens, P., and Molina, L. T.: Impacts of HONO sources on the photochemistry in Mexico City during the MCMA-2006/MILAGO Campaign, Atmos. Chem. Phys., 10, 6551–6567, https://doi.org/10.5194/acp-10-6551-2010, 2010.
Li, K., Jacob, D. J., Liao, H., Shen, L., Zhang, Q., and Bates, K. H.: Anthropogenic drivers of 2013–2017 trends in summer surface ozone in China, P. Natl. Acad. Sci. USA, 116, 422–427, https://doi.org/10.1073/pnas.1812168116, 2019a.
Li, K., Jacob, D. J., Liao, H., Zhu, J., Shah, V., Shen, L., Bates, K. H., Zhang, Q., and Zhai, S. X.: A two-pollutant strategy for improving ozone and particulate air quality in China, Nat. Geosci., 12, 906–910, https://doi.org/10.1038/s41561-019-0464-x, 2019b.
Li, L., Duan, Z. Y., Li, H., Zhu, C. Q., Henkelman, G., Francisco, J. S., and Zeng, X. C.: Formation of HONO from the NH3-promoted hydrolysis of NO2 dimers in the atmosphere, P. Natl. Acad. Sci. USA, 115, 7236–7241, https://doi.org/10.1073/pnas.1807719115, 2018b.
Li, Q. Y., Zhang, L., Wang, T., Wang, Z., Fu, X., and Zhang, Q.: “New” Reactive Nitrogen Chemistry Reshapes the Relationship of Ozone to Its Precursors, Environ Sci. Technol., 52, 2810–2818, https://doi.org/10.1021/acs.est.7b05771, 2018c.
Li, S. P., Matthews, J., and Sinha, A.: Atmospheric hydroxyl radical production from electronically excited NO2 and H2O, Science, 319, 1657–1660, https://doi.org/10.1126/science.1151443, 2008.
Li, Y., Wang, X., Wu, Z., Li, L., Wang, C., Li, H., Zhang, X., Zhang, Y., Li, J., Gao, R., Xue, L., Mellouki, A., Ren, Y., and Zhang, Q.: Atmospheric nitrous acid (HONO) in an alternate process of haze pollution and ozone pollution in urban Beijing in summertime: Variations, sources and contribution to atmospheric photochemistry, Atmos. Res., 260, 105689, https://doi.org/10.1016/j.atmosres.2021.105689, 2021.
Liu, J., Li, B., Deng, H., Yang, Y., Song, W., Wang, X., Luo, Y., Francisco, J. S., Li, L., and Gligorovski, S.: Resolving the Formation Mechanism of HONO via Ammonia-Promoted Photosensitized Conversion of Monomeric NO2 on Urban Glass Surfaces, J. Am. Chem. Soc., 145, 11488–11493, https://doi.org/10.1021/jacs.3c02067, 2023a.
Liu, J. Y., Liu, Z. R., Ma, Z. Q., Yang, S. H., Yao, D., Zhao, S. M., Hu, B., Tang, G. Q., Sun, J., Cheng, M. T., Xu, Z. J., and Wang, Y. S.: Detailed budget analysis of HONO in Beijing, China: Implication on atmosphere oxidation capacity in polluted megacity, Atmos. Environ., 244, 14, https://doi.org/10.1016/j.atmosenv.2020.117957, 2021.
Liu, P., Xue, C., Ye, C., Liu, C., Zhang, C., Wang, J., Zhang, Y., Liu, J., and Mu, Y.: The Lack of HONO Measurement May Affect the Accurate Diagnosis of Ozone Production Sensitivity, ACS Environ. Au., 3, 18–23, https://doi.org/10.1021/acsenvironau.2c00048, 2023b.
Liu, Y., Nie, W., Xu, Z., Wang, T., Wang, R., Li, Y., Wang, L., Chi, X., and Ding, A.: Semi-quantitative understanding of source contribution to nitrous acid (HONO) based on 1 year of continuous observation at the SORPES station in eastern China, Atmos. Chem. Phys., 19, 13289–13308, https://doi.org/10.5194/acp-19-13289-2019, 2019a.
Liu, Y., Zhao, Q., Hao, X., Zhao, J., Zhang, Y., Yang, X., Fu, Q., Xu, X., Wang, X., Huo, J., and Chen, J.: Increasing surface ozone and enhanced secondary organic carbon formation at a city junction site: An epitome of the Yangtze River Delta, China (2014–2017), Environ. Pollut., 265, 114847, https://doi.org/10.1016/j.envpol.2020.114847, 2020.
Liu, Y., Lu, K., Li, X., Dong, H., Tan, Z., Wang, H., Zou, Q., Wu, Y., Zeng, L., Hu, M., Min, K.-E., Kecorius, S., Wiedensohler, A., and Zhang, Y.: A Comprehensive Model Test of the HONO Sources Constrained to Field Measurements at Rural North China Plain, Environ Sci. Technol., 53, 3517–3525, https://doi.org/10.1021/acs.est.8b06367, 2019b.
Lu, K. D., Hofzumahaus, A., Holland, F., Bohn, B., Brauers, T., Fuchs, H., Hu, M., Häseler, R., Kita, K., Kondo, Y., Li, X., Lou, S. R., Oebel, A., Shao, M., Zeng, L. M., Wahner, A., Zhu, T., Zhang, Y. H., and Rohrer, F.: Missing OH source in a suburban environment near Beijing: observed and modelled OH and HO2 concentrations in summer 2006, Atmos. Chem. Phys., 13, 1057–1080, https://doi.org/10.5194/acp-13-1057-2013, 2013.
Ma, X. F., Tan, Z. F., Lu, K. D., Yang, X. P., Liu, Y. H., Li, S. L., Li, X., Chen, S. Y., Novelli, A., Cho, C. M., Zeng, L. M., Wahner, A., and Zhang, Y. H.: Winter photochemistry in Beijing: Observation and model simulation of OH and HO2 radicals at an urban site, Sci. Total Environ., 685, 85–95, 2019.
Ma, X., Tan, Z., Lu, K., Yang, X., Chen, X., Wang, H., Chen, S., Fang, X., Li, S., Li, X., Liu, J., Liu, Y., Lou, S., Qiu, W., Wang, H., Zeng, L., and Zhang, Y.: OH and HO2 radical chemistry at a suburban site during the EXPLORE-YRD campaign in 2018, Atmos. Chem. Phys., 22, 7005–7028, https://doi.org/10.5194/acp-22-7005-2022, 2022.
Michoud, V., Colomb, A., Borbon, A., Miet, K., Beekmann, M., Camredon, M., Aumont, B., Perrier, S., Zapf, P., Siour, G., Ait-Helal, W., Afif, C., Kukui, A., Furger, M., Dupont, J. C., Haeffelin, M., and Doussin, J. F.: Study of the unknown HONO daytime source at a European suburban site during the MEGAPOLI summer and winter field campaigns, Atmos. Chem. Phys., 14, 2805–2822, https://doi.org/10.5194/acp-14-2805-2014, 2014.
Michoud, V., Kukui, A., Camredon, M., Colomb, A., Borbon, A., Miet, K., Aumont, B., Beekmann, M., Durand-Jolibois, R., Perrier, S., Zapf, P., Siour, G., Ait-Helal, W., Locoge, N., Sauvage, S., Afif, C., Gros, V., Furger, M., Ancellet, G., and Doussin, J. F.: Radical budget analysis in a suburban European site during the MEGAPOLI summer field campaign, Atmos. Chem. Phys., 12, 11951–11974, https://doi.org/10.5194/acp-12-11951-2012, 2012.
Neftel, A., Blatter, A., Hesterberg, R., and Staffelbach, T.: Measurements of concentration gradients of HNO2 and HNO3 over a semi-natural ecosystem, Atmos. Environ., 30, 3017–3025, https://doi.org/10.1016/1352-2310(96)00011-8, 1996.
Nie, W., Ding, A. J., Xie, Y. N., Xu, Z., Mao, H., Kerminen, V.-M., Zheng, L. F., Qi, X. M., Huang, X., Yang, X.-Q., Sun, J. N., Herrmann, E., Petäjä, T., Kulmala, M., and Fu, C. B.: Influence of biomass burning plumes on HONO chemistry in eastern China, Atmos. Chem. Phys., 15, 1147–1159, https://doi.org/10.5194/acp-15-1147-2015, 2015.
Oswald, R., Behrendt, T., Ermel, M., Wu, D., Su, H., Cheng, Y., Breuninger, C., Moravek, A., Mougin, E., Delon, C., Loubet, B., Pommerening-Roser, A., Sorgel, M., Pöschl, U., Hoffmann, T., Andreae, M. O., Meixner, F. X., and Trebs, I.: HONO Emissions from Soil Bacteria as a Major Source of Atmospheric Reactive Nitrogen, Science, 341, 1233–1235, https://doi.org/10.1126/science.1242266, 2013.
Ren, X., Brune, W. H., Mao, J., Mitchell, M. J., Lesher, R. L., Simpas, J. B., Metcalf, A. R., Schwab, J. J., Cai, C., and Li, Y.: Behavior of OH and HO2 in the winter atmosphere in New York City, Atmos. Environ., 40, 252–263, https://doi.org/10.1016/j.atmosenv.2005.11.073, 2006.
Ren, X. R., Harder, H., Martinez, M., Lesher, R. L., Oliger, A., Simpas, J. B., Brune, W. H., Schwab, J. J., Demerjian, K. L., He, Y., Zhou, X. L., and Gao, H. G.: OH and HO2 chemistry in the urban atmosphere of New York City, Atmos. Environ., 37, 3639–3651, 10.1016/s1352-2310(03)00459-x, 2003.
Romer, P. S., Wooldridge, P. J., Crounse, J. D., Kim, M. J., Wennberg, P. O., Dibb, J. E., Scheuer, E., Blake, D. R., Meinardi, S., Brosius, A. L., Thames, A. B., Miller, D. O., Brune, W. H., Hall, S. R., Ryerson, T. B., and Cohen, R. C.: Constraints on Aerosol Nitrate Photolysis as a Potential Source of HONO and NOx, Environ Sci. Technol., 52, 13738–13746, 2018.
Scharko, N. K., Schütte, U. M. E., Berke, A. E., Banina, L., Peel, H. R., Donaldson, M. A., Hemmerich, C., White, J. R., and Raff, J. D.: Combined Flux Chamber and Genomics Approach Links Nitrous Acid Emissions to Ammonia Oxidizing Bacteria and Archaea in Urban and Agricultural Soil, Environ. Sci. Technol., 49, 13825–13834, https://doi.org/10.1021/acs.est.5b00838, 2015.
Shi, Q., Tao, Y., Krechmer, J. E., Heald, C. L., Murphy, J. G., Kroll, J. H., and Ye, Q.: Laboratory Investigation of Renoxification from the Photolysis of Inorganic Particulate Nitrate, Environ. Sci. Technol., 55, 854–861, 2021.
Song, Y., Zhang, Y., Xue, C., Liu, P., He, X., Li, X., and Mu, Y.: The seasonal variations and potential sources of nitrous acid (HONO) in the rural North China Plain, Environ. Pollut., 311, 119967, https://doi.org/10.1016/j.envpol.2022.119967, 2022.
Sörgel, M., Regelin, E., Bozem, H., Diesch, J.-M., Drewnick, F., Fischer, H., Harder, H., Held, A., Hosaynali-Beygi, Z., Martinez, M., and Zetzsch, C.: Quantification of the unknown HONO daytime source and its relation to NO2, Atmos. Chem. Phys., 11, 10433–10447, https://doi.org/10.5194/acp-11-10433-2011, 2011.
Spataro, F., Ianniello, A., Esposito, G., Allegrini, I., Zhu, T., and Hu, M.: Occurrence of atmospheric nitrous acid in the urban area of Beijing (China), Sci. Total Environ., 447, 210–224, https://doi.org/10.1016/j.scitotenv.2012.12.065, 2013.
Stemmler, K., Ammann, M., Donders, C., Kleffmann, J., and George, C.: Photosensitized reduction of nitrogen dioxide on humic acid as a source of nitrous acid, Nature, 440, 195–198, https://doi.org/10.1038/nature04603, 2006.
Stemmler, K., Ndour, M., Elshorbany, Y., Kleffmann, J., D'Anna, B., George, C., Bohn, B., and Ammann, M.: Light induced conversion of nitrogen dioxide into nitrous acid on submicron humic acid aerosol, Atmos. Chem. Phys., 7, 4237–4248, https://doi.org/10.5194/acp-7-4237-2007, 2007.
Stutz, J., Alicke, B., Ackermann, R., Geyer, A., Wang, S. H., White, A. B., Williams, E. J., Spicer, C. W., and Fast, J. D.: Relative humidity dependence of HONO chemistry in urban areas, J. Geophys. Res.-Atmos., 109, 14, https://doi.org/10.1029/2003jd004135, 2004.
Su, H., Cheng, Y. F., Oswald, R., Behrendt, T., Trebs, I., Meixner, F. X., Andreae, M. O., Cheng, P., Zhang, Y., and Pöschl, U.: Soil Nitrite as a Source of Atmospheric HONO and OH Radicals, Science, 333, 1616–1618, 2011.
Tan, Z., Fuchs, H., Lu, K., Hofzumahaus, A., Bohn, B., Broch, S., Dong, H., Gomm, S., Häseler, R., He, L., Holland, F., Li, X., Liu, Y., Lu, S., Rohrer, F., Shao, M., Wang, B., Wang, M., Wu, Y., Zeng, L., Zhang, Y., Wahner, A., and Zhang, Y.: Radical chemistry at a rural site (Wangdu) in the North China Plain: observation and model calculations of OH, HO2 and RO2 radicals, Atmos. Chem. Phys., 17, 663–690, https://doi.org/10.5194/acp-17-663-2017, 2017.
Tan, Z., Rohrer, F., Lu, K., Ma, X., Bohn, B., Broch, S., Dong, H., Fuchs, H., Gkatzelis, G. I., Hofzumahaus, A., Holland, F., Li, X., Liu, Y., Liu, Y., Novelli, A., Shao, M., Wang, H., Wu, Y., Zeng, L., Hu, M., Kiendler-Scharr, A., Wahner, A., and Zhang, Y.: Wintertime photochemistry in Beijing: observations of ROx radical concentrations in the North China Plain during the BEST-ONE campaign, Atmos. Chem. Phys., 18, 12391–12411, https://doi.org/10.5194/acp-18-12391-2018, 2018.
Theys, N., Volkamer, R., Müller, J. F., Zarzana, K. J., Kille, N., Clarisse, L., De Smedt, I., Lerot, C., Finkenzeller, H., Hendrick, F., Koenig, T. K., Lee, C. F., Knote, C., Yu, H., and Van Roozendael, M.: Global nitrous acid emissions and levels of regional oxidants enhanced by wildfires, Nat. Geosci., 13, 681–686, https://doi.org/10.1038/s41561-020-0637-7, 2020.
Tuite, K., Thomas, J. L., Veres, P. R., Roberts, J. M., Stevens, P. S., Griffith, S. M., Dusanter, S., Flynn, J. H., Ahmed, S., Emmons, L., Kim, S.-W., Washenfelder, R., Young, C., Tsai, C., Pikelnaya, O., and Stutz, J.: Quantifying Nitrous Acid Formation Mechanisms Using Measured Vertical Profiles During the CalNex 2010 Campaign and 1D Column Modeling, J. Geophys. Res.-Atmos., 126, e2021JD034689, https://doi.org/10.1029/2021JD034689, 2021.
VandenBoer, T. C., Brown, S. S., Murphy, J. G., Keene, W. C., Young, C. J., Pszenny, A. A. P., Kim, S., Warneke, C., de Gouw, J. A., Maben, J. R., Wagner, N. L., Riedel, T. P., Thornton, J. A., Wolfe, D. E., Dubé, W. P., Öztürk, F., Brock, C. A., Grossberg, N., Lefer, B., Lerner, B., Middlebrook, A. M., and Roberts, J. M.: Understanding the role of the ground surface in HONO vertical structure: High resolution vertical profiles during NACHTT-11, J. Geophys. Res.-Atmos., 118, 10155–110171, https://doi.org/10.1002/jgrd.50721, 2013.
VandenBoer, T. C., Young, C. J., Talukdar, R. K., Markovic, M. Z., Brown, S. S., Roberts, J. M., and Murphy, J. G.: Nocturnal loss and daytime source of nitrous acid through reactive uptake and displacement, Nat. Geosci., 8, 55–60, https://doi.org/10.1038/ngeo2298, 2015.
Vogel, B., Vogel, H., Kleffmann, J., and Kurtenbach, R.: Measured and simulated vertical profiles of nitrous acid – Part II, Model simulations and indications for a photolytic source, Atmos. Environ., 37, 2957–2966, 10.1016/s1352-2310(03)00243-7, 2003.
Wang, H., Huang, C., Tao, W., Gao, Y., Wang, S., Jing, S., Wang, W., Yan, R., Wang, Q., An, J., Tian, J., Hu, Q., Lou, S., Pöschl, U., Cheng, Y., and Su, H.: Seasonality and reduced nitric oxide titration dominated ozone increase during COVID-19 lockdown in eastern China, npj Clim. Atmos. Sci., 5, 24, https://doi.org/10.1038/s41612-022-00249-3, 2022.
Wang, N., Lyu, X. P., Deng, X. J., Huang, X., Jiang, F., and Ding, A. J.: Aggravating O3 pollution due to NOx emission control in eastern China, Sci. Total Environ., 677, 732–744, https://doi.org/10.1016/j.scitotenv.2019.04.388, 2019.
Wang, Y. A., Fu, X., Wu, D. M., Wang, M. D., Lu, K. D., Mu, Y. J., Liu, Z. G., Zhang, Y. H., and Wang, T.: Agricultural Fertilization Aggravates Air Pollution by Stimulating Soil Nitrous Acid Emissions at High Soil Moisture, Environ Sci. Technol., 55, 14556–14566, https://doi.org/10.1021/acs.est.1c04134, 2021.
Weber, B., Wu, D. M., Tamm, A., Ruckteschler, N., Rodriguez-Caballero, E., Steinkamp, J., Meusel, H., Elbert, W., Behrendt, T., Sorgel, M., Cheng, Y. F., Crutzen, P. J., Su, H., and Poschi, U.: Biological soil crusts accelerate the nitrogen cycle through large NO and HONO emissions in drylands, P. Natl. Acad. Sci. USA, 112, 15384–15389, https://doi.org/10.1073/pnas.1515818112, 2015.
Wong, K. W., Tsai, C., Lefer, B., Grossberg, N., and Stutz, J.: Modeling of daytime HONO vertical gradients during SHARP 2009, Atmos. Chem. Phys., 13, 3587–3601, https://doi.org/10.5194/acp-13-3587-2013, 2013.
Xia, D. M., Zhang, X. R., Chen, J. W., Tong, S. R., Xie, H. B., Wang, Z. Y., Xu, T., Ge, M. F., and Allen, D. T.: Heterogeneous Formation of HONO Catalyzed by CO2, Environ. Sci. Technol., 55, 12215–12222, https://doi.org/10.1021/acs.est.1c02706, 2021.
Xing, C., Liu, C., Wang, S., Chan, K. L., Gao, Y., Huang, X., Su, W., Zhang, C., Dong, Y., Fan, G., Zhang, T., Chen, Z., Hu, Q., Su, H., Xie, Z., and Liu, J.: Observations of the vertical distributions of summertime atmospheric pollutants and the corresponding ozone production in Shanghai, China, Atmos. Chem. Phys., 17, 14275–14289, https://doi.org/10.5194/acp-17-14275-2017, 2017.
Xing, C. Z., Liu, C., Hu, Q. H., Fu, Q. Y., Wang, S. S., Lin, H., Zhu, Y. Z., Wang, S. T., Wang, W. W., Javed, Z. S., Ji, X. G., and Liu, J. G.: Vertical distributions of wintertime atmospheric nitrogenous compounds and the corresponding OH radicals production in Leshan, southwest China, J. Environ. Sci., 105, 44–55, https://doi.org/10.1016/j.jes.2020.11.019, 2021.
Xu, W., Kuang, Y., Zhao, C., Tao, J., Zhao, G., Bian, Y., Yang, W., Yu, Y., Shen, C., Liang, L., Zhang, G., Lin, W., and Xu, X.: NH3-promoted hydrolysis of NO2 induces explosive growth in HONO, Atmos. Chem. Phys., 19, 10557–10570, https://doi.org/10.5194/acp-19-10557-2019, 2019.
Xu, Z., Wang, T., Wu, J., Xue, L., Chan, J., Zha, Q., Zhou, S., Louie, P. K. K., and Luk, C. W. Y.: Nitrous acid (HONO) in a polluted subtropical atmosphere: Seasonal variability, direct vehicle emissions and heterogeneous production at ground surface, Atmos. Environ., 106, 100–109, https://doi.org/10.1016/j.atmosenv.2015.01.061, 2015.
Xue, C., Ye, C., Kleffmann, J., Zhang, W., He, X., Liu, P., Zhang, C., Zhao, X., Liu, C., Ma, Z., Liu, J., Wang, J., Lu, K., Catoire, V., Mellouki, A., and Mu, Y.: Atmospheric measurements at Mt. Tai – Part II: HONO budget and radical (ROx + NO3) chemistry in the lower boundary layer, Atmos. Chem. Phys., 22, 1035–1057, https://doi.org/10.5194/acp-22-1035-2022, 2022.
Xue, C., Ye, C., Zhang, C., Catoire, V., Liu, P., Gu, R., Zhang, J., Ma, Z., Zhao, X., Zhang, W., Ren, Y., Krysztofiak, G., Tong, S., Xue, L., An, J., Ge, M., Mellouki, A., and Mu, Y.: Evidence for Strong HONO Emission from Fertilized Agricultural Fields and its Remarkable Impact on Regional O3 Pollution in the Summer North China Plain, ACS Earth Space Chem., 5, 340–347, https://doi.org/10.1021/acsearthspacechem.0c00314, 2021.
Xue, C. Y., Zhang, C. L., Ye, C., Liu, P. F., Catoire, V., Krysztofiak, G., Chen, H., Ren, Y. G., Zhao, X. X., Wang, J. H., Zhang, F., Zhang, C. X., Zhang, J. W., An, J. L., Wang, T., Chen, J. M., Kleffmann, J., Mellouki, A., and Mu, Y. J.: HONO Budget and Its Role in Nitrate Formation in the Rural North China Plain, Environ. Sci. Technol., 54, 11048–11057, 2020.
Yang, W. J., You, D., Li, C. H., Han, C., Tang, N., Yang, H., and Xue, X. X.: Photolysis of Nitroaromatic Compounds under Sunlight: A Possible Daytime Photochemical Source of Nitrous Acid?, Environ. Sci. Technol. Lett., 8, 747–752, https://doi.org/10.1021/acs.estlett.1c00614, 2021a.
Yang, X. P., Lu, K. D., Ma, X. F., Liu, Y. H., Wang, H. C., Hu, R. Z., Li, X., Lou, S. R., Chen, S. Y., Dong, H. B., Wang, F. Y., Wang, Y. H., Zhang, G. X., Li, S. L., Yang, S. D., Yang, Y. M., Kuang, C. L., Tan, Z. F., Chen, X. R., Qiu, P. P., Zeng, L. M., Xie, P. H., and Zhang, Y. H.: Observations and modeling of OH and HO2 radicals in Chengdu, China in summer 2019, Sci. Total Environ., 772, 144829, https://doi.org/10.1016/j.scitotenv.2020.144829, 2021.
Yang, Y. M., Li, X., Zu, K. X., Lian, C. F., Chen, S. Y., Dong, H. B., Feng, M., Liu, H. F., Liu, J. W., Lu, K. D., Lu, S. H., Ma, X. F., Song, D. L., Wang, W. G., Yang, S. D., Yang, X. P., Yu, X. N., Zhu, Y., Zeng, L. M., Tan, Q. W., and Zhang, Y. H.: Elucidating the effect of HONO on O3 pollution by a case study in southwest China, Sci. Total Environ., 756, 13, https://doi.org/10.1016/j.scitotenv.2020.144127, 2021c.
Ye, C., Zhou, X., Pu, D., Stutz, J., Festa, J., Spolaor, M., Tsai, C., Cantrell, C., Mauldin, R. L., Campos, T., Weinheimer, A., Hornbrook, R. S., Apel, E. C., Guenther, A., Kaser, L., Yuan, B., Karl, T., Haggerty, J., Hall, S., Ullmann, K., Smith, J. N., Ortega, J., and Knote, C.: Rapid cycling of reactive nitrogen in the marine boundary layer, Nature, 532, 489–491, https://doi.org/10.1038/nature17195, 2016.
Ye, C. X., Zhang, N., Gao, H. L., and Zhou, X. L.: Photolysis of Particulate Nitrate as a Source of HONO and NOx, Environ Sci. Technol., 51, 6849–6856, 2017.
Zhang, J., Lian, C., Wang, W., Ge, M., Guo, Y., Ran, H., Zhang, Y., Zheng, F., Fan, X., Yan, C., Daellenbach, K. R., Liu, Y., Kulmala, M., and An, J.: Amplified role of potential HONO sources in O3 formation in North China Plain during autumn haze aggravating processes, Atmos. Chem. Phys., 22, 3275–3302, https://doi.org/10.5194/acp-22-3275-2022, 2022a.
Zhang, L., Wang, T., Zhang, Q., Zheng, J. Y., Xu, Z., and Lv, M. Y.: Potential sources of nitrous acid (HONO) and their impacts on ozone: A WRF-Chem study in a polluted subtropical region, J. Geophys. Res.-Atmos., 121, 3645–3662, https://doi.org/10.1002/2015jd024468, 2016.
Zhang, W. Q., Tong, S. R., Lin, D., Li, F. J., Zhang, X. R., Wang, L. L., Ji, D. S., Tang, G. Q., Liu, Z. R., Hu, B., and Ge, M. F.: Atmospheric chemistry of nitrous acid and its effects on hydroxyl radical and ozone at the urban area of Beijing in early spring 2021, Environ. Pollut., 316, 9, https://doi.org/10.1016/j.envpol.2022.120710, 2023.
Zhang, W. Q., Tong, S. R., Jia, C. H., Ge, M. F., Ji, D. S., Zhang, C. L., Liu, P. F., Zhao, X. X., Mu, Y. J., Hu, B., Wang, L. L., Tang, G. Q., Li, X., Li, W. R., and Wang, Z.: Effect of Different Combustion Processes on Atmospheric NitrousAcid Formation Mechanisms: A Winter Comparative Observation inUrban, Suburban and Rural Areas of the North China Plain, Environ. Sci. Technol., 56, 4828–4837, https://doi.org/10.1021/acs.est.1c07784, 2022b.
Zhang, X. R., Tong, S. R., Jia, C. H., Zhang, W. Q., Li, J., Wang, W. G., Sun, Y. L., Wang, X., Wang, L. L., Ji, D. S., Wang, L. L., Zhao, P. S., Tang, G. Q., Xin, J. Y., Li, A., and Ge, M. F.: The Levels and Sources of Nitrous Acid (HONO) in Winter of Beijing and Sanmenxia, J. Geophys. Res.-Atmos., 127, 16, https://doi.org/10.1029/2021jd036278, 2022c.
Zhao, Y., Zhang, K., Xu, X., Shen, H., Zhu, X., Zhang, Y., Hu, Y., and Shen, G.: Substantial Changes in Nitrogen Dioxide and Ozone after Excluding Meteorological Impacts during the COVID-19 Outbreak in Mainland China, Environ. Sci. Technol. Lett., 7, 402–408, https://doi.org/10.1021/acs.estlett.0c00304, 2020.
Zhou, X., Gao, H., He, Y., Huang, G., Bertman, S. B., Civerolo, K., and Schwab, J.: Nitric acid photolysis on surfaces in low-NOx environments: Significant atmospheric implications, Geophys. Res. Lett., 30, 2217, https://doi.org/10.1029/2003GL018620, 2003.
Zhou, X., Zhang, N., TerAvest, M., Tang, D., Hou, J., Bertman, S., Alaghmand, M., Shepson, P. B., Carroll, M. A., Griffith, S., Dusanter, S., and Stevens, P. S.: Nitric acid photolysis on forest canopy surface as a source for tropospheric nitrous acid, Nat. Geosci., 4, 440–443, https://doi.org/10.1038/ngeo1164, 2011.