the Creative Commons Attribution 4.0 License.
the Creative Commons Attribution 4.0 License.
 | 18 Dec 2023
Future tropospheric ozone budget and distribution over east Asia under a net-zero scenario
Oliver Wild
Bin Zhu
James Lee
Under future net-zero emission policies, reductions in emissions of ozone (O3) precursors are expected to alter the temporal and spatial distributions of tropospheric O3. In this study, we quantify changes in the tropospheric O3 budget and in the spatiotemporal distribution of surface O3 in east Asia and the contributions of regional emissions, intercontinental transport and climate change between the present day and 2060 under a net-zero scenario using the NCAR Community Earth System Model (CESM) with online tagging of O3 and its precursors. The results reveal that the global tropospheric O3 burden is likely to decrease by more than 20 %, from 316 Tg in the present day to 247 Tg in 2060, under a net-zero scenario. The burden of stratospheric O3 in the troposphere is expected to increase from 69 to 77 Tg. The mean lifetime of tropospheric O3 is expected to increase by 2 d (∼10 %). Changes in climate under a net-zero pathway are relatively small and only lead to small increases in tropospheric O3. Over eastern China, surface O3 increases in winter due to the weakened titration of O3 by NO associated with reduced anthropogenic NO emissions and due to enhanced stratospheric input. In summer, surface O3 decreases by more than 30 ppbv, and peak concentrations shift from July to May. Local contributions from anthropogenic emissions to surface O3 over east Asia are highest in summer but drop substantially, from 30 % to 14 %, under a net-zero scenario. The contribution of biogenic NO sources is enhanced and forms the dominant contributor to future surface O3, especially in summer (∼40 %). This enhanced contribution is mainly due to the increased O3 production efficiency under lower anthropogenic precursor emissions. Over eastern China, local anthropogenic contributions decrease from 50 % to 30 %. The decreases in surface O3 are strongly beneficial and are more than sufficient to counteract the increases in surface O3 observed in China over recent years. This study thus highlights the important co-benefits of net-zero policies that target climate change in addressing surface O3 pollution over east Asia.
- Article
(7320 KB) - Full-text XML
-
Supplement
(946 KB) - BibTeX
- EndNote


Although ozone (O3) occurs naturally in small quantities in the lower troposphere, unhealthy levels of tropospheric O3 are created when high levels of anthropogenic pollutants, such as nitrogen oxides (NOx), and volatile organic compounds (VOCs) are oxidized in the presence of solar radiation. This excess O3 acts as a pollutant and greenhouse gas, contributing to harmful smog that damages human health and ecosystems (Jerrett et al., 2009; Malley et al., 2017; Emberson, 2020) and contributing to higher tropospheric temperatures (Myhre et al., 2013; Stevenson et al., 2013). The relatively short lifetime of O3 in the troposphere (∼3 weeks; Young et al., 2013) means that it is classified as a near-term climate forcer (NTCF), having an important influence on climate over shorter timescales compared to the long-lived greenhouse gases such as CO2. Tropospheric O3 is also an oxidant and a precursor for the hydroxyl (OH) radical (Griffiths et al., 2021). OH (and, by implication, O3) controls the lifetime of methane (Voulgarakis et al., 2013), the second most important anthropogenic greenhouse gas after carbon dioxide (Myhre et al., 2013). Oxidant levels mediate the formation of secondary aerosols such as sulfate and nitrate and play a major role in the aerosol budget and burden, with important consequences for radiative forcing (Shindell et al., 2009; Karset et al., 2018). Understanding how tropospheric O3 changes is important for both future air quality and climate (Turnock et al., 2019).
A multi-model assessment of future changes in tropospheric O3 was made in the Atmospheric Chemistry and Climate Model Intercomparison Project (ACCMIP), using future changes in climate and O3 precursor emissions from the Representative Concentration Pathways (RCPs) (Lamarque et al., 2013). The models participating in ACCMIP projected changes in global annual mean surface O3 concentrations between 2000 and 2030 of ±1.5 ppbv under the different RCPs (Young et al., 2013). More recent single-model estimates by O'Connor et al. (2014) and Kim et al. (2015) predict surface O3 responses across the different RCPs of between −4.0 and +2.0 ppbv by 2050 relative to 2000. The global annual mean tropospheric O3 burden was projected to change by between −18 % and +20 % from 2000 to 2100 under the different RCPs (Cionni et al., 2011; Kawase et al., 2011; O'Connor et al., 2014; Young et al., 2013). Whether tropospheric O3 increases or decreases in future is dependent on the climate mitigation measures and air pollution policies that are implemented. In preparation for the sixth Coupled Model Intercomparison Project (CMIP6), a new set of future pathways was created. Five different socio-economic pathways (SSPs) were developed with centennial trends based on different combinations of social, economic and environmental developments (O'Neill et al., 2014). Different levels of emission mitigation were included within each SSP to meet particular climate and air pollution targets (Rao et al., 2017; Riahi et al., 2017). They incorporate stronger links between socio-economic development patterns and climate change risks than previous assessments and provide better hypothetical scenarios for future projections. The five most widely used scenarios are SSP1-1.9, SSP1-2.6, SSP2-4.5, SSP3-7.0 and SSP5-8.5, where SSP1–SSP5 represent differing socio-economic pathways, and the suffixes 1.9–8.5 indicate the total radiative forcing (W m−2) at the end of the 21st century compared with that before the Industrial Revolution. These pathways provide a good foundation for an assessment of air quality, radiative forcing, ecological environmental effects and human health effects in the future. Many studies have focused on the pessimistic SSP3-7.0 scenario reflecting regional rivalry, and Griffiths et al. (2021) demonstrate that the tropospheric O3 burden increases from 356±31 Tg in the present day to 416±35 Tg in 2100 under this pathway. Liu et al. (2022) show that the tropospheric O3 burden increases by 4 % between 2010 and 2050 under SSP3-7.0. Based on multi-model simulations conducted for the Aerosol and Chemistry Model Intercomparison Project (AerChemMIP), Allen et al. (2020) and Zanis et al. (2022) reveal a global surface O3 decrease in the future under the SSP3-7.0 scenario due to enhanced ozone destruction from higher water vapor abundances under a warmer climate. The sustainability-focused SSP1-1.9 pathway is the scenario that is mostly closely aligned with recent pledges aiming for net zero greenhouse gas emissions, limiting warming to 1.5 ∘C by 2100, but the impacts of this pathway on tropospheric O3 are less well studied and remain unclear.
In east Asia, surface O3 has increased rapidly since 2000 (Lu et al., 2020) and is expected to increase by another ∼10 ppbv by 2050 following the IPCC A1B (Wang et al., 2013), RCP6.0 (Zhu and Liao, 2016) and RCP4.5 (Hong et al., 2019) scenarios. In September 2020, China committed to achieving carbon neutrality by 2060, following the commitments of many developed countries to achieving net-zero emissions by 2050. The effect of these strong mitigation measures on surface O3 has not been explored thoroughly, but the proposed emission pathway to net zero loosely aligns with the SSP1-1.9 pathway. Turnock et al. (2019) showed large reductions of more than 8 ppbv in surface O3 over east Asia by 2050 under this pathway due to large reductions in precursor emissions and CH4. The study also shows that any benefits to surface O3 from reducing local emission sources over east Asia could be offset by intercontinental transport of O3 formed from sources remote to the region and from global CH4 sources. This analysis used an O3 parameterization to rapidly assess changes in O3 and source attribution (Wild et al., 2012; Turnock et al., 2018) which did not account for changes in climate, stratosphere-to-troposphere exchange or chemical regime. Other recent assessments exploring the implications of carbon neutrality in China have suggested that O3 concentrations may decline to 63–94 µg m−3 by 2060 (Shi et al., 2021; Wang and Liao, 2022; Xu et al., 2022). The differences between these results have been attributed to the emission and climate scenarios used. Wang and Liao (2022) also found that the annual mean contribution of southeast Asia to surface MDA8 O3 in China is 3–19 µg m−3, about 2–10 ppbv, and this contribution is reduced in future under the SSP1-1.9 pathway.
While previous studies have quantified possible changes in surface O3 under carbon neutrality, the wider impact on the global tropospheric O3 budget and the changing contributions of different sources remain unclear. In this study, we quantify the changes in surface O3 over east Asia and especially over eastern China, which currently has high anthropogenic emissions, and consider the contribution of different sources based on emissions and climate change under the SSP1-1.9 pathway using the NCAR Community Earth System Model (CESM) with online tagging of O3 and its precursors. We present a self-consistent assessment of the changes in surface O3 associated with changes in emissions and climate, along with the first attribution of these changes. The paper is organized as follows. Section 2 describes the model configurations, experimental settings, O3-tagging method and evaluation datasets. In Sect. 3, O3 and NOx in present-day simulations are evaluated against observations. In Sect. 4, changes in tropospheric O3 under the net-zero scenario are presented. In Sect. 5, the contributions of O3 chemistry and intercontinental transport are discussed under present-day and future conditions. We close with a summary in Sect. 6.
2.1 Model configurations and experiments
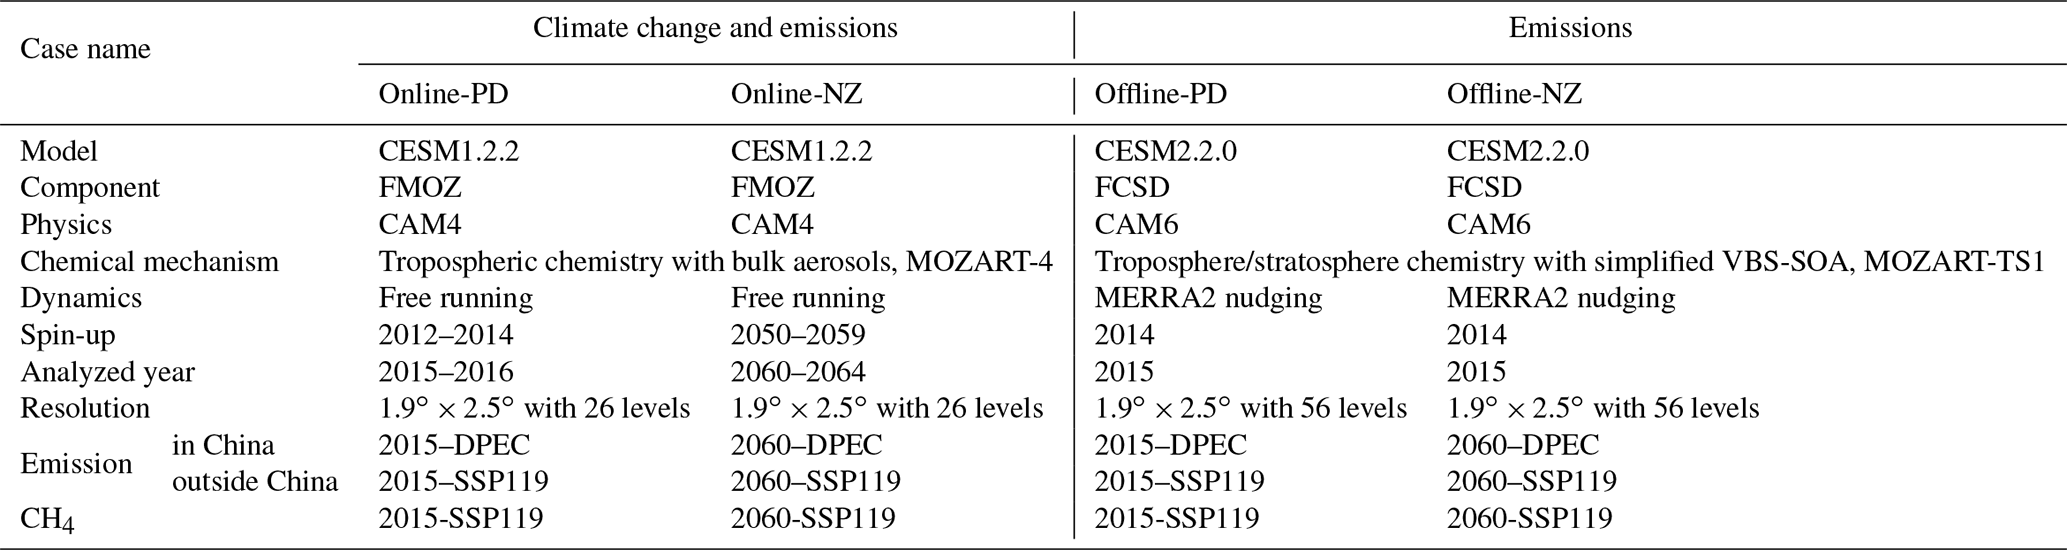
The NCAR CESM is a coupled climate model incorporating components for simulating the Earth's atmosphere, ocean, land, land ice and sea ice (e.g., Neale et al., 2013; Lamarque et al., 2012; Tilmes et al., 2015; Danabasoglu et al., 2020), allowing fundamental research into the Earth's past, present and future climate states. CESM showed excellent performance in CMIP6 (Eyring et al., 2016; Fan et al., 2020; Yang et al., 2021). The experiments here use CESM version 1.2.2 (https://www.cesm.ucar.edu/models/cesm1.2/, last access: 30 November 2023) and the latest version 2.2.0 (https://www.cesm.ucar.edu/models/cesm2/, last access: 30 November 2023) to reproduce present-day O3 mixing ratios and to predict O3 responses to emissions and climate in the future under the SSP1-1.9 pathway. All model simulations are performed with prescribed sea surface temperatures and sea ice distribution data for climatological conditions in the present day and future net zero since we focus on the atmospheric component. Dry deposition of gases and aerosols is implemented in the Community Land Model (Oleson et al., 2010) as described in Lamarque et al. (2012).
Atmospheric chemistry of gas phase and aerosol species in the global Community Atmosphere Model (CAM version 4, Neale et al., 2013; CAM version 6, Danabasoglu et al., 2020), the atmospheric component of CESM, is represented by CAM-chem. CAM-chem provides the flexibility of using the same code to perform climate simulations (online) and simulations with specified meteorological fields (offline). The chemical mechanism is based on the Model for Ozone and Related chemical Tracers (MOZART) version 4 mechanism for the troposphere (Emmons et al., 2010), extended for stratospheric chemistry (Kinnison et al., 2007), with further updates as described in Lamarque et al. (2012), including additional reaction rate updates following JPL-2010 recommendations (Sander et al., 2011).
In this paper, offline simulations are used to investigate the effect of emission changes on tropospheric O3 under fixed meteorological parameters, while online simulations are used for the effects of emission and climate changes with a two-way feedback of atmospheric components and meteorological parameters. Two different versions of CESM are used in this study due to the application of online tagging of O3 and its precursors, which is only fully tested and evaluated in CESM1. The use of a similar chemical mechanism (MOZART) in different model versions may reduce the uncertainties in the simulation results. All simulations discussed in this paper are performed at a horizontal resolution of 1.9∘ (latitude) and 2.5∘ (longitude). The model has 26 vertical levels in the online configuration and 56 levels in the offline configuration using specified meteorological fields; in all these cases, the model extends to approximately 4 hPa (≈40 km). Offline simulations were driven by Modern Era Retrospective analysis for Research and Applications version 2 (MERRA2) meteorology (Rienecker et al., 2011). Simulations using present-day emissions (2015) are labeled PD, while those using future net-zero emissions (2060) are labeled NZ, and these are prefixed with online or offline depending on whether the model is run online or driven by MERRA2 meteorology. To ensure the stability of the response to climate change, the future online simulations are run for 15 years, with the first 10 years being used as spin-up. The CH4 concentrations are prescribed following the SSP1-1.9 pathway using a fixed lower-boundary condition. A summary of the simulations is provided in Table 1.
2.2 Emissions
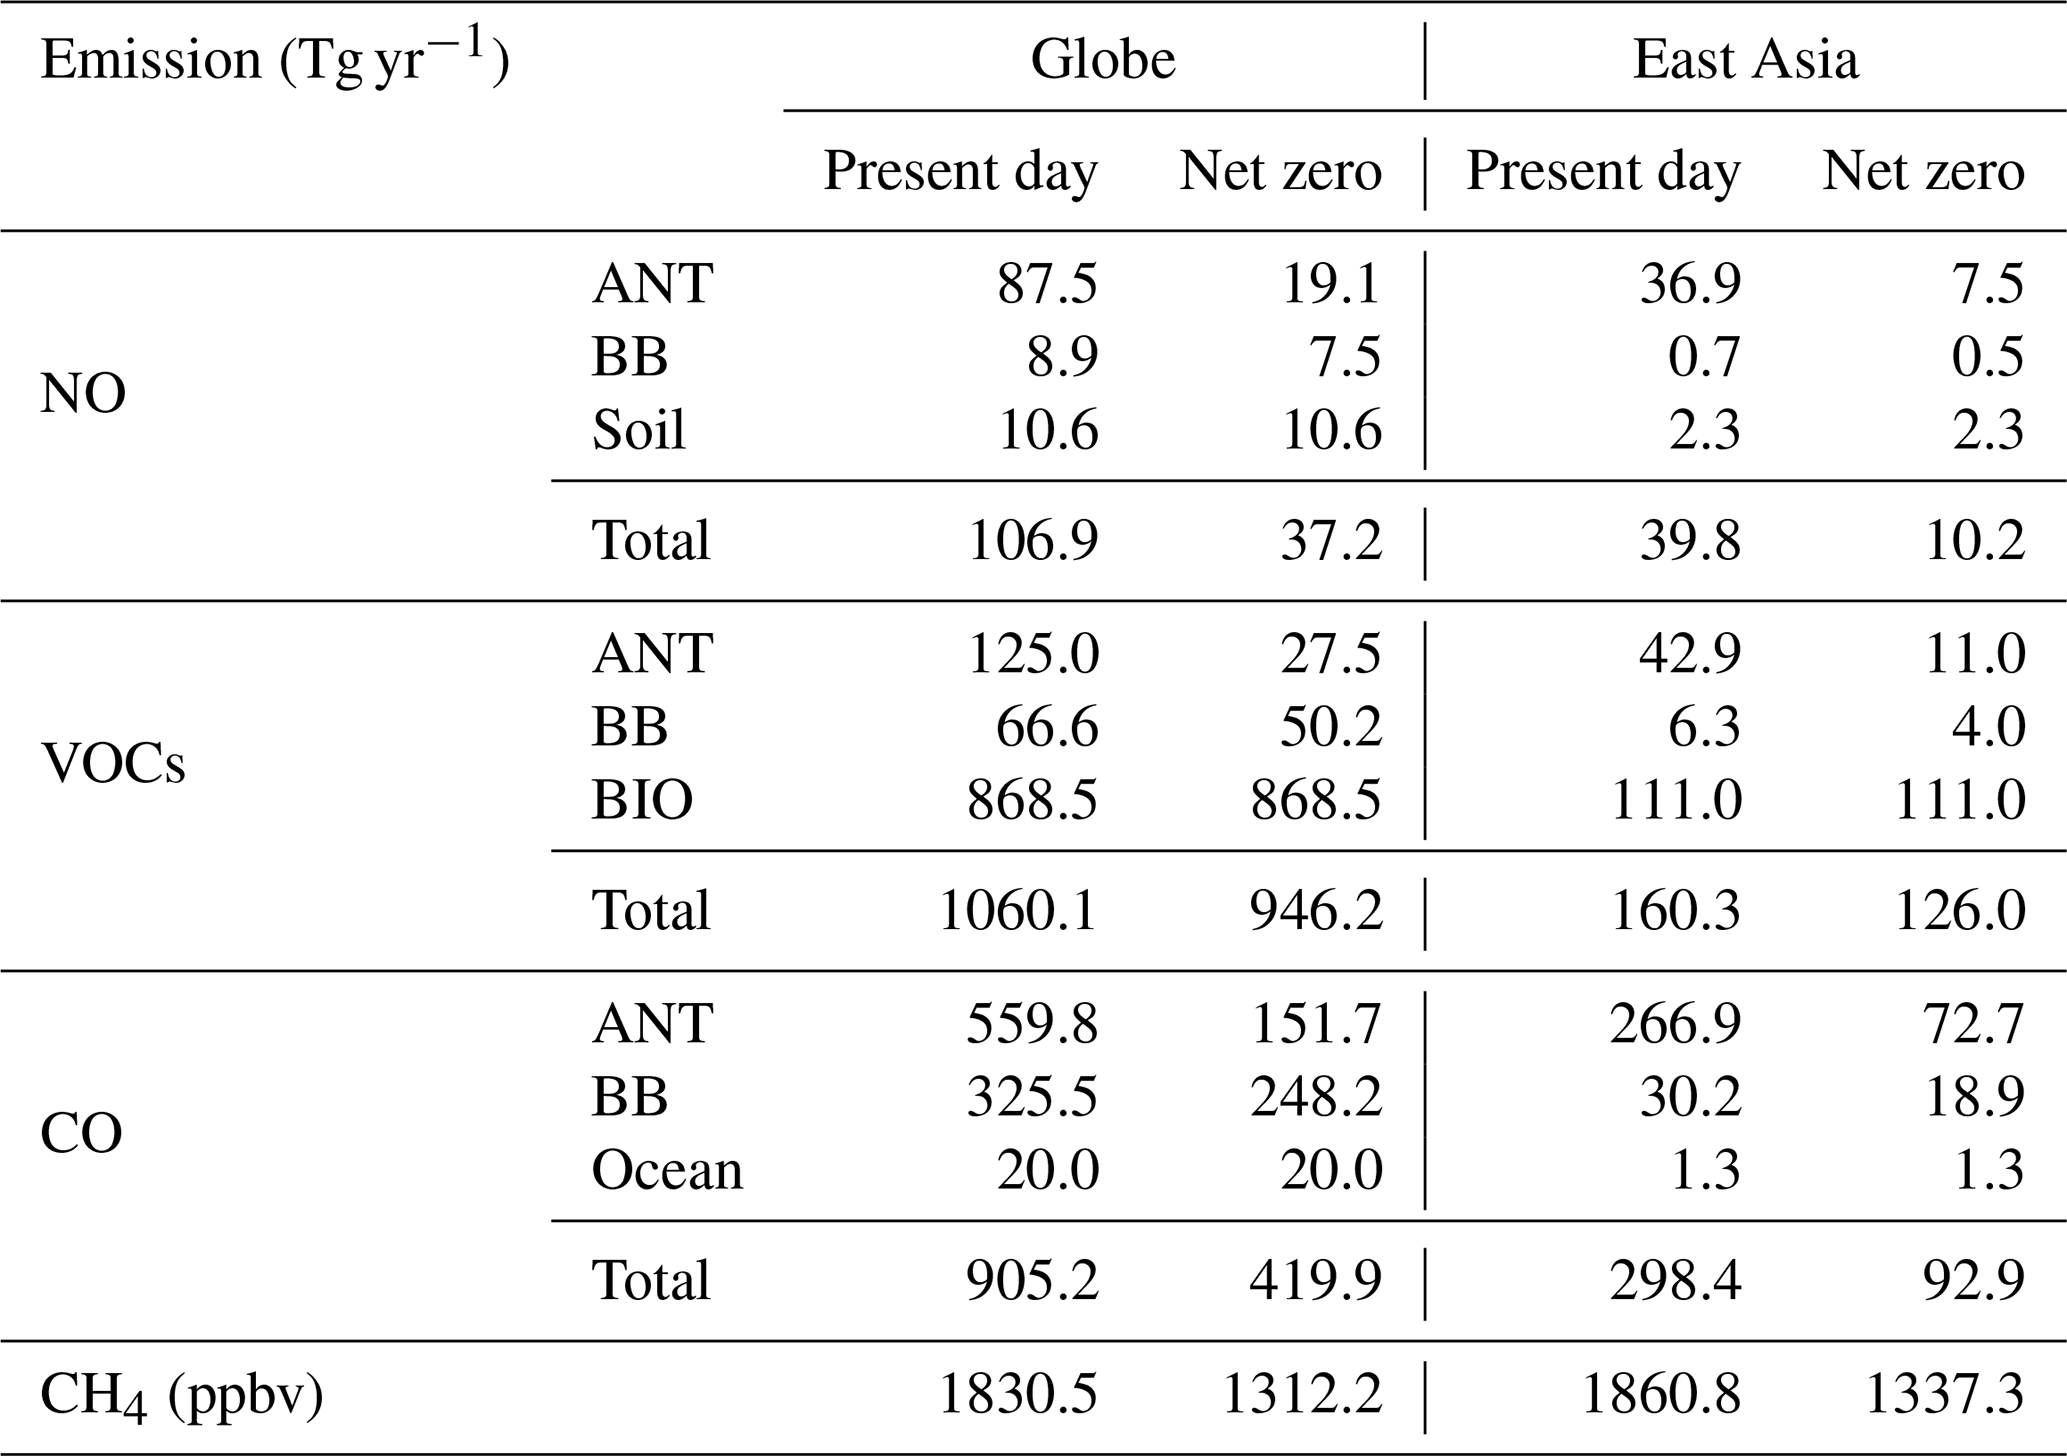
For this analysis, we use estimates of global future anthropogenic and biomass burning emissions and future abundances of greenhouse gases and aerosols provided by the SSP1-1.9 pathway (https://esgf-node.llnl.gov/projects/input4mips/, last access: 30 November 2023) along with more recent estimates for China using the Ambitious-pollution-Neutral-goals scenario from the Dynamic Projection model for Emissions in China (DPEC, http://meicmodel.org/, last access: 30 November 2023). The SSP1-1.9 pathway results in a climate radiative forcing of 1.9 W m−2 by 2100 under the sustainable-development path. The SSP1-1.9 pathway is a strong pollution control scenario and is the only route to limit the global average temperature increase since the preindustrial period to 1.5 ∘C by 2100 (O'Neill et al., 2014; Rao et al., 2017; Riahi et al., 2017). The emissions inventory includes monthly atmospheric pollutants, aerosols and O3 precursors (NOx, CO, non-methane volatile organic (VOCs), sulfur dioxide (SO2), ammonia (NH3), black carbon (BC), organic carbon (OC), dimethyl sulfide (DMS)) and concentrations of greenhouse gases such as CH4. Biogenic emissions of VOCs are calculated online in CESM using the Model of Emissions of Gases and Aerosols from Nature model (MEGAN; Guenther et al., 2006, 2012). We use emissions for the years 2015 and 2060. Over China, the anthropogenic emissions are replaced by the Ambitious-pollution-Neutral-goals scenario from DPEC (Tong et al., 2020; Cheng et al., 2021). This considers a scenario in which China achieves carbon neutrality by 2060. The DPEC anthropogenic emissions are based on SSP scenarios and MEIC but give anthropogenic emissions at a higher resolution in China, which more accurately characterizes China's emission sources and reflects recent rapid changes in emissions. The total anthropogenic NO emission in China in the Ambitious-pollution-Neutral-goals scenario from DPEC is 1.1 Tg yr−1 lower in the present day than in SSP1-1.9 and 1.5 Tg yr−1 lower in 2060, but in most regions of eastern China, it is slightly higher. The combined emission distributions for NOx and its changes in future are shown in Fig. S1 in the Supplement. The total annual mean surface emissions of key pollutants from anthropogenic (ANT), biomass burning (BB) and biogenic (BIO) sources for the present day (2015) and future net zero (2060) over the globe and in east Asia are listed in Table 2.
The global anthropogenic emissions of all O3 precursors are significantly reduced in the net-zero scenario. Due to strict control policies on pollutant emissions and changes in technology and behavior, global anthropogenic NO emissions decrease from 87 Tg yr−1 in the present day to 19 Tg yr−1 in 2060, and total anthropogenic VOC emissions decrease from 125 to 28 Tg yr−1. Biomass burning emissions also decrease slightly. Natural NO soil emission, VOC biogenic emission and CO ocean emission are assumed not to change in this study as changes in land use are relatively small. Anthropogenic emissions over east Asia account for more than 35 % of the global total, with biomass combustion emissions accounting for a smaller proportion at ∼10 % and with natural emissions of NO, VOCs and CO accounting for ∼20 %. The decrease of anthropogenic emissions over east Asia (about 80 % for NO) is greater than the global average of >70 %, which may be due to the high present-day emissions over the region, especially in eastern China. The global CH4 concentration decreases from the current 1831 ppbv to 1312 ppbv due to the lower global CH4 emissions under net zero.
Table 2Annual mean time-varying surface emissions of NOx, VOCs and CO from anthropogenic (ANT), biomass burning (BB) and biogenic (BIO) emissions for the present day (2015) and future (2060, net zero) in east Asia and over the globe. Annual mean surface CH4 mixing ratios (ppbv) are also shown.
2.3 Tagging of ozone
In this study, we use the Tropospheric Ozone Attribution of Sources with Tagging (TOAST) ozone methodology in CESM1.2.2 previously described by Butler et al. (2018, 2020) to perform separate source attributions of ground-level O3 to NOx. The parameterizations based on the work of Butler et al. (2018, 2020) include tagging the biogenic, biomass burning and anthropogenic emissions of NOx or VOCs by their geographical source regions. This tagging methodology allows us to examine the seasonal cycle of the surface O3 attribution in receptor regions using the geographical locations defined in the Hemispheric Transport of Air Pollutants Phase 2 (HTAP2, Janssens-Maenhout et al., 2015; Koffi et al., 2016). We consider 16 sources, including 11 geographical source regions for anthropogenic NOx emission, shown in Table 3 and Fig. 1; NOx emissions from biogenic sources (BIO); biomass burning (BB); aircraft (AIR) and lightning (LIG); and O3 originating in the stratosphere (STR).
Table 3Source sector tagging of anthropogenic NOx emissions by geographical source region, NOx emissions from biogenic burning, soil emission, aircraft and lightning and the contribution of stratospheric O3 input.
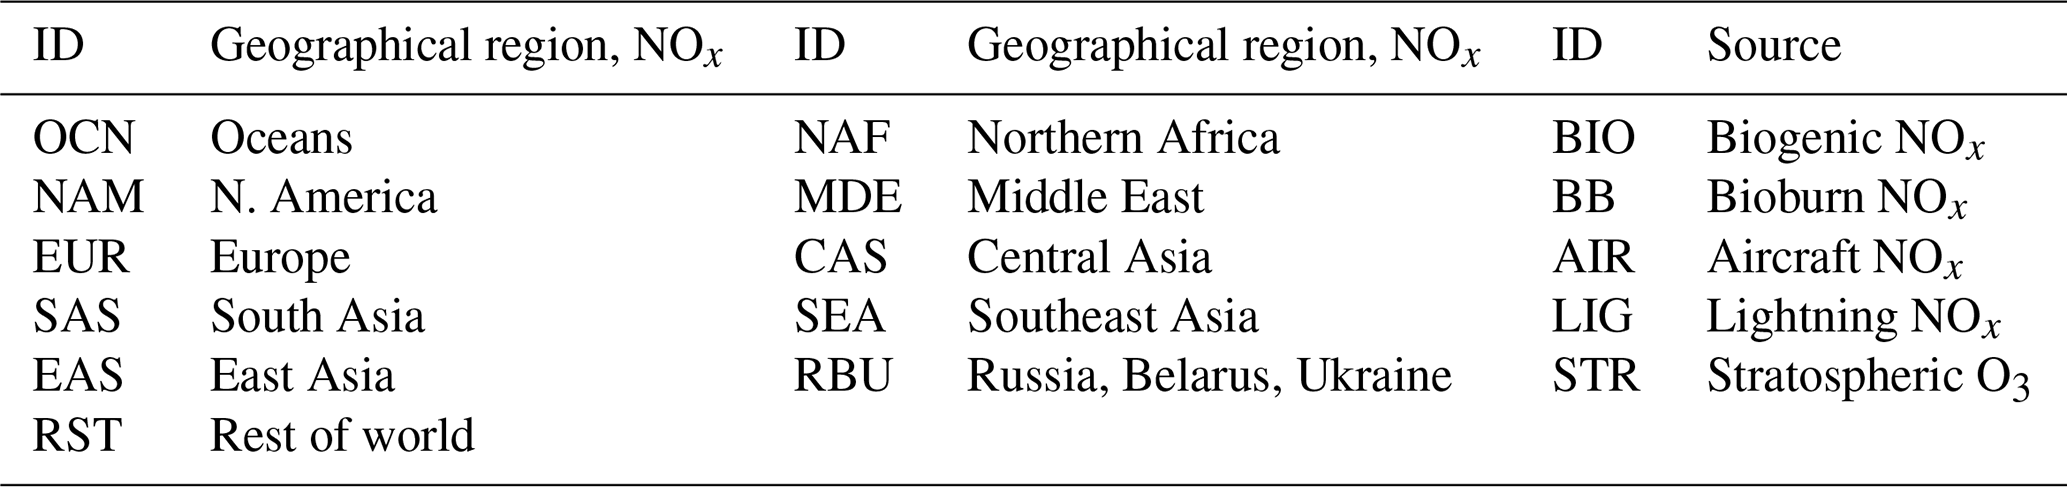
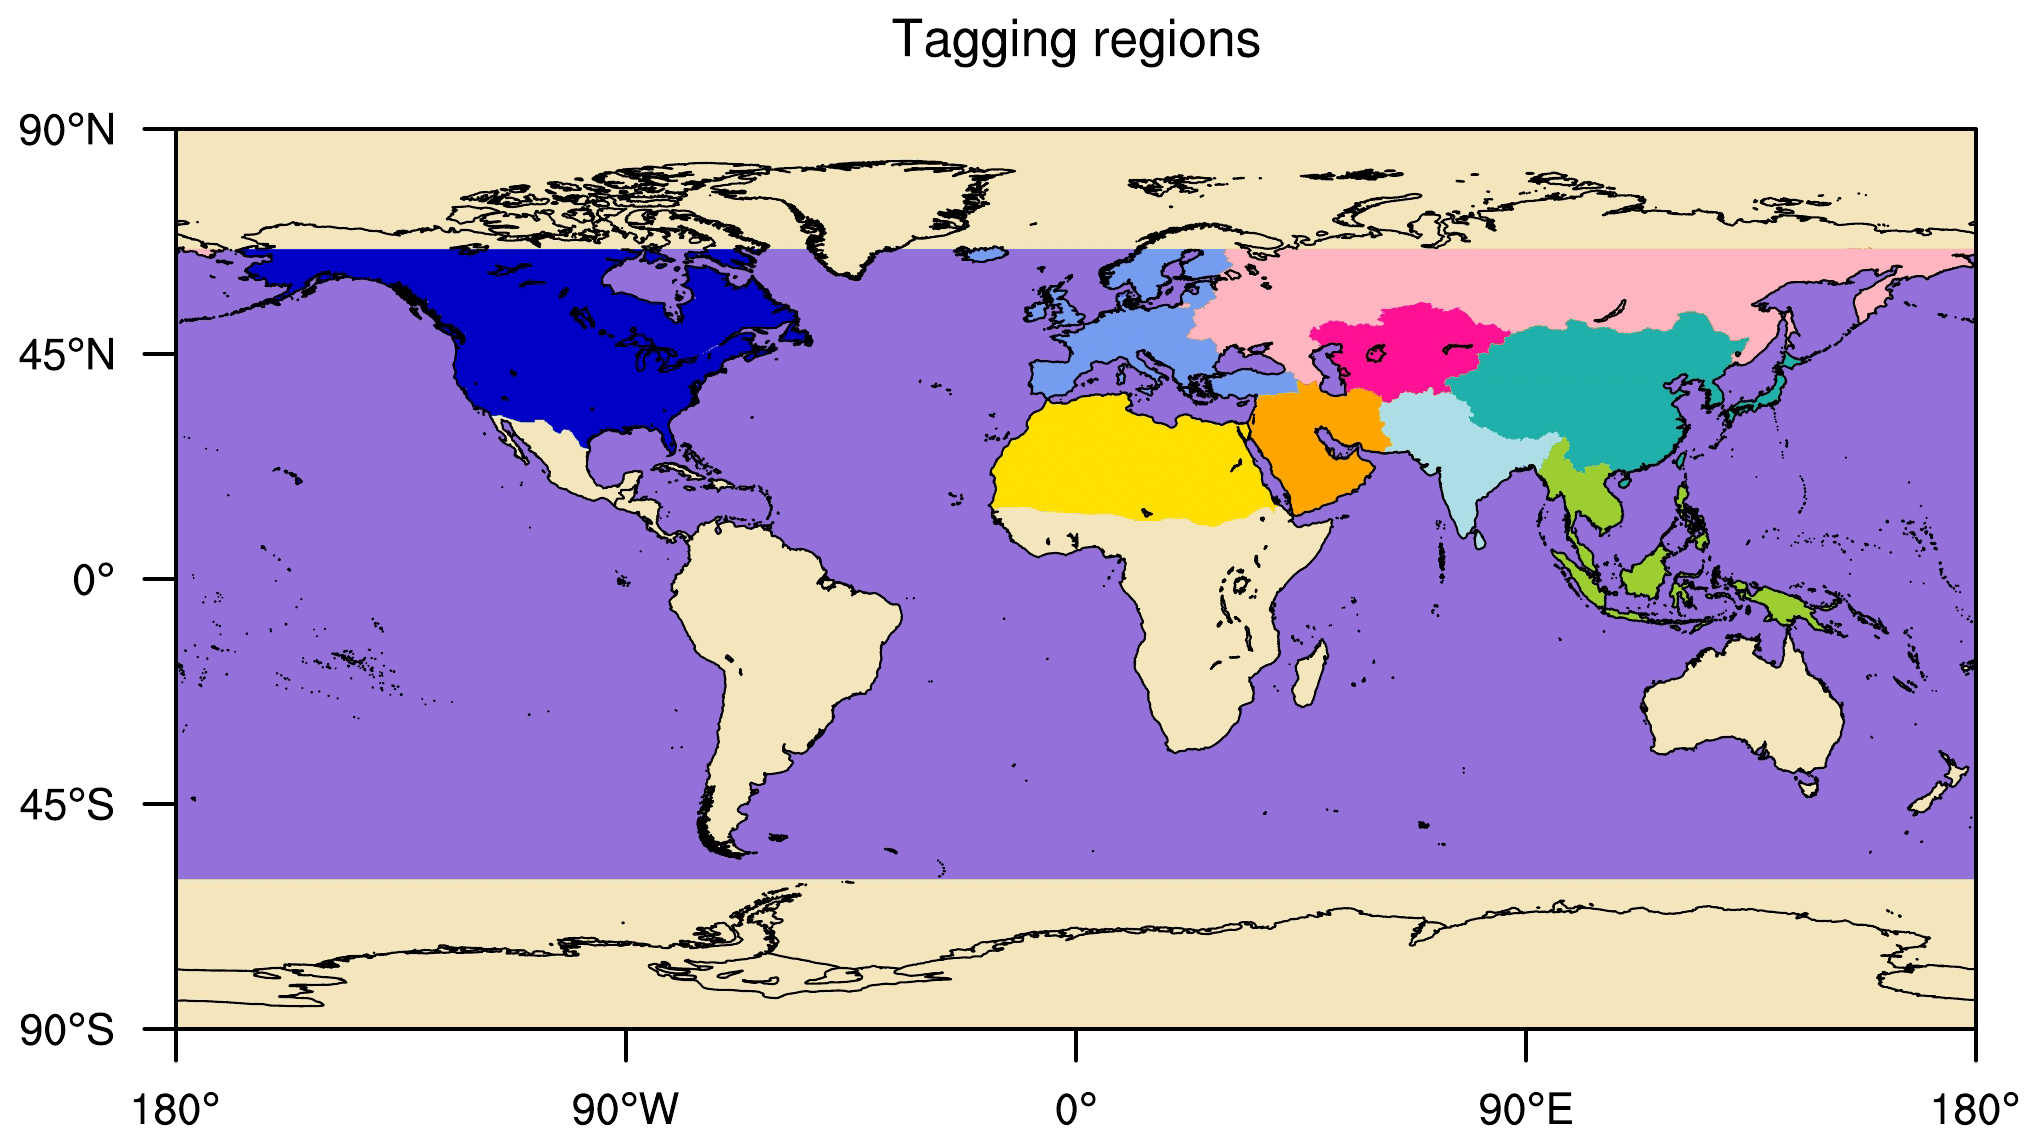
Figure 1Geographical source regions for tagging anthropogenic NOx emissions in this study, as defined in HTAP Phase 2.
2.4 Measurement data
To evaluate tropospheric column O3 in the model simulations, we use a present-day satellite dataset of tropospheric column O3 which was derived by combining retrievals from the Aura Ozone Monitoring Instrument (OMI) and Microwave Limb Sounder (MLS) observations (https://acd-ext.gsfc.nasa.gov/Data_services/cloud_slice/, last access: 30 November 2023). More details about the generation of this dataset are provided by Ziemke et al. (2011). The dataset resolution used in this study is 1∘ (latitude) × 1.25∘ (longitude), and the year is 2015. The monthly mean thermal tropopause pressure is used to separate tropospheric and stratospheric O3 for the model results and satellite observations.
A high-resolution Air Quality Reanalysis Dataset over China (CAQRA, Kong et al., 2021; Tang et al., 2020a, b) is used to evaluate the simulated present-day surface O3 over China. This dataset is generated by assimilating surface observations from the China National Environmental Monitoring Centre (CNEMC) into the Nested Air Quality Prediction Modeling System (Tang et al., 2011; Wang et al., 2000), and it provides self-consistent concentration fields of O3 in China from 2013 to 2019 at high spatial (15 km) and temporal (1 h) resolutions. The year used in this study is 2015.
In addition, monthly observational surface O3 concentration are taken from 12 regional stations of the Acid Deposition Monitoring Network in east Asia (EANET; https://www.eanet.asia/, last access: 30 November 2023) for 2015: Rishiri, Ochiishi, Tappi, Sado-Seki, Happo, Oki, Yusuhara, Hedo, Mondy, Listvyanka, Kanghwa and Cheju. The locations and altitudes of these sites are shown in Fig. S2.
We compared the simulated monthly mean tropospheric column O3 (TCO) with that derived from OMI/MLS for January and July in 2015 (Fig. 2). The model captures the general features of the observed tropospheric column, reproducing the seasonal pattern, with a minimum of 15 DU at 180∘ E in the tropics during January and a maximum of >50 DU in the Northern Hemisphere at mid-latitudes during July. The highest values in the northern mid-latitudes are overestimated in both offline and online simulations, especially during July. In the simulations, TCO was calculated by integrating the O3 from the surface to the tropopause. Some of the differences between the simulated TCO and OMI/MLS may be due to the relatively coarse vertical resolution of the model (26 levels in online simulations and 56 levels in offline simulations). Uncertainty in the satellite dataset (exceeding 5 DU in high latitudes; Ziemke et al., 2011) might also contribute to these differences. The accuracy of the emission inventory also affects the simulation results, especially at the surface. The global (60∘ S–60∘ N) annual mean tropospheric O3 columns from the offline and online simulations are 29.0 and 32.3 DU, respectively, which match those from OMI/MLS (31.7 DU) and the ACCMIP models' mean values (30.8 DU; Young et al., 2013) well. The online simulated tropospheric ozone column global annual average is the highest due to the coarser vertical resolution in the online simulation (Lamarque et al., 2012).
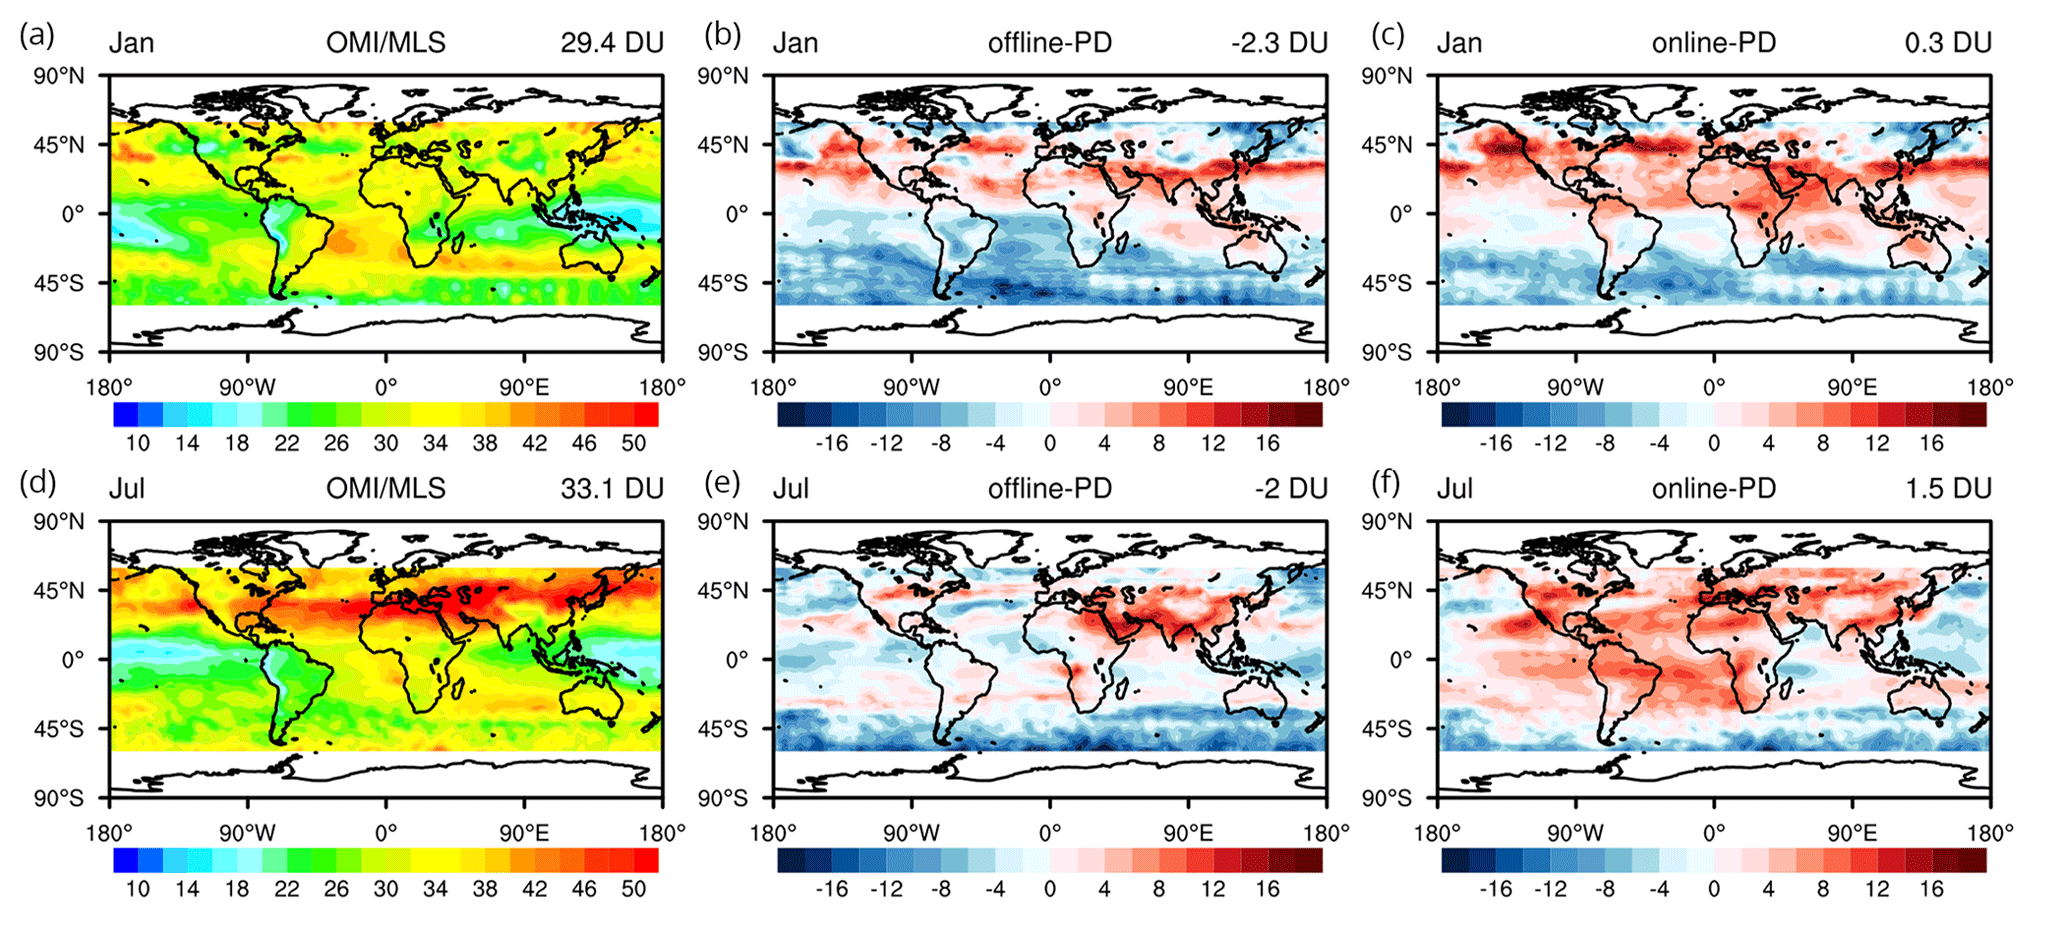
Figure 2Tropospheric column O3 (DU) from OMI/MLS (a, d) and the biases of offline (b, e) and online (c, f) simulations for January and July under present-day conditions. The biases are the simulated result minus the satellite (OML/MLS) result. The values in the right corner of each sub-figure are the average over the globe (−60∘ S to 60∘ N).
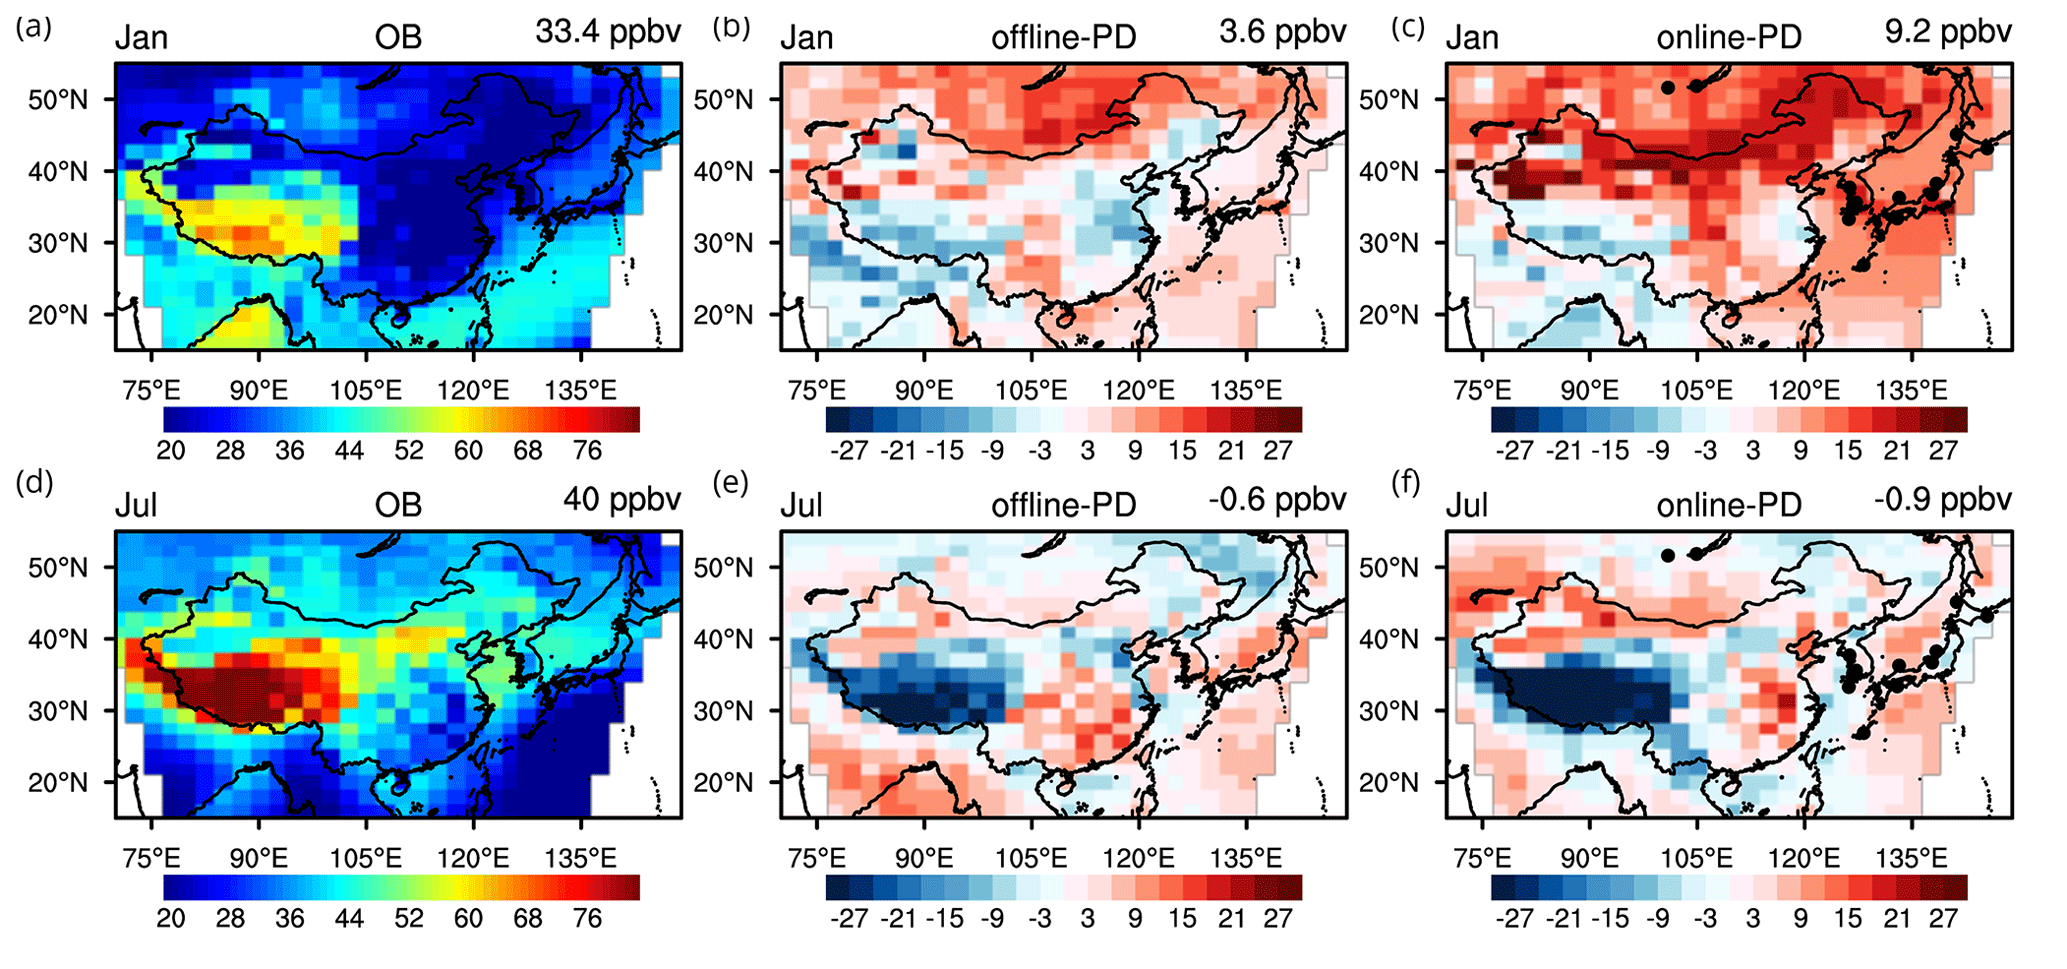
Figure 3Surface O3 mixing ratios in east Asia (ppbv) from the CAQRA reanalysis (a, d) and the biases from offline (b, e) and online (c, f) present-day simulations in January and July. The biases are the simulations minus the observations, and black dots show the locations of EANET observation sites. The values in the right corner of each sub-figure are the regional mean for east Asia (15–55∘ N, 70–149∘ E).
As shown in Fig. 3, surface O3 shows substantial seasonal variations with low concentrations in winter and high concentrations in summer. The spatial distributions of simulated surface O3 concentrations match the observations well. The online simulated surface O3 (ppbv) is overestimated by 9.2 ppbv on average in winter, especially in Mongolia, north and middle of China, Korea, and Japan, while the offline simulation is much closer to the observation with a bias of 3.6 ppbv. The coarser resolution of the online model is likely a reason for its higher bias. The comparison of simulated surface O3 (ppbv) with EANET observations shows that the simulations reproduce the seasonal variations at these 12 sites (Fig. S2 in the Supplement). In general, the performance of these simulations is very similar to those from other chemical model studies (Li et al., 2019; Young et al., 2018).
An overview of the global model diagnostics for the simulation experiments is given in Table 4. The tropospheric O3 burden and budget terms for present-day conditions in this study match previous results well. Under net zero, the chemical production decreases from 5038 to 3392 Tg(O3) yr−1, and the chemical loss decreases from 4641 to 3311 Tg(O3) yr−1. The net chemical tendency of tropospheric O3 (NetChem in Table 4) drops substantially, decreasing from the current 397 to 81 Tg(O3) yr−1 due to the large reduction in O3 precursor emissions (Table 2). This results in an increase in the lifetime of tropospheric O3 from 20 to 22 d. The residual term, which principally reflects net transport from the stratosphere, increases from the current 595 to 626 Tg(O3) yr−1. The global tropospheric O3 burden decreases by about 20 %, from 316 to 247 Tg, bringing it close to the mean burden of 239±22 Tg estimated for the pre-industrial period (Young et al., 2013; Griffiths et al., 2021). The burden of O3 of stratospheric origin in the troposphere (O3S) increases from 69 to 77 Tg. This increased stratospheric contribution may be due to the enhancement of stratospheric circulation and increased stratosphere–troposphere exchange caused by climate change (Sudo et al., 2003; Lu et al., 2019) and has been seen in previous studies (e.g., Zanis et al., 2022). In addition, the longer chemical lifetime allows stratospheric O3 to persist for longer in the troposphere, enhancing the stratospheric contribution. Compared with pre-industrial conditions (Griffiths et al., 2021; Table 4), the net chemical production rate is slower, while the stratospheric contribution is higher. This may indicate that anthropogenic influence is somewhat weaker than that in the pre-industrial. Compared with other SSP scenarios, particularly the much-studied SSP3-7.0 pathway (Liu et al., 2022; Griffiths et al., 2021), SSP1-1.9 provides a more positive perspective on the opportunities for controlling future tropospheric O3 and the benefits for air quality.
Over east Asia, the net photochemical production of tropospheric O3 also decreases significantly, from the current 227 to 137 Tg(O3) yr−1 under net zero, but the reduction is less than the global average, and this is attributed to the higher emissions and smaller reductions in precursors over east Asia. The negative residual budget term for east Asia indicates that the production is larger than the sink, and the total contribution of vertical and horizontal transport from outside of east Asia is negative. This indicates that there is net outflow from east Asia with transport of tropospheric O3 to other regions, and this outflow is weakened in the future, from 89 Tg(O3) yr−1 under present-day conditions to 38 Tg(O3) yr−1 under net zero. The tropospheric O3 burden in east Asia decreases from 25 to 19 Tg, while the burden of O3 from the stratosphere increases slightly from 5 to 6 Tg. The tropospheric O3 lifetime in east Asia is 15 d, slightly lower than the global average due to the faster photochemical processing under relatively high anthropogenic emissions. But the increase of ∼2 d matches that of the global average.
Table 4Global tropospheric O3 burden (Tg) and budget terms (Tg yr−1) in chemical transport models. Bold font represents the simulated results of this study.
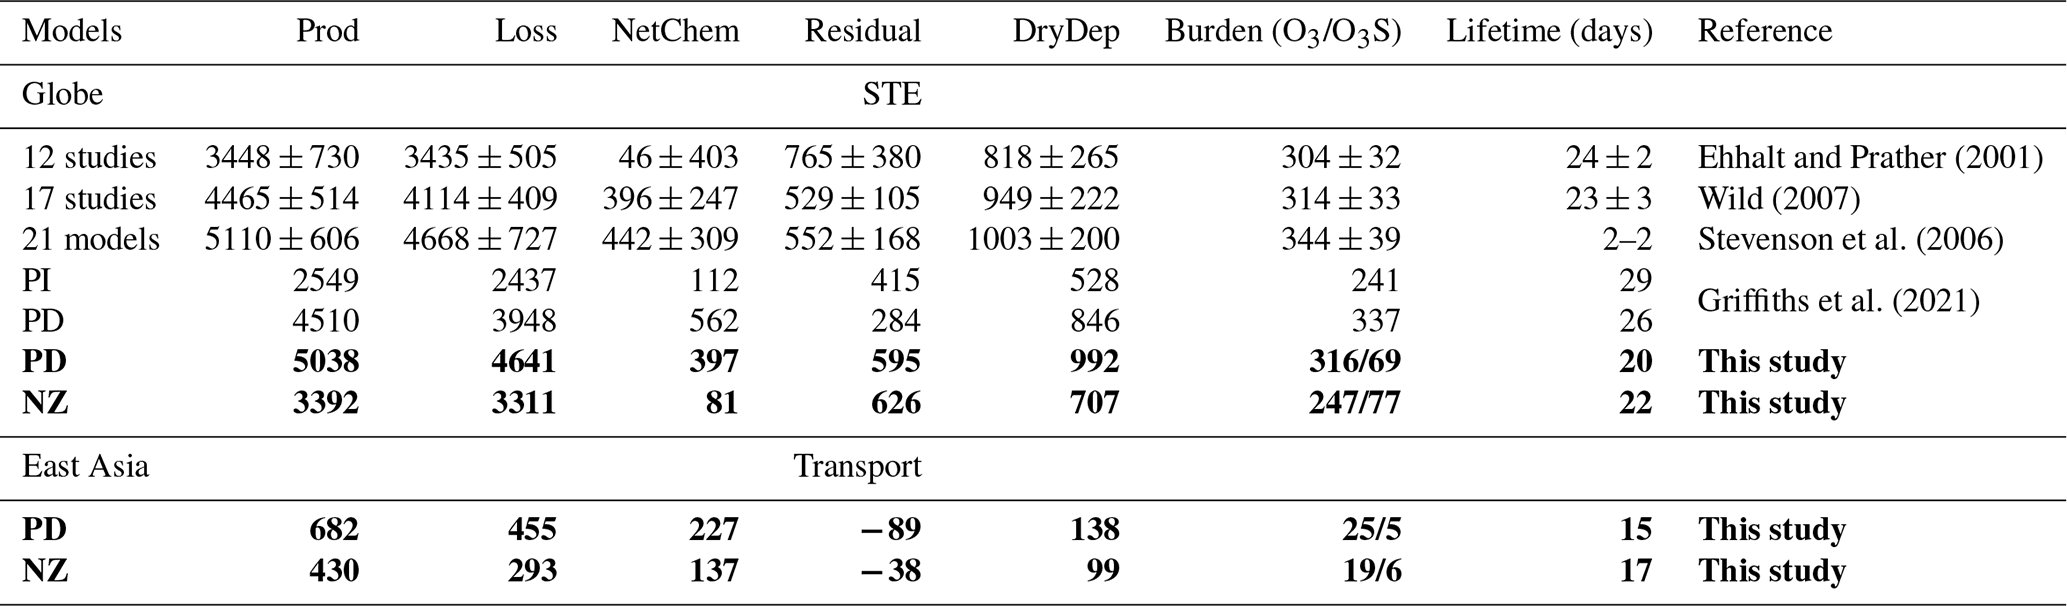
Prod is for chemical production, Loss is for chemical loss, Prod-Loss is for net chemical production (NetChem), and DryDep is for dry deposition; Residual is the term balance by Residual = Loss-Prod + DryDep. Units of Prod, Loss, NetChem, Residual and DryDep are in Tg(O3) yr−1, Burden is in Tg(O3), and Lifetime is in days. The climatological pressure tropopause is used. PD is the online present-day experiment simulation. NZ is the online net-zero experiment simulation. The results of Griffiths et al. (2021) are the average of four models (UKESM1, CESM2-WACCM, GFDL-ESM4, MRI-ESM2-0), and PD is the average from 1995 to 2004, while PI (pre-industrial) is the average from 1850 to 1859. Bold font represents the simulated results of this study.
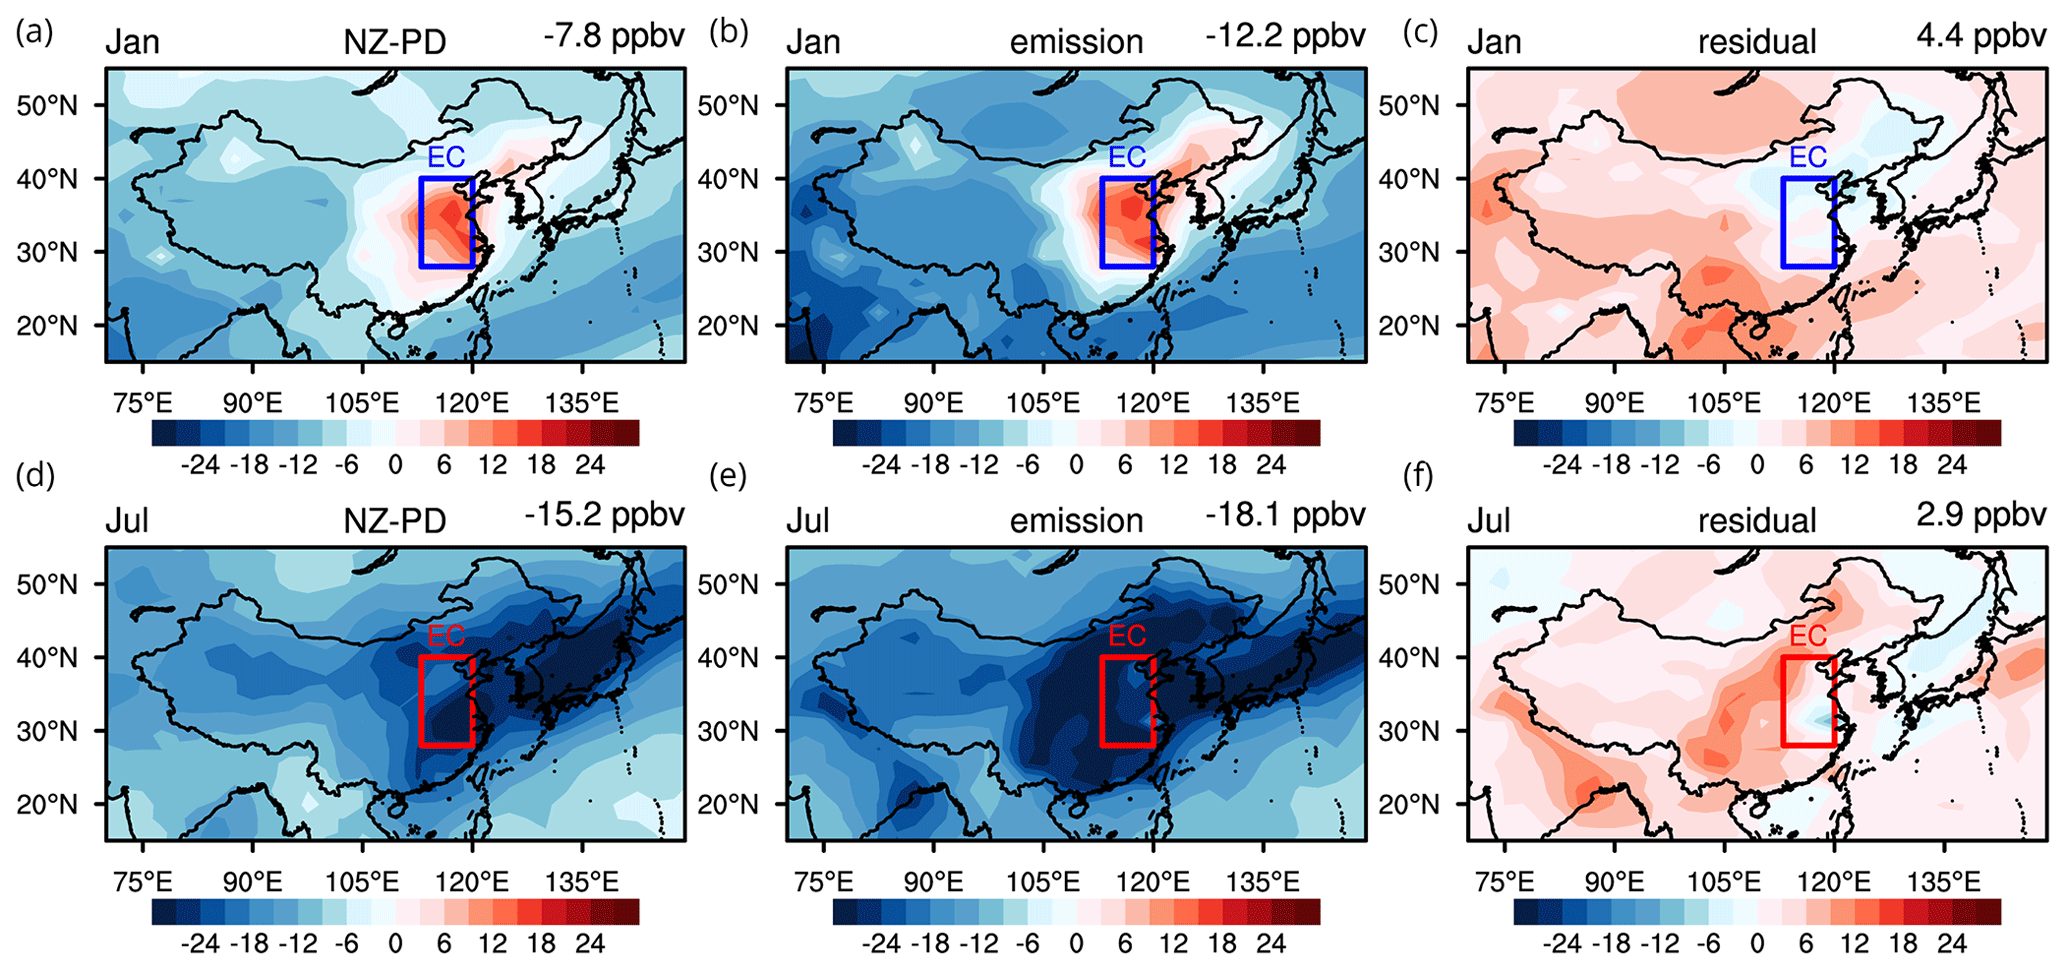
Figure 4Changes in surface O3 mixing ratio (ppbv) over China in January and July between present day and net zero (online-NZ minus online-PD; a, d) and changes due to emissions (offline-NZ minus offline-PD; b, e) and the residual (left minus middle panel; c, f). The values in the right corner of each panel are the region means over east Asia (15–55∘ N, 70–149∘ E). The frame is the region of eastern China (EC, 28–40∘ N, 113–120∘ E).
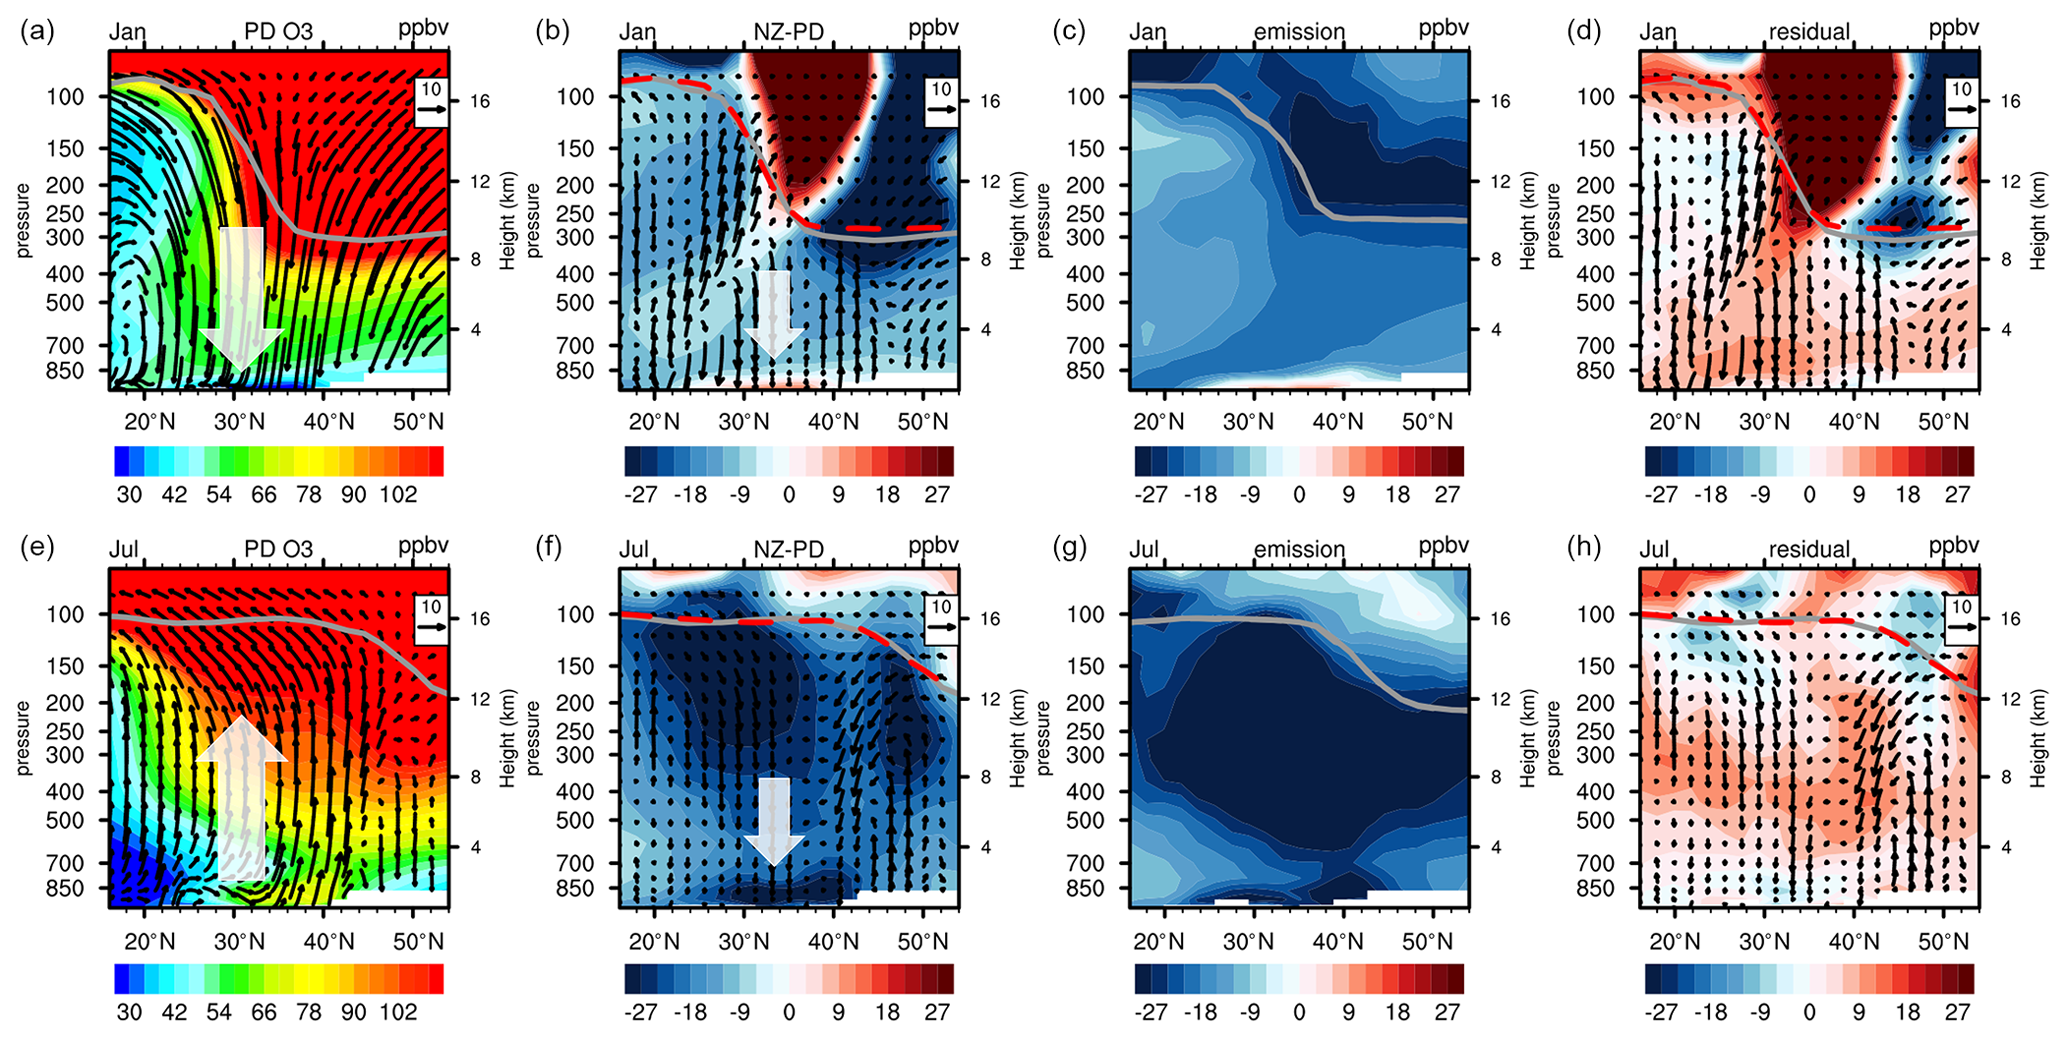
Figure 5Zonal mean O3 cross-section (ppbv) and wind speed (vectors, v: m s−1, w: *(−500) pa s−1) over eastern China (longitudes 111–122∘ E) in January and July under present-day conditions (online-PD, a, e), the changes in O3 and wind speed (b, f) and changes due to emissions (c, g), and the residual (second panels minus third panels; d, h). Grey lines show the tropopause location under present-day conditions; the dashed red lines show the tropopause location under net zero.
The changes in surface O3 over east Asia between 2015 and 2060 in winter and summer are shown in Fig. 4. The left panels show the changes in surface O3 under net zero (online-NZ minus online-PD), which include the effects of climate change and emissions changes. The climate change in this study includes changes in atmospheric parameters (air temperature, relative humidity, atmospheric circulation, etc.) from the free run of atmospheric simulation experiments (online). The climate change under SSP1-1.9 is much weaker than under other pathways, and the change in global surface air temperature in this study is not significant (Fig. S3 in Supplement). Over east Asia, the surface air temperature is increased by an annual average of 0.2 ∘C. The middle panels show the changes in surface O3 under the effect of emission changes only (offline-NZ minus offline-PD). The right panels show the residual changes in surface O3 which reflect the effect of climate change but are also influenced by differences in the model setup between the online and offline simulations (left panels minus middle panels). Surface O3 decreases in east Asia under net zero, with a mean reduction of 7.7 ppbv in winter and a greater reduction of 16.2 ppbv in summer. Turnock et al. (2019) estimated an annual mean reduction of 8 ppbv in 2050 under the SSP1-1.9 pathway, slightly less than we find here. However, we have used the more stringent DPEC Ambitious-pollution-Neutral-goals emission scenario for China rather than the standard SSP1-1.9 pathway, and we note that anthropogenic NO emissions in China are 1.5 Tg (NO) yr−1 lower in this scenario than those in SSP1-1.9. Surface O3 over eastern China and South Korea increases in winter in these scenarios, driven by the reduction in emissions (left and middle panels). This increase in surface O3 is caused by a weakening of titration under lower regional NO emissions in the future. The influence of climate change on surface O3 is relatively weak and leads to an increase in surface O3 in most parts of east Asia (right panels). This is partly due to enhanced vertical circulation leading to an increased contribution from stratospheric O3 (Akritidis et al., 2019; shown in Fig. S4) and the photochemical change under warmer climate (Zanis et al., 2022). Xu et al. (2022) also showed that emission reduction is far more effective than climate change in improving air quality (PM2.5 and O3) over east Asia under a carbon-neutral reduction pathway. Here, we will use tagging simulations to quantify the contributions of different sources to surface O3 changes over east Asia, especially over eastern China where surface O3 increases in winter and decreases in summer.
It can be seen from the vertical distribution of O3 and circulation (shown in the first panels of Fig. 5) that the O3 concentration increases with altitude under present-day conditions. At the same altitude, the O3 concentration is higher in middle and high latitudes than in low latitudes. In winter, there is a strong net descent of air over eastern China (30–40∘ N), which weakens in spring and turns to updraft in summer. These may be due to the weakened Brewer–Dobson circulation and strengthened convection (Butchart, 2014; Wild and Akimoto, 2001). As shown in the second panels of Fig. 5, there is a net decrease in tropospheric O3 in future, with an increase only seen near 30∘ N very close to the surface. In summer, the reduction in tropospheric O3 is greatest, especially near the tropopause where it exceeds 30 ppbv. In addition, due to the temperature increase and circulation enhancement in the future, the tropopause height increases, especially in the mid-latitude region in winter, where the increase is about 7 hPa. As seen from the third panels of Fig. 5, the reduction in emissions from aircraft (NO emissions in Fig. S1) leads to a reduction in O3 production, and the O3 concentration near the tropopause decreases substantially in the future. However, other factors such as climate change (the fourth panel in Fig. 5) lead to increases in tropospheric O3 by 2060.
Surface O3 shows substantial seasonal variations over east Asia, with a peak in spring, as shown in Fig. 6a. It reaches a maximum (56 ppbv) in March and is lowest (41 ppbv) in August under present-day conditions. Under net zero, the concentration of surface O3 is lower throughout the year, and while the peak is still in March, the mixing ratio drops to 43 ppbv. The decrease is greatest in July at 16 ppbv, which reflects weaker chemical production in summertime under lower future emissions (Fig. 6e). In contrast, surface O3 over eastern China is highest (71 ppbv) in July and lowest (21 ppbv) in December under present-day conditions (Fig. 6b). Under net zero, surface O3 increases in winter and decreases in summer, and the peak shifts from July to May due to the changes in O3 precursor emissions (Bowman et al., 2022). This shifts the seasonal peak from summer towards spring, when it is more greatly influenced by stratosphere–troposphere exchange. The decrease is highest in July, as seen over the wider east Asian region, but it is twice as large at 34 ppbv, reflecting the stronger present-day emissions over eastern China. There is a substantial increase in O3 in January of 12 ppbv, reflecting reduced titration by NO. The concentration of surface NOx decreases by more than 60 % and by an even larger factor in winter (∼90 %, 14 ppbv), and its seasonal variation is reduced, which accounts for the reduction in anthropogenic emissions (Fig. 6d). In terms of the O3 chemical budget, local chemical production and destruction are both reduced in the future. The peak in net O3 chemical production still occurs in summer, which highlights that photochemical processes continue to dominate the seasonal variation of surface O3 in eastern China in future (Fig. 6f). However, the net chemical destruction that currently occurs in winter is replaced with a small net O3 production, reflecting the reduced titration of O3 by NO under future emissions, which are very greatly reduced under net zero (Liu et al., 2022, 2023).
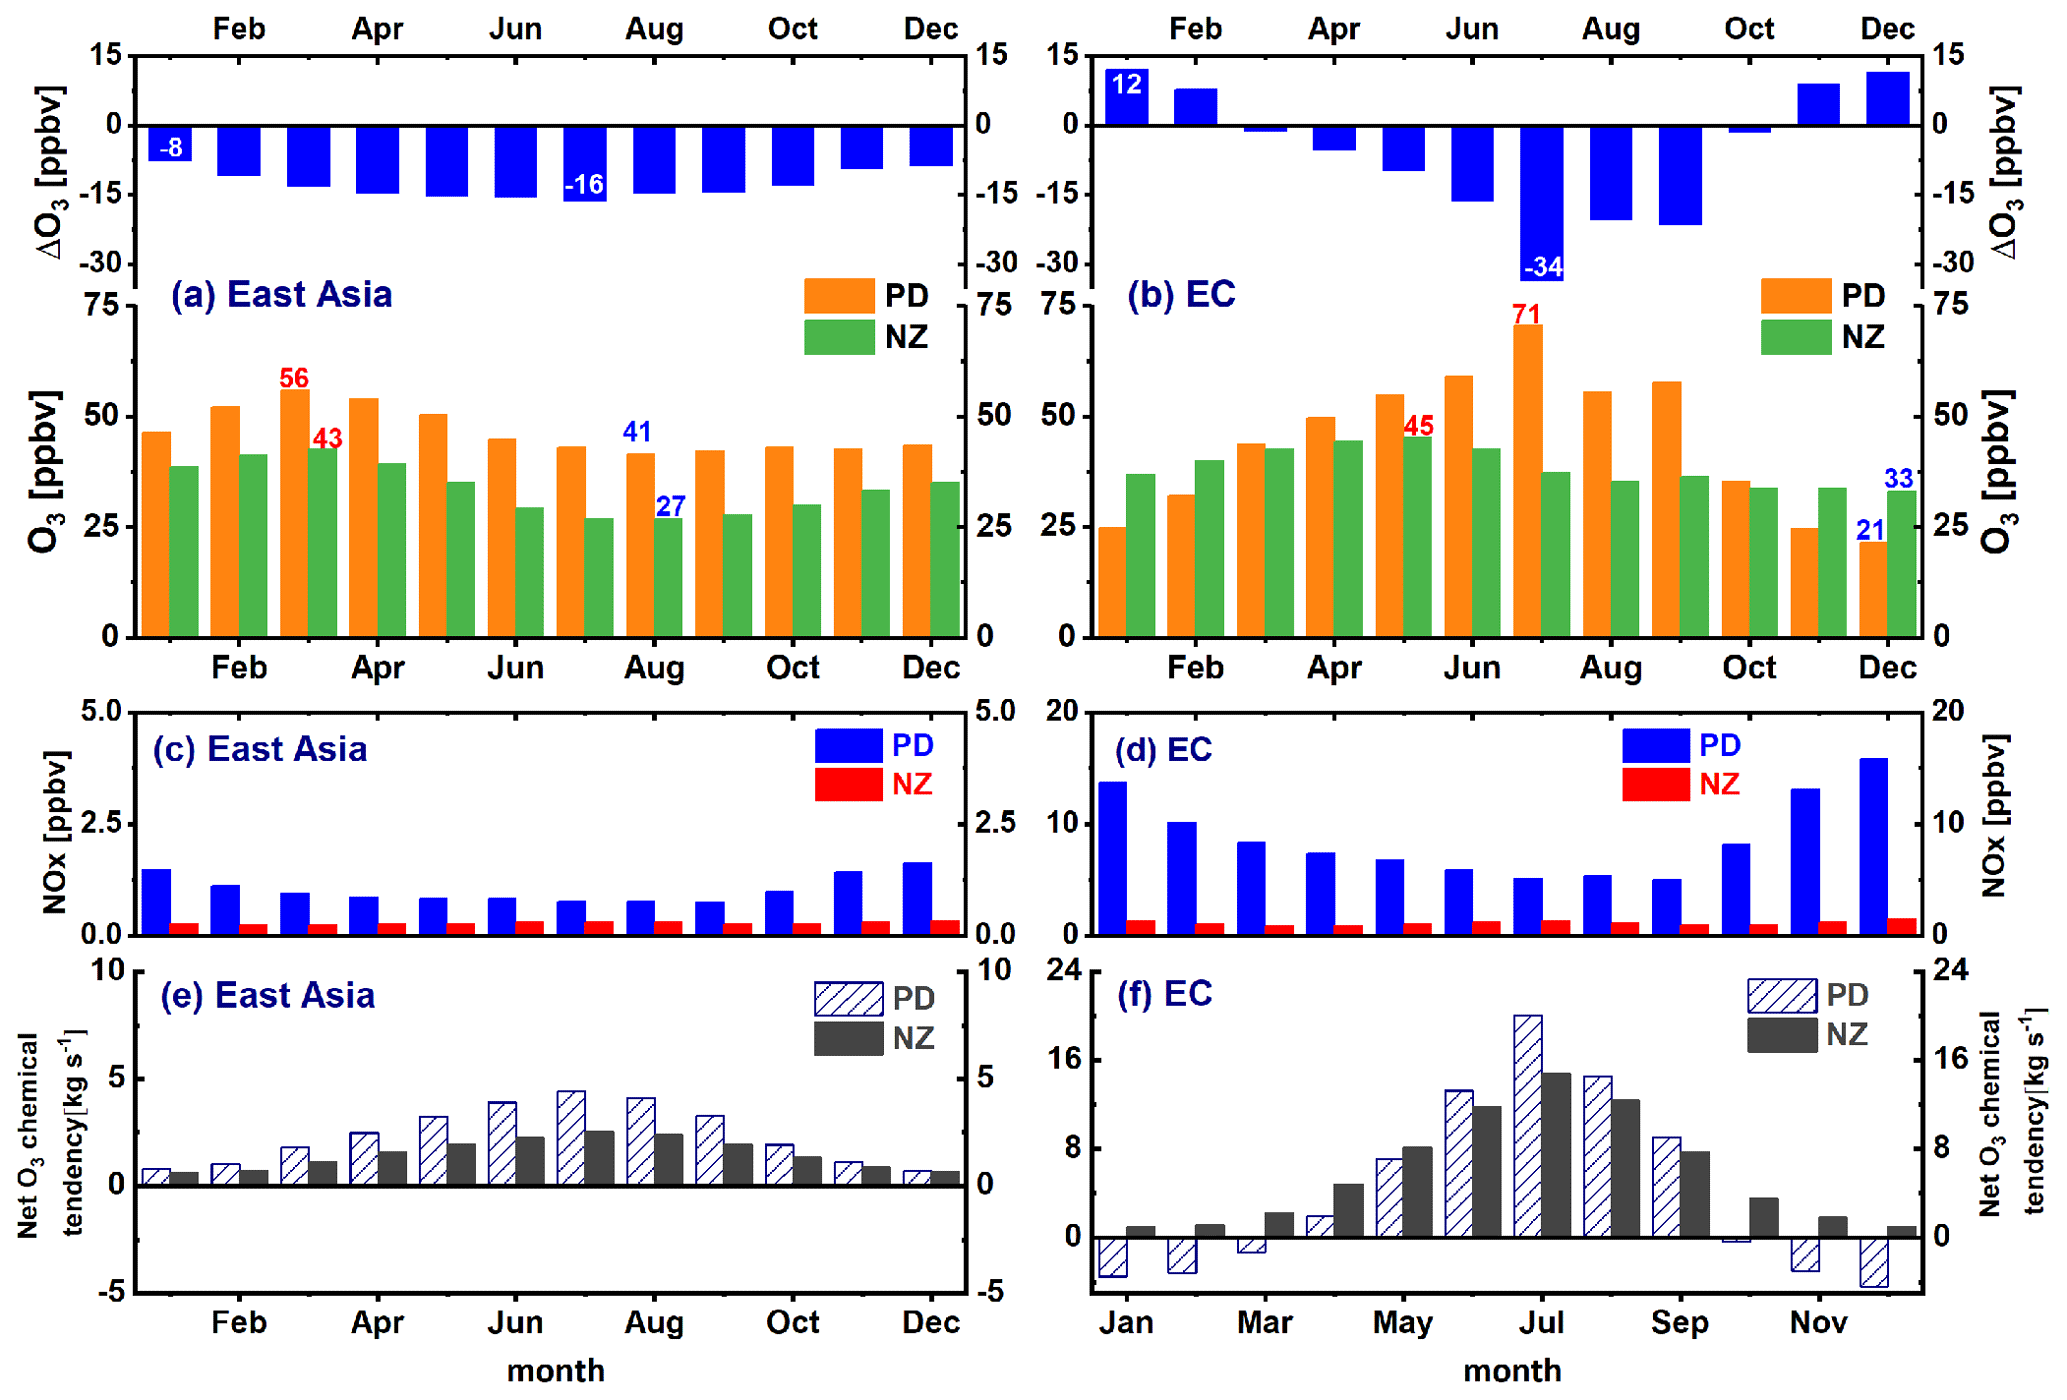
Figure 6Comparison of O3 (a, b), NOx (c, d) and net O3 chemical tendency (e, f) at the surface under present-day and net-zero conditions over east Asia (a, c, e) and eastern China (b, d, f). Results are from the online simulations (online-PD and online-NZ). Maximum and minimum O3 mixing ratios are highlighted in red and blue, respectively, and the largest and smallest O3 changes are indicated in white. The net O3 chemical tendency is the net photochemical production rate of O3 (kg s−1).
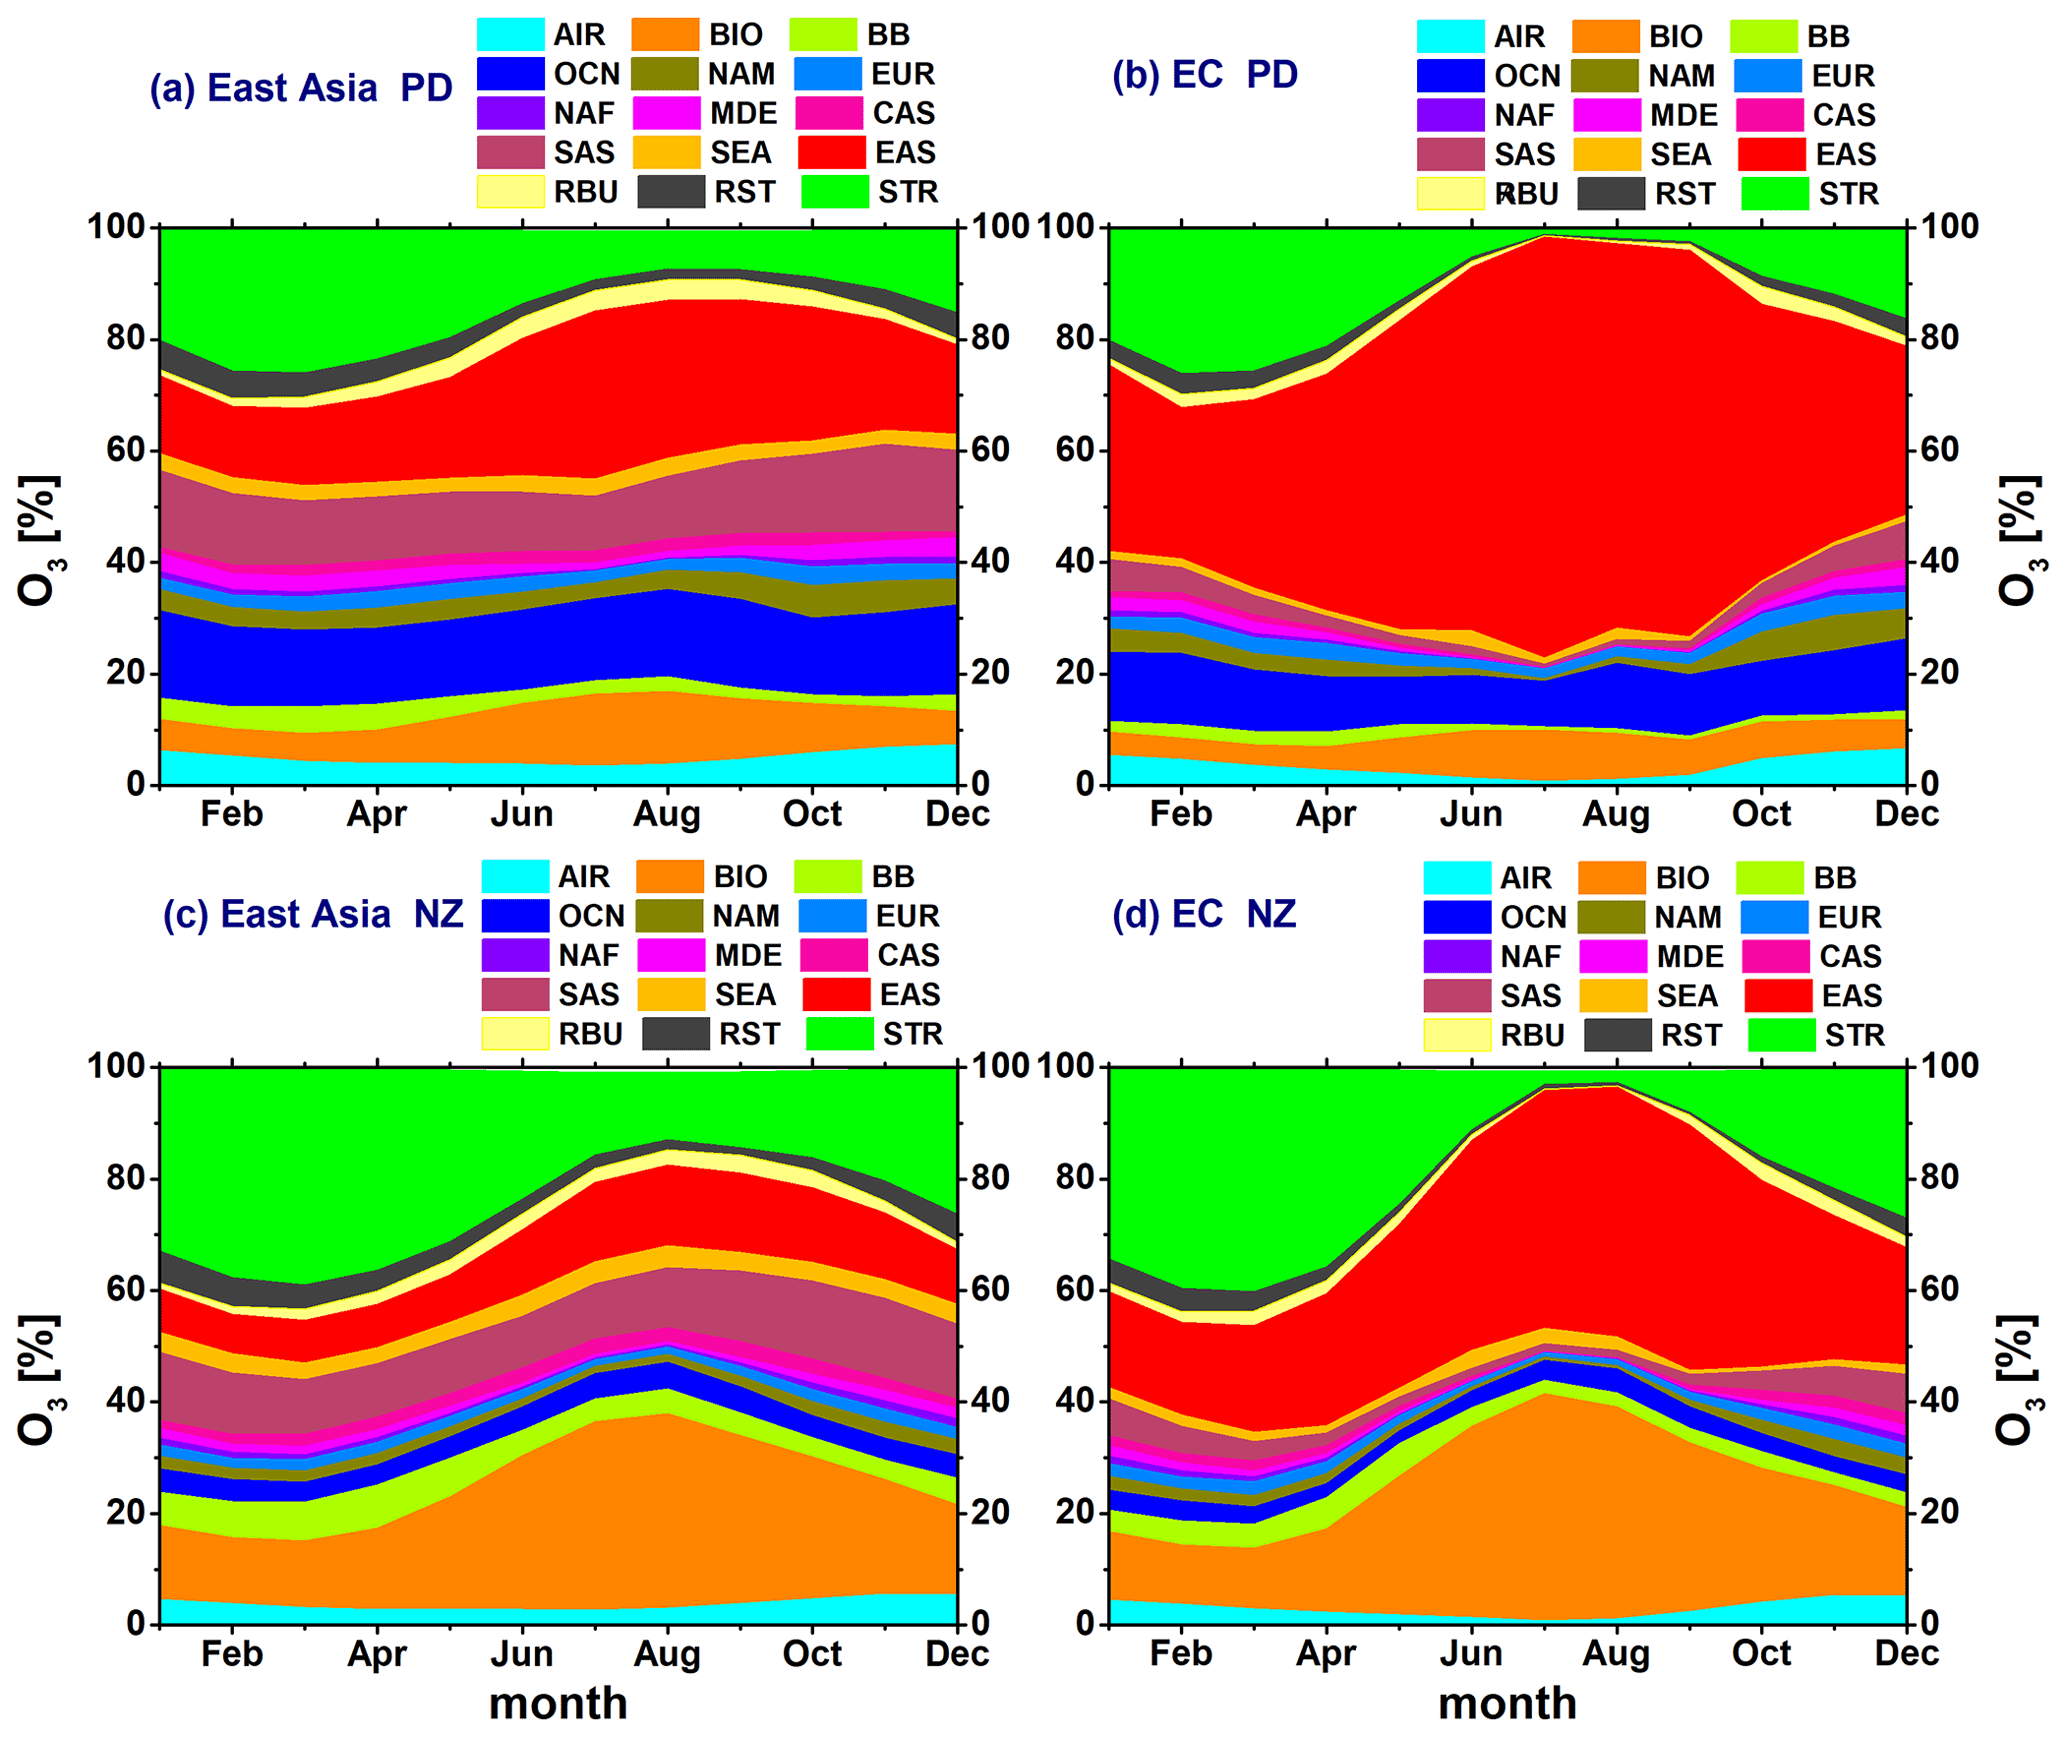
Figure 7Contributions of different sources to surface O3 under present-day and net-zero conditions over east Asia (a, c) and eastern China (b, d). Results are from the online simulations (online-PD and online-NZ). A total of 11 geographical source regions are used for anthropogenic NOx emission. BIO, BB, AIR and LIG are the contributions of NOx emissions from biogenic sources, biomass burning, aircraft and lightning to O3. STR is the contribution of O3 originating in the stratosphere.
We quantify the contributions of regional transport and stratospheric input to surface O3 on a monthly basis in Fig. 7. In the present day (Fig. 7a), we find that the contribution of anthropogenic NO emissions from east Asia (EAS) is highest, especially in summer, when it reaches 30 % (12 ppbv in Fig. 8). The total contributions from anthropogenic NO emissions outside east Asia (EAS_out, without ocean) are 33 % (16 ppbv) on average, with little seasonal variation, and these are highest over south Asia (SAS), accounting for 12 % (6 ppbv). The contribution from biogenic NO emissions from soils (BIO) is also important, exceeding 10 % (5 ppbv in Fig. 8) in summer. The contributions from the ocean (OCN) show little seasonal variation, contributing 15 % (6 ppbv). Under net zero (Fig. 7c), the anthropogenic contribution from east Asia drops dramatically to 14 % (4 ppbv in Fig. 8) in summer due to the reduced emissions of O3 precursors. The total contributions from anthropogenic NO emissions outside east Asia decrease to 28 % (10 ppbv) on average and to 7 ppbv in summer (in Fig. 8). The contribution of biogenic sources is enhanced and forms the dominant contributor to surface O3 under net zero, especially in summer at ∼40 % (9 ppbv in Fig. 8). The emissions from biogenic sources do not vary from year to year in this study. The enhanced contribution of biogenic sources is mainly due to the increased O3 production efficiency, which is a consequence of lower O3 precursor concentrations (Kleinman et al., 2002; Zaveri et al., 2003). The contribution of oceanic sources decreases to 4 % (1 ppbv) due to reduced emissions from shipping. The contribution from stratospheric O3 (STR) is highest in March (26 %, 14 ppbv) and lowest in August (7 %, 3 ppbv) under present-day conditions. Under net zero, the highest contribution is increased to 39 % (17 ppbv), and the lowest contribution is also increased to 12 % (3 ppbv). This may be due to enhanced stratospheric circulation, slower photochemical loss and a longer lifetime of O3 in the troposphere, allowing greater transport of stratospheric O3 to the ground.
Over eastern China (Fig. 7b), the contribution from east Asian anthropogenic sources is highest, especially in summer, when it exceeds 70 % (43 ppbv, shown in Fig. 8). The total contributions from anthropogenic NO emissions out of east Asia are 16 % (6 ppbv) on average and 4 ppbv in summer (in Fig. 8). Biogenic and oceanic sources make a smaller contribution over this region, only 6 % (3 ppbv) and 10 % (5 ppbv) on average, respectively. Under net zero (Fig. 7d), the contribution of east Asian anthropogenic sources drops to 42 % (16 ppbv) in summer but remains the dominant source of surface O3 in eastern China. The total contributions from anthropogenic NO emissions outside east Asia show little change. The contribution of biogenic sources is enhanced, especially in summer, reaching 40 % (14 ppbv in Fig. 8), close to the contribution from east Asian sources. The stratospheric contribution is highest in early spring (25 %, 11 ppbv) and lowest in summer (2 %, 1 ppbv). Under net zero, the stratospheric contribution is enhanced to 40 % (17 ppbv) in March and 3 % (1 ppbv) in summer, similarly to the seasonal contributions over east Asia. In addition, the high NO concentration in heavily urbanized eastern China has a titration effect on O3, but the strong future decreases in NO weaken this effect, reducing the loss of stratospheric O3 and of O3 from local sources. Overall, surface O3 shows substantial decreases through much of the year, and the local contribution is reduced, which highlights the beneficial role that net-zero policies may have for controlling surface O3 pollution in China.
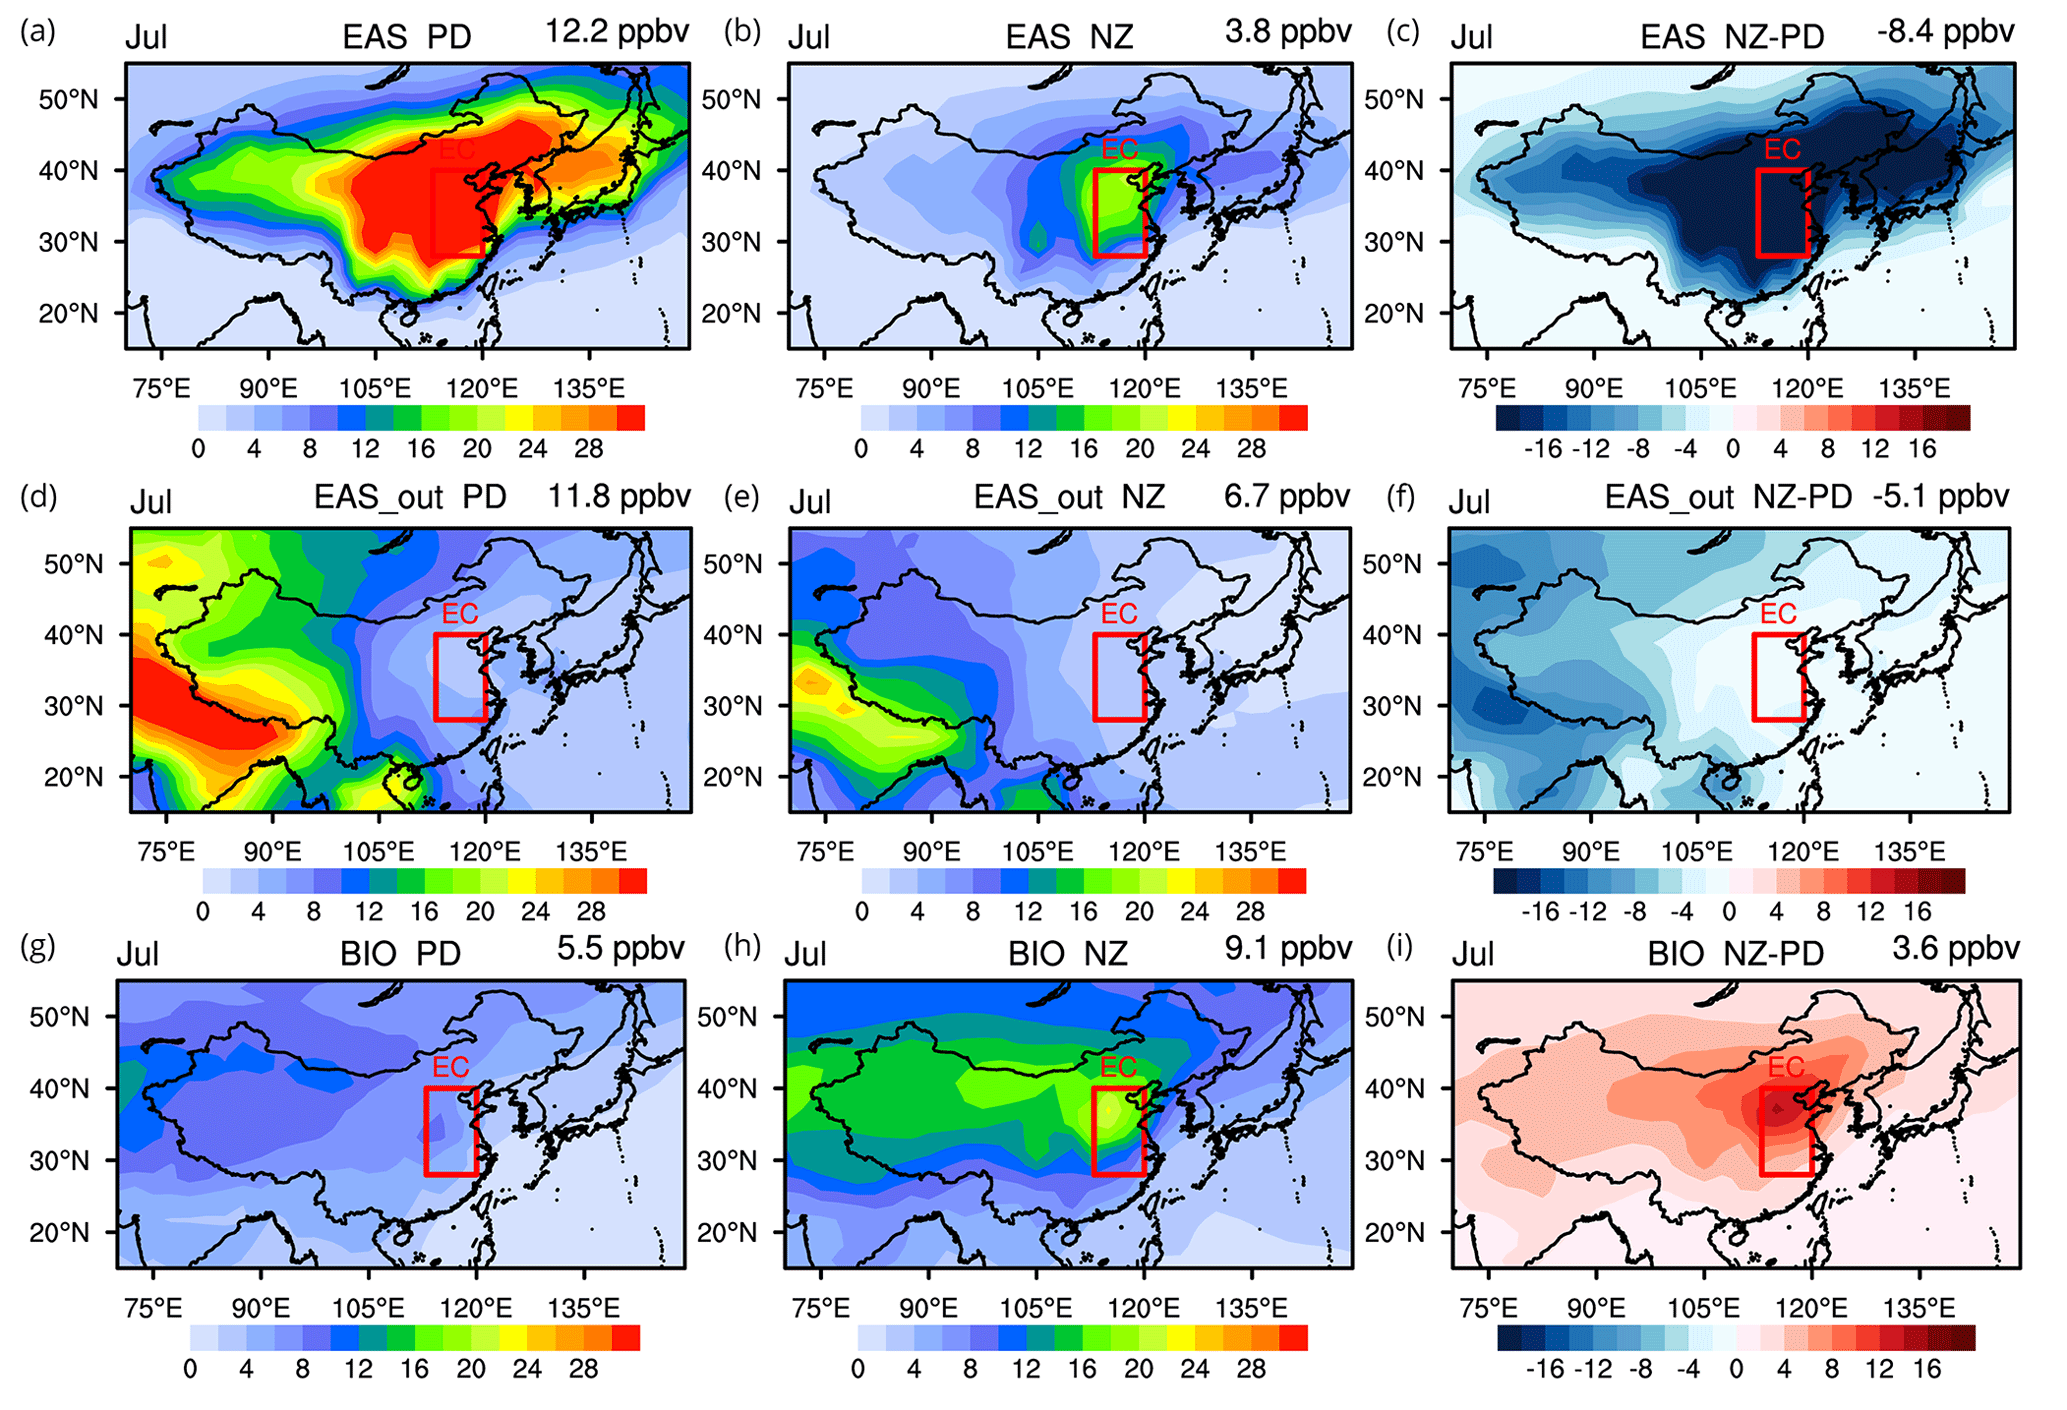
Figure 8The contributions of anthropogenic NO emissions over east Asia (EAS, a–c) and outside east Asia (EAS_out; d–f) and of biogenic emission (BIO; g–i) on surface O3 (ppbv) over east Asia in July in the present day (online-PD; a, d, g) and under net zero (online-NZ; b, e, h) and the differences between PD and NZ (online-NZ minus online-PD; c, f, i). The values in the right corners of each sub-figure are the regional means over east Asia. The box shows the region of eastern China.
We quantify tropospheric O3 budgets, spatiotemporal distributions of future surface O3 in east Asia and regional O3 source contributions for 2060 under a net-zero scenario using the NCAR Community Earth System Model (CESM) and online O3-tagging methods. The simulated monthly mean global tropospheric column O3 and surface O3 mixing ratios over east Asia capture the general features in observations well under present-day conditions. The offline simulations perform better than online simulations as the nudging provides a closer match to observed meteorological conditions. The tropospheric O3 burden and budget terms under present-day conditions in this study also match those of previous model studies well.
The simulated tropospheric O3 burden is likely to decrease from 316 Tg under present-day conditions to 247 Tg by 2060 under the net-zero scenario. This brings it close to that found in previous studies under preindustrial conditions of 239±22 Tg (Young et al., 2013). Future tropospheric O3 chemical production and loss are both reduced, and the net chemical tendency decreases from 397 to 81 Tg(O3) yr−1. The contribution of stratospheric O3 increases from 69 to 77 Tg due to the enhancement of atmospheric circulation and the increased stratosphere–troposphere exchange that is caused by climate change and the longer chemical lifetime of stratospheric O3 in the troposphere under decreased anthropogenic emissions of pollutants. The mean tropospheric lifetime of O3 is increased by 2 d (∼10 %). Over east Asia, one of the highest anthropogenic emission regions, the O3 burden decreases from 25 to 19 Tg, and the net chemical tendency drops from 227 to 137 Tg(O3) yr−1. East Asia is a region of net O3 production, and the outflow is expected to decrease from 89 to 38 Tg(O3) yr−1. The burden of O3 from the stratosphere increases from 5 to 6 Tg. The lifetime of tropospheric O3 over east Asia is shorter than the global average at ∼15 d due to the high anthropogenic emissions, but it increases by 2 d, similarly to the global mean. Compared with other SSP scenarios, particularly the much-studied SSP3-7.0 pathway, SSP1-1.9 provides a more positive perspective on the opportunities for controlling future tropospheric O3 and the benefits for the improvement of air quality.
Regional average surface O3 decreases throughout the year over east Asia, with the highest decreases in summer (16 ppbv) in the future under the net-zero scenario. Over eastern China, the peak in surface O3 shifts from July to May. Surface O3 decreases strongly in July (34 ppbv) and increases in winter, especially in January at 12 ppbv. The increased O3 in winter is caused by reduced titration of O3 by NO associated with lower anthropogenic NO emissions and by enhanced stratospheric input. The tropospheric O3 over most regions decreases due to the large decrease in O3 precursor emissions. Climate change leads to only a small increase in tropospheric O3 under this scenario. Local anthropogenic emissions play a dominant role in controlling O3 changes over east Asia in summer, but this will drop substantially from 30 % in the present day to 14 % under net zero. The contribution of biogenic sources is enhanced and forms the dominant contributor to future surface O3, especially in summer at ∼40 %. Here, this enhanced contribution of biogenic sources is due to increased O3 production efficiency associated with reduced O3 precursor concentrations, but this may be underestimated if biogenic emissions also increase in future as expected. The lower extent of climate change under SSP1-1.9 leads to relatively little impact on tropospheric O3 under net zero, while the emission reductions associated with net-zero policies are sufficient to mitigate surface O3 pollution over east Asia, especially in summer.
The combined emissions and O3-tagging method used here provide a reliable way to quantify the changes in tropospheric O3 and its sources in future under a net-zero scenario. The results of this study clarify the separate impacts of climate change and emissions on tropospheric O3 changes over east Asia and highlight the significance of controlling O3 precursor emissions along the net-zero scenario, especially anthropogenic emissions. The reduction in anthropogenic O3 precursor emissions should be the most effective way to control the increase in tropospheric O3, and this requires joint efforts on a global scale.
CAQRA can be freely downloaded at https://doi.org/10.11922/sciencedb.00053 (Tang et al., 2020a), and the prototype product, which contains the monthly and annual means of the CAQRA dataset, is available at https://doi.org/10.11922/sciencedb.00092 (Tang et al., 2020b). The simulated O3 data generated in this study are available on https://doi.org/10.5281/zenodo.8137796 (Hou, 2023).
The supplement related to this article is available online at: https://doi.org/10.5194/acp-23-15395-2023-supplement.
XH, OW and BZ jointly developed the concept for this study. XH set up the model and conducted the simulations and data analysis. XH and OW contributed to the writing. BZ and JL discussed the results and offered valuable comments.
The contact author has declared that none of the authors has any competing interests.
Publisher's note: Copernicus Publications remains neutral with regard to jurisdictional claims made in the text, published maps, institutional affiliations, or any other geographical representation in this paper. While Copernicus Publications makes every effort to include appropriate place names, the final responsibility lies with the authors.
Xuewei Hou acknowledges the High-Performance Computing Center of Nanjing University of Information Science and Technology for the high-performance computing system. The authors would like to thank Tim Butler and Aurelia Lupascu at the Institute for Advanced Sustainability Studies (now the Research Institute for Sustainability) in Potsdam, Germany, for helping us to update the TOAST source attribution code in the CESM model, and Yongjie Huang (IAP/CAS) for providing the map database (https://github.com/huangynj/NCL-Chinamap.git, last access: 30 November 2023).
This study was supported by the National Key Research and Development Program of China (grant no. 2022YFC3701204), the National Natural Science Foundation of China (grant nos. 42021004 and 42275115) and the Key Laboratory of Atmospheric Chemistry, China Meteorological Administration (LAC/CMA, grant no. 2023B05). Oliver Wild and James Lee received support from the UK–China collaboration to optimize net-zero policy options for air quality and health (COP-AQ) under grant no. 2021GRIP02COP-AQ.
This paper was edited by Bryan N. Duncan and reviewed by two anonymous referees.
Akritidis, D., Pozzer, A., and Zanis, P.: On the impact of future climate change on tropopause folds and tropospheric ozone, Atmos. Chem. Phys., 19, 14387–14401, https://doi.org/10.5194/acp-19-14387-2019, 2019.
Allen, R. J., Turnock, S., Nabat, P., Neubauer, D., Lohmann, U., Olivié, D., Oshima, N., Michou, M., Wu, T., Zhang, J., Takemura, T., Schulz, M., Tsigaridis, K., Bauer, S. E., Emmons, L., Horowitz, L., Naik, V., van Noije, T., Bergman, T., Lamarque, J.-F., Zanis, P., Tegen, I., Westervelt, D. M., Le Sager, P., Good, P., Shim, S., O'Connor, F., Akritidis, D., Georgoulias, A. K., Deushi, M., Sentman, L. T., John, J. G., Fujimori, S., and Collins, W. J.: Climate and air quality impacts due to mitigation of non-methane near-term climate forcers, Atmos. Chem. Phys., 20, 9641–9663, https://doi.org/10.5194/acp-20-9641-2020, 2020.
Bowman, H., Turnock, S., Bauer, S. E., Tsigaridis, K., Deushi, M., Oshima, N., O'Connor, F. M., Horowitz, L., Wu, T., Zhang, J., Kubistin, D., and Parrish, D. D.: Changes in anthropogenic precursor emissions drive shifts in the ozone seasonal cycle throughout the northern midlatitude troposphere, Atmos. Chem. Phys., 22, 3507–3524, https://doi.org/10.5194/acp-22-3507-2022, 2022.
Butchart, N.: The Brewer-Dobson circulation, Rev. Geophys., 52, 157–184, https://doi.org/10.1002/2013RG000448, 2014.
Butler, T., Lupascu, A., Coates, J., and Zhu, S.: TOAST 1.0: Tropospheric Ozone Attribution of Sources with Tagging for CESM 1.2.2, Geosci. Model Dev., 11, 2825–2840, https://doi.org/10.5194/gmd-11-2825-2018, 2018.
Butler, T., Lupascu, A., and Nalam, A.: Attribution of ground-level ozone to anthropogenic and natural sources of nitrogen oxides and reactive carbon in a global chemical transport model, Atmos. Chem. Phys., 20, 10707–10731, https://doi.org/10.5194/acp-20-10707-2020, 2020.
Cheng, J., Tong, D., Zhang, Q., Liu, Y., Lei, Y., Yan, G., Yan, L., Yu, S., Cui, R. Y., Clarke, L., Geng, G, N., Zheng, B., Zhang, X, Y., Davis, J. S., and He, K, B.: Pathways of China's PM2.5 air quality 2015–2060 in the context of carbon neutrality, Natl. Sci. Rev., 8, nwab078, https://doi.org/10.1093/nsr/nwab078, 2021.
Cionni, I., Eyring, V., Lamarque, J. F., Randel, W. J., Stevenson, D. S., Wu, F., Bodeker, G. E., Shepherd, T. G., Shindell, D. T., and Waugh, D. W.: Ozone database in support of CMIP5 simulations: results and corresponding radiative forcing, Atmos. Chem. Phys., 11, 11267–11292, https://doi.org/10.5194/acp-11-11267-2011, 2011.
Danabasoglu, G., Lamarque, J. -F., Bacmeister, J., Bailey, D. A., DuVivier, A. K., Edwards, J., Emmons, L. K., Fasullo, J., Garcia, R., Gettelman, A., Hannay, C., Holland, M. M., Large, W. G., Lauritzen, P. H., Lawrence, D. M., Lenaerts, J. T. M., Lindsay, K., Lipscomb, W. H., Mills, M. J., Neale, R., Oleson, K. W., Otto-Bliesner, B., Phillips, A. S., Sacks, W., Tilmes, S., Kampenhout, L. van, Vertenstein, M., Bertini, A., Dennis, J., Deser, C., Fischer, C., Fox-Kemper, B., Kay, J. E., Kinnison, D., Kushner, P. J., Larson, V. E., Long, M. C., Mickelson, S., Moore, J. K., Nienhouse, E., Polvani, L., Rasch, P. J., and Strand, W. G.: The Community Earth System Model Version 2 (CESM2), J. Adv. Model. Earth Syst., 12, e2019MS001916, https://doi.org/10.1029/2019MS001916, 2020.
Ehhalt, D. and Prather, M. J.: Atmospheric Chemistry and Greenhouse Gases, in Climate Change 2001: The Scientific Basis, edited by: Houghton, J. T., Ding, Y., Griggs, D. J., Noguer, M., van der Linden, P. J., Dai, X., Maskell, K., and Johnson, C. A., Cambridge University Press, Cambridge, UK, 239–287, https://www.ipcc.ch/report/ar3/wg1 (last access: 5 December 2023), 2001.
Emberson, L.: Effects of ozone on agriculture, forests and grasslands, Philos. T. Roy. Soc. A, 378, 20190327, https://doi.org/10.1098/rsta.2019.0327, 2020.
Emmons, L. K., Walters, S., Hess, P. G., Lamarque, J.-F., Pfister, G. G., Fillmore, D., Granier, C., Guenther, A., Kinnison, D., Laepple, T., Orlando, J., Tie, X., Tyndall, G., Wiedinmyer, C., Baughcum, S. L., and Kloster, S.: Description and evaluation of the Model for Ozone and Related chemical Tracers, version 4 (MOZART-4), Geosci. Model Dev., 3, 43–67, https://doi.org/10.5194/gmd-3-43-2010, 2010.
Eyring, V., Bony, S., Meehl, G. A., Senior, C. A., Stevens, B., Stouffer, R. J., and Taylor, K. E.: Overview of the Coupled Model Intercomparison Project Phase 6 (CMIP6) experimental design and organization, Geosci. Model Dev., 9, 1937–1958, https://doi.org/10.5194/gmd-9-1937-2016, 2016.
Fan, X., Duan, Q., Shen, C., Wu, Y., and Xing, C.: Global surface air temperatures in CMIP6: historical performance and future changes, Environ. Res. Lett., 15, 104056, https://doi.org/10.1088/1748-9326/abb051, 2020.
Griffiths, P. T., Murray, L. T., Zeng, G., Shin, Y. M., Abraham, N. L., Archibald, A. T., Deushi, M., Emmons, L. K., Galbally, I. E., Hassler, B., Horowitz, L. W., Keeble, J., Liu, J., Moeini, O., Naik, V., O'Connor, F. M., Oshima, N., Tarasick, D., Tilmes, S., Turnock, S. T., Wild, O., Young, P. J., and Zanis, P.: Tropospheric ozone in CMIP6 simulations, Atmos. Chem. Phys., 21, 4187–4218, https://doi.org/10.5194/acp-21-4187-2021, 2021.
Guenther, A., Karl, T., Harley, P., Wiedinmyer, C., Palmer, P. I., and Geron, C.: Estimates of global terrestrial isoprene emissions using MEGAN (Model of Emissions of Gases and Aerosols from Nature), Atmos. Chem. Phys., 6, 3181–3210, https://doi.org/10.5194/acp-6-3181-2006, 2006.
Guenther, A. B., Jiang, X., Heald, C. L., Sakulyanontvittaya, T., Duhl, T., Emmons, L. K., and Wang, X.: The Model of Emissions of Gases and Aerosols from Nature version 2.1 (MEGAN2.1): an extended and updated framework for modeling biogenic emissions, Geosci. Model Dev., 5, 1471–1492, https://doi.org/10.5194/gmd-5-1471-2012, 2012.
Hong, C. P., Zhang, Q., Zhang, Y., Davis, S. J., Tong, D., Zheng, Y. X., Liu, Z., Guan, D., He, K. B., and Schellnhuber, H. J.: Impacts of climate change on future air quality and human health in China, P. Natl. Acad. Sci. USA, 116, 17193–17200, https://doi.org/10.1073/pnas.1812881116, 2019.
Hou, X.: The simulated data for “Future tropospheric ozone budget and distribution over East Asia under a Net Zero scenario”, Zenodo [data set], https://doi.org/10.5281/zenodo.8137796, 2023.
Janssens-Maenhout, G., Crippa, M., Guizzardi, D., Dentener, F., Muntean, M., Pouliot, G., Keating, T., Zhang, Q., Kurokawa, J., Wankmüller, R., Denier van der Gon, H., Kuenen, J. J. P., Klimont, Z., Frost, G., Darras, S., Koffi, B., and Li, M.: HTAP_v2.2: a mosaic of regional and global emission grid maps for 2008 and 2010 to study hemispheric transport of air pollution, Atmos. Chem. Phys., 15, 11411–11432, https://doi.org/10.5194/acp-15-11411-2015, 2015.
Jerrett, M., Burnett, R.T., Pope, C.A., Ito, K., Thurston, G., Krewski, D., Shi, Y., Calle, E., and Thun, M.: Long-term ozone exposure and mortality, N. Engl. J. Med., 360, 1085–1095, https://doi.org/10.1056/NEJMoa0803894, 2009.
Karset, I. H. H., Berntsen, T. K., Storelvmo, T., Alterskjær, K., Grini, A., Olivié, D., Kirkevåg, A., Seland, Ø., Iversen, T., and Schulz, M.: Strong impacts on aerosol indirect effects from historical oxidant changes, Atmos. Chem. Phys., 18, 7669–7690, https://doi.org/10.5194/acp-18-7669-2018, 2018.
Kawase, H., Nagashima, T., Sudo, K., and Nozawa, T.: Future changes in tropospheric ozone under representative concentration pathways (RCPs), Geophys. Res. Lett., 38, L05801, https://doi.org/10.1029/2010GL046402, 2011.
Kim, M.J., Park, R.J., Ho, C.-H., Woo, J.-H., Choi, K.-C., Song, C.-K., and Lee, J.-B.: Future ozone and oxidants change under the RCP scenarios, Atmos. Environ., 101, 103–115, https://doi.org/10.1016/J.ATMOSENV.2014.11.016, 2015.
Kinnison, D. E., Brasseur, G. P., Walters, S., Garcia, R. R., Marsch, D. A., Sassi, F., Boville, B. A., Harvey, V. L., Randall, C. E., Emmons, L., Lamarque, J. F., Hess, P., Orlando, J. J., Tie, X. X., Randel, W., Pan, L. L., Gettelman, A., Granier, C., Diehl, T., Niemaier, U., and Simmons, A. J.: Sensitivity of chemical tracers to meteorological parameters in the MOZART-3 chemical transport model, J. Geophys. Res., 112, D20302, https://doi.org/10.1029/2006JD007879, 2007.
Kleinman, I., Daum, P. H., Lee, Y.-N., Nunnermacker, L. J., Springston, S. R., Weinstein-Lloyd, J., and Rudolph, J.: Ozone production efficiency in an urban area, J. Geophys. Res., 107, 4733, https://doi.org/10.1029/2002JD002529, 2002.
Koffi, B., Dentener, F., Janssens-Maenhout, G., Guizzardi, D., Crippa, M., Diehl, T., Galmarini, S., and Solazzo, E.: Hemispheric Transport Air Pollution (HTAP): Specification of the HTAP2 experiments–Ensuring harmonized modelling, EUR 28255 EN, Publications Office of the European Union, Luxembourg, https://doi.org/10.2788/725244, 2016.
Kong, L., Tang, X., Zhu, J., Wang, Z., Li, J., Wu, H., Wu, Q., Chen, H., Zhu, L., Wang, W., Liu, B., Wang, Q., Chen, D., Pan, Y., Song, T., Li, F., Zheng, H., Jia, G., Lu, M., Wu, L., and Carmichael, G. R.: A 6-year-long (2013–2018) high-resolution air quality reanalysis dataset in China based on the assimilation of surface observations from CNEMC, Earth Syst. Sci. Data, 13, 529–570, https://doi.org/10.5194/essd-13-529-2021, 2021.
Lamarque, J.-F., Emmons, L. K., Hess, P. G., Kinnison, D. E., Tilmes, S., Vitt, F., Heald, C. L., Holland, E. A., Lauritzen, P. H., Neu, J., Orlando, J. J., Rasch, P. J., and Tyndall, G. K.: CAM-chem: description and evaluation of interactive atmospheric chemistry in the Community Earth System Model, Geosci. Model Dev., 5, 369–411, https://doi.org/10.5194/gmd-5-369-2012, 2012.
Lamarque, J.-F., Shindell, D. T., Josse, B., Young, P. J., Cionni, I., Eyring, V., Bergmann, D., Cameron-Smith, P., Collins, W. J., Doherty, R., Dalsoren, S., Faluvegi, G., Folberth, G., Ghan, S. J., Horowitz, L. W., Lee, Y. H., MacKenzie, I. A., Nagashima, T., Naik, V., Plummer, D., Righi, M., Rumbold, S. T., Schulz, M., Skeie, R. B., Stevenson, D. S., Strode, S., Sudo, K., Szopa, S., Voulgarakis, A., and Zeng, G.: The Atmospheric Chemistry and Climate Model Intercomparison Project (ACCMIP): overview and description of models, simulations and climate diagnostics, Geosci. Model Dev., 6, 179–206, https://doi.org/10.5194/gmd-6-179-2013, 2013.
Li, J., Nagashima, T., Kong, L., Ge, B., Yamaji, K., Fu, J. S., Wang, X., Fan, Q., Itahashi, S., Lee, H.-J., Kim, C.-H., Lin, C.-Y., Zhang, M., Tao, Z., Kajino, M., Liao, H., Li, M., Woo, J.-H., Kurokawa, J., Wang, Z., Wu, Q., Akimoto, H., Carmichael, G. R., and Wang, Z.: Model evaluation and intercomparison of surface-level ozone and relevant species in East Asia in the context of MICS-Asia Phase III – Part 1: Overview, Atmos. Chem. Phys., 19, 12993–13015, https://doi.org/10.5194/acp-19-12993-2019, 2019.
Liu, Z., Doherty, R. M., Wild, O., O'Connor, F. M., and Turnock, S. T.: Tropospheric ozone changes and ozone sensitivity from the present day to the future under shared socio-economic pathways, Atmos. Chem. Phys., 22, 1209–1227, https://doi.org/10.5194/acp-22-1209-2022, 2022.
Liu, Z., Wild, O., Doherty, R. M., O'Connor, F. M., and Turnock, S. T.: Benefits of net-zero policies for future ozone pollution in China, Atmos. Chem. Phys., 23, 13755–13768, https://doi.org/10.5194/acp-23-13755-2023, 2023.
Lu, X., Zhang, L., and Shen, L.: Meteorology and Climate Influences on Tropospheric Ozone: a Review of Natural Sources, Chemistry, and Transport Patterns, Current Pollution Reports, 5, 238–260, https://doi.org/10.1007/s40726-019-00118-3, 2019.
Lu, X., Zhang, L., Wang, X., Gao, M., Li, K., Zhang, Y., Yue, X., and Zhang, Y.: Rapid Increases in Warm-Season Surface Ozone and Resulting Health Impact in China since 2013, Environ. Sci. Technol. Lett., 7, 240–247, https://doi.org/10.1021/acs.estlett.0c00171, 2020.
Malley, C. S., Henze, D. K., Kuylenstierna, J. C. I., Vallack, H. W., Davila, Y., Anenberg, S. C., Turner, M. C., and Ashmore, M. R.: Updated global estimates of respiratory mortality in adults ≥30 Years of age attributable to long-term ozone exposure, Environ. Health Perspect., 125, 87021, https://doi.org/10.1289/EHP1390, 2017.
Myhre, G., Shindell, D., Breon, F.-M., Collins, W., Fuglestvedt, J., Huang, J., Koch, D., Lamarque, J.-F., Lee, D., Mendoza, B., Nakajima, T., Robock, A., Stephens, G., Takemura, T., and Zhang, H.: Anthropogenic and natural radiative forcing, in: Climate Change 2013: the Physical Science Basis, Contribution of Working Group I to the Fifth Assessment Report of the Intergovernemental Panel on Cliamte Change, Cambridge University Press, Cambridge, United Kingdom and New York, NY, USA, 659–740, 2013.
Neale, R. B., Richter, J., Park, S., Lauritzen, P. H., Vavrus, S. J., Rasch, P. J., and Zhang, M.: The Mean Climate of the Community Atmosphere Model (CAM4) in forced SST and fully coupled experiments, J. Climate, 26, 5150–5168, https://doi.org/10.1175/JCLI-D-12-00236.1, 2013.
O'Connor, F. M., Johnson, C. E., Morgenstern, O., Abraham, N. L., Braesicke, P., Dalvi, M., Folberth, G. A., Sanderson, M. G., Telford, P. J., Voulgarakis, A., Young, P. J., Zeng, G., Collins, W. J., and Pyle, J. A.: Evaluation of the new UKCA climate-composition model – Part 2: The Troposphere, Geosci. Model Dev., 7, 41–91, https://doi.org/10.5194/gmd-7-41-2014, 2014.
Oleson, K. W., Lawrence, D. M., Bonan, G. B., Flanner, M. G., Kluzek, E., Lawrence, P. J., Levis, S., Sean C. Swenson, S. C., Peter, E. T., Dai, A., Decker, M., Dickinson, R., Feddema, J., Heald, C. L., Hoffman, F., Lamarque, J.-F., Mahowald, N., Niu, G.-Y., Qian, T., Randerson, J., Running, S., Sakaguchi, K., Slater, A., Stöckli, R., Wang, A., Yang, Z. L., and Zeng, X.: Technical Description of version 4.0 of the Community Land Model (CLM) (No. NCAR/TN-478+STR), University Corporation for Atmospheric Research, https://doi.org/10.5065/D6FB50WZ, 2010.
O'Neill, B. C., Kriegler, E., Riahi, K., Ebi, K. L., Hallegatte, S., Carter, T. R., Mathur, R., and van Vuuren, D. P.: A new scenario framework for climate change research: the concept of shared socioeconomic pathways, Clim. Change, 122, 387–400, https://doi.org/10.1007/s10584-013-0905-2, 2014.
Rao, S., Klimont, Z., Smith, S. J., Van Dingenen, R., Dentener, F., Bouwman, L., Riahi, K., Amann, M., Bodirsky, B. L., Van Vuuren, D. P., Reis, L. A., Calvin, K., Drouet, L., Fricko, O., Fujimori, S., Gernaat, D., Havlik, P., Harmsen, M., Hasegawa, T., Heyes, C., Hilaire, J., Luderer, G., Masui, T., Stehfest, E., Strefler, J., Van Der Sluis, S., and Tavoni, M.: Future air pollution in the shared socio-economic pathways, Glob. Environ. Chang., 42, 346–358, https://doi.org/10.1016/j.gloenvcha.2016.05.012, 2017.
Riahi, K., Van Vuuren, D.P., Kriegler, E., Edmonds, J., O 'neill, B.C., Fujimori, S., Bauer, N., Calvin, K., Dellink, R., Fricko, O., Lutz, W., Popp, A., Cuaresma, J.C., Kc, S., Leimbach, M., Jiang, L., Kram, T., Rao, S., Emmerling, J., Ebi, K., Hasegawa, T., Havlik, P., Humpenöder, F., Aleluia, L., Silva, D., Smith, S., Stehfest, E., Bosetti, V., Eom, J., Gernaat, D., Masui, T., Rogelj, J., Strefler, J., Drouet, L., Krey, V., Luderer, G., Harmsen, M., Takahashi, K., Baumstark, L., Doelman, J.C., Kainuma, M., Klimont, Z., Marangoni, G., Lotze-Campen, H., Obersteiner, M., Tabeau, A., and Tavoni, M.: The Shared Socioeconomic Pathways and their energy, land use, and greenhouse gas emissions implications: an overview, Glob. Environ. Chang., 42, 153–168, https://doi.org/10.1016/j.gloenvcha.2016.05.009, 2017.
Rienecker, M. M., Suarez, M. J., Gelaro, R., Todling, R., Bacmeister, J., Liu, E., Bosilovich, M. G., Schubert, S. D., Takacs, L., Kim, G.-K., Bloom, S., Chen, J., Collins, D., Conaty, A., da Silva, A., Gu, W., Joiner, J., Koster, R. D., Lucchesi, R., Molod, A., Owens, T., Pawson, S., Pegion, P., Redder, C. R., Reichle, R., Robertson, F. R., Ruddick, A. G., Sienkiewicz, M., and Woollen, J.: MERRA: NASA's Modern-Era Retrospective Analysis for Research and Application, J. Climate, 24, 3624–3648, https://doi.org/10.1175/JCLI-D-11-00015.1, 2011.
Sander, S. P., Friedl, R. R., Barker, J. R., Golden, D. M., Kurylo, M. J., Sciences, G. E., Wine, P. H., Abbatt, J. P. D., Burkholder, J. B., Kolb, C. E., Moortgat, G. K., Huie, R. E., and Orkin, V. L.: Chemical Kinetics and Photochemical Data for Use in Atmospheric Studies Evaluation Number 17 NASA Panel for Data Evaluation, JLP Publ., 10–6, 2011.
Shi, X., Zheng, Y., Lei, Y., Xue, W., Yan, G., Liu, X., Cai, B., Tong, D., and Wang, J.: Air quality benefits of achieving carbon neutrality in China, Sci. Total Environ., 795, 148784, https://doi.org/10.1016/j.scitotenv.2021.148784, 2021.
Shindell, D. T., Faluvegi, G., Koch, D. M., Schmidt, G. A., Unger, N., and Bauer, S. E.: Improved Attribution of Climate Forcing to Emissions, Science, 326, 716–718, https://doi.org/10.1126/science.1174760, 2009.
Stevenson, D. S., Dentener, F. J., Schultz, M. G., Ellingsen, K., van Noije, T. P. C., Wild, O., Zeng, G., Amann, M., Atherton, C. S., Bell, N., Bergmann, D. J., Bey, I., Butler, T., Cofala, J., Collins, W. J., Derwent, R. G., Doherty, R. M., Drevet, J., Eskes, H. J., Fiore, A. M., Gauss, M., Hauglustaine, D. A., Horowitz, L. W., Isaksen, I. S. A., Krol, M. C., Lamarque, J.-F., Lawrence, M. G., Montanaro, V., Müller, J.-F., Pitari, G., Prather, M. J., Pyle, J. A., Rast, S., Rodriguez, J. M., Sanderson, M. G., Savage, N. H., Shindell, D. T., Strahan, S. E., Sudo, K., and Szopa, S.: Multi-model ensemble simulations of present-day and near future tropospheric ozone, J. Geophys. Res., 111, D08301, https://doi.org/10.1029/2005JD006338, 2006.
Stevenson, D. S., Young, P. J., Naik, V., Lamarque, J.-F., Shindell, D. T., Voulgarakis, A., Skeie, R. B., Dalsoren, S. B., Myhre, G., Berntsen, T. K., Folberth, G. A., Rumbold, S. T., Collins, W. J., MacKenzie, I. A., Doherty, R. M., Zeng, G., van Noije, T. P. C., Strunk, A., Bergmann, D., Cameron-Smith, P., Plummer, D. A., Strode, S. A., Horowitz, L., Lee, Y. H., Szopa, S., Sudo, K., Nagashima, T., Josse, B., Cionni, I., Righi, M., Eyring, V., Conley, A., Bowman, K. W., Wild, O., and Archibald, A.: Tropospheric ozone changes, radiative forcing and attribution to emissions in the Atmospheric Chemistry and Climate Model Intercomparison Project (ACCMIP), Atmos. Chem. Phys., 13, 3063–3085, https://doi.org/10.5194/acp-13-3063-2013, 2013.
Sudo, K., Takahashi, M., and Akimoto, H.: Future changes in stratosphere-troposphere exchange and their impacts on future tropospheric ozone simulations, Geophys. Res. Lett., 30, 2256, https://doi.org/10.1029/2003GL018526, 2003.
Tang, X., Zhu, J., Wang, Z. F., and Gbaguidi, A.: Improvement of ozone forecast over Beijing based on ensemble Kalman filter with simultaneous adjustment of initial conditions and emissions, Atmos. Chem. Phys., 11, 12901–12916, https://doi.org/10.5194/acp-11-12901-2011, 2011.
Tang, X., Kong, L., Zhu, J., Wang, Z. F., Li, J. J., Wu, H. J., Wu, Q. Z., Chen, H. S., Zhu, L. L., Wang, W., Liu, B., Wang, Q., Chen, D. H., Pan, Y. P., Song, T., Li, F., Zheng, H. T., Jia, G. L., Lu, M. M., Wu, L., and Carmichael, G. R.: A Six-year long High-resolution Air Quality Reanalysis Dataset over China from 2013 to 2018, V2, Sci. Data Bank [data set], https://doi.org/10.11922/sciencedb.00053, 2020a.
Tang, X., Kong, L., Zhu, J., Wang, Z. F., Li, J. J., Wu, H. J., Wu, Q. Z., Chen, H. S., Zhu, L. L., Wang, W., Liu, B., Wang, Q., Chen, D. H., Pan, Y. P., Song, T., Li, F., Zheng, H. T., Jia, G. L., Lu, M. M., Wu, L., and Carmichael, G. R.: A Six-year long High-resolution Air Quality Reanalysis Dataset over China from 2013 to 2018 (monthly and annual version), V1, Sci. Data Bank [data set], https://doi.org/10.11922/sciencedb.00092, 2020b.
Tilmes, S., Lamarque, J.-F., Emmons, L. K., Kinnison, D. E., Ma, P.-L., Liu, X., Ghan, S., Bardeen, C., Arnold, S., Deeter, M., Vitt, F., Ryerson, T., Elkins, J. W., Moore, F., Spackman, J. R., and Val Martin, M.: Description and evaluation of tropospheric chemistry and aerosols in the Community Earth System Model (CESM1.2), Geosci. Model Dev., 8, 1395–1426, https://doi.org/10.5194/gmd-8-1395-2015, 2015.
Tong, D., Cheng, J., Liu, Y., Yu, S., Yan, L., Hong, C., Qin, Y., Zhao, H., Zheng, Y., Geng, G., Li, M., Liu, F., Zhang, Y., Zheng, B., Clarke, L., and Zhang, Q.: Dynamic projection of anthropogenic emissions in China: methodology and 2015–2050 emission pathways under a range of socio-economic, climate policy, and pollution control scenarios, Atmos. Chem. Phys., 20, 5729–5757, https://doi.org/10.5194/acp-20-5729-2020, 2020.
Turnock, S. T., Wild, O., Dentener, F. J., Davila, Y., Emmons, L. K., Flemming, J., Folberth, G. A., Henze, D. K., Jonson, J. E., Keating, T. J., Kengo, S., Lin, M., Lund, M., Tilmes, S., and O'Connor, F. M.: The impact of future emission policies on tropospheric ozone using a parameterised approach, Atmos. Chem. Phys., 18, 8953–8978, https://doi.org/10.5194/acp-18-8953-2018, 2018.
Turnock, S. T., Wild, O., Sellara, A., and O'Connor, F. M.: 300 years of tropospheric ozone changes using CMIP6 scenarios with a parameterised approach, Atmos. Environ., 213, 686–698, https://doi.org/10.1016/j.atmosenv.2019.07.001, 2019.
Voulgarakis, A., Naik, V., Lamarque, J.-F., Shindell, D. T., Young, P. J., Prather, M. J., Wild, O., Field, R. D., Bergmann, D., Cameron-Smith, P., Cionni, I., Collins, W. J., Dalsøren, S. B., Doherty, R. M., Eyring, V., Faluvegi, G., Folberth, G. A., Horowitz, L. W., Josse, B., MacKenzie, I. A., Nagashima, T., Plummer, D. A., Righi, M., Rumbold, S. T., Stevenson, D. S., Strode, S. A., Sudo, K., Szopa, S., and Zeng, G.: Analysis of present day and future OH and methane lifetime in the ACCMIP simulations, Atmos. Chem. Phys., 13, 2563–2587, https://doi.org/10.5194/acp-13-2563-2013, 2013.
Wang, Y. and Liao, H.: The impacts of transport from South and Southeast Asia on O3 concentrations in China from 2015 to 2050, Chinese Sci. B., 67, 2043–2059, https://doi.org/10.1360/tb-2021-0707, 2022 (in Chinese).
Wang, Y., Shen, L., Wu, S., Mickley, L., He, J., and Hao, J.: Sensitivity of surface ozone over China to 2000–2050 global changes of climate and emissions, Atmos. Environ., 75, 374–382, https://doi.org/10.1016/j.atmosenv.2013.04.045, 2013.
Wang, Z. F., Sha, W. M., and Ueda, H.: Numerical modeling of pollutant transport and chemistry during a high-ozone event in northern Taiwan, Tellus B, 52, 1189–1205, https://doi.org/10.1034/j.1600-0889.2000.01064.x, 2000.
Wild, O.: Modelling the global tropospheric ozone budget: exploring the variability in current models, Atmos. Chem. Phys., 7, 2643–2660, https://doi.org/10.5194/acp-7-2643-2007, 2007.
Wild, O. and Akimoto, H.: Intercontinental transport of ozone and its precursors in a three-dimensional global CTM, J. Geophys. Res., 106, 27729–27744, https://doi.org/10.1029/2000jd000123, 2001.
Wild, O., Fiore, A. M., Shindell, D. T., Doherty, R. M., Collins, W. J., Dentener, F. J., Schultz, M. G., Gong, S., MacKenzie, I. A., Zeng, G., Hess, P., Duncan, B. N., Bergmann, D. J., Szopa, S., Jonson, J. E., Keating, T. J., and Zuber, A.: Modelling future changes in surface ozone: a parameterized approach, Atmos. Chem. Phys., 12, 2037–2054, https://doi.org/10.5194/acp-12-2037-2012, 2012.
Xu, B., Wang, T., Ma, D., Song, R., Zhang, M., Gao, L., Li, S., Zhuang, B., Li, M., and Xie, M.: Impacts of regional emission reduction and global climate change on air quality and temperature to attain carbon neutrality in China, Atmos. Res., 279, 106384, https://doi.org/10.1016/j.atmosres.2022.106384, 2022.
Yang, X. L., Zhou, B. T., Xu, Y., and Han, Z.-Y.: CMIP6 Evaluation and Projection of Temperature and Precipitation over China, Adv. Atmos. Sci., 38, 817–830, https://doi.org/10.1007/s00376-021-0351-4, 2021.
Young, P. J., Archibald, A. T., Bowman, K. W., Lamarque, J.-F., Naik, V., Stevenson, D. S., Tilmes, S., Voulgarakis, A., Wild, O., Bergmann, D., Cameron-Smith, P., Cionni, I., Collins, W. J., Dalsøren, S. B., Doherty, R. M., Eyring, V., Faluvegi, G., Horowitz, L. W., Josse, B., Lee, Y. H., MacKenzie, I. A., Nagashima, T., Plummer, D. A., Righi, M., Rumbold, S. T., Skeie, R. B., Shindell, D. T., Strode, S. A., Sudo, K., Szopa, S., and Zeng, G.: Pre-industrial to end 21st century projections of tropospheric ozone from the Atmospheric Chemistry and Climate Model Intercomparison Project (ACCMIP), Atmos. Chem. Phys., 13, 2063–2090, https://doi.org/10.5194/acp-13-2063-2013, 2013.
Young, P. J., Naik, V., Fiore, A. M., Gaudel, A., Guo, J., Lin, M. Y., Neu, J. L., Parrish, D. D., Rieder, H. E., Schnell, J. L., Tilmes, S., Wild, O., Zhang, L., Ziemke, J., Brandt, J., Delcloo, A., Doherty, R. M., Geels, C., Hegglin, M. I., Hu, L., Im, U., Kumar, R., Luhar, A., Murray, L., Plummer, D., Rodriguez, J., Saiz-Lopez, A., Schultz, M. G., Woodhouse, M. T., and Zeng, G.: Tropospheric Ozone Assessment Report: Assessment of global-scale model performance for global and regional ozone distributions, variability, and trends, Elem. Sci. Anth., 6, 10, https://doi.org/10.1525/elementa.265, 2018.
Zanis, P., Akritidis, D., Turnock, S., Naik, V., Szopa, S., Georgoulias, A. K., Bauer, S. E., Deushi, M., Horowitz, L. W., Keeble, J., Sager, P. L., O'Connor, F. M., Oshima, Naga., Tsigaridis, K., and Noije, T.: Climate change penalty and benefit on surface ozone: A global perspective based on CMIP6 Earth system models, Environ. Res. Lett., 17, 024014, https://doi.org/10.1088/1748-9326/ac4a34, 2022.
Zaveri, R. A., Berkowitz, C. M., Kleinman, L. I., Springston, S. R., Doskey, P. V., Lonneman, W. A., and Spicer, C. W.: Ozone production efficiency and NOx depletion in an urban plume: Interpretation of field observations and implications for evaluating O3-NOx-VOC sensitivity, J. Geophys. Res., 108, 4436, https://doi.org/10.1029/2002JD003144, 2003.
Ziemke, J. R., Chandra, S., Labow, G. J., Bhartia, P. K., Froidevaux, L., and Witte, J. C.: A global climatology of tropospheric and stratospheric ozone derived from Aura OMI and MLS measurements, Atmos. Chem. Phys., 11, 9237–9251, https://doi.org/10.5194/acp-11-9237-2011, 2011.
Zhu, J. and Liao, H.: Future ozone air quality and radiative forcing over China owing to future changes in emissions under the Representative Concentration Pathways (RCPs), J. Geophys. Res.-Atmos., 121, 1978–2001, https://doi.org/10.1002/2015JD023926, 2016.
- Abstract
- Introduction
- Materials and methods
- Tropospheric ozone evaluation
- Tropospheric ozone budgets and distributions under the net-zero scenario
- The contribution of O3 chemistry and intercontinental transport
- Summary and conclusions
- Data availability
- Author contributions
- Competing interests
- Disclaimer
- Acknowledgements
- Financial support
- Review statement
- References
- Supplement