the Creative Commons Attribution 4.0 License.
the Creative Commons Attribution 4.0 License.
 | 14 Dec 2023
Measurement report: Ammonia in Paris derived from ground-based open-path and satellite observations
Camille Viatte
Nadir Guendouz
Clarisse Dufaux
Arjan Hensen
Daan Swart
Martin Van Damme
Lieven Clarisse
Pierre Coheur
Cathy Clerbaux
Ammonia (NH3) is an important air pollutant which, as a precursor of fine particulate matter, raises public health concerns. This study analyzes 2.5 years of NH3 observations derived from ground-based (miniDOAS; differential optical absorption spectroscopy) and satellite (IASI; Infrared Atmospheric Sounding Interferometer) remote sensing instruments to quantify, for the first time, temporal variabilities (from interannual to diurnal) in NH3 concentrations in Paris.
The IASI and miniDOAS datasets are found to be in relatively good agreement (R>0.70) when atmospheric NH3 concentrations are high and driven by regional agricultural activities. Over the investigated period (January 2020–June 2022), NH3 average concentrations in Paris measured by the miniDOAS and IASI are 2.23 µg m−3 and 7.10×10¹⁵ molec. cm−2, respectively, which are lower than or equivalent to those documented in other urban areas. The seasonal and monthly variabilities in NH3 concentrations in Paris are driven by sporadic agricultural emissions influenced by meteorological conditions, with NH3 concentrations in spring up to 2 times higher than in other seasons.
The potential source contribution function (PSCF) reveals that the close (100–200 km) east and northeast regions of Paris constitute the most important potential emission source areas of NH3 in the megacity.
Weekly cycles of NH3 derived from satellite and ground-based observations show different ammonia sources in Paris. In spring, agriculture has a major influence on ammonia concentrations, and, in the other seasons, multi-platform observations suggest that ammonia is also controlled by traffic-related emissions.
In Paris, the diurnal cycle of NH3 concentrations is very similar to the one of NO2, with morning enhancements coincident with intensified road traffic. NH3 evening enhancements synchronous with rush hours are also monitored in winter and fall. NH3 concentrations measured during the weekends are consistently lower than NH3 concentrations measured during weekdays in summer and fall. This is further evidence of a significant traffic source of NH3 in Paris.
- Article
(2849 KB) - Full-text XML
-
Supplement
(957 KB) - BibTeX
- EndNote


Ammonia (NH3) is an air pollutant which plays a role in important environmental and health issues (Rockström et al., 2009). It is a highly reactive gas, with a lifetime of a few hours to a few days (Evangeliou et al., 2021; Dammers et al., 2019), capable of reacting with nitrogen oxides (NOx) and sulfur oxides (SOx) to form fine particulate matter composed of ammonium nitrate and ammonium sulfate (Sutton et al., 2013). The formation of fine particles plays a major role in the degradation of air quality, as they are the cause of respiratory and cardiovascular diseases (Pope et al., 2009).
Models have difficulty predicting events of particulate pollution associated with NH3 since ground-based atmospheric observations of this gas are still relatively sparse (Nair and Yu, 2020) and difficult to implement (Twigg et al., 2022; von Bobrutzki et al., 2010). To our knowledge, only six countries in the world (the United States, China, the Netherlands, the United Kingdom, Belgium, and Canada) have dedicated NH3 observations in their atmospheric monitoring networks. This poses a problem for long-term monitoring of pollution and the implementation of emission reduction policies.
Global population growth causes increased food demand, leading to higher ammonia emissions from intensive agricultural production systems (Fowler et al., 2013). Global NH3 emissions have increased by more than 80 % between 1970 and 2017 (McDuffie et al., 2020). In Europe, a substantial increase in nitrate and ammonium concentrations in the composition of fine articles has been observed for several years in the early spring when fertilizer applications intensify (Favez et al., 2021). In addition, the share of emissions related to road traffic is also increasing because of popularization of catalytic converters in car engines (Zhang et al., 2021). In France, 98 % of ammonia comes from agricultural activities, via decomposition and volatilization of nitrogen fertilizers (34 %) and animal waste (64 %); the rest are from industry, road traffic, and residential heating (CITEPA, 2022). In the Île-de-France region (greater Paris area), the share of agriculture is lower (75 %) due to a higher contribution of traffic and residential sectors (13 % and 12 %, respectively; Airparif, 2022). NH3 emissions from road traffic are very poorly quantified and may be a larger-than-expected source in urban areas (Pu et al., 2023; Chatain et al., 2022; Cao et al., 2021; Roe et al., 2004; Sutton et al., 2000).
Monitoring NH3 is therefore essential, especially in urban areas such as Paris, where particulate pollution episodes are observed almost every spring (Viatte et al., 2022) and often associated with emissions from agricultural activities in the surrounding areas (Viatte et al., 2020, 2021; Kutzner et al., 2021; Petetin et al., 2016; Petit et al., 2015).
Global-scale measurement of atmospheric ammonia is possible via soundings from several satellite-borne instruments such as the Atmospheric Infrared Sounder (AIRS; Warner et al., 2016), the Cross-track Infrared Sounder (CrIS; Shephard and Cady-Pereira, 2015), and the Infrared Atmospheric Sounding Interferometer (IASI; Clarisse et al., 2009). Satellite measurements of atmospheric ammonia allow for a description of its spatial distribution with global coverage. The detection of the multi-year evolution of concentrations is possible, as well as the detection of emission sources at the kilometer scale (Van Damme et al., 2018), and even the quantification of their variability (Van Damme et al., 2021; Dammers et al., 2019). Remote sensing data are also used as a means to estimate ammonia emission inventories (Marais et al., 2021; Cao et al., 2020; Fortems-Cheiney et al., 2020).
Quantifying and analyzing temporal NH3 variabilities at different scales (diurnal, weekly, seasonal, and interannual) help to improve emission inventories and air quality forecasts (Cao et al., 2021). Diurnal NH3 variability, which is rarely measured, is particularly crucial because atmospheric models have difficulty representing it (Lonsdale et al., 2017). NH3 concentrations increase during the day due to the temperature dependence of emissions, but there may be many other factors at play influencing the diurnal variability in NH3 concentrations in the atmosphere, such as transport, boundary layer height, deposition, fertilizer application time, road traffic emissions, and the interaction of all these factors (Sudesh and Kulshrestha, 2021; Osada, 2020; Wang et al., 2015). The diurnal variability of NH3, which is still largely missing from ground and satellite observations, provides valuable information regarding sources, surface exchange, deposition, gas–particle conversion, and transport of NH3 (Clarisse et al., 2021).
In this work, we present 2.5 years of atmospheric NH3 concentrations measured in Paris using the synergy of ground-based and IASI satellite observations to quantify NH3 variabilities at different timescales.
2.1 miniDOAS
NH3 concentrations have been measured since January 2020 in the Paris city center (48.8∘ N, 2.3∘ E) using the ground-based miniDOAS (differential optical absorption spectroscopy) instrument located at the QUALAIR supersite (40 m a.g.l.; https://qualair.fr/index.php/en/english/, last access: 13 December 2023). To the best of our knowledge, this dataset constitutes the only continuous (day and night) NH3 observations available at high temporal frequency representative of the Paris megacity. The miniDOAS is a state-of-the-art instrument suitable for NH3 monitoring (Sintermann et al., 2016; Berkhout et al., 2017) since it performs accurate high-temporal-resolution measurements (every hour, day and night) (Volten et al., 2012). It has been designed and developed by the National Institute for Public Health and the Environment (RIVM; the Netherlands) to be part of the Dutch National Air Quality Monitoring Network (Berkhout et al., 2017). The miniDOAS is an active remote sensing instrument based on open-path differential absorption spectrometry. It uses a xenon lamp which emits a UV light, with ammonia having a strong absorption band in the UV range between 200 and 230 nm. The UV light beam travels along an optical path of 20 m, at the end of which there is a reflector which reflects the UV light and sends it back to the spectrometer or receiver. The Beer–Lambert law is used to quantify the extinction at the absorption wavelengths of ammonia to retrieve atmospheric ammonia concentrations (Volten et al., 2012). The miniDOAS can measure a wide range of ammonia concentrations (from 0.5 to 200 µg m−3) day and night and does not suffer from sampling artifacts, since it does not use a filter or inlet, unlike other commonly used instruments (such as Picarro, Caville et al., 2023; von Bobrutzki et al., 2010). Estimated errors are 4.10−3µg m−3 in hourly measurements (Volten et al., 2012). Using ammonia measurements performed by the miniDOAS in Paris, Viatte et al. (2021) demonstrated the contribution of NH3 to particulate pollution events that occurred during the 2020 COVID-19 lockdown.
2.2 IASI
The Infrared Atmospheric Sounding Interferometer (IASI; Clerbaux et al., 2009) was first launched in 2006 as part of the MetOp satellite (Meteorological Operational satellite) series to monitor atmospheric composition twice a day (at 09:30 and 21:30 LT) globally. IASI measures atmospheric spectra in the thermal infrared region with an elliptical pixel footprint of 12 × 12 km at nadir and 20 × 39 km at the far end of the swath. In this study, we use NH3 columns derived from IASI morning (09:30 LT) overpasses on board MetOp-B and MetOp-C from January 2020 to June 2022. When comparing IASI and miniDOAS NH3 concentrations in Paris, we selected coincident observations made within the same hour, and the center of the IASI pixels was used to determine the distance between the miniDOAS and IASI measurements. In this work, we use version 3 of the ANNI-NH3 reanalyzed dataset (Van Damme et al., 2021; Guo et al., 2021; Viatte et al., 2022).
2.3 Meteorological data from ERA5
Meteorological parameters originate from the ERA5 database of the European Centre for Medium-Range Weather Forecasts (ECMWF; Hersbach et al., 2020), which is built from observations recalibrated into a global assimilation model at a 30 km resolution. In this work, we used the hourly data of the temperature at 2 m, the precipitation, the u and v components of the wind at 100 m, and the height of the boundary layer, taken from the grid cells in which Paris is located.
2.4 Back trajectories and potential source contribution factor (PSCF) analysis
To study the transport affecting the concentration of ammonia in Paris, we use the Hybrid Single-Particle Lagrangian Integrated Trajectory model (HYSPLIT; Stein et al., 2015) to calculate backward trajectories of air masses ending at altitudes of 100 m (above sea level, which corresponds to the altitude of the miniDOAS location) between January 2020 and June 2022.
Meteorological data used in the runs are from the National Centers for Environmental Prediction–National Center for Atmospheric Research (NCEP–NCAR) reanalysis at a 2.5∘ global latitude–longitude projection. We ensure by visual inspections that the back trajectories using a 2.5∘ resolution meteorological dataset are similar to those using a finer meteorological dataset at 0.25∘ resolution (Global Forecast System; GFS).
Due to the short and highly variable lifetime of NH3, ranging between 2–4 h (Dammers et al., 2019) and 12 h (Evangeliou et al., 2021), we simulated an average of 6 h of backward trajectories with an interval of 1 h. Using the hourly NH3 observations from the miniDOAS, the potential emission sources of NH3 were analyzed. The potential source contribution factor (PSCF) method (Malm et al., 1986) is used to identify source regions affecting air quality in terms of NH3 concentration in Paris between January 2020 and June 2022. This method is now commonly used in atmospheric science (Wang et al., 2023; Qadri et al., 2022; Martino et al., 2022; Biuki et al., 2022; Ren et al., 2021; Zachary et al., 2018; Jeong et al., 2011) and combines the concentration dataset with air parcel back trajectory to identify preferred pathways producing high observed NH3 concentrations in Paris. The larger the PSCF (range: 0–1), the greater the contribution of the pollution region to the atmospheric pollutants at the receptor site.
3.1 Comparison of NH3 concentrations between IASI and miniDOAS
The 2.5-year mean NH3 total column distribution around Paris derived from IASI from 1 January 2020 to 31 May 2022 is shown in Fig. 1 (top panel). To obtain averages at a high resolution needed for Greater Paris-scale studies, we used the oversampling method described by van Damme et al. (2018) that takes into account the real elliptical sizes of each IASI pixel. All IASI maps shown in this study were computed using this methodology. Hot spots of ammonia are found around Paris in agricultural areas, especially in the Champagne-Ardennes region between the cities of Troyes and Reims (Viatte et al., 2020).
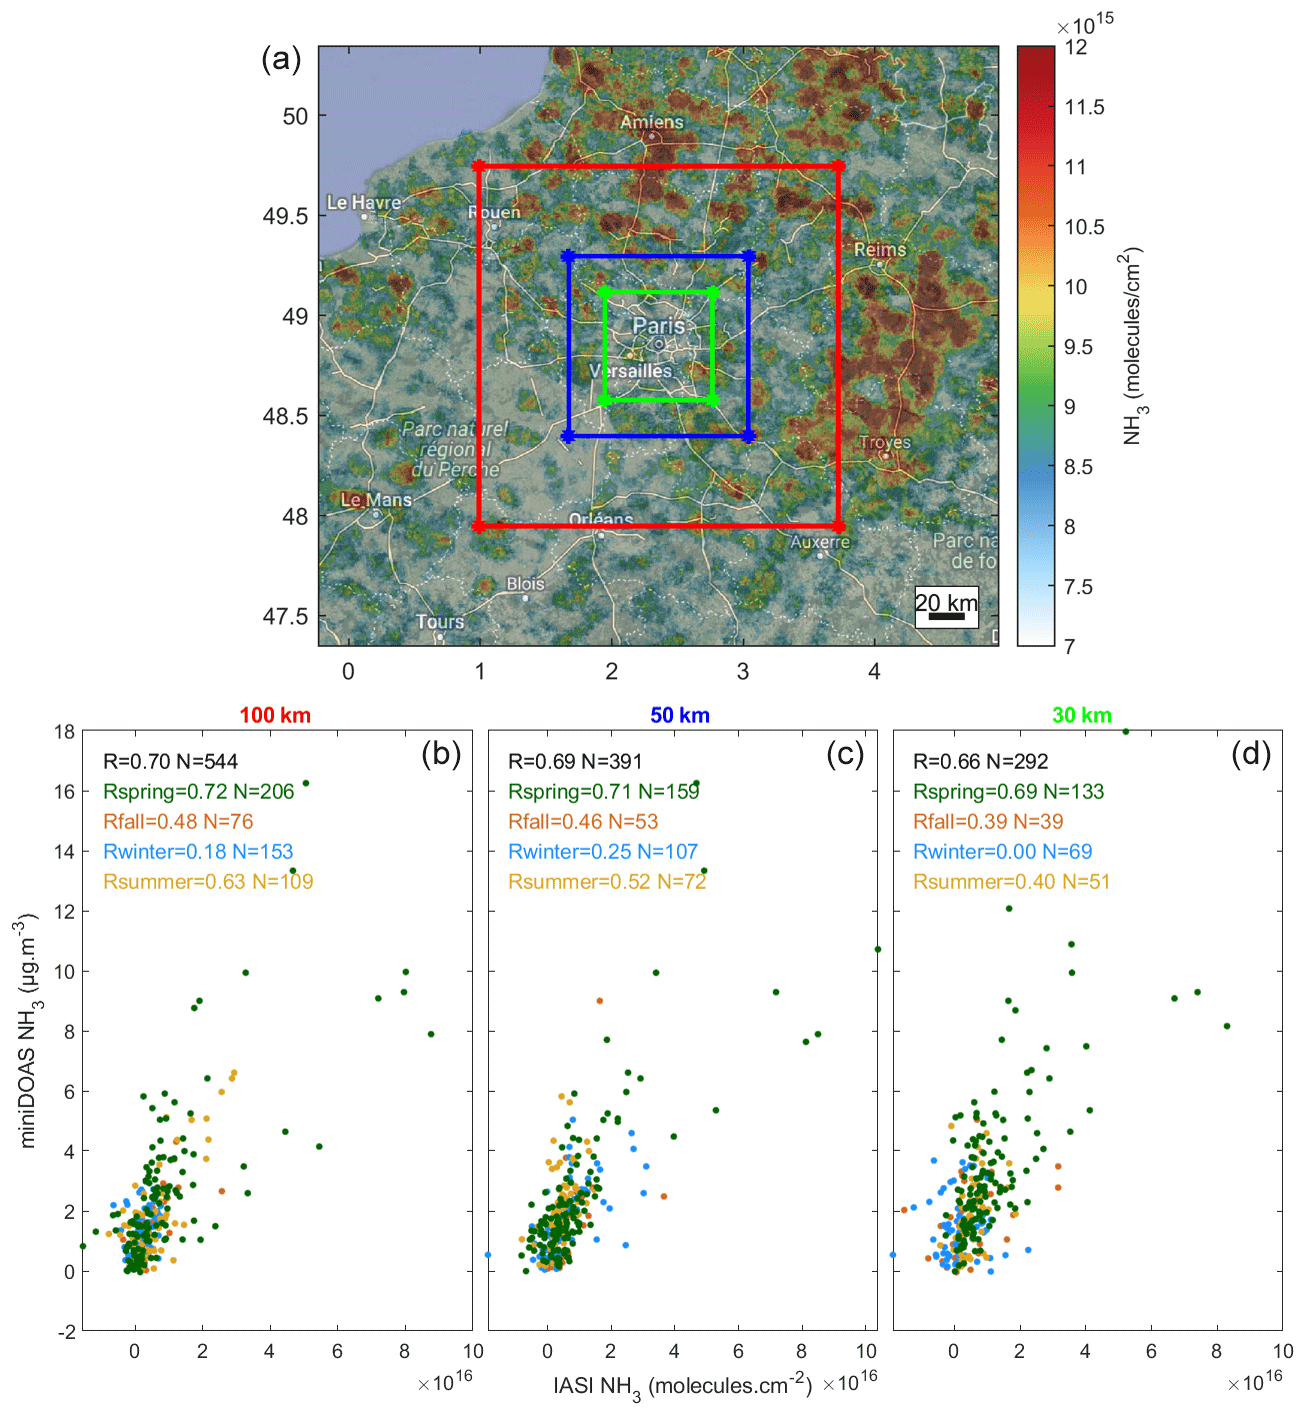
Figure 1(a) The 2.5-year average of IASI NH3 column distributions (from 1 January 2020 to 31 May 2022). (b, c, d) The miniDOAS ground-based NH3 concentrations (µg m−3) versus IASI-retrieved NH3 column concentrations (molec. cm−2) per season for different spatial criteria from the Paris city center where the miniDOAS is located (100 km in the red box, 50 km in the blue box, and 30 km in the green box).
NH3 has a short atmospheric lifetime, which is why we only compare the miniDOAS data recorded within the same hour as the IASI morning overpass time. The IASI-retrieved column (in molec. cm−2) and the miniDOAS ground-based concentrations (µg m−3) are compared to assess the spatial criteria (100 km in the red box, 50 km in the blue box, and 30 km in the green box) and the season in which both datasets are in the best agreement. In this study we are not converting IASI columns to surface observations since it introduces additional errors and does not change the correlation as explained in Van Damme et al. (2015).
Overall, the miniDOAS and IASI NH3 concentrations are in moderate agreement with a Pearson correlation (Akoglu et al., 2018) of 0.70, 0.69, and 0.66 when considering IASI pixels within a 100, 50, and 30 km box around Paris, respectively. The number of pairs is, however, reduced by a factor of 2 when considering IASI pixels in a 100 km versus a 30 km box around Paris. All correlations are significant (p value < 0.05), except in winter for the 100 and 30 km boxes and in fall for the 30 km box. The best agreement between the miniDOAS and IASI is in spring, with Pearson correlations ranging from 0.72 to 0.69 (green points in the scatterplots of Fig. 1). This period corresponds to high atmospheric NH3 concentrations when spreading practices occur in the surrounding agricultural regions of Paris (Viatte et al., 2022). The high correlation in spring between the two datasets can be attributed to two factors: (1) NH3 concentrations are higher, and therefore the signal measured by the two instruments is larger, leading to a better correlation from the wide range of NH3 concentrations (0–18 µg m−3 for the miniDOAS and 0–1.1016 molec. cm−2 for IASI, Fig. 1), and (2) the high amount of NH3 emitted in spring in the surrounding regions due to fertilizer applications can be transported to Paris (Viatte et al., 2021, 2022), resulting in high correlations between the ∼12 km IASI footprints and the local miniDOAS observations. In fall and summer, the Pearson correlation coefficients range from 0.63 to 0.40 between IASI and the miniDOAS for all box sizes. The lower correlations between the ground-based and the satellite NH3 observations could reveal specific NH3 sources in the close vicinity of the miniDOAS, which might not be representative of the IASI pixel size. In winter, the agreements between the miniDOAS and IASI are poor because NH3 concentrations are weak, and IASI is less sensitive to lower atmospheric layers when thermal contrast is low (Van Damme et al., 2014).
A trade-off between good correlations and keeping a sufficient number of collocations is found when comparing NH3 concentrations from ground-based measurements located in the Paris city center with the IASI dataset in a 50 km box. We chose the IASI dataset within the 50 km box for the rest of the analysis to analyze temporal variabilities in NH3 in Paris.
3.2 Impact of agriculture on NH3 concentrations in Paris
3.2.1 2.5 years of NH3 measurements in Paris
Here, we investigate temporal variabilities in NH3 using 2.5 years of hourly measurements from 1 January 2020 to 31 May 2022 (Fig. 2). The miniDOAS worked almost full time during this period, with 16 888 hourly measurements of the possible 21 145. The missing data are due to either some technical issues during warm conditions (malfunctioning air conditioner in August 2021) or their removal from the QUALAIR facility for field measurement campaigns (from 15 September 2021 to 24 November 2021). Over the 16 888 hourly NH3 measurements, average errors are µg m−3 with maximum values occurring when signal is low due to a transient poor alignment (such as in April 2020; yellow dots in Fig. 2). A description of the measurement uncertainties can be found in Volten et al. (2012).
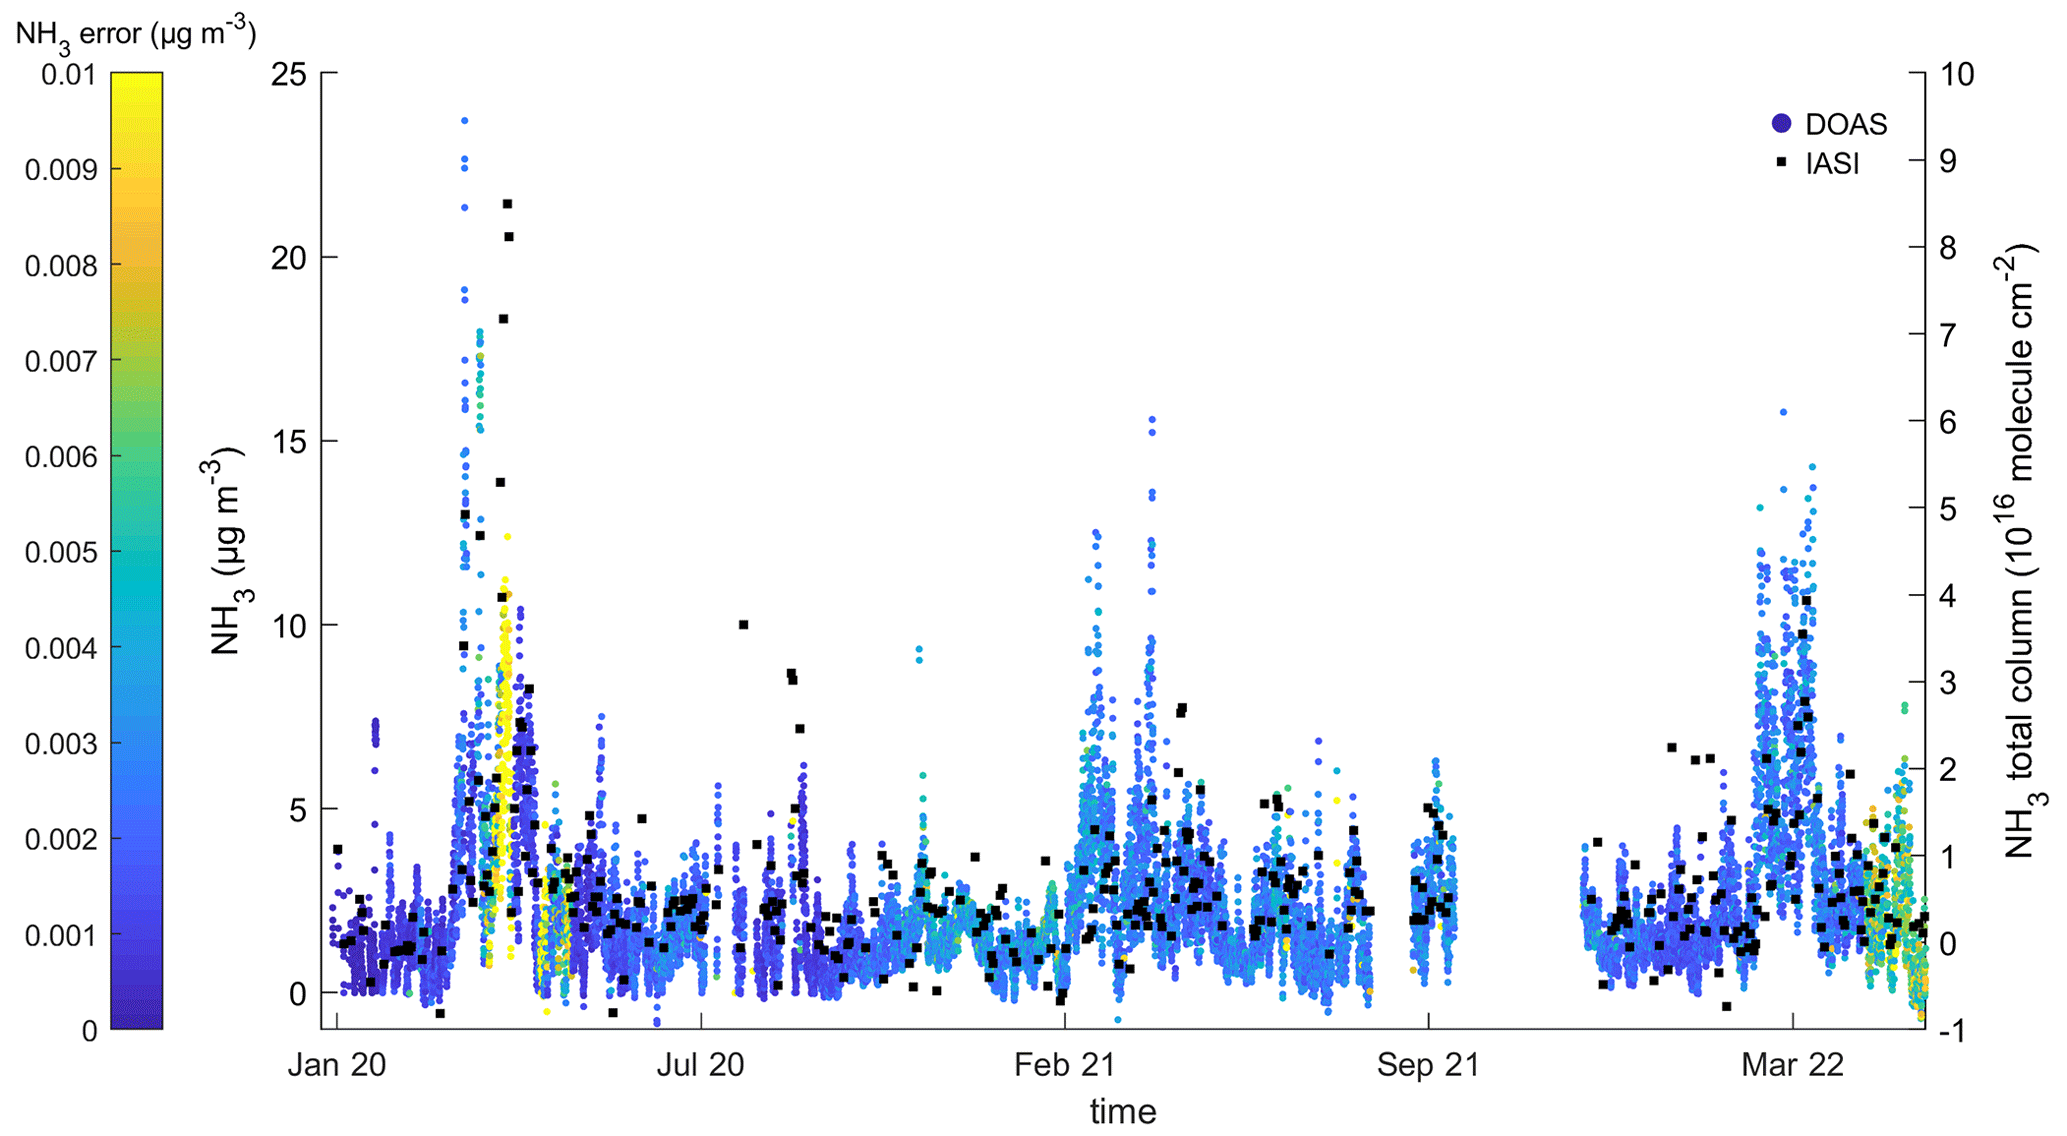
Figure 2Time series of hourly NH3 concentrations (in µg m−3) color coded by the errors in the measurements derived from the miniDOAS located in Paris and IASI NH3 total columns (in black, molec. cm−2) observed in a 50 km box centered around Paris from 1 January 2020 to 31 May 2022.
The measurements made by the miniDOAS over the January 2020–June 2022 period (N=16 888) show an average ammonia concentration of 2.23 µg m−3 in Paris over this period, with a standard deviation of 2.02 µg m−3, indicating a high NH3 variability. In comparison, the average concentration measured by the miniDOAS in an agricultural site at Grignon (Loubet et al., 2022) in September–October 2021 (France) is 6.52±8.44 µg m−3 (Caville et al., 2023), almost 3 times higher than in Paris. The relatively low concentrations observed in Paris are explained by the distance to the major emission sources which are related to agricultural activities. Ammonia concentrations measured in Paris are on average lower than or equivalent to those documented in urban areas such as Beijing (China; average of 21± standard deviations of 14 ppb, corresponding to 14.7±10 µg m−3 from January 2018 to January 2019; Lan et al., 2021), Shanghai (China; 6.2±4.6 ppb, which corresponds to 4.3±3.2 µg m−3 from July 2013 to September 2014; Wang et al., 2015), Rome (Italy; 1.2–21.6 µg m−3 between May 2001 and March 2002; Perrino et al., 2002), Milan (Italy; 4.4–13.4 µg m−3 between 2007 and 2019; Lonati et al., 2020), Louisville (the United States; 2.2–5.2 µg m−3 from June to August 2011; Li et al., 2017), and Toronto (Canada; 2.5 ppb, which corresponds to 1.75 µg m−3 from 2003 to 2011; Hu et al., 2014). The miniDOAS is located at an altitude of 40 m so that its observation footprint is representative of Greater Paris. This may partly explain the lower NH3 concentrations observed in Paris compared to other urban areas.
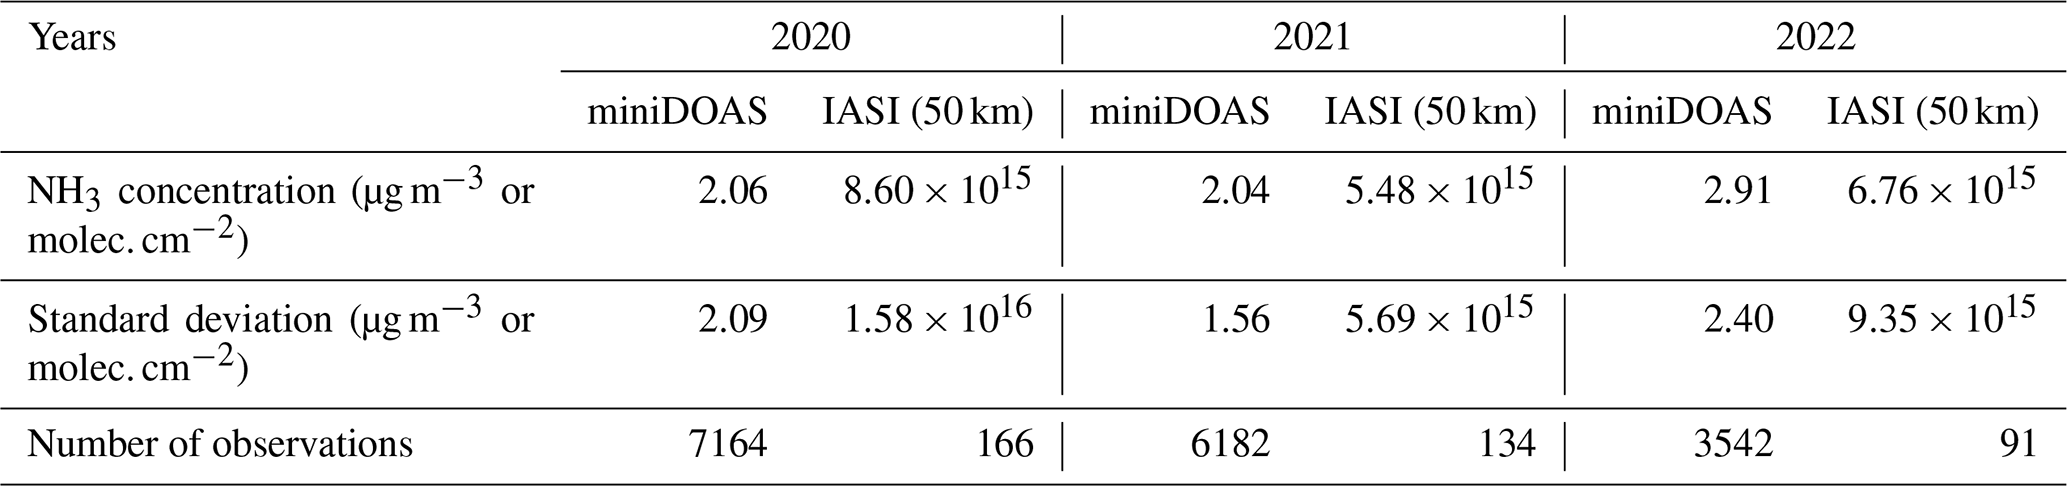
The miniDOAS and IASI coincident measurements show relatively low interannual variability (Table 1). NH3 annual concentrations measured by the miniDOAS are 2.06±2.09 µg m−3 and 2.04±1.56 µg m−3 for 2020 and 2021, respectively. The higher mean and standard deviation in 2022 (2.91±2.40 µg m−3 for the miniDOAS) compared to the other years can be due to the fact that measurements are performed from January to June only. IASI NH3 total columns around Paris exhibit a higher NH3 annual concentration and standard deviation in 2020 compared to the other years because of the multiple high-pollution events occurring in spring during the 2020 COVID-19 lockdown, as described in Viatte et al. (2021).
Table 1Average NH3 concentration, standard deviation, and number of observations for 2020, 2021, and part of 2022 derived from coincident measurements of the miniDOAS and IASI (50 km box around Paris).
3.2.2 Seasonal and monthly NH3 variabilities in Paris
Unlike the weak interannual variability in NH3 concentrations in Paris, both ground-based (miniDOAS) and satellite (IASI) measurements reveal high seasonal variabilities in NH3 concentrations (Fig. 3). In spring, NH3 concentrations measured in Paris by the miniDOAS and IASI are on average 3.34±2.67 µg m−3 and molec. cm−2, respectively. These springtime NH3 concentrations are enhanced by a factor of 2 compared to the other seasons, which is consistent with the fertilizer application periods of the nearby agricultural fields. Both datasets show that NH3 concentrations in March and April are 2 to 3 times higher than the other months. Precipitation for these months is also lower than in February on average (see Fig. S1 in the Supplement).
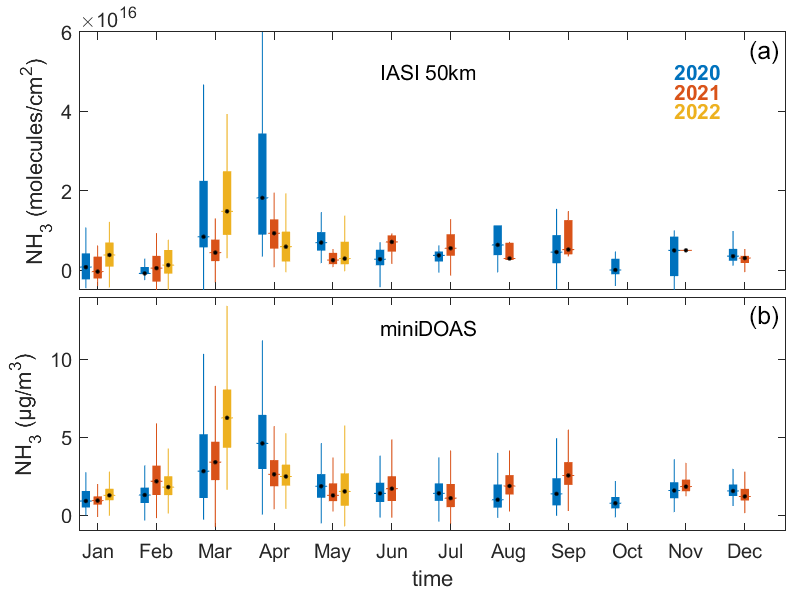
Figure 3Monthly NH3 concentrations color coded by the year of measurements (2020 in blue, 2021 in orange, and 2022 in yellow) derived from IASI (a, in molec. cm−2) in a 50 km box around Paris and the ground-based miniDOAS instrument (b, in µg m−3) located in the Paris city center. Note that IASI observations are only considered when a miniDOAS observation is available within the same hour as the IASI overpass.
When considering each year of measurement separately, we notice that the timing of the maximum NH3 concentrations is variable. In 2020, the maximum is reached in April, with averaged NH3 concentrations of 4.76±2.48 µg m−3 (miniDOAS) and molec. cm−2 (IASI), whereas in 2022 the maximum appears in March, with a monthly NH3 concentration of 6.42±2.46 µg m−3 and molec. cm−2 derived from the miniDOAS and IASI, respectively.
Meteorological conditions influence the timing of the agricultural practices (farmers do not spread their fertilizer when it rains), NH3 volatilization from the soil to the atmosphere (higher temperature favors NH3 volatilization; Sutton et al., 2013), and the transport of NH3 over Paris.
In April 2020, NH3 concentrations observed by IASI and the miniDOAS are high compared to April 2022. In April 2020, precipitation is low (0.3 mm compared to 0.75 mm in April 2022), and the monthly-averaged atmospheric temperature is 3 to 5 ∘C higher than in 2021 and 2022 (Fig. S1). This could explain why NH3 concentrations are higher in April 2020 than in April 2022. Similarly, the lower ammonia concentration recorded in March 2021 compared to March 2022 is likely explained by higher precipitation (0.09 mm) and a lower temperature (of 2 ∘C on a monthly average) than in March 2022.
In 2021, a second NH3 enhancement is measured in September by the miniDOAS (2.73±1.14 µg m−3) and IASI ( molec. cm−2), which is not observed in 2020, possibly because atmospheric temperatures were lower than in 2021 (Fig. S1). The pronounced seasonal variability can be explained at the first order by the practices of the farmers. In most European countries, strict regulations are applied in terms of the timing of fertilizer application (Ge et al., 2020). In France, it is forbidden to spread nitrogen fertilizers in winter months (between 30 November and 15 February; Ludemann et al., 2022) depending on the fertilizer and land and crop types.
Overall, the seasonal and monthly variabilities in NH3 concentrations in Paris are dominated by agricultural activities and meteorological conditions.
3.2.3 Potential source contribution function (PSCF) analysis for NH3 concentrations
To determine the origin of the NH3 measured in Paris, the potential source contribution function (PSCF) is used. The PSCF analysis and the IASI NH3 maps are shown for the investigated period (January 2020–June 2022; Fig. 4, upper panels) and the spring of 2020, 2021, and 2022 (Fig. 4, three lower panels).
Over the whole time series, the northeast (100 km from Paris in the Aisne department of France) and east (70 km from Paris in the Seine-et-Marne department) locations are found to affect the NH3 concentrations observed in the city between January 2020 and June 2022. These areas are indeed source regions of NH3 according to coincident IASI observations (Fig. 4, upper panels). According to wind field parameters derived from ERA5 over Paris (not shown here), the winds from the south are more intense (up to 18 m s−1) and are related to lower ammonia concentrations (between 0 and 4 µg m−3). The northern winds are on average weaker (maximum around 12 m s−1) and are associated with higher ammonia concentrations. In particular, for the northeast section the measured NH3 concentration is found to exceed 8 µg m−3.
According to the PSCF analysis, the main sources of NH3 from agricultural activities are found in the areas close to Paris (within 100 and 200 km from the Paris city center) mainly from the east and northeast directions. In France, the averaged utilized agricultural area per department in 2020 is 64.5 ha (Agreste – Recensements agricoles, https://stats.agriculture.gouv.fr/cartostat/#c=home, last access: 13 December 2023). The departments highlighted by the PSCF analysis are ranked in order of having the most cultivated areas in France with 141.5 ha for the Seine-et-Marne, 124.4 ha for the Oise, and 110.4 ha for the Aisne departments, for instance.
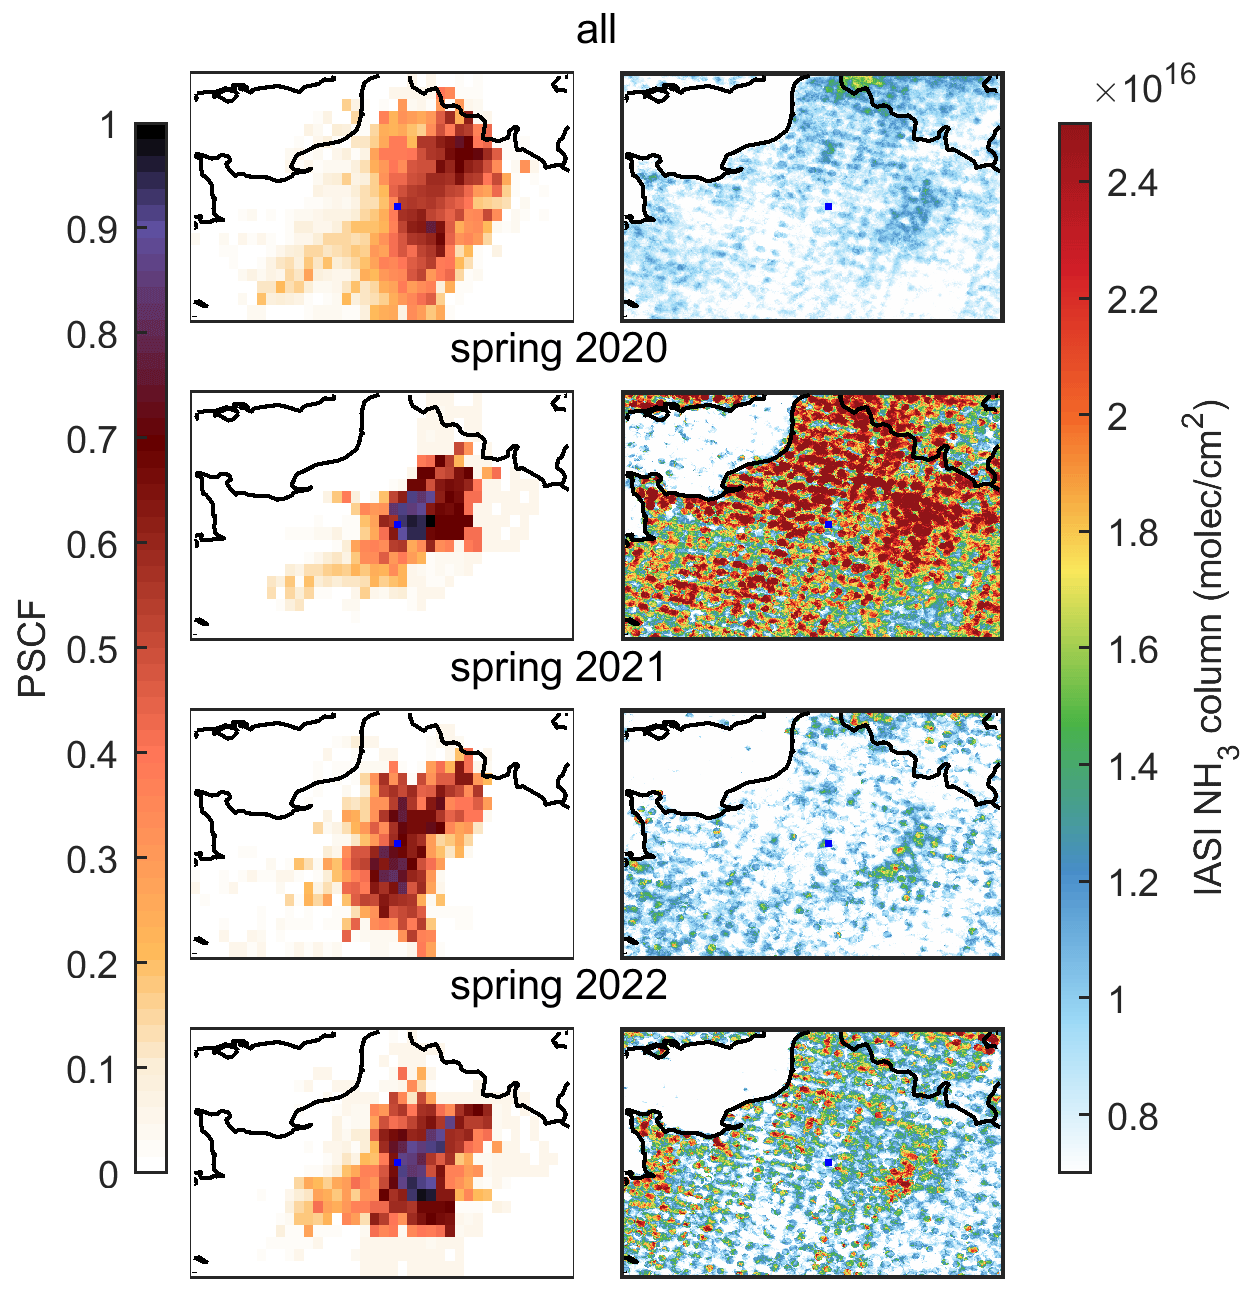
Figure 4Potential source contribution function (PSCF; left) and IASI NH3 total columns (right, in molec. cm−2) The top row is the January 2020 to June 2022 average, and the three lower panels are for the spring of 2020, 2021, and 2022. The blue dot indicates the location of Paris.
In spring, when NH3 concentrations are significantly higher in Paris (Fig. 3) and in the surroundings (Fig. 4, three lower-right panels), the PSCF analysis shows that the northeast and southeast regions are the major sources of the observed NH3 concentrations in Paris. In spring 2020, NH3 columns are higher than in spring 2021 and 2022, according to IASI observations. The main sources of NH3 in spring 2020 are pronounced in the nearby east-northeast areas (50 km from Paris in the surrounding departments of Seine-et-Marne, Oise, and Val d'Oise). In spring 2021, IASI observations reveal lower NH3 columns than in 2020 and 2022, and the sources of NH3 concentrations in Paris are in the surrounding regions of Paris (100 km in all directions). In spring 2022, the northeast pathway is highlighted similarly to spring 2020 but with a contribution of the southeast region as well.
3.3 Effect of road traffic on NH3 variability in Paris
3.3.1 Weekly cycle of NH3 concentrations
The weekly cycles of ammonia concentrations measured in Paris by the miniDOAS and IASI over the studied time series are presented in Fig. 5 (black bars, top panels). Both datasets show an increase in ammonia concentrations during the week, reaching a maximum on Thursday (2.21 µg m3 for the miniDOAS and 5.90×10¹⁵ molec. cm−2 for IASI).
The weekly cycle of IASI measurements in Paris is almost analogous to the one observed over European agricultural areas, with low concentrations observed on Mondays as a result of reduced NH3 emissions over the weekend, and an accumulation of ammonia during the week (Van Damme et al., 2022). In addition, the IASI NH3 weekly cycle averaged over 2.5 years of measurements in Paris is very similar to the NH3 weekly cycle measured in spring (Fig. 5) when agricultural activities intensify. Monitoring similar NH3 weekly variability in the urban area of Paris demonstrates that agricultural activities in the surrounding areas control the variability of ammonia in Paris on average over the whole season.
The NH3 weekly cycle observed over 2.5 years of measurements from the ground-based miniDOAS and IASI satellite observations shows, however, relatively low NH3 concentrations on Saturday and Sunday. The cycle is less pronounced for IASI measurements. Ammonia concentrations observed over the weekend by the miniDOAS and IASI are lower by 25 % and 20 % compared to NH3 concentrations averaged over weekdays in Paris.
When considering intraweek variabilities by seasons (Fig. 5, four lower panels), one can observe that both the IASI and the miniDOAS datasets reveal similar NH3 weekly cycles. The NH3 miniDOAS measurements and coincident IASI total columns measured in a 50 km box around Paris exhibit lower concentrations over the weekends compared to weekdays for all seasons, except in spring for which higher NH3 concentrations are found on Wednesday and Sunday. In spring, the miniDOAS and IASI measure a difference in NH3 concentrations averaged over the weekends compared to weekdays of +1 % and −7 %, respectively. In fall, summer, and winter, the miniDOAS (IASI) instrument measures a decrease in NH3 concentrations between weekends and weekdays of 70 % (34 %), 42 % (28 %), and 27 % (53 %), respectively.
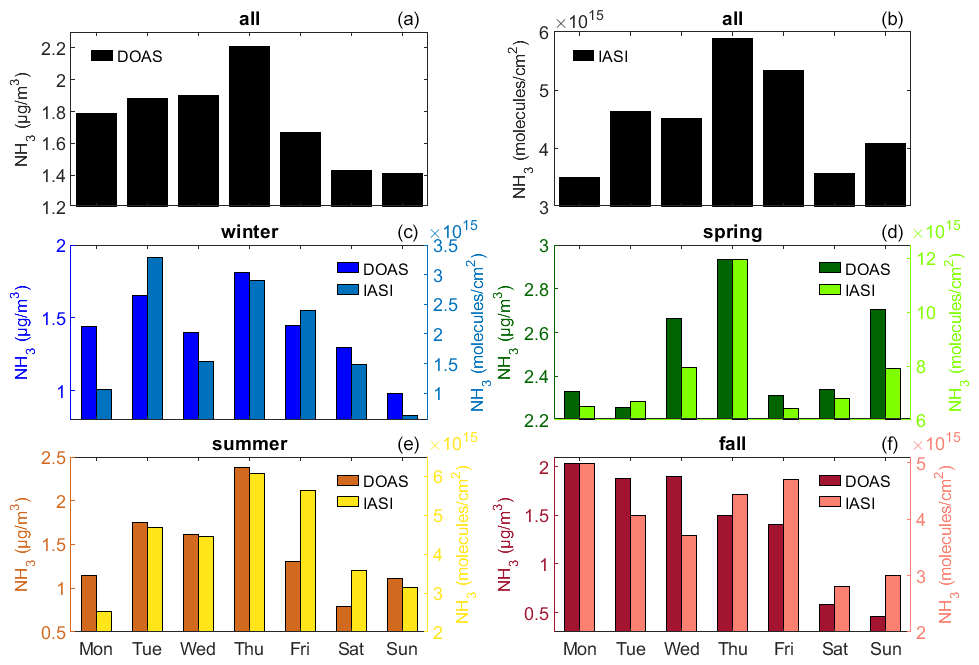
Figure 5NH3 concentrations for each day of the week, derived from the miniDOAS (µg m−3) and IASI (molec. cm−2) in Paris for the investigated period (January 2020 to May 2022, a, b) and for different seasons (winter in blue, spring in green, summer in brown and yellow, and fall in red and pink bars, c, d, e, f).
Comparing these weekly variabilities with those of the weekly flow of cars in Paris (Fig. S2), the same pattern is clearly highlighted with a stable number of cars per hour from Monday to Friday (around 640) and a decrease of 14 % over the weekends.
We can make the hypothesis that during all seasons, except spring, the influence of the agricultural practices on the variability of ammonia in Paris is less pronounced, revealing NH3 contribution from a traffic source. Since the road traffic intensity is constant throughout the year in Paris, the proportion of ammonia emitted from road traffic is proportionally higher outside the fertilization period.
3.3.2 Diurnal cycle of NH3 concentration in Paris
With the high temporal resolution of the miniDOAS acquisitions, the diurnal variability in NH3 concentration is assessed in Paris using, for the first time, a quasi-continuous (temporal coverage of 80 %) and a relatively long time series of 2.5 years of NH3 observations.
Hourly NH3 concentrations measured by the miniDOAS from January 2020 to May 2022 are shown in Fig. S3. It shows a marked diurnal variability in NH3, with a decrease of about 30 % in the middle of the day (around 14:00 LT) compared to the night, then an increase in the afternoon to again reach a maximum during the night.
Note that this diurnal variability in NH3 measured by the miniDOAS is different than that reported during springtime pollution episodes from a ground-based Fourier transform infrared spectrometer located in the suburbs of Paris (Kutzner et al., 2021). While measured integrated NH3 total columns show an intraday increase until late afternoon, the miniDOAS measures NH3 concentrations varying in opposition to the boundary layer height (Fig. S3). This reflects the dynamical effect of the boundary layer height, which is controlled by atmospheric temperature, on the dilution of pollutant concentrations measured close to the surface. Such an effect is also seen with surface measurements of NO2 concentrations in Paris (Fig. S3).
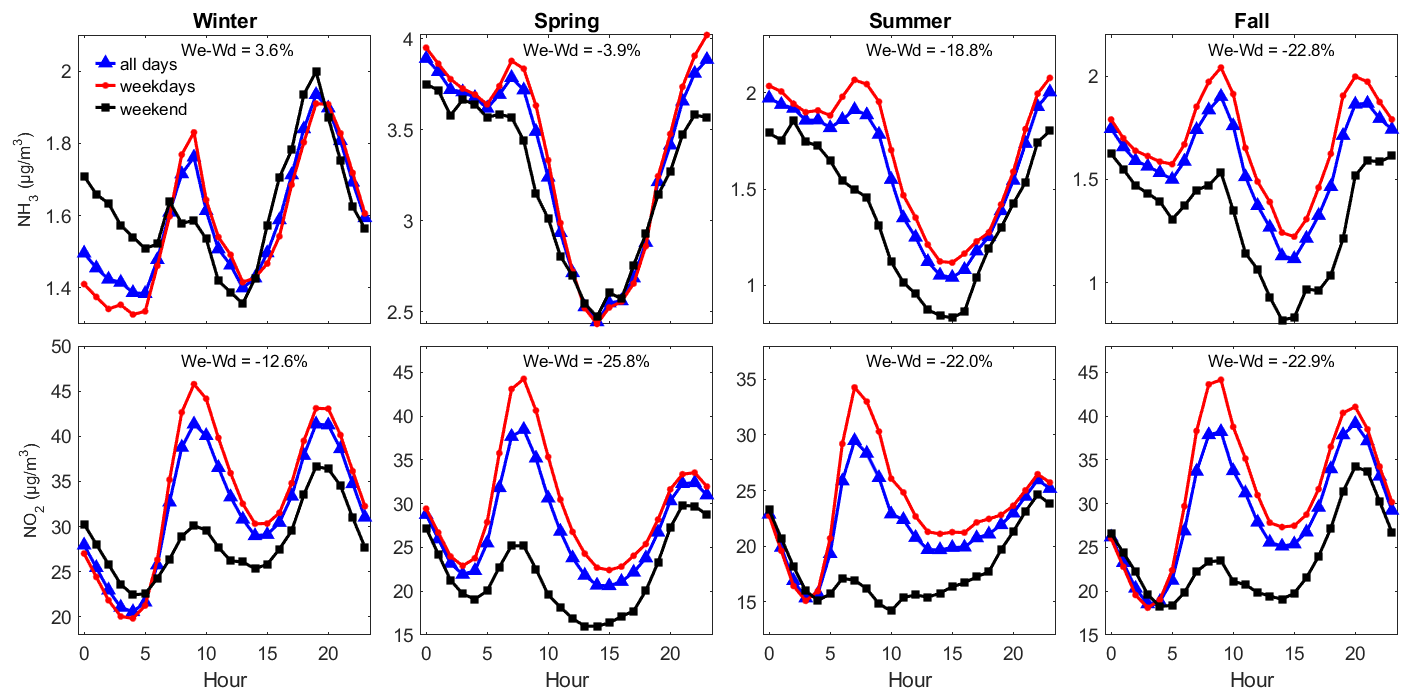
Figure 6Diurnal variability in NH3 (upper panels) and NO2 (lower panels) concentrations measured by the miniDOAS and Airparif (µg m−3) averaged by season using 2.5 years of measurements in Paris. Hours are indicated in local time. The diurnal variability in NH3 and NO2 is shown with blue lines when considering all days, in red lines for weekdays, and in black lines for weekends.
The diurnal variability in NH3 concentrations presents an increase in the morning visible for all seasons (Fig. 6). Between 05:00 and 08:00 LT, road traffic in Paris increases by a factor of 4 (Fig. S2), and NH3 concentrations rise by more than 20 % in winter and fall and by about 3 % in summer and spring.
To verify the hypothesis that road traffic is responsible for these morning enhancements, NO2 diurnal variability is also shown in Fig. 6 (lower panels). In Paris, NO2 is considered a proxy for road traffic emissions (Pazmino et al., 2021). For all seasons, morning enhancements of NO2 concentrations related to intensified road traffic emissions are coincident with morning enhancements of NH3 concentrations. Similarly, enhancements of NO2 and NH3 concentrations are observed during the evenings (20:00 to 22:00 LT) in winter and fall only. In spring, agriculture, which is the overall dominant source of ammonia in Paris, prevents the monitoring of NH3 emitted from road traffic. Conversely, in fall and winter, the relative share of agriculture is weaker, and the peaks of NH3 concentrations during rush hours (morning and evening) are observed clearly by the miniDOAS.
Diurnal variability in NH3 and NO2 concentrations averaged during weekdays (red lines) and weekends (black lines) are shown in Fig. 6. NO2 concentrations are systematically lower during weekends by 12.6 %, 25.8 %, 22.0 %, and 22.9 % in winter, spring, summer, and fall, respectively, compared to weekdays. Similarly, diurnal cycles of NH3 concentrations averaged during weekends are consistently lower than NH3 concentrations averaged during weekdays in summer and fall by 22.0 % and 22.9 %.
This highlights the importance of traffic emissions of NH3 in an urban area like Paris, detected by ground-based measurements when agricultural practices are reduced in the surrounding region.
These results are consistent with previous studies showing the importance of NH3 emissions from traffic in urban areas, such as in Rome (Italy; Perrino et al., 2002), Beijing (China; Ianniello et al., 2010), Shanghai (China; Wang et al., 2015), and Manchester (the United Kingdom; Whitehead et al., 2004) for instance. These emissions have gradually become another major contributor of ammonia pollution in urban areas in the United States and China (Sun et al., 2017). Ammonia emissions from road vehicles are shown to be underestimated in the United Kingdom (Farren et al., 2020) and in densely populated areas in China (Wen at al., 2023). In France, NH3 levels measured at a traffic site of Reims are significantly higher than those observed in a background site (Chatain et al., 2022). Our results in Paris confirm that traffic has a significant contribution to atmospheric nitrogen budgets and stress the need for further NH3 monitoring in urban sites.
Temporal variabilities in NH3 concentrations in Paris are assessed using joint observations of ground-based (miniDOAS) and satellite (IASI) remote sensing observations from January 2020 to June 2022. We present the first relatively long (2.5 years) and continuous record of hourly NH3 concentrations in Paris to determine temporal variabilities of ammonia at different scales (from interannual to diurnal variability) to unravel emission sources (traffic and agriculture).
Qualitative comparison of NH3 derived from the ground-based miniDOAS located in the Paris city center and IASI satellite observations reveals an overall moderate agreement with Pearson's correlation coefficients of 0.66, 0.69, and 0.70 when considering IASI observations in a 100, 50, and 30 km box around Paris. The best agreement between both datasets is found during springtime when NH3 concentrations are 2 to 3 times higher than during the other seasons due to fertilizer spreading occurring in the surrounding agricultural regions of Paris. Overall, agricultural activities driven by favorable meteorological conditions (high temperature and low precipitation) control the seasonal and monthly variabilities in NH3 in Paris. The PSCF analyses indicate that the agricultural regions to the east and northeast within 100 to 200 km from the Paris city center have the greatest impact on the NH3 budget in Paris.
Road traffic emissions are noticeable in the weekly NH3 cycles measured by satellite and ground-based instruments, when agricultural-related emissions are weak. Ammonia concentrations observed over the weekend by the miniDOAS and IASI are lower by 25 % and 20 % compared to NH3 concentrations averaged over the weekdays. In addition, diurnal cycles of NH3 concentrations in Paris are similar to NO2 and reveal coincident enhancements during rush hours. Further long-term NH3 monitoring in urban areas is needed to better estimate NH3 emissions from the on-road sector and their impact on secondary particle formation.
We have shown that the planetary boundary layer height greatly influences diurnal variabilities derived from surface measurements. Future work will be carried to compare these NH3 datasets in Paris to atmospheric model outputs to evaluate the timing and the absolute value of emission inventories, as well as the partition between NH3 emission sectors (traffic vs. agriculture). The launch of the geostationary Meteosat Third Generation (MTG) satellite carrying the InfraRed Sounder (IRS) hyperspectral sounder, scheduled for 2024, will offer unprecedented atmospheric observations with a spatial resolution of 4 km × 4 km (at the Equator) and a high temporal resolution (every 30 min over Europe). These new observations will improve our understanding of the diurnal variability of ammonia, and it will be a great addition to the miniDOAS and IASI observations.
The IASI NH3 dataset used in this study is available via the Zenodo repository (https://doi.org/10.5281/zenodo.7962362; Viatte, 2023a). The miniDOAS data are available at https://iasi-ft.eu/products/nh3_minidoas/ (Viatte, 2023b). The ERA5 data are available via the Climate Data Record (CDR) on the Copernicus website https://cds.climate.copernicus.eu/cdsapp#!/search?text=ERA5 back extension&type=dataset (Copernicus Climate Change Service (Climate Data Store), 2023). The potential source contribution function is available via Meteothink.org at http://meteothink.org/docs/trajstat/pscf.html (Wang et al., 2009).
The supplement related to this article is available online at: https://doi.org/10.5194/acp-23-15253-2023-supplement.
CV and NG designed the project. MVD and LC provided the IASI data. AH, AW, and DS helped with the miniDOAS installation and data acquisition. CV and CD analyzed the data. CV and CD wrote the manuscript draft. All the co-authors reviewed and edited the paper. CC wrote proposals for the financial support of the miniDOAS.
The contact author has declared that none of the authors has any competing interests.
Publisher’s note: Copernicus Publications remains neutral with regard to jurisdictional claims made in the text, published maps, institutional affiliations, or any other geographical representation in this paper. While Copernicus Publications makes every effort to include appropriate place names, the final responsibility lies with the authors.
IASI is a joint mission of EUMETSAT and the Centre National d'Etudes Spatiales (CNES; France). The IASI Level 1C data are distributed in near-real time by EUMETSAT through the EUMETCast system distribution. The authors acknowledge the AERIS data infrastructure (https://www.aeris-data.fr, last access: 13 December 2023) for providing access to the IASI Level 1 radiance and Level 2 NH3 concentration data used in this study. We thank NOAA's Air Resources Laboratory (ARL) for providing the HYSPLIT model. Research at ULB was supported by the Belgian Science Policy Office (formerly the Belgian State Federal Office for Scientific, Technical and Cultural Affairs) (Prodex HIRS) and the Air Liquide Foundation (Tapir project). Lieven Clarisse is a research associate supported by the Belgian F.R.S.-FNRS. Martin Van Damme is supported by the Arenberg FED-tWIN project funded by the Belgian Science Policy Office (BELSPO).
CNES and the AC-SAF (CDOP3) project provided financial support for the miniDOAS acquisition.
This paper was edited by Michel Van Roozendael and reviewed by two anonymous referees.
AERIS: NH3 total column from IASI (Level 2), AERIS [data set], https://iasi.aeris-data.fr/NH3/, last access: 11 May 2023.
Airparif: https://www.airparif.asso.fr/surveiller-la-pollution/les-emissions (last access: 24 February 2023), 2022.
Akoglu, H.: User's guide to correlation coefficients, Turkish J. Emerg. Med., 18, 91–93, https://doi.org/10.1016/j.tjem.2018.08.001, 2018.
Berkhout, A. J. C., Swart, D. P. J., Volten, H., Gast, L. F. L., Haaima, M., Verboom, H., Stefess, G., Hafkenscheid, T., and Hoogerbrugge, R.: Replacing the AMOR with the miniDOAS in the ammonia monitoring network in the Netherlands, Atmos. Meas. Tech., 10, 4099–4120, https://doi.org/10.5194/amt-10-4099-2017, 2017.
Biuki, Z. A., Parvin, P., and Aghaei, M.: Satellite remote sensing of particulate matter in the atmosphere of megacities: A case study of Tehran, Iran, Atmos. Pollut. Res., 13, 101545, https://doi.org/10.1016/j.apr.2022.101545, 2022.
Cao, H., Henze, D. K., Shephard, M. W., Dammers, E., Cady-Pereira, K., Alvarado, M., Lonsdale, C., Luo, G., Yu, F., Zhu, L., Danielson, C. G., and Edgerton, E. S.: Inverse modeling of NH3 sources using CrIS remote sensing measurements, Environ. Res. Lett., 15, 104082, https://doi.org/10.1088/1748-9326/abb5cc, 2020.
Cao, H., Henze, D. K., Cady-Pereira, K., McDonald, B. C., Harkins, C., Sun, K., Bowman, K. W., Fu, T.-M., and Nawaz, M. O.: COVID-19 Lockdowns Afford the First Satellite-Based Confirmation That Vehicles Are an Under-recognized Source of Urban NH3 Pollution in Los Angeles, Environ. Sci. Technol. Lett., 9, 3–9, https://doi.org/10.1021/acs.estlett.1c00730, 2021.
Caville, S., Guendouz, N., Michoud, V., Berge, A., Fortineau, A., Decuq, C., Buysse, P., Loubet, B., Esnault, B., Genermont, S., Ciuraru, R., Burban, M., Depuydt, J., Durand, B., Viatte, C., Cailteau-Fischbach, C., Petit, J.-E., Crunaire, S., Espina, P., Redon, N., Joly, L., Parent, L., Bonne, J.-L., Cousin, J., Flechard, C., Fauvel, Y., Romain, A.-C., Scheuren, M., and Chelin, P.: Measurements of ammonia in ambient air and over a controlled artificial source during the AMICA field campaign at a rural site in the Ile-de-France region, Sensors, to be submitted, 2023.
Chatain, M., Chretien, E., Crunaire, S., and Jantzem, E.: Road Traffic and Its Influence on Urban Ammonia Concentrations (France), Atmosphere-Basel, 13, 1032, https://doi.org/10.3390/atmos13071032, 2022.
CITEPA: https://www.citepa.org/wp-content/uploads/publications/cee-nu/UNECE_France_mars2022.pdf (last access: 24 February 2023), 2022.
Clarisse, L., Clerbaux, C., Dentener, F., Hurtmans, D., and Coheur, P.-F.: Global ammonia distribution derived from infrared satellite observations, Nat. Geosci., 2, 479–483, https://doi.org/10.1038/ngeo551, 2009.
Clarisse, L., Van Damme, M., Hurtmans, D., Franco, B., Clerbaux, C., and Coheur, P.-F.: The diel cycle of NH3 observed from the FY-4A Geostationary Interferometric Infrared Sounder (GIIRS), Geophys. Res. Lett., 48, e2021GL093010, https://doi.org/10.1029/2021GL093010, 2021.
Clerbaux, C., Boynard, A., Clarisse, L., George, M., Hadji-Lazaro, J., Herbin, H., Hurtmans, D., Pommier, M., Razavi, A., Turquety, S., Wespes, C., and Coheur, P.-F.: Monitoring of atmospheric composition using the thermal infrared IASI/MetOp sounder, Atmos. Chem. Phys., 9, 6041–6054, https://doi.org/10.5194/acp-9-6041-2009, 2009.
Copernicus Climate Change Service (Climate Data Store): ERA5 hourly data on single levels from 1940 to present, Copernicus Climate Change Service (C3S) Climate Data Store (CDS), https://doi.org/10.24381/cds.adbb2d47, 2023 (data available at: https://cds.climate.copernicus.eu/cdsapp#!/search?text=ERA5 back extension&type=dataset, last access: 23 May 2023).
Dammers, E., McLinden, C. A., Griffin, D., Shephard, M. W., Van Der Graaf, S., Lutsch, E., Schaap, M., Gainairu-Matz, Y., Fioletov, V., Van Damme, M., Whitburn, S., Clarisse, L., Cady-Pereira, K., Clerbaux, C., Coheur, P. F., and Erisman, J. W.: NH3 emissions from large point sources derived from CrIS and IASI satellite observations, Atmos. Chem. Phys., 19, 12261–12293, https://doi.org/10.5194/acp-19-12261-2019, 2019.
Evangeliou, N., Balkanski, Y., Eckhardt, S., Cozic, A., Van Damme, M., Coheur, P.-F., Clarisse, L., Shephard, M. W., Cady-Pereira, K. E., and Hauglustaine, D.: 10-year satellite-constrained fluxes of ammonia improve performance of chemistry transport models, Atmos. Chem. Phys., 21, 4431–4451, https://doi.org/10.5194/acp-21-4431-2021, 2021.
Farren, N. J., Davison, J., Rose, R. A., Wagner, R. L., and Carslaw, D. C.: Underestimated Ammonia Emissions from Road Vehicles, Environ. Sci. Technol., 54, 15689–15697, https://doi.org/10.1021/acs.est.0c05839, 2020.
Favez, O., Weber, S., Petit, J.-E., Alleman, L. Y., Albinet, A., Riffault, V., Chazeau, B., Amodeo, T., Salameh, D., Zhang, Y., Srivastava, D., Samaké, A., Aujay-Plouzeau, R., Papin, A., Bonnaire, N., Boullanger, C., Chatain, M., Chevrier, F., Detournay, A., and Leoz-Garziandia, E.: Overview of the French Operational Network for In Situ Observation of PM Chemical Composition and Sources in Urban Environments (CARA Program), Atmosphere, 12, 207, https://doi.org/10.3390/atmos12020207, 2021.
Fortems-Cheiney, A., Dufour, G., Dufossé, K., Couvidat, F., Gilliot, J.-M., Siour, G., Beekmann, M., Foret, G., Meleux, F., Clarisse, L., Coheur, P.-F., Van Damme, M., Clerbaux, C., and Génermont, S.: Do alternative inventories converge on the spatiotemporal representation of spring ammonia emissions in France?, Atmos. Chem. Phys., 20, 13481–13495, https://doi.org/10.5194/acp-20-13481-2020, 2020.
Fowler, D., Coyle, M., Skiba, U., Sutton, M. A., Cape, J. N., Reis, S., Sheppard, L. J., Jenkins, A., Grizzetti, B., Galloway, J. N., Vitousek, P., Leach, A., Bouwman, A. F., Butterbach-Bahl, K., Dentener, F., Stevenson, D., Amann, M., and Voss, M.: The global nitrogen cycle in the twenty-first century, Philos. Trans. R. Soc. B, 368, 1–13, https://doi.org/10.1098/rstb.2013.0164, 2013.
Ge, X., Schaap, M., Kranenburg, R., Segers, A., Reinds, G. J., Kros, H., and de Vries, W.: Modeling atmospheric ammonia using agricultural emissions with improved spatial variability and temporal dynamics, Atmos. Chem. Phys., 20, 16055–16087, https://doi.org/10.5194/acp-20-16055-2020, 2020.
Guo, X., Wang, R., Pan, D., Zondlo, M. A., Clarisse, L., Van Damme, M., Whitburn, S., Coheur, P.-F., Clerbaux, C., Franco, B., Golston, L. M., Wendt, L., Sun, K., Tao, L., Miller, D., Mikoviny, T., Müller, M., Wisthaler, A., Tevlin, A. G., Murphy, J. G., Nowak, J. B., Roscioli, J. R., Volkamer, R., Kille, N., Neuman, J. A., Eilerman, S. J., Crawford, J. H., Yacovitch, T. I., Barrick, J. D., and Scarino, A. J.: Validation of IASI Satellite Ammonia Observations at the Pixel Scale Using In Situ Vertical Profiles, J. Geophys. Res.-Atmos., 126, e2020JD033475, https://doi.org/10.1029/2020JD033475, 2021.
Hersbach, H., Bell, B., Berrisford, P., Hirahara, S., Horányi, A., Muñoz-Sabater, J., Nicolas, J., Peubey, C., Radu, R., Schepers, D., Simmons, A., Soci, C., Abdalla, S., Abellan, X., Balsamo, G., Bechtold, P., Biavati, G., Bidlot, J., Bonavita, M., De Chiara, G., Dahlgren, P., Dee, D., Diamantakis, M., Dragani, R., Flemming, J., Forbes, R., Fuentes, M., Geer, A., Haimberger, L., Healy, S., Hogan, R. J., Hólm, E., Janisková, M., Keeley, S., Laloyaux, P., Lopez, P., Lupu, C., Radnoti, G., de Rosnay, P., Rozum, I., Vamborg, F., Villaume, S., and Thépaut, J.-N.: The ERA5 global reanalysis, Q. J. Roy. Meteor. Soc., 146, 1999–2049, https://doi.org/10.1002/qj.3803, 2020.
Hu, Q., Zhang, L., Evans, G. J., and Yao, X.: Variability of atmospheric ammonia related to potential emission sources in downtown Toronto, Canada, Atmos. Environ., 99, 365–373, https://doi.org/10.1016/j.atmosenv.2014.10.006, 2014.
Ianniello, A., Spataro, F., Esposito, G., Allegrini, I., Rantica, E., Ancora, M. P., Hu, M., and Zhu, T.: Occurrence of gas phase ammonia in the area of Beijing (China), Atmos. Chem. Phys., 10, 9487–9503, https://doi.org/10.5194/acp-10-9487-2010, 2010.
Jeong, U., Kim, J., Lee, H., Jung, J., Kim, Y. J., Song, C. H., and Koo, J.-H.: Estimation of the contributions of long range transported aerosol in East Asia to carbonaceous aerosol and PM concentrations in Seoul, Korea using highly time resolved measurements: a PSCF model approach, J. Environ. Monit., 13, 1905–1918, https://doi.org/10.1039/C0EM00659A, 2011.
Kutzner, R. D., Cuesta, J., Chelin, P., Petit, J.-E., Ray, M., Landsheere, X., Tournadre, B., Dupont, J.-C., Rosso, A., Hase, F., Orphal, J., and Beekmann, M.: Diurnal evolution of total column and surface atmospheric ammonia in the megacity of Paris, France, during an intense springtime pollution episode, Atmos. Chem. Phys., 21, 12091–12111, https://doi.org/10.5194/acp-21-12091-2021, 2021.
Lan, Z., Lin, W., Pu, W., and Ma, Z.: Measurement report: Exploring NH3 behavior in urban and suburban Beijing: comparison and implications, Atmos. Chem. Phys., 21, 4561–4573, https://doi.org/10.5194/acp-21-4561-2021, 2021.
Li, Y., Thompson, T. M., Van Damme, M., Chen, X., Benedict, K. B., Shao, Y., Day, D., Boris, A., Sullivan, A. P., Ham, J., Whitburn, S., Clarisse, L., Coheur, P.-F., and Collett Jr., J. L.: Temporal and spatial variability of ammonia in urban and agricultural regions of northern Colorado, United States, Atmos. Chem. Phys., 17, 6197–6213, https://doi.org/10.5194/acp-17-6197-2017, 2017.
Lonati, G. and Cernuschi, S.: Temporal and spatial variability of atmospheric ammonia in the Lombardy region (Northern Italy), Atmos. Pollut. Res., 11, 2154–2163, https://doi.org/10.1016/j.apr.2020.06.004, 2020.
Lonsdale, C. R., Hegarty, J. D., Cady-Pereira, K. E., Alvarado, M. J., Henze, D. K., Turner, M. D., Capps, S. L., Nowak, J. B., Neuman, J. A., Middlebrook, A. M., Bahreini, R., Murphy, J. G., Markovic, M. Z., VandenBoer, T. C., Russell, L. M., and Scarino, A. J.: Modeling the diurnal variability of agricultural ammonia in Bakersfield, California, during the CalNex campaign, Atmos. Chem. Phys., 17, 2721–2739, https://doi.org/10.5194/acp-17-2721-2017, 2017.
Loubet, B., Buysse, P., Gonzaga-Gomez, L., Lafouge, F., Ciuraru, R., Decuq, C., Kammer, J., Bsaibes, S., Boissard, C., Durand, B., Gueudet, J.-C., Fanucci, O., Zurfluh, O., Abis, L., Zannoni, N., Truong, F., Baisnée, D., Sarda-Estève, R., Staudt, M., and Gros, V.: Volatile organic compound fluxes over a winter wheat field by PTR-Qi-TOF-MS and eddy covariance, Atmos. Chem. Phys., 22, 2817–2842, https://doi.org/10.5194/acp-22-2817-2022, 2022.
Ludemann, C. I., Gruere, A., Heffer, P., and Dobermann, A.: Global data on fertilizer use by crop and by country, Sci. Data, 9, 501, https://doi.org/10.1038/s41597-022-01592-z, 2022.
Malm, W. C., Johnson, C. E., and Bresch, J. F.: Application of principal component analysis for purpose of identifying source receptor relationships, in Receptor Methods for Source Apportionment, edited by: Pace, T. G., Publication TR-5, Air Pollution Control Association, Pittsburgh, PA, 127–148, 1986.
Marais, E. A., Pandey, A. K., Van Damme, M., Clarisse, L., Coheur, P.-F., Shephard, M. W., Cady-Pereira, K. E., Misselbrook, T., Zhu, L., Luo, G., and Yu, F.: UK Ammonia Emissions Estimated With Satellite Observations and GEOS-Chem, J. Geophys. Res.-Atmos., 126, e2021JD035237, https://doi.org/10.1029/2021JD035237, 2021.
Martino, M., Tassone, A., Angiuli, L., Naccarato, A., Dambruoso, P. R., Mazzone, F., Trizio, L., Leonardi, C., Petracchini, F., Sprovieri, F., Pirrone, N., D'Amore, F., and Bencardino, M.: First atmospheric mercury measurements at a coastal site in the Apulia region: seasonal variability and source analysis, Environ. Sci. Pollut. Res., 29, 68460–68475, https://doi.org/10.1007/s11356-022-20505-6, 2022.
McDuffie, E. E., Smith, S. J., O'Rourke, P., Tibrewal, K., Venkataraman, C., Marais, E. A., Zheng, B., Crippa, M., Brauer, M., and Martin, R. V.: A global anthropogenic emission inventory of atmospheric pollutants from sector- and fuel-specific sources (1970–2017): an application of the Community Emissions Data System (CEDS), Earth Syst. Sci. Data, 12, 3413–3442, https://doi.org/10.5194/essd-12-3413-2020, 2020.
Nair, A. A. and Yu, F.: Quantification of Atmospheric Ammonia Concentrations: A Review of Its Measurement and Modeling, Atmosphere-Basel, 11, https://doi.org/10.3390/atmos11101092, 2020.
Osada, K.: Measurement report: Short-term variation in ammonia concentrations in an urban area increased by mist evaporation and emissions from a forest canopy with bird droppings, Atmos. Chem. Phys., 20, 11941–11954, https://doi.org/10.5194/acp-20-11941-2020, 2020.
Pazmiño, A., Beekmann, M., Goutail, F., Ionov, D., Bazureau, A., Nunes-Pinharanda, M., Hauchecorne, A., and Godin-Beekmann, S.: Impact of the COVID-19 pandemic related to lockdown measures on tropospheric NO2 columns over Île-de-France, Atmos. Chem. Phys., 21, 18303–18317, https://doi.org/10.5194/acp-21-18303-2021, 2021.
Perrino, C., Catrambone, M., Di Menno Di Bucchianico, A., and Allegrini, I.: Gaseous ammonia in the urban area of Rome, Italy and its relationship with traffic emissions, Atmos. Environ., 36, 5385–5394, https://doi.org/10.1016/S1352-2310(02)00469-7, 2002.
Petetin, H., Sciare, J., Bressi, M., Gros, V., Rosso, A., Sanchez, O., Sarda-Estève, R., Petit, J.-E., and Beekmann, M.: Assessing the ammonium nitrate formation regime in the Paris megacity and its representation in the CHIMERE model, Atmos. Chem. Phys., 16, 10419–10440, https://doi.org/10.5194/acp-16-10419-2016, 2016.
Petit, J.-E., Favez, O., Sciare, J., Crenn, V., Sarda-Estève, R., Bonnaire, N., Močnik, G., Dupont, J.-C., Haeffelin, M., and Leoz-Garziandia, E.: Two years of near real-time chemical composition of submicron aerosols in the region of Paris using an Aerosol Chemical Speciation Monitor (ACSM) and a multi-wavelength Aethalometer, Atmos. Chem. Phys., 15, 2985–3005, https://doi.org/10.5194/acp-15-2985-2015, 2015.
Pu, W., Sheng, J., Tian, P., Huang, M., Liu, X., Collett, J. L., Li, Z., Zhao, X., He, D., Dong, F., Zhang, N., Quan, W., Qiu, Y., Song, Y., Lin, W., Pan, Y., and Ma, Z.: On-road mobile mapping of spatial variations and source contributions of ammonia in Beijing, China, Sci. Total Environ., 864, 160869, https://doi.org/10.1016/j.scitotenv.2022.160869, 2023.
Pope III, C. A., Ezzati, M., and Dockery, D. W.: Fine-particulate air pollution and life expectancy in the United States, N. Engl. J. Med., 360, 376–386, https://doi.org/10.1056/NEJMsa0805646, 2009.
Qadri, A. M., Singh, G. K., Paul, D., Gupta, T., Rabha, S., Islam, N., and Saikia, B. K.: Variabilities of δ13C and carbonaceous components in ambient PM2.5 in Northeast India: Insights into sources and atmospheric processes, Environ. Res., 214, 113801, https://doi.org/10.1016/j.envres.2022.113801, 2022.
Ren, B., Xie, P., Xu, J., Li, A., Tian, X., Hu, Z., Huang, Y., Li, X., Zhang, Q., Ren, H., and Ji, H.: Use of the PSCF method to analyze the variations of potential sources and transports of NO2, SO2, and HCHO observed by MAX-DOAS in Nanjing, China during 2019, Sci. Total Environ., 782, 146865, https://doi.org/10.1016/j.scitotenv.2021.146865, 2021.
Rockström, J., Steffen, W., Noone, K., Persson, Å., Chapin, F. S., Lambin, E. F., Lenton, T. M., Scheffer, M., Folke, C., Schellnhuber, H. J., Nykvist, B., de Wit, C. A., Hughes, T., van der Leeuw, S., Rodhe, H., Sörlin, S., Snyder, P. K., Costanza, R., Svedin, U., Falkenmark, M., Karlberg, L., Corell, R. W., Fabry, V. J., Hansen, J., Walker, B., Liverman, D., Richardson, K., Crutzen, P., and Foley, J. A.: A safe operating space for humanity, Nature, 461, 472–475, https://doi.org/10.1038/461472a, 2009.
Roe, S., Spivey, M., Lindquist, H., Thesing, K., Strait, R., Pechan, E., and Associates, I.: Estimating Ammonia Emissions from Anthropogenic Nonagricultural Sources. EPA Emission Inventory Improvement Program, Technical Report, Emission Inventory Improvement Program, https://www.epa.gov/sites/default/files/2015-08/documents/eiip_areasourcesnh3.pdf (last access: 13 December 2023), 2004.
Shephard, M. W. and Cady-Pereira, K. E.: Cross-track Infrared Sounder (CrIS) satellite observations of tropospheric ammonia, Atmos. Meas. Tech., 8, 1323–1336, https://doi.org/10.5194/amt-8-1323-2015, 2015.
Sintermann, J., Dietrich, K., Häni, C., Bell, M., Jocher, M., and Neftel, A.: A miniDOAS instrument optimised for ammonia field measurements, Atmos. Meas. Tech., 9, 2721–2734, https://doi.org/10.5194/amt-9-2721-2016, 2016.
Stein, A. F., Draxler, R. R., Rolph, G. D., Stunder, B. J. B., Cohen, M. D., and Ngan, F.: NOAA's HYSPLIT Atmospheric Transport and Dispersion Modeling System, B. Am. Meteorol. Soc., 96, 2059–2077, https://doi.org/10.1175/BAMS-D-14-00110.1, 2015.
Sudesh, S. and Kulshrestha, U. C.: Diurnal Variation of Ambient NH3 in Relation with Agricultural Activities and Meteorological Factors at a Rural Site in North India. Curr World Environ, SI1, https://doi.org/10.12944/CWE.16.Special-Issue1.02, 2021.
Sun, K., Tao, L., Miller, D. J., Pan, D., Golston, L. M., Zondlo, M. A., Griffin, R. J., Wallace, H. W., Leong, Y. J., Yang, M. M., Zhang, Y., Mauzerall, D. L., and Zhu, T.: Vehicle Emissions as an Important Urban Ammonia Source in the United States and China, Environ. Sci. Technol., 51, 2472–2481, https://doi.org/10.1021/acs.est.6b02805, 2017.
Sutton, M., Dragosits, U., Tang, Y., and Fowler, D.: Ammonia emissions from nonagricultural sources in the UK, Atmos. Environ. 34, 855–869, https://doi.org/10.1016/S1352-2310(99)00362-3, 2000.
Sutton, M. A., Reis, S., Riddick, S. N., Dragosits, U., Nemitz, E., Theobald, M. R., Tang, Y. S., Braban, C. F., Vieno, M., Dore, A. J., Mitchell, R. F., Wanless, S., Daunt, F., Fowler, D., Blackall, T. D., Milford, C., Flechard, C. R., Loubet, B., Massad, R., Cellier, P., Personne, E., Coheur, P. F., Clarisse, L., Van Damme, M., Ngadi, Y., Clerbaux, C., Skjøth, C. A., Geels, C., Hertel, O., Wichink Kruit, R. J., Pinder, R. W., Bash, J. O., Walker, J. T., Simpson, D., Horváth, L., Misselbrook, T. H., Bleeker, A., Dentener, F., and de Vries, W.: Towards a climate-dependent paradigm of ammonia emission and deposition, Philos. T. Roy. Soc. B., 368, 20130166, https://doi.org/10.1098/rstb.2013.0166, 2013.
Twigg, M. M., Berkhout, A. J. C., Cowan, N., Crunaire, S., Dammers, E., Ebert, V., Gaudion, V., Haaima, M., Häni, C., John, L., Jones, M. R., Kamps, B., Kentisbeer, J., Kupper, T., Leeson, S. R., Leuenberger, D., Lüttschwager, N. O. B., Makkonen, U., Martin, N. A., Missler, D., Mounsor, D., Neftel, A., Nelson, C., Nemitz, E., Oudwater, R., Pascale, C., Petit, J.-E., Pogany, A., Redon, N., Sintermann, J., Stephens, A., Sutton, M. A., Tang, Y. S., Zijlmans, R., Braban, C. F., and Niederhauser, B.: Intercomparison of in situ measurements of ambient NH3: instrument performance and application under field conditions, Atmos. Meas. Tech., 15, 6755–6787, https://doi.org/10.5194/amt-15-6755-2022, 2022.
Van Damme, M., Clarisse, L., Heald, C. L., Hurtmans, D., Ngadi, Y., Clerbaux, C., Dolman, A. J., Erisman, J. W., and Coheur, P. F.: Global distributions, time series and error characterization of atmospheric ammonia (NH3) from IASI satellite observations, Atmos. Chem. Phys., 14, 2905–2922, https://doi.org/10.5194/acp-14-2905-2014, 2014.
Van Damme, M., Clarisse, L., Dammers, E., Liu, X., Nowak, J. B., Clerbaux, C., Flechard, C. R., Galy-Lacaux, C., Xu, W., Neuman, J. A., Tang, Y. S., Sutton, M. A., Erisman, J. W., and Coheur, P. F.: Towards validation of ammonia (NH3) measurements from the IASI satellite, Atmos. Meas. Tech., 8, 1575–1591, https://doi.org/10.5194/amt-8-1575-2015, 2015.
Van Damme, M., Clarisse, L., Whitburn, S., Hadji-Lazaro, J., Hurtmans, D., Clerbaux, C., and Coheur, P.-F.: Industrial and agricultural ammonia point sources exposed, Nature, 564, 99–103, https://doi.org/10.1038/s41586-018-0747-1, 2018.
Van Damme, M., Clarisse, L., Franco, B., Sutton, M. A., Erisman, J. W., Wichink Kruit, R., van Zanten, M., Whitburn, S., Hadji-Lazaro, J., Hurtmans, D., Clerbaux, C., and Coheur, P.-F.: Global, regional and national trends of atmospheric ammonia derived from a decadal (2008–2018) satellite record, Environ. Res. Lett., 16, 55017, https://doi.org/10.1088/1748-9326/abd5e0, 2021.
Van Damme, M., Clarisse, L., Stavrakou, T., Wichink Kruit, R., Sellekaerts, L., Viatte, C., Clerbaux, C., and Coheur, P.-F.: On the weekly cycle of atmospheric ammonia over European agricultural hotspots, Sci. Rep., 12, 12327, https://doi.org/10.1038/s41598-022-15836-w, 2022.
Viatte, C.: IASI BC data AM, Zenodo [data set], https://doi.org/10.5281/zenodo.7962362, 2023a.
Viatte, C.: NH3 from Mini Doas [data set], LATMOS, https://iasi-ft.eu/products/nh3_minidoas/ (last access: 13 December 2023), 2023b.
Viatte, C., Wang, T., Van Damme, M., Dammers, E., Meleux, F., Clarisse, L., Shephard, M. W., Whitburn, S., Coheur, P. F., Cady-Pereira, K. E., and Clerbaux, C.: Atmospheric ammonia variability and link with particulate matter formation: a case study over the Paris area, Atmos. Chem. Phys., 20, 577–596, https://doi.org/10.5194/acp-20-577-2020, 2020.
Viatte, C., Petit, J.-E., Yamanouchi, S., Van Damme, M., Doucerain, C., Germain-Piaulenne, E., Gros, V., Favez, O., Clarisse, L., Coheur, P.-F., Strong, K., and Clerbaux, C.: Ammonia and PM2.5 air pollution in paris during the 2020 covid lockdown, Atmosphere, 12, 160, https://doi.org/10.3390/atmos12020160, 2021.
Viatte, C., Abeed, R., Yamanouchi, S., Porter, W. C., Safieddine, S., Van Damme, M., Clarisse, L., Herrera, B., Grutter, M., Coheur, P.-F., Strong, K., and Clerbaux, C.: NH3 spatiotemporal variability over Paris, Mexico City, and Toronto, and its link to PM2.5 during pollution events, Atmos. Chem. Phys., 22, 12907–12922, https://doi.org/10.5194/acp-22-12907-2022, 2022.
Volten, H., Bergwerff, J. B., Haaima, M., Lolkema, D. E., Berkhout, A. J. C., van der Hoff, G. R., Potma, C. J. M., Wichink Kruit, R. J., van Pul, W. A. J., and Swart, D. P. J.: Two instruments based on differential optical absorption spectroscopy (DOAS) to measure accurate ammonia concentrations in the atmosphere, Atmos. Meas. Tech., 5, 413–427, https://doi.org/10.5194/amt-5-413-2012, 2012.
von Bobrutzki, K., Braban, C. F., Famulari, D., Jones, S. K., Blackall, T., Smith, T. E. L., Blom, M., Coe, H., Gallagher, M., Ghalaieny, M., McGillen, M. R., Percival, C. J., Whitehead, J. D., Ellis, R., Murphy, J., Mohacsi, A., Pogany, A., Junninen, H., Rantanen, S., Sutton, M. A., and Nemitz, E.: Field inter-comparison of eleven atmospheric ammonia measurement techniques, Atmos. Meas. Tech., 3, 91–112, https://doi.org/10.5194/amt-3-91-2010, 2010.
Wang, B., Liu, Z., Li, Z., Sun, Y., Wang, C., Zhu, C., Sun, L., Yang, N., Bai, G., Fan, G., Sun, X., Xia, Z., Pan, G., Xu, C., and Yan, G.: Characteristics, chemical transformation and source apportionment of volatile organic compounds (VOCs) during wintertime at a suburban site in a provincial capital city, east China, Atmos. Environ., 298, 119621, https://doi.org/10.1016/j.atmosenv.2023.119621, 2023.
Wang, S., Nan, J., Shi, C., Fu, Q., Gao, S., Wang, D., Cui, H., Saiz-Lopez, A., and Zhou, B.: Atmospheric ammonia and its impacts on regional air quality over the megacity of Shanghai, China, Sci. Rep., 5, 15842, https://doi.org/10.1038/srep15842, 2015.
Wang, Y. Q., Zhang, X. Y., and Draxler, R.: TrajStat: GIS-based software that uses various trajectory statistical analysis methods to identify potential sources from long-term air pollution measurement data, Environ. Modell. Softw., 24, 938–939, 2009 (data available at: http://meteothink.org/docs/trajstat/pscf.html, last access: 23 May 2023).
Warner, J. X., Wei, Z., Strow, L. L., Dickerson, R. R., and Nowak, J. B.: The global tropospheric ammonia distribution as seen in the 13-year AIRS measurement record, Atmos. Chem. Phys., 16, 5467–5479, https://doi.org/10.5194/acp-16-5467-2016, 2016.
Wen, Y., Zhang, S., Wu, Y., and Hao, J.: Vehicular ammonia emissions: an underappreciated emission source in densely populated areas, Atmos. Chem. Phys., 23, 3819–3828, https://doi.org/10.5194/acp-23-3819-2023, 2023.
Whitehead, J., Longley, D., Coe, H., and Gallagher, M.: Hourly concentrations of ammonia during the winter in Manchester, UK, related to traffic and background sources, Fifth Conference on Urban Environment, Session 14 urban air quality (including urban airshed modeling and urban air chemistry experiments), Vancouver, BC, Canada, https://ams.confex.com/ams/AFAPURBBIO/techprogram/paper_79435.htm (last access: 13 December 2023), 23–26 August 2004.
Zachary, M., Yin, L., and Zacharia, M.: Application of PSCF and CWT to Identify Potential Sources of Aerosol Optical Depth in ICIPE Mbita, Open Access Library Journal, 5, 1–12, https://doi.org/10.4236/oalib.1104487, 2018.
Zhang, Q., Wei, N., Zou, C., and Mao, H.: Evaluating the ammonia emission from in-use vehicles using on-road remote sensing test, Environ. Pollut., 271, 116384, https://doi.org/10.1016/j.envpol.2020.116384, 2021.