the Creative Commons Attribution 4.0 License.
the Creative Commons Attribution 4.0 License.
 | 05 Dec 2023
Insights into soil NO emissions and the contribution to surface ozone formation in China
Ling Huang
Jiong Fang
Jiaqiang Liao
Greg Yarwood
Hui Chen
Yangjun Wang
Elevated ground-level ozone concentrations have emerged as a major environmental issue in China. Nitrogen oxide (NOx) is a key precursor to ozone formation. Although control strategies aimed at reducing NOx emissions from conventional combustion sources are widely recognized, soil NOx emissions (mainly as NO) due to microbial processes have received little attention. The impact of soil NO emissions on ground-level ozone concentration is yet to be evaluated. This study estimated soil NO emissions in China using the Berkeley–Dalhousie Soil NOx Parameterization (BDSNP) algorithm. A typical modeling approach was used to quantify the contribution of soil NO emissions to surface ozone concentration. The brute-force method (BFM) and the Ozone Source Apportionment Technology (OSAT) implemented in the Comprehensive Air Quality Model with Extensions (CAMx) were used. The total soil NO emissions in China for 2018 were estimated to be 1157.9 Gg N, with an uncertainty range of 715.7–1902.6 Gg N. Spatially, soil NO emissions are mainly concentrated in Central China, North China, Northeast China, the northern Yangtze River Delta (YRD), and the eastern Sichuan Basin, with distinct diurnal and monthly variations that are mainly affected by the temperature and timing of fertilizer application. Both the BFM and OSAT results indicate a substantial contribution of soil NO emissions to the maximum daily 8 h (MDA8) ozone concentrations by 8.0–12.5 µg m−3 on average for June 2018, with the OSAT results being consistently higher than the BFM results. The results also showed that soil NO emissions led to a relative increase in ozone exceedance days by 10.5 %–43.5 % for selected regions. Reducing the soil NO emissions resulted in a general decrease in monthly MDA8 ozone concentrations, and the magnitude of ozone reduction became more pronounced as reductions increased. However, even with complete reductions in soil NO emissions, approximately 450.3 million people are still exposed to unhealthy ozone levels, necessitating multiple control policies at the same time. This study highlights the importance of soil NO emissions for ground-level ozone concentrations and the potential for reducing NO emissions as a future control strategy for ozone mitigation in China.
- Article
(6054 KB) - Full-text XML
-
Supplement
(2396 KB) - BibTeX
- EndNote


A substantial decrease in the atmospheric fine particulate matter (PM2.5) concentrations has been witnessed in China during the past decade (Zhai et al., 2019; Xiao et al., 2020; Maji, 2020), while the ground-level ozone (O3) concentrations do not exhibit a steady downward trend (Lu et al., 2020; Lu et al., 2021; J. Wang et al., 2022; Sun et al., 2021). Because high ozone concentration increases respiratory and circulatory risks (Malley et al., 2017; Cakaj et al., 2023; Wang et al., 2020) and reduces crop yields (Feng et al., 2019; Lin et al., 2018; Mukherjee et al., 2021; Montes et al., 2022), the coordinated control of PM2.5 and O3 was proposed as part of the 14th Five-Year Plan (14th Plan, https://www.gov.cn/xinwen/2021-03/13/content_5592681.htm, last access: 1 December 2021). A continuous increase in summertime surface ozone was observed across China's nationwide monitoring network from 2013 to 2019, followed by an unprecedented decline in 2020 (except for the Sichuan Basin) (Sun et al., 2021), which is equally attributed to meteorology and anthropogenic emissions reductions (Yin et al., 2021). As a secondary air pollutant, ozone is generated from the photochemical oxidation of volatile organic compounds (VOCs) in the presence of nitrogen oxides (NOx = NO + NO2), both of which are considered ozone precursors. The nonlinear response of ozone formation to its precursors is well established (Kleinman et al., 1994; Sillman et al., 1990). In regions classified as NOx-limited, reducing NOx emissions is an effective strategy for ozone mitigation. However, in regions classified as VOC-limited, typically regions characterized by high NOx emissions such as metropolitan areas, decreasing NOx emissions may actually result in increased ozone concentrations due to reduced ozone titration by NO and diminished OH titration by NO2 (Seinfeld and Pandis, 2006). Under such circumstances, reducing VOC emissions will counteract ozone increases caused by reducing NOx emissions. The control strategies to mitigate ozone pollution in China focused on reducing NOx emissions at an early stage and started to stress the control of VOC emissions in recent years (e.g., the 2020 action plan for VOC mitigation), including control of fugitive emissions, stringent emissions standards, and substituting raw materials for low-VOC content (https://www.mee.gov.cn/xxgk2018/xxgk/xxgk03/202006/t20200624_785827.html, last access: 1 December 2021). Ding et al. (2021) concluded that for the North China Plain (NCP), a region that experienced the most severe PM2.5 and ozone pollution in China, reductions in NOx emissions are essential regardless of VOC reduction.
Existing control strategies for NOx emissions are almost exclusively targeted at combustion sources, for example power plants, industrial boilers, cement production, and vehicle exhausts (Sun et al., 2018; Ding et al., 2017; Diao et al., 2018). However, the NOx emissions from soils (mainly as NO), as a result of microbial processes (e.g., nitrification and denitrification), could make up a substantial fraction of the total NOx emissions (Lu et al., 2021; Drury et al., 2021), yet they are often overlooked. In California, soil NOx emissions in July accounted for 40 % of the state's total NOx emissions (when using an updated estimation algorithm) and resulted in 23 % enhanced surface ozone concentration (Sha et al., 2021). However, a wide range of annual soil NOx emissions from 8685 t, as NO2 (Guo et al., 2020), to 161 100 t of NOx-N (Almaraz et al., 2018) were reported, depending on different methods. Romer et al. (2018) estimated that nearly half of the increase in hot-day ozone concentration in a forested area of the rural southeastern United States is attributable to the temperature-induced increases in NOx emissions, most likely due to soil microbes.
Soil NO emissions are affected by many factors, including nitrogen fertilizer application, soil organic carbon content, soil temperature, humidity, and pH (Vinken et al., 2014; Yan et al., 2005; Wang et al., 2021; Skiba et al., 2021). The amount of nitrogen fertilizer application in China was estimated to account for one-third of the global nitrogen fertilizer application (Heffer and Prud'homme, 2016), with most of the land under high nitrogen deposition (Liu et al., 2013; Lü and Tian, 2007). Therefore, soil NO emissions in China are expected to be significant, and their impacts on ozone pollution need to be systematically evaluated. So far, only a limited number of studies have addressed this issue in China (Lu et al., 2021; Shen et al., 2023; Wang et al., 2008; R. Wang et al., 2022). Lu et al. (2021) concluded that soil NO significantly reduced the ozone sensitivity to anthropogenic emissions in the NCP, therefore causing a so-called “emissions control penalty”. R. Wang et al. (2022) reported that NOx emissions from the cropland contributed 5.0 % of the maximum daily 8 h average ozone (MDA8 O3) and 27.7 % of the NO2 concentration in the NCP. These studies focused solely on the NCP, a region with persistent O3 pollution in warm seasons (Liu et al., 2020; Lu et al., 2020). The impact of soil NO emissions on ozone concentrations across other regions, for example, the northern Yangtze River Delta (YRD) and Sichuan Basin, where soil emissions are high (see Sect. 3.1) and ozone pollution is severe (Shen et al., 2022; Yang et al., 2021), has not been evaluated in much detail (Shen et al., 2023). In addition, the method employed in existing studies to evaluate the impact of soil NO emissions on ozone concentration is the conventional “brute-force” zero-out approach, which might be inappropriate given the strong nonlinearity of the ozone chemistry (Clappier et al., 2017; Thunis et al., 2019).
With the deepening of emissions control measures for power and industrial and on-road sectors, anthropogenic NOx emissions from combustion sources have decreased at a much faster rate (by 4.9 % since 2012) than those from soil (fertilizer application decreases at a rate of 1.5 % since 2015, Fig. S1 in the Supplement). Therefore, understanding the impacts of soil NO emissions on ground-level ozone concentration, particularly considering the spatial heterogeneities over different regions of China, is of great importance for formulating future ozone mitigation strategies. In this study, soil NO emissions in China for 2018 were estimated based on a very recent soil NO parameterization scheme with updated fertilizer data as input. The spatial and temporal variations of soil NO emissions were described first. Uncertainties associated with the estimation of soil NO emissions were discussed. An integrated meteorology and air quality model was applied to quantify the impact of soil NO emissions on surface ozone concentration based on two different methods. Lastly, we evaluated the changes in ozone concentration and exposed population under different emissions scenarios to highlight the effectiveness of reducing soil NO emissions as a potential control policy. Our results provide insights into developing effective emissions reduction strategies to mitigate the ozone pollution in China.
2.1 Estimation of soil NO emissions in China
Soil NO emissions were estimated based on the Berkeley–Dalhousie Soil NOx Parameterization (BDSNP) that is implemented in the Model of Emissions of Gases and Aerosols from Nature (MEGAN) version 3.2 (https://bai.ess.uci.edu/megan/data-and-code, last access: 1 September 2021). The BDSNP algorithm estimates the soil NO emissions by adjusting a biome-specific NO emissions factor in response to various conditions, including the soil temperature, soil moisture, precipitation-induced pulsing, and a canopy reduction factor (Eq. 1; Rasool et al., 2016):
where f(T) and g(θ) are the temperature (T, unit: K) and soil moisture (θ, unit: m3 m−3) dependence functions, respectively; P(ldry) represents the pulsed soil emissions due to the wetting of dry soils; ldry (hours) is the antecedent dry period of a pulse; and CRF describes the canopy reduction factor, which is a function of the leaf area index (LAI, m2 m−2) and the meteorology. (ng N m−2 s−1) is the biome-specific emissions factor, which is further calculated as Eq. (2):
In Eq. (2), Aw,biome (ng N m−2 s−1) is the wet biome-dependent emissions factor, Navail is the available nitrogen from fertilizer and deposition, and is the emissions rate based on an observed global estimate of fertilizer emissions (Rasool et al., 2016). The detailed expressions of these parameters are presented in the Supplement. More information on the BDSNP parameterizations can be found in previous studies (Hudman et al., 2012).
The default N fertilizer input data provided with the BDSNP algorithm is based on the International Fertilizer Industry Association (IFA) fertilizer-use dataset for the year 2000 (Potter et al., 2010), which gives a number of 19.6 Tg N a−1. In this study, we collected fertilizer data from statistical yearbooks at the provincial level. The total amount of pure nitrogen fertilizer (hereafter N fertilizer) applied in the year 2018 is 20.7 Tg N a−1, which is similar (5.6 % higher) to the IFA value. However, besides the N fertilizer, NPK compound fertilizer (containing nitrogen (N), phosphorous (P), and potassium (K)) is being increasingly applied in China. According to the statistical yearbook, the amount of N fertilizer that was applied decreased from 23.5 Tg in 2010 to 20.7 Tg in 2018 (a relative reduction of 11.9 %). In contrast, NPK fertilizer increased from 18.0 Tg in 2010 to 22.7 Tg in 2018 (a relative increase of 26.1 %). We assumed one-third of the NPK fertilizer is nitrogen (Liu and Liu, 2014); thus the total amount of nitrogen applied as fertilizer is 28.2 Tg N in 2018, which is 43.9 % higher than the value from Potter et al. (2010). As Fig. 1 indicates by different colors, we divided China into seven regions for emissions analysis on a regional scale, namely Northeast China, North China, Central China, East China, South China, Southwest China, and Northwest China (see Table S1 for the list of provinces in each region). At the regional level, the amount of total fertilizer differs by as much as 9.1 % to 46.6 % from the default fertilizer (Table S2).
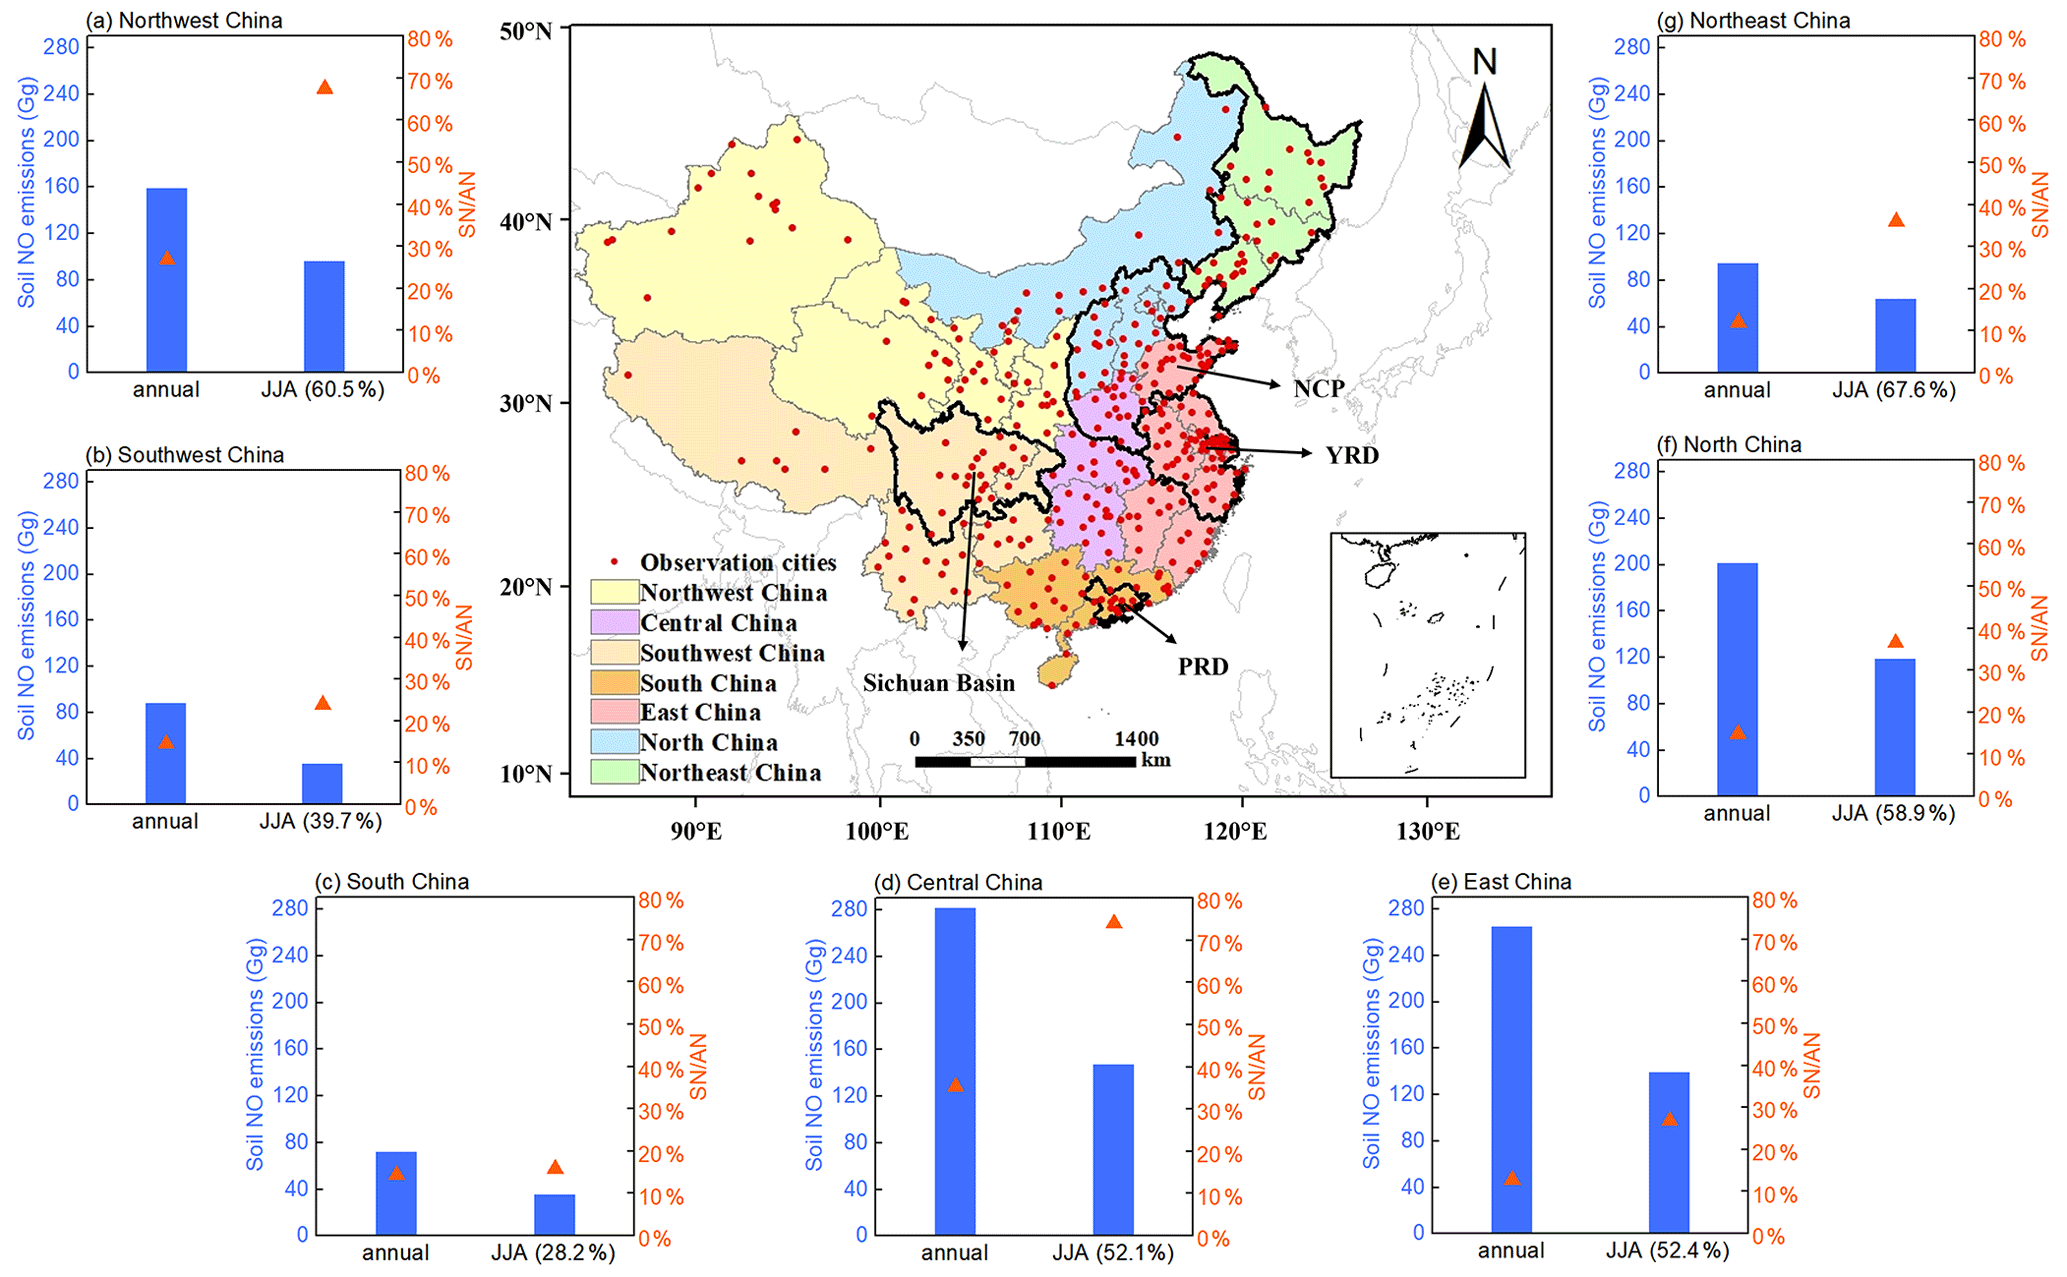
Figure 1Modeling domain and region definitions. Surrounding charts show the annual and summer (June–July–August, JJA) soil NO emissions and ratio of soil NO to anthropogenic NOx emissions for each region.
2.2 Model configurations
A typical modeling approach was applied to evaluate the contribution of soil NO emissions to surface ozone concentration. The Weather Research and Forecasting (WRF) model (version 3.7, https://www.mmm.ucar.edu/wrf-model-general, last access: 1 December 2021) and the Comprehensive Air Quality Model with Extensions (CAMx, version 7.0, http://www.camx.com/, last access: 1 December 2021) were applied to simulate the meteorological fields and subsequent ozone concentrations. Table S3 in the Supplement lists the detailed model configurations for WRF and CAMx. Anthropogenic emissions include the Multi-resolution Emission Inventory of China for 2017 (MEIC, http://www.meicmodel.org, last access: 1 December 2021) and the 2010 European Commission's Emissions Database for Global Atmospheric Research (EDGAR, http://edgar.jrc.ec.europa.eu/index.php, last access: 1 December 2021) for locations outside China. Biogenic emissions were calculated along with the soil NO emissions using MEGAN3.2. Open biomass burning emissions are adopted from the Fire INventory from NCAR version (FINN, version 1.5, https://www.acom.ucar.edu/Data/fire/, last access: 1 December 2021) with MOZART speciation and converted to CAMx CB05 model species. The gaseous and aerosol modules used in CAMx include the CB05 chemical mechanism (Yarwood et al., 2010) and the CF module. The aqueous-phase chemistry is based on the updated mechanism of the Regional Acid Deposition Model (RADM) (Chang et al., 1987). A base case simulation was conducted for June 2018 when soil NO emissions reached maxima (Sect. 3.1) and ozone pollution was severe over eastern China (Mao et al., 2020; Jiang et al., 2022). Base case model performances have been evaluated in our previous studies (L. Huang et al., 2021, 2022). Here, we evaluated simulated ozone concentrations using the Pearson correlation coefficient (R), mean bias (MB), root-mean-square error (RMSE), normalized mean bias (NMB), and normalized mean error (NME) against hourly observed ozone concentrations for 365 cities in China. Table S4 gives the formula for each of the statistical metrics. Observed hourly ozone concentrations were obtained from the China National Environmental Monitoring Center.
2.3 Brute force and OSAT
In this study, two methods were used to quantify the impact of soil NO emissions on surface ozone concentration during the simulation period. The first method is the conventional brute-force method (BFM), which involves a comparison of the simulated ozone concentration between the base case and a scenario case without soil NO emissions. The difference between these two scenarios was considered to represent the contribution of soil NO emissions to ozone. The second method applies the widely used Ozone Source Apportionment Technology (OSAT) implemented in CAMx (Yarwood et al., 1996), with soil NO emissions being tagged as an individual emissions group. OSAT attributes ozone formation to NOx or VOCs based on their relative availability and apportions NOx and VOC emissions by source group and region (Ramboll, 2020). In addition to soil NO emissions, anthropogenic and natural emissions (including biogenic VOC emissions, lightning NO emissions, and open biomass burning) were also tagged as individual emissions groups.
3.1 Soil NO emissions in China for 2018
3.1.1 Spatial and temporal variations
National total soil NO emissions for 2018 are estimated to be 1157.9 Gg N, with an uncertainty range of 715.7–1902.6 Gg N, which Sect. 3.1.2 will discuss more. On an annual scale, soil NO emissions accounted for 17.3 % of the total anthropogenic NOx emissions in China for 2017 (based on MEIC). This ratio varies from 12.0 % to 35.3 % on a regional scale. Unlike the anthropogenic NOx emissions that concentrate across densely populated regions (e.g., the NCP and YRD), soil NO emissions are most abundant in Central China, particularly Henan Province and nearby provinces, including Hebei and Shandong in the NCP and Jiangsu and Anhui in the northern YRD (Fig. 2a). Other hotspots of soil NO emissions include Northeast China and the eastern part of the Sichuan Basin. As expected, the spatial distribution of soil NO emissions closely mirrors that of the fertilizer application (Fig. 2b). Henan (located in Central China), Shandong (NCP), and Hebei (NCP) are the three provinces that have the highest fertilizer application (together accounting for 24.1 % of the national totals in 2018) and, thus, the highest soil NO emissions (together accounting for 35.7 %).
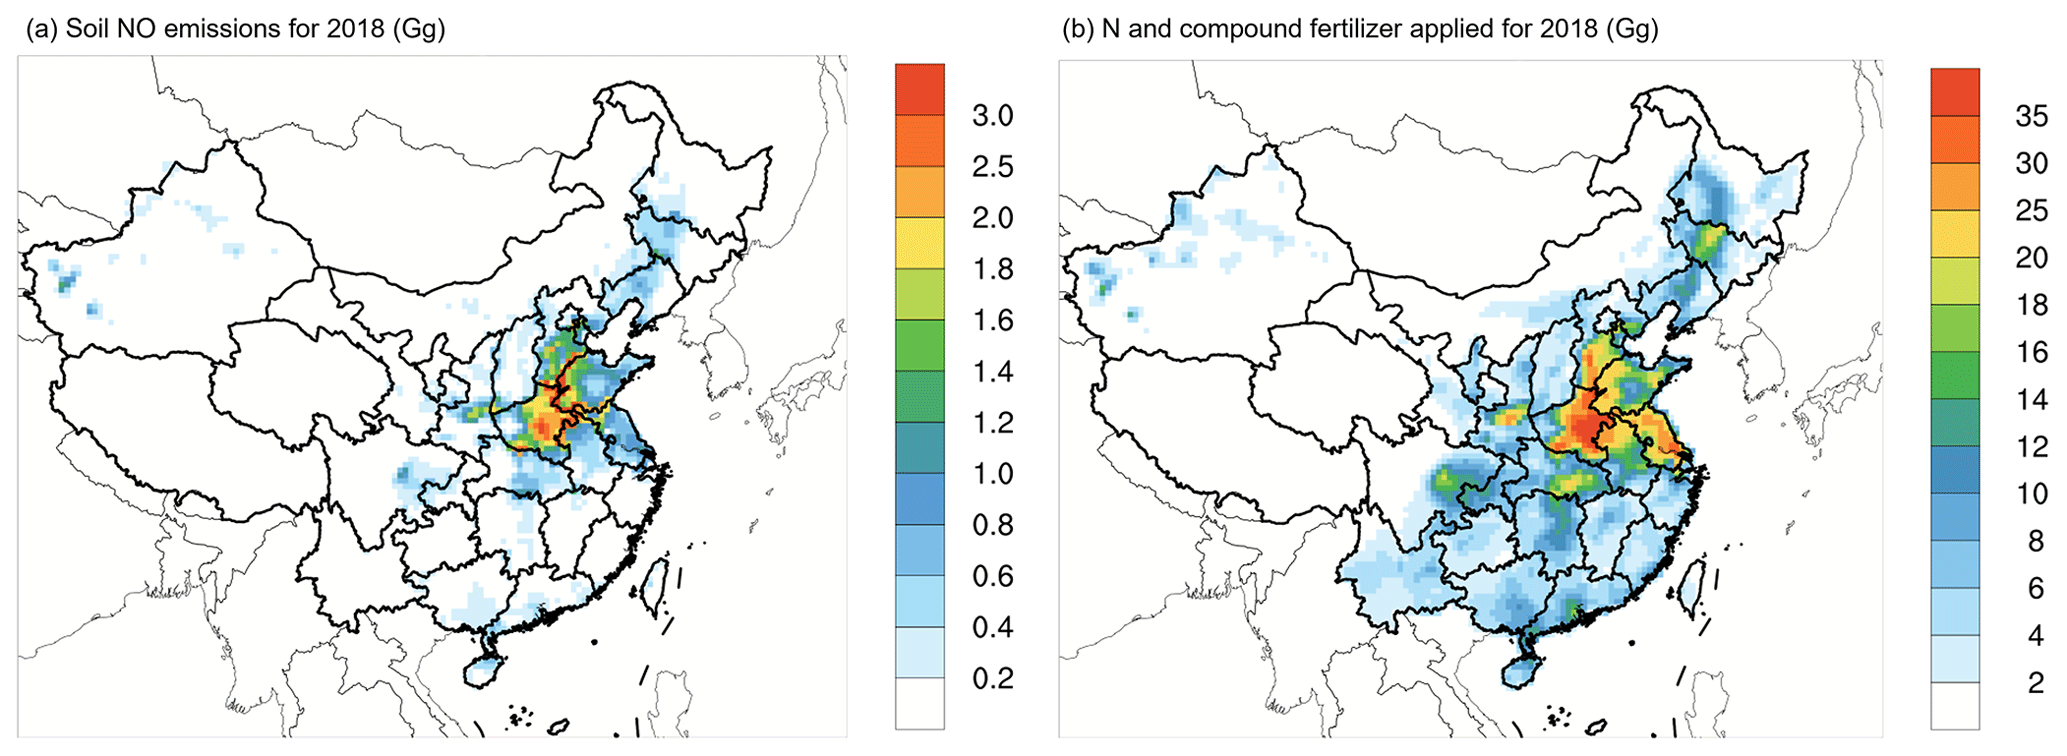
Figure 2Spatial distribution of (a) soil NO emissions for 2018 and (b) N and compound fertilizer applied for 2018.
In terms of the monthly variations, the total soil NO emissions show a unimodal pattern (as Fig. 3a shows, with the highest emissions occurring in the summer months of June, July, and August), except for South China and Southeast China (Fig. S2), where the peak emissions occur in April or May. Soil NO emissions during the summer months account for 28.2 % (South China) and 67.6 % (Northeast China) of the annual totals (Fig. 1 and Table S5). The shape of monthly soil NO emissions is influenced by the temperature and timing of fertilizer application. The BDSNP algorithm assumes that 75 % of the annual fertilizer is applied over the first month of the growing season, with the remaining 25 % applied evenly throughout the rest of the growing season. This assumption results in a significant amount of fertilizer being applied from April to August (Fig. 3a). In contrast, anthropogenic NOx emissions display weaker monthly variations (Zheng et al., 2021). Consequently, the ratio of soil NO emissions to anthropogenic NOx (SN AN) is much higher during the summer months. In regions such as Central China and Northwest China, where soil NO emissions are high and anthropogenic NOx emissions are relatively low, SN AN reaches 74.0 % and 67.5 % during the summer months (Fig. 1 and Table S5). In East China and North China, where anthropogenic NOx emissions are high, SN AN ranges from 26.8 % to 36.5 % during the summer months. These findings align with the findings of Chen et al. (2022), who reported that soil NO emissions make up 28 % of total NOx (soil NO + anthropogenic NOx) emissions in summer and could reach 50 %–90 % in isolated areas and suburbs. The substantial contribution of soil NO emissions to the ozone pollution season implies a potentially significant impact on surface ozone concentration. In terms of diurnal variations, soil NO emissions peak in the afternoon due to diurnal temperature fluctuations. As Fig. 3b illustrates, the average hourly soil NO emissions across the NCP for June 2018 closely follow the WRF's simulated soil temperature changes.
The BDSNP algorithm identifies three sources of soil nitrogen: background, atmospheric nitrogen deposition, and fertilizer application, with the latter being the primary contributor. A decomposition analysis of soil NO emissions for the NCP reveals that fertilizer application accounts for 83.4 % of total NO soil emissions (Fig. 3b), while background and atmospheric nitrogen deposition only account for 11.2 % and 5.4 %, respectively. Thus, although soil NO emissions are generally considered a “natural” source (Galbally et al., 2008) and are not currently targeted in NOx emissions mitigation strategies, human fertilizer activities render soil NO emissions as anthropogenic source.
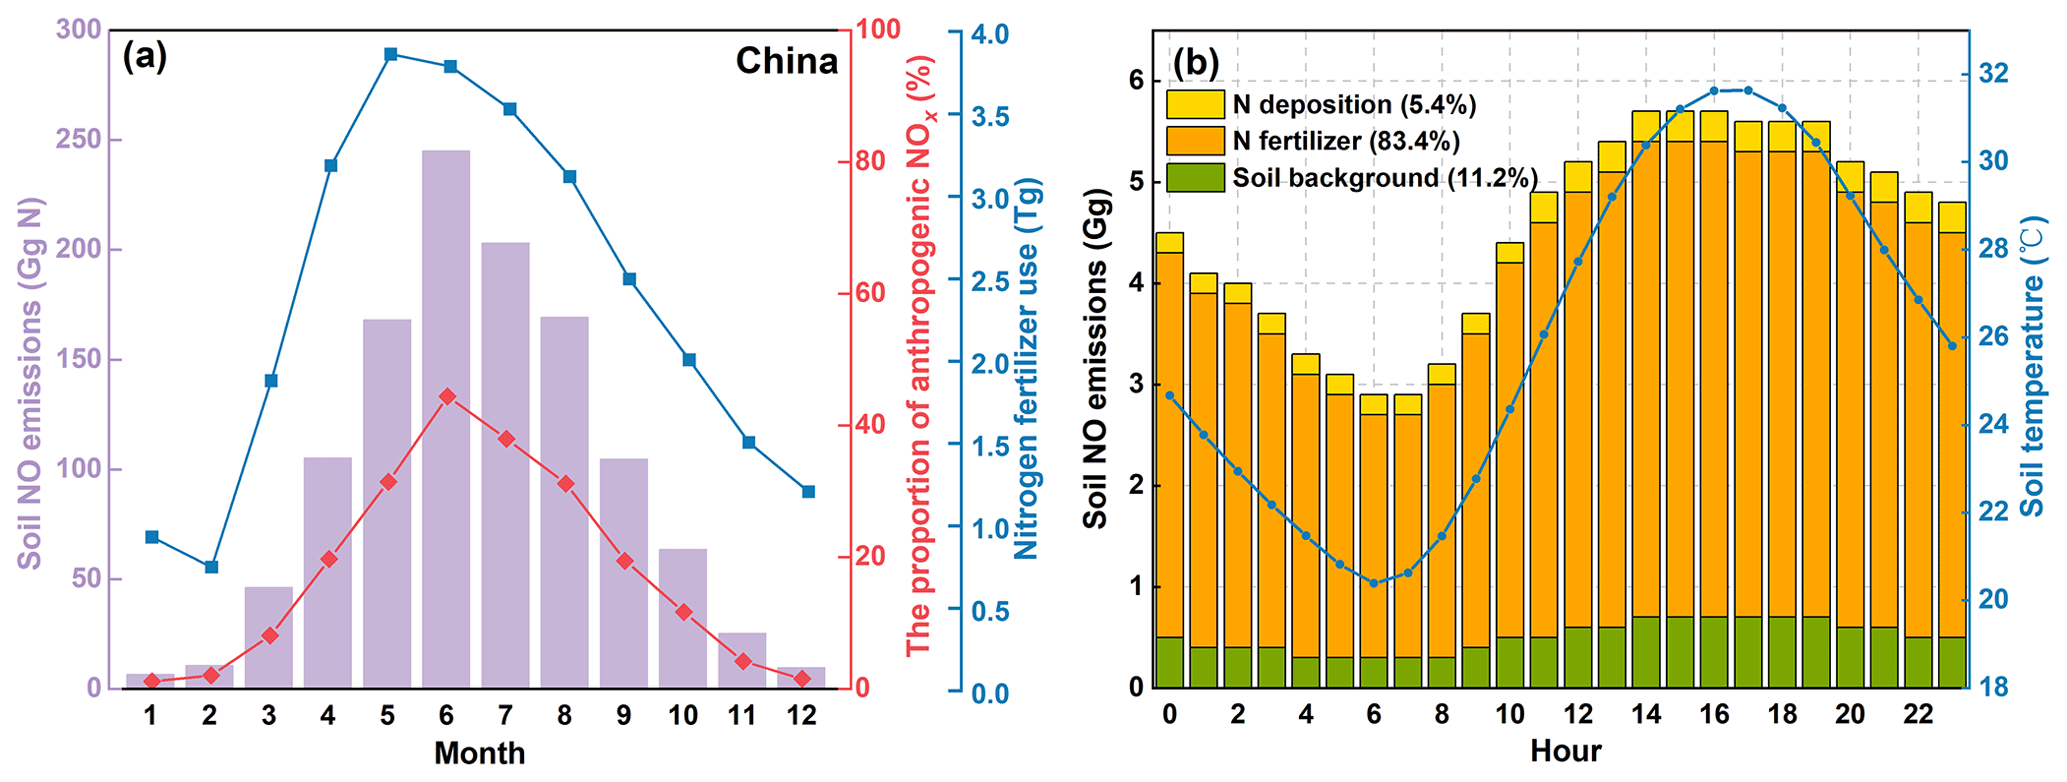
Figure 3(a) Monthly fertilizer (N + compound) applied and soil NO emissions in China and (b) hourly soil NO emissions for June 2018 in the NCP and domain-averaged soil temperature simulated by WRF.
3.1.2 Limitations and uncertainties associated with soil NO emissions estimation
Although the current BDSNP algorithm is considered more sophisticated than the old YL95 algorithm, it still suffers certain limitations. For example, the current BDSNP parameterization employs a static classification of “arid” versus “nonarid” soils, upon which the relationship between soil NO emissions and soil moisture relies (Hudman et al., 2012). However, recent studies (Sha et al., 2021; Huber et al., 2023) have shown that a more dynamic representation of this classification is needed to capture the emissions characteristics as observed by many chamber and atmospheric studies (e.g., Oikawa et al., 2015; K. Huang et al., 2022). Huber et al. (2023) showed that the estimated emissions based on the static classification is also very sensitive to the soil moisture and, thus, could not produce self-consistent results when using different soil moisture products.
In addition to the aforementioned limitation, the estimated soil NO emissions are also subjected to certain limitations and large uncertainties. The first uncertainty comes from the amount of fertilizer application, which has been identified as the dominant contributor to soil NO emissions, as mentioned earlier. According to the global dataset (Potter et al., 2012), the amount of fertilizer applied is 19.6 Tg, which is comparable to the sum of the nitrogen fertilizer for 2018 (20.7 Tg), as obtained from provincial statistical yearbooks. However, compound fertilizer, usually with a nitrogen, phosphorus, and potassium ratio of 15 : 15 : 15, has been more commonly used in China. Each number represents the percentage of the nutrient by weight in the fertilizer. In the case of 15 : 15 : 15 NPK fertilizer, it means that the fertilizer contains 15 % nitrogen, 15 % phosphorus, and 15 % potassium. Since 2016, the amount of nitrogen fertilizer has been decreasing annually at an average rate of 4.6 %, while the amount of compound fertilizer has been increasing since 2010 at an average rate of 3.3 %. The ratio of compound fertilizer to nitrogen fertilizer increased from 76.4 % in 2010 to 109.8 % in 2018. Consequently, soil NO emissions may be largely underestimated if the compound fertilizer is not taken into account. Our calculation shows that if only nitrogen fertilizer is considered, the estimated total soil NO emissions are 805.2 Gg N a−1 for 2018, which is comparable to the average value (770 Gg N a−1 from 2008–2017) reported by Lu et al. (2021), but 30.5 % lower than the estimated total soil emissions based on both nitrogen fertilizer and compound fertilizer. Regionally, this underestimation ranges from 11.1 %–41.5 %, with a larger underestimation in Central China and East China (Fig. S3).
Another major uncertainty in estimating soil NO emissions is the temperature dependence factor f(T) in Eq. (1). According to the BDSNP scheme, soil NO emissions increase exponentially with a temperature between 0 and 30 ∘C and reach their maximum when the temperature exceeds 30 ∘C. The default temperature dependence coefficient (i.e., k in Eq. S2 in the Supplement) follows the value used in the YL95 scheme, which is 0.103 ± 0.04. However, as Table 3 in Yienger and Levy (1995) shows, this value is the weighted average of the values reported for different land types, which shows a wide range from 0.040 to 0.189. Even for the same crop type (e.g., corn), the value of k could be quite different (0.130 vs. 0.066). We conducted a sensitivity analysis to examine the impact of varying the k value on estimated soil NO emissions. When the k value decreases or increases by 20 %, the estimated total soil NO emissions change from 715.7 to 1902.6 Gg N a−1, representing a relative difference of −38.2 % to 64.3 % deviation from the default value (1157.9 Gg N a−1). Using the default k value would result in a large overestimation of simulated NO2 concentrations across the NCP and YRD and underestimation across Northeast China (Fig. S4). According to the total sown areas of farm crops reported in the provincial statistical yearbook, the primary crops grown in these regions are wheat and corn, which have a relatively low k value (0.066–0.073). Therefore, we adjusted the k value for the NCP (reduced by 20 %), YRD (reduced by 10 %), and Northeast China (increased by 10 %). CAMx simulation results show that this adjustment would not significantly affect the simulated MDA8 O3 concentration but could reduce the NO2 gap between observation and simulation (Figs. S4–S5). Therefore, we applied this adjustment to soil NO emissions in subsequent CAMx simulations.
3.2 Contribution of soil NO emissions to ground-level ozone
3.2.1 Base case model evaluation
Figure 4 shows the monthly averaged MDA8 ozone concentration simulated for June 2018 with observed values presented on top. Overall, the spatial distribution of MDA8, with a spatial correlation of R=0.89, was well captured by the model. Across the 365 cities in China, the simulated monthly averaged MDA8 ozone concentration is 146.7 ± 36.1 µg m−3, which is slightly higher than the observed value of 129.6 ± 37.6 µg m−3 (NMB = 13.2 %). Regionally, the model performs better in Northeast China (MB = 2.4 µg m−3, NMB = 1.9 %) and the NCP (MB = 13.3 µg m−3, NMB = 7.7 %). Overprediction is observed for the Sichuan Basin and YRD (Table S6). Simulated ozone concentration across the northwest Qinghai–Tibet Plateau was also much higher than the observed values. Our OSAT results (shown later) show that the high ozone concentration across the Qinghai–Tibet Plateau is mostly attributed to the transport of boundary ozone, which includes both horizontal and vertical (i.e., stratospheric) directions. For regions with high altitude (e.g., the Qinghai–Tibet Plateau), vertical ozone intrusion from the stratosphere is the most substantial, which is consistent with the findings of Chen et al. (2023) that show the boundary layer height was identified as the most important feature of ozone across the Qinghai–Tibet Plateau.
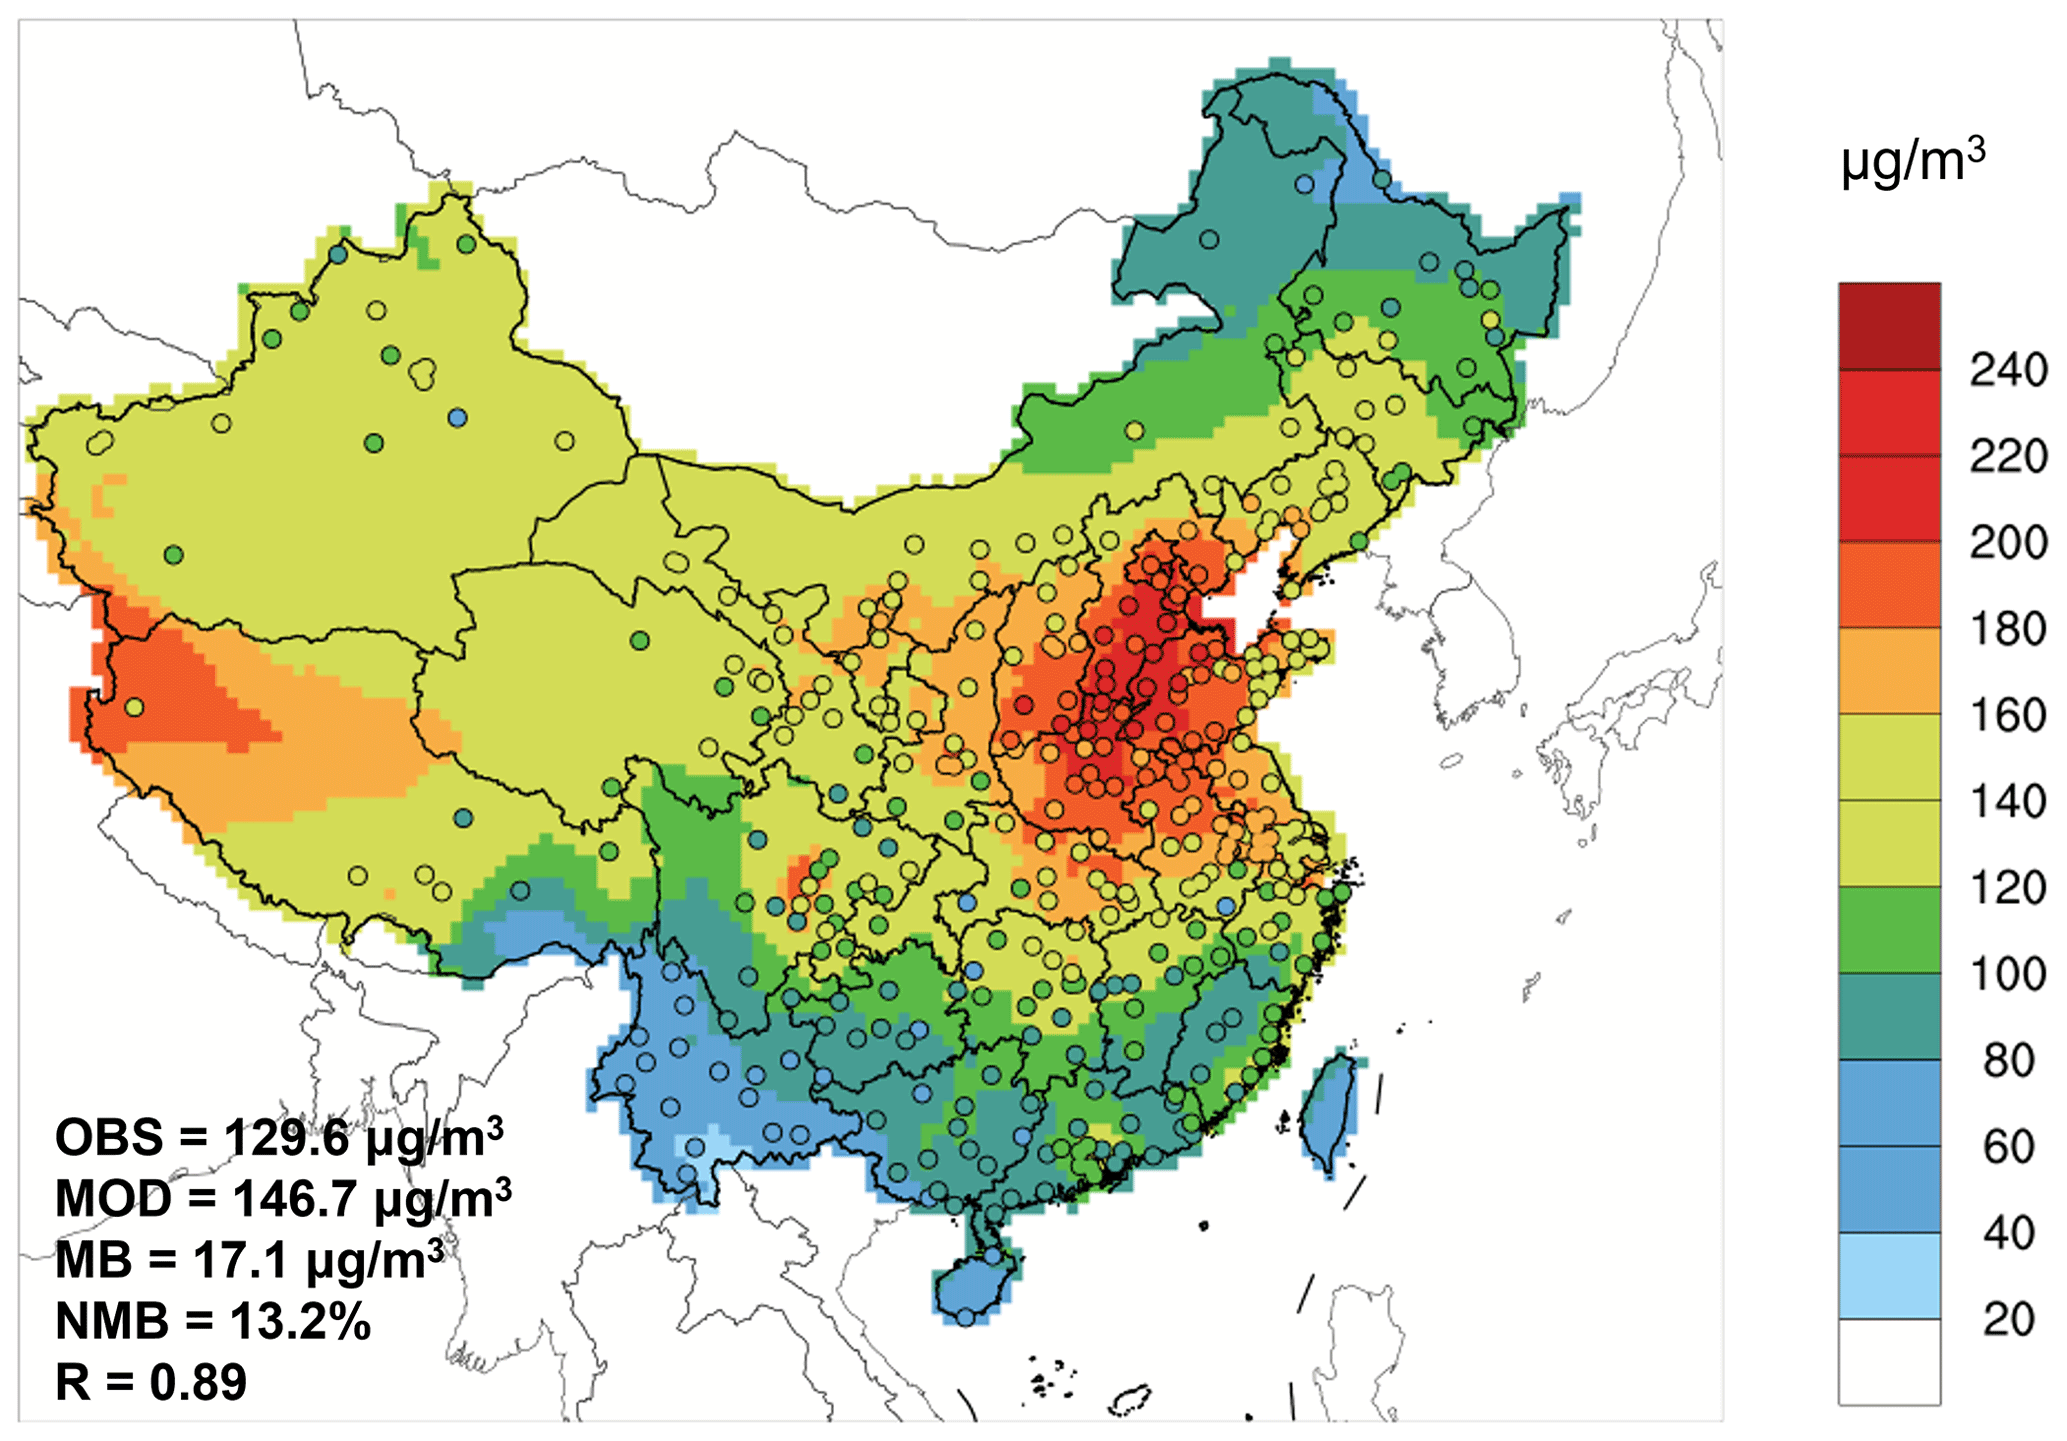
Figure 4Comparison of simulated (base colors) and observed (scatter points) values of MDA8 ozone in China in June 2018.
3.2.2 Impacts on regional ozone
To assess the contribution of soil NO emissions to surface ozone, both the brute-force method (BFM) and the OSAT method were applied, and Fig. 5 shows the results. Generally, the two methods show consistent ozone contribution from soil NO emissions but with different magnitudes. The BFM shows widespread ozone enhancement due to soil NO emissions with a spatial pattern that aligns with the distribution of soil NO emissions. Substantial ozone enhancement is found across Central China, the Sichuan Basin, the northern YRD, and eastern Northeast China. Maximum ozone enhancement (ΔMDA8) due to soil NO emissions is 26.4 µg m−3 with a domain-averaged value of 8.0 µg m−3. For selected key regions, the ozone contribution ranges from low to high: Pearl River Delta (PRD) (3.8 ± 1.1 µg m−3), the YRD (8.7 ± 4.7 µg m−3), the Sichuan Basin (9.1 ± 0.9 µg m−3), Northeast China (9.3 ± 3.0 µg m−3), and the NCP (13.9 ± 4.4 µg m−3). A similar spatial pattern is observed from the OSAT results, but the magnitudes are much higher. The maximum ozone contribution from soil NO emissions reaches 40.4 µg m−3 according to the OSAT results, which is 53.0 % higher than the brute-force method. The corresponding ozone contribution for each selected region is 6.7 ± 1.2 µg m−3 (PRD), 13.5 ± 7.4 µg m−3 (the Sichuan Basin), 14.5 ± 4.9 µg m−3 (Northeast China), 16.2 ± 7.8 µg m−3 (YRD), and 25.7 ± 5.3 µg m−3 (NCP). The scatterplots between the BFM and OSAT results show good correlations (Fig. S6, R2 = 0.78 to 0.97), with the OSAT results being higher by 10 %–61 %. For the YRD, the Sichuan Basin, and Northeast China, the difference between the OSAT method and BFM increases with the absolute ozone concentration (Fig. S7), while the NCP shows the opposite trend. The difference between the two methods reflects the nonlinear ozone response to NOx emissions. This nonlinearity becomes stronger in regions with larger NOx concentrations, especially where O3 production is characterized as NOx saturated (or VOC-limited), such as the NCP. In such cases, removing a portion of the NO emissions (e.g., zeroing out soil NO for the BFM simulation) makes O3 production from the remaining NO emissions more efficient, which lessens the O3 response. As Fig. 7a shows later, the O3 response from the NCP is more curved (nonlinear) than that from other regions, consistent with the NCP, which tends to have more NOx-saturated O3 production. This nonlinear effect also accounts for the smaller O3 attribution to soil NO from the BFM than OSAT, especially across the NCP. Attributing a secondary pollutant to a primary emission (e.g., O3 to NO) is inherently tricky with nonlinear chemistry, as discussed by Koo et al. (2009). Therefore, it is useful to present estimates from different methods. The path-integral method (PIM) is a source apportionment method that explicitly treats nonlinear responses with mathematical rigor (Dunker et al., 2015). However, applying the PIM is more costly than the BFM or OSAT.
In addition to soil NO contribution, OSAT also gives ozone contributions from other source groups, including anthropogenic emissions within China, boundary contribution, natural emissions (e.g., biogenic emissions, open biomass burning, and lightning NOx), and emissions outside China. Figure S8 presents the spatial distribution across each source category, and Fig. S9 shows the relative contribution from each selected region. Overall, boundary transport (56.5 %) and anthropogenic emissions (24.0 %) contributed the most to MDA8 ozone for June 2018. Boundary contribution is high across the western and northern parts of China, while the contribution from anthropogenic emissions is substantial across eastern China, where anthropogenic emissions are extensive. On a national scale, soil NO emissions exhibit a relative ozone contribution of 9.1 %, and this value ranges regionally from 6.1 % in PRD to 13.8 % in the NCP.
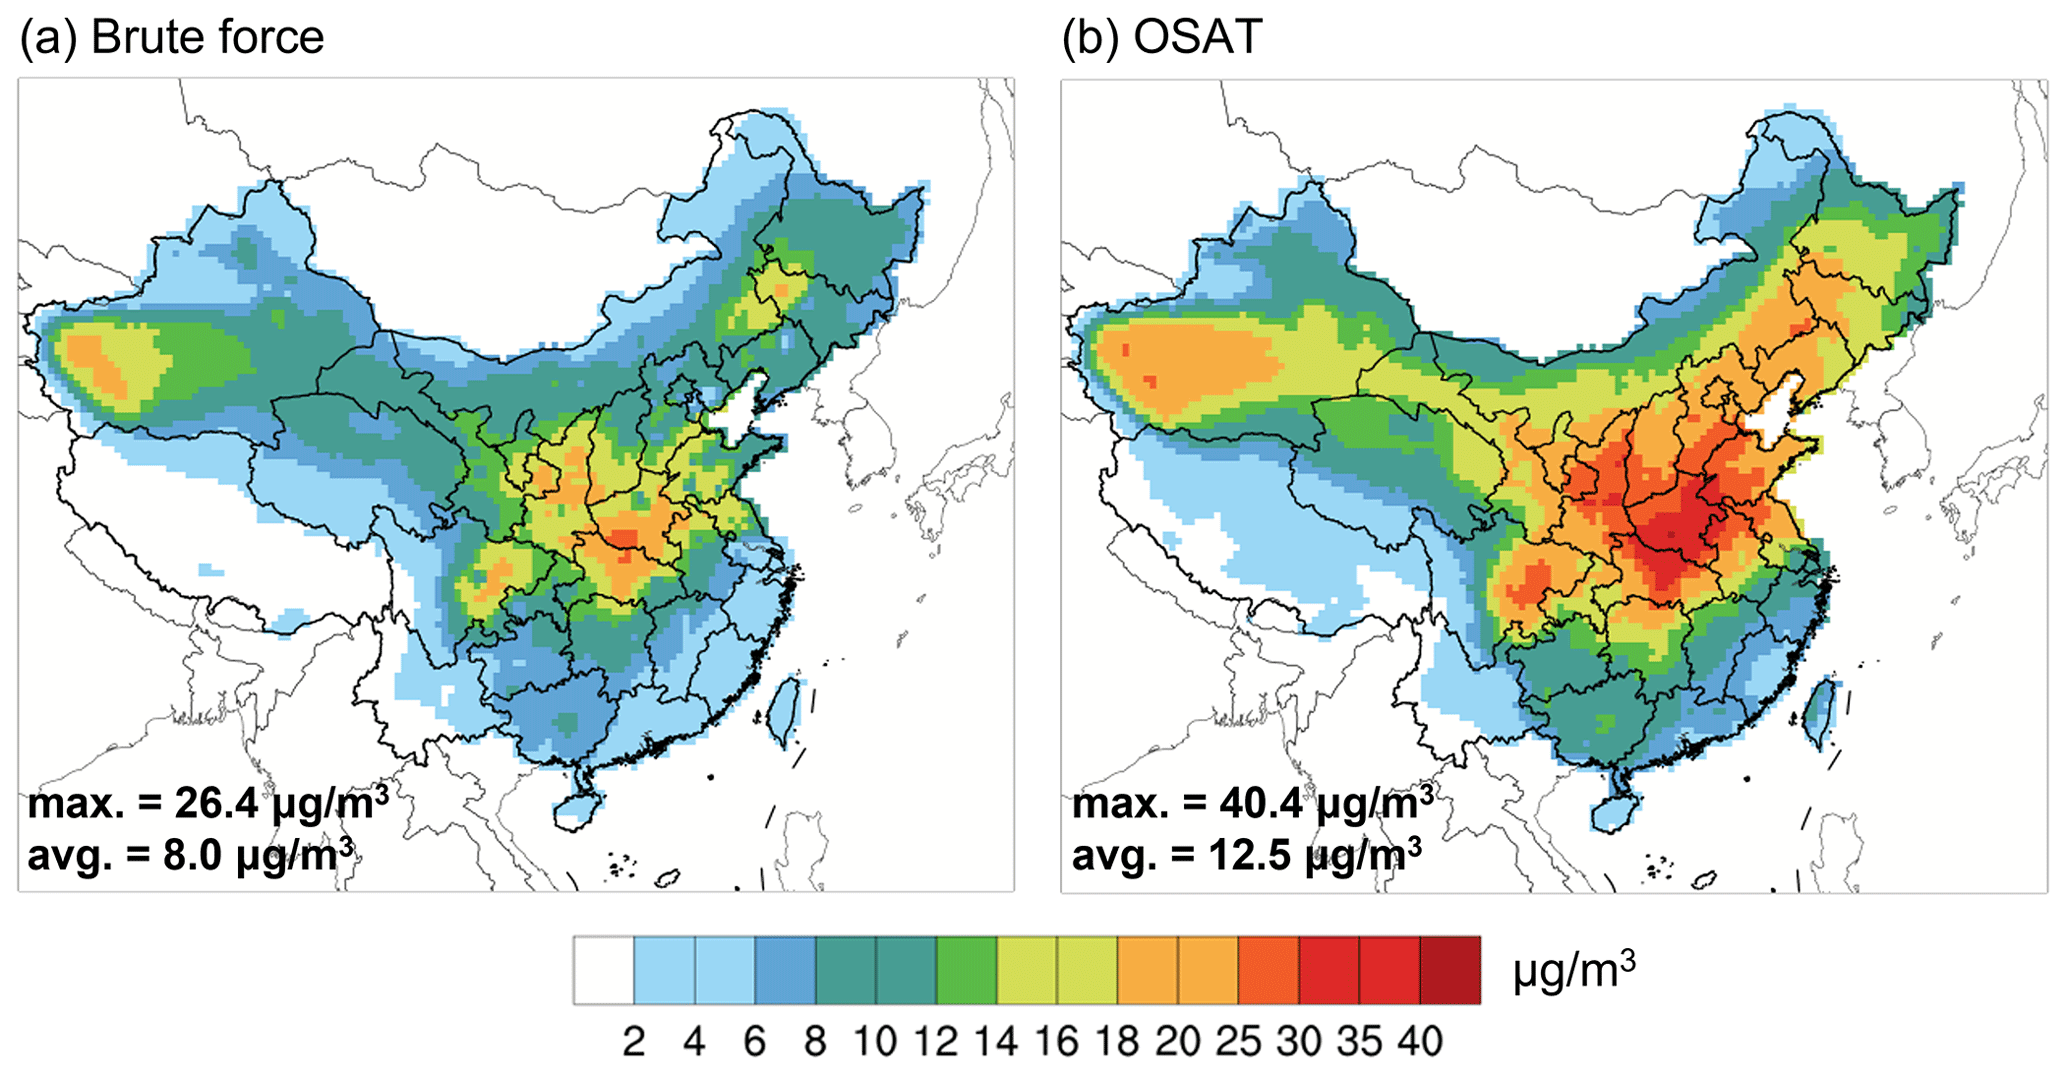
Figure 5Ozone contribution from soil NO emissions based on (a) brute-force method and (b) OSAT method.
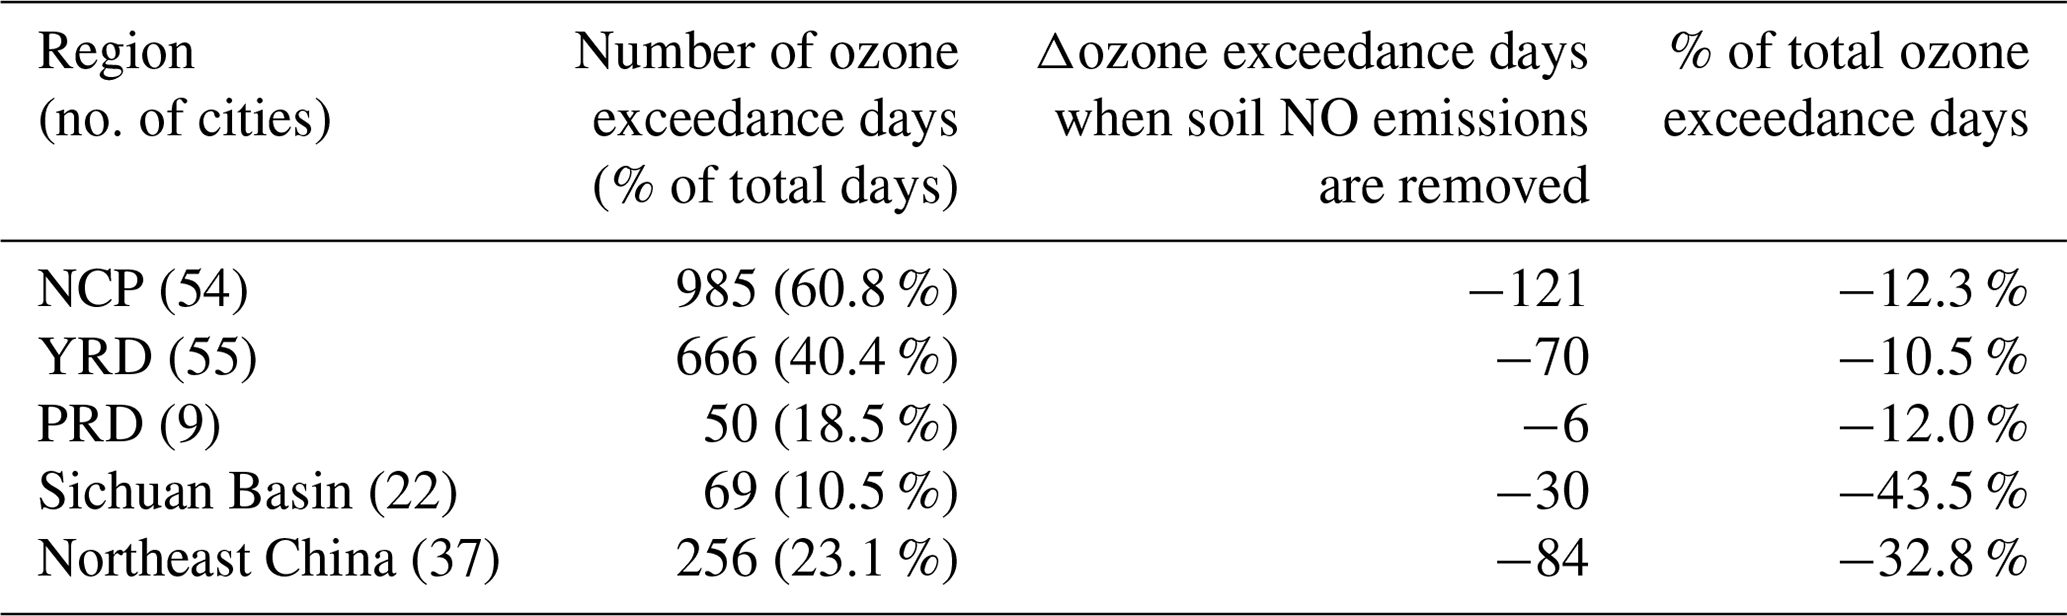
We further evaluated the impact of soil NO emissions on the number of ozone exceedance days (i.e., days with MDA8 O3 higher than 160 µg m−3) during June 2018 based on the relative response factor (RRF) method and results from the brute-force method. The total number of ozone exceedance days during June 2018 for the five selected regions ranged from 50 d in PRD to 985 d in the NCP (Table 1). The number of ozone exceedance days per city ranged from 3.1 d in the Sichuan Basin to 18.2 d in the NCP, suggesting that the ozone pollution in June 2018 across the NCP was severe. The RRF was first calculated for each city as the ratio of simulated ozone concentration between the base case and the case with soil NO emissions excluded and applied to the observed ozone concentrations to obtain adjusted ozone concentrations without soil NO emissions. Soil NO emissions are estimated to lead to 121 ozone exceedance days in the NCP followed by 84 d in Northeast China and 70 d in the YRD, corresponding to a percent change of 12.3 %, 32.8 %, and 10.5 %, respectively. In the Sichuan Basin, where soil NO emissions are also substantial, soil NO emissions contribute 30 ozone exceedance days, which accounts for 43.5 % of the total ozone exceedance days. These results suggest that soil NO emissions contribute significantly to the number of ozone exceedance days in regions with high soil NO emissions.
Table 1Number of ozone exceedance days across selected regions during June 2018.
3.3 Ozone responses to reductions in soil NO emissions
Current NOx emissions control policies primarily target combustion sources, such as power plants (Du et al., 2021) and on-road vehicles (Park et al., 2021). Nitrification inhibitors, such as dicyandiamide (DCD, C2H4N4), have been found to be effective in reducing nitrogen loss, thereby reducing NO emissions from soil (Abalos et al., 2014). Studies have shown that using 5 % DCD with nitrogen fertilizer can reduce NO emissions by up to 70 % (Xue et al., 2023). In light of this, it is important to evaluate the impact of reduced soil NO emissions on ozone concentration. To address this question, four sensitivity simulations were carried out for June 2018, with soil NO emissions reduced by 25 %, 50 %, 75 %, and 100 % relative to the base case. As Fig. 6 shows, reducing soil NO emissions led to a general decrease in monthly MDA8 ozone concentration (ΔMDA8), with the magnitude of ΔMDA8 becoming more significant with the reduction ratio. With a 25 % reduction in soil NO emissions, there was a widespread small decrease in monthly average MDA8 ozone concentration (ΔMDA8: −1.5 ± 0.9 µg m−3), except across the NCP, where ozone showed a slight increase (up to 1.3 µg m−3) in the Shandong and Henan provinces. These ozone increases reflect the nonlinearity of ozone chemistry, and this nonlinearity becomes stronger in regions with large NOx concentrations, especially where O3 production is characterized as VOC-limited (such as in the NCP). When soil NO emissions were cut by 50 %, the effect of reduced O3 titration is overwhelmed by reduced O3 formation due to less NOx being available; thus the ΔMDA8 showed a ubiquitous decrease across the entire country of China with an average ΔMDA8 of −3.3 µg m−3. When soil NO emissions were removed entirely, the maximum ΔMDA8 could exceed 25 µg m−3 across Central China, part of the Sichuan Basin, Northeast China, and Northwest China. Regions with strong ozone responses generally aligned with regions that also had high soil NO emissions. However, it should be noted that the ozone response to soil NO reductions not only depends on the magnitude of soil NO emissions but is also affected by the (1) local ozone formation regime that is further determined by the relative abundance of NOx and VOCs and (2) changes in the transport of the upwind ozone.
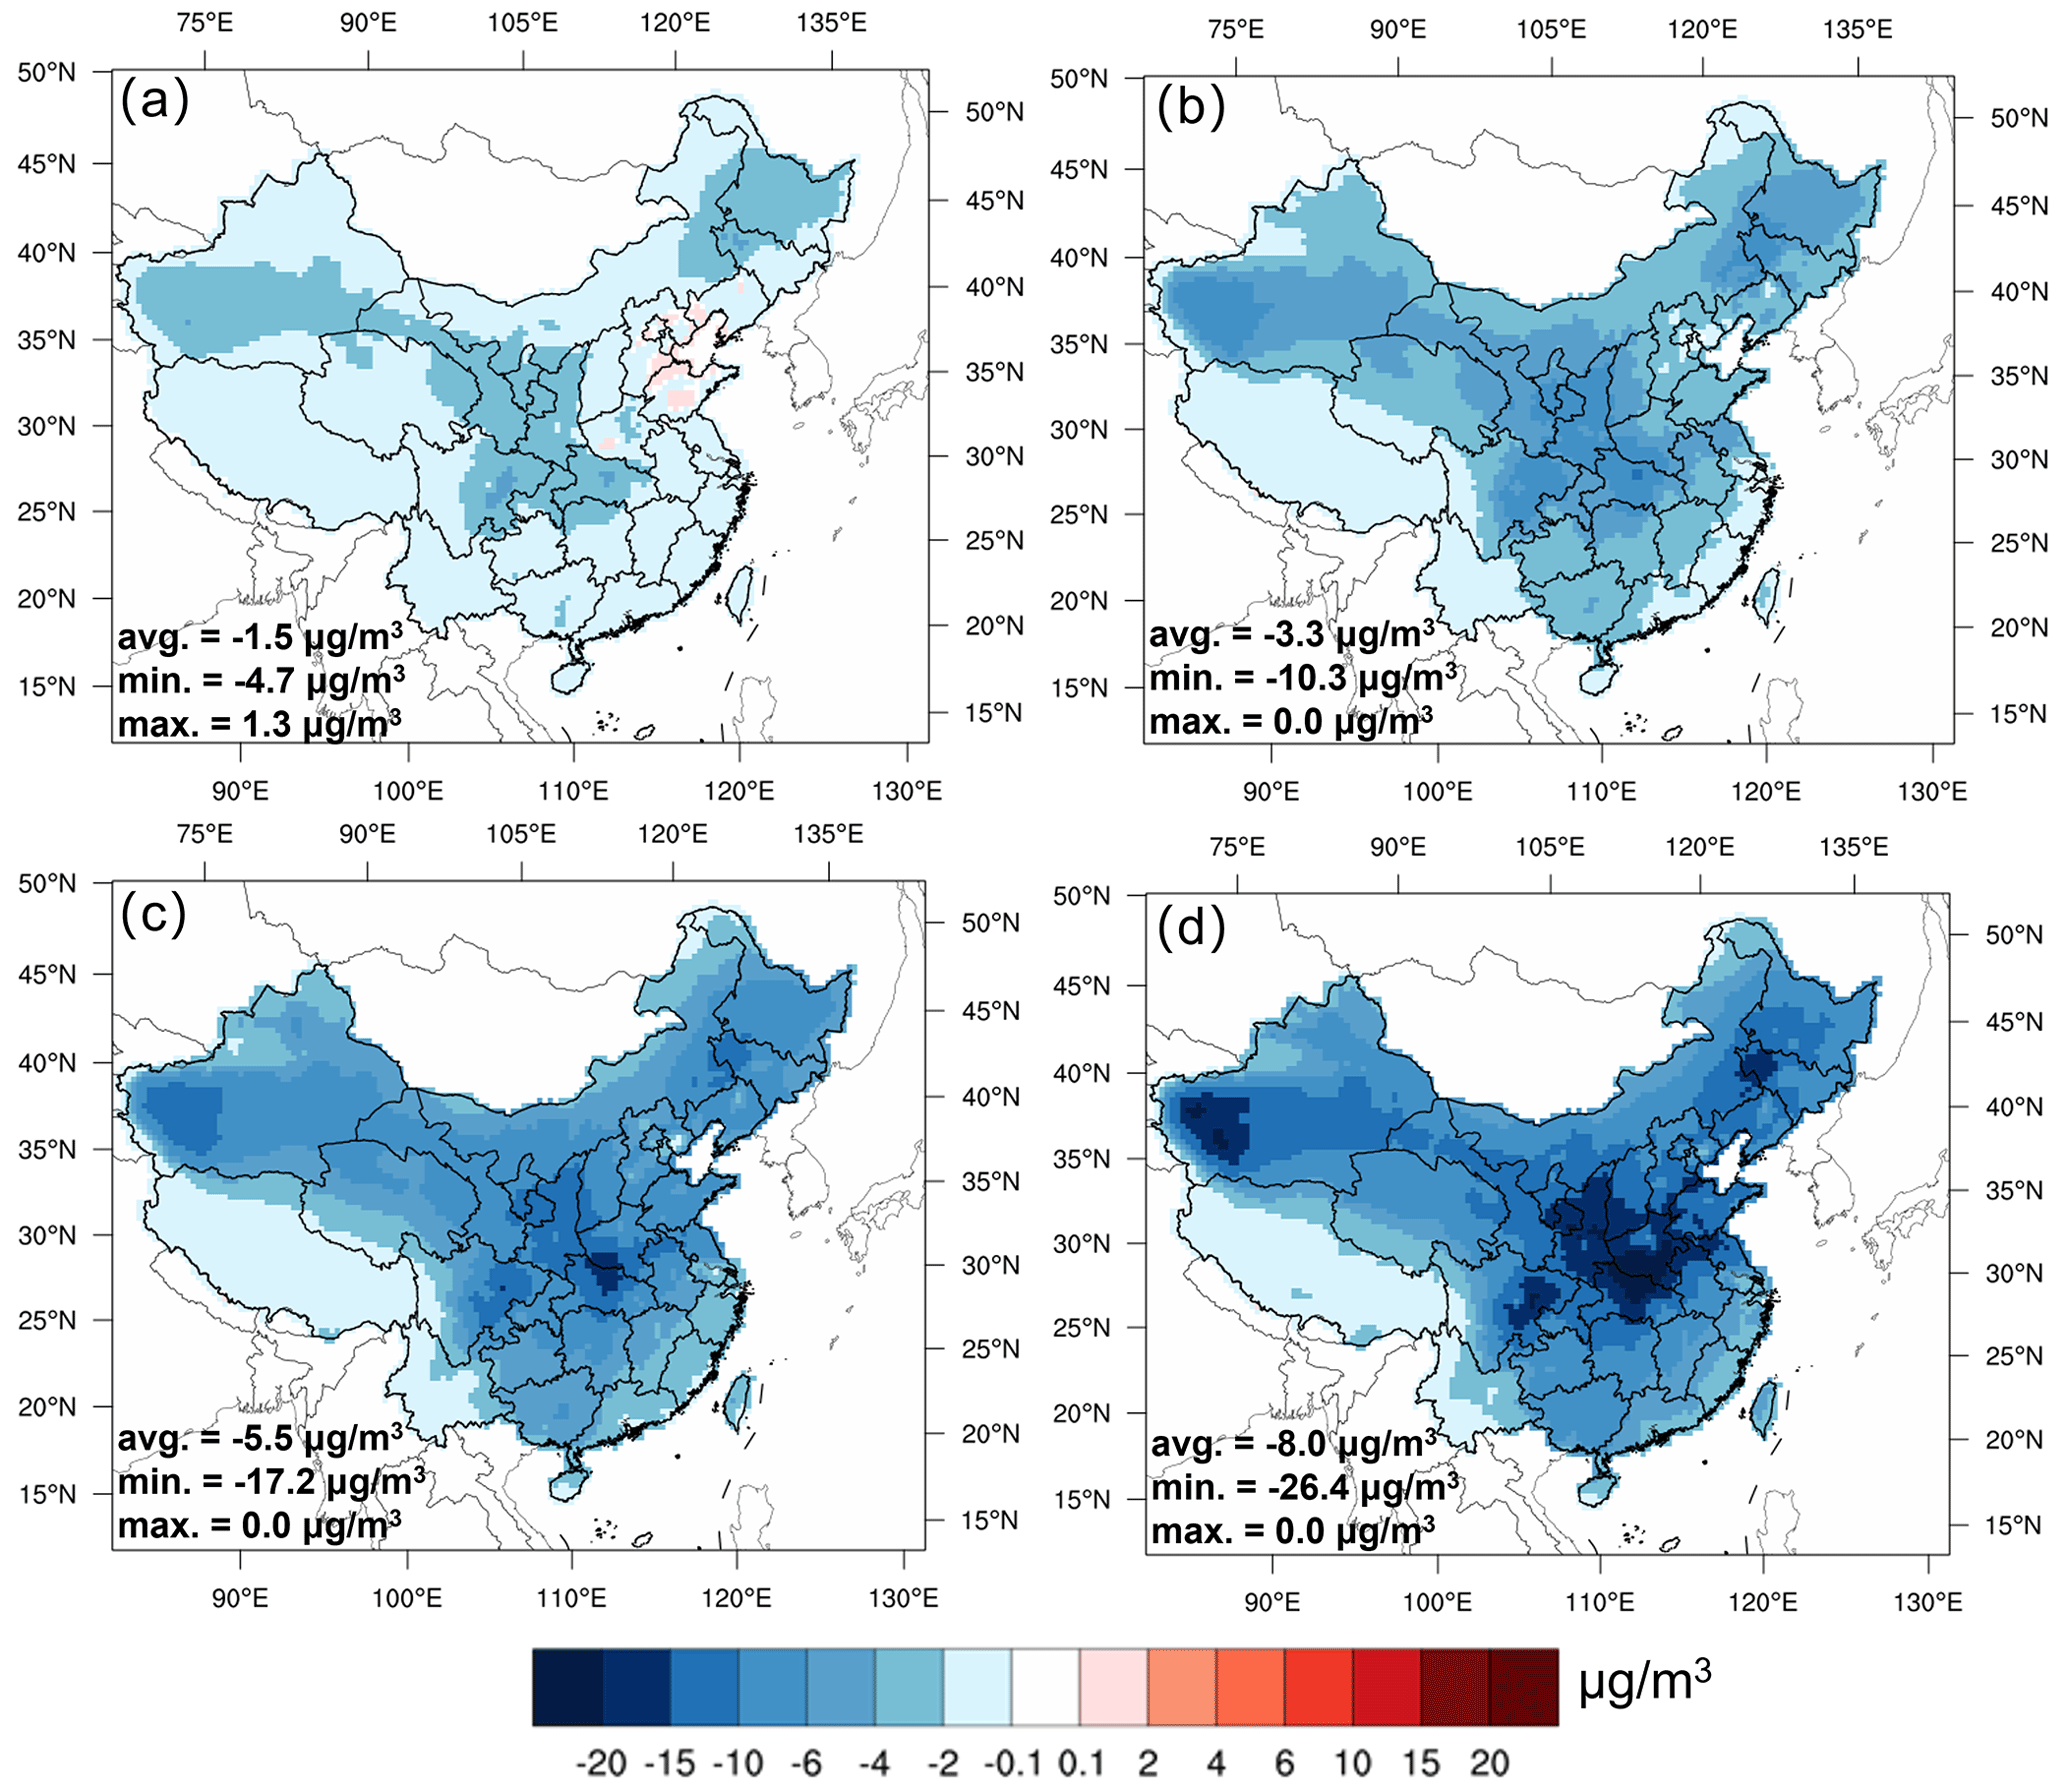
Figure 6Spatial distribution of ΔMDA8 under (a) 25 %, (b) 50 %, (c) 75 %, and (d) 100 % reductions of soil NO emissions in June 2018.
Figure 7a provides further details on the domain-averaged ΔMDA8 under different reduction scenarios for the five key regions. As expected, the ozone response in each region increased as the reduction in the soil NO emissions increased. The NCP exhibited the strongest ozone responses to changes in soil NO emissions, with ΔMDA8 increasing from −0.7 ± 0.8 µg m−3 with 25 % reductions to −13.9 ± 4.4 µg m−3 when all soil NO emissions were removed. The YRD, the Sichuan Basin, and Northeast China exhibit similar ozone responses when soil NO emissions are reduced. Under the 25 % scenario, ΔMDA8 ranged from −4.7 to 1.3 µg m−3 for these three regions; with 100 % soil NO reductions, ΔMDA8 ranged from −21.4 to −0.9 µg m−3. ΔMDA8 in PRD was relatively small. Even with a 100 % reduction, the average ΔMDA8 in PRD was less than 5 µg m−3, which is associated with the small soil NO emissions in PRD. It is interesting to note that all regions except the NCP exhibited an approximate linear ozone response to changes in soil NO emissions reductions. The NCP showed more significant ozone reductions as the reduction ratio increased, suggesting that the NCP would gain more benefits with more aggressive reductions in soil NO emissions compared with other regions.
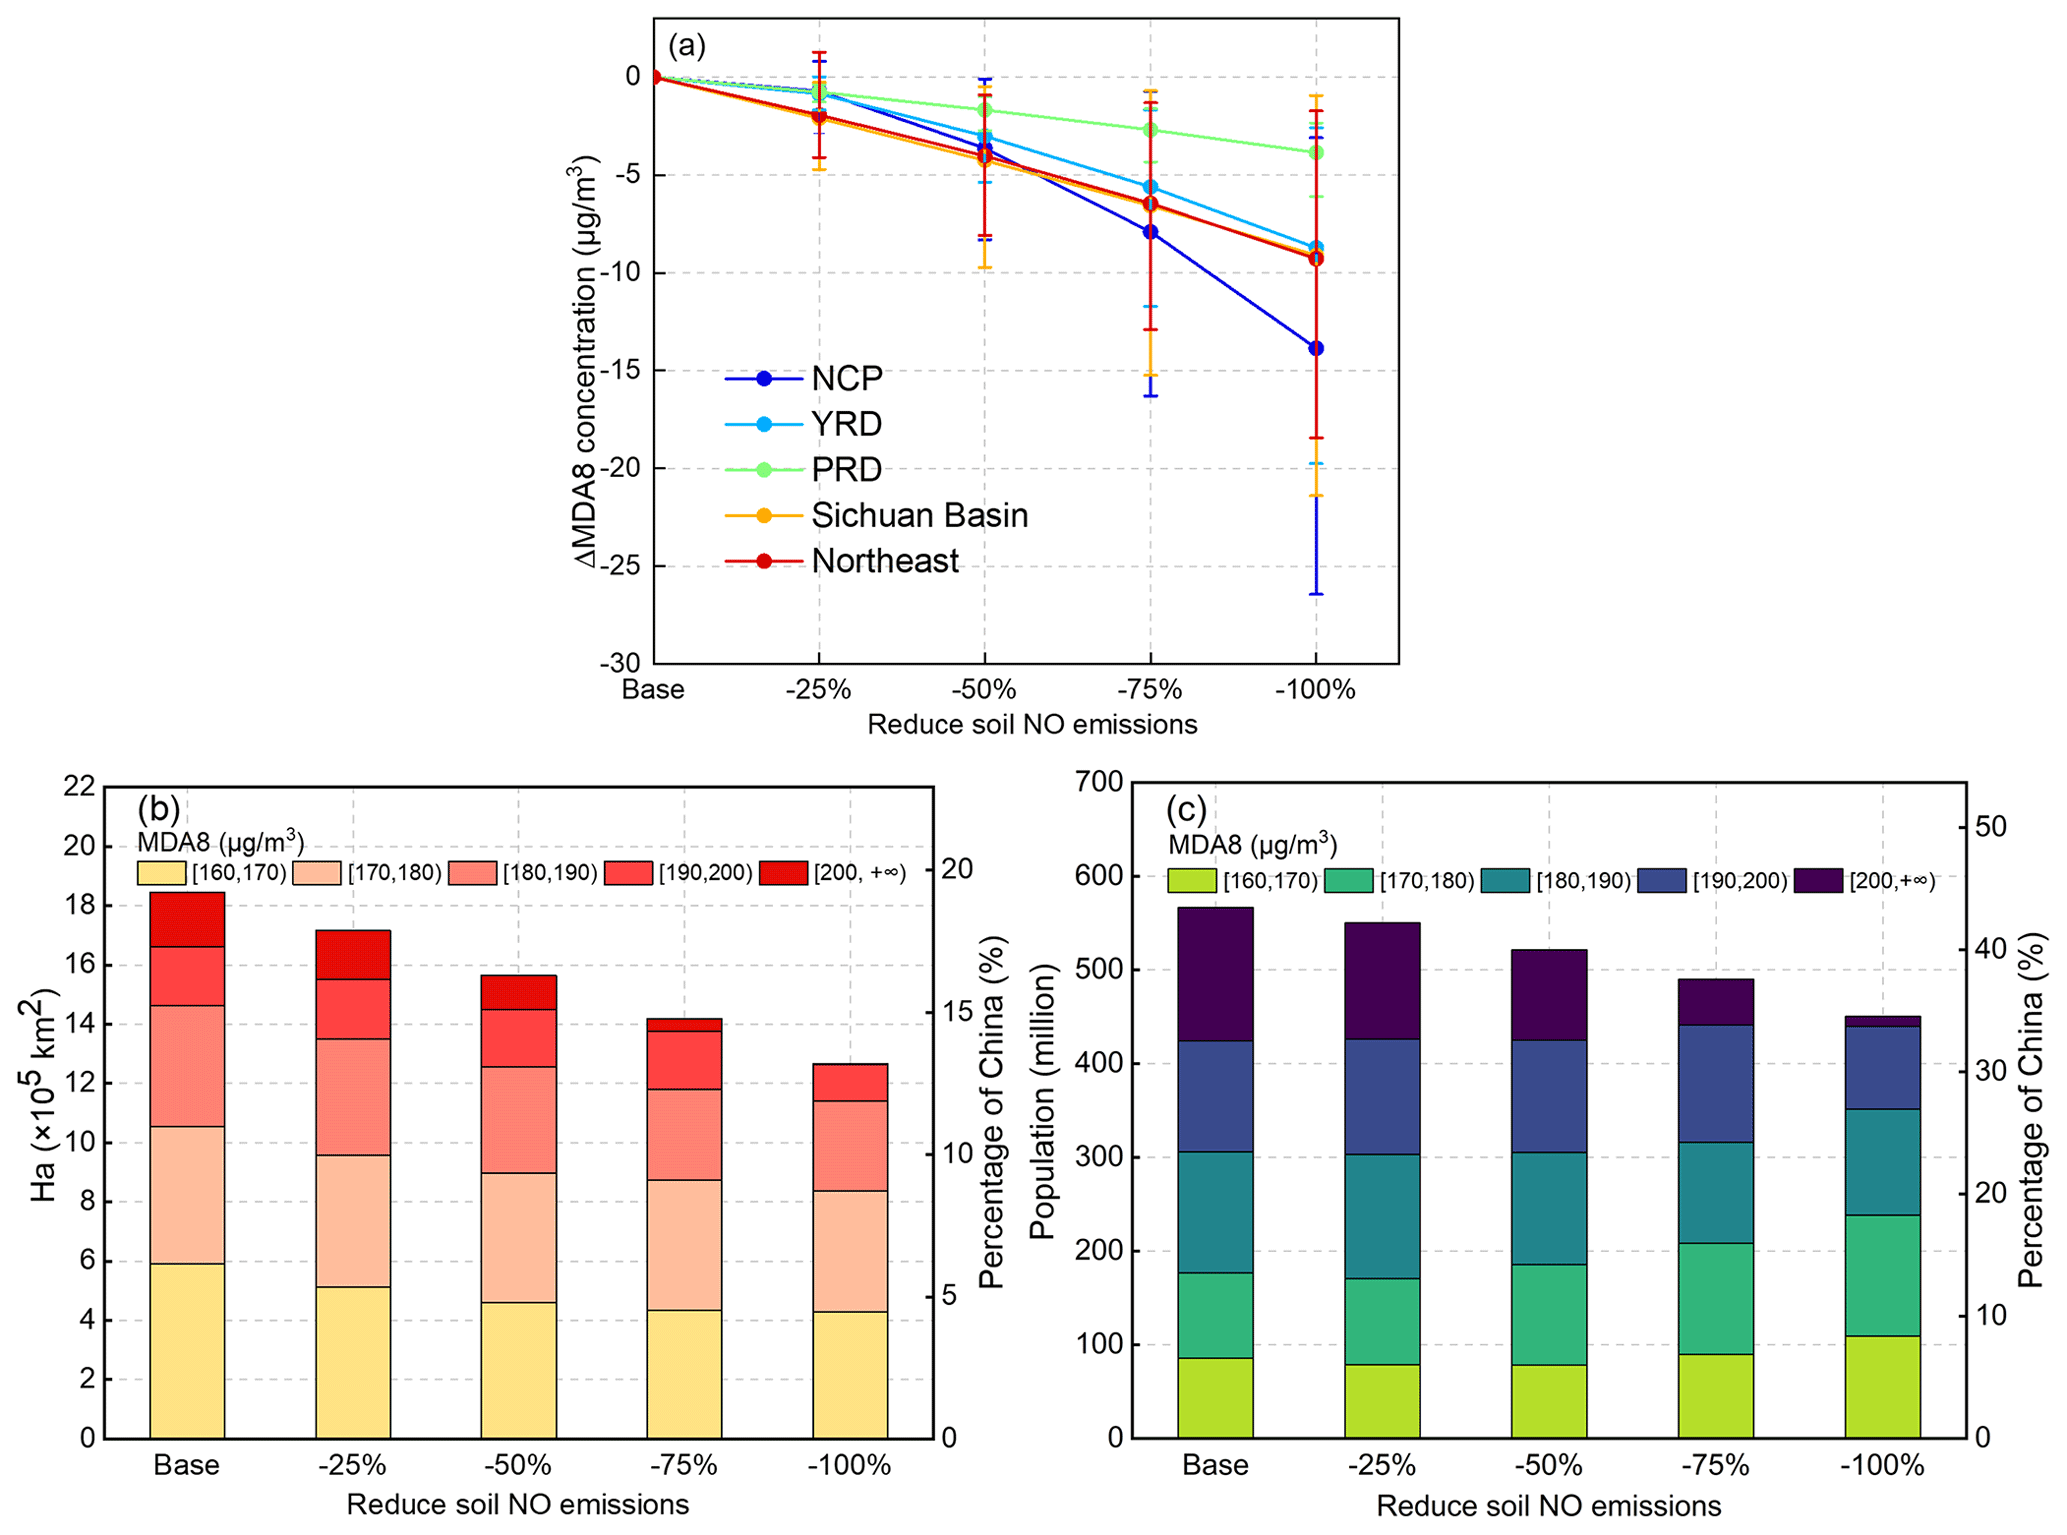
Figure 7(a) ΔMDA8 concentrations in five key regions under different emissions reduction scenarios. (b) Area and (c) population exposed to different ozone levels under different soil NO emissions reduction scenarios.
We evaluated the impact of different soil NO emissions reduction scenarios on the area and population exposed to varying ozone levels. The results, presented in Fig. 7b and c, revealed a decrease in coverage and an exposed population under high ozone concentrations as soil NO emissions decrease. The data presented in the plots are for grid cells with monthly MDA8 ozone concentrations exceeding 160 µg m−3. In the base scenario, the estimated coverage of MDA8 ozone exceeding 160 µg m−3 was 1.84 × 10⁶ km2, equivalent to 19.2 % of the national land area. The population exposed to ozone concentrations exceeding 160 µg m−3 amounts to 566.6 million, representing 43.4 % of the entire population. The areas with extremely high ozone concentrations (MDA8 > 200 µg m−3) account for 1.9 % of the national land area, with a corresponding exposed population of 10.9 %, indicating that densely populated areas experience higher ozone concentrations. When soil NO emissions are halved, there is a 15.2 % reduction in the coverage of nonattainment areas and an 8.0 % reduction in the total exposed population. If soil NO emissions are eliminated, the total area coverage and population exposed to MDA8 ozone concentrations exceeding 160 µg m−3 would be 1.27 × 10⁶ km2 and 450.3 million, respectively, representing 13.2 % and 34.5 % of the total. Compared with the base scenario, a 100 % theoretical reduction in soil NO emissions leads to a 31.3 % and 20.5 % reduction in the exposed area and population under high ozone concentration, respectively, indicating that substantial health benefits are gained when soil NO emissions are mitigated.
Figures S10 and S11 display similar area and population plots for selected key regions. The overall trends for each sub-region are consistent. With 100 % reductions in soil NO emissions, the area with high ozone concentration decreased by 17.8 %, 22.3 %, 65.4 %, and 100.0 % for the NCP, the YRD, the Sichuan Basin, and Northeast China, respectively; the corresponding values for the exposed population are 91.4 %, 60.3 %, 9.8 %, and 0.0 %, respectively. While the relative change is more significant in the Sichuan Basin and Northeast China, the NCP and YRD gain more health benefits due to the significantly higher total population for these two regions. However, it is worth noting that even with the complete elimination of soil NO emissions, a total of 450.3 million people are still exposed to ozone levels exceeding the national standard, necessitating multiple control policies at the same time, such as the synergistic control of anthropogenic VOC emissions (Chen et al., 2022; Ding et al., 2021).
3.4 Comparison with existing studies
The soil NO emissions estimated in this study were also compared with the values reported by existing studies based on either field measurement or model estimation (Table S7). Previous studies report a wide range of soil NO emissions from 480 to 1375 Gg N and soil NO flux ranging from 10 to 47.5 ng N m−2 s−1. The soil NO emissions estimated in our study are 1157.9 Gg N with the default k value and 951.9 Gg N with region-adjusted k value, which fall within the upper range of previously reported values. The averaged soil NO flux across the NCP in June 2018 estimated in our study is 35.4 ng N m−2 s−1, which is within the range reported by previous studies (12.9–40.0 ng N m−2 s−1).
The simulated ozone contribution by soil NO emissions is compared with other studies. In California, soil NO was estimated to cause a 23.0 % increase in surface O3 concentrations (Sha et al., 2021). Constrained by satellite-measured NO2 column densities, R. Wang et al. (2022) reported an MDA8 ozone contribution of 9.0 µg m−3 (relative contribution of 5.4 %) from cropland NOx emissions across the NCP during a growing season in 2020. Lu et al. (2021) showed the interactive effect of domestic anthropogenic emissions on soil NO emissions of 9.5 ppb in the NCP during July 2017. In addition, soil NOx emissions strongly affect the sensitivity of ozone concentrations to anthropogenic sources in the NCP. In a very recent study by Shen et al. (2023), the addition of the soil NOx emissions was shown to result in up to a 15 ppb increase in the ozone concentration across Xinjiang, Tibet, Inner Mongolia, and Heilongjiang, although a minor reduction was evident across the Yangtze River basin. The findings of this study align with previous studies, emphasizing the important role of soil NO emissions in influencing surface ozone concentrations in China. Furthermore, spatial heterogeneities exist in terms of both the soil NO emissions and the responses of ozone to reductions in soil NO emissions. However, it should be noted that the spatial pattern of ozone response to reduced soil NO emissions in this study is different from the findings of Shen et al. (2023). For instance, with a 30 % reduction in soil NO emissions, O3 concentration increased by 3–5 ppb across Inner Mongolia, Heilongjiang, Xinjiang, and Tibet and decreased by 0–2 ppb across the Yangtze River basin in Shen et al. (2023). In this study, a 20 % reduction in soil NO emissions was found to lead to widespread but small decreases (less than 4 µg m−3) in ozone concentrations, except across the NCP (Fig. 6a). These inconsistences may stem from the differences in the estimated soil NO emissions, associated with both the magnitude and the spatial distribution, as also noted in other studies (Zhu et al., 2023). Therefore, more observations, such as direct measurement of soil NO flux, especially over agricultural areas, are urgently needed to better constrain the estimated soil NO emissions.
Soil NO emissions are non-negligible NOx sources, particularly during summer. The importance of soil NO emissions to ground-level ozone in China is much less evaluated than combustion NOx emissions. In this study, the total national soil NO emissions were estimated to be 1157.9 Gg N in 2018 based on the BDSNP algorithm, with a spatial distribution closely following that of fertilizer application. High soil NO emissions were the greatest over the Henan, Shandong, and Hebei provinces, which differs significantly from where anthropogenic NOx emissions were. Distinct diurnal and seasonal variations in soil NO emissions were found, mainly driven by the changes in soil temperature as well as the timing of fertilizer application. Uncertainty analysis of the estimated soil NO emissions reveals a range of 715.7–1902.6 Gg N that warrants further study and, preferably, a constraint on observations.
Using two ozone source attribution methods (the BFM and OSAT), we evaluated the contribution of soil NO emissions to ground-level ozone concentration for June 2018. Both methods suggest a substantial contribution of soil NO emissions to average MDA8 ozone concentrations of 8.0–12.5 µg m−3 for June 2018, with the OSAT results being consistently higher than the BFM results. Soil NO emissions were shown to increase in ozone exceedance days (i.e., MDA8 above 160 µg m−3) by 10.5 %–43.5 %, depending on the region. The reduction in soil NO emissions could generally reduce the ground-level ozone concentrations and population exposure to unhealthy ozone levels, especially across the NCP and YRD. For example, a 50 % reduction in soil NO emissions decreased the land area experiencing ozone above 160 µg m−3 by 15.2 % and the population exposed to this ozone concentration by 8.0 %. However, even with the complete removal of soil NO emissions, approximately 450.3 million people are still exposed to ozone above 160 µg m−3.
The major findings of this study reinforce previous studies by highlighting the important contribution of soil NO emissions to surface ozone concentrations in China, although substantial uncertainties remain with soil NO emissions estimates. Observational constraints on the magnitude of soil NOx emissions in China are needed. The ozone response to the reduction in soil NO emissions varies by region due to the nonlinear chemistry of ozone formation. Future ozone mitigation strategies should consider the potential benefit of reducing noncombustion NOx emissions, such as soil NO, with due consideration to the sensitivity of ozone to reducing NOx in the region.
Data will be made available on request.
The supplement related to this article is available online at: https://doi.org/10.5194/acp-23-14919-2023-supplement.
Conceptualization, formal analysis, writing (original draft): LH. Data curation, formal analysis, visualization: JF. Data curation, formal analysis, visualization: JL. Writing (reviewing and editing): GY. Writing (reviewing and editing): HC. Writing (reviewing and editing): YW. Conceptualization, supervision, funding acquisition: LL.
The contact author has declared that none of the authors has any competing interests.
Publisher's note: Copernicus Publications remains neutral with regard to jurisdictional claims made in the text, published maps, institutional affiliations, or any other geographical representation in this paper. While Copernicus Publications makes every effort to include appropriate place names, the final responsibility lies with the authors. Regarding the maps used in this paper, please note that Figs. 1, 2, and 4–6 contain disputed territories.
This work is supported by Shanghai Technical Service Center of Science and Engineering Computing, Shanghai University.
This study was financially sponsored by the National Natural Science Foundation of China (grant nos. 42005112, 42075144), the Open Funding of Zhejiang Key Laboratory of Ecological and Environmental Big Data (grant no. EEBD-2022-06), and the Shanghai International Science and Technology Cooperation Fund (grant no. 19230742500).
This paper was edited by Amos Tai and reviewed by two anonymous referees.
Abalos, D., Jeffery, S., Sanz-Cobena, A., Guardia, G., and Vallejo, A.: Meta-analysis of the effect of urease and nitrification inhibitors on crop productivity and nitrogen use efficiency, Agr. Ecosyst. Environ., 189, 136–144, 2014.
Almaraz, M., Bai, E., Wang, C., Trousdell, J., Conley, S., Faloona, I., and Houlton, B. Z.: Agriculture is a major source of NOx pollution in California, Sci. Adv., 4, eaao3477, https://doi.org/10.1126/sciadv.aao3477, 2018.
Cakaj, A., Qorri, E., Coulibaly, F., De Marco, A., Agathokleous, E., Leca, S., and Sicard, P.: Assessing surface ozone risk to human health and forests over time in Poland, Atmos. Environ., 309, 119926, https://doi.org/10.1016/j.atmosenv.2023.119926, 2023.
Chang, J., Brost, R., Isaksen, I., Madronich, S., Middleton, P., Stockwell, W., and Walcek, C.: A three-dimensional Eulerian acid deposition model: Physical concepts and formulation, J. Geophys. Res.-Atmos., 92, 14681–14700, 1987.
Chen, B., Wang, Y., Huang, J., Zhao, L., Chen, R., Song, Z., and Hu, J.: Estimation of near-surface ozone concentration and analysis of main weather situation in China based on machine learning model and Himawari-8 TOAR data, Sci. Total Environ., 864, 160928, https://doi.org/10.1016/j.scitotenv.2022.160928, 2023.
Chen, W., Guenther, A. B., Jia, S., Mao, J., Yan, F., Wang, X., and Shao, M.: Synergistic effects of biogenic volatile organic compounds and soil nitric oxide emissions on summertime ozone formation in China, Sci. Total Environ., 828, 154218, https://doi.org/10.1016/j.scitotenv.2022.154218, 2022.
Clappier, A., Belis, C. A., Pernigotti, D., and Thunis, P.: Source apportionment and sensitivity analysis: two methodologies with two different purposes, Geosci. Model Dev., 10, 4245–4256, https://doi.org/10.5194/gmd-10-4245-2017, 2017.
Diao, B., Ding, L., Su, P., and Cheng, J.: The spatial-temporal characteristics and influential factors of NOx emissions in China: A spatial econometric analysis, Int. J. Env. Res. Pub. He., 15, 1405, https://doi.org/10.3390/ijerph15071405, 2018.
Ding, D., Xing, J., Wang, S., Dong, Z., Zhang, F., Liu, S., and Hao, J.: Optimization of a NOx and VOC cooperative control strategy based on clean air benefits, Environ. Sci. Technol., 56, 739–749, 2021.
Ding, L., Liu, C., Chen, K., Huang, Y., and Diao, B.: Atmospheric pollution reduction effect and regional predicament: An empirical analysis based on the Chinese provincial NOx emissions, J. Environ. Manage., 196, 178–187, 2017.
Drury, C. F., Reynolds, W. D., Yang, X., McLaughlin, N. B., Calder, W., and Phillips, L. A.: Diverse rotations impact microbial processes, seasonality and overall nitrous oxide emissions from soils, Soil Sci. Soc. Am. J., 85, 1448–1464, 2021.
Du, L., Zhao, H., Tang, H., Jiang, P., and Ma, W.: Analysis of the synergistic effects of air pollutant emission reduction and carbon emissions at coal-fired power plants in China, Environ. Prog. Sustain., 40, e13630, https://doi.org/10.1002/ep.13630, 2021.
Dunker, A. M., Koo, B., and Yarwood, G.: Source apportionment of the anthropogenic increment to ozone, formaldehyde, and nitrogen dioxide by the path-integral method in a 3D model, Environ. Sci. Technol., 49, 6751–6759, 2015.
Feng, Z., De Marco, A., Anav, A., Gualtieri, M., Sicard, P., Tian, H., Fornasier, F., Tao, F., Guo, A., and Paoletti, E.: Economic losses due to ozone impacts on human health, forest productivity and crop yield across China, Environ. Int., 131, 104966, https://doi.org/10.1016/j.envint.2019.104966, 2019.
Galbally, I. E., Kirstine, W. V., Meyer, C., and Wang, Y. P.: Soil–atmosphere trace gas exchange in semiarid and arid zones, J. Environ. Qual., 37, 599–607, 2008.
Guo, L., Chen, J., Luo, D., Liu, S., Lee, H. J., Motallebi, N., Fong, A., Deng, J., Rasool, Q. Z., and Avise, J. C.: Assessment of nitrogen oxide emissions and San Joaquin Valley PM2.5 impacts from soils in California, J. Geophys. Res.-Atmos., 125, e2020JD033304, https://doi.org/10.1029/2020JD033304, 2020.
Heffer, P. and Prud'homme, M.: Global nitrogen fertilizer demand and supply: Trend, current level and outlook, International Nitrogen Initiative Conference, Melbourne, Australia, 4–8 December 2016, https://www.ini2016.com (last access: 22 November 2023), 2016.
Huang, K., Su, C., Liu, D., Duan, Y., Kang, R., Yu, H., Liu, Y., Li, X., Gurmesa, G. A., and Quan, Z.: A strong temperature dependence of soil nitric oxide emission from a temperate forest in Northeast China, Agr. Forest Meteorol., 323, 109035, https://doi.org/10.1016/j.agrformet.2022.109035, 2022.
Huang, L., Wang, Q., Wang, Y., Emery, C., Zhu, A., Zhu, Y., Yin, S., Yarwood, G., Zhang, K., and Li, L.: Simulation of secondary organic aerosol over the Yangtze River Delta region: The impacts from the emissions of intermediate volatility organic compounds and the SOA modeling framework, Atmos. Environ., 246, 118079, https://doi.org/10.1016/j.atmosenv.2020.118079, 2021.
Huang, L., Kimura, Y., and Allen, D. T.: Assessing the impact of episodic flare emissions on ozone formation in the Houston-Galveston-Brazoria area of Texas, Sci. Total Environ., 828, 154276, https://doi.org/10.1016/j.scitotenv.2022.154276, 2022.
Huber, D. E., Steiner, A. L., and Kort, E. A.: Sensitivity of Modeled Soil NOx Emissions to Soil Moisture, J. Geophys. Res.-Atmos., 128, e2022JD037611, https://doi.org/10.1029/2022JD037611, 2023.
Hudman, R. C., Moore, N. E., Mebust, A. K., Martin, R. V., Russell, A. R., Valin, L. C., and Cohen, R. C.: Steps towards a mechanistic model of global soil nitric oxide emissions: implementation and space based-constraints, Atmos. Chem. Phys., 12, 7779–7795, https://doi.org/10.5194/acp-12-7779-2012, 2012.
Jiang, Y., Wang, S., Xing, J., Zhao, B., Li, S., Chang, X., Zhang, S., and Dong, Z.: Ambient fine particulate matter and ozone pollution in China: synergy in anthropogenic emissions and atmospheric processes, Environ. Res. Lett., 17, 123001, https://doi.org/10.1088/1748-9326/aca16a, 2022.
Kleinman, L., Lee, Y. N., Springston, S. R., Nunnermacker, L., Zhou, X., Brown, R., Hallock, K., Klotz, P., Leahy, D., and Lee, J. H.: Ozone formation at a rural site in the southeastern United States, J. Geophys. Res.-Atmos., 99, 3469–3482, 1994.
Koo, B., Wilson, G. M., Morris, R. E., Dunker, A. M., and Yarwood, G.: Comparison of source apportionment and sensitivity analysis in a particulate matter air quality model, Environ. Sci. Technol., 43, 6669–6675, 2009.
Lin, Y., Jiang, F., Zhao, J., Zhu, G., He, X., Ma, X., Li, S., Sabel, C. E., and Wang, H.: Impacts of O3 on premature mortality and crop yield loss across China, Atmos. Environ., 194, 41–47, 2018.
Liu, H. Z. and Liu, Q.: Distribution of Fertilizer Application and Its Environmental Risk in Different Provinces of China, Scientia Agricultura Sinica, 47, 3596–3605, 2014.
Liu, P., Song, H., Wang, T., Wang, F., Li, X., Miao, C., and Zhao, H.: Effects of meteorological conditions and anthropogenic precursors on ground-level ozone concentrations in Chinese cities, Environ. Pollut., 262, 114366, https://doi.org/10.1016/j.envpol.2020.114366, 2020.
Liu, X., Zhang, Y., Han, W., Tang, A., Shen, J., Cui, Z., Vitousek, P., Erisman, J. W., Goulding, K., and Christie, P.: Enhanced nitrogen deposition over China, Nature, 494, 459–462, 2013.
Lü, C. and Tian, H.: Spatial and temporal patterns of nitrogen deposition in China: Synthesis of observational data, J. Geophys. Res.-Atmos., 112, D22S05, https://doi.org/10.1029/2006JD007990, 2007.
Lu, X., Zhang, L., Wang, X., Gao, M., Li, K., Zhang, Y., Yue, X., and Zhang, Y.: Rapid increases in warm-season surface ozone and resulting health impact in China since 2013, Environ. Sci. Tech. Let., 7, 240–247, 2020.
Lu, X., Ye, X., Zhou, M., Zhao, Y., Weng, H., Kong, H., Li, K., Gao, M., Zheng, B., and Lin, J.: The underappreciated role of agricultural soil nitrogen oxide emissions in ozone pollution regulation in North China, Nat. Commun., 12, 5021, https://doi.org/10.1038/s41467-021-25147-9, 2021.
Maji, K. J.: Substantial changes in PM2.5 pollution and corresponding premature deaths across China during 2015–2019: A model prospective, Sci. Total Environ., 729, 138838, https://doi.org/10.1016/j.scitotenv.2020.138838, 2020.
Malley, C. S., Henze, D. K., Kuylenstierna, J. C., Vallack, H. W., Davila, Y., Anenberg, S. C., Turner, M. C., and Ashmore, M. R.: Updated global estimates of respiratory mortality in adults ≥30 years of age attributable to long-term ozone exposure, Environ. Health Persp., 125, 087021, https://doi.org/10.1289/EHP1390, 2017.
Mao, J., Wang, L., Lu, C., Liu, J., Li, M., Tang, G., Ji, D., Zhang, N., and Wang, Y.: Meteorological mechanism for a large-scale persistent severe ozone pollution event over eastern China in 2017, J. Environ. Sci., 92, 187–199, 2020.
Montes, C. M., Demler, H. J., Li, S., Martin, D. G., and Ainsworth, E. A.: Approaches to investigate crop responses to ozone pollution: from O3-FACE to satellite-enabled modeling, Plant J., 109, 432–446, 2022.
Mukherjee, A., Yadav, D. S., Agrawal, S. B., and Agrawal, M.: Ozone a persistent challenge to food security in India: current status and policy implications, Current Opinion in Environmental Science & Health, 19, 100220, https://doi.org/10.1016/j.coesh.2020.10.008, 2021.
Oikawa, P., Ge, C., Wang, J., Eberwein, J., Liang, L., Allsman, L., Grantz, D., and Jenerette, G.: Unusually high soil nitrogen oxide emissions influence air quality in a high-temperature agricultural region, Nat. Commun., 6, 8753, https://doi.org/10.1038/ncomms9753, 2015.
Park, J., Shin, M., Lee, J., and Lee, J.: Estimating the effectiveness of vehicle emission regulations for reducing NOx from light-duty vehicles in Korea using on-road measurements, Sci. Total Environ., 767, 144250, https://doi.org/10.1016/j.scitotenv.2020.144250, 2021.
Potter, P., Ramankutty, N., Bennett, E. M., and Donner, S. D.: Characterizing the spatial patterns of global fertilizer application and manure production, Earth Interact., 14, 1–22, 2010.
Potter, P., Ramankutty, N., Bennett, E. M., and Donner, S. D.: Global Fertilizer and Manure, Version 1: Nitrogen Fertilizer Application, NASA Socioeconomic Data and Applications Center (SEDAC) [data set], https://doi.org/10.7927/H4Q81B0R, 2012.
Ramboll, E. H.: User’s guide comprehensive air quality model with extensions, Version 7.1, Ramboll Environmental and Health, https://camx-wp.azurewebsites.net/Files/CAMxUsersGuide_v7.10.pdf (last access: 22 November 2023), 2020.
Rasool, Q. Z., Zhang, R., Lash, B., Cohan, D. S., Cooter, E. J., Bash, J. O., and Lamsal, L. N.: Enhanced representation of soil NO emissions in the Community Multiscale Air Quality (CMAQ) model version 5.0.2, Geosci. Model Dev., 9, 3177–3197, https://doi.org/10.5194/gmd-9-3177-2016, 2016.
Romer, P. S., Duffey, K. C., Wooldridge, P. J., Edgerton, E., Baumann, K., Feiner, P. A., Miller, D. O., Brune, W. H., Koss, A. R., de Gouw, J. A., Misztal, P. K., Goldstein, A. H., and Cohen, R. C.: Effects of temperature-dependent NOx emissions on continental ozone production, Atmos. Chem. Phys., 18, 2601–2614, https://doi.org/10.5194/acp-18-2601-2018, 2018.
Seinfeld, J. H. and Pandis, S. N.: Atmospheric chemistry and physics: From air pollution to climate change, John Wiley & Sons, New Jersey, 2006.
Sha, T., Ma, X., Zhang, H., Janechek, N., Wang, Y., Wang, Y., Castro García, L., Jenerette, G. D., and Wang, J.: Impacts of Soil NOx Emission on O3 Air Quality in Rural California, Environ. Sci. Technol., 55, 7113–7122, 2021.
Shen, L., Liu, J., Zhao, T., Xu, X., Han, H., Wang, H., and Shu, Z.: Atmospheric transport drives regional interactions of ozone pollution in China, Sci. Total Environ., 830, 154634, https://doi.org/10.1016/j.scitotenv.2022.154634, 2022.
Shen, Y., Xiao, Z., Wang, Y., Xiao, W., Yao, L., and Zhou, C.: Impacts of Agricultural Soil NOx Emissions on O3 Over Mainland China, J. Geophys. Res.-Atmos., 128, e2022JD037986, https://doi.org/10.1029/2022JD037986, 2023.
Sillman, S., Logan, J. A., and Wofsy, S. C.: The sensitivity of ozone to nitrogen oxides and hydrocarbons in regional ozone episodes, J. Geophys. Res.-Atmos., 95, 1837–1851, 1990.
Skiba, U., Medinets, S., Cardenas, L. M., Carnell, E. J., Hutchings, N., and Amon, B.: Assessing the contribution of soil NOx emissions to European atmospheric pollution, Environ. Res. Lett., 16, 025009, https://doi.org/10.1088/1748-9326/abd2f2, 2021.
Sun, W., Shao, M., Granier, C., Liu, Y., Ye, C., and Zheng, J.: Long-term trends of Anthropogenic SO2, NOx, CO, and NMVOCs emissions in China, Earth's Future, 6, 1112–1133, 2018.
Sun, Y., Yin, H., Lu, X., Notholt, J., Palm, M., Liu, C., Tian, Y., and Zheng, B.: The drivers and health risks of unexpected surface ozone enhancements over the Sichuan Basin, China, in 2020, Atmos. Chem. Phys., 21, 18589–18608, https://doi.org/10.5194/acp-21-18589-2021, 2021.
Thunis, P., Clappier, A., Tarrasón, L., Cuvelier, C., Monteiro, A., Pisoni, E., Wesseling, J., Belis, C., Pirovano, G., and Janssen, S.: Source apportionment to support air quality planning: Strengths and weaknesses of existing approaches, Environ. Int., 130, 104825, https://doi.org/10.1016/j.envint.2019.05.019, 2019.
Vinken, G. C. M., Boersma, K. F., Maasakkers, J. D., Adon, M., and Martin, R. V.: Worldwide biogenic soil NOx emissions inferred from OMI NO2 observations, Atmos. Chem. Phys., 14, 10363–10381, https://doi.org/10.5194/acp-14-10363-2014, 2014.
Wang, J., Wang, D., Ge, B., Lin, W., Ji, D., Pan, X., Li, J., and Wang, Z.: Increase in daytime ozone exposure due to nighttime accumulation in a typical city in eastern China during 2014–2020, Atmos. Pollut. Res., 13, 101387, https://doi.org/10.1016/j.apr.2022.101387, 2022.
Wang, P., Wang, T., and Ying, Q.: Regional source apportionment of summertime ozone and its precursors in the megacities of Beijing and Shanghai using a source-oriented chemical transport model, Atmos. Environ., 224, 117337, https://doi.org/10.1016/j.atmosenv.2020.117337, 2020.
Wang, Q. G., Han, Z., Wang, T., and Zhang, R.: Impacts of biogenic emissions of VOC and NOx on tropospheric ozone during summertime in eastern China, Sci. Total Environ., 395, 41–49, 2008.
Wang, R., Bei, N., Wu, J., Li, X., Liu, S., Yu, J., Jiang, Q., Tie, X., and Li, G.: Cropland nitrogen dioxide emissions and effects on the ozone pollution in the North China plain, Environ. Pollut., 294, 118617, https://doi.org/10.1016/j.envpol.2021.118617, 2022.
Wang, Y., Ge, C., Garcia, L. C., Jenerette, G. D., Oikawa, P. Y., and Wang, J.: Improved modelling of soil NOx emissions in a high temperature agricultural region: role of background emissions on NO2 trend over the US, Environ. Res. Lett., 16, 084061, https://doi.org/10.1088/1748-9326/ac16a3, 2021.
Xiao, Q., Geng, G., Liang, F., Wang, X., Lv, Z., Lei, Y., Huang, X., Zhang, Q., Liu, Y., and He, K.: Changes in spatial patterns of PM2.5 pollution in China 2000–2018: Impact of clean air policies, Environ. Int., 141, 105776, https://doi.org/10.1016/j.envint.2020.105776, 2020.
Xue, C., Ye, C., Liu, P., Zhang, C., Su, H., Bao, F., Cheng, Y., Catoire, V., Ma, Z., and Zhao, X.: Strong HONO Emissions from Fertilized Soil in the North China Plain 4 Driven by Nitrification and Water Evaporation, Research Square [preprint], https://doi.org/10.21203/rs.3.rs-2045348/v4, 19 Feburary 2023.
Yan, X., Ohara, T., and Akimoto, H.: Statistical modeling of global soil NOx emissions, Global Biogeochem. Cy., 19, GB3019, https://doi.org/10.1029/2004GB002276, 2005.
Yang, X., Wu, K., Lu, Y., Wang, S., Qiao, Y., Zhang, X., Wang, Y., Wang, H., Liu, Z., and Liu, Y.: Origin of regional springtime ozone episodes in the Sichuan Basin, China: role of synoptic forcing and regional transport, Environ. Pollut., 278, 116845, https://doi.org/10.1016/j.envpol.2021.116845, 2021.
Yarwood, G., Morris, R. E., Yocke, M. A., Hogo, H., and Chico, T.: Development of a methodology for source apportionment of ozone concentration estimates from a photochemical grid model, J. Air Waste Manage., p. 15222, 1996.
Yarwood, G., Jung, J., Whitten, G. Z., Heo, G., Mellberg, J., and Estes, E.: Updates to the Carbon Bond Mechanism for Version 6 (CB6), presented at the 9th Annual CMAS Conference, Chapel, Hill, NC, ENVIRON International Corporation, Novato, https://www.cmascenter.org/conference/2010/abstracts/emery_updates_carbon_2010.pdf (last access: 20 December 2021), 2010.
Yienger, J. and Levy, H.: Empirical model of global soil-biogenic NOx emissions, J. Geophys. Res.-Atmos., 100, 11447–11464, 1995.
Yin, H., Lu, X., Sun, Y., Li, K., Gao, M., Zheng, B., and Liu, C.: Unprecedented decline in summertime surface ozone over eastern China in 2020 comparably attributable to anthropogenic emission reductions and meteorology, Environ. Res. Lett., 16, 124069, https://doi.org/10.1088/1748-9326/ac3e22, 2021.
Zhai, S., Jacob, D. J., Wang, X., Shen, L., Li, K., Zhang, Y., Gui, K., Zhao, T., and Liao, H.: Fine particulate matter (PM2.5) trends in China, 2013–2018: separating contributions from anthropogenic emissions and meteorology, Atmos. Chem. Phys., 19, 11031–11041, https://doi.org/10.5194/acp-19-11031-2019, 2019.
Zheng, B., Zhang, Q., Geng, G., Chen, C., Shi, Q., Cui, M., Lei, Y., and He, K.: Changes in China's anthropogenic emissions and air quality during the COVID-19 pandemic in 2020, Earth Syst. Sci. Data, 13, 2895–2907, https://doi.org/10.5194/essd-13-2895-2021, 2021.
Zhu, Q., Place, B., Pfannerstill, E. Y., Tong, S., Zhang, H., Wang, J., Nussbaumer, C. M., Wooldridge, P., Schulze, B. C., Arata, C., Bucholtz, A., Seinfeld, J. H., Goldstein, A. H., and Cohen, R. C.: Direct observations of NOx emissions over the San Joaquin Valley using airborne flux measurements during RECAP-CA 2021 field campaign, Atmos. Chem. Phys., 23, 9669–9683, https://doi.org/10.5194/acp-23-9669-2023, 2023.