the Creative Commons Attribution 4.0 License.
the Creative Commons Attribution 4.0 License.
 | 01 Dec 2023
Aerosol absorption using in situ filter-based photometers and ground-based sun photometry in the Po Valley urban atmosphere
Alessandro Bigi
Giorgio Veratti
Elisabeth Andrews
Martine Collaud Coen
Lorenzo Guerrieri
Vera Bernardoni
Dario Massabò
Luca Ferrero
Sergio Teggi
Grazia Ghermandi
Light-absorbing aerosols (LAAs) are short-lived climate forcers with a significant impact on Earth's radiative balance. LAAs include dust aerosols, black carbon (BC) and organic light-absorbing carbonaceous aerosol (collectively termed brown carbon, BrC), which have also been proven to be highly toxic. In this study, aerosol absorption at five wavelengths (ranging from ultraviolet to infrared) was monitored continuously using filter-based photometers during two winter seasons in 2020 and 2021 in the city of Modena (southern central Po Valley, northern Italy), at two regulatory air quality monitoring sites, along with other pollutants (coarse particulate matter, PM10; fine particulate matter, PM2.5; O3; NO; NO2; and C6H6) and the vehicular traffic rate. The aerosol optical depth (AOD) and other column aerosol optical properties were concurrently monitored at four wavelengths by an AErosol RObotic NETwork (AERONET) sun photometer under urban background conditions within Modena. In situ absorption levels were apportioned to both sources (fossil fuel and biomass burning) and species (BC and BrC), while columnar absorption was apportioned to BC, BrC and mineral dust. The combined analysis of the atmospheric aerosol and gas measurements and of the meteorological conditions (in situ and from the ERA5 reanalysis) identified the location of potential urban sources of BC and BrC, most likely related to traffic and biomass burning. In situ data show different diurnal/weekly patterns for BrC from biomass burning and BC from traffic, with minor differences between the background and the urban traffic conditions. AERONET version 3 absorption aerosol optical depth (AAOD) retrievals at four wavelengths allowed the estimation of the absorptive direct radiative effect due to LAAs over the same period under the reasonable assumption that the AOD signal is concentrated within the mixing layer. AERONET retrievals showed a modest correlation of columnar absorption with planetary boundary layer (PBL)-scaled in situ observations, although the correlation improved significantly during a desert dust transport event that affected both in situ aerosol and columnar absorption, particularly in the blue spectrum range. A low correlation occurred between the contribution of BrC to aerosol absorption for the in situ and the columnar observations, with the BrC contribution being generally larger for in situ observations. Finally, evidence of a highly layered atmosphere during the study period, featuring significant spatial mixing and modest vertical mixing, was shown by ERA5-based atmospheric temperature profiles and by the large correlation of concurrent AERONET AOD retrievals in Modena and in Ispra (on the northwestern side of the Po Valley, ca. 225 km from Modena).
- Article
(6198 KB) - Full-text XML
-
Supplement
(3630 KB) - BibTeX
- EndNote


Light-absorbing aerosols (LAAs) include dust aerosols and soot-like, graphitic, elemental carbonaceous light-absorbing particles, the latter of which are qualitatively named black carbon (BC). A wide range of experimental techniques, which rely on the different properties of LAAs, are available for the experimental measurement of BC. In order to harmonize the terminology used reporting the concentration of this species, the scientific community recommends reporting BC observations based on light absorption as equivalent BC (eBC; Petzold et al., 2013). eBC aerosol particles have a fairly constant refractive index across the ultraviolet–infrared (UV–IR) range (Moosmüller et al., 2009). The eBC concentrations are converted into the light-absorbing carbon mass concentration using the mass-specific absorption cross section (MAC). Another type of LAA is brown carbon (BrC; Andreae and Gelencsér, 2006; Laskin et al., 2015): the fraction of light-absorbing organic aerosol with optical properties that differ from those of BC, due to their enhancement in absorption towards UV wavelengths.
LAAs are short-lived climate forcers (∼ 1-week atmospheric residence time; Forster et al., 2021) and significantly affect the Earth radiative balance (Bond et al., 2013; R. Wang et al., 2016). In terms of global impact, BC has been shown to have a positive direct radiative effect at the top of the atmosphere (TOA) in the range of 0.71–0.82 W m−2 (Chung et al., 2012; Bond et al., 2013; Lin et al., 2014). Estimates of global direct effect are lower for BrC, in the range of 0.04–0.57 W m−2, than for BC (Feng et al., 2013; Lin et al., 2014; Saleh et al., 2014; Jo et al., 2016; Brown et al., 2018; Zhang et al., 2020). BrC concentrations are very spatially variable, and concentrations depend on the study specifics. Due to aerosol–cloud interactions, the overall effective radiative forcing of LAAs (i.e., the difference in their radiative effect between the present day and preindustrial times; Heald et al., 2014) is 0.15±0.17 W m−2 for BC (Thornhill et al., 2021; Forster et al., 2021), with the largest part of this uncertainty mainly arising from the indirect and semi-direct effects exerted by aerosol on cloud condensation nuclei, ice nuclei and on the atmospheric lapse rate, along with the aerosol mixing state (Twomey, 1974; Charlson et al., 1992; Bond et al., 2013; Rosenfeld et al., 2014; Takemura and Suzuki, 2019).
In addition to aerosol effects on climate, the scientific literature has documented adverse effects on human health, which significantly affects life expectancy (Loomis et al., 2013; Cohen et al., 2017; West et al., 2016). The toxicological effect of particulate matter (PM) is known to depend on the aerosol size distribution and chemical composition (Pöschl, 2005). BC is one of the components with a proven harmful effect on human health (Janssen et al., 2012), and both long-term and acute exposure to increased eBC concentrations have been shown to increase the mortality risk (Ostro et al., 2015; Yang et al., 2021). Recent studies have also shown that exposure to increased eBC concentrations is positively associated with various health issues, such as ischemic heart disease and myocardial infarction (Luben et al., 2017; Magalhaes et al., 2018; Kirrane et al., 2019). In addition, Regencia et al. (2021) observed that short-term cumulative exposure to traffic-related eBC concentrations could adversely affect blood pressure, resulting in cardiovascular diseases. BrC has also been shown to have detrimental health effects, enhanced because of its enrichment in organic compounds (Chowdhury et al., 2019; Offer et al., 2022), possibly related to aerosol aging (Li et al., 2022; Tuet et al., 2017; Weitekamp et al., 2020).
The compilation of reliable and accurate emission inventories for eBC is critical for the development of robust air quality control strategies and the mitigation of global warming. However, the large uncertainty associated with source emission factors, PM speciation and eBC definition makes the implementation of systematic and harmonized emission estimates a challenging task. Despite these limitations, most studies identify road transport as the largest eBC emission source in Europe (Wang, 2015), followed by biomass burning and industry (European Environment Agency, 2013), as more recently confirmed by the analysis of the eBC emission change in Europe due to COVID-19 lockdowns (Evangeliou et al., 2021). Similar to BC, BrC can be directly emitted into the atmosphere during the combustion of fossil fuels, although its major source is biomass burning. BrC can also originate from secondary reactions, e.g., through aging processes or via the photooxidation of biogenic or anthropogenic volatile organic compounds (VOCs) (Laskin et al., 2015).
Several approaches have been proposed in the literature to measure LAAs, including photothermal interferometry, photo-acoustic spectroscopy, and online or offline filter-based light attenuation methods (Lack et al., 2014). The difference in the BC reported by these techniques increases when significant amounts of secondary organics are present (Kalbermatter et al., 2022). Both the interferometric and acoustic approaches can be considered to be thermally based measurements, as they quantify the fraction of absorbed optical energy that is rapidly transferred into the surroundings under a controlled light source emission. The main advantage of these techniques is their direct measurement of the absorption of particles while suspended in air; however, they both suffer from technical and operational limitations. For example, the photo-acoustic technique is very sensitive to atmospheric conditions, such as relative humidity, temperature and pressure (Langridge et al., 2013), while photothermal interferometry is sensitive to mechanical vibration, although it has recently gained new attention (e.g., Visser et al., 2020; Drinovec et al., 2022). Filter-based measurements are very simple to operate but have the main disadvantages of filter-related artifacts, such as filter loading and multiple-scattering effects within filter fibers and between the collected particles and the filter fibers, possibly leading to systematic errors in the measurements. With the aim of overcoming these limitations, different technical and analytical corrections have been developed to correct for the non-idealities of filter-based measurements (e.g., Weingartner et al., 2003; Petzold et al., 2005; Virkkula et al., 2007; Collaud Coen et al., 2010; Hyvärinen et al., 2013; Drinovec et al., 2015; Li et al., 2020) for filter absorption photometers common in field experiments and in air quality monitoring networks. The Aethalometer (Magee Scientific Aerosol, Ljubljana, Slovenia) is a commonly used filter-based photometer designed to measure LAAs at multiple wavelengths and at high temporal resolution, generally at fixed monitoring sites. Lightweight portable micro-Aethalometer instruments, such as the AE51 or the MA200 series (AethLabs, San Francisco, USA), have recently been developed and successfully used in complex urban environments for pedestrian exposure assessments (Viana et al., 2015; Good et al., 2017; Boniardi et al., 2021), mobile observations (Grivas et al., 2019; Liu et al., 2019, 2021), and vertical profile investigations via drones and balloons (Ferrero et al., 2011, 2014; Pikridas et al., 2019; Kezoudi et al., 2021). Despite their limitations, multiwavelength aerosol absorption observations by filter photometers have proven suitable for the application of source and component apportionment models, such as the “Aethalometer model” (Sandradewi et al., 2008) to apportion BC between wood burning and fossil fuel combustion emissions or the Multi-Wavelength Absorption Analyzer (MWAA; Massabò et al., 2015; Bernardoni et al., 2017) algorithm, which enables the disentanglement of the BC and BrC components of LAAs as well as the determination of their radiative forcing (Ferrero et al., 2021a).
Surface in situ aerosol measurements can provide important information about aerosol characterization and concentration for the lowest tropospheric layer. However, estimating the vertical distribution of aerosol particles or their columnar load remains crucial to completely understand their impact on the climate system. In order to meet this need, a worldwide network of calibrated sun/sky photometers – the AErosol RObotic NETwork (AERONET; Holben et al., 1998) – was developed, with the goal of measuring aerosol optical columnar properties, e.g., aerosol optical depth (AOD) and column single-scattering albedo (SSA). Numerous studies have attempted to compare in situ observations with ground-based columnar aerosol optical properties and have provided different results depending on the atmospheric mixing state, the aerosol vertical profile and the local/regional pollution conditions. Several authors have used the ratio between the surface in situ aerosol mass concentration or aerosol absorption and the boundary layer height (i.e., they rescaled surface data over this atmospheric layer) and have shown how this ratio underestimated sun photometry observations of AOD or absorption AOD (AAOD), respectively (e.g., Bergin et al., 2000; Slater and Dibb, 2004; Aryal et al., 2014; Chauvigné et al., 2016; Chen et al., 2019). These findings were consistent across various types of locations (e.g., rural background, moderately polluted or marine) and highlighted that, in those settings, the main factors generally limiting the representativity of surface in situ measurements of the atmospheric column are the aerosol mixing within the boundary layer (BL) and the presence of aerosol above the BL, which can contribute significantly to the extinction and absorption in the column.
Datasets allowing a worldwide trend analysis of LAA levels remain limited (Laj et al., 2020); however, according to both in situ (Collaud Coen et al., 2020) and ground-based columnar (Li et al., 2014) observations, in the Northern Hemisphere, particularly in the US and Europe, the aerosol absorption coefficient (σap) has decreased over the last decade(s). More specific to the region of interest for our study, the Po Valley is a European hotspot for atmospheric pollution situated in northern Italy. Previous work focused on the Po Basin observed a decrease in both columnar AOD and in situ aerosol scattering and absorption in Ispra, on the northwestern side of the Po Valley, in the early 2000s (Putaud et al., 2014). This drop was consistent with a significant valley-wide decrease in in situ PM10 and PM2.5 ground levels (Bigi and Ghermandi, 2014, 2016), thanks also to a drop in primary PM emissions from vehicular transport. Similarly, a drop of ∼ 4 % yr−1 was recorded over the period from 1997 to 2016 for the elemental carbon content in fog samples at the rural background site of San Pietro Capofiume (Gilardoni et al., 2020b).
Significant aerosol sources other than traffic remain present in the valley, e.g., biomass burning for domestic heating for several compounds (including organic aerosols and BC) and farming for NH3 (a major PM precursor). Their role in PM levels was highlighted by the small decrease in PM across the basin (Ciarelli et al., 2021; Putaud et al., 2021) and in particle count in Modena (Shen et al., 2021) during the 2020 COVID-19 pandemic lockdown. Some studies in the Po Valley have addressed temporal and vertical variability in σap in Milan, the largest city in the basin (Ferrero et al., 2011, 2014; Vecchi et al., 2018). These authors found a decline in BC levels within the mixing layer, with higher BC levels observed at the ground (i.e., 50–100 m) and a marked drop (more than 50 %) above the mixing height, with BC contributing to ∼ 10 % (∼ 8 %) of the overall PM1 extinction (mass) at a Milan urban surface background site in winter. Other studies in the Po Valley focused on the effect of the reduction in NOx and NH3 on PM2.5 levels (Veratti et al., 2023) as well as on the impact of biomass burning on surface aerosols, particularly at the rural background site of San Pietro Capofiume and the urban site of Bologna (Gilardoni et al., 2016; Costabile et al., 2017; Paglione et al., 2020). These latter studies highlighted the large absorption Ångström exponents (AAEs; Moosmüller et al., 2009) for biomass burning organic aerosol, ranging from ∼ 3 to 5, mainly due to aged aerosols in the aqueous phase and related to an increase in the organic aerosol BC mass ratio. Previous investigations of the spatial variability in PM surface observations highlighted the impact of large urban areas on the aerosol load, particularly for PM10, using cluster analysis (Bigi and Ghermandi, 2014, 2016). A Europe-wide assessment of urban air quality by Thunis et al. (2017), based on a simplified dispersion model, estimated a 57 % contribution of in-city emissions to urban PM2.5 in Milan, making this city the one with the largest self-contribution to local PM2.5 across the European Union. Similarly the spatial variability in columnar aerosol load observed by ground-based remote-sensing instruments between Ispra and the Adriatic Sea, east of the Po Basin, showed larger AOD and lower SSA at the Ispra site (Clerici and Mélin, 2008), confirming the impact of in-valley combustion emissions.
Relying on these previous findings, the current study provides additional knowledge on LAAs in the Po Valley by investigating the temporal, spatial and columnar variability in σap in Modena, an urban area representative of several cities in the basin. The city of Modena is located in the southern central part of the Po Valley. The study period is winter 2020–2021, and the experimental dataset includes both in situ and ground-based columnar observations. Additionally, source apportionment of σap using the in situ and the ground-based columnar observations in Modena are compared to investigate the impact of low-level emissions and long-range transport on the aerosol optical properties, along with the first estimation of the LAA heating rate (HR) and its diurnal trend in Modena. Finally, more insight into the spatial and temporal variability in the different absorbing components in the Po Valley are provided by a comparison between columnar optical properties in Modena and Ispra. Below, we first describe the measurements that we will use and then address these topics.
Modena (44.6∘ N, 10.9∘ E; 32 m a.s.l., above sea level; ∼ 180 000 inhabitants) is located on the central southern side of the Po Valley, northern Italy, and is a basin surrounded by the Alps and Apennine mountains. The basin area is affected by recurrent atmospheric temperature inversions in winter and low-wind conditions, leading to a buildup of atmospheric pollutants. As a result, the Po Valley is one of the largest European regions exceeding the daily PM10 limits set by the European regulation (EC 50/2008) and by the World Health Organization (WHO) guidelines (WHO, 2021). The city is situated in a region with flat topography, 13 km north of the foot of the closest Apennine hills and 96 km south of the foot of the Alps, i.e., it is on the southern side of a wide (∼ 110 km) valley.
The latest bottom-up regional emission inventory for the Modena municipal area (ARPAE, 2020), reference year 2017, identifies traffic and domestic heating as the main PM10 sources, contributing 38 % and 58 % of the total emissions, respectively, although Modena also hosts a few districts for light manufacturing (Selected Nomenclature for sources of Air Pollution, SNAP 3 and 4), contributing 3 % of total PM10 emissions (Fig. 1). More specific to nonindustrial combustion (SNAP 2), most of buildings use compressed natural gas for both heating and cooking; thus, 99.4 % of SNAP-2 PM10 emissions are estimated to be produced by biomass combustion for domestic heating (ARPAE, 2020).
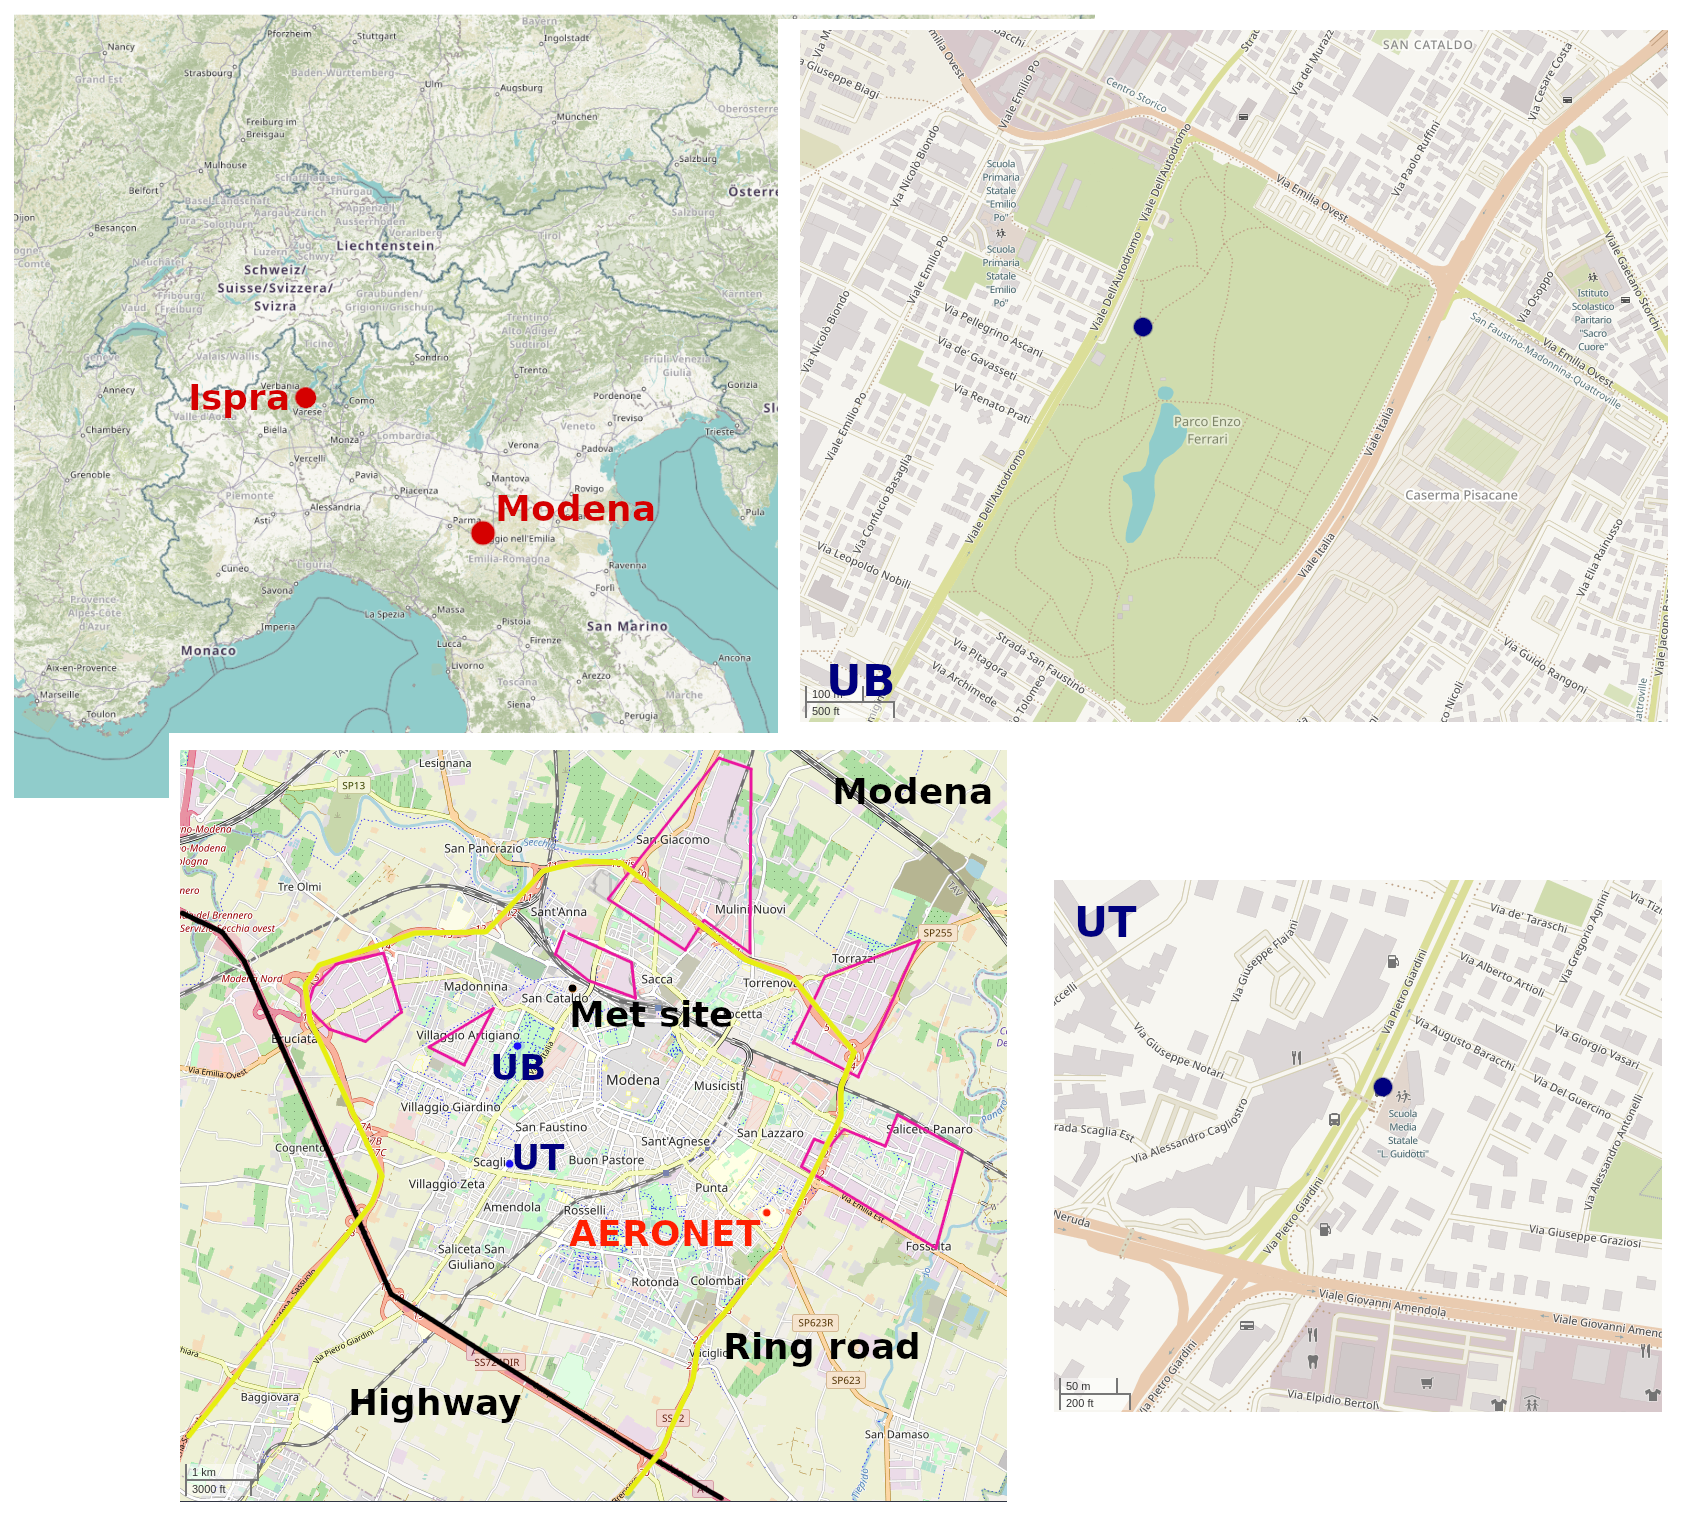
Figure 1Measurement site locations and settings. Areas outlined in purple indicate the manufacturing districts (© OpenStreetMap contributors 2023; distributed under the Open Data Commons Open Database License, ODbL, v1.0.).
As is common to most urban areas in the basin, vehicular traffic is the main source of NOx emissions (78 % of total NOx emissions; ARPAE, 2020), with a significant impact on local air quality (Ghermandi et al., 2020; Veratti et al., 2020) and on population exposure (Veratti et al., 2021). Modena's setting is quite representative of several midsize urban areas across the Po Valley, particularly in terms of traffic and domestic emission sources and topography.
2.1 In situ surface measurements
Two MA200 micro-Aethalometer instruments were installed in Modena, sampling from the gently heated ( ∘C) glassware manifold inlet lines already in use for reactive gas monitors at the two regulatory air quality monitoring sites in town: Giardini (EoI code IT0721A; 44.637∘ N, 10.906∘ E; 39 m a.s.l.) and Parco Ferrari (EoI code IT1771A; 44.652∘ N, 10.907∘ E; 30 m a.s.l.). These two sites are representative of urban traffic and urban background conditions, hereafter referred as UT and UB, respectively (see Fig. 1 for their locations). The UT site faces a major four-lane (two lanes in each direction) road, with estimated median daily traffic counts of ∼ 20 000 vehicles, whereas the UB is within Modena's largest urban park at a distance of ∼ 120 m from the nearest road. The inlet height at both sites is approximately 4 m above the ground. The inlet has no size cut, i.e., the instruments are sampling total suspended particles.
The MA200 instrument is a filter absorption photometer that measures at five wavelengths (λ= 375, 470, 528, 625 and 880 nm) using polytetrafluoroethylene (PTFE) filter tapes. The AAE for in situ observations (hereafter AAEi) was computed by a fit to absorption at all five wavelengths. The instruments were used in dual-spot sampling mode (1.09 and 1.10 firmware versions were installed during the study), and a compensation algorithm similar to the one proposed by Drinovec et al. (2015) was applied by the internal firmware. This firmware uses a multiple-scattering correction coefficient Cref=1.3, which was chosen by the manufacturer in order to mimic the response of the AE33 Aethalometer (AethLabs, personal communication, 2020).
Aerosol absorption monitoring at the UT site was performed between 19 January and 21 April in 2020 and between 9 November 2020 and 8 March in 2021 at a time resolution of 1 min. At the UB site, aerosol absorption was monitored between 4 February and 13 October in 2020 at a 1 min time resolution and between 13 December 2020 and 20 March in 2021 at a 5 min time resolution. In order to compensate for the occasionally low absorption readings at the latter site, the 1 min raw transmittance counts at the UB site were firstly aggregated to 5 min and then used to compute the corresponding σap via a transcription of the dual-spot compensation algorithm in the R programming language, as described in Drinovec et al. (2015). The MA200 measurements were screened depending on the status reported by the instrument. Flow calibration was performed before each filter change. The flow was set to 100 mL min−1 in winter and increased to 125 mL min−1 in summer due to the lower atmospheric concentrations. In the present study, only measurements from the winter months were analyzed, i.e., December, January and February. Strict lockdown restrictions in northern Italy due to the COVID-19 pandemic lasted from 8 March until 4 May 2020; therefore, the winter data reported here are representative of a business-as-usual scenario, partly spanning across two winter seasons. Absorption data were averaged to 1 h prior to the analysis in order to match the time resolution of the other analyzed variables.
A comprehensive uncertainty analysis for absorption observations by the MA200 has not yet been fully performed by the scientific community. Li et al. (2021) looked at the multiple-scattering uncertainty of its PTFE filter and suggested that multiple-scattering artifacts might lead to an overestimation of the absorption by BrC, with the bias dependent on the absorbing strength of the compound, i.e., a behavior qualitatively similar to that of the AE33 (Yus-Díez et al., 2021). Alas et al. (2020) performed a large intercomparison involving these devices, testing several MA200s (single-spot mode, 10 and 60 s time resolution) and highlighted a low unit-to-unit variability (ca. 2 %) across all wavelengths and good agreement (R2>0.93) for loading-corrected eBC when compared to the AE33. In the current study, an 8 % uncertainty was attributed to MA200 absorption, based on the mean standard error of the slope of the linear regression between the eBC by the MA200 and the AE33 found by Alas et al. (2020).
Regulatory air quality data were also available at the two sites and include NO, NO2, O3 (UB site only) and C6H6 (UT site only) at an hourly timescale. PM10 and PM2.5 (at UB site only) were also available, although at a daily timescale. The daily median (10th and 90th quantiles) PM10 concentration at the UB site over the period from 2017 to 2021 was 24 µg m−3 (13 µg m−3 and 57 µg m−3), while the same statistics for PM10 were 27 µg m−3 (14 µg m−3 and 63 µg m−3) at the UT site . Consistently, over the same period, hourly NO2 at the UB site showed lower levels than at the UT site, with the two locations having a median (10th and 90th quantiles) of 23 µg m−3 (6 µg m−3 and 50 µg m−3) and 35µg m−3 (14 µg m−3 and 66 µg m−3), respectively.
Direct traffic counts were also available for the urban area during the period of investigation. These data were collected by 400 induction loops for traffic light control within the urban and suburban street network. Continuous vehicle counts from the induction loops nearest to the UT and UB sites were aggregated into 1 h total traffic data; these hourly aggregates were primarily used to highlight variability in traffic patterns. The uncertainty in the count from these devices is approximately 10 % (Bellucci and Cipriani, 2010).
Meteorological variables were provided by the regional weather monitoring network station within the urban area of Modena and include wind speed and direction (WS and WD, respectively), atmospheric temperature (T), relative humidity (RH), downward global radiation (Q) and atmospheric pressure (p). The site is on the roof of the municipality offices at 40 m above the ground and is the highest weather station in the urban area with data available over the study period. These data provide indications of the wind conditions inside the urban canopy but may differ from wind conditions at the 4 m height of the MA200 measurements.
2.2 Mixing layer height
Hourly estimates of the mixing layer height (MLH) were provided by the ERA5 reanalysis (Hersbach et al., 2023). The ERA5 reanalysis, provided by the European Centre for Medium-Range Weather Forecasts (ECMWF), results from the data assimilation of global observations into the Integrated Forecast System (IFS), a global numerical weather prediction model, to produce a globally complete and consistent dataset of physical quantities, continuous in time and space. ERA5 provides hourly estimates for several geophysical quantities, including the MLH, at a grid resolution over the period from 1940 to today. For this study, we extracted the MLH at the ERA5 grid point with the following coordinates: 44.75∘ N, 11.00∘ W. Modena is about 14 km south of this grid point, i.e., it lays between two ERA5 grid points, as the size of the ERA5 cell is ∼ 20 km × ∼ 28 km in this region. The MLH was extracted at the aforementioned grid point because it is representative of a cell over an area with flat topography, i.e., very similar to the area of Modena. The MLH estimates from ERA5 are used in the analysis because no experimental estimates of the planetary boundary layer height were available in town, and the closest location with regular atmospheric sounding (at 12:00 and 00:00 UTC) is in San Pietro Capofiume, a rural background site surrounded by flat topography, 53 km east of Modena. The ERA5 estimate of the MLH in Europe was assessed to be underestimated by ∼ 54 m (∼ 19 m) on average (median) based on a comparison between ERA5 and daytime radiosoundings by Guo et al. (2021). This underestimate represents a lower-end estimate, as soundings in Europe are generally taken around 12:00 UTC, i.e., when the MLH is quite developed.
It is worth noting that deficiencies have been observed in various planetary boundary layer and surface parameterizations for conventional meteorological models, e.g., IFS, the Weather Research and Forecasting (WRF) model, and the Consortium for Small-scale Modeling (COSMO) model (Martilli et al., 2021; Maroneze et al., 2021; Lapo et al., 2019; Battisti et al., 2017), leading to a challenge with respect to the characterization of strong thermal inversions (Mahrt, 2014; Acevedo et al., 2019), like those occurring in the Po Valley. All of these meteorological models typically rely on a single stability parameter, e.g., the Richardson number or the turbulent kinetic energy, to automatically estimate the MLH based on fixed thresholds, regardless of the wide range of possible atmospheric conditions, as these models cannot apply ad hoc methods for each individual situation. More specific to this study, MLH estimates from the IFS are based on the bulk Richardson number (Vogelezang and Holtslag, 1996), regardless of the atmospheric stability conditions, and the MLH is defined as the lowest level at which the bulk Richardson number reaches the critical value of 0.25 (ECMWF, 2017).
2.3 Ground-based columnar measurements
Column-integrated measurements of optical properties of the Modena urban atmosphere were collected by a multi-channel Cimel CE318 sun/sky photometer installed on the roof of the “Enzo Ferrari” Department of Engineering at about 20 m above the ground. The instrument is part of NASA's AERONET network (Holben et al., 1998). This site, within the grounds of the University of Modena and Reggio Emilia and representative of residential background conditions, is on the southeastern edge of the urban settlement, whereas the UB and UT sites are on the west side of the town at a distance of 4km and 3.5kmfrom the sun/sky photometer location, respectively (Fig. 1).
In our analysis of the Cimel data, we considered both Level-2.0 and Level-1.5 version 3 almucantar retrievals at four wavelengths (λ= 440, 675, 870 and 1020 nm) (Sinyuk et al., 2020). Level-2.0 absorption data are more robust (e.g., Dubovik et al., 2000), but Level-1.5 data provide more matches with surface measurements, as discussed below. The almucantar retrievals provide several columnar properties, including absorption aerosol optical depth (AAOD), SSA, the depolarization ratio and the lidar ratio at the four wavelengths, as well as the particle volume size distribution and AOD apportioned to submicron and supermicron aerosols from which the fine-mode fraction (FMF) is calculated (O'Neill et al., 2003). AERONET retrievals also allowed the estimation of the scattering for each of the four wavelengths, the wavelength dependence of SAOD, i.e., the column scattering Ångström exponent (hereafter SAEc), and the column absorption Ångström exponent (AAEc).
There is much information in the literature about the uncertainty in AERONET products (e.g., Eck et al., 1999; Andrews et al., 2017; Sinyuk et al., 2020; Kayetha et al., 2022). A fixed AOD uncertainty set to 0.01 was used, following Eck et al. (1999). For the current study, an AOD-dependent uncertainty in SSA at 440, 675 and 875 nm for AERONET v3 retrievals was estimated based on the data from an urban site in Sinyuk et al. (2020), ranging from 0.017 at 440 nm when AOD440 is 0.7 to 0.103 at 870 nm when AOD440 is 0.03. The overall uncertainty for the analyzed aerosol parameter, e.g., AAOD, was estimated as a propagation of the uncertainties of AOD and SSA and ranged between 0.011 and 0.033.
In addition, the direct radiative effect (DRE) at the top of the atmosphere (TOA) and bottom of the atmosphere (BOA), retrieved by AERONET under clear-sky conditions in winter, were considered. As the atmospheric aerosol is characterized by a significant absorptive capacity, the difference between the DRE at TOA and BOA (hereafter ΔDREatm) represents the instantaneous radiative power density absorbed along the atmospheric column by the aerosol within that atmospheric layer (Chakrabarty et al., 2012; Kedia et al., 2010). ΔDREatm is expressed in watts per square meter (W m−2), which is the common metric used in the literature to quantify the integrated radiative power density absorbed by the aerosol in the atmosphere (Kedia et al., 2010; Das and Jayaraman, 2011; Bond et al., 2013; Heald et al., 2014). However, as demonstrated in Ferrero et al. (2014), a more useful parameter is the absorptive DRE (ADRE) of atmospheric aerosol, which can be computed simply by normalizing ΔDREatm by the atmospheric thickness Δz hosting most of the LAA; this thickness in the Po Valley can be generally assumed to correspond to the MLH. The ADRE represents the radiative power absorbed by the aerosol per unit volume of atmosphere (W m−3). The advantage of using ADRE in the Po Valley environment in wintertime is that, in this case, most of the AOD signal is built up within the mixing layer, as shown by both Ferrero et al. (2019), who found that up to 87 % of the AOD signal in Milan was generated within the mixing layer, 8 % was generated in the residual layer and 5 % was generated in the free troposphere, and by Barnaba et al. (2010), who found similar figures at the Ispra background site. This means that, if the thickness Δz is the MLH, the ADRE will refer to the MLH with an expected maximum overestimation of approximately 13 % (i.e., roughly the amount of the aerosol optical depth above the MLH). From the ADRE, the instantaneous heating rate (HR, K d−1) can be computed as follows (Ferrero et al., 2014):
where ρ is the air density and Cp (1005 J kg−1 K−1) is the isobaric specific heat of dry air. The most important advantages of this AERONET-based approach to derive the LAA HRs are as follows: (a) the possibility of obtaining a rapid HR estimation to investigate the HR temporal evolution during a selected time period and (b) the possibility of deriving the HR using a well-established network (AERONET), allowing a global comparison of the output. This approach is limited because HR can be obtained directly by the AERONET retrievals only if most of the AOD signal is built up within the mixing layer (thus with an expected overestimation of ∼ 13 %). Due to these limitations, the analysis of the HR is limited to retrievals collected on days without a significant dust content. This screening process followed the same process used for in situ data described in Sect. 2.4.1, as the apportionment of in situ data suffered from a similar limitation to that of the HR analysis.
Furthermore, in some of the analysis described below, the in situ and columnar data were compared, requiring temporal matching of the two datasets. An in situ–columnar observation match is considered successful when the AERONET retrieval occurred during the hourly averaged in situ measurement. Level-1.5 version 2 AERONET data are known to have large uncertainty when AOD at 440 nm (AOD440) is less than 0.4 (Dubovik et al., 2000). In order to maximize the availability of columnar measurements for the analysis, Level-1.5 data were used. Level-1.5 data points with AOD440≤0.2 were discarded from the analysis, and the data remaining after the AOD screening are referred to as “L1.5*” in what follows.
2.4 Source apportionment of in situ and columnar data
Both in situ and columnar data were apportioned according to the aerosol spectral properties, i.e., solving the balance of the aerosol absorption based on its dependence on the AAE, on the absorbing species and on the wavelengths. Two different apportionment approaches were used for the in situ and the columnar observations, although based on the same foundation. The approach applied to the in situ data requires at least five wavelengths to ensure stability (Bernardoni et al., 2017).
2.4.1 In situ apportionment
In situ aerosol absorption σap was apportioned to species (black carbon and brown carbon, referred to as and , respectively) and sources (fossil fuel and biomass burning combustion, referred to and , respectively) using the Multi-Wavelength Absorption Analyzer (MWAA) model (Massabò et al., 2015; Bernardoni et al., 2017). This model assumes an equivalence between the absorption Ångström exponent (AAE; Moosmüller et al., 2009) of BC and that of fossil fuel (AAE AAE), and it assumes biomass burning to be the only source of BrC. Under these hypotheses, the MWAA model assumes that both the following equations hold for the total σap(λ) at each wavelength:
In Eqs. (2) and (3), AAE AAE was set, based on the AAEi computed over five wavelengths during morning rush hour on winter weekdays at the UT site, consistent with fresh, uncoated BC particles (e.g., Liu et al., 2018). The AAEi for BrC was determined by a preliminary nonlinear fit of Eq. (2), performed treating AAE as a free parameter (and resulting in an average AAE); AAE was set based on data from the literature for the Po Valley (Bernardoni et al., 2011, 2013; Costabile et al., 2017; Vecchi et al., 2018). A and B were then obtained for each sample via a multiwavelength fit of Eq. (2) (after fixing AAE), and A′ and B′ were obtained via a multiwavelength fit of Eq. (3). It is noteworthy that the MWAA model neglects possible contributions from mineral dust. To limit uncertainties resulting from this, the days with a significant dust load were discarded prior the application of the MWAA model to the in situ data (i.e., whenever the in situ apportionment data are presented throughout the text, they have been screened for dust). Days with a significant dust content were first identified for the atmospheric column, using the particle volume size distribution estimated by the AERONET inversion (Sinyuk et al., 2020); the identification of dust events was performed qualitatively, based on the retrievals having a dominant coarse mode (e.g., Fig. S7b in the Supplement). These retrievals were subsequently double-checked by 72 h Hybrid Single-Particle Lagrangian Integrated Trajectory (HYSPLIT) back trajectories using Global Data Assimilation System (GDAS) 1∘ resolution wind fields. Additionally, the impact of dust at the ground level was assessed based on the daily PM2.5 / PM10 ratio from the in situ measurements (Fig. S1), with a ratio of ≤0.5 as a qualitative threshold for a dust event. For reference, the daily PM2.5 / PM10 ratio in winter between 2017 and 2021 at the UB site had a median of 0.71 and a 10th (25th) quantile of 0.53 (0.62), i.e., the two aerosol fractions are quite similar, as previously observed at most UB sites across the basin (Bigi and Ghermandi, 2016).
2.4.2 Columnar apportionment
The AAOD was apportioned to BC, BrC and mineral dust using the approach proposed in Bahadur et al. (2012), i.e., by directly solving the system of Ångström equations (see Appendix A) using the AERONET almucantar L1.5* retrievals. The system includes Eq. (A1), describing the additive contribution of the AAOD from each species to the total AAOD, and Eq. (A2), describing the exponential dependence of the AAOD on the wavelength. This apportionment method neglects the mixing state of absorbing species (i.e., the aerosol is assumed to be externally mixed) and assumes that the observed AAOD is representative of a well-mixed sample of these species. Bahadur et al. (2012) estimated globally valid ranges of the AAEc and SAEc for BC, BrC and dust, parameters needed to solve the system of AAE equations, based on long-term, worldwide AERONET observations (Level 2.0 version 2).
For the current study, a tailored estimate of the AAEc values for Modena was performed, based on the full time series of AERONET retrievals in Modena (from January 2000 to June 2021). The classification of aerosol species (BC, BrC and dust), in order to estimate their AAEc values, was performed by combining the approaches of Bahadur et al. (2012), Cazorla et al. (2013) and Shin et al. (2019). Cazorla et al. (2013) suggests threshold values for SAEc and AAEc across the 440–675 nm range (hereafter SAE1c and AAE1c, respectively), which were applied for a preliminary classification (Fig. S2). Shin et al. (2019) combined the particle linear depolarization ratio and the lidar ratio at 1020 nm into a dust ratio coefficient χd,λ, estimating the contribution of dust and non-dust aerosol to the AOD. Following Bahadur et al. (2012), in order to disentangle the spectral properties of fossil fuel and biomass burning aerosol, first AAEc for dust was assessed using the full L1.5* time series (259 data points), based on the conditions SAE1c<1, AAE1c>1.5 and . As the major source of biomass burning in the Po Valley is domestic heating during winter, AAEc for BC was estimated based on the full time series of summer L1.5* retrievals (1752 data points). The conditions applied in this case were SAE1c>1.2 and AAE2 AAE1c>0.8, with an index of 1 indicating the range 440–675 nm and an index of 2 indicating the range 675–880 nm (Bahadur et al., 2012). Then, the AAEc for BrC was computed by solving the AAE equation system on the L1.5* non-dust winter retrievals over the period from 2015 to 2022 (89 data points). The AAEc values for BC and BrC are based on datasets with different sizes, as fewer retrievals are available in winter due to the shorter daytime duration and clouds; to limit the possible bias induced by this difference in sample size and by the potential presence of outliers, the median ± median absolute deviance values of the AAEc for dust, BC and BrC were computed for both Modena and Ispra (see below) and are reported in Table 1. Table 1 also includes values of column AAEc from the literature for different absorbing aerosol types for comparison.
Bahadur et al. (2012)Bahadur et al. (2012)Dubovik et al. (2002)Giles et al. (2012)Russell et al. (2010)Zhang et al. (2022)Mallet et al. (2013)Kayetha et al. (2022)Zhu et al. (2021)Table 1Summary of the columnar absorption Ångström exponent (AAEc) for BC, BrC and dust from this work and other studies in the literature. Rows are organized by wavelength.
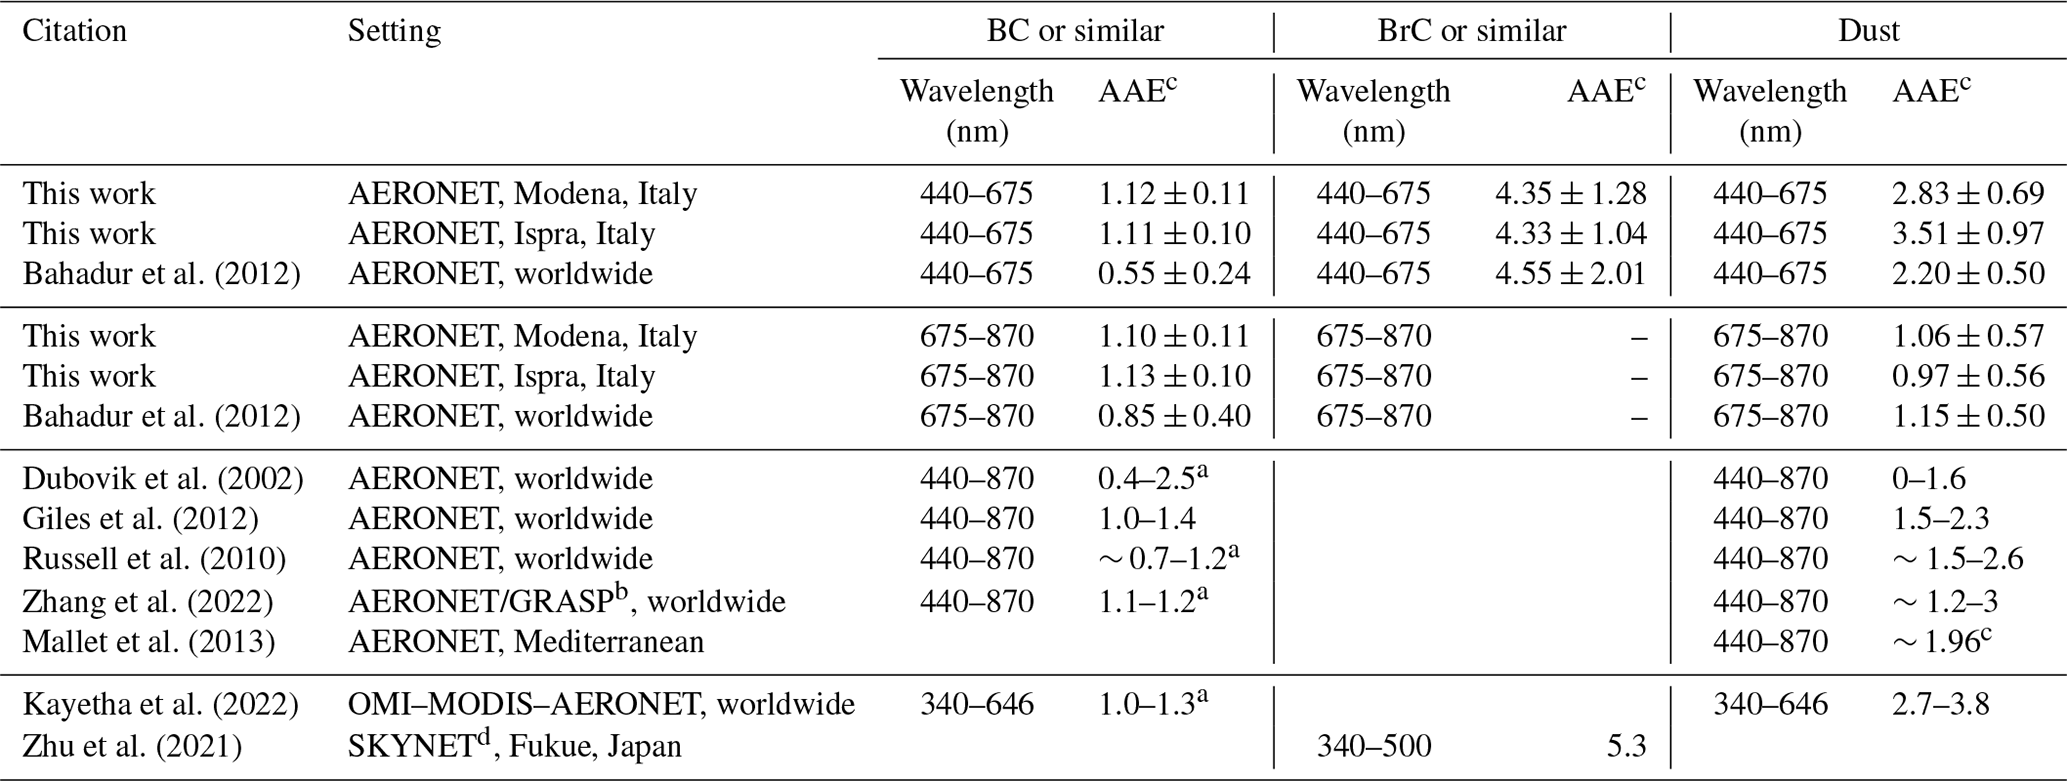
a These values generically refer to “urban/industrial/polluted aerosol”, i.e., potentially from a mixture of BC and BrC.
b GRASP: Generalized Retrieval of Aerosol and Surface Properties (Dubovik et al., 2014).
c These values generically refer to “dusty sites”.
d SKYNET is a worldwide network of sun/sky photometers (Nakajima et al., 2020).
To assess the representativity of the AAEc values derived for Modena, sun/sky photometer retrievals in Modena were also compared to AERONET data from Ispra (45.80∘ N, 8.63∘ E; 220 m a.s.l.; 225 km northwest of Modena) collected by a second Cimel CE318 sun/sky photometer within the AERONET network. Ispra exhibited a SAE AAEc matrix very similar to that observed in Modena (not shown). The resulting AAEc values for BC, BrC and dust in Modena and Ispra (Table 1) are consistent with most of the existing literature and the variability reported therein (e.g., Russell et al., 2010; Bahadur et al., 2012; Giles et al., 2012; Kayetha et al., 2022).
Finally, with reasonable confidence in the tailored AAE values for the different absorbing components, each AERONET retrieval at Modena and Ispra was apportioned by summarizing the solutions of the equation system as described by Bahadur et al. (2012). The apportionment was performed using the following two-step procedure, based on the assumption that AAEc followed a normal distribution featured by the parameters in Table 1:
-
step 1 – random extraction of AAEc for all species at all wavelengths;
-
step 2 – direct solution of the system of Ångström equations.
Steps 1 and 2 were repeated 104 times for each retrieval in order to develop statistics of the AAEc combination that provides a solution to the system. The time series of median AAEc values was fairly stable over the measurement period at both sites, except during an intense episode of dust transport during which the AAEc for BrC increased significantly and AAE2c for dust dropped (Fig. S3). Both AAEc for BrC and AAE2c for dust values were on the tails of their respective distributions. It is worth noting that AAEc refers to BC and not to eBC, as it results from a direct estimate of the absorption wavelength dependence of aerosol particles while suspended in air.
3.1 Diurnal patterns for the in situ data
Figure 2 shows the medians and interquartile ranges of atmospheric species obtained from in situ observations along with the hourly traffic count from the induction loops closest to each monitoring site for winter (December, January and February) from early 2020 until March 2021. These data are screened for days with a non-negligible dust load, as specified in Sect. 2.4.1. The σap at 528 nm for winter weekdays (Monday through Friday) and winter holidays (i.e., Sundays and local and national holidays) is in the top panel of Fig. 2 and represents the absorption by aerosol at about 4 m above the ground. Saturdays are excluded due to their mixed signal between a holiday and a weekday. The pattern of absorption apportionment components at 880 nm is also shown, followed by NO, NO2, O3 (UB only) and C6H6 (UT only). Figure 3, based on the same dataset as Fig. 2, displays the share of σap at 375 nm due to BC from fossil fuel, due to BC from biomass burning and due to BrC, along with the variability in AAE over the 375–880 nm range. The medians and interquartile ranges for meteorological variables over the same period are shown in Fig. 4, while the hourly wind rose is shown in Fig. S4. Overall median and interquartile ranges for the dataset in Fig. 2 (i.e., with dust screening) and Fig. 4 are shown in Tables 2 and S1 in the Supplement, respectively.
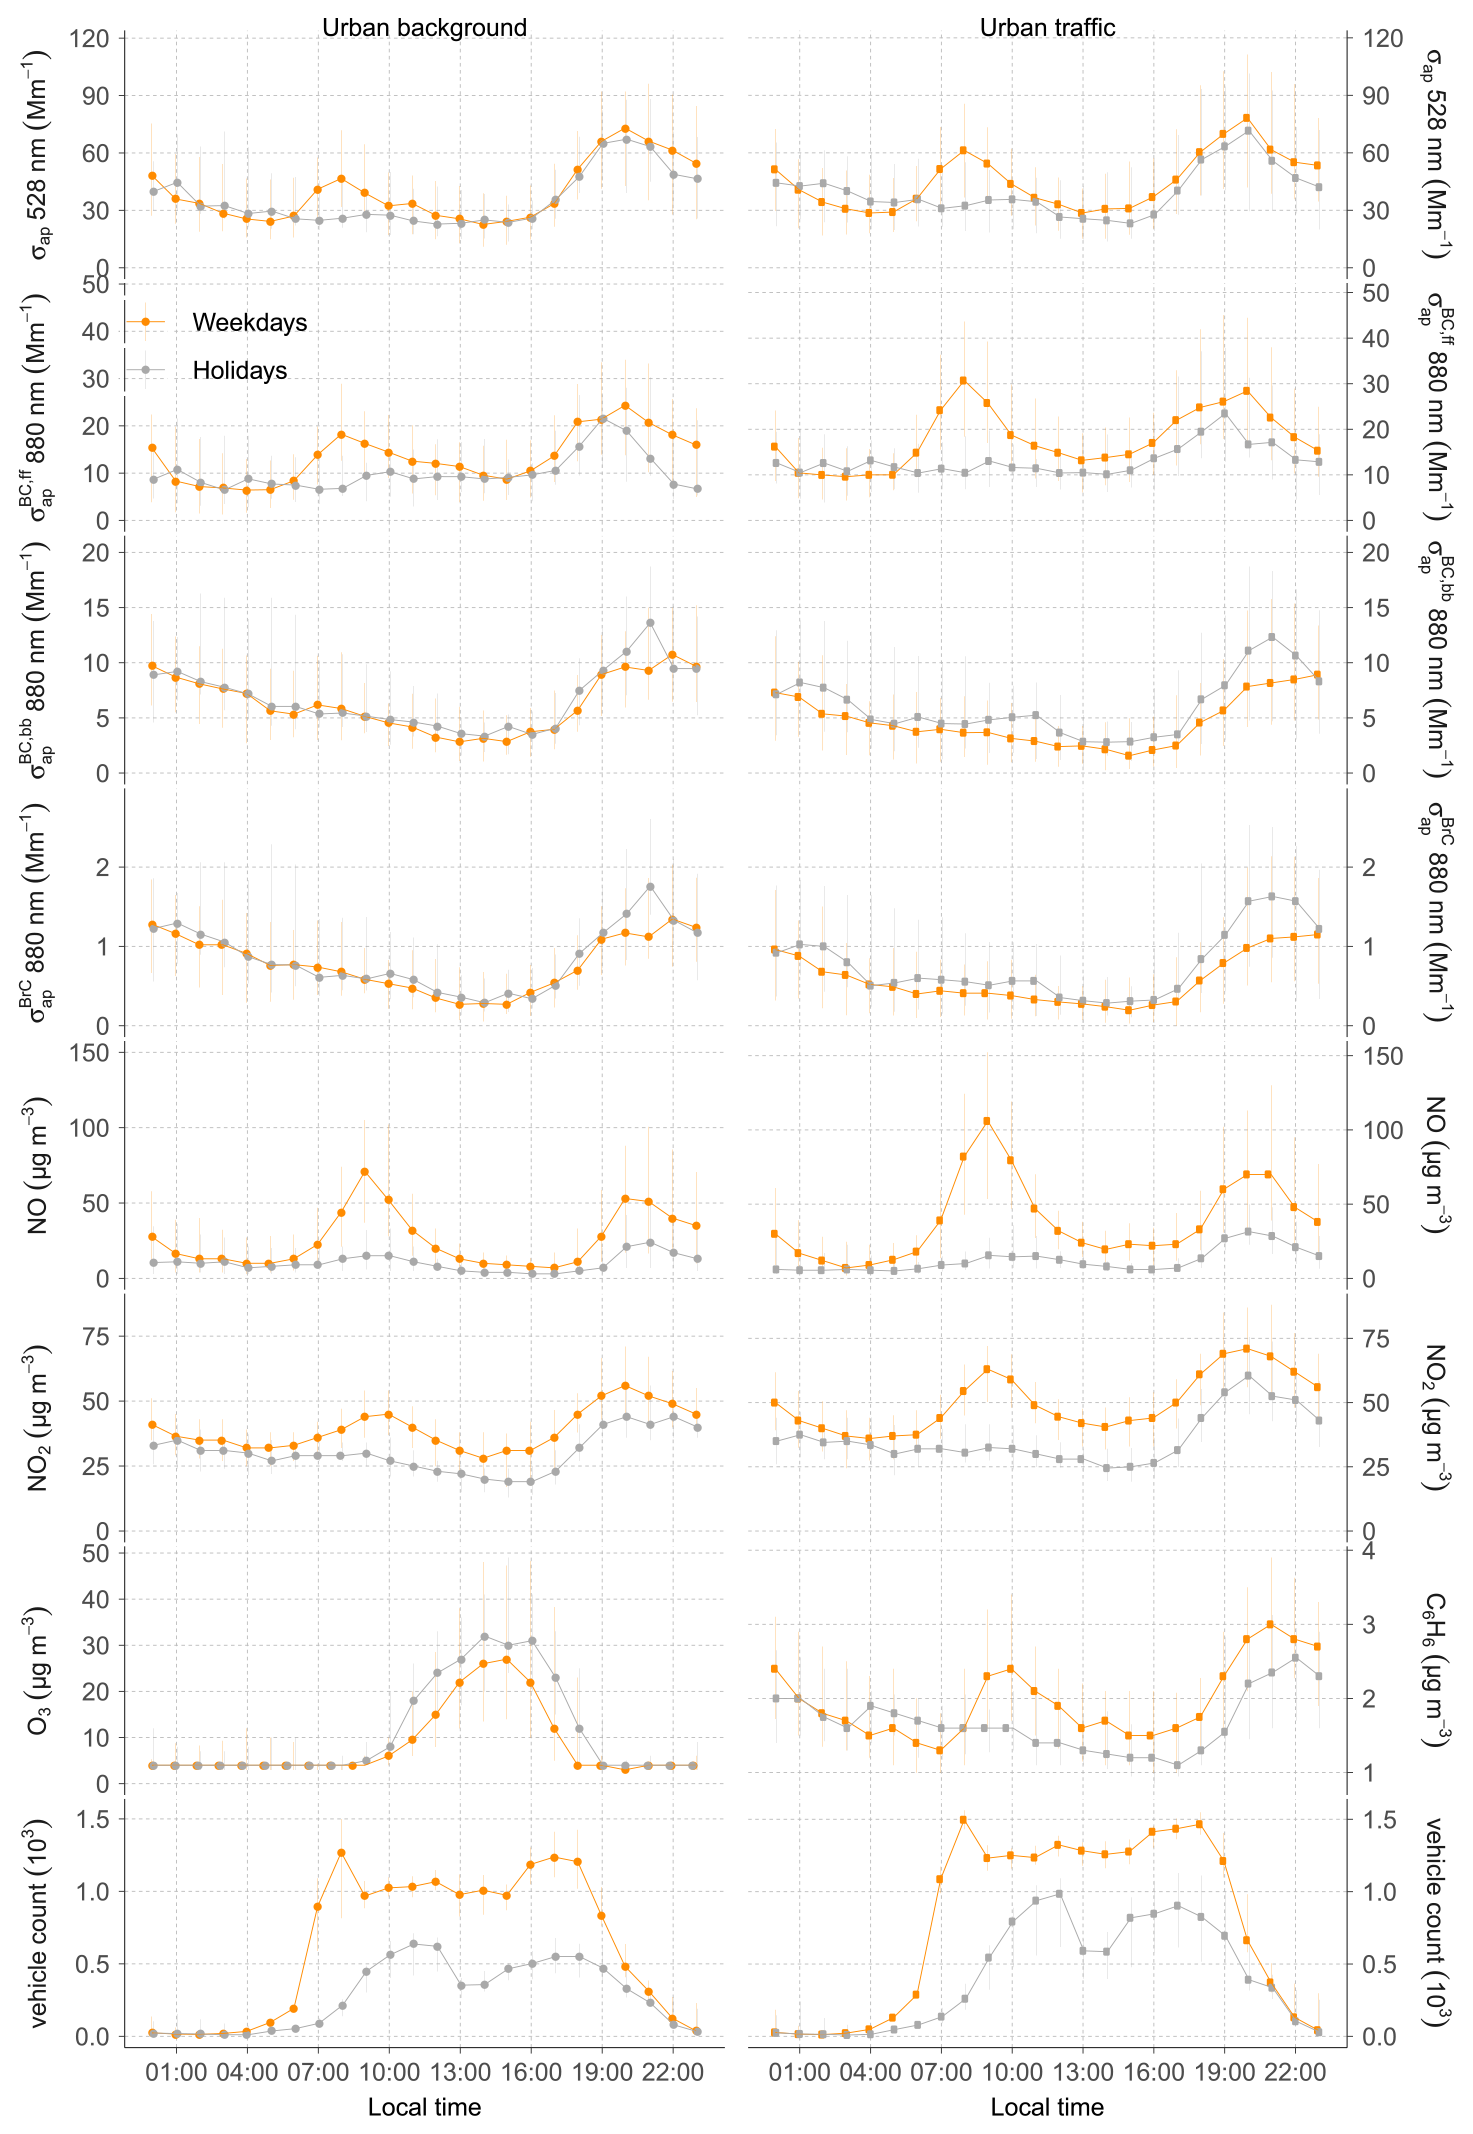
Figure 2Diurnal pattern of the median and the interquartile range values for total σap at 528 nm, the apportioned σap at 880 and regulatory gas compounds at the urban background (left) and urban traffic (right) air quality monitoring sites on weekdays (orange) and holidays (gray).
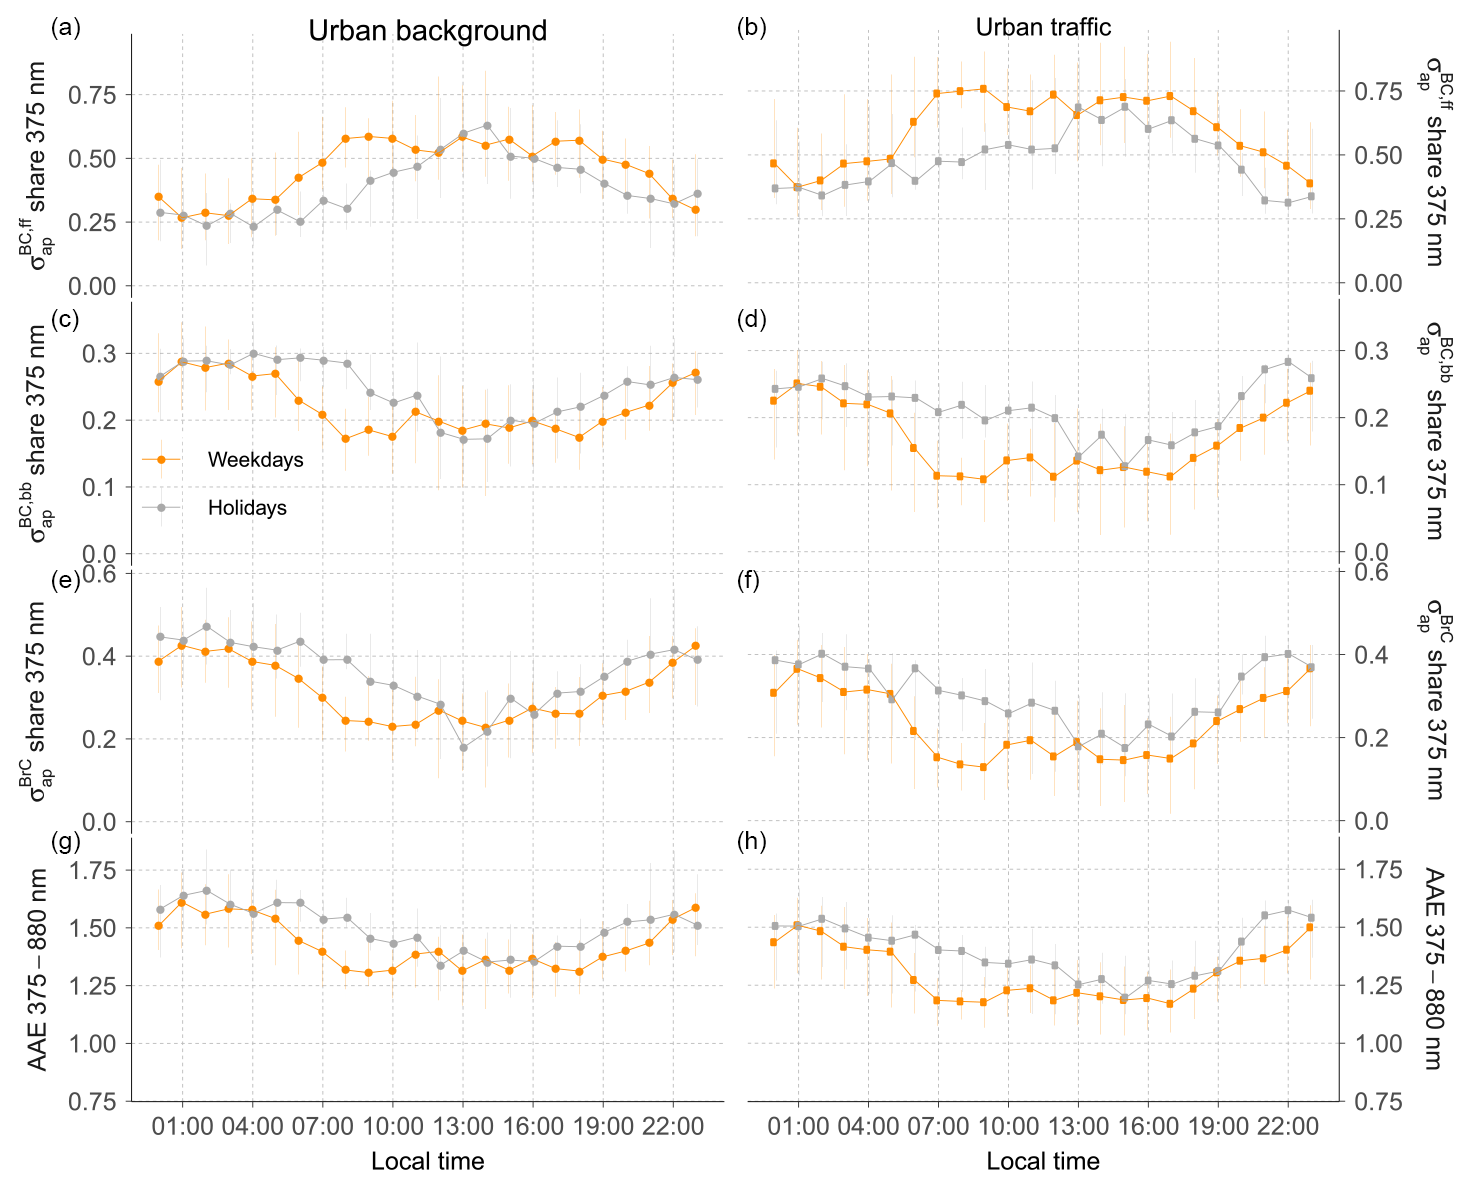
Figure 3Diurnal pattern of the median and the interquartile range values for apportioned σap at 375 nm and of the AAE (375–880 nm) at the urban background (a, c, e, g) and urban traffic (b, d, f, h) air quality monitoring sites on weekdays (orange) and holidays (gray).
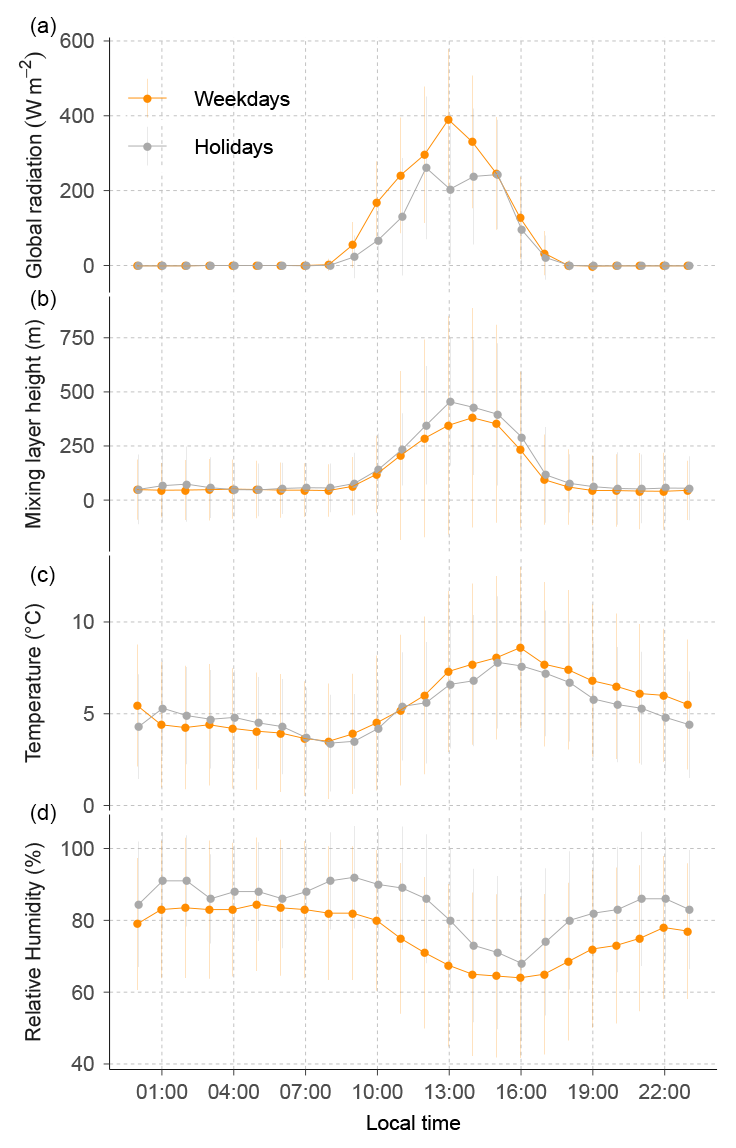
Figure 4Diurnal pattern of the median and the interquartile range values of meteorological variables in winter (December–January–February) during weekdays and holidays. All variables stem from an urban meteorological station except the mixing layer height, which is provided by the ERA5 reanalysis.
Table 2Summary of atmospheric species and the traffic volume for the urban background (UB) and the urban traffic (UT) sites, showing the median (Med) and the 25th and 75th quantile (25Q and 75Q, respectively) values.
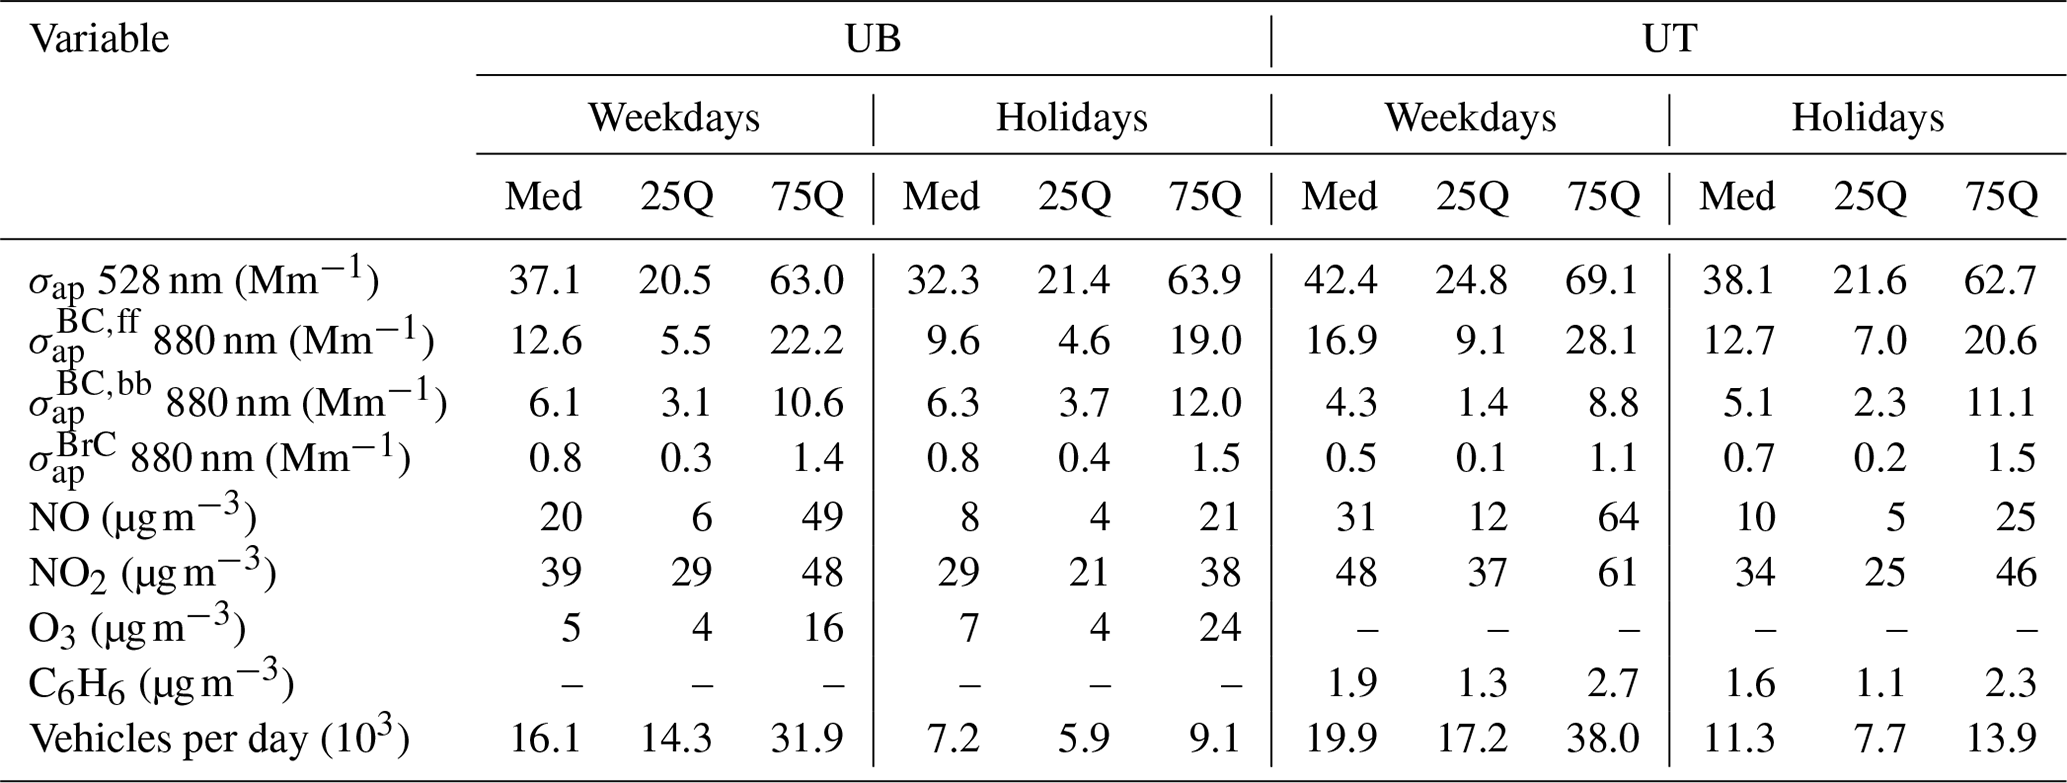
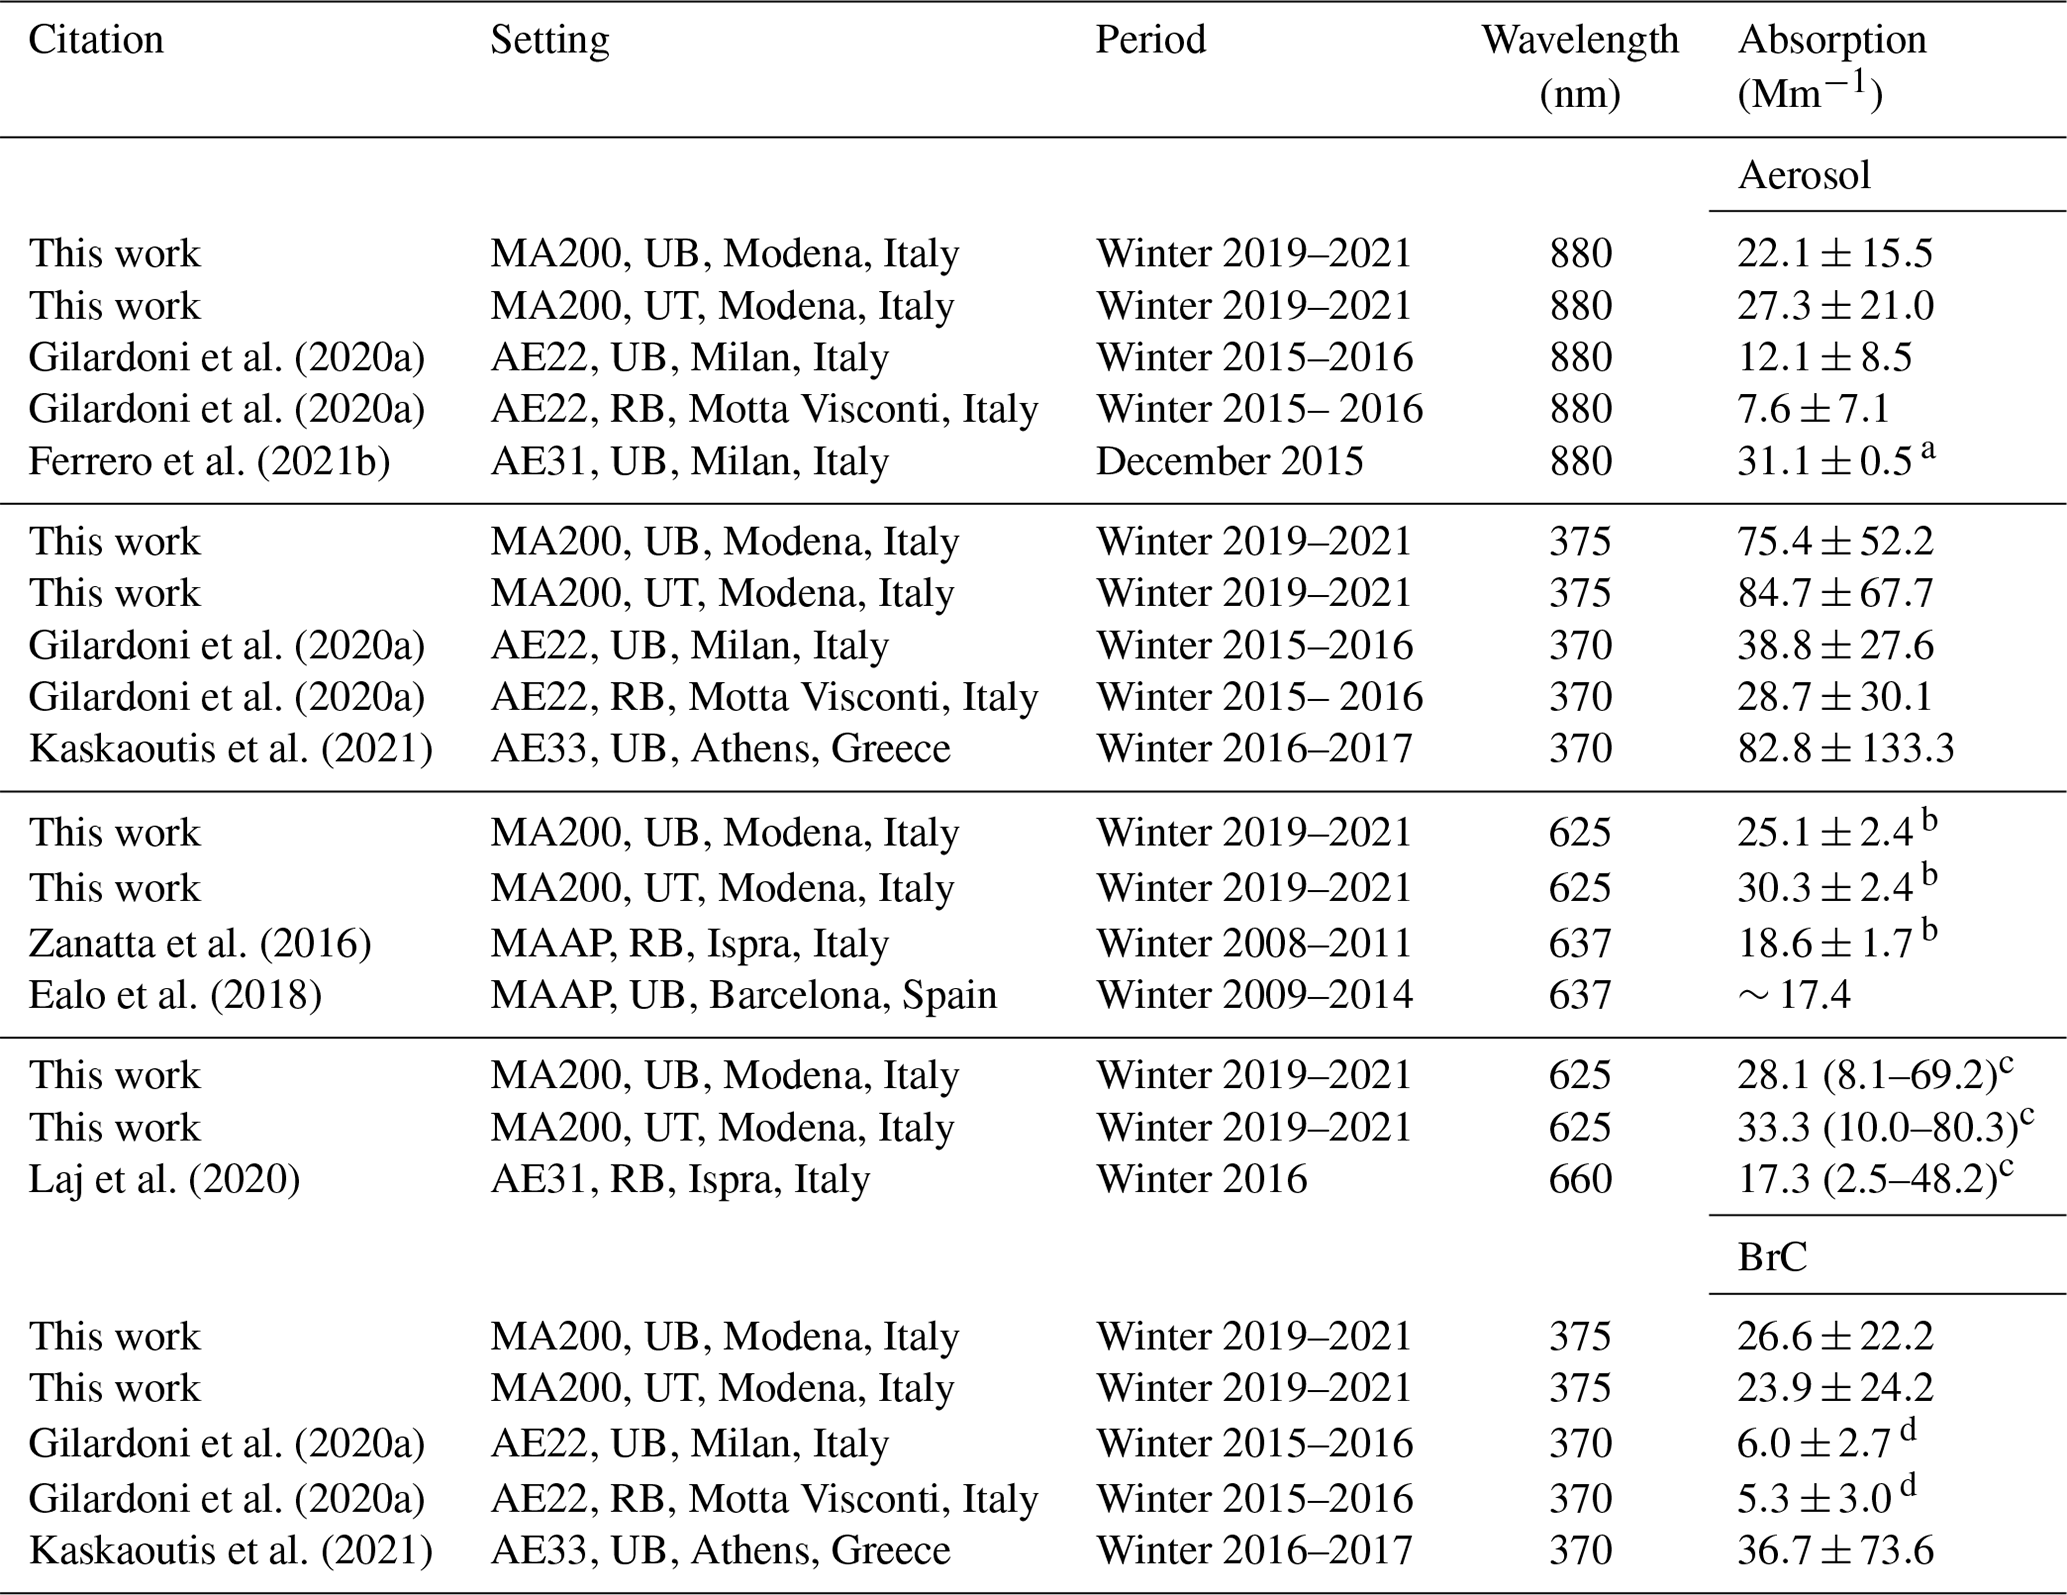
Table 3 reports a comparison of aerosol and BrC absorption reported by this and other studies at a few Po Valley sites. Values in Modena are generally higher than those reported in urban background Milan and the rural background sites of Motta Visconti and Ispra (Ferrero et al., 2021b; Gilardoni et al., 2020a; Laj et al., 2020; Zanatta et al., 2016). The data from these earlier studies come from filter absorption photometers, either Multi-Angle Absorption Photometer (MAAP) or Aethalometer instruments, with the latter instrument being corrected for multiple-scattering-induced bias based on co-located observations. For example, in Gilardoni et al. (2020a), a Cref=3.0 based on Collaud Coen et al. (2010) was used to correct AE22 absorption. Compared with other southern European urban sites, Modena recorded larger σap at 660 nm than Barcelona (Ealo et al., 2018) but lower σap at 375 nm than Athens (Greece), mainly due to the large impact of biomass burning emissions in this city (Liakakou et al., 2020; Katsanos et al., 2019). A similar pattern is observed for BrC absorption. No MAAP co-location was available for the two MA200 instruments in Modena, leading to a larger uncertainty in their absolute readings; however, these two units showed good agreement with a MAAP during a BC intercomparison in urban background Athens (Stavroulas et al., 2022), where they exhibited a linear slope of 1.00 (R2=0.92) in winter and 1.07 (R2=0.92) in summer.
Gilardoni et al. (2020a)Gilardoni et al. (2020a)Ferrero et al. (2021b)Gilardoni et al. (2020a)Gilardoni et al. (2020a)Kaskaoutis et al. (2021)Zanatta et al. (2016)Ealo et al. (2018)Laj et al. (2020)Gilardoni et al. (2020a)Gilardoni et al. (2020a)Kaskaoutis et al. (2021)Table 3Summary of the mean ± standard deviation of absorption for aerosol and BrC based on this work and other studies in the literature. Rows are organized by wavelength. UB, UT and RB stand for urban background, urban traffic and rural background, respectively.
a The 95 % confidence interval of the mean.
b The geometric mean ± geometric standard deviation.
c The median (10th–90th quantile).
d The BrC determined on methanol extraction.
The diurnal pattern in the absolute levels of fossil fuel combustion species (Fig. 2) exhibits a similar pattern. There is an initial increase during the morning rush hour (08:00–10:00 LT, local time), followed by a drop at midday due to the dilution induced by an increased MLH depth despite the steady traffic rate. A second increase occurs at 18:00 LT, followed by a drop at approximately 20:00 LT that is delayed compared with the drop in traffic, possibly because of the shallow MLH in the evening or because of frequent thermal inversions at ground level. More specifically, on weekday evenings, peaks at 20:00 LT, 1 h later than on holidays, at both UB and UT, with the former site recording levels higher in the evening than in the morning.
This main pattern is followed by all atmospheric species except for secondary pollutants (e.g., O3) and aerosols related to biomass burning (e.g., and ). The pattern features higher concentrations on weekdays than during holidays at both sites, as shown by the 7 %–240 % increase on weekdays, similar to the 230 %–250 % increase in traffic, confirming a major and local fossil fuel combustion source of direct origin. For most of these species, the absolute interquartile range (IQR) is larger on weekdays than during holidays. For gas-phase compounds, the IQR increased on weekdays, from 8 % for NO2 at the UT site to 160 % for NO at the UB site. For absorption, the largest increase in the IQR (a 56 % increase) occurred for at the UT site. The difference in variability between weekdays and holidays might be partly driven by the larger variability in fossil fuel combustion emissions during the former, along with the larger count of weekdays compared with holidays in the statistics.
and exhibit a diurnal pattern featuring an increase from 17:00 to 23:00 LT, possibly triggered by the decrease in both the MLH and T, leading to the condensation of semivolatile organics and to an increase in biomass burning emissions. A similar diurnal pattern for BrC absorption was observed in UB Milan and RB Po Valley sites (Gilardoni et al., 2020a) as well as in the UB in Athens (Liakakou et al., 2020; Kaskaoutis et al., 2021). The weekly pattern for these two species is larger at the UT site, with an increase in the overall median values of and of 22 % and 35 % during holidays, respectively, along with an increase in their respective IQRs of 16 % and 28 %.
The share of absorption at 375 nm for the three apportioned species (Fig. 3) shows a distinct diurnal and weekly pattern at the UT site, with and being ca. 37 % larger during holidays, in contrast to which is 32 % larger on weekdays. The UB exhibited a similar pattern, although with lower intensity. The holiday increase in biomass burning aerosol is probably linked to the longer period spent at home compared with weekdays and to a large recreational use of biomass burning in town, where most houses use compressed natural gas for domestic heating and cooking (99.4 % of SNAP-2 PM10 emissions in Modena are from biomass combustion for domestic heating according to ARPAE, 2020). The diurnal pattern of the share of absorption from at 375 nm is similar to the diurnal traffic count cycle, exhibiting larger values during weekdays and at the UT site. This supports the results of the apportionment and the hypothesis of the role of the MLH in the evening enhancement of absorption.
O3 exhibits a “weekend effect” (Cleveland et al., 1974), common to most urban areas in Europe with a VOC-limited regime, i.e., ozone rises earlier in the morning on holidays due to the lower NOx levels, leading to a more efficient photocatalytic cycle, and drops later in the evening due to the (later) increase in NOx.
Atmospheric heating by aerosols based on σap values in Modena was estimated by determining the HR from AERONET data, as detailed in Sect. 2.2. Figure 5a shows the complete HR time series obtained over Modena during the investigated period. Under an average (standard deviation) irradiance value of 386 (143) W m−2, the average (standard deviation) HR was 1.61 (1.58) K d−1. This value is consistent with data from Milan for wintertime, under clear-sky conditions, where a mean (± mean confidence interval) of 1.68±0.04 K d−1 was found, when the incoming radiation was similar (441±148 W m−2). This latter point is important, as AERONET data are mainly available under clear-sky conditions; thus, the obtained HR data represent the upper limit for the site. In the Po Valley, the HR was shown to decrease by ∼ 12 % for every okta of sky covered by clouds (Ferrero et al., 2021b). With respect to the HR diurnal pattern, Fig. 5b shows the mean diurnal pattern of irradiance and HR under clear-sky and cloudy conditions. The incoming radiation peaked at 529±55 W m−2 at 13:00 LT (Fig. 5b), while σap peaked between 08:00 and 10:00 LT (Fig. 2). This causes an asymmetric HR diurnal pattern, characterized by a fast increase to the maximum at 11:00 LT (1.83±0.84 K d−1) and a subsequent slower decrease till sunset (Fig. 5b), as is common under clear-sky conditions (Ferrero et al., 2018, 2021b).
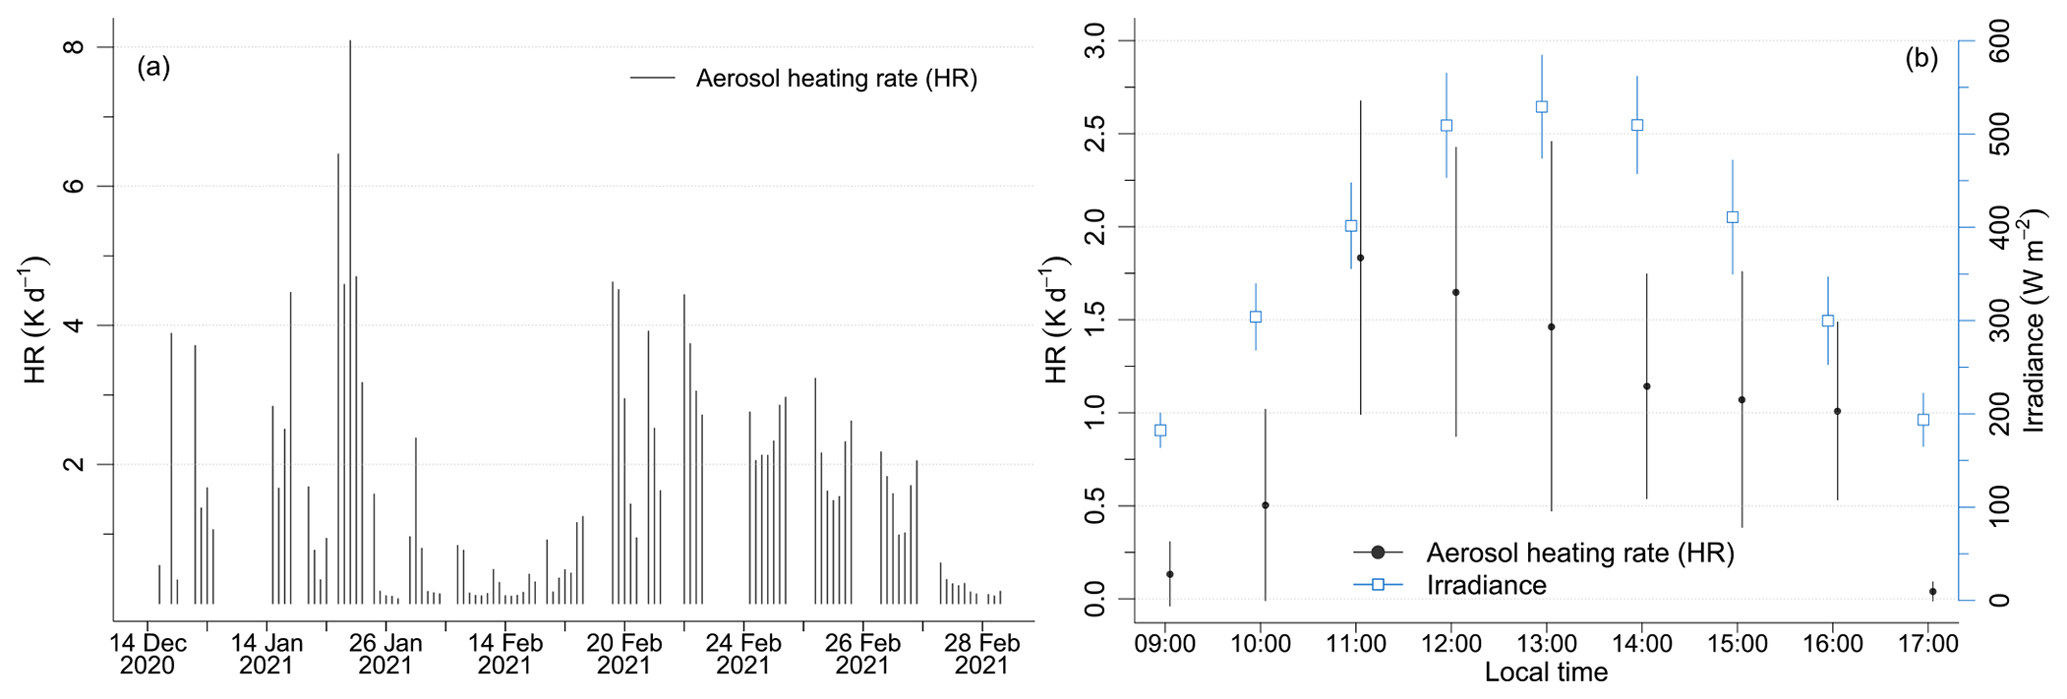
Figure 5Time series (a) and diurnal pattern (b) of the aerosol heating rate (HR) at Modena from AERONET retrievals.
The wind pattern in Modena features a mild mountain–valley breeze system along the Po Valley longitudinal axis, superimposed on the local wind circulation. During the investigated winter period, calm wind conditions (speed lower than 1 m s−1) occurred 25 % of the time and an overall wind speed average of ca. 1.5 m s−1 was recorded. Northwesterly winds, blowing from the higher side of the valley, dominated during daytime hours (11:00–17:00 LT) and were associated with the highest wind speed (occasionally above 9 m s−1). The rest of the day featured local west–southwesterly low winds (wind speeds lower than 3 m s−1) and some easterly winds (Fig. S4).
A conditional bivariate polar function was applied to NOx, at 880 nm and at 375 nm at both the UT and UB sites to identify the position of potential emission sources (Fig. 6) on weekdays and holidays, excluding days with a significant dust load at the ground. Wind speed and direction data were combined with atmospheric compounds' levels by the use of conditional bivariate polar functions (Uria-Tellaetxe and Carslaw, 2014), as implemented in the openair package for the R software (Carslaw and Ropkins, 2012). This tool provides information on both the direction and the distance of the (relatively local) emission sources that are contributing significantly to the observed concentration levels as well as on the wind direction sectors that might provide clean air masses.
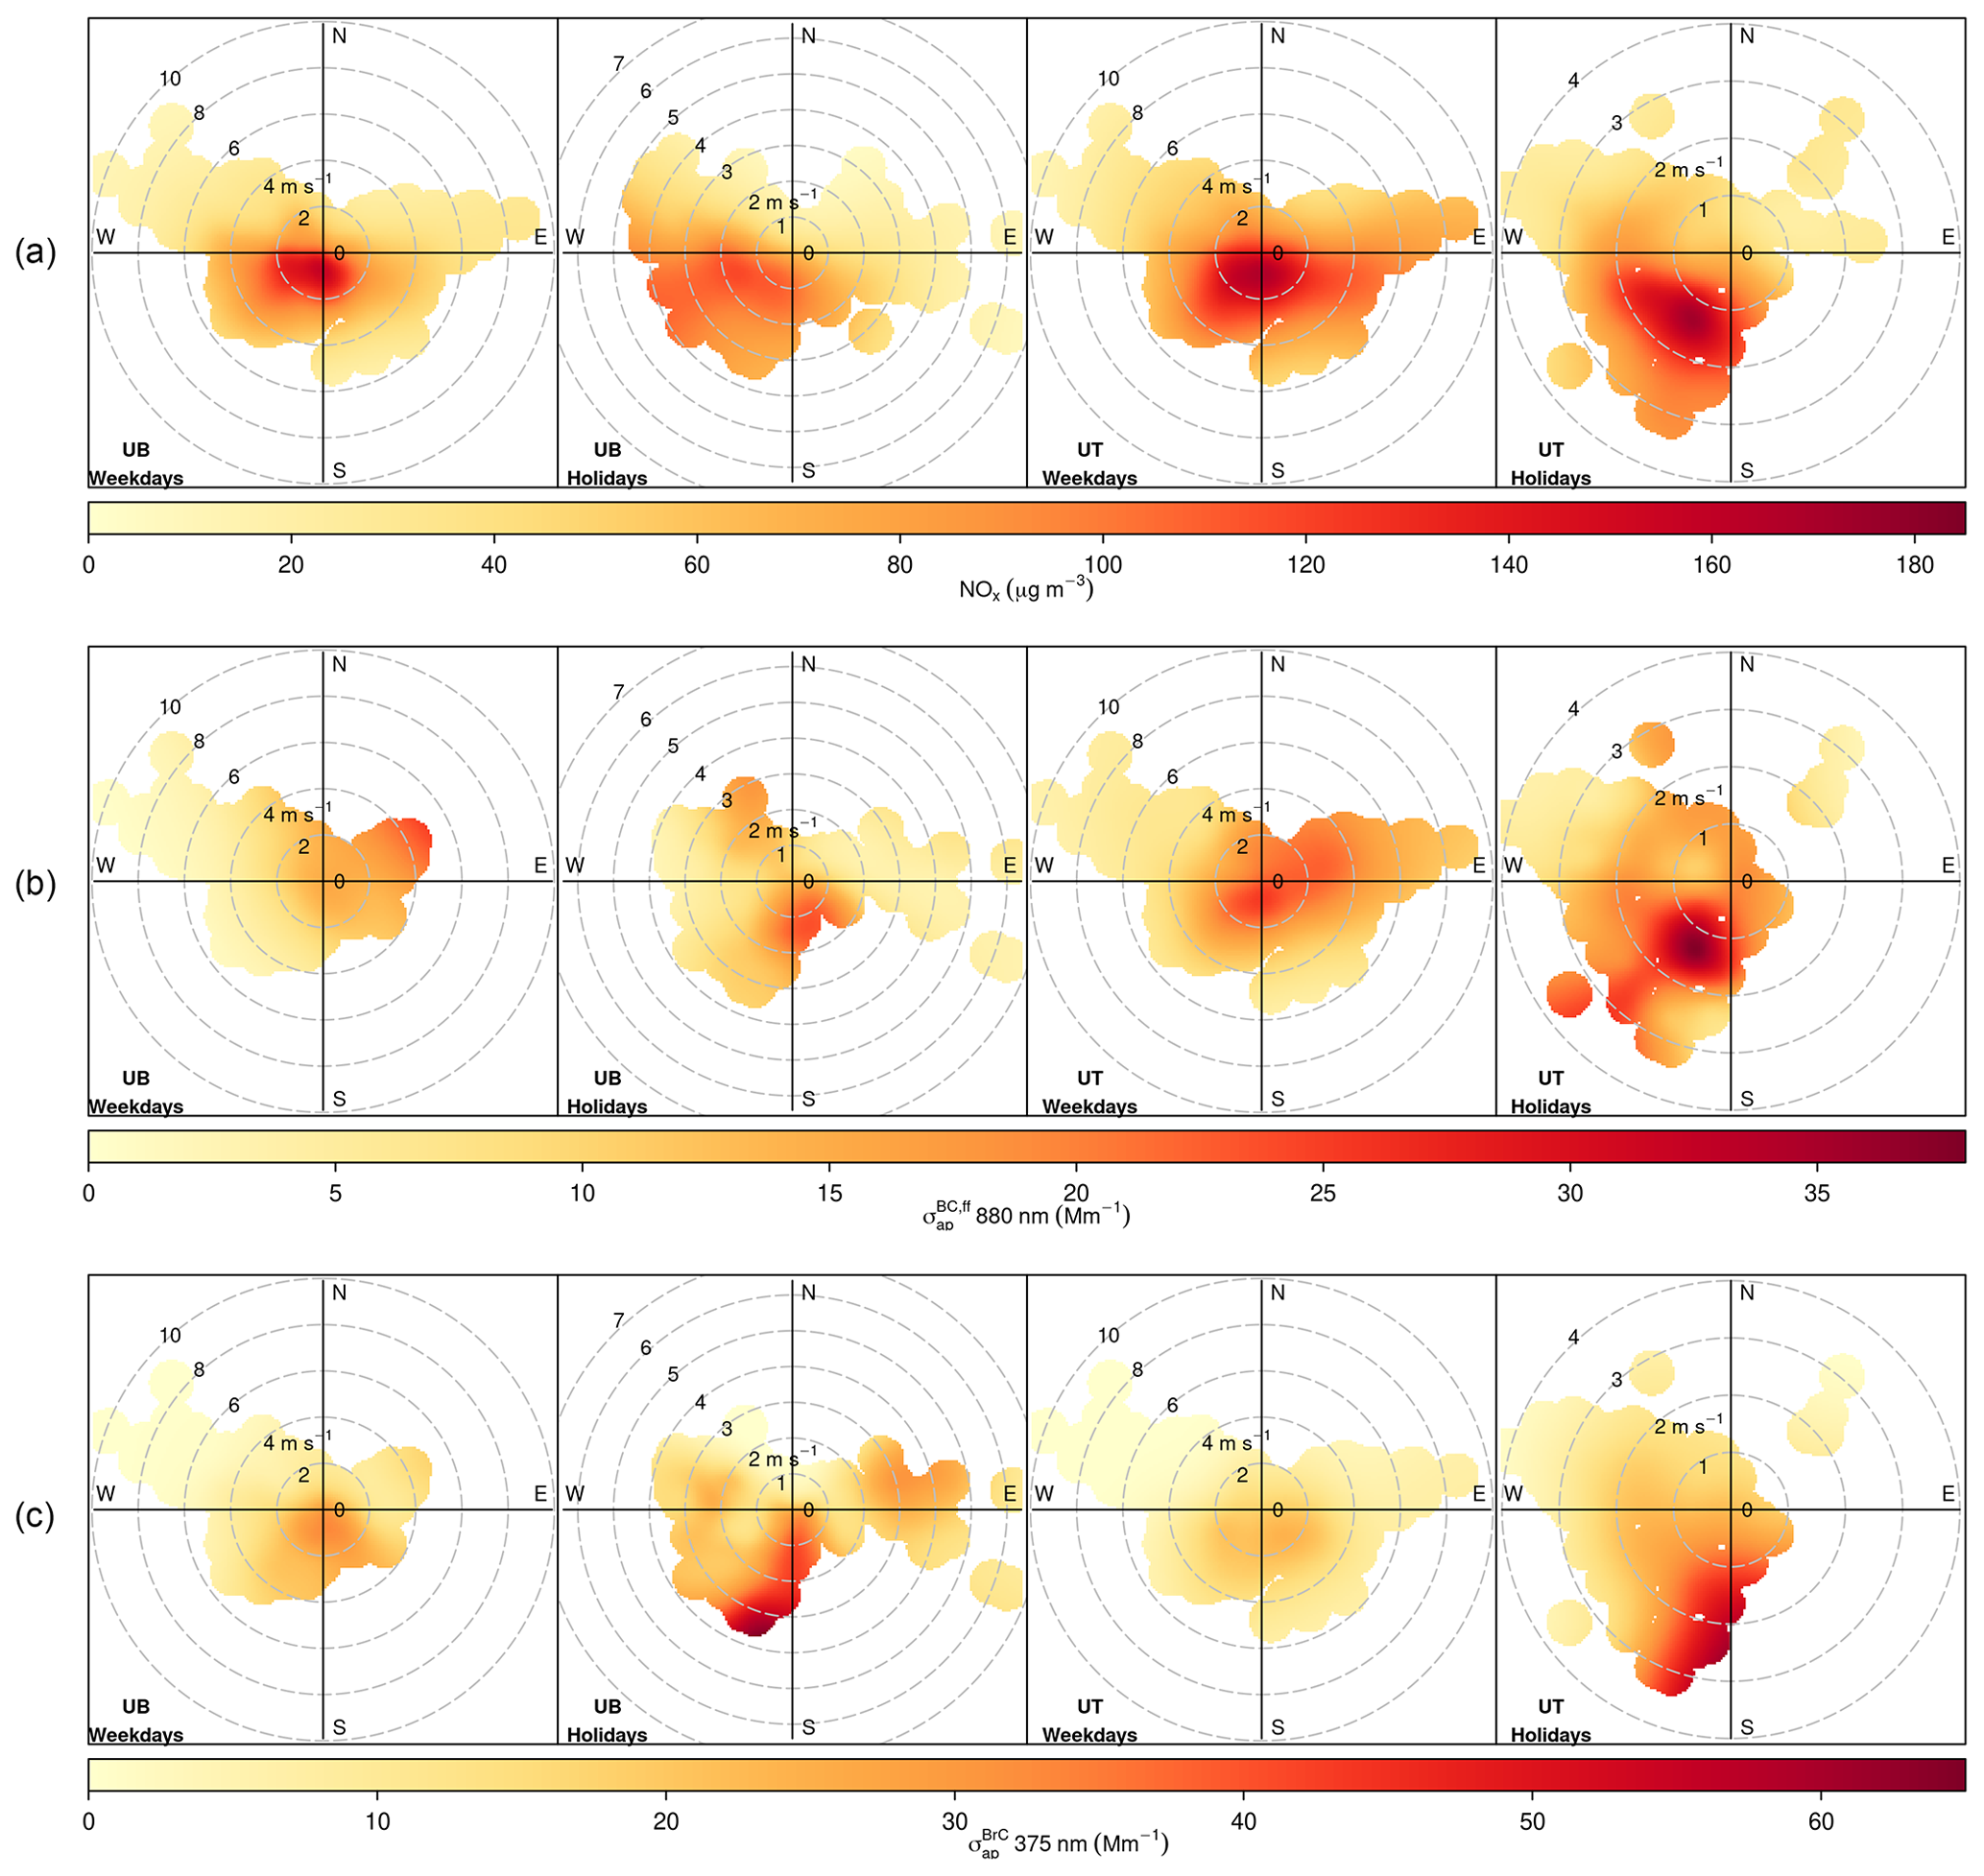
Figure 6Bivariate polar function applied to NOx (a), at 880 nm (b) and at 375 nm (c) at the UB (left panels) and UT (right panels) sites for weekdays and holidays.
At the UB site, NOx and absorption exhibit slightly different directional patterns: both show an increase associated with slow south–southwesterly winds, particularly on weekdays, while exhibits an increase on weekdays during northeasterly moderate winds, probably linked to traffic on the busy road 400 m in that direction. exhibits larger values during holidays during southerly winds, which is different from the pattern for BC from fossil fuels and NOx for the same period. At the UT site, the directional pattern between NOx and is quite similar, highlighting the role of nearby traffic during weekdays and of the major east–west road south of the UT site which contributes mainly during holidays. Moreover, at the UT site, is higher during holidays and under southerly wind conditions. This latter increase occurs during evening/night hours (not shown), consistent with biomass burning from domestic heating for recreational use, with the increase probably enhanced by nighttime atmospheric stagnation. Finally, northwesterly moderate winds are associated with low levels of NOx, and , mainly because northwesterly winds occur primarily at midday during maximum atmospheric mixing.
3.2 Comparing absorption optical depth from remote-sensing and in situ values
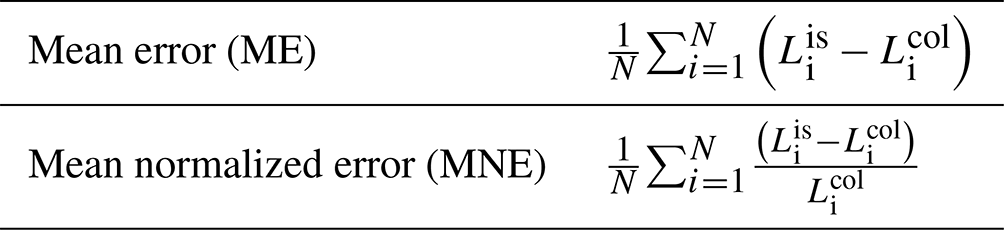
In situ and columnar aerosol optical properties were compared to assess (1) how representative the surface in situ aerosol optical measurements are of the mixed layer and (2) how the absorption within the MLH compares to the atmospheric column. Urban in situ and column data were compared over the whole time period, although simultaneous observations were mainly only available in February 2021. For this comparison, the in situ σap values were rescaled over (i.e., multiplied by) the MLH height; this estimate of the integral aerosol absorption height corresponds to the case of vertically homogeneous σap across the MLH. The in situ σap in the IR spectral range (λ=880 nm) rescaled over the MLH height was generally larger than the AAOD (Fig. 7), for both the L1.5* and L2.0 AERONET inversions, with mean normalized errors of MNE =2.2 and MNE =1.7, respectively. A better agreement occurred for blue wavelengths (λ= 470 and 440 nm for the in situ and the columnar observations, respectively) with MNE =1.0 and MNE =0.8 for L1.5* and L2.0, respectively. These results suggest an inhomogeneous vertical distribution of aerosols, i.e., most likely the occurrence of a very large accumulation of aerosols in the ground layer if compared with the atmospheric column and with the MLH, similar to previous observations in Milan under very stable atmospheric conditions (Ferrero et al., 2011). The overestimation of scaled in situ aerosol properties compared with columnar aerosol properties observed in this study may be affected by some concurrent conditions: (a) the large role of traffic and of other ground emissions on aerosol absorption; (b) a persistent ground thermal inversion occasionally as low as a few hundred meters, according to radiosoundings at 12:00 UTC at the rural Po Valley site of San Pietro Capofiume; and (c) a bias in the ERA5 estimate of the MLH. These conditions mainly contribute to the significantly larger values observed in scaled ground absorption, particularly at 880 nm, where fossil fuel emissions provide the largest contribution. At remote sites, an opposite pattern was consistently found (e.g., Bergin et al., 2000; Slater and Dibb, 2004; Aryal et al., 2014; Chauvigné et al., 2016), where MLH-scaled surface in situ atmospheric extinction underestimates sun photometry observations of AOD, mainly because of aerosol hygroscopicity (in situ measurements are typically made at low RH) and aerosol layers above the MLH.
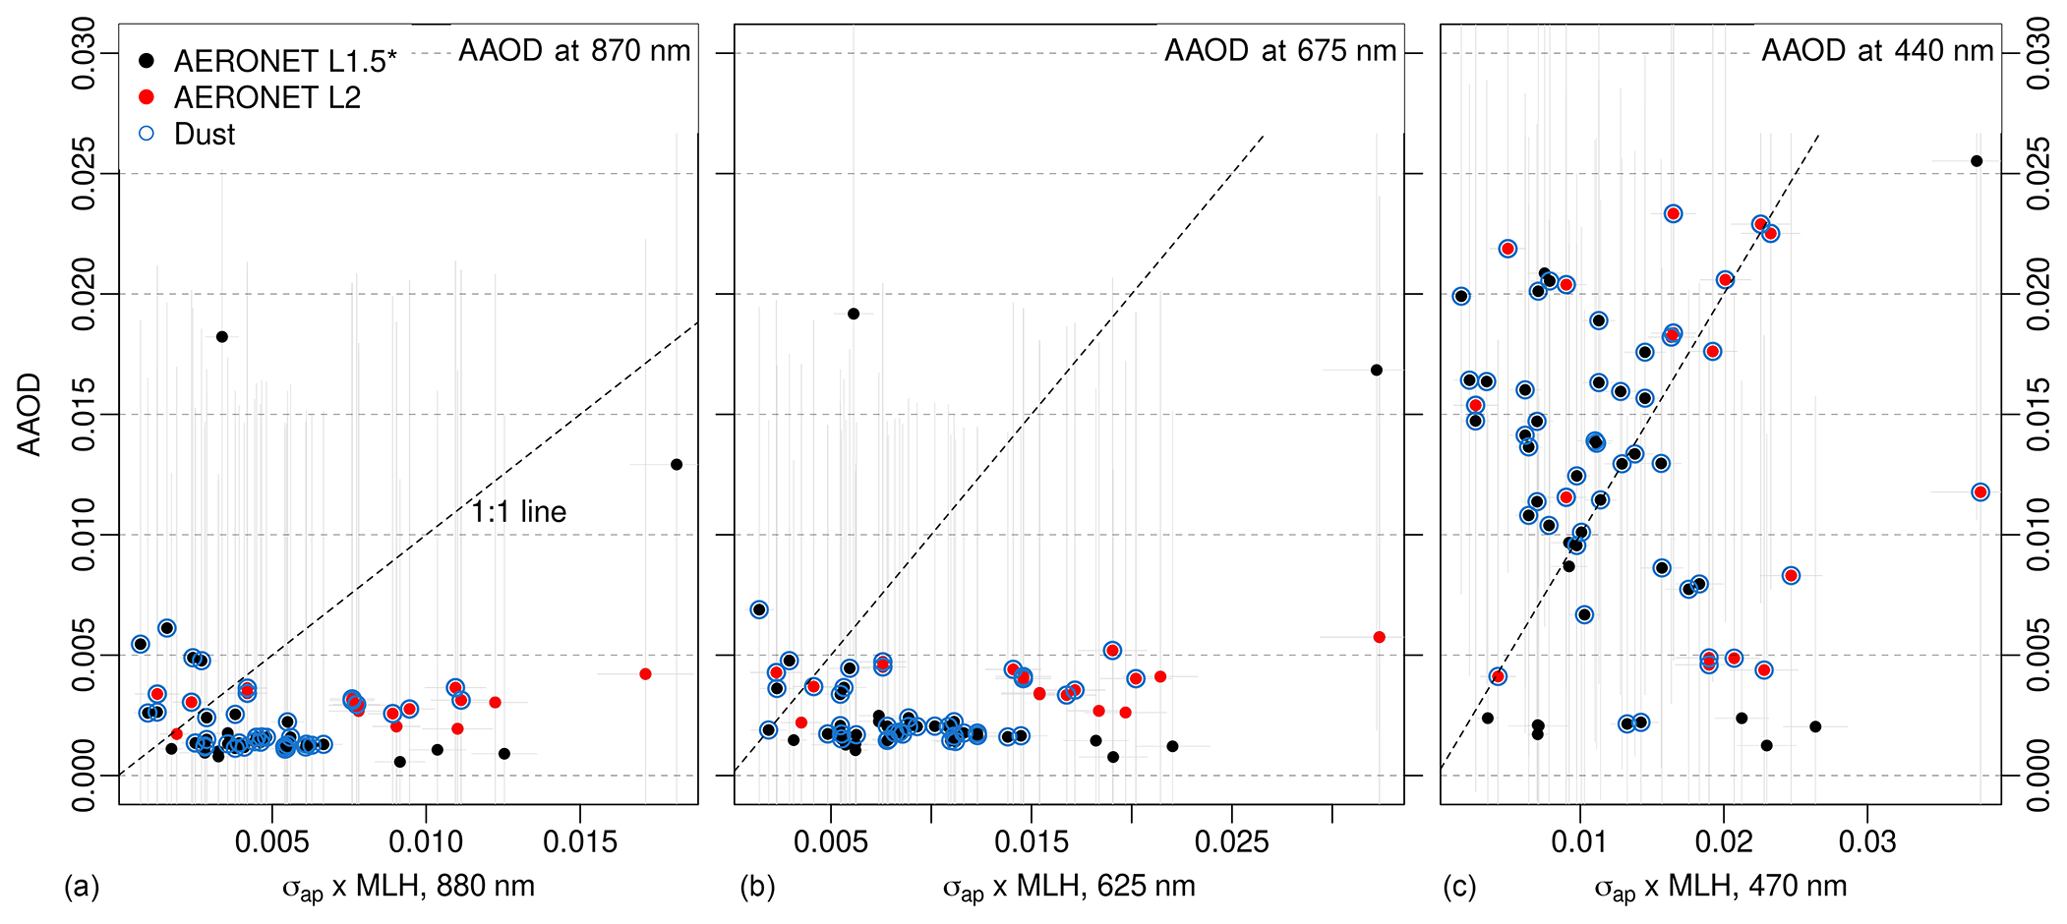
Figure 7Absorption aerosol optical depth based on columnar and in situ observations in the IR (a), green (b) and UV (c) regions using both L1.5 and L2.0 AERONET retrievals. Bars indicate measurement uncertainty.
For an assessment of the role of the MLH and of atmospheric layers in the discrepancies between surface and column observations mentioned above, an analysis of the apparent aerosol optical height (ApAOH) was performed. The ApAOH can be defined as the ratio between AAOD and σap (giving ApAOH units of length) to represent the atmospheric depth below which aerosols are uniformly distributed (Loría-Salazar et al., 2014). In the case of well-mixed conditions for absorbing aerosols, the ApAOH is similar to the MLH, while larger differences indicate less vertical mixing of the aerosol particles.
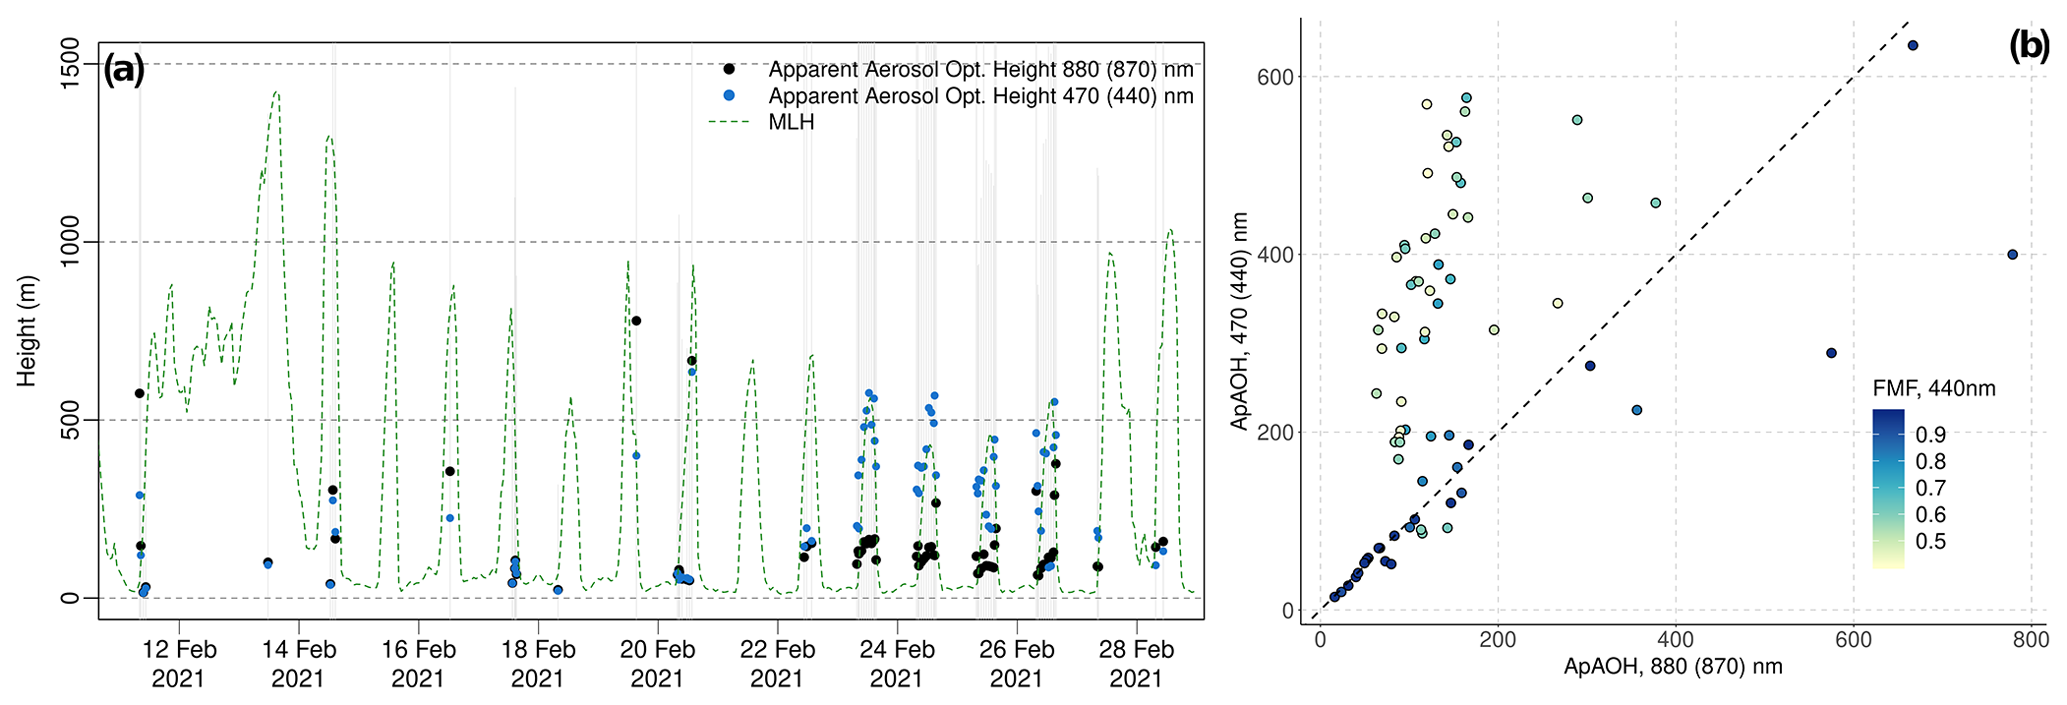
Figure 8(a) Apparent aerosol optical height (ApAOH) computed based on aerosol absorption at 880 nm (870 nm) and 470 nm (440 nm) from in situ (columnar, L1.5*) instruments. The simulated MLH depth from ERA5 is also plotted. (b) ApAOH computed based on aerosol absorption at 880 nm (870 nm) and 470 nm (440 nm) from in situ (columnar) instruments and color-coded according to the fine-mode fraction (FMF) at 440 nm. The dashed line indicates the 1:1 line.
The comparison of the ApAOH using L1.5* and the MLH in Fig. 8a shows that ApAOH is, on average, lower than the MLH, at both the 880 (870) nm (ME m, where ME represents the mean error) and 470 (440) nm (ME m) wavelengths of the in situ (columnar) instruments. In the period from 22 to 26 February, the ApAOH was highly consistent with the MLH for 470 (440) nm, with ME =31 m, i.e., similar to the bias reported for ERA5 estimates of the MLH in Europe by Guo et al. (2021). Conversely, the ApAOH at 880 (870) nm was significantly lower than the MLH (ME m), suggesting different vertical mixing between two absorbing aerosol species. The end of February 2021 featured the development of a strong anticyclone system in the Mediterranean Basin, leading to an above-average atmospheric temperature in southern and central Europe, clear sky (as shown by the high frequency of retrievals), the buildup of atmospheric pollutants and the arrival of Saharan dust-rich air masses in Italy. During the development of this high-pressure system, daily soundings collected at 00:00 and 12:00 UTC at the rural site of San Pietro Capofiume (44.65∘ N, 11.62∘ E; 60 km east of Modena) show the progressive vertical drop of a thermal inversion from about 2 km (on 20 February) to approximately a few hundred meters (on 26 February), leading to levels above the seasonal median for the in situ σap at both 880 and 470 nm (Fig. S6). Concurrent AAOD observations were above the median at 440 nm and within the seasonal median at 870 nm, leading to different ApAOH values for these two wavelengths (Fig. 8a). Differences in the AAOD might originate from different atmospheric layering and mixing of aerosols species: the volume size distribution from the AERONET inversion shows a switch from a major modal peak in submicron diameters on 20 February (Fig. S7a) to a modal peak in the supermicron diameter range on 23 February (Fig. S7b), which lasted until 27 February at midday. Consistently, the AOD at 500 nm derived by the AERONET Spectral Deconvolution Algorithm (Sinyuk et al., 2020) had a monthly minimum during this clear-sky period, showing a switch from a fine-aerosol-controlled AOD (until 20 February) to a coarse-aerosol-controlled AOD (since 23 February). This suggests that the ApAOH at 470 (440) nm is similar to the MLH depth, most likely because of good vertical mixing of dust aerosol, as shown by the decrease in the PMPM10 ratio over the same period (Fig. S1), while the low ApAOH in the IR is probably due to the dominant contribution of (ground-level) traffic emissions to the σap at this latter wavelength. This suggests that, in this case, the radiative effect due to traffic emissions was relevant mainly at the urban scale. Figure 8b shows that the ApAOH values at 880 (870) and 470 (440) nm are correlated and mainly lay on the 1:1 line during high-FMF440 conditions and periods with an aerosol volume size distribution with a fine-mode peak (Fig. S7a). For FMF440>0.8, a linear Pearson correlation of r=0.91 is found, with FMF440 indicating the contribution of fine aerosol to the AOD in the blue range, where dust is a significant absorber. Under low-FMF440 conditions, the ApAOH at 470 (440) nm increases significantly, in contrast with the ApAOH at 880 (870) nm; nonetheless, the correlation between the two remains.
3.3 Comparison of the contribution by BrC to absorption based on in situ and columnar data
The contribution of BrC to absorption in Modena according to the in situ and columnar L1.5* data was also compared (Fig. 9). Days with a significant dust load were removed from the comparison, because the MWAA apportionment method does not include dust absorption. This is necessary because, as shown by the ApAOH, the vertical mixing of dust can be significant, affecting both columnar and in situ observations. Figure 9 compares the contribution of biomass burning to absorption in the blue region (470 and 440 nm for the columnar and in situ observations, respectively) for the two apportionment models for 17 matched data points. Calculated statistics indicate ME =0.04, MNE =1.23 and a low linear correlation (Pearson's r=0.39, Spearman's ρ=0.34). According to columnar retrievals, the biomass burning contribution ranged between 2 % and 23 %, with a median (median absolute deviation) of 3.9 % (0.8 %) and a mean (standard deviation) of 5.3 % (4.3 %); in situ observations exhibited a similar range (0 %–24 %) but suggested a higher contribution of biomass related to a lower MLH depth and a median (median absolute deviation) of 8.7 % (8.7 %). Despite the uncertainty associated with these estimates, these results highlight that urban BrC emissions have a large impact on the lower levels of the atmosphere, similar to the findings of Ferrero et al. (2011) for BC. This is consistent with the dynamics of biomass burning emissions from domestic heating, featuring a low exit velocity and negligible plume rise, particularly for natural-convection fireplaces or traditional woodstoves. This BrC absorption contribution is based on days with a negligible dust content and, thus, represents a higher-end estimate; nonetheless, it is lower than values found for polluted urban sites in eastern Asia, e.g., Beijing, Hong Kong, Seoul and Osaka, where the share of AAOD due to BrC ranged between 12 % and 14 % in the UV during non-dust days on a yearly basis (Cho et al., 2019). Even larger contributions than those found for the eastern Asian sites were reported for Europe during winter: a mean 21 % contribution of BrC to the AAOD in the blue region was reported by X. Wang et al. (2016), based on 10 years (2005–2014) of AERONET data, also excluding “dust days”. It is worth noting that, over the same decade, X. Wang et al. (2016) also reported the in situ mean share of absorption by BrC in winter at Ispra and SIRTA (Paris, France) to be ∼ 23 %. A similar study in California found that the contribution of BC and BrC to absorption by in situ and ground-based sun/sky photometers can be similar, depending on the vertical mixing of the planetary boundary layer (Chen et al., 2019). They showed that, according to both methods, the share of BrC absorption at 440 nm was approximately 30 %. Similarly, during high-pollution events in the Kathmandu Valley, Kim et al. (2021) found a good correlation between the in situ and the columnar estimates of BC and BrC. They estimated a similar share of UV absorption by BrC: 34 % and 31 % by an AE33 Aethalometer and AERONET, respectively, and a good correlation between the two techniques (R2=0.71).
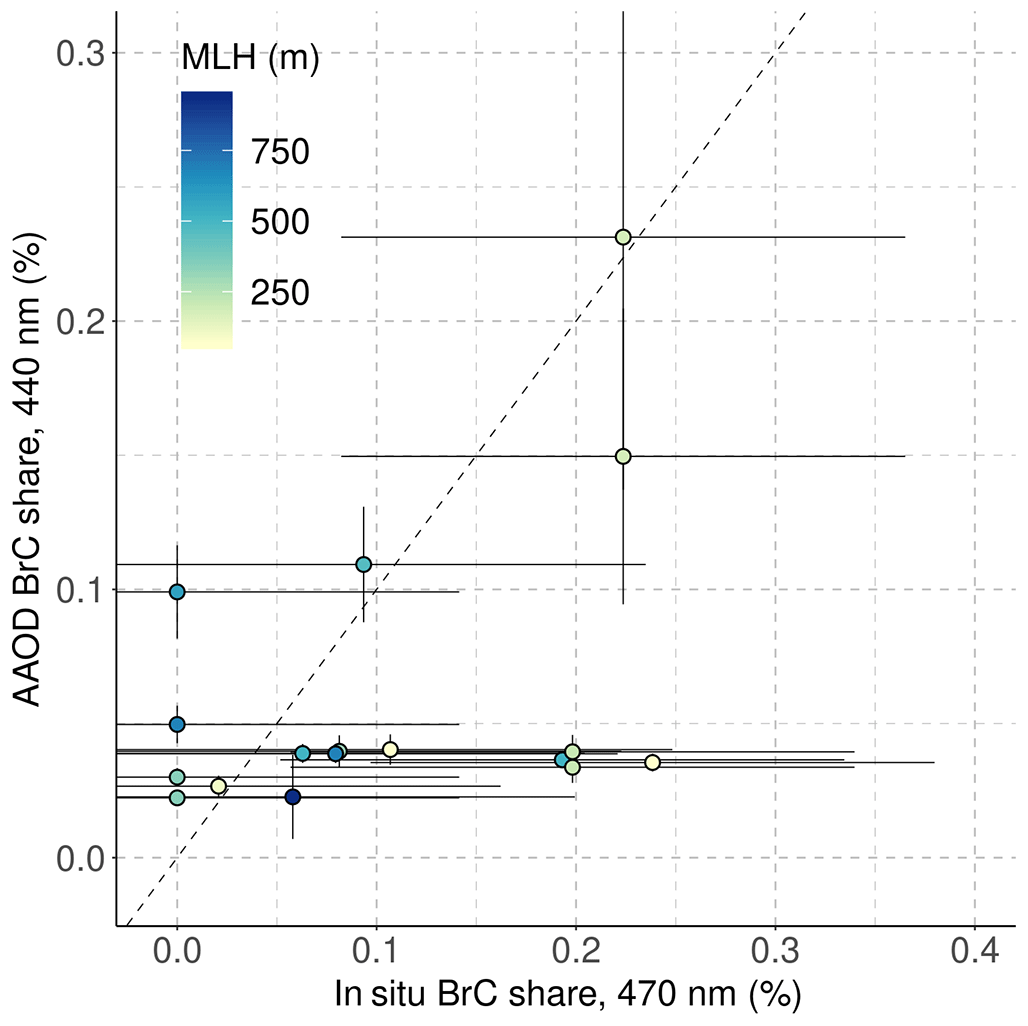
Figure 9Scatterplot of the share of total AAOD due to BrC and the share total in situ absorption due to BrC. Bars indicate measurement uncertainty.
3.4 Spatial variability in ground-based columnar retrievals
In addition to checking the vertical mixing of aerosol, the spatial mixing of ground-based columnar properties across part of the Po Valley during the study period was also investigated by comparing AERONET L1.5* version 3 retrievals from Modena and Ispra. The observations from the two instruments were matched when collected within the same hour. The AOD data are partly scattered along the 1:1 line (Fig. 10), with a significant (at the 95 %) Pearson's (Spearman's) correlation coefficient ranging from r=0.67 (ρ=0.56) at 440 nm to r=0.84 (ρ=0.79) at 1020 nm and an orthogonal regression coefficient ranging between 0.74 at 440 nm and 1.4 at 1020 nm. The high correlation in the AOD at the two sites is mainly driven by the observations in February, when both sites experienced a drop in the FMF and an increase in the AOD because of the dust transport event. This dust event was also detected in Ispra by a ground-based lidar within the European Aerosol Research Lidar Network (EARLINET), whose total attenuated backscatter at 500 and 1064 nm showed an aerosol layer between 1.3 and 2.3 km above the ground during 23 and 24 February. The layer subsequently dropped to heights between few hundred meters above the ground and 1.8 km above the ground on 25 February (no lidar data are available for 26 and 27 February). The temporal variability in the AOD440 and FMF440 between the two sites also shows a similar pattern (Fig. 10). The AOD in Ispra was similar to Modena for most retrievals, with Ispra and Modena having overall median AOD500 values of 0.27 and 0.24, respectively. The two sites differed during mid-January, when Modena had a median AOD500=0.21, whereas Ispra had a median AOD500=0.12, consistent with Modena being a site that is more representative of urban pollution than Ispra.
Concurrent AAOD retrievals at two sites had a different correlation pattern compared with the AOD (Fig. S8), exhibiting the largest linear correlation at 440 nm (r=0.70 and ρ=0.72, both statistically significant at the 95 % level). The correlation decreases noticeably with increasing wavelength: there is a significant correlation for 675 nm (r=0.42, ρ=0.43, 95 % significance) and 870 nm (r=0.37, ρ=0.40, 95 % significance), whereas no significant correlation occurred at 1020 nm. In contrast to the AOD, the AAOD at Ispra was larger than at Modena, with the median AAOD440 being 0.025 and 0.011 at Ispra and Modena, respectively. The differences in the AAOD at the two sites decreased at longer wavelengths, with the median AAOD870 being 0.003 and 0.002 at Ispra and Modena, respectively. According to the apportionment model (Fig. S5), the larger AAOD440 at Ispra is due to the larger impact of dust at this site compared with Modena, with AAOD440,dust being 0.022 and 0.001 at the two sites, respectively. AAOD440,dust was the component with the largest correlation between the two sites (r=0.62, ρ=0.60, 95 % significance), followed by BC (r=0.50, ρ=0.43, 95 % significance), with similar correlation values for AAOD870,dust and AAOD870,BC for these two species (Fig. S5), whereas the correlation for BrC absorption at 440 nm was not significant.
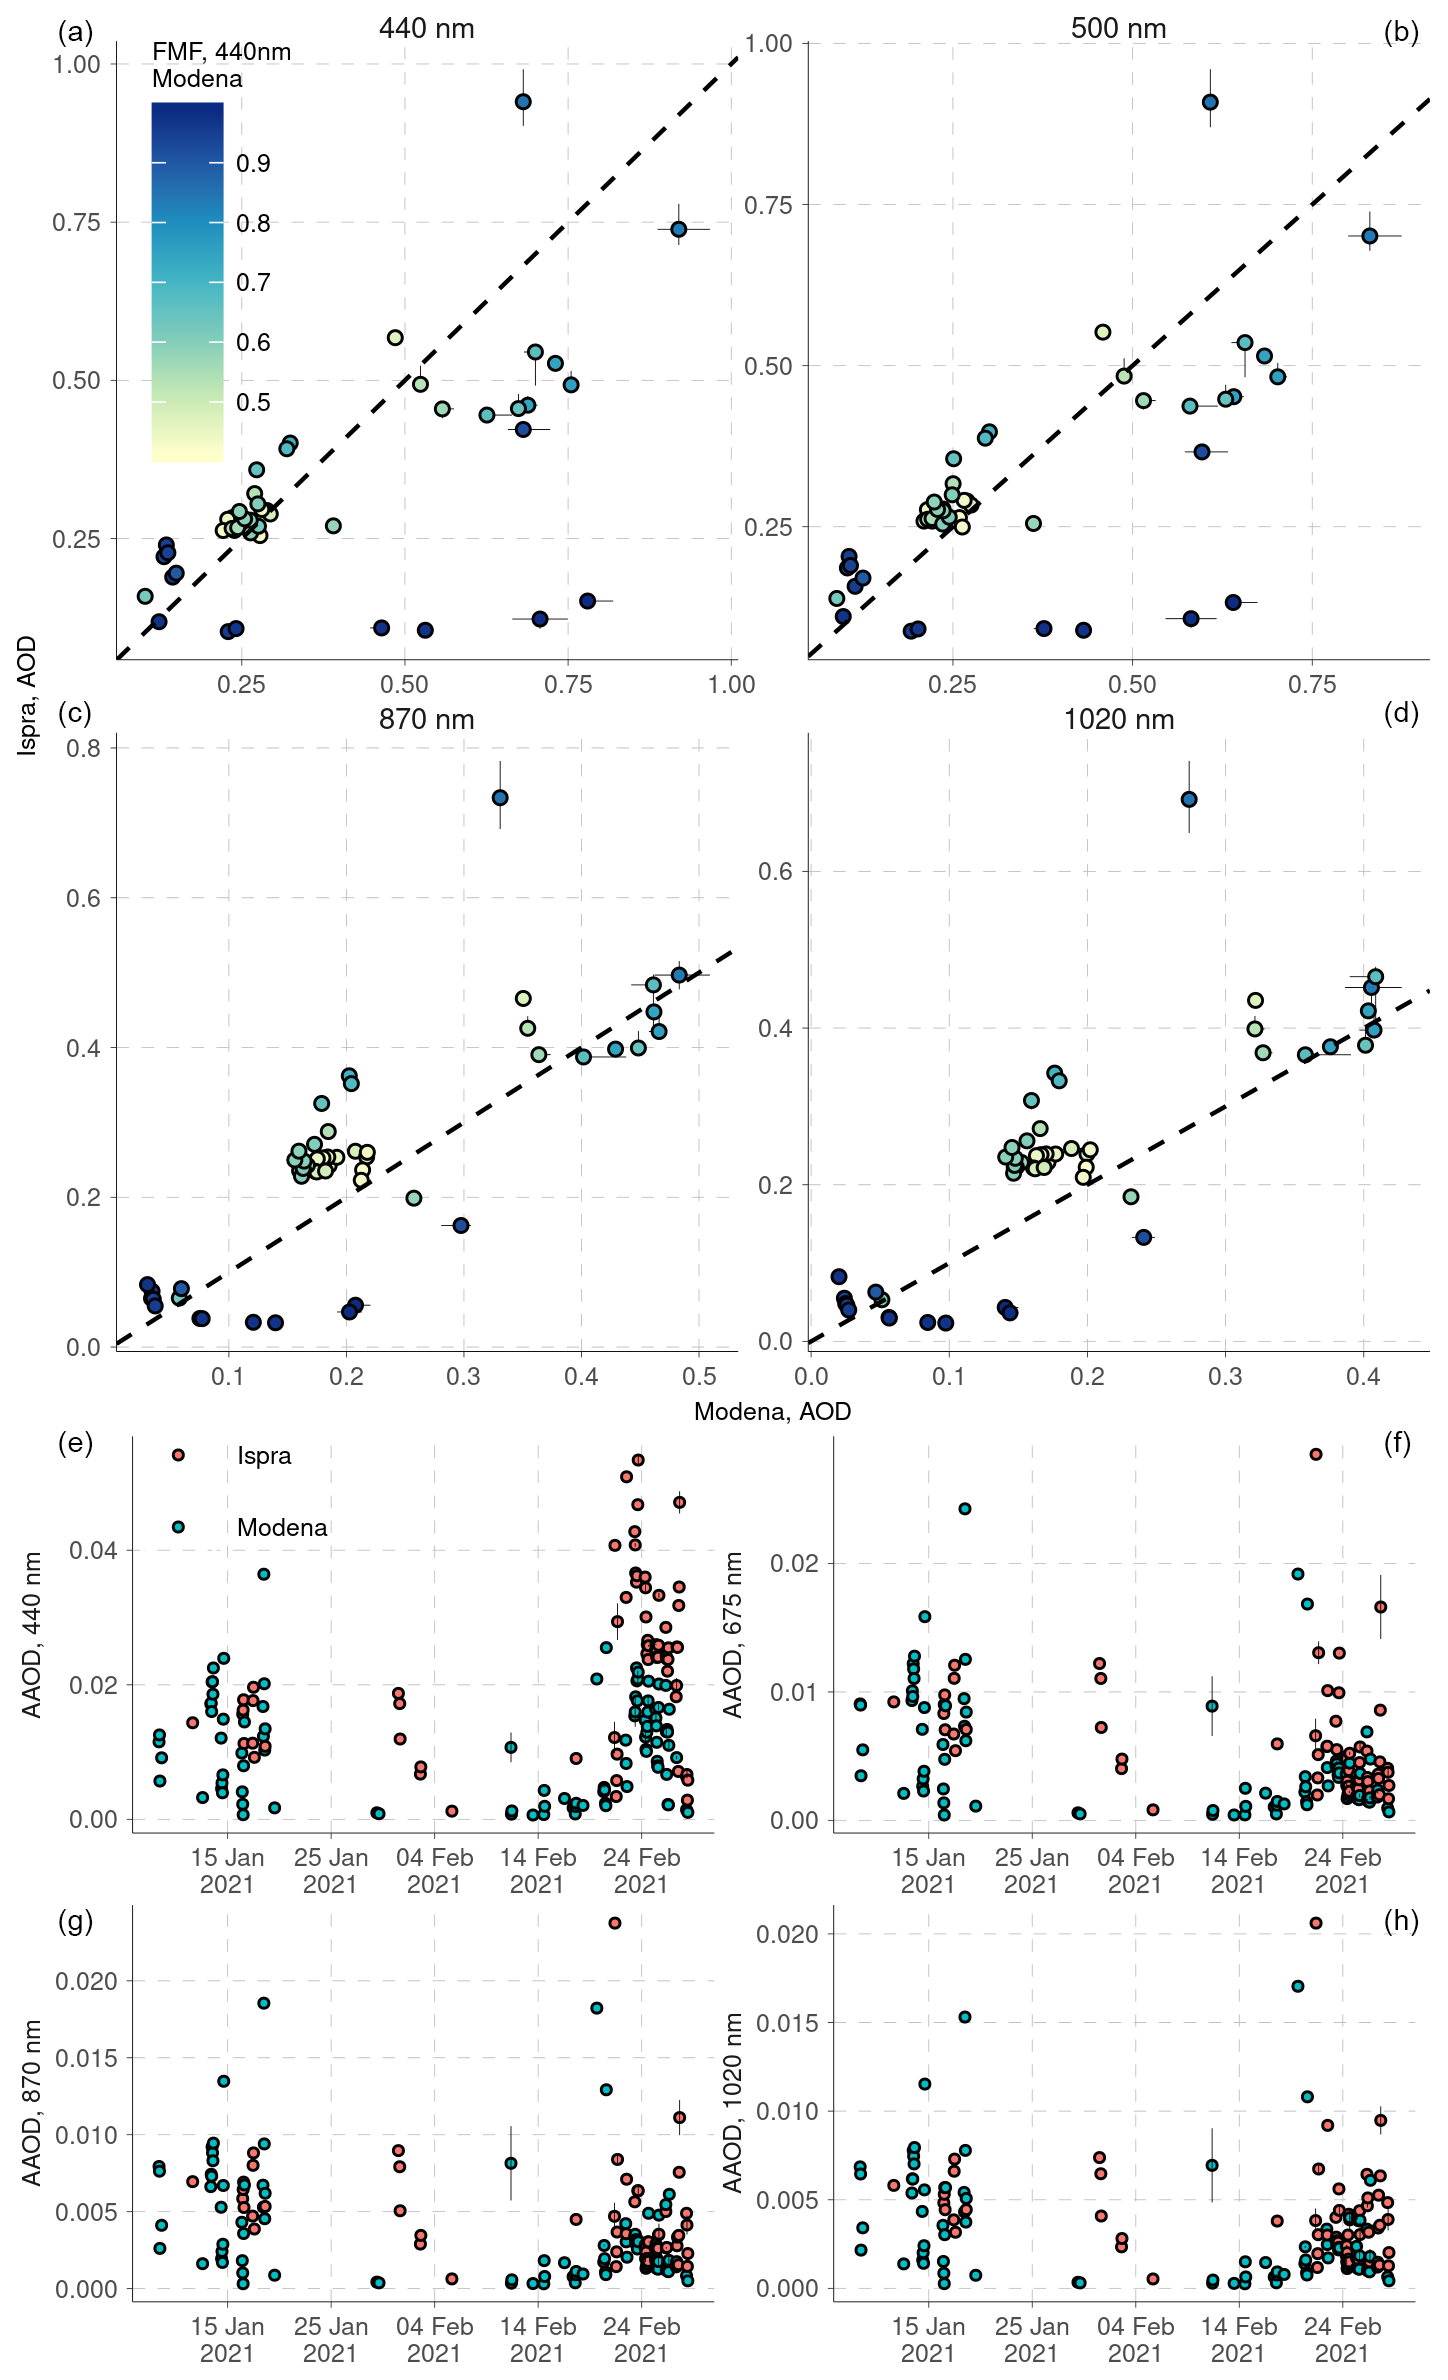
Figure 10(a–d) Comparison of hourly median AOD retrieved at Modena and Ispra at four wavelengths during the investigated period (January 2020–March 2021), color-coded according to the fine-mode fraction (FMF) at 440 nm. The dashed line indicates the 1:1 line. (e–h) Time series of the AAOD at Modena and Ispra during the investigated period (January 2020–March 2021). The bars indicate the hourly interquartile range.
In the urban area of Modena, a town representative of several urban regions in the Po Valley (a pollution hotspot for Europe), a set of light-absorbing aerosol (LAA) observations at multiple wavelengths was collected, along with meteorological and vehicle traffic data. Aerosol absorption was monitored by two in situ micro-Aethalometer instruments (MA200) and by a Cimel CE318 sun/sky photometer contributing to the AERONET network. The MA200 instruments were deployed at two locations representative of urban background and urban traffic conditions in Modena, while the Cimel sun photometer was located in an area representative of urban background conditions in Modena. In situ observations, apportioned to fossil fuel and biomass burning, were shown to be largely influenced by ground emissions. The comparison of columnar absorption and in situ absorption rescaled over the mixing layer exhibited contrasting results, demonstrated by a large difference in the infrared region (mean normalized error, MNE, of up to 2.2) but with better agreement in the blue wavelength region (MNE =0.8), confirming the impact of ground emissions on atmospheric levels of LAAs. Under the (reasonable) assumption of the generation of most of the AOD signal within the mixing layer, the heating rate due to LAAs was estimated to be 1.61 K d−1. The apportionment of columnar absorption to black carbon (BC), brown carbon (BrC) and dust, along with the aerosol size distribution by AERONET inversion, highlighted the major role of long-range-transported dust in driving the correspondence between the in situ and the columnar absorption at 440 nm, indicating a deeper vertical mixing for dust, in contrast with urban ground-based emissions that are confined to lower heights. This latter result was shown specifically for BrC absorption, whose contribution to in situ absorption was larger (up to 23 %) and featured a wider variability, relative to the columnar retrieval of absorption. The spatial extent of the dust impact was evaluated by the combined analysis of concurrent columnar retrievals at Modena and Ispra (225 km northwest of Modena): the sites showed large agreement with respect to the AOD (Pearson's linear correlation coefficient of r=0.84 at 1020 nm) and AAOD at 440 nm (r=0.70), where dust has a significant absorption. Consistently, the AAOD apportioned to dust was the species with the largest correlation between the two sites, reaching r=0.62 at 440nm, supporting the occurrence of significant spatial mixing of the transported dust, along with the vertical mixing.
An improved knowledge of the role of urban emissions of LAAs is critical to control local air quality, urban heat island effects and climate forcing, and an apportionment of LAAs based on their atmospheric levels, as presented here, contributes towards this goal. This study provides important insights into the role of in situ absorption monitoring in estimating the actual absorption aloft and whether it can be used for radiative forcing estimates. Moreover, the characterization of the intra-urban variation in absorbing aerosol based on different site types contributes to the ambient exposure domain. Towards this latter outcome, a more in-depth investigation of the contribution of urban areas to atmospheric LAAs can be gained by the application of specific atmospheric dispersion tools, and this represents one of the major study outlooks. More specifically, Lagrangian particle dispersion models would provide information on atmospheric levels across the urban area at a fine spatial resolution, supporting advanced exposure studies, and, further, would give an estimate of the spatially and temporally resolved emission factors for LAAs in the urban area.
AAOD was apportioned by solving the following equation system:
Here, i is BC, dust or BrC and λ is 440, 675, or 880 nm (BrC only at 440 and 675 nm).
Table A1Statistical metrics for the assessment of the agreement between the in situ and columnar data (Lis and , respectively).
| Symbol | Description |
| σap | Aerosol particle absorption coefficient |
| σap from BC by fossil fuel combustion | |
| σap from BC by biomass burning | |
| σap by brown carbon | |
| AAEc | Absorption Ångström exponent for column observations |
| AAEc1 | AAEc across the 440–675 nm range |
| AAEc2 | AAEc across the 675–880 nm range |
| AAEi | Absorption Ångström exponent for in situ observations |
| AAE | AAEi from BC by fossil fuel combustion |
| AAE | AAEi from BrC |
| AAODλ,species | Absorption AOD at wavelength λ and species (i.e., BC, BrC or dust) |
| ADRE | Absorptive direct radiative effect |
| AERONET | AErosol RObotic NETwork |
| AODλ | AOD at wavelength λ |
| ApAOH | Apparent aerosol optical height |
| BOA | Bottom of the atmosphere |
| BC | Black carbon |
| BL | Boundary layer |
| BrC | Brown carbon |
| DRE | Direct radiative effect |
| eBC | Equivalent black carbon |
| FMFλ | Fine-mode fraction at wavelength λ |
| HR | Heating rate |
| IQR | Interquartile range |
| LAA | Light-absorbing aerosol |
| ME | Mean error |
| MLH | Mixing layer height |
| MNE | Mean normalized error |
| MWAA | Multi-Wavelength Absorption Analyzer |
| SAEc | Scattering Ångström exponent for columnar observations |
| SAEc1 | SAEc across the 440–675 nm range |
| SAEc2 | SAEc across the 675–880 nm range |
| SAOD | Scattering AOD |
| SSA | Column single-scattering albedo |
| TOA | Top of the atmosphere |
| UB | Urban background |
| UT | Urban traffic |
We provide the following code and data:
– the transcription of the dual-spot correction algorithm in the R programming language, following Drinovec et al. (2015, https://doi.org/10.5194/amt-8-1965-2015), which was used for 1 min urban background data (version 1.0.1 at https://doi.org/10.5281/zenodo.10009230; Bigi, 2023a). This open-source code is distributed under the GNU Affero General Public License v3.0.
– the R code for the apportionment of the AAOD AERONET data, according to Bahadur et al. (2012, https://doi.org/10.1073/pnas.1205910109) (https://doi.org/10.5281/zenodo.10009250; Bigi, 2023b). This open-source code is distributed under the GNU Affero General Public License v3.0.
– raw in situ aerosol absorption data for Modena during the study period (https://doi.org/10.5281/zenodo.8140250; Bigi, 2023c).
The latest versions of these tools are available on dedicated GitHub repositories (https://github.com/abigmo/ae33_dualspot_correction, last access: 16 October 2023; https://github.com/abigmo/aaod_apportionment, last access: 16 October 2023).
AERONET data are publicly available at https://aeronet.gsfc.nasa.gov/ (AERONET, 2023). Regulatory air quality data for Modena are publicly available at https://dati.arpae.it/ (ARPAE, 2023) and on the European Environmental Agency air quality portal. Meteorological data for Modena are also publicly available at https://dati.arpae.it/ (ARPAE, 2023).
The supplement related to this article is available online at: https://doi.org/10.5194/acp-23-14841-2023-supplement.
AB designed the study, acquired the funds for the absorption in situ measurements, led the writing of the manuscript and carried out the data analysis. GV, EA, MCC, VB, DM, LF and GG contributed to the development of the methodology and to data interpretation. ST and LG funded and maintained the sun photometer. DM ran the Multi-Wavelength Absorption Analyzer code. LF computed the heating rate. All authors contributed to the manuscript.
The contact author has declared that none of the authors has any competing interests.
Publisher’s note: Copernicus Publications remains neutral with regard to jurisdictional claims made in the text, published maps, institutional affiliations, or any other geographical representation in this paper. While Copernicus Publications makes every effort to include appropriate place names, the final responsibility lies with the authors.
Luca Ferrero acknowledges the GEMMA Center in the framework of the TECLA project, MIUR “Dipartimenti di Eccellenza 2023–2027”. Carla Barbieri and Enrica Canossa from ARPAE are kindly acknowledged for hosting the filter absorption photometers at the air quality monitoring stations and for granting full access to these sites. The municipality of Modena is kindly acknowledged for providing the vehicular traffic data. Hersbach et al. (2023) was downloaded from the Copernicus Climate Change Service (C3S) Climate Data Store: the results contain modified Copernicus Climate Change Service information 2020. Neither the European Commission nor ECMWF is responsible for any use that may be made of the Copernicus information nor the data it contains. We thank Giuseppe Zibordi and his staff for establishing and maintaining the Ispra AERONET site used in this investigation.
This research has been supported by the “Black Air” project (grant no. CUP E94I19001080005) funded by the University of Modena and Reggio Emilia and the Fondazione di Modena within the framework of the “Fondo di Ateneo per la Ricerca 2019” program. Elisabeth Andrews was supported by NOAA cooperative agreement nos. NA17OAR4320101 and NA22OAR4320151. This study was also supported by the “Multilayered Urban Sustainability Action (MUSA)” project, funded by the European Union NextGenerationEU program, under the National Recovery and Resilience Plan (NRRP) Mission 4 Component 2 Investment Line 1.5: Establishing and strengthening of “innovation ecosystems for sustainability”, building “territorial leaders of R&D”.
This paper was edited by Stelios Kazadzis and reviewed by three anonymous referees.
Acevedo, O. C., Maroneze, R., Costa, F. D., Puhales, F. S., Degrazia, G. A., Nogueira Martins, L. G., Soares de Oliveira, P. E., and Mortarini, L.: The nocturnal boundary layer transition from weakly to very stable. Part I: Observations, Q. J. Roy. Meteor. Soc., 145, 3577–3592, https://doi.org/10.1002/qj.3642, 2019. a
AERONET: Aerosol Robotic Network aerosol database, http://aeronet.gsfc.nasa.gov/ (last access: 24 November 2023), 2023. a
Alas, H. D. C., Müller, T., Weinhold, K., Pfeifer, S., Glojek, K., Gregorič, A., Močnik, G., Drinovec, L., Costabile, F., Ristorini, M., and Wiedensohler, A.: Performance of microAethalometers: Real-world Field Intercomparisons from Multiple Mobile Measurement Campaigns in Different Atmospheric Environments, Aerosol Air Qual. Res., 20, 2640–2653, https://doi.org/10.4209/aaqr.2020.03.0113, 2020. a, b
Andreae, M. O. and Gelencsér, A.: Black carbon or brown carbon? The nature of light-absorbing carbonaceous aerosols, Atmos. Chem. Phys., 6, 3131–3148, https://doi.org/10.5194/acp-6-3131-2006, 2006. a
Andrews, E., Ogren, J. A., Kinne, S., and Samset, B.: Comparison of AOD, AAOD and column single scattering albedo from AERONET retrievals and in situ profiling measurements, Atmos. Chem. Phys., 17, 6041–6072, https://doi.org/10.5194/acp-17-6041-2017, 2017. a
ARPAE: Update on the Emilia Romagna regional inventory of atmospheric emissions for the year 2017, Tech. rep., ARPAE, https://www.arpae.it/it/temi-ambientali/aria/inventari-emissioni/inventario-inemar/inventario_emissioni_2017.pdf/@@display-file/file/inventario_emissioni_2017.pdf (last access: 24 November 2023), 2020 (in Italian). a, b, c, d
ARPAE Regional Agency for Prevention, Environment and Energy of Emilia-Romagna (ARPAE): https://dati.arpae.it/ (last access: 24 November 2023), 2023. a, b
Aryal, R. P., Voss, K. J., Terman, P. A., Keene, W. C., Moody, J. L., Welton, E. J., and Holben, B. N.: Comparison of surface and column measurements of aerosol scattering properties over the western North Atlantic Ocean at Bermuda, Atmos. Chem. Phys., 14, 7617–7629, https://doi.org/10.5194/acp-14-7617-2014, 2014. a, b
Bahadur, R., Praveen, P. S., Xu, Y., and Ramanathan, V.: Solar absorption by elemental and brown carbon determined from spectral observations, P. Natl. Acad. Sci. USA, 109, 17366–17371, https://doi.org/10.1073/pnas.1205910109, 2012. a, b, c, d, e, f, g, h, i, j
Barnaba, F., Putaud, J. P., Gruening, C., Dell'Acqua, A., and Dos Santos, S.: Annual cycle in co-located in situ, total-column, and height-resolved aerosol observations in the Po Valley (Italy): Implications for ground-level particulate matter mass concentration estimation from remote sensing, J. Geophys. Res.-Atmos., 115, D19209, https://doi.org/10.1029/2009JD013002, 2010. a
Battisti, A., Acevedo, O. C., Costa, F. D., Puhales, F. S., Anabor, V., and Degrazia, G. A.: Evaluation of Nocturnal Temperature Forecasts Provided by the Weather Research and Forecast Model for Different Stability Regimes and Terrain Characteristics, Bound.-Lay. Meteorol., 162, 523–546, https://doi.org/10.1007/s10546-016-0209-y, 2017. a
Bellucci, P. and Cipriani, E.: Data accuracy on automatic traffic counting: the SMART project results, Eur. Transp. Res. Rev., 2, 175–187, https://doi.org/10.1007/s12544-010-0039-9, 2010. a
Bergin, M. H., Schwartz, S. E., Halthore, R. N., Ogren, J. A., and Hlavka, D. L.: Comparison of aerosol optical depth inferred from surface measurements with that determined by Sun photometry for cloud-free conditions at a continental U.S. site, J. Geophys. Res.-Atmos., 105, 6807–6816, https://doi.org/10.1029/1999JD900454, 2000. a, b
Bernardoni, V., Vecchi, R., Valli, G., Piazzalunga, A., and Fermo, P.: PM10 source apportionment in Milan (Italy) using time-resolved data, Sci Total Environ., 409, 4788–4795, https://doi.org/10.1016/j.scitotenv.2011.07.048, 2011. a
Bernardoni, V., Calzolai, G., Chiari, M., Fedi, M., Lucarelli, F., Nava, S., Piazzalunga, A., Riccobono, F., Taccetti, F., Valli, G., and Vecchi, R.: Radiocarbon analysis on organic and elemental carbon in aerosol samples and source apportionment at an urban site in Northern Italy, J. Aerosol Sci., 56, 88–99, https://doi.org/10.1016/j.jaerosci.2012.06.001, 2013. a
Bernardoni, V., Pileci, R. E., Caponi, L., and Massabò, D.: The Multi-Wavelength Absorption Analyzer (MWAA) Model as a Tool for Source and Component Apportionment Based on Aerosol Absorption Properties: Application to Samples Collected in Different Environments, Atmosphere, 8, 218, https://doi.org/10.3390/atmos8110218, 2017. a, b, c
Bigi, A.: Aethalometer AE33 dualspot correction algorithm, Version 1.0.1, Zenodo [code], https://doi.org/10.5281/zenodo.10009230, 2023a. a
Bigi, A.: Apportionment of AAOD from AERONET retrievals, Version 1.0.1, Zenodo [code], https://doi.org/10.5281/zenodo.10009250, 2023b. a
Bigi, A.: Aerosol absorption data in Modena, Italy published in the journal article by Bigi et. al. (2023), Version 1.0.0, Zenodo [data set], https://doi.org/10.5281/zenodo.8140250, 2023c. a
Bigi, A. and Ghermandi, G.: Long-term trend and variability of atmospheric PM10 concentration in the Po Valley, Atmos. Chem. Phys., 14, 4895–4907, https://doi.org/10.5194/acp-14-4895-2014, 2014. a, b
Bigi, A. and Ghermandi, G.: Trends and variability of atmospheric PM2.5 and PM10−2.5 concentration in the Po Valley, Italy, Atmos. Chem. Phys., 16, 15777–15788, https://doi.org/10.5194/acp-16-15777-2016, 2016. a, b, c
Bond, T. C., Doherty, S. J., Fahey, D. W., Forster, P. M., Berntsen, T., DeAngelo, B. J., Flanner, M. G., Ghan, S., Kärcher, B., Koch, D., Kinne, S., Kondo, Y., Quinn, P. K., Sarofim, M. C., Schultz, M. G., Schulz, M., Venkataraman, C., Zhang, H., Zhang, S., Bellouin, N., Guttikunda, S. K., Hopke, P. K., Jacobson, M. Z., Kaiser, J. W., Klimont, Z., Lohmann, U., Schwarz, J. P., Shindell, D., Storelvmo, T., Warren, S. G., and Zender, C. S.: Bounding the role of black carbon in the climate system: a scientific assessment, J. Geophys. Res.-Atmos., 118, 5380–5552, https://doi.org/10.1002/jgrd.50171, 2013. a, b, c, d
Boniardi, L., Dons, E., Longhi, F., Scuffi, C., Campo, L., Van Poppel, M., Int Panis, L., and Fustinoni, S.: Personal exposure to equivalent black carbon in children in Milan, Italy: Time-activity patterns and predictors by season, Environ. Pollut., 274, 116530, https://doi.org/10.1016/j.envpol.2021.116530, 2021. a
Brown, H., Liu, X., Feng, Y., Jiang, Y., Wu, M., Lu, Z., Wu, C., Murphy, S., and Pokhrel, R.: Radiative effect and climate impacts of brown carbon with the Community Atmosphere Model (CAM5), Atmos. Chem. Phys., 18, 17745–17768, https://doi.org/10.5194/acp-18-17745-2018, 2018. a
Carslaw, D. C. and Ropkins, K.: openair – An R package for air quality data analysis, Environ. Modell. Softw., 27–28, 52–61, https://doi.org/10.1016/j.envsoft.2011.09.008, 2012. a
Cazorla, A., Bahadur, R., Suski, K. J., Cahill, J. F., Chand, D., Schmid, B., Ramanathan, V., and Prather, K. A.: Relating aerosol absorption due to soot, organic carbon, and dust to emission sources determined from in-situ chemical measurements, Atmos. Chem. Phys., 13, 9337–9350, https://doi.org/10.5194/acp-13-9337-2013, 2013. a, b
Chakrabarty, R. K., Garro, M. A., Wilcox, E. M., and Moosmüller, H.: Strong radiative heating due to wintertime black carbon aerosols in the Brahmaputra River Valley, Geophys. Res. Lett., 39, L09804, https://doi.org/10.1029/2012GL051148, 2012. a
Charlson, R. J., Schwartz, S. E., Hales, J. M., Cess, R. D., Coakley, J. A., Hansen, J. E., and Hofmann, D. J.: Climate forcing by anthropogenic aerosols, Science, 255, 423–430, https://doi.org/10.1126/science.255.5043.423, 1992. a
Chauvigné, A., Sellegri, K., Hervo, M., Montoux, N., Freville, P., and Goloub, P.: Comparison of the aerosol optical properties and size distribution retrieved by sun photometer with in situ measurements at midlatitude, Atmos. Meas. Tech., 9, 4569–4585, https://doi.org/10.5194/amt-9-4569-2016, 2016. a, b
Chen, S., Russell, L. M., Cappa, C. D., Zhang, X., Kleeman, M. J., Kumar, A., Liu, D., and Ramanathan, V.: Comparing black and brown carbon absorption from AERONET and surface measurements at wintertime Fresno, Atmos. Environ., 199, 164–176, https://doi.org/10.1016/j.atmosenv.2018.11.032, 2019. a, b
Cho, C., Kim, S.-W., Lee, M., Lim, S., Fang, W., Gustafsson, O., Andersson, A., Park, R. J., and Sheridan, P. J.: Observation-based estimates of the mass absorption cross-section of black and brown carbon and their contribution to aerosol light absorption in East Asia, Atmos. Environ., 212, 65–74, https://doi.org/10.1016/j.atmosenv.2019.05.024, 2019. a
Chowdhury, P. H., He, Q., Carmieli, R., Li, C., Rudich, Y., and Pardo, M.: Connecting the Oxidative Potential of Secondary Organic Aerosols with Reactive Oxygen Species in Exposed Lung Cells, Environ. Sci. Technol., 53, 13949–13958, https://doi.org/10.1021/acs.est.9b04449, 2019. a
Chung, C. E., Ramanathan, V., and Decremer, D.: Observationally constrained estimates of carbonaceous aerosol radiative forcing, P. Natl. Acad. Sci. USA, 109, 11624–11629, https://doi.org/10.1073/pnas.1203707109, 2012. a
Ciarelli, G., Jiang, J., El Haddad, I., Bigi, A., Aksoyoglu, S., Prévôt, A. S. H., Marinoni, A., Shen, J., Yan, C., and Bianchi, F.: Modeling the effect of reduced traffic due to COVID-19 measures on air quality using a chemical transport model: impacts on the Po Valley and the Swiss Plateau regions, Environmental Science: Atmospheres, 1, 228–240, https://doi.org/10.1039/D1EA00036E, 2021. a
Clerici, M. and Mélin, F.: Aerosol direct radiative effect in the Po Valley region derived from AERONET measurements, Atmos. Chem. Phys., 8, 4925–4946, https://doi.org/10.5194/acp-8-4925-2008, 2008. a
Cleveland, W. S., Graedel, T. E., Kleiner, B., and Warner, J. L.: Sunday and Workday Variations in Photochemical Air Pollutants in New Jersey and New York, Science, 186, 1037–1038, https://doi.org/10.1126/science.186.4168.1037, 1974. a
Cohen, A. J., Brauer, M., Burnett, R., Anderson, H. R., Frostad, J., Estep, K., Balakrishnan, K., Brunekreef, B., Dandona, L., Dandona, R., Feigin, V., Freedman, G., Hubbell, B., Jobling, A., Kan, H., Knibbs, L., Liu, Y., Martin, R., Morawska, L., Pope, C. A., Shin, H., Straif, K., Shaddick, G., Thomas, M., van Dingenen, R., van Donkelaar, A., Vos, T., Murray, C. J. L., and Forouzanfar, M. H.: Estimates and 25-year trends of the global burden of disease attributable to ambient air pollution: an analysis of data from the Global Burden of Diseases Study 2015, The Lancet, 389, 1907–1918, https://doi.org/10.1016/S0140-6736(17)30505-6, 2017. a
Collaud Coen, M., Weingartner, E., Apituley, A., Ceburnis, D., Fierz-Schmidhauser, R., Flentje, H., Henzing, J. S., Jennings, S. G., Moerman, M., Petzold, A., Schmid, O., and Baltensperger, U.: Minimizing light absorption measurement artifacts of the Aethalometer: evaluation of five correction algorithms, Atmos. Meas. Tech., 3, 457–474, https://doi.org/10.5194/amt-3-457-2010, 2010. a, b
Collaud Coen, M., Andrews, E., Alastuey, A., Arsov, T. P., Backman, J., Brem, B. T., Bukowiecki, N., Couret, C., Eleftheriadis, K., Flentje, H., Fiebig, M., Gysel-Beer, M., Hand, J. L., Hoffer, A., Hooda, R., Hueglin, C., Joubert, W., Keywood, M., Kim, J. E., Kim, S.-W., Labuschagne, C., Lin, N.-H., Lin, Y., Lund Myhre, C., Luoma, K., Lyamani, H., Marinoni, A., Mayol-Bracero, O. L., Mihalopoulos, N., Pandolfi, M., Prats, N., Prenni, A. J., Putaud, J.-P., Ries, L., Reisen, F., Sellegri, K., Sharma, S., Sheridan, P., Sherman, J. P., Sun, J., Titos, G., Torres, E., Tuch, T., Weller, R., Wiedensohler, A., Zieger, P., and Laj, P.: Multidecadal trend analysis of in situ aerosol radiative properties around the world, Atmos. Chem. Phys., 20, 8867–8908, https://doi.org/10.5194/acp-20-8867-2020, 2020. a
Costabile, F., Gilardoni, S., Barnaba, F., Di Ianni, A., Di Liberto, L., Dionisi, D., Manigrasso, M., Paglione, M., Poluzzi, V., Rinaldi, M., Facchini, M. C., and Gobbi, G. P.: Characteristics of brown carbon in the urban Po Valley atmosphere, Atmos. Chem. Phys., 17, 313–326, https://doi.org/10.5194/acp-17-313-2017, 2017. a, b
Das, S. K. and Jayaraman, A.: Role of black carbon in aerosol properties and radiative forcing over western India during premonsoon period, Atmos. Res., 102, 320–334, https://doi.org/10.1016/j.atmosres.2011.08.003, 2011. a
Drinovec, L., Močnik, G., Zotter, P., Prévôt, A. S. H., Ruckstuhl, C., Coz, E., Rupakheti, M., Sciare, J., Müller, T., Wiedensohler, A., and Hansen, A. D. A.: The “dual-spot” Aethalometer: an improved measurement of aerosol black carbon with real-time loading compensation, Atmos. Meas. Tech., 8, 1965–1979, https://doi.org/10.5194/amt-8-1965-2015, 2015. a, b, c, d
Drinovec, L., Jagodič, U., Pirker, L., Škarabot, M., Kurtjak, M., Vidović, K., Ferrero, L., Visser, B., Röhrbein, J., Weingartner, E., Kalbermatter, D. M., Vasilatou, K., Bühlmann, T., Pascale, C., Müller, T., Wiedensohler, A., and Močnik, G.: A dual-wavelength photothermal aerosol absorption monitor: design, calibration and performance, Atmos. Meas. Tech., 15, 3805–3825, https://doi.org/10.5194/amt-15-3805-2022, 2022. a
Dubovik, O., Lapyonok, T., Litvinov, P., Herman, M., Fuertes, M., Ducos, F., Torres, B., Derimian, Y., Huang, X., Lopatin, A., Chaikovsky, A., Aspetsberger, M., and Federspiel, C.: GRASP: a versatile algorithm for characterizing the atmosphere, SPIE: Newsroom, online, https://doi.org/10.1117/2.1201408.005558, 19 September 2014. a
Dubovik, O., Smirnov, A., Holben, B. N., King, M. D., Kaufman, Y. J., Eck, T. F., and Slutsker, I.: Accuracy assessments of aerosol optical properties retrieved from Aerosol Robotic Network (AERONET) Sun and sky radiance measurements, J. Geophys. Res.-Atmos., 105, 9791–9806, https://doi.org/10.1029/2000JD900040, 2000. a, b
Dubovik, O., Holben, B., Eck, T. F., Smirnov, A., Kaufman, Y. J., King, M. D., Tanré, D., and Slutsker, I.: Variability of Absorption and Optical Properties of Key Aerosol Types Observed in Worldwide Locations, J. Atmos. Sci., 59, 590–608, https://doi.org/10.1175/1520-0469(2002)059<0590:VOAAOP>2.0.CO;2, 2002. a
Ealo, M., Alastuey, A., Pérez, N., Ripoll, A., Querol, X., and Pandolfi, M.: Impact of aerosol particle sources on optical properties in urban, regional and remote areas in the north-western Mediterranean, Atmos. Chem. Phys., 18, 1149–1169, https://doi.org/10.5194/acp-18-1149-2018, 2018. a, b
Eck, T. F., Holben, B. N., Reid, J. S., Dubovik, O., Smirnov, A., O'Neill, N. T., Slutsker, I., and Kinne, S.: Wavelength dependence of the optical depth of biomass burning, urban, and desert dust aerosols, J. Geophys. Res.-Atmos., 104, 31333–31349, https://doi.org/10.1029/1999JD900923, 1999. a, b
ECMWF: IFS DOCUMENTATION – Cy43r3, Operational implementation 11 July 2017 PART IV: PHYSICAL PROCESSES, ECMWF, https://doi.org/10.21957/efyk72kl, 2017. a
European Environment Agency: Status of black carbon monitoring in ambient air in Europe, Tech. Rep. 18/2013, Publications Office, Luxembourg, https://op.europa.eu/s/y5BV (last access: 24 November 2023), 2013. a
Evangeliou, N., Platt, S. M., Eckhardt, S., Lund Myhre, C., Laj, P., Alados-Arboledas, L., Backman, J., Brem, B. T., Fiebig, M., Flentje, H., Marinoni, A., Pandolfi, M., Yus-Dìez, J., Prats, N., Putaud, J. P., Sellegri, K., Sorribas, M., Eleftheriadis, K., Vratolis, S., Wiedensohler, A., and Stohl, A.: Changes in black carbon emissions over Europe due to COVID-19 lockdowns, Atmos. Chem. Phys., 21, 2675–2692, https://doi.org/10.5194/acp-21-2675-2021, 2021. a
Feng, Y., Ramanathan, V., and Kotamarthi, V. R.: Brown carbon: a significant atmospheric absorber of solar radiation?, Atmos. Chem. Phys., 13, 8607–8621, https://doi.org/10.5194/acp-13-8607-2013, 2013. a
Ferrero, L., Močnik, G., Ferrini, B., Perrone, M., Sangiorgi, G., and Bolzacchini, E.: Vertical profiles of aerosol absorption coefficient from micro-Aethalometer data and Mie calculation over Milan, Sci. Total Environ., 409, 2824–2837, https://doi.org/10.1016/j.scitotenv.2011.04.022, 2011. a, b, c, d
Ferrero, L., Castelli, M., Ferrini, B. S., Moscatelli, M., Perrone, M. G., Sangiorgi, G., D'Angelo, L., Rovelli, G., Moroni, B., Scardazza, F., Močnik, G., Bolzacchini, E., Petitta, M., and Cappelletti, D.: Impact of black carbon aerosol over Italian basin valleys: high-resolution measurements along vertical profiles, radiative forcing and heating rate, Atmos. Chem. Phys., 14, 9641–9664, https://doi.org/10.5194/acp-14-9641-2014, 2014. a, b, c, d
Ferrero, L., Močnik, G., Cogliati, S., Gregorič, A., Colombo, R., and Bolzacchini, E.: Heating Rate of Light Absorbing Aerosols: Time-Resolved Measurements, the Role of Clouds, and Source Identification, Environ. Sci. Technol., 52, 3546–3555, https://doi.org/10.1021/acs.est.7b04320, 2018. a
Ferrero, L., Riccio, A., Ferrini, B. S., D'Angelo, L., Rovelli, G., Casati, M., Angelini, F., Barnaba, F., Gobbi, G. P., Cataldi, M., and Bolzacchini, E.: Satellite AOD conversion into ground PM10. PM2.5 and PM1 over the Po valley (Milan, Italy) exploiting information on aerosol vertical profiles, chemistry, hygroscopicity and meteorology, Atmos. Pollut. Res., 10, 1895–1912, https://doi.org/10.1016/j.apr.2019.08.003, 2019. a
Ferrero, L., Bernardoni, V., Santagostini, L., Cogliati, S., Soldan, F., Valentini, S., D., M., Močnik, G., Gregorič, A., Rigler, M., Prati, P., Bigogno, A., Losi, N., Valli, G., Vecchi, R., and Bolzacchini, E.: Consistent determination of the heating rate of light-absorbing aerosol using wavelength- and time-dependent Aethalometer multiple-scattering correction, Sci. Total Environ., 791, 148277, https://doi.org/10.1016/j.scitotenv.2021.148277, 2021a. a
Ferrero, L., Gregorič, A., Močnik, G., Rigler, M., Cogliati, S., Barnaba, F., Di Liberto, L., Gobbi, G. P., Losi, N., and Bolzacchini, E.: The impact of cloudiness and cloud type on the atmospheric heating rate of black and brown carbon in the Po Valley, Atmos. Chem. Phys., 21, 4869–4897, https://doi.org/10.5194/acp-21-4869-2021, 2021b. a, b, c, d
Forster, P., Storelvmo, T., Armour, K., Collins, W., Dufresne, J.-L., Frame, D., Lunt, D. J., Mauritsen, T., Palmer, M. D., Watanabe, M., Wild, M., and Zhang, H.: The Earth's Energy Budget, Climate Feedbacks and Climate Sensitivity, in: Climate Change 2021: The Physical Science Basis. Contribution of Working Group I to the Sixth Assessment Report of the Intergovernmental Panel on Climate Change, edited by: Masson-Delmotte, V., Zhai, P., Pirani, A., Connors, S. L., Péan, C., Berger, S., Caud, N., Chen, Y., Goldfarb, L., Gomis, M. I., Huang, M., Leitzell, K., Lonnoy, E., Matthews, J. B. R., Maycock, T. K., Waterfield, T., Yelekçi, O., Yu, R., and Zhou, B., Cambridge University Press, Cambridge, United Kingdom and New York, NY, USA, 923–1054, https://doi.org/10.1017/9781009157896.009, 2021. a, b
Ghermandi, G., Fabbi, S., Veratti, G., Bigi, A., and Teggi, S.: Estimate of secondary NO2 levels at two urban traffic sites using observations and modelling, Sustainability-Basel, 12, 7897, https://doi.org/10.3390/SU12197897, 2020. a
Gilardoni, S., Massoli, P., Paglione, M., Giulianelli, L., Carbone, C., Rinaldi, M., Decesari, S., Sandrini, S., Costabile, F., Gobbi, G. P., Pietrogrande, M. C., Visentin, M., Scotto, F., Fuzzi, S., and Facchini, M. C.: Direct observation of aqueous secondary organic aerosol from biomass-burning emissions, P. Natl. Acad. Sci. USA, 113, 10013–10018, https://doi.org/10.1073/pnas.1602212113, 2016. a
Gilardoni, S., Massoli, P., Marinoni, A., Mazzoleni, C., Freedman, A., Lonati, G., De Iuliis, S., and Gianelle, V.: Spatial and temporal variability of carbonaceous aerosol absorption in the Po Valley, Aerosol Air Qual. Res., 20, 2624–2639, https://doi.org/10.4209/aaqr.2020.03.0085, 2020a. a, b, c, d, e, f, g, h, i
Gilardoni, S., Tarozzi, L., Sandrini, S., Ielpo, P., Contini, D., Putaud, J.-P., Cavalli, F., Poluzzi, V., Bacco, D., Leonardi, C., Genga, A., Langone, L., and Fuzzi, S.: Reconstructing Elemental Carbon Long-Term Trend in the Po Valley (Italy) from Fog Water Samples, Atmosphere, 11, 580, https://doi.org/10.3390/atmos11060580, 2020b. a
Giles, D. M., Holben, B. N., Eck, T. F., Sinyuk, A., Smirnov, A., Slutsker, I., Dickerson, R. R., Thompson, A. M., and Schafer, J. S.: An analysis of AERONET aerosol absorption properties and classifications representative of aerosol source regions, J. Geophys. Res.-Atmos., 117, D17203, https://doi.org/10.1029/2012JD018127, 2012. a, b
Good, N., Mölter, A., Peel, J. L., and Volckens, J.: An accurate filter loading correction is essential for assessing personal exposure to black carbon using an Aethalometer, J. Expo. Sci. Env. Epid., 27, 409–416, https://doi.org/10.1038/jes.2016.71, 2017. a
Grivas, G., Stavroulas, I., Liakakou, E., Kaskaoutis, D. G., Bougiatioti, A., Paraskevopoulou, D., Gerasopoulos, E., and Mihalopoulos, N.: Measuring the spatial variability of black carbon in Athens during wintertime, Air Qual. Atmos. Hlth, 12, 1405–1417, https://doi.org/10.1007/s11869-019-00756-y, 2019. a
Guo, J., Zhang, J., Yang, K., Liao, H., Zhang, S., Huang, K., Lv, Y., Shao, J., Yu, T., Tong, B., Li, J., Su, T., Yim, S. H. L., Stoffelen, A., Zhai, P., and Xu, X.: Investigation of near-global daytime boundary layer height using high-resolution radiosondes: first results and comparison with ERA5, MERRA-2, JRA-55, and NCEP-2 reanalyses, Atmos. Chem. Phys., 21, 17079–17097, https://doi.org/10.5194/acp-21-17079-2021, 2021. a, b
Heald, C. L., Ridley, D. A., Kroll, J. H., Barrett, S. R. H., Cady-Pereira, K. E., Alvarado, M. J., and Holmes, C. D.: Contrasting the direct radiative effect and direct radiative forcing of aerosols, Atmos. Chem. Phys., 14, 5513–5527, https://doi.org/10.5194/acp-14-5513-2014, 2014. a, b
Hersbach, H., Bell, B., Berrisford, P., Biavati, G., Horányi, A., Muñoz Sabater, J., Nicolas, J., Peubey, C., Radu, R., Rozum, I., Schepers, D., Simmons, A., Soci, C., Dee, D., and Thépaut, J.-N.: ERA5 hourly data on single levels from 1979 to present, Copernicus Climate Change Service (C3S) Climate Data Store (CDS) [data set], https://doi.org/10.24381/cds.adbb2d47, 2023. a, b
Holben, B., Eck, T., Slutsker, I., Tanré, D., Buis, J., Setzer, A., Vermote, E., Reagan, J., Kaufman, Y., Nakajima, T., Lavenu, F., Jankowiak, I., and Smirnover, A.: AERONET – A Federated Instrument Network and Data Archive for Aerosol Characterization, Remote Sens. Environ., 66, 1–16, https://doi.org/10.1016/S0034-4257(98)00031-5, 1998. a, b
Hyvärinen, A.-P., Vakkari, V., Laakso, L., Hooda, R. K., Sharma, V. P., Panwar, T. S., Beukes, J. P., van Zyl, P. G., Josipovic, M., Garland, R. M., Andreae, M. O., Pöschl, U., and Petzold, A.: Correction for a measurement artifact of the Multi-Angle Absorption Photometer (MAAP) at high black carbon mass concentration levels, Atmos. Meas. Tech., 6, 81–90, https://doi.org/10.5194/amt-6-81-2013, 2013. a
Janssen, N. A., Gerlofs-Nijland, M. E., Lanki, T., Salonen, R. O., Cassee, F., Hoek, G., Fischer, P., Brunekreef, B., and Krzyzanowsk, M.: Health Effects of Black Carbon, Tech. rep., WHO regional office for Europe, Copenhagen, ISBN: 978 92 890 0265 3, 2012. a
Jo, D. S., Park, R. J., Lee, S., Kim, S.-W., and Zhang, X.: A global simulation of brown carbon: implications for photochemistry and direct radiative effect, Atmos. Chem. Phys., 16, 3413–3432, https://doi.org/10.5194/acp-16-3413-2016, 2016. a
Kalbermatter, D. M., Močnik, G., Drinovec, L., Visser, B., Röhrbein, J., Oscity, M., Weingartner, E., Hyvärinen, A.-P., and Vasilatou, K.: Comparing black-carbon- and aerosol-absorption-measuring instruments – a new system using lab-generated soot coated with controlled amounts of secondary organic matter, Atmos. Meas. Tech., 15, 561–572, https://doi.org/10.5194/amt-15-561-2022, 2022. a
Kaskaoutis, D. G., Grivas, G., Stavroulas, I., Bougiatioti, A., Liakakou, E., Dumka, U. C., Gerasopoulos, E., and Mihalopoulos, N.: Apportionment of black and brown carbon spectral absorption sources in the urban environment of Athens, Greece, during winter, Sci. Total Environ., 801, 149739, https://doi.org/10.1016/j.scitotenv.2021.149739, 2021. a, b, c
Katsanos, D., Bougiatioti, A., Liakakou, E., Kaskaoutis, D. G., Stavroulas, I., Paraskevopoulou, D., Lianou, M., Psiloglou, B. E., Gerasopoulos, E., Pilinis, C., and Mihalopoulos, N.: Optical Properties of Near-Surface Urban Aerosols and their Chemical Tracing in a Mediterranean City (Athens), Aerosol Air Qual. Res., 19, 49–70, https://doi.org/10.4209/aaqr.2017.11.0544, 2019. a
Kayetha, V., Torres, O., and Jethva, H.: Retrieval of UV–visible aerosol absorption using AERONET and OMI–MODIS synergy: spatial and temporal variability across major aerosol environments, Atmos. Meas. Tech., 15, 845–877, https://doi.org/10.5194/amt-15-845-2022, 2022. a, b, c
Kedia, S., Ramachandran, S., Kumar, A., and Sarin, M. M.: Spatiotemporal gradients in aerosol radiative forcing and heating rate over Bay of Bengal and Arabian Sea derived on the basis of optical, physical, and chemical properties, J. Geophys. Res.-Atmos., 115, D07205, https://doi.org/10.1029/2009JD013136, 2010. a, b
Kezoudi, M., Keleshis, C., Antoniou, P., Biskos, G., Bronz, M., Constantinides, C., Desservettaz, M., Gao, R.-S., Girdwood, J., Harnetiaux, J., Kandler, K., Leonidou, A., Liu, Y., Lelieveld, J., Marenco, F., Mihalopoulos, N., Močnik, G., Neitola, K., Paris, J.-D., Pikridas, M., Sarda-Esteve, R., Stopford, C., Unga, F., Vrekoussis, M., and Sciare, J.: The Unmanned Systems Research Laboratory (USRL): A New Facility for UAV-Based Atmospheric Observations, Atmosphere, 12, 1042, https://doi.org/10.3390/atmos12081042, 2021. a
Kim, S.-W., Cho, C., and Rupakheti, M.: Estimating contributions of black and brown carbon to solar absorption from aethalometer and AERONET measurements in the highly polluted Kathmandu Valley, Nepal, Atmos. Res., 247, 105164, https://doi.org/10.1016/j.atmosres.2020.105164, 2021. a
Kirrane, E. F., Luben, T. J., Benson, A., Owens, E. O., Sacks, J. D., Dutton, S. J., Madden, M., and Nichols, J. L.: A systematic review of cardiovascular responses associated with ambient black carbon and fine particulate matter, Environ. Int., 127, 305–316, https://doi.org/10.1016/j.envint.2019.02.027, 2019. a
Lack, D. A., Moosmüller, H., McMeeking, G. R., Chakrabarty, R. K., and Baumgardner, D.: Characterizing elemental, equivalent black, and refractory black carbon aerosol particles: a review of techniques, their limitations and uncertainties, Anal. Bioanal. Chem., 406, 99–122, https://doi.org/10.1007/s00216-013-7402-3, 2014. a
Laj, P., Bigi, A., Rose, C., Andrews, E., Lund Myhre, C., Collaud Coen, M., Lin, Y., Wiedensohler, A., Schulz, M., Ogren, J. A., Fiebig, M., Gliß, J., Mortier, A., Pandolfi, M., Petäja, T., Kim, S.-W., Aas, W., Putaud, J.-P., Mayol-Bracero, O., Keywood, M., Labrador, L., Aalto, P., Ahlberg, E., Alados Arboledas, L., Alastuey, A., Andrade, M., Artíñano, B., Ausmeel, S., Arsov, T., Asmi, E., Backman, J., Baltensperger, U., Bastian, S., Bath, O., Beukes, J. P., Brem, B. T., Bukowiecki, N., Conil, S., Couret, C., Day, D., Dayantolis, W., Degorska, A., Eleftheriadis, K., Fetfatzis, P., Favez, O., Flentje, H., Gini, M. I., Gregorič, A., Gysel-Beer, M., Hallar, A. G., Hand, J., Hoffer, A., Hueglin, C., Hooda, R. K., Hyvärinen, A., Kalapov, I., Kalivitis, N., Kasper-Giebl, A., Kim, J. E., Kouvarakis, G., Kranjc, I., Krejci, R., Kulmala, M., Labuschagne, C., Lee, H.-J., Lihavainen, H., Lin, N.-H., Löschau, G., Luoma, K., Marinoni, A., Martins Dos Santos, S., Meinhardt, F., Merkel, M., Metzger, J.-M., Mihalopoulos, N., Nguyen, N. A., Ondracek, J., Pérez, N., Perrone, M. R., Petit, J.-E., Picard, D., Pichon, J.-M., Pont, V., Prats, N., Prenni, A., Reisen, F., Romano, S., Sellegri, K., Sharma, S., Schauer, G., Sheridan, P., Sherman, J. P., Schütze, M., Schwerin, A., Sohmer, R., Sorribas, M., Steinbacher, M., Sun, J., Titos, G., Toczko, B., Tuch, T., Tulet, P., Tunved, P., Vakkari, V., Velarde, F., Velasquez, P., Villani, P., Vratolis, S., Wang, S.-H., Weinhold, K., Weller, R., Yela, M., Yus-Diez, J., Zdimal, V., Zieger, P., and Zikova, N.: A global analysis of climate-relevant aerosol properties retrieved from the network of Global Atmosphere Watch (GAW) near-surface observatories, Atmos. Meas. Tech., 13, 4353–4392, https://doi.org/10.5194/amt-13-4353-2020, 2020. a, b, c
Langridge, J. M., Richardson, M. S., Lack, D. A., Brock, C. A., and Murphy, D. M.: Limitations of the Photoacoustic Technique for Aerosol Absorption Measurement at High Relative Humidity, Aerosol Sci. Tech., 47, 1163–1173, https://doi.org/10.1080/02786826.2013.827324, 2013. a
Lapo, K., Nijssen, B., and Lundquist, J. D.: Evaluation of Turbulence Stability Schemes of Land Models for Stable Conditions, J. Geophys. Res.-Atmospheres, 124, 3072–3089, https://doi.org/10.1029/2018JD028970, 2019. a
Laskin, A., Laskin, J., and Nizkorodov, S. A.: Chemistry of Atmospheric Brown Carbon, Chem. Rev., 115, 4335–4382, https://doi.org/10.1021/cr5006167, 2015. a, b
Li, C., Windwer, E., Fang, Z., Nissenbaum, D., and Rudich, Y.: Correcting micro-aethalometer absorption measurements for brown carbon aerosol, Sci. Total Environ., 777, 146143, https://doi.org/10.1016/j.scitotenv.2021.146143, 2021. a
Li, C., Misovich, M. V., Pardo, M., Fang, Z., Laskin, A., Chen, J., and Rudich, Y.: Secondary organic aerosol formation from atmospheric reactions of anisole and associated health effects, Chemosphere, 308, 136421, https://doi.org/10.1016/j.chemosphere.2022.136421, 2022. a
Li, H., McMeeking, G. R., and May, A. A.: Development of a new correction algorithm applicable to any filter-based absorption photometer, Atmos. Meas. Tech., 13, 2865–2886, https://doi.org/10.5194/amt-13-2865-2020, 2020. a
Li, J., Carlson, B. E., Dubovik, O., and Lacis, A. A.: Recent trends in aerosol optical properties derived from AERONET measurements, Atmos. Chem. Phys., 14, 12271–12289, https://doi.org/10.5194/acp-14-12271-2014, 2014. a
Liakakou, E., Kaskaoutis, D. G., Grivas, G., Stavroulas, I., Tsagkaraki, M., Paraskevopoulou, D., Bougiatioti, A., Dumka, U. C., Gerasopoulos, E., and Mihalopoulos, N.: Long-term brown carbon spectral characteristics in a Mediterranean city (Athens), Sci. Total Environ., 708, 135019, https://doi.org/10.1016/j.scitotenv.2019.135019, 2020. a, b
Lin, G., Penner, J. E., Flanner, M. G., Sillman, S., Xu, L., and Zhou, C.: Radiative forcing of organic aerosol in the atmosphere and on snow: Effects of SOA and brown carbon, J. Geophys. Res.-Atmos., 119, 7453–7476, https://doi.org/10.1002/2013JD021186, 2014. a, b
Liu, C., Chung, C. E., Yin, Y., and Schnaiter, M.: The absorption Ångström exponent of black carbon: from numerical aspects, Atmos. Chem. Phys., 18, 6259–6273, https://doi.org/10.5194/acp-18-6259-2018, 2018. a
Liu, M., Peng, X., Meng, Z., Zhou, T., Long, L., and She, Q.: Spatial characteristics and determinants of in-traffic black carbon in Shanghai, China: Combination of mobile monitoring and land use regression model, Sci. Total Environ., 658, 51–61, https://doi.org/10.1016/j.scitotenv.2018.12.135, 2019. a
Liu, X., Hadiatullah, H., Zhang, X., Hill, L. D., White, A. H. A., Schnelle-Kreis, J., Bendl, J., Jakobi, G., Schloter-Hai, B., and Zimmermann, R.: Analysis of mobile monitoring data from the microAeth® MA200 for measuring changes in black carbon on the roadside in Augsburg, Atmos. Meas. Tech., 14, 5139–5151, https://doi.org/10.5194/amt-14-5139-2021, 2021. a
Loría-Salazar, S. M., Arnott, W. P., and Moosmüller, H.: Accuracy of near-surface aerosol extinction determined from columnar aerosol optical depth measurements in Reno, NV, USA, J. Geophys. Res.-Atmos., 119, 11355–11374, https://doi.org/10.1002/2014JD022138, 2014. a
Loomis, D., Grosse, Y., Lauby-Secretan, B., Ghissassi, F. E., Bouvard, V., Benbrahim-Tallaa, L., Guha, N., Baan, R., Mattock, H., and Straif, K.: The carcinogenicity of outdoor air pollution, The Lancet Oncol., 14, 1262–1263, https://doi.org/10.1016/S1470-2045(13)70487-X, 2013. a
Luben, T. J., Nichols, J. L., Dutton, S. J., Kirrane, E., Owens, E. O., Datko-Williams, L., Madden, M., and Sacks, J. D.: A systematic review of cardiovascular emergency department visits, hospital admissions and mortality associated with ambient black carbon, Environ. Int., 107, 154–162, https://doi.org/10.1016/j.envint.2017.07.005, 2017. a
Magalhaes, S., Baumgartner, J., and Weichenthal, S.: Impacts of exposure to black carbon, elemental carbon, and ultrafine particles from indoor and outdoor sources on blood pressure in adults: A review of epidemiological evidence, Environ. Res., 161, 345–353, https://doi.org/10.1016/j.envres.2017.11.030, 2018. a
Mahrt, L.: Stably Stratified Atmospheric Boundary Layers, Annu. Rev. Fluid Mech., 46, 23–45, https://doi.org/10.1146/annurev-fluid-010313-141354, 2014. a
Mallet, M., Dubovik, O., Nabat, P., Dulac, F., Kahn, R., Sciare, J., Paronis, D., and Léon, J. F.: Absorption properties of Mediterranean aerosols obtained from multi-year ground-based remote sensing observations, Atmos. Chem. Phys., 13, 9195–9210, https://doi.org/10.5194/acp-13-9195-2013, 2013. a
Maroneze, R., Acevedo, O. C., Costa, F. D., Puhales, F. S., Anabor, V., Lemes, D. N., and Mortarini, L.: How is the Two-Regime Stable Boundary Layer Reproduced by the Different Turbulence Parametrizations in the Weather Research and Forecasting Model?, Bound.-Lay. Meteorol., 178, 383–413, https://doi.org/10.1007/s10546-020-00581-2, 2021. a
Martilli, A., Sanchez, B., Rasilla, D., Pappaccogli, G., Allende, F., Martin, F., Román-Cascón, C., Yagüe, C., and Fernandez, F.: Simulating the meteorology during persistent Wintertime Thermal Inversions over urban areas. The case of Madrid, Atmos. Res., 263, 105789, https://doi.org/10.1016/j.atmosres.2021.105789, 2021. a
Massabò, D., Caponi, L., Bernardoni, V., Bove, M., Brotto, P., Calzolai, G., Cassola, F., Chiari, M., Fedi, M., Fermo, P., Giannoni, M., Lucarelli, F., Nava, S., Piazzalunga, A., Valli, G., Vecchi, R., and Prati, P.: Multi-wavelength optical determination of black and brown carbon in atmospheric aerosols, Atmos. Environ., 108, 1–12, https://doi.org/10.1016/j.atmosenv.2015.02.058, 2015. a, b
Moosmüller, H., Chakrabarty, R., and Arnott, W.: Aerosol light absorption and its measurement: A review, J. Quant. Spectrosc. Ra., 110, 844–878, https://doi.org/10.1016/j.jqsrt.2009.02.035, 2009. a, b, c
Nakajima, T., Campanelli, M., Che, H., Estellés, V., Irie, H., Kim, S.-W., Kim, J., Liu, D., Nishizawa, T., Pandithurai, G., Soni, V. K., Thana, B., Tugjsurn, N.-U., Aoki, K., Go, S., Hashimoto, M., Higurashi, A., Kazadzis, S., Khatri, P., Kouremeti, N., Kudo, R., Marenco, F., Momoi, M., Ningombam, S. S., Ryder, C. L., Uchiyama, A., and Yamazaki, A.: An overview of and issues with sky radiometer technology and SKYNET, Atmos. Meas. Tech., 13, 4195–4218, https://doi.org/10.5194/amt-13-4195-2020, 2020. a
Offer, S., Hartner, E., Bucchianico, S. D., Bisig, C., Bauer, S., Pantzke, J., Zimmermann, E. J., Cao, X., Binder, S., Kuhn, E., Huber, A., Jeong, S., Käfer, U., Martens, P., Mesceriakovas, A., Bendl, J., Brejcha, R., Buchholz, A., Gat, D., Hohaus, T., Rastak, N., Jakobi, G., Kalberer, M., Kanashova, T., Hu, Y., Ogris, C., Marsico, A., Theis, F., Pardo, M., Gröger, T., Oeder, S., Orasche, J., Paul, A., Ziehm, T., Zhang, Z.-H., Adam, T., Sippula, O., Sklorz, M., Schnelle-Kreis, J., Czech, H., Kiendler-Scharr, A., Rudich, Y., and Zimmermann, R.: Effect of Atmospheric Aging on Soot Particle Toxicity in Lung Cell Models at the Air–Liquid Interface: Differential Toxicological Impacts of Biogenic and Anthropogenic Secondary Organic Aerosols (SOAs), Environ. Health Persp., 130, 027003, https://doi.org/10.1289/EHP9413, 2022. a
O'Neill, N. T., Eck, T. F., Smirnov, A., Holben, B. N., and Thulasiraman, S.: Spectral discrimination of coarse and fine mode optical depth, J. Geophys. Res.-Atmos., 108, 4559, https://doi.org/10.1029/2002JD002975, 2003. a
Ostro, B., Tobias, A., Karanasiou, A., Samoli, E., Querol, X., Rodopoulou, S., Basagaña, X., Eleftheriadis, K., Diapouli, E., Vratolis, S., Jacquemin, B., Katsouyanni, K., Sunyer, J., Forastiere, F., and Stafoggia, M.: The risks of acute exposure to black carbon in Southern Europe: results from the MED-PARTICLES project, Occup. Environ. Med., 72, 123–129, https://doi.org/10.1136/oemed-2014-102184, 2015. a
Paglione, M., Gilardoni, S., Rinaldi, M., Decesari, S., Zanca, N., Sandrini, S., Giulianelli, L., Bacco, D., Ferrari, S., Poluzzi, V., Scotto, F., Trentini, A., Poulain, L., Herrmann, H., Wiedensohler, A., Canonaco, F., Prévôt, A. S. H., Massoli, P., Carbone, C., Facchini, M. C., and Fuzzi, S.: The impact of biomass burning and aqueous-phase processing on air quality: a multi-year source apportionment study in the Po Valley, Italy, Atmos. Chem. Phys., 20, 1233–1254, https://doi.org/10.5194/acp-20-1233-2020, 2020. a
Petzold, A., Schloesser, H., Sheridan, P. J., Arnott, W. P., Ogren, J. A., and Virkkula, A.: Evaluation of Multiangle Absorption Photometry for Measuring Aerosol Light Absorption, Aerosol Sci. Tech., 39, 40–51, https://doi.org/10.1080/027868290901945, 2005. a
Petzold, A., Ogren, J. A., Fiebig, M., Laj, P., Li, S.-M., Baltensperger, U., Holzer-Popp, T., Kinne, S., Pappalardo, G., Sugimoto, N., Wehrli, C., Wiedensohler, A., and Zhang, X.-Y.: Recommendations for reporting “black carbon” measurements, Atmos. Chem. Phys., 13, 8365–8379, https://doi.org/10.5194/acp-13-8365-2013, 2013. a
Pikridas, M., Bezantakos, S., Močnik, G., Keleshis, C., Brechtel, F., Stavroulas, I., Demetriades, G., Antoniou, P., Vouterakos, P., Argyrides, M., Liakakou, E., Drinovec, L., Marinou, E., Amiridis, V., Vrekoussis, M., Mihalopoulos, N., and Sciare, J.: On-flight intercomparison of three miniature aerosol absorption sensors using unmanned aerial systems (UASs), Atmos. Meas. Tech., 12, 6425–6447, https://doi.org/10.5194/amt-12-6425-2019, 2019. a
Pöschl, U.: Atmospheric Aerosols: Composition, Transformation, Climate and Health Effects, Angew. Chem. Int. Edit., 44, 7520–7540, https://doi.org/10.1002/anie.200501122, 2005. a
Putaud, J. P., Cavalli, F., Martins dos Santos, S., and Dell'Acqua, A.: Long-term trends in aerosol optical characteristics in the Po Valley, Italy, Atmos. Chem. Phys., 14, 9129–9136, https://doi.org/10.5194/acp-14-9129-2014, 2014. a
Putaud, J.-P., Pozzoli, L., Pisoni, E., Martins Dos Santos, S., Lagler, F., Lanzani, G., Dal Santo, U., and Colette, A.: Impacts of the COVID-19 lockdown on air pollution at regional and urban background sites in northern Italy, Atmos. Chem. Phys., 21, 7597–7609, https://doi.org/10.5194/acp-21-7597-2021, 2021. a
Regencia, Z. J. G., Dalmacion, G. V., Ligsay, A. D., and Baja, E. S.: Short-Term Cumulative Exposure to Ambient Traffic-Related Black Carbon and Blood Pressure: MMDA Traffic Enforcers' Health Study, Int. J. Env. Res. Pub. He., 18, 12122, https://doi.org/10.3390/ijerph182212122, 2021. a
Rosenfeld, D., Andreae, M. O., Asmi, A., Chin, M., de Leeuw, G., Donovan, D. P., Kahn, R., Kinne, S., Kivekäs, N., Kulmala, M., Lau, W., Schmidt, K. S., Suni, T., Wagner, T., Wild, M., and Quaas, J.: Global observations of aerosol-cloud-precipitation-climate interactions, Rev. Geophys., 52, 750–808, https://doi.org/10.1002/2013RG000441, 2014. a
Russell, P. B., Bergstrom, R. W., Shinozuka, Y., Clarke, A. D., DeCarlo, P. F., Jimenez, J. L., Livingston, J. M., Redemann, J., Dubovik, O., and Strawa, A.: Absorption Angstrom Exponent in AERONET and related data as an indicator of aerosol composition, Atmos. Chem. Phys., 10, 1155–1169, https://doi.org/10.5194/acp-10-1155-2010, 2010. a, b
Saleh, R., Robinson, E. S., Tkacik, D. S., Ahern, A. T., Liu, S., Aiken, A. C., Sullivan, R. C., Presto, A. A., Dubey, M. K., Yokelson, R. J., Donahue, N. M., and Robinson, A. L.: Brownness of organics in aerosols from biomass burning linked to their black carbon content, Nat. Geosci., 7, 647–650, https://doi.org/10.1038/ngeo2220, 2014. a
Sandradewi, J., Prévôt, A. S. H., Szidat, S., Perron, N., Alfarra, M. R., Lanz, V. A., Weingartner, E., and Baltensperger, U.: Using Aerosol Light Absorption Measurements for the Quantitative Determination of Wood Burning and Traffic Emission Contributions to Particulate Matter, Environ. Sci. Technol., 42, 3316–3323, https://doi.org/10.1021/es702253m, 2008. a
Shen, J., Bigi, A., Marinoni, A., Lampilahti, J., Kontkanen, J., Ciarelli, G., Putaud, J., Nieminen, T., Kulmala, M., Lehtipalo, K., and Bianchi, F.: Emerging Investigator Series: COVID-19 lockdown effects on aerosol particle size distributions in Northern Italy, Environmental Science: Atmospheres, 1, 214–227, https://doi.org/10.1039/D1EA00016K, 2021. a
Shin, S.-K., Tesche, M., Müller, D., and Noh, Y.: Technical note: Absorption aerosol optical depth components from AERONET observations of mixed dust plumes, Atmos. Meas. Tech., 12, 607–618, https://doi.org/10.5194/amt-12-607-2019, 2019. a, b
Sinyuk, A., Holben, B. N., Eck, T. F., Giles, D. M., Slutsker, I., Korkin, S., Schafer, J. S., Smirnov, A., Sorokin, M., and Lyapustin, A.: The AERONET Version 3 aerosol retrieval algorithm, associated uncertainties and comparisons to Version 2, Atmos. Meas. Tech., 13, 3375–3411, https://doi.org/10.5194/amt-13-3375-2020, 2020. a, b, c, d, e
Slater, J. F. and Dibb, J. E.: Relationships between surface and column aerosol radiative properties and air mass transport at a rural New England site, J. Geophys. Res.-Atmos., 109, D01303, https://doi.org/10.1029/2003JD003406, 2004. a, b
Stavroulas, I., Pikridas, M., Grivas, G., Bezantakos, S., Liakakou, E., Kalkavouras, P., Veratti, G., Bigi, A., Gerasopoulos, E., Sciare, J., and Mihalopoulos, N.: Field evaluation of miniature absorption photometers in an Eastern Mediterranean urban environment, in: 11th International Aerosol Conference (IAC 2022), Athens, Greece, 4-9 September 2022. a
Takemura, T. and Suzuki, K.: Weak global warming mitigation by reducing black carbon emissions, Sci. Rep.-UK, 9, 1–6, https://doi.org/10.1038/s41598-019-41181-6, 2019. a
Thornhill, G. D., Collins, W. J., Kramer, R. J., Olivié, D., Skeie, R. B., O'Connor, F. M., Abraham, N. L., Checa-Garcia, R., Bauer, S. E., Deushi, M., Emmons, L. K., Forster, P. M., Horowitz, L. W., Johnson, B., Keeble, J., Lamarque, J.-F., Michou, M., Mills, M. J., Mulcahy, J. P., Myhre, G., Nabat, P., Naik, V., Oshima, N., Schulz, M., Smith, C. J., Takemura, T., Tilmes, S., Wu, T., Zeng, G., and Zhang, J.: Effective radiative forcing from emissions of reactive gases and aerosols – a multi-model comparison, Atmos. Chem. Phys., 21, 853–874, https://doi.org/10.5194/acp-21-853-2021, 2021. a
Thunis, P., Degraeuwe, B., Pisoni, E., Trombetti, M., Peduzzi, E., Belis, C. A., Wilson, J., and Vignati, E.: Urban PM2.5 Atlas – Air quality in European cities, EUR 28804 EN, Publications Office of the European Union, Luxembourg, https://doi.org/10.2760/336669, 2017. a
Tuet, W. Y., Chen, Y., Xu, L., Fok, S., Gao, D., Weber, R. J., and Ng, N. L.: Chemical oxidative potential of secondary organic aerosol (SOA) generated from the photooxidation of biogenic and anthropogenic volatile organic compounds, Atmos. Chem. Phys., 17, 839–853, https://doi.org/10.5194/acp-17-839-2017, 2017. a
Twomey, S.: Pollution and the planetary albedo, Atmospheric Environment (1967), 8, 1251–1256, https://doi.org/10.1016/0004-6981(74)90004-3, 1974. a
Uria-Tellaetxe, I. and Carslaw, D. C.: Conditional bivariate probability function for source identification, Environ. Modell. Softw., 59, 1–9, https://doi.org/10.1016/j.envsoft.2014.05.002, 2014. a
Vecchi, R., Bernardoni, V., Valentini, S., Piazzalunga, A., Fermo, P., and Valli, G.: Assessment of light extinction at a European polluted urban area during wintertime: Impact of PM1 composition and sources, Environ. Pollut., 233, 679–689, https://doi.org/10.1016/j.envpol.2017.10.059, 2018. a, b
Veratti, G., Fabbi, S., Bigi, A., Lupascu, A., Tinarelli, G., Teggi, S., Brusasca, G., Butler, T., and Ghermandi, G.: Towards the coupling of a chemical transport model with a micro-scale Lagrangian modelling system for evaluation of urban NOx levels in a European hotspot, Atmos. Environ., 223, 117285, https://doi.org/10.1016/j.atmosenv.2020.117285, 2020. a
Veratti, G., Bigi, A., Lupascu, A., Butler, T., and Ghermandi, G.: Urban population exposure forecast system to predict NO2 impact by a building-resolving multi-scale model approach, Atmos. Environ., 261, 118566, https://doi.org/10.1016/j.atmosenv.2021.118566, 2021. a
Veratti, G., Stortini, M., Amorati, R., Bressan, L., Giovannini, G., Bande, S., Bissardella, F., Ghigo, S., Angelino, E., Colombo, L., Fossati, G., Malvestiti, G., Marongiu, A., Dalla Fontana, A., Intini, B., and Pillon, S.: Impact of NOx and NH3 Emission Reduction on Particulate Matter across Po Valley: A LIFE-IP-PREPAIR Study, Atmosphere, 14, 762, https://doi.org/10.3390/atmos14050762, 2023. a
Viana, M., Rivas, I., Reche, C., Fonseca, A. S., Pérez, N., Querol, X., Alastuey, A., Álvarez Pedrerol, M., and Sunyer, J.: Field comparison of portable and stationary instruments for outdoor urban air exposure assessments, Atmos. Environ., 123, 220–228, https://doi.org/10.1016/j.atmosenv.2015.10.076, 2015. a
Virkkula, A., Mäkelä, T., Hillamo, R., Yli-Tuomi, T., Hirsikko, A., Hämeri, K., and Koponen, I. K.: A Simple Procedure for Correcting Loading Effects of Aethalometer Data, J. Air Waste Manage., 57, 1214–1222, https://doi.org/10.3155/1047-3289.57.10.1214, 2007. a
Visser, B., Röhrbein, J., Steigmeier, P., Drinovec, L., Močnik, G., and Weingartner, E.: A single-beam photothermal interferometer for in situ measurements of aerosol light absorption, Atmos. Meas. Tech., 13, 7097–7111, https://doi.org/10.5194/amt-13-7097-2020, 2020. a
Vogelezang, D. H. P. and Holtslag, A. A. M.: Evaluation and model impacts of alternative boundary-layer height formulations, Bound.-Lay. Meteorol., 81, 245–269, https://doi.org/10.1007/BF02430331, 1996. a
Wang, R.: Global emission inventory and atmospheric transport of Black Carbon, Springer Theses, Springer Berlin Heidelberg, Berlin, Heidelberg, https://doi.org/10.1007/978-3-662-46479-3, 2015. a
Wang, R., Balkanski, Y., Boucher, O., Ciais, P., Schuster, G. L., Chevallier, F., Samset, B. H., Liu, J., Piao, S., Valari, M., and Tao, S.: Estimation of global black carbon direct radiative forcing and its uncertainty constrained by observations, J. Geophys. Res.-Atmos., 121, 5948–5971, https://doi.org/10.1002/2015JD024326, 2016. a
Wang, X., Heald, C. L., Sedlacek, A. J., de Sá, S. S., Martin, S. T., Alexander, M. L., Watson, T. B., Aiken, A. C., Springston, S. R., and Artaxo, P.: Deriving brown carbon from multiwavelength absorption measurements: method and application to AERONET and Aethalometer observations, Atmos. Chem. Phys., 16, 12733–12752, https://doi.org/10.5194/acp-16-12733-2016, 2016. a, b
Weingartner, E., Saathoff, H., Schnaiter, M., Streit, N., Bitnar, B., and Baltensperger, U.: Absorption of light by soot particles: determination of the absorption coefficient by means of aethalometers, J. Aerosol Sci., 34, 1445–1463, https://doi.org/10.1016/S0021-8502(03)00359-8, 2003. a
Weitekamp, C. A., Stevens, T., Stewart, M. J., Bhave, P., and Gilmour, M. I.: Health effects from freshly emitted versus oxidatively or photochemically aged air pollutants, Sci. Total Environ., 704, 135772, https://doi.org/10.1016/j.scitotenv.2019.135772, 2020. a
West, J. J., Cohen, A., Dentener, F., Brunekreef, B., Zhu, T., Armstrong, B., Bell, M. L., Brauer, M., Carmichael, G., Costa, D. L., Dockery, D. W., Kleeman, M., Krzyzanowski, M., Künzli, N., Liousse, C., Lung, S.-C. C., Martin, R. V., Pöschl, U., Pope, C. A., Roberts, J. M., Russell, A. G., and Wiedinmyer, C.: What we breathe impacts our health: improving understanding of the link between air pollution and health, Environ. Sci. Technol., 50, 4895–4904, https://doi.org/10.1021/acs.est.5b03827, 2016. a
WHO: WHO global air quality guidelines. Particulate matter (PM2.5 and PM10), ozone, nitrogen dioxide, sulfur dioxide and carbon monoxide, Tech. rep., World Health Organization, Geneva, CH, ISBN 978-92-4-003422-8, 2021. a
Yang, J., Sakhvidi, M. J. Z., de Hoogh, K., Vienneau, D., Siemiatyck, J., Zins, M., Goldberg, M., Chen, J., Lequy, E., and Jacquemin, B.: Long-term exposure to black carbon and mortality: A 28-year follow-up of the GAZEL cohort, Environ. Int., 157, 106805, https://doi.org/10.1016/j.envint.2021.106805, 2021. a
Yus-Díez, J., Bernardoni, V., Močnik, G., Alastuey, A., Ciniglia, D., Ivančič, M., Querol, X., Perez, N., Reche, C., Rigler, M., Vecchi, R., Valentini, S., and Pandolfi, M.: Determination of the multiple-scattering correction factor and its cross-sensitivity to scattering and wavelength dependence for different AE33 Aethalometer filter tapes: a multi-instrumental approach, Atmos. Meas. Tech., 14, 6335–6355, https://doi.org/10.5194/amt-14-6335-2021, 2021. a
Zanatta, M., Gysel, M., Bukowiecki, N., Müller, T., Weingartner, E., Areskoug, H., Fiebig, M., Yttri, K. E., Mihalopoulos, N., Kouvarakis, G., Beddows, D., Harrison, R. M., Cavalli, F., Putaud, J. P., Spindler, G., Wiedensohler, A., Alastuey, A., Pandolfi, M., Sellegri, K., Swietlicki, E., Jaffrezo, J. L., Baltensperger, U., and Laj, P.: A European aerosol phenomenology-5: Climatology of black carbon optical properties at 9 regional background sites across Europe, Atmos. Environ., 145, 346–364, https://doi.org/10.1016/j.atmosenv.2016.09.035, 2016. a, b
Zhang, A., Wang, Y., Zhang, Y., Weber, R. J., Song, Y., Ke, Z., and Zou, Y.: Modeling the global radiative effect of brown carbon: a potentially larger heating source in the tropical free troposphere than black carbon, Atmos. Chem. Phys., 20, 1901–1920, https://doi.org/10.5194/acp-20-1901-2020, 2020. a
Zhang, X., Li, L., Chen, C., Zheng, Y., Dubovik, O., Derimian, Y., Lopatin, A., Gui, K., Wang, Y., Zhao, H., Liang, Y., Holben, B., Che, H., and Zhang, X.: Extensive characterization of aerosol optical properties and chemical component concentrations: Application of the GRASP/Component approach to long-term AERONET measurements, Sci. Total Environ., 812, 152553, https://doi.org/10.1016/j.scitotenv.2021.152553, 2022. a
Zhu, C., Miyakawa, T., Irie, H., Choi, Y., Taketani, F., and Kanaya, Y.: Light-absorption properties of brown carbon aerosols in the Asian outflow: Implications of a combination of filter and ground remote-sensing observations at Fukue Island, Japan, Sci. Total Environ., 797, 149155, https://doi.org/10.1016/j.scitotenv.2021.149155, 2021. a
- Abstract
- Introduction
- Measurement site and methods
- Results
- Conclusions
- Appendix A: AAOD apportionment model
- Appendix B: Description of symbols and acronyms used in the text
- Code and data availability
- Author contributions
- Competing interests
- Disclaimer
- Acknowledgements
- Financial support
- Review statement
- References
- Supplement