the Creative Commons Attribution 4.0 License.
the Creative Commons Attribution 4.0 License.
 | 29 Nov 2023
Summertime response of ozone and fine particulate matter to mixing layer meteorology over the North China Plain
Jiaqi Wang
Jian Gao
Fei Che
Xin Yang
Yuanqin Yang
Lei Liu
Yan Xiang
Haisheng Li
Measurements of surface ozone (O3), PM2.5 and its major secondary components (SO, NO, NH, and organic carbon (OC)), mixing layer height (MLH), and other meteorological parameters were made in the North China Plain (NCP) during the warm season (June–July) in 2021. The observation results showed that the summertime regional maximum daily 8 h average ozone (MDA8 O3) initially increased and reached the maximum value (195.88 µg m−3) when the MLH ranged from approximately 900 to 1800 m, after which the concentration of O3 decreased with further increase in MLH. Interestingly, synchronous increases in PM2.5 concentration along with the development of the mixing layer (MLH <1200 m) were observed, and the positive response of PM2.5 to MLH was significantly associated with the increase in SO and OC. It was found that this increasing trend of PM2.5 with elevated MLH was driven not only by the wet deposition process but also by the enhanced secondary chemical formation, which was related to appropriate meteorological conditions (50 % < RH <70 %) and increased availability of atmospheric oxidants. Air temperature played a minor role in the change characteristics of PM2.5 concentration, but it greatly controlled the different change characteristics of SO and NO. The concentrations of PM2.5, its major secondary components, and the oxidation ratios of sulfate (SOR) and nitrate (NOR) increased synchronously with elevated MDA8 O3 concentrations, and the initial increase in PM2.5 along with increased MLH corresponded well with that of MDA8 O3. We highlight that the correlation between MLH and secondary air pollutants should be treated with care in hot weather, and the superposition-composite effects of PM2.5 and O3 along with the evolution of mixing layer should be considered when developing PM2.5–O3 coordinated control strategies.
- Article
(10397 KB) - Full-text XML
-
Supplement
(2146 KB) - BibTeX
- EndNote


Surface ozone (O3) and PM2.5 (atmospheric fine particles with an aerodynamic diameter of less than 2.5 µm) are important air pollutants in the atmosphere and have aroused a lot of attention from the public due to their adverse health impacts (Jiang et al., 2018; Cohen et al., 2017; Gao and Ji, 2018). Even though stringent clean air actions have been implemented in China during the past decade, high concentrations of O3 and/or PM2.5, exceeding national air quality standards, still occurred during the warm season, especially in the North China Plain (NCP), the economic centre of China (Dai et al., 2023). O3 is a secondary pollutant that originates from the photochemical oxidation of volatile organic compounds (VOCs) and carbon monoxide (CO) in the presence of nitrogen oxides (NOx). The level of PM2.5 is mainly determined by pollutant emissions and secondary formation from gaseous precursors. In addition to air pollutant emissions, meteorological conditions play critical roles in the formation of PM2.5 and O3 (Miao et al., 2021). The mixing layer height (MLH), which influences vertical mixing within the pollution mixing layer and determines the dilution of pollutants emitted near the ground (Haman et al., 2014; Zhu et al., 2018; Lou et al., 2019), often serves as a critical physical parameter in atmospheric environmental evaluation. Elucidating the association of MLH with surface O3 and PM2.5 is fundamental for the development of PM2.5–O3 coordinated control strategies.
The response of air pollution to the MLH is variable and complicated (Miao et al., 2021). In previous studies, it was often assumed that the narrowing of the mixing layer resulted in the accumulation of pollutants near the ground, and the increase in MLH was expected to reduce PM2.5 concentration due to dilution (Murthy et al., 2020; Du et al., 2013). However, the relationship between mixing layer structure and PM2.5 concentration depends on the site, observation period, and the properties of MLH retrievals (Geiß et al., 2017; Lu et al., 2019). Although the link between PM2.5 concentration and MLH has been investigated in many studies, most observations were conducted in winter conditions and comparatively few in hot weather. Interestingly, in some cities, such as Delhi (Murthy et al., 2020) and Shanghai (Pan et al., 2019; Miao et al., 2021), an increase in PM2.5 was observed when the MLH increased during summer. As for O3, the relationship between the changes in the MLH and O3 concentrations is very complex. Both increase and decrease of O3 have been observed to correspond to the growth of MLH. Generally, the O3 concentration decreases, with an increase in MLH owing to dilution. However, an increase in the MLH generally promotes the downward mixing of upper air containing higher O3 (Ma et al., 2021; Haman et al., 2014; Xu et al., 2018). In addition, the meteorological conditions along with the changes of MLH can influence O3 concentrations through effecting O3 gaseous precursors or production rates (Porter and Heald, 2019; Zhang et al., 2022). The combined effects of these processes ultimately determine whether the concentration of O3 decreases or increases.
Other meteorological variables in the mixing layer were also found to significantly affect PM2.5 and O3 concentrations. Poor air quality in the NCP was closely associated with near-surface southerly winds and warm stagnant conditions during summer (H. Zhang et al., 2015). The increase in PM2.5 concentration often coincided with high relative humidity (RH) conditions (T. Liu et al., 2017), which was beneficial to liquid-phase heterogeneous reactions and fine-particle hygroscopic growth (Seinfeld and Pandis, 2006; Wang et al., 2016; R. Zhang et al., 2015). Temperature was essential to secondary chemical reactions (Dawson et al., 2007). The increase in temperature not only promoted chemical reaction rates but also stimulated the evaporation of semi-volatile aerosol components, such as nitrate (Wen et al., 2018). As for O3, elevated concentrations generally occurred on days with strong sunlight and low wind speeds, which favoured photochemical production and the accumulation of O3 and its precursors. Several studies have shown that O3 was significantly positively correlated with temperature but negatively correlated with RH (Li et al., 2021; Hou and Wu, 2016; Steiner et al., 2010).
In recent years, long-term PM2.5 composition measurements in the NCP have revealed an increase in the contributions of secondary species, e.g. sulfate (SO), nitrate (NO), ammonium (NH), and organic matter (OM) (Cheng et al., 2019; J. Wang et al., 2022a). As air quality improved (PM2.5<50 µg m−3), the correlation between O3 and PM2.5 tended to change from negative to positive in China (Chu et al., 2020). One possible reason is that when the PM2.5 concentration is low, PM2.5 does not reduce actinic flux or the HO2 radical significantly. On the other hand, PM2.5 and O3 tend to be positively correlated, possibly due to their common precursors, such as VOCs and NOx, and their simultaneous generation in photochemical reactions. In addition, the generation of O3 enhances the atmospheric oxidation capacity and catalyses the generation of the secondary PM2.5 (Cheng et al., 2019; Kang et al., 2021; Wu et al., 2022). Although some studies have discussed the correlations between MLH and some secondary pollutants, the understanding of the interaction between O3 and PM2.5 (including its major components) along with the evolution of the mixing layer during the warm season remained poor, owing to the limited observations of PM2.5 chemical species involved. Regional-scale observations can represent the variation characteristics of an area and avoid spatial heterogeneity between sites. However, to the best of our knowledge, previous observational studies were mostly limited to specific cities. Thus, rather than drawing conclusions based on individual datasets, an analysis of multiple data sources is needed to determine the overall trends.
According to the hourly concentrations of PM2.5 and MDA8 O3 in China over the years of 2013–2020, the months of June and July can well represent the typical characteristics of O3–PM2.5 coordinated pollution during the warm season in the NCP (Dai et al., 2023). To enhance the understanding of the linkages between the mixing layer structure and air pollution, in this study, a regional-scale field observation of meteorological factors, O3, and PM2.5 concentration and its secondary composition were conducted in the NCP from 1 June to 31 July 2021. For the first time, the potential associations between ground-level observed O3, PM2.5 and its dominant components, and mixing layer meteorological conditions in the NCP during summer are presented and discussed.
2.1 Measurements
Observations were made in the NCP from 1 June to 31 July 2021. Air pollution observation stations covered 2 megacities (BeiJ and TianJ; all region abbreviations are defined in Fig. 1) and 26 surrounding cities (denoted “2+26 cities”). The geographical locations of these stations are shown in Fig. 1. The NCP is bordered by the Taihang Mountains to the west, the Yan Mountains to the north, and the Bohai Sea in the east. The hourly concentrations of ground-level O3, PM2.5 and its major components (SO, NO, NH, and organic carbon [OC]), and meteorological variables, including air temperature, relative humidity (RH), wind speed (WS), and wind direction (WD), and 24 h accumulated precipitation, at the sites were obtained from the platform of the National Atmospheric Particulate Chemical-Speciation-Network, which is established for improving the understanding of the heavy pollution formation mechanism in the NCP and supporting the decision-making of local governments and state administration. Hourly SO2, NO2, O3, and PM2.5 and its chemical compositions were recorded in the PM2.5 component network, which was selected following the Technical Regulation for Selection of Ambient Air Quality Monitoring Stations published by the Ministry of Ecology and Environment of the People's Republic of China (HJ664-2013). The monitoring sites of the PM2.5 component network were mostly set up within the cities and reflected the average pollution level of each city. Details of the near-ground observation stations of the PM2.5 component network are listed in Table S1 in the Supplement. Mass concentrations of SO, NO, and NH in PM2.5 were continuously measured at a 1 h resolution by MARGA (model ADI 2080) or AIM-IC (URG 9000D) analysers equipped with a PM2.5 sampling inlet. These two ion chromatography (IC)-based online instruments have shown good performance through instrument intercomparison studies or comparison to offline filters under clean to moderately polluted conditions (Markovic et al., 2012; Wu and Wang, 2007; Park et al., 2013; Rumsey et al., 2014). OC was measured online by a Sunset Semi-Continuous Carbon Analyzer (Sunset Laboratory Inc., USA). The concentration of OM was obtained by multiplying the OC concentration by a factor of 1.6 (Li et al., 2021). PM2.5, O3, NO2, and SO2 concentrations were recorded hourly using Thermo Fisher Scientific samplers and analysers. Detailed descriptions of these online sampling instruments can be found in our previous studies (Kong et al., 2018; J. Liu et al., 2017; Pang et al., 2020; J. Wang et al., 2022a). The meteorological variables were recorded in the national meteorological observation stations, and the information of each station was obtained from the public website of the China Meteorological Administration (http://data.cma.cn/data/cdcindex/cid/0b9164954813c573.html, last access: 3 February 2023). The temporal resolution of air temperature, RH, WS, and WD was 1 h. To avoid the influence of diurnal boundary layer cycles, this study focused on the relationship between the daily mean air pollutants and meteorological factors. The daily mean meteorological factors and PM2.5 and its major secondary components were calculated from the hourly data, and the daily O3 concentration was characterized by the maximum daily 8 h average ozone (MDA8 O3). Details for the near-ground observation species and the metrics are shown in Table S2.
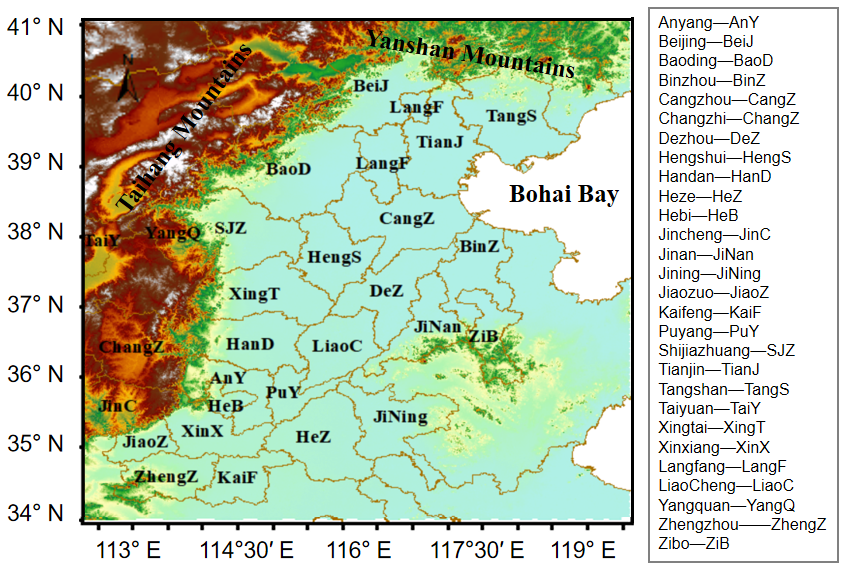
Figure 1Location of monitoring stations in the North China Plain.
To better demonstrate the overall change characteristics of the regional air pollution and meteorological conditions during the observation period, the occurrence frequency (%), which is the proportion of the cities at each air pollutant or methodology level, was calculated based on the following equation:
where X means the air pollutants or methodology factors, represents the number of cities at each X level, and Total NX represents the total number of cities.
2.2 The calculation of MLH
In recent years, many investigations have progressed in the atmospheric boundary layer characteristics, and they analysed the impacts of these parameters on air pollution (Haugen et al., 1971; Wang et al., 2014; Zhang et al., 2005). However, the way the boundary layer describes the influences of air pollution is easily duplicated and confused (Niu et al., 2017). For air pollution measurement, one of the selected functionalities of the parameterization scheme for pollution mixing layer is to judge whether an air mass over a specific locality satisfies the “static and stable” attribute or not. Therefore, in this work, to express the basic physics for diagnosing meteorological conditions, we used the concept of pollution MLH proposed by Wang et al. (2017), which was based on the classical synoptic theory according to the level of the convective condensation layer, and the details of this method can be seen in previous work (Wang and Yang, 2000; Wang et al., 2017).
To be specific, we defined the height close to the cloud base as the height of the supersaturation layer (HSSL). The isentropic atmospheric process meets the level of the convective condensation layer (LCL) in the supersaturation state; that is, it is very close to the HSSL. An iterative algorithm was used to work out the HSSL (Wang and Yang, 2000):
where es represents the saturated water vapour pressure, and T is the temperature (K). Equation (2) can be used to calculate the HSSL which is favourable for pollutant mixing and is represented by (P). Below this height, the atmosphere gets supersaturated, causing the pollution mixing and wetting process in low altitudes to continue, so this height is called the height of pollution mixing layer (MLH). Thus, MLH can be derived in the following expression:
According to the relationship between air pressure and height, the units of MLH can be converted to the height (in m) as follows:
where z is the height, ρ0 is the density of gas, and pz and p0 represent the air pressure at the heights of z and 0, respectively.
Several studies have verified the reliability of the results based on this method. Using this method, Wang et al. (2017) characterized the features of the mixing layer height in highly sensitive areas of pollution in China. J. Wang et al. (2022b) also used this method to explore PM2.5 and O3 superposition-composite pollution events during spring 2020 in Beijing, China, and the hourly evolution of MLH, O3, and PM2.5 during the observation period was analysed. In addition, Niu et al. (2017) have applied this method to Beijing, and the results showed that the pollution mixing layer could effectively represent the change characteristics of the haze pollution process. In this work, we applied this method to investigate the impact of MLH on the change characteristics of ozone and fine particulate matter.
3.1 General characteristics
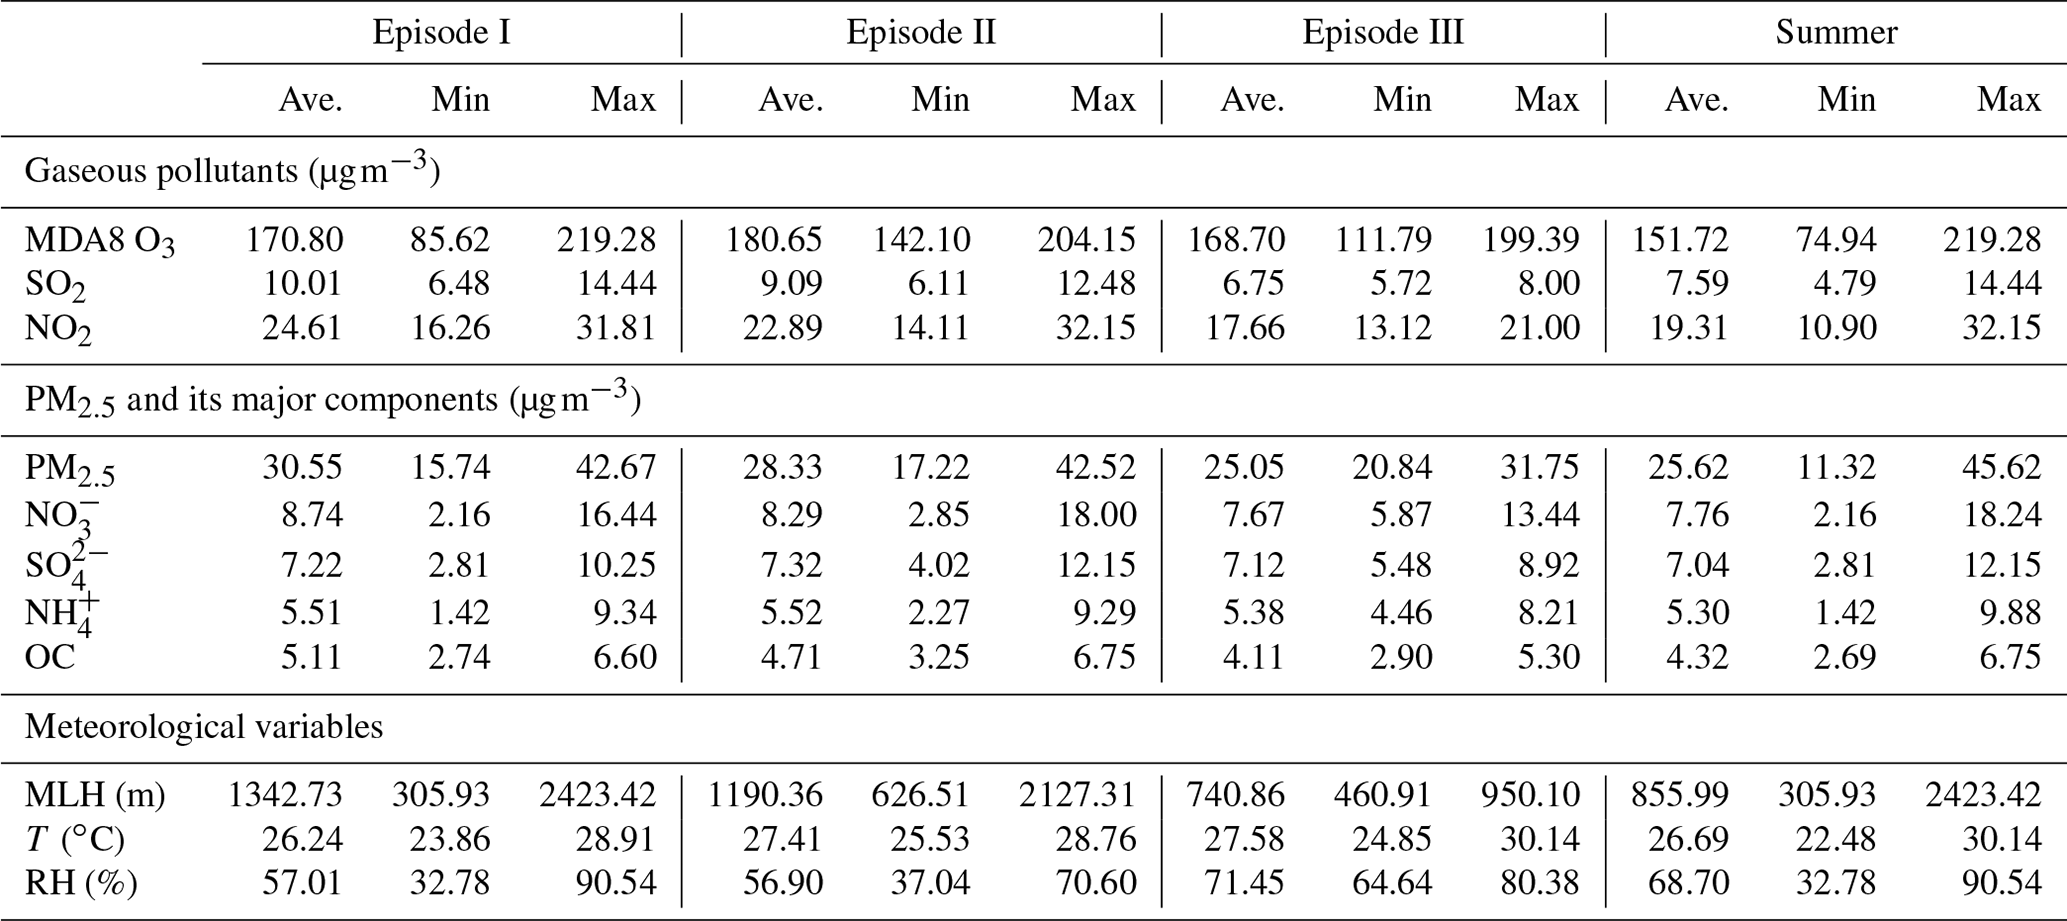
The summertime change characteristics of ground-level meteorological factors (MLH, RH, temperature, and WS), MDA8 O3, and PM2.5 and its major components in the NCP are shown in Figs. 2 and S1 in the Supplement. The primary atmospheric pollutant in the NCP during the summer was O3, and the concentrations of MDA8 O3 averaged over all sites in the NCP varied from 74.94 to 219.28 µg m−3, with the mean value of 151.72 µg m−3 (Table 1). O3 pollution lasted for nearly the entire observation period and was characterized by frequent and long-lasting pollution episodes. The PM2.5 concentration was much lower when comparing with O3 during the observation period. The mean, maximum, and minimum of the regional daily mean PM2.5 concentration was 25.62, 45.62, and 11.32 µg m−3, respectively. NO was the prominent PM2.5 component, with the mean concentration of 7.76 µg m−3. According to the National Ambient Air Quality Standard of China (GB3095-2012), the daily PM2.5 averages in the 2+26 cities can meet the level-II standard of 75 µg m−3, while exceeding the level-I standard (35 µg m−3). As shown in Fig. 2, the regional PM2.5 pollution processes corresponded well with the increasing processes of MDA8 O3. Here, we define a O3–PM2.5 co-polluted episode as a set of continuous days (longer than 4 d) with MDA8 O3 and daily mean PM2.5 (in more than 10 % NCP cities) exceeding 160 and 35 µg m−3, respectively. On the basis of this criterion, three typical O3–PM2.5 co-polluted episodes were selected: 4–14 June (Episode I), 18–29 June (Episode II), and 2–11 July (Episode III) 2021.
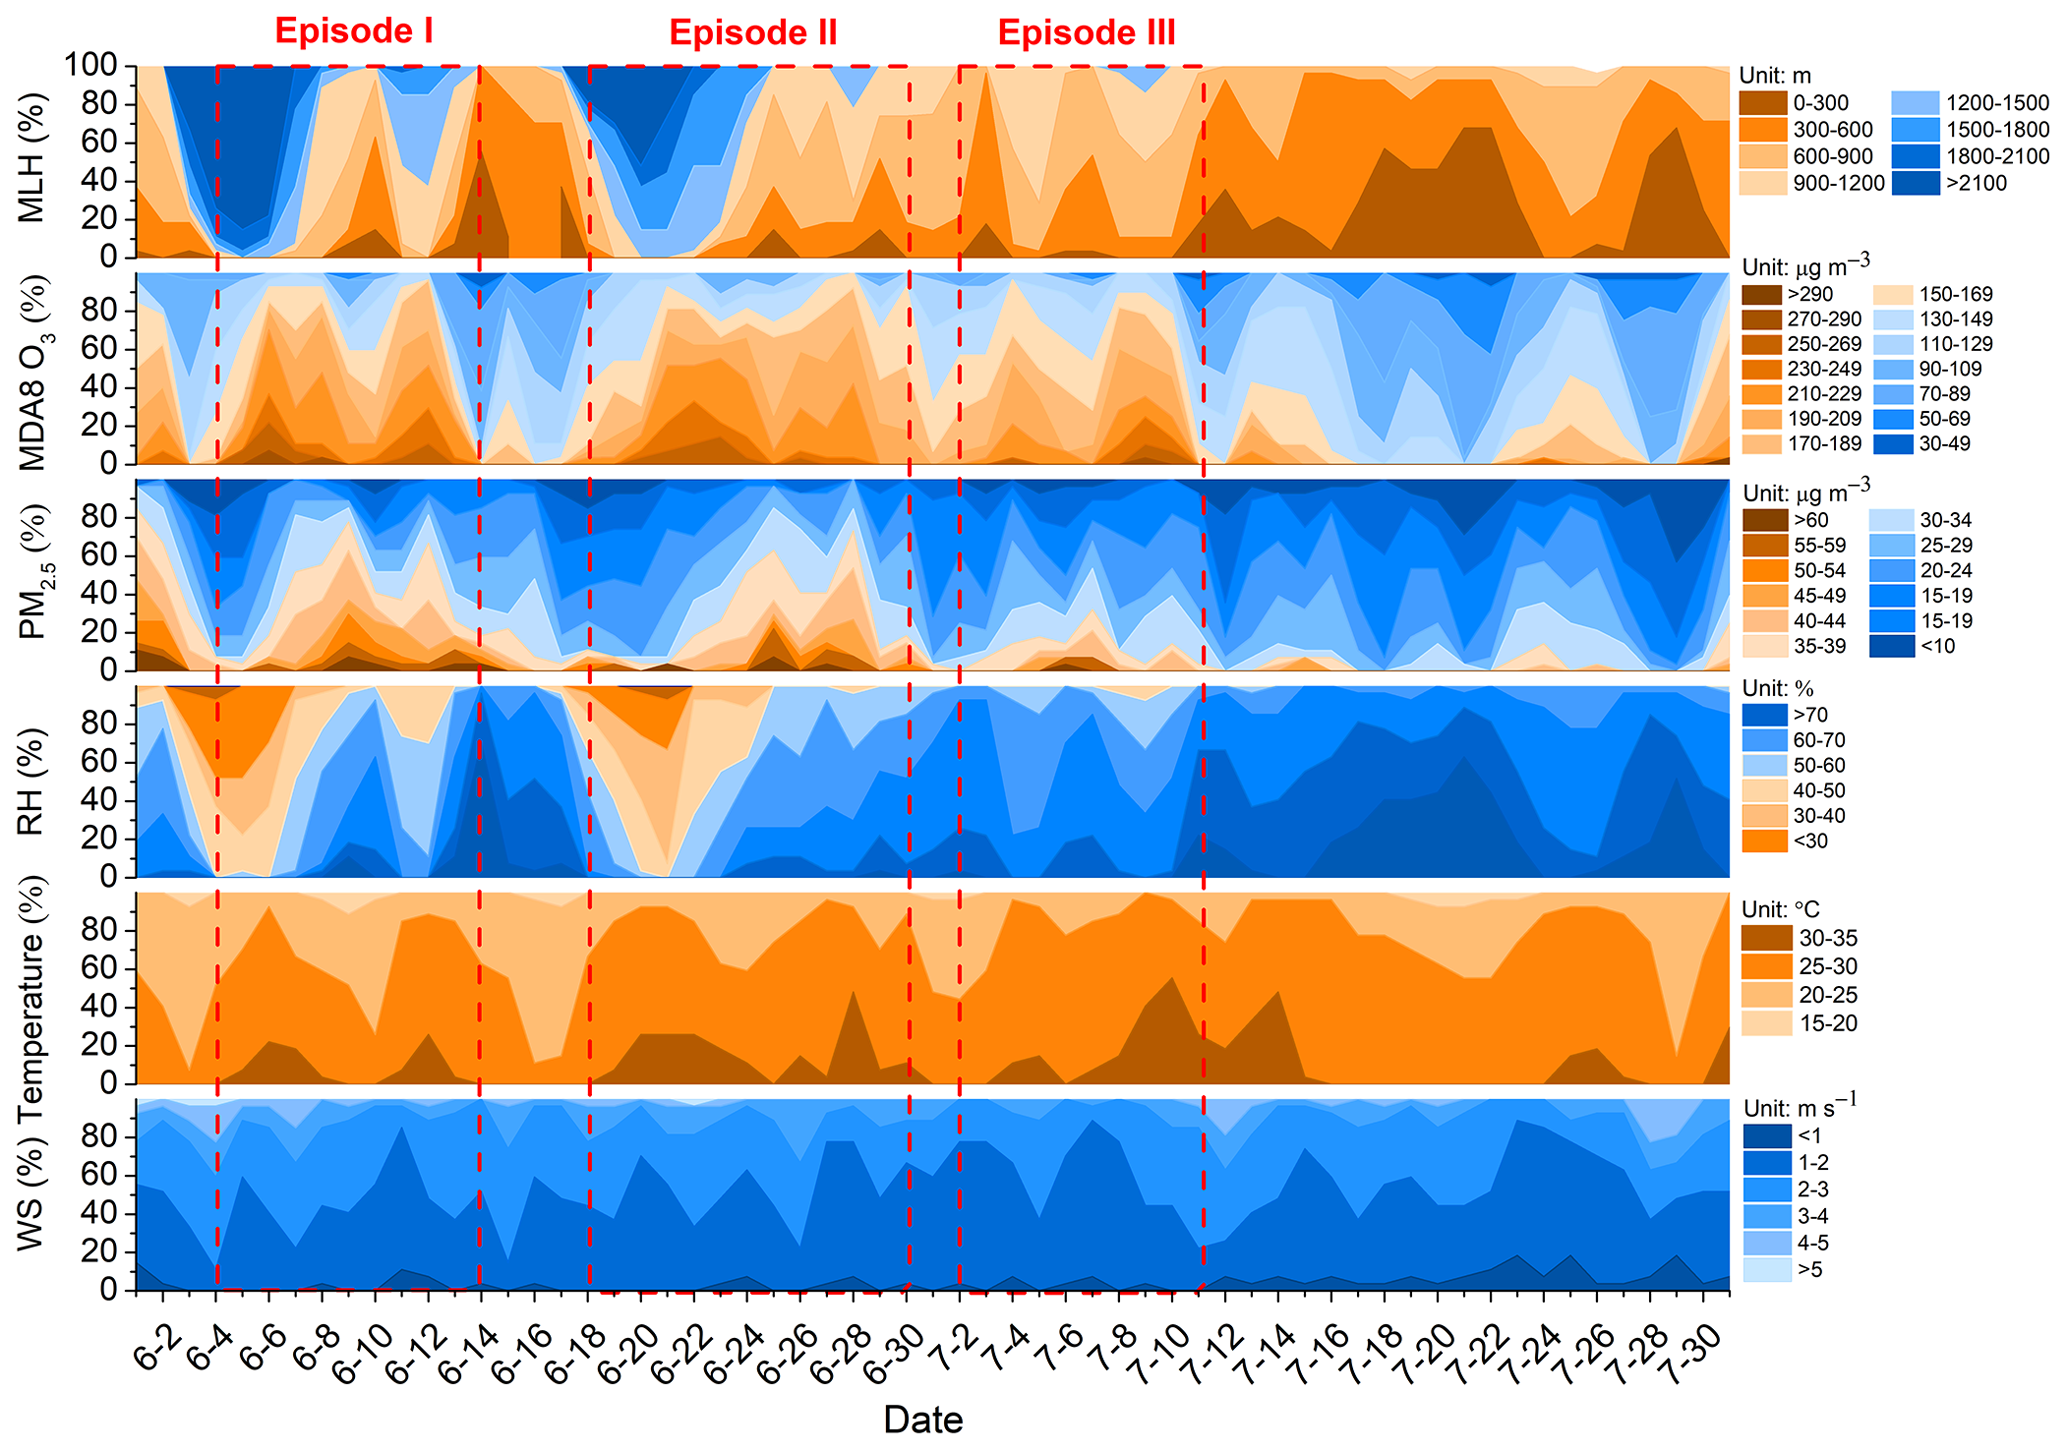
Figure 2Occurrence frequency (%) of PM2.5, MDA8 O3, and meteorological factors under different levels in the NCP from 1 June to 31 July 2021. The colour shading represents different categories classified by PM2.5, MDA8 O3, and meteorological factors. Boxed areas delineated by red dashes represent three typical PM2.5 and O3 co-polluted episodes: 4–14 June (Episode I), 18–29 June (Episode II), and 2–11 July (Episode III), 2021.
Table 1General information on O3–PM2.5 co-polluted episodes from 1 June to 31 July 2021.
During these three typical episodes, the synchronous change characteristics of air pollutants and the mixing layer meteorology were analysed. In Episodes I and II, when MLH was higher than 2100 m, both MDA8 O3 and PM2.5 concentrations were low. Along with the reduction in MLH (from 1800–2100 to 1200–1800 m), regional MDA8 O3 and PM2.5 concentrations both gradually increased. When MLH fell in the range of 1200–1800 m, MDA8 O3 concentration reached the maximum, with approximately 80 % of areas having levels greater than 170 µg m−3. With a further decrease in MLH, MDA8 O3 declined, whereas PM2.5 remained stable or continued to increase, when the regional MLH was in the range of 600–1200 m. In Episode III, the MLH in most cities was lower than 1200 m, and the regional MDA8 O3 and PM2.5 pollution conditions were lighter than other episodes, with 80 % of the PM2.5 values less than 35 µg m−3. It is interesting to note that the change characteristics of SO and NO differed (Fig. S1), and the regional peaks of these two components were inconsistent, especially in Episode II. With the evolution of MLH, NO climbed up and peaked on 24 June when there was a regional MLH lower that 900 m, and SO reached the maximum on 28 June when MLH was approximately 900–1500 m. This may be related to other synchronized mixing layer meteorological factors, such as RH and temperature. For example, the evolution of the mixing layer is often accompanied by changes in temperature. The increase in temperature can promote the chemical formation rate of these secondary components but also stimulate the volatilization of NO to gaseous state (HNO3), which leads to the decrease in NO concentration. Further analysis of the responses of O3 and PM2.5 and its secondary components to different mixing layer meteorological factors is presented in the following sections.
3.2 Evolution of ozone with mixing layer meteorology
To quantify the effect of MLH on near-ground O3 concentrations, relationships between MLH and MDA8 O3 were analysed (Fig. 3a). A data-binning method was used to remove the expected day-to-day atmospheric variability from the sampling uncertainty (Seidel et al., 2010), which has been applied in other studies (Lou et al., 2019). The MLH was grouped into eight classes of 300 m width: 0–300, 300–600, 600–900, 900–1200, 1200–1500, 1500–1800, 1800–2100, and >2100 m. It was found that MDA8 O3 concentration dramatically increased when MLH fell in the range of 0–900 m and levelled off when MLH was approximately 900–1800 m, with the maximum MDA8 O3 of 195.88±42.76 µg m−3, after which the concentration began to decrease with further development of MLH. This non-linear relationship between MDA8 O3 and MLH is consistent with the results reported by Zhao et al. (2019), who found that the O3 concentration was highest at medium boundary layer heights (1200–1500 m) during summertime in Shijiazhuang, China.
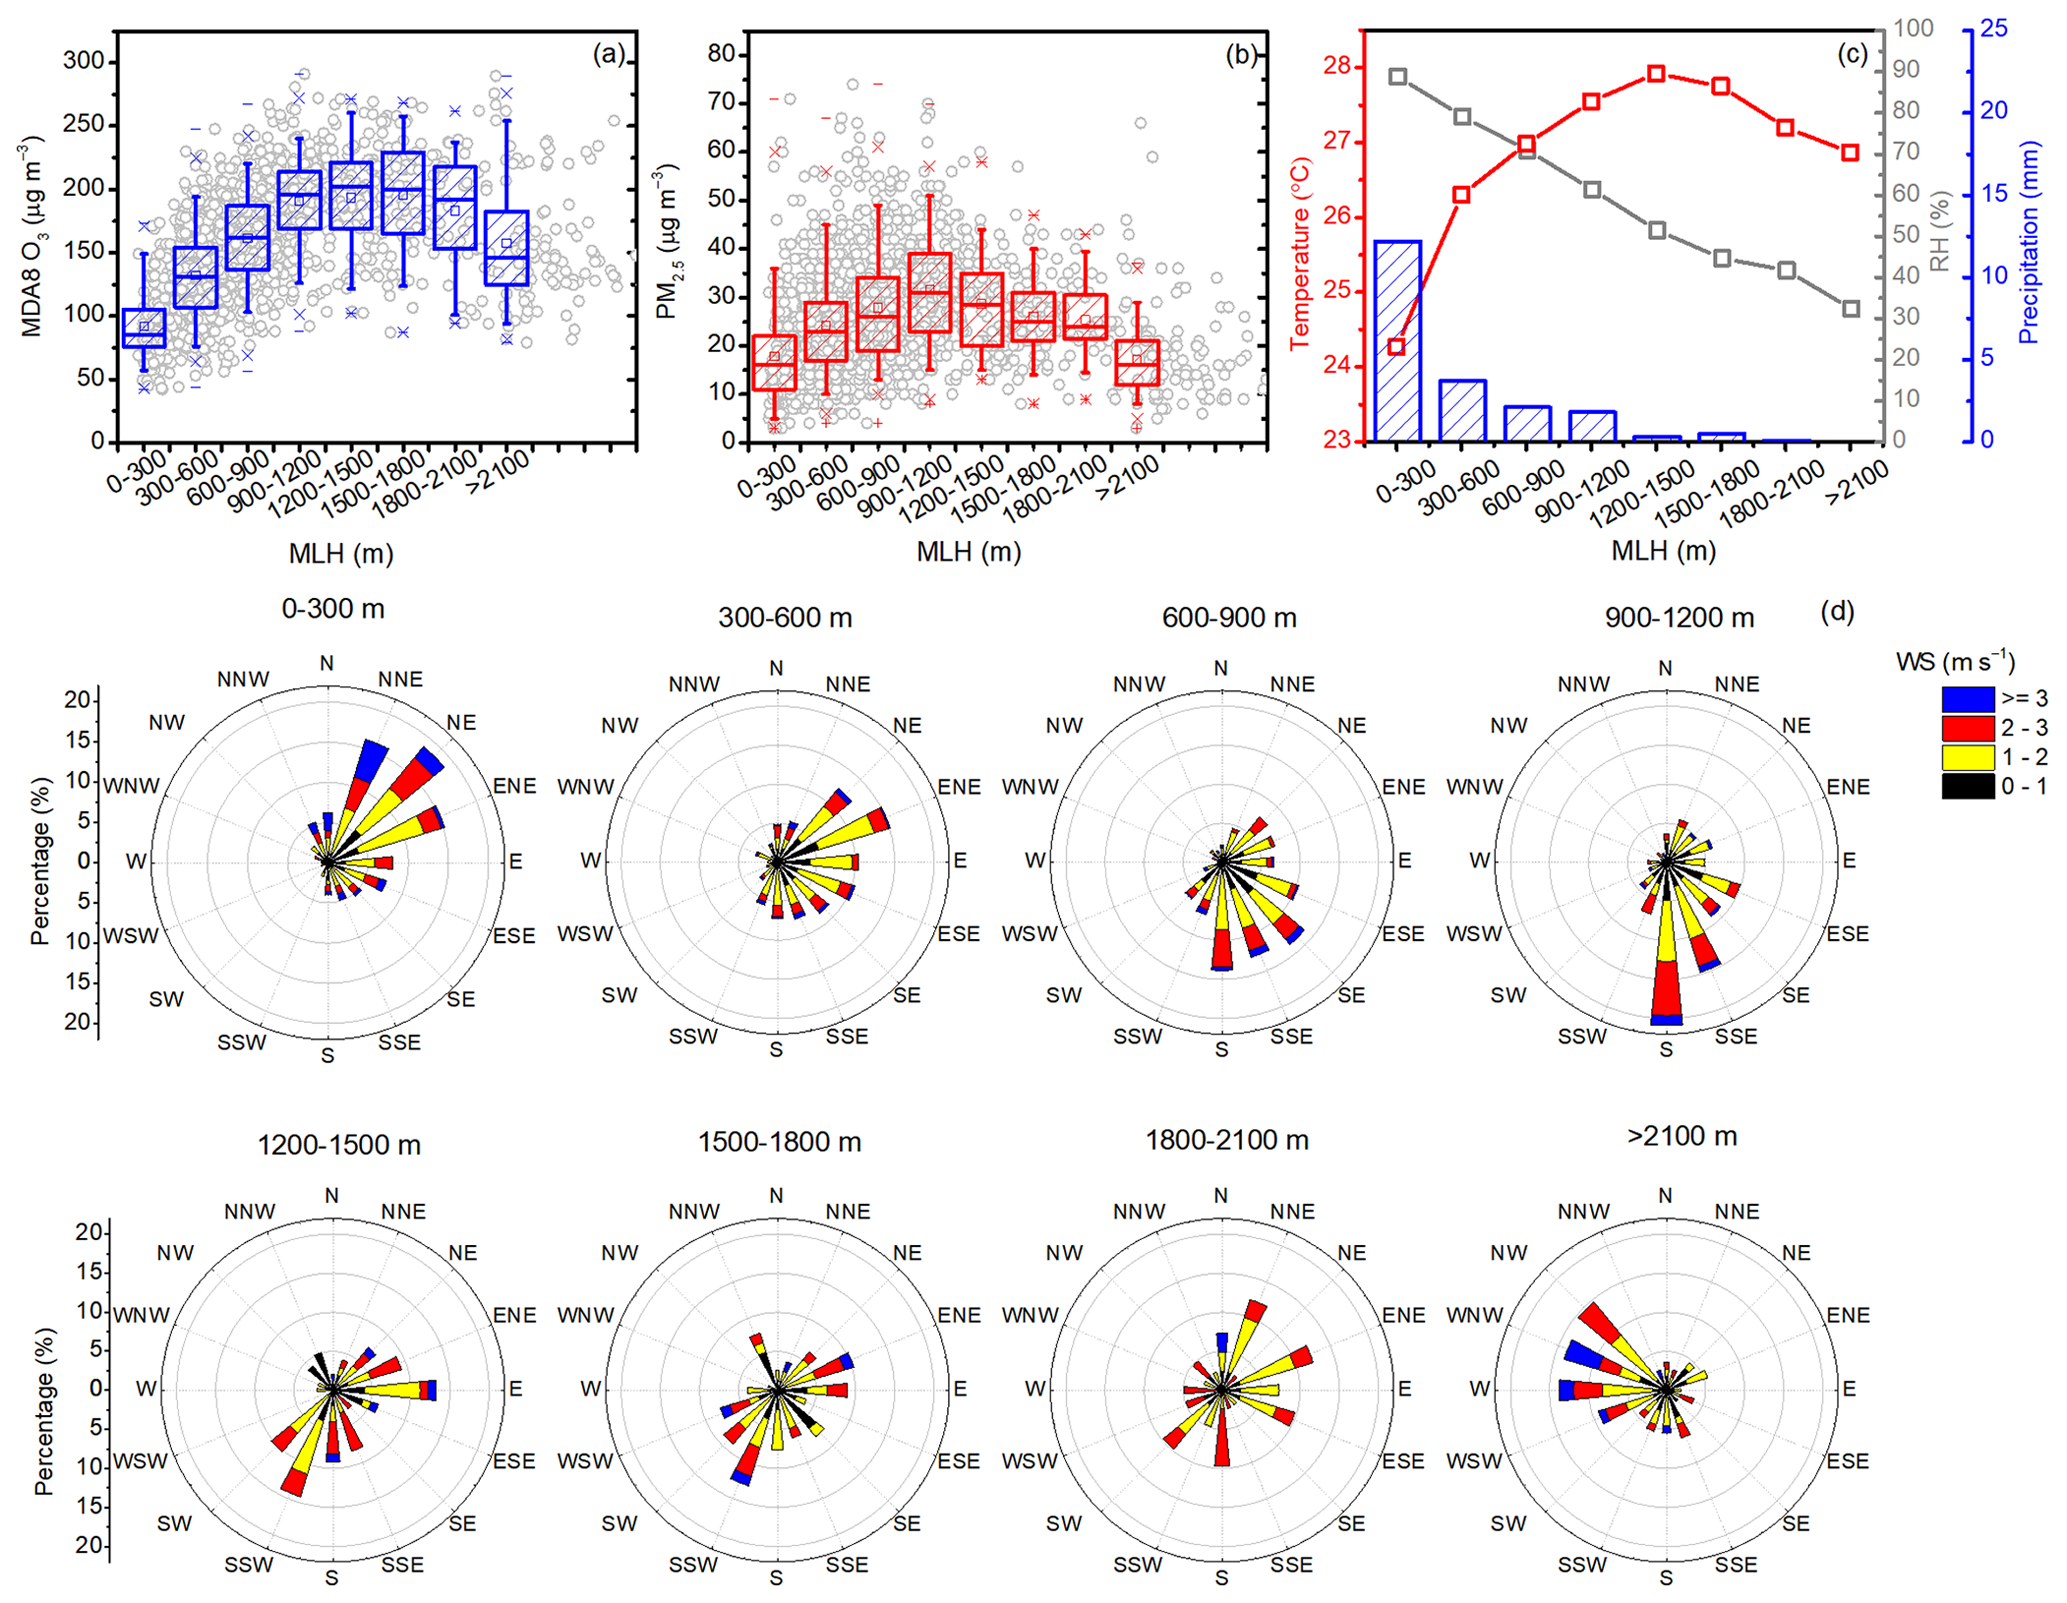
Figure 3Variation characteristics of (a) MDA8 O3, (b) PM2.5, (c) temperature, RH, 24 h precipitation, and (d) WS and WD in different MLH conditions. Box plots in panels (a) and (b) show the inter-quartile range (the distance between the bottom and the top of the box), median (the band inside the box), and 95 % confidence interval (whiskers above and below the box) of the data.
The relationship observed between MDA8 O3 and MLH is complex. Previous studies have shown that a higher MLH can lead to the mixing of near-surface air with the O3-rich air aloft, resulting in enhanced surface O3 concentrations (Reddy et al., 2012). Concurrently, the evolution of the mixing layer was strongly associated with the changes in other meteorological conditions, such as air temperature, RH, and precipitation, which can also affect the O3 concentration (Haman et al., 2014). The combined effects of these processes ultimately determine whether ground-level O3 increases along the evolution of the mixing layer. The increase in the MLH often coincides with higher air temperature, lower RH, and less precipitation (Fig. 3c), and this combination of factors is more conducive to O3 production (Ma et al., 2021; Xu et al., 2018). As shown in Fig. 4a–c, as the MLH remained constant, the MDA8 O3 concentration climbed up with the increase in air temperature but decrease in RH and precipitation levels. Possible reasons for these results are the following: (1) the increase in RH contributes to the depletion of O3 and leads to weakened O3-related photochemical reaction (Ma et al., 2021; Yu, 2019); (2) due to higher RH or rainfall, gaseous precursors and O3 are washed out from the atmosphere through wet deposition (Reddy et al., 2012); and (3) the rise of temperature accelerates the emission rate of gaseous precursors, such as biogenic VOCs and soil NOx (Dang et al., 2021; Porter and Heald, 2019), and also stimulates the photochemical reaction rate in the generation of O3 (Ma et al., 2021). Wind fields also alter surface O3 concentrations by transporting O3 or its precursors into and out of the region (Ma et al., 2021). As shown in Fig. S2, during the entire campaign the NCP was dominated by winds from the northeast and south (45–225∘). Because more than 75 % of WD values were in the range of 45–225∘, the WD was classified into four categories: 45–90, 90–135, 135–180, and 180–225∘. As shown in Fig. 3d, along with the evolution of the mixing layer, the WD gradually changed from the northeast (MLH = 0–600 m) to the southeast (MLH = 600–900 m) and south (MLH = 900–1200 m). Southerly winds can transport the gaseous pollutants or O3 from the southern part of the plain area to the northern part, and the Taihang Mountains may block pollutant transport, leading to pollutant accumulation at the foot of the Taihang Mountains. It should be noted that the concentration of MDA8 O3 was higher when the plain was dominated by southerlies (180–225∘) when MLH was lower than 1200 m (Fig. 4e). Generally, WS can affect the diffusion of air pollutants. Owing to the limited dilution and dispersion effects of weak winds, the MDA8 O3 concentrations at low wind speed (0–1 m s−1) were relatively higher than those of the other WS conditions (Fig. 4d) .
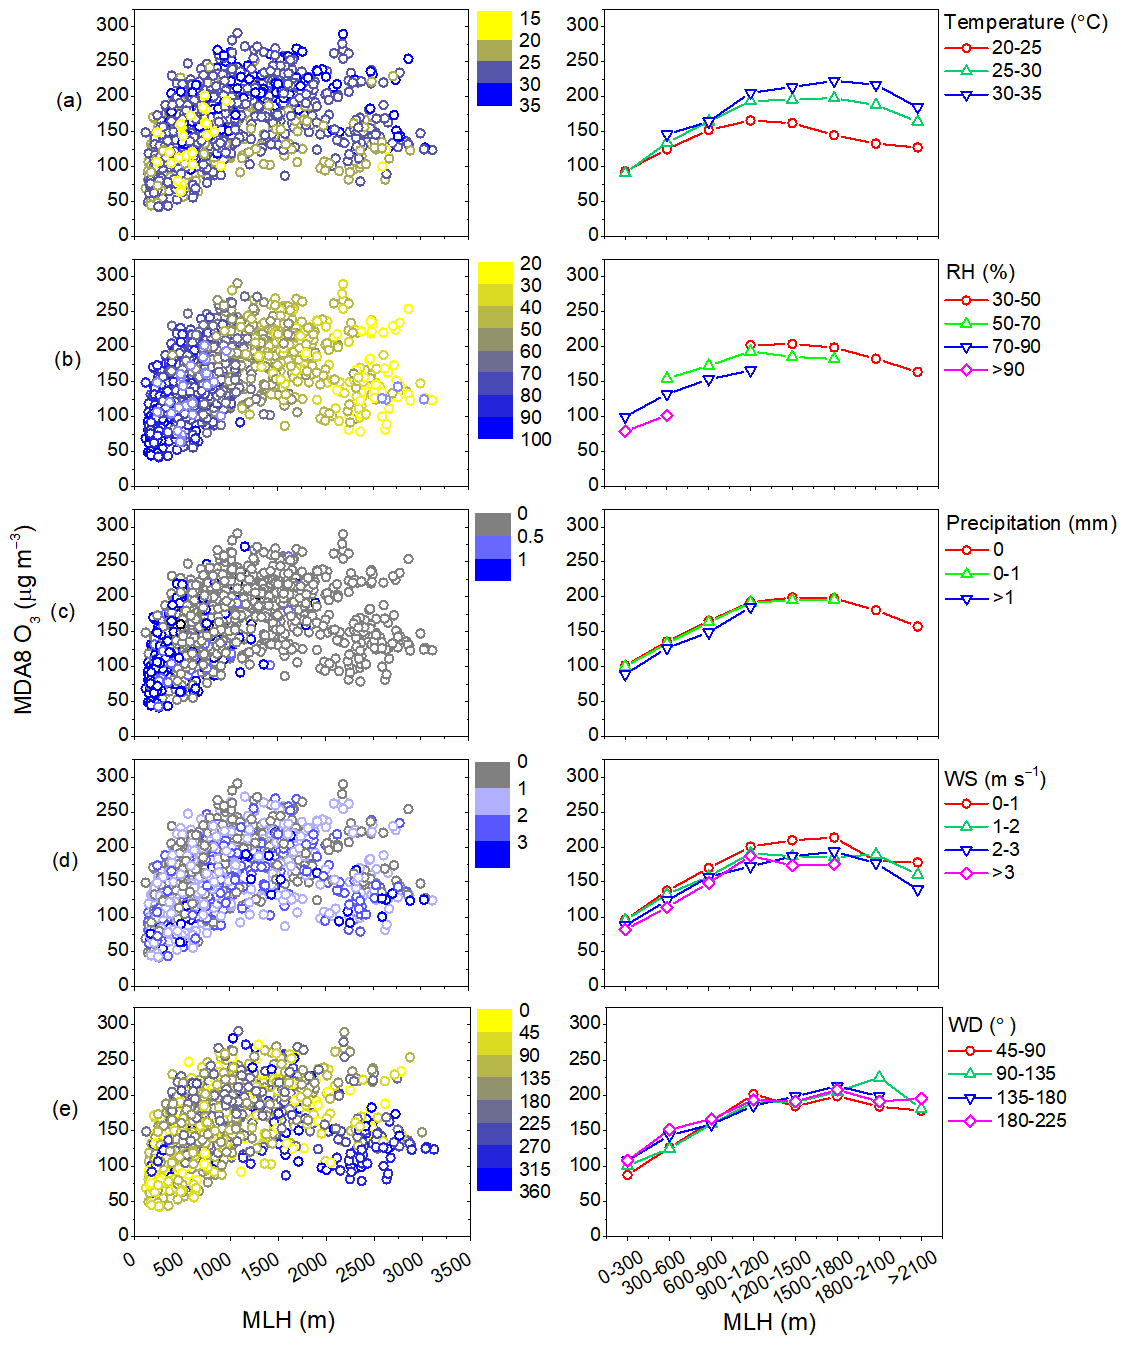
Figure 4Distribution characteristics of the MDA8 O3 concentrations with the evolution of MLH under different (a) temperature, (b) RH, (c) precipitation, (d) WS, and (e) WD conditions.
3.3 Evolution of PM2.5 and its secondary compositions with mixing layer meteorology
The concentration distribution of surface PM2.5 in different MLH bins is shown in Fig. 3b. Interestingly, PM2.5 showed a similar change profile as MDA8 O3, which initially increased and then declined with the growth of MLH. PM2.5 concentration reached the maximum of 31.65 µg m−3 when MLH fell in the range of 900–1200 m and the concentration had increased by 1.51 µg m−3 through the rising phase for the variation of 100 m MLH. This phenomenon differs from the results obtained in the cold season (Pan et al., 2019; Du et al., 2013; Murthy et al., 2020). It has been suggested that the narrowing of the mixing layer compressed air pollutants into a shallow layer, resulting in elevated pollution levels; thus, MLH has been illustrated as the key factor that aggravated the haze events in large cities of China in winter. However, the response of PM2.5 concentration to MLH is not only determined by the vertical stratification of the mixing layer but also by local sources, secondary chemical formation, wet deposition, and the wind field (Lu et al., 2019; Geiß et al., 2017; Pan et al., 2019; Miao et al., 2021; Lou et al., 2019). It should be noted that in this study there were still some extremely high PM2.5 values under low-MLH conditions, as shown in Fig. 3b. This phenomenon will be discussed in the following part when exploring the effect of precipitation.
The response of PM2.5 concentrations to mixing layer structure was the net effect of the changes in PM2.5 major chemical components, such as SO, NO, NH, and OC. The changes in the major components of PM2.5 due to the evolution of the mixing layer are shown in Fig. 5. All the secondary components showed increasing trends when MLH was lower than 1200 m, with SO and OC showing the highest increment, followed by NO and NH. When MLH changed from 300–600 to 900–1200 m, the increment was not significant for NO and NH. As NH3 was generally abundantly supplied in the NCP, the formation of NH was predominantly controlled by the reaction of ammonia with sulfate and nitrate aerosols, and the changes in NH were a consequence of the changes in SO and NO (Chow et al., 2022). When MLH <1200 m, the mass fraction of NO was higher than SO in PM2.5 (Fig. S3), and the change characteristics of NH along with the evolution of mixing layer were consistent with that of NO. The mass ratio of SO to NO gradually increased along with the development of mixing layer. When MLH was higher than 1200 m, SO surpassed NO and became the dominant PM2.5 component. The difference in the relationships between these aerosol species and MLH reflected the intrinsic complexity mechanisms of PM2.5 formation, which were probably related to other meteorological parameters, such as temperature, RH, precipitation, WS, and WD. To understand how the other meteorological factors impacted the relationship between MLH and PM2.5, we analysed the statistics on the concentration distribution of PM2.5 and its dominant components with the increase in MLH under different RH, temperature, precipitation, WS, and WD conditions (Figs. 6 and 7).
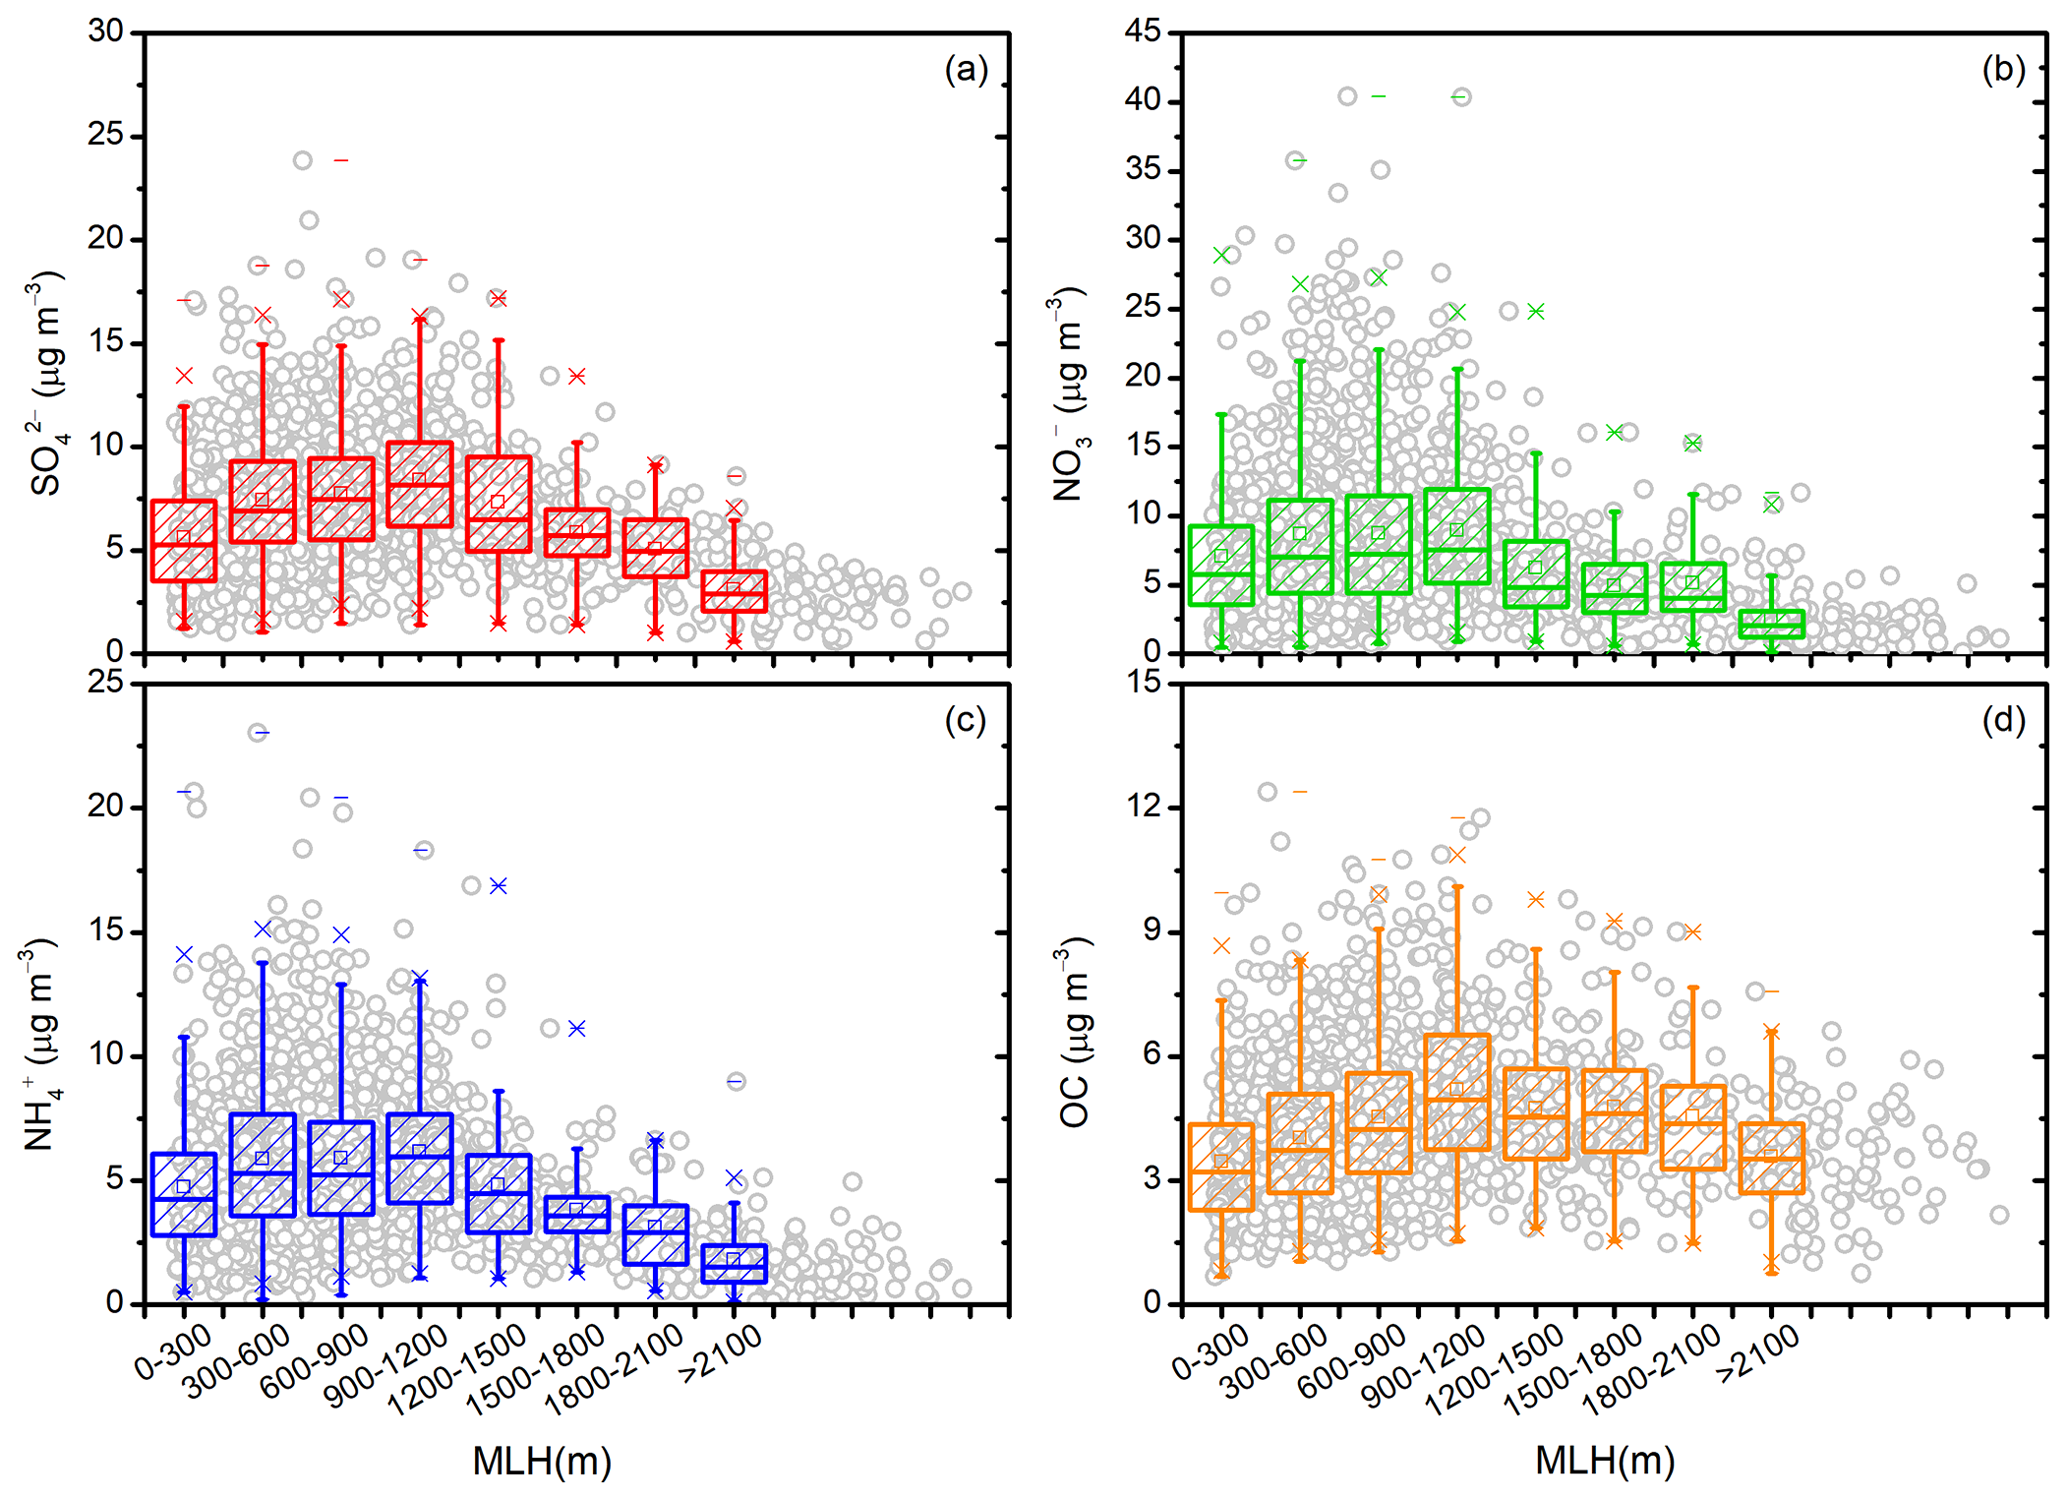
Figure 5Variation characteristics of (a) SO, (b) NO, (c) NH, and (d) OC in different MLH conditions. Box plots show the interquartile range (the distance between the bottom and the top of the box), median (the band inside the box), and 95 % confidence interval (whiskers above and below the box) of the data.
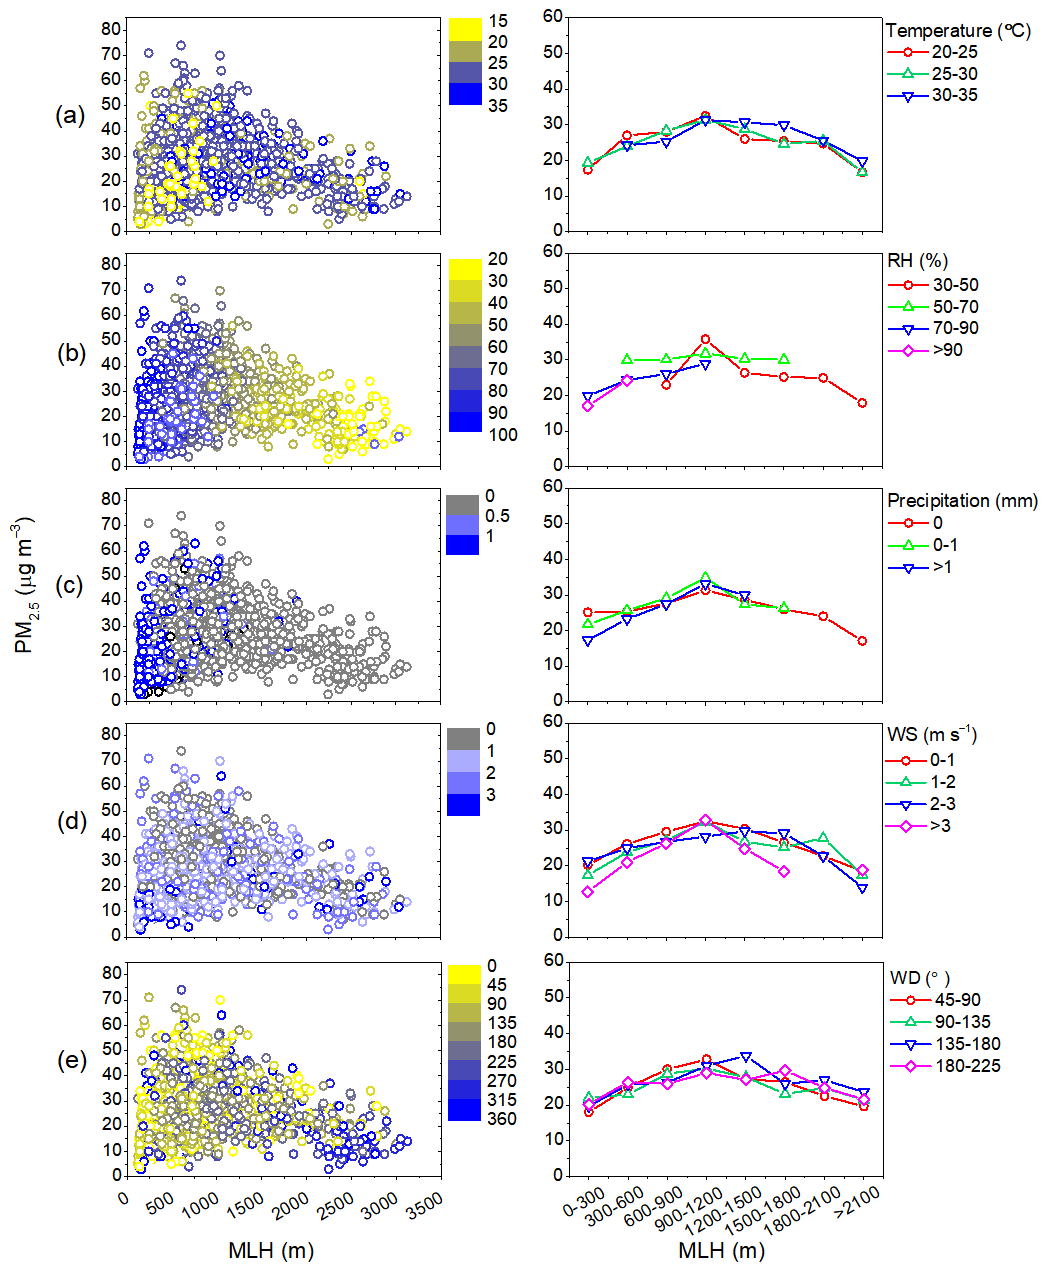
Figure 6Distribution characteristics of the PM2.5 concentrations with the evolution of MLH under different (a) temperature, (b) RH, (c) precipitation, (d) WS, and (e) WD conditions.
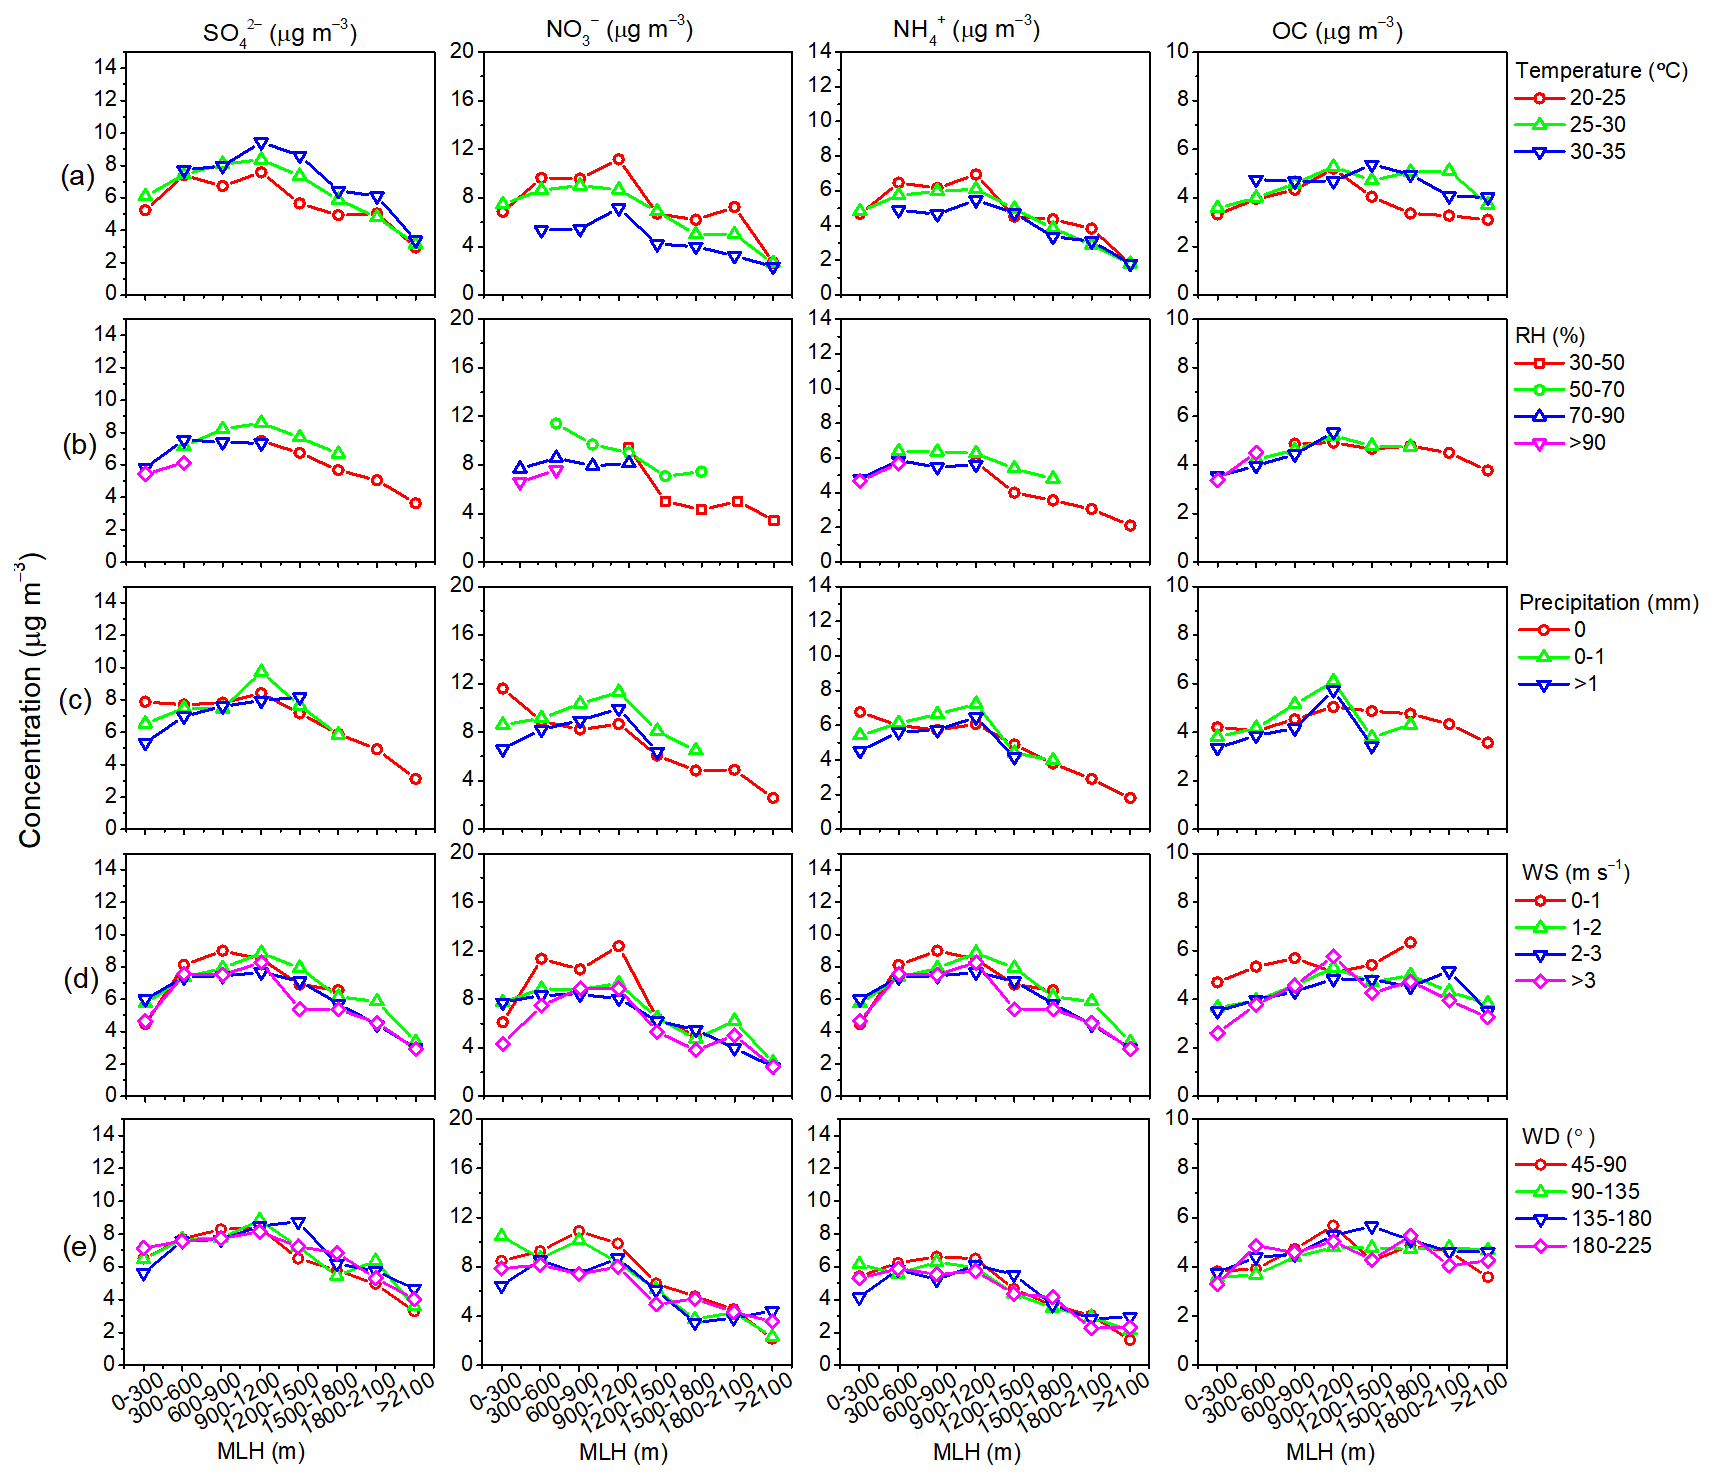
Figure 7Distribution characteristics of NO, SO, NH, and OC concentrations with the evolution of MLH under different conditions: (a) temperature, (b) RH, (c) precipitation, (d) WS, and (e) WD.
Temperature is not only essential for the secondary chemical reaction of trace gases but also for the gas–particle partitioning of volatile PM2.5 species. The response of PM2.5 and its dominant components to MLH followed similar change characteristics under different temperature conditions, all increasing with the development of the mixing layer when MLH was lower than 1200 m. The response of PM2.5 to temperature was largely the result of opposite changes in NO and SO concentrations with a smaller role played by organics (Fig. 7). Specifically, as MLH kept constant, SO concentration climbed up with increasing temperature level, while the concentration of NO declined when temperature kept going up. Higher temperature may promote faster oxidation of SO2 to SO, resulting in a significant increase in SO concentrations. Unlike SO, which predominantly exists in the particle phase, NO could be either presented as nitric acid (HNO3) in the gas phase or as ammonium nitrate (NH4NO3) in the particle phase (Chow et al., 2022). Temperature strongly influenced the partitioning of nitrate between the gas and particle phases. Higher temperature prompts the partitioning of nitrate to HNO3; thus, nitrate tends to exit in the gas phase, resulting in a significant decrease in NO and NH concentrations.
The response of PM2.5 and its dominant components to the evolution of the mixing layer was more sensitive to RH, and the distinct distribution characteristics under different RH ranges are shown in Figs. 6b and 7b. When MLH fell in the range of 300–900 m, the concentration of PM2.5 (Fig. 6b) and its major components (Fig. 7b) mostly decreased with RH rising from 50 %–70 % to 70 %–90 %. Previous studies have shown that when RH is higher than 60 %, local humidity-related physicochemical processes play important roles in transforming the gases into aerosols (M. Wang et al., 2022; Liu et al., 2020). We considered that the RH range from 50 % to 70 % was more beneficial for the aqueous chemical production of major PM2.5 components, thus leading to the increase in PM2.5 concentration. It is worth noting that when MLH fell in the range of 0–300 m, with RH increasing from 70 %–90 % to >90 %, the concentration of PM2.5 (Fig. 6b) and its major components (Fig. 7b) severely decreased, which was probably related to the fast hygroscopic growth and enhanced wet deposition processes.
All aerosol species have wet deposition as a major sink; therefore, precipitation is expected to have significant effects on PM2.5 concentrations. As shown in Fig. 6c, changes in the concentrations of PM2.5 were sensitive to rain events. When the MLH fell in the range of 0–300 m, the concentration of PM2.5 significantly decreased during the rainfall period. Interestingly, when no rainfall occurred, even though the PM2.5 concentration kept stable under low-MLH conditions, its response of PM2.5 concentrations to MLH followed an upward trend as the MLH increased from 300–600 to 900–1200 m. As for specific aerosol species (Fig. 7c), NO and NH concentrations showed two prominent peaks, with one in the range of 0–300 m and the other in the range of 900–1200 m. Under low-MLH conditions, the concentrations of NO and NH were high, with NO as the dominant species in PM2.5 (Fig. 8b). With the growth of MLH, NO and NH initially decreased but turned to increase again when MLH fell in the range of 900–1200 m. As for SO and OC, the concentrations increased with the elevation of MLH and exceeded that of NO when the MLH was higher than 1200 m. As shown in Fig. 8a, a low mixing layer was generally accompanied by cloudy and rainy conditions during summer in the NCP in 2021, and only a small fraction of days without rainfall were captured during this period. Therefore, despite some high PM2.5 or major aerosol species values that have been witnessed under low-MLH conditions, the overall trend in Fig. 3b was still upward along with the growth of the mixing layer (MLH <1200 m). The increase in PM2.5 and its major chemical components under medium-MLH conditions was not only associated with the weaker particle removal process by precipitation but also related to the enhancement of secondary aerosol formation due to the appropriate chemical reaction environment.
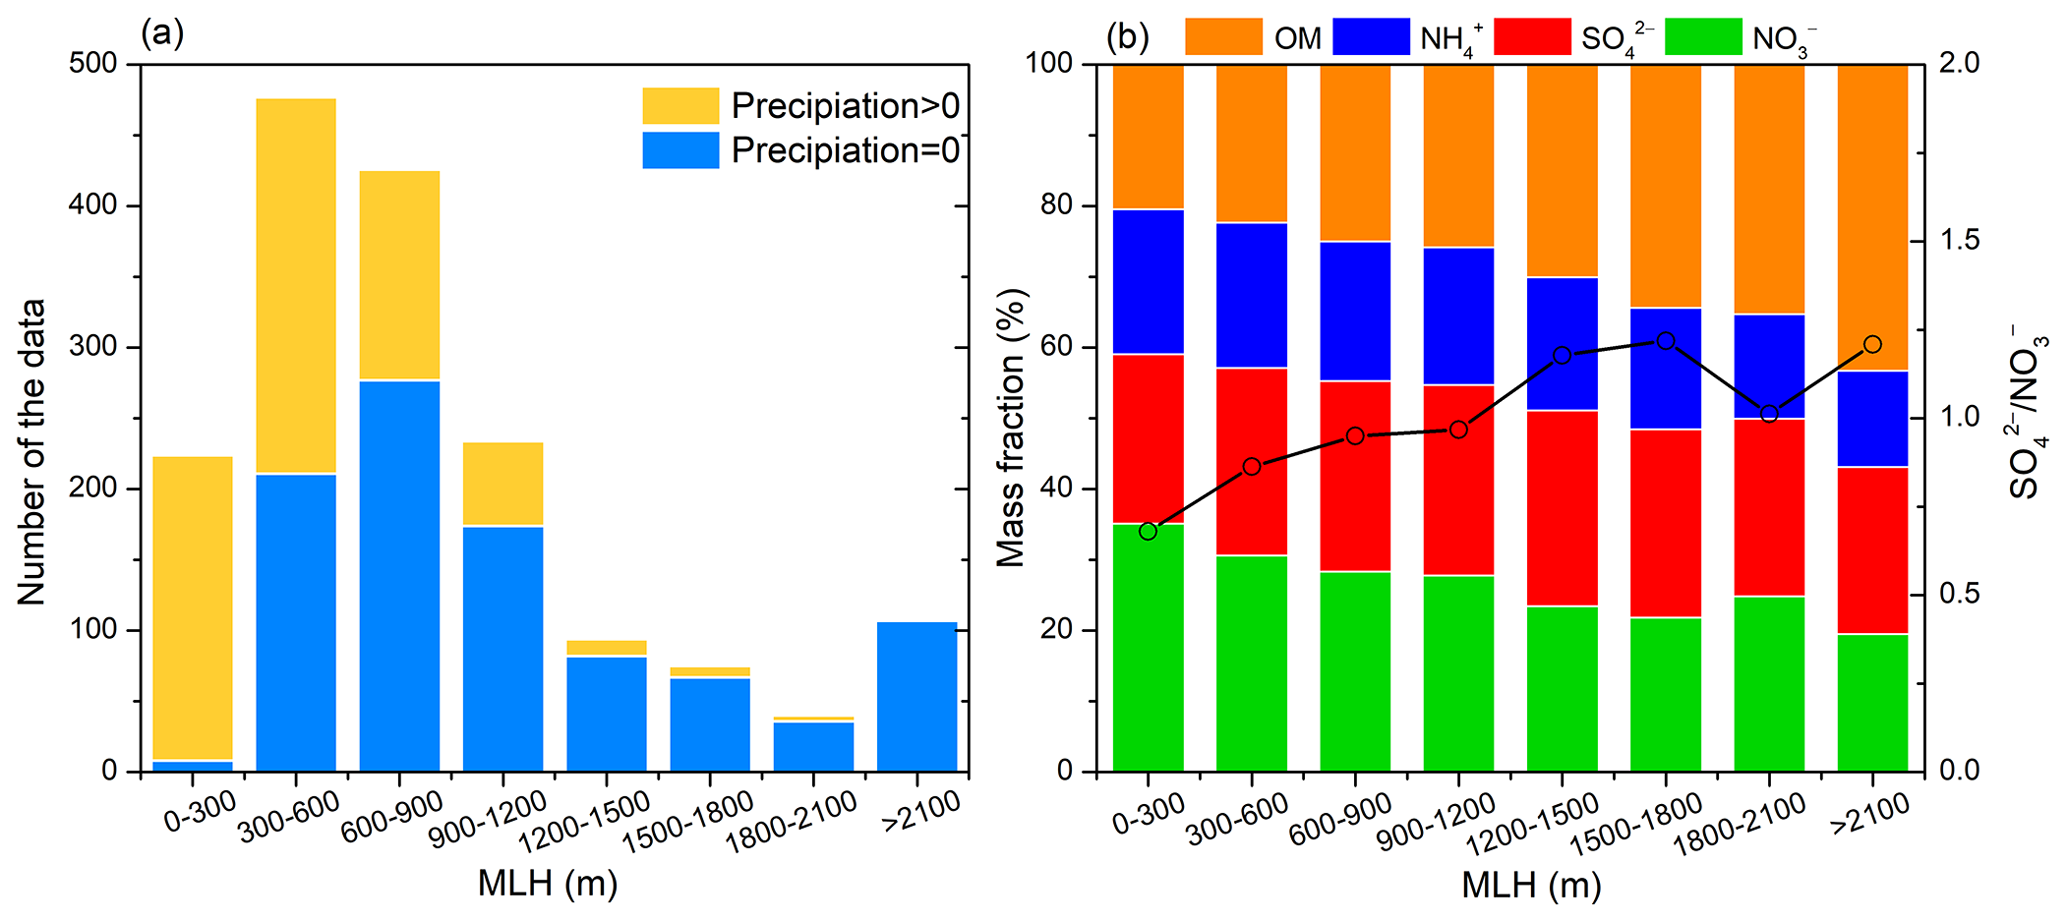
Figure 8(a) Number distributions of the data when the daily precipitation was larger than 0 mm or equal to 0 mm along with the evolution of MLH. (b) Mass fractions of major PM2.5 components and the mass ratios of SO to NO along with the evolution of MLH when the daily precipitation was equal to 0 mm.
WS can represent the atmospheric dissipation potential in the horizontal directions (Zhu et al., 2018). Low WS generally suggests weak pressure gradients and potentially more favourable meteorological conditions for PM2.5 enhancement (Ma et al., 2021). As expected, the concentrations of PM2.5 (Fig. 6d) and its aerosol species (Fig. 7d) gradually decreased with increasing WS. The response of these air pollutants to the MLH followed similar upward trends under different WS conditions (MLH <1200 m). Compared with O3, the impact of WD along with the increase in MLH seems different for PM2.5 and its dominant components. When the MLH fell in the range of 600–1200 m, the NCP was dominated by southeast or southern winds (Fig. 3d). However, when southeast or southern winds prevailed, the corresponding PM2.5 and its dominant component concentrations were comparable or even lower than in other WD situations (Figs. 6e and 7e). This indicated that regional transport was not the dominant factor leading to the elevation of PM2.5 and its aerosol species along with the evolution of the mixing layer (MLH <1200 m).
3.4 Superposition-composite effects of PM2.5 and O3 with the evolution of mixing layer
3.4.1 A case study of the typical PM2.5–O3 co-polluted episode
Previous results have indicated that MDA8 O3 and PM2.5 concentrations were closely related to the evolution of the MLH. The increasing trend of PM2.5 concentration with the development of mixing layer under medium-MLH conditions indicated that the evolution of the mixing layer was not a simple physical dilution process, and its influence on the enhanced secondary photochemical formation should also be considered. We illustrated the relationship between the mixing layer and pollutant levels in Figs. 9 and 10, showing a typical PM2.5–O3 co-polluted episode (Episode II) during 18–29 June 2021. On 18–20 June, the MLH gradually increased from 600–1200 to 1500–3000 m in the southern and eastern parts of the NCP, and the PM2.5 and MDA8 O3 concentrations concurrently increased and showed similar spatial distributions. The WS dropped significantly on 20 June, and the value was lower than 1 m s−1 in most cities. On 21–23 June, the MLH began to decrease from 1500–3000 to 1200–1800 m, PM2.5 and MDA8 O3 concentrations further increased, and the areas of high PM2.5 concentrations also coincided well with those of MDA8 O3 concentrations. During 24–25 June, the MLH continued to decrease, with some values even lower than 300 m. The MLH for the areas with high MDA8 O3 was in the range of 900–1500 m. Interestingly, the synchronized spatial change characteristics of PM2.5 and MDA8 O3 were consistent when MLH fell in the range of 900–1200 m but inconsistent when MLH was lower than 600 m. A significant rise in PM2.5 concentration was observed in some cities with MLH was lower than 300 m. It is noted that the dominant chemical composition of PM2.5 in these areas was NO. On 28 June, the rise in MLH was observed in the central and southern parts in the NCP, and a surge in MDA8 O3 and PM2.5 concentrations occurred (with 160–220 and 40–50 µg m−3, respectively). In general, most cities were dominated by weak winds from the east and southeast, which favoured the formation of secondary pollutants from gaseous precursors transported from the southeast part and promoted the accumulation of air pollutants.
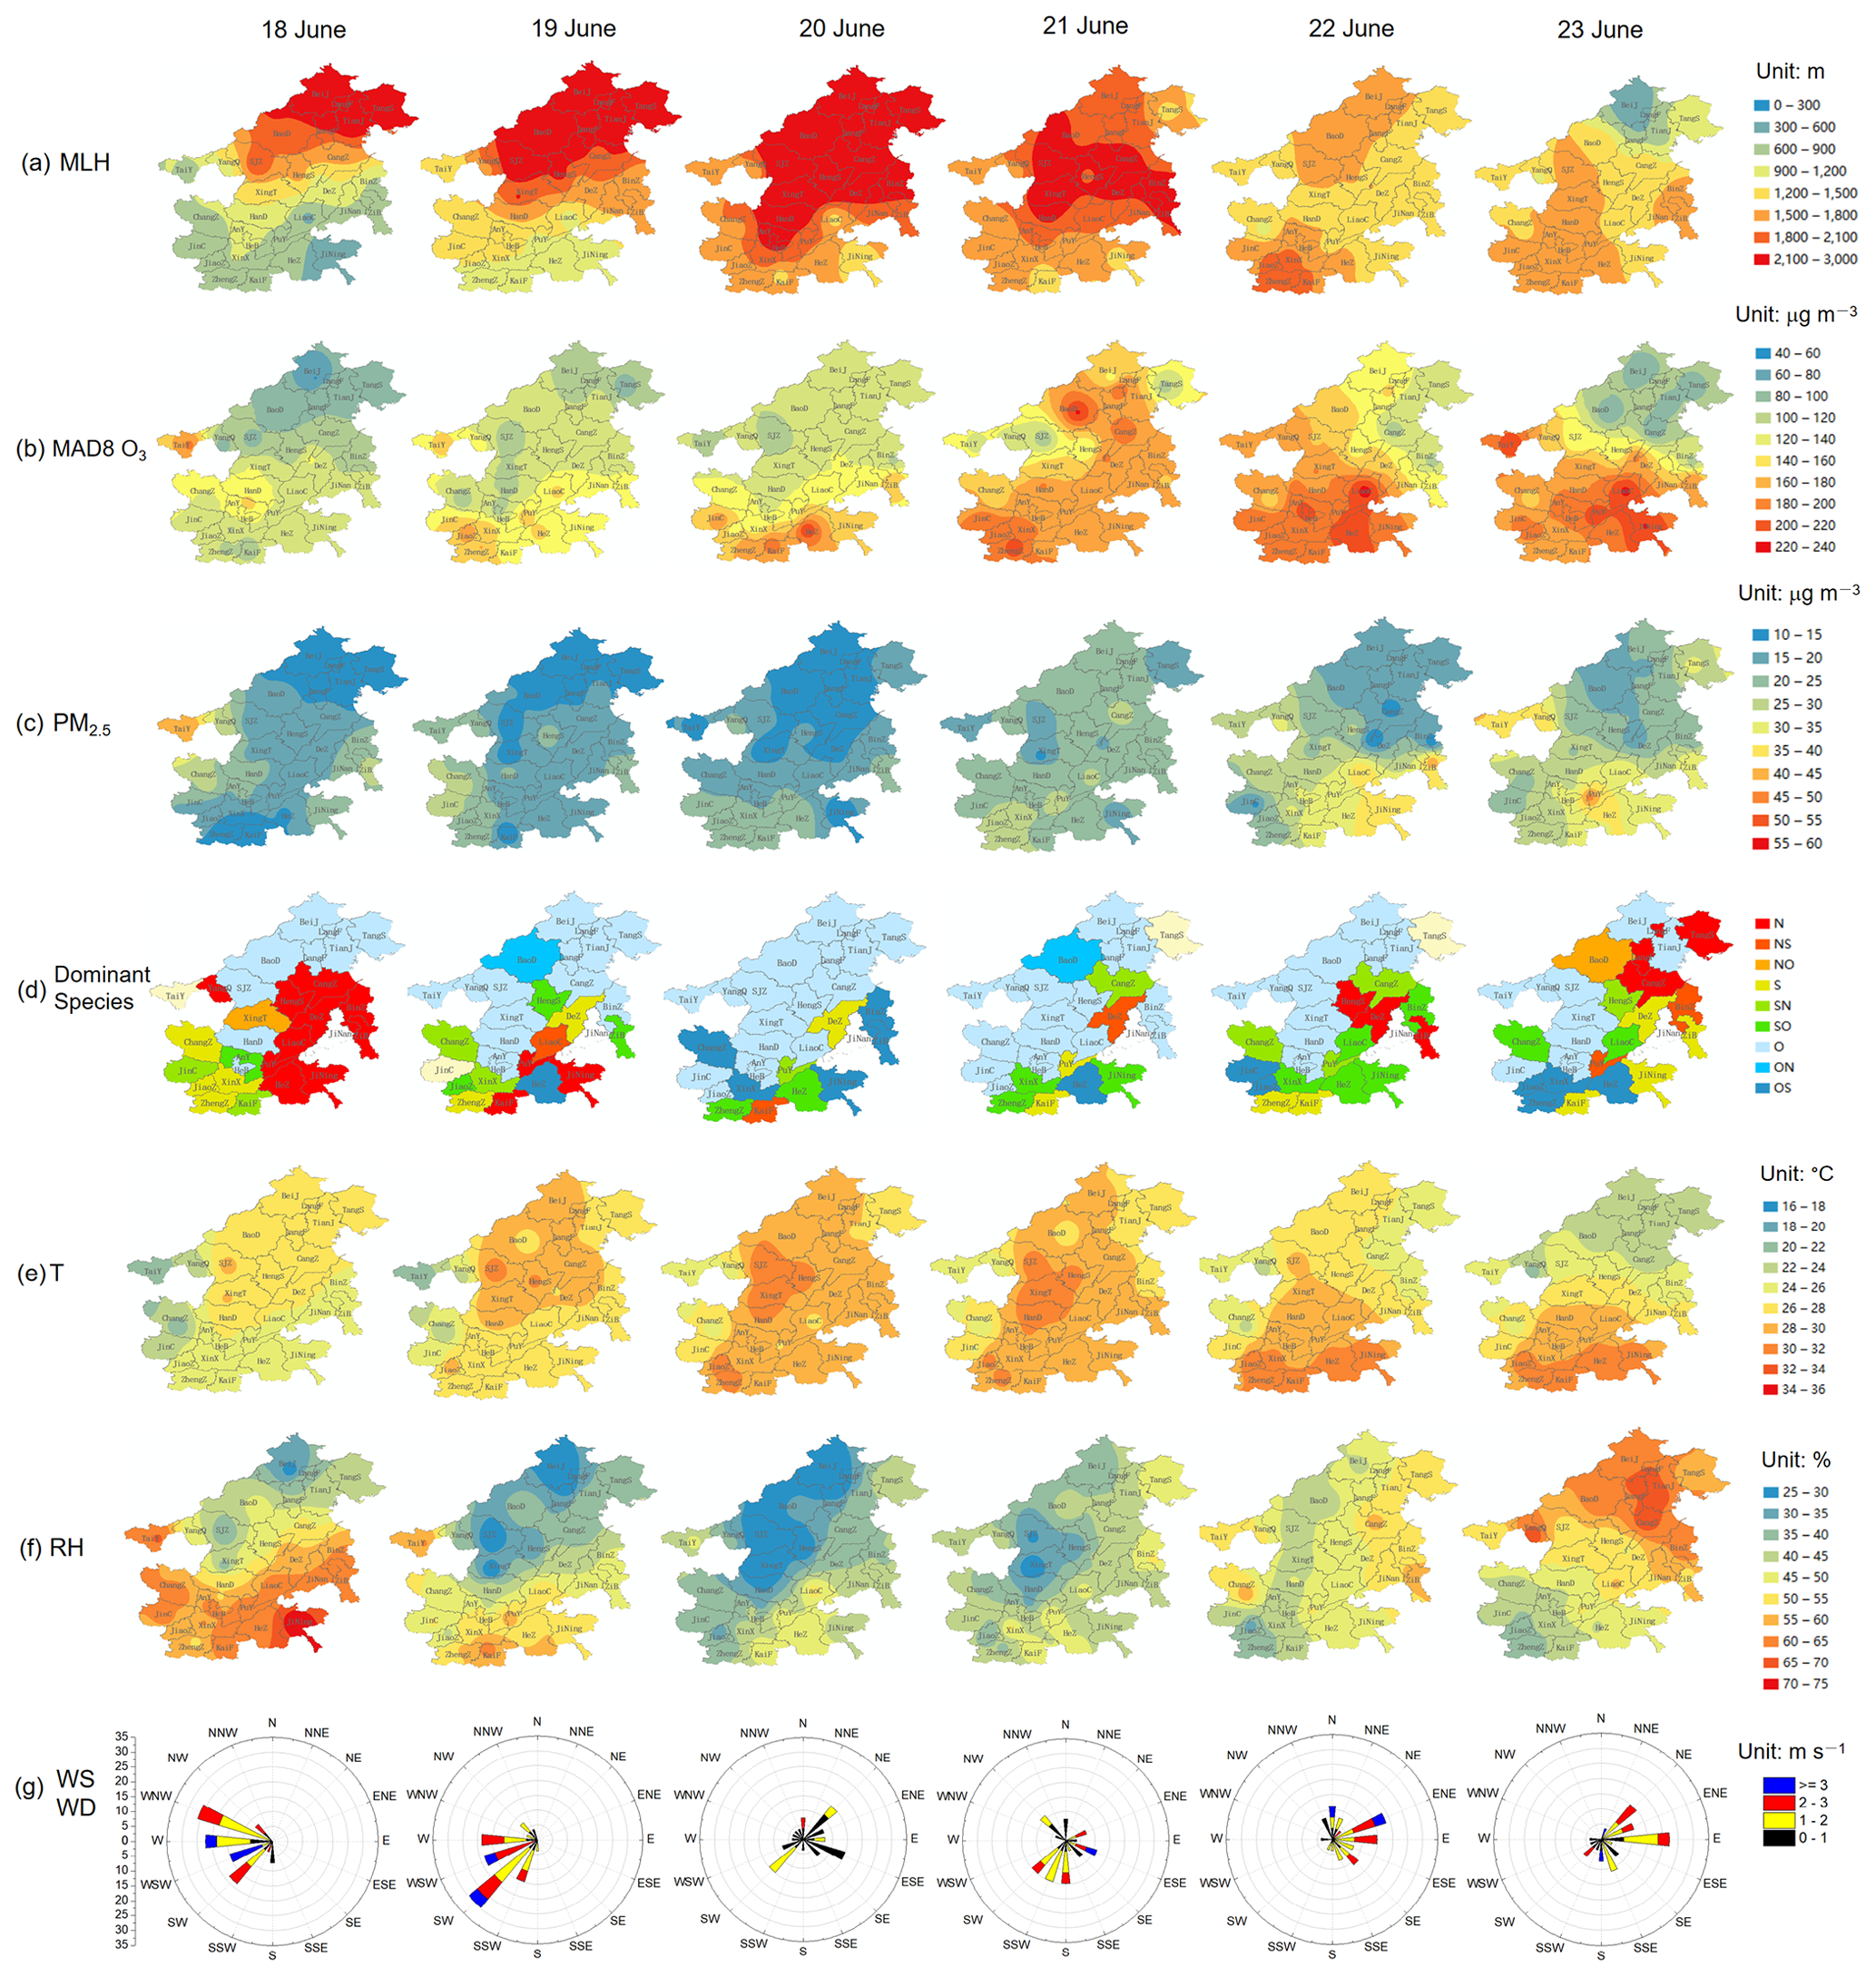
Figure 9Spatial distributions of (a) MLH, (b) MDA8 O3, (c) PM2.5, (d) the dominant PM2.5 chemical component (N: NO dominant, NS: NO and SO dominant, NO: NO and OM dominant, S: SO dominant, SN: SO and NO dominant, SO: SO and OM dominant, O: OM dominant, ON: OM and NO dominant, OS: OM and SO dominant), (e) T, and (f) RH. Row (g) shows the overall change characteristics of WS and WD in the NCP from 18 to 23 June 2021. The dominant PM2.5 chemical component type was identified with the method proposed by J. Wang et al. (2022a): if the mass fraction of the maximum component was 1.2 times higher than that of the secondary one, the former was considered the dominant factor; otherwise, both dominated PM2.5 formation.
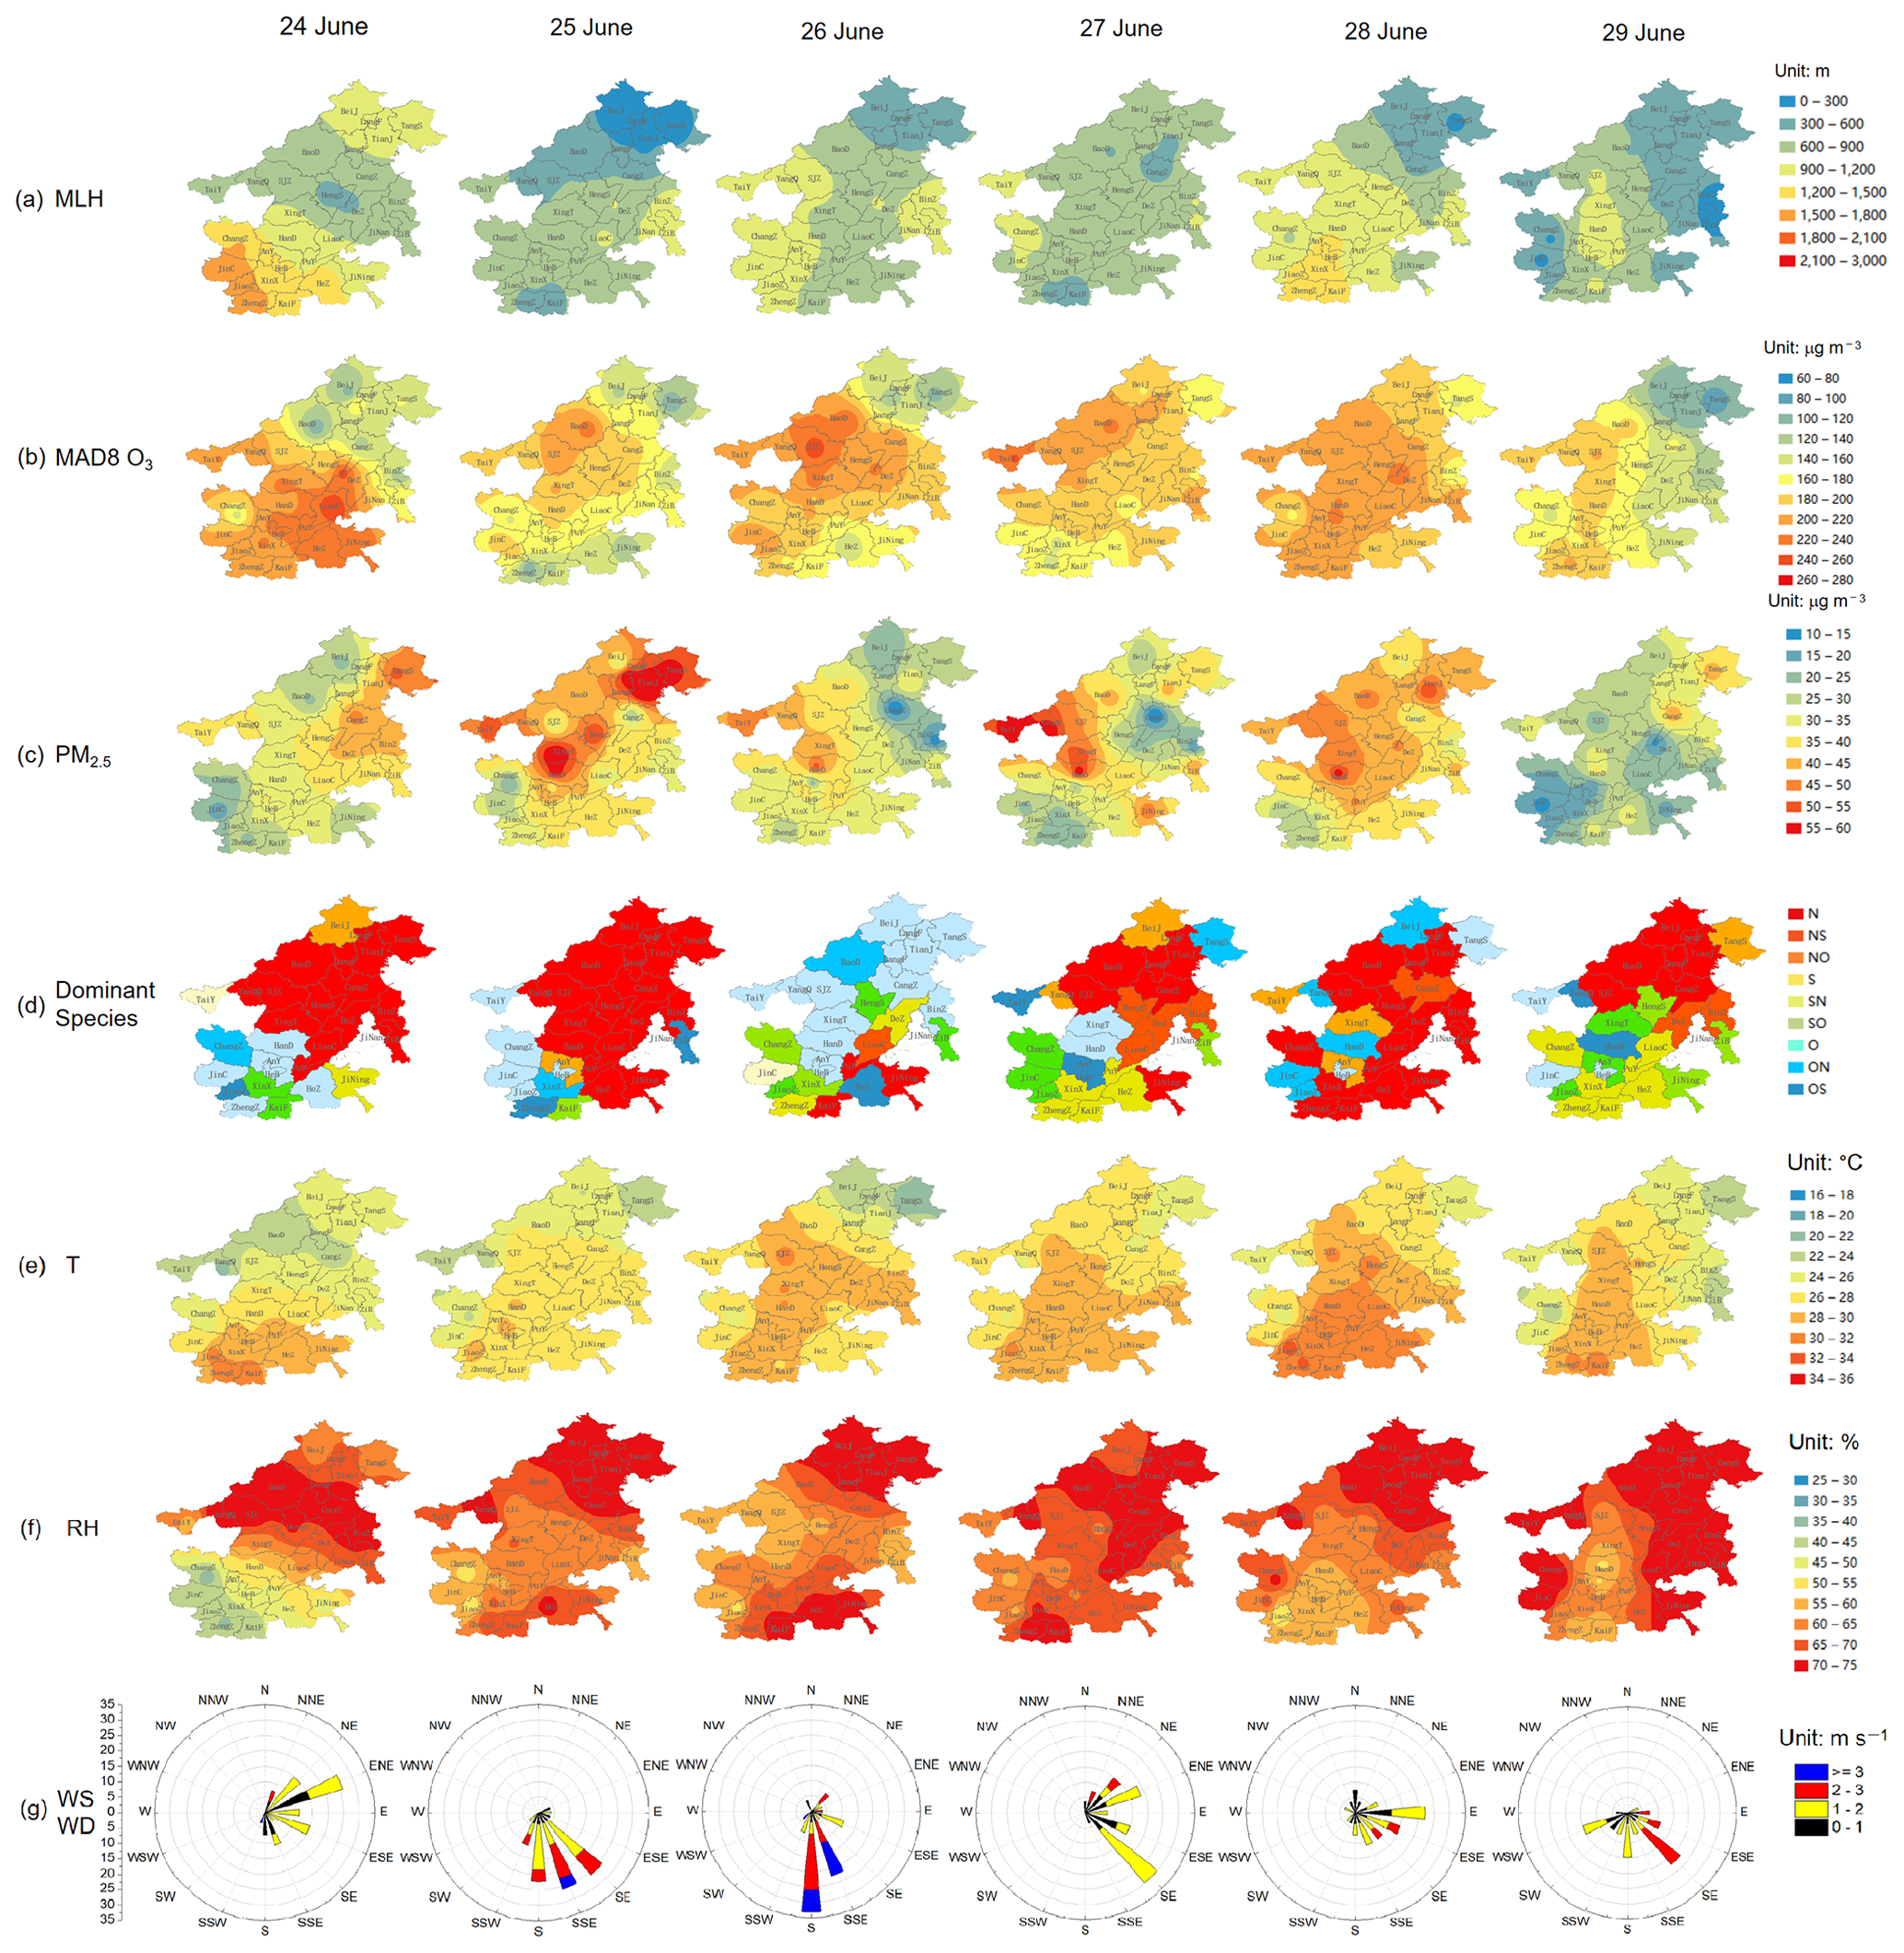
Figure 10Spatial distribution of (a) MLH, (b) MDA8 O3, (c) PM2.5, (d) the dominant PM2.5 chemical component (N: NO dominant, NS: NO and SO dominant, NO: NO and OM dominant, S: SO dominant, SN: SO and NO dominant, SO: SO and OM dominant, O: OM dominant, ON: OM and NO dominant, OS: OM and SO dominant), (e) T, and (f) RH. Row (g) shows the overall change characteristics of WS and WD in the NCP from 24 to 29 June 2021. The dominant PM2.5 chemical component type was identified with the method proposed by J. Wang et al. (2022a): if the mass fraction of the maximum component was 1.2 times higher than that of the secondary one, the former was considered the dominant factor; otherwise, both dominated PM2.5 formation.
To better understand this PM2.5–O3 co-polluted event, here we classified the observations during this typical event into four categories: O3 polluted days (O3PDs; MDA8 O3 concentration >160 µg m−3 and PM2.5<35 µg m−3), PM2.5 polluted days (PM2.5PDs; MDA8 O3 concentration <160 µg m−3 and PM2.5>35 µg m−3), O3–PM2.5 co-pollution days (O3–PM2.5CPDs; MDA8 O3 concentration >160 µg m−3 and PM2.5>35 µg m−3), and non-polluted days (NPDs; MDA8 O3<80 µg m−3 and PM2.5<35 µg m−3). The meteorological and chemical characteristics of the O3–PM2.5CPD, O3PD, PM2.5PD, and NPD categories are presented in Fig. 11. The results indicate that the values of MLH on O3–PM2.5CPDs were between those on O3PDs and PM2.5PDs at approximately 900 m. On O3–PM2.5CPDs, the oxidation ratio of sulfate (SOR, the molar ratio of sulfate to the sum of sulfate and SO2) and oxidation ratio of nitrate (NOR, the molar ratio of nitrate to the sum of nitrate and NO2) were the highest, with values of 0.44 and 0.33, respectively, which indicated the strong secondary formation of SO and NO promoted by high O3 concentration. The PM2.5PDs occurred when MLH was lower than 650 m, and the percentage of NO was the highest on PM2.5PDs. The rise in PM2.5 in some cities under low-MLH conditions may be attributed to three mechanisms. The first is the accumulation effect due to unfavourable diffusion conditions when MLH decreased. Secondly, these cities experienced little rain, and the effect of wet deposition was weak. In addition, the corresponding low temperature and high RH stimulated the formation of NO from the gaseous state (HNO3). On the O3PDs, the MLH was approximately 1300 m, and the NOR turned to decrease, demonstrating a more significant role of the partitioning process between gas and aerosols than that of the atmospheric oxidation process at this stage. On the NPDs, the MLH was the highest, with a value of approximately 2400 m, and the PM2.5 chemical composition was dominated by OM.
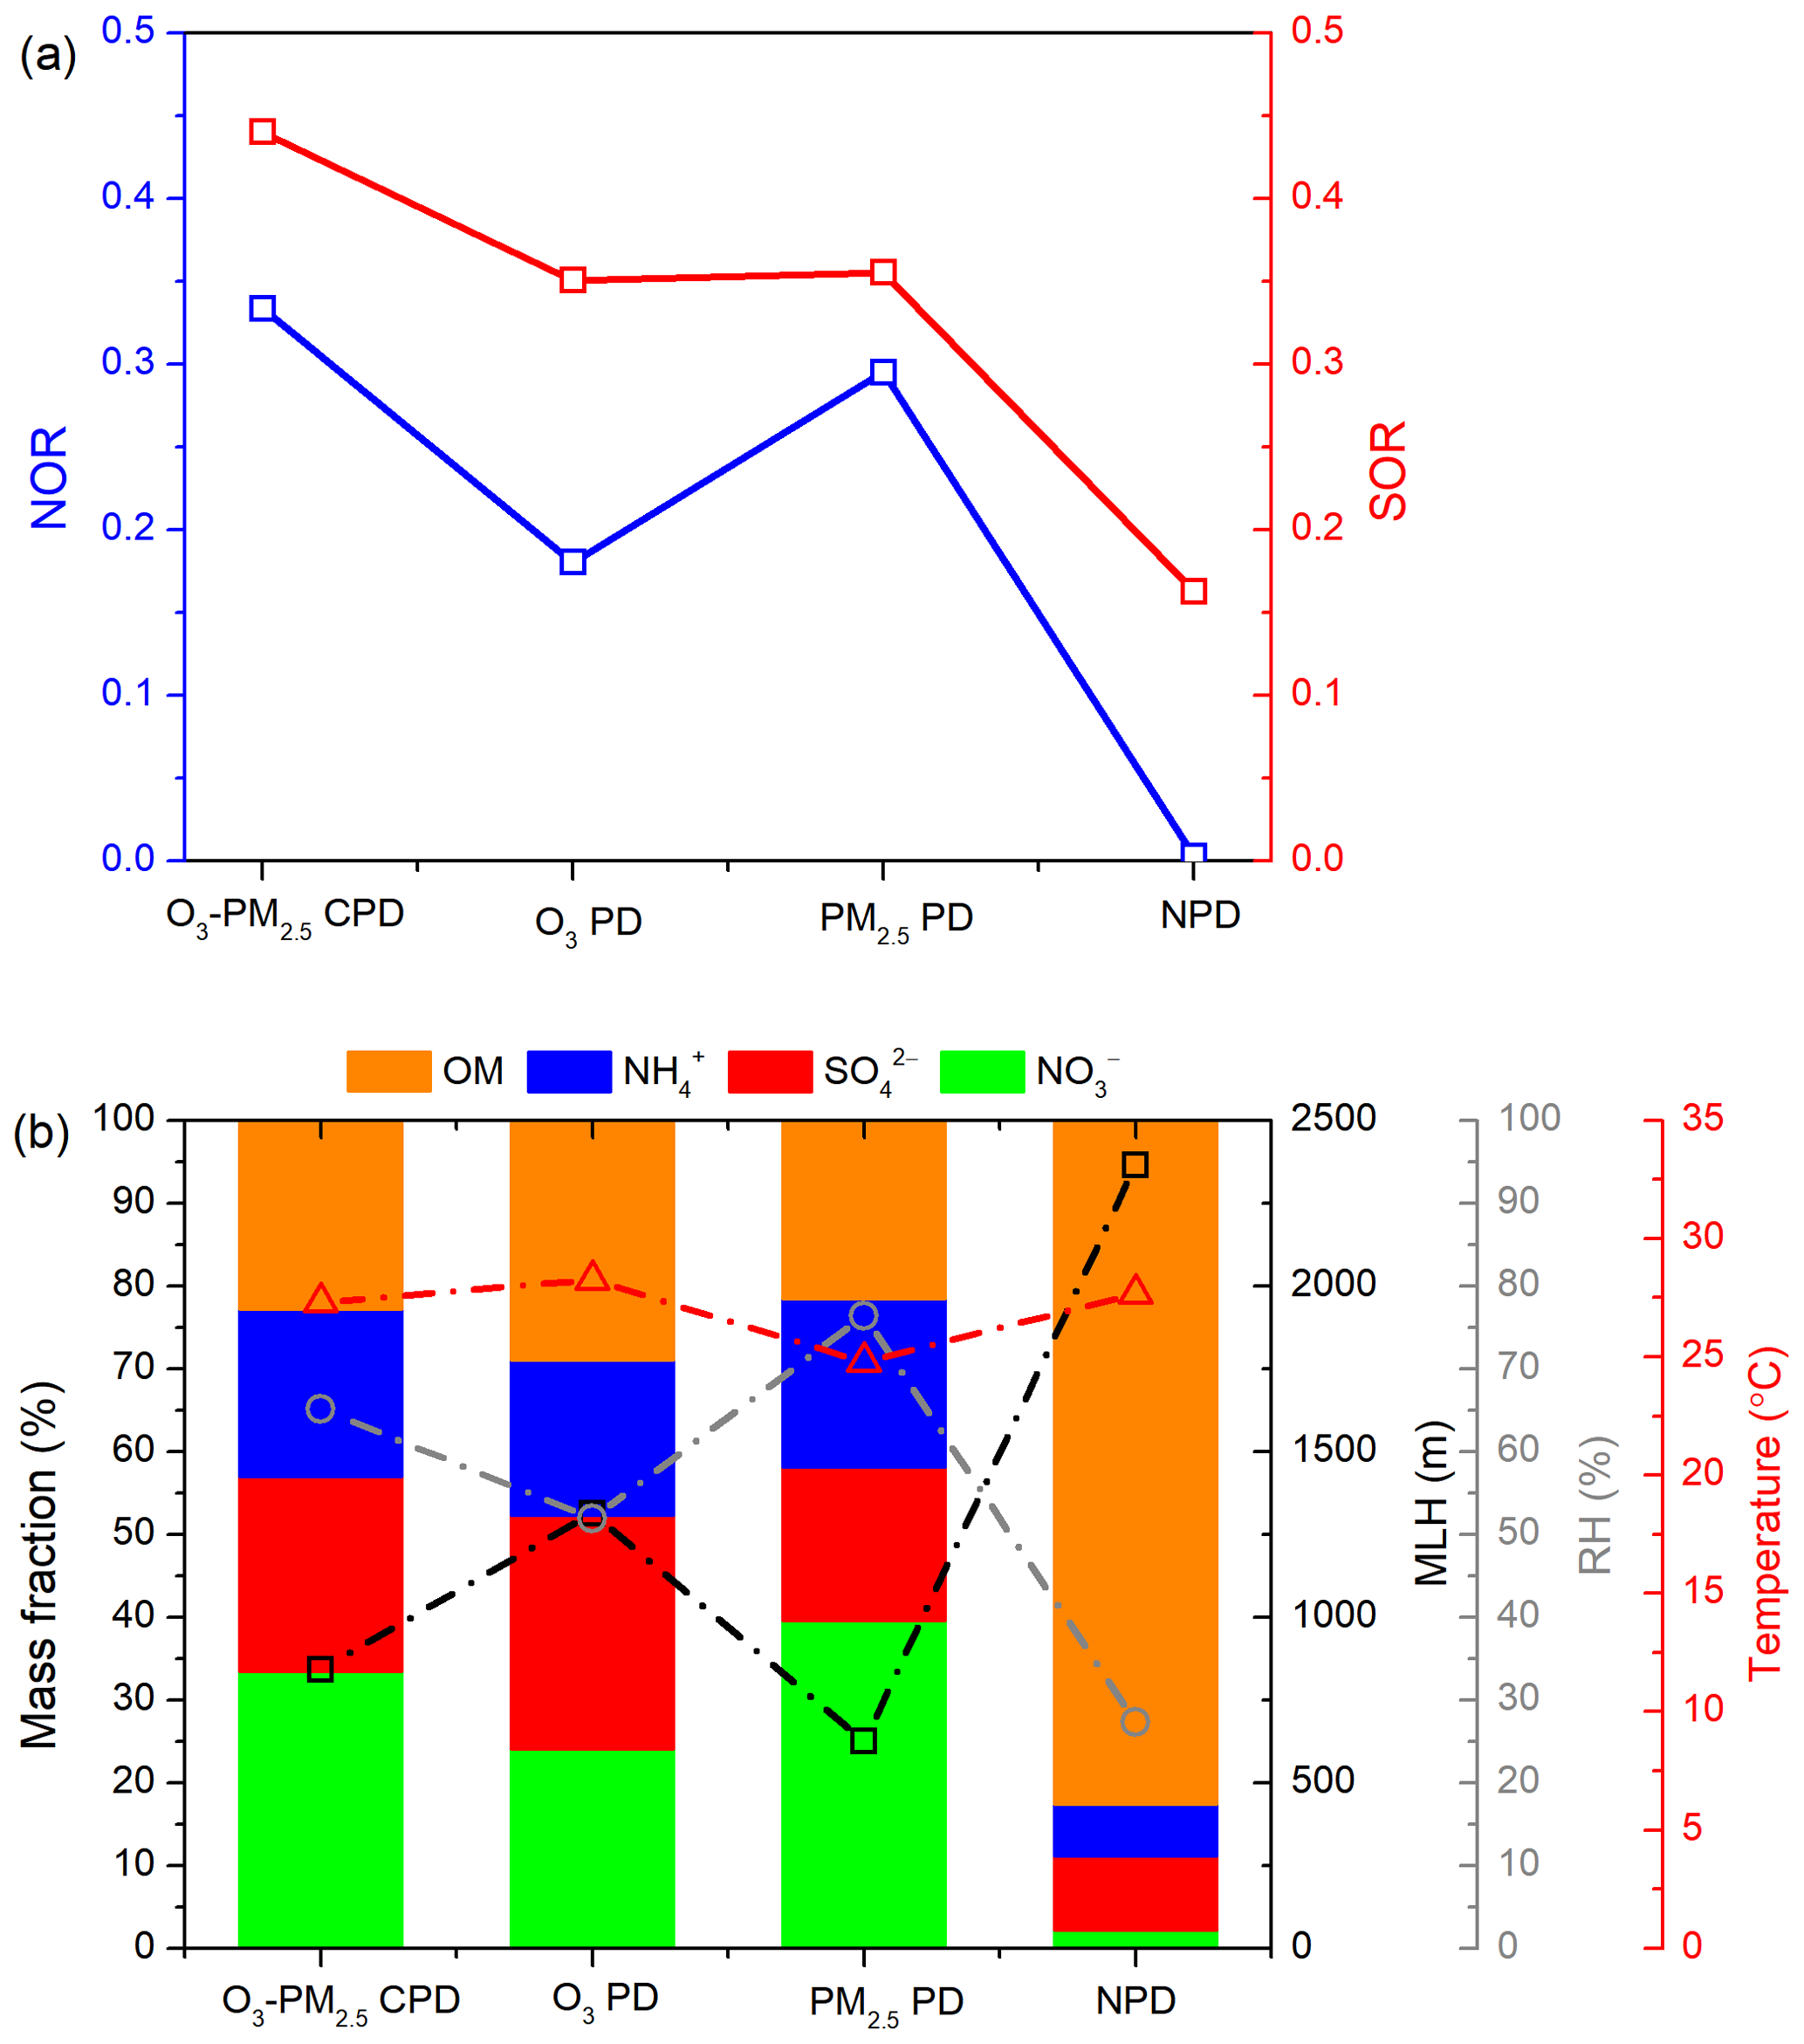
Figure 11Distribution characteristics of (a) NOR and SOR and (b) the mass fractions of major PM2.5 components, MLH, RH, and temperature under O3–PM2.5CPDs, O3PDs, PM2.5PDs, and NPD conditions from 24 to 29 June 2021.
To explore the relevance of hourly O3, PM2.5, its components, and MLH, we have taken PuY and HeZ as examples. Figure S4 plotted the day-to-day variations along with the diurnal variations in O3, PM2.5, its components, and MLH in PuY and HeZ during Episode II (18-29 June 2021). The results showed that there was large diurnal and day-to-day variability in O3 and PM2.5 levels. Diurnal variations in MLH were clearly visible (Fig. S5), with an increase in MLH during the daytime and a decrease at night. The concentration of PM2.5 increased with the decrease in MLH at night, but the concentration of O3 increased with an increase in MLH during the daytime. Interestingly, we observed a noontime soaring of SO and OC concentrations in PuY, and the values of SOR remained stable or even increased at noon. Additionally, O3 and PM2.5 gradually accumulated with the development of mixing layer during 18–21 and 26–28 June, which can be attributed to the O3 and PM2.5 superposition-composite effects. The decrease in PM2.5 during the daytime with the rise in MLH can be offset partly by an increment in secondary pollutant formation derived from O3 growth. Then, with the decrease in MLH at night, the concentration of the original existing PM2.5 increased, owing to unfavourable diffusion. In general, the conclusions of this study are only suitable for the day-to-day relationship between air pollutants and MLH. Hourly relationships are much more complicated and require further analysis.
3.4.2 Interaction between PM2.5 and O3 along with the evolution of MLH
Figure 12 displays the box-and-whisker plots of PM2.5 and its major components for different MDA8 O3 conditions. To isolate the impacts of precipitation on PM2.5 concentration, these rainy days when the daily rainfall amount was greater than 0 mm were excluded. Here the concentrations of PM2.5 and its major components were found to increase synchronously with elevated MDA8 O3 concentration, especially when MDA8 O3 increased from <140 to 180–200 µg m−3. This summertime collaborative growth process of PM2.5–O3 has also been observed in other studies (F. Wang et al., 2022; Wu et al., 2022). With elevated MDA8 O3 concentration, SOR and NOR both slightly increased and reached the maximum when MDA8 O3 was at around 160–200 µg m−3, which indicated the strong secondary formation of SO and NO promoted by high O3 concentration. When MDA8 O3 increased from 180–200 to >200 µg m−3, the concentrations of NO, NH, and SO kept stable or began to decrease, and the values of SOR and NOR decreased synchronously. During this stage, the high O3 concentration was often accompanied by dry and hot meteorological conditions, which was not beneficial to aqueous chemical production and was conducive to the partitioning of nitrate to the gas phase.
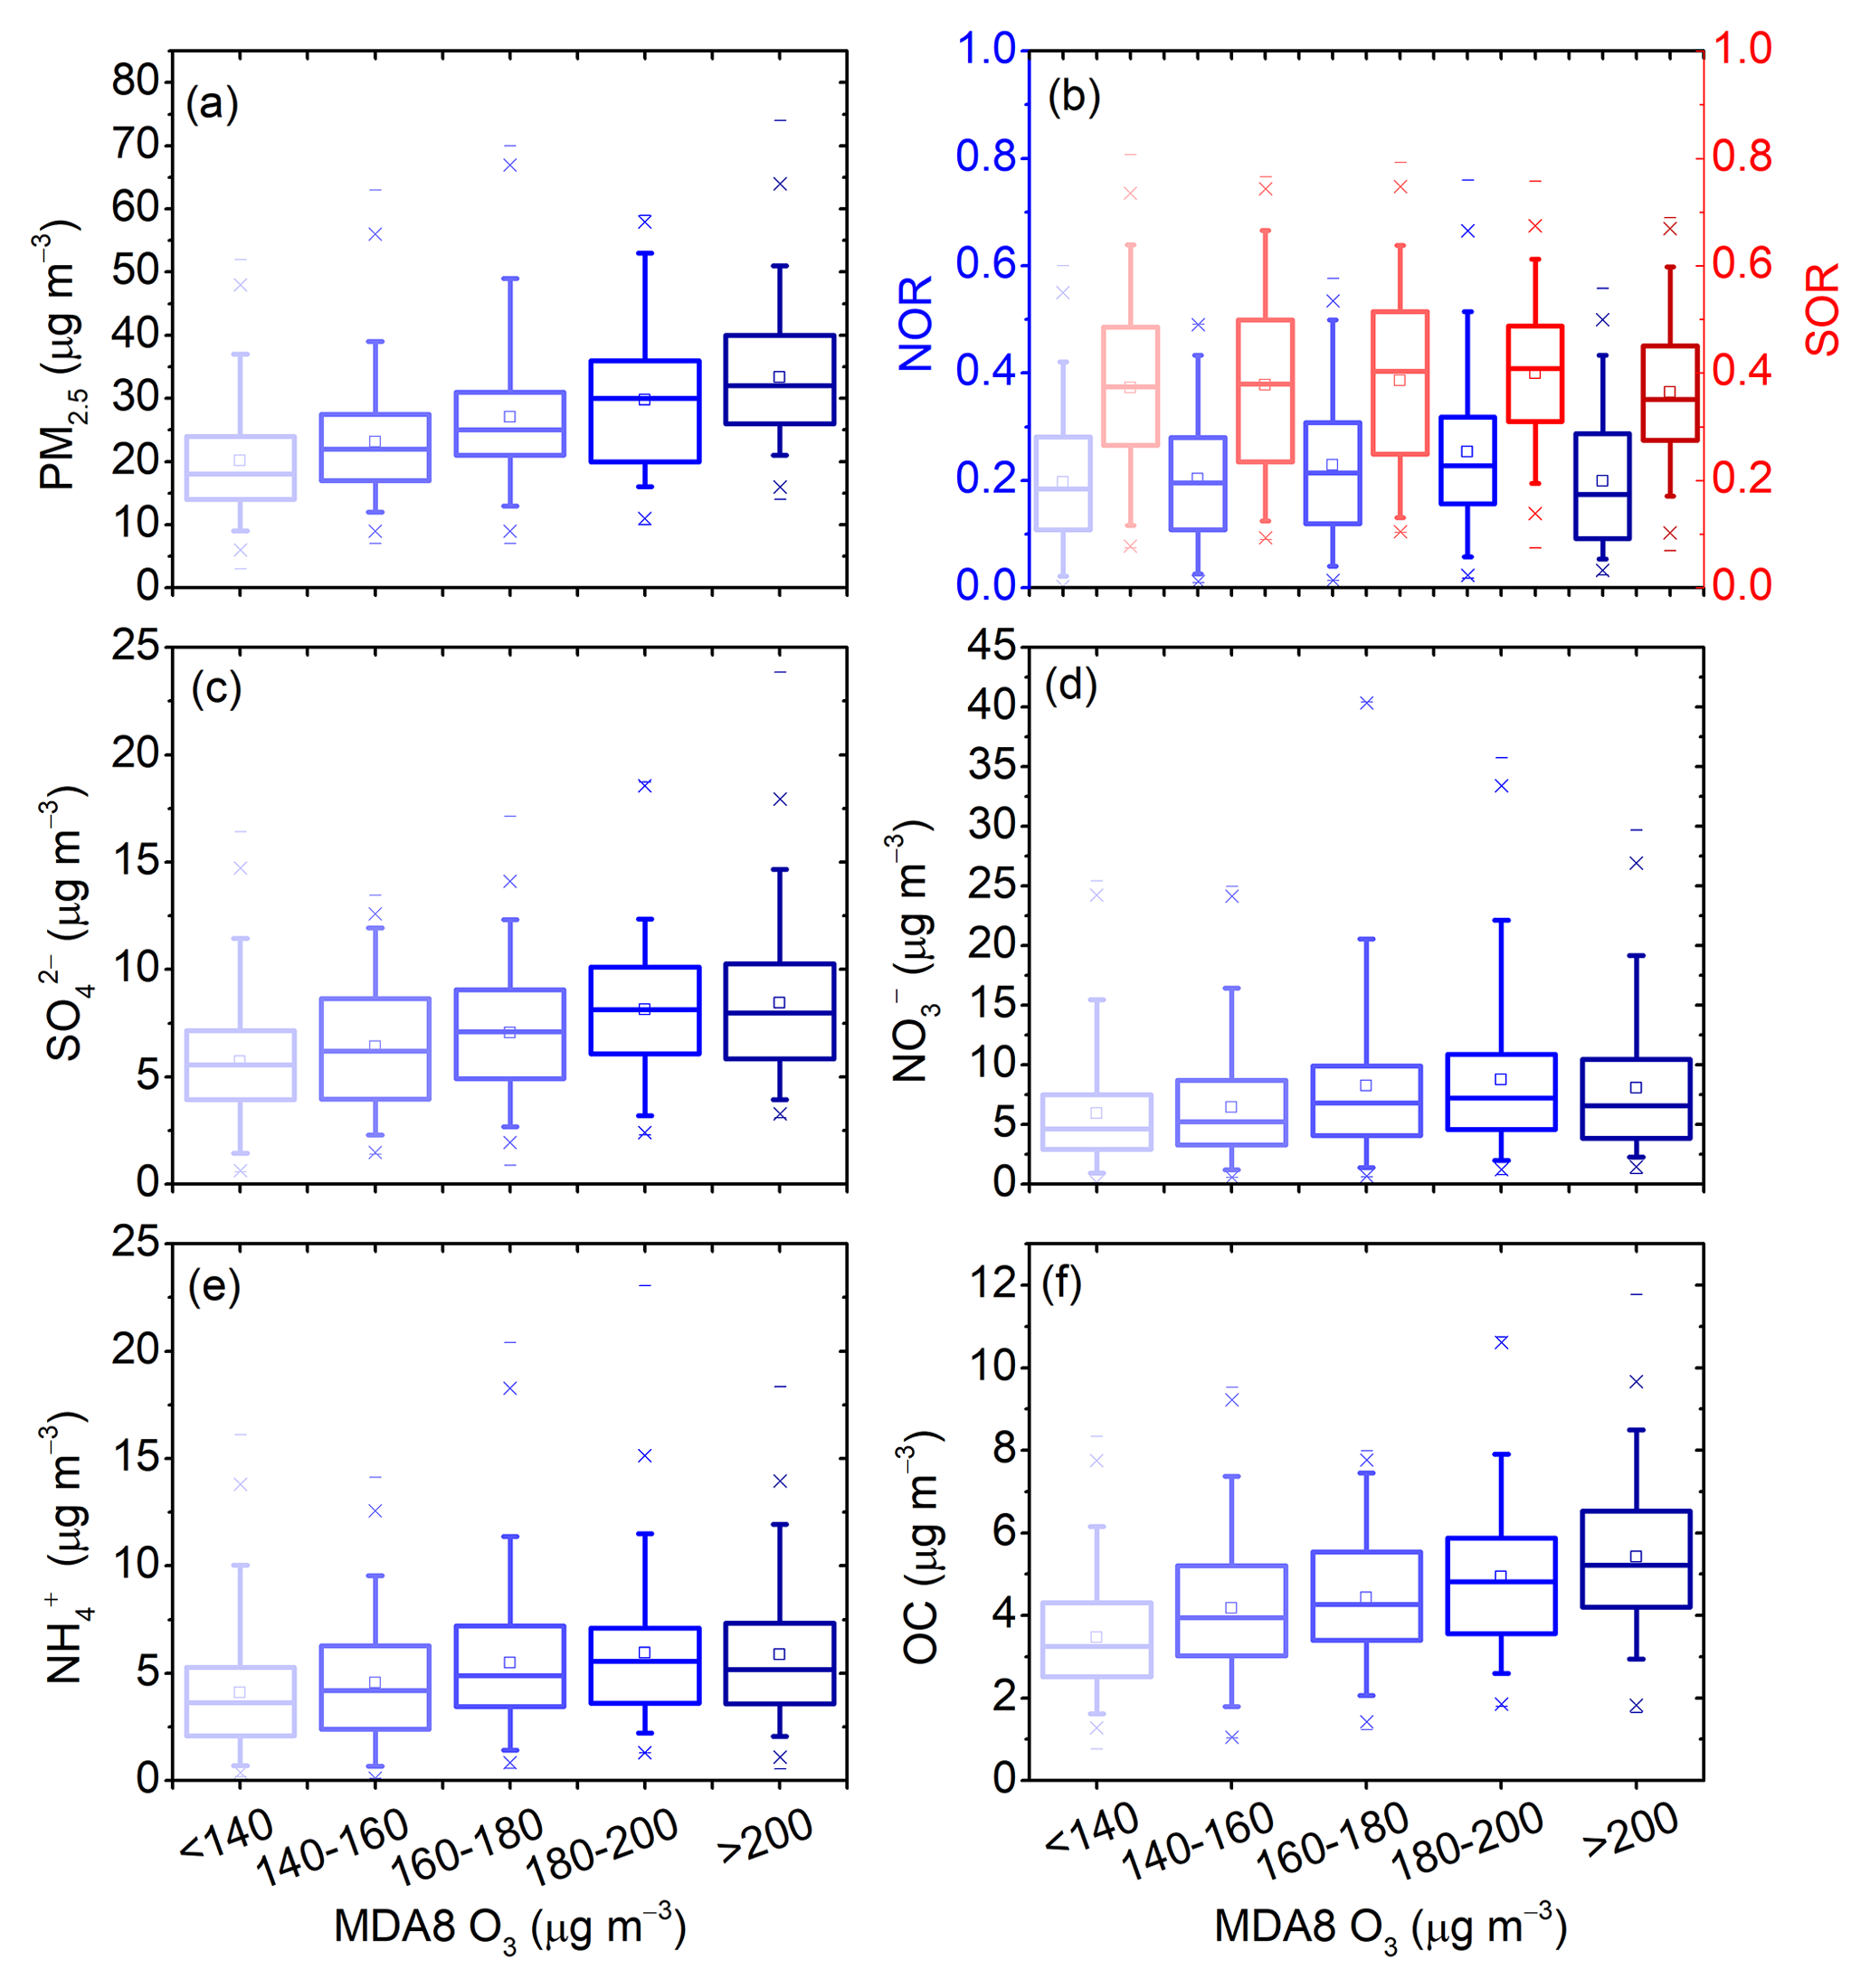
Figure 12Box plots showing the statistics of (a) PM2.5, (b) NOR and SOR, (c) SO, (d) NO, (e) NH, and (f) OC for different MDA8 O3 conditions (< 140, 140–160, 160–180, 180–200, and >200 µg m−3). The distance between the bottom and the top of the box reflects the interquartile range; the line and square in between are the median and mean values, respectively. The whiskers above and below the box refer to the 95 % confidence interval of the data. Note that rainy days were excluded.
To verify the potential impact of photochemical oxidation on the increase in PM2.5 concentration with mixing layer development, the changes in PM2.5 and MDA8 O3 along with the increase in MLH were quantified in the 2+26 cities in the NCP. Linear regression equations between air pollutants and MLH were fitted during the initial increasing stage (300 m < MLH < 1200 m), and their slopes are shown in Fig. 13. The slopes indicated the rates of the maximum changes in air pollutant concentration per unit change in the MLH (100 m). The slopes of PM2.5 and O3 were expressed as ΔPM2.5 and ΔO3 (µg m−3 (100) m−1). It was found that ΔPM2.5 was closely related to ΔO3 (R2=0.58), and the spatial difference in ΔPM2.5 and ΔO3 was witnessed in the NCP during the observation period. ΔPM2.5 and ΔO3 both showed high values in YangQ, LangF, and CangZ, with values of 7.56 and 20.24 µg m−3 (100) m−1 in YangQ, 5.75 and 18.97 µg m−3 (100) m−1 in LangF, and 4.02 and 19.49 µg m−3 (100) m−1 in CangZ, respectively. Comparing with these cities, ΔPM2.5 and ΔO3 were lowest in HeB, with the value of 3.54 and −2.02 µg m−3 (100) m−1, respectively, which implied that the secondary formation here was weak, and the surface PM2.5 change characteristic was dominantly controlled by local emissions or vertical diffusion effect.
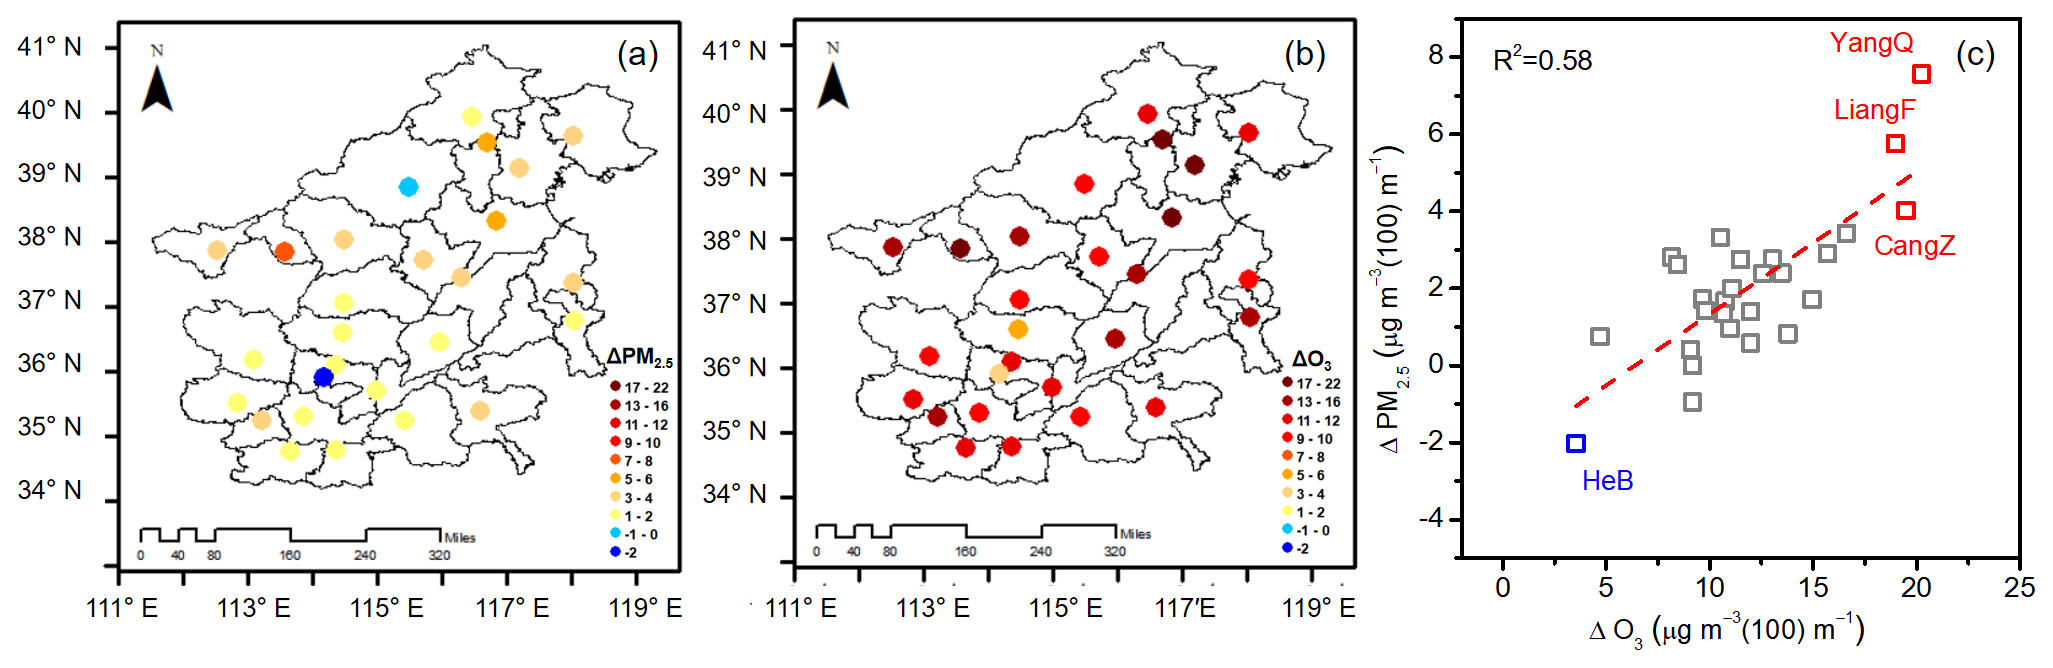
Figure 13Spatial distribution of (a) ΔPM2.5 and (b) ΔO3. (c) The relationships between ΔPM2.5 and ΔO3 in the NCP during summertime. The corresponding correlation coefficient (R2) is given at the top of the panel.
Compared to winter, photochemistry in summer is quite active because of strong solar radiation. Although a deep MLH favours the dilution of air pollutants, a higher MLH can also promote secondary chemical feedback by enhancing the availability of atmospheric oxidation capacity (such as changes in O3) along with appropriate meteorological conditions. This conclusion corresponds well with the findings based on a chemical transport model (Dai et al., 2023), which proposed strong chemical production of secondary aerosols when the planetary boundary layer height was approximately 946.1 m on O3–PM2.5 co-pollution days. The strong chemical productions in the oxidative atmosphere at medium-MLH conditions may overcome the dilution effect on PM2.5 induced by mixing layer development, leading to higher PM2.5 level at the ground level. However, it should be noted that the conclusions of this study are only suitable for summertime regional observations, especially for the warm and humid season. Conditions were different in winter (much lower O3 levels). More extended observations in time and space are needed in the future to further examine and better understand the complex interactions between MLH, air pollution, and chemical processing.
The MLH is generally considered a critical physical parameter in atmospheric environmental evaluation. It is assumed that an extended mixing layer may lead to the dilution of air pollutants and thus tend to decrease surface concentrations. Several publications have indeed reported such anti-correlations in cold seasons. However, the understanding of the interaction between near-surface O3 and PM2.5 (including its major components) along with the evolution of the mixing layer during the warm season, remains poor. Furthermore, previous observational studies were mostly limited to specific cities. This paper is devoted to these topics by examining the response of MDA8 O3, and PM2.5 and its major components to the changes in mixing layer meteorology in the NCP during summer. We showed that MDA8 O3 initially increased and then decreased with the growth of MLH. The maximum turning point of the MLH was approximately 900–1800 m. As for near-ground PM2.5, a similar non-linear change profile was found, with the maximum value of 31.65 µg m−3 under medium-MLH conditions (900–1200 m), which was quite different from the results conducted in the cold season. Compared to winter, the occurrence of low MLH during summer in the NCP was mostly accompanied by cloudy or rainy conditions, which promoted wet deposition and led to low concentrations of PM2.5 at the ground level. Under medium-MLH conditions, strong chemical productions of SO and OC occurred along with appropriate mixing layer meteorology, where RH was around 50 %–70 % and the availability of atmospheric oxidants (i.e. O3) increased. Strong chemical productions under medium-MLH conditions may offset the diffusion effect on PM2.5 induced by the mixing layer development, resulting in higher PM2.5. The chemical characteristics of PM2.5 changed significantly with the growth of MLH. The composited concentration of NO was the highest under low-MLH conditions, while the composited concentrations of SO and OC increased under medium-MLH conditions. Temperature was the key factor controlling the different changes in NO and SO concentrations in PM2.5. We conclude that MLH can be an indicator of air pollutants in cold seasons, but the correlation between MLH and air pollutants, such as O3 and PM2.5, should be treated with care during the hot season. At least for the observation period in the NCP, this was not the case. Although several studies have examined the change characteristics of the MLH and its influence on ground-level O3 and PM2.5, it remains challenging to elucidate the mechanisms underlying these complex relationships. In this study, we did not quantify the sensitivity of O3 and PM2.5 to different meteorological factors and chemical processes. To better understand the complex interactions among MLH, air pollution, and chemical processing, a more detailed consideration with the aid of explicit models is needed in the future. We also note that the present study is only confined to summer conditions (including 2 summer months) in the NCP, and the conclusions are likely to differ for other seasons and regions. Therefore, more extensive observations in time and space are required in the future.
The data used in this paper can be provided upon request from the corresponding author.
The supplement related to this article is available online at: https://doi.org/10.5194/acp-23-14715-2023-supplement.
JW, JG, and HL conceived the study and designed the experiments. JW, FC, XY, YY, LL, and YX analysed the data. JW prepared the paper, and all the co-authors helped improve the paper.
The contact author has declared that none of the authors has any competing interests.
Publisher's note: Copernicus Publications remains neutral with regard to jurisdictional claims made in the text, published maps, institutional affiliations, or any other geographical representation in this paper. While Copernicus Publications makes every effort to include appropriate place names, the final responsibility lies with the authors.
We thank the platform of the National Atmospheric Particulate Chemical-Speciation-Network for making the PM2.5 chemical composition data available.
This work was supported by the National Natural Science Foundation of China (grant no. 42075182), the National research programme for key issues in air pollution control (grant no. DQGG2021101) and the Central Level, Scientific Research Institutes for Basic R&D Special Fund Business, China (grant no. 2022YSKY-26).
This paper was edited by Xavier Querol and reviewed by two anonymous referees.
Cheng, J., Su, J., Cui, T., Li, X., Dong, X., Sun, F., Yang, Y., Tong, D., Zheng, Y., Li, Y., Li, J., Zhang, Q., and He, K.: Dominant role of emission reduction in PM2.5 air quality improvement in Beijing during 2013–2017: a model-based decomposition analysis, Atmos. Chem. Phys., 19, 6125–6146, https://doi.org/10.5194/acp-19-6125-2019, 2019.
Chow, W. S., Liao, K., Huang, X. H. H., Leung, K. F., Lau, A. K. H., and Yu, J. Z.: Measurement report: The 10-year trend of PM2.5 major components and source tracers from 2008 to 2017 in an urban site of Hong Kong, China, Atmos. Chem. Phys., 22, 11557–11577, https://doi.org/10.5194/acp-22-11557-2022, 2022.
Chu, B., Ma, Q., Liu, J., Ma, J., Zhang, P., Chen, T., Feng, Q., Wang, C., Yang, N., Ma, H., Ma, J., Russell, A. G., and He, H.: Air Pollutant Correlations in China: Secondary Air Pollutant Responses to NOx and SO2 Control, Environ. Sci. Tech. Let., 7, 695–700, https://doi.org/10.1021/acs.estlett.0c00403, 2020.
Cohen, A. J., Brauer, M., Burnett, R., Anderson, H. R., Frostad, J., Estep, K., Balakrishnan, K., Brunekreef, B., Dandona, L., and Dandona, R.: Estimates and 25-year trends of the global burden of disease attributable to ambient air pollution: an analysis of data from the Global Burden of Diseases Study 2015, Lancet, 389, 1907–1918, https://doi.org/10.1016/S0140-6736(17)30505-6, 2017.
Dai, H., Liao, H., Li, K., Yue, X., Yang, Y., Zhu, J., Jin, J., Li, B., and Jiang, X.: Composited analyses of the chemical and physical characteristics of co-polluted days by ozone and PM2.5 over 2013–2020 in the Beijing–Tianjin–Hebei region, Atmos. Chem. Phys., 23, 23–39, https://doi.org/10.5194/acp-23-23-2023, 2023.
Dang, R., Liao, H., and Fu, Y.: Quantifying the anthropogenic and meteorological influences on summertime surface ozone in China over 2012–2017, Sci. Total. Environ., 754, 142394, https://doi.org/10.1016/j.scitotenv.2020.142394, 2021.
Dawson, J. P., Adams, P. J., and Pandis, S. N.: Sensitivity of PM2.5 to climate in the Eastern US: a modeling case study, Atmos. Chem. Phys., 7, 4295–4309, https://doi.org/10.5194/acp-7-4295-2007, 2007.
Du, C., Liu, S., Yu, X., Li, X., Chen, C., Peng, Y., Dong, Y., Dong, Z., and Wang, F.: Urban boundary layer height characteristics and relationship with particulate matter mass concentrations in Xi'an, Central China, Aerosol Air Qual. Res., 13, 1598–1607, https://doi.org/10.4209/aaqr.2012.10.0274, 2013.
Gao, Y. and Ji, H.: Microscopic morphology and seasonal variation of health effect arising from heavy metals in PM2.5 and PM10: One-year measurement in a densely populated area of urban Beijing, Atmos. Res., 212, 213–226, https://doi.org/10.1016/j.atmosres.2018.04.027, 2018.
Geiß, A., Wiegner, M., Bonn, B., Schäfer, K., Forkel, R., von Schneidemesser, E., Münkel, C., Chan, K. L., and Nothard, R.: Mixing layer height as an indicator for urban air quality?, Atmos. Meas. Tech., 10, 2969–2988, https://doi.org/10.5194/amt-10-2969-2017, 2017.
Haman, C. L., Couzo, E., Flynn, J. H., Vizuete, W., Heffron, B., and Lefer, B. L.: Relationship between boundary layer heights and growth rates with ground-level ozone in Houston, Texas, J. Geophys. Res.-Atmos., 119, 6230–6245, https://doi.org/10.1002/2013jd020473, 2014.
Haugen, D. A., Kaimal, J. C., and Bradley, E. F.: An experimental study of Reynolds stress and heat flux in the atmospheric surface layer, Q. J. Roy. Meteor. Soc., 97, 168–180, 1971.
Hou, P. and Wu, S.: Long-term changes in extreme air pollution meteorology and the implications for air quality, Sci. Rep.-UK, 6, 23792, https://doi.org/10.1038/srep23792, 2016.
Jiang, N., Li, L., Wang, S., Li, Q., Dong, Z., Duan, S., Zhang, R., and Li, S.: Variation tendency of pollution characterization, sources, and health risks of PM2.5-bound polycyclic aromatic hydrocarbons in an emerging megacity in China: Based on three-year data, Atmos. Res., 217, 81–92, 2018.
Kang, M., Zhang, J., Zhang, H., and Ying, Q.: On the relevancy of observed ozone increase during COVID-19 lockdown to summertime ozone and PM2.5 control policies in China, Environ. Sci. Tech. Let., 8, 289–294, https://doi.org/10.1021/acs.estlett.1c00036, 2021.
Kong, L., Du, C., Zhanzakova, A., Cheng, T., and Zhang, S.: Trends in heterogeneous aqueous reaction in continuous haze episodes in suburban Shanghai: An in-depth case study, Sci. Total Environ., 634, 1192, https://doi.org/10.1016/j.scitotenv.2018.04.086, 2018.
Li, J., Cai, J., Zhang, M., Liu, H., Han, X., Cai, X., and Xu, Y.: Model analysis of meteorology and emission impacts on springtime surface ozone in Shandong, Sci. Total. Environ., 771, 144784, https://doi.org/10.1016/j.scitotenv.2020.144784, 2021.
Liu, J., Wu, D., Fan, S., Mao, X., and Chen, H.: A one-year, on-line, multi-site observational study on water-soluble inorganic ions in PM2.5 over the Pearl River Delta region, China, Sci. Total Environ., 601–602, 1720–1732, https://doi.org/10.1016/j.scitotenv.2017.06.039, 2017.
Liu, P., Ye, C., Xue, C., Zhang, C., Mu, Y., and Sun, X.: Formation mechanisms of atmospheric nitrate and sulfate during the winter haze pollution periods in Beijing: gas-phase, heterogeneous and aqueous-phase chemistry, Atmos. Chem. Phys., 20, 4153–4165, https://doi.org/10.5194/acp-20-4153-2020, 2020.
Liu, T., Gong, S., He, J., Yu, M., Wang, Q., Li, H., Liu, W., Zhang, J., Li, L., Wang, X., Li, S., Lu, Y., Du, H., Wang, Y., Zhou, C., Liu, H., and Zhao, Q.: Attributions of meteorological and emission factors to the 2015 winter severe haze pollution episodes in China's Jing-Jin-Ji area, Atmos. Chem. Phys., 17, 2971–2980, https://doi.org/10.5194/acp-17-2971-2017, 2017.
Lou, M., Guo, J., Wang, L., Xu, H., Chen, D., Miao, Y., Lv, Y., Li, Y., Guo, X., Ma, S., and Li, J.: On the relationship between aerosol and boundary layer height in summer in China under different thermodynamic conditions, Earth Space Sci., 6, 887–901, https://doi.org/10.1029/2019ea000620, 2019.
Lu, M., Tang, X., Wang, Z., Wu, L., Chen, X., Liang, S., Zhou, H., Wu, H., Hu, K., Shen, L., Yu, J., and Zhu, J.: Investigating the transport mechanism of PM2.5 pollution during January 2014 in Wuhan, Central China, Adv. Atmos. Sci., 36, 1217–1234, https://doi.org/10.1007/s00376-019-8260-5, 2019.
Ma, S., Shao, M., Zhang, Y., Dai, Q., and Xie, M.: Sensitivity of PM2.5 and O3 pollution episodes to meteorological factors over the North China Plain, Sci. Total. Environ., 792, 148474, https://doi.org/10.1016/j.scitotenv.2021.148474, 2021.
Markovic, M. Z., VandenBoer, T. C., and Murphy, J. G.: Characterization and optimization of an online system for the simultaneous measurement of atmospheric water-soluble constituents in the gas and particle phases, J. Environ. Monitor., 14, 1872–1884, https://doi.org/10.1039/c2em00004k, 2012.
Miao, Y., Che, H., Zhang, X., and Liu, S.: Relationship between summertime concurring PM2.5 and O3 pollution and boundary layer height differs between Beijing and Shanghai, China, Environ. Pollut., 268, 115775, https://doi.org/10.1016/j.envpol.2020.115775, 2021.
Murthy, B. S., Latha, R., Tiwari, A., Rathod, A., Singh, S., and Beig, G.: Impact of mixing layer height on air quality in winter, J. Atmos. Sol.-Terr. Phy., 197, 105157, https://doi.org/10.1016/j.jastp.2019.105157, 2020.
Niu, T., Wang, J., Yang, Y., Wang, Y., and Chen, C.: A study on parameterization of the Beijing winter heavy haze events associated with height of pollution mixing layer, Adv. Meteorol., 2017, 1–11, https://doi.org/10.1155/2017/8971236, 2017.
Pan, L., Xu, J., Tie, X., Mao, X., Gao, W., and Chang, L.: Long-term measurements of planetary boundary layer height and interactions with PM2.5 in Shanghai, China, Atmos. Pollut. Res., 10, 989–996, https://doi.org/10.1016/j.apr.2019.01.007, 2019.
Pang, N., Gao, J., Che, F., Ma, T., Liu, S., Yang, Y., Zhao, P., Yuan, J., Liu, J., Xu, Z., and Chai, F.: Cause of PM2.5 pollution during the 2016–2017 heating season in Beijing, Tianjin, and Langfang, China, J. Environ. Sci. (China), 95, 201–209, https://doi.org/10.1016/j.jes.2020.03.024, 2020.
Park, S. S., Jung, S. A., Gong, B. J., Cho, S. Y., and Lee, S. J.: Characteristics of PM2.5 haze episodes revealed by highly time-resolved measurements at an air pollution monitoring supersite in Korea, Aerosol Air Qual. Res., 13, 957–976, https://doi.org/10.4209/aaqr.2012.07.0184, 2013.
Porter, W. C. and Heald, C. L.: The mechanisms and meteorological drivers of the summertime ozone–temperature relationship, Atmos. Chem. Phys., 19, 13367–13381, https://doi.org/10.5194/acp-19-13367-2019, 2019.
Reddy, K. K., Naja, M., Ojha, N., Mahesh, P., and Lal, S.: Influences of the boundary layer evolution on surface ozone variations at a tropical rural site in India, J. Earth Syst. Sci., 121, 911–922, https://doi.org/10.1007/s12040-012-0200-z, 2012.
Rumsey, I. C., Cowen, K. A., Walker, J. T., Kelly, T. J., Hanft, E. A., Mishoe, K., Rogers, C., Proost, R., Beachley, G. M., Lear, G., Frelink, T., and Otjes, R. P.: An assessment of the performance of the Monitor for AeRosols and GAses in ambient air (MARGA): a semi-continuous method for soluble compounds, Atmos. Chem. Phys., 14, 5639–5658, https://doi.org/10.5194/acp-14-5639-2014, 2014.
Seidel, D. J., Ao, C. O., and, Li, K.: Estimating climatological planetary boundary layer heights from radiosonde observations: Comparison of methods and uncertainty analysis, J. Geophys. Res. Atmos., 115, D16113, https://doi.org/10.1029/2009JD013680, 2010.
Seinfeld, J. H. and Pandis, S. N.: Atmospheric Chemistry and Physics: From Air Pollution to Climate Change, 2nd edn., J. Wiley, Hoboken, N.J., ISBN 9781118591369, 1203 pp., 2006.
Steiner, A. L., Davis, A. J., Sillman, S., Owen, R. C., Michalak, A. M., and Fiore, A. M.: Observed suppression of ozone formation at extremely high temperatures due to chemical and biophysical feedbacks, P. Natl. Acad. Sci. USA, 107, 19685–19690, 2010.
Wang, F., Wang, W., Wang, Z., Zhang, Z., Feng, Y., Russell, A. G., and Shi, G.: Drivers of PM2.5-O3 co-pollution: from the perspective of reactive nitrogen conversion pathways in atmospheric nitrogen cycling, Sci. Bull. (Beijing), 67, 1833–1836, https://doi.org/10.1016/j.scib.2022.08.016, 2022.
Wang, G., Zhang, R., Gomez, M. E., Yang, L., Levy Zamora, M., Hu, M., Lin, Y., Peng, J., Guo, S., Meng, J., Li, J., Cheng, C., Hu, T., Ren, Y., Wang, Y., Gao, J., Cao, J., An, Z., Zhou, W., Li, G., Wang, J., Tian, P., Marrero-Ortiz, W., Secrest, J., Du, Z., Zheng, J., Shang, D., Zeng, L., Shao, M., Wang, W., Huang, Y., Wang, Y., Zhu, Y., Li, Y., Hu, J., Pan, B., Cai, L., Cheng, Y., Ji, Y., Zhang, F., Rosenfeld, D., Liss, P. S., Duce, R. A., Kolb, C. E., and Molina, M. J.: Persistent sulfate formation from London Fog to Chinese haze, P. Natl. Acad. Sci. USA, 113, 13630–13635, https://doi.org/10.1073/pnas.1616540113, 2016.
Wang, J. and Yang, Y.: Modern weather engineering, Meteorological Press, Beijing, 334–339, 2000.
Wang, J., Bian, L., and Xiao, C.: Dynamics of ekman boundary layer over the antarctic plateau in summer, Chinese Sci. Bull., 59, 999–1005, 2014.
Wang, J., Yang, Y., Zhang, X., Liu, H., Che, H., Shen, X., and Wang, Y.: On the influence of atmospheric super-saturation layer on China's heavy haze-fog events, Atmos. Environ., 171, 261–271, https://doi.org/10.1016/j.atmosenv.2017.10.034, 2017.
Wang, J., Gao, J., Che, F., Wang, Y., Lin, P., and Zhang, Y.: Dramatic changes in aerosol composition during the 2016-2020 heating seasons in Beijing-Tianjin-Hebei region and its surrounding areas: The role of primary pollutants and secondary aerosol formation, Sci. Total. Environ., 849, 157621, https://doi.org/10.1016/j.scitotenv.2022.157621, 2022a.
Wang, J., Yang, Y., Jiang, X., Wang, D., Zhong, J., and Wang, Y.: Observational study of the PM2.5 and O3 superposition-composite pollution event during spring 2020 in Beijing associated with the water vapor conveyor belt in the northern hemisphere, Atmos. Environ., 272, 118966, https://doi.org/10.1016/j.atmosenv.2022.118966, 2022b.
Wang, M., Duan, Y., Xu, W., Wang, Q., Zhang, Z., Yuan, Q., Li, X., Han, S., Tong, H., Huo, J., Chen, J., Gao, S., Wu, Z., Cui, L., Huang, Y., Xiu, G., Cao, J., Fu, Q., and Lee, S.: Measurement report: Characterisation and sources of the secondary organic carbon in a Chinese megacity over 5 years from 2016 to 2020, Atmos. Chem. Phys., 22, 12789–12802, https://doi.org/10.5194/acp-22-12789-2022, 2022.
Wen, L., Xue, L., Wang, X., Xu, C., Chen, T., Yang, L., Wang, T., Zhang, Q., and Wang, W.: Summertime fine particulate nitrate pollution in the North China Plain: increasing trends, formation mechanisms and implications for control policy, Atmos. Chem. Phys., 18, 11261–11275, https://doi.org/10.5194/acp-18-11261-2018, 2018.
Wu, W. and Wang, T.: On the performance of a semi-continuous PM2.5 sulphate and nitrate instrument under high loadings of particulate and sulphur dioxide, Atmos. Environ., 41, 5442–5451, https://doi.org/10.1016/j.atmosenv.2007.02.025, 2007.
Wu, X., Xin, J., Zhang, W., Gao, W., Ma, Y., Ma, Y., Wen, T., Liu, Z., Hu, B., Wang, Y., and Wang, L.: Variation characteristics of air combined pollution in Beijing City, Atmos. Res., 274, 106197, https://doi.org/10.1016/j.atmosres.2022.106197, 2022.
Xu, X., Zhang, H., Lin, W., Wang, Y., Xu, W., and Jia, S.: First simultaneous measurements of peroxyacetyl nitrate (PAN) and ozone at Nam Co in the central Tibetan Plateau: impacts from the PBL evolution and transport processes, Atmos. Chem. Phys., 18, 5199–5217, https://doi.org/10.5194/acp-18-5199-2018, 2018.
Yu, S.: Fog geoengineering to abate local ozone pollution at ground level by enhancing air moisture, Environ. Chem. Lett., 17, 565–580, https://doi.org/10.1007/s10311-018-0809-5, 2019.
Zhang, G., Bian, L., Wang, J., Yang, Y., Yao, W., Xu, X.: The boundary layer characteristics in the heavy fog formation process over Beijing and its adjacent areas, Sci. China Earth Sci., 48, 88–101, 2005.
Zhang, H., Wang, Y., Hu, J., Ying, Q., and Hu, X.-M.: Relationships between meteorological parameters and criteria air pollutants in three megacities in China, Environ. Res., 140, 242–254, https://doi.org/10.1016/j.envres.2015.04.004, 2015.
Zhang, R., Wang, G., Guo, S., Zamora, M. L., Ying, Q., Lin, Y., Wang, W., Hu, M., and Wang, Y.: Formation of urban fine particulate matter, Chem. Rev., 115, 3803–3855, https://doi.org/10.1021/acs.chemrev.5b00067, 2015.
Zhang, X., Xiao, X., Wang, F., Brasseur, G., Chen, S., Wang, J., and Gao, M.: Observed sensitivities of PM2.5 and O3 extremes to meteorological conditions in China and implications for the future, Environ. Int., 168, 107428, https://doi.org/10.1016/j.envint.2022.107428, 2022.
Zhao, W., Tang, G., Yu, H., Yang, Y., Wang, Y., Wang, L., An, J., Gao, W., Hu, B., Cheng, M., An, X., Li, X., and Wang, Y.: Evolution of boundary layer ozone in Shijiazhuang, a suburban site on the North China Plain, J. Environ. Sci. (China), 83, 152–160, https://doi.org/10.1016/j.jes.2019.02.016, 2019.
Zhu, X., Tang, G., Guo, J., Hu, B., Song, T., Wang, L., Xin, J., Gao, W., Münkel, C., Schäfer, K., Li, X., and Wang, Y.: Mixing layer height on the North China Plain and meteorological evidence of serious air pollution in southern Hebei, Atmos. Chem. Phys., 18, 4897–4910, https://doi.org/10.5194/acp-18-4897-2018, 2018.