the Creative Commons Attribution 4.0 License.
the Creative Commons Attribution 4.0 License.
Undetected biogenic volatile organic compounds from Norway spruce drive total ozone reactivity measurements
Steven Job Thomas
Toni Tykkä
Heidi Hellén
Federico Bianchi
Arnaud P. Praplan
Biogenic volatile organic compounds (BVOCs) are continuously emitted from terrestrial vegetation into the atmosphere and react with various atmospheric oxidants, with ozone being an important one. The reaction between BVOCs and ozone can lead to low volatile organic compounds, other pollutants, and the formation of secondary organic aerosols. To understand the chemical and physical processes taking place in the atmosphere, a complete picture of the BVOCs emitted is necessary. However, the large pool of BVOCs present makes it difficult to detect every compound. The total ozone reactivity method can help understand the ozone reactive potential of all BVOCs emitted into the atmosphere and also help determine whether current analytical techniques can measure the total BVOC budget.
In this study, we measured the total ozone reactivity of emissions (TOZRE) from a Norway spruce tree in Hyytiälä in late summer using the total ozone reactivity monitor (TORM) built at the Finnish Meteorological Institute (FMI). Additionally, we conducted comprehensive chemical characterisation and quantification of BVOC emissions using a gas chromatograph coupled with a mass spectrometer (GC–MS), enabling us to estimate the calculated reactivity of emissions (COZRE).
TOZRE reached up to m3 s−2 g−1, which corresponds to 65 µg g−1 h−1 of α-pinene. Stress-related sesquiterpenes, such as β-farnesene and α-farnesene, and an unidentified sesquiterpene contributed the most to the observed emissions. However, COZRE made up only 35 % of the TOZRE, with sesquiterpenes being the most important sink for ozone. High TOZRE values were especially seen during high-temperature periods, with up to 95 % of TOZRE remaining unexplained. Emissions of unidentified stress-related compounds could be the reason for the high fraction of missing reactivity.
- Article
(3094 KB) - Full-text XML
- BibTeX
- EndNote
Terrestrial vegetation is the largest emitter of biogenic volatile organic compounds (BVOCs), which are produced from a variety of sources but with most emissions observed from foliage. BVOCs play an important role in the global climate and influence air quality by acting as precursors to ozone and secondary organic aerosols (SOAs) (Šimpraga et al., 2019). Thousands of compounds are emitted into the atmosphere, but a group of compounds called terpenoids – namely isoprene and monoterpenes (MTs) – are the dominant global BVOCs. Based on the latest biogenic emission model, the Model of Emissions of Gases and Aerosols from Nature (MEGAN v2.1; Guenther et al., 2012), it is estimated that BVOCs from tropical regions account for 80% of terpenoid emissions and 50 % of other VOC emissions. In contrast, trees from other biomes collectively contribute only 10 % of the total BVOC emissions. Another study (Messina et al., 2016) estimated that terpenoid emissions, especially MTs and sesquiterpenes (SQTs) from boreal forests in the northern regions, are higher than calculated using the MEGAN model.
The boreal zone is one of the most active zones for new particle formation, and the northern boreal region has been extensively studied for aerosol formation (e.g. Tunved et al., 2006; Kulmala et al., 2013; Ehn et al., 2014; Kerminen et al., 2018; Barreira et al., 2021). There is substantial evidence to prove that terpenoids are one of the main precursors for aerosol formation in several sites (Tunved et al., 2006; Barreira et al., 2021). Terpenoids such as MTs and SQTs are highly reactive and once emitted into the atmosphere will undergo oxidation via reactions with oxidants such as the hydroxyl radical (OH), the nitrate radical (NO3), or ozone (O3) to form low volatile oxidised products that participate in atmospheric particle formation (Paasonen et al., 2013; Ehn et al., 2014; Jokinen et al., 2015; Bianchi et al., 2019). Several studies conducted in the boreal forest in Finland (Hyytiälä) have observed monoterpenes such as α-pinene undergoing ozonolysis or OH-initiated reactions, resulting in the formation of highly oxygenated molecules that may lead to the formation of SOAs (Ehn et al., 2012; Bianchi et al., 2017). Since α-pinene is one of the most prominent BVOCs to be emitted globally, it is also used as a proxy to predict various atmospheric processes (Guenther et al., 2012; Holopainen et al., 2017).
However, BVOC emissions from plants can be complex, especially when exposed to stress like heat and drought. The emission blend and quantity can vary depending on the plant species, organ of the plant, location, and other environmental factors. With the help of recent advances in BVOC measurement techniques, high emissions of SQTs and low volatile oxygenated compound emissions have been detected from trees (Hellén et al., 2021; Hakola et al., 2023). Some of the emitted SQTs like β-caryophyllene have been reported to have prominent effects such as higher SOA mass yields and a larger impact on ozone chemistry (Faiola et al., 2018; Hellén et al., 2018; Ylisirniö et al., 2020; Barreira et al., 2021). Consequently, the volatile bouquet of plant emissions contains a complex mixture of organics – many of which can act as precursors to SOAs.
Despite more than 1700 BVOCs being identified over the past few decades, total OH reactivity studies conducted across various sites have shown that there still lies a major fraction of OH reactivity (Dudareva et al., 2013; Yang et al., 2016) that cannot be identified with known BVOCs. Praplan et al. (2020) found unexplained OH reactivity to be as high as 96 % from emissions of birch tree and up to 82 % for pine and spruce emissions. The unexplained fraction was high, especially when stress-induced compounds such as green leaf volatiles (GLVs) were emitted more from the trees. Nölscher et al. (2013) showed that 15% to 84% of total OH reactivity from Norway spruce emissions could not be explained. However, another OH reactivity study observed that the total OH reactivity could be explained from the detected isoprene, monoterpene, and sesquiterpene emissions (Kim et al., 2011). OH-initiated oxidation of BVOCs could contribute to SOA formation; therefore, characterising the missing fraction could modify the generalised properties of the ambient air and lead to better understanding of the atmosphere. While the OH radical is a very reactive molecule, it also reacts with most identified BVOCs quite instantly, making the study quite demanding.
Ozone is another important oxidant that is present in the atmosphere which is prominent even in the night, unlike OH. But ozone is selectively reactive; i.e. it reacts with molecules containing a C–C double bond. Total ozone reactivity studies can help narrow down the reactive compounds that might be emitted from plants. Comparing the directly measured total ozone reactivity (or total ozone loss rate) in the BVOC sample (emissions or ambient) with reactivity derived from known chemical composition of the same BVOC sample will help identify the knowledge gaps in the BVOC compositions. Moreover, ozone reaction with BVOCs has been identified as a source of aerosols (Kulmala et al., 2004; Kammer et al., 2018; Rose et al., 2018). Similar to total OH reactivity, total ozone reactivity can be an important parameter to identify the contribution of BVOCs to atmospheric chemistry and a tool to assess the exhaustiveness of BVOC measurements.
In this study, the total ozone reactivity monitor (TORM) built at the Finnish Meteorological Institute based on the work by Helmig et al. (2022) was deployed in the field. Simultaneous BVOC and total ozone reactivity measurements were conducted from Norway spruce emissions from August to September 2021. Norway spruce is one of Finland's most common tree species, and their emission characteristics have been studied plenty (Bourtsoukidis et al., 2014a; Hakola et al., 2017, 2023). Hakola et al. (2017) have also described that SQT emissions from spruce greatly impact ozone chemistry. Using TORM coupled with emission measurements, the effect of BVOCs from Norway spruce on ozone chemistry can be verified.
The study was conducted at the SMEAR II (Station for Measuring Forest Ecosystem–Atmosphere Relationships II) research station, a boreal forest site, in Hyytiälä, southern Finland (61∘51′ N, 24∘17′ E; 181 m a.s.l.; Hari and Kulmala (2005)). It is a flagship station maintained by the University of Helsinki, where continuous and comprehensive measurements are conducted to study the biosphere–atmosphere interaction. The forest stand is dominated mainly by Scots pine (Pinus sylvestris), but other species such as Norway spruce (Picea abies) and birches are found in the minority.
The instruments to measure BVOCs and total ozone reactivity were placed in a container owned by the Finnish Meteorological Institute, which is located about 128 m south of the SMEAR II mast. The Norway spruce tree used in this study is ca. 50 years old and located 5 m from the container.
2.1 Description of branch scale BVOC measurements
The sampling technique and materials used for BVOC emission measurements followed the method described in Hakola et al. (2017). The branch to be measured was placed in a 6 L branch enclosure covered with a transparent fluorinated ethylene propylene (FEP) film. The film was attached to the branch on one end and to a Teflon frame consisting of ports for zero-air inlet, sample-air inlet, and temperature–humidity sensors. Air devoid of any VOC supplied by a zero-air generator (HPZA-7000, Parker Balston, Lancaster, NY, USA) was directed to the enclosure at approximately 4 L min−1. The relative humidity (RH) and the temperature in the enclosure were recorded with a USB data logger (EL-USB-2 Data Logger, Lascar Electronics, Salisbury, United Kingdom). From 23 August, leaf level sensors were used to measure temperature and RH. A leaf-and-air-temperature conifer type sensor (LAT-C; Ecomatik GmbH, Dachau, Germany) recorded the temperature inside the enclosure as well as the difference between the needle surface temperature and the air temperature in the enclosure; two HygroVUE5 temperature and relative humidity sensors (Campbell Scientific, Inc., Logan UT, USA) were monitoring these parameters both inside and outside the enclosure. These sensors output absolute leaf temperature and can help to improve the precision of the data that are to be measured. A quantum sensor SQ-110 SS (Apogee Instruments, Inc., Logan UT, USA) measured the incoming photosynthetically active radiation (PAR) above the enclosure. After 23 August, the PAR measurements were low throughout as the new sensor (SQ-110 SS Apogee PAR quantum sensor solar calibrated) was placed in a position where it was shaded by a scaffolding in front. All data reported in this study are given in the time zone of UTC+2, which corresponds to Finnish wintertime.
2.2 Total ozone reactivity
Total ozone reactivity () is the inverse of the ozone loss rate in the presence of gases (here, BVOCs) in a sample air. The total ozone reactivity can be theoretically calculated as the product of the sum of the concentration of individually measured compounds [Ai] and their respective reaction rate coefficient () with O3:
By comparing the theoretically calculated reactivity with measured reactivity, we can assess whether all BVOCs from emissions have been characterised and quantified by the gas chromatograph coupled with mass spectrometer (GC–MS).
2.2.1 Total ozone reactivity monitor (TORM)
The total ozone reactivity monitor (TORM) is the instrument devised to experimentally determine total ozone reactivity. The measurement principle of TORM and the instrument is described in Helmig et al. (2022). The principle of TORM is that the sample air is enriched with ozone and directed to a reaction chamber where the mixture is allowed to react for a known amount of time. The difference in ozone before and after the reaction is used to calculate total ozone reactivity using the following formula:
where [O3]o is ozone concentration before reaction and [O3]t is ozone concentration after reaction with BVOCs at residence time Δt in the reactor (120 s). The differential signal, [O3], is directly measured by a modified ozone analyser (see below). Using this equation, R cannot be calculated at all situations. This equation becomes invalid in the presence of a fast-reacting compound where ozone decays exponentially and breaks the assumption of pseudo-first-order reaction upon which this equation was derived (Helmig et al., 2022).
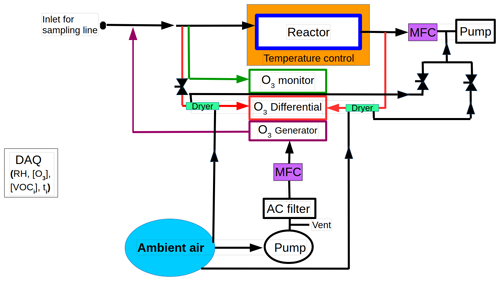
The schematic of TORM used in this study is illustrated in Fig. 1. In brief, TORM consists of three main parts (i) reactor, (ii) ozone analyser (differential analyser) and generator, and (iii) second ozone analyser (monitor). The sample air enriched with ozone is directed to the 6 L reaction chamber made of three glass flasks (2 L each) connected in series. A 100 ppb of ozone produced by the ozone generator (Model 49i, Thermo Scientific in Waltham, MA, USA), which is constantly monitored by the ozone monitor, is mixed with sample air containing BVOCs. With the help of a Python program, the ozone concentration was maintained at 100 ppb by automatically adjusting the UV lamp level when the ozone concentration changed beyond ±2 ppb. Another ozone monitor (Model 49i, Thermo Scientific in Waltham, MA, USA) termed differential analyser measures the difference in ozone concentration before and after the O3–BVOC reaction in the reactor directly. The differential analyser is a modified configuration of the standard ozone analyser. In the standard configuration, the ozone monitor measures by finding the difference in ozone concentration between the sample line (ozone-containing air) and the reference line (a line containing a scrubber to make ozone-free air). In the differential configuration, the scrubber in the reference line is removed to convert it into a normal sampling line. By connecting one of the lines before the reactor and the other line after, the resulting output from this differential analyser is the ozone lost in the reactor.
The loss of ozone on the reactor wall was considered by bypassing the branch chamber and connecting the TORM sampling line to zero air. If the differential signal due to the ozone loss on the reactor wall is Δ[O3]zero, then the corrected differential signal is
The overall uncertainty associated with TORM can be evaluated by considering various factors. These include the uncertainty in determining the residence time (estimated at 10 % based on Helmig et al., 2022), the uncertainty of the ozone monitors (1 %), and the variability of background measurements (9 %), resulting in a combined uncertainty of approximately 20 % in this study. The detection limit (2σ) of TORM was s−1.
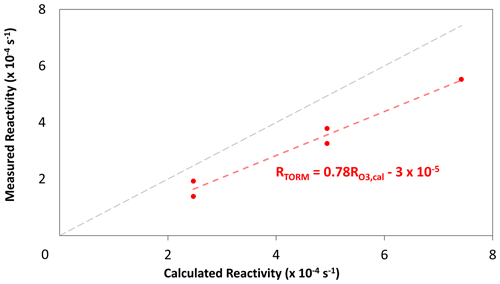
TORM utilises glass flasks as the reaction chamber unlike the flow tube reactor in Sommariva et al. (2020). The continuous injection of ozone into the reactor (flasks) counteracts the ozone decay resulting from BVOCs, which leads to an underestimation of reactivity. To address this issue, TORM needs to be calibrated with measured reactivity using a standard. TORM was calibrated twice using a standard mixture (National Physical Laboratory, UK). The mixture contained 200 ppb of α-pinene, 3-carene, limonene, and 1,8-cineole each. Calibration was performed at the end of the campaign on two different days. Figure B1 shows the calibration lines and that TORM underestimated reactivity at three different concentrations.
The reactivity inside the reactor of TORM (RTORM) is then derived according to the following equation:
where 0.78 and are coefficients of the linear regression between measured total ozone reactivity in the reactor and calculated reactivity during TORM calibration (Appendix B1). Also, due to the mixing of sample air with ozone before reaching the reactor, the total ozone reactivity measured in the reactor is less compared to total ozone reactivity measured in the sample, which requires correcting using the dilution factor D:
where fsample and are flow rates of sample air and from ozone generator, respectively. In this study, the total ozone reactivity is normalised based on the total air flow through the enclosure (f) and the dry mass of the needles present inside the enclosure (mdw). The resultant normalised total ozone reactivity of emissions will be referred to as TOZRE. The formula used for this normalisation is as follows and is expressed in units of m3 s−2 g−1:
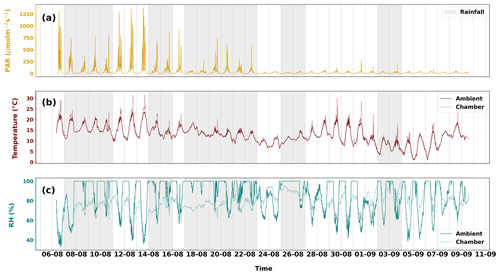
Figure 2The different environmental parameters ((a) PAR, (b) temperature and (c) relative humidity) that were observed from 6 August to 10 September 2021. In panels (b) and (c), the solid lines are ambient observations downloaded from FMI open weather data (https://en.ilmatieteenlaitos.fi/download-observations, last access: 15 October 2023). The dashed lines are measurements from the sampling enclosure. Grey shaded areas show periods of rainfall. Only days having more than 3 h of rainfall have been shaded.
2.3 In situ emission measurements
In order to calculate the theoretical reactivity, it is necessary to quantify and identify the chemical composition of BVOCs emitted from the tree. This was made possible with the help of a gas chromatograph coupled with mass spectrometer (GC–MS), which was described previously in Hellén et al. (2018); Helin et al. (2020). The compounds were collected at 40 mL min−1 for 30 min in the cold trap (Carbopack B/Tenax TA) of the thermal desorption unit (TurboMatrix, 350, PerkinElmer) connected to the GC (Clarus 680, PerkinElmer) coupled with the MS (Clarus SQ 8 T, PerkinElmer). A DB-5MS column (60 m, i.d. 0.25 mm, film thickness 0.25 µm) was used for separation. The instrument was calibrated for 2-methyl-3-butenol (MBO), mono- and sesquiterpenes using liquid standards in methanol solutions. Isoprene was calibrated using a gaseous standard (National Physical Laboratory, 32 VOC mix at 4 ppbv level). α-Farnesene was tentatively identified based on the mass spectra and the retention indices in the NIST library (NIST/EPA/NIH Mass Spectral Library, version 2.0). α-Farnesene and the unknown sesquiterpene were quantified based on the response of β-caryophyllene, while bornyl acetate was quantified as nopinone. The detection limits for terpenoids range from 0.02 to 0.41 ng g−1 h−1, with measurement uncertainties falling within the 18 %–25 % range (Helin et al., 2020). As for methacrolein, MBO, and cis-3-hexenol, their detection limits are 0.04, 0.35, and 0.48 ng g−1 h−1, respectively (Hellén et al., 2018). Compounds lacking authentic standards exhibited higher levels of uncertainty compared to the others. The emission rate of BVOCs is calculated based on Hakola et al. (2001).
The calculated ozone reactivity can be ascertained by considering the chemical composition of emissions detected through GC–MS, as outlined by Eq. (1). Similar to the process of normalising TOZRE, the calculated reactivity of emissions is also normalised using the flow through the enclosure (f) and the dry mass of the needle (mdw) and termed as COZRE ().
3.1 Ambient and chamber environment
The weather during the measurement period varied from cold and humid to pleasantly warm conditions. Ambient mean night-time temperature was 4 ∘C cooler than mean daytime (14.3 ∘C) temperature. Ambient temperatures above 20 ∘C were seen mostly until 13 August, with the period maximum reaching on 13 August. Chamber temperatures above 25 ∘C were seen on 6, 11, 12, 13, 29, and 31 August. High temperatures in the enclosure may have been recorded when prolonged sunlight heated the enclosure, as the effect can be seen before 24 August in Fig. 2. Only 5 % of the chamber temperature data deviate from ambient temperature beyond 2 ∘C. The maximum temperature difference between both is 11.3 ∘C. These were days when skies were clear or partly cloudy. Mild but frequent precipitation and overcast conditions were also seen during the measurement period. Rainfall was observed between 7 and 11 August and almost every day from 14 to 26 August, while sunny weather and high temperatures were seen from 11 to 13 August and from 29 August to 1 September, during which temperature spikes up to 30 ∘C were measured in the chamber. The maximum temperature recorded in the chamber was 31.8 ∘C (Table 1).
3.2 Overview of Norway spruce emissions
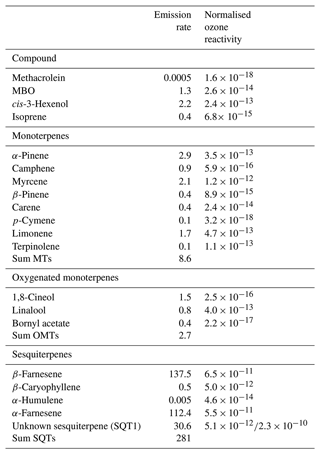
Different compounds observed during the measurement period and their respective mean emission rates are shown in Table A1. Highest emissions were observed from SQTs (Fig. 2) with 281 ng g−1 h−1 as the period average, followed by MTs. The MT emissions observed in our study are less than those observed in the study by Hakola et al. (2017) during late summer. In our study, β-farnesene contributed the highest (137.5 ng g−1 h−1), while comparable emissions of α-farnesene (112.4 ng g−1 h−1) were also measured. Minor contributions from certain ozone-reactive compounds like β-caryophyllene, α-humulene, and terpinolene were observed during emission spikes on 7 and 13 August. The emission pattern observed in this study with high SQTs and lower MTs is in agreement with that observed in Hakola et al. (2017). In that study, the mean emission of β-farnesene is around 3 times lower than observed here.
A total of 20 compounds were detected, out of which only 7 compounds (4 MTs, 2 SQTs and 1 MBO) were detected to be emitted from the tree everyday. At the start of the measurement period, MT emissions were at their highest, close to 250 ng g−1 h−1, with α-pinene and myrcene being the biggest contributors (Fig. 3). However, MT emissions decreased gradually with an increase seen only on 13 August, when the temperature reached the maximum. Emissions of MTs were low after 16 August (maximum: 7 ng g−1 h−1) but with clear diel patterns. This similar trend was observed from oxygenated monoterpenes (OMTs) too. Different behaviour was observed from SQTs as their emissions were high during the start and end of the campaign. The magnitude of the one unidentified sesquiterpene (SQT1) was similar to α-farnesene at the beginning. But after 9 August emissions of SQT1 were hardly observed, while there were clear emissions of α-farnesene. The emissions of α-farnesene increased by 2–3 times from 27 August and remained relatively high until the end. We began to observe emissions of SQT1 again starting from 27 August which peaked on 31 August after which it gradually decreased, unlike α-farnesene. The emissions of α-farnesene correlated positively with β-farnesene (r=0.85) and cis-3-hexenol (r=0.57). The three highly emitted SQTs correlated weakly with temperature and PAR (r<0.3), and cis-3-hexenol correlated with chamber parameters poorly (r<0). The low correlation also suggests that these compounds may have been emitted as a form of stress. Emissions of α-farnesene and β-farnesene from Norway spruce have been reported to be induced as a response to insect infestation (Blande et al., 2009; Kännaste et al., 2009; Kleist et al., 2012). High emissions of these two compounds are a typical reaction of spruce trees to biotic stress. Although potential signals of biotic stress have been noted, there is no evidence to confirm signs of insect infestation. Emissions of the SQT1 could also be a result of some stress that we could not discern in this study.
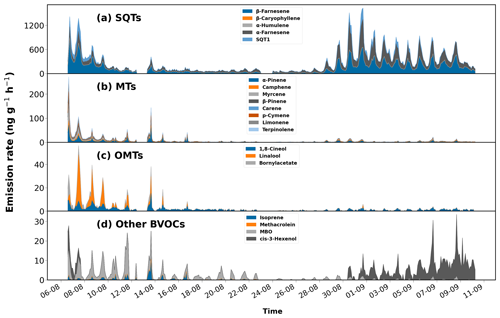
Figure 3Time series of emissions of (a) sesquiterpenes (SQTs), (b) monoterpenes (MTs), (c) oxygenated monoterpenes (OMTs), and (d) different BVOCs observed from Norway spruce.
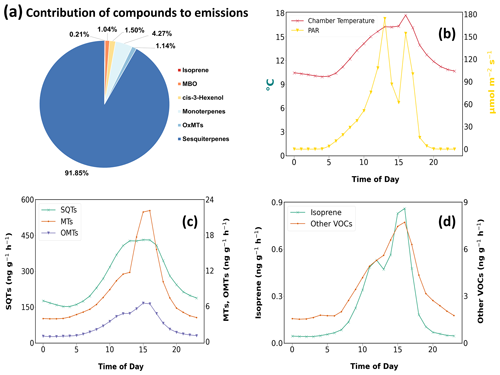
Figure 4(a) Contribution of observed BVOC to Norway spruce emissions. Mean diel variation in emission rates of (b) chamber temperature and PAR, (c) MTs, OMTs, and SQTs, and (d) isoprene and the sum of the rest of BVOCs.
All compounds besides methacrolein and α-humulene showed a clear diel pattern forming a peak post noon. As both those compounds were detected only a couple of times during the whole period, no diel pattern exists for them. The diel variation of emissions showed all groups of compounds besides SQTs to gradually increase over the day and shoot up after 13:00 LT (Fig. 4). This increase coincides with the high PAR observed at 13:00 LT. However, it is essential to acknowledge that this conclusion cannot be made with absolute confidence, as the PAR measurements during the second half of the campaign may have been underestimated for a couple of hours during the day. SQT emissions that were dominated by β-farnesene and α-farnesene gradually started to increase from 06:00 LT. The SQT emissions remained high and steady from 12:00 to 16:00 LT.
3.3 Total ozone reactivity
High TOZREs from Norway spruce emissions were seen, with a few peaks during the start and another set of peaks towards the end of August. TOZRE was split into (1) high-reactivity (7–8 August; 12–13 August; 29 August–2 September) and (2) low-reactivity (9–11 August; 14–28 August; 3–10 September) periods based on the daily average. The highest TOZRE was seen on 31 August with a value of m3 s−2 g−1 (Fig. 5a). This maximum value corresponds to 65 µg g−1 h−1 (365 ppb in the enclosure) of α-pinene or 0.8 µg g−1 h−1 (3 ppb in the enclosure) of β-caryophyllene. These concentration levels are typically not observed in the atmosphere. These compounds once emitted into the atmosphere react almost instantly with atmospheric oxidants, and therefore such high concentrations will not be present in the ambient environment. However, high emissions of compounds can be seen in branch enclosure studies (Hakola et al., 2023, 2017; Bourtsoukidis et al., 2012).
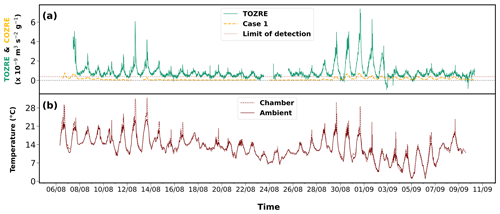
Figure 5Observation of (a) TOZRE (green), case 1 (dashed orange line) of COZRE determined using slower reaction rate. The limit of detection of TORM is also indicated on the graph. (b) Chamber (dashed red) and ambient (solid red) temperatures observed during the measurement period.

Figure 6Observation of (a) TOZRE (green) corrected in the presence of a fast-reacting compound and case 2 (dashed violet line) of COZRE determined using a faster reaction rate. The limit of detection of TORM is also indicated on the graph. (b) Diel plot of TOZRE, TOZRE (corrected), case 1, and case 2.
To compare TOZRE with COZRE, two different cases of COZREs were considered. In each case, the unknown sesquiterpene (SQT1) was assigned a different reaction rate with ozone before determining the COZREs. In case 1, the reaction rate of cedrene, which is on the lower end of the known sesquiterpene reaction rates, was assigned ( cm3 s−1), while in case 2 a faster reaction rate with ozone was used ( cm3 s−1), which is equivalent to the reaction rate of β-caryophyllene (Table 2). A reaction rate faster than this would lead to COZRE surpassing TOZRE, which is not possible. The two reaction rates will explain how COZRE values compare with TOZRE. After comparing the TORM signal with the two cases, any unexplained signal confirms the presence of unmeasured compounds.
Table 2O3 reaction rate coefficients used in reactivity calculations. Reaction rate coefficients are taken from IUPAC Task Group on Atmospheric Chemical Kinetic Data Evaluation (http://iupac.pole-ether.fr, last access: 27 January 2022) (Atkinson et al., 2004, 1990; Calvert et al., 2015; Matsumoto, 2016).
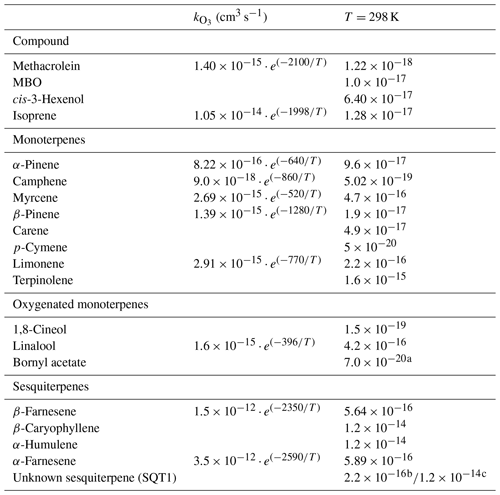
a Reaction rate of camphor (similar structure). b Reaction rate of α-cedrene. c Reaction rate equivalent to a fast-reacting compound like β-caryophyllene.
TOZRE obtained from the differential ozone signal (Eq. 2) assumes linear ozone decay (Helmig et al., 2022). However, the linear relationship becomes invalid as ozone decays exponentially in the presence of a fast-reacting compound when concentrations are above the limit of detection of TORM, as mentioned in Sect. 2.2.1. This leads to an underestimation of TOZRE measured by TORM. Therefore in order to compare TOZRE with case 2 of COZRE (as SQT1 is a fast-reacting compound in case 2), a correction factor obtained in Appendix B2 was applied to TOZRE when concentration of SQT1 increased beyond 0.2 ppb to obtain the true TOZRE in the presence of a fast-reacting compound (Fig. 6).
TOZRE measured by TORM follows the pattern of the COZRE (r=0.50 for case 1 and r=0.52 for case 2) for both cases especially during the later stage of the campaign. From 14 to 28 August, emissions detected from spruce were close to the detection limit of the GC–MS. The TOZRE was also close to the detection limit of TORM during this period of 14 d (Fig. 2). The period experienced either rainfall or heavily overcast conditions. This long and low-reactivity period was immediately followed by high total ozone reactivity for 5 d. Without the low-reactivity period between 14 and 28 August, the correlation between COZRE AND TOZRE increased to 0.62 for case 2. Sudden bursts of TOZRE like that seen on 31 August followed the temperature spikes observed in the chamber. The sudden increase in temperature may have caused emissions of highly reactive compounds that TORM detected. In Fig. 6, it can be seen that TOZRE and case 2 of COZRE match after 3 September 2021. This would mean that our assumption for SQT1 to be a fast-reacting compound is possible and that at least half of the TOZRE was driven by SQT1 especially during the last few days of the campaign.
The diel pattern of TOZRE increased gradually until 12:00 LT in the afternoon followed by a sudden peak at 16:00 LT (Fig. 6b). This coincides with the peak in temperature observed at the same time (Fig. 4b). At 16:00 LT, all observed BVOC classes except SQTs showed a spike in their emission pattern. However, since both cases of COZREs were driven by SQT emissions, there was no unusual spike seen in the COZREs. Instead, in both cases, the reactivity gradually increased throughout the day and reached the maximum at 16:00 LT. Hence, other reactive compounds were emitted during this hour which were missed out by the GC–MS.
3.4 Missing reactivity
The detection of the unknown sesquiterpene in the emissions causes ambiguity for COZRE. During the whole campaign, the missing fraction varied from 65 %–86 % based on the case and period of reactivity (Fig. 7). Between the high and low periods, the missing fraction did not differ by more than 12 %, indicating the presence of undetected compounds during both the periods.
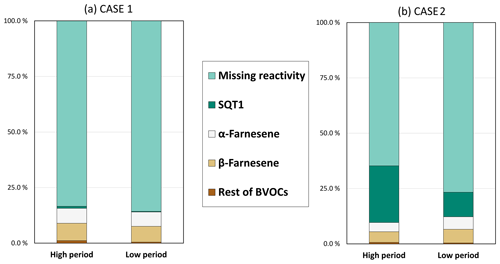
Figure 7Fraction of various contributions of observed BVOCs and missing fraction to the TOZRE for two different cases. (a) Case 1 was calculated after applying the slower reaction rate to the unknown sesquiterpene (SQT1). (b) Case 2 was calculated after applying the faster reaction rate to the unknown sesquiterpene (SQT1).
COZRE could not explain the observed TOZRE well during the low-reactivity period. During this period, the correlation for the two cases with the total ozone reactivity was less than <0.37. Between 14 and 28 August (low-reactivity period), the use of either reaction rates did not change the COZRE as the emissions of SQT1 were either very low or absent. However, the low-reactivity period in September (3–10 September) could be explained partly (∼64 %) by COZRE when the faster reaction rate was applied (case 2). At least half of the reactivity was driven by SQTs alone during this low-reactivity period in case 2. It should be noted that both COZRE and TOZRE values during the low-reactivity period are close to or below the detection limit of the instrument, and therefore the missing fraction may not be high during the low-reactivity period as observed.
During the high-reactivity period, SQTs were the primary contributors to the known fraction of TOZRE, accounting for 16 % in case 1 and 35 % in case 2. Among the SQTs, the highest contributions were observed from β-farnesene (8 %) in case 1 and an unknown sesquiterpene (26 %) in case 2. However, it is important to note that the missing fraction of reactivity was as high as 95 % on 29 August, with a mean of 84 % and 65 % in case 1 and case 2 respectively during the high-reactivity period. These findings highlight the need for further research to identify the unknown compounds responsible for the missing fraction. High fractions of missing OH reactivity have been observed from other studies too, especially during higher temperature or drought periods (Nölscher et al., 2013; Praplan et al., 2020). In our study too, the possibility for the existence of undetected compounds that could contribute to TOZRE cannot be neglected. GLVs and homoterpenes are compounds with C–C double bonds that can react with ozone. Several studies have highlighted the importance of ozone–GLV reactions (Hamilton et al., 2009; Jain et al., 2014; Barbosa et al., 2017). GLVs are compounds that are released following tissue damage in plants. Besides damage from insects, high temperatures have also found to damage membranes of needles. Kleist et al. (2012) found increase in BVOC emissions when Norway spruce was subjected to high temperatures, which was 35 ∘C. The authors mentioned a thermal threshold that exists beyond which the membrane gets damaged. Pikkarainen et al. (2022) reported that over two growing seasons, the mean emission rate of GLVs from Norway spruce seedlings increased by 350 % when the temperature was +4 ∘C greater than ambient. Most GLVs have reaction rates with O3 of the order of 10−17–10−16 cm3 s−1, and if emitted considerably, these GLVs can contribute to reactivity. Homoterpenes such as (E)-4,8-dimethyl-1,3,7-nonatriene and (E,E)-4,8,12-trimethyltrideca-1,3,7,11-tetraene are commonly emitted stress BVOCs that are known to be readily oxidised by ozone (Pinto et al., 2007; Blande et al., 2010). However, although both GLVs and homoterpenes can contribute to TOZRE, their emissions were below the detection limits of the GC–MS used in this study. Therefore, it is unlikely that these compounds were solely responsible for the missing reactivity observed during the high-reactivity period. It is possible that the missing reactivity was caused by entirely unknown compounds or a large number of compounds including GLVs and homoterpenes, emitted in very low quantities. Future studies could aim to identify these unknown compounds and also use alternate sampling methods and analytical tools to investigate the potential contribution to TOZRE.
3.5 Temperature dependence of total ozone reactivity
The temperature dependence of TOZRE was also studied. In reference to the temperature dependence of MT emission from Guenther et al. (1993), a regression line fitted to an exponential curve was calculated for the TOZRE data.
where TOZRE(Ts) is the TOZRE at standard temperature (Ts=303.15 K), β is the temperature sensitivity of TOZRE, and T is the temperature of the needle surface.
The correlation coefficient for the fit is slightly higher during the low-reactivity period (R2=0.48), suggesting that temperature was the primary driver of TOZRE during this time. Reactivity increased gradually with temperature, with most of the TOZRE measured between 280 and 290 K (Fig. 8). During the high-reactivity period, the calculated R2 value of 0.36 suggests that factors other than temperature were also driving TOZRE. This indicates that other stress factors may have contributed to the increase in TOZRE during this period. Unlike during the low-reactivity period, the data did not follow an exponential curve, and high TOZRE was also observed at lower temperatures. Exposure to high temperatures may have caused tissue damage (Kleist et al., 2012) and subsequent prolonged emissions of highly reactive compounds, leading to the observed increase in TOZRE even at lower temperatures.
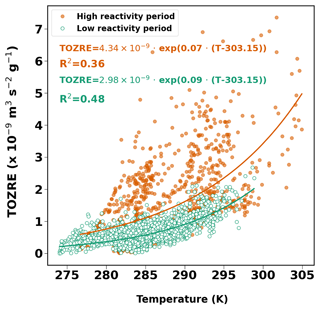
Figure 8TOZRE as a function of temperature for high-reactivity period (orange dots) and low-reactivity period (green dots). Red and green lines indicate the exponential fit for the high- and low-reactivity periods respectively.
The β depends on the variation of the composition and quantities of ozone-reactive BVOCs in association with temperature. β values from this study are 0.07 and 0.09 K−1 for high- and low-reactivity period respectively. The lower β for the high-reactivity period combined with a lower R2 could be an indication of stress-related non-terpene emissions. The β values for BVOC emissions from Norway spruce studies ranged from 0.008 to 0.3 depending on the compound (Hakola et al., 2017; Filella et al., 2007; Bourtsoukidis et al., 2014a, b). The β values obtained here are closer to the β of MTs (0.1 K−1) as recommended by Guenther et al. (2012). SQTs, owing to their higher vapour pressures, have been found to have a stronger temperature dependence and therefore higher β values. However, in a review by Duhl et al. (2008), a β as low as 0.05 K−1 is mentioned. Hakola et al. (2017) reported β values that ranged from 0.02–0.06 K−1 for SQT emissions from Norway spruce in late summer. The β values observed in our study do fall within the range observed from other studies. In our study, the β value during one low-reactivity period (17–27 August) was the highest at 0.13 K−1, which lies in between the values of MTs (0.1 K−1) and SQTs (0.17 K−1) given in Guenther et al. (2012). Emissions measured during this time were dominated by α-farnesene and β-farnesene. However, COZRE during that period does not entirely account for the observed TOZRE, which may suggest the presence of additional compounds.
This study presents the total ozone reactivity measurements conducted on a Norway spruce tree branch in Hyytiälä. Total ozone reactivity of emissions (TOZRE) was measured directly by the total ozone reactivity monitor (TORM) developed in the Finnish Meteorological Institute based on the work by Helmig et al. (2022). These measurements were compared to the calculated ozone reactivities of emissions (COZREs) using direct measurements of BVOC emissions from the Norway spruce by the GC–MS.
BVOC emissions from Norway spruce were dominated by the SQTs, namely β-farnesene and α-farnesene. Emissions of α-farnesene and also cis-3-hexenol increased by up to 3 times after the overcast conditions (14–28 August). Other studies have also observed similar dominance by SQTs from Norway spruce emissions during late summer which were related to stress. An unidentified sesquiterpene was found to be emitted in similar quantities to α-farnesene but did not increase as much during the later stage of the campaign. These SQTs correlated poorly with the temperature and PAR, and since there were no visible signs of stress, this characteristic emission pattern could be a systemic defence response taken by the tree as suspected in Hakola et al. (2017).
TORM measured a maximum TOZRE value that is equivalent to 65 µg g−1 h−1 of α-pinene or 0.8 µg g−1 h−1 of β-caryophyllene emissions from the measured branch of Norway spruce tree. While high emissions of these compounds can be seen in branch enclosure studies, their concentrations in the atmosphere will be low as they react rapidly with other trace gases in the atmosphere. The SQTs accounted for 14 %–35.1 % of the TOZRE in the low-reactivity period in case 1 and the high-reactivity period in case 2. While we have quantified and observed SQTs from a branch of a spruce tree to significantly influence ozone chemistry, a large chunk of TOZRE remains to be explained even during the high-reactivity period (65 %).
High fraction of missing reactivity was observed when the branch was exposed to heat stress. Spikes in temperature inside the chamber may have induced emissions of reactive compounds undetected by the GC–MS. TOZRE had a temperature dependence when comparing it to the pool emission (temperature dependent) algorithm of vegetation, and high TOZRE was observed even at lower temperatures. This suggests that stress-related compounds observed during the high-reactivity period may have had prolonged emissions due to possible tissue damage caused by high temperatures, and the lower β value also suggests the presence of non-terpenoid compounds induced by stress. As for the diel variation in the TOZRE, a sudden spike at 16:00 LT coincides with the peak in temperature. The absence of a spike in the COZREs at this hour indicates again the presence of undetected reactive compounds. Observation across different seasons and different trees must be conducted in the future to verify the findings and to provide more insight into stress-related ozone reactivity.
Our study has been able to emphasise the presence of undetected BVOCs from the branch of a Norway spruce that were mostly emitted in times of stress. This also puts an emphasis on the need to expand our search for other classes of compounds than the ones that are often measured. Stress episodes in the form of both biotic and abiotic have become increasingly common, especially in the Arctic, and these events will cause the release of a vast range of BVOCs not known earlier.
B1 Calibration of TORM
Total ozone reactivity measured by TORM (RTORM) is underestimated from the expected or calculated reactivity (), which can be seen from Fig. B1. This underestimation should not be confused with the underestimation occurring due to the presence of a fast-reacting compound, which is dependent on the sample air. This underestimation arises due to the instrumental design due to the continuous introduction of ozone into the reactor, thereby interfering in the interaction between BVOCs and decaying ozone. This causes the differential term in the numerator of Eq. (2) to be undervalued in the absence of ozone addition. This effect, in turn, leads to the underestimation of total ozone reactivity measured by TORM. This issue can be solved by the calibration of TORM using a known standard. Figure B1 shows the calibration curves.
Equation of calibration is as follows:
B2 Correction of measured reactivity in the presence of fast-reacting compound (required to compare measured reactivity with case 2)
When a fast-reacting compound is present in the sample air, the total ozone reactivity, determined using Eq. (2), tends to be underestimated. This is due to the exponential decay of ozone, which violates the assumption of a pseudo-first-order reaction, upon which this equation was derived (Helmig et al., 2022). In our case 2, SQT1 is assumed to be a fast-reacting compound. To facilitate a comparison between the total ozone reactivity and the calculated reactivity, a correction must be applied to account for the underestimated total ozone reactivity. The correction factor obtained in this section was applied to 33 % of the TORM dataset, specifically when emissions of SQT1 were observed to increase beyond 0.2 ppb.
The reaction between ozone and a fast-reacting compound was modelled using the pykpp chemical box model in the Python programming language. The pykpp (https://github.com/barronh/pykpp/, last access: 14 March 2023) is based on KPP (the Kinetics Pre-Processor; Damian et al., 2002), which generates a box model that can be run in the Python programming language. The model used chemical equations of the form to describe the chemical degradation of VOCs in the presence of ozone. The reaction rates for the reaction between different VOCs and ozone are given in Table 2. The model considered 1 ppb of a compound with a fast reaction rate ( cm3 s−1) and 100 ppb of ozone at 298 K and 1 atm. The ozone decay under these conditions is shown in Fig. B2.
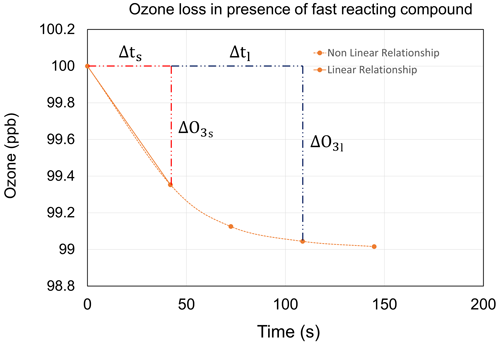
Figure B2Ozone loss modelled using pykpp in the presence of 1 ppb of a fast-reacting compound and 100 ppb of ozone.
The total ozone reactivity calculated using Eq. (2) will not be the same between any two points in time in Fig. B2 due to the exponential decay of ozone in the presence of a fast-reacting compound. However, ozone decay is linear for a short time interval (Δts), and this is the true total ozone reactivity in the presence of a fast-reacting compound. The residence time in TORM is considered to be 108 s and by which the total ozone reactivity will be underestimated in these conditions. The correction factor to calculate the true total ozone reactivity can be obtained considering Δts=41.9 s, Δ[O3]s=0.65 ppb, Δtl=108.7 s, Δ[O3]l=0.96 ppb, and [O3]o=100 ppb.
Let reactivity calculated for the short time (Δts) be
And let the reactivity calculated for the longer time (Δtl) be
Then the correction factor for total ozone reactivity for a fast-reacting compound is
The data are available from https://doi.org/10.23728/b2share.061ebbcf764544b59ce834c316f0 (Thomas, 2023). The raw data measured by TORM, GC–MS, and other sensors will be made available upon request. The ambient data were taken from the FMI open weather data (https://en.ilmatieteenlaitos.fi/download-observations, FMI, 2023).
SJT conducted the ozone reactivity measurements, performed the data analysis, and led the writing of the manuscript. TT and HH conducted the GC–MS measurements, analysed the data produced by the GC–MS, and commented on the manuscript. APP was the principal investigator, designed the measurement campaign, assisted in the data analysis of ozone reactivity measurements, and commented on the manuscript. FB contributed to the discussions of the results and provided input for the manuscript.
The contact author has declared that none of the authors has any competing interests.
Publisher's note: Copernicus Publications remains neutral with regard to jurisdictional claims made in the text, published maps, institutional affiliations, or any other geographical representation in this paper. While Copernicus Publications makes every effort to include appropriate place names, the final responsibility lies with the authors.
We thank SMEAR II station and their staff for providing infrastructure and support during the campaign.
This research has been supported by the Academy of Finland (grant nos. 307797 and 335319) and the H2020 European Research Council (ERC; CHAPAs no. 850614).
Open-access funding was provided by the Helsinki University Library.
This paper was edited by Tao Wang and reviewed by two anonymous referees.
Atkinson, R., Hasegawa, D., and Aschmann, S. M.: Rate constants for the gas-phase reactions of O3 with a series of monoterpenes and related compounds at 296±2 K, Int. J. Chem. Kinet., 22, 871–887, https://doi.org/10.1002/kin.550220807, 1990. a
Atkinson, R., Arey, J., Aschmann, S., Corchnoy, S., and Shu, Y.: Rate constants for the gas-phase reactions of cis-3-Hexen-1-ol, cis-3-Hexenylacetate, trans-2-Hexenal, and Linalool with OH and NO3 radicals and O3 at 296±2 K, and OH radical formation yields from the O3 reactions, Int. J. Chem. Kinet., 27, 941–955, https://doi.org/10.1002/kin.550271002, 2004. a
Barbosa, T. S., Riva, M., Chen, Y., da Silva, C. M., Ameida, J. C. S., Zhang, Z., Gold, A., Arbilla, G., Bauerfeldt, G. F., and Surratt, J. D.: Chemical characterization of organosulfates from the hydroxyl radical-initiated oxidation and ozonolysis of cis-3-hexen-1-ol, Atmos. Environ., 162, 141–151, https://doi.org/10.1016/j.atmosenv.2017.04.026, 2017. a
Barreira, L. M. F., Ylisirniö, A., Pullinen, I., Buchholz, A., Li, Z., Lipp, H., Junninen, H., Hõrrak, U., Noe, S. M., Krasnova, A., Krasnov, D., Kask, K., Talts, E., Niinemets, Ü., Ruiz-Jimenez, J., and Schobesberger, S.: The importance of sesquiterpene oxidation products for secondary organic aerosol formation in a springtime hemiboreal forest, Atmos. Chem. Phys., 21, 11781–11800, https://doi.org/10.5194/acp-21-11781-2021, 2021. a, b, c
Bianchi, F., Garmash, O., He, X., Yan, C., Iyer, S., Rosendahl, I., Xu, Z., Rissanen, M. P., Riva, M., Taipale, R., Sarnela, N., Petäjä, T., Worsnop, D. R., Kulmala, M., Ehn, M., and Junninen, H.: The role of highly oxygenated molecules (HOMs) in determining the composition of ambient ions in the boreal forest, Atmos. Chem. Phys., 17, 13819–13831, https://doi.org/10.5194/acp-17-13819-2017, 2017. a
Bianchi, F., Kurtén, T., Riva, M., Mohr, C., Rissanen, M. P., Roldin, P., Berndt, T., Crounse, J. D., Wennberg, P. O., Mentel, T. F., Wildt, J., Junninen, H., Jokinen, T., Kulmala, M., Worsnop, D. R., Thornton, J. A., Donahue, N., Kjaergaard, H. G., and Ehn, M.: Highly Oxygenated Organic Molecules (HOM) from Gas-Phase Autoxidation Involving Peroxy Radicals: A Key Contributor to Atmospheric Aerosol, Chem. Rev., 119, 3472–3509, https://doi.org/10.1021/acs.chemrev.8b00395, 2019. a
Blande, J. D., Turunen, K., and Holopainen, J. K.: Pine weevil feeding on Norway spruce bark has a stronger impact on needle VOC emissions than enhanced ultraviolet-B radiation, Environ. Pollut., 157, 174–180, https://doi.org/10.1016/j.envpol.2008.07.007, 2009. a
Blande, J. D., Holopainen, J. K., and Li, T.: Air pollution impedes plant-to-plant communication by volatiles, Ecol. Lett., 13, 1172–1181, https://doi.org/10.1111/j.1461-0248.2010.01510.x, 2010. a
Bourtsoukidis, E., Bonn, B., Dittmann, A., Hakola, H., Hellén, H., and Jacobi, S.: Ozone stress as a driving force of sesquiterpene emissions: a suggested parameterisation, Biogeosciences, 9, 4337–4352, https://doi.org/10.5194/bg-9-4337-2012, 2012. a
Bourtsoukidis, E., Bonn, B., and Noe, S.: On-line field measurements of BVOC emissions from Norway spruce (Picea abies) at the hemiboreal SMEAR-Estonia site under autumn conditions, Boreal Environ. Res., 19, 153–167, 2014a. a, b
Bourtsoukidis, E., Williams, J., Kesselmeier, J., Jacobi, S., and Bonn, B.: From emissions to ambient mixing ratios: online seasonal field measurements of volatile organic compounds over a Norway spruce-dominated forest in central Germany, Atmos. Chem. Phys., 14, 6495–6510, https://doi.org/10.5194/acp-14-6495-2014, 2014b. a
Calvert, J. G., Orlando, J. J., Stockwell, W. R., and Wallington, T. J.: Mechanisms of Ozone Reactions in the Troposphere, in: The Mechanisms of Reactions Influencing Atmospheric Ozone, Oxford University Press, ISBN 9780190233020, https://doi.org/10.1093/oso/9780190233020.003.0005, 2015. a
Damian, V., Sandu, A., Damian, M., Potra, F., and Carmichael, G. R.: The kinetic preprocessor KPP-a software environment for solving chemical kinetics, Comput. Chem. Eng., 26, 1567–1579, https://doi.org/10.1016/S0098-1354(02)00128-X, 2002. a
Dudareva, N., Klempien, A., Muhlemann, J. K., and Kaplan, I.: Biosynthesis, function and metabolic engineering of plant volatile organic compounds, New Phytol., 198, 16–32, https://doi.org/10.1111/nph.12145, 2013. a
Duhl, T. R., Helmig, D., and Guenther, A.: Sesquiterpene emissions from vegetation: a review, Biogeosciences, 5, 761–777, https://doi.org/10.5194/bg-5-761-2008, 2008. a
Ehn, M., Kleist, E., Junninen, H., Petäjä, T., Lönn, G., Schobesberger, S., Dal Maso, M., Trimborn, A., Kulmala, M., Worsnop, D. R., Wahner, A., Wildt, J., and Mentel, T. F.: Gas phase formation of extremely oxidized pinene reaction products in chamber and ambient air, Atmos. Chem. Phys., 12, 5113–5127, https://doi.org/10.5194/acp-12-5113-2012, 2012. a
Ehn, M., Thornton, J., Kleist, E., Sipila, M., Junninen, H., Pullinen, I., Springer, M., Rubach, F., Tillmann, R., Lee, B., Lopez-Hilfiker, F., Andres, S., Acir, I.-H., Rissanen, M., Jokinen, T., Schobesberger, S., Kangasluoma, J., Kontkanen, J., Nieminen, T., Kurten, T., Nielsen, L., Jorgensen, S., Kjaergaard, H., Canagaratna, M., Dal Maso, M., Berndt, T., Petaja, T., Wahner, A., Kerminen, V.-M., Kulmala, M., Worsnop, D., Wildt, J., and Mentel, T.: A large source of low-volatility secondary organic aerosol, Nature, 506, 476–479, https://doi.org/10.1038/nature13032, 2014. a, b
Faiola, C., Buchholz, A., Kari, E., Yli-Pirilä, P., Holopainen, J., Kivimäenpää, M., Miettinen, P., Worsnop, D., Lehtinen, K., Guenther, A., and Virtanen, A.: Terpene Composition Complexity Controls Secondary Organic Aerosol Yields from Scots Pine Volatile Emissions, Sci. Rep., 8, 3053, https://doi.org/10.1038/s41598-018-21045-1, 2018. a
Filella, I., Wilkinson, M. J., Llusiã, J., Hewitt, C. N., and Peñuelas, J.: Volatile organic compounds emissions in Norway spruce (Picea abies) in response to temperature changes, Physiol. Plant., 130, 58–66, https://doi.org/10.1111/j.1399-3054.2007.00881.x, 2007. a
FMI – Finnish Meteorological Institute: Weather and sea/Download observations, https://en.ilmatieteenlaitos.fi/download-observations, (last access: 15 October 2023), 2023. a
Guenther, A. B., Zimmerman, P. R., Harley, P. C., Monson, R. K., and Fall, R.: Isoprene and monoterpene emission rate variability: Model evaluations and sensitivity analyses, J. Geophys. Res.-Atmos., 98, 12609–12617, https://doi.org/10.1029/93JD00527, 1993. a
Guenther, A. B., Jiang, X., Heald, C. L., Sakulyanontvittaya, T., Duhl, T., Emmons, L. K., and Wang, X.: The Model of Emissions of Gases and Aerosols from Nature version 2.1 (MEGAN2.1): an extended and updated framework for modeling biogenic emissions, Geosci. Model Dev., 5, 1471–1492, https://doi.org/10.5194/gmd-5-1471-2012, 2012. a, b, c, d
Hakola, H., Laurila, T., Lindfors, V., Hellën, H., Hienola (Gaman), A., and Rinne, J.: Variation of the VOC emission rates of birch species during the growing season, Boreal Environ. Res., 6, 237–249, 2001. a
Hakola, H., Tarvainen, V., Praplan, A. P., Jaars, K., Hemmilä, M., Kulmala, M., Bäck, J., and Hellén, H.: Terpenoid and carbonyl emissions from Norway spruce in Finland during the growing season, Atmos. Chem. Phys., 17, 3357–3370, https://doi.org/10.5194/acp-17-3357-2017, 2017. a, b, c, d, e, f, g, h, i
Hakola, H., Taipale, D., Praplan, A., Schallhart, S., Thomas, S., Tykkä, T., Helin, A., Bäck, J., and Hellén, H.: Emissions of volatile organic compounds from Norway spruce and potential atmospheric impacts, Front. Forest. Global Change, 6, 1116414, https://doi.org/10.3389/ffgc.2023.1116414, 2023. a, b, c
Hamilton, J. F., Lewis, A. C., Carey, T. J., Wenger, J C., Borrás i Garcia, E., and Muñoz, A.: Reactive oxidation products promote secondary organic aerosol formation from green leaf volatiles, Atmos. Chem. Phys., 9, 3815–3823, https://doi.org/10.5194/acp-9-3815-2009, 2009. a
Hari, P. and Kulmala, M.: Station for Measuring Ecosystem-Atmosphere Relations (SMEAR II), Boreal Environ. Res., 10, 315–322, 2005. a
Helin, A., Hakola, H., and Hellén, H.: Optimisation of a thermal desorption–gas chromatography–mass spectrometry method for the analysis of monoterpenes, sesquiterpenes and diterpenes, Atmos. Meas. Tech., 13, 3543–3560, https://doi.org/10.5194/amt-13-3543-2020, 2020. a, b
Hellén, H., Praplan, A. P., Tykkä, T., Ylivinkka, I., Vakkari, V., Bäck, J., Petäjä, T., Kulmala, M., and Hakola, H.: Long-term measurements of volatile organic compounds highlight the importance of sesquiterpenes for the atmospheric chemistry of a boreal forest, Atmos. Chem. Phys., 18, 13839–13863, https://doi.org/10.5194/acp-18-13839-2018, 2018. a, b, c
Hellén, H., Praplan, A. P., Tykkä, T., Helin, A., Schallhart, S., Schiestl-Aalto, P. P., Bäck, J., and Hakola, H.: Sesquiterpenes and oxygenated sesquiterpenes dominate the VOC (C5–C20) emissions of downy birches, Atmos. Chem. Phys., 21, 8045–8066, https://doi.org/10.5194/acp-21-8045-2021, 2021. a
Helmig, D., Guenther, A., Hueber, J., Daly, R., Wang, W., Park, J.-H., Liikanen, A., and Praplan, A. P.: Ozone reactivity measurement of biogenic volatile organic compound emissions, Atmos. Meas. Tech., 15, 5439–5454, https://doi.org/10.5194/amt-15-5439-2022, 2022. a, b, c, d, e, f, g
Holopainen, J., Kivimäenpää, M., and Nizkorodov, S.: Plant-derived Secondary Organic Material in the Air and Ecosystems, Trends Plant Sci., 22, 744–753, https://doi.org/10.1016/j.tplants.2017.07.004, 2017. a
Jain, S., Zahardis, J., and Petrucci, G. A.: Soft Ionization Chemical Analysis of Secondary Organic Aerosol from Green Leaf Volatiles Emitted by Turf Grass, Environ. Sci. Technol., 48, 4835–4843, https://doi.org/10.1021/es405355d, 2014. a
Jokinen, T., Berndt, T., Makkonen, R., Kerminen, V.-M., Junninen, H., Paasonen, P., Stratmann, F., Herrmann, H., Guenther, A. B., Worsnop, D. R., Kulmala, M., Ehn, M., and Sipilä, M.: Production of extremely low volatile organic compounds from biogenic emissions: Measured yields and atmospheric implications, P. Natl. Acad. Sci. USA, 112, 7123–7128, https://doi.org/10.1073/pnas.1423977112, 2015. a
Kammer, J., Perraudin, E., Flaud, P.-M., Lamaud, E., Bonnefond, J., and Villenave, E.: Observation of nighttime new particle formation over the French Landes forest, Sci. Total Environ., 621, 1084–1092, https://doi.org/10.1016/j.scitotenv.2017.10.118, 2018. a
Kännaste, A., Nordenhem, H., Nordlander, G., and Borg-Karlson, A.-K.: Volatiles from a Mite-Infested Spruce Clone and Their Effects on Pine Weevil Behavior, J. Chem. Ecol., 35, 1262–1271, https://doi.org/10.1007/s10886-009-9708-3, 2009. a
Kerminen, V.-M., Chen, X., Vakkari, V., Petäjä, T., Kulmala, M., and Bianchi, F.: Atmospheric new particle formation and growth: review of field observations, Environ. Res. Lett., 13, 103003, https://doi.org/10.1088/1748-9326/aadf3c, 2018. a
Kim, S., Guenther, A., Karl, T., and Greenberg, J.: Contributions of primary and secondary biogenic VOC tototal OH reactivity during the CABINEX (Community Atmosphere-Biosphere INteractions Experiments)-09 field campaign, Atmos. Chem. Phys., 11, 8613–8623, https://doi.org/10.5194/acp-11-8613-2011, 2011. a
Kleist, E., Mentel, T. F., Andres, S., Bohne, A., Folkers, A., Kiendler-Scharr, A., Rudich, Y., Springer, M., Tillmann, R., and Wildt, J.: Irreversible impacts of heat on the emissions of monoterpenes, sesquiterpenes, phenolic BVOC and green leaf volatiles from several tree species, Biogeosciences, 9, 5111–5123, https://doi.org/10.5194/bg-9-5111-2012, 2012. a, b, c
Kulmala, M., Suni, T., Lehtinen, K. E. J., Dal Maso, M., Boy, M., Reissell, A., Rannik, U., Aalto, P., Keronen, P., Hakola, H., Bäck, J., Hoffmann, T., Vesala, T., and Hari, P.: A new feedback mechanism linking forests, aerosols, and climate, Atmos. Chem. Phys., 4, 557–562, https://doi.org/10.5194/acp-4-557-2004, 2004. a
Kulmala, M., Kontkanen, J., Junninen, H., Lehtipalo, K., Manninen, H. E., Nieminen, T., Petäjä, T., Sipilä, M., Schobesberger, S., Rantala, P., Franchin, A., Jokinen, T., Järvinen, E., Äijälä, M., Kangasluoma, J., Hakala, J., Aalto, P. P., Paasonen, P., Mikkilä, J., Vanhanen, J., Aalto, J., Hakola, H., Makkonen, U., Ruuskanen, T., Mauldin, R. L., Duplissy, J., Vehkamäki, H., Bäck, J., Kortelainen, A., Riipinen, I., Kurtën, T., Johnston, M. V., Smith, J. N., Ehn, M., Mentel, T. F., Lehtinen, K. E. J., Laaksonen, A., Kerminen, V.-M., and Worsnop, D. R.: Direct Observations of Atmospheric Aerosol Nucleation, Science, 339, 943–946, https://doi.org/10.1126/science.1227385, 2013. a
Matsumoto, J.: Temperature dependence of rate constant for the gas-phase reaction of ozone with linalool, Chem. Lett., 45, 1102–1104, https://doi.org/10.1246/cl.160500, 2016. a
Messina, P., Lathière, J., Sindelarova, K., Vuichard, N., Granier, C., Ghattas, J., Cozic, A., and Hauglustaine, D. A.: Global biogenic volatile organic compound emissions in the ORCHIDEE and MEGAN models and sensitivity to key parameters, Atmos. Chem. Phys., 16, 14169–14202, https://doi.org/10.5194/acp-16-14169-2016, 2016. a
Nölscher, A. C., Bourtsoukidis, E., Bonn, B., Kesselmeier, J., Lelieveld, J., and Williams, J.: Seasonal measurements of total OH reactivity emission rates from Norway spruce in 2011, Biogeosciences, 10, 4241–4257, https://doi.org/10.5194/bg-10-4241-2013, 2013. a, b
Paasonen, P., Asmi, A., Petaja, T., Kajos, M., Aijala, M., Junninen, H., Holst, T., Abbatt, J., Arneth, A., Birmili, W., van der Gon, H., Hamed, A., Hoffer, A., Laakso, L., Laaksonen, A., Leaitch, W., Plass-Duelmer, C., Pryor, S., Raisanen, P., Swietlicki, E., Wiedensohler, A., Worsnop, D., Kerminen, V.-M., and Kulmala, M.: Warming-induced increase in aerosol number concentration likely to moderate climate change, Nat. Geosci., 6, 438–442, https://doi.org/10.1038/NGEO1800, 2013. a
Pikkarainen, L., Nissinen, K., Ghimire, R. P., Kivimäenpää, M., Ikonen, V.-P., Kilpäls̈inen, A., Virjamo, V., Yu, H., Kirsikka-Aho, S., Salminen, T., Hirvonen, J., Vahimaa, T., Luoranen, J., and Peltola, H.: Responses in growth and emissions of biogenic volatile organic compounds in Scots pine, Norway spruce and silver birch seedlings to different warming treatments in a controlled field experiment, Sci. Total Environ., 821, 153277, https://doi.org/10.1016/j.scitotenv.2022.153277, 2022. a
Pinto, D. M., Blande, J. D., Nykänen, R., Dong, W.-X., Nerg, A.-M., and Holopainen, J. K.: Ozone Degrades Common Herbivore-Induced Plant Volatiles: Does This Affect Herbivore Prey Location by Predators and Parasitoids?, J. Chem. Ecol., 33, 683–694, https://doi.org/10.1007/s10886-007-9255-8, 2007. a
Praplan, A. P., Tykkä, T., Schallhart, S., Tarvainen, V., Bäck, J., and Hellén, H.: OH reactivity from the emissions of different tree species: investigating the missing reactivity in a boreal forest, Biogeosciences, 17, 4681–4705, https://doi.org/10.5194/bg-17-4681-2020, 2020. a, b
Rose, C., Zha, Q., Dada, L., Yan, C., Lehtipalo, K., Junninen, H., Mazon, S. B., Jokinen, T., Sarnela, N., Sipilä, M., Petäjä, T., Kerminen, V.-M., Bianchi, F., and Kulmala, M.: Observations of biogenic ion-induced cluster formation in the atmosphere, Sci. Adv., 4, eaar5218, https://doi.org/10.1126/sciadv.aar5218, 2018. a
Šimpraga, M., Ghimire, R. P., Van Der Straeten, D., Blande, J. D., Kasurinen, A., Sorvari, J., Holopainen, T., Adriaenssens, S., Holopainen, J. K., and Kivimäenpää, M.: Unravelling the functions of biogenic volatiles in boreal and temperate forest ecosystems, Eur. J. Forst Res., 138, 763–787, https://doi.org/10.1007/s10342-019-01213-2, 2019. a
Sommariva, R., Kramer, L. J., Crilley, L. R., Alam, M. S., and Bloss, W. J.: An instrument for in situ measurement of total ozone reactivity, Atmos. Meas. Tech., 13, 1655–1670, https://doi.org/10.5194/amt-13-1655-2020, 2020. a
Thomas, S. J.: Undetected BVOCs from Norway spruce drive total ozone reactivity measurements, B2SHARE [data set], https://doi.org/10.23728/B2SHARE.061EBBCF764544B59CE8, 2023. a
Tunved, P., Hansson, H.-C., Kerminen, V.-M., Ström, J., Maso, M. D., Lihavainen, H., Viisanen, Y., Aalto, P. P., Komppula, M., and Kulmala, M.: High Natural Aerosol Loading over Boreal Forests, Science, 312, 261–263, https://doi.org/10.1126/science.1123052, 2006. a, b
Yang, Y., Shao, M., Wang, X., Nölscher, A. C., Kessel, S., Guenther, A., and Williams, J.: Towards a quantitative understanding of total OH reactivity: A review, Atmos. Environ., 134, 147–161, https://doi.org/10.1016/j.atmosenv.2016.03.010, 2016. a
Ylisirniö, A., Buchholz, A., Mohr, C., Li, Z., Barreira, L., Lambe, A., Faiola, C., Kari, E., Yli-Juuti, T., Nizkorodov, S. A., Worsnop, D. R., Virtanen, A., and Schobesberger, S.: Composition and volatility of secondary organic aerosol (SOA) formed from oxidation of real tree emissions compared to simplified volatile organic compound (VOC) systems, Atmos. Chem. Phys., 20, 5629–5644, https://doi.org/10.5194/acp-20-5629-2020, 2020. a
- Abstract
- Introduction
- Methodology
- Results and discussion
- Conclusions
- Appendix A: Biogenic volatile organic compounds (BVOCs) detected using GC–MS
- Appendix B: Total ozone reactivity monitor
- Data availability
- Author contributions
- Competing interests
- Disclaimer
- Acknowledgements
- Financial support
- Review statement
- References


