the Creative Commons Attribution 4.0 License.
the Creative Commons Attribution 4.0 License.
 | 21 Nov 2023
Radical chemistry and ozone production at a UK coastal receptor site
Robert Woodward-Massey
Roberto Sommariva
Lisa K. Whalley
Danny R. Cryer
Trevor Ingham
William J. Bloss
Stephen M. Ball
James D. Lee
Chris P. Reed
Leigh R. Crilley
Louisa J. Kramer
Brian J. Bandy
Grant L. Forster
Claire E. Reeves
Paul S. Monks
OH, HO2, total and partially speciated RO2, and OH reactivity () were measured during the July 2015 ICOZA (Integrated Chemistry of OZone in the Atmosphere) project that took place at a coastal site in north Norfolk, UK. Maximum measured daily OH, HO2 and total RO2 radical concentrations were in the range 2.6–17 × 106, 0.75–4.2 × 10⁸ and 2.3–8.0 × 10⁸ molec. cm−3, respectively. ranged from 1.7 to 17.6 s−1, with a median value of 4.7 s−1. ICOZA data were split by wind direction to assess differences in the radical chemistry between air that had passed over the North Sea (NW–SE sectors) and that over major urban conurbations such as London (SW sector). A box model using the Master Chemical Mechanism (MCMv3.3.1) was in reasonable agreement with the OH measurements, but it overpredicted HO2 observations in NW–SE air in the afternoon by a factor of ∼ 2–3, although slightly better agreement was found for HO2 in SW air (factor of ∼ 1.4–2.0 underprediction). The box model severely underpredicted total RO2 observations in both NW–SE and SW air by factors of ∼ 8–9 on average. Measured radical and levels and measurement–model ratios displayed strong dependences on NO mixing ratios, with the results suggesting that peroxy radical chemistry is not well understood under high-NOx conditions. The simultaneous measurement of OH, HO2, total RO2 and was used to derive experimental (i.e. observationally determined) budgets for all radical species as well as total ROx (i.e. OH + HO2 + RO2). In NW–SE air, the ROx budget could be closed during the daytime within experimental uncertainty, but the rate of OH destruction exceeded the rate of OH production, and the rate of HO2 production greatly exceeded the rate of HO2 destruction, while the opposite was true for RO2. In SW air, the ROx budget analysis indicated missing daytime ROx sources, but the OH budget was balanced, and the same imbalances were found with the HO2 and RO2 budgets as in NW–SE air. For HO2 and RO2, the budget imbalances were most severe at high-NO mixing ratios, and the best agreement between HO2 and RO2 rates of production and destruction rates was found when the RO2 + NO rate coefficient was reduced by a factor of 5. A photostationary-steady-state (PSS) calculation underpredicted daytime OH in NW–SE air by ∼ 35 %, whereas agreement (∼ 15 %) was found within instrumental uncertainty (∼ 26 % at 2σ) in SW air. The rate of in situ ozone production (P(Ox)) was calculated from observations of ROx, NO and NO2 and compared to that calculated from MCM-modelled radical concentrations. The MCM-calculated P(Ox) significantly underpredicted the measurement-calculated P(Ox) in the morning, and the degree of underprediction was found to scale with NO.
- Article
(6235 KB) - Full-text XML
-
Supplement
(2838 KB) - BibTeX
- EndNote


The removal of trace gases in the troposphere is dominated by reactions with the hydroxyl radical (OH) during the daytime. At semi-polluted locations, OH formation is mainly initiated by the photolysis of ozone (O3) and nitrous acid (HONO):
The OH oxidation of volatile organic compounds (VOCs) in the presence of oxygen results in the formation of organic peroxy radicals (RO2), for example via H-atom abstraction,
or via addition to unsaturated VOCs. RO2 radicals may also be formed from the photolysis of oxygenated VOCs (OVOCs). In the presence of NO, RO2 radicals produce hydroperoxyl radicals (HO2) and carbonyl species:
HO2 also reacts with NO and also O3 to reform OH:
thus completing the atmospheric reaction cycle known as the hydrogen oxide (HOx= OH + HO2) cycle. HO2 is also formed by formaldehyde (HCHO) photolysis and by reaction of OH with CO and HCHO. Non-photolytic sources of radicals include nitrate radical (NO3) chemistry and the ozonolysis of alkenes. Chlorine atoms may also react with VOCs to generate RO2 radicals. The subsequent photolysis of NO2 formed in Reactions (R4a) and (R5) results in the production of ozone in the troposphere:
The short lifetimes of OH, HO2 and RO2, collectively known as ROx, make them ideal species to test our understanding of tropospheric oxidation chemistry, particularly when measurements of OH reactivity (the inverse of the OH lifetime, ) are also available.
The marine boundary layer (MBL) accounts for a substantial fraction (71 %) of the planetary boundary layer. Field measurements of OH and HO2 radicals in the MBL have shown that in general, models are capable of simulating the observed concentrations to within ∼ 30 % or better. The majority of these studies were characterised by clean air masses with very low to relatively low NO mixing ratios (Sommariva et al., 2004; Heard et al., 2006; Mao et al., 2009; Whalley et al., 2010; Hosaynali Beygi et al., 2011; Vaughan et al., 2012; Mallik et al., 2018), where observed OH and HO2 concentrations were generally in the range ∼ 3–8 × 10⁶ and ∼ 1–4 × 10⁸ molec. cm−3, respectively. In the MBL, HOx radical production is normally dominated by the reaction of O(1D) with water vapour (Reaction R1), but HCHO photolysis to HO2 is often an important primary radical source (Ren et al., 2008; Stone et al., 2018). Similarly, owing to low primary VOC levels, OVOCs other than HCHO can account for a significant proportion of OH reactivity (Sommariva et al., 2006; Mao et al., 2009; Whalley et al., 2010; Stone et al., 2018), and their photolysis can also be important radical sources. HOx chemistry was shown to be sensitive to halogen chemistry in some studies (Bloss et al., 2005b; Whalley et al., 2010; Stone et al., 2018), particularly with regard to the partitioning between OH and HO2 since BrO and IO radicals act to convert HO2 to OH (Sommariva et al., 2006). Heterogeneous uptake of HO2 on aerosols can be a significant HOx loss route under low NO conditions (Sommariva et al., 2004, 2006; Whalley et al., 2010; Stone et al., 2018), but considerable uncertainty surrounds the treatment of heterogeneous processes such as the parameterisation of uptake coefficients () (Song et al., 2020), which historically have sometimes been set to unrealistically high values to achieve measurement–model agreement.
To the authors' knowledge, there are no reported field campaigns in the MBL in which OH, HO2, RO2 and were all measured simultaneously. Similarly, there are only two studies (Novelli et al., 2014a; Mallik et al., 2018) in the MBL in which OH measurements made by laser-induced fluorescence (LIF) used a technique that allows for the discrimination of OH measurement interferences (Mao et al., 2012). In this work, we present interference-free measurements of OH (Woodward-Massey et al., 2020) alongside HO2, total and partially speciated RO2, and from a field campaign at a UK coastal receptor site. This complete suite of ROx measurements allowed for more comprehensive testing of our understanding of MBL chemistry through comparisons to the predictions of a box model. The field campaign took place at a site subject to a variety of air mass types, at which previous field campaigns with (incomplete) ROx and/or measurements were conducted in 1994–1995 (Forberich et al., 1999; Grenfell et al., 1999; Penkett et al., 1999), 2002 (Fleming et al., 2006; Green et al., 2006) and 2004 (Smith, 2007; Lee et al., 2009b). Recently, Tan et al. (2019) showed that, provided ROx observations are available along with simultaneous supporting measurements (trace gas mixing ratios, photolysis rates, etc.), experimental budgets can be derived for all measured radical species, previously done for OH only. Budget imbalances can be identified with such an approach and would indicate problems with experimental input data, such as radical concentrations and rate coefficients and/or an incorrect chemical mechanism. Here we adopt the approach of Tan et al. (2019) and show that large imbalances exist between experimental radical production and destruction rates and suggest explanations for such differences. In addition, we use the measured radical data to calculate in situ ozone production rates and compare these to those calculated from modelled radical concentrations.
The ICOZA field campaign focussed on the chemistry surrounding the production of ozone, which is harmful to human health (Jerrett et al., 2009), damages vegetation (Krupa et al., 1998) and is a potent greenhouse gas (IPCC, 2023). The ICOZA campaign took place in June–July 2015 at the Weybourne Atmospheric Observatory (WAO), which is a Global Atmospheric Watch (GAW) regional station run by the University of East Anglia (UEA) on behalf of the National Centre for Atmospheric Science (https://weybourne.uea.ac.uk/, last access: 9 November 2023). As shown in Fig. S1 in the Supplement, the site is located on the north Norfolk Coast, UK (52∘57′02′′ N, 1∘07′19′′ E), ∼ 50 km NNW of Norwich and ∼ 190 km NE of London. The site is situated 16 m above sea level and is surrounded by grass fields on three sides, with the fourth facing due north towards a gently sloped pebble beach. The nearest major road is a rural road (A147) located ∼ 800 m to the south.
As the site is situated on the North Sea coast, it is subject to clean air masses that have travelled over the North Sea and originate from polar regions, as well as more polluted air that has been influenced by emissions from major UK cities (e.g. London, Birmingham) ∼ 12–24 h before arriving at the site (Lee et al., 2009b). Polluted continental air, containing aged (by up to 36 h) anthropogenic emissions from continental Europe, may also be sampled (Lee et al., 2009b). In addition, the site is subject to emissions from local roads, as well as shipping influences (Cárdenas et al., 1998).
The campaign began on 1 July 2015, but radical measurements commenced on the afternoon of 29 June. The last radical observations were made during the early morning of 22 July, before the campaign end date of 31 July.
2.1 Instrumentation
A list of the instrumentation involved in measurements of trace gases, aerosols and photolysis frequencies during the ICOZA campaign is given in Table 1. Instruments sampled ambient air from a height of ∼ 4 m from the roofs of individual shipping containers (Universities of Leeds and Leicester), a van (Birmingham) and from either the roof (∼ 5 m) of the main WAO building directly or via a common glass manifold (glass, ∼ 15 cm ID) located on a tower that reached ∼ 10 m above the roof. Comparisons of NOx observations, measured using multiple instruments, indicated no significant heterogeneity in the air sampled from different positions of the site.
Table 1List of species observed and their corresponding measurement techniques for the ICOZA campaign. For descriptions of simple and complex RO2, see Sect. 2.1.2. For some species (e.g. NO, NO2, HONO, HCHO), more than one measurement technique was available.
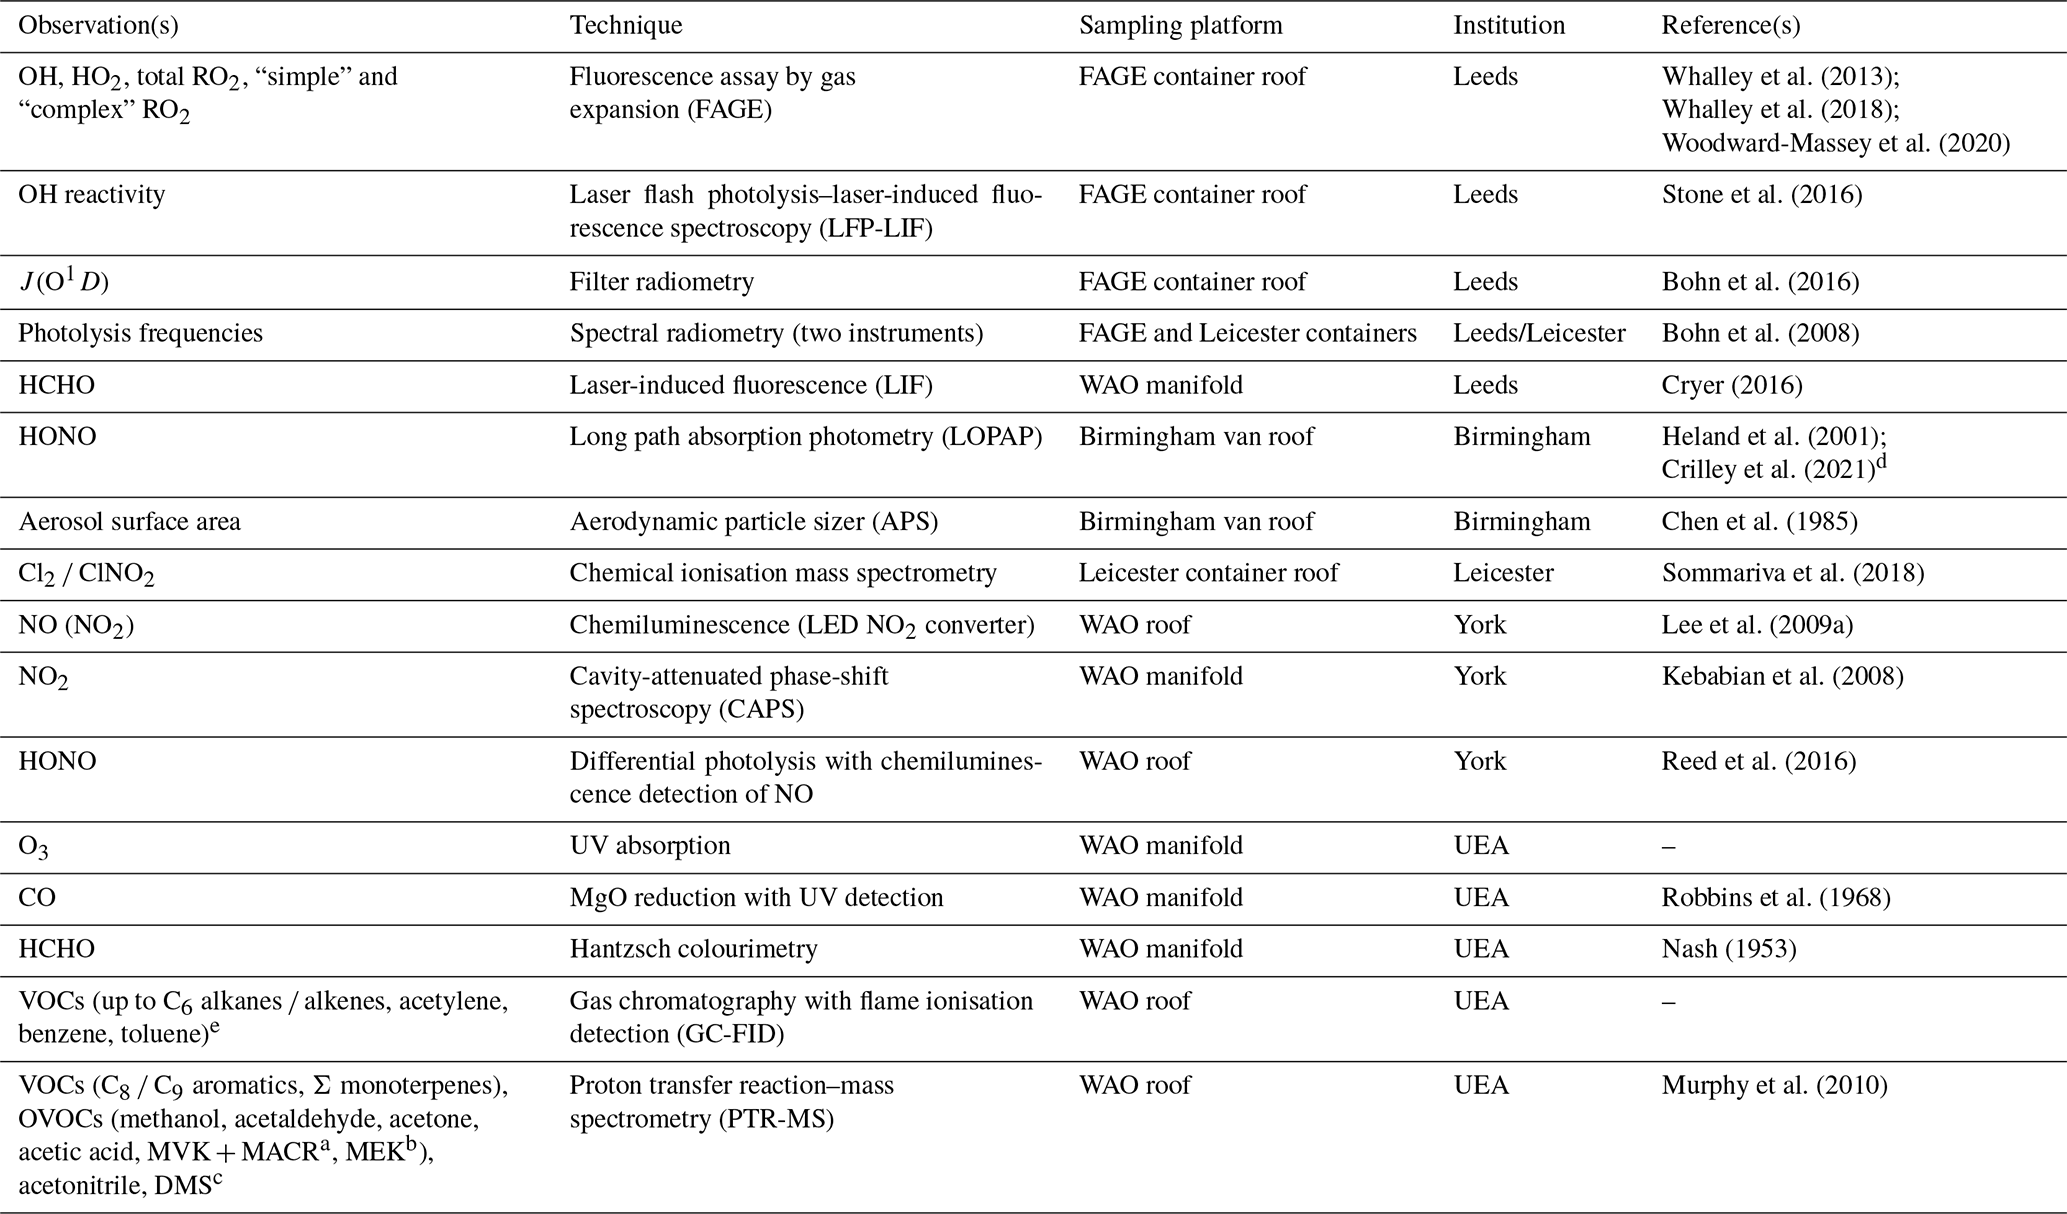
a Sum of methyl vinyl ketone and methacrolein. b Methyl ethyl ketone. c Dimethyl sulfide. d Used to constrain the Master Chemical Mechanism (MCM) model. e A constant methane mixing ratio of 1900 ppm was used to constrain the MCM model and to calculate OH reactivity.
2.1.1 The Leeds ground-based FAGE instrument
OH, HO2 and RO2 radicals were measured using the fluorescence assay by gas expansion (FAGE) technique (Hard et al., 1984; Heard and Pilling, 2003). Only a brief description of the Leeds instrument is given here as it has been described in detail elsewhere (Creasey et al., 1997; Whalley et al., 2010, 2013, 2018; Woodward-Massey, 2018; Woodward-Massey et al., 2020) and was used to measure OH and HO2 during a previous campaign at the WAO, namely the Tropospheric ORganic photoCHemistry experiment (TORCH) 2 campaign (Smith, 2007).
Ambient OH concentrations are measured using laser-induced fluorescence (LIF) spectroscopy. The inlet consists of a conical turret (4 cm length, 3.4 cm ID) with a 1.0 mm diameter pinhole through which ambient air is sampled at ∼ 7 slm. The turret is mounted on top of a stainless steel fluorescence cell (HOx cell), which is held at ∼ 1.5 Torr (∼ 2 hPa) using a combination of a Roots blower (Leybold RUVAC WAU 10001) and a rotary pump (Leybold SOGEVAC SV2000). A wavelength tuneable solid-state laser (YAG pumped Ti:Sapphire laser) with a pulse repetition frequency of 5 kHz is tuned to the OH A2Σ+ ( 0) ← X ( 0) electronic transition at λ= 308 nm. Approximately 10–20 mW of laser light is supplied to the fluorescence cell using an optical fibre. OH fluorescence near 308 nm is detected with a micro-channel plate photomultiplier (MCP; Photek PMT325/Q/BI/G with 10 mm diameter photocathode), which is used together with a 50 ns gating unit (Photek GM10-50) and a 2 GHz 20 dB gain amplifier (Photek PA200-10). Due to failures of the MCP detectors used during ICOZA, channel photomultiplier (CPM; Perkin Elmer 993P) detectors were sometimes used for the ROx fluorescence cell. Fluorescence signals from the MCP/CPM detectors are analysed using gated photon counting.
HO2 is detected after conversion to OH by the addition of NO (BOC, 99.8 %) delivered using a mass flow controller (MFC; MKS Instruments 1179A series). An advantage for ICOZA relative to TORCH 2 and other previous field campaigns is the addition of instrumental capability for observations of RO2 radicals, using the ROxLIF technique (Fuchs et al., 2008), as well as interference-free measurements of HO2 (Fuchs et al., 2011; Whalley et al., 2013). The Leeds group first applied the ROxLIF method to ambient RO2 observations in London (Whalley et al., 2018) and has since deployed this approach in Beijing (Slater et al., 2020; Whalley et al., 2021). The ROxLIF method relies on the reactions of RO2 radicals with NO (BOC, 500 ppmv in N2) and CO (BOC, 5 % in N2) in a flow tube held at ∼ 30 Torr, which result in initial conversion of RO2 to OH (RO2 + NO → HO2, HO2 + NO → OH) and then to HO2 (OH + CO → HO2; very rapid conversion back to HO2 results in minimal radical wall losses) that is finally detected as OH via addition of NO inside a second FAGE cell (ROx cell) that the RO2 flow tube is coupled to. During fieldwork, the two FAGE cells are used to make sequential measurements of OH, HO2, HO (HO2 plus an interference from RO2 radicals derived from long-chain alkanes and alkene and aromatic species; see Whalley et al. (2013) for full details) and total RO2 in the following data acquisition cycle: (1) the first cell (HOx) measures OH, while simultaneously the second cell (ROx) measures HO (high-NO flow, 50 sccm; RO2 interference maximised), and (2) the HOx cell measures HO2 (low NO flow, 5 sccm; RO2 interference minimised), while the ROx cell measures total RO2. The ROxLIF method allows for the speciation of total RO2 into “complex” (cRO2) and “simple” (sRO2) RO2 types (Whalley et al., 2013; Tan et al., 2017; Whalley et al., 2018). cRO2 are RO2 species that readily convert to OH in HO mode (cRO2= HO HO2; note that in other previous studies, cRO2 have also been labelled as RO or RO2i) and correspond to RO2 radicals derived from alkenes, aromatics and long-chain (> C3) alkanes. sRO2 concentrations are derived from the difference between total RO2 and cRO2 and correspond to RO2 radicals derived from small-chain (< C4) alkanes. For more details of the speciation of sRO2 and cRO2, the reader is referred to Whalley et al. (2013, 2018).
Background signals are normally obtained by scanning the laser wavelength to a position that is off-resonance from the OH transition line. In the case of OH, this yields the measurement referred to as OHwave (Mao et al., 2012). Alternatively, the OH background may be determined chemically, via addition of an OH scavenger (e.g. propane) prior to FAGE sampling, which results in an OH measurement known as OHchem (Mao et al., 2012). The recording of OHchem can be used to test for the presence of interferences in conventional OHwave detection. Prior to the ICOZA campaign, an inlet pre-injector (IPI) module (Novelli et al., 2014a) was constructed to facilitate OHchem measurements in the Leeds FAGE system (Woodward-Massey et al., 2020). The IPI module was first deployed for ambient measurements of OHchem during ICOZA. To test for interferences, two IPI sampling periods were conducted in the middle of the campaign, separated by a few days (3–8 and 12–16 July). A comparison of OHwave (corrected for the small and well-characterised interference from O(1D) + H2O, with O(1D) deriving from laser photolysis of O3 (Woodward-Massey et al., 2020)) and OHchem measurements yielded a slope (OHwave versus OHchem) of 1.16 ± 0.06, with the non-unity value suggesting the presence of a small unknown OHwave interference during ICOZA on the order of 10 %–20 %, which is smaller than the overall measurement accuracy of 26 % at 2σ. The OH data presented in this work correspond to OHchem when such data were available but OHwave otherwise, where all OHwave data have been corrected for the known interference from O3 H2O. No attempt has been made to correct the OHwave data for the presence of other unknown interferences, which must be considered an additional uncertainty in our analyses.
The Leeds FAGE instrument was calibrated by supplying known radical concentrations to the instrument inlets. Radicals were delivered in an excess flow (∼ 40 slm) of humidified synthetic air (BOC, BTCA 178) using a turbulent flow tube. OH and HO2 were generated in a 1:1 ratio (Fuchs et al., 2011) by the photolysis of water vapour at 184.9 nm using a Hg(Ar) pen-ray lamp (LOT LSP035). For RO2 calibrations, CH4 (BOC, CP grade 99.5 %) was added to form HO2 and CH3O2 in a 1:1 ratio. To enable the calculation of radical concentrations, N2O (BOC, medical grade 98 %) chemical actinometry (Edwards et al., 2003; Faloona et al., 2004) was performed before and after the campaign in order to determine the product of the lamp flux at 184.9 nm and the photolysis time in the flow tube. Multipoint calibrations were performed for all radical species at regular intervals during the campaign, approximately once per week. The calibration factors (i.e. sensitivities) obtained did vary somewhat due to instrumental issues, namely the need to switch between MCP/CPM detectors. One calibration factor was applied to periods in which an MCP was used and one for periods in which a CPM was used, where both calibration factors were derived from the average sensitivities of multiple MCP or CPM calibrations. As a consequence of the detector changes, limits of detection (LODs) also varied over the course of ICOZA, with campaign-median 5 min LODs (± 1σ) of (6.1 ± 4.1) × 105, (4.0 ± 2.7) × 106 and (5.0 ± 1.2) × 107 molec. cm−3 for OH, HO2 and total RO2, respectively, for a signal-to-noise ratio (SNR) of 2.
2.1.2 The Leeds OH reactivity instrument
The Leeds shipping container also housed an instrument used for the measurement of total OH reactivity, . Full details may be found in Cryer (2016) and Stone et al. (2016), but the key features are described here. The instrument consists of an atmospheric pressure flow tube (85 cm length, 5 cm ID) coupled to an OH fluorescence cell, which was located on the roof of the Leeds container during the ICOZA field campaign. The low pressure in the fluorescence cell (∼ 2 Torr) is provided by the same pumping system as the FAGE cells. The flow tube samples air (via in. PFA tubing) from close to the FAGE inlets at ∼ 16 slm using a vacuum pump (Agilent Technologies IDP-3 Dry Scroll Pump). The laser flash photolysis pump and probe technique is used here (Jeanneret et al., 2001; Sadanaga et al., 2004), which involves the 266 nm laser (Quantel USA CFR 200) photolysis (pump) of ambient O3 to generate OH via the reaction of O(1D) with H2O. The OH signal decay is then observed in real time by LIF (the probe). Fitting of the first-order exponential obtained yields , after subtraction of the physical decay rate controlled by non-chemical losses of OH (e.g. diffusion). Using the laser system described above, 308 nm probe light is generated. Previously, OH reactivity was measured at the WAO during TORCH 2 using a different method, the sliding injector technique with FAGE detection of OH (Ingham et al., 2009; Lee et al., 2009b).
2.1.3 Supporting measurements
Formaldehyde (HCHO) was measured using a LIF instrument developed in Leeds, full details of which may be found in Cryer (2016). The instrument is based on the design of Hottle et al. (2009) and uses a pulsed (300 kHz) tuneable fibre laser (TFL3000, Novawave) to generate UV radiation at 353.370 nm, which excites the HCHO 5 51,4 rotational transition of the 4 A1A2← X1A1 vibronic band. As with FAGE, gas is sampled into a low-pressure detection cell (110–120 Torr), but broadband fluorescence is collected at red-shifted wavelengths (λ ∼ 390–550 nm). The fluorescence was detected using a PMT (Sens-Tech P25PC photodetector module), and the signal was recorded by gated photon counting (PMS400A, Becker and Hickl). The background is determined by moving the laser wavelength to an offline position (λ= 353.360 nm). The compact HCHO instrument is housed in a shock-insulated 19 in. rack inside a plastic case, which was situated in the main WAO building during ICOZA and sampled air through the common glass manifold at a height of ∼ 15 m. HCHO was also measured using Hantzsch colourimetry (Nash, 1953), with reasonably good agreement between the two techniques, as demonstrated by the fit [HCHO]LIF= 1.2 × [HCHO]Hantzch + 0.3 ppbv (R2= 0.77; data not shown).
Photolysis frequencies (J) for a variety of species, including O3→ O(1D), NO2, H2O2, HONO, HNO3 and HCHO, were calculated using the actinic flux measured using a 2π spectral radiometer and published absorption cross-sections and photodissociation quantum yields; J(O1D) was also measured using a 2π filter radiometer (Meteorologie Consult GmbH) (Bohn et al., 2008). A variety of other supporting instruments (Table 1) were brought to the WAO site. Observational data were also provided by instruments permanently located at WAO (e.g. CO, NOx, O3, SO2, VOCs and meteorological data; see Table 1).
2.2 Model description
In this work, radical concentrations were compared to the predictions of a zero-dimensional box model incorporating a kinetic and photochemical mechanism, the Master Chemical Mechanism (MCM; https://mcm.york.ac.uk/MCM/, last access: 9 November 2023) (Saunders et al., 1997; Jenkin et al., 2003; Saunders et al., 2003). The current version of the MCM was used, v3.3.1 (Jenkin et al., 2015). The MCM is a near-explicit chemical mechanism, which represents the oxidative degradation of methane and 142 primary emitted VOCs and incorporates ∼ 17 000 reactions of ∼ 6700 closed shell and free radical species. A subset of the MCM with 4258 species and 12 851 reactions was used instead of the full MCM, reflecting the suite of VOC measurements during ICOZA (Table 1), e.g. no measurements of > C6 alkanes and limited BVOC observations (discussed below).
The MCM model simulations were conducted using AtChem2 (https://github.com/AtChem/AtChem2, last access: 9 November 2023; Sommariva et al., 2020). Three model scenarios were used for the interpretation of radical observations: MCM-base, MCM-carb and MCM-hox. The base model, MCM-base, was constrained to all measured trace gases listed in Table 1, with the exception of radical species (including NO3 radicals, due to limited measurement data for NO3) and OH reactivity, Cl2, HCHO, the sum of methyl vinyl ketone and methacrolein (MVK + MACR), xylenes, monoterpenes, and dimethyl sulfide (DMS). A constant mixing ratio of 1900 ppm for methane, CH4, was used for all model runs. MCM-carb was additionally constrained to measured carbonyl species (HCHO, MVK + MACR) but was otherwise identical to the base model; MVK and MACR (both C4H6O, measured as a sum using proton transfer reaction–mass spectrometry (PTR–MS)) were assumed to be present in a 1:1 ratio. Similarly, MCM-hox was the same as the base model but was additionally constrained to FAGE-measured HO2. In all simulations, the ratio of trimethylbenzene (TMB) isomers (i.e. C9 aromatics, also indistinguishable by PTR–MS) was assumed to be . In all simulations, NO and NO2 were constrained as separate species rather than as total NOx.
Temperature, pressure and RH were also constrained in the MCM models, along with spectral radiometer measurements of photolysis frequencies: O3 → O(1D), NO2, HONO, HNO3, NO3, HCHO, CHOCHO, CH3CHO, CH3COCH3, CH3NO3, C2H5NO3, 1-C3H7NO3, 2-C3H7NO3 and ClNO2. For species with more than one photolytic decomposition channel, branching ratios were taken from the MCM, with the exception of CHOCHO (glyoxal, three channels) for which values were corrected with those used in the Tropospheric Ultraviolet and Visible (TUV) radiation model (Madronich, 1992). Photolysis frequencies that were not measured were calculated using the MCM parameterisation, scaled by a factor derived from measured and calculated J(NO2) to account for cloud cover.
All measurement constraints were used at their original time resolution, as described in Sommariva et al. (2020). First-order physical losses of unmeasured, model-generated intermediates (e.g. unmeasured OVOCs, organic nitrates, peroxides, acids and alcohols) through dry deposition were taken from Zhang et al. (2003), where an environment of deciduous trees and long grass/crops was assumed, representative of the immediate area around the WAO. The boundary layer height was estimated at 800 m and kept constant for the duration of the simulations. As examples, these constraints led to deposition velocities of ∼ 6.4, ∼ 2.8 and ∼ 2.3 cm s−1, corresponding to first-order deposition lifetimes of ∼ 4, ∼ 10 and ∼ 12 h, for HNO3, H2O2 and HCHO, respectively. The lifetime of these model-generated secondary products was determined by their first-order loss rates of dry deposition, heterogeneous uptake (see below) and photolysis and bimolecular reactions (e.g. with OH and Cl atoms).
In addition to dry deposition, physical losses to aerosols (i.e. heterogeneous uptake) were considered in all model scenarios, represented by the following first-order loss rate (Ravishankara, 1997):
where ω is the mean molecular speed of the species being taken up, A is the aerosol surface area measured using an aerodynamic particle sizer (APS, range: < 0.5–20 µm) and γ is the aerosol uptake coefficient. Heterogeneous uptake was considered for the following species: O3, OH, HO2, H2O2, HO2NO2, NO, NO2, HONO, HNO3, NO3, N2O5, SO2, SO3, HCl, Cl and ClNO2. γHO2 was set to a constant value of 0.1 in all model scenarios, the same value used in analyses of the Clean air for London (ClearfLo) campaign (Whalley et al., 2018).
The model was run for 48 h (spin-up time) and then reinitialised with the values of all species at the end of this period and rerun for the whole campaign. This allowed radical species and other reactive intermediates to reach steady-state levels but prevented the build-up of secondary products. The model output data were averaged to 15 min for the comparisons featured in this work.
OH concentrations can also be calculated using a photostationary-steady-state (PSS) approach, which uses field-measured quantities only, providing a check on (1) the internal consistency of OH, HO2 and observations and (2) whether the OH budget can be balanced using measured quantities. PSS OH was calculated using the following equation:
where is obtained directly from measured OH reactivity, and POH terms accounted for the photolysis of O3 to O(1D) (Reaction R1a) and reaction with water vapour (Reaction R1b), photolysis of HONO (Reaction R2), reactions of HO2 with NO (R5) and O3 (Reaction R6), and alkene ozonolysis reactions (Reaction R8):
where f is the fraction of O(1D) atoms that react with H2O to form OH (∼ 10 % but dependent upon water vapour), J(HONO) is the spectral-radiometer-determined HONO photolysis rate and the final term on the right-hand side accounts for the total OH formation from the ozonolysis of each measured alkene (ALK) i with yield . Rate coefficients and yields were taken from MCMv3.3.1 (Saunders et al., 1997; Jenkin et al., 2003; Saunders et al., 2003; Bloss et al., 2005a; Jenkin et al., 2015).
2.3 Meteorological and chemical conditions encountered during ICOZA
The overall conditions encountered during the ICOZA campaign are summarised by the time series of meteorological (wind speed and direction, temperature, RH, photolysis frequencies) and chemical (mixing ratios of NO, NO2, CO, HCHO, isoprene, MVK+MACR, O3, HONO) parameters shown in Fig. 1, which includes all available measurements at 15 min time resolution for the period 29 June–22 July 2015. As shown in Fig. S2, the predominant wind sectors were W, SW and S (i.e. ∼ 180–270∘). In terms of air mass back-trajectories (Cryer, 2016), during ICOZA the WAO site was generally under the influence of Atlantic air, which had been transported over the UK, likely encountering anthropogenic emissions from major conurbations (e.g. Birmingham, London, Leicester; Fig. S1). However, there were some exceptions to this on certain days of the campaign. For example, at the start of the campaign on 1 July, air that had spent a considerable amount of time over northern mainland Europe was sampled, which coincided with a heatwave (temperature of up to 30 ∘C) and an event where high mixing ratios of ozone were encountered. Similarly, 11 and 16 July were characterised by a strong European influence, while on 9 July the site was subject to air masses originating from the North Sea.
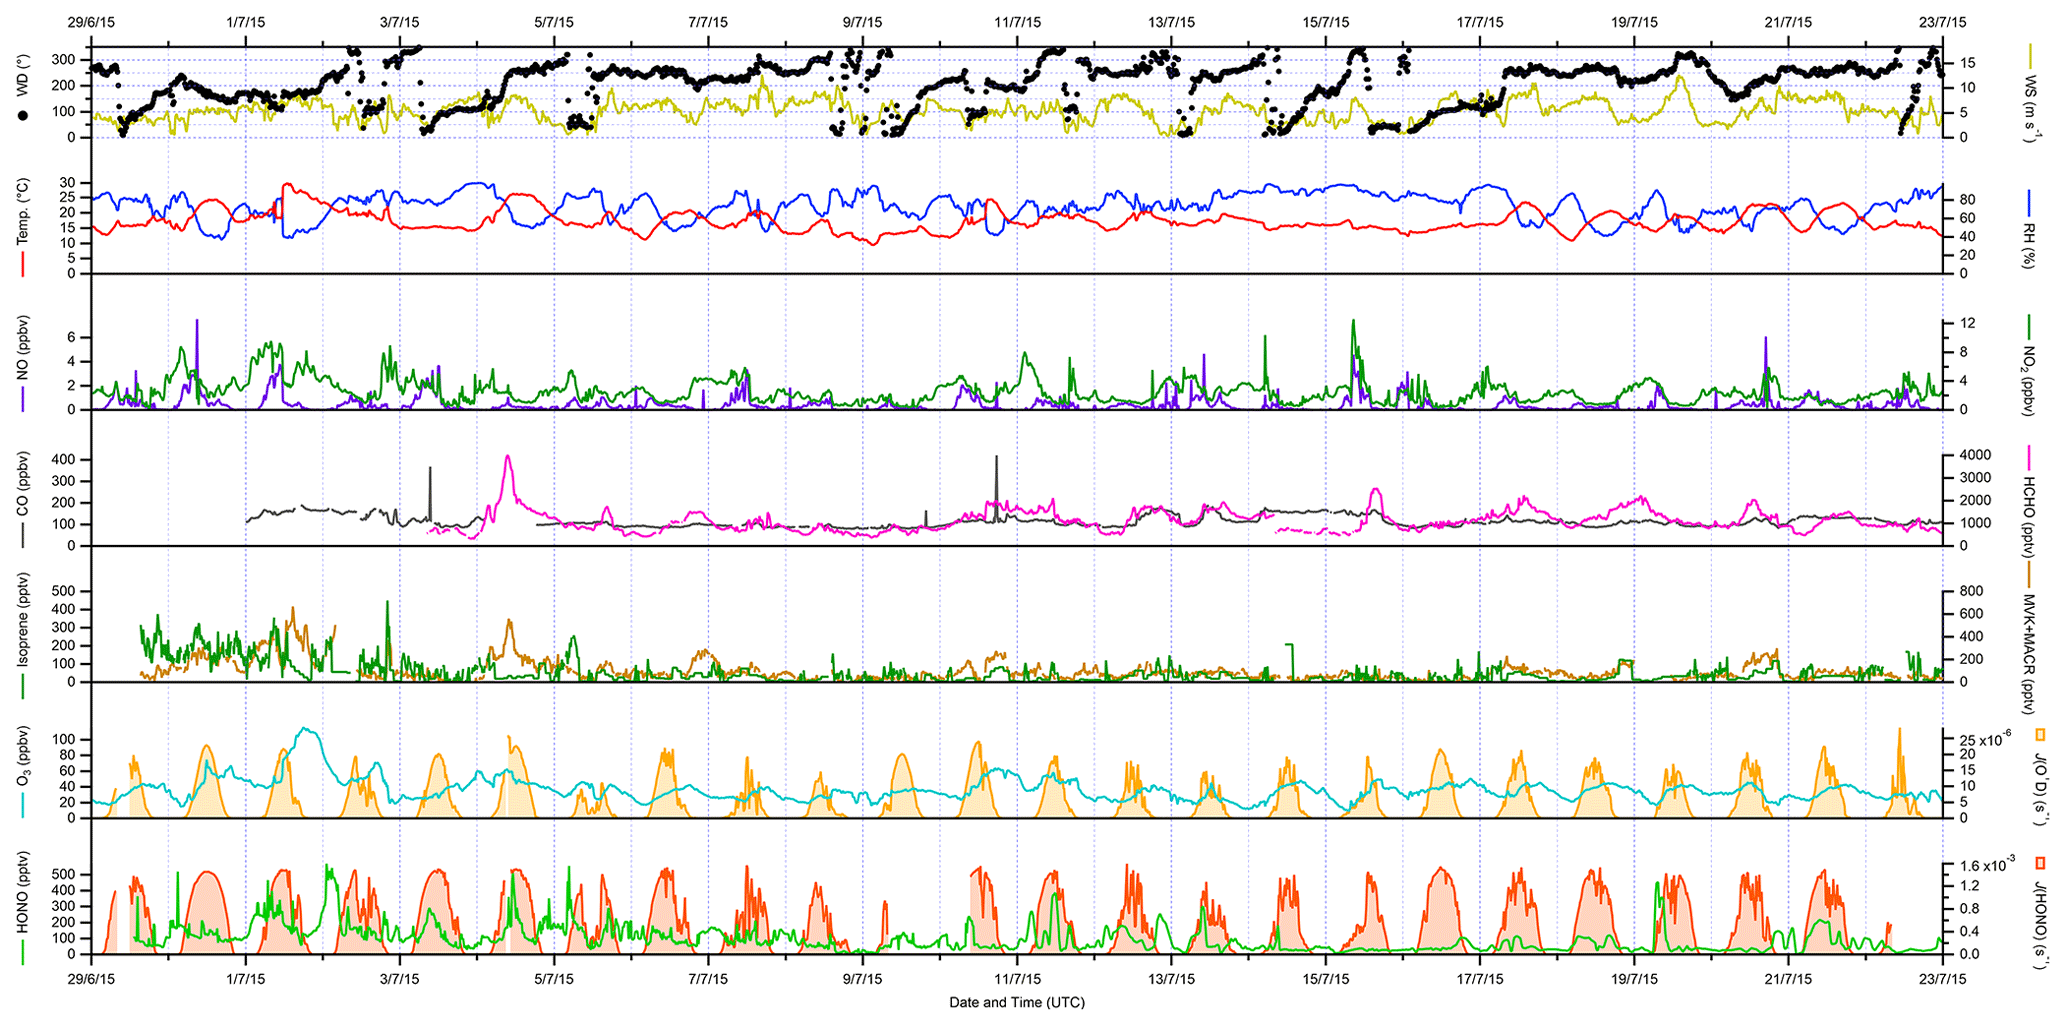
Figure 1Time series of meteorological parameters (wind speed and direction, temperature, RH, photolysis frequencies) and trace gases (NO, NO2, CO, HCHO, isoprene, MVK + MACR, O3, HONO) measured during ICOZA (29 June–23 July 2015). All data presented are 15 min averages. UTC: coordinated universal time.
During the ICOZA campaign, wind speeds were relatively strong, with a median of 5.5 m s−1 and a maximum of 12.7 m s−1, and tended to drop slightly in the morning. Temperatures generally increased through the day from ∼ 15 ∘C before sunrise to ∼ 20 ∘C in the late afternoon, with a campaign maximum of 29.8 ∘C during the heatwave on 1 July. RH varied between ∼ 40 %–90 % and was strongly anticorrelated with temperature. Based on Fig. S2, and given that the SW sector corresponds to air that may have been transported over large urban areas (Fig. S1), all ICOZA data (from 2 July onwards) were split into two categories according to wind direction – SW winds (180–270∘) and all other winds (NW–SE, < 165 and > 285∘) – as shown in Table S1 and Fig. S3. It can be seen that temperatures were generally higher (and conversely RH lower) in SW air. In addition, increased cloud cover in SW air is evident from the slightly lower average values of J(O1D).
Overall, moderate levels of pollution were observed during the ICOZA campaign. For example, the campaign median NO mixing ratio, for periods of overlap with FAGE radical observations, was 160 pptv with a maximum of 4650 pptv (15 min). NO generally peaked in the morning, with median values of ∼ 500–1500 pptv at 08:00–10:00 coordinated universal time (UTC = GMT = BST − 1), ∼ 100–400 pptv in the afternoon and < 100 pptv at night (Fig. S3). On average, NO mixing ratios were almost a factor of 2 higher in SW air than in NW–SE air (Table S1). NO2 exhibited median and maximum levels of 2.2 and 10.4 ppbv, respectively, and followed an inverse diel profile to that of NO, peaking at night at ∼ 3–4 ppbv with an afternoon minimum of ∼ 1–1.5 ppbv. Both NO and NO2 exhibited significant short-term variability (Fig. 1).
The highest ozone mixing ratios of ∼ 110 ppbv were observed on 1 July (Fig. 1), which, as mentioned above, coincided with elevated temperatures. It should be noted that this day, although interesting as a case study, was not characteristic of the general chemical conditions (particularly ozone levels) of the ICOZA campaign and was thus omitted from the wind sector analysis discussed in this paper; VOC measurements were also not available at this time. On average, ozone exhibits a classically expected photochemical diel profile, with a minimum of ∼ 25–30 ppbv around 06:00 UTC and a maximum of ∼ 35–45 ppbv in the afternoon. Due to higher NO levels, O3 mixing ratios were lower in SW air (Table S1 and Fig. S3).
The diel profile of HCHO for SW air is similar to ozone (Fig. S3), which is typical for an environment where HCHO production is largely driven by the photochemical oxidation of VOCs (Ayers et al., 1997; Cryer, 2016), with a diel minimum of ∼ 800 pptv in the late morning and evening and a maximum around 16:00 UTC in the range ∼ 1000–1800 pptv. The diel profile of HCHO in NW–SE air is less pronounced, with lower mixing ratios indicating less integrated photochemical processing. The highest HCHO levels of 3990 pptv were observed during the late morning of 4 July, although unfortunately radical and other measurements are not available for this time, owing to instrumental issues caused by a power cut on the preceding night.
Levels of HONO were quite variable and reached a maximum of ∼ 570 pptv during the night that followed the daytime ozone event discussed previously (1–2 July, Fig. 1). In general, HONO mixing ratios tended to peak after sunset and midnight in NW–SE (∼ 100 pptv) and SW air (∼ 150 pptv), respectively (Fig. S3). There is no obvious diel profile in CO measurements (Fig. S3) and no clear difference between NW–SE and SW wind, with median levels of ∼ 90–150 ppbv observed throughout the day but a few short-term spikes of up to ∼ 420 ppbv. The flat diel profile observed for CO indicates that, for the most part, the WAO site was not strongly impacted by fresh anthropogenic combustion emissions during the ICOZA campaign.
Isoprene levels were low during ICOZA, with a campaign median mixing ratio of 24 pptv and a maximum of 450 pptv. Diel profiles of isoprene were similar between NW–SE and SW air and bear slight resemblance to isoprene levels expected from biogenic emissions with a maximum of ∼ 50 pptv in the afternoon/early evening. The isoprene oxidation products MVK and MACR, measured as a sum using PTR–MS, exhibited significantly higher levels of ∼ 80–200 pptv in SW air compared to ∼ 20–60 pptv in NW–SE air. PM2.5 levels exhibited no clear diel profile, with similar loadings between the two wind sector types.
2.4 Radical budget equations
Experimental budget analyses for OH, HO2 and RO2 as well as their sum, ROx, were first described by Tan et al. (2019) for measurements made in the Pearl River Delta, China, although many previous studies have investigated the experimental budget of OH only (e.g. Whalley et al., 2011). Given the short lifetimes of OH, HO2 and RO2 radicals (on the order of seconds to < 1 min), we can assume that their concentrations are in steady state (Geyer et al., 2004) and hence expect their production and destruction rates to be equal at a location such as the WAO where incoming air is homogeneous. In this section, we describe the reactions involved in ROx initiation and termination as well as those that interconvert different ROx species (i.e. propagation). We then show how such reactions can be used to derive budget equations (i.e. production and destruction rates) for all radical species. All reaction rate coefficients and branching ratios were taken from the Master Chemical Mechanism, MCMv3.3.1 (https://mcm.york.ac.uk/MCM/, last access: 9 November 2023; (Jenkin et al., 2003; Jenkin et al., 2015)).
2.4.1 Budget for total ROx= OH+ HO2+ RO2
ROx production is driven by the photolysis of O3 (Reaction R1), HONO (Reaction R2) and OVOCs (Reaction R9) as well as alkene ozonolysis reactions (Reaction R8):
Other photolabile radical reservoir species, such as H2O2, ROOH, HNO3 and RONO2, were not measured during ICOZA and therefore were not considered in ROx production. H2O2 and CH3OOH, and some other peroxides have been measured at coastal locations. For example, mean concentrations of H2O2 and CH3OOH at Mace Head were 0.23–1.58 and 0.1–0.15 ppbv, respectively (Morgan and Jackson, 2002). At coastal locations peroxide photolysis was shown to be a minor source of OH or HO2 (via CH3O) (Sommariva et al., 2004, 2006). Specifically at Cape Grim, the rate of OH production from CH3OOH was less than 5 % of the rate of production from O(1D) + H2O (Sommariva et al., 2004), and hence peroxides were not included in the radical budget analyses. The total ROx production rate may therefore be approximated using
where f is the fraction of O(1D) atoms that react with H2O vapour to form OH; and are the HO2 and RO2 radical yields from the photolysis of OVOC i, respectively; and , and are the radical yields from the ozonolysis of alkene (ALK) j. Of the OVOCs measured during ICOZA, those included in Eq. (4) were formaldehyde (that photolyses to form HO2), acetaldehyde (HO2 and RO2) and acetone (RO2). All measured alkenes were included in Eq. (4). ROx termination is controlled by radical loss to NOx and the self- and cross-reactions of peroxy radicals:
The total ROx destruction rate is thus given by
In this budget analysis, RO2 radicals are treated as a single species, with generalised rate coefficients taken from the MCMv3.3.1: at 298 K and 1 atm, k12=β × 9.0 × 10⁻¹² cm3 molec.−1 s−1, where β is the RONO2 yield which we have assumed to be a constant 5 % for all RO2 species (Orlando and Tyndall, 2012; Tan et al., 2019); k14= 3.5 × 10⁻¹³ cm3 molec.−1 s−1; and k15= 2.3 × 10⁻¹¹ cm3 molec.−1 s−1.
In line with Tan et al. (2019), we do not explicitly consider equilibrium reactions of the type HO2 + NO2 + M ⇌ HO2NO2 + M and RO2 + NO2 + M ⇌ RO2NO2 + M (e.g, peroxyacetyl nitrate (PAN) formation and decomposition) in the budget analyses and assume these processes result in no net gain or loss of the radical species. The reaction of acyl peroxy radical with NO2 is the only way to form PAN in the MCM, and acyl peroxy constitutes 7 %–8 % of the RO2 pool. For typical temperatures of the campaign, HO2NO2 and PAN (and other PANs) will be in equilibrium. Only at extremes in temperature would the equilibrium be skewed. For example, at Hudson Bay in the Arctic, the formation of HO2NO2 was identified as an important radical reservoir, reducing HOx concentrations during the day and enhancing them at night (Edwards et al., 2011).
2.4.2 Budget for OH
OH production is described by Eq. (3), and we do not consider the photolysis of hypohalous acids (HOX; e.g. HOI or HOBr) as a source of OH owing to the lack of IO or BrO measurements during ICOZA needed to quantify this. However, we expect the HOX source to only be very minor owing to the absence of exposed macroalgae and thus low inputs of I and Br. OH loss rates are obtained directly from measured [OH] and measured OH reactivity:
2.4.3 Budget for HO2
As shown in Sect. 2.4.1, primary sources of HO2 are OVOC photolysis (of HCHO and CH3CHO, Reaction R3) and alkene ozonolysis (Reaction R4). The reaction of OH with some VOCs can also lead to the prompt formation of HO2 (e.g. from isoprene and aromatics). The yield of HO2 from OH oxidation of these species is explicitly contained in the MCM mechanism and so prompt HO2 formation is included. For the Beijing AIRPRO field campaign, the formation of HO2 from VOC + OH → HO2 versus the formation of RO2 from VOC+OH → RO2 was investigated (Whalley et al., 2021) – and HO2 production was significant, owing to the presence of VOCs like isoprene and aromatics in the Beijing in summer. Secondary HO2 sources are Reactions (R4a, R4b) and also
The total HO2 production rate may therefore be calculated as
where k4=α × 9.0 × 10⁻¹² cm3 molec.−1 s−1 at 298 K (α is the HO2 yield of the RO2+NO reaction, which is assumed to be equal to 0.95 for all RO2). Prompt HO2 sources as discussed above are not included in the budget analysis, so calculated using (Eq. 7) may be a lower estimate.
HO2 is lost through Reactions (R5), (R6), (R13) and (R15) (we do not consider the reactions of HO2 with IO or BrO for reasons given in Sect. 2.4.2). Thus, the HO2 destruction rate is given by
2.4.4 Budget for RO2
Analogous to HO2, primary RO2 sources are Reactions (R8) and (R9). The major secondary source of RO2 radicals is the reaction of OH with VOCs and OVOCs:
The RO2 production rate from Reaction (R3) () may be calculated using measured VOC and OVOC concentrations, multiplied by their OH reaction rate coefficients and [OH] (i.e. [OH] × [VOCi]). Alternatively, we can calculate from measured OH reactivity, after corrections for the contributions of inorganic reactants (i.e. NOx, CO, SO2, etc.) and organics that do not produce RO2 (i.e. HCHO):
The total RO2 production rate is then calculated as
The reactions of the nitrate radical (NO3) and chlorine atoms (Cl) with VOCs and OVOCs could also constitute a source of RO2. NO3 radical concentrations were measured during ICOZA, but data coverage was poor; we have therefore omitted NO3 radical reactions in our budget analyses. We note that this limitation should only impact the nighttime results. The impact of Cl atom chemistry is discussed in Sect. 3.10.3.
RO2 radicals are lost through Reactions (R4a), (R12), (R14) and (R15). From these reactions, the total RO2 destruction rate may be derived as
3.1 Radical and OH reactivity observations and comparison to model predictions
Figure 2 shows the full time series of OH, HO2 and total RO2 radical concentrations as well as OH reactivity (15 min means) observed during ICOZA, covering the period 29 June–21 July 2015. Also shown are the MCM-base model results for all radical species and for periods in which measurements of all key species used to constrain the model were available, and the PSS calculated OH concentrations. The radical observations follow their expected photochemical diel profiles, with maximum levels around solar noon (∼ 12:00 UTC on cloud-free days) and low nighttime concentrations, approximately an order of magnitude smaller than during the daytime for OH and HO2, and frequently scattered around zero. There was less of a day–night contrast for total RO2, for which nighttime levels were almost always above the RO2 LOD (∼ 5 × 10⁷ molec. cm−3 (∼ 2 pptv)). Unlike radical concentrations, OH reactivity does not appear to show any diel pattern, with a median value of 4.7 s−1 but frequent spikes of up to ∼ 10–15 s−1 (range = 1.7–17.6 s−1). OH reactivity values were much higher at the start of the campaign (i.e. 1–2 July 2015), due to the aforementioned heatwave event that coincided with the transport of pollution from northern continental Europe (Cryer, 2016).
Daily maximum OH concentrations were in the range 2.6–17 × 106 and 1.8–13 × 106 molec. cm−3 for observations and PSS calculations, respectively, based on the 90th percentile of the daytime concentrations with daytime defined as J(O1D) > 5 × 10⁻⁷ s−1. The MCM-base-modelled OH (1.1–14 × 106 molec. cm−3) is discussed in more detail below. Similarly, daily maximum observed HO2 and total RO2 levels were in the range 0.75–4.2 × 10⁸ and 2.3–8.0 × 10⁸ molec. cm−3, respectively, or 1.0–4.9 × 10⁸ and 0.53–2.8 × 10⁸ molec. cm−3 for MCM-base predictions. It is clear from these features that the PSS calculation can broadly capture the range in daily maximum OH levels, while the MCM-base model can generally reproduce peak HO2 but significantly underpredicts midday total RO2. Observed nighttime concentrations were on the order of 1–3 × 10⁵, 2–3 × 10⁷ and 1–2 × 10⁸ molec. cm−3 for OH, HO2 and total RO2, respectively (see Fig. 2).
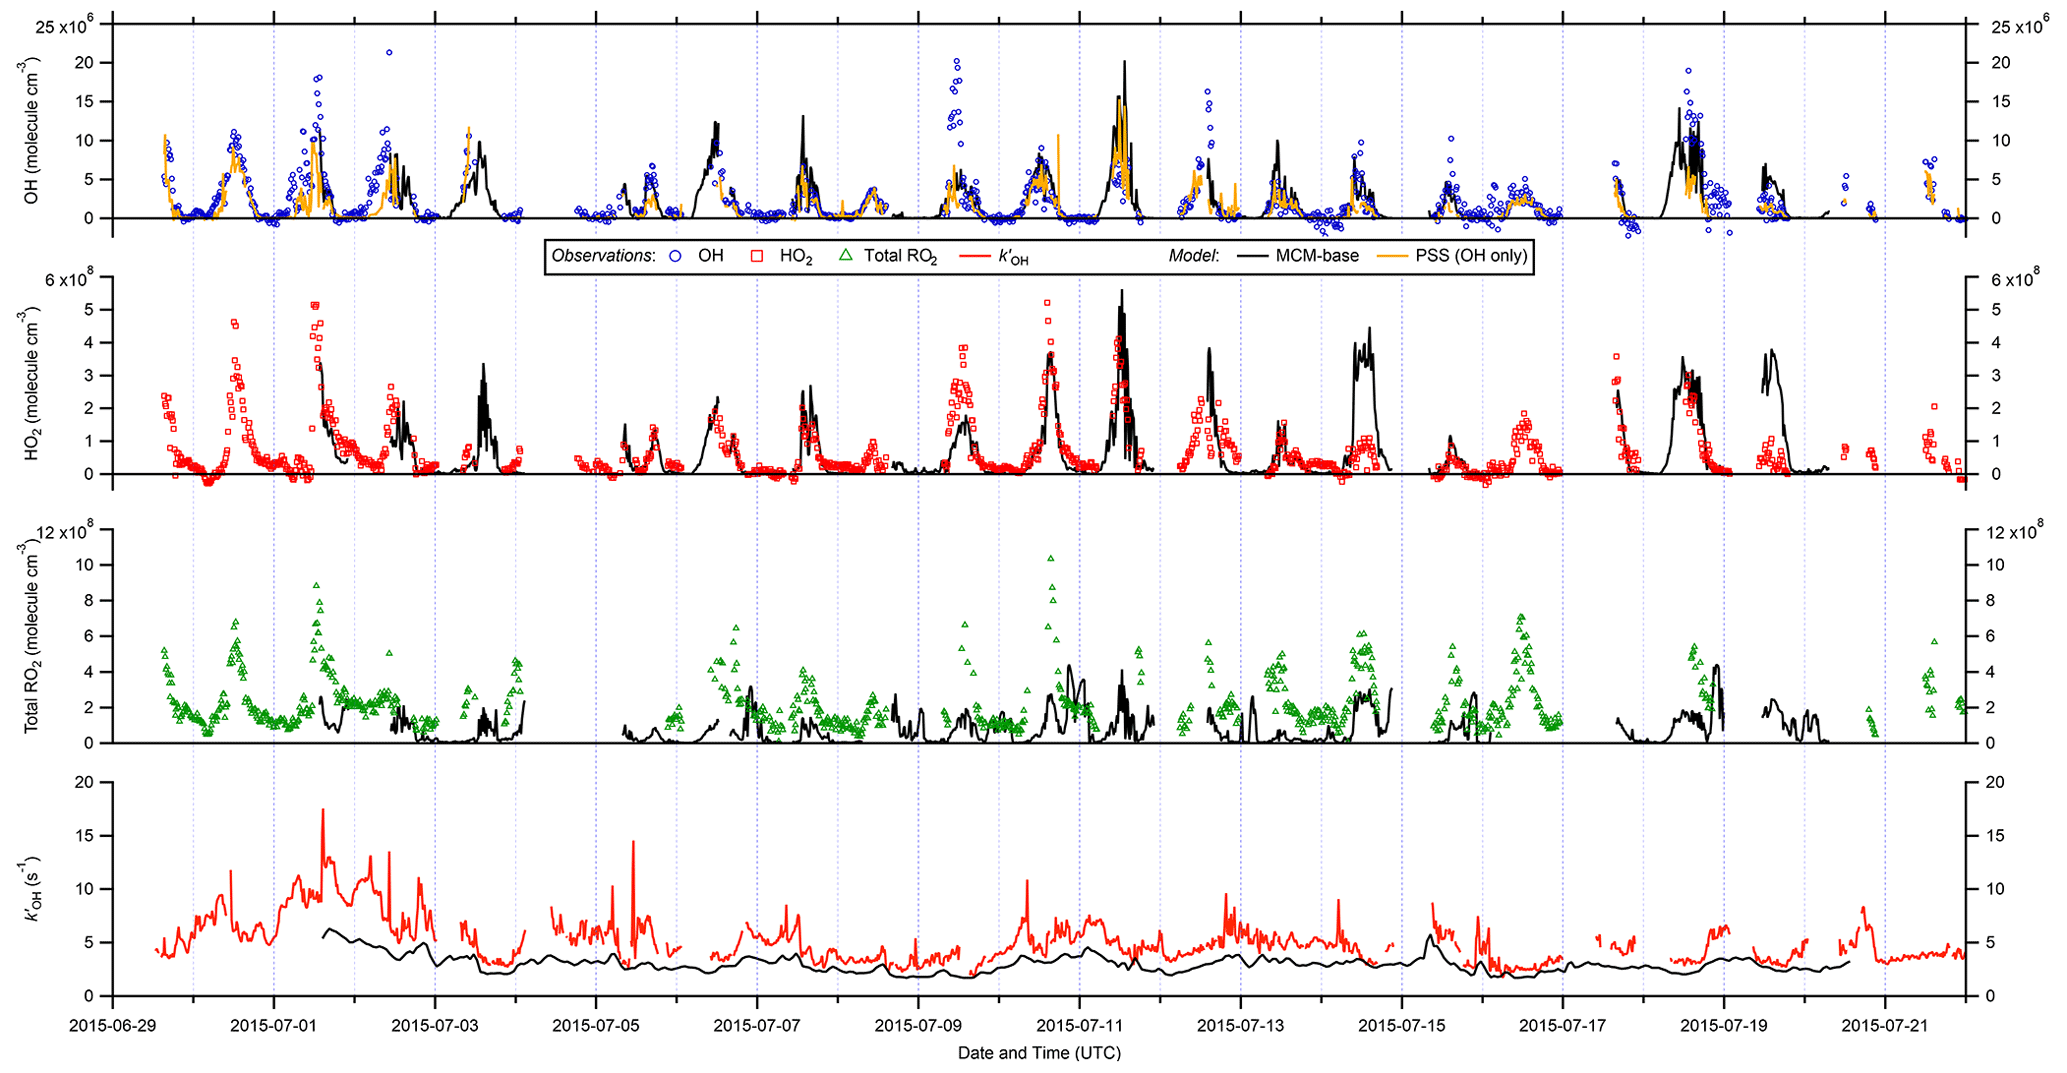
Figure 2Time series of OH, HO2, and total RO2 measurements and comparison to MCM-base model and photostationary-steady-state (PSS) predictions. All data are at 15 min time resolution except for model OH reactivity (1 h). Error bars omitted for clarity.
On shorter timescales it can be seen (Fig. 2) that the level of agreement is more variable. For example, the PSS calculation tracks OH observations very tightly for extended periods, but severe underpredictions are often found around midday, with smaller but still significant underpredictions on some mornings. The MCM-base-predicted OH levels generally follow changes in the measurements but with a tendency towards overprediction during the daytime (median ∼ 10 %; see below). Similar to the PSS model capture of OH measurements, MCM-base modelled HO2 concentrations show excellent agreement with measurements for much of the campaign (median daytime overprediction of ∼ 3 %). For total RO2 radicals, the level of agreement is poor (median daytime underprediction of ∼ 80 %), where, with a few exceptions (e.g. 14 July), the MCM-base model cannot reproduce temporal changes in RO2 concentrations and generally cannot capture their magnitudes with any reasonable degree of success, consistent with the discrepancy between the predicted and observed ranges in daily maxima. OH reactivity is almost always underpredicted (daytime median ∼ 35 %), with a few examples of short periods where the MCM-base model reactivity matches the observations.
Figure 3 shows the median diel profiles of observed and modelled radical concentrations and OH reactivity, split by wind direction. All radicals display their characteristic photochemical diel profiles, peaking around midday (albeit with strong day-to-day variability), and their qualitative features (i.e. overall shapes) are generally well captured by the various model schemes. Smaller but still significant (i.e. above the LOD for each species) concentrations were observed at night that are generally larger than the model predictions.
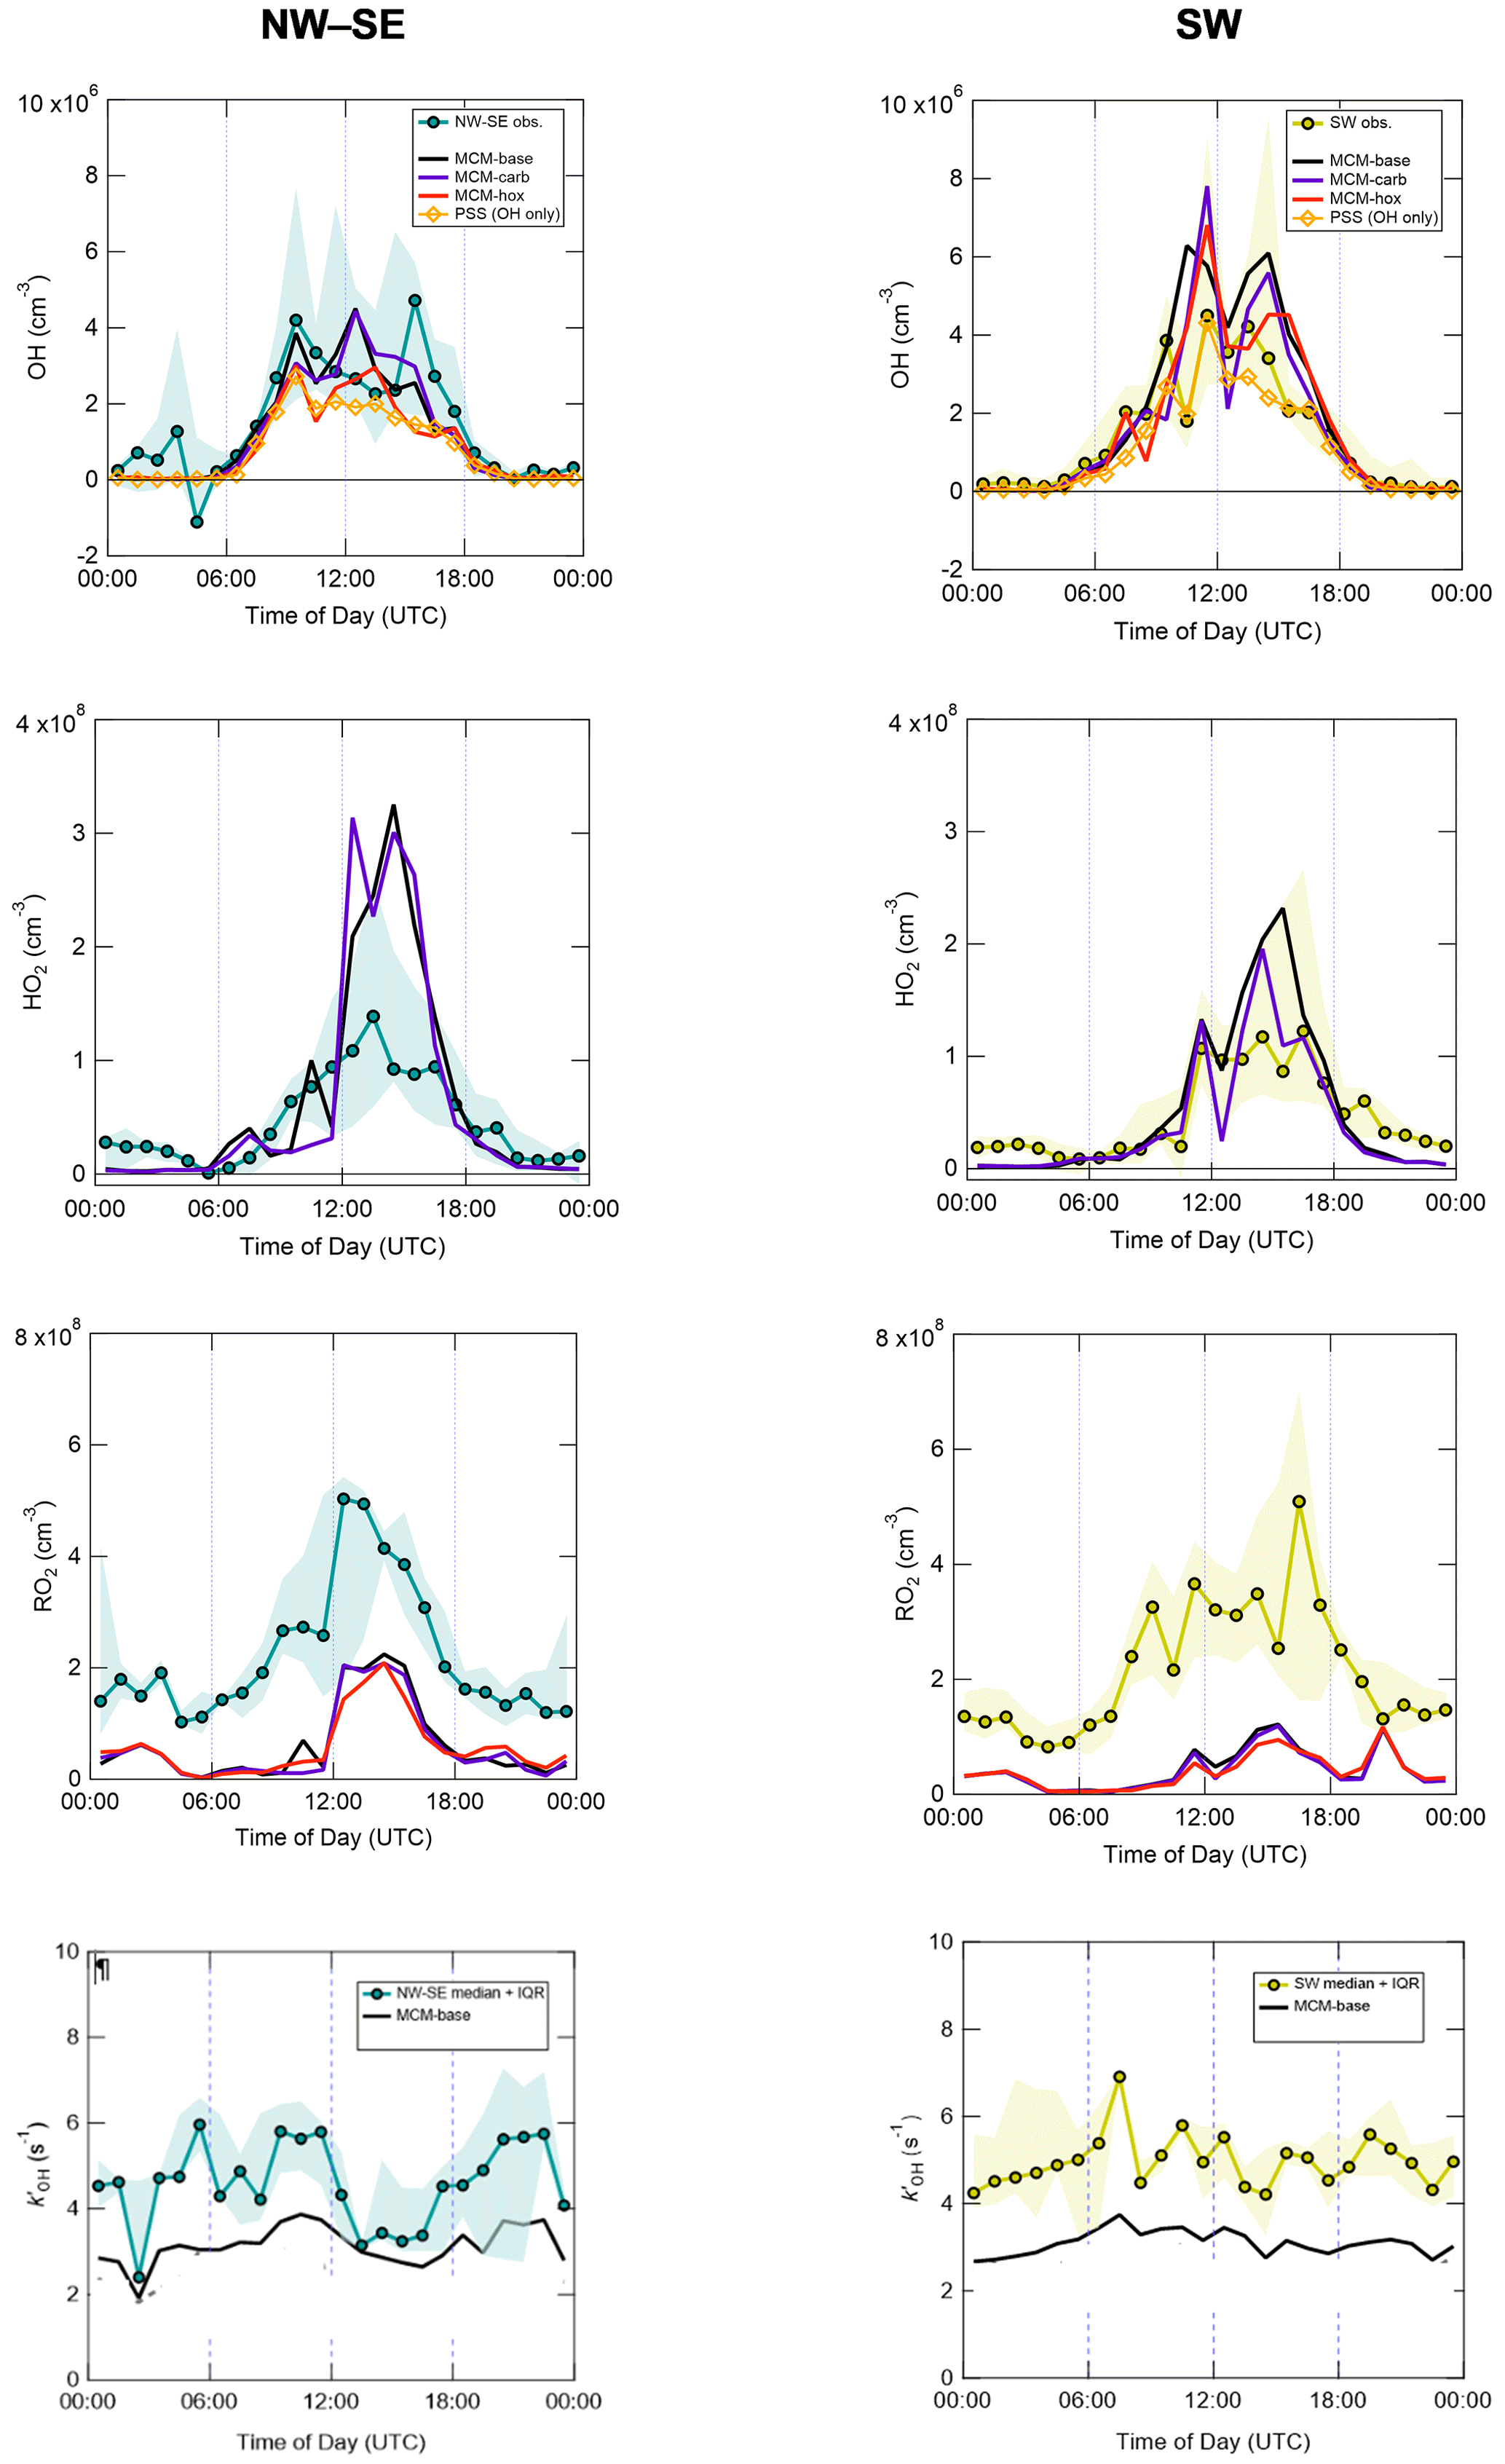
Figure 3Hourly median diel profiles of OH, HO2, total RO2 and and comparison to MCM box model and PSS model predictions, split according to wind direction (left NW–SE, right SW). Shaded areas correspond to 25th and 75th percentiles of the data in each time bin.
Measured diel profiles of OH concentrations were similar in NW–SE and SW air, reaching ∼ 2–4 × 10⁶ molec. cm−3 but with slight differences in the shape of their diel profiles. Overall, the models capture the observations reasonably well (i.e. generally within a factor of 2 during the daytime, although this is larger than the measurement uncertainty of 26 % at 2σ), with the best agreement seen in SW air for the MCM-hox model (median difference ∼ 15 % during the daytime) and the PSS calculation (∼ 20 %). The PSS calculation underpredicts OH concentrations throughout the day in NW–SE air by ∼ 35 % but tracks the measurements very tightly in SW air with a slight tendency towards underprediction, suggesting missing OH sources (see Eq. 2). For OH, differences between the MCM-base and MCM-carb models are only minor (median difference NW–SE ∼ 1 %, SW ∼ 2 %), with a greater difference seen for the MCM-hox run.
Measured HO2 levels and diel profiles were very similar between the two wind sector types, with peak levels of around ∼ 1–1.5 × 10⁸ molec. cm−3 in the afternoon and nighttime concentrations on the order of ∼ 2 × 10⁷ molec. cm−3. However, the MCM models predict very different behaviour in NW–SE and SW air. In NW–SE air, HO2 levels are significantly underpredicted in the evening by a factor of ∼ 2 but overpredicted by about a factor of ∼ 2–3 in the afternoon. For SW air, HO2 is still significantly underpredicted in the evening, but agreement throughout the daytime is fairly reasonable (median ∼ 1 % difference between measured HO2 and MCM-carb), with less substantial afternoon disagreement. In either wind sector type, there are strong differences, both positive and negative, between the MCM-base and MCM-carb models (range: −50 % to +70 %).
Total RO2 observations reached similar maximum concentrations of ∼ 5 × 10⁸ molec. cm−3 in NW–SE and SW air but exhibit different diel profiles. In NW–SE air, RO2 levels peaked sharply just after midday, with concentrations of ∼ 1–3 × 10⁸ molec. cm−3 in the morning and late afternoon. In SW air, the profile is broader, with concentrations of ∼ 2–4 × 10⁸ molec. cm−3 sustained from mid-morning to the afternoon and maximum levels observed around 16:00 UTC. In contrast to OH and HO2, the level of measurement–model agreement for total RO2 is poor at all times of day, as might be expected based on their time series comparison (Fig. 2). For example, in NW–SE air, the measurement–MCM-base model ratios range from ∼ 2–5 in the afternoon to almost 40 in the early morning, with an average value of 8. Similar ratios are found in SW air, albeit with more substantial afternoon disagreement, with an average of 9. The models do capture the general shape of the diel profiles, not evident from the time series data in Fig. 2, although, the models predict small secondary maxima in total RO2 at night, which is not seen in the measurements; such behaviour was also found in London (Whalley et al., 2018). Constraining the model to the few measured carbonyls (MCM-carb) or HO2 (MCM-hox) does little to improve the measurement–model agreement.
OH reactivity exhibits similar behaviour in the two wind sector types, with relatively flat diel profiles and levels of 3–6 s−1. In NW–SE air, the model reactivity roughly tracks temporal changes in the measured reactivity (e.g. the afternoon decrease), but the reactivity is underpredicted by ∼ 34 % throughout the day (maximum ∼ 49 %). The contribution of model intermediates to model reactivity is ∼ 35 % on average, with an afternoon maximum of ∼ 63 %. In SW air, the measured OH reactivity profile is flatter but is also underpredicted throughout the day by ∼ 37 % on average (maximum ∼ 46 %). Model intermediates were less important than in NW–SE air but accounted for a slightly greater proportion of model reactivity in the afternoon and evening of up to ∼ 30 %–40 %, compared to ∼ 22 % on average.
Many aspects are fairly similar between the two wind sector types, for example, measured OH, HO2, RO2 and OH reactivity levels. Perhaps the most striking difference between the two wind sector types is the model performance for OH and HO2 (Fig. 3). In NW–SE air, measured OH is underpredicted by the PSS calculation by ∼ 35 % on average, but reasonable agreement is found in SW air (within 20 % on average). Similarly, HO2 is overpredicted by both the MCM-base and MCM-carb models by a factor of 2–3 during the afternoon in NW–SE air, but reasonable agreement is found between measured HO2 and the MCM-carb model for daytime SW air. In contrast, the model underprediction of RO2 is more severe in SW air compared to the NW–SE sector, suggesting that the good agreement found for HO2 may be fortuitous (i.e. if the model was able to reproduce RO2, then RO2 + NO → HO2 reactions would likely lead to the model overpredicting HO2). The underprediction of OH and overprediction of HO2 in NW–SE air only occur at low-NOx conditions (Figs. S7 and 5). Possible reasons for these discrepancies are discussed in Sect. 4.4.
A comparison of measured and modelled concentrations of radical species and OH reactivity in previous coastal field campaigns can be found in Sect. S1 of the Supplement, together with further discussion of the model results in Sect. S2.
3.2 RO2 speciation
The ROxLIF technique allows for “simple” (sRO2) and “complex” (cRO2) organic peroxy radicals to be measured separately, as discussed in Sect. 2.1.1. ROxLIF observations of speciated RO2 radicals are compared to MCM-base model predictions in Fig. S4. On average, both observed and modelled sRO2 account for ∼ 60 %–100 % of total RO2 radicals. The overall levels of sRO2 (∼ 1–3 × 10⁸ molec. cm−3) and cRO2 (∼ 0–1.5 × 10⁸ molec. cm−3) are similar between each wind sector type. In NW–SE air, sRO2 and cRO2 display slightly different diel profile shapes, the latter being suppressed in the morning hours. sRO2 levels are always significantly underpredicted by the model (average measurement–model ratio ∼ 9), whereas there is agreement for cRO2 around ∼ 06:00 and ∼ 18:00 UTC but disagreement overall (average ratio ∼ 7). In SW air, both diel profiles are broader, and the degree of underprediction in the afternoon is worse, with average values of ∼ 10 and ∼ 7 for sRO2 and cRO2, respectively. Similar to NW–SE air, agreement is also seen for cRO2 in the early morning in SW air.
Figure S5 shows the daytime breakdown of RO2 species predicted by the MCM-base model, split according to wind direction. The model predicts that the dominant species in both wind sector types was methylperoxy (CH3O2), with contributions of ∼ 58 % and ∼ 55 % (daytime median) in NW–SE and SW air, respectively. In NW–SE air, the next most important species is HYPROPO2 (CH2(OH)CH(CH3)O2, formed from OH addition to propene) with a contribution of ∼ 9 %, followed by acetylperoxy (CH3CO3, ∼ 7 %), BUTDBO2 (CH2(OH)CH(O2)CH = CH2, formed from OH addition to 1,3-butadiene, ∼ 2 %), and HOCH2CH2O2 (CH2(OH)CH2O2, formed from OH addition to ethene, ∼ 2 %). Other RO2 radicals contribute ∼ 22 % in total. In SW air, the contributions are fairly similar: HYPROPO2 ∼ 6 %, acetylperoxy ∼ 8 %, BUTDBO2 ∼ 2 % and HOCH2CH2O2 ∼ 2 %. Other RO2 radicals are slightly more important than in NW–SE air, with a total contribution of ∼ 25 %. Isoprene-derived peroxy radicals (with the most important being ISOPBO2 and ISOPDO2) contribute only ∼ 2 % and ∼ 5 % in NW–SE and SW air, respectively.
3.3 Observed and modelled OH versus J(O1D)
The discussion of this can be found in Sect. S3 of the Supplement, and includes Fig. S6.
3.4 Observed and modelled RO2 versus HO2
RO2 is plotted against HO2 in Fig. 4 for both measurement and model results, with fit parameters summarised in Table S3. Observed RO2 and HO2 are strongly correlated, with a stronger correlation in SW air (R= 0.81 versus R= 0.63 in NW–SE air). For NW–SE air, the correlation is much stronger for sRO2 versus HO2 (R= 0.68) than cRO2 versus HO2 (R= 0.37) (data not shown). The fit slopes suggest that in NW–SE air RO2 and HO2 coexisted in approximately a 1:1 ratio, while this was closer to 2:1 for SW air. The non-negligible intercepts of ∼ 1–2 × 10⁸ molec. cm−3 suggest that there are some RO2 sources that do not result in the concomitant production of HO2, consistent with the time series data in Fig. 2, which may be more relevant at night and possibly indicates a contribution from NO3 chemistry. For the model results, the RO2 : HO2 ratio was closer to 1:2 in both NW–SE and SW air during the daytime but much higher (∼ 12:1) during nighttime. The different slopes for day and nighttime data in the model cases are not seen in the observations. The increased slope for the model results during nighttime indicates slower RO2 → HO2 cycling due to lower NO levels compared to the daytime. However, small amounts of RO2 will be converted to HO2, so a correlation still exists (either because there is a small amount of NO present or the RO2 + RO2 self-reaction can form HO2). The nighttime modelling results might also be sensitive to the choice of boundary layer height, which was kept constant at 800 m in the model.
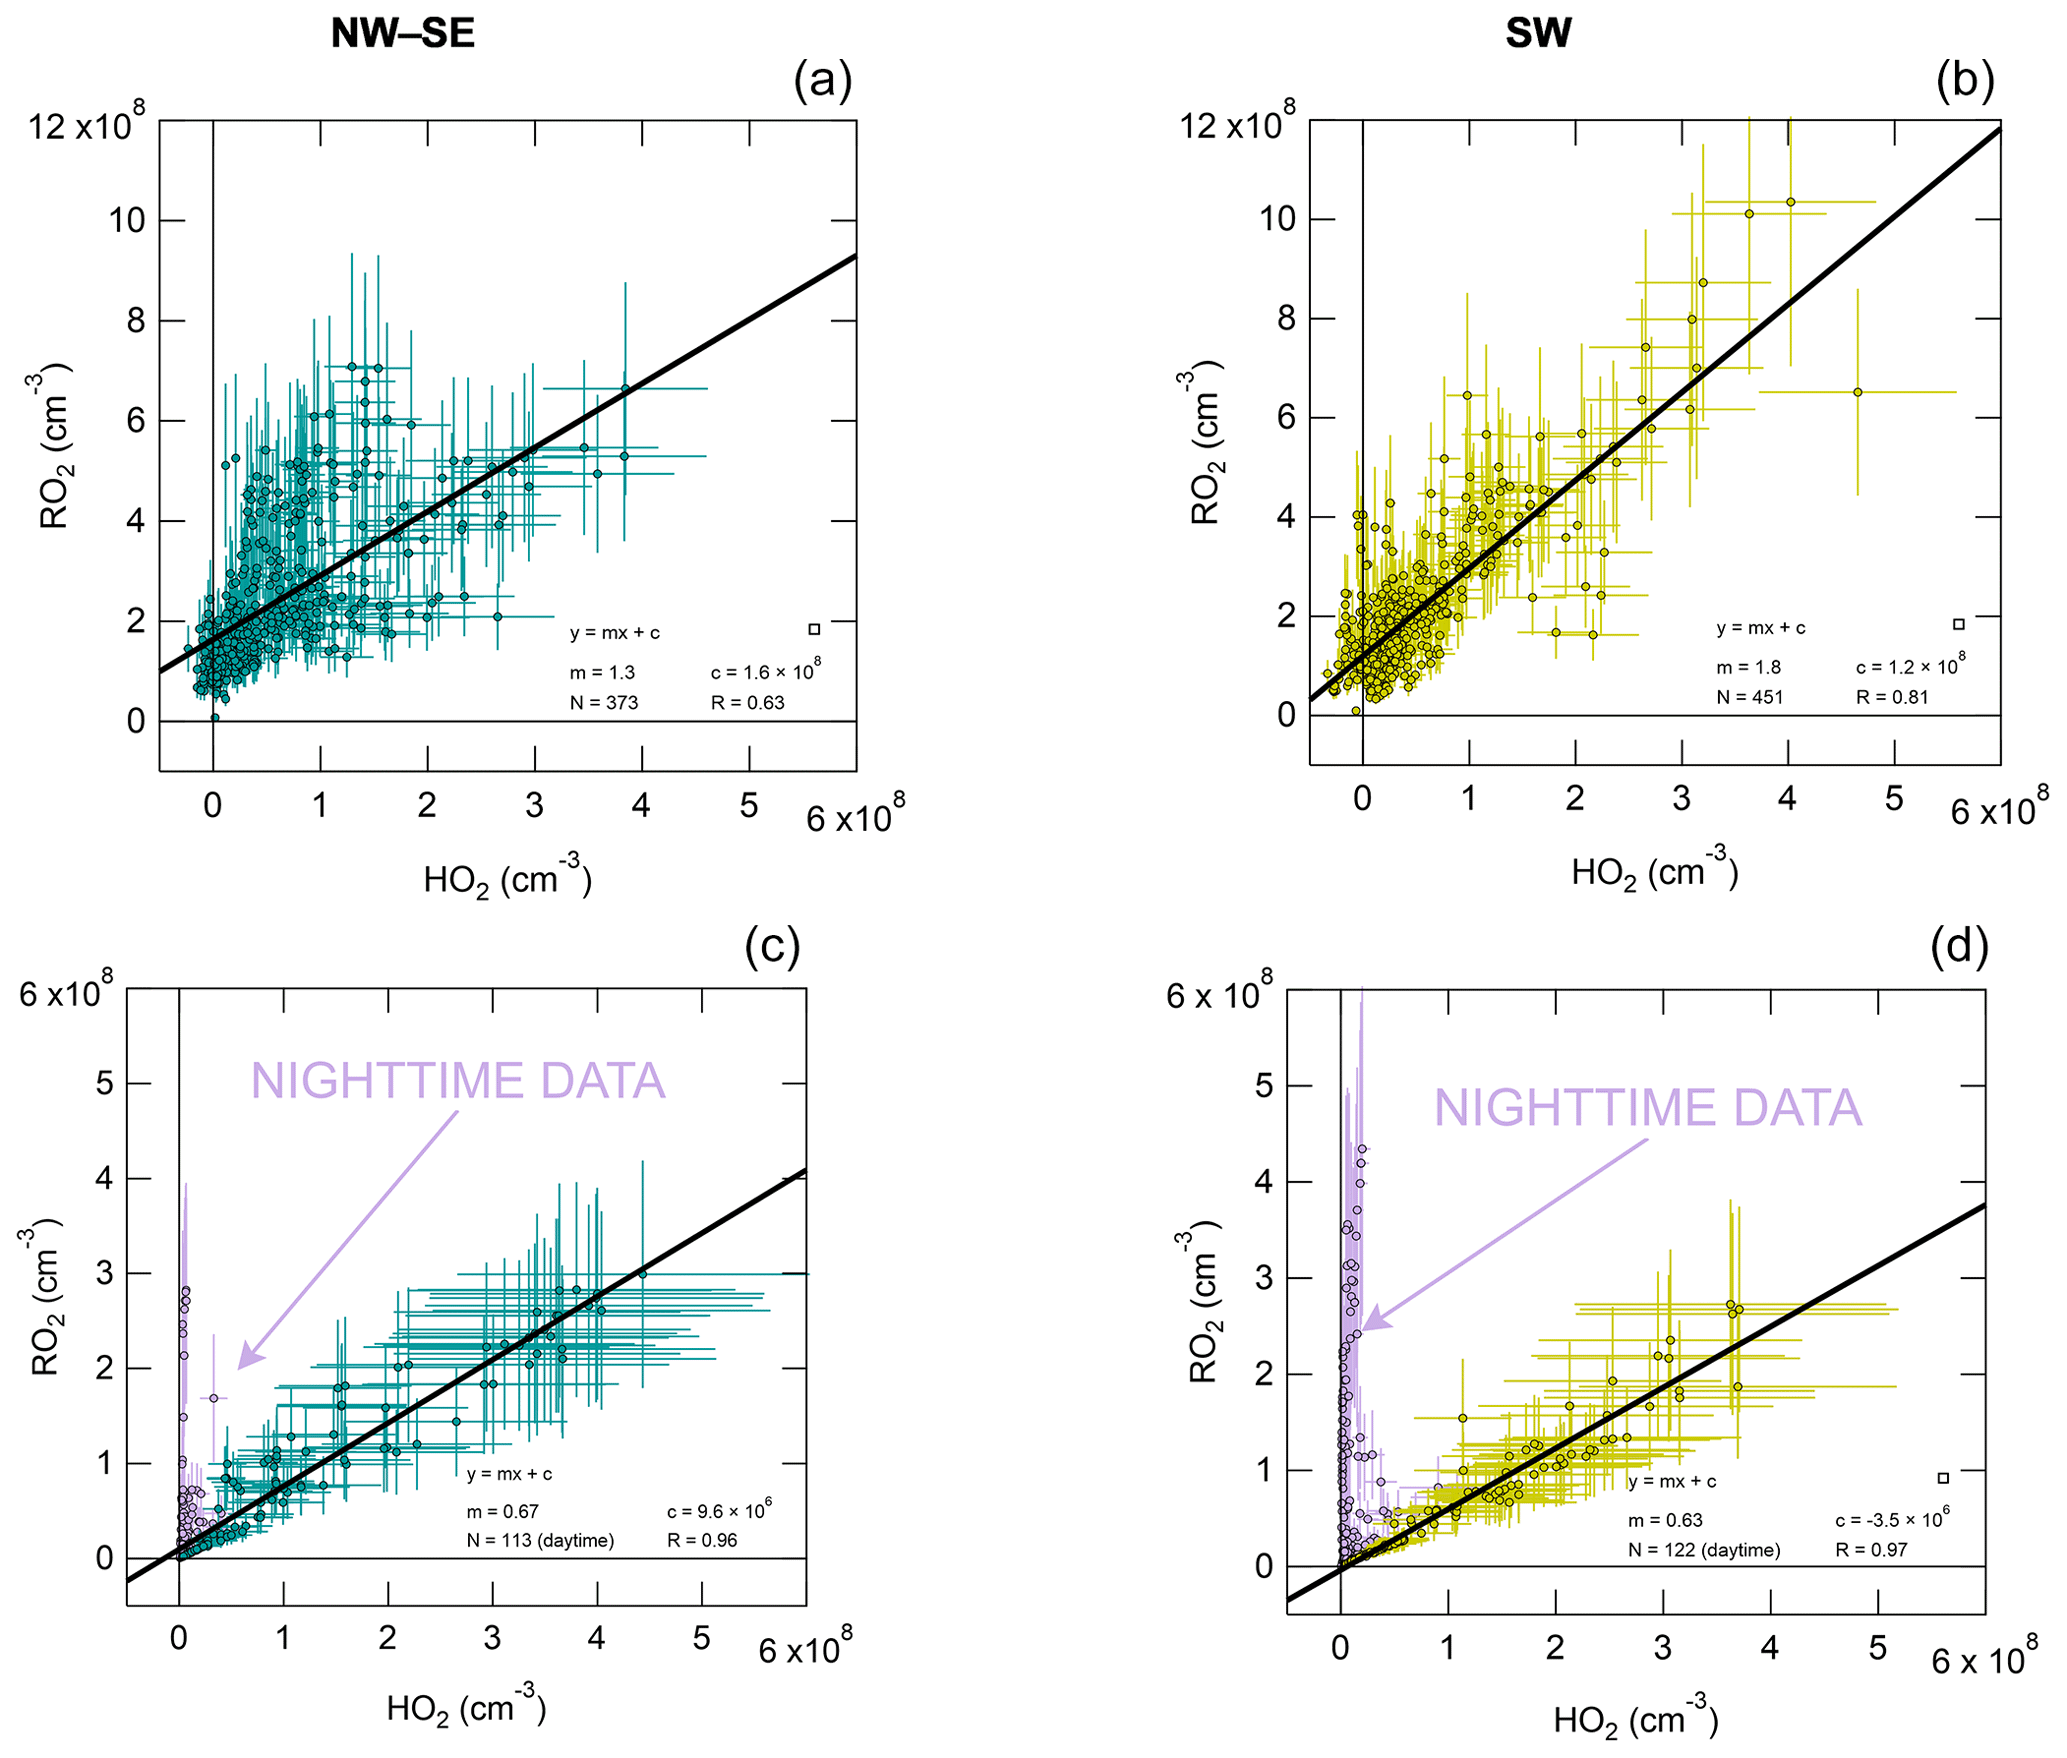
Figure 4Observed total RO2 versus observed HO2 (a, b) and modelled total RO2 versus modelled HO2 (c, d), split according to wind direction (left NW–SE, right SW). Solid black lines correspond to linear least-squares fits. For the model results, nighttime data exhibit a different RO2 versus HO2 slope (not observed in the observations), highlighted in purple; these data were not included in fits.
3.5 Observed and modelled OH, HO2, RO2 and versus NO
Radical levels are known to display a strong dependence on NOx concentrations since radical propagation is promoted by NO, and radical loss is often dominated by the reactions of radicals with NO and NO2. In recent studies utilising the ROxLIF technique, it has become apparent that measurement–model ratios for RO2 are particularly sensitive to NO (Tan et al., 2017, 2018; Whalley et al., 2018; Slater et al., 2020; Whalley et al., 2021), which has implications for the calculation of ozone production rates. The dependence of daytime (J(O1D) > 5 × 10⁻⁷ s−1) radical concentrations and OH reactivity values on NO mixing ratios is shown in Fig. S7, split according to wind direction. For OH only, both measured and modelled concentrations were normalised to the campaign-average J(O1D) to remove the dependence on OH source strength (i.e. OH_Jnorm; e.g. Tan et al., 2017). This approach is justified by the almost linear dependence of OH on J(O1D) (Fig. S6); similar trends were also found for un-normalised OH albeit with more scatter (data not shown).
In NW–SE air, observed OH_Jnorm levels exhibit a classically expected dependence on NO, increasing up to ∼ 100 pptv NO before decreasing at higher NO (Fig. S7). The MCM-base model reproduces the measured trend reasonably well. However, the PSS model significantly underpredicts the observations at low NO, yielding measurement–model ratios of ∼ 2–3 below ∼ 200 pptv NO (Fig. 5), which is greater than the estimated combined measurement–model uncertainty (∼ 50 %). In SW air, measured OH_Jnorm decreases with NO across the full NO range. The PSS model underpredicts the observations more severely at low NO (< 300 pptv), yielding similar measurement–model ratios to those in NW–SE air. The MCM-base model slightly underpredicts the observations at low NO (by up to ∼ 90 %) but there is reasonable agreement (within ∼ 40 %) at moderate to high NO (> 300 pptv).
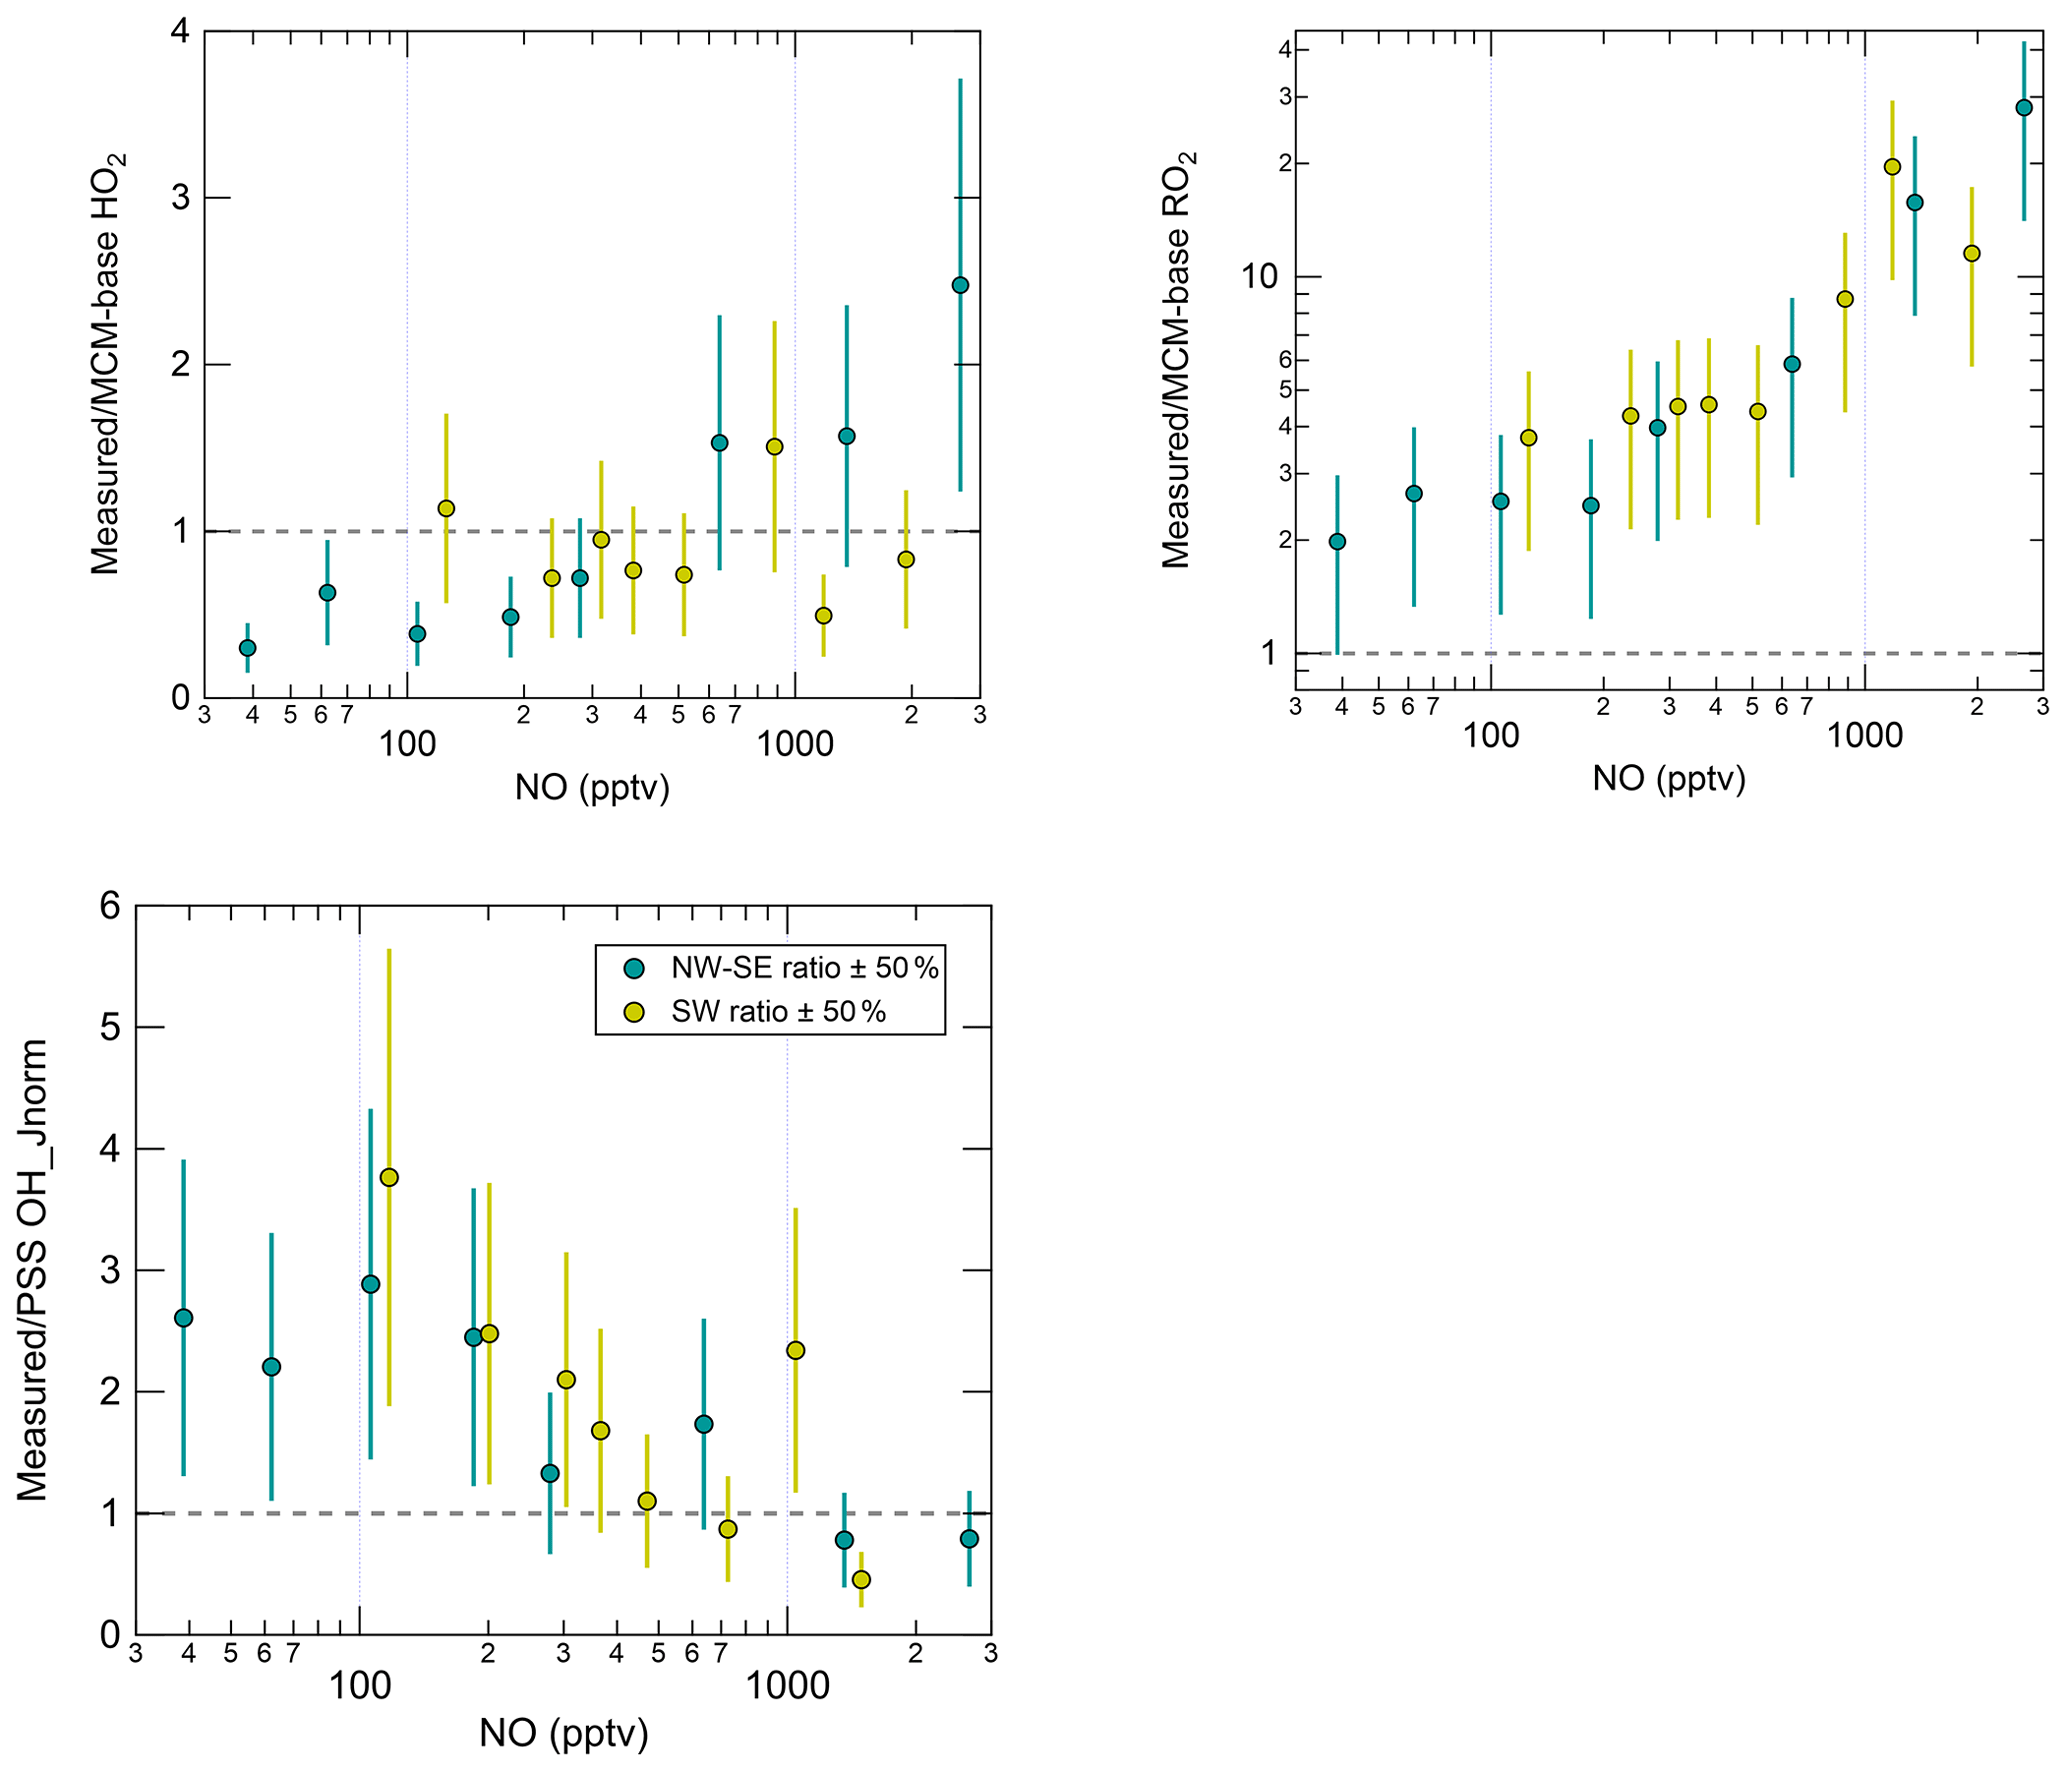
Figure 5NO dependence of the measurement–model ratios for radical species. Error bars correspond to an estimated combined measurement–model error of 50 %. For OH, the reference model is the PSS calculation, and for HO2 and RO2 this is MCM-base. Note the y log scale for RO2.
Measured HO2 in NW–SE air exhibits a weak decreasing trend with NO, with levels of ∼ 0.7–1.3 × 10⁸ molec. cm−3 below ∼ 1 ppbv NO and ∼ 0.3 × 10⁸ molec. cm−3 above this threshold. By contrast, the model dependence on NO is much stronger such that HO2 levels are overpredicted by up to a factor of ∼ 3 at low NO, as seen in previous field campaigns (Sommariva et al., 2004, 2006; Kanaya et al., 2007; Griffith et al., 2013; Whalley et al., 2018). Extremely low NO levels of < 3 pptv were observed during the Southern Ocean Photochemistry Experiment (SOAPEX-2), which took place at Cape Grim in austral summer 1999. HO2 observations were overpredicted by ∼ 40 %, but improved agreement could be found by inclusion of HO2 uptake with an uptake coefficient () of unity (Sommariva et al., 2004). HO2 uptake was considered in the present work, using = 0.1. HO2 measurements were overpredicted by a factor of 2 during NAMBLEX, for which the model analysis was performed for days with low NOx levels (NO < 30 pptv) (Sommariva et al., 2006). Agreement was improved when the model was constrained to measured OVOCs (acetaldehyde, methanol and acetone in the case of NAMBLEX)). Additionally, at Mace Head, seaweed beds are exposed at low tide that represent a significant source of reactive halogen species such as I2 and CH2I2 (Carpenter et al., 1999, 2003; McFiggans et al., 2004). Halogen oxides (XO; where X = Br, I) are able to convert HO2 to OH:
where hypohalous acids (HOX) may also undergo heterogeneous loss to aerosols. In a steady-state analysis, Bloss et al. (2005b) found that up to 40 % of HO2 could be lost to IO under low-NOx conditions, for measured IO levels of 0.8–4.0 pptv (Commane et al., 2011). In the full modelling study (Sommariva et al., 2006), constraining the model to BrO and IO resulted in similar decreases in model HO2, depending on the uptake coefficients used for HOI and HOBr. Reactive iodine species were not measured during ICOZA, and their influence is expected to be negligible due to the lack of seaweed beds at the WAO site. However, it is possible that there was a source of reactive bromine through sea salt aerosol chemistry (Keene et al., 2009). We therefore speculate that inclusion of reactive halogens could simultaneously reduce the underprediction of OH and the overprediction of HO2 under low-NOx conditions in NW–SE air. To our knowledge there have been no measurements of I2, BrO, or IO at the WAO (John Plane, personal communication, 2022).
OH and HO2 were measured at Rishiri Island, Japan, in September 2003 (Kanaya et al., 2007). Daytime HO2 levels were overpredicted by almost a factor of 2. In addition to halogen chemistry and HO2 uptake, the authors also considered the possibility that HO2 + RO2 reactions were faster than previously thought. Increasing the rate of HO2 + RO2 reactions would result in increased RO2 destruction rates, therefore worsening the agreement between RO2 destruction and production rates, which should be in balance. For this reason, we do not think that faster-than-expected HO2 + RO2 reactions are the cause of the overprediction of HO2 levels under low-NOx conditions in NW–SE air during ICOZA. In fact, the value of the rate coefficient for the RO2 + HO2 reaction used in the budget analysis may already be too large, as discussed further in Sect. 3.7 below.
During the Clean air for London (ClearfLo) campaign in summer 2012, HO2 concentrations were overpredicted by a box model using MCMv3.2 by up to a factor of 10 at low NO (< 1 ppbv) (Whalley et al., 2018). The model HO2 was somewhat reduced, but the observations could still not be reconciled after inclusion of both HO2 aerosol uptake (using 1) and autoxidation chemistry (Bianchi et al., 2019), which is now known to play a significant role in the gas-phase oxidation of both BVOCs (e.g. Zha et al., 2017, and references therein) and anthropogenic VOCs (AVOCs) (Mehra et al., 2020, and references therein). Whalley et al. (2018) found that good agreement between the model and HO2 measurements could be found if the rate of RO2 + NO → HO2 propagation was reduced, in their case by increasing the branching ratio for alkyl nitrate formation.
In the highest NO bin, measured HO2 is underpredicted by a factor of ∼ 2. In SW air, both measured and modelled HO2 decrease sharply with NO, from ∼ 2 × 10⁸ molec. cm−3 at ∼ 100 pptv NO to ∼ 0.1–0.3 × 10⁸ molec. cm−3 above 1 ppbv. For this wind direction, the measurements and model results are in agreement across the full NO range.
Overall, measured OH and HO2 are in reasonable agreement with the PSS calculation and the MCM-base model prediction, respectively, at high NO. There is also good agreement between measured and MCM-base OH at moderate to high NO. However, RO2 radicals are significantly underpredicted by the base model across all NO mixing ratios in both NW–SE and SW air. Observed and modelled RO2 concentrations display a constant decrease with NO in either wind sector type. Comparing the two sets of observations, the dependence is steeper in SW air. In both wind sector types, the model NO dependence of RO2 is steeper than the corresponding measurement NO dependence, such that the measurement–model ratio increases from ∼ 2–3 for NO < 100 pptv to ∼ 10–30 for NO > 1 ppbv (Fig. 5). Such discrepancies likely relate to the model underprediction of OH reactivity, the degree of which also scaled with NO (Fig. S7), since this indicates missing RO2 sources from the OH oxidation of missing VOCs. Missing OH reactivity, i.e. the difference between measured and modelled OH reactivity, reached values of ∼ 2–3 s−1 for NO > 1 ppbv or ∼ 30 %–45 % of measured reactivity.
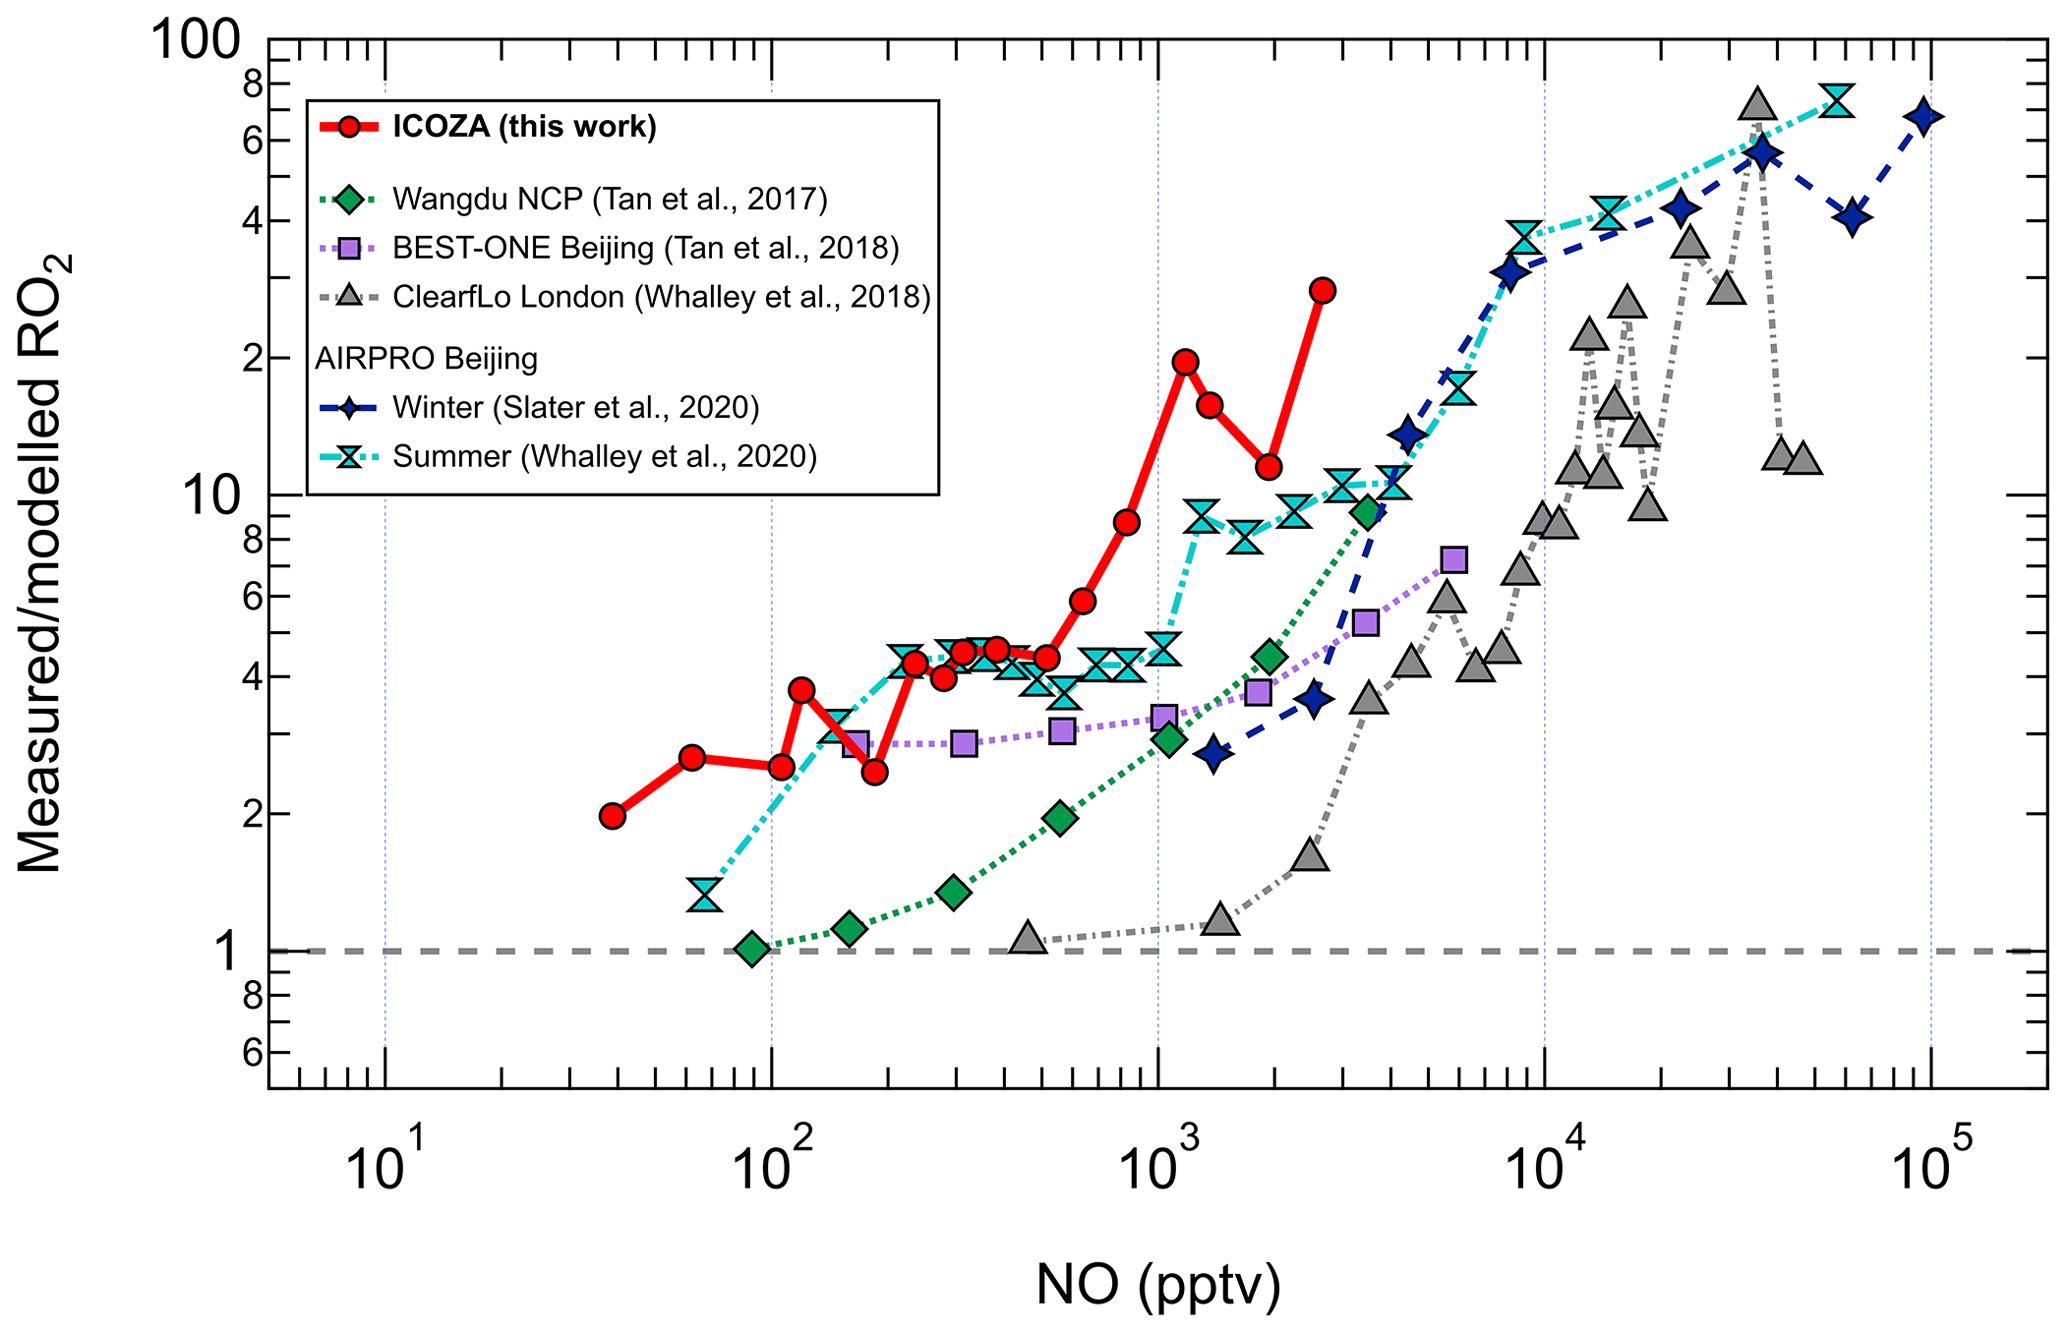
The increasing underprediction of RO2 radicals as NO increases has been seen in all previous field campaigns in which RO2 (distinct from HO2) was measured using the ROxLIF technique (Fuchs et al., 2008; Whalley et al., 2013). RO2 measurement–model ratios as a function of NO from these campaigns (Tan et al., 2017, 2018; Whalley et al., 2018; Slater et al., 2020; Whalley et al., 2021) are compared with ICOZA in Fig. 6. It can be seen that the measurement–model discrepancy starts to appear at lower NO (i.e. < 100 pptv) for ICOZA in comparison to the other campaigns, although the curves for ICOZA and AIRPRO summer display strong overlap in the ∼ 100–600 pptv NO range. There is also some overlap between the curves for ICOZA and BEST-ONE (Tan et al., 2018), a winter campaign conducted at a suburban site near Beijing, at low/moderate NO (∼ 100–200 pptv). Overall, the largest measurement–model ratios were found in London (Whalley et al., 2018) and central Beijing (Slater et al., 2020; Whalley et al., 2021) but at higher NO levels (> 10 ppbv) than those seen in most other campaigns including ICOZA. Tan et al. (2017) found that an additional primary RO2 source from chlorine chemistry could explain a small portion (10 %–20 %) of the missing RO2 in their study. Whalley et al. (2018) found that chlorine chemistry increased modelled RO2 for the ClearfLo campaign by ∼ 20 % in the morning when NOx levels were high, in comparison to RO2 underpredictions of greater than factor of 10. Since the major Cl atom precursor ClNO2 was measured during ICOZA (Sommariva et al., 2018) and constrained in all model scenarios, ClNO2 photolysis to form Cl atoms and the subsequent reactions of Cl with VOCs are not thought to be the source of the missing RO2 in the present study. However, as the chlorine chemistry in MCMv3.3.1 is limited to reactions with alkanes, additional chlorine chemistry (e.g. reactions with alkenes, OVOCs) may be needed to fully assess the role of chlorine during ICOZA.
Since missing OH reactivity was also found at high-NOx conditions, some of the missing RO2 may be due to the reactions of OH with unmeasured VOCs. However, as discussed in Sect. 3.7, evidence is also found for missing RO2 sources at high NOx using calculations constrained to measured OH reactivity. Thus the missing OH reactivity cannot fully explain the missing RO2. It is possible that the missing RO2 found for ICOZA is not due to a missing RO2 source but an overestimated RO2 sink, and this is explored further in Sect. 3.10.
Recently, Whalley et al. (2020) presented measurements of OH, HO2, RO2 and OH reactivity in summertime in Beijing. RO2 concentrations were underpredicted by a box model with MCMv3.3.1 chemistry, most severely at high NOx. Missing OH reactivity was also identified. The measurement–model agreement for RO2 was significantly improved after the model inclusion of an α-pinene-derived RO2 radical, C96O2 (MCM nomenclature), formed at a rate set equal to the level of missing OH reactivity. This complex RO2 species does not generate HO2 directly from its reaction with NO, but instead the RO radical formed preferentially isomerises (via a H shift) to form another RO2 radical in the presence of O2 and undergoes multiple RO2 + NO → R′O2 reactions before eventually forming HO2. Such autoxidation chemistry has the net effect of reducing the rate of RO2 → HO2 propagation and effectively extends the lifetime of RO2 radicals, resulting in higher concentrations. Based on the results in the present work, it is possible that similar chemistry occurred during the ICOZA campaign, although it is unlikely that a BVOC was involved because of the low biogenic influence at the WAO site. However, aromatic species, more relevant to ICOZA, have also been shown to undergo autoxidation (Wang et al., 2017; Mehra et al., 2020). To further explore the RO2 discrepancy found for ICOZA, the contribution of sRO2 to total RO2 is plotted as a function of NO for measurement and model results in Fig. S8. For the measurements, the sRO2 contribution increases with NO in both NW–SE and SW air from ∼ 0.7 to values close to 1. In contrast, the model predicts a constant sRO2 fraction of ∼ 0.7, in accordance with the dominance of CH3O2 (Fig. S5). The reasons for the strong dependence of the measured sRO2 fraction on NO are unclear but may be due to the NO-mediated propagation of cRO2 to sRO2 as VOCs are increasingly fragmented into smaller and less complex RO2 species. Alternatively, cRO2 formation may be facilitated by low NOx levels, e.g. due to autoxidation chemistry (Crounse et al., 2013; Jokinen et al., 2014; Bianchi et al., 2019).
3.6 Missing versus OVOCs and temperature
Missing OH reactivity has been found in many previous field studies in which OH reactivity was measured and compared to calculated reactivity or model simulations (Kovacs et al., 2003; Ren et al., 2003; Di Carlo et al., 2004; Sinha et al., 2008; Lee et al., 2009b; Lou et al., 2010; Mao et al., 2012; Nolscher et al., 2012; Edwards et al., 2013; Brune et al., 2016; Whalley et al., 2016; Kumar et al., 2018). Missing OH reactivity is normally attributed to either unmeasured primary VOCs (e.g. BVOCs) or unmeasured VOC oxidation products (i.e. OVOCs). To test which was responsible for the missing reactivity observed for ICOZA, missing OH reactivity (measured–modelled) was binned against various chemical concentrations and temperature. These data are shown in Fig. S9. It can be seen that missing reactivity exhibits strong correlations (R2 ≥ 0.83) with several measured OVOCs, such as acetaldehyde, acetone and methanol (all constrained in MCM-base). This finding suggests that the missing reactivity is due to unmeasured VOC oxidation products that were not well simulated by the base model. The only OVOCs measured and constrained in the base model were acetone, acetaldehyde and methanol, and as such many OVOCs were missing, e.g. the oxidation products of > C2 VOCs. Weaker correlations (R2 ≤ 0.7) were found for isoprene (maximum = 418 pptv) and the PTR-MS measured sum of monoterpenes (maximum = 105 pptv), such that unmeasured primary BVOCs are unlikely to be the root of the missing reactivity. BVOC emissions are known to display an exponential dependence on temperature (Guenther et al., 1993). It is therefore expected that missing reactivity should scale exponentially with temperature if missing biogenic species are responsible (Di Carlo et al., 2004). As shown in Fig. S9, this was not the case for ICOZA, and the dependence is clearly linear, albeit over a relatively small temperature range of ∼ 12–24 ∘C. This is further evidence that the missing reactivity for ICOZA is due to OVOCs, not a primary biogenic species. It is hypothesised that the correlation with temperature is due to increased VOC oxidation rates at high temperature that results in greater OVOC production. Missing reactivity is also reasonably well correlated with toluene (R2= 0.84, data not shown), such that unmeasured aromatic VOCs could also be responsible, as suggested by Lee et al. (2009b).
When missing OH reactivity is calculated using the MCM-carb model, which is additionally constrained to measured HCHO and MVK + MACR, all the correlations in Fig. S9 remain (R2 ≥ 0.83), with the exception of temperature (R2= 0.61). Therefore, species other than HCHO and MVK + MACR must be responsible for the missing OH reactivity. In recent years, OVOC emissions have increased in importance in the UK, with ethanol now the largest contributor to non-methane VOCs in terms of mass emissions (Lewis et al., 2020). More generally, alcohols are now the largest contributors to ozone production (∼ 30 %) in terms of their photochemical ozone creation potentials (POCPs). It is therefore critical that in future field campaigns, alcohols such as ethanol and isopropanol are measured to evaluate their impacts on radical budgets and ozone production.
3.7 Experimental radical budget balance
3.7.1 Budget for total ROx
Figure 7 shows median diel profiles of the rates of ROx production and destruction calculated using Eqs. (1)–(2), split according to wind direction. In NW–SE air, which was encountered for ∼ 40 % of the data, both P(ROx) and D(ROx) peak at ∼ 0.7–0.8 ppbv h−1 around 12:00 UTC with a fairly symmetrical profile either side of midday (solar noon ∼ 12:00 UTC based on cloud-free days). Within uncertainty, P(ROx) and D(ROx) are equal for much of the day, indicating budget closure, apart from around midnight. In SW air (∼ 60 % of the data), P(ROx) and D(ROx) peak at ∼ 1.2–1.4 ppbv h−1 around 10:00 UTC, where D(ROx) displays a broader profile than that in NW–SE air. P(ROx) is always smaller than D(ROx) but greater than the measurement uncertainty in the hours 06:00–09:00 UTC, late afternoon and evening, suggesting missing ROx sources in SW air on the order of ∼ 0.2–0.6 ppbv h−1 at these times. Alternatively, the rate coefficient for RO2 + HO2 used in the budget analysis may be too large for the mix of RO2 present at the WAO. Since NO3 + VOC reactions were omitted from the budget analysis, it is suggested that NO3 radical reactions, acting as a net ROx source, would likely reduce the gap between P(ROx) and D(ROx) at night.
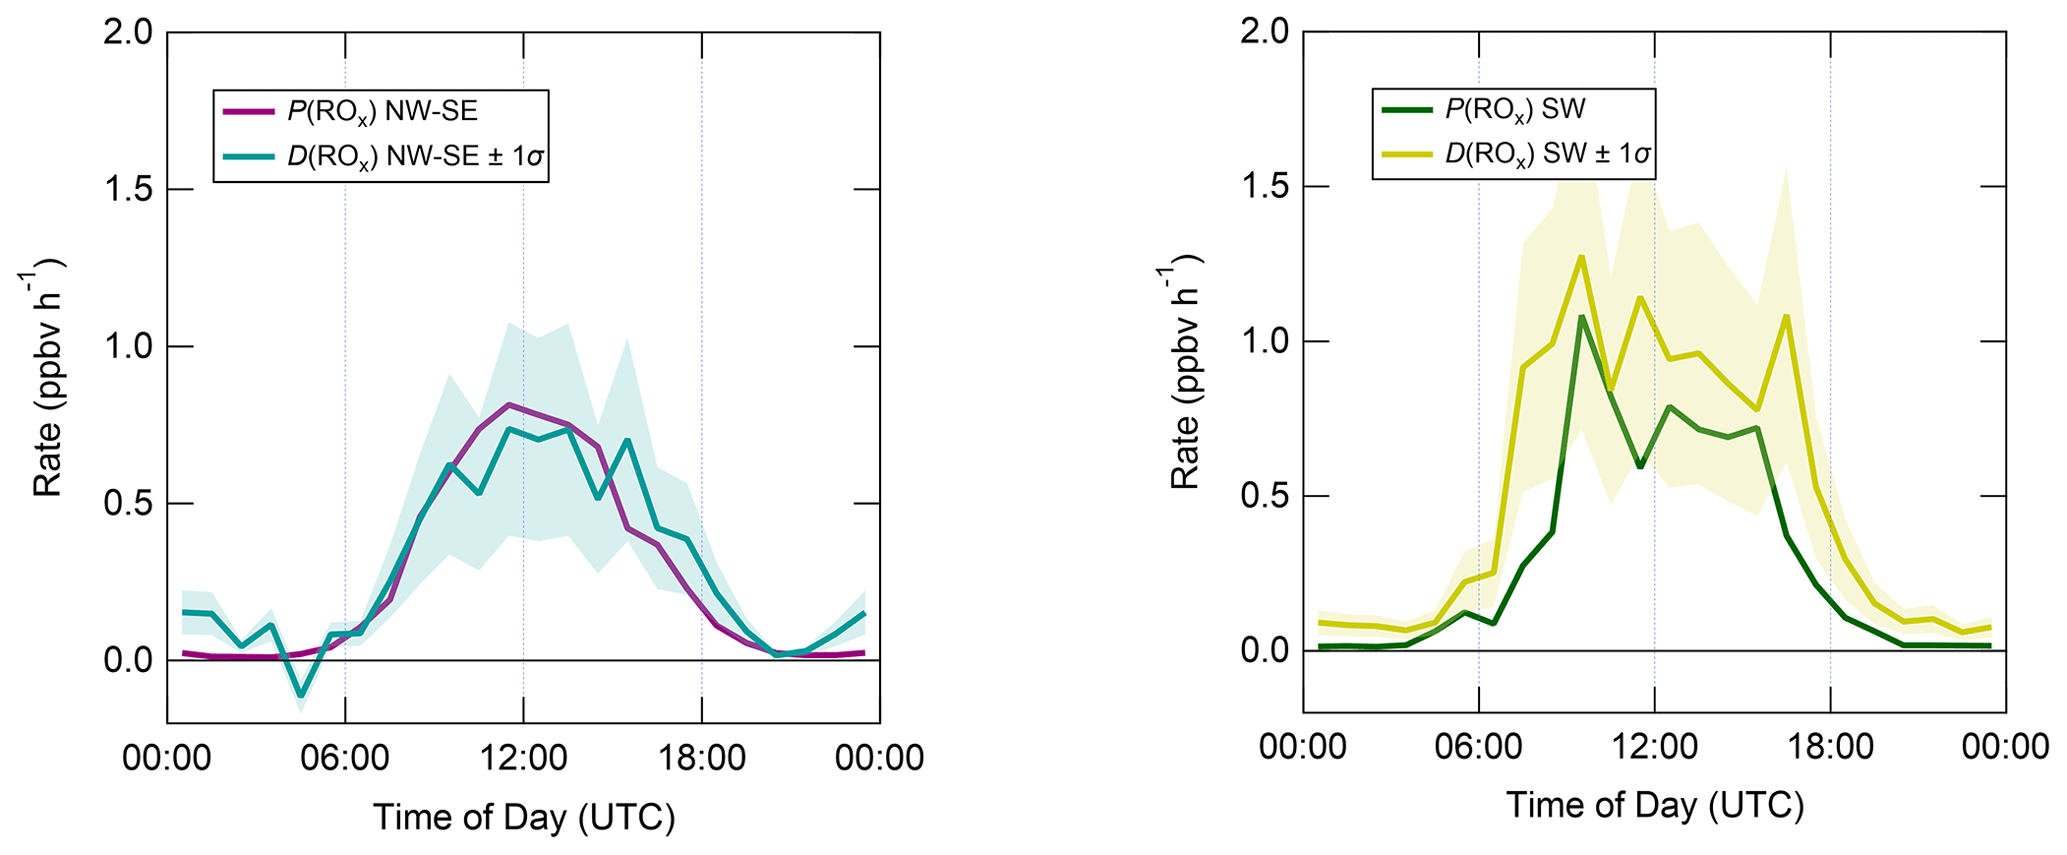
Figure 7Median diel profiles of ROx production and destruction, split according to wind direction (NW–SE = < 165 and > 285∘; SW = 180–270∘). Shaded area on D(ROx) corresponds to the estimated 1σ uncertainty of 35 % (derived from calibration accuracy and reproducibility), not shown for P(ROx) for clarity.
3.7.2 Budget for OH
Figure 8 displays median diel profiles of OH rates of production and destruction calculated using Eqs. (3) and (6). In contrast to the ROx budget, in which rates of production and destruction were in balance for most of the 24 h diel cycle in NW–SE air, P(OH) is almost always smaller than D(OH) in NW–SE air, which, since D(OH) is calculated directly from measured OH reactivity, indicates missing OH sources of up to ∼ 2–3 ppbv h−1. In addition, D(OH) exhibits two diel peaks at ∼ 10:00 UTC (∼ 2.5 ppbv h−1) and ∼ 16:00 UTC (∼ 3.5 ppbv h−1), whereas P(OH) peaks only once at ∼ 1.5 ppbv h−1 in the morning and then decreases through midday and over the course of the afternoon. It should be noted that the peak at ∼ 16:00 UTC is the 1 h median of many 15 min data points, corresponding to different days, and is not driven by a single high value in the averaging. In SW air, OH rates of production and destruction are reasonably well balanced throughout the day, with P(OH) slightly smaller than D(OH) by ∼ 0.2 ppbv h−1 on average, but differences of up to ∼ 1 ppbv h−1 (∼ 14:00 UTC) can be seen.
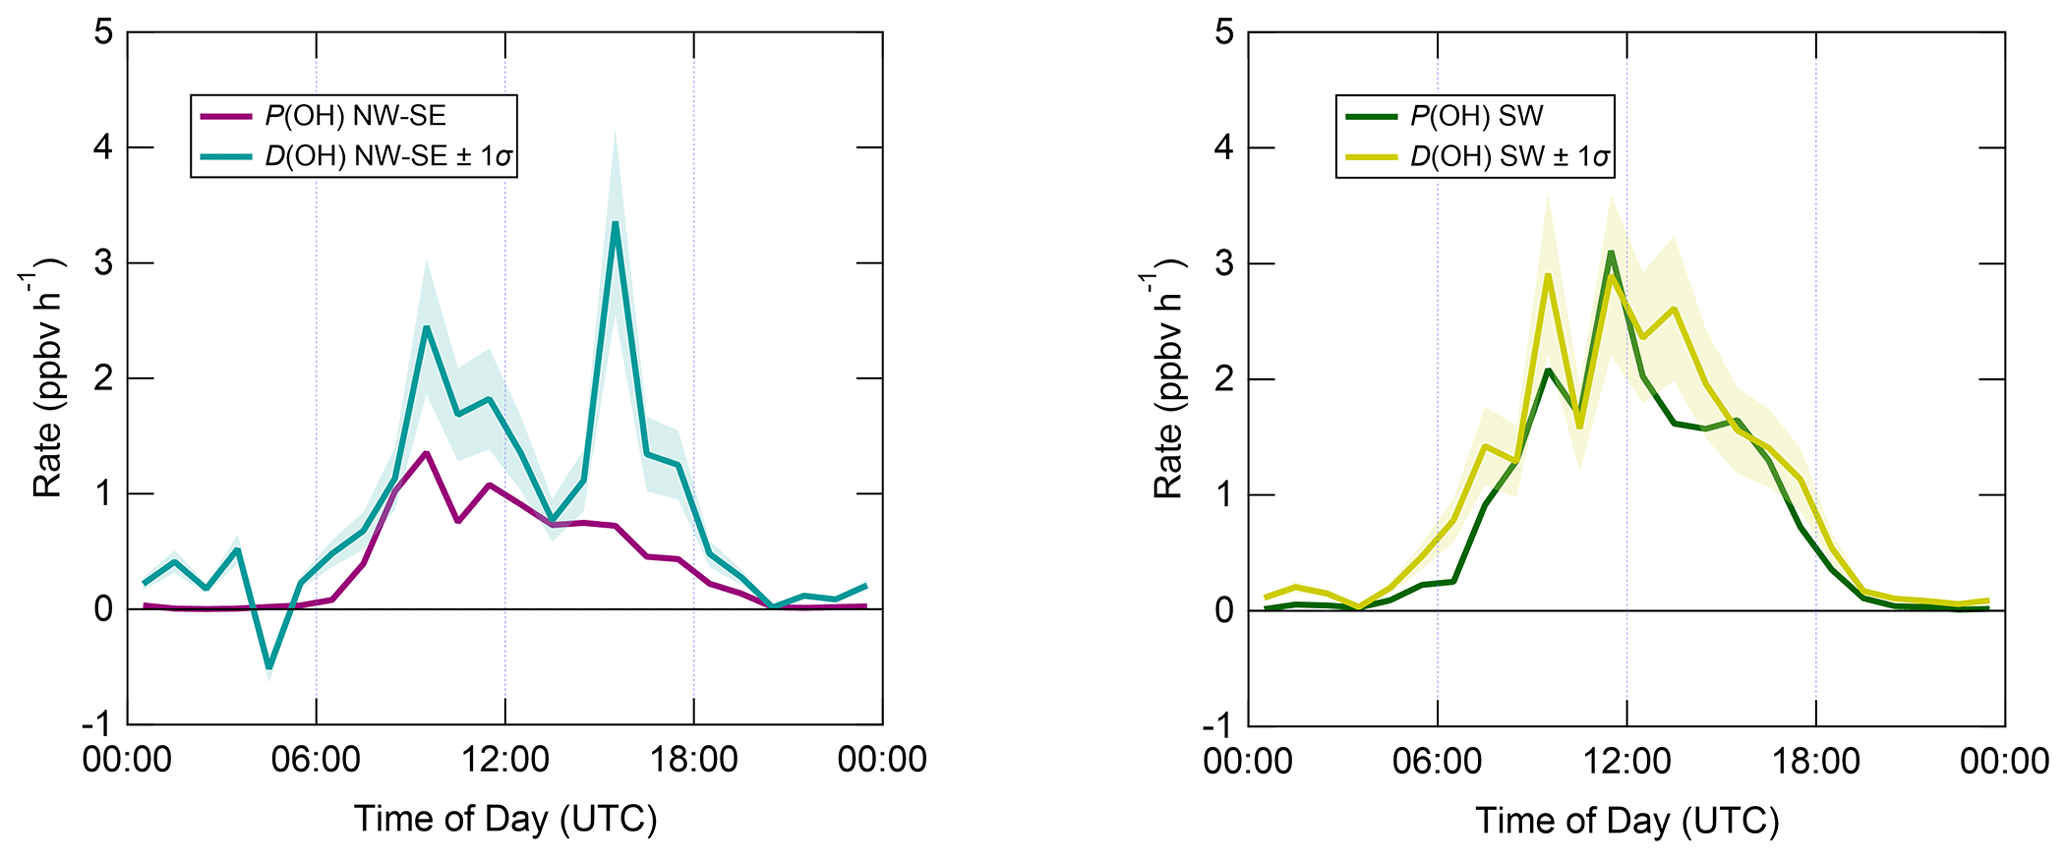
Figure 8Median diel profiles of OH production and destruction, split according to wind direction. Shaded area on D(OH) corresponds to the estimated 1σ uncertainty of 24 %, not shown for P(OH) for clarity.
3.7.3 Budget for HO2
In contrast to the ROx and OH budgets, the HO2 budgets calculated using Eqs. (7) and (8) (Fig. 9) are out of balance throughout the daytime in both NW–SE and SW air, with HO2 rates of production greatly exceeding rates of destruction by up to an order of magnitude in the morning. P(HO2) peaks around ∼ 10:00 UTC at ∼ 8 and ∼ 14 ppbv h−1 in NW–SE and SW air, respectively. At this time, known HO2 sinks amount only to ∼ 1 ppbv h−1. D(HO2) reaches diel maxima of only ∼ 1 and ∼ 2 ppbv h−1 in NW–SE and SW air, respectively. The imbalance between P(HO2) and D(HO2) cannot be accounted for by the measurement uncertainty in D(HO2) of ∼ 44 % (derived from calibration accuracy and reproducibility) and would imply the very rapid build-up of HO2 to multi-ppbv levels, which was not observed.
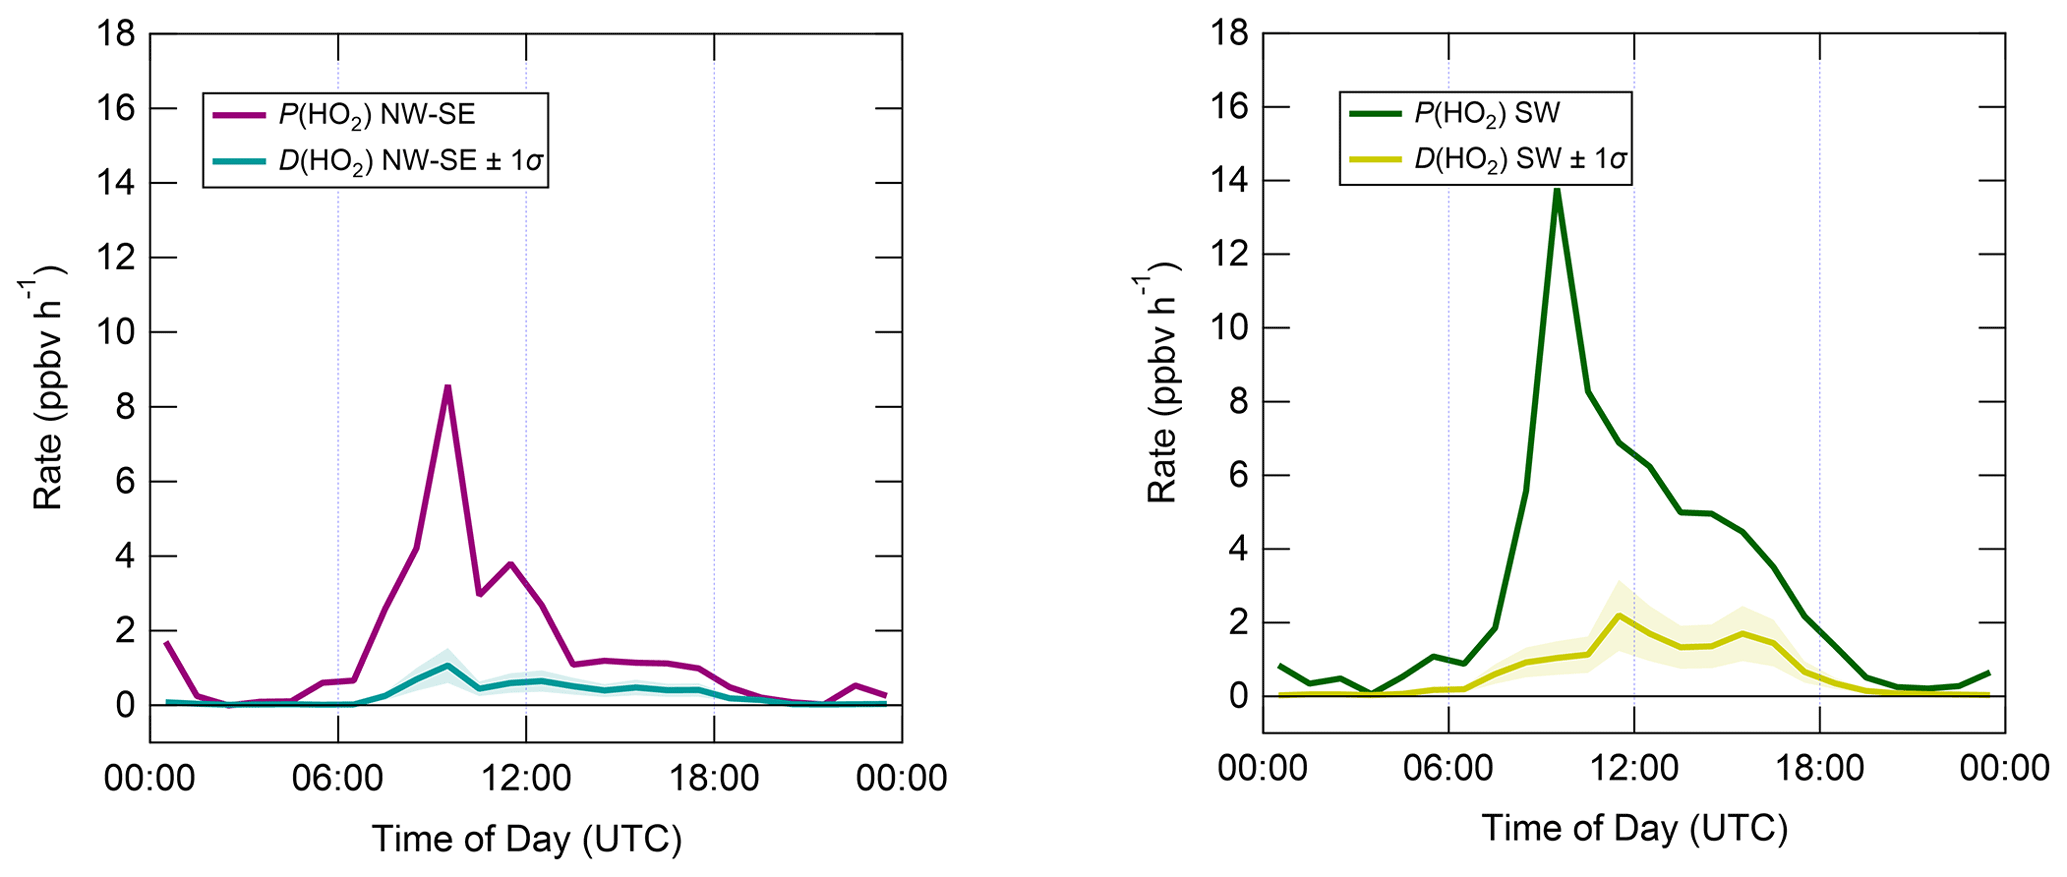
Figure 9Median diel profiles of HO2 production and destruction, split according to wind direction. Shaded area on D(HO2) corresponds to the estimated 1σ uncertainty of 32 %, not shown for P(HO2) for clarity.
3.7.4 Budget for RO2
The diel profiles of RO2 rates of production and destruction calculated using Eqs. (7)–(10) (Fig. 10) bear close resemblance to those of HO2 but with opposite sign imbalances; i.e. for RO2, destruction greatly exceeds known production processes. In NW–SE air, D(RO2) peaks at ∼ 7 ppbv h−1 around ∼ 10:00 UTC, at which time known RO2 sources amount to only ∼ 0.6 ppbv h−1. Maximum P(RO2) occurs around midday at almost 1 ppbv h−1, which is a factor of 3 slower than D(RO2) at the same time. RO2 destruction is even faster in SW air, reaching ∼ 13 ppbv h−1 around 09:00–10:00 UTC, at which time P(RO2) is only ∼ 0.6–1.5 ppbv h−1. RO2 production rates were almost twice as fast in SW air compared to NW–SE air, with a diel maximum of ∼ 2 ppbv h−1 around ∼ 14:00 UTC.
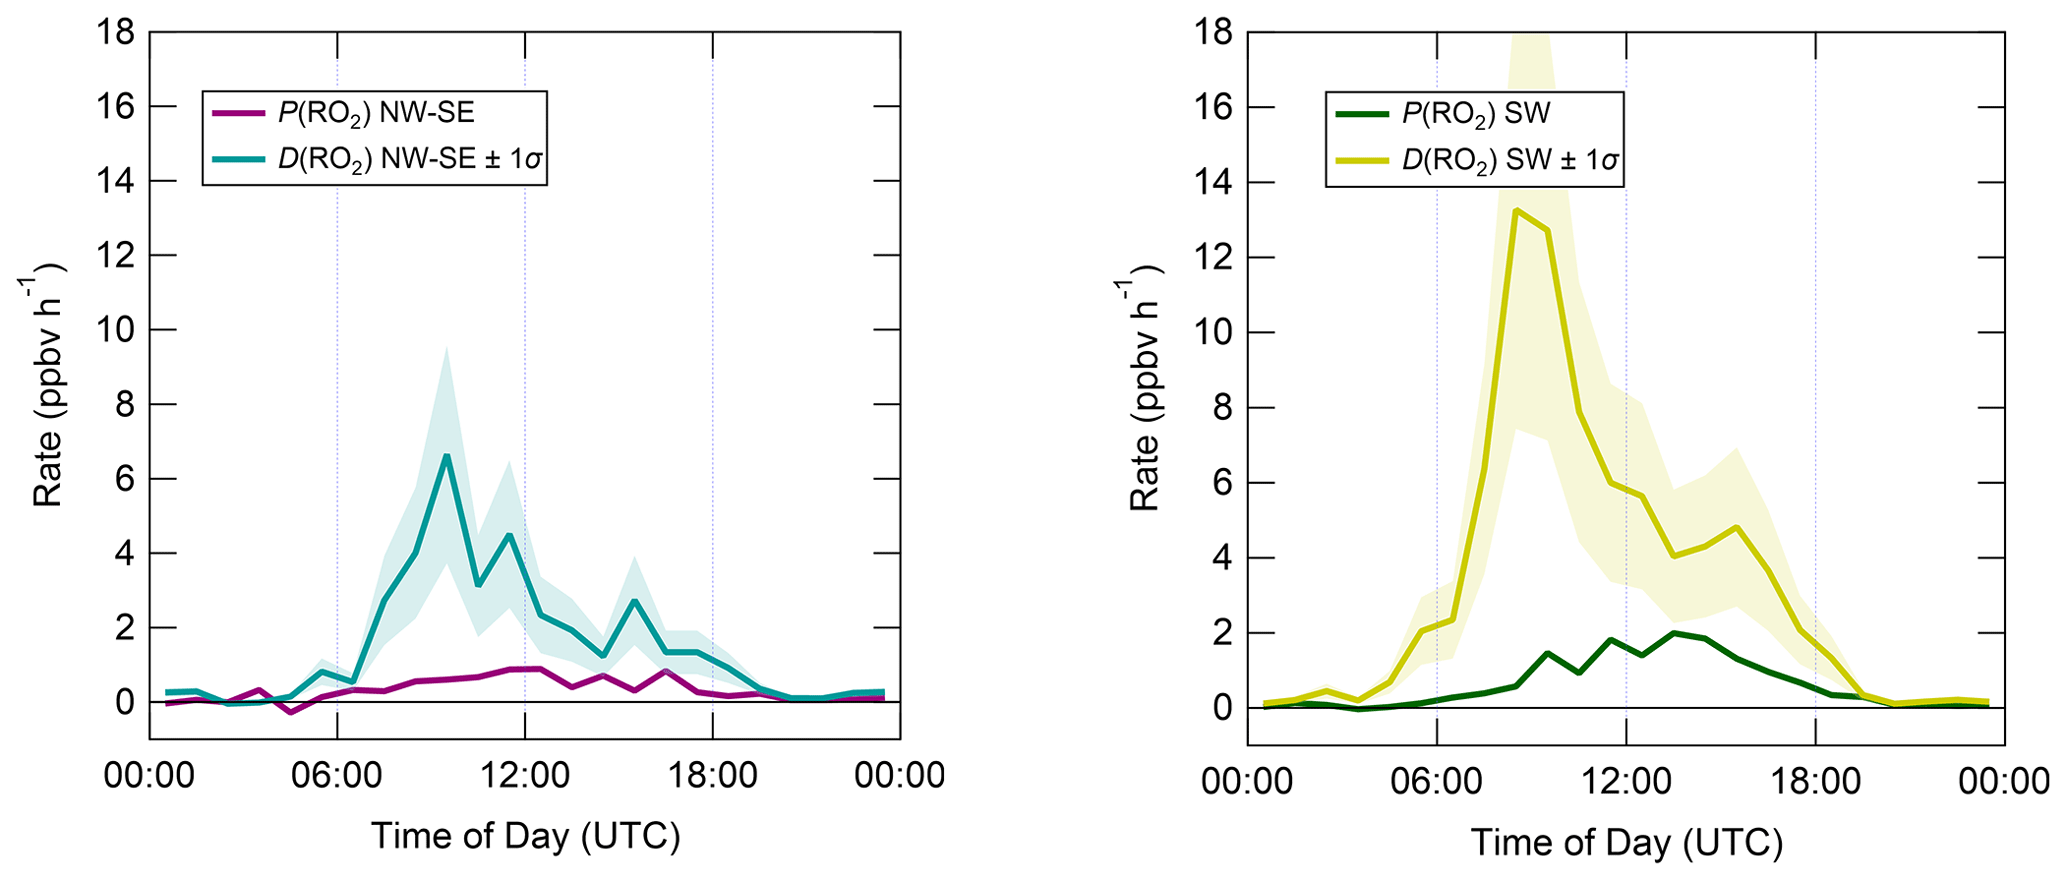
Figure 10Median diel profiles of RO2 production and destruction, split according to wind direction. Shaded area on D(RO2) corresponds to the estimated 1σ uncertainty of 32 %, not shown for P(RO2) for clarity.
3.8 Dependencies of radical budgets upon NO mixing ratios
To summarise thus far, in NW–SE air during daytime the total ROx budget is balanced but OH is missing a source, and HO2 production rates greatly exceed HO2 destruction rates, while the opposite is true for RO2. In SW air, evidence for missing ROx sources is found in the morning and late afternoon, while the daytime OH budget is balanced, and the same problems with the HO2 and RO2 budgets in NW–SE air are also found (i.e. calculated RO2 → HO2 conversion is perhaps too fast in both wind sectors).
As radical levels and measurement–model ratios are strongly dependent on NO mixing ratios, it is expected that the budget imbalances may also have been influenced by NO. As shown in Fig. S10, this was indeed the case, with the difference between the rate of destruction and the rate of production displaying a strong dependence on NO for ROx, HO2 and RO2.
D(ROx)–P(ROx) increases with NO in NW–SE air, from virtually zero (i.e. budget balance) at < 600 pptv NO to almost 1 ppbv h−1 at ∼ 2000–3000 pptv NO. This suggests missing ROx sources and/or overestimated ROx loss rates under high-NOx conditions. However, in SW air, the difference between destruction and production rates exhibits a U-shaped dependence on NO. D(ROx)–P(ROx) is ∼ 1 ppbv h−1 at ∼ 100–200 pptv NO, is scattered around zero in the ∼ 300–600 pptv NO region and increases again to ∼ 0.5 ppbv h−1 at 1000–2000 pptv NO. This may suggest that in SW air, the radical chemistry is well understood at moderate NOx but that there are missing ROx sources and/or overestimated ROx loss rates at both low and high NOx. At low NOx, the choice of the rate coefficient used for the RO2 + HO2 reaction may be too high, causing D(ROx) to be greater than P(ROx). It is unclear why the budget is balanced at low NOx in NW–SE air but not SW air, but this may relate to differences in VOC composition between the two wind sectors.
For OH, the rate of destruction minus the rate of production does not exhibit any obvious trend with NO level, with values of ∼ 0–2 ppbv h−1 across the entirety of NO space encountered during ICOZA, in both NW–SE and SW air. Since D(OH) is constrained by measured OH reactivity, this suggests the presence of missing OH sources, which are independent of NO. One possibility is that OH radicals were formed from the reactions of HO2 or RO2 with species other than NO, discussed in further detail in Sect. 3.10. Although this contrasts with the lack of NO dependence found for D(OH)–P(OH), their ratios D(OH) P(OH) do show a decreasing trend with NO as shown in Figs. 5 and S7, consistent with the presence of missing OH sources under low NOx conditions.
For the HO2 and RO2 budgets, the NO trends are the same in NW–SE and SW air. D(HO2)–P(HO2) is close to zero at low NO but becomes more negative with increasing NO, reaching −(12–15) ppbv h−1 at > 1000 pptv NO. Similarly, for RO2, the budget is closed at low NO but D(RO2)–P(RO2) reaches up to +(13–16) ppbv h−1 at high NO. Thus, the HO2 and RO2 budget balances show virtually the same trends with NO in magnitude but with opposite sign. This is strong evidence that the rate of RO2 → HO2 propagation has been substantially overestimated and is discussed in further detail in Sect. 3.10.
The results of our work may be compared to those of Tan et al. (2019), who first used the experimental budget approach for a campaign in the Pearl River Delta (PRD), China. Pollution levels were much higher during the PRD campaign compared to those encountered at the WAO – for example much greater OH reactivities of up to 80 s−1 were measured (cf. 18 s−1 for ICOZA), and NO mixing ratios were higher (diurnal maximum of ∼ 4 ppbv versus ∼ 0.8–1.4 ppbv for ICOZA). Despite this, measured radical concentrations were fairly similar, with maximum diel median concentrations of 4.5 × 10⁶ molec. cm−3 for OH (cf. 2–4 × 10⁶ molec. cm−3 during ICOZA), 3 × 10⁸ molec. cm−3 for HO2 (cf. 1–1.5 × 10⁸ molec. cm−3) and 2 × 10⁸ molec. cm−3 for RO2 (cf. ∼ 5 × 10⁸ molec. cm−3). In the PRD, maximum loss rates for OH, HO2 and RO2 reached up to 10–15 ppbv h−1, similar to the loss rates observed for RO2 in SW air during ICOZA (Fig. 10). The loss rate of total ROx peaked at midday at ∼ 3 ppbv h−1, compared with ∼ 0.8–1.2 ppbv h−1 for ICOZA (Fig. 7), where the difference is likely due to the higher pollution levels found in the PRD (i.e. increased radical loss to NOx). Within experimental uncertainties, the ROx budget was balanced, similar to that observed for ICOZA. Evidence for a missing afternoon OH source was presented (with an inferred source strength of 4–6 ppbv h−1), which was also the case for NW–SE air during ICOZA (up to ∼ 2 ppbv h−1; Fig. 8). However, in the PRD, the HO2 budget was closed within experimental uncertainty, and the closure of the RO2 budget could be greatly improved when the rate of RO2 production was calculated from measured OH reactivity, although a missing afternoon RO2 sink was still present. This is in contrast to our results, from which a significant missing HO2 sink (Fig. 9) and a missing RO2 source (Fig. 10) on the order of 10 ppbv h−1 may be inferred. In the PRD, the strongest differences between calculated RO2 production and destruction rates were found at low NO (< 1 ppbv), with budget closure at high NO. However, during ICOZA, the difference between RO2 (and HO2) production and destruction rates was most severe at high NO (Fig. S10).
More recently, Whalley et al. (2020) also assessed the experimental radical budget for ROx and OH reactivity observations made in summertime Beijing. A missing OH source was identified under the low-NO conditions (< 0.5 ppbv) experienced in the afternoon, similar to that for ICOZA NW–SE air but with a much higher inferred source strength on the order of ∼ 15 ppbv h−1. Identical to ICOZA, their budget analysis indicated that the HO2 and RO2 budgets were both out of balance but with opposite sign, where the ratios of production to destruction rates displayed a strong dependence on NO concentration; under the highest-NO conditions (∼ 100 ppbv), P(HO2) exceeded D(HO2) by ∼ 50 ppbv h−1 (cf. ∼ 10–15 ppbv h−1 for ICOZA at ∼ 2 ppbv NO), whilst D(RO2) exceeded P(RO2) by the same magnitude. The agreement between experimental production and destruction rates for HO2 and RO2 was much improved after reducing the rate of RO2 → HO2 propagation (by reducing α from 0.95 to 0.10), similar to our approach of reducing the RO2 + NO rate coefficient (Fig. S11). Whalley et al. (2020) suggested that some complex RO2 species (e.g. from BVOC or aromatic VOC oxidation) do not directly generate HO2 after reaction with NO, but instead the RO radicals formed autoxidise (via H shifts) to form new RO2 species that undergo further reaction with NO before eventually forming HO2. This type of chemistry serves to reduce the rate of RO2 → HO2 propagation and could help to explain the differences between experimental production and destruction rates of HO2 and RO2 found for ICOZA.
3.9 Radical sources and sinks
3.9.1 ROx initiation and termination
Figure S15 in the Supplement shows a time series of the experimentally determined radical budgets for the ICOZA campaign, which demonstrates the variability of the total rate of production and the total rate of destruction for OH, HO2, RO2 and ROx (i.e. the sum of OH, HO2 and RO2). Figure 11 displays average diel profiles of the contributions of known ROx sources and sinks, split according to wind direction. Table 2 summarises these data by presenting the median daytime (defined as J(O1D) > 5 × 10⁻⁷) percentage contributions of individual ROx sources and sinks in NW–SE and SW air. In NW–SE air, ROx initiation had roughly equal contributions from O1D + H2O and HONO photolysis (∼ 37 %) on average, where HONO photolysis dominated ROx initiation in the early morning (∼ 05:00–08:00 UTC) but was less important over the rest of the day. In contrast, HONO photolysis was dominant (median 44 % versus 29 % for O1D + H2O) in the more polluted SW air throughout the day. This might be expected based on the mixing ratios of HONO in each wind sector type, with median values of 52 and 97 pptv in NW–SE and SW air, respectively. The contributions from carbonyl (HCHO, acetaldehyde and acetone) photolysis (∼ 23 %–25 %) and ozonolysis (∼ 3 %) were about the same in each wind sector type.
Table 2Median daytime (defined as J(O1D) > 5 × 10⁻⁷ s−1, approximately 06:00–18:00 UTC) ROx source and sink contributions, split according to wind direction (NW–SE = < 165 and > 285∘; SW = 180–270∘).
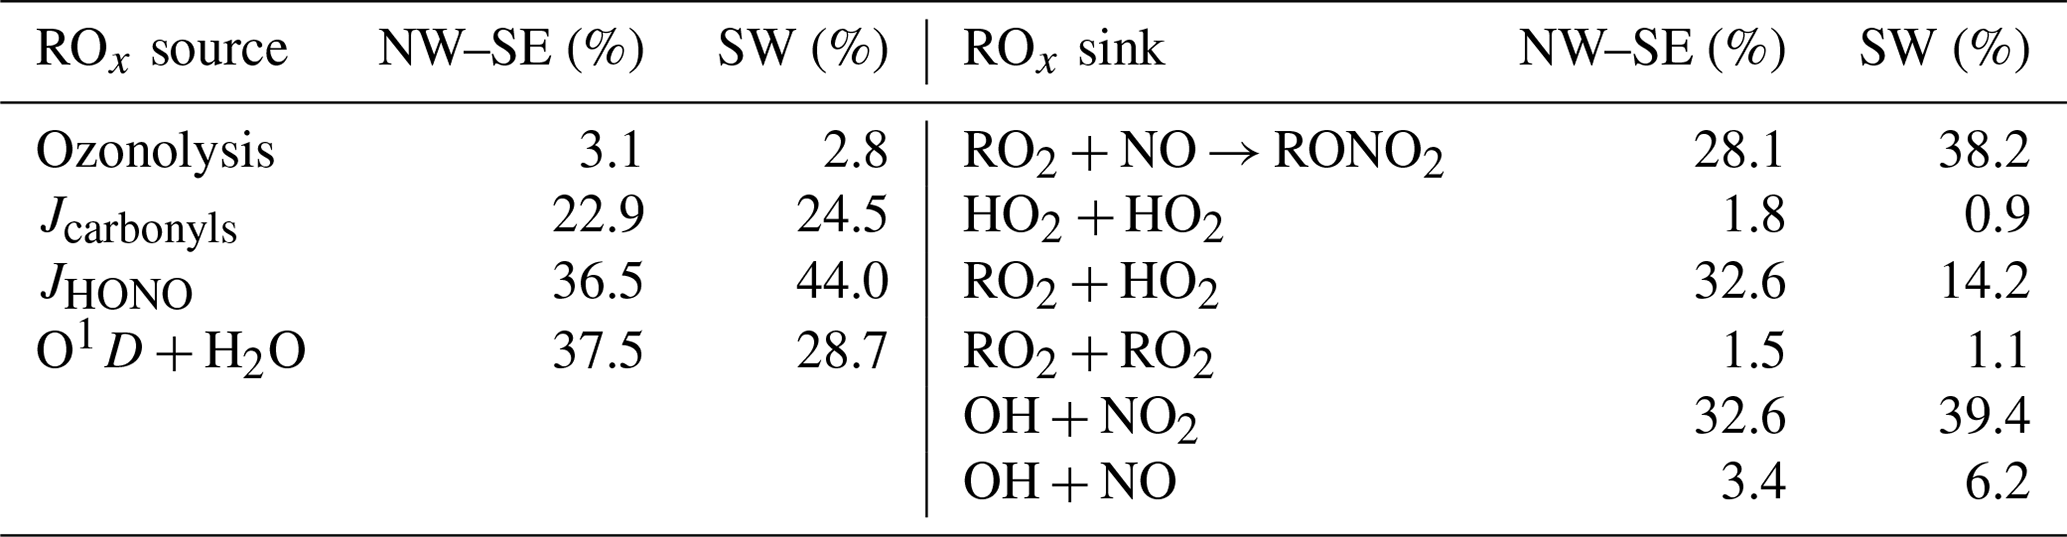
In terms of ROx termination, the main contributors in both wind sector types were calculated to be alkyl nitrate formation, RO2 + HO2 reactions and the reaction of OH with NO2 to yield HNO3. In NW–SE air, these three loss processes were of equal importance on average (∼ 30 %), with alkyl nitrate formation dominant around ∼ 09:00 UTC and RO2 + HO2 reactions dominant in the afternoon. The contributions from HO2 + HO2, RO2 + RO2 and OH + NO were all small on average (< 4 %). The contributions from alkyl nitrate and HNO3 formation were greater in SW air (almost 40 % on average), whereas RO2 + HO2 reactions were less important (∼ 14 %), driven by differences in NOx levels between the two wind sectors. Again, alkyl nitrate formation was most important in the morning but also contributed substantially throughout the afternoon. HO2 + HO2 and RO2 + RO2 reactions were almost negligible (∼ 1 %), but the contribution from OH + NO (∼ 6 %) was greater than in NW–SE air (∼ 3 %).
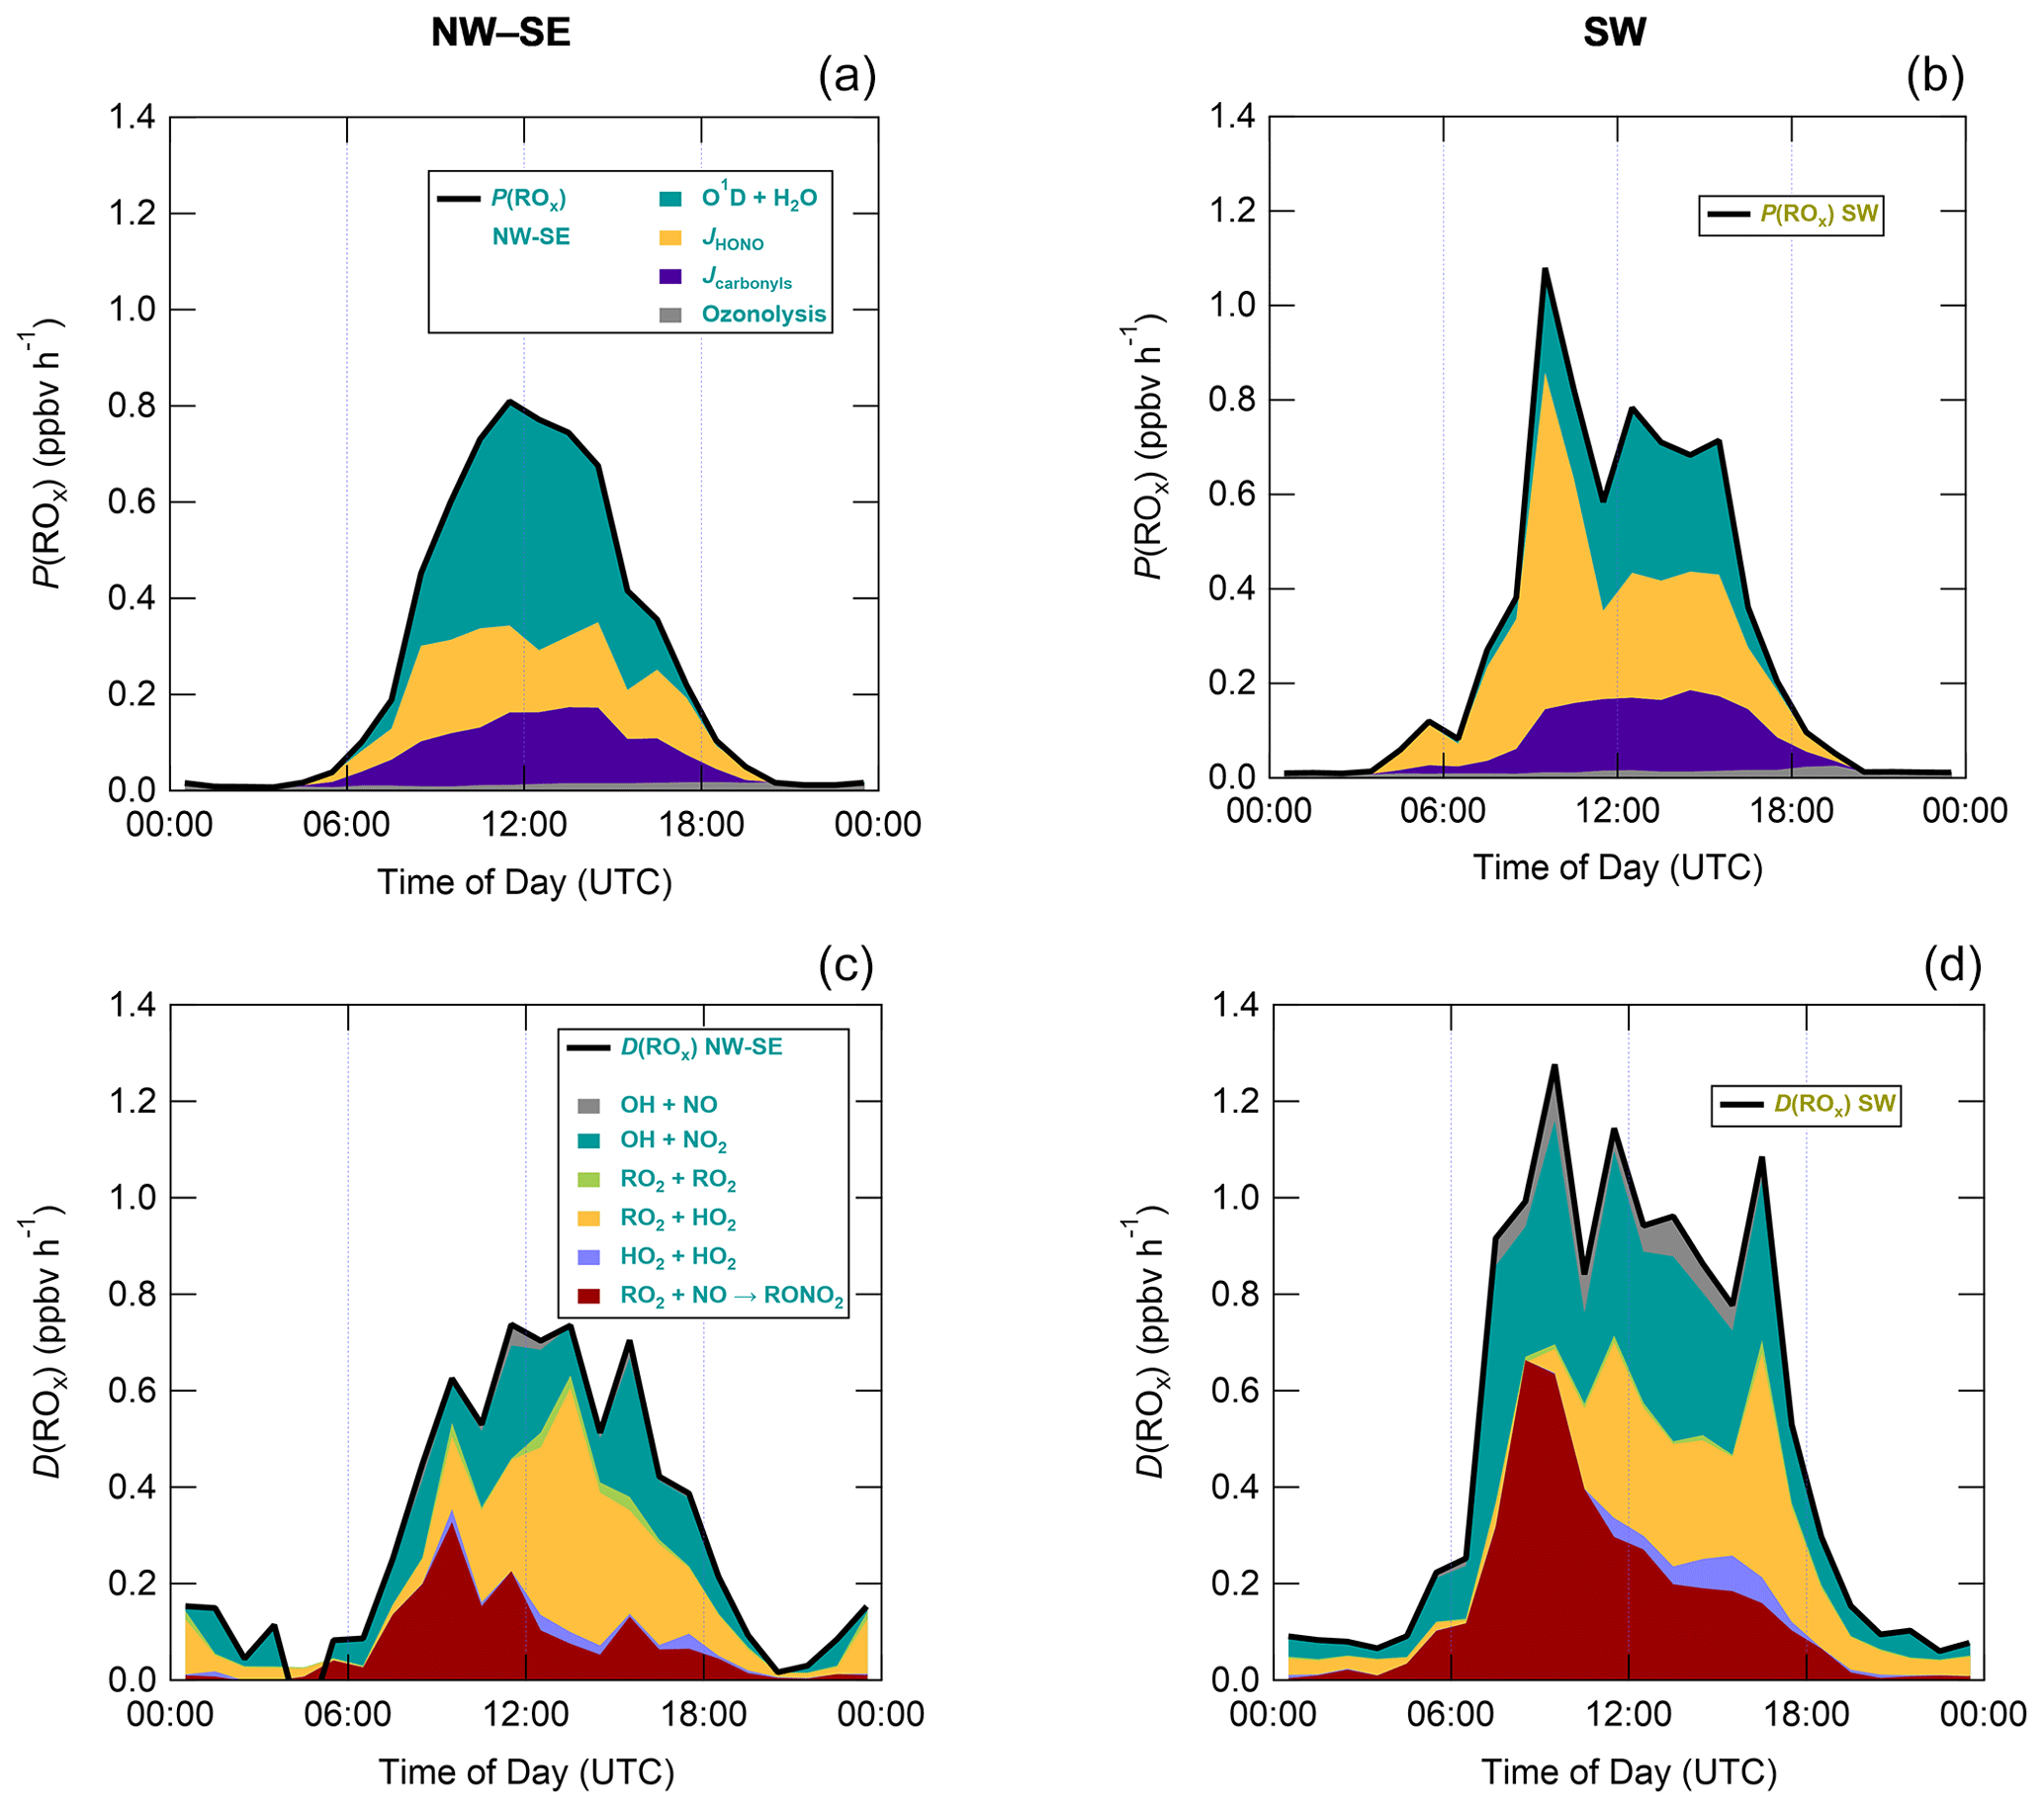
Figure 11Median diel profiles of known ROx sources (a, b) and sinks (c, d), split according to wind direction. Average daytime contributions are given in Table 2. For interpretation of colours, please see the figure legend.
3.9.2 OH production and
The breakdown of OH production and its comparison to measured OH destruction ([OH] × ) are given in Fig. 12, again split by wind direction. These data are summarised in Table 3, which shows the median daytime contributions of the known OH sources. Similarly, Fig. 13 gives the breakdown of OH reactivity and comparison to measured , also summarised in Table 3.
Table 3Median daytime OH source and sink contributions, split according to wind direction. OH reactivity contributions are derived from calculated OH reactivity, not measured nor modelled using the MCM. OH sink groupings are based on MCM classifications.
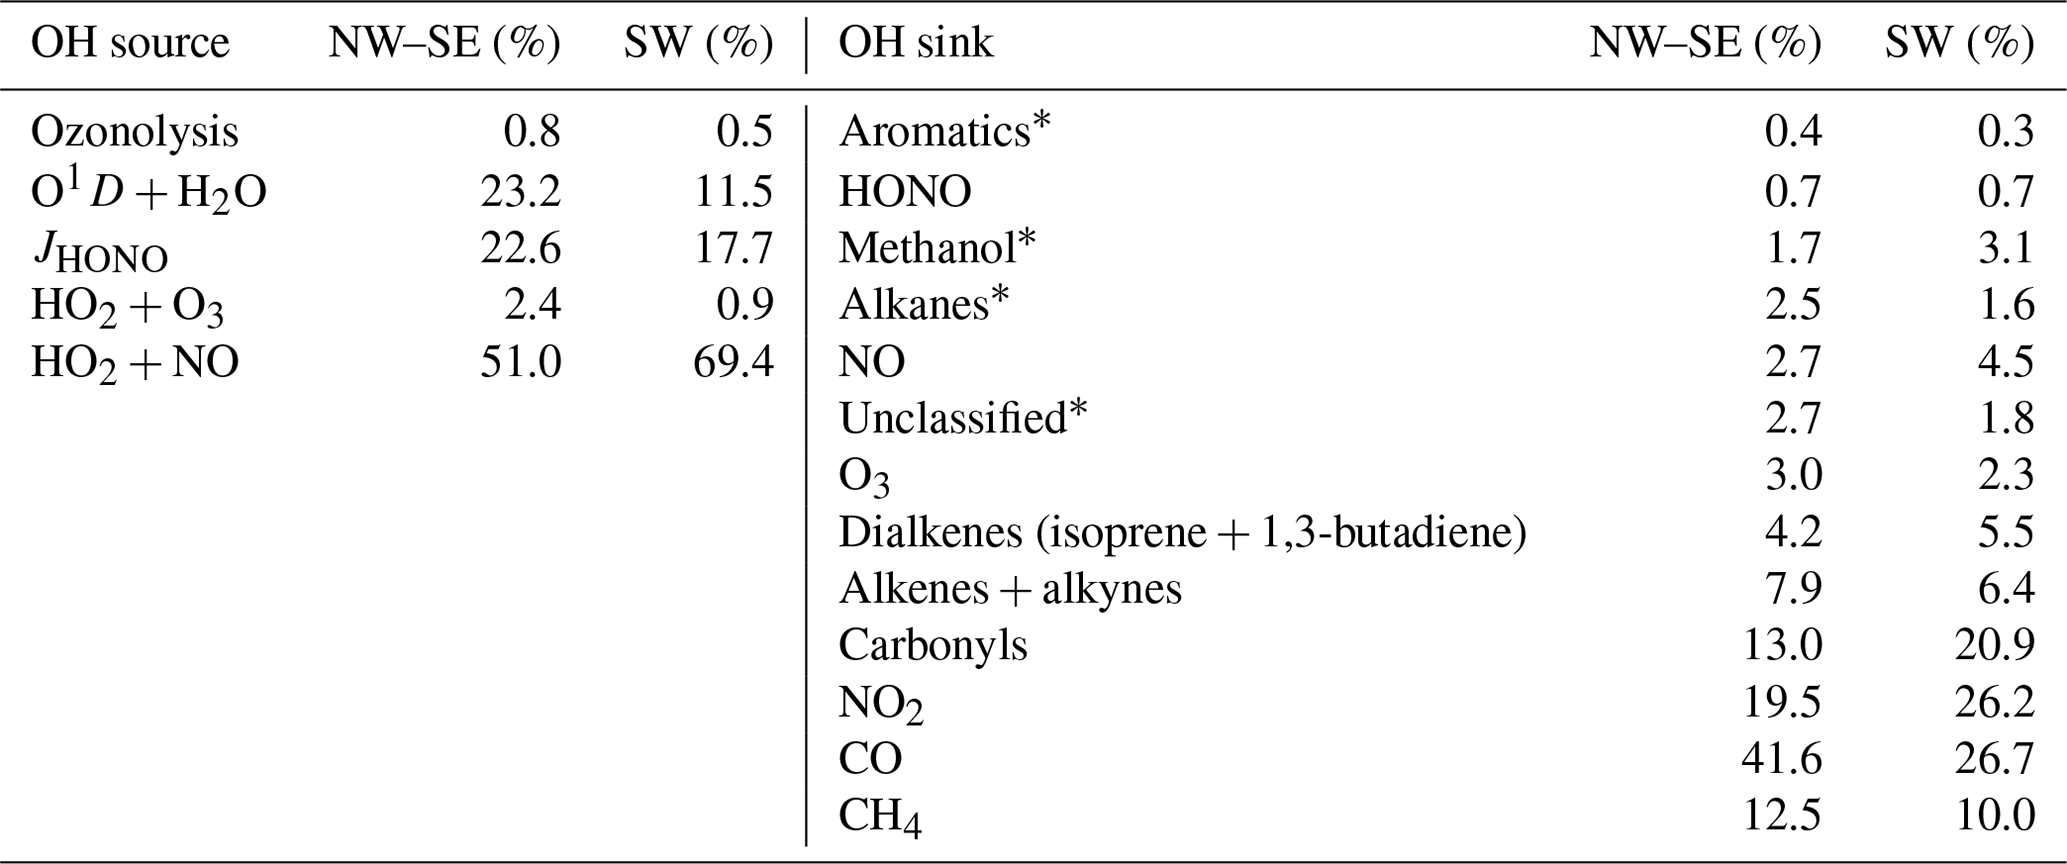
* Lumped together as “Other” in Fig. 13.
OH production was dominated throughout the daytime by the secondary source HO2 + NO in both NW–SE (∼ 50 % on average) and SW (∼ 70 %) air. In NW–SE air, the next most important OH sources were the primary sources O1D + H2O and HONO photolysis, with average contributions of ∼ 23 % each. Similar to the ROx budget (Sect. 3.9.1), HONO photolysis (∼ 18 %) was more important than O1D + H2O (∼ 12 %) as an OH source in the more polluted SW air. Radical recycling from HO2 + O3 (< 3 %) and radical initiation from ozonolysis (< 1 %) were of only minor importance in both wind sector types.
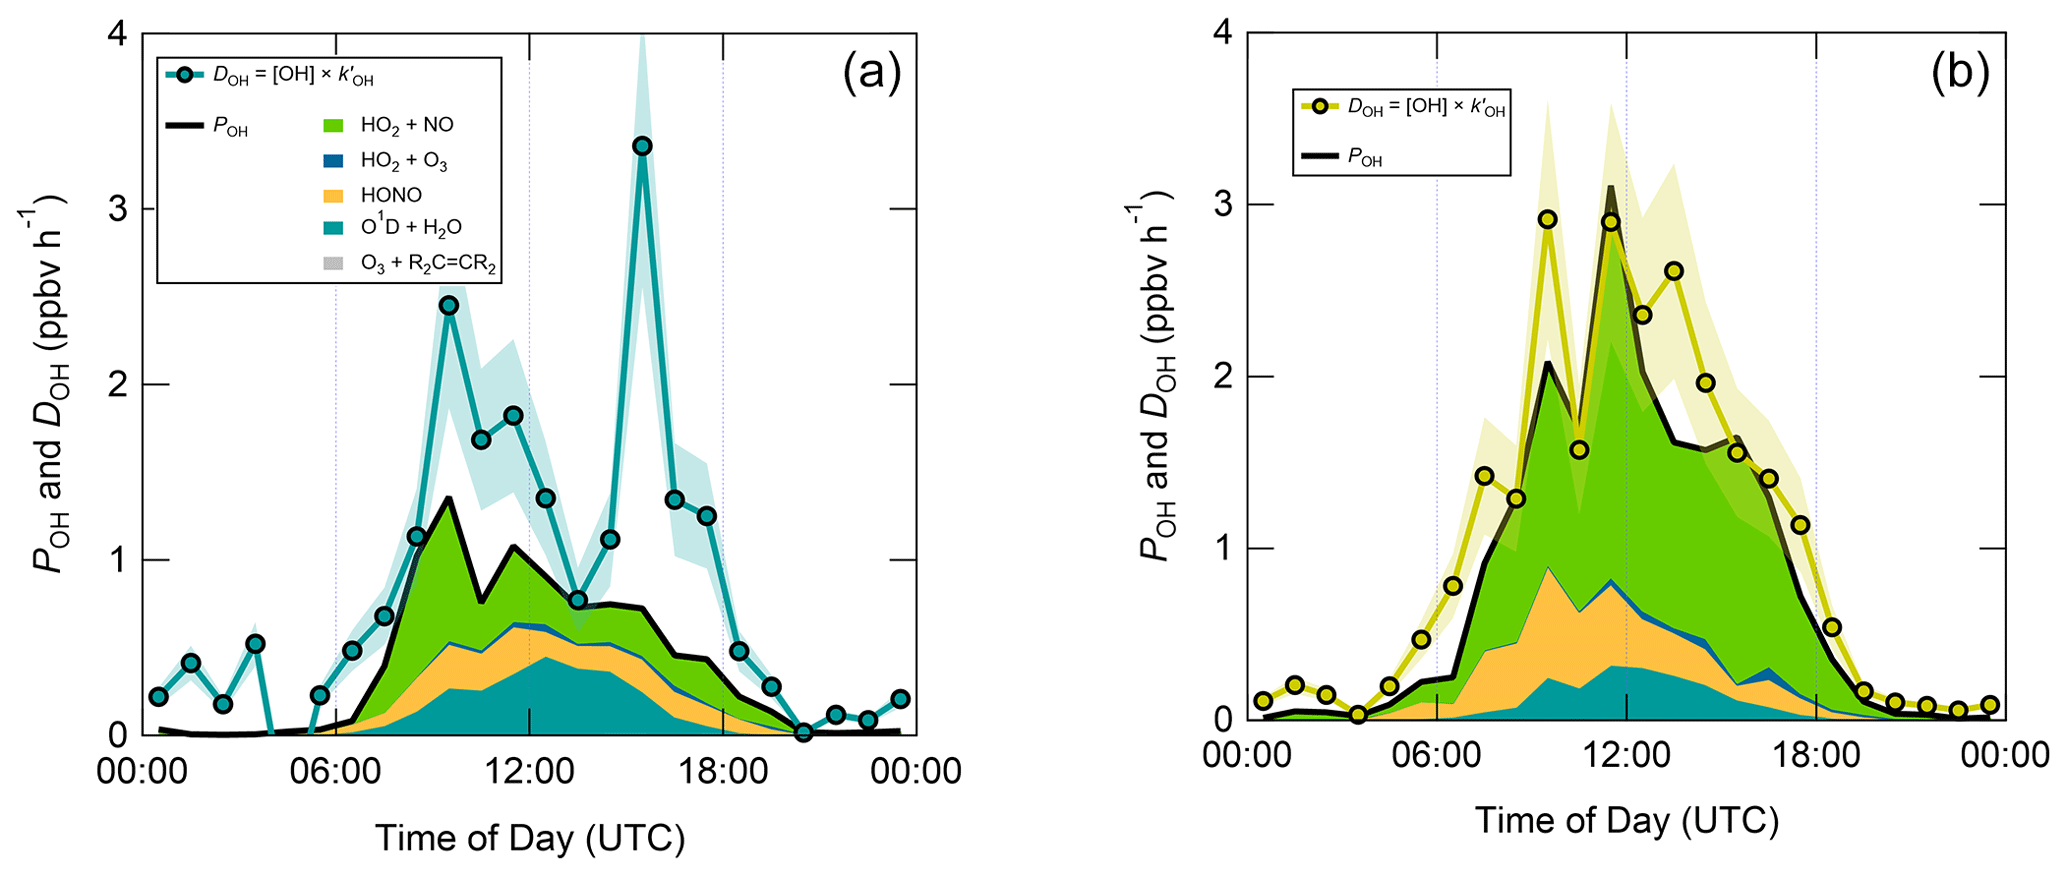
Figure 12Median diel profiles of known OH sources and comparison to measured OH destruction, split according to wind direction (a: NW–SE, b: SW). Average daytime contributions are given in Table 3. For interpretation of colours, please see the figure legend.
In terms of OH loss (Table 3), the most important OH reactant was CO (NW–SE daytime median: ∼ 42 % of calculated OH reactivity, SW: ∼ 27 %), followed by NO2 (∼ 20 %, ∼ 26 %), reflecting the overall dominance of inorganic reactants to calculated OH reactivity. In terms of organic OH reactivity, methane (∼ 10 %, 12.5 %, a constant mixing ratio of 1900 ppm was used) carbonyls (∼ 13 %, ∼ 21 %; mostly (∼ 57 %) HCHO) and alkenes and alkynes (∼ 6 %–8 %; mostly (∼ 62 %) propene) were the most important species. The dialkenes isoprene and 1,3-butadiene made small contributions to OH reactivity (∼ 4 %–6 %), whereas the contributions from aromatics, alkanes and methanol were all minor (≤ 3 %). Monoterpenes (MTs) were not included in the calculation of OH reactivity as their sum (measured using proton transfer reaction–mass spectrometry, PTR–MS) was generally below the LOD; if we use these data, the maximum contribution of MTs was only ∼ 0.4 s−1 (median 0.04 s−1, compared to measured ∼ 4.7 s−1), using the rate coefficient for OH + limonene.
3.10 Attempts to balance the HO2 and RO2 radical budgets
Whalley et al. (2018) presented field measurements of HO2 and RO2 radicals in London. HO2 levels were significantly overpredicted by an MCM model during the daytime, particularly in air that had passed over central London. It was found that HO2 concentrations could be reasonably well simulated if the fraction of RO2 radicals that propagated to HO2 (i.e. the branching ratio α in Reactions R12 and R4) was reduced. To achieve good agreement, α was reduced to 0.15, compared to α ∼ 0.5 in the base model, a factor of ∼ 3 reduction.
In the present work, α was set to 0.95 based on literature values of the branching ratios for alkyl nitrate formation (β) of ∼ 5 % (Orlando and Tyndall, 2012; Tan et al., 2019). However, even with such a low RONO2 branching ratio, P(RONO2) values of up to ∼ 0.7 ppbv h−1 (Fig. S11) are already very high considering previous measurements of RONO2 at Weybourne were on the order of tens of parts per trillion by volume (pptv; Worton et al., 2010). Therefore, it is not thought that changing the value of α is appropriate for ICOZA. Instead, we have reduced the RO2 + NO rate coefficient (originally 9.0 × 10⁻¹¹ cm3 molec.−1 s−1 as recommended by the MCM) by a factor of 5, with Fig. S11 showing the impact on the HO2 and RO2 budgets. It can be seen that the HO2 and RO2 budgets are now reasonably well balanced in the afternoon but still P(HO2) > D(HO2) and P(RO2) < D(RO2) by ∼ 1–2 ppbv h−1 in the morning. It should be noted that no evidence exists for such small RO2 + NO rate coefficients, with published k(298 K) values in the range ∼ 8–20 × 10−12 cm3 molec.−1 s−1 and associated uncertainties of ∼ 15 %–35 % (Orlando and Tyndall, 2012), although the kinetics of relatively few RO2 species with NO have been studied directly. It is therefore imperative that more laboratory studies are conducted to measure RO2 + NO rate coefficients with a wide variety of RO2 types.
We discuss the impact of heterogeneous chemistry and chlorine initiated oxidation chemistry on the experimental HO2 budget in Sects. S4 and S5, respectively, in the Supplement, which includes Figs. S12 and S13.
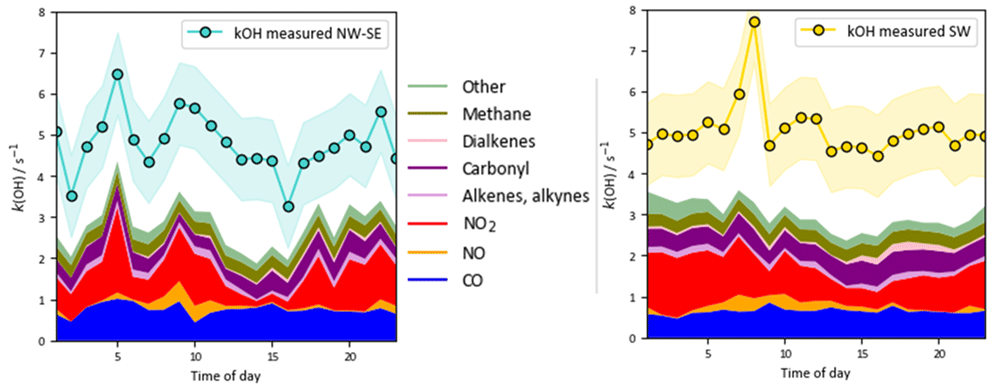
Figure 13Median diel profiles of the OH reactivity calculated from measured reactants and comparison to measured OH reactivity, split according to wind direction. Average daytime contributions are given in Table 3. For interpretation of colours, please see the figure legend. Reactants in the “Other” class are listed in Table 3. The shaded area on measured corresponds to the 1σ precision of ∼ 1 s−1. Model intermediates are not included here, but their contributions are discussed in the text.
3.11 Ozone production
3.11.1 P(Ox) and comparison to MCM model predictions
The in situ ozone production rate, p(O3), may be defined in terms of the rate of net NO → NO2 conversion (Cazorla et al., 2012), i.e. p(Ox), where Ox= O3 + NO2:
Here, α is the branching ratio for the channel of the RO2 + NO reaction generating HO2 + NO2 formation (Reaction R4)). The chemical loss rate of ozone, l(O3), may be derived from the rate of radical–NOx termination reactions and the loss of O3 to HO2, approximated by
where β (= 1−α) is the branching ratio for RONO2 formation (Reaction R12). The net ozone production rate, P(O3), is then obtained from the difference between Eqs. (13) and (14):
Calculation of P(O3) (≈P(Ox)) from FAGE observations of HO2 and RO2 radicals was one of the main aims of the ICOZA project.
Median diel profiles of the rate of net ozone production, P(Ox), calculated from measured and modelled OH, HO2 and RO2 radical concentrations are shown in Fig. S14. Here, P(Ox) was calculated from Eqs (12)–(14), with the same values of and α (= 0.95) applied to both observations and model-predicted concentrations of total RO2 (i.e. model P(Ox) was not calculated from the rate coefficients and yields for individual RO2 species). was set to the generic value used in the MCM ( 2.7 × 10⁻¹² exp() = 9.0 × 10⁻¹² cm3 molec.−1 s−1 at 298 K; for reference, 7.7 × 10⁻¹² cm3 molec.−1 s−1 at 298 K).
In NW–SE air, P(Ox) derived from measurements using the FAGE instrument peaks at ∼ 16 ppbv h−1 at 09:30 UTC when NO and peroxy radical levels are both high, before decreasing sharply in the afternoon to ∼ 0.7–1.4 ppbv h−1. Model-calculated P(Ox) also peaks at 09:30 UTC but at a 10-fold-lower value of ∼ 1.6 ppbv h−1. The afternoon decrease is less severe than for FAGE-calculated P(Ox), resulting in good agreement between FAGE- and model-calculated P(Ox) in the afternoon. In SW air, FAGE-calculated P(Ox) displays a broader morning peak in the hours ∼ 07:00–10:00 UTC of ∼ 10–15 ppbv h−1. In comparison to NW–SE air, afternoon FAGE-calculated P(Ox) was greater, with values of ∼ 5–8 ppbv h−1. Daytime model-calculated P(Ox) is in the range 0.3–2.3 ppbv h−1, peaking at 14:30 UTC, and underpredicts the observations throughout the daytime, in contrast to NW–SE air. P(Ox) will be impacted by a change in the rate coefficient for RO2 + NO, owing to the change in RO2 and HO2 budgets, as shown in Fig. S11.
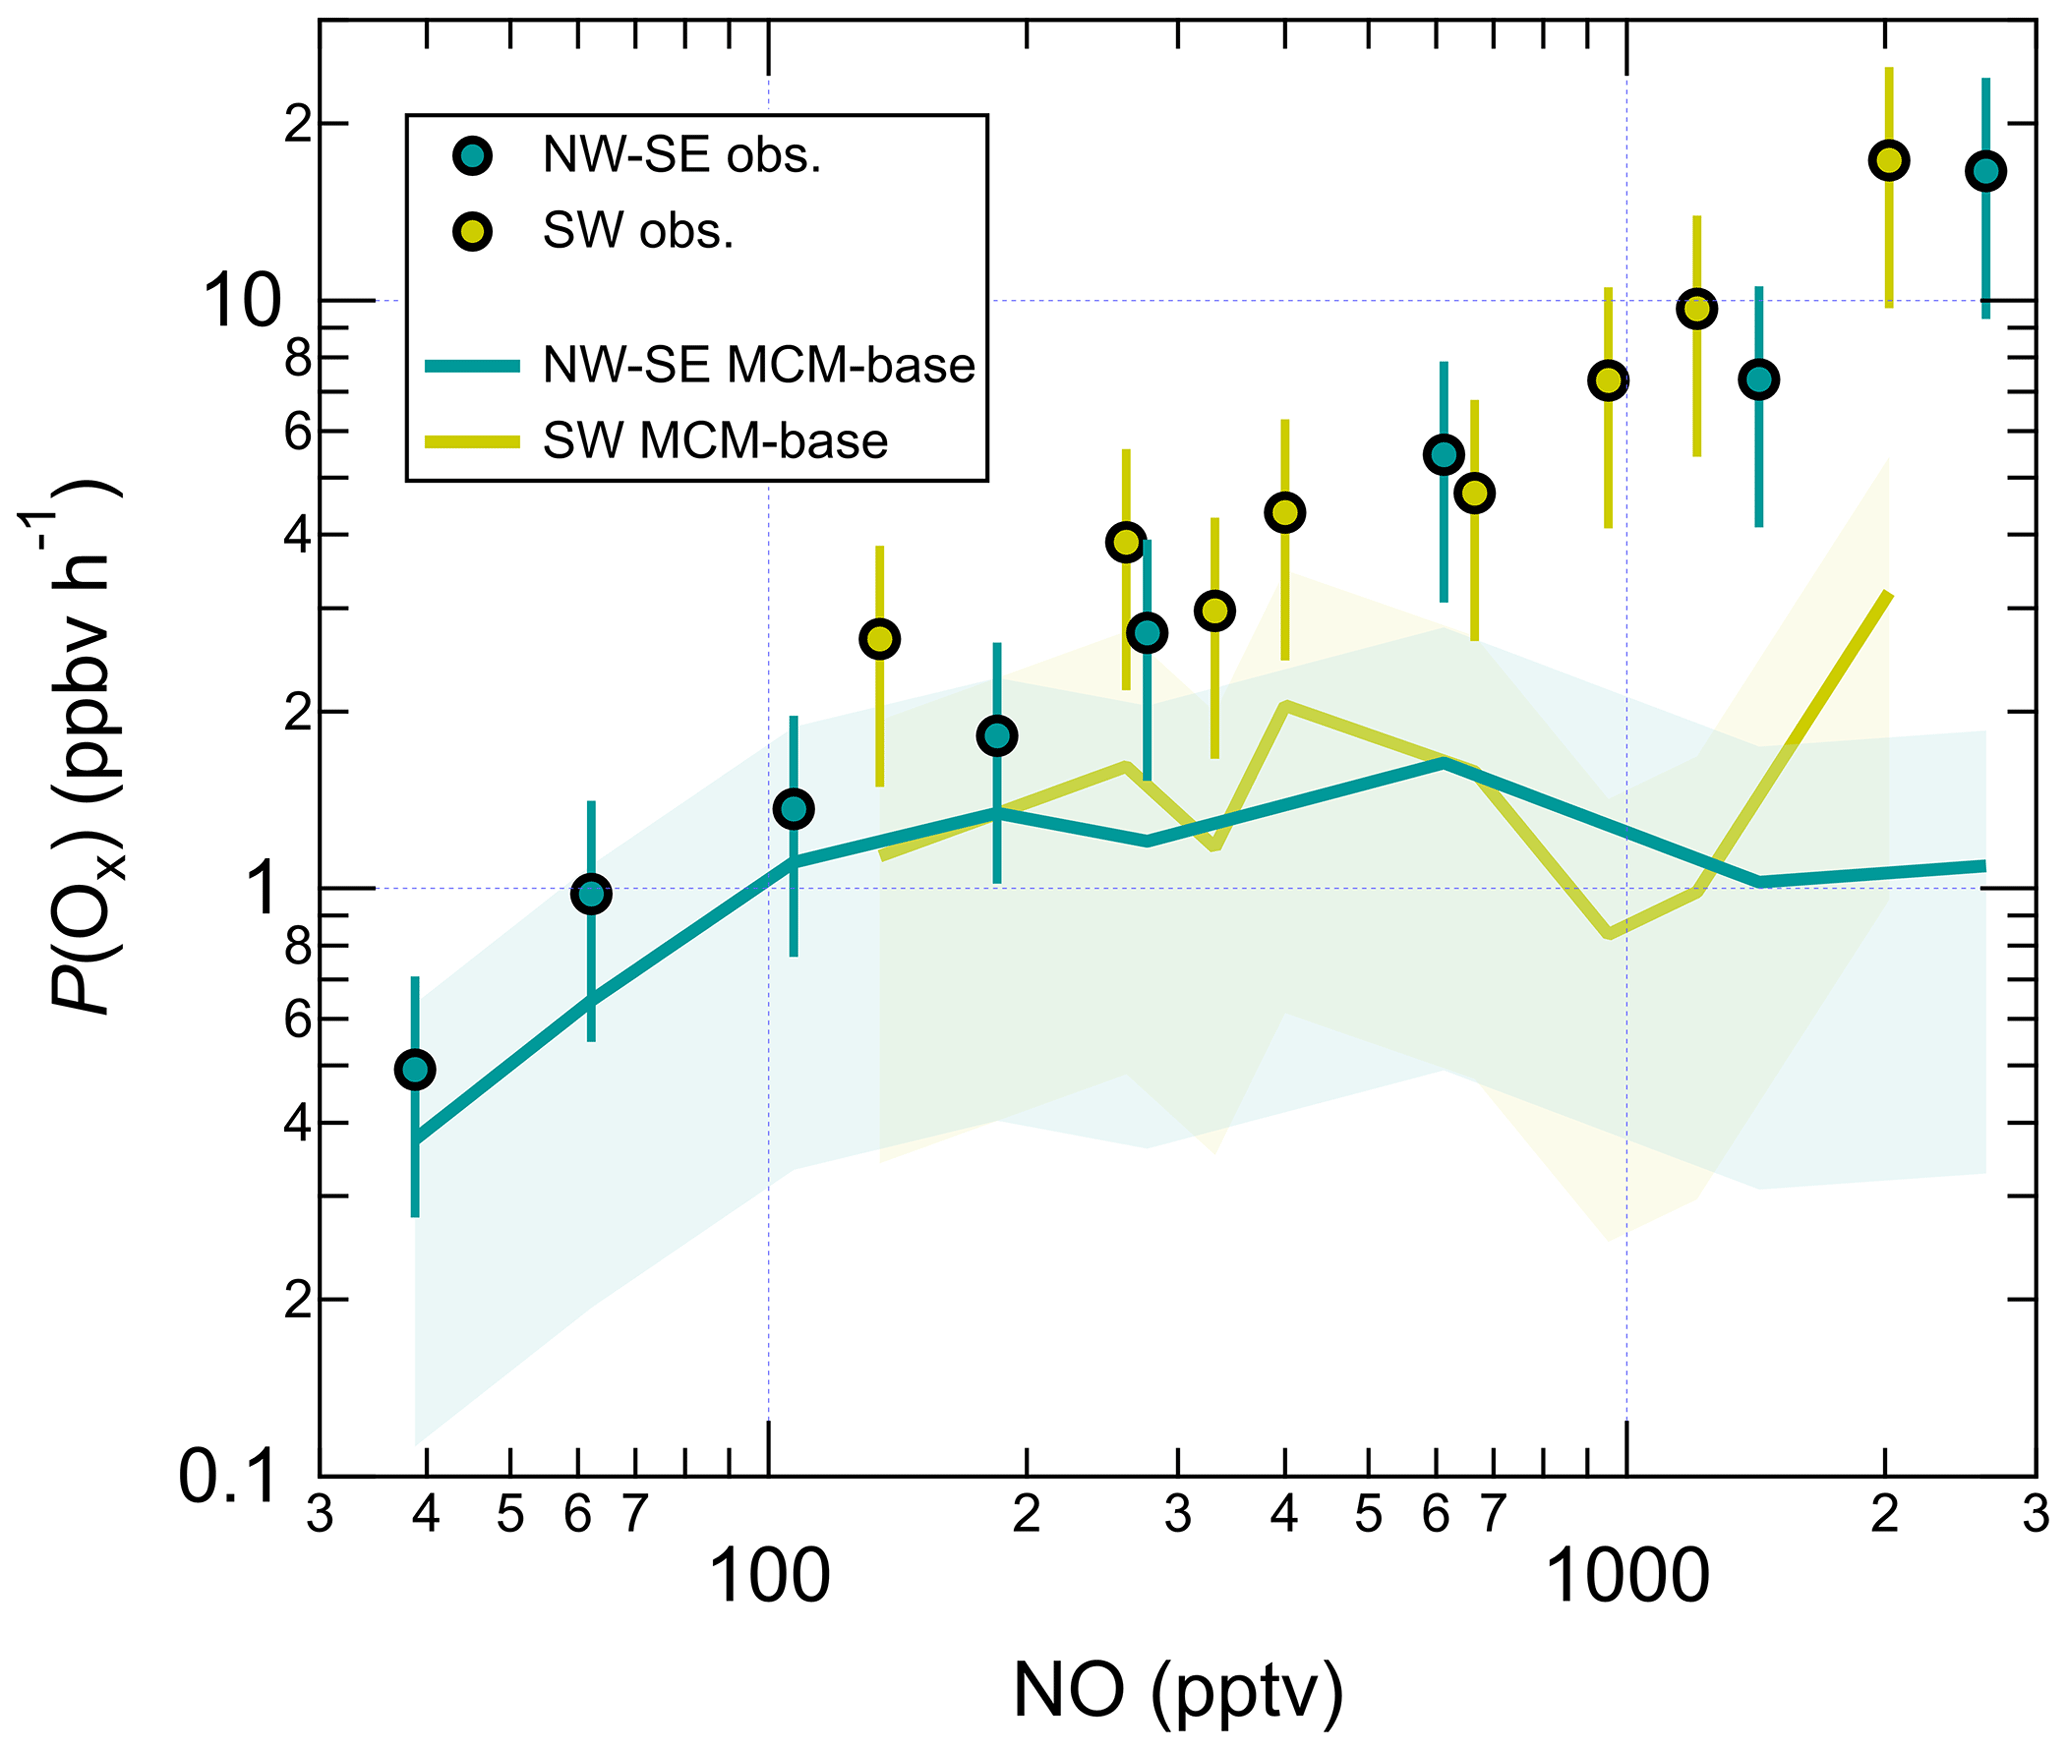
Figure 14P(Ox) as a function of NO for measured and MCM-base model HO2 and RO2. Error bars and shaded areas correspond to estimated 1σ uncertainties of 40 % and 70 % for measured and model P(Ox), respectively. Note y and x log scales. P(Ox) will be impacted by a change in the rate coefficient for RO2 + NO, owing to the change in RO2 and HO2 budgets, as shown in Fig. S11.
3.11.2 P(Ox) dependence on NO mixing ratios
Figure 14 shows that both FAGE- and model-calculated P(Ox) are strongly dependent on NO, with similar trends in NW–SE and SW air. FAGE-calculated P(Ox) shows a consistent increase with NO in both NW–SE and SW air, with values of < 1 ppbv h−1 below 100 pptv NO and up to ∼ 17 ppbv h−1 at ∼ 2–3 ppbv NO. In contrast, model-calculated P(Ox) starts to fall off a little above 1 ppbv NO in NW–SE air but generally increases with NO in SW air, but the latter is largely due to a single point at 2 ppb NO. Below ∼ 500 pptv NO, FAGE- and model-calculated P(Ox) are in reasonable agreement within combined uncertainties. However, above this threshold, FAGE-calculated P(Ox) is much greater than model-calculated P(Ox), with measurement–model ratios of up to ∼ 5–15 for NO ∼ 2–3 ppbv. NOx levels were not high enough to show any onset of a plateau in FAGE-calculated P(Ox).
OH, HO2 and RO2 radicals and OH reactivity () were measured at a UK coastal receptor site during the July 2015 ICOZA intensive field campaign. Maximum measured daily OH, HO2 and total RO2 radical concentrations were in the range 2.6–17 × 106, 0.75–4.2 × 10⁸ and 2.3–8.0 × 10⁸ molec. cm−3, respectively. ranged from 1.7 to 17.6 s−1, with a median value of 4.7 s−1. ICOZA data were split by wind direction to assess differences in the radical chemistry between air that had passed over the North Sea (NW–SE sectors) or over major urban conurbations such as London (SW sector). A photo-stationary state (PSS) calculation underpredicted daytime OH in NW–SE air by ∼ 35 % on average, whereas agreement was found within instrumental uncertainty (∼ 26 % at 2σ) in SW air. The OH levels predicted by a box model using MCM chemistry were in better agreement with the measurements. However, for HO2, the base MCM model overpredicted the observations in NW–SE air in the afternoon by a factor of ∼ 2–3, whereas reasonable agreement was found for HO2 in SW air when the model was constrained to measured carbonyls (HCHO, MVK + MACR). In contrast, for total RO2, the model severely underpredicted the observations in both NW–SE and SW air, with measurement–model ratios ranging from ∼ 2–5 in the afternoon to almost 40 in the early morning. The model predicted that the dominant RO2 species in both wind sector types was CH3O2. observations were underpredicted by ∼ 34 % and ∼ 37 % in NW–SE and SW air, respectively. Good correlations were also observed between measured total RO2 and measured HO2, and the fit slopes indicated that the RO2 : HO2 ratio was close to 1:1 in NW–SE air and ∼ 2:1 in the more polluted SW air. The slopes of modelled RO2 versus modelled HO2 were different between day and nighttime data, which was not seen in the observations.
Measured radical and levels and measurement–model ratios displayed strong dependences on NO mixing ratios. For OH, the PSS calculation could capture the observations at high NO (> 1 ppbv) but underpredicted the observations at low NO (< 200–300 pptv) by a factor of ∼ 2–3, suggesting missing OH sources. The MCM-base model performed better in terms of reproducing the observed dependence of OH on NO, but there was still a tendency towards underprediction at low NO. The MCM-base model overpredicted HO2 concentrations at low NO in NW–SE air by a factor of ∼ 3, whereas in SW air, the measurements and model results were in agreement across the full NO range. For RO2, measurement–model ratios scaled with NO, from ∼ 2–3 for NO < 100 pptv to ∼ 10–30 for NO > 1 ppbv, a trend found in all previous field campaigns in which RO2 was measured using the ROxLIF technique. This suggests that peroxy radical chemistry is not well understood under high-NOx conditions. Missing OH reactivity, i.e. the difference between measured and modelled , also scaled with NO. The strong correlation of missing OH reactivity with several OVOCs suggests that the missing reactivity was due to unmeasured VOC oxidation products that were not well simulated by the model, rather than a primary VOC species (e.g. a BVOC).
The simultaneous measurement of OH, HO2, RO2 and allowed for experimental (i.e. observationally determined) budgets to be derived for all radical species as well as total ROx. In NW–SE air, the ROx budget could be closed during the daytime within experimental uncertainty, but OH destruction exceeded OH production by ∼ 2–3 ppbv h−1, and HO2 production greatly exceeded HO2 destruction, while the opposite was true for RO2. In SW air, the ROx budget analysis indicated missing daytime ROx sources on the order of ∼ 0.2–0.6 ppbv h−1, but the OH budget was balanced, and the same behaviour was found with the HO2 and RO2 budgets as in NW–SE air. Differences between radical destruction and production rates were found to exhibit species-dependent trends with respect to NO mixing ratios; the budget imbalances were most severe for HO2 and RO2 at high NO (> 1000 pptv), with differences of −(12–15) ppbv h−1 and +(13–16) ppbv h−1, respectively.
In NW–SE air, the dominant daytime ROx sources were O1D + H2O and HONO photolysis (∼ 37 % each), with significant contributions from carbonyl photolysis (∼ 23 %), while the major ROx sinks were the reactions RO2 + NO → RONO2 (∼ 28 %), RO2 + HO2 (∼ 33 %) and OH + NO2 (∼ 33 %). The major OH source was the secondary source HO2 + NO (∼ 50 %), with significant contributions from O1D + H2O and HONO photolysis (∼ 23 % each), while in terms of OH loss, the most important reactions were OH + CO (∼ 42 %) and OH + NO2 (∼ 20 %). In the more polluted SW air, ROx initiation was dominated by HONO photolysis (∼ 44 %), with similar contributions from O1D + H2O (∼ 29 %) and carbonyl photolysis (∼ 25 %), while ROx termination was mainly controlled by the reactions RO2 + NO → RONO2 (∼ 38 %) and OH + NO2 (∼ 39 %). The rate of OH production was dominated by HO2 + NO (∼ 70 %), while OH loss was controlled by reactions with CO (∼ 27 %), NO2 (∼ 26 %) and carbonyls (∼ 21 %).
The best agreement between HO2 and RO2 production and destruction rates was found when the RO2 + NO rate coefficient was reduced by a factor of 5. However, if the RO2 + HO2 rate coefficient were reduced, then the reduction in the RO2 + NO rate coefficient necessary to explain the discrepancy in the budgets would in turn not need to be as much. It is therefore recommended that more studies are conducted to measure RO2 + NO and RO2+HO2 rate coefficients, in particular for more complex, functionalised RO2, and to explain a lower-than-expected RO2-to-HO2 propagation rate. Further study of the fate of RO radicals is also recommended, particularly those which may be involved in autoxidation. The rate of in situ ozone production (P(Ox)) was calculated from observations of ROx, NO and NO2 and compared to that calculated from MCM-modelled radical concentrations. The MCM-calculated P(Ox) significantly underpredicted the measurement-calculated P(Ox) in the morning by up to a factor of 10, and the degree of underprediction was found to scale with NO. The strong NO dependences of the HO2 and RO2 budget imbalances reveal a systematic limitation to our understanding of peroxy radical cycling chemistry, which directly impacts our ability to calculate ozone production rates correctly. Future tropospheric ozone abatement strategies rely on the accurate simulation of ozone chemistry. It is therefore crucial that further studies seek to explain the budget imbalances found in this work.
The data used in this study are available from the corresponding authors upon request (l.k.whalley@leeds.ac.uk and d.e.heard@leeds.ac.uk) and are also archived on CEDA (https://archive.ceda.ac.uk/, Crilley et al., 2018).
The supplement related to this article is available online at: https://doi.org/10.5194/acp-23-14393-2023-supplement.
WJB was the principal investigator of the ICOZA project and was responsible for organisation of the Weybourne field intensive. RWM, LKW, DRC, TI and DEH were responsible for measurements of radicals, OH reactivity, HCHO and photolysis frequencies (J values also provided by RS, SMB and PSM). LRC, LJK and WJB made measurements of HONO and aerosol surface area. RS, SMB and PSM provided Cl2 and ClNO2 data. JDL and CR measured NO, NO2 and HONO. BJB was responsible for the long-term operation of the Weybourne Atmospheric Observatory and provided O3, CO and HCHO data. GLF was responsible for measurements of VOCs. RS and SC developed the AtChem modelling framework. RS conducted the MCM model simulations. RWM, LKW and RS analysed the data. RWM and DEH wrote the manuscript with input from all co-authors.
At least one of the (co-)authors is a member of the editorial board of Atmospheric Chemistry and Physics. The peer-review process was guided by an independent editor, and the authors also have no other competing interests to declare.
Publisher’s note: Copernicus Publications remains neutral with regard to jurisdictional claims made in the text, published maps, institutional affiliations, or any other geographical representation in this paper. While Copernicus Publications makes every effort to include appropriate place names, the final responsibility lies with the authors.
We thank the science team of the ICOZA project. Robert Woodward-Massey and Danny R. Cryer are grateful to the NERC for funding PhD studentships. Robert Woodward-Massey, Lisa K. Whalley, Danny R. Cryer, Trevor Ingham and Dwayne E. Heard would like to thank the University of Leeds' electronic and mechanical workshops. Robert Woodward-Massey is grateful to Hans Osthoff (University of Calgary) for the provision of Igor functions and to Chunxiang Ye (Peking University) and Samuel Seldon (University Of Leeds) for useful discussions. We thank Lloyd Hollis and Roland Leigh (University of Leicester) for assistance with the spectral radiometer and chemical ionisation mass spectrometer. We thank Sam Cox for his help with the AtChem modelling framework.
This research has been supported by the Natural Environment Research Council (grant nos. NE/K012029/1, NE/K012169/1 and NE/K004069/1).
This paper was edited by Steven Brown and reviewed by four anonymous referees.
Ayers, G. P., Gillett, R. W., Granek, H., de Serves, C., and Cox, R. A.: Formaldehyde production in clean marine air, Geophys. Res. Lett., 24, 401–404, https://doi.org/10.1029/97gl00123, 1997.
Bianchi, F., Kurtén, T., Riva, M., Mohr, C., Rissanen, M. P., Roldin, P., Berndt, T., Crounse, J. D., Wennberg, P. O., Mentel, T. F., Wildt, J., Junninen, H., Jokinen, T., Kulmala, M., Worsnop, D. R., Thornton, J. A., Donahue, N., Kjaergaard, H. G., and Ehn, M.: Highly Oxygenated Organic Molecules (HOM) from Gas-Phase Autoxidation Involving Peroxy Radicals: A Key Contributor to Atmospheric Aerosol, Chem. Rev., 119, 3472–3509, https://doi.org/10.1021/acs.chemrev.8b00395, 2019.
Bloss, C., Wagner, V., Jenkin, M. E., Volkamer, R., Bloss, W. J., Lee, J. D., Heard, D. E., Wirtz, K., Martin-Reviejo, M., Rea, G., Wenger, J. C., and Pilling, M. J.: Development of a detailed chemical mechanism (MCMv3.1) for the atmospheric oxidation of aromatic hydrocarbons, Atmos. Chem. Phys., 5, 641–664, https://doi.org/10.5194/acp-5-641-2005, 2005a.
Bloss, W. J., Lee, J. D., Johnson, G. P., Sommariva, R., Heard, D. E., Saiz-Lopez, A., Plane, J. M. C., McFiggans, G., Coe, H., Flynn, M., Williams, P., Rickard, A. R., and Fleming, Z. L.: Impact of halogen monoxide chemistry upon boundary layer OH and HO2 concentrations at a coastal site, Geophys. Res. Lett., 32, L06814, https://doi.org/10.1029/2004gl022084, 2005b.
Bohn, B., Corlett, G. K., Gillmann, M., Sanghavi, S., Stange, G., Tensing, E., Vrekoussis, M., Bloss, W. J., Clapp, L. J., Kortner, M., Dorn, H. P., Monks, P. S., Platt, U., Plass-Dulmer, C., Mihalopoulos, N., Heard, D. E., Clemitshaw, K. C., Meixner, F. X., Prevot, A. S. H., and Schmitt, R.: Photolysis frequency measurement techniques: results of a comparison within the ACCENT project, Atmos. Chem. Phys., 8, 5373–5391, https://doi.org/10.5194/acp-8-5373-2008, 2008.
Bohn, B., Heard, D. E., Mihalopoulos, N., Plass-Dülmer, C., Schmitt, R., and Whalley, L. K.: Characterisation and improvement of j(O1D) filter radiometers, Atmos. Meas. Tech., 9, 3455–3466, https://doi.org/10.5194/amt-9-3455-2016, 2016.
Brune, W. H., Baier, B. C., Thomas, J., Ren, X., Cohen, R. C., Pusede, S. E., Browne, E. C., Goldstein, A. H., Gentner, D. R., Keutsch, F. N., Thornton, J. A., Harrold, S., Lopez-Hilfiker, F. D., and Wennberg, P. O.: Ozone production chemistry in the presence of urban plumes, Faraday Discuss., 189, 169–189, https://doi.org/10.1039/c5fd00204d, 2016.
Cárdenas, L. M., Austin, J. F., Burgess, R. A., Clemitshaw, K. C., Dorling, S., Penkett, S. A., and Harrison, R. M.: Correlations between CO, NOy, O3 and non-methane hydrocarbons and their relationships with meteorology during winter 1993 on the North Norfolk Coast, UK, Atmos. Environ., 32, 3339–3351, https://doi.org/10.1016/s1352-2310(97)00445-7, 1998.
Carpenter, L. J., Sturges, W. T., Penkett, S. A., Liss, P. S., Alicke, B., Hebestreit, K., and Platt, U.: Short-lived alkyl iodides and bromides at Mace Head, Ireland: Links to biogenic sources and halogen oxide production, J. Geophys. Res.-Atmos., 104, 1679–1689, https://doi.org/10.1029/98jd02746, 1999.
Carpenter, L. J., Liss, P. S., and Penkett, S. A.: Marine organohalogens in the atmosphere over the Atlantic and Southern Oceans, J. Geophys. Res.-Atmos., 108, 4256, https://doi.org/10.1029/2002jd002769, 2003.
Cazorla, M., Brune, W. H., Ren, X., and Lefer, B.: Direct measurement of ozone production rates in Houston in 2009 and comparison with two estimation methods, Atmos. Chem. Phys., 12, 1203–1212, https://doi.org/10.5194/acp-12-1203-2012, 2012.
Commane, R., Seitz, K., Bale, C. S. E., Bloss, W. J., Buxmann, J., Platt, U., Pohler, D., and Heard, D. E.: Iodine monoxide at a clean marine coastal site: observations of high frequency variations and inhomogeneous distributions, Atmos. Chem. Phys., 11, 6721–6733, https://doi.org/10.5194/acp-11-6721-2011, 2011.
Creasey, D. J., HalfordMaw, P. A., Heard, D. E., Pilling, M. J., and Whitaker, B. J.: Implementation and initial deployment of a field instrument for measurement of OH and HO2 in the troposphere by laser-induced fluorescence, J. Chem. Soc. Faraday T., 93, 2907–2913, https://doi.org/10.1039/a701469d, 1997.
Crilley, L., Kramer, L., Reed, C., Lee, J. D., Massey-Woodward, R., Whalley, L., Forster, G., and Bandy, B.: ICOZA: Atmospheric species measurements of OH, HONO, HO2, NO, NO2, NOy, O3, SO2 and CO from Weybourne Atmosphere Observatory July 2015, Centre for Environmental Data Analysis [data set], https://catalogue.ceda.ac.uk/uuid/ddf1032d626b45f78ce1c5e94f289a66 (last access: 14 November 2023), 2018.
Crilley, L. R., Kramer, L. J., Pope, F. D., Reed, C., Lee, J. D., Carpenter, L. J., Hollis, L. D. J., Ball, S. M., and Bloss, W. J.: Is the ocean surface a source of nitrous acid (HONO) in the marine boundary layer?, Atmos. Chem. Phys., 21, 18213–18225, https://doi.org/10.5194/acp-21-18213-2021, 2021.
Crounse, J. D., Nielsen, L. B., Jorgensen, S., Kjaergaard, H. G., and Wennberg, P. O.: Autoxidation of Organic Compounds in the Atmosphere, J. Phys. Chem. Lett., 4, 3513–3520, https://doi.org/10.1021/jz4019207, 2013.
Cryer, D. R.: Measurements of hydroxyl radical reactivity and formaldehyde in the atmosphere, PhD thesis, School of Chemistry, University of Leeds, White Rose, https://etheses.whiterose.ac.uk/16834 (last access: 13 November 2023), 2016.
Di Carlo, P., Brune, W. H., Martinez, M., Harder, H., Lesher, R., Ren, X., Thornberry, T., Carroll, M. A., Young, V., Shepson, P. B., Riemer, D., Apel, E., and Campbell, C.: Missing OH reactivity in a forest: evidence for unknown reactive biogenic VOCs, Science, 304, 722–725, https://doi.org/10.1126/science.1094392, 2004.
Edwards, G. D., Cantrell, C. A., Stephens, S., Hill, B., Goyea, O., Shetter, R. E., Mauldin, R. L., 3rd, Kosciuch, E., Tanner, D. J., and Eisele, F. L.: Chemical ionization mass spectrometer instrument for the measurement of tropospheric HO2 and RO2, Anal. Chem., 75, 5317–5327, https://doi.org/10.1021/ac034402b, 2003.
Edwards, P., Evans, M. J., Commane, R., Ingham, T., Stone, D., Mahajan, A. S., Oetjen, H., Dorsey, J. R., Hopkins, J. R., Lee, J. D., Moller, S. J., Leigh, R., Plane, J. M. C., Carpenter, L. J., and Heard, D. E.: Hydrogen oxide photochemistry in the northern Canadian spring time boundary layer, J. Geophys. Res., 116, D22306, https://doi.org/10.1029/2011JD016390, 2011.
Edwards, P. M., Evans, M. J., Furneaux, K. L., Hopkins, J., Ingham, T., Jones, C., Lee, J. D., Lewis, A. C., Moller, S. J., Stone, D., Whalley, L. K., and Heard, D. E.: OH reactivity in a South East Asian tropical rainforest during the Oxidant and Particle Photochemical Processes (OP3) project, Atmos. Chem. Phys., 13, 9497–9514, https://doi.org/10.5194/acp-13-9497-2013, 2013.
Faloona, I. C., Tan, D., Lesher, R. L., Hazen, N. L., Frame, C. L., Simpas, J. B., Harder, H., Martinez, M., Di Carlo, P., Ren, X. R., and Brune, W. H.: A laser-induced fluorescence instrument for detecting tropospheric OH and HO2: Characteristics and calibration, J. Atmos. Chem., 47, 139–167, https://doi.org/10.1023/B:JOCH.0000021036.53185.0e, 2004.
Fleming, Z. L., Monks, P. S., Rickard, A. R., Bandy, B. J., Brough, N., Green, T. J., Reeves, C. E., and Penkett, S. A.: Seasonal dependence of peroxy radical concentrations at a Northern hemisphere marine boundary layer site during summer and winter: evidence for radical activity in winter, Atmos. Chem. Phys., 6, 5415–5433, https://doi.org/10.5194/acp-6-5415-2006, 2006.
Forberich, O., Pfeiffer, T., Spiekermann, M., Walter, J., Comes, F. J., Grigonis, R., Clemitshaw, K. C., and Burgess, R. A.: Measurement of the Diurnal Variation of the OH Radical Concentration and Analysis of the Data by Modelling, J. Atmos. Chem., 33, 155–181, https://doi.org/10.1023/A:1005973130335, 1999.
Fuchs, H., Holland, F., and Hofzumahaus, A.: Measurement of tropospheric RO2 and HO2 radicals by a laser-induced fluorescence instrument, Rev. Sci. Instrum., 79, 084104, https://doi.org/10.1063/1.2968712, 2008.
Fuchs, H., Bohn, B., Hofzumahaus, A., Holland, F., Lu, K. D., Nehr, S., Rohrer, F., and Wahner, A.: Detection of HO2 by laser-induced fluorescence: calibration and interferences from RO2 radicals, Atmos. Meas. Tech., 4, 1209–1225, https://doi.org/10.5194/amt-4-1209-2011, 2011.
Geyer, A. and Stutz, J., The vertical structure of OH-HO2-RO2 chemistry in the nocturnal boundary layer: A one-dimensional model study, J. Geophys. Res. 109, D16301, https://doi.org/10.1029/2003JD004425, 2004.
Green, T. J., Reeves, C. E., Fleming, Z. L., Brough, N., Rickard, A. R., Bandy, B. J., Monks, P. S., and Penkett, S. A.: An improved dual channel PERCA instrument for atmospheric measurements of peroxy radicals, J. Environ. Monit., 8, 530–536, https://doi.org/10.1039/b514630e, 2006.
Grenfell, J. L., Savage, N. H., Harrison, R. M., Penkett, S. A., Forberich, O., Comes, F. J., Clemitshaw, K. C., Burgess, R. A., Cárdenas, L. M., Davison, B., and McFadyen, G. G.: Tropospheric Box-Modelling and Analytical Studies of the Hydroxyl (OH) Radical and Related Species: Comparison with Observations, J. Atmos. Chem., 33, 183–214, https://doi.org/10.1023/A:1006009901180, 1999.
Griffith, S. M., Hansen, R. F., Dusanter, S., Stevens, P. S., Alaghmand, M., Bertman, S. B., Carroll, M. A., Erickson, M., Galloway, M., Grossberg, N., Hottle, J., Hou, J., Jobson, B. T., Kammrath, A., Keutsch, F. N., Lefer, B. L., Mielke, L. H., O'Brien, A., Shepson, P. B., Thurlow, M., Wallace, W., Zhang, N., and Zhou, X. L.: OH and HO2 radical chemistry during PROPHET 2008 and CABINEX 2009 – Part 1: Measurements and model comparison, Atmos. Chem. Phys., 13, 5403–5423, https://doi.org/10.5194/acp-13-5403-2013, 2013.
Guenther, A. B., Zimmerman, P. R., Harley, P. C., Monson, R. K., and Fall, R.: Isoprene and Monoterpene Emission Rate Variability – Model Evaluations and Sensitivity Analyses, J. Geophys. Res.-Atmos., 98, 12609–12617, https://doi.org/10.1029/93jd00527, 1993.
Hard, T. M., Obrien, R. J., Chan, C. Y., and Mehrabzadeh, A. A.: Tropospheric Free-Radical Determination by Fage, Environ. Sci. Technol., 18, 768–777, https://doi.org/10.1021/es00128a009, 1984.
Heard, D. E. and Pilling, M. J.: Measurement of OH and HO2 in the troposphere, Chem. Rev., 103, 5163–5198, https://doi.org/10.1021/cr020522s, 2003.
Heard, D. E., Read, K. A., Methven, J., Al-Haider, S., Bloss, W. J., Johnson, G. P., Pilling, M. J., Seakins, P. W., Smith, S. C., Sommariva, R., Stanton, J. C., Still, T. J., Ingham, T., Brooks, B., De Leeuw, G., Jackson, A. V., McQuaid, J. B., Morgan, R., Smith, M. H., Carpenter, L. J., Carslaw, N., Hamilton, J., Hopkins, J. R., Lee, J. D., Lewis, A. C., Purvis, R. M., Wevill, D. J., Brough, N., Green, T., Mills, G., Penkett, S. A., Plane, J. M. C., Saiz-Lopez, A., Worton, D., Monks, P. S., Fleming, Z., Rickard, A. R., Alfarra, M. R., Allan, J. D., Bower, K., Coe, H., Cubison, M., Flynn, M., McFiggans, G., Gallagher, M., Norton, E. G., O'Dowd, C. D., Shillito, J., Topping, D., Vaughan, G., Williams, P., Bitter, M., Ball, S. M., Jones, R. L., Povey, I. M., O'Doherty, S., Simmonds, P. G., Allen, A., Kinnersley, R. P., Beddows, D. C. S., Dall'Osto, M., Harrison, R. M., Donovan, R. J., Heal, M. R., Jennings, S. G., Noone, C., and Spain, G.: The North Atlantic Marine Boundary Layer Experiment (NAMBLEX). Overview of the campaign held at Mace Head, Ireland, in summer 2002, Atmos. Chem. Phys., 6, 2241–2272, https://doi.org/10.5194/acp-6-2241-2006, 2006.
Hosaynali Beygi, Z., Fischer, H., Harder, H. D., Martinez, M., Sander, R., Williams, J., Brookes, D. M., Monks, P. S., and Lelieveld, J.: Oxidation photochemistry in the Southern Atlantic boundary layer: unexpected deviations of photochemical steady state, Atmos. Chem. Phys., 11, 8497–8513, https://doi.org/10.5194/acp-11-8497-2011, 2011.
Hottle, J. R., Huisman, A. J., DiGangi, J. P., Kammrath, A., Galloway, M. M., Coens, K. L., and Keutsch, F. N.: A laser induced fluorescence-based instrument for in-situ measurements of atmospheric formaldehyde, Environ. Sci. Technol., 43, 790–795, https://doi.org/10.1021/es801621f, 2009.
Ingham, T., Goddard, A., Whalley, L. K., Furneaux, K. L., Edwards, P. M., Seal, C. P., Self, D. E., Johnson, G. P., Read, K. A., Lee, J. D., and Heard, D. E.: A flow-tube based laser-induced fluorescence instrument to measure OH reactivity in the troposphere, Atmos. Meas. Tech., 2, 465–477, https://doi.org/10.5194/amt-2-465-2009, 2009.
IPCC: Climate Change 2023: Synthesis Report, Contribution of Working Groups I, II and III to the Sixth Assessment Report of the Intergovernmental Panel on Climate Change, edited by: Core Writing Team, Lee, H. and Romero, J., IPCC, Geneva, Switzerland, 35–115, https://doi.org/10.59327/IPCC/AR6-9789291691647, 2023.
Jeanneret, F., Kirchner, F., Clappier, A., van den Bergh, H., and Calpini, B.: Total VOC reactivity in the planetary boundary layer 1, Estimation by a pump and probe OH experiment, J. Geophys. Res.-Atmos., 106, 3083–3093, https://doi.org/10.1029/2000jd900602, 2001.
Jenkin, M. E., Saunders, S. M., Wagner, V., and Pilling, M. J.: Protocol for the development of the Master Chemical Mechanism, MCM v3 (Part B): tropospheric degradation of aromatic volatile organic compounds, Atmos. Chem. Phys., 3, 181–193, https://doi.org/10.5194/acp-3-181-2003, 2003.
Jenkin, M. E., Young, J. C., and Rickard, A. R.: The MCM v3.3.1 degradation scheme for isoprene, Atmos. Chem. Phys., 15, 11433–11459, https://doi.org/10.5194/acp-15-11433-2015, 2015.
Jerrett, M., Burnett, R. T., Pope III, C. A., Ito, K., Thurston, G., Krewski, D., Shi, Y., Calle, E., and Thun, M.: Long-term ozone exposure and mortality, N. Engl. J. Med., 360, 1085–1095, https://doi.org/10.1056/NEJMoa0803894, 2009.
Jokinen, T., Sipila, M., Richters, S., Kerminen, V. M., Paasonen, P., Stratmann, F., Worsnop, D., Kulmala, M., Ehn, M., Herrmann, H., and Berndt, T.: Rapid autoxidation forms highly oxidized RO2 radicals in the atmosphere, Angew. Chem. Int. Ed. Engl., 53, 14596–14600, https://doi.org/10.1002/anie.201408566, 2014.
Kanaya, Y. G., Cao, R. Q., Kato, S. G., Miyakawa, Y. K., Kajii, Y., Tanimoto, H., Yokouchi, Y., Mochida, M., Kawamura, K., and Akimoto, H.: Chemistry of OH and HO2 radicals observed at Rishiri Island, Japan, in September 2003: Missing daytime sink of HO2 and positive nighttime correlations with monoterpenes, J. Geophys. Res.-Atmos., 112, D11308, https://doi.org/10.1029/2006jd007987, 2007.
Kebabian, P. L., Wood, E. C., Herndon, S. C., and Freedman, A.: A practical alternative to chemiluminescence-based detection of nitrogen dioxide: cavity attenuated phase shift spectroscopy, Environ. Sci. Technol., 42, 6040–6045, https://doi.org/10.1021/es703204j, 2008.
Keene, W. C., Long, M. S., Pszenny, A. A. P., Sander, R., Maben, J. R., Wall, A. J., O'Halloran, T. L., Kerkweg, A., Fischer, E. V., and Schrems, O.: Latitudinal variation in the multiphase chemical processing of inorganic halogens and related species over the eastern North and South Atlantic Oceans, Atmos. Chem. Phys., 9, 7361–7385, https://doi.org/10.5194/acp-9-7361-2009, 2009.
Kovacs, T. A., Brune, W. H., Harder, H., Martinez, M., Simpas, J. B., Frost, G. J., Williams, E., Jobson, T., Stroud, C., Young, V., Fried, A., and Wert, B.: Direct measurements of urban OH reactivity during Nashville SOS in summer 1999, J. Environ. Monit., 5, 68–74, https://doi.org/10.1039/b204339d, 2003.
Krupa, S. V., Nosal, M., and Legge, A. H.: A numerical analysis of the combined open-top chamber data from the USA and Europe on ambient ozone and negative crop responses, Environ. Pollut., 101, 157–160, https://doi.org/10.1016/S0269-7491(98)00019-0, 1998.
Kumar, V., Chandra, B. P., and Sinha, V.: Large unexplained suite of chemically reactive compounds present in ambient air due to biomass fires, Sci. Rep., 8, 626, https://doi.org/10.1038/s41598-017-19139-3, 2018.
Lee, J. D., Moller, S. J., Read, K. A., Lewis, A. C., Mendes, L., and Carpenter, L. J.: Year-round measurements of nitrogen oxides and ozone in the tropical North Atlantic marine boundary layer, J. Geophys. Res.-Atmos., 114, D21302, https://doi.org/10.1029/2009jd011878, 2009a.
Lee, J. D., Young, J. C., Read, K. A., Hamilton, J. F., Hopkins, J. R., Lewis, A. C., Bandy, B. J., Davey, J., Edwards, P., Ingham, T., Self, D. E., Smith, S. C., Pilling, M. J., and Heard, D. E.: Measurement and calculation of OH reactivity at a United Kingdom coastal site, J. Atmos. Chem., 64, 53–76, https://doi.org/10.1007/s10874-010-9171-0, 2009b.
Lewis, A., Carslaw, D., and Moller, S.: Non-methane Volatile Organic Compounds in the UK, Air Quality Expert Group, Depart. Environ., Food and Rural Affairs, https://uk-air.defra.gov.uk/research/aqeg/publications (last access: 13 November 2023), 2020.
Lou, S., Holland, F., Rohrer, F., Lu, K., Bohn, B., Brauers, T., Chang, C. C., Fuchs, H., Haseler, R., Kita, K., Kondo, Y., Li, X., Shao, M., Zeng, L., Wahner, A., Zhang, Y., Wang, W., and Hofzumahaus, A.: Atmospheric OH reactivities in the Pearl River Delta – China in summer 2006: measurement and model results, Atmos. Chem. Phys., 10, 11243–11260, https://doi.org/10.5194/acp-10-11243-2010, 2010.
Madronich, S.: Implications of recent total atmospheric ozone measurements for biologically active ultraviolet radiation reaching the Earth's surface, Geophys. Res. Lett., 19, 37–40, https://doi.org/10.1029/91gl02954, 1992.
Mallik, C., Tomsche, L., Bourtsoukidis, E., Crowley, J. N., Derstroff, B., Fischer, H., Hafermann, S., Huser, I., Javed, U., Kessel, S., Lelieveld, J., Martinez, M., Meusel, H., Novelli, A., Phillips, G. J., Pozzer, A., Reiffs, A., Sander, R., Taraborrelli, D., Sauvage, C., Schuladen, J., Su, H., Williams, J., and Harder, H.: Oxidation processes in the eastern Mediterranean atmosphere: evidence from the modelling of HOx measurements over Cyprus, Atmos. Chem. Phys., 18, 10825–10847, https://doi.org/10.5194/acp-18-10825-2018, 2018.
Mao, J., Ren, X., Brune, W. H., Olson, J. R., Crawford, J. H., Fried, A., Huey, L. G., Cohen, R. C., Heikes, B., Singh, H. B., Blake, D. R., Sachse, G. W., Diskin, G. S., Hall, S. R., and Shetter, R. E.: Airborne measurement of OH reactivity during INTEX-B, Atmos. Chem. Phys., 9, 163–173, https://doi.org/10.5194/acp-9-163-2009, 2009.
Mao, J., Ren, X., Zhang, L., Van Duin, D. M., Cohen, R. C., Park, J. H., Goldstein, A. H., Paulot, F., Beaver, M. R., Crounse, J. D., Wennberg, P. O., DiGangi, J. P., Henry, S. B., Keutsch, F. N., Park, C., Schade, G. W., Wolfe, G. M., Thornton, J. A., and Brune, W. H.: Insights into hydroxyl measurements and atmospheric oxidation in a California forest, Atmos. Chem. Phys., 12, 8009–8020, https://doi.org/10.5194/acp-12-8009-2012, 2012.
McFiggans, G., Coe, H., Burgess, R., Allan, J., Cubison, M., Alfarra, M. R., Saunders, R., Saiz-Lopez, A., Plane, J. M. C., Wevill, D., Carpenter, L., Rickard, A. R., and Monks, P. S.: Direct evidence for coastal iodine particles from Laminaria macroalgae – linkage to emissions of molecular iodine, Atmos. Chem. Phys., 4, 701–713, https://doi.org/10.5194/acp-4-701-2004, 2004.
Mehra, A., Wang, Y., Krechmer, J. E., Lambe, A., Majluf, F., Morris, M. A., Priestley, M., Bannan, T. J., Bryant, D. J., Pereira, K. L., Hamilton, J. F., Rickard, A. R., Newland, M. J., Stark, H., Croteau, P., Jayne, J. T., Worsnop, D. R., Canagaratna, M. R., Wang, L., and Coe, H.: Evaluation of the Chemical Composition of Gas and Particle Phase Products of Aromatic Oxidation, Atmos. Chem. Phys., 20, 9783–9803, 2020.
Morgan, R. B. and Jackson, A. V.: Measurements of gas-phase hydrogen peroxide and methyl hydroperoxide in the coastal environment during the PARFORCE project, J. Geophys. Res., 107, 8109, https://doi.org/10.1029/2000JD000257, 2002
Murphy, J. G., Oram, D. E., and Reeves, C. E.: Measurements of volatile organic compounds over West Africa, Atmos. Chem. Phys., 10, 5281–5294, https://doi.org/10.5194/acp-10-5281-2010, 2010.
Nash, T.: The colorimetric estimation of formaldehyde by means of the Hantzsch reaction, Biochem. J., 55, 416–421, 1953.
Nolscher, A. C., Williams, J., Sinha, V., Custer, T., Song, W., Johnson, A. M., Axinte, R., Bozem, H., Fischer, H., Pouvesle, N., Phillips, G., Crowley, J. N., Rantala, P., Rinne, J., Kulmala, M., Gonzales, D., Valverde-Canossa, J., Vogel, A., Hoffmann, T., Ouwersloot, H. G., de Arellano, J. V. G., and Lelieveld, J.: Summertime total OH reactivity measurements from boreal forest during HUMPPA-COPEC 2010, Atmos. Chem. Phys., 12, 8257–8270, https://doi.org/10.5194/acp-12-8257-2012, 2012.
Novelli, A., Hens, K., Ernest, C. T., Kubistin, D., Regelin, E., Elste, T., Plass-Dulmer, C., Martinez, M., Lelieveld, J., and Harder, H.: Characterisation of an inlet pre-injector laser-induced fluorescence instrument for the measurement of atmospheric hydroxyl radicals, Atmos. Meas. Tech., 7, 3413–3430, https://doi.org/10.5194/amt-7-3413-2014, 2014a.
Orlando, J. J. and Tyndall, G. S.: Laboratory studies of organic peroxy radical chemistry: an overview with emphasis on recent issues of atmospheric significance, Chem. Soc. Rev., 41, 6294–6317, https://doi.org/10.1039/c2cs35166h, 2012.
Penkett, S. A., Clemitshaw, K. C., Savage, N. H., Burgess, R. A., Cardenas, L. M., Carpenter, L. J., McFadyen, G. G., and Cape, J. N.: Studies of oxidant production at the Weybourne Atmospheric Observatory in summer and winter conditions, J. Atmos. Chem., 33, 111–128, https://doi.org/10.1023/A:1005969204215, 1999.
Ravishankara, A. R.: Heterogeneous and multiphase chemistry in the troposphere, Science, 276, 1058–1065, https://doi.org/10.1126/science.276.5315.1058, 1997.
Reed, C., Brumby, C. A., Crilley, L. R., Kramer, L. J., Bloss, W. J., Seakins, P. W., Lee, J. D., and Carpenter, L. J.: HONO measurement by differential photolysis, Atmos. Meas. Tech., 9, 2483–2495, https://doi.org/10.5194/amt-9-2483-2016, 2016.
Ren, X. R., Harder, H., Martinez, M., Lesher, R. L., Oliger, A., Shirley, T., Adams, J., Simpas, J. B., and Brune, W. H.: HOx concentrations and OH reactivity observations in New York City during PMTACS-NY2001, Atmos. Environ., 37, 3627–3637, https://doi.org/10.1016/S1352-2310(03)00460-6, 2003.
Ren, X. R., Olson, J. R., Crawford, J. H., Brune, W. H., Mao, J. Q., Long, R. B., Chen, Z., Chen, G., Avery, M. A., Sachse, G. W., Barrick, J. D., Diskin, G. S., Huey, L. G., Fried, A., Cohen, R. C., Heikes, B., Wennberg, P. O., Singh, H. B., Blake, D. R., and Shetter, R. E.: HOx chemistry during INTEX-A 2004: Observation, model calculation, and comparison with previous studies, J. Geophys. Res.-Atmos., 113, D05310, https://doi.org/10.1029/2007jd009166, 2008.
Robbins, R. C., Borg, K. M., and Robinson, E.: Carbon monoxide in the atmosphere, J. Air Pollut. Control. Assoc., 18, 106–110, https://doi.org/10.1080/00022470.1968.10469094, 1968.
Sadanaga, Y., Yoshino, A., Watanabe, K., Yoshioka, A., Wakazono, Y., Kanaya, Y., and Kajii, Y.: Development of a measurement system of OH reactivity in the atmosphere by using a laser-induced pump and probe technique, Rev. Sci. Instrum., 75, 2648–2655, https://doi.org/10.1063/1.1775311, 2004.
Saunders, S. M., Jenkin, M. E., Derwent, R. G., and Pilling, M. J.: World Wide Web site of a Master Chemical Mechanism (MCM) for use in tropospheric chemistry models, Atmos. Environ., 31, 1249–1249, https://doi.org/10.1016/S1352-2310(97)85197-7, 1997.
Saunders, S. M., Jenkin, M. E., Derwent, R. G., and Pilling, M. J.: Protocol for the development of the Master Chemical Mechanism, MCM v3 (Part A): tropospheric degradation of non-aromatic volatile organic compounds, Atmos. Chem. Phys., 3, 161–180, https://doi.org/10.5194/acp-3-161-2003, 2003.
Sinha, V., Williams, J., Crowley, J. N., and Lelieveld, J.: The comparative reactivity method – a new tool to measure total OH reactivity in ambient air, Atmos. Chem. Phys., 8, 2213–2227, https://doi.org/10.5194/acp-8-2213-2008, 2008.
Slater, E. J., Whalley, L. K., Woodward-Massey, R., Ye, C., Lee, J. D., Squires, F., Hopkins, J. R., Dunmore, R. E., Shaw, M., Hamilton, J. F., Lewis, A. C., Crilley, L. R., Kramer, L., Bloss, W., Vu, T., Sun, Y., Xu, W., Yue, S., Ren, L., Acton, W. J. F., Hewitt, C. N., Wang, X., Fu, P., and Heard, D. E.: Elevated levels of OH observed in haze events during wintertime in central Beijing, Atmos. Chem. Phys., 20, 14847–14871, https://doi.org/10.5194/acp-20-14847-2020, 2020.
Smith, S. C.: Atmospheric measurements of OH and HO2 using the FAGE technique: Instrument development and data analysis, PhD thesis, School of Chemistry, University of Leeds, available from University of Leeds Library 2007.
Sommariva, R., Haggerstone, A.-L., Carpenter, L. J., Carslaw, N., Creasey, D. J., Heard, D. E., Lee, J. D., Lewis, A. C., Pilling, M. J., and Zádor, J.: OH and HO2 chemistry in clean marine air during SOAPEX-2, Atmos. Chem. Phys., 4, 839–856, https://doi.org/10.5194/acp-4-839-2004, 2004.
Sommariva, R., Bloss, W. J., Brough, N., Carslaw, N., Flynn, M., Haggerstone, A. L., Heard, D. E., Hopkins, J. R., Lee, J. D., Lewis, A. C., McFiggans, G., Monks, P. S., Penkett, S. A., Pilling, M. J., Plane, J. M. C., Read, K. A., Saiz-Lopez, A., Rickard, A. R., and Williams, P. I.: OH and HO2 chemistry during NAMBLEX: roles of oxygenates, halogen oxides and heterogeneous uptake, Atmos. Chem. Phys., 6, 1135–1153, https://doi.org/10.5194/acp-6-1135-2006, 2006.
Sommariva, R., Hollis, L., Sherwen, T., R Baker, A., M Ball, S., J Bandy, B., G Bell, T., N Chowdhury, M., Cordell, R., Evans, M., D Lee, J., Reed, C. E Reeves, C., M Roberts, J., Yang, M., and Monks, P.: Seasonal and geographical variability of nitryl chloride and its precursors in Northern Europe, Atmos. Sci. Lett., 19, e844, https://doi.org/10.1002/asl.844, 2018.
Sommariva, R., Cox, S., Martin, C., Boroñska, K., Young, J., Jimack, P. K., Pilling, M. J., Matthaios, V. N., Nelson, B. S., Newland, M. J., Panagi, M., Bloss, W. J., Monks, P. S., and Rickard, A. R.: AtChem (version 1), an open-source box model for the Master Chemical Mechanism, Geosci. Model Dev., 13, 169–183, https://doi.org/10.5194/gmd-13-169-2020, 2020.
Song, H., Chen, X., Lu, K., Zou, Q., Tan, Z., Fuchs, H., Wiedensohler, A., Moon, D. R., Heard, D. E., Baeza-Romero, M. T., Zheng, M., Wahner, A., Kiendler-Scharr, A., and Zhang, Y.: Influence of aerosol copper on HO2 uptake: a novel parameterized equation, Atmos. Chem. Phys., 20, 15835–15850, https://doi.org/10.5194/acp-20-15835-2020, 2020.
Stone, D., Whalley, L. K., Ingham, T., Edwards, P. M., Cryer, D. R., Brumby, C. A., Seakins, P. W., and Heard, D. E.: Measurement of OH reactivity by laser flash photolysis coupled with laser-induced fluorescence spectroscopy, Atmos. Meas. Tech., 9, 2827–2844, https://doi.org/10.5194/amt-9-2827-2016, 2016.
Stone, D., Sherwen, T., Evans, M. J., Vaughan, S., Ingham, T., Whalley, L. K., Edwards, P. M., Read, K. A., Lee, J. D., Moller, S. J., Carpenter, L. J., Lewis, A. C., and Heard, D. E.: Impacts of bromine and iodine chemistry on tropospheric OH and HO2: comparing observations with box and global model perspectives, Atmos. Chem. Phys., 18, 3541–3561, https://doi.org/10.5194/acp-18-3541-2018, 2018.
Tan, Z., Fuchs, H., Lu, K., Hofzumahaus, A., Bohn, B., Broch, S., Dong, H., Gomm, S., Häseler, R., He, L., Holland, F., Li, X., Liu, Y., Lu, S., Rohrer, F., Shao, M., Wang, B., Wang, M., Wu, Y., Zeng, L., Zhang, Y., Wahner, A., and Zhang, Y.: Radical chemistry at a rural site (Wangdu) in the North China Plain: observation and model calculations of OH, HO2 and RO2 radicals, Atmos. Chem. Phys., 17, 663–690, https://doi.org/10.5194/acp-17-663-2017, 2017.
Tan, Z., Rohrer, F., Lu, K., Ma, X., Bohn, B., Broch, S., Dong, H., Fuchs, H., Gkatzelis, G. I., Hofzumahaus, A., Holland, F., Li, X., Liu, Y., Liu, Y., Novelli, A., Shao, M., Wang, H., Wu, Y., Zeng, L., Hu, M., Kiendler-Scharr, A., Wahner, A., and Zhang, Y.: Wintertime photochemistry in Beijing: observations of ROx radical concentrations in the North China Plain during the BEST-ONE campaign, Atmos. Chem. Phys., 18, 12391–12411, https://doi.org/10.5194/acp-18-12391-2018, 2018.
Tan, Z., Lu, K., Hofzumahaus, A., Fuchs, H., Bohn, B., Holland, F., Liu, Y., Rohrer, F., Shao, M., Sun, K., Wu, Y., Zeng, L., Zhang, Y., Zou, Q., Kiendler-Scharr, A., Wahner, A., and Zhang, Y.: Experimental budgets of OH, HO2, and RO2 radicals and implications for ozone formation in the Pearl River Delta in China 2014, Atmos. Chem. Phys., 19, 7129–7150, https://doi.org/10.5194/acp-19-7129-2019, 2019.
Vaughan, S., Ingham, T., Whalley, L. K., Stone, D., Evans, M. J., Read, K. A., Lee, J. D., Moller, S. J., Carpenter, L. J., Lewis, A. C., Fleming, Z. L., and Heard, D. E.: Seasonal observations of OH and HO2 in the remote tropical marine boundary layer, Atmos. Chem. Phys., 12, 2149–2172, https://doi.org/10.5194/acp-12-2149-2012, 2012.
Wang, S., Wu, R., Berndt, T., Ehn, M., and Wang, L.: Formation of Highly Oxidized Radicals and Multifunctional Products from the Atmospheric Oxidation of Alkylbenzenes, Environ. Sci. Technol., 51, 8442–8449, https://doi.org/10.1021/acs.est.7b02374, 2017.
Whalley, L. K., Furneaux, K. L., Goddard, A., Lee, J. D., Mahajan, A., Oetjen, H., Read, K. A., Kaaden, N., Carpenter, L. J., Lewis, A. C., Plane, J. M. C., Saltzman, E. S., Wiedensohler, A., and Heard, D. E.: The chemistry of OH and HO2 radicals in the boundary layer over the tropical Atlantic Ocean, Atmos. Chem. Phys., 10, 1555–1576, https://doi.org/10.5194/acp-10-1555-2010, 2010.
Whalley, L. K., Edwards, P. M., Furneaux, K. L., Goddard, A., Ingham, T., Evans, M. J., Stone, D., Hopkins, J. R., Jones, C. E., Karunaharan, A., Lee, J. D., Lewis, A. C., Monks, P. S., Moller, S. J., and Heard, D. E.: Quantifying the magnitude of a missing hydroxyl radical source in a tropical rainforest, Atmos. Chem. Phys., 11, 7223–7233, https://doi.org/10.5194/acp-11-7223-2011, 2011.
Whalley, L. K., Blitz, M. A., Desservettaz, M., Seakins, P. W., and Heard, D. E.: Reporting the sensitivity of laser-induced fluorescence instruments used for HO2 detection to an interference from RO2 radicals and introducing a novel approach that enables HO2 and certain RO2 types to be selectively measured, Atmos. Meas. Tech., 6, 3425–3440, https://doi.org/10.5194/amt-6-3425-2013, 2013.
Whalley, L. K., Stone, D., Bandy, B., Dunmore, R., Hamilton, J. F., Hopkins, J., Lee, J. D., Lewis, A. C., and Heard, D. E.: Atmospheric OH reactivity in central London: observations, model predictions and estimates of in situ ozone production, Atmos. Chem. Phys., 16, 2109–2122, https://doi.org/10.5194/acp-16-2109-2016, 2016.
Whalley, L. K., Stone, D., Dunmore, R., Hamilton, J., Hopkins, J. R., Lee, J. D., Lewis, A. C., Williams, P., Kleffmann, J., Laufs, S., Woodward-Massey, R., and Heard, D. E.: Understanding in situ ozone production in the summertime through radical observations and modelling studies during the Clean air for London project (ClearfLo), Atmos. Chem. Phys., 18, 2547–2571, https://doi.org/10.5194/acp-18-2547-2018, 2018.
Whalley, L. K., Slater, E. J., Woodward-Massey, R., Ye, C., Lee, J. D., Squires, F., Hopkins, J. R., Dunmore, R. E., Shaw, M., Hamilton, J. F., Lewis, A. C., Mehra, A., Worrall, S. D., Bacak, A., Bannan, T. J., Coe, H., Ouyang, B., Jones, R. L., Crilley, L. R., Kramer, L. J., Bloss, W. J., Vu, T., Kotthaus, S., Grimmond, S., Sun, Y., Xu, W., Yue, S., Ren, L., Acton, W. J. F., Hewitt, C. N., Wang, X., Fu, P., and Heard, D. E.: Evaluating the sensitivity of radical chemistry and ozone formation to ambient VOCs and NOx in Beijing, Atmos. Chem. Phys., 21, 2125–2147, https://doi.org/10.5194/acp-21-2125-2021, 2021.
Woodward-Massey, R.: Observations of radicals in the atmosphere: measurement validation and model comparisons, PhD Thesis, School of Chemistry, University of Leeds, White Rose, https://etheses.whiterose.ac.uk/22164/ (last access: 13 November 2023), 2018.
Woodward-Massey, R., Slater, E. J., Alen, J., Ingham, T., Cryer, D. R., Stimpson, L. M., Ye, C., Seakins, P. W., Whalley, L. K., and Heard, D. E.: Implementation of a chemical background method for atmospheric OH measurements by laser-induced fluorescence: characterisation and observations from the UK and China, Atmos. Meas. Tech., 13, 3119–3146, https://doi.org/10.5194/amt-13-3119-2020, 2020.
Worton, D. R., Reeves, C. E., Penkett, S. A., Sturges, W. T., Slemr, J., Oram, D. E., Bandy, B. J., Bloss, W. J., Carslaw, N., Davey, J., Emmerson, K. M., Gravestock, T. J., Hamilton, J. F., Heard, D. E., Hopkins, J. R., Hulse, A., Ingram, T., Jacob, M. J., Lee, J. D., Leigh, R. J., Lewis, A. C., Monks, P. S., and Smith, S. C.: Alkyl nitrate photochemistry during the tropospheric organic chemistry experiment, Atmos. Environ., 44, 773–785, https://doi.org/10.1016/j.atmosenv.2009.11.038, 2010.
Zha, Q., Yan, C., Junninen, H., Riva, M., Sarnela, N., Aalto, J., Quéléver, L., Schallhart, S., Dada, L., Heikkinen, L., Peräkylä, O., Zou, J., Rose, C., Wang, Y., Mammarella, I., Katul, G., Vesala, T., Worsnop, D. R., Kulmala, M., Petäjä, T., Bianchi, F., and Ehn, M.: Vertical characterization of highly oxygenated molecules (HOMs) below and above a boreal forest canopy, Atmos. Chem. Phys., 18, 17437–17450, https://doi.org/10.5194/acp-18-17437-2018, 2018.
Zhang, L., Brook, J. R., and Vet, R.: A revised parameterization for gaseous dry deposition in air-quality models, Atmos. Chem. Phys., 3, 2067–2082, https://doi.org/10.5194/acp-3-2067-2003, 2003.