the Creative Commons Attribution 4.0 License.
the Creative Commons Attribution 4.0 License.
 | 20 Nov 2023
Climatology, sources, and transport characteristics of observed water vapor extrema in the lower stratosphere
Cameron R. Homeyer
Stratospheric water vapor (H2O) is a substantial component of the global radiation budget and therefore important to variability in the climate system. Efforts to understand the distribution, transport, and sources of stratospheric water vapor have increased in recent years, with many studies utilizing long-term satellite observations. Previous work to examine stratospheric H2O extrema has typically focused on the stratospheric overworld (pressures ≤ 100 hPa) to ensure the observations used are truly stratospheric. However, this leads to the broad exclusion of the lowermost stratosphere, which can extend over depths of more than 5 km below the 100 hPa level in the midlatitudes and polar regions and has been shown to be the largest contributing layer to the stratospheric H2O feedback. Moreover, focusing on the overworld only can lead to a large underestimation of stratospheric H2O extrema occurrence. Therefore, we expand on previous work by examining 16 years of Microwave Limb Sounder (MLS) observations of water vapor extrema (≥ 8 ppmv) in both the stratospheric overworld and the lowermost stratosphere to create a new lower-stratosphere climatology. The resulting frequency of H2O extrema increases by more than 300 % globally compared to extrema frequencies within stratospheric overworld observations only, though the percentage increase varies substantially by region and season. Additional context is provided for this climatology through a backward isentropic trajectory analysis to identify potential sources of the extrema. We show that, in general, tropopause-overshooting convection presents itself as a likely source of H2O extrema in much of the world, while meridional isentropic transport of air from the tropical upper troposphere to the extratropical lower stratosphere is also possible.
- Article
(16578 KB) - Full-text XML
- BibTeX
- EndNote


The troposphere and stratosphere are fundamentally different in their composition of atmospheric trace gases. For example, while abundant in the troposphere, water vapor (H2O) in the stratosphere is uniformly low. In the lower stratosphere (LS), however, the per molecule radiative forcing of H2O is maximized, where even small increases (on the order of < 1 ppmv) can lead to substantial surface warming (Solomon et al., 2010; Dessler et al., 2013; Wang et al., 2017). An understanding of the sources and controls of stratospheric water vapor is therefore essential for improving our understanding of the climate system. This is especially valuable due to the implications of stratospheric H2O acting as a positive climate feedback, where stratospheric H2O concentrations increase in response to anthropogenic global warming (Dessler et al., 2013; Banerjee et al., 2019; Konopka et al., 2022; Nowack et al., 2023). Therefore, it is vital to understand processes that facilitate the cross-tropopause transport of air. This transport, known as stratosphere–troposphere exchange (STE), can significantly and rapidly alter the composition and therefore radiative forcing of the upper troposphere and lower stratosphere (UTLS).
The LS can be categorized into two separate regions: the extratropical lowermost stratosphere (LMS) and the stratospheric overworld. The stratospheric overworld is conventionally defined where potential temperature, θ, is at least 380 K such that isentropes of the stratospheric overworld remain above the tropopause globally (e.g., Hoskins, 1991; Holton et al., 1995; Stohl et al., 2003). The remaining portion of the stratosphere is the LMS, which lies above the extratropical tropopause but below the 380 K isentrope (i.e., below the height of the tropical tropopause). Therefore, the total LS can be thought of as the combination of the LMS and the lower part (i.e., θ≤ 450 K, or ∼ 2–3 km above the tropical tropopause) of the stratospheric overworld. The concentration of H2O in the overworld is strongly correlated to and controlled by tropical tropopause temperatures, via the freeze-drying of air across the tropical tropopause as part of the ascending branch of the Brewer–Dobson circulation (e.g., Randel and Park, 2019; Mote et al., 1996). Alternatively, H2O in the LMS is impacted by both the downwelling branch of the Brewer–Dobson circulation and frequent STE, specifically troposphere-to-stratosphere transport (TST; Holton et al., 1995; Stohl et al., 2003), though the contributions of specific processes are still not well understood.
At larger scales, enhancements in LMS H2O concentrations can be linked to isentropic cross-tropopause transport. So-called “tropospheric intrusions” are driven by poleward Rossby wave breaking events and transport tropical upper-troposphere air to the extratropical LMS across the tropopause break near the subtropical jet (Pan et al., 2009; Homeyer et al., 2011; Homeyer and Bowman, 2013; Ploeger et al., 2013; Langille et al., 2020). Note that while a small population of these events have been shown to substantially moisten the LMS, tropospheric intrusions are frequently related to decreases in LMS H2O (Schwartz et al., 2015). Large-scale cross-tropopause transport can also be facilitated by isentropic ascent along the warm conveyor belts of midlatitude cyclones, which has been shown to transport H2O and boundary-layer pollutants into the LMS (Roiger et al., 2011; Stohl, 2001; Wernli and Bourqui, 2002). Isentropic transport related to monsoon dynamics – which is intrinsically linked with smaller-scale monsoon convection – has also been shown to substantially contribute to LMS H2O enhancements (e.g., Randel et al., 2010; Pan et al., 2016; Honomichl and Pan, 2020; Pan et al., 2022).
Tropopause-overshooting convection typically results in the most extreme localized stratospheric hydration. Both regional and global climatologies of deep convection show that convection overshoots the extratropical tropopause relatively frequently over land (and occasionally reaches the stratospheric overworld), especially in the Americas (Solomon et al., 2016; Cooney et al., 2018; Liu and Liu, 2016; Clapp et al., 2019; Liu et al., 2020; Homeyer and Bowman, 2021). While some studies identify a minimal role of convective contributions to stratospheric water vapor (∼ 10 %), these are typically restricted in focus to tropical convection and impacts on the stratospheric overworld (e.g., Dauhut and Hohenegger, 2022; Ueyama et al., 2023, and references therein). Studies that focus on convection within extratropical environments, subtropical environments, and monsoon regions often show substantial contributions from convection to the LMS H2O concentration locally (Hanisco et al., 2007; Dessler and Sherwood, 2004; Smith et al., 2017; Jensen et al., 2020; Tinney and Homeyer, 2021; Gordon and Homeyer, 2022; Phoenix and Homeyer, 2021; Homeyer et al., 2014; Hegglin et al., 2004; Mullendore et al., 2005; Schwartz et al., 2013; Werner et al., 2020; O'Neill et al., 2021). Overall, the contributions of any specific process to the stratospheric H2O budget, especially deep convection, remain a topic of scientific debate.
An important instrument that has been frequently employed in studying the global LS H2O is NASA's Microwave Limb Sounder (MLS). For example, Schwartz et al. (2013) and Werner et al. (2020) use MLS observations to assess the global distribution of high H2O concentrations at a pressure level of 100 hPa, which is commonly found at a similar level to the 380 K isentrope. Both studies show that high H2O concentrations (≥ 8 ppmv) are most frequent in monsoon-related active convection regions and therefore contribute to the growing body of evidence suggesting that convection is a substantial contributor to LS H2O, especially at a regional level. However, such studies do not evaluate the frequency of H2O enhancements in the LMS, which can encompass a layer 5 km or deeper below the 100 hPa and 380 K levels (Holton et al., 1995). Higher MLS pressure levels have not been considered in previous studies due to large latitudinal and seasonal variations in tropopause heights complicating the diagnosis of LMS layers. Unfortunately, this choice is likely to lead to substantial underestimations of both the frequency and the magnitude of enhanced LMS H2O concentrations. The potential for underestimation of convection-driven extrema specifically is expected to be impacted the most since convection-driven enhancements are typically confined to only a few kilometers above the tropopause (e.g., Tinney and Homeyer, 2021).
Therefore, this study intends to expand upon previous work by examining 16 years (2005–2020) of MLS H2O observations to create a climatology of H2O extrema in both the lowermost and the overworld stratosphere. To achieve this, we use reanalysis data to diagnose whether individual layers in an MLS profile are stratospheric, allowing for accounting of observed LMS H2O extrema for the first time. Additional context is provided for these observations through an isentropic back-trajectory analysis of common transport pathways and discussion of the potential roles of large-scale vs. convective sources.
2.1 Reanalysis
Three-hourly assimilations of the global atmosphere are employed from the NASA Modern-Era Retrospective Analysis for Research and Applications, version 2 (MERRA-2; Gelaro et al., 2017). Temperature, pressure, potential vorticity (PV), and wind fields are used in this study. MERRA-2 lapse-rate tropopause (LRT) heights and pressures are calculated according to the World Meteorological Organization (WMO) definition (WMO, 1957). MERRA-2 is available from 1979–present on an approximately 0.5∘ × 0.625∘ longitude–latitude grid with 72 vertical model levels, which corresponds to ∼ 1.1 km vertical resolution in the UTLS.
2.2 Global H2O observations
Measurements of H2O in the UTLS are sourced from the Earth Observing System (EOS) Microwave Limb Sounder (MLS) v5.0x dataset. The MLS is aboard the Aura spacecraft as part of the NASA A-Train constellation of sun-synchronous satellites, and has Equator crossing times of 01:30 and 13:30 LT. The instrument performs a continuous vertical scan of the atmosphere (surface – 90 km) in the forward direction of orbital motion, completing ∼ 3600 profiles per day with a 1.5∘ along-track separation between each scan (Livesey et al., 2020). Concentrations of 16 different trace gases have been collected globally by MLS since August 2004. The MLS retrieval range of H2O is 316–0.001 hPa, with measurements at 12 levels per decade of pressure in the UTLS. The precision, accuracy, horizontal resolution, and vertical resolution of the H2O measurement vary with height, ranging from 4 %–65 %, 4 %–25 %, 168–400 km, and 1.3–3.5 km, respectively, for pressures 316–1.0 hPa before degrading at lower pressures. Only MLS layers with pressures of 147 hPa and less are analyzed here, where the precision and accuracy of the measurement are more suitable for this study. The data are quality-controlled following the recommendations of Livesey et al. (2020). MLS v5.0x has a number of improvements on previous data versions, including partial amelioration of a calibration-related drift in the H2O measurement.
2.3 Stratospheric H2O extrema identification
MLS observations from 2005–2020 are utilized in conjunction with MERRA-2 data to assess the frequency of H2O extrema in the stratosphere. MERRA-2 LRT pressure, PV, and potential temperature (θ) are linearly interpolated in space and time to each MLS profile location and logarithmically interpolated vertically to the individual layers of each MLS profile. These atmospheric parameters are then employed to diagnose whether any individual MLS layer is located in the stratosphere. The most important aspect of this method is to balance the objective of retaining as many LMS observations as possible for analysis with the necessary condition that the identified stratospheric layers are free of tropospheric contamination (which would result in artificially high frequencies of stratospheric H2O extrema, especially in the LMS). This is particularly important due to the relative thickness of MLS layers and potential uncertainties in tropopause identification.
Employing a singular criterion, like a requirement that MLS layers be above the LRT, proved to be insufficient as LRT errors along the tropopause break led to large swaths of nonphysical extrema occurrences. Similarly, a single PV-based requirement showed clear tropospheric contamination in regions with frequent stratospheric intrusions (or tropopause folding events). Ultimately, a combination of multiple requirements is required to ensure that the limitations of any single stratospheric parameter do not lead to tropospheric contamination within the analysis. To determine appropriate thresholds for each requirement, the analysis was performed and subjectively evaluated with dozens of different threshold combinations until a suitable final set of criteria were selected. These criteria were chosen as they allowed for as many layers in the analysis as possible while still limiting tropospheric contamination (which is characterized by widespread, uniformly high frequencies of H2O extrema).
Therefore, based on the rigorous testing and evaluation described above, we require that layers meet a set of three criteria to be classified as wholly stratospheric: (1) PV ≥6 PVU, (2) log(PMLS) ≤ log(PLRT) − 0.075 (i.e., the layer must be at least ∼ 1 km above the LRT), and (3) θ≥340 K. While these criteria are applicable in the middle and high latitudes, they are inappropriate for application to tropical profiles due to PV converging to zero in this region. Therefore, we also consider MLS layers to be stratospheric if θ ≥ 380 K. As an upper limit for layers to be included in the analysis, we additionally require that layers have θ ≤ 450 K to restrict the analysis to lower-stratosphere layers only. This set of stringent criteria allows us to analyze observations characteristic of the extratropical LMS and ensure that tropospheric contamination is minimized. In a few rare circumstances, these criteria can be met within the deep tropics; an example of this is discussed in detail in Sect. 3.2.
For analysis, the wettest identified stratospheric MLS layers from each profile are collected in 5∘ latitude–longitude bins (i.e., only one layer from each profile is used). The frequency of H2O extrema (exceeding a given threshold) in each bin is then calculated. To quantify how inclusion of the LMS impacts the distribution and frequency of extrema identification, the same binning process is completed for stratospheric overworld (θ ≥ 380 K) observations only. Due to seasonal variation in the frequency, location, and magnitude of stratospheric H2O extrema, analysis is conducted separately for DJF (December, January, February), MAM (March, April, May), JJA (June, July, August), and SON (September, October, November) when necessary.
2.4 Trajectory analysis
To provide context for the LMS H2O extrema climatology, large-scale transport characteristics are explored via isentropic trajectory analyses. Trajectories are initialized at the latitude, longitude, and θ of stratospheric H2O extrema that occur within eight identified high-frequency regions shown in Fig. 1. Using the TRAJ3D trajectory model (Bowman, 1993; Bowman and Carrie, 2002), particles are advected backward in time using MERRA-2 winds for up to 10 d, with positions saved every 6 h along the trajectory path. Two-dimensional (latitude–longitude) frequency distributions of trajectory particle locations at multiple time intervals are used to identify common pathways to regions of frequent extrema. Given the MERRA-2 spatiotemporal resolution and wind field uncertainties, horizontal displacement errors of individual trajectories are expected to be ∼ 60 km d−1 (Bowman et al., 2013; Stohl et al., 1995), but these errors are largely irrelevant for examining the bulk transport behavior sought here. Evaluating the recent history of identified H2O extrema air masses helps to provide context for their potential (or likely) sources.
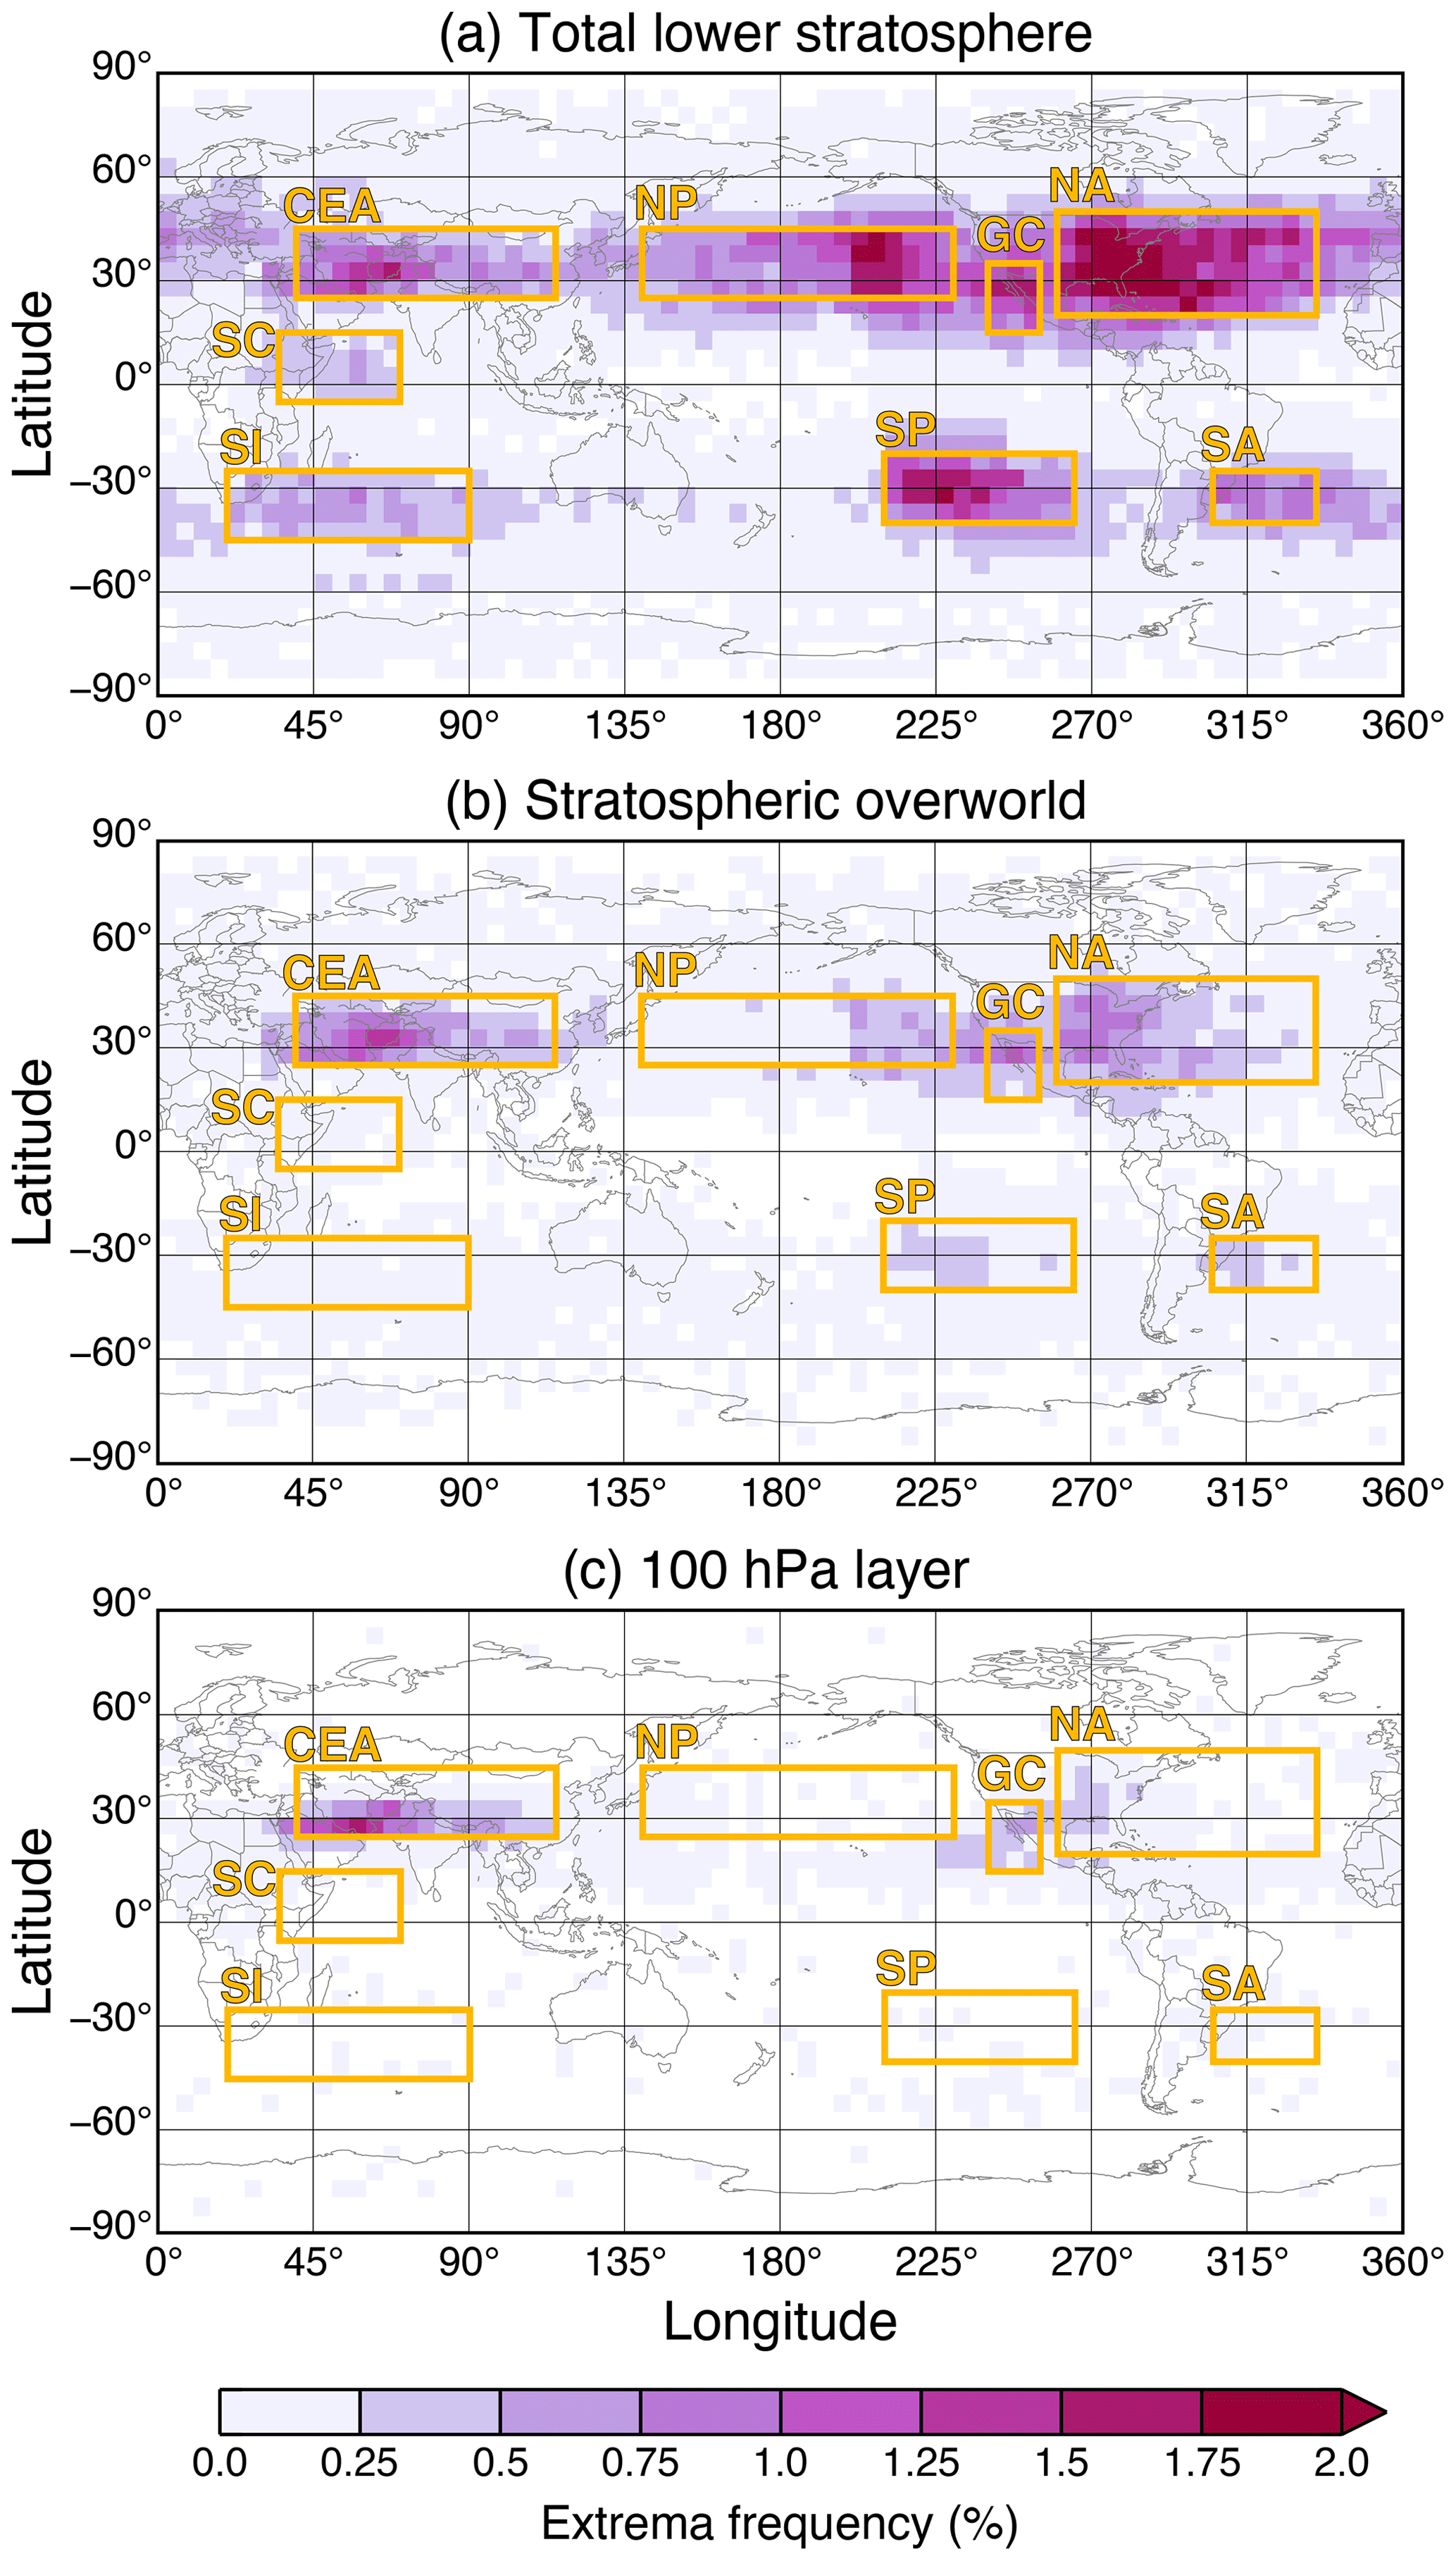
Figure 1Binned frequency of H2O extrema (≥ 8 ppmv) as observed by MLS for (a) layers classified as stratospheric, (b) overworld layers only, and (c) the 100 hPa layer only. Eight local maxima are classified into regions (gold) for further analysis.
2.5 Observations of convection
Observations of tropopause-overshooting convection are sourced from NASA's Global Precipitation Measurement (GPM) mission. The GPM core satellite was launched in 2014 and is able to measure precipitation characteristics in three dimensions, allowing for the detection of precipitation features from the tropics to the middle and high latitudes (Hou et al., 2014; Skofronick-Jackson et al., 2017; Nesbitt et al., 2000; Liu et al., 2008). These precipitation features can be used in combination with tropopause altitudes to identify overshooting convection. We use an extended record (2015–2020) of GPM overshoots that was originally produced for and analyzed in Liu et al. (2020), which has been updated to use the newer ECMWF Reanalysis version 5 (ERA5) LRT as a reference (Hersbach et al., 2020). Any precipitation feature (radar echo > 20 dBZ) found at an altitude above the ERA5 LRT altitude is classified as an overshoot. We use the resulting seasonal geographic distributions of overshoot frequency to provide context for the transport analysis in this study.
The analysis presented here was completed for three different thresholds of H2O extrema (8, 10, and 12 ppmv). As expected, the frequency of extrema identification decreases as the threshold increases. In general, the choice of threshold does not have a substantial impact on the global and seasonal distributions of extrema. For simplicity, we therefore present here the results for H2O extrema exceeding 8 ppmv only, as this is the most commonly used extrema threshold in prior work and provides the largest sample of extrema for analysis. Relevant discussion of sensitivities to the extrema threshold can be found in Sect. 4.
3.1 Extrema frequency
The frequency of H2O extrema in the total LS (overworld + LMS) and the overworld only is shown in Fig. 1a and b. Over most of the world, H2O concentrations exceeding 8 ppmv in the stratospheric overworld occur less than 0.25 % of the time. There are six notable geographic features where the frequency of extrema is maximized, which we highlight and subjectively classify into regions here: central and eastern Asia (CEA), the North Pacific (NP), the South Pacific (SP), the Gulf of California (GC), North America and the North Atlantic (NA), and finally South America and the South Atlantic (SA). The maximum frequency of overworld H2O extrema in each of these regions varies from ∼ 0.25 %–1.25 %. The CEA feature is the most pronounced in its spatial extent and magnitude, followed closely by the NA feature.
When this analysis is extended to include the LMS, the magnitude and spatial extent of nearly every feature increase, although the strength of the frequency change is variable across the domain (Fig. 1a). The NA, GC, NP, and SP maxima experience the greatest increases in frequency magnitude, exceeding 2 % in some locations, which is more than double that of their overworld counterparts. The SA feature displays a modest increase in frequency, with a maximum frequency of 1.25 %. Notably, the magnitude of extrema in the CEA region is minimally impacted by the inclusion of the LMS, which results in the central Asia maximum being one of the least pronounced features in the total LS, despite being the dominant region in the overworld-only analysis. This result is consistent with previous work showing that tropopause heights are anomalously high in the region and season of the Asian monsoon anticyclone, leading to a shallow – or non-existent – LMS in this region (Munchak and Pan, 2014). There are also two additional maxima that become apparent with the inclusion of the LMS: along and just east of the Somalian coast (SC) and over the southern Indian Ocean (SI). These features were not detectable in the overworld-only analysis, where, like in much of the rest of the world, the occurrence of H2O extrema did not exceed a frequency of 0.25 %. However, these maxima become comparable to the CEA feature in the total-LS analysis, with extrema frequencies reaching up to ∼ 1 %. In addition to changes in the magnitude of H2O extrema frequencies in the total-LS analysis for most features, the spatial extent of most features increases as well. Specifically, the features tend to be elongated zonally from their position in the overworld. This can most clearly be seen in the NA and SA features extending eastward over the Atlantic and the NP feature extending westward to far eastern Asia. This pattern of local extrema hot spots followed by downstream plumes of decreasing frequency is reasonable given typical mixing timescales (5–7 d; Homeyer et al., 2011) and average LS zonal flow. Put simply, a large initial H2O enhancement can be detectable for days as it is transported downstream before being fully mixed into the background stratosphere. Finally, it is important to note that all regions were subjectively chosen based on the locations of maxima in the total lower-stratosphere analysis.
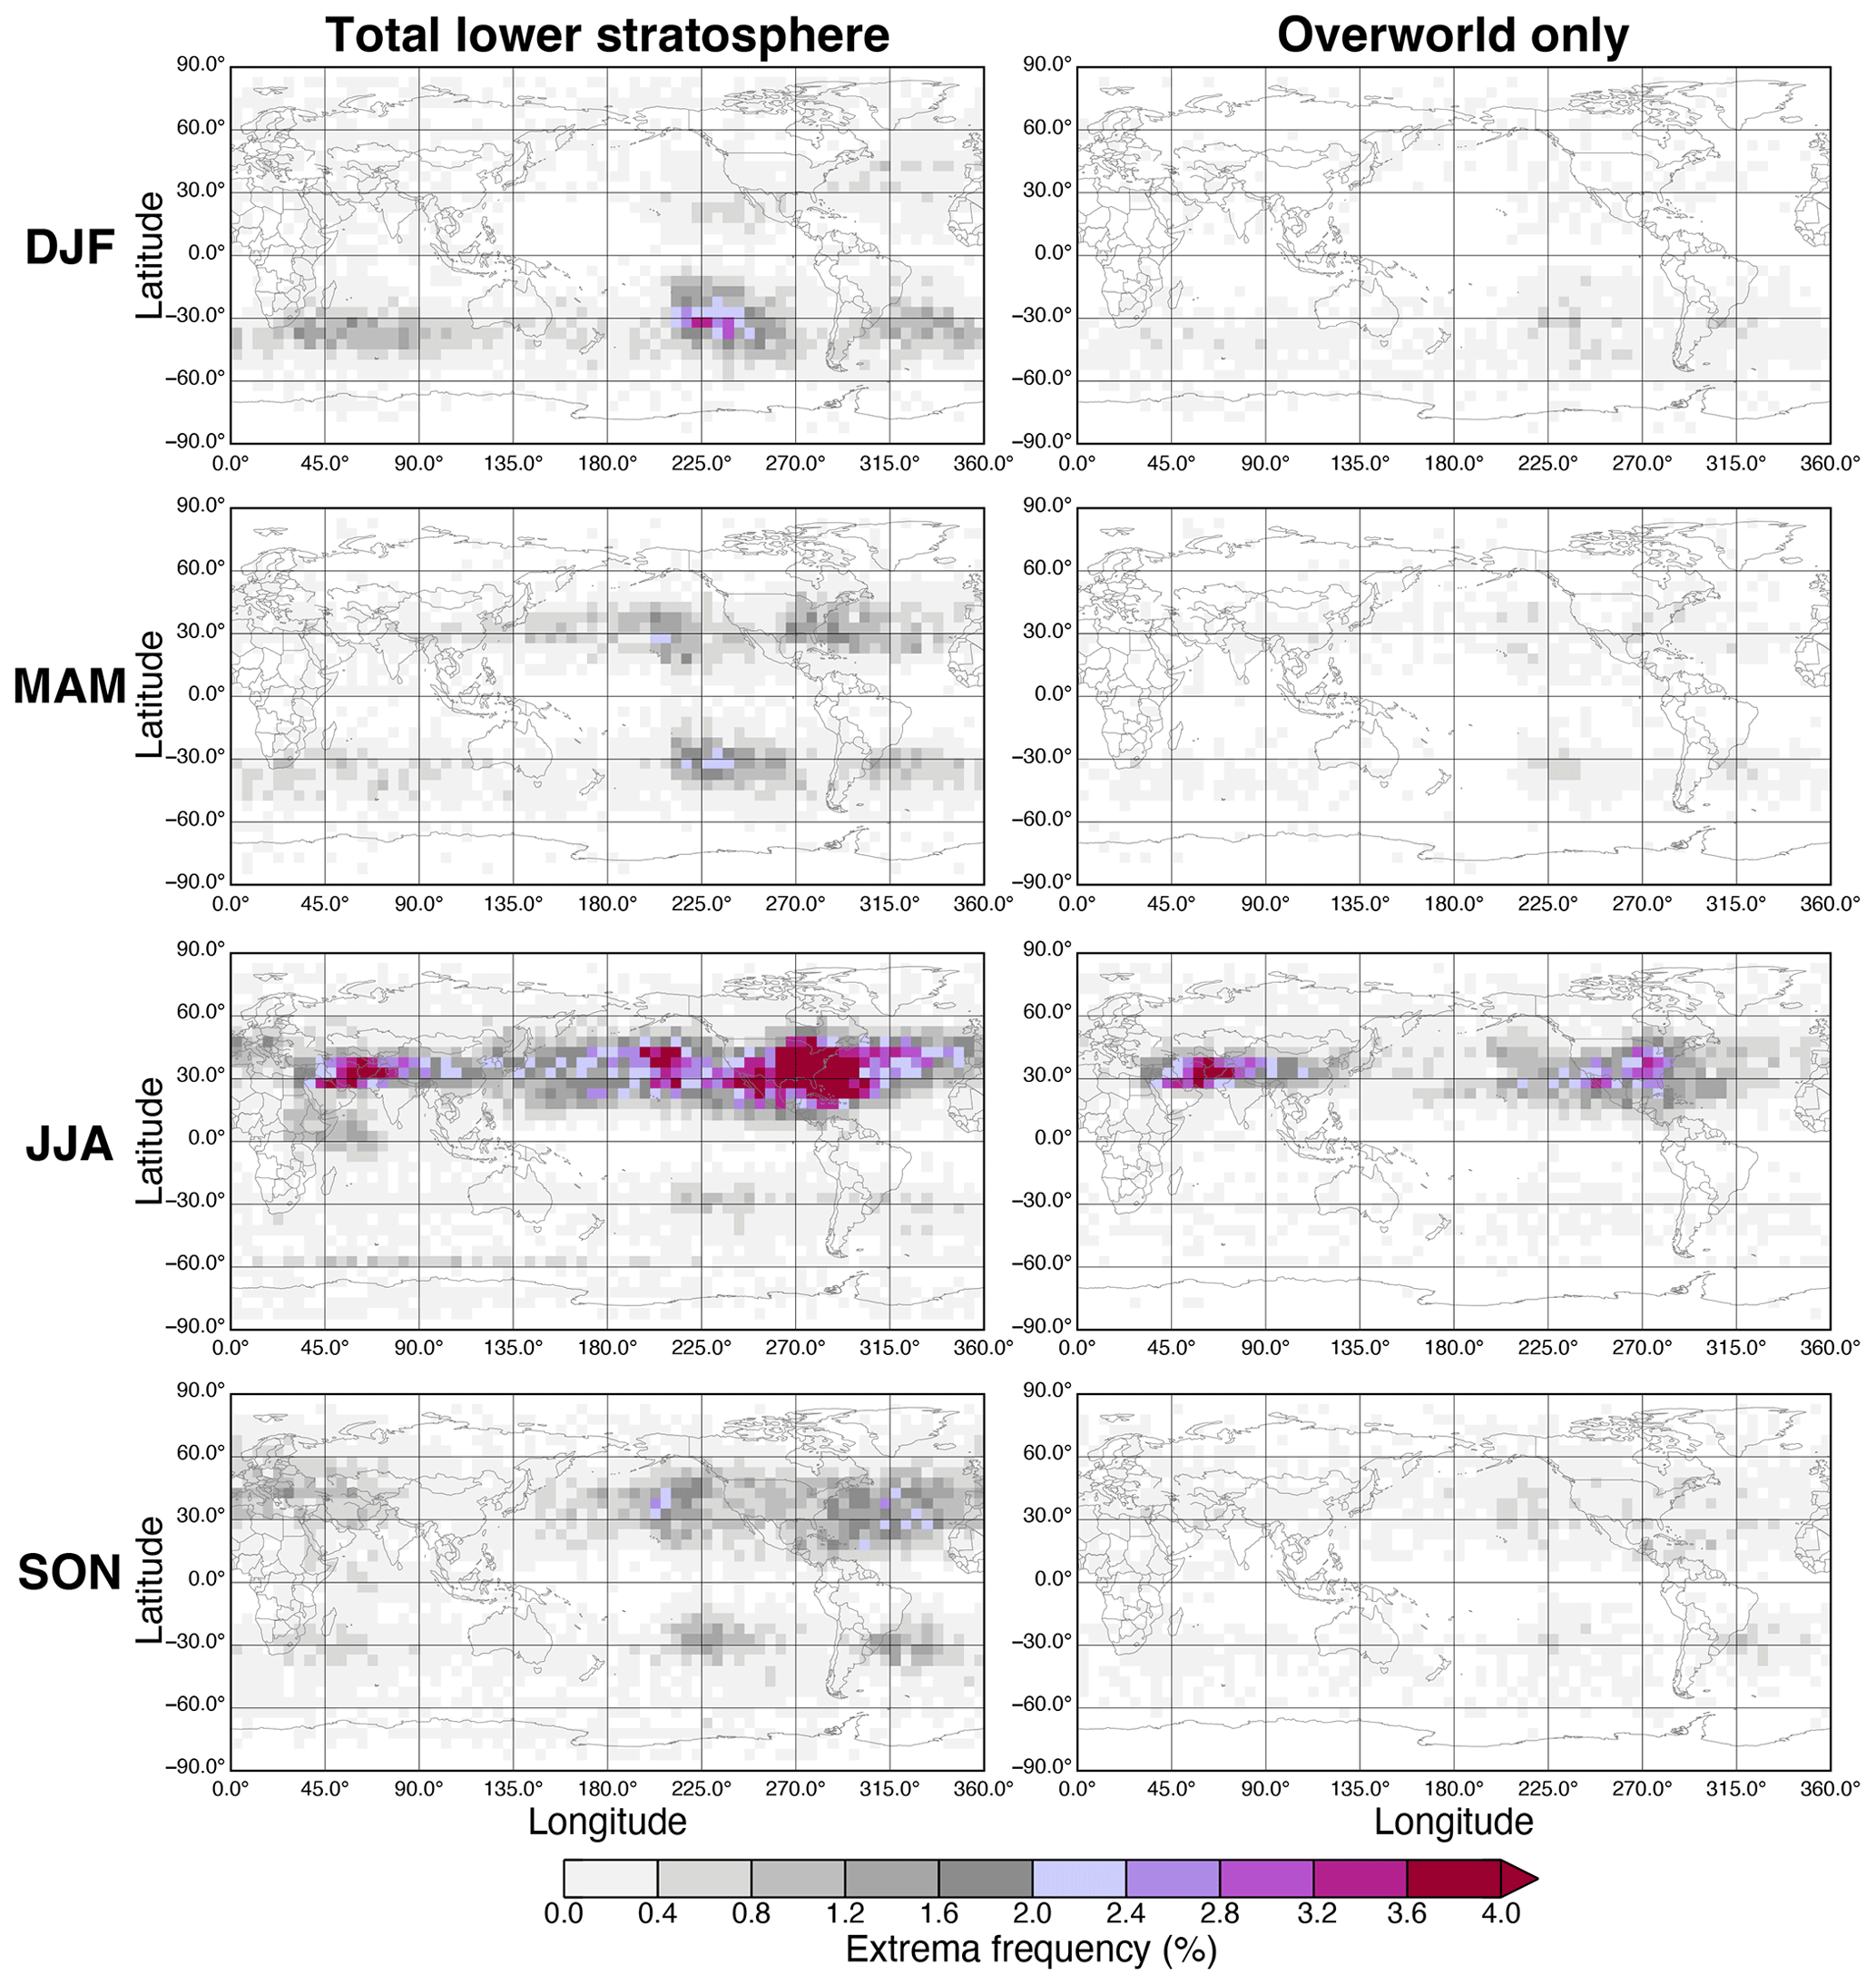
Figure 2Binned frequencies of MLS H2O extrema (≥ 8 ppmv) separated seasonally into December, January, and February (DJF; top row); March, April, and May (MAM; second row); June, July, and August (JJA; third row); and September, October, and November (SON; bottom row) for (left) lower-stratospheric layers and (right) stratospheric overworld layers only.
The prominent features over North America (both the NA and the GC regions), Asia (the CEA region), and South America (the SA region) have been seen in previous studies of MLS H2O extrema at the 100 and 82.5 hPa levels, and they have been linked to convective sources associated with the monsoon anticyclone circulations on these continents (e.g., Werner et al., 2020; Schwartz et al., 2013). In contrast, the maxima over the North Pacific and South Pacific (the NP and SP regions) and over the Indian Ocean (the SC and SI regions) have never been identified. This, combined with no major local convective features identified in previous analyses (e.g., Liu et al., 2020), may lead to some concerns that this result could be a nonphysical artifact of or error in the analysis. For this reason, we also apply our analysis to the 100 hPa layer only to allow for a comparison to previous work (Fig. 1c). These results are nearly identical to those shown in Werner et al. (2020) and Schwartz et al. (2013), with minor differences likely accounted for by the length of the MLS record used, bin sizes, and previous choices to exclude certain anomalous events that were not made here. Most importantly, the NP, SP, SC, and SI are not found in our 100 hPa only analysis. The similarity of the analysis presented here to the results in Schwartz et al. (2013) and Werner et al. (2020) provides confidence that the previously unseen features are not due to analysis error but rather due to the inclusion of additional MLS layers that can be classified as stratospheric. However, the presence of the LMS in the deep tropics where the SC region is located is – by definition – non-existent, which leads to a question of how the total-LS analysis indicates a local maximum over this region when it is not present in the stratospheric overworld. This is investigated further in the transport analysis below.
A seasonal breakdown of the H2O extrema patterns is shown in Fig. 2. In the Northern Hemisphere, JJA dominates the annual cycle in both the total LS and the overworld. In the NA and NP regions, the frequency of H2O extrema in JJA far surpasses that of any other season, with more than 4 % of total-LS observations exceeding 8 ppmv. The westward extent of NP maxima seen in Fig. 1 is even more evident when restricted to JJA only. MAM and SON have modest contributions to Northern Hemisphere extrema and are most substantial over the NP and NA regions, while DJF (boreal winter) frequencies are < 0.4 % across nearly the whole of the Northern Hemisphere. The significance of the Asian monsoon anticyclone is made apparent in the total-LS seasonal analysis where the CEA maximum is pronounced in JJA, while other features – such as NA maxima – are present in all seasons except for DJF. In the stratospheric overworld, however, locations over CEA and the NA regions exceed an extrema frequency of 0.8 % in JJA only.
In the Southern Hemisphere, DJF (austral summer) has the most prominent contribution to both LS and overworld extrema, though the overall annual cycle is far less clear than that of the Northern Hemisphere. The SP region is the dominant feature of the DJF analysis, with frequencies exceeding 2 %–3 % throughout the region. The SI and SA maxima are also noticeable in the DJF total-LS analysis, though their frequencies remain below 1.6 %. Similarly to their contributions in the Northern Hemisphere, MAM and SON feature modest frequencies of H2O concentrations exceeding 8 ppmv in the Southern Hemisphere, with the maximum over South America being the only notable feature in addition to that over the Pacific. Finally, Southern Hemisphere extrema in JJA (austral winter) are exceedingly rare.
3.2 Transport characteristics
To provide context for the extrema observations described above, we investigate the recent transport behavior of all LS H2O extrema located in the eight regions identified in Fig. 1 via an isentropic backward-trajectory analysis for the season in which the feature is most pronounced. This analysis serves as a complement to the extrema climatology presented above and allows us to investigate potential sources of extreme LS H2O. We show here and discuss in detail the statistical transport for a well-known H2O frequency maximum (the CEA region) and two unexpected maxima (the NP and SC regions). The transport analyses for the remaining regions are located in the Appendix.
The statistical transport behavior of H2O extrema located in the CEA region during JJA is shown in Fig. 3. Throughout the 10 d history, the vast majority of trajectory particles remain over Asia, indicating that the extrema air was confined within the summertime Asian monsoon anticyclone throughout its recent history. As expected, and consistent with previous studies (e.g., Bergman et al., 2013; Khaykin et al., 2022), this demonstrates that the frequent high LS H2O concentrations over this region are related to a combination of monsoon dynamics and convection. It is important to note, however, specific convective moistening of the particles along the trajectory path may have occurred before or at any time during the preceding 10 d period, as convective transport is not captured by these large-scale isentropic trajectories. For the NP maxima, transport is largely zonal along the subtropical jet axis (Fig. 4). At 4 d prior to the extrema observation, the highest-density area of trajectory particles is located over active overshooting convection areas across Asia, Siberia, and southern Russia, as observed by GPM, suggesting that convective moistening is a likely contributor to these extrema. A smaller, but still substantial, portion of trajectories can be traced back eastward to Central American convection 4 to 6 d previously. As demonstrated in Figs. 1 and 2, the frequency of H2O extrema in the eastern half of the defined NP region is approximately double that of the western half. This transport analysis suggests that Central American convection related to the North American monsoon anticyclone is at least partly responsible for the high frequency of extrema over the eastern North Pacific, which is consistent with recent work (Clapp et al., 2021). Another potential source for high LS H2O concentrations over the NP worth investigating would be poleward Rossby wave breaking transport of tropical/subtropical upper-troposphere air. The North Pacific is a location of frequent Rossby wave breaking (Homeyer and Bowman, 2013), and poleward wave breaking has the potential to transport relatively moist, tropical upper-tropospheric air into the lowermost stratosphere and contribute to this maximum (Langille et al., 2020). However, the lack of substantial meridional transport from the tropics (i.e., equatorward of the average tropopause break latitude) related to the observed extrema, outside of the aforementioned path from Central America, suggests that this method of stratospheric hydration may be limited when it comes to H2O concentrations exceeding 8 ppmv.
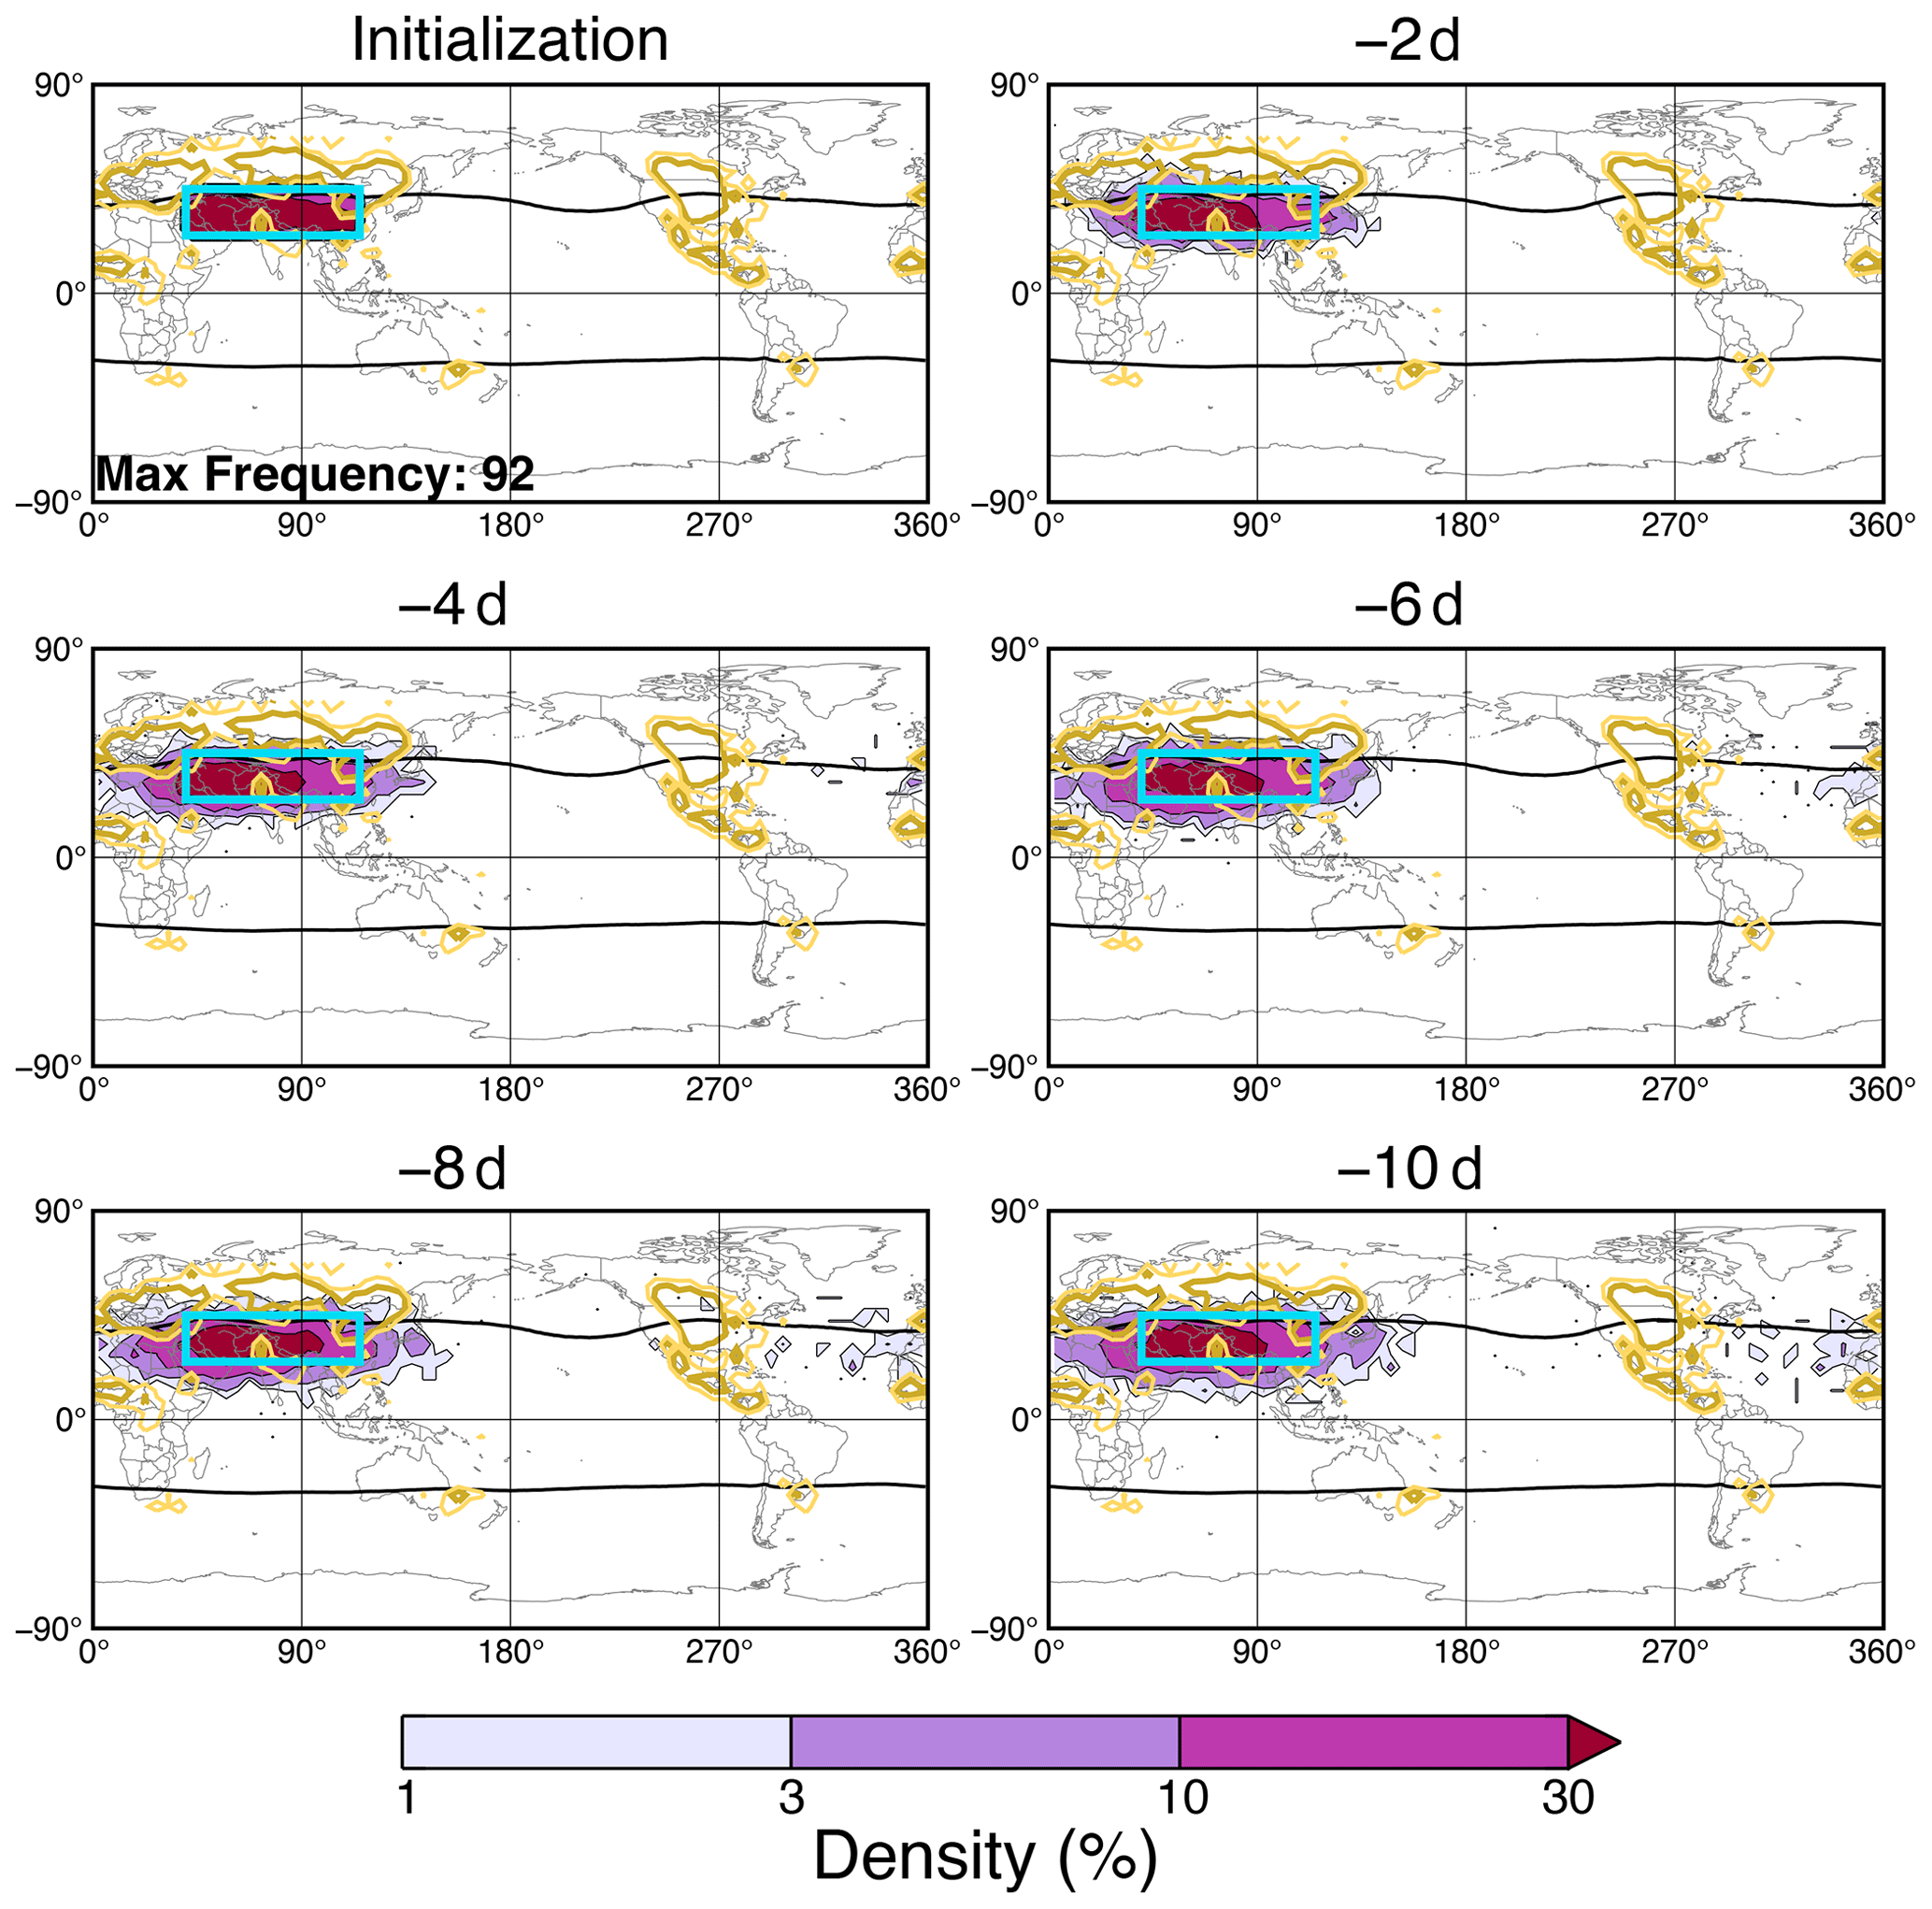
Figure 3Isentropic backward-trajectory analysis for H2O extrema in the CEA region (blue box) in JJA. The normalized density of trajectories at initialization and at 2, 4, 6, 8, and 10 d previously is shown by the color fill, with the maximum density value given in the initialization panel. The seasonal frequency of tropopause-overshooting convection as detected by GPM is given by the golden contours at intervals of overshoots per observation (lighter gold) and overshoots per observation (darker gold). The seasonal-average tropopause break (i.e., the location of the sharp discontinuity between tropical and extratropical tropopause heights) for each hemisphere is indicated by the solid black line.
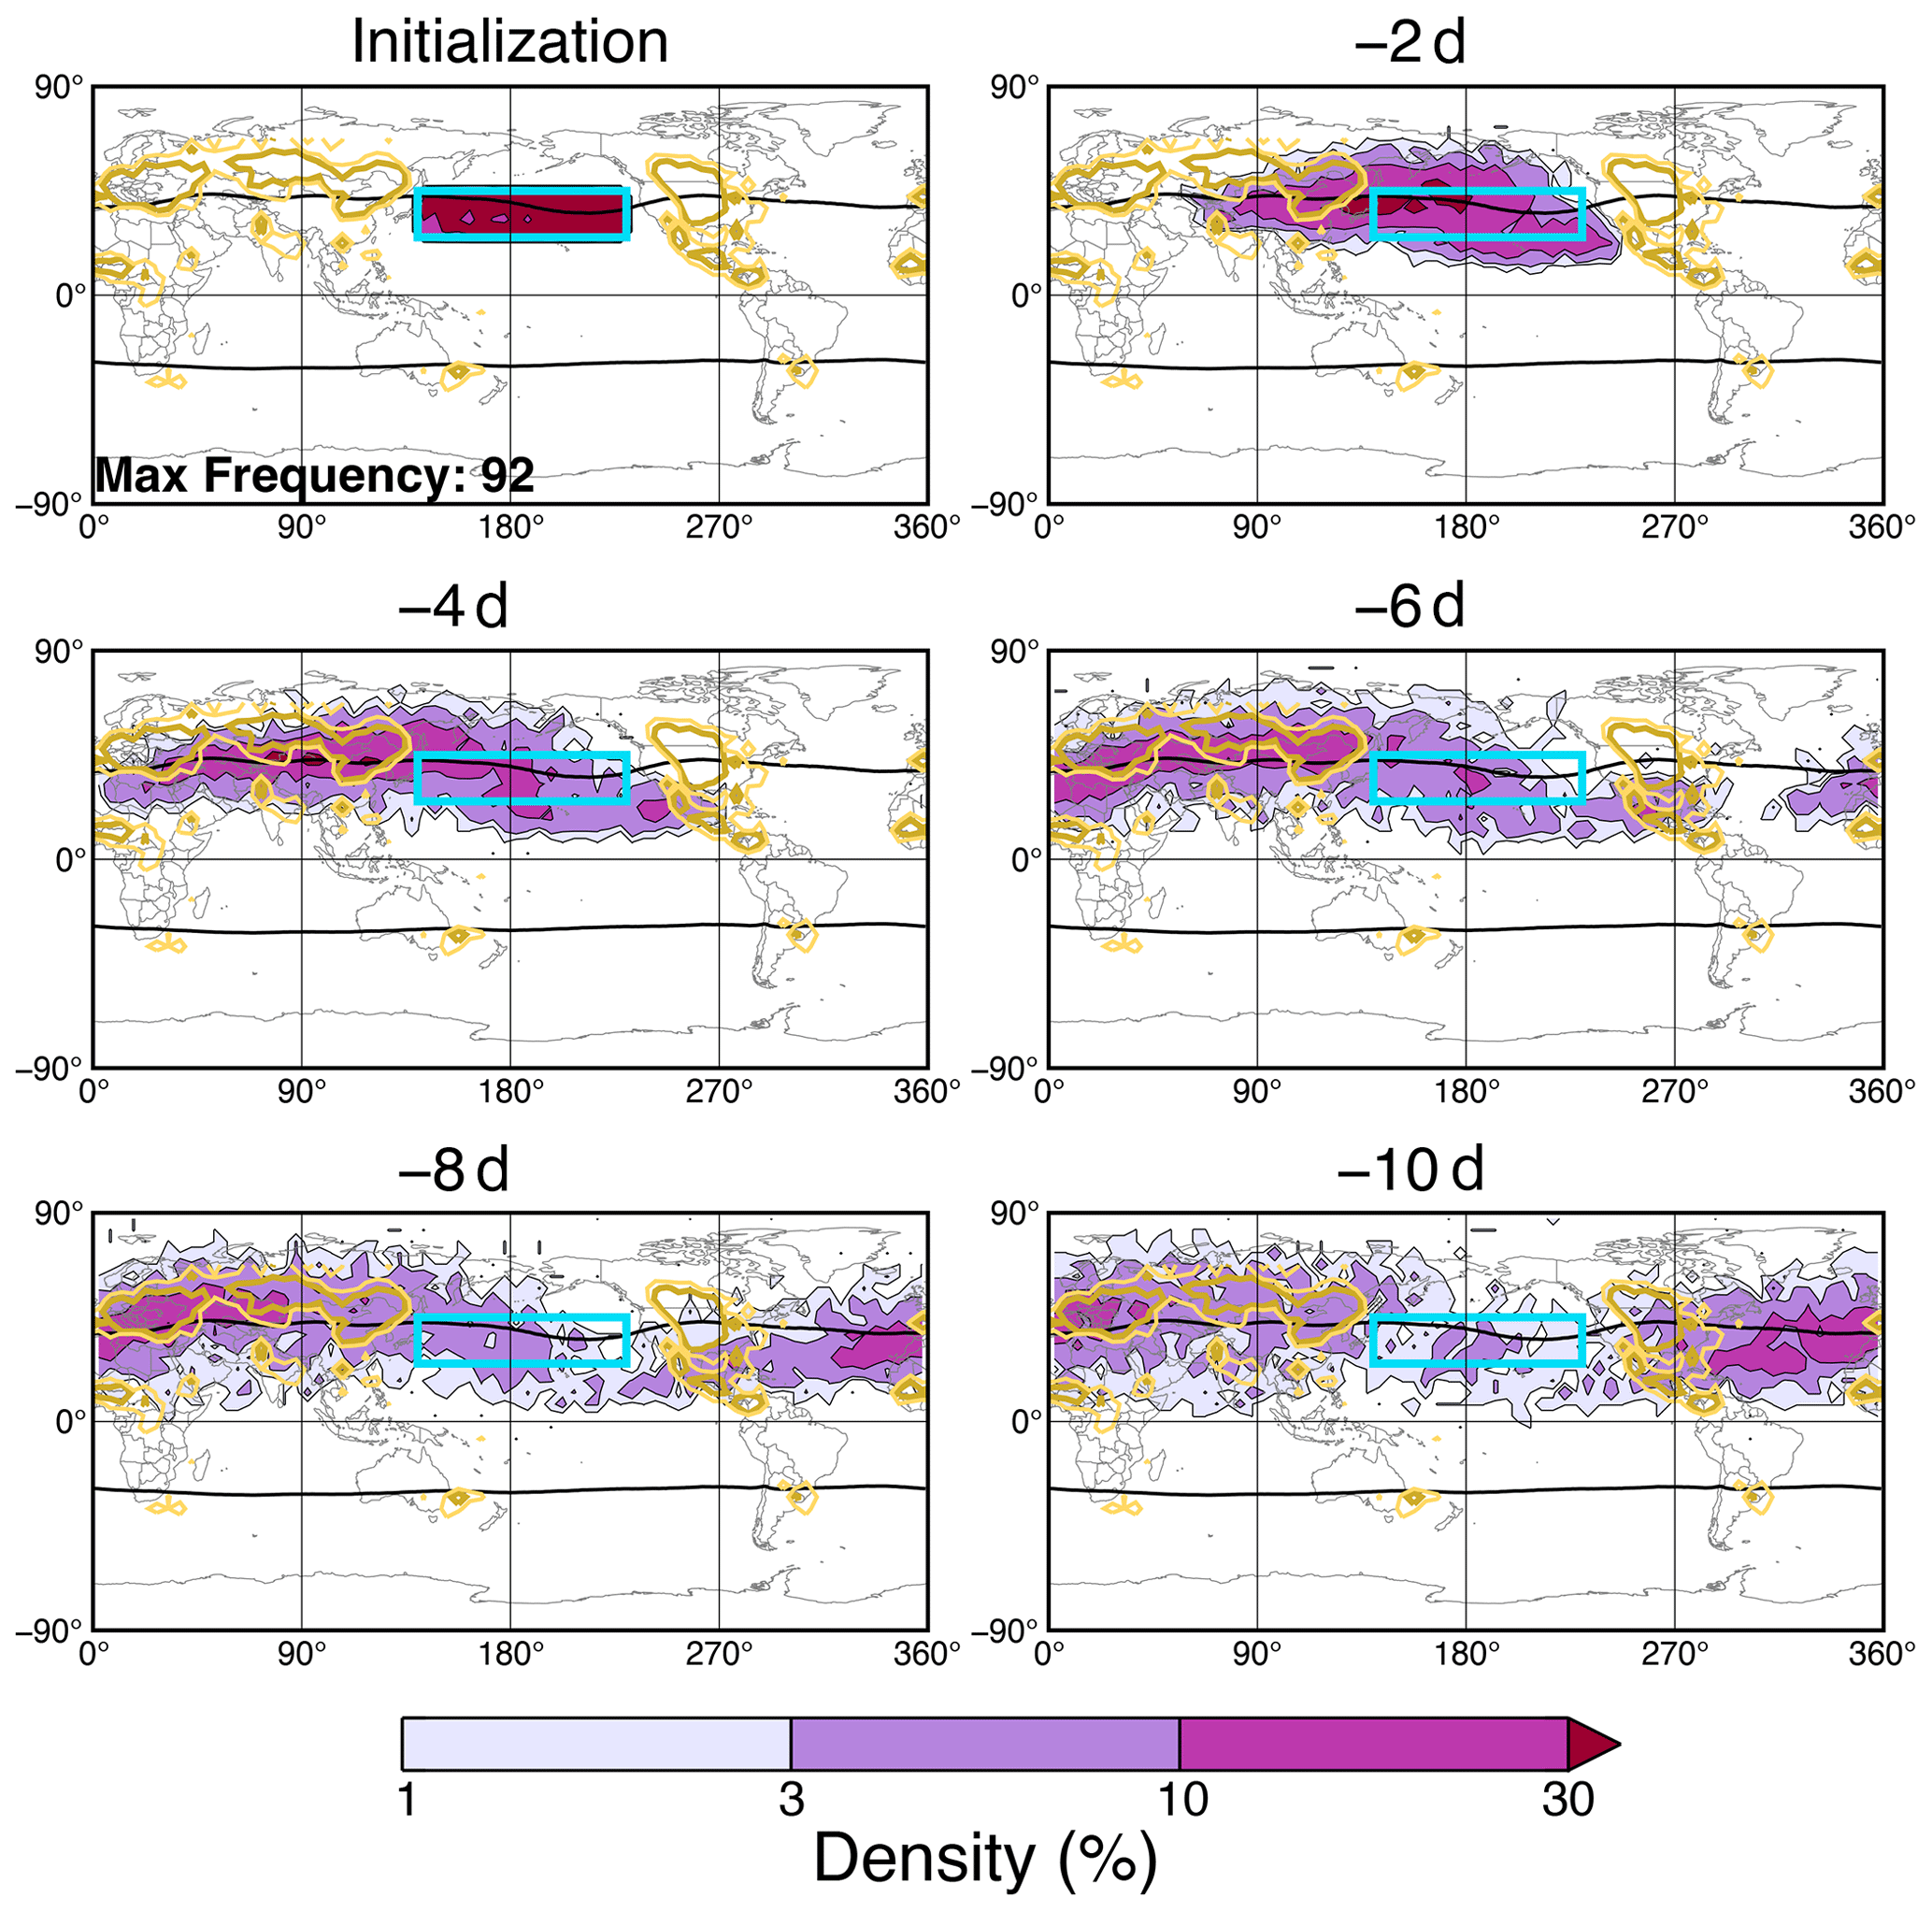
Figure 4As in Fig. 3 but for the NP region in JJA.
Finally, the transport history of the SC local maximum is shown in Fig. 5. As mentioned above, the existence of relatively high frequencies of H2O extrema in the SC region in the total-LS analysis, but not the overworld-only analysis, is theoretically impossible, as the LMS does not exist in the deep tropics. The transport behavior indicates that this air largely originated from southeast Asia as recently as 2 d previously and was located within the monsoon circulation for the preceding 10 d. The path of these trajectories largely resembles equatorward wave breaking of midlatitude LMS air along the eastern portion of the monsoon anticyclone shown in previous studies (e.g., Konopka et al., 2010). The transport of this air into the deep tropics would retain some characteristics of its source region for up to 1 week, namely higher PV and potential temperature, which is likely what allows for this air to meet the threshold requirements set here and be identified as LMS though it is encompassed by tropical upper-troposphere air. Additionally, LRT altitudes in this region are frequently identified as lower than in other regions located along the same latitude band (not shown), again suggesting a modification confined to this region due to monsoon dynamics.
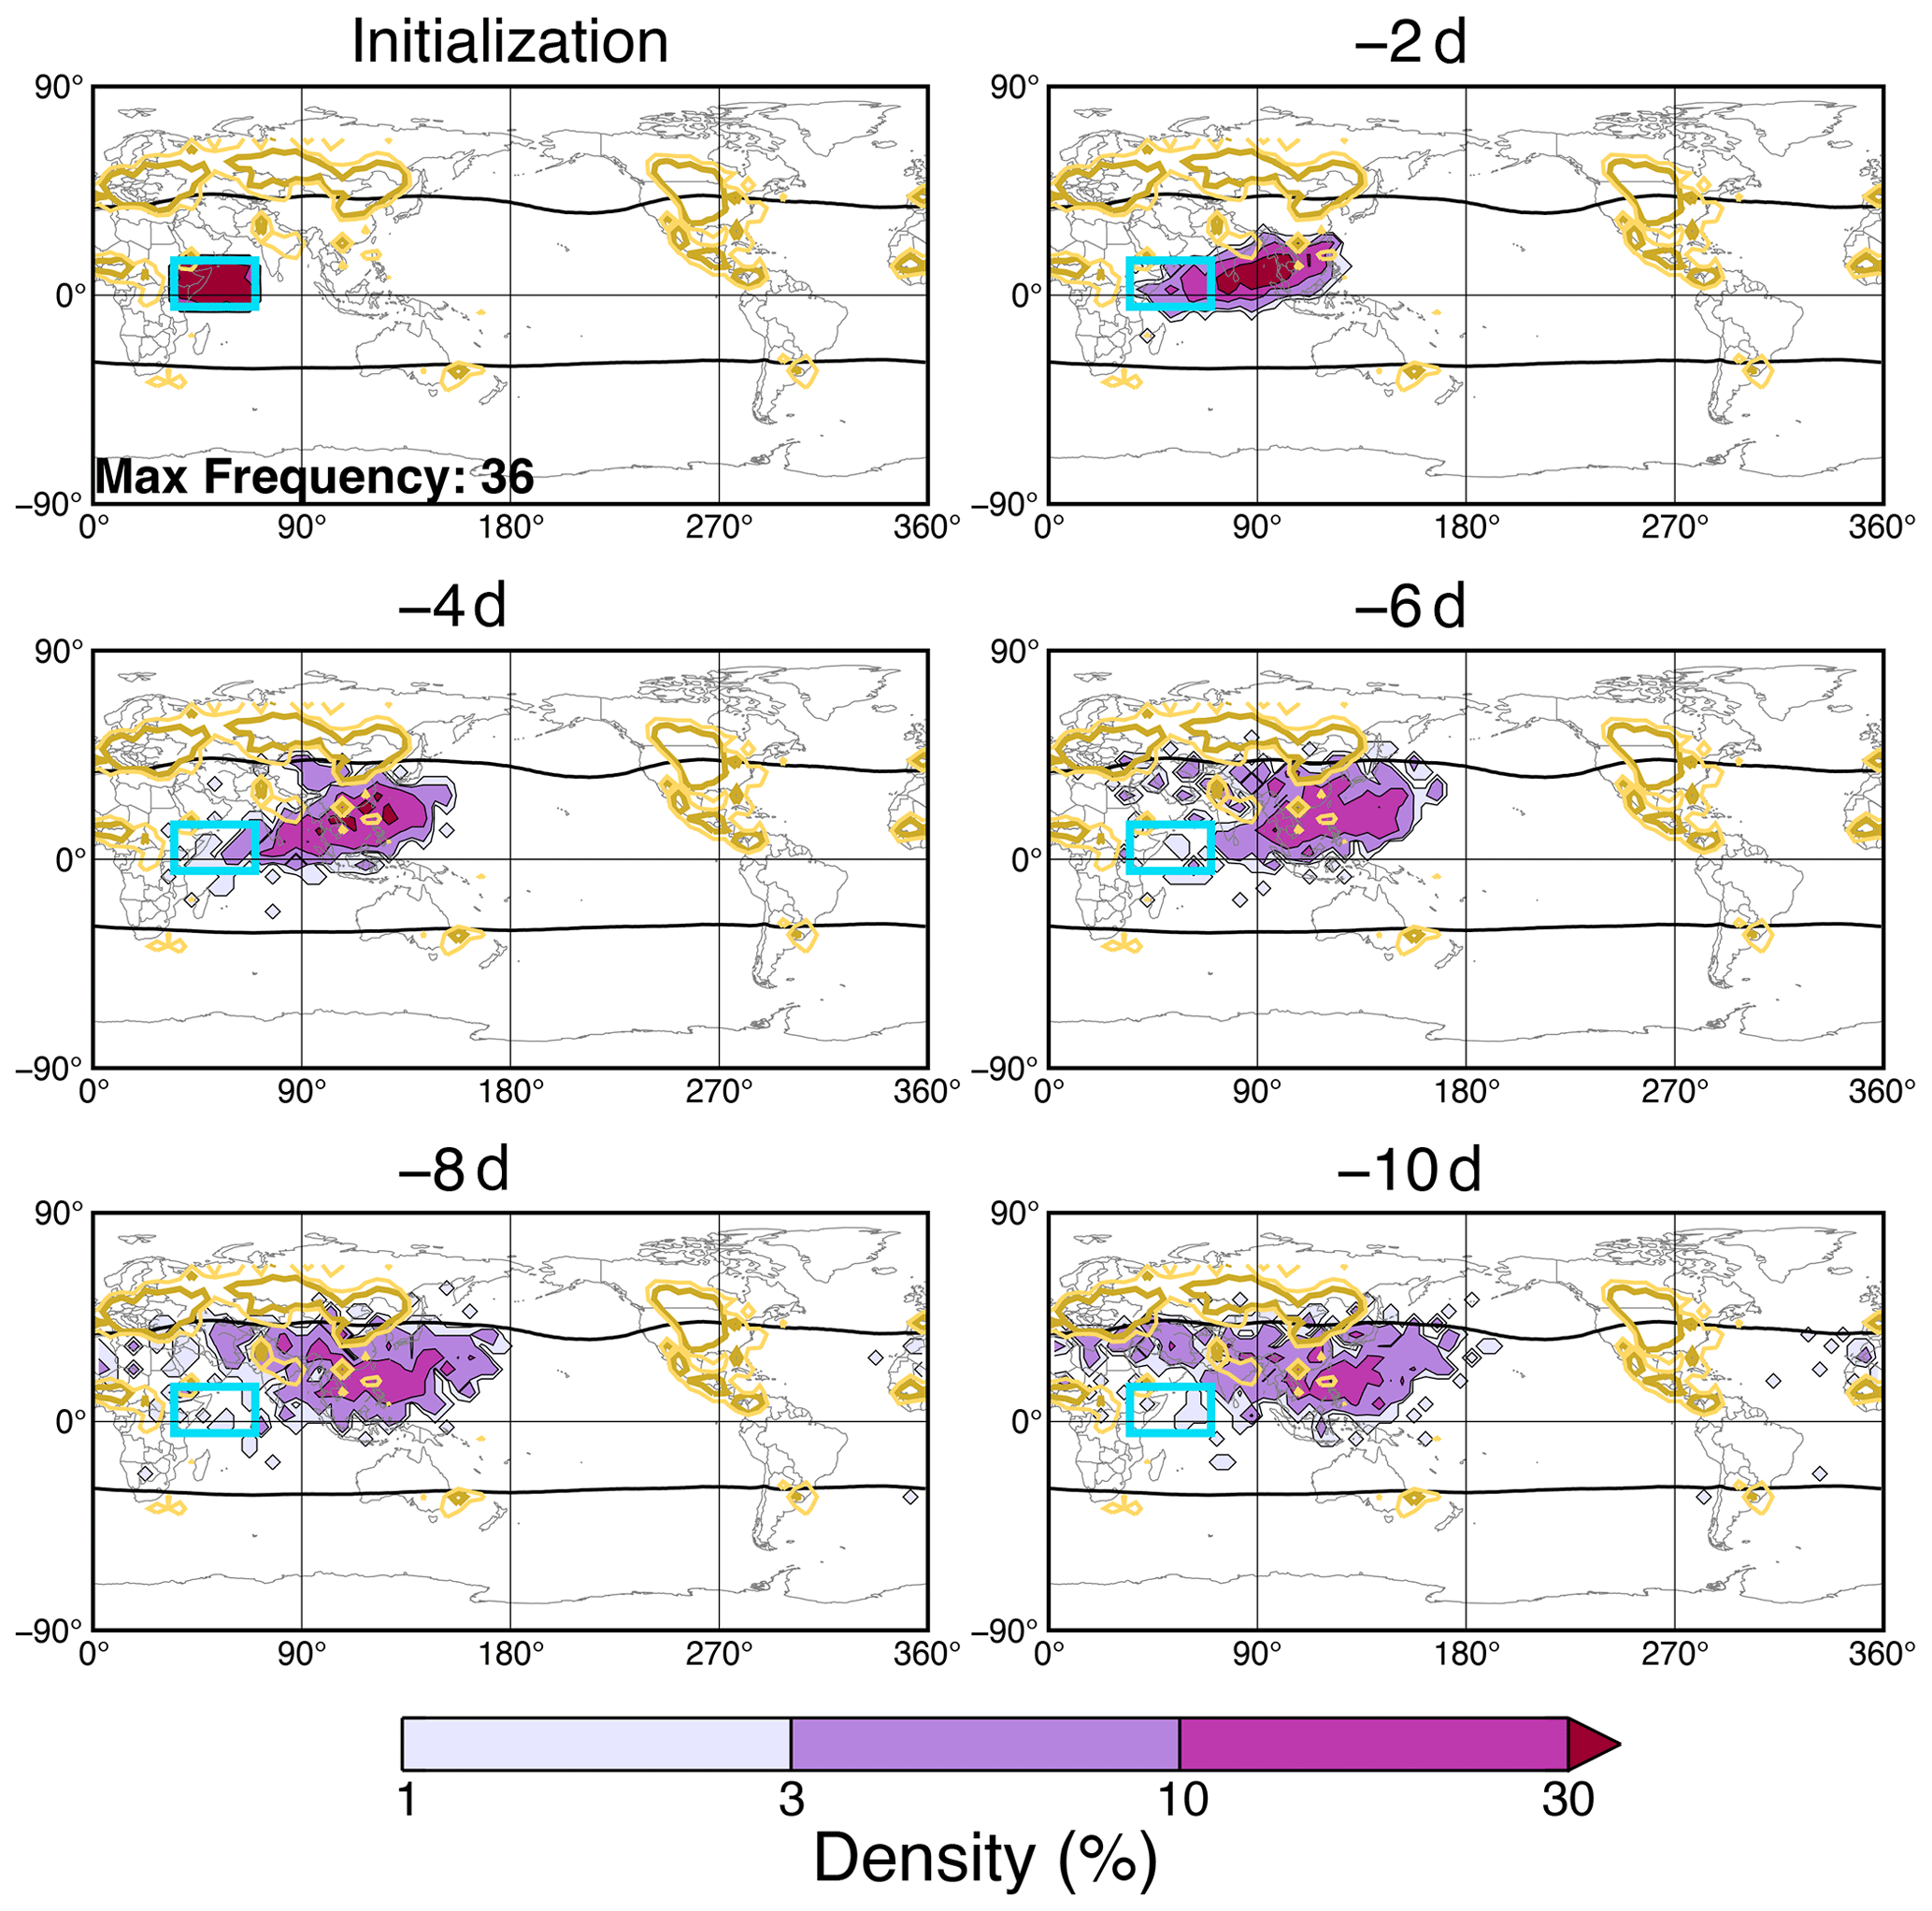
Figure 5As in Fig. 3 but for the SC region in JJA.
To provide additional insight into the potential sources of LS H2O extrema, we can analyze the cross-tropopause transport nature of the isentropic trajectories to assess the likelihood of large-scale moistening (rather than delivery by tropopause-overshooting convection). As a proxy for large-scale isentropic TST, the percentage of trajectories that spent at least 72 of the 120 h prior to extrema observation within the troposphere in each season is shown in Fig. 6. The seasonal variation in large-scale TST at any given location appears minimal. However, it is important to note that for each season, data are only shown for bins with at least 20 initialized trajectories, which could obscure seasonal variation from this analysis. In general, locations over the South Pacific, southern Indian Ocean, Somalian coast, and Asian monsoon region more frequently (≥ 60 %) indicate recent large-scale TST, while the northern Pacific and North America have much lower large-scale transport percentages (< 40 %).
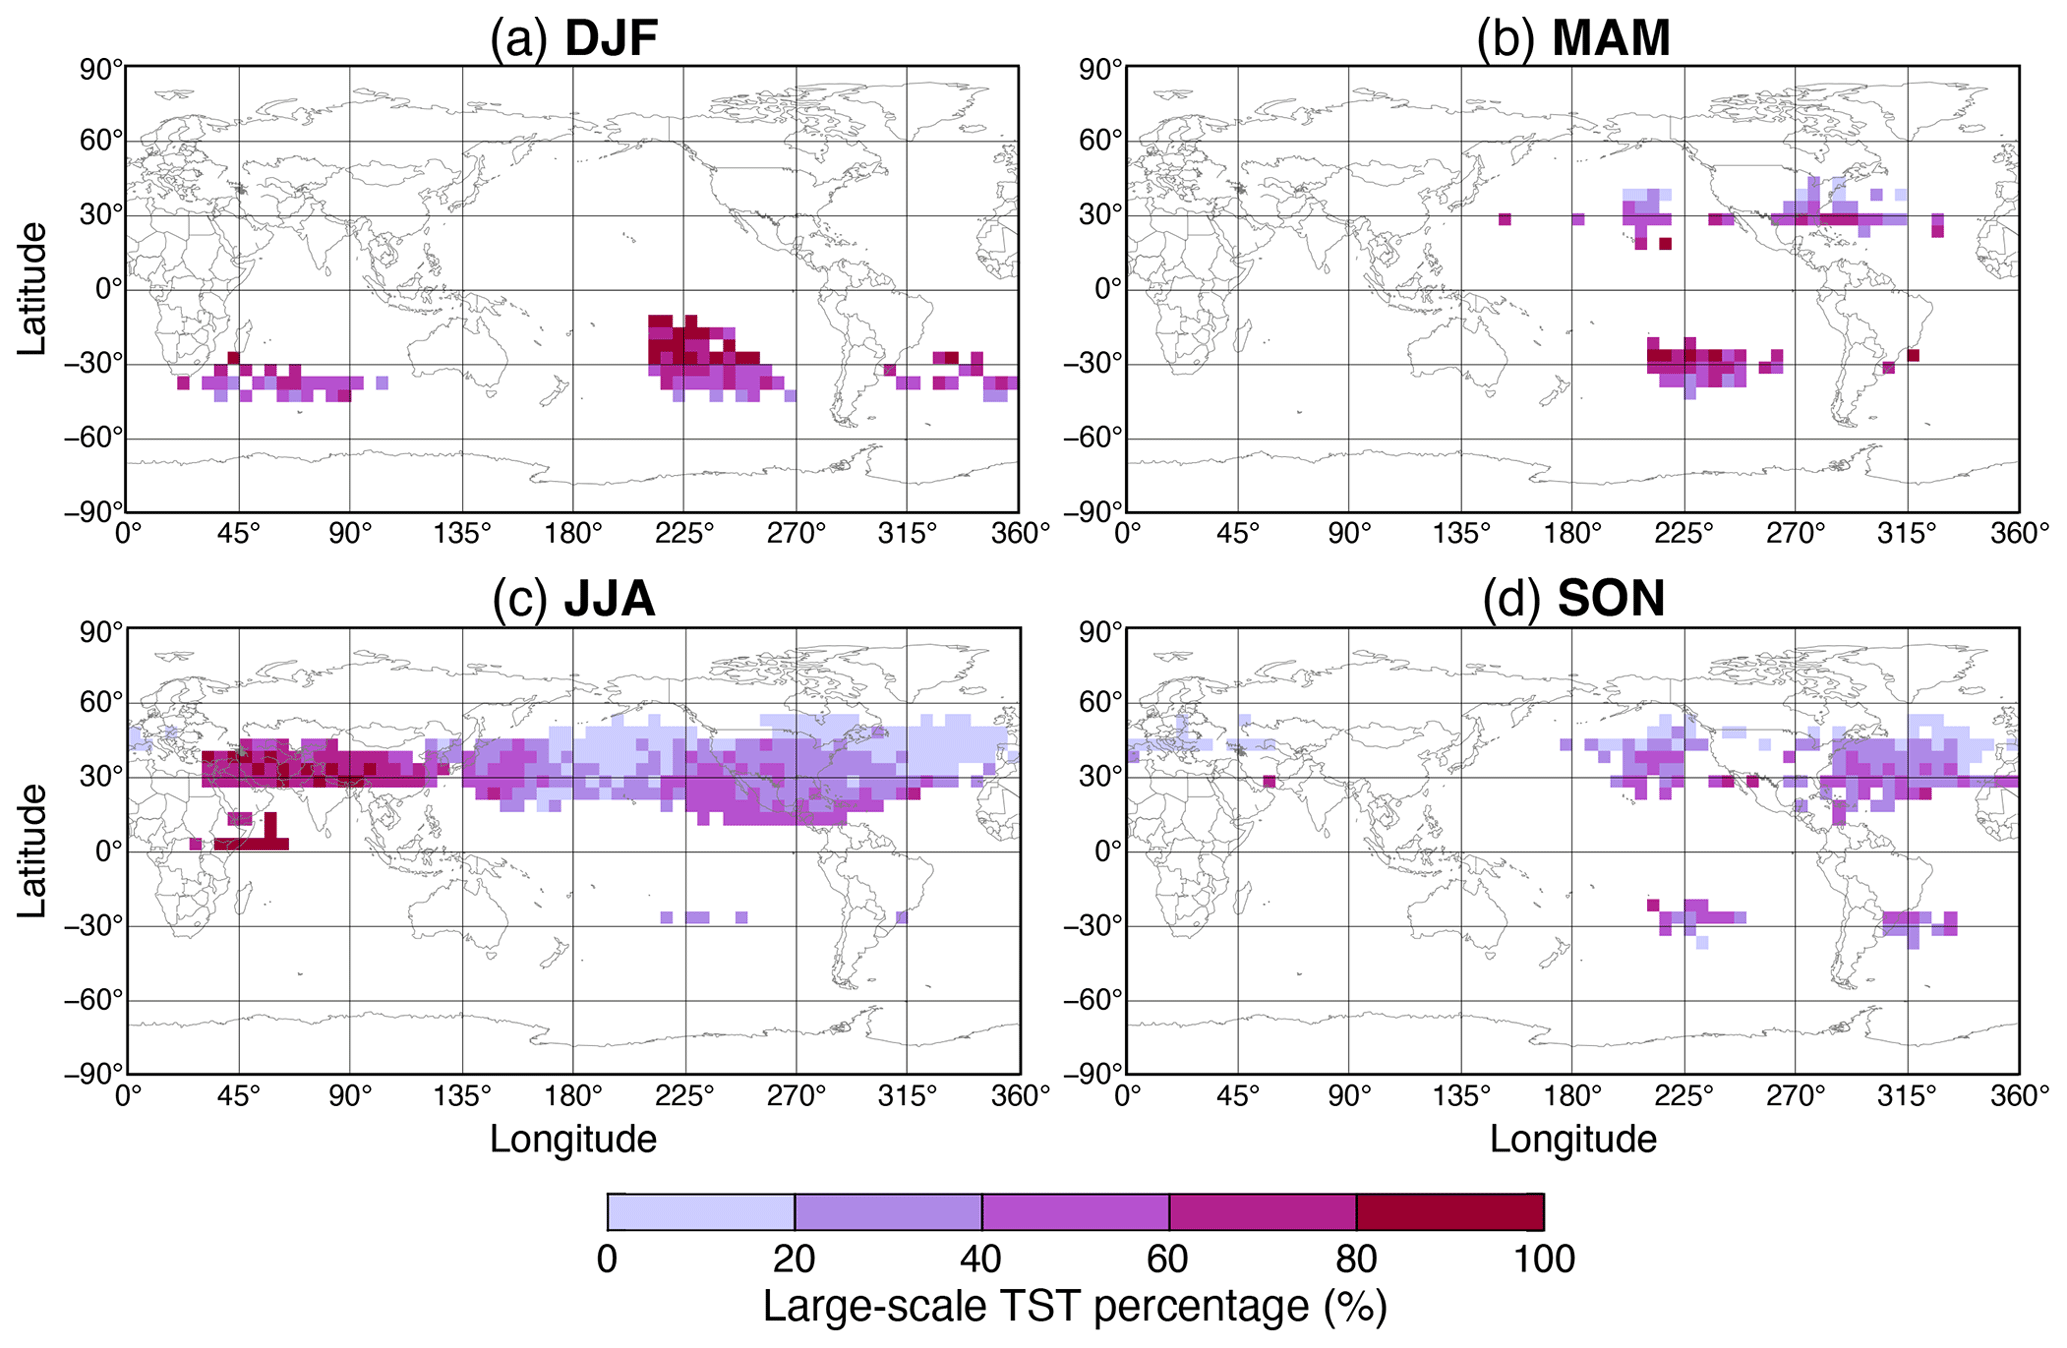
Figure 6The binned percentage of H2O extrema trajectories classified as large-scale TST at their initialized location for (a) DJF, (b) MAM, (c) JJA, and (d) SON. To restrict the analysis to bins with sufficient sampling of extrema, percentages are only shown for bins with ≥ 20 observations for the corresponding season.
The higher frequency of large-scale TST over the Asian monsoon region (> 80 % in some places) is consistent with recent studies that have shown the importance of monsoon dynamics in stratospheric moistening over Asia, where monsoon convection often moistens the upper troposphere but additional monsoon-driven isentropic cross-tropopause transport is required to extend these impacts to the stratosphere (e.g., Randel et al., 2010; Pan et al., 2016; Honomichl and Pan, 2020; Pan et al., 2022). Alternatively, the lower percentages common throughout the rest of the Northern Hemisphere subtropics and extratropics suggest that direct convective moistening via overshooting is the primary driver of these extreme concentrations. In some locations, like over North America extending eastward into the North Atlantic, this adds to the body of work which has shown that convection over North America is particularly capable of moistening the lowermost stratosphere (e.g., Randel et al., 2012; Tinney and Homeyer, 2021).
On the other hand, the low frequencies of large-scale TST for the summertime band of extrema from 180–225∘ E longitude over the northern Pacific are somewhat surprising given that this is a location of frequent Rossby wave breaking in boreal summer (Homeyer and Bowman, 2013). However, this is in line with the analysis shown in Fig. 4, which has a lack of meridional transport from the tropics outside of a pathway of summertime transport from Central American convection, which suggests poleward Rossby wave breaking is not a substantial contributor for LS H2O concentrations greater than 8 ppmv. The significance of the contribution of Rossby wave breaking events to stratospheric H2O concentrations has been debated in previous work (e.g., Ploeger et al., 2013). The analysis above suggests that while horizontal transport events between the tropical upper troposphere and extratropical LS via Rossby wave breaking may be common in this location, the air involved in associated TST is not moist enough to substantially contribute to the populations of H2O extrema analyzed here.
3.3 Annual cycles in monsoon-related regions
Monsoon dynamics and circulations have a unique and substantial impact on LS H2O extrema. The seasonal nature of monsoon circulations motivates additional analysis of the annual cycle of LS H2O extrema in monsoon-related regions, with a goal of providing further insight into the relationship between monsoon circulations and LS H2O extrema. In particular, we focus on the Asian monsoon anticyclone (AMA; 20–40∘ N, 30–130∘ E), the North American monsoon anticyclone (NAMA; 20–45∘ N, 230–290∘ E), and the South American monsoon anticyclone (SAMA; 20–40∘ S, 260– 320∘ E). Note that these region boundaries are different from those defined and discussed previously, as those were subjectively chosen based on local maxima of LS H2O extrema frequency and do not necessarily align with the tropopause-level monsoon circulations. These monsoon regions, shown in Fig. 7d, were specifically chosen to encapsulate their associated tropopause-level anticyclonic circulations as indicated by the climatological mean of hemispheric summer 100 hPa winds in reanalysis (not shown).
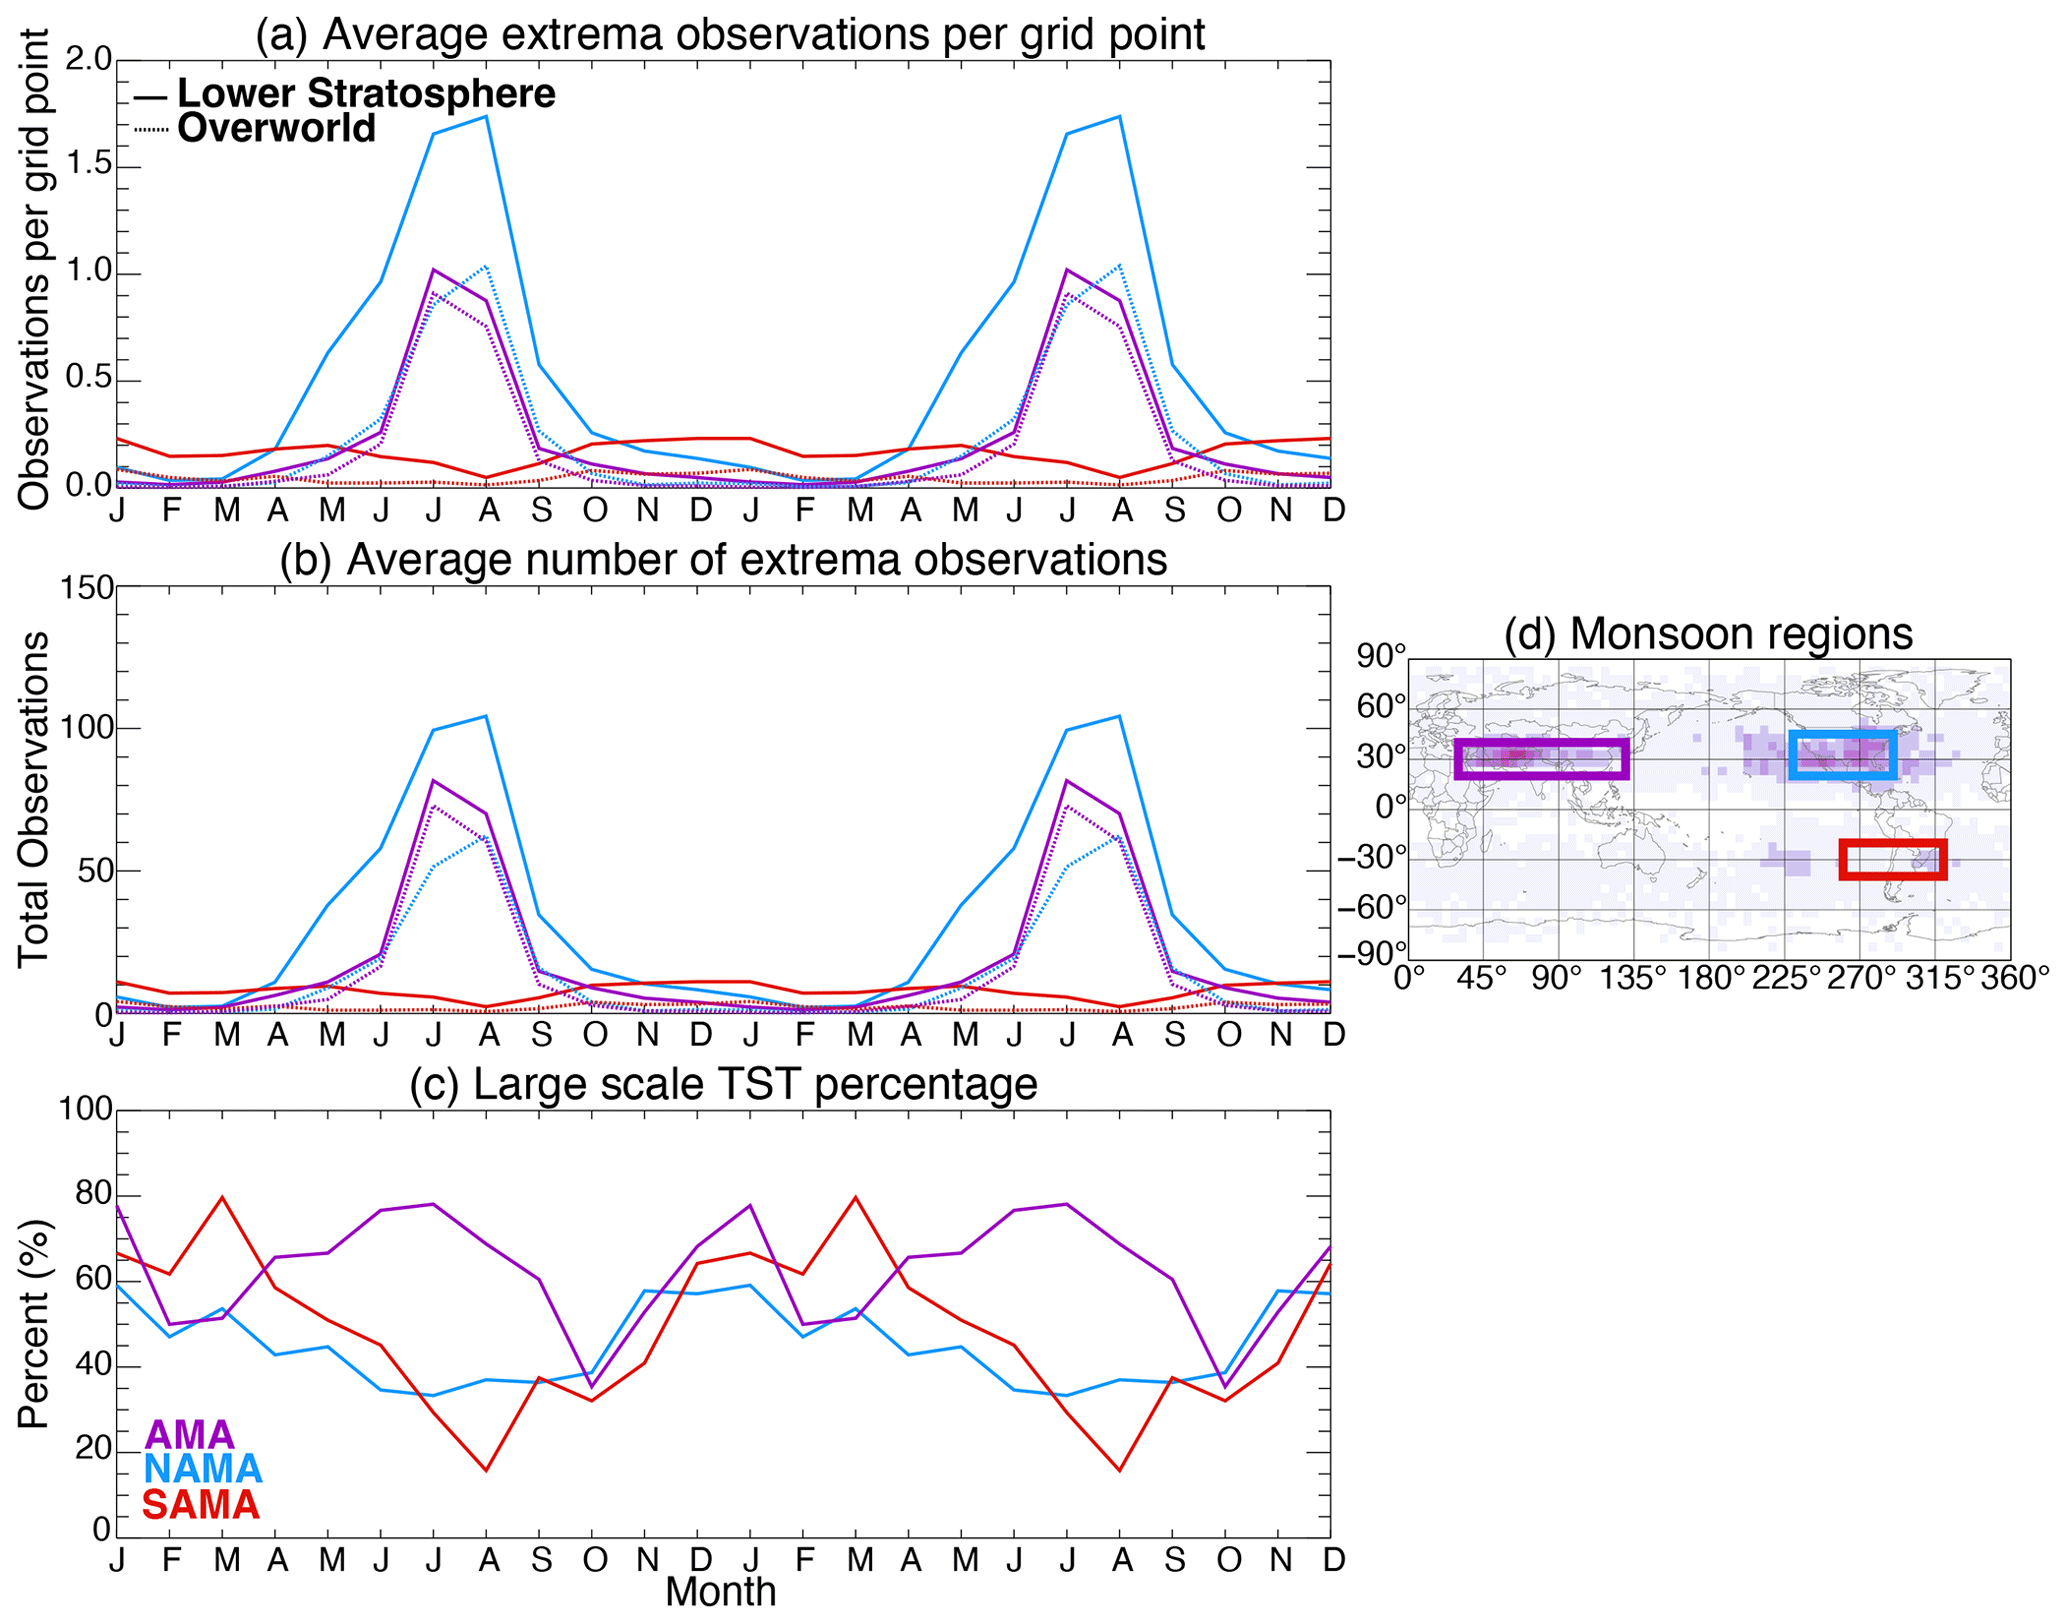
Figure 7Two average annual cycles of (a) the number of H2O extrema per grid point, (b) the average regional number H2O extrema, and (c) the percentage of extrema with a large-scale transport history given for the Asian monsoon anticyclone (AMA; 20–40∘ N, 30–130∘ E; purple), the North American monsoon anticyclone (NAMA; 20–45∘ N, 230–290∘ E; blue), and the South American monsoon anticyclone (SAMA; 20–40∘ S, 260–320∘ E; red). For (a) and (b), the number of observations for the total lower stratosphere is given by the solid line and the number of observations in the stratospheric overworld only is given by the dotted line. The region boundaries for each monsoon described above are given in (d).
While the frequency of H2O extrema peaks in summer and decreases in winter for each monsoon anticyclone, the characteristics of each cycle vary substantially. Both when normalizing for region size (Fig. 7a) and when not (Fig. 7b), the frequency of LS H2O extrema in AMA and NAMA is an order of magnitude larger than in SAMA at their respective peaks. The SAMA annual cycle is characterized by a broad, shallow peak from October to January (hemispheric spring and summer) with a maximum average of ∼ 0.2 observations per grid point. For NAMA the occurrence of LS H2O extrema largely exists between April and October (hemispheric late spring to early fall), peaking in August at a maximum average of ∼ 1.7 observations per grid point. Alternatively, AMA extrema primarily exist within boreal summer (JJA) and peak in July at ∼ 1.0 observations per grid point. From a per grid point standpoint, the NAMA region clearly dominates contributions to LS H2O extrema in both magnitude of the frequency and the longevity compared to AMA and SAMA, likely as a result of combined contributions from monsoon-driven deep convection near the Sierra Madre Occidental in northwest Mexico and additional frequent convection in the central and eastern United States during spring, summer, and fall. When comparing the monsoons as a whole and allowing for their size to modulate their contributions, the NAMA region still exhibits the greatest H2O extrema frequency, though AMA is more comparable in its total number of extrema observations (Fig. 7b). Perhaps even more notable is the disparity between the proportion of total-LS versus overworld-only extrema in each region. For NAMA and SAMA, the overall overworld contributions to the total-LS extrema frequency is less than 50 %, while more than 90 % of AMA LS H2O extrema are from the stratospheric overworld, which reflects the anomalously high tropopause heights in this region (Munchak and Pan, 2014). This result especially highlights the importance of considering the LMS when assessing the contributions of each monsoon to extreme H2O concentrations.
Figure 7 also shows the percentage of extrema in each monsoon region whose back-trajectory analysis indicates a recent tropospheric origin (as described above). Again, there are substantial differences between the three monsoons. For AMA and SAMA, the large-scale TST percentage peaks during the monsoon season when the frequency of extrema peaks. Alternatively, the NAMA region experiences a minimum in large-scale TST percentage in August when the H2O extrema frequency peaks, providing more evidence that convection in the NAMA region is uniquely capable of transporting H2O to the LS without necessitating some additional, larger-scale transport, as has been demonstrated in previous studies (e.g., Randel et al., 2012; Tinney and Homeyer, 2021). Both the AMA and the NAMA regions also experience relative maxima in the frequency of large-scale TST in December–January, which is likely a result of the substantial decrease in tropopause-overshooting convection in the winter months.
MLS observations from 2005–2020 were used in conjunction with MERRA-2 reanalysis data to create a climatology of H2O extrema (> 8 ppmv) in the stratospheric overworld and in the total LS (overworld + LMS). We show that the frequency and distribution of H2O extrema in the total LS (0.27 % of MLS total LS observations globally) are dramatically different from those of the stratospheric overworld (0.08 % of MLS overworld observations globally), revealing that the frequency of LS extrema increases by more than 300 % when the LMS is included in the analysis. On both a yearly and a seasonal basis, the frequency of extrema in the total-LS analysis is substantially greater than that of the stratospheric overworld, but the magnitude of the difference varies by region (Figs. 1 and 2).
To provide additional context for this climatology, a statistical transport analysis was conducted by initializing isentropic trajectories at the latitude, longitude, and θ of H2O extrema (Figs. 3–5, A1–A5). The transport analysis reveals two main transport patterns: (1) air being traced to or confined within monsoon circulations (i.e., the CEA, SC, NA, and GC regions; Figs. 3, 5, A1, and A3) and (2) largely zonal transport along the tropopause break via subtropical jet streams (the NP, NA, SA, SP, and SI regions; Figs. 4, A1, A2, A4, and A5). For all regions, the large-scale transport pathways indicate that the extrema air can be traced to regions of relatively frequent tropopause-overshooting convection. This analysis also reveals that, outside of monsoon-related circulations, meridional transport from the tropics to the observed H2O extrema is infrequent. To further investigate the potential origins of H2O extrema, the cross-tropopause nature of the isentropic trajectories was also investigated using the percentage of trajectories with recent history within the troposphere as a proxy for large-scale isentropic TST (Fig. 6). The percentage of trajectories classified as being related to large-scale TST is regionally dependent, notably showing low occurrences of large-scale TST over the NP, NA, and GC regions – providing further evidence of convection serving as the major source of H2O extrema in those regions. In regions where large-scale TST is more frequent, it remains unknown whether convection upstream is coupled to such extrema. Namely, moist air that is transported isentropically to the LS may be related to upstream convective sources that acted to hydrate the upper troposphere prior to the large-scale TST.
Finally, the annual cycles of extrema frequency were investigated for regions encompassing AMA, NAMA, and SAMA (Fig. 7). The LS frequency of H2O extrema in the AMA and NAMA regions was shown to be an order of magnitude larger than that of SAMA. Additionally, while AMA and NAMA have similar overworld extrema frequencies throughout the annual cycle, the magnitude and duration of peak extrema frequencies for NAMA increase substantially with the inclusion of the LMS in the total-LS analysis, compared to a small increase for AMA. The results presented above highlight the importance of including the LMS in analyses of LS composition. The frequency, geographic extent, and longevity of extrema are all substantially larger in the total-LS analysis compared to the overworld-only analysis. Additionally, the transport analysis strongly suggests that convection is a substantial contributor to the occurrence of LS H2O extrema, which may not have been clear if conducted for the overworld only.
Throughout this study, several choices and assumptions were necessary for conducting the analysis. For example, using the tropopause-relative location of trajectories as a proxy for large-scale TST can be sensitive to the requirements for the percentage of time spent in the troposphere. In addition to the requirement used here (60 % of the preceding 5 d spent in the troposphere), the analysis was performed requiring that trajectories must be located in the troposphere for only 40 % of the preceding 5 d. This changed the number of trajectories but did not impact the resulting large-scale pathways (not shown). Additionally, while the analysis was conducted for MLS extrema thresholds of 8, 10, and 12 ppmv, only the 8 ppmv results were presented here. In general, the 8 ppmv threshold increased the number of extrema in all regions and all seasons compared to the more restrictive thresholds. For example, 8 ppmv extrema are typically ∼ 1–2 times more frequent than 10 ppmv extrema globally. However, the 8 ppmv threshold does disproportionately increase the number of extrema in the CEA–AMA region, where 8 ppmv extrema are ∼ 3–4 times more frequent than 10 ppmv extrema (not shown). Another sensitivity to the choice of threshold is found when examining the annual cycle of extrema in the NH, where 10 and 12 ppmv extrema frequency peaks in July, while 8 ppmv extrema frequency peaks in August (not shown). This slight seasonal shift is likely related to the increase in background stratospheric water vapor concentrations in the summer months (e.g., Tinney and Homeyer, 2021). Though these sensitivities are notable, they do not impact the conclusions drawn from the analysis.
Lastly, the biggest challenge for this work arose from the major goal of this study – to expand on previous work through the inclusion of the LMS in analysis of LS composition. Restricting the analysis to stratospheric MLS layers only proved to be a difficult task due to the relatively coarse vertical resolutions of MLS and MERRA-2. For this study, the selected criteria were as lenient as possible while still accounting for the uncertainties within the data. Specifically, to limit contamination from MLS layers whose depth may extend across the tropopause, a series of stringent criteria were put in place and only MLS layers at pressures of 147 hPa were included in this analysis. Despite these efforts, it is possible that upper-tropospheric H2O could influence parts of the analysis and partially inflate LS extrema frequencies. Alternatively, the stringent criteria may also obscure and prevent truly lower-stratospheric layers from being included within this analysis – therefore potentially undercounting extrema. We emphasize here that the inclusion of the LMS in analyses like that presented here is challenging – but worthwhile – and is important to do in future work that aims to increase understanding of the concentrations and sources of H2O and other trace gases in the LS, especially given the implications for understanding the role of tropopause-overshooting convection in the STE budget.
The statistical backward-trajectory transport analysis described and shown for the CEA, NP, and SC regions in the main text is presented and briefly discussed here for the remaining regions. Figures A1–A3 show back-trajectory density maps for H2O extrema in the NA, SA, and GC regions. These regions are all characterized by rapid transport of extrema observations to active overshooting convection regions upstream of and spatially adjacent to the extrema locations, implying that MLS is capturing H2O enhancements from convection at times shortly after the storms. For the NA region, overshooting over the US Great Plains, Gulf of Mexico, and – at longer transport times – the Mediterranean is a likely contributor (with significance in that order). For the SA region, overshooting in Argentina is most likely responsible. For the GC region, overshooting over the Sierra Madre Occidental in Mexico and the Gulf of Mexico is likely a contributor. In contrast with these apparently dominant local convective sources, transport pathways of H2O extrema in the SP region (Fig. A4) are not linked to a clear overshooting source region but are densely sourced from the equatorward side of the mean tropopause break location. This behavior suggests that many of the H2O extrema in that region are facilitated in part by large-scale TST. It is noted, however, that SP extrema transport bypasses the South Pacific Convergence Zone (SPCZ), which is one of the more globally active convective regions in DJF (when SP extrema are most common; Vincent, 1994, and references therein). Thus, it is possible that H2O extrema in this region are the result of large-scale transport of UT air hydrated by convection over the SPCZ to the LS over the east Pacific. Finally, transport histories for H2O extrema within the SI region (Fig. A5) indicate rapid linkages to two upstream overshooting convection sources along the mean tropopause break location (i.e., the subtropical jet) within 2–4 d: southern Africa and Argentina.
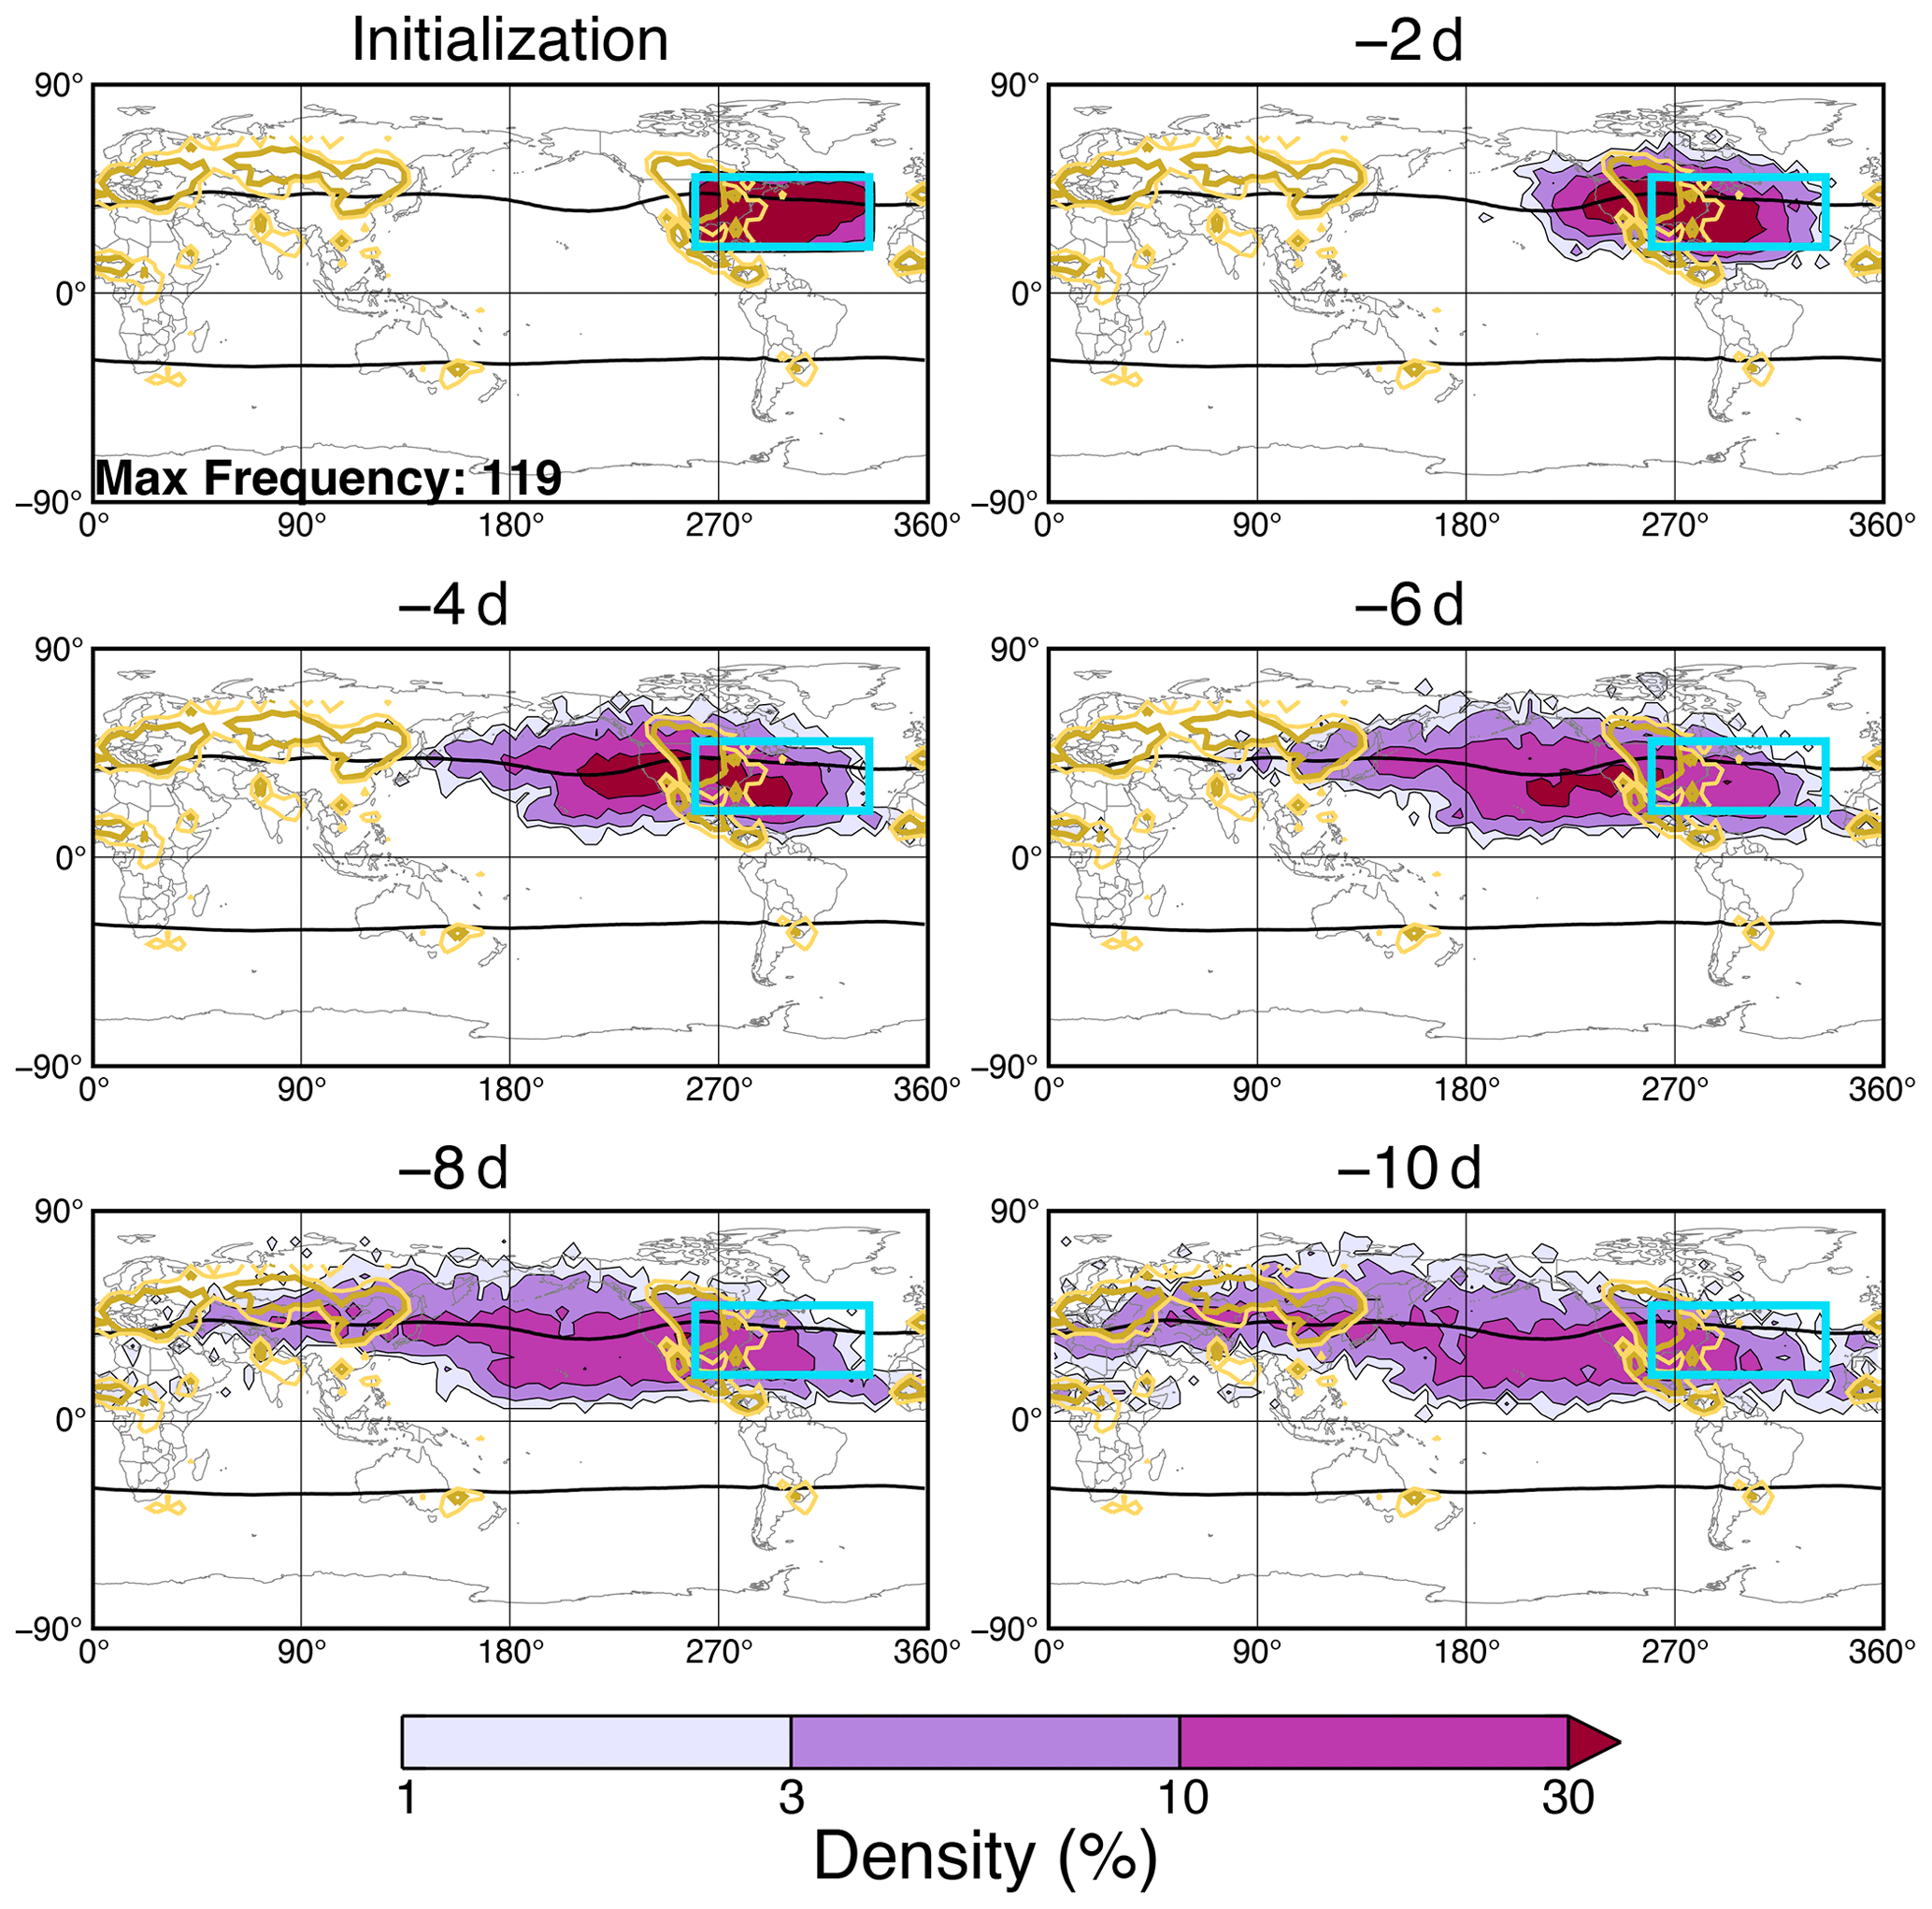
Figure A1As in Fig. 3 but for the NA region in JJA.
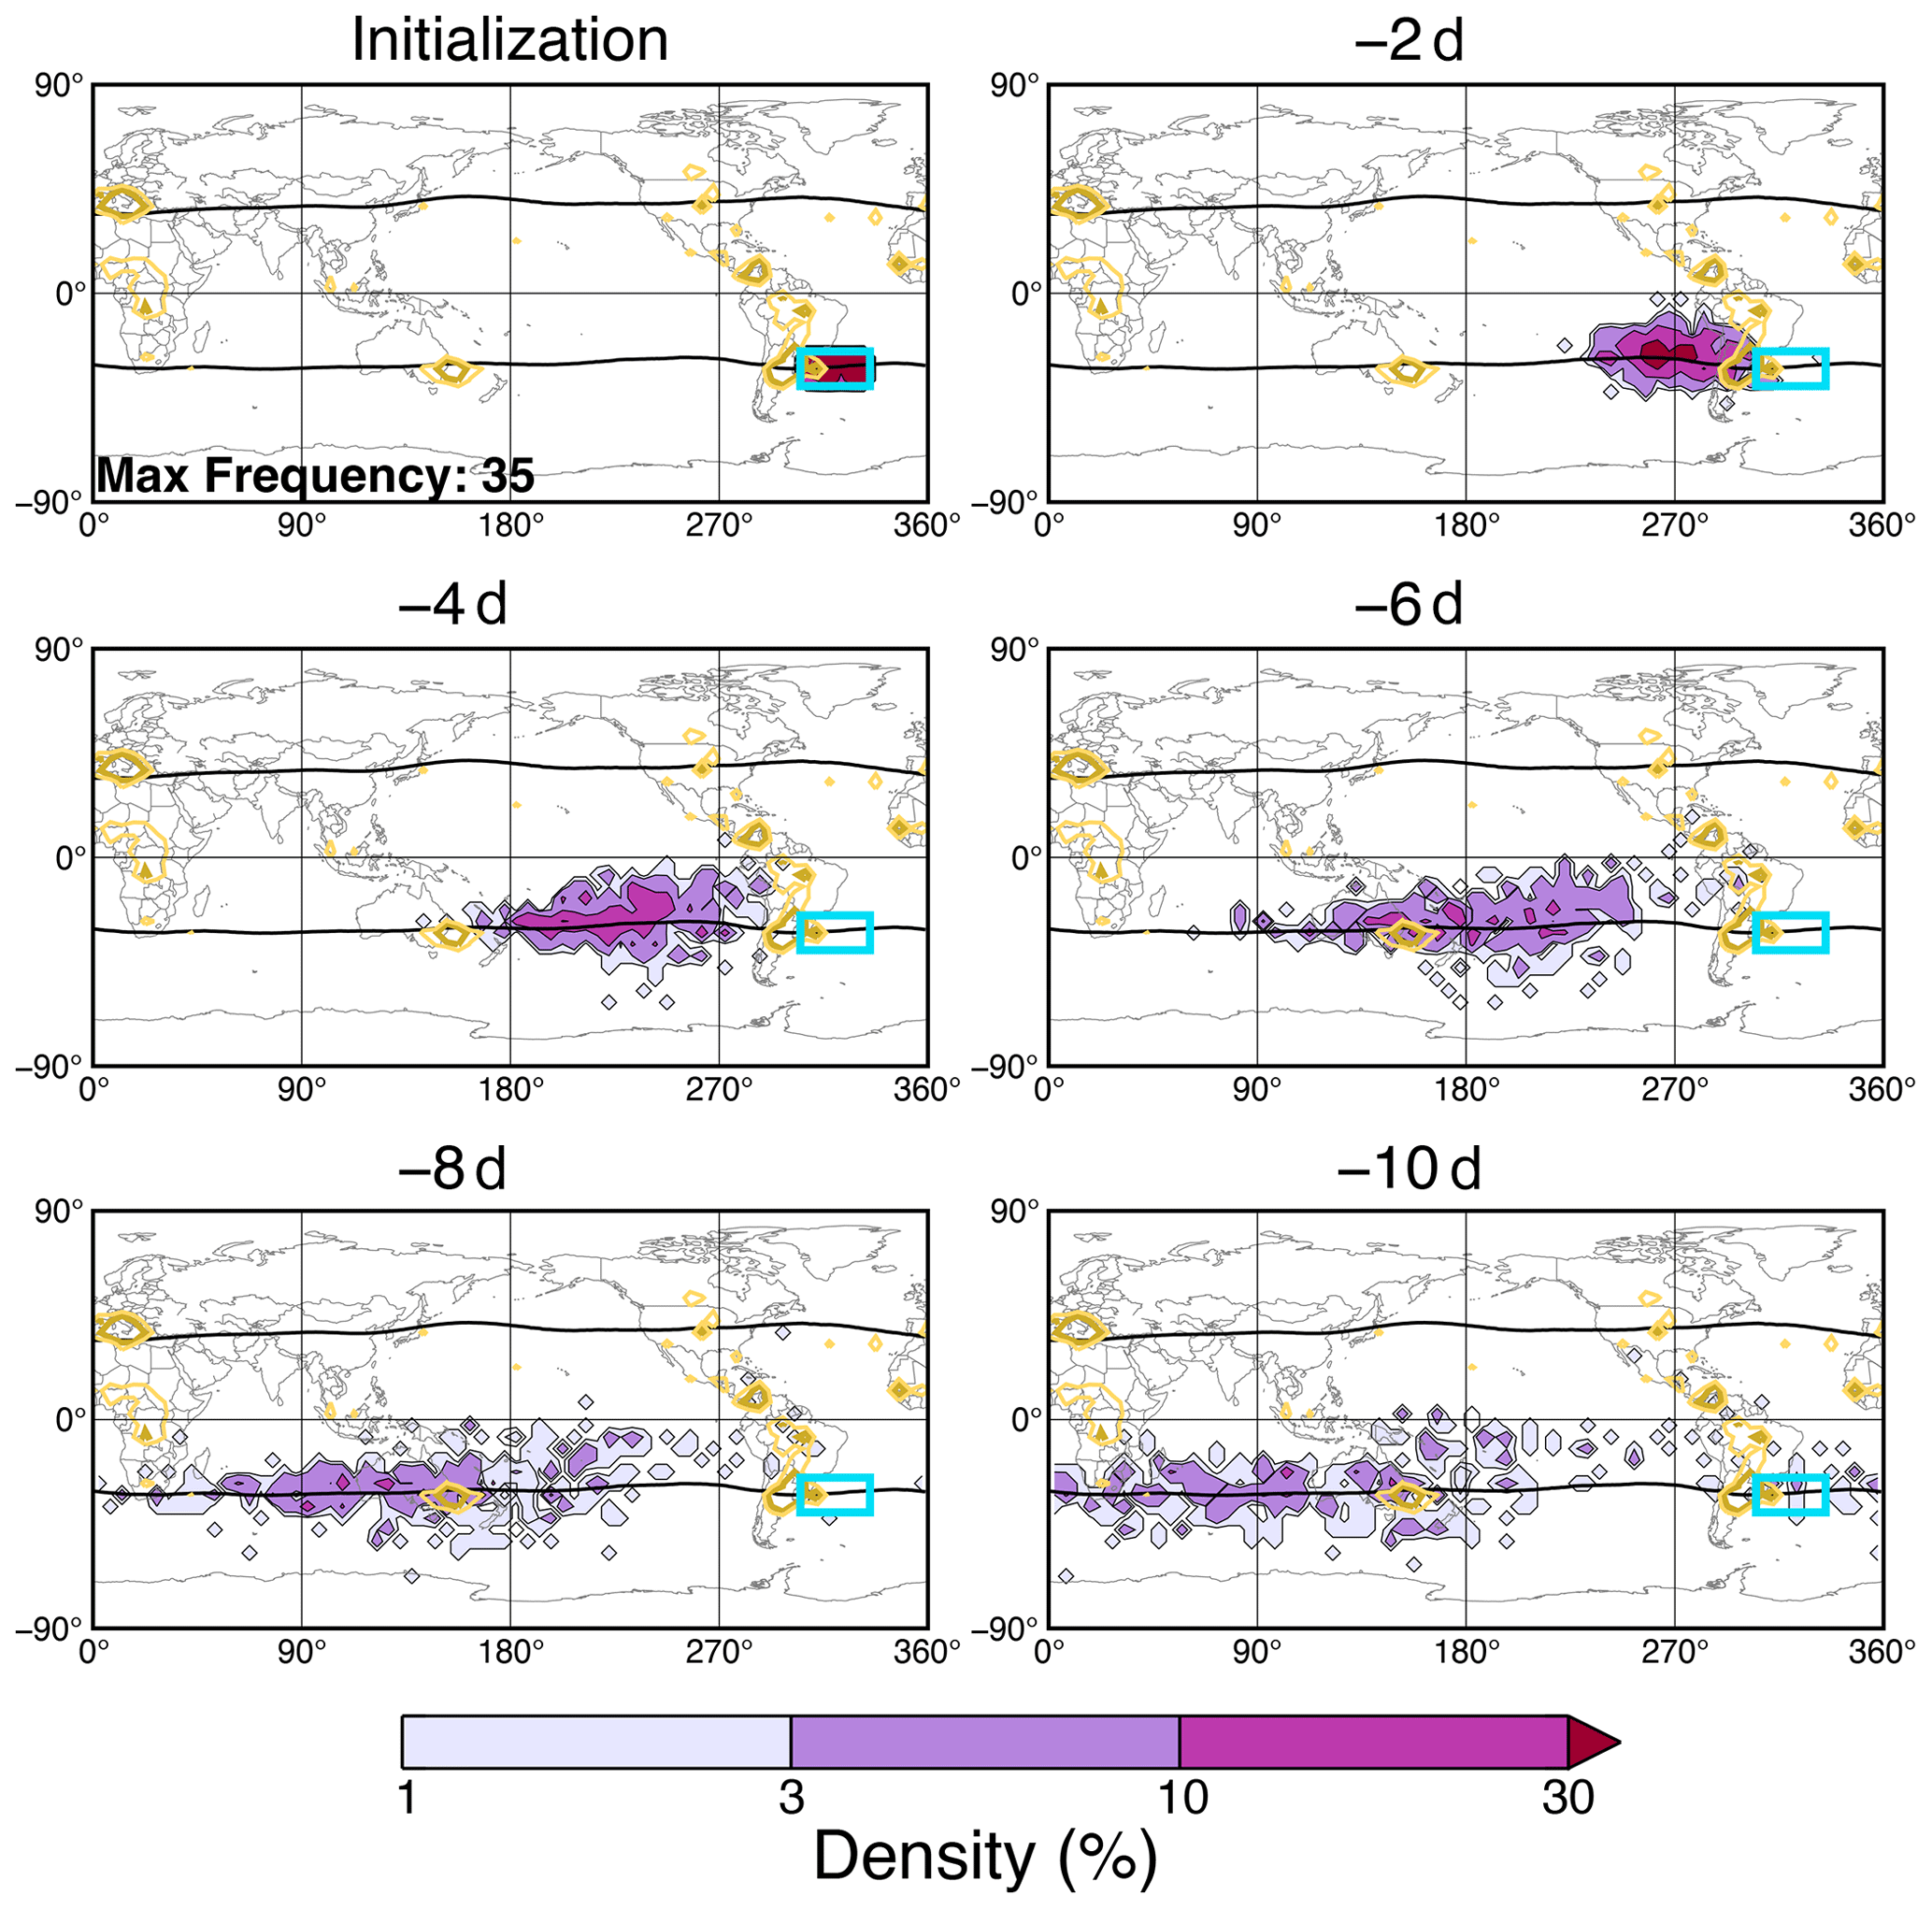
Figure A2As in Fig. 3 but for the SA region in SON.
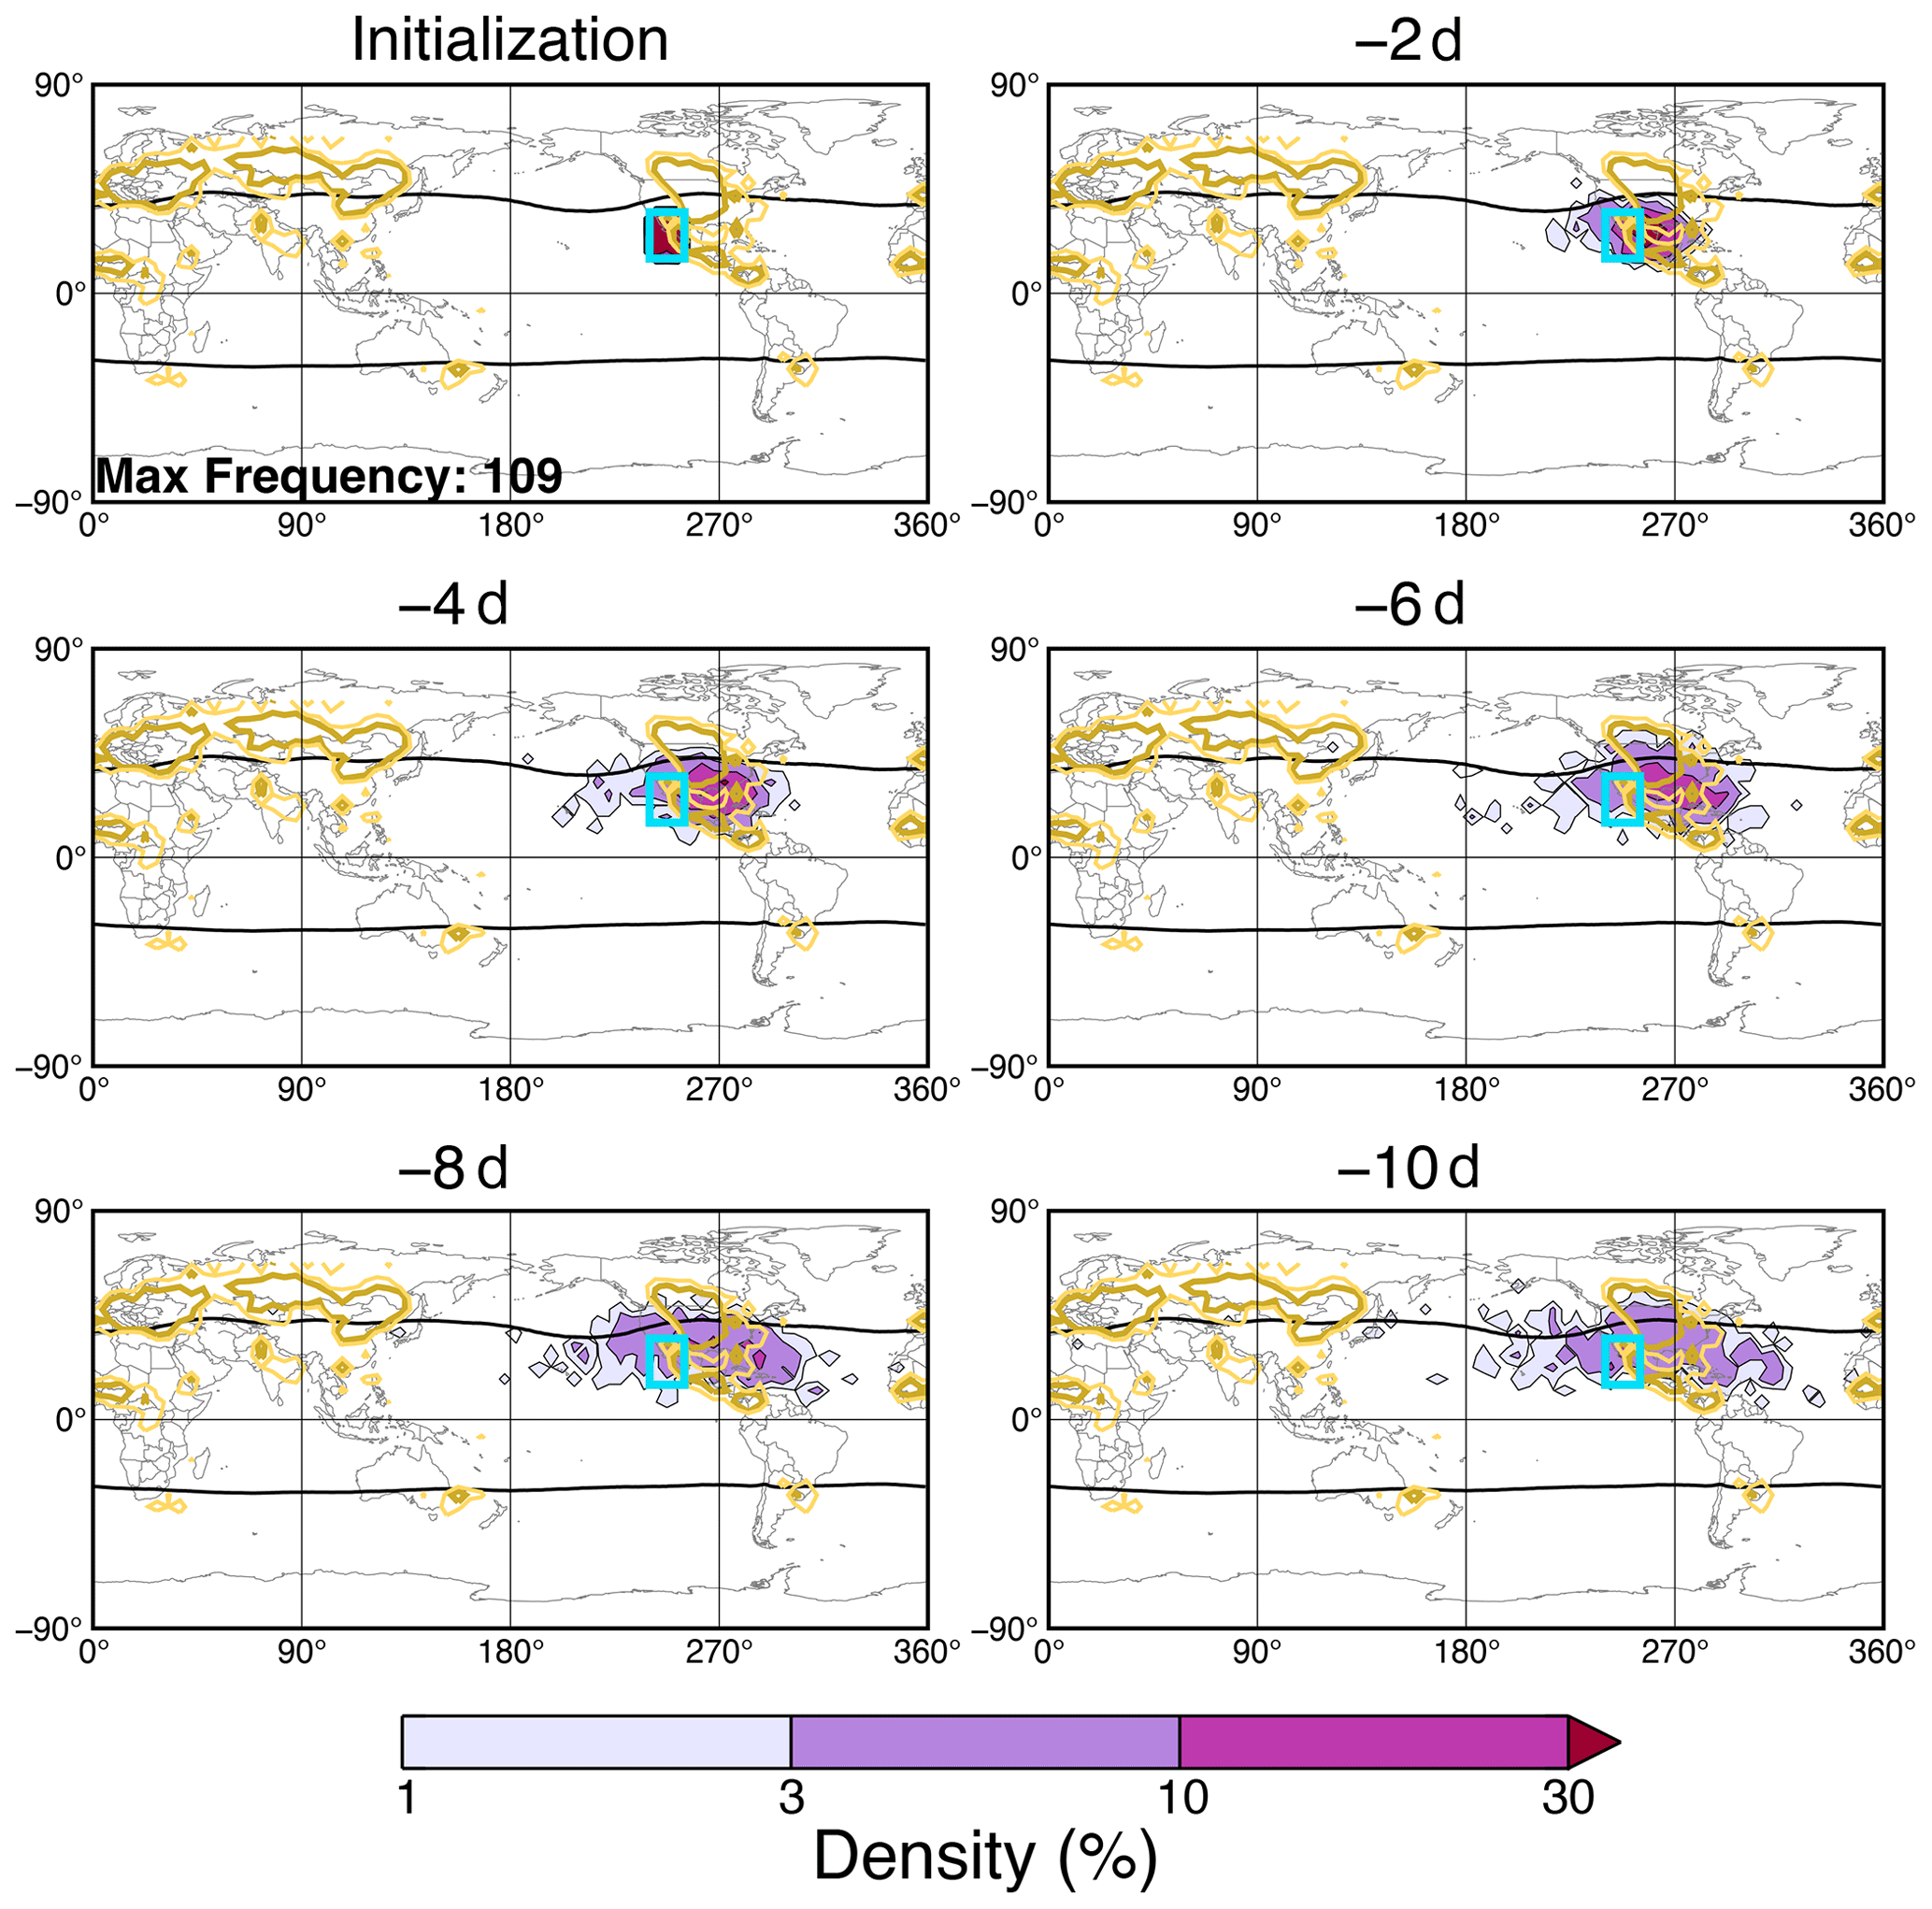
Figure A3As in Fig. 3 but for the GC region in JJA.
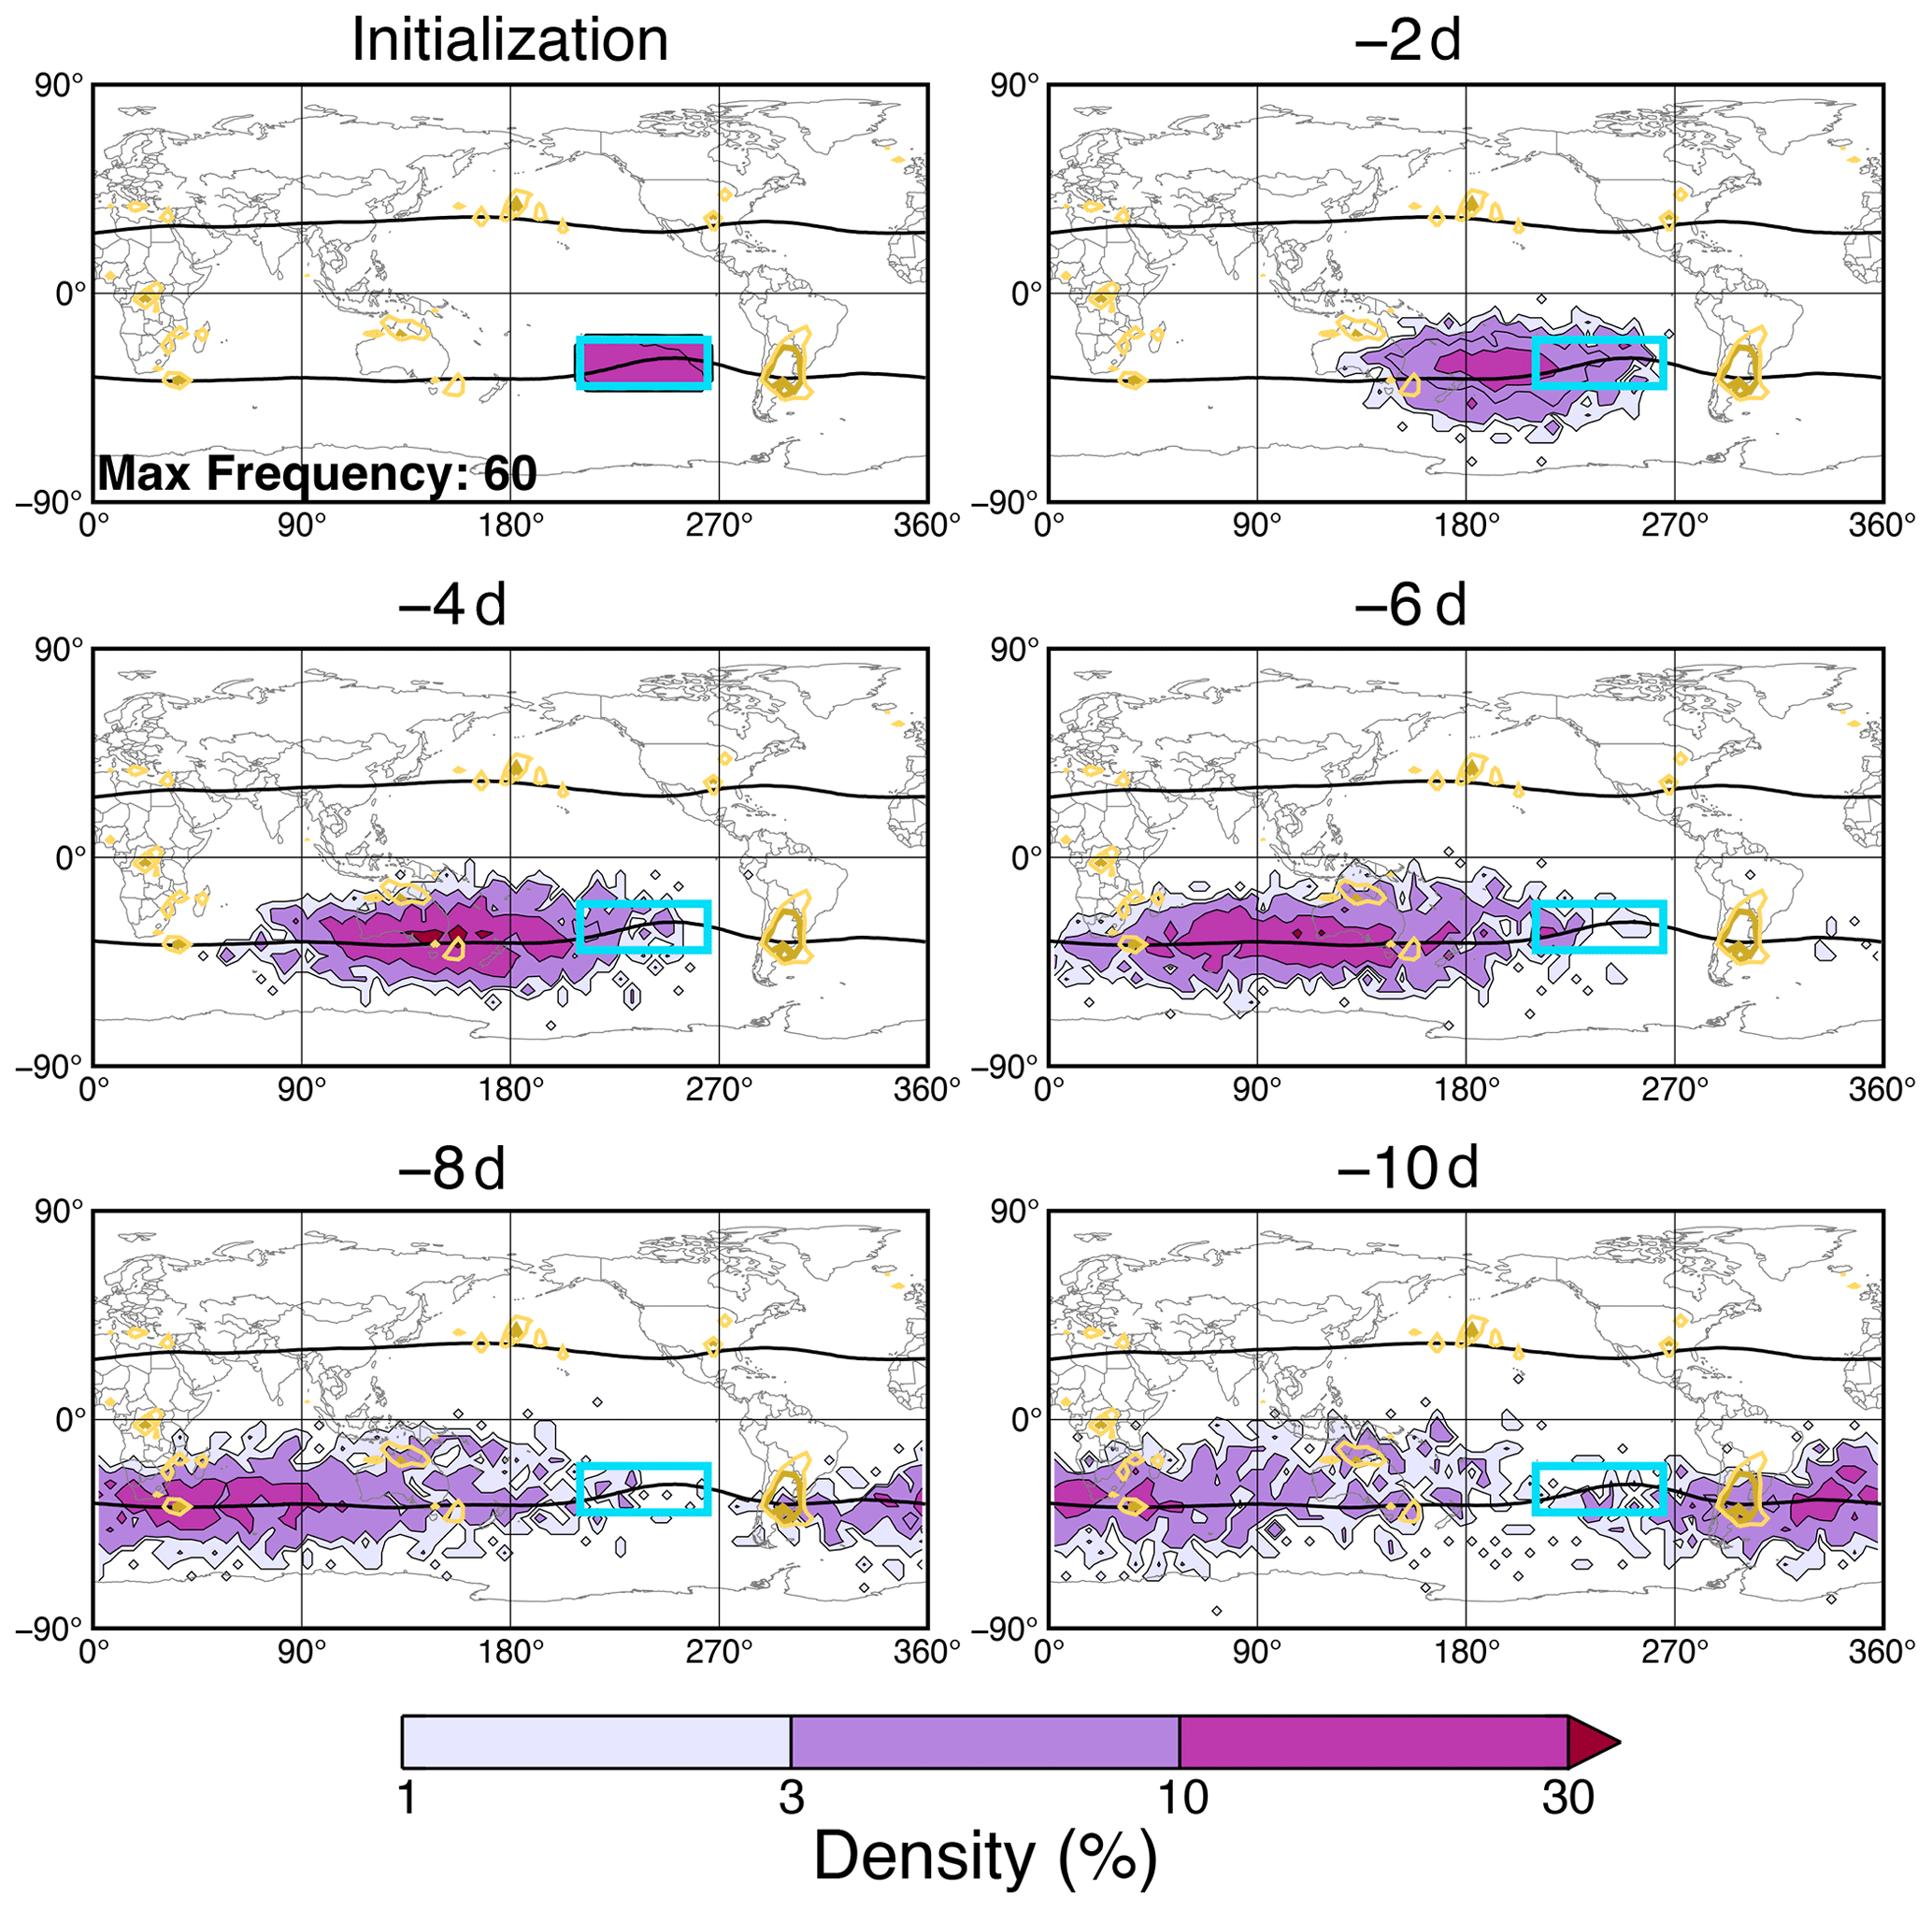
Figure A4As in Fig. 3 but for the SP region in DJF.
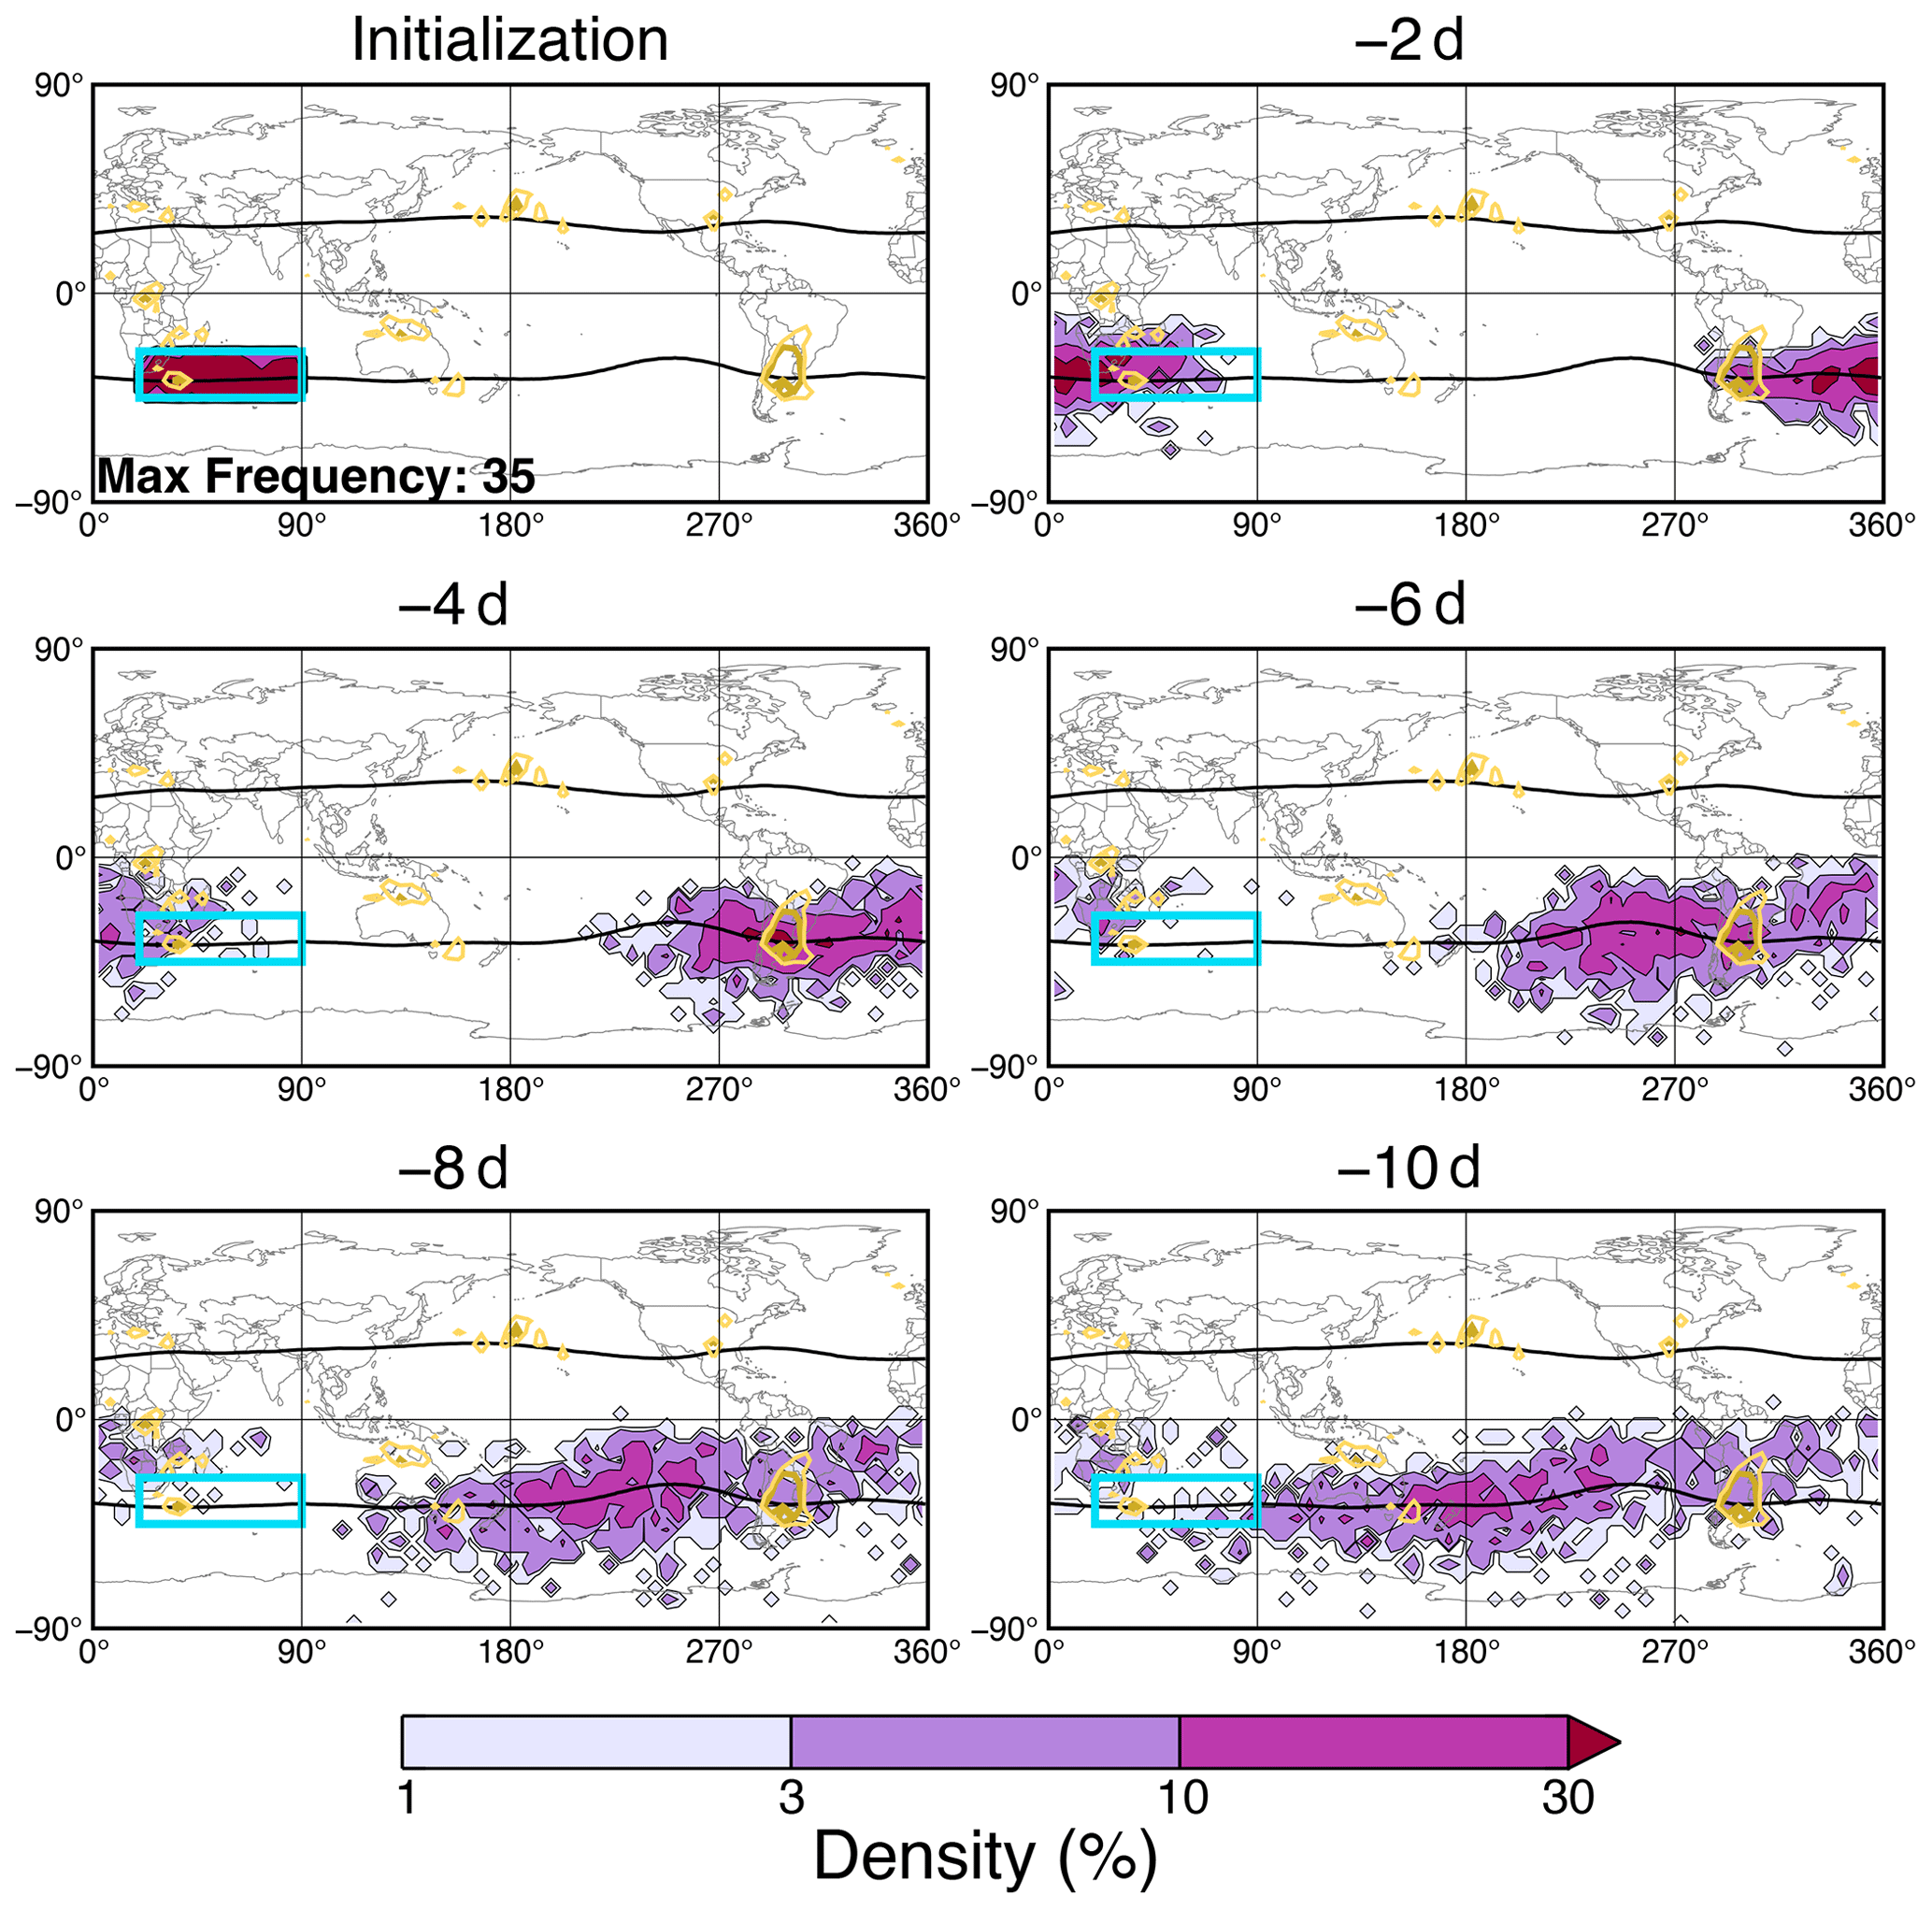
Figure A5As in Fig. 3 but for the SI region in DJF.
All data used in this study are publicly available. MLS and MERRA-2 data were obtained from NASA GES DISC (https://doi.org/10.5067/Aura/MLS/DATA2508, Lambert et al., 2020; https://doi.org/10.5067/WWQSXQ8IVFW8, Global Modeling and Assimilation Office (GMAO), 2015). The processed GPM precipitation feature data used in this study are available online at http://atmos.tamucc.edu/trmm/data/ (Liu, 2021).
ENT and CRH designed the study, and ENT carried it out. ENT wrote the original draft of the manuscript, with review and editing by CRH. ENT led the revision and author comments during public discussion, with review and editing by CRH.
The contact author has declared that neither of the authors has any competing interests.
Publisher’s note: Copernicus Publications remains neutral with regard to jurisdictional claims made in the text, published maps, institutional affiliations, or any other geographical representation in this paper. While Copernicus Publications makes every effort to include appropriate place names, the final responsibility lies with the authors.
We thank Nana Liu and Chuntao Liu for providing the processed GPM data used for context in this paper. We also thank the two anonymous reviewers for their helpful feedback on the paper.
This research has been supported by the Science Mission Directorate (grant nos. 80NSSC18K0746 and 80NSSC19K0347).
This paper was edited by William Ward and reviewed by two anonymous referees.
Banerjee, A., Chiodo, G., Previdi, M., Ponater, M., Conley, A. J., and Polvani, L. M.: Stratospheric water vapor: an important climate feedback, Clim. Dynam., 53, 1697–1710, https://doi.org/10.1007/s00382-019-04721-4, 2019. a
Bergman, J. W., Fierli, F., Jensen, E. J., Honomichl, S., and Pan, L. L.: Boundary layer sources for the Asian anticyclone: Regional contributions to a vertical conduit, J. Geophys. Res.-Atmos., 118, 2560–2575, https://doi.org/10.1002/jgrd.50142, 2013. a
Bowman, K. P.: Large-scale isentropic mixing properties of the Antarctic polar vortex from analyzed winds, J. Geophys. Res.-Atmos., 98, 23013–23027, https://doi.org/10.1029/93JD02599, 1993. a
Bowman, K. P. and Carrie, G. D.: The Mean-Meridional Transport Circulation of the Troposphere in an Idealized GCM, J. Atmos. Sci., 59, 1502–1514, https://doi.org/10.1175/1520-0469(2002)059<1502:TMMTCO>2.0.CO;2, 2002. a
Bowman, K. P., Lin, J., Stohl, A., Draxler, R., Konopka, P., Andrews, A., and Brunner, D.: Input Data Requirements Lagrangian Trajectory Models, B. Am. Meteorol. Soc., 94, 1051–1058, https://doi.org/10.1175/BAMS-D-12-00076.1, 2013. a
Clapp, C., Smith, J., Bedka, K., and Anderson, J.: Identifying Source Regions and the Distribution of Cross-Tropopause Convective Outflow Over North America During the Warm Season, J. Geophys. Res.-Atmos., 124, 13750–13762, https://doi.org/10.1029/2019JD031382, 2019. a
Clapp, C. E., Smith, J. B., Bedka, K. M., and Anderson, J. G.: Identifying Outflow Regions of North American Monsoon Anticyclone-Mediated Meridional Transport of Convectively Influenced Air Masses in the Lower Stratosphere, J. Geophys. Res.-Atmos., 126, e2021JD034644, https://doi.org/10.1029/2021JD034644, 2021. a
Cooney, J. W., Bowman, K. P., Homeyer, C. R., and Fenske, T. M.: Ten Year Analysis of Tropopause-Overshooting Convection Using GridRad Data, J. Geophys. Res.-Atmos., 123, 329–343, https://doi.org/10.1002/2017JD027718, 2018. a
Dauhut, T. and Hohenegger, C.: The Contribution of Convection to the Stratospheric Water Vapor: The First Budget Using a Global Storm-Resolving Model, J. Geophys. Res.-Atmos., 127, e2021JD036295, https://doi.org/10.1029/2021JD036295, 2022. a
Dessler, A. E. and Sherwood, S. C.: Effect of convection on the summertime extratropical lower stratosphere, J. Geophys. Res.-Atmos., 109, D23301, https://doi.org/10.1029/2004JD005209, 2004. a
Dessler, A. E., Schoeberl, M. R., Wang, T., Davis, S. M., and Rosenlof, K. H.: Stratospheric water vapor feedback, P. Natl. Acad. Sci., 110, 18087–18091, https://doi.org/10.1073/pnas.1310344110, 2013. a, b
Gelaro, R., McCarty, W., Suárez, M. J., Todling, R., Molod, A., Molod, A., Takacs, L., Randles, C. A., Darmenov, A., Bosilovich, M. G., Reichle, R., Wargan, K., Coy, L., Cullather, R., Draper, C., Akella, S., Buchard, V., Conaty, A., Da Silva, A. M., Gu, W., Kim, G.-K., Koster, R., Lucchesi, R., Merkova, D., Nielsen, J. E., Partyka, G., Pawson, S., Putnam, W., Rienecker, M., Schubert, S. D., Sienkiewicz, M., and Zhao, B.: The Modern-Era Retrospective Analysis for Research and Applications, Version 2 (MERRA-2), J. Climate, 30, 5419–5454, https://doi.org/10.1175/JCLI-D-16-0758.1, 2017. a
Global Modeling and Assimilation Office (GMAO): MERRA-2 inst3_3d_asm_Nv: 3d, 3-Hourly, Instantaneous, Model-Level, Assimilation, Assimilated Meteorological Fields V5.12.4, GES DISC [data set], https://doi.org/10.5067/WWQSXQ8IVFW8, 2015. a
Gordon, A. E. and Homeyer, C. R.: Sensitivities of Cross-Tropopause Transport in Midlatitude Overshooting Convection to the Lower Stratosphere Environment, J. Geophys. Res.-Atmos., 127, e2022JD036713, https://doi.org/10.1029/2022JD036713, 2022. a
Hanisco, T. F., Moyer, E. J., Weinstock, E. M., St. Clair, J. M., Sayres, D. S., Smith, J. B., Lockwood, R., Anderson, J. G., Dessler, A. E., Keutsch, F. N., Spackman, J. R., Read, W. G., and Bui, T. P.: Observations of deep convective influence on stratospheric water vapor and its isotopic composition, Geophys. Res. Lett., 34, L04814, https://doi.org/10.1029/2006GL027899, 2007. a
Hegglin, M. I., Brunner, D., Wernli, H., Schwierz, C., Martius, O., Hoor, P., Fischer, H., Parchatka, U., Spelten, N., Schiller, C., Krebsbach, M., Weers, U., Staehelin, J., and Peter, Th.: Tracing troposphere-to-stratosphere transport above a mid-latitude deep convective system, Atmos. Chem. Phys., 4, 741–756, https://doi.org/10.5194/acp-4-741-2004, 2004. a
Hersbach, H., Bell, B., Berrisford, P., Hirahara, S., Horányi, A., Muñoz-Sabater, J., Nicolas, J., Peubey, C., Radu, R., Schepers, D., Simmons, A., Soci, C., Abdalla, S., Abellan, X., Balsamo, G., Bechtold, P., Biavati, G., Bidlot, J., Bonavita, M., De Chiara, G., Dahlgren, P., Dee, D., Diamantakis, M., Dragani, R., Flemming, J., Forbes, R., Fuentes, M., Geer, A., Haimberger, L., Healy, S., Hogan, R. J., Hólm, E., Janisková, M., Keeley, S., Laloyaux, P., Lopez, P., Lupu, C., Radnoti, G., de Rosnay, P., Rozum, I., Vamborg, F., Villaume, S., and Thépaut, J.-N.: The ERA5 global reanalysis,Q. J. Roy. Meteor. Soc., 146, 1999–2049, https://doi.org/10.1002/qj.3803, 2020. a
Holton, J. R., Haynes, P. H., McIntyre, M. E., Douglass, A. R., Rood, R. B., and Pfister, L.: Stratosphere-troposphere exchange, Rev. Geophys., 33, 403–439, https://doi.org/10.1029/95RG02097, 1995. a, b, c
Homeyer, C. R. and Bowman, K. P.: Rossby Wave Breaking and Transport between the Tropics and Extratropics above the Subtropical Jet, J. Atmos. Sci., 70, 607–626, https://doi.org/10.1175/JAS-D-12-0198.1, 2013. a, b, c
Homeyer, C. R. and Bowman, K. P.: A 22-Year Evaluation of Convection Reaching the Stratosphere Over the United States, J. Geophys. Res.-Atmos., 126, e2021JD034808, https://doi.org/10.1029/2021JD034808, 2021. a
Homeyer, C. R., Bowman, K. P., Pan, L. L., Atlas, E. L., Gao, R.-S., and Campos, T. L.: Dynamical and chemical characteristics of tropospheric intrusions observed during START08, J. Geophys. Res.-Atmos., 116, D06111, https://doi.org/10.1029/2010JD015098, 2011. a, b
Homeyer, C. R., Pan, L. L., Dorsi, S. W., Avallone, L. M., Weinheimer, A. J., O'Brien, A. S., DiGangi, J. P., Zondlo, M. A., Ryerson, T. B., Diskin, G. S., and Campos, T. L.: Convective transport of water vapor into the lower stratosphere observed during double-tropopause events, J. Geophys. Res.-Atmos., 119, 10941–10958, https://doi.org/10.1002/2014JD021485, 2014. a
Honomichl, S. B. and Pan, L. L.: Transport From the Asian Summer Monsoon Anticyclone Over the Western Pacific, J. Geophys. Res.-Atmos., 125, e2019JD032094, https://doi.org/10.1029/2019JD032094, 2020. a, b
Hoskins, B. J.: Towards a PV-θ view of the general circulation, Tellus B, 43, 27–35, https://doi.org/10.1034/j.1600-0889.1991.t01-3-00005.x, 1991. a
Hou, A. Y., Kakar, R. K., Neeck, S., Azarbarzin, A. A., Kummerow, C. D., Kojima, M., Oki, R., Nakamura, K., and Iguchi, T.: The Global Precipitation Measurement Mission, B. Am. Meteorol. Soc., 95, 701–722, https://doi.org/10.1175/BAMS-D-13-00164.1, 2014. a
Jensen, E. J., Pan, L. L., Honomichl, S., Diskin, G. S., Krämer, M., Spelten, N., Günther, G., Hurst, D. F., Fujiwara, M., Vömel, H., Selkirk, H. B., Suzuki, J., Schwartz, M. J., and Smith, J. B.: Assessment of Observational Evidence for Direct Convective Hydration of the Lower Stratosphere, J. Geophys. Res.-Atmos., 125, e2020JD032793, https://doi.org/10.1029/2020JD032793, 2020. a
Khaykin, S. M., Moyer, E., Krämer, M., Clouser, B., Bucci, S., Legras, B., Lykov, A., Afchine, A., Cairo, F., Formanyuk, I., Mitev, V., Matthey, R., Rolf, C., Singer, C. E., Spelten, N., Volkov, V., Yushkov, V., and Stroh, F.: Persistence of moist plumes from overshooting convection in the Asian monsoon anticyclone, Atmos. Chem. Phys., 22, 3169–3189, https://doi.org/10.5194/acp-22-3169-2022, 2022. a
Konopka, P., Grooß, J.-U., Günther, G., Ploeger, F., Pommrich, R., Müller, R., and Livesey, N.: Annual cycle of ozone at and above the tropical tropopause: observations versus simulations with the Chemical Lagrangian Model of the Stratosphere (CLaMS), Atmos. Chem. Phys., 10, 121–132, https://doi.org/10.5194/acp-10-121-2010, 2010. a
Konopka, P., Tao, M., Ploeger, F., Hurst, D. F., Santee, M. L., Wright, J. S., and Riese, M.: Stratospheric Moistening After 2000, Geophys. Res. Lett., 49, e2021GL097609, https://doi.org/10.1029/2021GL097609, 2022. a
Lambert, A., Read, W., and Livesey, N.: MLS/Aura Level 2 Water Vapor (H2O) Mixing Ratio V005, GES DISC [data set], https://doi.org/10.5067/Aura/MLS/DATA2508, 2020. a
Langille, J., Bourassa, A., Pan, L. L., Letros, D., Solheim, B., Zawada, D., and Degenstein, D.: Observational evidence of moistening the lowermost stratosphere via isentropic mixing across the subtropical jet, Atmos. Chem. Phys., 20, 5477–5486, https://doi.org/10.5194/acp-20-5477-2020, 2020. a, b
Liu, C.: GPM precipitation feature database [data set], http://atmos.tamucc.edu/trmm/data/gpm/ (last access: 21 July 2021), 2020. a
Liu, C., Zipser, E. J., Cecil, D. J., Nesbitt, S. W., and Sherwood, S.: A Cloud and Precipitation Feature Database from Nine Years of TRMM Observations, J. Appl. Meteorol. Clim., 47, 2712–2728, https://doi.org/10.1175/2008JAMC1890.1, 2008. a
Liu, N. and Liu, C.: Global distribution of deep convection reaching tropopause in 1 year GPM observations, J. Geophys. Res.-Atmos., 121, 3824–3842, https://doi.org/10.1002/2015JD024430, 2016. a
Liu, N., Liu, C., and Hayden, L.: Climatology and Detection of Overshooting Convection From 4 Years of GPM Precipitation Radar and Passive Microwave Observations, J. Geophys. Res. Atmos., 125, e2019JD032003, https://doi.org/10.1029/2019JD032003, 2020. a, b, c
Livesey, N. J., Read, W. G., Wagner, P. A., Froidevaux, L., Lambert, A., Manney, G. L., Valle, L. F. M., Pumphrey, H. C., Santee, M. L., Schwartz, M. J., Wang, S., Fuller, R. A., Jarnot, R. F., Knosp, B. W., Martinez, E., and Lay, R. R.: Earth Observing System (EOS) Aura Microwave Limb Sounder (MLS): Version 4.2x Level 2 data quality and description document, https://mls.jpl.nasa.gov/data/v4-2_data_quality_document.pdf (last access: 27 August 2020), 2020. a, b
Mote, P. W., Rosenlof, K. H., McIntyre, M. E., Carr, E. S., Gille, J. C., Holton, J. R., Kinnersley, J. S., Pumphrey, H. C., Russell III, J. M., and Waters, J. W.: An atmospheric tape recorder: The imprint of tropical tropopause temperatures on stratospheric water vapor, J. Geophys. Res.-Atmos., 101, 3989–4006, https://doi.org/10.1029/95JD03422, 1996. a
Mullendore, G. L., Durran, D. R., and Holton, J. R.: Cross-tropopause tracer transport in midlatitude convection, J. Geophys. Res.-Atmos., 110, D06113, https://doi.org/10.1029/2004JD005059, 2005. a
Munchak, L. A. and Pan, L. L.: Separation of the lapse rate and the cold point tropopauses in the tropics and the resulting impact on cloud top-tropopause relationships, J. Geophys. Res.-Atmos., 119, 7963–7978, https://doi.org/10.1002/2013JD021189, 2014. a, b
Nesbitt, S. W., Zipser, E. J., and Cecil, D. J.: A Census of Precipitation Features in the Tropics Using TRMM: Radar, Ice Scattering, and Lightning Observations, J. Climate, 13, 4087–4106, https://doi.org/10.1175/1520-0442(2000)013<4087:ACOPFI>2.0.CO;2, 2000. a
Nowack, P., Ceppi, P., Davis, S. M., Chiodo, G., Ball, W., Diallo, M. A., Hassler, B., Jia, Y., Keeble, J., and Joshi, M.: Response of stratospheric water vapour to warming constrained by satellite observations, Nat. Geosci., 16, 577–583, https://doi.org/10.1038/s41561-023-01183-6, 2023. a
O'Neill, M. E., Orf, L., Heymsfield, G. M., and Halbert, K.: Hydraulic jump dynamics above supercell thunderstorms, Science, 373, 1248–1251, https://doi.org/10.1126/science.abh3857, 2021. a
Pan, L. L., Randel, W. J., Gille, J. C., Hall, W. D., Nardi, B., Massie, S., Yudin, V., Khosravi, R., Konopka, P., and Tarasick, D.: Tropospheric intrusions associated with the secondary tropopause, J. Geophys. Res.-Atmos., 114, D10302, https://doi.org/10.1029/2008JD011374, 2009. a
Pan, L. L., Honomichl, S. B., Kinnison, D. E., Abalos, M., Randel, W. J., Bergman, J. W., and Bian, J.: Transport of chemical tracers from the boundary layer to stratosphere associated with the dynamics of the Asian summer monsoon, J. Geophys. Res.-Atmos., 121, 14159–14174, https://doi.org/10.1002/2016JD025616, 2016. a, b
Pan, L. L., Kinnison, D., Liang, Q., Chin, M., Santee, M. L., Flemming, J., Smith, W. P., Honomichl, S. B., Bresch, J. F., Lait, L. R., Zhu, Y., Tilmes, S., Colarco, P. R., Warner, J., Vuvan, A., Clerbaux, C., Atlas, E. L., Newman, P. A., Thornberry, T., Randel, W. J., and Toon, O. B.: A Multimodel Investigation of Asian Summer Monsoon UTLS Transport Over the Western Pacific, J. Geophys. Res.-Atmos., 127, e2022JD037511, https://doi.org/10.1029/2022JD037511, 2022. a, b
Phoenix, D. B. and Homeyer, C. R.: Simulated Impacts of Tropopause-Overshooting Convection on the Chemical Composition of the Upper Troposphere and Lower Stratosphere, J. Geophys. Res.-Atmos., 126, e2021JD034568, https://doi.org/10.1029/2021JD034568, 2021. a
Ploeger, F., Günther, G., Konopka, P., Fueglistaler, S., Müller, R., Hoppe, C., Kunz, A., Spang, R., Grooß, J.-U., and Riese, M.: Horizontal water vapor transport in the lower stratosphere from subtropics to high latitudes during boreal summer, J. Geophys. Res.-Atmos., 118, 8111–8127, https://doi.org/10.1002/jgrd.50636, 2013. a, b
Randel, W. and Park, M.: Diagnosing Observed Stratospheric Water Vapor Relationships to the Cold Point Tropical Tropopause, J. Geophys. Res.-Atmos., 124, 7018–7033, https://doi.org/10.1029/2019JD030648, 2019. a
Randel, W. J., Park, M., Emmons, L., Kinnison, D., Bernath, P., Walker, K. A., Boone, C., and Pumphrey, H.: Asian Monsoon Transport of Pollution to the Stratosphere, Science, 328, 611–613, https://doi.org/10.1126/science.1182274, 2010. a, b
Randel, W. J., Moyer, E., Park, M., Jensen, E., Bernath, P., Walker, K., and Boone, C.: Global variations of HDO and HDO H2O ratios in the upper troposphere and lower stratosphere derived from ACE-FTS satellite measurements, J. Geophys. Res.-Atmos., 117, D06303, https://doi.org/10.1029/2011JD016632, 2012. a, b
Roiger, A., Schlager, H., Schäfler, A., Huntrieser, H., Scheibe, M., Aufmhoff, H., Cooper, O. R., Sodemann, H., Stohl, A., Burkhart, J., Lazzara, M., Schiller, C., Law, K. S., and Arnold, F.: In-situ observation of Asian pollution transported into the Arctic lowermost stratosphere, Atmos. Chem. Phys., 11, 10975–10994, https://doi.org/10.5194/acp-11-10975-2011, 2011. a
Schwartz, M. J., Read, W. G., Santee, M. L., Livesey, N. J., Froidevaux, L., Lambert, A., and Manney, G. L.: Convectively injected water vapor in the North American summer lowermost stratosphere, Geophys. Res. Lett., 40, 2316–2321, https://doi.org/10.1002/grl.50421, 2013. a, b, c, d, e
Schwartz, M. J., Manney, G. L., Hegglin, M. I., Livesey, N. J., Santee, M. L., and Daffer, W. H.: Climatology and variability of trace gases in extratropical double-tropopause regions from MLS, HIRDLS, and ACE-FTS measurements, J. Geophys. Res. Atmos., 120, 843–867, https://doi.org/10.1002/2014JD021964, 2015. a
Skofronick-Jackson, G., Petersen, W. A., Berg, W., Kidd, C., Stocker, E. F., Kirschbaum, D. B., Kakar, R., Braun, S. A., Huffman, G. J., Iguchi, T., Kirstetter, P. E., Kummerow, C., Meneghini, R., Oki, R., Olson, W. S., Takayabu, Y. N., Furukawa, K., and Wilheit, T.: The Global Precipitation Measurement (GPM) Mission for Science and Society, B. Am. Meteorol. Soc., 98, 1679–1695, https://doi.org/10.1175/BAMS-D-15-00306.1, 2017. a
Smith, J. B., Wilmouth, D. M., Bedka, K. M., Bowman, K. P., Homeyer, C. R., Dykema, J. A., Sargent, M. R., Clapp, C. E., Leroy, S. S., Sayres, D. S., Dean-Day, J. M., Paul Bui, T., and Anderson, J. G.: A case study of convectively sourced water vapor observed in the overworld stratosphere over the United States, J. Geophys. Res.-Atmos., 122, 9529–9554, https://doi.org/10.1002/2017JD026831, 2017. a
Solomon, D. L., Bowman, K. P., and Homeyer, C. R.: Tropopause-Penetrating Convection from Three-Dimensional Gridded NEXRAD Data, J. Appl. Meteorol. Clim., 55, 465–478, https://doi.org/10.1175/JAMC-D-15-0190.1, 2016. a
Solomon, S., Rosenlof, K. H., Portmann, R. W., Daniell, J. S., Davis, S. M., Sanford, T. J., and Plattner, G.-K.: Contributions of Stratospheric Water Vapor to Decadal Changes in the Rate of Global Warming, Science, 327, 1219–1223, https://doi.org/10.1126/science.1182488, 2010. a
Stohl, A.: A 1-year Lagrangian “climatology” of airstreams in the northern hemisphere troposphere and lowermost stratosphere, J. Geophys. Res.-Atmos., 106, 7263–7279, https://doi.org/10.1029/2000JD900570, 2001. a
Stohl, A., Wotawa, G., Seibert, P., and Kromp-Kolb, H.: Interpolation Errors in Wind Fields as a Function of Spatial and Temporal Resolution and Their Impact on Different Types of Kinematic Trajectories, J. Appl. Meteorol., 34, 2149–2165, https://doi.org/10.1175/1520-0450(1995)034<2149:IEIWFA>2.0.CO;2, 1995. a
Stohl, A., Wernli, H., James, P., Bourqui, M., Forster, C., Liniger, M. A., Seibert, P., and Sprenger, M.: A new perspective of stratosphere-troposphere exchange, B. Am. Meteorol. Soc., 84, 1565–1573, 2003. a, b
Tinney, E. N. and Homeyer, C. R.: A 13-year Trajectory-Based Analysis of Convection-Driven Changes in Upper Troposphere Lower Stratosphere Composition Over the United States, J. Geophys. Res.-Atmos., 126, e2020JD033657, https://doi.org/10.1029/2020JD033657, 2021. a, b, c, d, e
Ueyama, R., Schoeberl, M., Jensen, E., Pfister, L., Park, M., and Ryoo, J.-M.: Convective Impact on the Global Lower Stratospheric Water Vapor Budget, J. Geophys. Res.-Atmos., 128, e2022JD037135, https://doi.org/10.1029/2022JD037135, 2023. a
Vincent, D. G.: The South Pacific Convergence Zone (SPCZ): A Review, Mon. Weather Rev., 122, 1949–1970, https://doi.org/10.1175/1520-0493(1994)122<1949:TSPCZA>2.0.CO;2, 1994. a
Wang, Y., Su, H., Jiang, J. H., Livesey, N. J., Santee, M. L., Froidevaux, L., Read, W. G., and Anderson, J.: The linkage between stratospheric water vapor and surface temperature in an observation-constrained coupled general circulation model, Clim. Dynam., 48, 2671–2683, https://doi.org/10.1007/s00382-016-3231-3, 2017. a
Werner, F., Schwartz, M. J., Livesey, N. J., Read, W. G., and Santee, M. L.: Extreme Outliers in Lower Stratospheric Water Vapor Over North America Observed by MLS: Relation to Overshooting Convection Diagnosed From Colocated Aqua-MODIS Data, Geophys. Res. Lett., 47, e2020GL090131, https://doi.org/10.1029/2020GL090131, 2020. a, b, c, d, e
Wernli, H. and Bourqui, M.: A Lagrangian “1-year climatology” of (deep) cross-tropopause exchange in the extratropical Northern Hemisphere, J. Geophys. Res.-Atmos., 107, ACL 13–1–ACL 13–16, https://doi.org/10.1029/2001JD000812, 2002. a
WMO: Meteorology-A three-dimensional science: Second session of the commission for aerology, WMO Bull., 4, 134–138, 1957 a