the Creative Commons Attribution 4.0 License.
the Creative Commons Attribution 4.0 License.
 | 05 Jan 2023
Vertical characterization of fine and coarse dust particles during an intense Saharan dust outbreak over the Iberian Peninsula in springtime 2021
María Ángeles López-Cayuela
Carmen Córdoba-Jabonero
Diego Bermejo-Pantaleón
Michaël Sicard
Vanda Salgueiro
Francisco Molero
Clara Violeta Carvajal-Pérez
María José Granados-Muñoz
Adolfo Comerón
Flavio T. Couto
Rubén Barragán
María-Paz Zorzano
Juan Antonio Bravo-Aranda
Constantino Muñoz-Porcar
María João Costa
Begoña Artíñano
Alejandro Rodríguez-Gómez
Daniele Bortoli
Manuel Pujadas
Jesús Abril-Gago
Lucas Alados-Arboledas
Juan Luis Guerrero-Rascado
An intense and long-lasting Saharan dust outbreak crossed the Iberian Peninsula (IP) from the southwest (SW) to the northeast (NE) from 25 March until 7 April 2021. This work aims to assess the optical and mass contribution of both fine and coarse dust particles along their transport. Five Iberian lidar stations were monitoring the transport and evolution of the Saharan dust particles, i.e. El Arenosillo/Huelva, Granada, Torrejón/Madrid and Barcelona in Spain, and Évora in Portugal. The particular meteorological conditions determined the aerosol scenario along the overall dust event, differing in the first part of the event (25–31 March), in which the strongest dust incidence occurred on 29–31 March at the south and central stations and 1 April at Barcelona, from the second one (1–7 April). The use of the two-step POLIPHON algorithm showed the relevance of using polarized lidar measurements for separating the aerosol properties of dust fine and coarse particles as an added value. Both the fine dust (Df) and coarse dust (Dc) components of the total particle backscatter coefficient (total dust, DD = Dc + Df) were separately derived. The dust plume was well-mixed with height and no significant differences were found in the vertical structure of both the Dc and Df particle backscatter coefficients. From the beginning of the dust outbreak until 1 April, the vertical Df DD mass ratio was nearly constant in time at each station and also in altitude with values of ∼ 10 %. Moreover, the mean dust optical depth at 532 nm was decreasing along that dust pathway, reporting values from SW to NE stations of 0.34 at El Arenosillo/Huelva, 0.28 at Granada, 0.20 at Évora, 0.28 at Torrejón/Madrid, and 0.14 at Barcelona, although its Df DD ratio remained almost constant (28 %–30 %). A similar pattern was found for the total dust mass loading and its Df DD ratio, i.e. mostly decreasing mean mass values were reported, being constant in its Df DD ratio (∼ 10 %) along the SW–NE dust pathway. In addition, the episode-mean centre-of-mass height increased with latitude overall, showing a high variability, being greater than 0.5 km at the southern sites (El Arenosillo/Huelva, Granada, Évora) and ∼ 1.0 km at Torrejón/Madrid and Barcelona. However, despite the relatively high intensity of the dust intrusion, the expected ageing of the dust particles was hardly observed, by taking into account the minor changes found in the contribution and properties of the coarse and fine dust particles. This is on the basis that the IP is relatively close to the Saharan dust sources and then, under certain dust transport conditions, any potential ageing processes in the dust particles remained unappreciated. The following must be highlighted: the different relative contribution of the fine dust particles to the total dust found for their optical properties (∼ 30 %) associated with the radiative effect of dust, with respect to that for the mass features (∼ 10 %) linked to air quality issues, along the overall dust event by crossing the IP.
- Article
(6940 KB) - Full-text XML
- Companion paper 1
- Companion paper 2
-
Supplement
(1182 KB) - BibTeX
- EndNote


The impact of atmospheric aerosol particles on climate change is directly related to both their optical and microphysical properties and their spatio-temporal distribution (Myhre et al., 2013). However, there are still large uncertainties associated with their aerosol direct and indirect radiative effects, mainly due to the change in the aerosol properties during the transport, the incomplete characterization of complex mixtures, and the lack of information on cloud–aerosol interaction mechanisms (Stevens, 2015). The most abundant aerosol in the atmosphere is mineral dust, leading to worse air quality with harmful effects on human health (e.g. Díaz et al., 2017; Querol et al., 2019; Hashizume et al., 2020), especially under scenarios of extreme events (e.g. Euphrasie-Clotilde et al., 2021), with potential socio-economic impacts. Thus, the study of their variability on a global, regional, and local scale is extremely useful to improve the understanding of atmospheric processes and model evaluation, and currently mineral dust is widely studied, becoming a remarkable scientific discipline (Ho et al., 2018; Middleton, 2017).
Global models estimated the total mineral dust emissions at 1000–3000 Tg yr−1 (e.g. Zender et al., 2004), but more recent studies, based on a global dust model intercomparison, suggested that they may range from 500 to 4000 Tg yr−1 (Huneeus et al., 2011). In particular, the Sahara Desert is the main source of airborne mineral dust (Shao et al., 2011), representing half of the global mineral dust emissions, between 400 to 2200 Tg yr−1 (Huneeus et al., 2011). Saharan dust can be transported to Europe under certain meteorological conditions (e.g. Salvador et al., 2014; Marinou et al., 2017; Russo et al., 2020; Couto et al., 2021), occasionally reaching rather high altitudes (up to 8 km height; e.g. Mona et al., 2006; Papayannis et al., 2008; Córdoba-Jabonero et al., 2021a; Sicard et al., 2022).
A great effort has been accomplished in the last decades to assess the mineral dust effect along the Mediterranean Basin, focused on the dust vertical distribution by using ground-based micro-pulse lidars and advanced lidar systems belonging to EARLINET (European Aerosol Research Lidar NETwork; https://www.earlinet.org/, last access: 21 December 2021; Pappalardo et al., 2014). Thus, several studies related to the study of dust optical and microphysical properties (e.g. Di Girolamo et al., 2012; Granados-Muñoz et al., 2016; Soupiona et al., 2019) and their impact on radiative forcing (e.g. Mallet et al., 2016; Sicard et al., 2016; Valenzuela et al., 2017; Soupiona et al., 2020; Kokkalis et al., 2021) were performed. Recent studies show an increase in the frequency of Saharan outbreaks over Europe when compared with long-term records (Sousa et al., 2019; Salvador et al., 2022). Moreover, since extreme dust outbreaks are more and more frequently detected (Guerrero-Rascado et al., 2009; Mamouri et al., 2016; Cazorla et al., 2017; Solomos et al., 2017; Fernández et al., 2019), the WMO SDS-WAS (World Meteorological Organization Sand and Dust Storm Warning Advisory and Assessment System; https://public.wmo.int/en/our-mandate/focus-areas/environment/SDS, last access: 20 February 2022) is devoted to research forecasting products from atmospheric dust models to contribute to risk reduction in many areas of societal benefit; and also, more recently, EARLINET has introduced an early warning system for atmospheric aerosol aviation hazards (Papagiannopoulos et al., 2020).
In particular, by focusing on the Iberian Peninsula (IP), the arrival of Saharan dust intrusions is more frequently observed in springtime and summertime (e.g. Guerrero-Rascado et al., 2008; Córdoba-Jabonero et al., 2011; Obregón et al., 2015; Mandija et al., 2017; Salvador et al., 2019; Córdoba-Jabonero et al., 2021a; López-Cayuela et al., 2021; Salgueiro et al., 2021; Abril-Gago et al., 2022), mainly at central and southern IP (Russo et al., 2020). An increase in the number of studies reporting severe and extreme events over the IP is also remarkable (Sánchez et al., 2007; Guerrero-Rascado et al., 2009; Preißler et al., 2011; Cabello et al., 2012; Valenzuela et al., 2017), including the less and less extraordinary wintertime dust outbreaks (Cazorla et al., 2017; Córdoba-Jabonero et al., 2019; Fernández et al., 2019).
This work aims to study an exceptionally intense and long-lasting Saharan dust event occurring over the IP in springtime 2021 and monitored by five Iberian lidar stations, which covered mostly the IP from SW to NE. Other authors also studied intense and extreme dust events of the IP at several stations, focusing on the optical properties of the event (Cazorla et al., 2017; Salvador et al., 2019). The new approach of this work is not only focused on applying a validated methodology to separate the contribution of both the coarse and fine dust particles, but also to include a study of the evolution of their microphysical properties along their transport from the SW to the NE IP in terms of the estimation of their mass concentrations, among other features. Moreover, thanks to the wide spatial coverage for dust monitoring, it is possible to assess the potential ageing of the dust particles along their transport by crossing the IP, by examining the minor changes found in the contribution and properties of the coarse and fine dust particles.
The paper is structured as follows: the instrumentation used in each station and the methodology applied are described in Sects. 2 and 3, respectively; the results and discussion are described in Sect. 4; and, finally, the main conclusions are exposed in Sect. 5.
An intense Saharan dust outbreak was observed over the IP in spring 2021 from 25 March until 7 April, being monitored by five Iberian lidar stations. A description of the stations used in this study (from SW to NE, by latitude), El Arenosillo/Huelva (ARN), Granada (GRA), Évora (EVO), Torrejón/Madrid (TRJ), and Barcelona (BCN), covering most of the IP, is shown in Table 1. Figure 1 shows the geographical position of each station to others in the IP.
Table 1Details of the five Iberian lidar stations used in this work and the corresponding period of the dust outbreak lasting over each one. P-MPL and RL denote polarized micro-pulse lidar and Raman lidar, respectively.

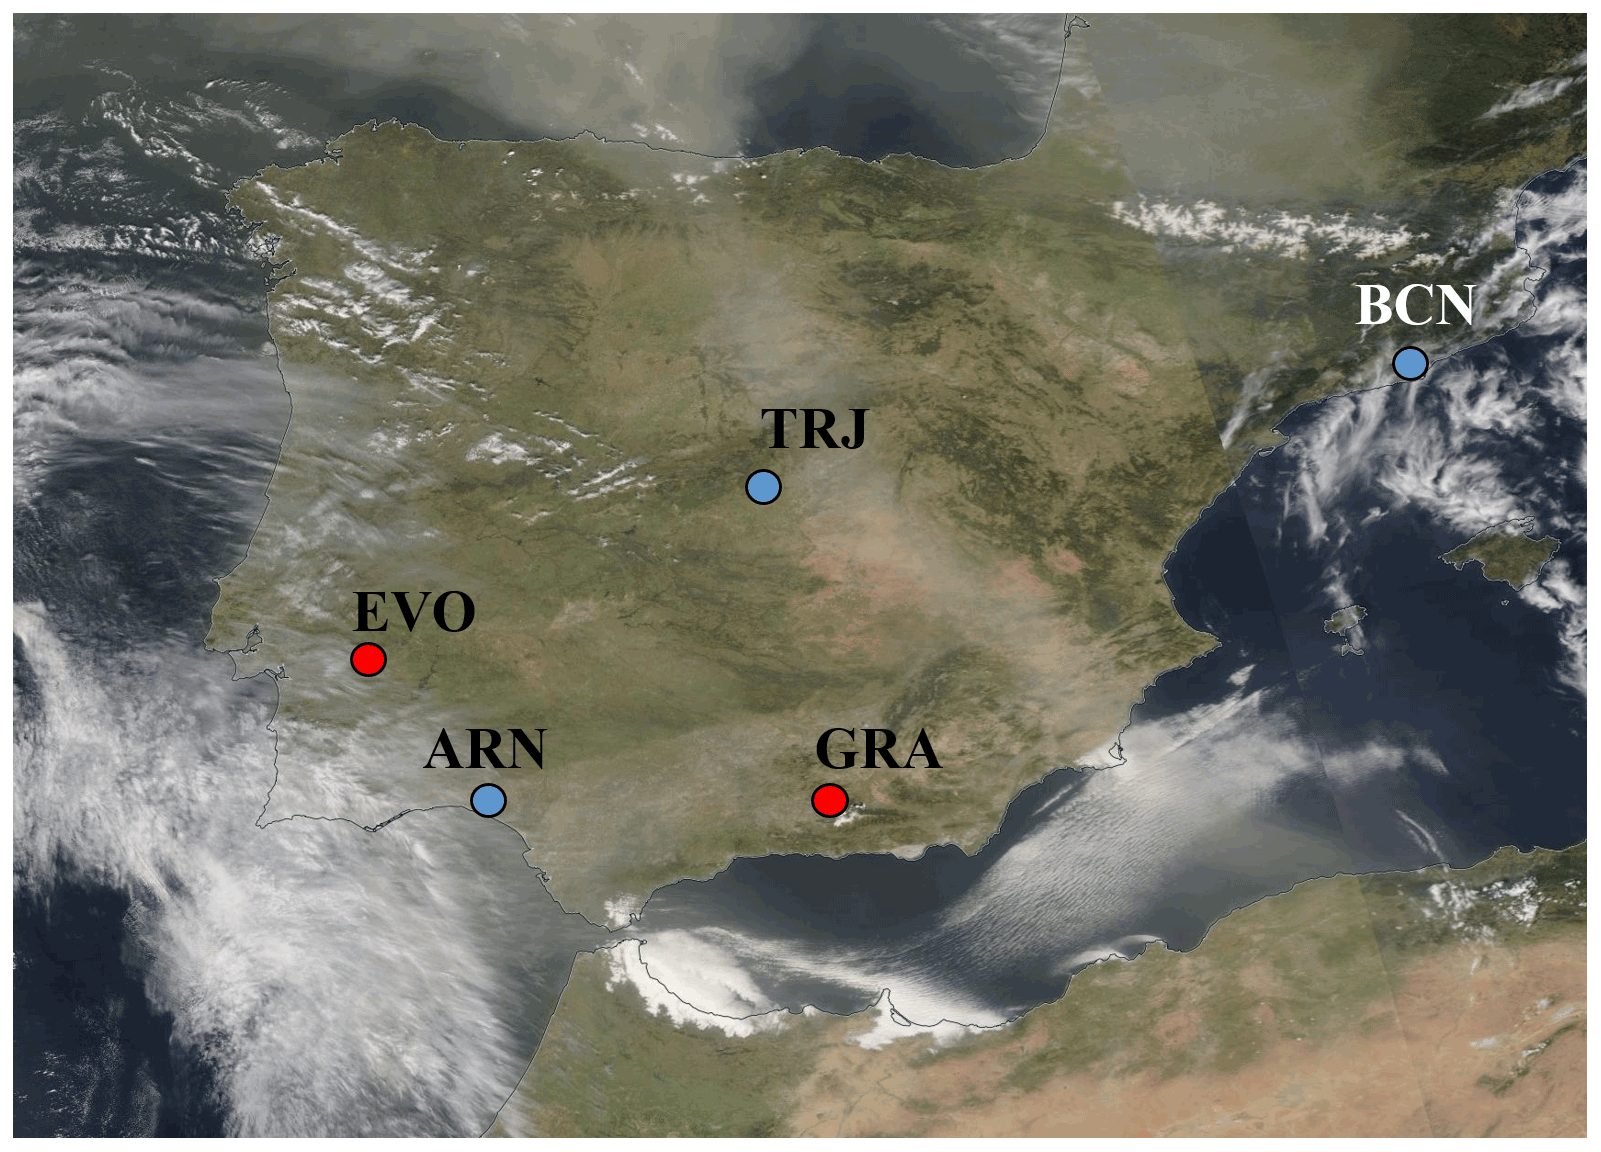
Figure 1MODIS image of the corrected reflectance over the Iberian Peninsula on 31 March 2021. The five Iberian lidar stations are marked with a red dot (Raman lidar, RL) and blue dot (polarized micro-pulse lidar, P-MPL) (from NE to SW in the Iberian Peninsula): Barcelona (BCN), Torrejón/Madrid (TRJ), Évora (EVO), Granada (GRA), and El Arenosillo/Huelva (ARN) sites.
On the one hand, polarized micro-pulse lidars (P-MPL, v.4B, Droplet Measurement Technologies LLC, USA) are operating at ARN, TRJ, and BCN. The P-MPL system is a one-wavelength elastic lidar with a relatively high pulse repetition frequency (2500 Hz) using a low-energy (∼ 7 µJ) Nd:YVO4 laser at 532 nm, including polarization capabilities. It operates in an automatic and full-time continuous mode (24/7). A dead-time correction was applied following the manufacturer's instructions and laboratory calibrations of the detector (Campbell et al., 2002). Dark-count and after-pulse correction measurements are performed monthly (Campbell et al., 2002; Welton and Campbell, 2002). The P-MPL total range-corrected signal (RCS) and volume linear depolarization ratio (VLDR) were determined according to Flynn et al. (2007) by using in-house, well-validated data processing (Córdoba-Jabonero et al., 2018, 2019, 2021b; Sicard et al., 2020). Both the RCS and the VLDR (δv) were obtained as hourly averaged profiles to increase the signal-to-noise ratio.
On the other hand, multi-wavelength Raman lidar (RL) systems are deployed at EVO and GRA stations, forming part of the ACTRIS/EARLINET network. Those RL operate at three elastic wavelengths (355, 532, and 1064 nm), two Raman channels (355 and 532 nm) and one polarization-sensitive channel (532 nm), using high energy (∼ 65–400 mJ) Nd:YAG laser and relatively low pulse repetition frequency (10–20 Hz). Specifically, the RL deployed at GRA station is an LR331D400 system (Raymetrics S.A., Greece), described in detail in Guerrero-Rascado et al. (2008, 2009), and a PollyXT system (Baars et al., 2016; Engelmann et al., 2016) is operative at EVO station (Preißler et al., 2011). A complete review of the lidar techniques using elastic, Raman, and polarization-sensitive channels can be found in Comerón et al. (2017).
The vertically-resolved particle backscatter coefficients (βp) were retrieved by assuming a fixed lidar ratio of 50 sr by applying the Klett–Fernald algorithm (Fernald, 1984; Klett, 1985) for the P-MPL measurements, and the Single Calculus Chain (SCC; D'Amico et al., 2016; Mattis et al., 2016) for the elastic RL measurements, which is the EARLINET standardized tool for lidar data processing. The particle linear depolarization ratio (δp) profiles were calculated from both the βp and δv ones.
3.1 Transport pathway and synoptic situation
The origin and pathway of the dust events affecting the IP were analysed by using several models to accurately determine the spatial and temporal coverage of the dusty event over the stations (see Table 1). On one hand, a first and general insight of the geographical allocation of the aerosol plumes was obtained using the added-value aerosol optical depth from Terra/Aqua MODIS satellite (https://modis.gsfc.nasa.gov/about/, last access: 20 June 2021); images not shown) and also from Meteosat SEVIRI image RGB composites tailored to monitor the evolution of dust storms (https://view.eumetsat.int/, last access: 10 March 2022; images not shown). On the other hand, an overview of the synoptic situation favouring the arrival and spreading of these dust particles was performed by using the NCEP/NCAR (National Centers for Environmental Prediction and National Center for Atmospheric Research) reanalysis. Specifically, images of the mean geopotential height (m) are shown. Those images are provided by the NOAA Physical Sciences Laboratory (http://psl.noaa.gov/data/composites/day/, last access: 11 April 2022).
Additionally, the PySPLIT HYSPLIT toolbox (Warner, 2018) has been used to identify the source area of the dust particles as observed over the stations. This is a package that contains functions and classes to automatically generate trajectories from the NOAA Air Research Laboratory's HYSPLIT model (Hybrid Single-Particle Lagrangian Integrated Trajectory model version 4; Rolph et al., 2017; https://ready.arl.noaa.gov/HYSPLIT.php, last access: 20 June 2021). In particular, a total of 456 single 5 d back-trajectories of air masses have been computed for each station and day of the dust event, including their vertical extent from 500 to 9500 m height (500 m step). That trajectory assembly is analysed in terms of the percentage of back-trajectory points overpassing the Saharan area. It is assumed that dust particles are potentially transported by those air masses if at least one point of their pathway is crossing the Sahara; otherwise, the trajectory is discarded. The Global Data Assimilation System database (GDAS, ftp://www.arl.noaa.gov/puv/archives/gdas1, last access: 12 November 2021; spatial resolution of 1∘ × 1∘ every 3 h) was used to feed the HYSPLIT model.
3.2 Separation of the optical and mass properties
The Polarisation LIdar PHOtometer Networking (POLIPHON) approach (Mamouri and Ansmann, 2014, 2017) is used with the elastic polarized lidar measurements for separating the optical properties (backscatter and extinction) of aerosol mixtures, whose particle components present clearly different depolarization ratios. Specifically in this work, the two-step POLIPHON approach was applied, using the total βp and δp profiles at 532 nm to discriminate the three components of a dusty mixture, namely the dust coarse (Dc), dust fine (Df), and non-dust (ND) components. The latter is assumed to be representative of background fine aerosols with low depolarizing particles (δp∼0.05), in contrast to the Df (δp∼0.16) and Dc (δp∼0.39) particles (Ansmann et al., 2019).
Note that βp is an extensive parameter and, therefore, βp=Σiβi(z), where βi (i = Df, Dc, ND) are the corresponding backscatter coefficients for Df, Dc, and ND components, respectively, and z denotes the height dependence. Hence, once the single backscatter coefficient (βi,) is separated, the profiles of the dust extinction coefficient for each component (αi) can be obtained by considering the specific particle lidar ratios at 532 nm for each one, i.e. 55 sr for Df and Dc and 50 sr for ND (Ansmann et al., 2019). The relative uncertainties related to αi are 20 %–30 %, 40 %–60 %, and 25 %–35 % for DD, Df, and Dc, respectively. More details on the extinction retrieval by components can be found in Córdoba-Jabonero et al. (2018, 2021a).
The total dust (DD) extinction coefficient can be obtained as the sum of the extinction coefficients for the Df and Dc components. Thus, the dust optical depth at 532 nm (DOD532) for each dust component, DOD, i = Df, Dc, is obtained by height integration of each αi(z).
Additionally, the dust mass features along the dust event are derived from the extinction profiles for the Dc and Df components, as described in Córdoba-Jabonero et al. (2019). Indeed, the vertical profile of the total dust mass concentration (mDD) can be calculated as follows:
where dp is the dust particle density (2.6 g cm−3; Mamouri and Ansmann, 2017) and cv is the volume-to-extinction conversion factors; that is, values of 0.83 × 10⁻¹² and 0.23 × 10⁻¹² Mm were selected for Dc and Df, respectively (Mamouri and Ansmann, 2017; Ansmann et al., 2019). This can yield a relative uncertainty in mi of 20 %–30 %, 40 %–60 % ,and 25 %–35 % for DD, Df, and Dc, respectively. The total dust mass loading (MDD, in g m−2) can be obtained by the height integration of the mass concentration profiles as follows:
where Δz is the vertical resolution of the profiles for each lidar system (see Table 1). The relative mass contribution of each component to the total dust mass loading (Mi, in %, where i = Dc, Df) is also calculated by using the following expression:
Finally, the centre-of-mass (CoM) height (ZCoM) is also estimated to provide a measure of the vertical mass impact of each component (Córdoba-Jabonero et al., 2019), which is expressed as
where mi are the mass concentration profiles for each i component (see Eq. 1, i = Df, Dc) and zk is the height at the k-step as defined by the vertical resolution of each lidar system (Table 1).
4.1 Synoptic scenario
The meteorological situation is described by using the NCEP/NCAR reanalysis data to check the conditions favouring the advection injection of Saharan dust over the IP (Salvador et al., 2014; Díaz et al., 2017; Couto et al., 2021). On the one hand, the meteorological scenarios are described by using daily pictures of geopotential height composite mean at 700 hPa (around 3000 m a.s.l.) on particular days (Fig. 2a–i). On the other hand, the geopotential at 500 hPa (around 5500 m a.s.l.) was selected on two critical days, namely 29 March and 1 April (Fig. 2j and k; vertical temperature gradient), when dust layers were observed on relatively high altitudes at central and north-eastern stations. Furthermore, the percentage of HYSPLIT back-trajectories coming from the Sahara desert area per day for each lidar station, and potentially carrying dust particles, are shown in Fig. S1 in the Supplement.
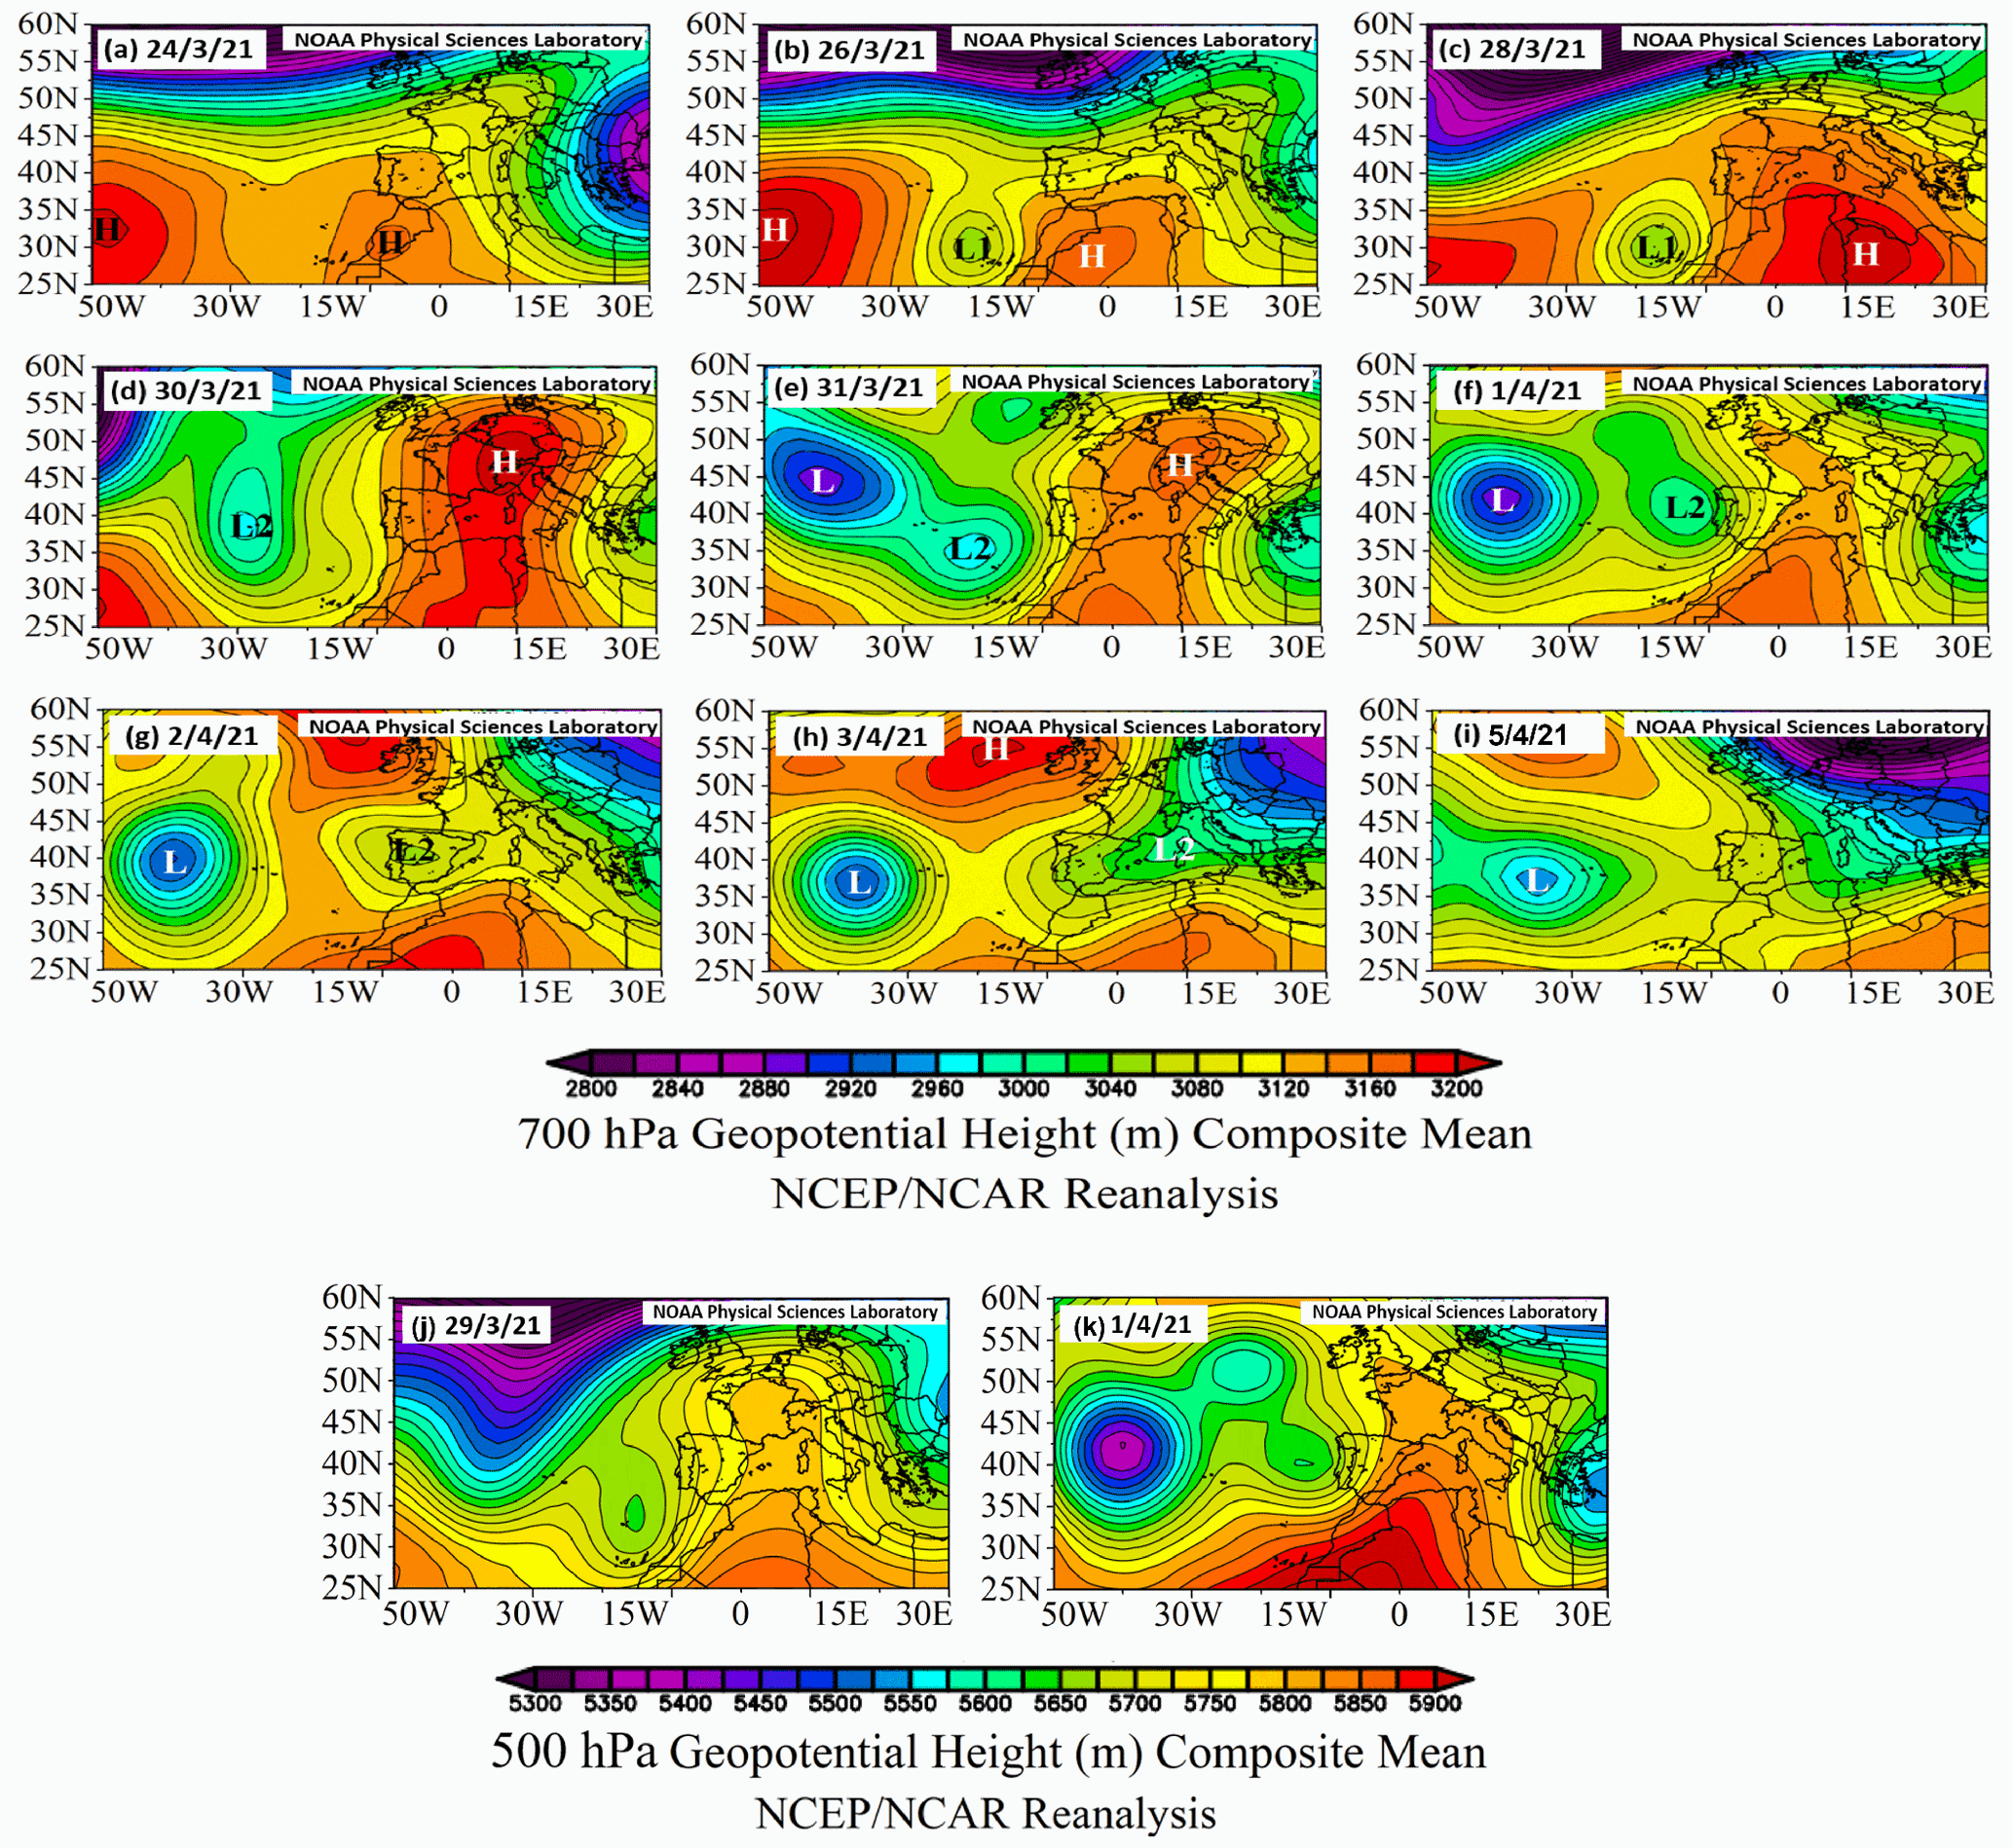
Figure 2(a–i) The 700 hPa geopotential height (in m) composite mean for several significant days of the dust outbreak: 24, 26, 28, 30, and 31 March (a–e) and 1, 2, 3, and 5 April 2021 (f–i). High- and low-pressure systems are indicated by H and L, respectively. (j, k) Geopotential height (in m) composite mean for 29 March and 1 April 2021 at 500 hPa. Images provided by the NOAA/ESRL Physical Sciences Laboratory, Boulder Colorado (http://psl.noaa.gov/, last access: 11 April 2022).
Before the dust intrusion arrival at the IP, the meteorological situation in the region was governed by the North Atlantic Anticyclone (Fig. 2a). From 25 March (Fig. 2b and c), the geopotential height map at 700 hPa shows a low-pressure system (L1) centred over the Canary Islands and leading to a southern/south-eastern (S/SE) circulation weather type (CWT). The highest probability of dust occurrence during the meteorological spring season (March–April–May) was 60 %–80 %, in particular, under the S/SE CWT (Russo et al. 2020). Under this synoptical situation, a southern flow was created, favouring the arrival of air masses from Northern Africa, making the dust advection feasible and carrying dust loads through the IP.
From 30 March (Fig. 2d and e), another low-pressure system (L2) moved down from higher latitudes, and the gradient between the high-pressure and the low-pressure systems intensified (Fig. 2e), favouring also the increase in the wind magnitude and moving toward the west IP from 31 March to 1 April (Fig. 2e and f). This synoptic situation was in agreement with the results of the HYSPLIT model (Fig. S1 in the Supplement), finding a gradually increasing percentage of air masses coming from the Sahara area, with maximum values (75 %–100 %) between 28–31 March. The L2 was accompanied by a closed upper-level low-pressure system (500 hPa, Fig. 2j) isolated from the general atmospheric circulation, which led to convection and instability. On one hand, the convection led to a rise in the air parcel coming from North Africa that could transport dust particles. On the other hand, this atmospheric instability induced vertical movements of the air parcel, rising dust to high heights (see Sect. 3.3), and favouring the formation of high-level thick ice clouds that gradually affected most of the IP from SW to NE, between the afternoon of 31 March and the night of 1 April. These vertical motions can also be related to the presence of the diffluent flow at 250 hPa and its relationship with the low-pressure system whose distribution extended up to this level and from 700 hPa (geopotential field at 250 hPa not shown). This synoptic situation agreed with the findings of Yang et al. (2022). Indeed, the presence of dust in the upper troposphere in the Northern Hemisphere is most prominent in spring due to the unique combination of the different annual cycles of the westerly jet and the presence of dust at 4–6 km a.s.l. For the African source, trough lifting is the leading uplift mechanism associated with a large temperature gradient at mid-latitudes and frequent synoptic cyclones.
On the surface and at elevated levels, L2 kept crossing from the west to the centre of the IP from 1 to 3 April (Fig. 2f and g), favouring the formation of low-level clouds and precipitation, as confirmed by Meteosat satellite images (https://view.eumetsat.int/, last access: 15 April 2022; images not included) and NCEP Climate Forecast System Reanalysis displayed (data not shown). This precipitation could have produced wet scavenging of dust aerosols and, consequently, the removal of these particles from the atmosphere at ARN, GRA, EVO, and TRJ stations (1–3 April). Nevertheless, the cyclonic wind system (L2) could have re-circulated dust particles again to the south IP, since the airflow came from NE IP, which was under dusty conditions. Regarding the HYSPLIT analysis, the percentage of Saharan back-trajectories decreased significantly from 1 to 3 April, down to values of 10 %, at all stations except BCN, coinciding with the conditions explained above. From 3 to 4 April, the incidence slightly increased again, reaching percentages of 25 %–35 %, still leading to dust advection. Finally, on 5 April, L2 had dissipated (Fig. 2i) and a northerly flow was verified over the northeast of the Peninsula at higher levels. Although from that date the number of trajectories from the Saharan source was almost zero, some dust remained suspended in the atmosphere, being still observed on 5 April at BCN and transported by the predominant northerly winds above 500 hPa (see Sect. 4.2).
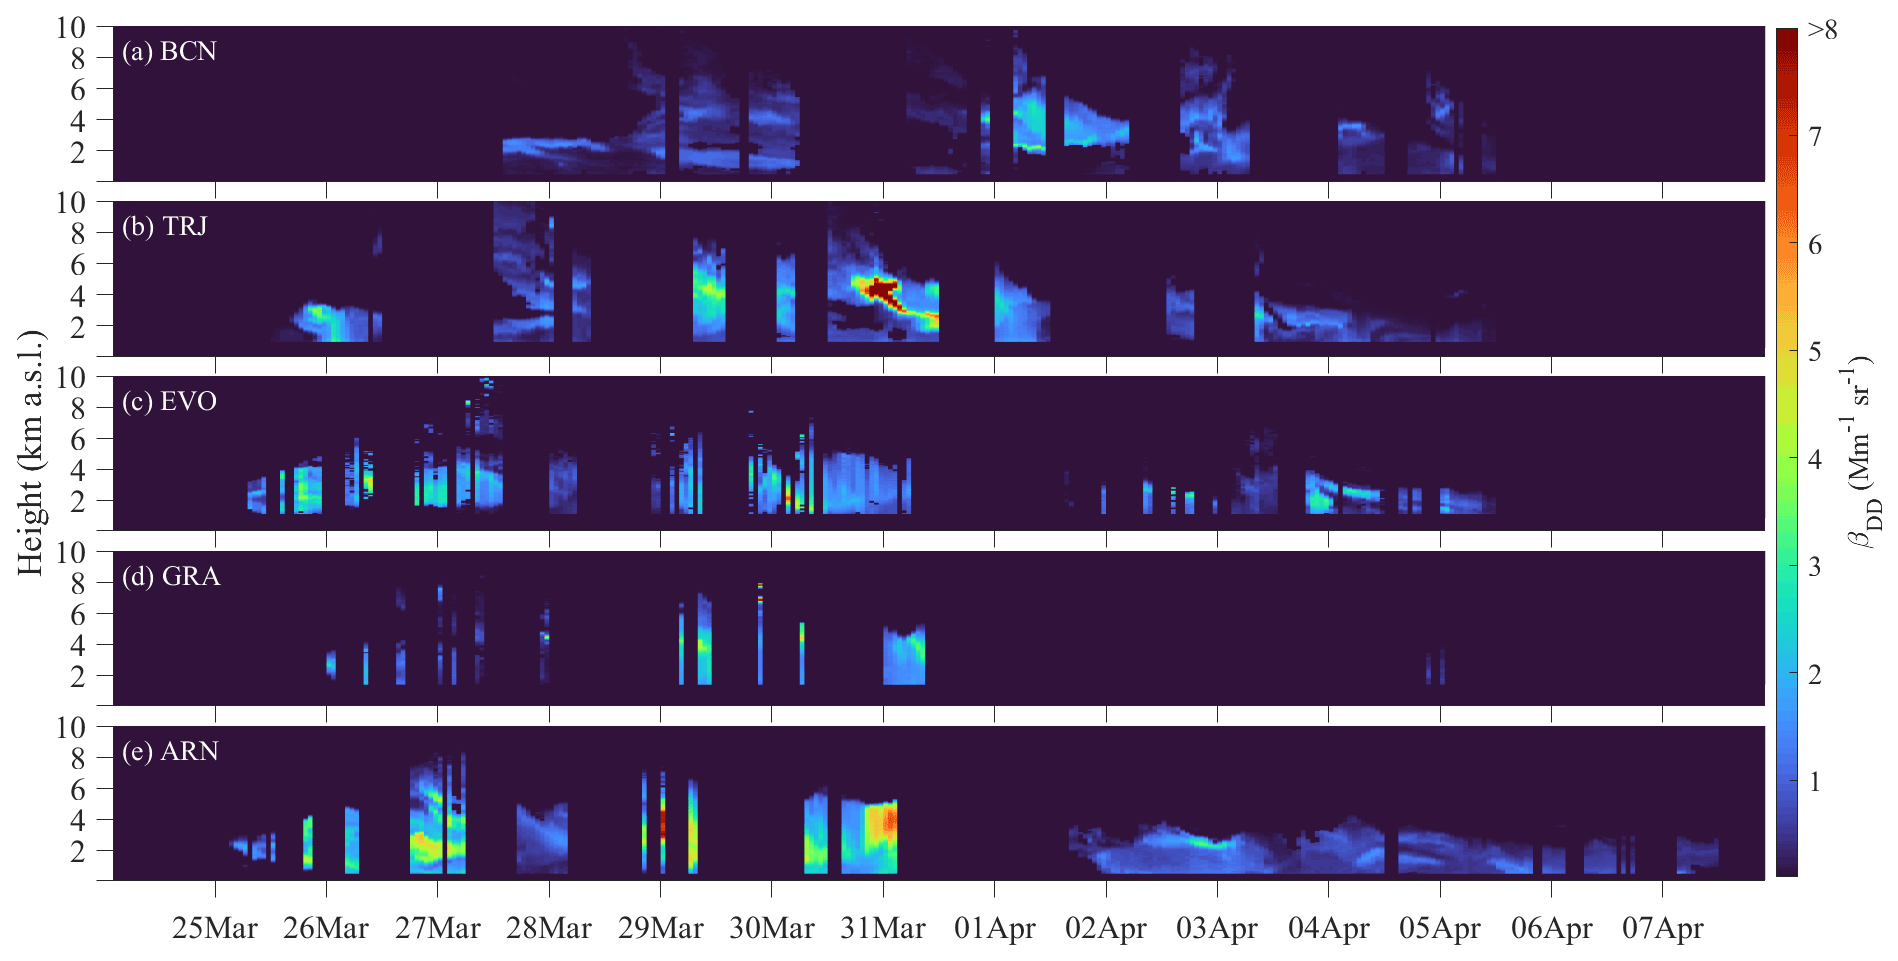
Figure 3Temporal evolution of the total dust backscatter coefficient (βDD, Mm−1 sr−1) at the five Iberian lidar stations (from NE to SW, by decreasing latitude): (a) BCN, (b) TRJ, (c) EVO, (d) GRA, and (e) ARN. Profile gaps correspond to either no possible inversion or no lidar measurements.
By looking at the dust plume behaviour by crossing through the IP, the desert dust plume entered the IP from the SW on 25 March (ARN, EVO), 1 d later reached the SE (GRA) and centre (TRJ), and finally the eastern part of the IP (BCN) on 28 March (Fig. 1, Table 1). Thus, the maximum incidence shifted over time by increasing the latitude of the lidar station, revealing the SW–NE crossing of the dust plumes over the IP (Fig. S1 in the Supplement). Finally, it should be noted that the dust event was profusely cloudy over the five Iberian lidar stations, preventing some lidar retrievals. Hence, several gaps can be found in the inversion dataset, together with the periods with no lidar measurements (see Fig. 3).
4.2 Optical properties
4.2.1 Particle backscatter and depolarization profiling
An overview of the temporal evolution of the dust intrusion crossing the IP in terms of the vertical total dust βDD profiles over the five lidar stations is shown in Fig. 3. Despite either no possible inversion or no lidar measurements, the transport of dust particles can be appreciated by looking the behaviour of the total dust backscatter coefficient by crossing the IP from SW (Fig. 3e) to NE (Fig. 3a) during the overall dusty period (25 March–7 April 2021). In particular, Fig. 4 shows the height-resolved βp and both the βDf and βDc components, together with the δp profiles, at representative times for each lidar station, including the arrival of the dust intrusion (Fig. 4a), the moment of the maximum dust incidence (Fig. 4b), and the final stage of the dusty event (Fig. 4c). Henceforth, the term “a.s.l.” is omitted for simplicity. It should be noted that the height-resolved βDf and βDc components presented a similar vertical structure, indicating that they were well mixed in the dust layers.
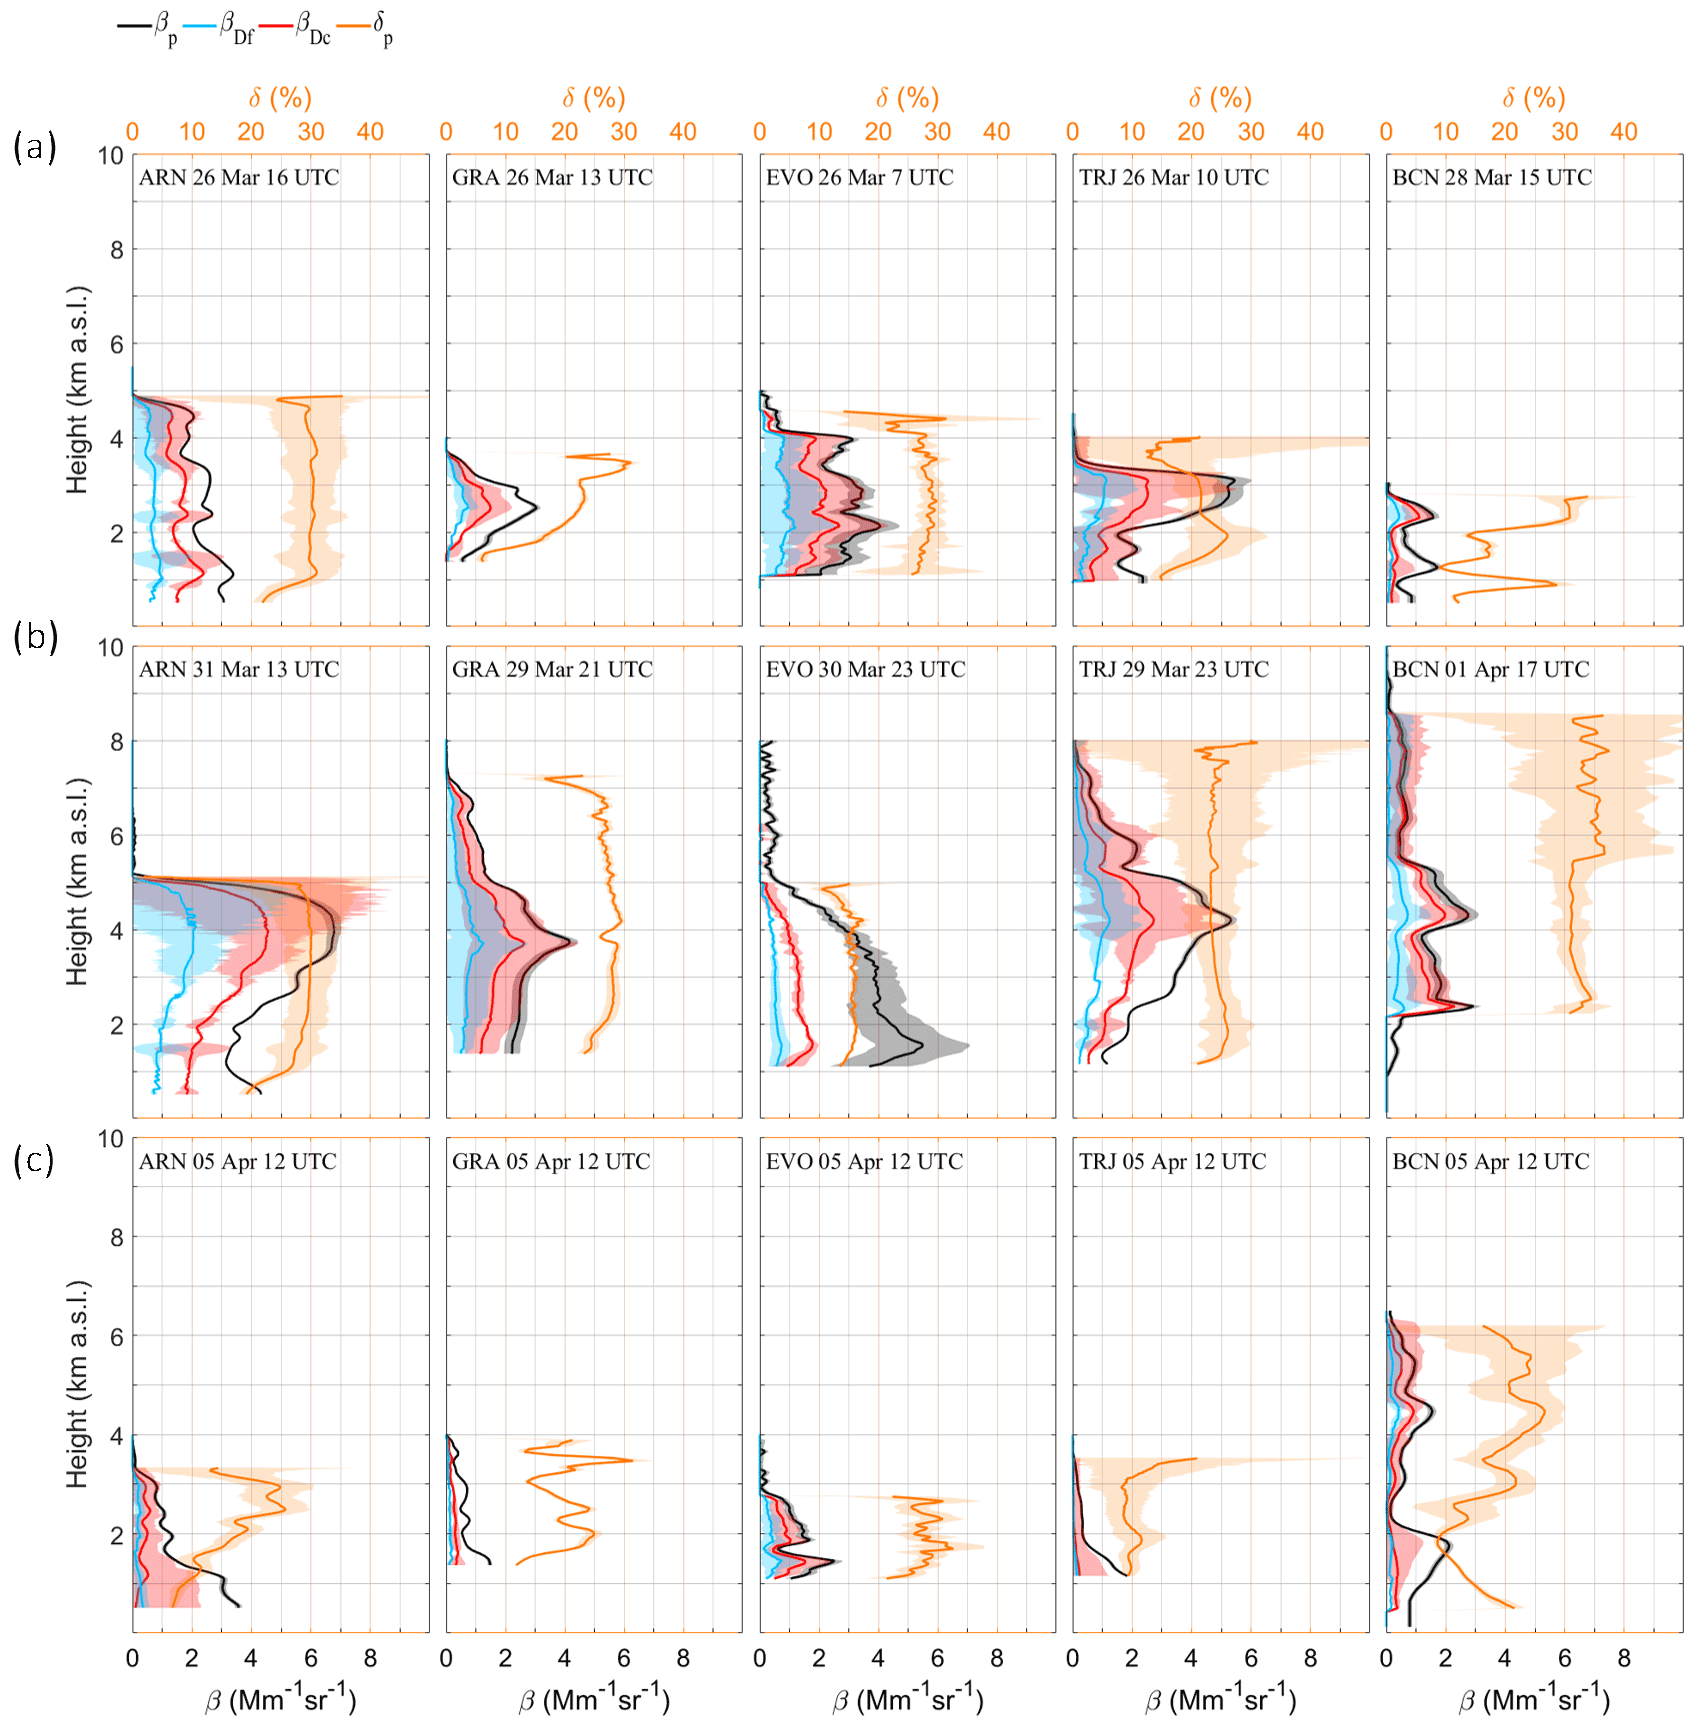
Figure 4Profiles of the optical properties for representative cases (date and time are shown in each panel) illustrating: (a) the arrival of the dust event, (b) the maximum dust incidence, and (c) the final stage of the event, as observed at (from left to right) ARN, GRA, EVO, TRJ, and BCN. The total βp (black) and those separated into dusty components (βDf, blue, and βDc, red), together with δp (orange) and with their errors bands (shaded areas) are shown.
At the southern stations (ARN, GRA, and EVO), the dust plume showed typical δp of dust (0.25–0.30) and followed the same pattern, being detected at low altitudes (below 3 km) at the beginning of the event (25–26 March). On 27 March, due to atmospheric instability (see Sect. 4.1), the dust intrusion ascended, reaching up to 6 km height at the top of the dust plume. Maximum βp values of around 5.0 Mm−1 sr−1 for ARN and EVO, and around 3.0 Mm−1 sr−1 for GRA, were observed (Fig. 4a). On 29–31 March, the greatest incidence of dust intrusion occurred, showing a pronounced dusty structure with a predominance of Dc particles (δp showed slightly higher values around 0.30) and extending from the surface up to around 7 km height. The peak of the βp ranged between similar values at the three southern stations (around 5.0–6.0 Mm−1 sr−1). However, the maximum peak of βDc (ranging between 2.0–6.0 Mm−1 sr−1) at ARN was 1.5 and 2 times greater than at GRA and EVO stations, respectively. The maximum βDf values at ARN (ranging between 0.5–3.0 Mm−1 sr−1) were almost 2 times greater than those observed at the other two southern stations. From 1 April on, the dust plume progressively descended to 3 km height, but also the incidence was weaker, with maximal βp values around 2.5 Mm−1 sr−1 for ARN and EVO and 1.0 Mm−1 sr−1 for GRA, and δp values ranged in 0.15–0.25 (Fig. 4c).
At the central TRJ station, the dust plume was firstly detected below 4 km on 26 March, ascending to 10 km height at the end of the day. On successive days, the top of the dust plume varied between 6–8 km height, reaching 10 km several times. Particularly, the greatest incidence was found on 29–31 March, with δp values of 0.25 on average, and maximum βp, βDc, and βDf values of 2.0–18.0, 1.0–9.0, and 0.5–4.0 Mm−1 sr−1, respectively. The highest βp peaks were found over this station on 31 March (around 09:00–13:00 UTC), with hourly values ranging between 16.0–18.0 Mm−1 sr−1 at 4–5 km height, being 3 times higher than the maximum values found at the southern stations. Similar results were reported in Córdoba-Jabonero et al. (2019) for an extreme dust event occurring at the IP in wintertime, showing peaks around 10.0–15.0 Mm−1 sr−1 over 3 km height. Finally, the dust plume lowered from 8 to 4 km height from 1 April until the end of the dust episode, with lower βp and δp values ranging between 1.0–3.0 Mm−1 sr−1 and 0.15–0.25, respectively.
Finally, the situation at the NE BCN station showed that the vertical dust structure was substantially stratified during the overall dust occurrence and was less intense with respect to that observed at the other lidar stations. The plume reached a maximum altitude of 10 km height several times along its pathway during the episode. On 28 March, the dust plume was found between 2–3 km height, showing βp values ranging between 1.0–1.5 Mm−1 sr−1, which are lower than those found at the other stations. However, δp values (around 0.30–0.35) also indicated a relatively high predominance of Dc particles. One day later, the dusty conditions at BCN were more complex. At the beginning of the day, two layers were found at 2–3 and 9–10 km, with βp values peaked around 0.3 and 0.2 Mm−1 sr−1, and δp between 0.31–0.35 and ∼ 0.25, respectively. At the end of the day, three layers were observed at 1–2, 4–7, and 8–10 km, with βp peak values around 0.9, 0.5 and 0.1 Mm−1 sr−1, and δp around 0.33, 0.28 and 0.25, respectively. During the successive days, the dust plume followed the same behaviour, reaching its maximum incidence on 1 April. Until the end of the dust episode (6 d later), the incidence was decreasing, with βp and δp values ranging between 0.5–2.0 Mm−1 sr−1 and 0.20–0.30, respectively.
One of the most interesting results of this work is the top of the dust plume was detected at very high altitudes (reaching 10 km) over the centre and north-eastern stations. Indeed, the detection of dust in the upper troposphere (above 6 km a.g.l.) is unusual, even though several works studied this phenomenon. Specifically, dust at high altitudes has been found at mid-latitudes by ground-based lidar instrumentation. For instance, a 3-year statistics of Saharan dust intrusions over the central Mediterranean showed the detection of dust particles between 1.8 and 9 km height, with the top of the dust layer ranging between 3.1 to 8.9 km (5.9±1.2 km in average; Mona et al., 2006). Moreover, Papayannis et al. (2008) investigated Saharan dust intrusions over south and south-east Europe for 2 years, finding the top of the dust plume as high as 9–10 km height. Particularly at BCN, an averaged value of the top height of the dust layer of 3.6±1.6 km was found, although ranging between 1.2 and 9 km height.
Results on the δp values obtained for this event in the IP are in agreement with those found in the literature. Particularly, δp showed typical values of dust between 0.25–0.35; those higher values corresponded to the higher incidence times of the dust outbreak at each station, showing a predominance of the Dc particles. For instance, during the SAMUM and SAMUM-2 (Saharan Mineral Dust Experiment) campaigns over Morocco and Cape Verde, the δp for pure dust particles ranged from 0.23 to 0.31 (Freudenthaler et al., 2009; Groß et al., 2011). Focusing on the IP, δp of 0.26–0.28 were obtained at GRA (Soupiona et al., 2019), with values over 0.30 at TRJ (Córdoba-Jabonero et al., 2019). In particular, during an extreme dust event in wintertime, Fernández et al. (2019) reported δp values of 0.26–0.31, 0.15–0.19, and ∼ 0.25 at GRA, EVO, and Madrid (20 km far from TRJ), respectively. Moreover, a study of a mixed event with smoke and dust showed values ranging from 0.24–0.28 in the dust layer at EVO (Salgueiro et al., 2021). Finally, δp values at the BCN station ranged from 0.23–0.31 (Córdoba-Jabonero et al., 2019, 2021a; Fernández et al., 2019).
4.2.2 Dust optical depth
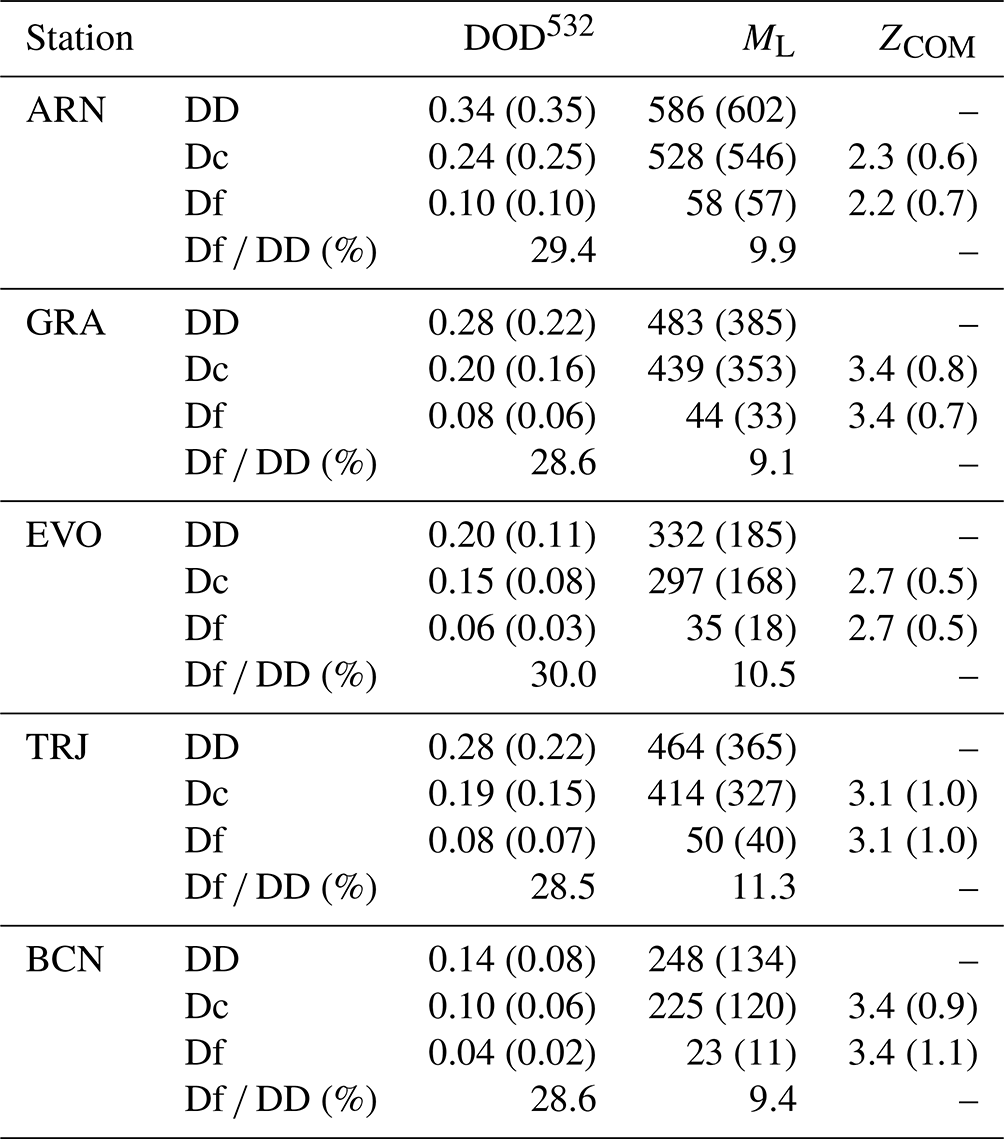
The evolution of dust optical depth at 532 nm (DOD532) in terms of their daily-averaged values ; see Table S1 in the Supplement) and its fine-to-total ratio (Df DD DOD532, in %; it will be denoted as ftr_DOD afterwards) along the dust episode for the five lidar stations is shown in Fig. 5. The ftr_DOD is one of the proxies used in this work to study the ageing of dust. At the southern stations, on 27 March, progressively increased, reaching values of 0.77±0.13, 0.15±0.03, and 0.33±0.05 and decreasing later on 28 March overall, 78 %, 20 %, and 45 %, with respect to previous values at ARN, GRA, and EVO, respectively (see Fig. 5c–e and Table S1 in the Supplement). During the highest incidence (29–31 March), (ftr_DOD) reached rather high (low) values: 1.02±0.26 (25.5 %) at ARN and 0.59±0.04 (28.3 %) at GRA. Moreover, hourly DOD532 values of 1.30 and 0.65 peaked at ARN and GRA, respectively. In the case of EVO station, the intensification of the dust outbreak is, on average, less pronounced, reaching maximum (ftr_DOD) values of 0.36±0.11 (30.6 %) on 30 March, with an hourly DOD532 peak of 0.60. On 1 April, the weather conditions avoided the dust observations over the southern stations, and apparently wet deposition occurred. As a consequence, later on (2–7 April), the dust incidence was significantly weaker, finding maximal values of of 7, 5, and 2 times lower than those observed on 29–31 March at ARN, GRA, and EVO, respectively. For the overall event, averaged (ftr_DOD) were 0.34±0.35 (29.4 %), 0.28±0.22 (28.6 %), and 0.20±0.11 (30.0 %) at ARN, GRA, and EVO, respectively.

Figure 5Temporal evolution of the total dust (DD) optical depth at 532 nm (DOD532) (right axis, in purple), and its fine to total ratio (ftr_DOD %) (left axis, in blue), over the five Iberian lidar stations as latitude decreases (from up to down panels): (a) BCN, (b) TRJ, (c) EVO, (d) GRA, and (e) ARN. Circles indicate hourly averages. Diamonds and squares indicate daily averages for ftr_DOD and DOD532, respectively.
Unfortunately, the meteorological conditions at the central IP prevented lidar measurements at TRJ on 27 March and 2 April. The dust incidence shows the same behaviour as in the southern stations; the (ftr_DOD) progressively increased (Fig. 5b, Table S1 in the Supplement), reaching high values between 29 and 31 March, with maximal values of 0.6±0.03 (28.6 %) on 29 March. By comparing those values with the highest daily DOD532 as found at the southern stations (i.e. on 29 March at ARN and GRA), was 1.5 times lower than that observed at the ARN station, with no significant differences concerning the GRA station or in the ftr_DOD for both stations. Notice that the hourly DOD532 peaked on 31 March (DOD532=0.88) at TRJ. For the entire dust episode, the averaged (ftr_DOD) was 0.28±0.22 (28.5 %).
Finally, the dust situation at the NE of the IP, as observed at the BCN station (Fig. 5a and Table S1 in the Supplement), showed that the greatest incidence was observed on 1 April, when reached 0.27±0.20, being the ftr_DOD 25.9 %. Taking as a reference the highest incidence observed in the southern stations (on 29 March), was almost 4 and 2 times lower than those values found at ARN and GRA, respectively. The averaged (ftr_DOD) for the overall dust event was 0.14±0.08 (28.6 %).
In summary, decreased as latitude increased, with mean values ranging from 0.34±0.35 at ARN to 0.14±0.08 at BCN station, i.e. 40 % lower in the NE with respect to SW of the IP; however, the ftr_DOD did not show significant differences (remained around 29 %) between SW and NE stations (see Table 2). These results indicate the decay of the dust incidence by overcrossing through the IP from SW to NE regions, together with a uniformly well-mixed state of the Dc and Df particles along that pathway.
Table 2Mean values of the dust optical depth at 532 nm (DOD532) and mass loading (ML, in mg m−2) for fine dust (Df), coarse dust (Dc), and total dust (DD), and the Df-to-total dust ratio (Df DD), referring to the DOD532 (ftr_DOD) and ML (ftr_ML) for the whole dust event over the five Iberian lidar stations (ARN, GRA, EVO, TRJ, and BCN). The centre-of-mass height (ZCOM) is also included for both the fine and coarse dust components. The standard deviation values are in brackets.
4.3 Mass-related properties
4.3.1 Mass concentration profiling
Figure 6 shows the mass concentration profiles (mDD in µg m−3) and their fine-to-total (Df DD) ratio (ftr_mDD, %) for particular dusty cases, which correspond to those shown in Fig. 4. They illustrate the beginning of the dust event (Fig. 6a), the moment of the maximum incidence (Fig. 6b), and the final of the event (Fig. 6c) for the five Iberian lidar stations. It is worth highlighting that, from the beginning of the event to the maximum incidence days, the ftr_mDD was nearly similar at all the stations, being almost constant in altitude, with values ∼ 10 %, except for BCN (Fig. 6b) that showed lower values (∼ 5 %) at higher altitudes (6–8 km). At the end of the dust outbreak, the ftr_mDD followed the same decreasing tendency, except at TRJ and BCN where it increased (∼ 15 %) for dust layers below 4 km height.
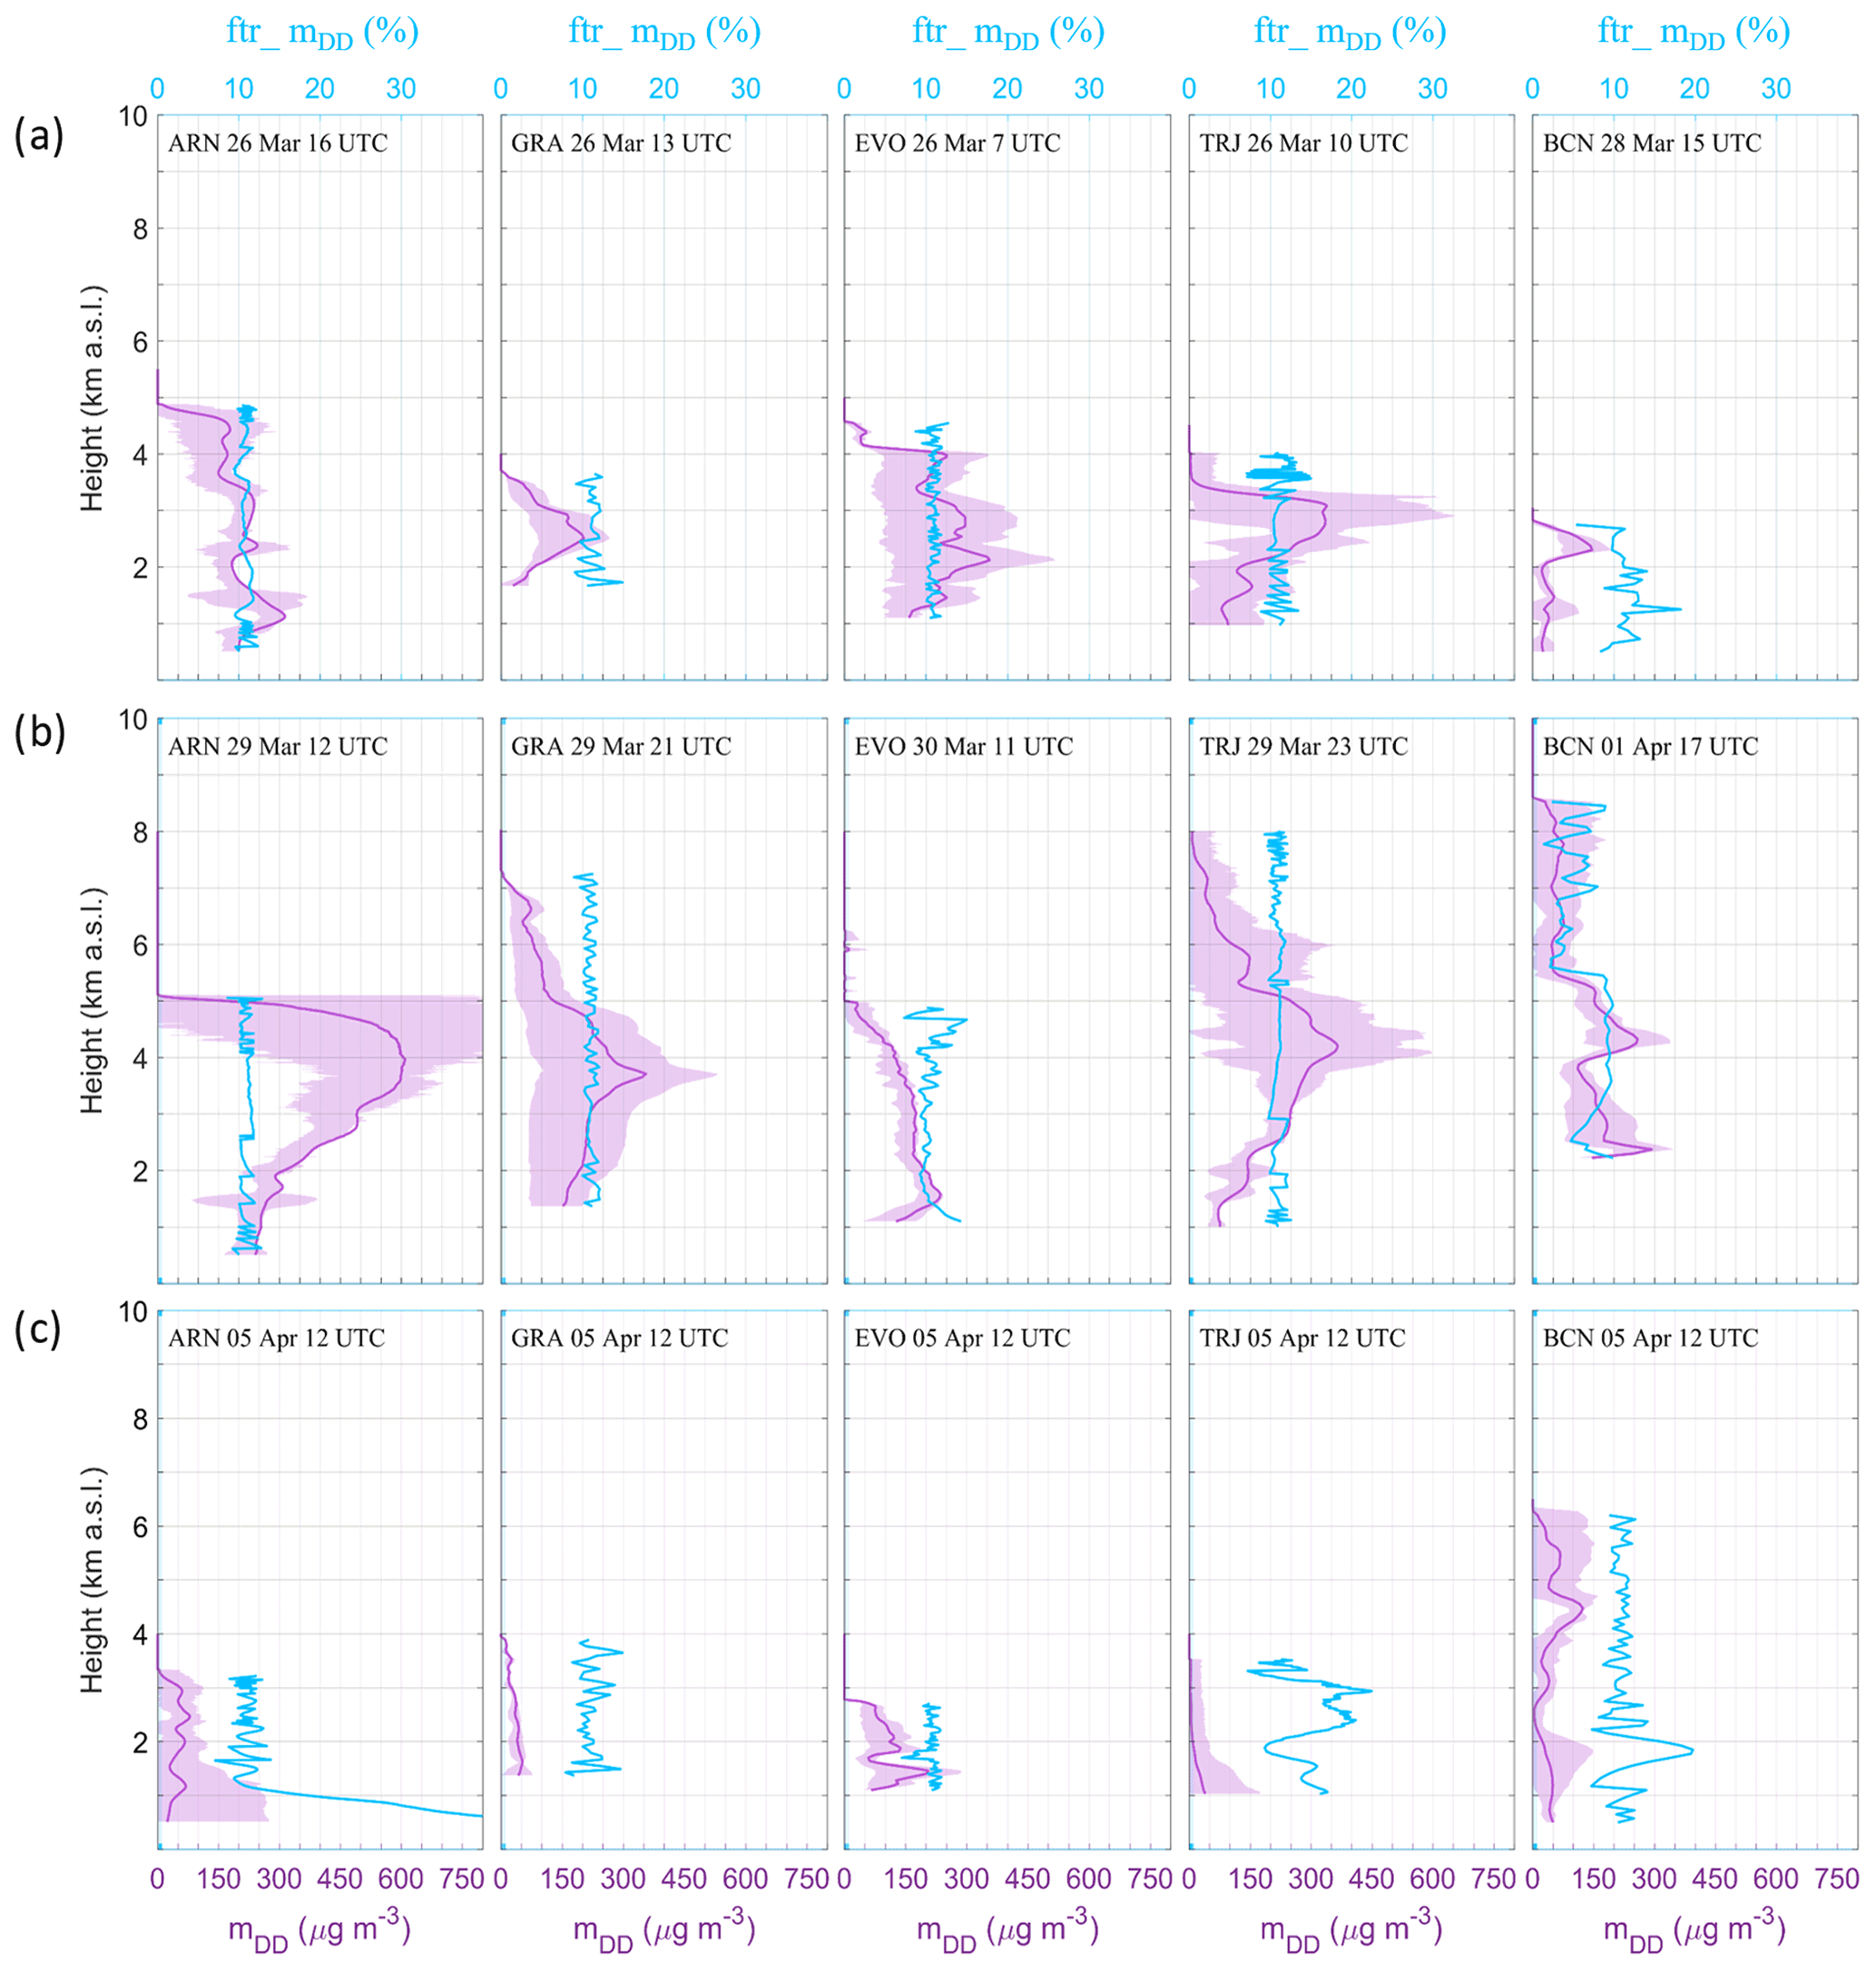
Figure 6Dust mass features profiles for representative cases (date and time are shown in each panel): (a) beginning of the dusty event, (b) maximum incidence, and (c) end of the event, as observed at ARN, GRA, EVO, TRJ, and BCN. The total dust mass concentration, mDD (purple), together with the ftr_mDD (%) (blue). Errors are shown by shaded bands.
As expected, the altitudes where the maximal mDD values were found are coincident with those altitudes where the maximums of βDD were observed (see Sect. 4.2.1). At the beginning of the dust intrusion (25–27 March), the dust signature peaked with mDD values ranging from 50–500, 80–260, and 150–500 µg m−3 at ARN, GRA, and EVO stations, respectively. On 28 March, the mDD decreased approximately down to 60 %–70 %, but on the period of the greatest incidence (29–31 March) increased, reaching maximum peaks of 200–750, 120–500, and 50–500 µg m−3 at ARN, GRA, and EVO. Finally, mDD ranged in 50–300, 50–60, and 30–300 µg m−3 for the successive days over those stations. In short, at the beginning of the episode, the mDD maximums were 50 % smaller at GRA than those obtained at ARN and EVO. However, GRA and EVO showed similar mDD peaks during the greatest incidence period (29–31 March), being around 40 % lower than those found at ARN station. For the second part of the episode (1–7 April), ARN and EVO showed similar mDD values, whereas they were 5 times lower at GRA in comparison.
In the case of TRJ (central IP), mDD peak values ranged from 30–350 µg m−3, progressively increasing up to 1000 µg m−3 on 31 March (09:00–13:00 UTC) and decreasing down to 15–260 µg m−3 from 1 April to the end of the dust outbreak (5 April). That highest value (1000 µg m−3) is 25 % greater than those found at the southern ARN station (750 µg m−3). By comparing with other results as reported at TRJ during an extreme dust event (Córdoba-Jabonero et al., 2019; see Sect. 4.2), similar values are found, ranging from 900 to 1000 µg m−3 (and also similar βDD values).
Finally, at the NE BCN station, the mDD evolution presented a similar pattern. It peaked with around 40–130 µg m−3 on 28–31 March, increasing up to 40–400 µg m−3 on 1 April and decreasing down to 35–300 µg m−3 from 2 to 5 April. The maximum mDD was 45 %, 20 %, 20 %, and 60 % smaller than those values found for the other Iberian stations, i.e. ARN, GRA, EVO, and TRJ, respectively.
To assess the incidence of this dust outbreak, these results can be compared with those derived for dust particles observed in West Europe. Binietoglou et al. (2015) performed an analysis of dust concentration profiles by using systematic observations of dust events at 10 ACTRIS/EARLINET stations. The peak of the mean mDD ranged from 30 to 80 µg m−3, and thus the maximum mDD values for the strongest dust incidence period as observed at the IP stations were 9 (ARN), 6 (GRA, EVO), 13 (TRJ), and 5 (BCN) times higher than the averaged values reported in Binietoglou et al. (2015).
In summary, by focusing on the maximum incidence, dust mass concentrations reached maximal values between 500 and 750 µg m−3 at the southern stations (ARN, GRA, EVO), being relatively higher (1000 µg m−3) at central-TRJ and rather lower (around 200 µg m−3) at the north-east BCN station. In general, ftr_MDD was almost constant in altitude with values around 10 % at all stations, showing a well-mixed state of the Dc and Df particles with height.
4.3.2 Dust mass loading and centre-of-mass height
The evolution of the hourly total dust mass loading (MDD, in g m−2; see Eq. 3) throughout the dusty episode together with their daily-averaged values () is shown in Fig. 7 in addition to the hourly and daily dust fine-to-total mass loading ratio (ftr_MDD, in %). Note that ftr_MDD is a proxy used in this work to study the ageing of dust.
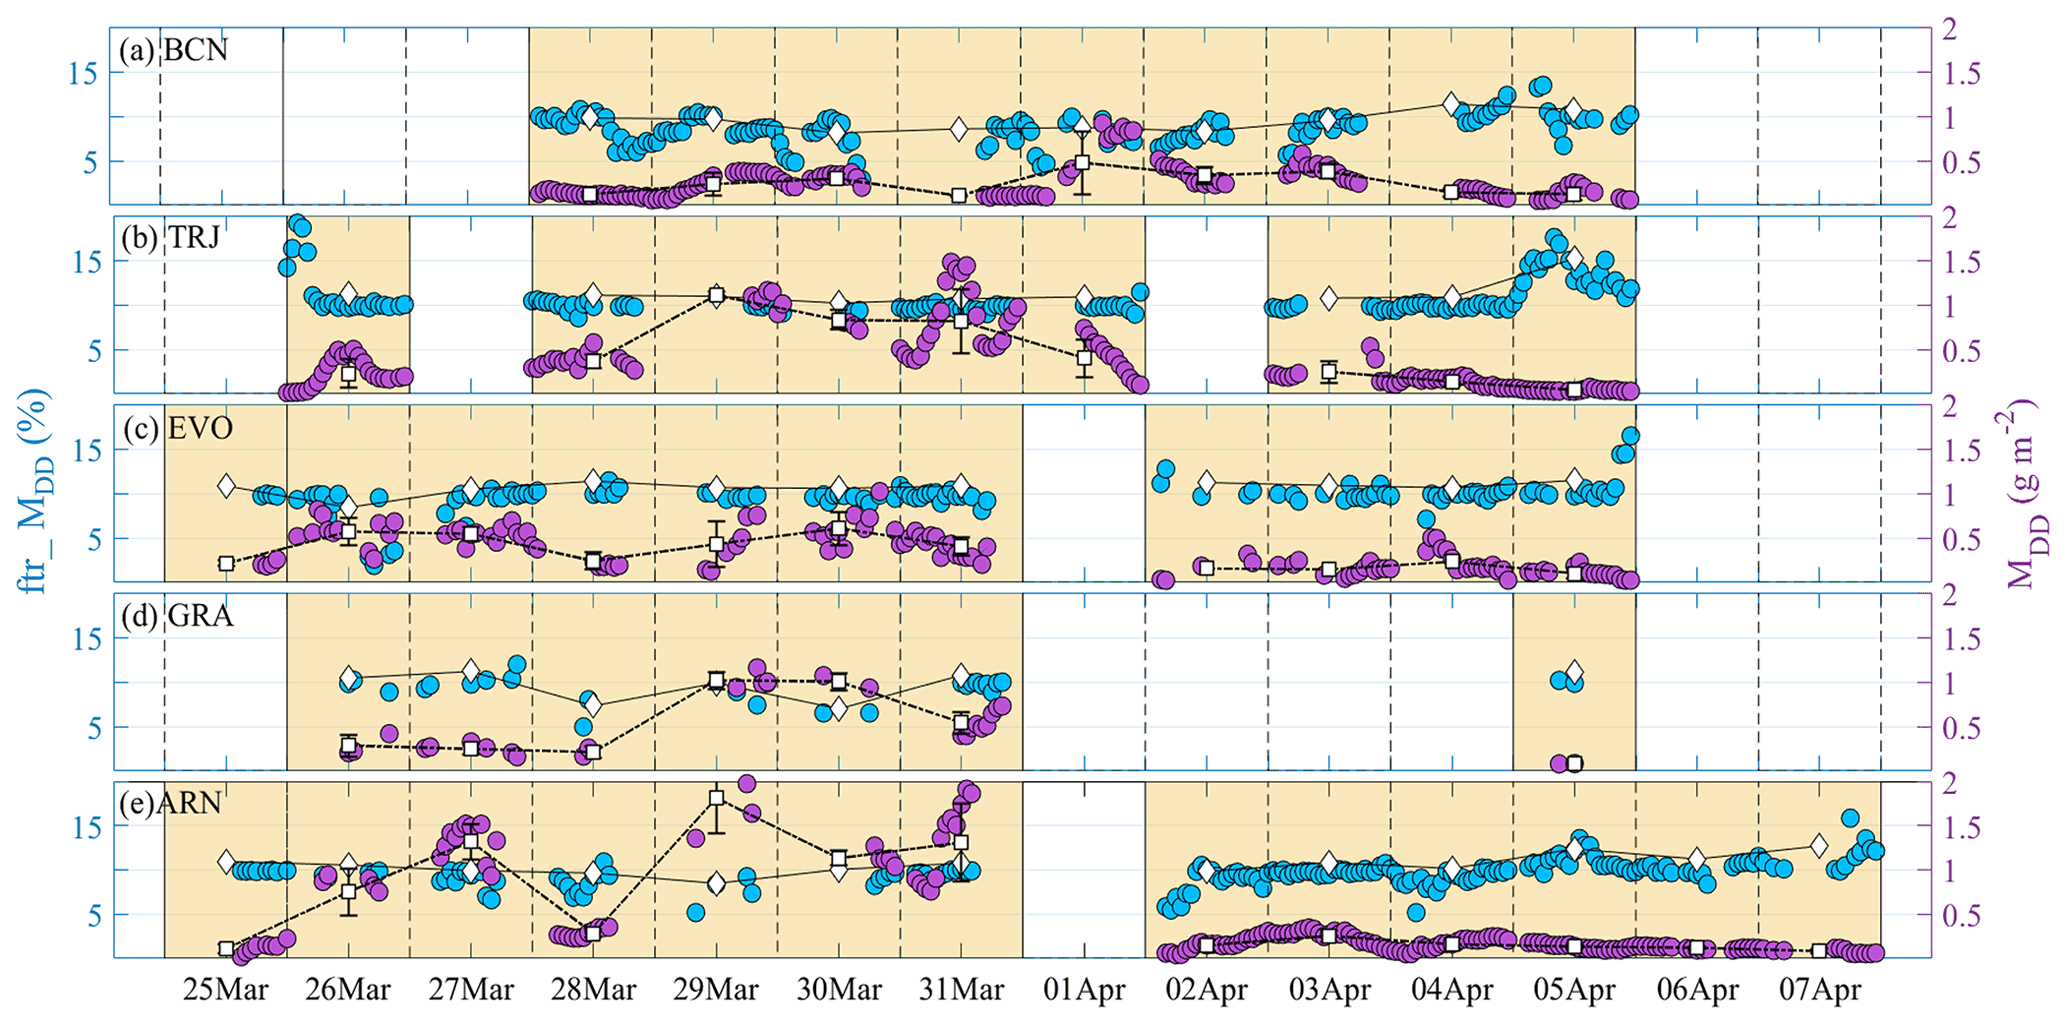
Figure 7The same as Fig. 5, but for the relative mass loading of the Df particles (ftr_MDD, in %) (left axis, in blue) and the total dust mass loading (MDD, in g m−2) (right axis, in purple).
As expected, at the southern stations (ARN, GRA, EVO), (daily ftr_MDD) (Fig. 7c–e and Table S2 in the Supplement) progressively increased (decreased) until reaching maximum (minimum) values on 29–30 March of 1809±396 mg m−2 (8.5 %), 1018±96 mg m−2 (9.8 %) and 605±183 mg m−2 (10.6 %), respectively, and decreased later on. For the second part of the dust event, when the dust incidence was getting weaker, being the maximal 7, 12, and 3 times lower than those found for the first part of the event. Regarding the TRJ station, (daily ftr_MDD) progressively also increased (Fig. 7b and Table S2 in the Supplement), being the maximum values as observed on 29 March of 1104±47 mg m−2 (11.0 %). Finally, the (daily ftr_MDD) at BCN (Fig. 7a and Table S2 in the Supplement) shows its greatest incidence on 1 April, with values of 478±350 mg m−2 (8.7 %). No significant differences were found for the daily ftr_MDD between the stations, with values approximately of 10 %. It should be noted that under the highest dust incidence conditions (29–31 March), the strongest mass loading is found at ARN (the most SW IP station), being 1.8 and 3 times higher than that found at GRA and EVO, respectively. At the central and NE IP stations (TRJ and BCN), the dust event reached its maximum intensity on 29 March and 1 April, respectively, being 1.6 and 3.8 times lower than those values observed at ARN.
The relation between DOD532 and MDD is consistent with other studies. Particularly comparing with Córdoba-Jabonero et al. (2019, 2021a), for low-to-medium DOD532 (<0.30), the MDD values ranged from 82 to 478 mg m−2, which are close to those found in the former work (i.e. from 40 to 640 mg m−2). Moreover, regarding higher DOD532 values (>0.30), MDD values were within 542–1809 mg m−2, also in the same range (570 to 2340 mg m−2).
In summary, for the whole dust event period, the MDD (ftr_MDD) values were, on average, 586±602 mg m−2 (9.9 %) at ARN, 483±385 mg m−2 (9.1 %) at GRA, 332±185 mg m−2 (10.5 %) at EVO, 464±365 mg m−2 (11.3 %) at TRJ, and 248±143 mg m−2 (9.4 %) at BCN (Table 2). Thus, the daily MDD decreased along the dust event as latitude increased, being 75 % lower in BCN with respect to ARN station. However, significant differences were unobserved for the ftr_MDD among stations, likewise found for the ftr_DOD (see Sect. 4.2.2).
Table 3Daily centre-of-mass height (ZCoM, in km a.s.l.) for fine dust (Df) and coarse dust (Dc) particles along the particular dust periods for the five Iberian lidar stations (ARN, GRA, EVO, TRJ, and BCN). The standard deviation values are in brackets.

A measure of the vertical incidence of each dust component can be introduced by the daily-averaged dust CoM height for the fine and coarse components ( and , respectively; their values are shown in Table 3), as obtained along the dust intrusion over the five Iberian lidar stations. It is worth highlighting that both and followed the same pattern, independently on the station, with a relative difference between and of around 5 % (Figs. S2 and S3 in the Supplement). For the sake of simplicity, both the daily-averaged and will be referred to indistinctly as CoM height henceforward in the text.
At the beginning of the dust outbreak, the CoM height was found at low altitudes over each station (∼ 2 km height). On 27 March at the southern stations, the CoM height ascended (∼ 3–4 km), remaining at that altitude until the end of the maximum dust incidence (29–31 March). From 1 April on, the CoM height gradually lowered until the end of the dust outbreak (∼ 1.5–2.5 km, on 5–7 April). At the TRJ station, the CoM height ascended from 2.5 km up since the beginning of the episode, reaching ∼ 5 km height, and progressively descended to ∼ 2 km on 5 April. The CoM height at BCN ascended gradually, until reaching 5 km on 31 March and progressively descending to ∼ 2.5 km height at the end of the dust episode. In summary, the mean CoM height increased with latitude along the overall dust episode, from 2.3 km height at ARN to 3.4 km at BCN, since the dust signature was found at higher altitudes as latitude increased (see Table 2). Maximum daily CoM heights of 3.3, 4.5, 3.2, 4.8, and 5.3 km were found at ARN, GRA, EVO, TRJ, and BCN, respectively. In all stations, a large CoM height variability is found, being higher than 0.5 km at the southern sites (ARN, GRA, EVO) and around 1 km at TRJ and BCN. For comparison with previous studies, the CoM height over central Europe during dust events is observed to vary between 2.3 to 6.6 km (Mona et al., 2006) and from 0.85 to 8 km over south and south-east Europe (Papayannis et al., 2008). For instance, CoM height values of 1–6 and 2–3 km were found at BCN and GRA, respectively (Papayannis et al., 2008; Cazorla et al., 2017).
An intense dust and long-lasting outbreak arrived at the Iberian Peninsula (IP) in spring 2021 (25 March–7 April). It was monitored and analysed by five Iberian lidar stations, strategically positioned to cover mostly the main extension of the IP (ARN, GRA, EVO, TRJ, and BCN). The meteorological conditions determined the particular aerosol scenario. The synoptic situation and back-trajectory analysis revealed that this dust intrusion, which originated in the Saharan region, crossed the Iberian Peninsula from south-west to north-east. This event is especially interesting, not only owing to the intensity of the dust outbreak but also due to the meteorological conditions that could favour the main findings: the detection of dust in upper layers of the troposphere and the absence of dust ageing observed along the IP (as regarded in changes in the contribution and properties of the coarse and fine dust particles), unlike the long-range dust events that reached central Europe. Thus, the IP stations could be considered as a point reference to evaluate ageing processes of Saharan dust outbreaks reaching higher latitudes (as central and northern Europe).
Indeed, in the basis of the results of this work, it can be deduced not only a uniform gravitational settling of both the coarse and fine dust particles that could be produced during their transport across the IP, but also a uniformly well-mixed state of the coarse and fine dust particles along their pathway over the IP. These findings could be related to the atmospheric instability during the dust outbreak, which could disfavour a balanced gravitational settling of the fine dust particles with the coarse dust ones.
Changes in the contribution and properties of the coarse and fine dust particles could be performed thanks to the state-of-the-art two-step POLIPHON algorithm in combination with polarized elastic lidar observations. Indeed, the separation of the optical properties of aerosol mixtures can be relatively well achieved from lidar systems with polarization capabilities as long as the particle components, i.e. both fine and coarse modes, have clearly different specific depolarization ratios.
That kind of study can be very valuable to assess the particular radiative (short- and longwave) effect of both coarse and fine dust particles under intense dusty conditions. This is particularly relevant taking into account the different relative contributions, on average, of the fine dust particles to the total dust found for their optical properties (30 %) with respect to the mass features (10 %) along the overall dust event by crossing the IP. Hence, a comprehensive study focused on the radiative impact of this Saharan dust outbreak will be addressed in the future.
EARLINET lidar files are available from the EARLINET Data Portal (https://data.earlinet.org/, last access: 21 December 2021; Pappalardo et al., 2014). The accessibility of these files is limited based on the EARLINET criteria. For additional lidar data or information, please contact the corresponding author.
The supplement related to this article is available online at: https://doi.org/10.5194/acp-23-143-2023-supplement.
MÁLC, CCJ, and JLGR conceptualized the study, were responsible for the formal analysis, and wrote the original draft of the paper. MÁLC, DBP, MS, and FTC developed the methodology. MÁLC and CVCP applied the software. MÁLC, CCJ, DBP, MS, VS, FM, CVCP, MJGM, AC, FTC, RB, MPZ, JABA, CMP, MJC, BA, ARG, DB, MP, JAG, LAA, and JLGR carried out the investigation and reviewed and edited the paper. MÁLC, CCJ, MJGM, ARG, and DB were responsible for data curation. CCJ, LAA, AC, MJC, and BA were in charge of the resources. CCJ and MPZ were responsible for funding acquisition. CCJ and JLGR supervised the investigation. All authors have read and agreed upon the published version of the paper.
The contact author has declared that none of the authors has any competing interests.
Publisher’s note: Copernicus Publications remains neutral with regard to jurisdictional claims in published maps and institutional affiliations.
This article is part of the special issue “Dust aerosol measurements, modeling and multidisciplinary effects (AMT/ACP inter-journal SI)”. It is not associated with a conference.
The authors are grateful for support from the Spanish Ministry of Science and Innovation (MICIN; grant nos. PID2020-117825GB-C21, PID2020-120015RB-I00, PID2019-104205GB-C21/AEI/10.13039/501100011033, PID2019-103886RB-I00/AEI/10.13039/501100011033, EQC2018-004686-P, CGL2017-90884-REDT, and CGL2017-85344-R), the Madrid Regional Government (grant no. Y2018/EMT-5177), the Andalusian Regional Government (grant nos. P20_00136 and P18-RT-3820), the University of Granada (grant no. A-RNM-430-UGR20, Singular Laboratory programme LS2022-1, Scientific Units of Excellence Program grant no. UCE-PP2017-02), and the EU H2020 programme (grant nos. 654109, 778349, 871115, 101008004, and 101086690). The EVO team is co-funded by Portuguese funds through the Fundação para a Ciência e a Tecnologia (FCT) within the framework of the ICT (grant nos. UIDB/04683/2020 and UIDP/04683/2020) and TOMAQAPA (grant no. PTDC/CTAMET/29678/2017) projects. The ARN team thanks the technical staff of the El Arenosillo site for maintenance support. The BCN team particularly thanks Ellsworth J. Welton for providing the MPL unit in place at the Barcelona site. The authors thankfully acknowledge the FEDER programme for the instrumentation used in this work, which is part of the Laboratorio Singular de Tecnologías Avanzadas Observatorio Global de la Atmósfera (ÁGORA), supported by the University of Granada. Ellsworth J. Welton and Sebastian A. Stewart are warmly acknowledged for their continuous help in keeping the MPL systems up to date. María Ángeles López-Cayuela and Clara Violeta Carvajal-Pérez are supported by the INTA predoctoral contract programme. The authors thank the NOAA/ESRL Physical Science Laboratory for providing synoptic maps. The authors acknowledge the use of imagery from the NASA Worldview application (https://worldview.earthdata.nasa.gov/, last access: 20 June 2021), part of the NASA Earth Observing System Data and Information System (EOSDIS).
This research has been supported by the Spanish Ministry of Science and Innovation (grant no. PID2019-104205GB-C21/AEI/10.13039/501100011033).
This paper was edited by Eduardo Landulfo and reviewed by two anonymous referees.
Abril-Gago, J., Guerrero-Rascado, J. L., Costa, M. J., Bravo-Aranda, J. A., Sicard, M., Bermejo-Pantaleón, D., Bortoli, D., Granados-Muñoz, M. J., Rodríguez-Gómez, A., Muñoz-Porcar, C., Comerón, A., Ortiz-Amezcua, P., Salgueiro, V., Jiménez-Martín, M. M., and Alados-Arboledas, L.: Statistical validation of Aeolus L2A particle backscatter coefficient retrievals over ACTRIS/EARLINET stations on the Iberian Peninsula, Atmos. Chem. Phys., 22, 1425–1451, https://doi.org/10.5194/acp-22-1425-2022, 2022.
Ansmann, A., Mamouri, R.-E., Hofer, J., Baars, H., Althausen, D., and Abdullaev, S. F.: Dust mass, cloud condensation nuclei, and ice-nucleating particle profiling with polarization lidar: updated POLIPHON conversion factors from global AERONET analysis, Atmos. Meas. Tech., 12, 4849–4865, https://doi.org/10.5194/amt-12-4849-2019, 2019.
Baars, H., Kanitz, T., Engelmann, R., Althausen, D., Heese, B., Komppula, M., Preißler, J., Tesche, M., Ansmann, A., Wandinger, U., Lim, J.-H., Ahn, J. Y., Stachlewska, I. S., Amiridis, V., Marinou, E., Seifert, P., Hofer, J., Skupin, A., Schneider, F., Bohlmann, S., Foth, A., Bley, S., Pfüller, A., Giannakaki, E., Lihavainen, H., Viisanen, Y., Hooda, R. K., Pereira, S. N., Bortoli, D., Wagner, F., Mattis, I., Janicka, L., Markowicz, K. M., Achtert, P., Artaxo, P., Pauliquevis, T., Souza, R. A. F., Sharma, V. P., van Zyl, P. G., Beukes, J. P., Sun, J., Rohwer, E. G., Deng, R., Mamouri, R.-E., and Zamorano, F.: An overview of the first decade of PollyNET: an emerging network of automated Raman-polarization lidars for continuous aerosol profiling, Atmos. Chem. Phys., 16, 5111–5137, https://doi.org/10.5194/acp-16-5111-2016, 2016.
Binietoglou, I., Basart, S., Alados-Arboledas, L., Amiridis, V., Argyrouli, A., Baars, H., Baldasano, J. M., Balis, D., Belegante, L., Bravo-Aranda, J. A., Burlizzi, P., Carrasco, V., Chaikovsky, A., Comerón, A., D'Amico, G., Filioglou, M., Granados-Muñoz, M. J., Guerrero-Rascado, J. L., Ilic, L., Kokkalis, P., Maurizi, A., Mona, L., Monti, F., Muñoz-Porcar, C., Nicolae, D., Papayannis, A., Pappalardo, G., Pejanovic, G., Pereira, S. N., Perrone, M. R., Pietruczuk, A., Posyniak, M., Rocadenbosch, F., Rodríguez-Gómez, A., Sicard, M., Siomos, N., Szkop, A., Terradellas, E., Tsekeri, A., Vukovic, A., Wandinger, U., and Wagner, J.: A methodology for investigating dust model performance using synergistic EARLINET/AERONET dust concentration retrievals, Atmos. Meas. Tech., 8, 3577–3600, https://doi.org/10.5194/amt-8-3577-2015, 2015.
Cabello, M., Orza, J. a. G., Barrero, M. A., Gordo, E., Berasaluce, A., Cantón, L., Dueñas, C., Fernández, M. C., and Pérez, M.: Spatial and temporal variation of the impact of an extreme Saharan dust event, J. Geophys. Res.-Atmos., 117, D11204, https://doi.org/10.1029/2012JD017513, 2012.
Campbell, J. R., Hlavka, D. L., Welton, E. J., Flynn, C. J., Turner, D. D., Spinhirne, J. D., Scott, V. S., and Hwang, I. H.: Full-Time, Eye-Safe Cloud and Aerosol Lidar Observation at Atmospheric Radiation Measurement Program Sites: Instruments and Data Processing, J. Atmos. Oceanic Technol., 19, 431–442, https://doi.org/10.1175/1520-0426(2002)019<0431:FTESCA>2.0.CO;2, 2002.
Cazorla, A., Casquero-Vera, J. A., Román, R., Guerrero-Rascado, J. L., Toledano, C., Cachorro, V. E., Orza, J. A. G., Cancillo, M. L., Serrano, A., Titos, G., Pandolfi, M., Alastuey, A., Hanrieder, N., and Alados-Arboledas, L.: Near-real-time processing of a ceilometer network assisted with sun-photometer data: monitoring a dust outbreak over the Iberian Peninsula, Atmos. Chem. Phys., 17, 11861–11876, https://doi.org/10.5194/acp-17-11861-2017, 2017.
Comerón, A., Muñoz-Porcar, C., Rocadenbosch, F., Rodríguez-Gómez, A., and Sicard, M.: Current Research in Lidar Technology Used for the Remote Sensing of Atmospheric Aerosols, Sensors, 17, 1450, https://doi.org/10.3390/s17061450, 2017.
Córdoba-Jabonero, C., Sorribas, M., Guerrero-Rascado, J. L., Adame, J. A., Hernández, Y., Lyamani, H., Cachorro, V., Gil, M., Alados-Arboledas, L., Cuevas, E., and de la Morena, B.: Synergetic monitoring of Saharan dust plumes and potential impact on surface: a case study of dust transport from Canary Islands to Iberian Peninsula, Atmos. Chem. Phys., 11, 3067–3091, https://doi.org/10.5194/acp-11-3067-2011, 2011.
Córdoba-Jabonero, C., Sicard, M., Ansmann, A., del Águila, A., and Baars, H.: Separation of the optical and mass features of particle components in different aerosol mixtures by using POLIPHON retrievals in synergy with continuous polarized Micro-Pulse Lidar (P-MPL) measurements, Atmos. Meas. Tech., 11, 4775–4795, https://doi.org/10.5194/amt-11-4775-2018, 2018.
Córdoba-Jabonero, C., Sicard, M., del Águila, A., Jiménez, M., and Zorzano, M.-P.: Performance of a dust model to predict the vertical mass concentration of an extreme Saharan dust event in the Iberian Peninsula: Comparison with continuous, elastic, polarization-sensitive lidars, Atmos. Environ., 214, 116828, https://doi.org/10.1016/j.atmosenv.2019.116828, 2019.
Córdoba-Jabonero, C., Sicard, M., López-Cayuela, M.-Á., Ansmann, A., Comerón, A., Zorzano, M.-P., Rodríguez-Gómez, A., and Muñoz-Porcar, C.: Aerosol radiative impact during the summer 2019 heatwave produced partly by an inter-continental Saharan dust outbreak – Part 1: Short-wave dust direct radiative effect, Atmos. Chem. Phys., 21, 6455–6479, https://doi.org/10.5194/acp-21-6455-2021, 2021a.
Córdoba-Jabonero, C., Ansmann, A., Jiménez, C., Baars, H., López-Cayuela, M.-Á., and Engelmann, R.: Experimental assessment of a micro-pulse lidar system in comparison with reference lidar measurements for aerosol optical properties retrieval, Atmos. Meas. Tech., 14, 5225–5239, https://doi.org/10.5194/amt-14-5225-2021, 2021b.
Couto, F. T., Cardoso, E. H. C., Costa, M. J., Salgado, R., Guerrero-Rascado, J. L., and Salgueiro, V.: How a mesoscale cyclonic vortex over Sahara leads to a dust outbreak in South-western Iberia, Atmos. Res., 249, 105302, https://doi.org/10.1016/j.atmosres.2020.105302, 2021.
D'Amico, G., Amodeo, A., Mattis, I., Freudenthaler, V., and Pappalardo, G.: EARLINET Single Calculus Chain – technical – Part 1: Pre-processing of raw lidar data, Atmos. Meas. Tech., 9, 491–507, https://doi.org/10.5194/amt-9-491-2016, 2016.
Díaz, J., Linares, C., Carmona, R., Russo, A., Ortiz, C., Salvador, P., and Trigo, R. M.: Saharan dust intrusions in Spain: Health impacts and associated synoptic conditions, Environ. Res., 156, 455–467, https://doi.org/10.1016/j.envres.2017.03.047, 2017.
Di Girolamo, P., Summa, D., Bhawar, R., Di Iorio, T., Cacciani, M., Veselovskii, I., Dubovik, O., and Kolgotin, A.: Raman lidar observations of a Saharan dust outbreak event: Characterization of the dust optical properties and determination of particle size and microphysical parameters, Atmos. Environ., 50, 66–78, https://doi.org/10.1016/j.atmosenv.2011.12.061, 2012.
Engelmann, R., Kanitz, T., Baars, H., Heese, B., Althausen, D., Skupin, A., Wandinger, U., Komppula, M., Stachlewska, I. S., Amiridis, V., Marinou, E., Mattis, I., Linné, H., and Ansmann, A.: The automated multiwavelength Raman polarization and water-vapor lidar PollyXT: the neXT generation, Atmos. Meas. Tech., 9, 1767–1784, https://doi.org/10.5194/amt-9-1767-2016, 2016.
Euphrasie-Clotilde, L., Plocoste, T., and Brute, F.-N.: Particle Size Analysis of African Dust Haze over the Last 20 Years: A Focus on the Extreme Event of June 2020, Atmosphere, 12, 502, https://doi.org/10.3390/atmos12040502, 2021.
Fernald, F. G.: Analysis of atmospheric lidar observations: some comments, Appl. Opt., 23, 652, https://doi.org/10.1364/AO.23.000652, 1984.
Fernández, A. J., Sicard, M., Costa, M. J., Guerrero-Rascado, J. L., Gómez-Amo, J. L., Molero, F., Barragán, R., Basart, S., Bortoli, D., Bedoya-Velásquez, A. E., Utrillas, M. P., Salvador, P., Granados-Muñoz, M. J., Potes, M., Ortiz-Amezcua, P., Martínez-Lozano, J. A., Artíñano, B., Muñoz-Porcar, C., Salgado, R., Román, R., Rocadenbosch, F., Salgueiro, V., Benavent-Oltra, J. A., Rodríguez-Gómez, A., Alados-Arboledas, L., Comerón, A., and Pujadas, M.: Extreme, wintertime Saharan dust intrusion in the Iberian Peninsula: Lidar monitoring and evaluation of dust forecast models during the February 2017 event, Atmos. Res., 228, 223–241, https://doi.org/10.1016/j.atmosres.2019.06.007, 2019.
Flynn, C. J., Mendoza, A., Zheng, Y., and Mathur, S.: Novel polarization-sensitive micropulse lidar measurement technique, Opt. Express, 15, 2785–2790, https://doi.org/10.1364/OE.15.002785, 2007.
Freudenthaler, V., Esselborn, M., Wiegner, M., Heese, B., Tesche, M., Ansmann, A., Müller, D., Althausen, D., Wirth, M., Fix, A., Ehret, G., Knippertz, P., Toledano, C., Gasteiger, J., Garhammer, M., and Seefeldner, M.: Depolarization ratio profiling at several wavelengths in pure Saharan dust during SAMUM 2006, Tellus B, 61, 165–179, https://doi.org/10.1111/j.1600-0889.2008.00396.x, 2009.
Granados-Muñoz, M. J., Navas-Guzmán, F., Guerrero-Rascado, J. L., Bravo-Aranda, J. A., Binietoglou, I., Pereira, S. N., Basart, S., Baldasano, J. M., Belegante, L., Chaikovsky, A., Comerón, A., D'Amico, G., Dubovik, O., Ilic, L., Kokkalis, P., Muñoz-Porcar, C., Nickovic, S., Nicolae, D., Olmo, F. J., Papayannis, A., Pappalardo, G., Rodríguez, A., Schepanski, K., Sicard, M., Vukovic, A., Wandinger, U., Dulac, F., and Alados-Arboledas, L.: Profiling of aerosol microphysical properties at several EARLINET/AERONET sites during the July 2012 ChArMEx/EMEP campaign, Atmos. Chem. Phys., 16, 7043–7066, https://doi.org/10.5194/acp-16-7043-2016, 2016.
Groß, S., Tesche, M., Freudenthaler, V., Toledano, C., Wiegner, M., Ansmann, A., Althausen, D., and Seefeldner, M.: Characterization of Saharan dust, marine aerosols and mixtures of biomass-burning aerosols and dust by means of multi-wavelength depolarization and Raman lidar measurements during SAMUM 2, Tellus B, 63, 706–724, https://doi.org/10.1111/j.1600-0889.2011.00556.x, 2011.
Guerrero-Rascado, J. L., Ruiz, B., and Alados-Arboledas, L.: Multi-spectral Lidar characterization of the vertical structure of Saharan dust aerosol over southern Spain, Atmos. Environ., 42, 2668–2681, https://doi.org/10.1016/j.atmosenv.2007.12.062, 2008.
Guerrero-Rascado, J. L., Olmo, F. J., Avilés-Rodríguez, I., Navas-Guzmán, F., Pérez-Ramírez, D., Lyamani, H., and Alados Arboledas, L.: Extreme Saharan dust event over the southern Iberian Peninsula in september 2007: active and passive remote sensing from surface and satellite, Atmos. Chem. Phys., 9, 8453–8469, https://doi.org/10.5194/acp-9-8453-2009, 2009.
Hashizume, M., Kim, Y., Ng, C. F. S., Chung, Y., Madaniyazi, L., Bell, M. L., Guo, Y. L., Kan, H., Honda, Y., Yi, S.-M., Kim, H., and Nishiwaki, Y.: Health Effects of Asian Dust: A Systematic Review and Meta-Analysis, Environ. Health Perspect., 128, 066001, https://doi.org/10.1289/EHP5312, 2020.
Ho, H. C., Wong, M. S., Yang, L., Chan, T.-C., and Bilal, M.: Influences of socioeconomic vulnerability and intra-urban air pollution exposure on short-term mortality during extreme dust events, Environ. Pollut., 235, 155–162, https://doi.org/10.1016/j.envpol.2017.12.047, 2018.
Huneeus, N., Schulz, M., Balkanski, Y., Griesfeller, J., Prospero, J., Kinne, S., Bauer, S., Boucher, O., Chin, M., Dentener, F., Diehl, T., Easter, R., Fillmore, D., Ghan, S., Ginoux, P., Grini, A., Horowitz, L., Koch, D., Krol, M. C., Landing, W., Liu, X., Mahowald, N., Miller, R., Morcrette, J.-J., Myhre, G., Penner, J., Perlwitz, J., Stier, P., Takemura, T., and Zender, C. S.: Global dust model intercomparison in AeroCom phase I, Atmos. Chem. Phys., 11, 7781–7816, https://doi.org/10.5194/acp-11-7781-2011, 2011.
Klett, J. D.: Lidar inversion with variable backscatter/extinction ratios, Appl. Opt., 24, 1638–1643, https://doi.org/10.1364/AO.24.001638, 1985.
Kokkalis, P., Soupiona, O., Papanikolaou, C.-A., Foskinis, R., Mylonaki, M., Solomos, S., Vratolis, S., Vasilatou, V., Kralli, E., Anagnou, D., and Papayannis, A.: Radiative Effect and Mixing Processes of a Long-Lasting Dust Event over Athens, Greece, during the COVID-19 Period, Atmosphere, 12, 318, https://doi.org/10.3390/atmos12030318, 2021.
López-Cayuela, M.-Á., Herreras-Giralda, M., Córdoba-Jabonero, C., Lopatin, A., Dubovik, O., and Guerrero-Rascado, J. L.: Vertical assessment of the mineral dust optical and microphysical properties as retrieved from the synergy between polarized micro-pulse lidar and sun/sky photometer observations using GRASP code, Atmos. Res., 264, 105818, https://doi.org/10.1016/j.atmosres.2021.105818, 2021.
Mallet, M., Dulac, F., Formenti, P., Nabat, P., Sciare, J., Roberts, G., Pelon, J., Ancellet, G., Tanré, D., Parol, F., Denjean, C., Brogniez, G., di Sarra, A., Alados-Arboledas, L., Arndt, J., Auriol, F., Blarel, L., Bourrianne, T., Chazette, P., Chevaillier, S., Claeys, M., D'Anna, B., Derimian, Y., Desboeufs, K., Di Iorio, T., Doussin, J.-F., Durand, P., Féron, A., Freney, E., Gaimoz, C., Goloub, P., Gómez-Amo, J. L., Granados-Muñoz, M. J., Grand, N., Hamonou, E., Jankowiak, I., Jeannot, M., Léon, J.-F., Maillé, M., Mailler, S., Meloni, D., Menut, L., Momboisse, G., Nicolas, J., Podvin, T., Pont, V., Rea, G., Renard, J.-B., Roblou, L., Schepanski, K., Schwarzenboeck, A., Sellegri, K., Sicard, M., Solmon, F., Somot, S., Torres, B., Totems, J., Triquet, S., Verdier, N., Verwaerde, C., Waquet, F., Wenger, J., and Zapf, P.: Overview of the Chemistry-Aerosol Mediterranean Experiment/Aerosol Direct Radiative Forcing on the Mediterranean Climate (ChArMEx/ADRIMED) summer 2013 campaign, Atmos. Chem. Phys., 16, 455–504, https://doi.org/10.5194/acp-16-455-2016, 2016.
Mamouri, R. E. and Ansmann, A.: Fine and coarse dust separation with polarization lidar, Atmos. Meas. Tech., 7, 3717–3735, https://doi.org/10.5194/amt-7-3717-2014, 2014.
Mamouri, R.-E., Ansmann, A., Nisantzi, A., Solomos, S., Kallos, G., and Hadjimitsis, D. G.: Extreme dust storm over the eastern Mediterranean in September 2015: satellite, lidar, and surface observations in the Cyprus region, Atmos. Chem. Phys., 16, 13711–13724, https://doi.org/10.5194/acp-16-13711-2016, 2016.
Mamouri, R.-E. and Ansmann, A.: Potential of polarization/Raman lidar to separate fine dust, coarse dust, maritime, and anthropogenic aerosol profiles, Atmos. Meas. Tech., 10, 3403–3427, https://doi.org/10.5194/amt-10-3403-2017, 2017.
Mandija, F., Sicard, M., Comerón, A., Alados Arboledas, L., Guerrero-Rascado, J. L., Barragán, R., Bravo-Aranda, J. A., Granados-Muñoz, M. J., Lyamani, H., Muñoz-Pocar, C., Rocadenbosch, F., Rodríguez, A., Valenzuela, A., and García Vizcaíno, D.: Origin and pathways of the mineral dust transport to two Spanish EARLINET sites: Effect on the observed columnar and range-resolved dust optical properties, Atmos. Res., 187, 69–83, https://doi.org/10.1016/j.atmosres.2016.12.002, 2017.
Marinou, E., Amiridis, V., Binietoglou, I., Tsikerdekis, A., Solomos, S., Proestakis, E., Konsta, D., Papagiannopoulos, N., Tsekeri, A., Vlastou, G., Zanis, P., Balis, D., Wandinger, U., and Ansmann, A.: Three-dimensional evolution of Saharan dust transport towards Europe based on a 9-year EARLINET-optimized CALIPSO dataset, Atmos. Chem. Phys., 17, 5893–5919, https://doi.org/10.5194/acp-17-5893-2017, 2017.
Mattis, I., D'Amico, G., Baars, H., Amodeo, A., Madonna, F., and Iarlori, M.: EARLINET Single Calculus Chain – technical – Part 2: Calculation of optical products, Atmos. Meas. Tech., 9, 3009–3029, https://doi.org/10.5194/amt-9-3009-2016, 2016.
Middleton, N. J.: Desert dust hazards: A global review, Aeolian Res., 24, 53–63, https://doi.org/10.1016/j.aeolia.2016.12.001, 2017.
Mona, L., Amodeo, A., Pandolfi, M., and Pappalardo, G.: Saharan dust intrusions in the Mediterranean area: Three years of Raman lidar measurements, J. Geophys. Res.-Atmos., 111, D16203, https://doi.org/10.1029/2005JD006569, 2006.
Myhre, G., Shindell, D., Bréon, F.-M., Collins, W., Fuglestvedt, J., Huang, J., Koch, D., Lamarque, J.-F., Lee, D., Mendoza, B., Nakajima, T., Robock, A., Stephens, G., Takemura, T., and Zhang, H.: Anthropogenic and natural radiative forcing, in: Climate Change 2013: The Physical Science Basis. Contribution of Working Group I to the Fifth Assessment Report of the Intergovernmental Panel on Climate Change, edited by: Stocker, T. F., Qin, D., Plattner, G.-K., Tignor, M., Allen, S. K., Boschung, J., Nauels, A., Xia, Y., Bex, V., and Midgley, P. M., Cambridge University Press, Cambridge, NY, USA, ISBN 978-1-107-66182-0, 2013.
Obregón, M. A., Pereira, S., Salgueiro, V., Costa, M. J., Silva, A. M., Serrano, A., and Bortoli, D.: Aerosol radiative effects during two desert dust events in August 2012 over the southwestern Iberian Peninsula, Atmos. Res., 153, 404–415, https://doi.org/10.1016/j.atmosres.2014.10.007, 2015.
Papagiannopoulos, N., D'Amico, G., Gialitaki, A., Ajtai, N., Alados-Arboledas, L., Amodeo, A., Amiridis, V., Baars, H., Balis, D., Binietoglou, I., Comerón, A., Dionisi, D., Falconieri, A., Fréville, P., Kampouri, A., Mattis, I., Mijić, Z., Molero, F., Papayannis, A., Pappalardo, G., Rodríguez-Gómez, A., Solomos, S., and Mona, L.: An EARLINET early warning system for atmospheric aerosol aviation hazards, Atmos. Chem. Phys., 20, 10775–10789, https://doi.org/10.5194/acp-20-10775-2020, 2020.
Pappalardo, G., Amodeo, A., Apituley, A., Comeron, A., Freudenthaler, V., Linné, H., Ansmann, A., Bösenberg, J., D'Amico, G., Mattis, I., Mona, L., Wandinger, U., Amiridis, V., Alados-Arboledas, L., Nicolae, D., and Wiegner, M.: EARLINET: towards an advanced sustainable European aerosol lidar network, Atmos. Meas. Tech., 7, 2389–2409, https://doi.org/10.5194/amt-7-2389-2014, 2014 (data available at: https://data.earlinet.org/, last access: 21 December 2021).
Papayannis, A., Amiridis, V., Mona, L., Tsaknakis, G., Balis, D., Bösenberg, J., Chaikovski, A., De Tomasi, F., Grigorov, I., Mattis, I., Mitev, V., Müller, D., Nickovic, S., Pérez, C., Pietruczuk, A., Pisani, G., Ravetta, F., Rizi, V., Sicard, M., Trickl, T., Wiegner, M., Gerding, M., Mamouri, R. E., D'Amico, G., and Pappalardo, G.: Systematic lidar observations of Saharan dust over Europe in the frame of EARLINET (2000–2002), J. Geoph. Res.-Atmos, 113, D10204, https://doi.org/10.1029/2007JD009028, 2008.
Preißler, J., Wagner, F., Pereira, S. N., and Guerrero-Rascado, J. L.: Multi-instrumental observation of an exceptionally strong Saharan dust outbreak over Portugal, J. Geophys. Res.-Atmos., 116, D24204, https://doi.org/10.1029/2011JD016527, 2011.
Querol, X., Tobías, A., Pérez, N., Karanasiou, A., Amato, F., Stafoggia, M., Pérez García-Pando, C., Ginoux, P., Forastiere, F., Gumy, S., Mudu, P., and Alastuey, A.: Monitoring the impact of desert dust outbreaks for air quality for health studies, Environ. Int., 130, 104867, https://doi.org/10.1016/j.envint.2019.05.061, 2019.
Rolph, G., Stein, A., and Stunder, B.: Real-time Environmental Applications and Display sYstem: READY, Environ. Model. Softw., 95, 210–228, https://doi.org/10.1016/j.envsoft.2017.06.025, 2017.
Russo, A., Sousa, P. M., Durão, R. M., Ramos, A. M., Salvador, P., Linares, C., Díaz, J., and Trigo, R. M.: Saharan dust intrusions in the Iberian Peninsula: Predominant synoptic conditions, Sci. Total Environ., 717, 137041, https://doi.org/10.1016/j.scitotenv.2020.137041, 2020.
Salgueiro, V., Costa, M. J., Guerrero-Rascado, J. L., Couto, F. T., and Bortoli, D.: Characterization of forest fire and Saharan desert dust aerosols over south-western Europe using a multi-wavelength Raman lidar and Sun-photometer, Atmos. Environ., 252, 118346, https://doi.org/10.1016/j.atmosenv.2021.118346, 2021.
Salvador, P., Alonso-Pérez, S., Pey, J., Artíñano, B., de Bustos, J. J., Alastuey, A., and Querol, X.: African dust outbreaks over the western Mediterranean Basin: 11-year characterization of atmospheric circulation patterns and dust source areas, Atmos. Chem. Phys., 14, 6759–6775, https://doi.org/10.5194/acp-14-6759-2014, 2014.
Salvador, P., Molero, F., Fernandez, A. J., Tobías, A., Pandolfi, M., Gómez-Moreno, F. J., Barreiro, M., Pérez, N., Marco, I. M., Revuelta, M. A., Querol, X., and Artíñano, B.: Synergistic effect of the occurrence of African dust outbreaks on atmospheric pollutant levels in the Madrid metropolitan area, Atmos. Res., 226, 208–218, https://doi.org/10.1016/j.atmosres.2019.04.025, 2019.
Salvador, P., Pey, J., Pérez, N., Querol, X., Artíñano, B.: Increasing atmospheric dust transport towards the western Mediterranean over 1948-2020. NPJ Clim. Atmos. Sci., 5, 34, https://doi.org/10.1038/s41612-022-00256-4 , 2022.
Sánchez, M. L., García, M. A., Pérez, I. A., and de Torre, B.: Ground laser remote sensing measurements of a Saharan dust outbreak in Central Spain. Influence on PM10 concentrations in the lower and upper Spanish plateaus, Chemosphere, 67, 229–239, https://doi.org/10.1016/j.chemosphere.2006.10.058, 2007.
Shao, Y., Wyrwoll, K.-H., Chappell, A., Huang, J., Lin, Z., McTainsh, G. H., Mikami, M., Tanaka, T. Y., Wang, X., and Yoon, S.: Dust cycle: An emerging core theme in Earth system science, Aeolian Res., 2, 181–204, https://doi.org/10.1016/j.aeolia.2011.02.001, 2011.
Sicard, M., Barragan, R., Dulac, F., Alados-Arboledas, L., and Mallet, M.: Aerosol optical, microphysical and radiative properties at regional background insular sites in the western Mediterranean, Atmos. Chem. Phys., 16, 12177–12203, https://doi.org/10.5194/acp-16-12177-2016, 2016.
Sicard, M., Rodríguez-Gómez, A., Comerón, A., and Muñoz-Porcar, C.: Calculation of the Overlap Function and Associated Error of an Elastic Lidar or a Ceilometer: Cross-Comparison with a Cooperative Overlap-Corrected System, Sensors, 20, 6312, https://doi.org/10.3390/s20216312, 2020.
Sicard, M., Córdoba-Jabonero, C., López-Cayuela, M.-Á., Ansmann, A., Comerón, A., Zorzano, M.-P., Rodríguez-Gómez, A., and Muñoz-Porcar, C.: Aerosol radiative impact during the summer 2019 heatwave produced partly by an inter-continental Saharan dust outbreak – Part 2: Long-wave and net dust direct radiative effect, Atmos. Chem. Phys., 22, 1921–1937, https://doi.org/10.5194/acp-22-1921-2022, 2022.
Solomos, S., Ansmann, A., Mamouri, R.-E., Binietoglou, I., Patlakas, P., Marinou, E., and Amiridis, V.: Remote sensing and modelling analysis of the extreme dust storm hitting the Middle East and eastern Mediterranean in September 2015, Atmos. Chem. Phys., 17, 4063–4079, https://doi.org/10.5194/acp-17-4063-2017, 2017.
Soupiona, O., Samaras, S., Ortiz-Amezcua, P., Böckmann, C., Papayannis, A., Moreira, G. A., Benavent-Oltra, J. A., Guerrero-Rascado, J. L., Bedoya-Velásquez, A. E., Olmo, F. J., Román, R., Kokkalis, P., Mylonaki, M., Alados-Arboledas, L., Papanikolaou, C. A., and Foskinis, R.: Retrieval of optical and microphysical properties of transported Saharan dust over Athens and Granada based on multi-wavelength Raman lidar measurements: Study of the mixing processes, Atmos. Environ., 214, 116824, https://doi.org/10.1016/j.atmosenv.2019.116824, 2019.
Soupiona, O., Papayannis, A., Kokkalis, P., Foskinis, R., Sánchez Hernández, G., Ortiz-Amezcua, P., Mylonaki, M., Papanikolaou, C.-A., Papagiannopoulos, N., Samaras, S., Groß, S., Mamouri, R.-E., Alados-Arboledas, L., Amodeo, A., and Psiloglou, B.: EARLINET observations of Saharan dust intrusions over the northern Mediterranean region (2014–2017): properties and impact on radiative forcing, Atmos. Chem. Phys., 20, 15147–15166, https://doi.org/10.5194/acp-20-15147-2020, 2020.
Sousa, P. M., Barriopedro, D., Ramos, A. M., García-Herrera, R., Espírito-Santo, F., and Trigo, R. M.: Saharan air intrusions as a relevant mechanism for Iberian heatwaves: The record breaking events of August 2018 and June 2019, Weather. Clim. Extremes, 26, 100224, https://doi.org/10.1016/j.wace.2019.100224, 2019.
Stevens, B.: Rethinking the Lower Bound on Aerosol Radiative Forcing, J. Climate, 28, 4794–4819, https://doi.org/10.1175/JCLI-D-14-00656.1, 2015.
Valenzuela, A., Costa, M. J., Guerrero-Rascado, J. L., Bortoli, D., and Olmo, F. J.: Solar and thermal radiative effects during the 2011 extreme desert dust episode over Portugal, Atmos. Environ., 148, 16–29, https://doi.org/10.1016/j.atmosenv.2016.10.037, 2017.
Warner, M. S. C.: Introduction to PySPLIT: A Python Toolkit for NOAA ARL's HYSPLIT Model, Comput. Sci. Eng., 20, 47–62, https://doi.org/10.1109/MCSE.2017.3301549, 2018.
Welton, E. J. and Campbell, J. R.: Micro-pulse lidar signals: Uncertainty analysis, J. Atmos. Oceanic Technol., 19, 2089–2094, 2002.
Yang, K., Wang, Z., Lou, T., Liu, X., and Wu, M.: Upper troposphere dust belt formation processes vary seasonally and spatially in the Northern Hemisphere, Commun. Earth Environ., 3, 1–10, https://doi.org/10.1038/s43247-022-00353-5, 2022.
Zender, C. S., Miller, R. L. R. L., and Tegen, I.: Quantifying mineral dust mass budgets: Terminology, constraints, and current estimates, EOS, 85, 509–512, https://doi.org/10.1029/2004EO480002, 2004.
- Article
(6940 KB) - Full-text XML