the Creative Commons Attribution 4.0 License.
the Creative Commons Attribution 4.0 License.
The atmospheric oxidizing capacity in China – Part 1: Roles of different photochemical processes
Jianing Dai
Guy P. Brasseur
Mihalis Vrekoussis
Maria Kanakidou
Yijuan Zhang
Hongliang Zhang
Atmospheric oxidation capacity (AOC) characterizes the ability of the atmosphere to scavenge air pollutants. However, the processes involved in China, where anthropogenic emissions have changed dramatically in the past decade, are not fully understood. A detailed analysis of different parameters that determine the AOC in China is presented on the basis of numerical simulations performed with the regional chemical–meteorological Weather Research and Forecasting model with Chemistry (WRF-Chem). The model shows that the aerosol effects related to extinction and heterogeneous processes produce a decrease in surface ozone of approximately 8–10 ppbv in NOx-limited rural areas and an increase of 5–10 ppbv in VOC-limited urban areas. In this latter case, the ozone increase is noticeable for aerosol concentrations ranging from 20 to 45 µg m−3 in July 2018. The ozone reduction in NOx-sensitive regions is due to the combined effect of nitrogen dioxide and peroxy radical uptake on particles and of the light extinction by aerosols, which affects the photodissociation rates. The ozone increase in VOC-sensitive areas is attributed to the uptake of NO2 by aerosols, which is offset by the reduced ozone formation associated with HO2 uptake and with aerosol extinction. Our study concludes that more than 90 % of the daytime AOC is due to the reaction of the hydroxyl radical with VOCs and carbon monoxide. In urban areas, during summertime, the main contributions to daytime AOC are the reactions of OH with alkene (30 %–50 %), oxidized volatile organic compounds (OVOCs) (33 %–45 %), and carbon monoxide (20 %–45 %). In rural areas, the largest contribution results from the reaction of OH with alkenes (60 %). Nocturnal AOC is dominantly attributed to the reactions with the nitrate radical (50 %–70 %). Our results shed light on the contribution of aerosol-related NOx loss and the high reactivity of alkenes for photochemical pollution. With the reduction in aerosols and anthropogenic ozone precursors, the chemistry of nitrogen and temperature-sensitive VOCs will become increasingly important. More attention needs to be paid to the role of photodegradable OVOCs and nocturnal oxidants in the formation of secondary pollutants.
- Article
(9656 KB) - Full-text XML
- Companion paper
-
Supplement
(6860 KB) - BibTeX
- EndNote
With the drastic actions initiated by the Chinese authorities to improve air quality, specifically to reduce the emissions of primary pollutants, including nitrogen oxides (NOx), volatile organic compounds (VOCs), carbon monoxide (CO), sulfur dioxide (SO2), and the concentration of particulate matter (PM) suspended in the atmosphere, the level of several secondary pollutants including near-surface ozone (O3) increased significantly between the years 2013 and 2019, most notably in the North China Plain (e.g., Lu et al., 2018; Liu and Wang, 2020; Liu and Wang, 2020). Several papers have documented the observed trends of O3 in China (Lu et al., 2018; T. Wang et al., 2022). In some cases, studies have provided some explanation for the causes of these trends (Li et al., 2019a; Liu and Wang et al., 2020), specifically in the most polluted areas, or have proposed some mitigation strategies (Li et al., 2019b). Among the formulated hypotheses to explain these trends, the most feasible explanation is the reduction in the level of NOx in the polluted planetary boundary layer (PBL) with a related reduction in the rate at which O3 is titrated by nitric oxide (NO) in VOC-limited areas. Another potential cause of the observed O3 increase is the reduction in the atmospheric aerosol burden and hence in the rate at which peroxy radicals (HO2 and RO2) that contribute to O3 formation are removed by heterogeneous processes (Li et al., 2019a; Liu and Wang, 2020).
Alleviating O3 pollution requires a quantitative understanding of the different chemical processes that contribute to the photochemical formation and destruction of secondary species. It also requires detailed investigation of the budget of fast-reacting radicals that are directly involved in photochemical oxidation processes. Recent observational studies have documented and analyzed the evolution of several reactive species, such as OH, HO2, and RO2 radicals as well as O3, on the basis of observations generally at a single location with routine measurements lasting for several years (P. Liu et al., 2022; Tan et al., 2019; Zhu et al., 2021; W. Wang et al., 2022). The sensitivity of ozone, particulate matter, and oxidative processes to precursor emissions has also been studied in previous work (Liu et al., 2010; Xing et al., 2017) under highly polluted conditions. Such studies need to be repeated for current conditions characterized by reduced pollutant emissions and aerosol loading.
The purpose of the present study is to provide a quantitative estimate of the different factors that affect the oxidation capacity of the atmosphere in the entire geographical area covered by China. The concept of atmospheric oxidation capacity (AOC) was introduced several decades ago (e.g., Thompson, 1992; Prinn, 2003) to highlight the existence of self-cleansing processes in the atmosphere. These processes allow the removal of most primary pollutants, including methane (CH4), non-methane hydrocarbons (NMHCs), CO, NOx, and SO2, as well as the formation of secondary species, including O3, particulate nitrate (NO), sulfate (SO), and secondary organic aerosols (SOA). The oxidation capacity is a measure of the ability of the atmosphere to destroy primary species emitted at the Earth's surface. It is directly linked to the presence of highly reactive radicals, including OH and nitrate radical (NO3). It is therefore influenced by processes such as photolysis generated by solar radiation, temperature, emission, scavenging processes, atmospheric transport, and other meteorological factors. It is characterized by different factors, including the atmospheric production rate of ROx radicals (with ROx defined as OH + HO2+ RO2, where R represents an organic chain) and the OH reactivity.
Based on the model simulation, the analysis presented in this paper assesses the relative importance of different photochemical processes that contribute to the formation and destruction of near-surface ROx and O3 in different chemical environments encountered in China. This paper is structured as follows. Section 2 first provides some theoretical considerations on which our analysis is based. The adopted regional chemical–meteorological model, described in Sect. 3, is driven by reanalyzed meteorology for the year 2018 and by regional surface emissions that account for the contributions of different sectors. The analysis of the model simulations performed for different conditions is presented in Sects. 4–6. Specifically, the budget of oxidants (ROx and O3) is discussed in Sect. 4. The effect of heterogeneous chemical processes in the presence of aerosols is addressed in Sect. 5. Section 6 provides a quantitative estimate of the different indicators that describe the oxidation capacity of the atmosphere. A summary of the principal findings is provided in Sect. 7. Additional information, including the validation of the model simulations, can be found in the Supplement.
2.1 ROx radicals
As shown in the pioneering paper by Levy (1971), the fate of many primary atmospheric species (CO, CH4, and NMHCs) and the formation of secondary species, including tropospheric O3, are associated with cycling chain reactions involving OH, HO2, and RO2. In the theoretical description of the key chemical processes presented here, we refer to the simplified reaction scheme listed in Table 1, but the chemical mechanism adopted in our model is considerably more detailed.
Table 1Simplified chemical mechanisms used for the interpretation of model results.
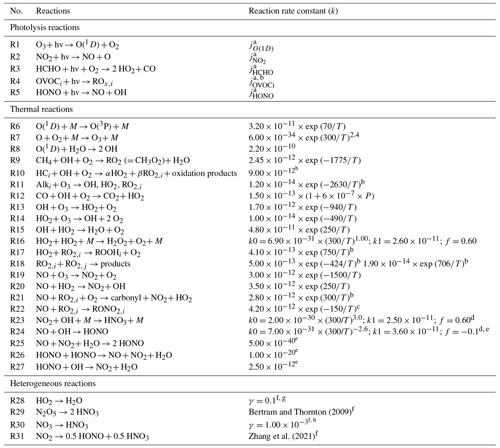
Notes: k is a rate constant. First-order rate constants are given per second (s−1). Second-order rate constants (cm3 molec.−1 s−1) and third-order rate constants (cm6 molec.−2 s−1). [M] is the total air concentration (molec. cm−3), and T is the air temperature (K). a Photolysis of O(1D), NO2, HCHO, OVOCs, and HONO. Each reaction rate is taken from MOZART-4 (Emmons et al., 2010). b Specific kinetics data for each compound are taken from MOZART-4 (Emmons et al., 2010). Here, HC, Alk, RO2, and ROOH refer to hydrocarbon, alkene, peroxy radical, and peroxide, respectively. c RO2 and RO2NO2 refer to ALKO2 (lumped alkane peroxy radical) and ONIT (organic nitrate). d Refer to the TROE function in WRF-Chem v 4.1.2 (Skamarock et al., 2019). e Zhang et al. (2021). f For calculation of the reaction rate, refer to Eq. (5). g Gaubert et al. (2020). h Liu and Wang (2020).
The production of ROx radicals in the troposphere results primarily from the photolysis of O3 (Reactions R1 and R8; see Table 1), of nitrous acid (HONO) (Reaction R5), and of different oxygenated volatile organic compounds (OVOCs) such as formaldehyde (HCHO) (Reaction R3), larger aldehydes, or acetone (Reaction R4). The ozonolysis of alkenes (Alk) (Reaction R11) is an additional source of ROx, which is believed to play a relatively minor role. When considering the sources due to the photolysis of OVOCs, we single out formaldehyde due to the major contribution of this species to ROx production. OVOCs stand, therefore, for the remaining non-HCHO OVOCs. Thus, we express the production rate of ROx as
Here and in the other expressions below, factors ki represent the reaction coefficients for Reaction i in Table 1, and J is the photolysis frequency for the chemical species under consideration. The parentheses stand for the number densities of species generally expressed in molecules or radicals per cubic centimeter. Coefficient ri represents the amount of ROx produced by the photolysis of each OVOC species, and si is the amount of ROx produced by each alkene ozonolysis reaction. These coefficients are specific to a reaction involving the photolysis of OVOCs and the ozonolysis of the alkenes. A more explicit form for the two last terms in the above expression depends on the adopted chemical mechanism. The ROx source term provides an estimate for the availability of radicals that initialize photooxidation processes in the troposphere.
The destruction of ROx radicals results from the termination Reactions (R15)–(R18) between different ROx radicals (LH), Reactions (R22)–(R24) between ROx radicals and nitric oxide (LN), and the heterogeneous uptake of HO2 (Reaction R28) on aerosol surfaces (Lhet). Thus, the total destruction rate of ROx can be expressed as
with
In the above expressions, we assume that, near the surface, the ROx termination reactions between HO2 and NO2 (that produce nitrous acid, HO2NO2) and between acetyl peroxy radicals and NO2 (that produce peroxyacetyl nitrate, PAN) are balanced by the regeneration of ROx resulting from the photolysis of HO2NO2 and the thermal decomposition of PAN (equilibrium conditions), respectively. Therefore, the related reaction rates do not appear explicitly in the above expressions.
2.2 Odd oxygen
In the troposphere, odd oxygen (Ox= O3+ NO2) is produced through complex recurrent radical reaction chains involving the oxidation of hydrocarbons in the presence of NOx. The O3 molecule is formed by the rapid photolysis of NO2 (Reaction R2) followed by the recombination of atomic oxygen (Reaction R7). Reaction (R2) is balanced by Reactions (R19) and (R20), which reproduce NO2. Production of odd oxygen occurs only if NO is converted to NO2 without consuming O3, i.e., by Reactions (R20) and (R21) with a peroxy radical (HO2, CH3O2, and other higher-order organic radicals) provided by the oxidation of methane, other hydrocarbons (HC), and carbon monoxide (Reactions R9, R10, and R12). The resulting production rate of odd oxygen can be expressed with a good approximation by
This equation highlights the nonlinear nature of P(Ox) since the concentrations of nitric oxide and peroxy radicals are dependent on each other.
The photochemical destruction of Ox results from several processes, including the photolysis of O3 (Reaction R1) followed by Reaction (R8) between the electronically excited oxygen atom O(1D) and water vapor (H2O). Other Ox loss mechanisms involve the reactions of ozone with OH (Reaction R13), HO2 (Reaction R14), and different alkenes (Alk) (Reaction R11). In the presence of NOx, an additional loss mechanism is provided by the conversion of NO2 to nitric acid (HNO3; Reaction R23). The total destruction rate of Ox is therefore expressed as
The dominant pathways leading to the formation and destruction rates of Ox and hydroxyl radicals vary according to chemical environments. Under relatively clean conditions with low levels of NOx, the production of odd oxygen, as provided by Reactions (R20) and (R21), is limited by the availability of NOx, while the loss of the ROx radicals is dominated by the peroxy-radical self-reaction (Reaction R16) that leads to the formation of hydrogen peroxide (H2O2) (Song et al., 2021). Under these conditions, a reduction in the emissions of NOx tends to reduce the ground-level O3 concentration.
In polluted areas, including many urban centers, the level of NOx is so high that saturation conditions prevail. In this environment, the formation of O3 is determined by the availability of VOCs, and the loss of ROx is dominated by Reaction (R23) between NO2 and OH, which produces HNO3. In this case, a reduction in NOx tends to increase the concentration of O3, while a reduction in VOCs is expected to reduce its near-surface abundance (T. Wang et al., 2022). Furthermore, since highly polluted environments are generally characterized by elevated aerosol loads, the effect of heterogeneous processes on the abundance of reactive species becomes particularly important. Among these reactions, we consider more specifically the uptake of HO2, NO2, NO3, and N2O5 on the atmospheric aerosol surfaces (Reactions R28–R31). The heterogeneous destruction of peroxy radicals on the surfaces of aerosols tends to inhibit the formation of O3 by reducing the rates of Reactions (R20) and (R21). Under high levels of aerosols, this reaction may become important for O3 formation, which led Ivatt et al. (2022) to define a third O3 sensitivity regime called the aerosol-inhibited photochemical O3 regime. The uptake of NO2 leads to the formation of HONO, whose photolysis represents a significant source of OH. It also forms NO, which reacts with HO2 and RO2 to produce O3. In short, heterogeneous processes may either favor or inhibit the formation of odd oxygen in polluted areas.
The lifetime of Ox in the PBL is sufficiently long (1 or 2 d) that additional processes besides photochemical production and destruction need to be taken into consideration. Among them is the additional loss of O3 and NO2 resulting from dry deposition on the vegetation. With a deposition velocity of about 1 cm s−1 (Wesely et al., 2000), the corresponding odd oxygen loss rate in the boundary layer is close to 1 ppbv h−1 if one assumes that the depth of the mixing layer is on the order of 1 km. In addition, vertical mixing in the convective PBL and advective horizontal transport tend to disperse locally produced O3 and balance its net production, for example in urban centers.
2.3 Formulation of aerosol uptake
As stated above, heterogeneous chemical reactions can substantially influence the concentrations of ROx radicals and O3. The reactions under consideration in our analysis are Reactions (R28) to (R31), which are listed in Table 1. The first-order reaction rate constant on aerosols ka (s−1) for species i associated with these reactions is expressed by Schwartz (1986):
where Aa (cm2 cm−3) is the aerosol surface area density; a (cm) is the mean radius of the particles; D (cm2 s−1) is the gas-phase diffusion coefficient (Mozurkewich et al., 1987) with values of 0.247 for HO2 uptake (Xue et al., 2016) and 0.1 for NO2, NO3, and N2O5 uptake (Gaubert et al., 2020; Liu and Wang, 2020); γa is the dimensionless reaction-dependent uptake coefficient for species i; and vi (cm s−1) is the mean thermal velocity of species i given as a function of temperature T (K) and molecular mass mi by
with kb (1.38 × 10⁻²³ J K−1) being the Boltzmann constant.
The chemical substances produced as a result of the HO2 uptake onto aerosol surfaces are not clearly established and could be H2O or H2O2 (Mao et al., 2010, 2017; Song et al., 2021). Here, to determine the maximum effect of this reaction, we assume that the HO2 uptake onto aerosols (Reaction R28) represents a terminal reaction of the hydrogen radical chain. Hence, water molecules rather than peroxide molecules are assumed to be formed. The corresponding uptake coefficient () is chosen to be 0.1 in this study, a value lower by a factor of 2 than those used in some earlier model studies (γHO2=0.2; Tie et al., 2001, 2005; Martin et al., 2003; Liu and Wang, 2020; Ivatt et al., 2022) but consistent with the conclusions reached by Gaubert et al. (2020) from their model simulations. These lower values are also adopted by Yang et al. (2022) and are consistent with the measurements of Lakey et al. (2015), Tan et al. (2020), and Song et al. (2020). Specifically, on the basis of observations made in the Beijing–Tianjin–Hebei area during the summer of 2014, Song et al. (2020) conclude that the best fit for the value of is a value of 0.116 ± 0.086, which is close to the value adopted in the present study.
The heterogeneous uptake of N2O5 by aerosol particles leads to the formation of nitric acid molecules (Reaction R29). In the present study, we neglect the possible formation of ClNO2 followed by its photolysis into Cl and NO2. This process associated with the presence of chloride ions in the bulk of the particles is a source of additional radicals and hence could have an influence on O3 (Thornton et al., 2010; Dai et al., 2020). Here, for the uptake of N2O5, we adopt the first-order rate constant as expressed by Bertram et al. (2009) and modified by C. Yu et al. (2020), with the surface concentrations of the particle chloride and nitrate ions taken from the Model for Simulating Aerosol Interactions and Chemistry (MOSAIC) estimates. This parameterization has been used in simulating the concentration of N2O5 at several Chinese sites (Yu et al., 2020), and the simulated levels are in good agreement with the observed N2O5 values (Dai et al., 2020).
The rate of heterogeneous conversion of NO3 (Reaction R30) is calculated by Eq. (5) with a value of the uptake coefficient equal to 10−3 (Jacob, 2000; Xue et al., 2014; Liu and Wang et al., 2020).
Finally, the heterogeneous uptake of NO2 on aerosol surfaces leads to the production of HONO and HNO3 (Reaction R31) and, as HONO is rapidly photolyzed after sunrise, this heterogeneous process represents a source of OH radicals. The process also converts NO2 into NO. Here, according to Zhang et al. (2021), we express the first-order rate constant by Eq. (5) with a value of the uptake coefficient equal to 8 × 10⁻⁶ during nighttime and equal to 1 × 10 () during daytime (Li et al., 2010; Czader et al., 2012; Fu et al., 2019), with J representing the light intensity (W m−2) and Jmax (W m−2) the peak value of the light intensity (chosen to be 400 W m−2 in this study).
2.4 Other HONO sources
For the particular heterogeneous reaction involving NO2, which leads to the formation of nitrous acid, we also consider the additional contribution of the uptake on flat surfaces, specifically on bare soils, including asphalt in urban areas. This effect is believed to play a significant role, particularly in urban areas (Zhang et al., 2016; Li et al., 2018). Zhang et al. (2021) claim that the measured vertical nighttime profile of this species suggests that the dominant formation nighttime mechanism of HONO results from the heterogeneous conversion of NO2 on the ground. For this process, which is only crudely represented here, we assume that the first-order rate constant kg (s−1) for this process is given by Liu et al. (2019) for nighttime conditions:
where Ag is the surface area density over the bare soil and urban surfaces and γg is the uptake coefficient on the ground. Here, according to Zhang et al. (2021), we express a value of the uptake coefficient that is equal to 4 × 10⁻⁶ during nighttime and 6 × 10 () during daytime, where J and Jmax (W m−2) represent the solar intensity and its maximum value. Following the suggestion of Vogel et al. (2003) adopted, for example, by Zhang et al. (2021), we express the surface density over the ground by , where h (m) represents the height of the model layer adjacent to the ground; the 1.7 value represents an effective factor per ground surface area in the first layer.
In this model case, we also account for the gas-phase reactions of HONO (Reactions R24–R27) as well as the direct-transportation HONO emissions. The latter are assumed to be equal to 0.8 % of the traffic emission of NO (Dai et al., 2021). In this study, we neglect the direct HONO emissions from soil and the daytime HONO source from the photolysis of NO, which may lead to an underestimation of HONO concentration in rural areas and during daytime (Zhang et al., 2016; Fu et al., 2019; Zhang et al., 2021).
2.5 Photochemical reactivity and AOC
To characterize the oxidation capacity of the atmosphere in China, we consider several indicators that have proven to be useful for developing O3-controlling strategies. These include the OH reactivity associated with the action of volatile organic compounds (VOCR) and nitrogen oxides (NO), the radical chain length (ChL), the ozone production efficiency (OPE), and the AOC.
Since NOx, VOCs, and CO are oxidized by the OH radical as part of a cyclic chain process that initiates the O3 formation, an estimate of the OH reactivity (s−1) allows us to understand the factors that determine the photochemical budget of O3 and more generally the factors that characterize the atmosphere's oxidizing capacity. The OH reactivity by the different VOCs and CO and by NOx is defined as
The ChL provides a measure of the number of cycles affecting ROx radicals before these radicals undergo a termination process. It can therefore be expressed by the ratio between the conversion rate between ROx radicals, including the conversion by NO of HO2 to OH (Reaction R20) and of RO2 to HO2 (Reaction R21), together with the destruction rate of ROx (or equivalently by the production rate of ROx). Thus, adopting here the definition of Martinez et al. (2003), Mao et al. (2010), and Zhu et al. (2020), we write
From this adopted definition in Eq. (9), and assuming that the ROx production and destruction rates are in balance, we can write
which shows that Ox production is proportional to the ROx production rate and is favored by a large number of radical regenerations.
The OPE is used to quantify the efficiency of O3 molecules formed per NOx molecule oxidized. It is defined as the ratio between the O3 production rate and the NOx loss rate,
and represents the efficiency of NOx. To a good approximation, this expression can be expressed as
As the instantaneous value of the OPE depends on the HO2 OH and NO NO2 concentration ratios, it accounts for the couplings between ROx and NOx cycles. One can show that this factor is usually highest in the remote atmosphere or low-NOx environments (Brasseur et al., 1999). Note that, under VOC-limited conditions (polluted areas) when the production rate of odd oxygen can be expressed as (Kleinman et al., 2002)
where φi represents the O3 yield from the production of HO2 radicals, the OPE can be approximated by
where represents an average yield value. In other words, under VOC-limited situations, the ratio between VOCR and NO has some similarities to the odd oxygen production efficiency.
Finally, the AOC (cm−3 s−1), a parameter introduced by Geyer et al. (2001) to account for the contributions of all the oxidants, is derived here as the rate at which CO, CH4, and NMHCs (all species are noted here as Yi) are oxidized by OH, O3, and NO3 (denoted as Xj) (Geyer et al., 2001; Elshorbany et al., 2009; Xue et al., 2016; W. Wang et al., 2022; Yang et al., 2022). Thus, when considering all the combinations of the different primary pollutants and atmospheric oxidants, we write
As stated by P. Wang et al. (2022) and Yang et al. (2022), AOC is a parameter well-suited to describing the removal rate of primary pollutants and the formation of secondary species including O3 and secondary PM2.5. It is, therefore, an indicator used to design control policies for these secondary species. During daytime, the largest contribution to AOC is due to the oxidation of pollutants by the OH radical (D. D. Li et al., 2018; T. Liu et al., 2022). At night, the oxidizing capacity is due to the oxidation by NO3 and O3 (Brown and Stutz, 2012; Ng et al., 2017).
3.1 Modeling setting
To characterize the chemical budget of reactive species, photochemical parameters, and AOC in China, we use version 4.1.2 of the WRF-Chem model (Skamarock et al., 2019) to simulate the meteorological fields as well as the regional transport and chemical and physical transformations of trace gases and aerosols. We adopt the MOZART-4 gas-phase chemical mechanism documented and evaluated by Emmons et al. (2010), which includes 108 chemical species and 235 gas-phase reactions. This scheme is coupled to the MOSAIC aerosol module described by Fast et al. (2006), Zaveri et al. (2008), and Lu et al. (2021). A detailed list of the RO2, VOCs, and aerosol species included in the model is provided in Table S1 in the Supplement.
We select one month in the winter (1 to 31 January) and the summer (1 to 31 July) of 2018, respectively, to analyze the calculated distributions of chemical species. The horizontal resolution adopted in the present study is 36 km × 36 km over the entire domain that covers East and Southeast Asia (from 15∘ S to 60∘ N in latitude and from 60 to 150∘ E in longitude). Initial meteorological conditions are taken from the National Centers for Environmental Prediction (NCEP) Final (FNL) reanalysis dataset (http://rda.ucar.edu/datasets/ds083.2/, last access: 10 April 2023). Initially, chemical boundary conditions are constrained by the results of the global Community Atmosphere Model with Chemistry (CAM-chem) (https://www.acom.ucar.edu/cam-chem/, last access: 10 April 2023). The different modules used to represent the physical processes are provided in Table S2.
For the anthropogenic emissions of air pollutants, we adopt the surface emissions provided by the Multi-resolution Emission Inventory for China (MEIC v1.3; http://www.meicmodel.org/, last access: 10 April 2023) derived for the year 2017 (Zhang et al., 2009; Zheng et al., 2018). This inventory covers the anthropogenic emissions for the geographical area of mainland China. For the remaining areas of Asia, we use the anthropogenic emissions provided by the 2018 global inventory of the Copernicus Atmosphere Monitoring Service (CAMS)-GLOB-ANT_v4.2 (Elguindi et al., 2020; Granier et al., 2019). Biogenic emissions are calculated online by the Model of Emission of Gases and Aerosols from Nature (MEGAN) version 2.1 (Guenther et al., 2006). The dust and sea-salt emissions are calculated online by the Global Ozone Chemistry Aerosol Radiation and Transport (GOCART) model (Chin et al., 2002).
The availability of several observational datasets allows us to evaluate the meteorological parameters and air pollutant concentrations derived by our regional model. The meteorological data used to validate the model simulations, including the wind direction, wind speed, surface temperatures, and specific humidity, are obtained from the NOAA National Climatic Data Center (NCDC). Conventional air pollutant data, including SO2, NO2, CO, O3, and PM2.5, are obtained from the surface stations of China's Ministry of Ecology and Environment (MEE; https://www.mee.gov.cn/, last access: 10 April 2023). To validate the model results, we calculate the mean bias, the normalized mean bias, the normalized mean error, the root mean square errors, and the correlation coefficient (Table S3). The equations for these statistical parameters are found in the paper by Dai et al. (2020).
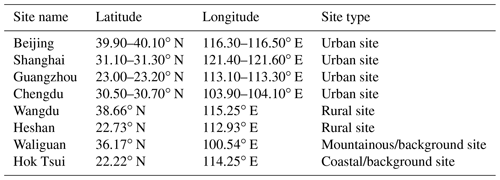
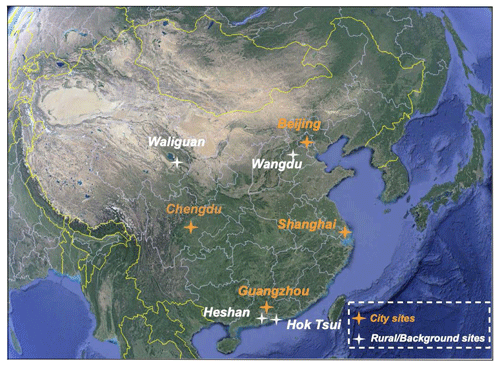
In our analysis presented in the subsequent sections, we examine in more detail the calculated concentrations of photochemical parameters at urban sites in four large cities in China: Beijing, Shanghai, Guangzhou, and Chengdu (Fig. 1). We also provide these parameters at four rural observational sites for which detailed observational analysis is available. These include the relatively polluted site of Wangdu in the suburban region near Beijing, the atmospheric supersite of Heshan located 50 km to the southwest of Guangzhou, the remote free site of Waliguan at about 3800 m altitude, and the coastal site of Hok Tsui in Hong Kong. Detailed information on the selected sites in the present study is listed in Table 2.
3.2 Design of numerical experiments
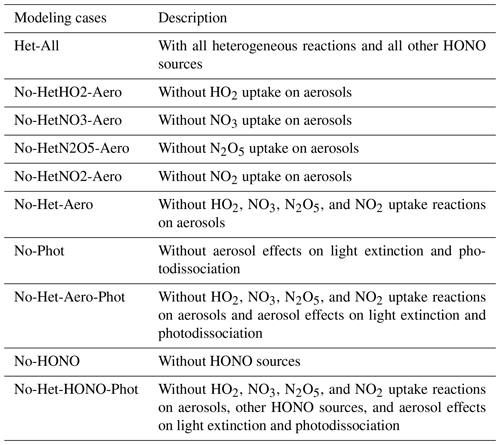
Table 3 lists the different sensitivity cases designed for this study. The baseline case, called Het-All, accounts for all heterogeneous reactions referred to in Table 1 and includes all identified sources of HONO mentioned in Sect. 2.4. The Het-All case is used to evaluate the performance of the model relative to observations. To quantify the specific aerosol effects through the uptake of HO2, N2O5, NO3 and NO2 extinction, and NO2 uptake over the ground on surface O3 concentration, another nine sensitivity cases are considered based on different assumptions. The details of these sensitivity cases are given as follows.
For the specific effects of aerosol uptake, the respective importance of these processes is determined by subtracting the baseline results from the results in sensitivity cases in which specific heterogeneous reactions are ignored: HO2 (No-HetHO2-Aero), NO3 (No-HetNO3-Aero), N2O5 (No-HetN2O5-Aero), and NO2 (No-HetNO2-Aero). The case labeled No-Het-Aero ignores all the above heterogeneous reactions on aerosols. The difference between Het-All and No-Het-Aero represents the combined effects of these heterogeneous reactions on particles. The case denoted as No-Phot ignores the radiative effects of aerosols on the calculation of the photodissociation coefficients. The difference between Het-All and No-Phot represents the effect of aerosol radiation. An additional case labeled No-Het-Aero-Phot ignores the abovementioned heterogeneous reactions on aerosols and aerosol effects on light extinction and photodissociation to quantify the combined effect of aerosol uptake and radiation.
In order to quantify the contribution of HONO sources added to the model, we consider a case labeled No-HONO in which the heterogeneous uptake of NO2 by aerosols, bare soils, and urban surfaces as well as the homogeneous formation and surface emissions of HONO are all ignored. The difference between the results of the Het-All case and the No-HONO case represents the effect of all the HONO sources. The final case, denoted as No-Het-HONO-Phot, ignores all the above heterogeneous reactions on aerosols, other HONO sources, and radiative effects of aerosols on the calculation of the photodissociation coefficients. The difference between Het-All and No-Het-HONO-Phot provides quantitative measures of the effects resulting from all the heterogeneous reactions (aerosols and ground effects), other HONO sources, and aerosol radiation.
3.3 Model validation
In Fig. S1, we compare the spatial distribution of the calculated surface concentrations of the maximum daily 8 h average (MDA8) O3 as well as the monthly averages of NO2, CO, and PM2.5 (the Het-All case) with available observational data from the MEE for January and July 2018. In most cases, this comparison shows a good performance of the model with, however, some discrepancies: an overestimation of summertime O3 in central and western China associated with an underestimation of NO2 in these regions and an underestimation of summertime O3 in eastern China with a slight overestimation of NO2 (Fig. S1). In the case of CO and PM2.5, the calculated concentrations are higher than the measured values in central China in both seasons.
One should stress here that a comparison of coarse-resolution model output with local measurements made at ground stations is not straightforward and can only provide crude information. In order to alleviate the problem, we have combined the concentration values measured by different stations within a given area with the 36 km resolution model results. The areas including the individual stations in metropolitan areas are provided in Table 2.
The diurnal variations of NO2, O3, CO, and PM2.5 in January and July for the four metropolitan areas selected in our study are compared with measurements from monitoring stations in Figs. S2 and S3. The model successfully simulates the diurnal variations of these chemicals. However, the summertime NO2 concentration is overestimated in these urban areas. Summertime ozone concentrations are underestimated at nighttime and are overestimated during daytime. These discrepancies can be explained by the relatively lower NO2 uptake coefficients used in our studies (Liu et al., 2019; Fu et al., 2019) and the coarse resolution of the model (Tie et al., 2010). An overestimation of the NO2 concentration tends to broaden the area in which ozone is VOC-controlled.
The simulated CO concentration is slightly overestimated, which can be attributed to uncertainties in the chemical boundary conditions and in the emissions (Liu and Wang et al., 2020). An overestimation of PM2.5 is found in summer, which can be partially due to uncertainties in emissions and the mechanisms of secondary aerosol formation (Li et al., 2022). Model estimates of the NO, HONO, HCHO, OH, HO2, NO3, isoprene, ethane, and ethene mixing ratios for the base case are found in Figs. S4–S6. Calculated diurnal variations of surface NO, HONO, OH, HO2, and NO3 are provided in Figs. S7–S11. Generally, based on the comparison of our simulated results with observed data in the literature, our simulated concentrations of OH, HO2, HONO, and HCHO match relatively well with the observational data. The calculated aerosol surface area density is shown in Fig. S12. The values calculated in eastern China are considerably higher during wintertime (2.5 to 3 × 10⁻⁵ cm2 cm−3) than during the summer (0.7 to 1.0 × 10⁻⁵ cm2 cm−3).
The validation of the model regarding volatile organic compounds is not easy to perform because of the short lifetimes of most of these species, the inhomogeneity in their emissions, the complexity of the chemical processes involved, and the lack of observational data. In China, only a few stations report continuous measurements of VOCs. The comparison is made particularly difficult with a model whose grid size is equal to 36 km. Therefore, as an illustrative example, we show in Fig. S13 of the Supplement a comparison of the calculated and observed diurnal variations in the mixing ratios of ethane, propene, isoprene, ethane, propane, benzene, toluene, and xylene at the Hok Tsui site (Hong Kong) in January 2018. The discrepancies in the calculated concentrations of anthropogenic VOCs and of biogenic isoprene lead to inaccuracies in the calculated concentrations of secondary organic species such as formaldehyde as well as in the calculation of the OH reactivity (VOCR) and of the AOC.
More detailed information on the model validation is provided in the Supplement.
In order to highlight the regional differences in the existing photochemical regimes, we first show the distributions of the areas where the ozone formation is either NOx- or VOC-limited. As an indicator to define these areas, we adopt the ratio between the H2O2 and HNO3 production rates. An area is considered to be NOx-limited if this ratio is larger than 0.2 and VOC-limited if it is less than 0.06 (Zhang et al., 2009).
Figure 2 shows that, during summertime, the ozone formation rate is primarily sensitive to NOx in southern and western China as well as in the surrounding oceanic regions. Exceptions are found at the southeastern coast, which is strongly influenced by the metropolitan regions of Guangzhou and Hong Kong. During this season, the formation of ozone is VOC-sensitive in a large fraction of northern China, specifically in the areas to the south of Beijing and in the vicinity of Shanghai. A broader area surrounding Beijing and Shanghai corresponds to an intermediate situation (transition). A similar situation prevails in and around urban hotspots such as Seoul and Tokyo. During winter, the ozone formation in most of eastern and northern China is VOC-limited.
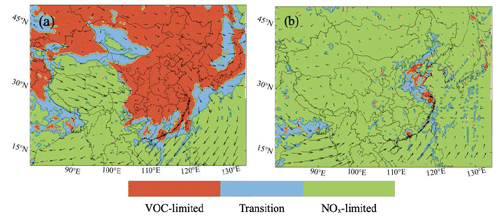
Figure 2Display of regions in which ozone production is limited by the availability of nitrogen oxides (NOx-limited, in green) and volatile organic carbon (VOC-limited, in red) in January (a) and July (b) 2018. The regions with intermediate conditions (transition) are shown in blue. The indicator used to define these regions is the production rate ratio between hydrogen peroxide (H2O2) and nitric acid (HNO3): P(H2O2) P(HNO3).
4.1 The budget of ROx
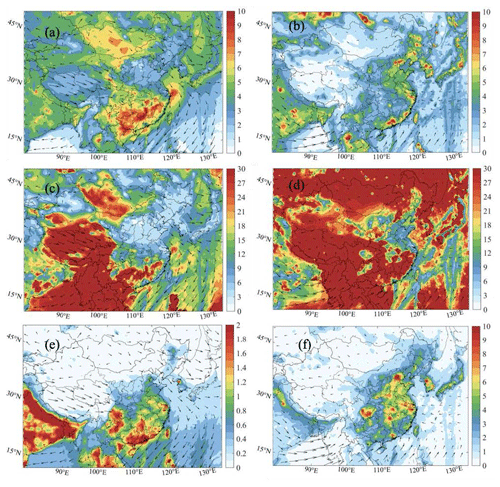
Figure 3 shows the geographical distribution of the average daytime (08:00–19:00 local standard time – LST) production rate of ROx (P(ROx)) contributed by the photolysis of HONO, HCHO, non-HCHO OVOCs, and O3 for January and July 2018.
In winter, the mean daytime production rate of the radicals is small in the less populated western China. In the eastern plain, its value associated with the HONO photolysis is typically 0.5–0.8 ppbv h−1 in rural areas and reaches 1–2 ppbv h−1 in polluted urban areas. The contribution of the HCHO photolysis to P(ROx) is on the order of 0.15 ppbv h−1 in most areas, with values as high as 0.5 ppbv h−1 in Guangzhou, which benefits from sufficient solar radiation during winter. Correspondingly, the contribution of the other OVOCs is around 0.2 ppbv h−1 in southern China, with a similar distribution of the photolysis of HCHO. The mean daytime P(ROx) associated with O3 photolysis is small (less than 0.5 ppbv h−1) over the entire Chinese territory except in the very south of the country, where it reaches 0.2 ppbv h−1. The contribution by alkene ozonolysis is negligible (Fig. S14).
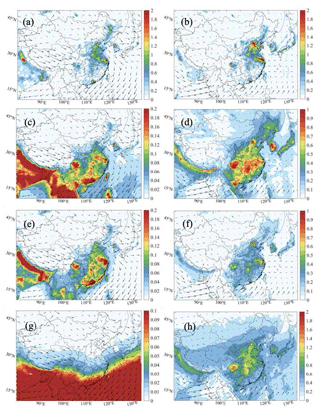
Figure 3Spatial distribution of the production rate of ROx (RO2+ HO2+ OH) (P(ROx), ppbv h−1) (the Het-All case) from the photolysis of nitrous acid (HONO) (a, b), formaldehyde (HCHO) (c, d), non-HCHO-oxidized volatile organic compounds (OVOCs) (g, h), and O3 (reactions between O1D and H2O; e, f) in the daytime (08:00–19:00 LST) of January (left column: a, c, e, g) and July (right column: b, d, f, h). Note the differences in scales among the panels.
In summer, the mean P(ROx) by HONO photolysis reaches 2 to 3 ppbv h−1 in the regions surrounding Beijing, Shanghai, Guangzhou, and Chengdu but is considerably smaller (less than 0.5 ppbv h−1) in the outskirt rural areas. The photolysis of HCHO reaches values ranging from 0.5 to 1.0 ppbv h−1 in the rural areas of eastern China, with no particular maximum in the metropolitan areas. The high value of P(ROx) contributed by non-HCHO OVOC photolysis ranges from 0.3 to 0.8 ppbv h−1, with obvious peak values in the city areas. The daytime-averaged value of P(ROx) resulting from the photolysis of O3 is on the order of 1.0 ppbv h−1 in eastern and southern China. The peak spot in the Sichuan Basin is due to the high water vapor contributed by heavy rainfall in summer, which leads to a high OH radical (Xia et al., 2021).
In summary, and for the present conditions, our model suggests a higher value of P(ROx) in summer than in winter. The higher summertime P(ROx) in eastern and southern China is associated with the photolysis of formaldehyde and O3. In urban areas, the dominant contribution to the higher P(ROx) in summer is provided by the photolysis of HONO. The spatial distributions that vary in winter and summer are also related to the seasonal variations in meteorological parameters, such as surface temperature and water vapor (Fig. S15).
The diurnal variation of the P(ROx) in four different metropolitan areas (Beijing, Shanghai, Guangzhou, and Chengdu) at two relatively polluted rural (Wangdu and Heshan) and two clean remote sites (Hok Tsui and Waliguan) is shown for summertime in Fig. 4. The graph shows the contribution of the HONO (green area), HCHO (red area), and non-HCHO OVOCs (dark green area), O3 (yellow-green area) photolysis, as well as the effect of alkene ozonolysis (blue area). In the four urban centers, the maximum values of P(ROx) in the early afternoon range between 5 ppbv h−1 in Shanghai and 6–8 ppbv h−1 in the three other cities. In the early morning, as the sun rises, the largest contribution is due to the photolysis of HONO. A few hours later, the contribution of the photolysis of HCHO and other OVOCs becomes large. The value of P(ROx) from the photolysis of O3 is small in the early morning and peaks in the mid-afternoon. At the four sites of the rural areas, the maximum value of P(ROx) is close to 5 ppbv h−1 in Wangdu (suburban site southwest of Beijing), 1.3 ppbv h−1 in Heshan (rural site close to Guangzhou), and less than 0.3 ppbv h−1 in Hok Tsui (coastal site) and Waliguan (western China). The contribution of O3 photolysis generally dominates at these rural sites.
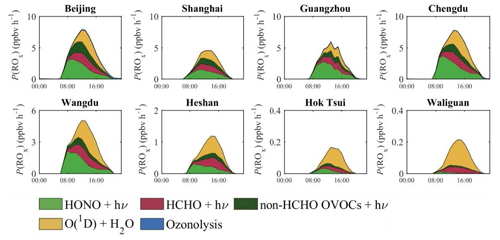
Figure 4Diurnal variation of the production rate of ROx (P(ROx), ppbv h−1) in different regions of China calculated for July 2018.
A comparison between the values of P(ROx) derived from local observations is performed with model estimates in Table 4. At the four city sites, our simulated values of the maximum of P(ROx) and the contributions of the photolysis of HONO, HCHO, and O3 reproduce the observations satisfactorily. However, at the Heshan site, the calculated value of P(ROx) (1.1 ppbv h−1) in our study is much smaller than the observed value (4.0 ppbv h−1) (Tan et al., 2019). One reason for this discrepancy may be the missing soil HONO emission, which leads to an underestimation of the HONO concentration at this site (Table S4) and the contributed value to P(ROx) by the photolysis of HONO (0.5 ppbv h−1 versus 2.0 ppbv h−1). Another uncertainty is the contribution of non-HCHO OVOC photolysis to the P(ROx). W. Wang et al. (2022), based on the measurement data in Guangzhou, reported that a model without constraints of non-HCHO OVOCs would lead to an underestimation of the production rates of ROx and O3. Owing to the lack of specific OVOC measurements, it is difficult to quantify the contributions of different OVOC species. Additional efforts regarding the OVOC measurements are needed to understand the specific contributions of OVOCs to the atmospheric oxidation capacity.
Table 4Comparison between values of the production rate of ROx (ppbv h−1) derived from local observations and calculated by our regional model in July 2018.
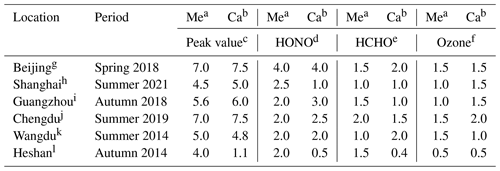
a Measured value in relevant periods. b Calculated value in our study in July 2018. c Peak value of the production rate of ROx. Peak value of the production rate of ROx from the photolysis of d HONO. e HCHO and f O3. Observations from the studies of g Whalley et al. (2021). h Zhu et al. (2021). i Wang et al. (2022). j Yang et al. (2022). k Tan et al. (2017). l Tan et al. (2019).
The diurnal variations of P(ROx) are displayed in Fig. S16. The maximum value of the P(ROx) is close to 3 ppbv h−1 in Beijing, Chengdu, and Shanghai and is about twice as large in the region of Guangzhou. In Wangdu and Heshan, the peak values are comparable with those in urban areas, while in Hok Tsui and Waliguan, they are lower than 1 and 0.1 ppbv h−1, respectively. In most cases, the major contribution to P(ROx) is provided by the photolysis of HONO.
The spatial distribution of the daytime-averaged destruction rate for ROx (D(ROx)) in January and July is shown in Fig. 5. In the two seasons under consideration, the loss rate is largest in the eastern and southern regions of China. In January, this quantity is largest in polluted metropolitan areas, with daytime mean values surpassing 2 ppbv h−1. In July, the total daytime-averaged value of D(ROx) is on the order of 3 ppbv h−1 in the rural areas of eastern China and reaches about 6 ppbv h−1 in the urban and industrialized areas. In Tibet, the value of this quantity is small (∼ 0.1 ppbv h−1 in winter and 1.2 ppbv h−1 in summer).
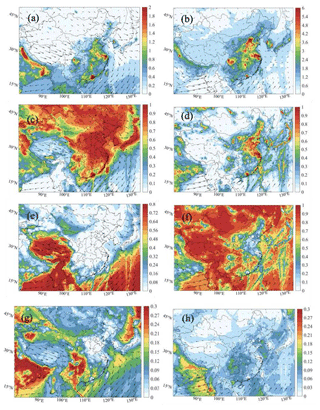
Figure 5Spatial distribution of the destruction rate of ROx (D(ROx), ppbv h−1) (a, b) and the relative contribution (ROx) (c, d), (ROx) (e, f), and (ROx) (g, h) in the daytime of January (left column: a, c, e, g) and July (right column: b, d, f, h).
Interestingly, the relative importance of the different photochemical mechanisms involved in the destruction rate D(ROx) varies considerably with the season. In January, the D(ROx) due to the reaction between OH radicals and NOx (LN in Eq. 2) dominates in most parts of eastern China (contribution of typically 90 %), except in Tibet, where the largest loss (contribution of 70 %–80 %) is due to the recombination of hydrogen radicals (LH in Eq. 2). In July, it is this last type of loss (LH) that plays the dominant role (typically 90 %), except in the eastern plain of China, where the level of NOx is highest, and LN (contribution of 70 %–80 %) is, therefore, larger than LH (contribution of 20 %). In both seasons, the destruction of ROx by the uptake of HO2 is relatively small (generally less than 15 %). The highest contribution occurs during winter in southwestern China (contribution of 30 %) and in the Ganges River Valley of India (contribution of 40 %).
The diurnal variation of D(ROx) in July is presented in Fig. 6 in four urban areas (Beijing, Shanghai, Guangzhou, and Chengdu) and in four selected locations in rural areas (Wangdu, Heshan, Hoktsui, and Waliguan; see Fig. 1). In the summertime, the value of D(ROx) around noon reaches about 13 ppbv h−1 in the urban areas except in Shanghai, where it reaches only 8 ppbv h−1. In winter, the corresponding maximum values are closer to 3–4 ppbv h−1, except in the southern city of Guangzhou, where the maximum loss rate is closer to 6 ppbv h−1. In all these cases, the dominant contribution to D(ROx) is attributed to the reactions involving the presence of NOx (LN). In the rural areas, the value of D(ROx) is considerably smaller. In July, it is on the order of or smaller than 2 ppbv h−1 and is dominated by the HOx recombination (LH). In the wintertime, the peak loss is smaller than 0.2 ppbv h−1, except in Chengdu, where it reaches 0.4 ppbv h−1. The major contribution is due to the reactions involving NOx (LN).
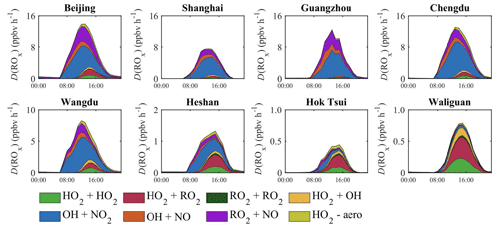
Figure 6Diurnal variation of the photochemical destruction rate of ROx (D(ROx), ppbv h−1) at eight sites in China for July 2018. The contributions to the destruction rate are the following. LH accounts for the following reactions: HO2+ HO2, HO2+ RO2, RO2+ RO2, and OH + HO2. LN accounts for OH + NO2 and RO2+ NO. represents the uptake of HO2 by particles.
The experimental study of Whalley et al. (2021) in Beijing during the summer of 2018 provides for D(ROx) a maximum daytime value of 7 ppbv h−1 with the following contributions: 4, 1.3, and 1 ppbv h−1 for the NO2+ OH, NO + OH, and RO2+ OH reactions, respectively. Our simulated value matches well the reported experimental data, and the corresponding values in July are 5, 0.8, and 1.2 ppbv h−1, respectively. Yang et al. (2021) report diurnal variations in D(ROx) as derived from their observation in Chengdu during the autumn of 2018. The peak value of this quantity is about 7 ppbv h−1, which is lower than our calculated value of 12.5 ppbv h−1 in July. The higher level in our study is due to the overestimated concentration of summertime NO2 in Chengdu (Fig. S2). This overestimation also leads to a higher contribution of the NO2+ OH reaction by 55 % in our study than the reported 35 % in the literature. The calculated values of D(ROx) depend on the concentration values of the NOx and HOx radicals as provided by the model with the related uncertainties. The model overestimation of NO2 reported in Sect. 3.3 (Fig. S2) may lead to a quantitative error in the relative contributions of the different radicals to D(ROx) at another city site (Guangzhou).
4.2 The budget of odd oxygen
The production rate of odd oxygen (P(Ox)) with its two contributions (the reaction of NO with hydrogenated and organic peroxy radicals (HO2 and RO2) shown in Eq. 3) is shown in Fig. 7 for January and July 2018. In the North China Plain and other urbanized areas, the production rate is on the order of 4–6 ppbv h−1 during winter (January), while in the rural areas of southern China, it is larger than 20 ppbv h−1 during summer (July) and 6–10 ppbv h−1 during winter. The value of P(Ox) is very small in the western part of China. The relative contributions of both step-limiting processes to the total P(Ox) are of the same order of magnitude, although the reaction involving the hydrogenated peroxy radicals seems to slightly dominate, particularly outside densely populated areas.
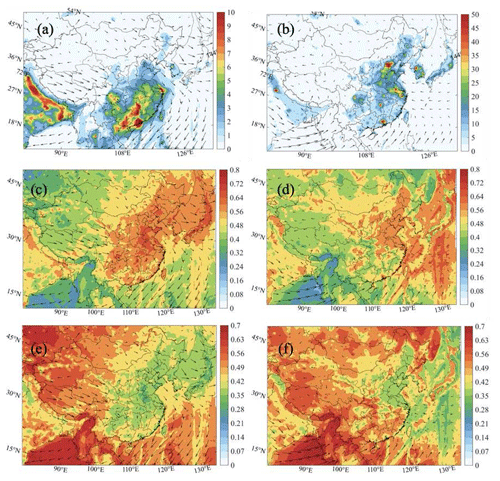
Figure 7Spatial distribution of the production rate of odd oxygen (P(Ox), ppbv h−1) (a, b) and the relative contributions from the reactions between HO2 and NO (c, d) and between RO2 and NO (e, f) in the daytime of January (left column: a, c, e) and July (right column: b, d, f).
The diurnal variations in P(Ox) are depicted in Fig. 8 for specific areas of China in July. This graph highlights the maximum values found during the early afternoon in the urban areas: 115 pphv h−1 in Beijing, 40 pphv h−1 in Shanghai, 110 ppbv h−1 in Guangzhou, and 70 ppbv h−1 in Chengdu. In Beijing, Whalley et al. (2021) derived from their observations in the summer of 2018 a maximum Ox production rate of 100 ppbv h−1. These high values must be contrasted with the considerably lower values found in the rural areas: 1.5 ppbv h−1 at Mount Walinguan and Hok Tsui. Intermediate maximum values are found at the sites located in the vicinities of the large metropolitan areas: 40 ppbv h−1 in Wangdu and only 7 ppbv h−1 in Heshan. The graph also shows the relative contributions of the hydrogen and organic peroxy radicals. Both radicals contribute about equally to the odd oxygen production rate. The contribution of the organic peroxy radical is determined by anthropogenic emissions of hydrocarbons in the cities and by biogenic hydrocarbons in the rural areas. A similar representation of the factors contributing to the formation of Ox during winter is shown in Fig. S17.
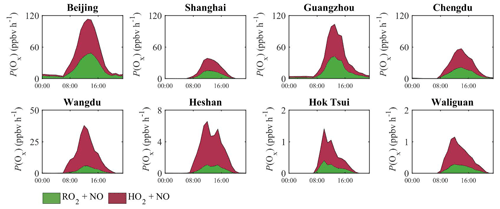
Figure 8Diurnal variation of the Ox production rate (P(Ox), ppbv h−1) in different regions of China for July 2018.
Finally, a quantitative estimate of Eq. (4) is provided in Fig. 9. In the eastern regions of China, the largest contribution to the diurnal mean value of D(Ox) is due to the reaction between NO2 and OH, particularly in winter. This chemical path remains, however, the dominant loss channel during summer in the polluted northern plain between Shanghai and Beijing. In the urbanized area, the reaction between H2O and O(1D) also plays a relatively considerable role in the value of D(Ox) in summer. The relative contribution of the ozonolysis reaction with alkene to the value of D(Ox) is displayed in southern China, which is associated with the high level of alkene in this area. In the rural areas, the highest contribution is from the reaction between H2O and O(1D) in summer, followed by the reaction between HO2 and O3.
The presence of aerosols in the atmosphere affects the abundance of atmospheric oxidants primarily through two different processes: (1) changes in the heterogeneous reaction rates associated with the uptake of several species by the particles (Tan et al., 2020, 2022) and (2) changes in the photolysis rate associated with enhanced extinction of solar light (Tie et al., 2001, 2005; Xing et al., 2017; Tan et al., 2022). Here we assess the relative importance of these two different mechanisms and derive the combined effect on the concentration of surface O3.
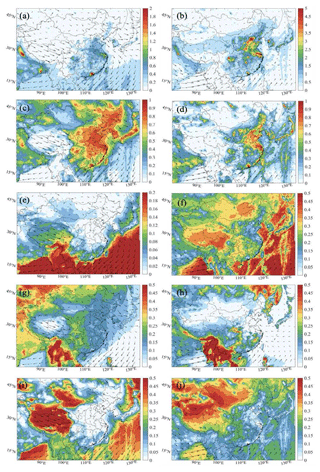
Figure 9Spatial distribution of the destruction rate of odd oxygen (a, b) (D(Ox), ppbv h−1) (the Het-All case) and the relative contributions from the reactions of OH with NO2 (c, d), O(1D) with H2O (e, f), alkene with O3 (g, h), and HO2 with O3 (i, j) in the daytime of January (left column: a, c, e, g, i) and July (right column: b, d, f, h, j).
5.1 Effects due to heterogeneous reactions
Figure S18 summarizes the response of surface NO, NO2, OH, and HO2 concentrations to the introduction of the added heterogeneous chemical reactions (R28–R31 in Table 1) in the model. The concentration of NOx species decreases due to the enhanced conversion of NOx into HNO3. In the eastern plain of China, we derive reductions of up to 9 ppbv for NO2 and 3 ppbv for NO in winter, with summertime decreases of 6 ppbv for NO2 and 2 ppbv for NO. At the same time, the concentration of HOx increases due to the enhanced formation of HONO, which is a source of HOx in the presence of sunlight. This process overrides the expected reduction in HO2 due to its uptake by the aerosol. We find increases of up to 0.15 pptv for OH and 5 pptv for HO2 in winter and 0.3 pptv for OH and 8 pptv for HO2 in summer.
We now examine how the uptake of HO2, N2O5, and NO2 on the surfaces of particles modifies the surface concentration of near-ground O3 (Fig. 10). As shown by Fig. 10a, the uptake of HO2 onto aerosols in January leads to a reduction in the surface concentration of ozone of about 3–4 ppbv, with a large decrease concentrated in the Sichuan Basin and central China. In July (Fig. 10b), the highest ozone changes are found in the North China Plain, especially in the vicinity of Beijing (about 3 ppbv). The high spots of aerosol effects of the HO2 uptake on ozone are associated with the spatial distribution of the aerosol surface area density. In winter (Fig. S12), high values of aerosol surface area density are derived in the Sichuan Basin and central China, while in summer high values are calculated in Beijing and the surrounding areas. The high sensitivity of the HO2 uptake on particles to the aerosol geometric parameters was highlighted by Song et al. (2020). Finally, we assess how the assumption made about the product of the HO2 uptake influences our model results. Figure S21 in the Supplement shows the differences in the calculated near-ground mixing ratios of OH, HO2, H2O2, and ozone when the heterogenous conversion of HO2 is assumed to produce hydrogen peroxide rather than water molecules.
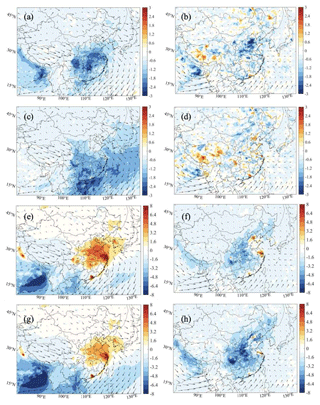
Figure 10Spatial distribution of the response of the monthly average surface O3 concentration (ppbv) to the aerosol uptake by HO2 (a, b; Het-All minus No-HetHO2-Aero), N2O5 (c, d; Het-All minus No-HetN2O5-Aero), and NO2 (e, f; Het-All minus No-HetNO2-Aero) and to the uptake by all these processes (g, h; Het-All minus No-Het-Aero). The results are shown for the daytime of January (left column: a, c, e, g) and July (right column: b, d, f, h) of 2018.
The response of ozone to the uptake of N2O5 by aerosols is negative during winter when the competing photochemical conversion of NOx to HNO3 by the OH radical is very slow. The heterogeneous conversion of N2O5 to HNO3 tends to reduce ozone by up to 3–4 ppbv in southern China during winter (Fig. 10c), with limited effects in the summertime (Fig. 10d).
The uptake of NO2 by aerosols tends to increase the wintertime ozone concentration by 8–9 ppbv in eastern China and in large urban areas of southern China (Fig. 10e) since the photolysis of HONO (formed from the heterogeneous NO2 conversion) leads to enhanced concentrations of NO and OH. As the simulated value of wintertime HO2 is low (below 0.5 pptv) in large parts of China, the production of HOx, from the photolysis of HONO, dominantly controls the value of P(ROx) (Fig. S14) and the formation of O3 in this season. In summer (Fig. 10f), the concentration of ozone is reduced by 3–6 ppbv in the NOx-sensitive rural areas of eastern and central China but is enhanced by 6–7 ppbv in VOC-sensitive urban areas. During this season, the high value of the HO2 density weakens the contribution of the HOx produced by the HONO photolysis. However, the lower level of summertime NOx strengthens the effect of the NO2 loss resulting from the NO2 uptake on particles.
The effect on the near-surface ozone of the heterogeneous conversion of NO3 by aerosols, also considered in the present model study (not shown), has been found to be very small.
Figure 10g and h show the change in ozone resulting from all four heterogeneous processes on aerosol surfaces. When combining the effects of all the HO2, NO2, NO3, and N2O5 heterogeneous reactions, we derive an ozone increase of 6–8 ppbv in winter and a decrease of 6–8 ppbv in summer. However, ozone increases up to 8 ppbv in the VOC-limited metropolitan areas of Beijing, Shanghai, Guangzhou, and Chengdu. Comparison of Fig. 10e, f with Fig. 10g, h, respectively, suggests that the heterogeneous loss of NO2 on atmospheric particles discussed above dominates the impact of the studied heterogeneous reactions on surface O3.
The O3 response to the uptake of HO2 and NO2 is complex. The HO2+ O3 reaction provides a direct destruction mechanism for ozone, and the heterogeneous uptake of HO2 contributes, therefore, to ozone enhancement. At the same time, the HO2 uptake reduces the ozone production resulting from the reaction between HO2 and NO, a photochemical process that is most efficient during summertime. The conversion of NO2 to HNO3 tends to reduce the O3 formation in NOx-limited areas due to the loss of NO2 by particles. However, in VOC-limited areas, the loss of NO2 leads to an increase in the O3 concentration. Moreover, the photolysis of HONO, which results from NO2 uptake, produces NO and OH, which further affects the formation of O3.
Our model simulation in July suggests that the presence of aerosol leads to a decrease in O3 in NOx-limited areas and an increase in O3 in VOC-limited areas. In other words, the continuous reduction in aerosol emissions observed in the past years should have led to an increased ozone concentration in NOx-limited areas and a reduced ozone concentration in VOC-limited areas. The O3 decrease in VOC-limited areas is the result of two opposite effects: the ozone decrease due to reduced NO2 uptake (increased NOx densities and enhanced ozone titration) and the ozone increase from reduced HO2 uptake (increased HO2 concentration and an enhanced rate of the HO2+ NO reaction). The importance of HO2 uptake by aerosols for ozone formation has been highlighted by several modeling studies (K. Li et al., 2019a; Liu and Wang, 2020; Ivatt et al., 2022). However, recent studies based on field measurements (Tan et al., 2020, 2022; Dyson et al., 2023; Yang et al., 2021) made in the urban and rural areas of northern and southern China (Wangdu, Beijing, Shenzhen, and Chengdu) during the summers of 2014, 2017, 2018, and 2019 highlighted the minor importance of HO2 uptake for radical chemistry and O3 formation and showed the increasing importance for the ozone production of the reduced NO2 uptake by particles. One potential reason for changes in the conclusions of these studies could be the sharp reduction in the emissions of pollutants in China (Zheng et al., 2018), including the reduction in the aerosol load and in the anthropogenic NOx emissions. Another possible explanation is the adoption for the analyses of different values for the uptake coefficients and for the aerosol geometric parameters associated with the heterogeneous reactions affecting NO2 and HO2.
5.2 Effects due to photolysis
The presence of aerosols in the atmosphere tends to enhance the absorption and scattering of incoming solar radiation, with direct impacts on the photolysis rates and hence on the abundance of chemical species. Figure S19 shows a model estimate of the resulting effects on the surface concentrations of NO2, NO, OH, and HO2.
In the month of January, during which the aerosol burden is high and the solar intensity is low, the effect of light reduction by the aerosols through changes in the photolysis rates tends to increase the surface concentration of NOx, especially in the most populated and polluted urban areas (Beijing, Shanghai, and Chengdu), where an increase in the concentration of NO2, typically 0.5 ppbv, is derived. In these urban areas, the concentration of NO is increased by 0.5 ppbv. Reductions in surface OH (about 0.1 pptv) and HO2 concentrations (about 1.5 pptv) are derived, with the largest effect occurring in the southeastern regions of China. The surface O3 decreases by up to 4–5 ppbv (Fig. 11a), with the highest decrease found in the Sichuan Basin. In July, the aerosol burden is lower, while the solar intensity is higher. The effect of light reduction by the aerosols tends to increase the surface concentration of NO2 by 1 ppbv in the North China Plain. In the case of OH and HO2, decreases of 0.05–0.1 and 2–3 pptv are found in the North China Plain. A decrease in O3 by up to 3–4 ppbv is derived in Beijing and the surrounding areas (Fig. 11b).
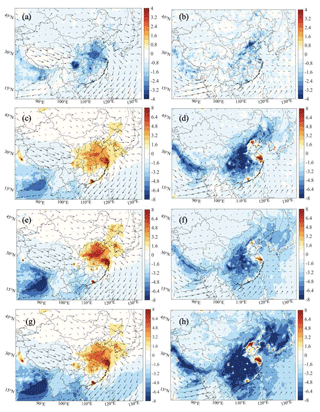
Figure 11Changes in the surface concentrations of daytime O3 (ppbv) resulting from the effect of aerosol-related solar light extinction on photolysis for January (a) and July (b) (Het-All minus No-Phot), the combined effect of photolysis and aerosol uptake for January (c) and July (d) (Het-All relative to No-Het-Aero-Phot), effects of NO2 uptake by aerosols and on the surfaces as well as direct HONO emissions from traffic and gas-phase formation for January (e) and July (f) (Het-All minus No-HONO), and effects from all the NO2, N2O5, NO3, and HO2 uptake processes, photolysis effects, and other HONO sources for January (g) and July (h) (Het-All minus No-Het-HONO-Phot).
5.3 Combined aerosol effects on ozone (uptake effects and photolysis)
When all the heterogeneous processes affecting HO2, N2O5, and NO2 are simultaneously taken into account, we derive for January an increase in the surface ozone concentration that is generally on the order of 6–8 ppbv (Fig. 11c) in the middle of the country. The change in the photolysis rates reduces the ozone concentration by 2–4 ppbv (Fig. 11a) and compensates to some extent for the increase due to aerosol uptake. Such a compensation mechanism was highlighted by Qu et al. (2023) based on their model study performed in the Yangtze River Delta region for different seasons. The combined effect in winter is therefore limited, with ozone values increasing by less than 4 ppbv in most regions of China and by less than 6 ppbv in the urban area.
In July, when combining the photolysis and uptake effects (Fig. S20), we derive a decrease in the concentrations of NO2 (up to 10 pptv) and NO (up to 5 pptv) and an increase in the concentrations of OH (0.05 pptv) and HO2 (up to 10 pptv) in eastern China. The response of ozone (Fig. 11b and d) is characterized by a reduction in the surface concentration of about 10 ppbv (or 15 %) in most NOx-limited regions of China. This value may be slightly overestimated in these regions since our calculated concentrations of aerosol are somewhat higher than the observed values. In the metropolitan areas of Shanghai and Beijing, an increase of about 8 ppbv (or about 12 %) is calculated.
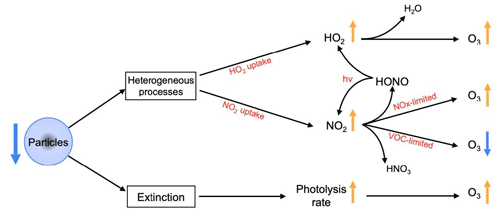
These results highlight that, during summertime, the presence of aerosol particles leads to a decrease in the surface O3 concentrations in NOx-limited areas, whereas it produces an increase in the ozone level in the VOC-limited (metropolitan) areas. Figure 12 presents a schematic view of different pathways that characterize the effects of aerosols on ozone concentrations. Specifically, this figure suggests that the reduction in the aerosol burden that has occurred in China in recent years should have produced an increase in surface ozone concentrations in NOx-limited areas and a decrease in VOC-limited areas. The cause of the ozone increase in NOx-sensitive areas should not be attributed exclusively to a reduction in the HO2 uptake but to a combination of the different uptake processes and a reduction in the light extinction by the aerosols. The ozone decrease in VOC-limited areas should be mainly attributed to the NO2 uptake with a counteracting effect by the HO2 aerosol uptake and by the light extinction by the particles. Our results imply that, if the aerosol loading continues to decrease in the future, the ozone formation will increase so that the air quality measures currently implemented will become less efficient in NOx-limited areas. This does not imply that ozone will necessarily increase in VOC-limited areas. With a further reduction in the NOx emissions, which tends to shift the O3-formation regimes from VOC-limited to NOx-limited (Tan et al., 2022), the O3 response to aerosol effects may gradually reverse in these geographical areas.
5.4 Effects of other HONO sources on ozone
Figure 11e–f show the changes in the surface ozone concentration due to all the sources of HONO considered in the model, including direct emissions from transportation, gas-phase production, and heterogeneous reactions of NO2 uptake on aerosol surfaces and on ground surfaces. In January, the increase in the ozone concentration due to all these different processes reaches 9 ppbv and is more pronounced than in the “aerosol-only” case shown in Fig. 10e. In July, the decrease in the ozone concentration in eastern China (8–10 ppbv) and the increase in the metropolitan regions of Beijing and Shanghai (6–8 ppbv) are about 50 % larger than when only the aerosol uptake of NO2 is taken into account (Fig. 10f).
Figure 11g–h also show the changes in the surface ozone concentrations when all the heterogeneous reactions involving HO2, NO2, NO3, and N2O5 and all the sources of HONO are included in the model calculation. These two panels (g and h) must be compared with Fig. 11c and d. With the additional formation processes of HONO, surface ozone is increased by about 6–8 ppbv in southeastern China during winter. For summer conditions, surface ozone concentration is reduced by up to 10 ppbv in the eastern and southern parts of China but is increased by about 6–8 ppbv in the two major metropolitan centers.
6.1 OH reactivity
The model results presented above allow us to quantify the different factors that characterize the oxidizing capacity of the atmosphere in China. We first analyze the geographical distribution of the OH reactivity (Eqs. 8a and 8b) resulting from the reaction of this radical with VOCs and CO (denoted as VOCR, Fig. 13a–b) as well as NOx (denoted as NO, Fig. 13c–d). These quantities, and particularly the VOCR NO ratio (Fig. 13e–f), can be viewed as a proxy representing the competition between radical production and destruction (Kirchner et al., 2001).
During winter, the calculated value of the daytime-averaged VOCR ranges from typically 2 s−1, mostly in rural areas, to 10 s−1 in the North China Plain between the urban areas of Shanghai and Beijing as well as in the area of Chengdu. The high value of the calculated VOCR in the urbanized areas is consistent with high values in the spatial distribution of wintertime VOCs, such as ethene (Fig. S5), ethane (Fig. S5), and HCHO (Fig. S4). The values derived for the daytime-averaged NO are on the order of 10 s−1 in the North China Plain and most metropolitan areas of the country. Values are close to 1 s−1 in the rural areas. The VOCR NO ratio is on the order of 2 in most regions of China, except in the polluted areas, where values close to 0.6 to 1 are derived.
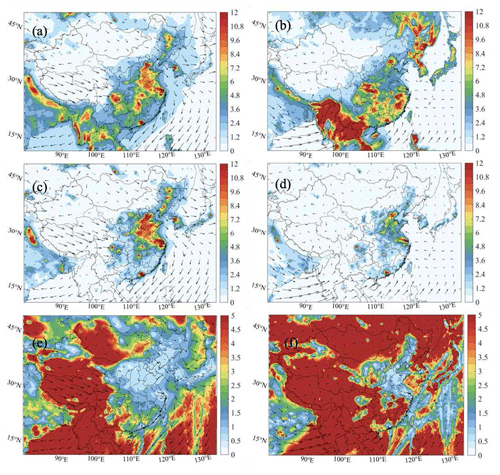
Figure 13Spatial distribution of the reactivities of VOCs (VOCR) (s−1) and NOx (NO; c, d) (s−1) and the VOCR-to-NO ratio (e, f) (the Het-All case) for daytime conditions in January (left column: a, c, e) and July (right column: b, d, f).
During summer, the daytime-averaged VOCR parameter reaches values close to or higher than 10 s−1 in southern China. This distribution of these high values is consistent with the spatial distribution of isoprene (Fig. S5) and HCHO (Fig. S4). The values of NO are smaller than in wintertime, with values generally close to 5 s−1 in the North China Plain and approaching 10 s−1 inside the cities of Beijing, Shanghai, Guangzhou, and Chengdu. The VOCR NO ratio is larger than 2 in the entire spatial domain, except in a small polluted area of the North China Plain and in the urban areas of Guangzhou and Shanghai, where it is close to 1. Figure S21 shows the diurnal variation of the simulated value of the VOCR-to-NO ratio at different sites in January and July 2018. The daytime values range from 0.5 to 1.8 at urban sites in both months, with the highest daytime value shown at the Wangdu site in July (by a value of 5).
The diurnal variations of the OH reactivities due to different organic compounds, CO, and nitrogen dioxide in January and July are shown in Fig. 14. These calculated values need to be compared with the data provided by the observations. At the city sites, for example, Whalley et al. (2021) reported diurnal variations of the OH reactivity in Beijing during the summer of 2018, with values of 25–35 s−1 to be compared with our model values of 23–42 s−1 in July. Based on measurements, the contribution to the OH reactivity of NOx reactions is 40 %–50 %, and that of VOC reactions is 40 %–50 %. The corresponding values derived in our model study in July are 50 % and 45 %, respectively. In Shanghai during summertime, Zhu et al. (2021) derived values of 10–25 s−1, where the contribution of the reaction of OH with NOx is 33 %, with CO 26 %, with OVOCs 18 %, and with alkenes 15 %. The reactivity value derived by our model is 10–17 s−1, with the highest contribution from the reaction of OH with NOx (50 %–60 %). The values measured by Tan et al. (2018) in Chengdu (September 2016) are in the range of 15–30 s−1 and are to be compared with our July model values of 12–32 s−1. During the campaign that took place in Shenzhen in the autumn of 2018, Yang et al. (2022) derived a total OH reactivity value that varied between 10 and 25 s−1, which is relatively lower than our calculated value by 20–45 s−1 in Guangzhou in summer.
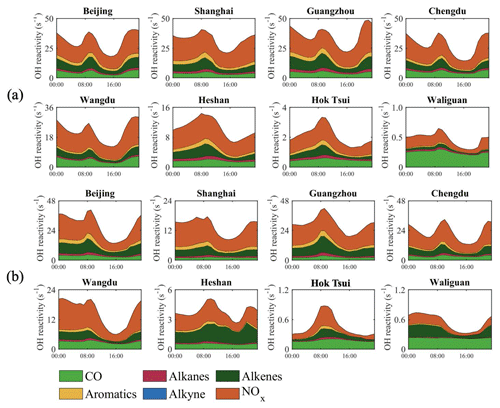
Figure 14Diurnal variation of different contributions to the OH reactivity (s−1) in cities and at remote sites. The values associated with alkenes include the contributions of biogenic isoprene and terpenes. The two upper rows refer to January (a) and the two lower rows to July (b).
Several other attempts have been made to derive the OH reactivity from in situ observations at rural sites. At Wangdu during summertime, Tan et al. (2017) derived a reactivity value of 12–23 s−1, and our model study provides a value of 8–22 s−1. Tan et al. (2019) refer to the campaign conducted at the Heshan site in the autumn of 2014, where derived experimentally mean daytime OH reactivities that range from 20 to 40 s−1 with the contributions with CO, NMHCs, and NOx are 10 % (2–4 s−1), 20 % (4–8 s−1), and 14 % (3–6 s−1), respectively. The values of VOCR and NO in our model account for approximately 1 to 5 s−1 and 2 to 5 s−1, respectively. The underestimation of the HONO concentration in our model (Table S5) contributes to the underestimation of the calculated value of the OH radical and the OH reactivity.
Generally, in winter (Fig. 14a), the dominant contribution to OH reactivity at the urban and rural sites is through the reaction of OH and NOx (40 %–60 %), while at a remote site (Waliguan) it is from the reaction between OH and CO (80 %). In summer (Fig. 14b), the contribution of NOx to OH reactivity is still high at the urban and rural sites (40 %–70 %), with one exception at the Heshan site. At this site, the largest reactivity of OH results from the reaction with alkene (40 %–50 %), which is associated with the relatively low value of NOx (Fig. S1d) and the high value of isoprene (Fig. S5) at this site.
We also show in Fig. 15 three other indicators; these describe the catalytic cycling of NOx leading to ozone formation until the chain reaction is interrupted: the ChL (defined by Eq. 9), the OPE (defined by Eq. 11), and the AOC (defined by Eq. 15).
6.2 ChL
The value of the daytime-averaged ChL, which, according to our definition, increases with the atmospheric concentration of ROx radicals and NO, is on the order of three to five cycles in remote areas. In January (Fig. 15a), the ChL reaches values as high as 8 to 10 cycles in the southern area of China. The ChL values are low in northern and western China, where the NO concentrations are low during winter. In July (Fig. 15b), the highest values of the ChL (about 10 cycles) are found only in the metropolitan areas, where the HOx concentrations are high. Since this parameter can be viewed as the ratio between the ozone and ROx production rates (see Eq. 11), the polluted areas tend to favor ozone production for a given value of the ROx formation rate. Examples of the diurnal variation of the chain length are provided in Fig. S22 in the Supplement.
A few experimental estimates are available to quantify the value of the chain length: Zhu et al. (2021) derived values of 2–6 for the daytime ChL in Shanghai during the warm season of 2018 to be compared with the values of 4–5 provided by our model (Fig. S23). Yang et al. (2021) derive daytime values of 2–4.5 in Chengdu during summer, while our model provides values close to 4–5. In Guangzhou during summer, W. Wang et al. (2022) derive daytime values of 3–12, in fair agreement with our calculated values of 6–10. This discrepancy in ChL at the city sites can be partially explained by the overestimation in relevant NO2 concentrations.
6.3 OPE
The OPE represents the number of ozone molecules produced by NOx before NOx is further oxidized to form more stable nitrogen reservoirs or is removed from the atmosphere by deposition. The daytime-averaged OPE values are highest (larger than 30) in the southwest of China and are on the order of 25–30 above the Tibetan Plateau (Fig. 15c–d) in both seasons. The OPE values typically range between 3 and 15 in the eastern plain during both months under consideration. We note the similarities suggested by Eq. (14) between the distributions of the OPE and the VOCR NO ratio in the VOC-limited regions of the North China Plain and over the East China Sea, where the effects of ship emissions are visible. Daytime OPE values are usually low at urban sites. More details on the diurnal variation of the OPE are provided in Fig. S24 of the Supplement.
A few experimental data characterizing the OPE are available: Wang et al. (2017) summarize the summertime OPE values derived in China between 2006 and 2015 with values ranging from 2.1 to 20.2, which is comparable with our results that range from 1 to 30.
6.4 AOC
Finally, we show in Fig. 15e–f the spatial distribution of the daytime-averaged value of the AOC in January and July, respectively. In winter, the highest daytime values of the AOC are found in the southern part of China, especially in the Pearl River Delta region (3 × 107 cm−3 s−1). During nighttime (Fig. S25), the AOC values are lower than 0.2 × 107 cm−3 s−1, with the maximum values found at the southern coast of China. These high AOC values are associated with the spatial distribution of wintertime formaldehyde (Fig. S4), isoprene (Fig. S5), and the HOx and NO3 radicals (Fig. S6). In summer, the values of the daytime AOC are highest in the metropolitan urban areas (up to 10 × 107 cm−3 s−1), particularly in the vicinity of Beijing. The nocturnal AOC values are lower than 2 × 107 cm−3 s−1 (Fig. S25), with high spots found in urban areas. The distribution of the summertime AOC has some resemblance to the distribution of nitrogen species, including NO2 (Fig. S1) and HONO (Fig. S4).
Figure 16 shows the diurnal evolution of the AOC and the dominant photochemical processes that contribute to this quantity in different urban and rural areas for January and July, respectively. First, we note that, in January, the noontime value of the AOC does not supersede 6 × 107 cm−3 s−1 in urban areas and 3 × 107 cm−3 s−1 at the rural sites (where the value is lower than 1.5 × 107 cm−3 s−1 in most of the cases). At the remote high-altitude station of Waliguan in western China (remote conditions), the maximum AOC value is lower than 0.2 × 107 cm−3 s−1. In July, as expected, the oxidizing capacity is larger than in winter, with noontime values reaching (15–20) × 107 cm−3 s−1 in metropolitan areas but with limited increases in rural and remote areas. The increasing summertime AOC at the city sites is attributed to the larger value of the AOC contributed by OVOCs and alkene, which is associated with the higher values of summertime OVOCs (Fig. S4) and isoprene (Fig. S6) in urban areas.
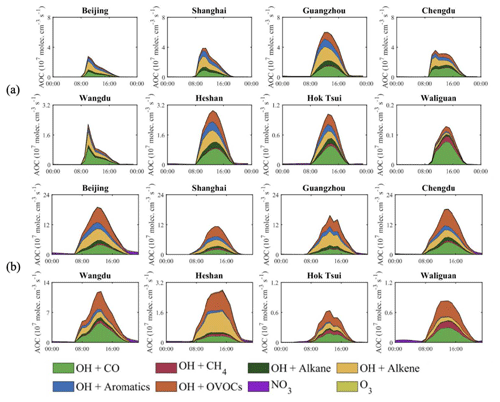
Figure 16Diurnal variation of the AOC (107 molec. cm−3 s−1) in cities and at remote sites. The effect of alkenes includes the contribution of biogenic isoprene and terpenes, while the effects of OVOC include the contribution of formaldehyde. The upper two rows refer to January (a) and the lower two rows to July (b).
Additional information on the relative contributions of different photochemical processes as a function of the time of the day and for two seasons is provided in Fig. 17. During winter, in Beijing during daytime, the major contributions to the AOC are provided by the reaction of OH with alkenes, aromatics, and carbon monoxide. The situation is similar in the other three metropolitan areas under consideration. In Chengdu, however, the relative contribution of CO is larger, as is the case at the rural sites, where the concentration of hydrocarbons is generally low. At night, the largest contributions in Beijing, Shanghai, and Chengdu are provided by the oxidation of hydrocarbons by ozone.
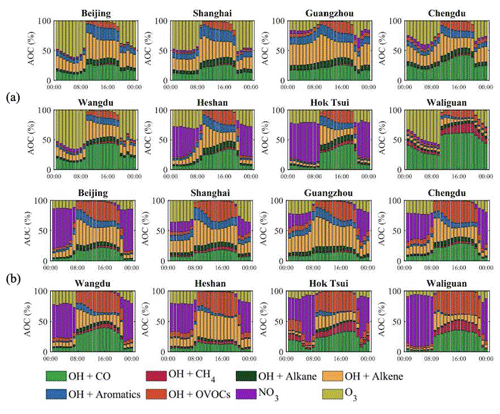
Figure 17Same as Fig. 16 but expressed in relative terms (%) and highlighting the nighttime contribution to the AOC value. The upper two rows refer to January (a) and the lower two rows to July (b).
During summertime, the daytime value of the AOC in the urban regions is determined by the reaction of OH with alkenes and with OVOCs. In remote areas, the dominant contribution is attributed to the reaction of OH with OVOCs and with CO. OVOCs are produced as a result of the oxidation of biogenic hydrocarbons such as isoprene, primarily but not exclusively in rural areas, and by the oxidation of anthropogenic hydrocarbons, mostly in urban and industrialized areas. Thus, any analysis of the processes that determine the value of the AOC, particularly during summertime, must take into account the role played by OVOCs. Li et al. (2022) reported that the OVOCs have a significant impact on the atmospheric oxidative capacity in the Yangtze River Delta region through reactions with OH during daytime and with NO3 at night. Due to the limited number of measurement data available (W. Wang et al., 2022) and the high uncertainties in the emissions of organic species (Li et al., 2023), the contributions of specific OVOCs to the oxidative process are still not clear. More work is needed to obtain a better understanding of the impact of OVOCs on the oxidative processes in China.
In all the regions under consideration, during summertime, a dominant nighttime contribution to the value of the AOC is provided by the oxidation of hydrocarbons by NO3. As the production of NO3 occurs through the reaction of O3 and NO2, the higher summertime O3 concentrations and temperature lead to the larger formation of NO3 than during winter. Wang (2023) highlights the increasingly critical role of NO3-related nighttime oxidative chemistry associated with the positive trend in particulate nitrate abundance and in the formation of O3 and other secondary pollutants. With the reduction in NOx emissions, the importance of NO3 radicals may become more notable.
The model study confirms that, during daytime, more than 90 % of the AOC is due to reactions of chemical species with the OH radical. During nighttime, the oxidation processes are considerably slower and are due principally to the reactions of hydrocarbons with the nitrate radical (NO3) and alkenes with ozone (O3). In urban areas, the dominant daytime contributions to the AOC during summertime are the reactions with carbon monoxide (20 %), alkenes (35 %), aromatics (10 %), and OVOCs (30 %). During winter, the corresponding numbers are 25 % for carbon monoxide, 40 % for alkenes, 15 % for aromatics, and 15 % for OVOCs, respectively. These approximate values vary somewhat from city to city. At night, during summer, the major contributions in urban areas are the oxidation by NO3 (60 % in Beijing, 45 % in Chengdu, and 15 % in Shanghai and Guangzhou) and ozone (20 % in Beijing, 35 % in Shanghai, and 25 % in Chengdu). At the very remote station of Waliguan, the relative daytime contributions to the AOC in summer are 25 % due to CO, 20 % due to methane, 40 % due to OVOCs, and 10 % due to alkenes. The corresponding contributions during winter are 60 % for CO, 20 % for methane, 10 % for OVOCs, and 5 % for alkenes.
These model values can be compared, for example, with values calculated by Zhu et al. (2020) from experimental data obtained in Shanghai. The peak value around noontime in summer is about (5–10) × 107 cm−3 s−1, which is in fair agreement with our estimates. In the wintertime, the values are between (5–8) × 107 cm−3 s−1, i.e., slightly higher than our calculated AOC. Feng et al. (2021) report a maximum value of about 1.7 × 108 cm−3 s−1 for the AOC at urban sites in Beijing during the summertime of 2014. This number is close to our calculated value of the AOC by 1.8 × 108 cm−3 s−1 in July. The peak AOC value of 2.1 × 107 cm−3 s−1 reported by Z. Liu et al. (2021) for the winter of 2018 in Beijing is close to the model value of 3 × 107 cm−3 s−1.
The oxidizing capacity of the atmosphere can be characterized by different parameters, including the production and destruction rates of ozone and other oxidants, the ozone production efficiency, the OH reactivity, and the length of the reaction chain responsible for the formation of ozone and ROx. The values of these parameters depend on whether ozone formation is limited by the availability of NOx or VOCs. They are also affected by the aerosol burden in the atmosphere, specifically by the rate at which heterogeneous chemical reactions take place in the atmosphere. In the present study, we have used a regional chemical transport model with a detailed chemical scheme to quantify these parameters in several chemical environments in China. Such studies should be helpful in determining the factors that are responsible for the documented changes in the oxidation capacity of the atmosphere and hence the mean concentration of surface ozone in different regions of the country.
Our study shows that, during winter, the formation of ozone in most of the eastern China Plain is VOC-limited. The ozone formation in the remote western regions of the country, however, is NOx-limited. In the south, an intermediate situation prevails, except in the Pearl River Delta area, where the formation of ozone is VOC-limited. In summer, ozone formation is NOx-limited in most regions of China, except in the urban areas of Beijing, Shanghai, Guangzhou, and Chengdu.
Our model calculations conducted for the summer season show that the largest contribution to the formation of ROx radicals in rural areas is due to the photolysis of ozone followed by the reaction of the electronically excited oxygen atom with water vapor. The second-largest contribution is provided by the photolysis of formaldehyde. In urban and suburban areas, the formation of ROx starts in the early morning with the photolysis of HONO, followed by the photolysis of HCHO and other OVOCs and finally of ozone. In polluted areas, the contribution of oxygenated VOCs is important and needs to be included in any oxidant budget analysis.
The summertime destruction of ROx radicals in the rural regions is principally due to radical–radical reactions, including HO2+ HO2, HO2+ RO2, and HO2+ OH. In the urban and suburban areas, the main destruction processes are associated with reactions between NO2 and OH and between RO2 and NO. The destruction of radicals associated with the uptake of HO2 on aerosol surfaces plays a limited role.
At all the considered sites, the production rate of ozone is due about equally to the reactions of NO with HO2 and RO2, respectively. The source of RO2 varies according to the region; it is mostly anthropogenic in urban areas and biogenic in remote areas. Values of the ozone production rate are substantially higher in metropolitan areas than in remote areas: the maximum value in the early afternoon reaches 100 ppbv h−1 in Beijing and Shanghai but is less than 2 ppbv h−1 at the rural sites.
Our model simulations suggest that heterogeneous chemistry and the effect of aerosol on light extinction (photolysis) contribute to an increase in the surface ozone concentrations by 4–6 ppbv during wintertime. In summer, the presence of the aerosol burden derived by our model leads to a reduction in surface ozone of up to 8 ppbv in the NOx-limited areas of the central and eastern parts of China. The ozone concentrations, however, are enhanced by about 5–7 ppbv in the VOC-limited regions near Shanghai and Beijing. The reduction in the aerosol burden, resulting from the measures taken by the Chinese authorities, will therefore lead to an increase in the O3 density in the NOx-limited rural areas and affect the efficiency of O3 pollution control. A decrease in the O3 concentration is expected in the VOC-limited areas. However, with the continuous reduction in NOx emissions, the NOx-limited areas tend to geographically expand, and an O3 increase should therefore occur in a broader area.
The daytime-averaged OH reactivity due to NOx varies from less than 1 s−1 in the western part of the country to 10 s−1 in the North China Plain during winter. It is closer to 3 s−1 during summer, except in large urban areas, where it is close to 10 s−1. The reactivity due to VOCs is very small in the western regions of the country but varies from 2 to 10 s−1 in eastern China, with somewhat higher values in winter. The VOCR-to-NO ratio is higher than 5 over the Tibetan Plateau but is less than 1.5 in the eastern regions of the country and even smaller in NOx-rich regions of the most polluted areas.
The number of cycles affecting ROx radicals during the daytime before they undergo a termination process is around three to five in remote areas. In January, it reaches 8 to 10 cycles in the eastern plain and in the southern area of China. The values are low in northern and western China, where the NO concentration is low during winter. In the metropolitan areas during July, about 10 cycles are performed before the radicals are lost.
Finally, our model simulations suggest that the daytime oxidizing capacity is mostly influenced by the reaction of the OH radical with alkenes, carbon monoxide, and oxygenated VOCs and to a lesser extent with aromatics. The relative contribution of the different chemical processes varies with the locations (urban versus rural) and with the seasons (winter versus summer). During nighttime, the largest contributions are due to the oxidation of hydrocarbons by NO3 and ozone.
The results reported in the present study are not exempt from uncertainties associated, for example, with the adopted surface emissions of primary species and the coarse spatial resolution of the model grid. One particularly important uncertainty is associated with the calculation of the VOC concentrations. The emissions of these organic species remain uncertain, and the adopted VOC oxidation mechanisms, partly based on the model of the definition of lumped species, are the sources of errors in the calculated values of the OH reactivity and of the atmospheric oxidation capacity.
With the reduction in NOx emissions observed in China and explicit consideration of nocturnal oxidative chemistry taken into account, the effect of nitrate radicals will become increasingly crucial for the assessment of air quality. With the reduction in the anthropogenic emissions of VOCs in China, the role of natural VOCs with high reactivity, such as isoprene, will become increasingly important regarding oxidative processes, especially in scenarios with increasing temperatures and extreme weather associated with climate change. Future work will focus on the role of emission changes in the photo-oxidative species and parameters. To understand the contribution of photodegradable OVOCs to the oxidative capacity of the atmosphere and to the formation of secondary pollutants, additional studies that include systematic measurements of OVOCs and more accurate time-dependent estimates of emissions will be needed.
The source code of WRF-Chem used in this work is available at https://github.com/wrf-model/WRF (https://doi.org/10.5065/1DFH-6P97, Skamarock et al., 2019, last access: 10 April 2023).
The supplement related to this article is available online at: https://doi.org/10.5194/acp-23-14127-2023-supplement.
JD and GPB designed the structure of the manuscript, performed the numerical experiments, analyzed the results, and wrote the manuscript. JD analyzed the data and created the figures. All the co-authors provided comments and reviewed the manuscript.
At least one of the (co-)authors is a member of the editorial board of Atmospheric Chemistry and Physics. The peer-review process was guided by an independent editor, and the authors also have no other competing interests to declare.
Publisher’s note: Copernicus Publications remains neutral with regard to jurisdictional claims made in the text, published maps, institutional affiliations, or any other geographical representation in this paper. While Copernicus Publications makes every effort to include appropriate place names, the final responsibility lies with the authors.
The present joint Sino-German study was supported by the German Research Foundation (Deutsche Forschungsgemeinschaft, DFG) and the National Science Foundation of China (NSFC) under Air-Changes grant no. 4487-20203. The National Center for Atmospheric Research (NCAR) is sponsored by the US National Science Foundation. We would like to acknowledge the high-performance computing support from NCAR Cheyenne.
This research has been supported by the Deutsche Forschungsgemeinschaft and the National Science Foundation of China (NSFC) (Air-Changes grant no. 4487-20203).
The article processing charges for this open-access publication were covered by the Max Planck Society.
This paper was edited by Frank Keutsch and reviewed by two anonymous referees.
Bertram, T. H. and Thornton, J. A.: Toward a general parameterization of N2O5 reactivity on aqueous particles: the competing effects of particle liquid water, nitrate, and chloride, Atmos. Chem. Phys., 9, 8351–8363, https://doi.org/10.5194/acp-9-8351-2009, 2009.
Brasseur, G. P., Orlando, J. J., and Tyndall, G. S.: Atmospheric chemistry and global change, Oxford University Press, Cambridge, USA, 654 pp., 1999.
Brown, S. S. and Stutz, J.: Nighttime radical observations and chemistry, Chem. Soc. Rev., 41, 6405–6447, https://doi.org/10.1039/C2CS35181A, 2012.
Chin, M., Ginoux, P., Kinne, S., Torres, O., Holben, B. N., Duncan, B. N., Martin, R. V., Logan, J. A., Higurashi, A., and Nakajima, T.: Tropospheric Aerosol Optical Thickness from the GOCART Model and Comparisons with Satellite and Sun Photometer Measurements, J. Atmos. Sci., 59, 461–483, 2002.
Czader, B. H., Rappenglück, B., Percell, P., Byun, D. W., Ngan, F., and Kim, S.: Modeling nitrous acid and its impact on ozone and hydroxyl radical during the Texas Air Quality Study 2006, Atmos. Chem. Phys., 12, 6939–6951, https://doi.org/10.5194/acp-12-6939-2012, 2012.
Dai, J. and Wang, T.: Impact of international shipping emissions on ozone and PM2.5 in East Asia during summer: the important role of HONO and ClNO2, Atmos. Chem. Phys., 21, 8747–8759, https://doi.org/10.5194/acp-21-8747-2021, 2021.
Dai, J., Liu, Y., Wang, P., Fu, X., Xia, M., and Wang, T.: The impact of sea-salt chloride on ozone through heterogeneous reaction with N2O5 in a coastal region of south China, Atmos. Environ., 236, 117604, https://doi.org/10.1016/j.atmosenv.2020.117604, 2020.
Dyson, J. E., Whalley, L. K., Slater, E. J., Woodward-Massey, R., Ye, C., Lee, J. D., Squires, F., Hopkins, J. R., Dunmore, R. E., Shaw, M., Hamilton, J. F., Lewis, A. C., Worrall, S. D., Bacak, A., Mehra, A., Bannan, T. J., Coe, H., Percival, C. J., Ouyang, B., Hewitt, C. N., Jones, R. L., Crilley, L. R., Kramer, L. J., Acton, W. J. F., Bloss, W. J., Saksakulkrai, S., Xu, J., Shi, Z., Harrison, R. M., Kotthaus, S., Grimmond, S., Sun, Y., Xu, W., Yue, S., Wei, L., Fu, P., Wang, X., Arnold, S. R., and Heard, D. E.: Impact of HO2 aerosol uptake on radical levels and O3 production during summertime in Beijing, Atmos. Chem. Phys., 23, 5679–5697, https://doi.org/10.5194/acp-23-5679-2023, 2023.
Elguindi, N., Granier, C., Stavrakou, T., Darras, S., Bauwens, M., Cao, H., Chen, C., Denier van der Gon, H. A. C., Dubovik, O., Fu, T. M., Henze, D. K., Jiang, Z., Keita, S., Kuenen, J. J. P., Kurokawa, J., Liousse, C., Miyazaki, K., Müller, J. F., Qu, Z., Solmon, F., and Zheng, B.: Intercomparison of magnitudes and trends in anthropogenic surface emissions from bottom-up inventories, top-down estimates, and emission scenarios, Earth's Future, 8, e2020EF001520, https://doi.org/10.1029/2020EF001520, 2020.
Elshorbany, Y. F., Kurtenbach, R., Wiesen, P., Lissi, E., Rubio, M., Villena, G., Gramsch, E., Rickard, A. R., Pilling, M. J., and Kleffmann, J.: Oxidation capacity of the city air of Santiago, Chile, Atmos. Chem. Phys., 9, 2257–2273, https://doi.org/10.5194/acp-9-2257-2009, 2009.
Emmons, L. K., Walters, S., Hess, P. G., Lamarque, J.-F., Pfister, G. G., Fillmore, D., Granier, C., Guenther, A., Kinnison, D., Laepple, T., Orlando, J., Tie, X., Tyndall, G., Wiedinmyer, C., Baughcum, S. L., and Kloster, S.: Description and evaluation of the Model for Ozone and Related chemical Tracers, version 4 (MOZART-4), Geosci. Model Dev., 3, 43–67, https://doi.org/10.5194/gmd-3-43-2010, 2010.
Fast, J. D., Gustafson, W. I., Easter, R. C., Zaveri, R. A., Barnard, J. C., Chapman, E. G., Grell, G. A., and Peckham, S. E.: Evolution of ozone, particulates, and aerosol direct radiative forcing in the vicinity of Houston using a fully coupled meteorology-chemistry-aerosol model, J. Geophys. Res., 111, D21305, https://doi.org/10.1029/2005JD006721, 2006.
Feng, T., Zhao, S., Hu, B., Bei, N., Zhang, X., Wu, J., and Li, G.: Assessment of Atmospheric Oxidizing Capacity Over the Beijing-Tianjin-Hebei (BTH) Area, China, J. Geophys. Res.-Atmos., 126, e2020JD033834, https://doi.org/10.1029/2020JD033834, 2021.
Fu, X., Wang, T., Zhang, L., Li, Q., Wang, Z., Xia, M., Yun, H., Wang, W., Yu, C., Yue, D., Zhou, Y., Zheng, J., and Han, R.: The significant contribution of HONO to secondary pollutants during a severe winter pollution event in southern China, Atmos. Chem. Phys., 19, 1–14, https://doi.org/10.5194/acp-19-1-2019, 2019.
Gaubert, B., Emmons, L. K., Raeder, K., Tilmes, S., Miyazaki, K., Arellano Jr., A. F., Elguindi, N., Granier, C., Tang, W., Barré, J., Worden, H. M., Buchholz, R. R., Edwards, D. P., Franke, P., Anderson, J. L., Saunois, M., Schroeder, J., Woo, J.-H., Simpson, I. J., Blake, D. R., Meinardi, S., Wennberg, P. O., Crounse, J., Teng, A., Kim, M., Dickerson, R. R., He, H., Ren, X., Pusede, S. E., and Diskin, G. S.: Correcting model biases of CO in East Asia: impact on oxidant distributions during KORUS-AQ, Atmos. Chem. Phys., 20, 14617–14647, https://doi.org/10.5194/acp-20-14617-2020, 2020.
Geyer, A., Alicke, B., Konrad, S., Schmitz, T., Stutz, J., and Platt, U.: Chemistry and oxidation capacity of the nitrate radical in the continental boundary layer near Berlin, J. Geophys. Res., 106, 8013–8025, https://doi.org/10.1029/2000JD900681, 2001.
Granier, C., Darras, S., Denier van der Gon, H. A. C., Doubalova, J., Elguindi, N., Galle, B., Gauss, M., Guevara, M., Jalkanen, J.-P., Kuenen, J., Liousse, C., Quack, B., Simpson, D., and Sindelarova, K.: The Copernicus Atmosphere Monitoring Service global and regional emissions (April 2019 version), Copernicus Atmosphere Monitoring Service (CAMS) report, 2019, Copernicus Atmosphere Monitoring Service (CAMS), Reading, UK, https://doi.org/10.24380/d0bn-kx16, 2019.
Guenther, A. B., Jiang, X., Heald, C. L., Sakulyanontvittaya, T., Duhl, T., Emmons, L. K., and Wang, X.: The Model of Emissions of Gases and Aerosols from Nature version 2.1 (MEGAN2.1): An extended and updated framework for modeling biogenic emissions, Geosci. Model Dev., 5, 1471–1492, https://doi.org/10.5194/gmd-5-1471-2012, 2012.
Ivatt, P. D., Evans, M. J., and Lewis, A. C.: Suppression of surface ozone by an aerosol-inhibited photochemical ozone regime, Nat. Geosci., 15, 536–540, https://doi.org/10.1038/s41561-022-00972-9, 2022
Jacob, D. J.: Heterogeneous chemistry and tropospheric ozone, Atmos. Environ., 34, 2131–2159, https://doi.org/10.1016/S1352-2310(99)00462-8, 2000.
Kirchner, F., Jeanneret, F., Clappier, A., Krüger, B., van den Bergh, H., and Calpini, B.: Total VOC reactivity in the planetary boundary layer: 2. A new indicator for determining the sensitivity of the ozone production to VOC and NOx, J. Geophys. Res., 106, 3095–3110, https://doi.org/10.1029/2000JD900603, 2001.
Lakey, P. S. J., George, I. J., Whalley, L. K., Baeza-Romero, M. T., and Heard, D. E.: Measurements of the HO2 uptake coefficients onto single component organic aerosols, Environ. Sci. Technol., 49, 4878–4885, https://doi.org/10.1021/acs.est.5b00948, 2015.
Levy, H.: Normal atmosphere: large radical and formaldehyde concentrations predicted, Science, 173, 141–143, 1971.
Li, D. D., Xue, L. K., Wen, L., Wang, X. F., Chen, T. S., Mellouki, A., Chen, J. M., and Wang, W. X.: Characteristics and source of nitrous acid in an urban atmosphere in northern China: Results from 1-yr continuous observations, Atmos. Environ., 182, 296–306, 2018.
Li, G., Lei, W., Zavala, M., Volkamer, R., Dusanter, S., Stevens, P., and Molina, L. T.: Impacts of HONO sources on the photochemistry in Mexico City during the MCMA-2006/MILAGO Campaign, Atmos. Chem. Phys., 10, 6551–6567, https://doi.org/10.5194/acp-10-6551-2010, 2010.
Li, K., Jacob, D. J., Liao, H., Shen, L., Zhang, Q., and Bates, K. H.: Anthropogenic drivers of 2013−2017 trends in summer surface ozone in China, P. Natl. Acad. Sci. USA, 116, 422–427, https://doi.org/10.1073/pnas.1812168116, 2019a.
Li, K., Jacob, D. J., Liao, H., Zhu, J., Shah, V., Shen, L., Bates, K. H., Zhang, Q., and Zhai, S.: A two-pollutant strategy for improving ozone and particulate air quality in China, Nat. Geosci., 12, 906–910, https://doi.org/10.1038/s41561-019-0464-x, 2019b.
Li, J., Li, X. L., Wang, X., Wang, H., Jing, S., Ying, Q., Qin, M., and Hu, J.: Fate of oxygenated volatile organic compounds in the Yangtze River Delta Region: source contributions and impacts on the atmospheric oxidation capacity, Environ. Sci. Technol., 56, 11212–11224, https://doi.org/10.1021/acs.est.2c00038, 2022.
Li, Z., Xue, L., Yang, X., Zha, Q., Tham, Y. J., Yan, C., Louie, P. K. K., Luk, C. W. Y., Wang, T., and Wang, W.: Oxidizing capacity of the rural atmosphere in Hong Kong, Southern China, Sci. Total Environ., 612, 1114–1122, https://doi.org/10.1016/j.scitotenv.2017.08.310, 2018.
Liu, P., Xue, C., Ye, C., Liu, C., Zhang, C., Wang, J., and Mu, Y.: The Lack of HONO Measurement May Affect the Accurate Diagnosis of Ozone Production Sensitivity, ACS Environ. AU, 1, 18–23, https://doi.org/10.1021/acsenvironau.2c00048, 2022.
Liu, T., Hong, Y., Li, M., Xu, L., Chen, J., Bian, Y., Yang, C., Dan, Y., Zhang, Y., Xue, L., Zhao, M., Huang, Z., and Wang, H.: Atmospheric oxidation capacity and ozone pollution mechanism in a coastal city of southeastern China: analysis of a typical photochemical episode by an observation-based model, Atmos. Chem. Phys., 22, 2173–2190, https://doi.org/10.5194/acp-22-2173-2022, 2022.
Liu, Y. and Wang, T.: Worsening urban ozone pollution in China from 2013 to 2017 – Part 2: The effects of emission changes and implications for multi-pollutant control, Atmos. Chem. Phys., 20, 6323–6337, https://doi.org/10.5194/acp-20-6323-2020, 2020.
Liu, Y., Lu, K., Li, X., Dong, H., Tan, Z., Wang, H., Zou, Q., Wu, Y., Hu, M., Min, K.-E., Kecorius, S., Wiendensohler, A., and Zhang, Y.: A comprehensive model test of the HONO sources constrained to field measurements at rural North China Plain, Environ. Sci., Technol. 53, 3517–3525, https://doi.org/10.1021/acs.est.8b06367, 2019.
Liu, Z., Wang, Y., Hu, B., Lu, K., Tang, G., Ji, D., and Zhang, Y.: Elucidating the quantitative characterization of atmospheric oxidation capacity in Beijing, China, Sci. Total Environ., 771, 145306, https://doi.org/10.1016/j.scitotenv.2021.145306, 2021.
Lu, X., Hong, J. Y., Zhang, L., Cooper, O. R., Schultz, M. G., Xu, X. B., Wang, T., Gao, M., Zhao, Y. H., and Zhang, Y. H.: Severe surface ozone pollution in China: A global perspective, Environ. Sci. Technol. Lett., 5, 487–494, https://doi.org/10.1021/acs.estlett.8b00366, 2018.
Mao, J., Ren, X., Chen, S., Brune, W. H., Chen, Z., Martinez, M., and Leuchner, M.: Atmospheric oxidation capacity in the summer of Houston 2006: Comparison with summer measurements in other metropolitan studies, Atmos. Environ., 44, 4107–4115, https://doi.org/10.1016/j.atmosenv.2009.01.013, 2010.
Mao, J., Fan, S., Travis, K. R., and Horowitz, L. W.: Soluble Fe in aerosols sustained by gaseous HO2 uptake, Environ. Sci. Technol. Lett., 4, 98–104, https://doi.org/10.1021/acs.estlett.7b00017, 2017.
Martin, R. V., Jacob, D. J., Yantosca, R. M., Chin, M., and Ginoux, P.: Global and regional decreases in tropospheric oxidants from photochemical effects of aerosols, J. Geophys. Res., 108, 4097, https://doi.org/10.1029/2002JD002622, 2003.
Martinez, M., Harder, H., Kovacs, T. A., Simpas, J. B., Bassis, J., Lesher, R., and Zamora, R. J.: OH and HO2 concentrations, sources, and loss rates during the Southern Oxidants Study in Nashville, Tennessee, summer 1999, J. Geophys. Res.-Atmos., 108, 4617, https://doi.org/10.1029/2003JD003551, 2003.
Mozurkewich, M., McMurry, P. H., Gupta, A., and Calvert, J. G.: Mass accommodation coefficient of HO2 on aqueous particles, J. Geophys. Res., 92, 4163–4170, https://doi.org/10.1029/JD092iD04p04163, 1987.
Ng, N. L., Brown, S. S., Archibald, A. T., Atlas, E., Cohen, R. C., Crowley, J. N., Day, D. A., Donahue, N. M., Fry, J. L., Fuchs, H., Griffin, R. J., Guzman, M. I., Herrmann, H., Hodzic, A., Iinuma, Y., Jimenez, J. L., Kiendler-Scharr, A., Lee, B. H., Luecken, D. J., Mao, J., McLaren, R., Mutzel, A., Osthoff, H. D., Ouyang, B., Picquet-Varrault, B., Platt, U., Pye, H. O. T., Rudich, Y., Schwantes, R. H., Shiraiwa, M., Stutz, J., Thornton, J. A., Tilgner, A., Williams, B. J., and Zaveri, R. A.: Nitrate radicals and biogenic volatile organic compounds: oxidation, mechanisms, and organic aerosol, Atmos. Chem. Phys., 17, 2103–2162, https://doi.org/10.5194/acp-17-2103-2017, 2017.
Qu, Y., Wang, T., Yuan, C., Wu, H., Gao, L., Huang, C., and Xie, M.: The underlying mechanisms of PM2.5 and O3 synergistic pollution in East China: Photochemical and heterogeneous interactions, Sci. Total Environ., 873, 162434, https://doi.org/10.1016/j.scitotenv.2023.162434, 2023.
Prinn, R. G.: The cleansing capacity of the atmosphere, Annu. Rev. Environ. Resour., 28, 29–57, https://https://doi.org/10.1146/annurev.energy.28.011503.163425, 2003.
Schwartz, S. E.: Mass-transport considerations pertinent to aqueous phase reactions of gases in liquid water clouds, in: Chemistry of Multiphase Atmospheric System, NATO ASI Ser. Ser. G., Vol. 6, edited by: Jaeschke, W., 415–471, Springer, New York. https://doi.org/10.1007/978-3-642-70627-1_16, 1986.
Skamarock, W. C., Klemp, J. B., Dudhia, J., Gill, D. O., Liu, Z., Berner, J., Wang, W., Powers, J. G., Duda, M. G., Barker, D. M., and Huang, X.-Y.: A Description of the Advanced Research WRF Model Version 4, Tech. rep., UCAR/NCAR [code and data set], https://doi.org/10.5065/1DFH-6P97, 2019.
Song, H., Chen, X., Lu, K., Zou, Q., Tan, Z., Fuchs, H., Wiedensohler, A., Moon, D. R., Heard, D. E., Baeza-Romero, M.-T., Zheng, M., Wahner, A., Kiendler-Scharr, A., and Zhang, Y.: Influence of aerosol copper on HO2 uptake: a novel parameterized equation, Atmos. Chem. Phys., 20, 15835–15850, https://doi.org/10.5194/acp-20-15835-2020, 2020.
Song, H., Lu, K., Dong, H., Tan, Z., Chen, S., Zeng, L., and Zhang, Y.: Reduced aerosol uptake of hydroperoxyl radical may increase the sensitivity of ozone production to volatile organic compounds, Environ. Sci. Technol. Lett., 9, 22–29, https://doi.org/10.1021/acs.estlett.1c00893, 2021.
Tan, Z., Fuchs, H., Lu, K., Hofzumahaus, A., Bohn, B., Broch, S., Dong, H., Gomm, S., Häseler, R., He, L., Holland, F., Li, X., Liu, Y., Lu, S., Rohrer, F., Shao, M., Wang, B., Wang, M., Wu, Y., Zeng, L., Zhang, Y., Wahner, A., and Zhang, Y.: Radical chemistry at a rural site (Wangdu) in the North China Plain: observation and model calculations of OH, HO2 and RO2 radicals, Atmos. Chem. Phys., 17, 663–690, https://doi.org/10.5194/acp-17-663-2017, 2017.
Tan, Z., Lu, K., Jiang, M., Su, R., Dong, H., Zeng, L., and Zhang, Y.: Exploring ozone pollution in Chengdu, southwestern China: A case study from radical chemistry to O3-VOC-NOx sensitivity, Sci. Total Environ., 636, 775–786, https://doi.org/10.1016/j.scitotenv.2018.04.286, 2018.
Tan, Z., Lu, K., Hofzumahaus, A., Fuchs, H., Bohn, B., Holland, F., Liu, Y., Rohrer, F., Shao, M., Sun, K., Wu, Y., Zeng, L., Zhang, Y., Zou, Q., Kiendler-Scharr, A., Wahner, A., and Zhang, Y.: Experimental budgets of OH, HO2, and RO2 radicals and implications for ozone formation in the Pearl River Delta in China 2014, Atmos. Chem. Phys., 19, 7129–7150, https://doi.org/10.5194/acp-19-7129-2019, 2019.
Tan, Z., Hofzumahaus, A., Lu, K., Brown, S. S., Holland, F., Huey, L. G., Kiendler-Scharr, A., Li, X., Liu, X., and Ma, N.: No evidence for a significant impact of heterogeneous chemistry on radical concentrations in the northern China Plain in summer 2014, Environ. Sci. Technol., 54, 5973–5979, https://doi.org/10.1021/acs.est.0c00525, 2020.
Tan, Z., Lu, K., Ma, X., Chen, S., He, L., Huang, X., and Zhang, Y.: Multiple Impacts of Aerosols on O3 Production Are Largely Compensated: A Case Study Shenzhen, China, Environ. Sci. Technol., 56, 17569–17580, https://doi.org/10.1021/acs.est.2c06217, 2022.
Tie, X., Brasseur, G., Emmons, L., Horowitz, L., and Kinnison, D.: Effects of aerosols on tropospheric oxidants: A global model study, J. Geophys. Res., 106, 2931–2964, https://doi.org/10.1029/2001JD900206, 2001.
Tie, X., Madronich, S., Walters, S., Edwards, D. P., Ginoux, P., Mahowald, N., Zhang, R. Y., Lou, C., and Brasseur, G.: Assessment of the global impact of aerosols on tropospheric oxidants, J. Geophys. Res., 110, D03204, https://doi.org/10.1029/2004JD005359, 2005.
Tie, X., Brasseur, G., and Ying, Z.: Impact of model resolution on chemical ozone formation in Mexico City: application of the WRF-Chem model, Atmos. Chem. Phys., 10, 8983–8995, https://doi.org/10.5194/acp-10-8983-2010, 2010.
Thompson, A. M.: The oxidizing capacity of the earth's atmosphere: Probable past and future changes, Science, 256, 1157–1165, https://doi.org/10.1126/science.256.5060.1157, 1992.
Thornton, J. A., Kercher, J. P., Riedel, T. P., Wagner, N. L., Cozic, J., Holloway, J. S., Dube, W. P., Wolfe, G. M., Quinn, P. K., Middlebrook, A. M., Alexander, B., and Brown, S. S.: A large atomic chlorine source inferred from mid-continental reactive nitrogen chemistry, Nature, 464, 271–274, https://doi.org/10.1038/nature08905, 2010.
Wang, H., Wang, H., Lu, X., Lu, K., Zhang, L., Tham, Y. J., and Zhang, Y.: Increased night-time oxidation over China despite widespread decrease across the globe, Nat. Geosci., 16, 217–223, https://doi.org/10.1038/s41561-022-01122-x, 2023.
Wang, P., Zhu, S., Vrekoussis, M., Brasseur, G. P., Wang, S., and Zhang, H.: Is atmospheric oxidation capacity better in indicating tropospheric O3 formation, Front. Environ. Sci. Eng., 16, https://doi.org/10.1007/s11783-022-1544-5, 2022.
Wang, W., Yuan, B., Peng, Y., Su, H., Cheng, Y., Yang, S., Wu, C., Qi, J., Bao, F., Huangfu, Y., Wang, C., Ye, C., Wang, Z., Wang, B., Wang, X., Song, W., Hu, W., Cheng, P., Zhu, M., Zheng, J., and Shao, M.: Direct observations indicate photodegradable oxygenated volatile organic compounds (OVOCs) as larger contributors to radicals and ozone production in the atmosphere, Atmos. Chem. Phys., 22, 4117–4128, https://doi.org/10.5194/acp-22-4117-2022, 2022.
Wang, T., Xue, L., Brimblecombe, P., Lam, Y. F., Li, L., and Zhang, L.: Ozone pollution in China: A review of concentrations, meteorological influences, chemical precursors, and effects, Sci. Total Environ., 575, 1582–1596,. https://doi.org/10.1016/j.scitotenv.2016.10.081, 2017.
Wang, T., Xue, L., Feng, Z., Dai, J., Zhang, Y., and Tan, Y.: Ground-level ozone pollution in China: a synthesis of recent findings on influencing factors and impacts, Environ. Res. Lett., 17, 063003, https://doi.org/10.1088/1748-9326/ac69fe, 2022.
Wesely, M. L. and Hicks, B. B.: A review of the current status of knowledge in a dry deposition, Atmos. Environ., 34, 2261–2282, https://doi.org/10.1016/S1352-2310(99)00467-7, 2000.
Whalley, L. K., Slater, E. J., Woodward-Massey, R., Ye, C., Lee, J. D., Squires, F., Hopkins, J. R., Dunmore, R. E., Shaw, M., Hamilton, J. F., Lewis, A. C., Mehra, A., Worrall, S. D., Bacak, A., Bannan, T. J., Coe, H., Percival, C. J., Ouyang, B., Jones, R. L., Crilley, L. R., Kramer, L. J., Bloss, W. J., Vu, T., Kotthaus, S., Grimmond, S., Sun, Y., Xu, W., Yue, S., Ren, L., Acton, W. J. F., Hewitt, C. N., Wang, X., Fu, P., and Heard, D. E.: Evaluating the sensitivity of radical chemistry and ozone formation to ambient VOCs and NOx in Beijing, Atmos. Chem. Phys., 21, 2125–2147, https://doi.org/10.5194/acp-21-2125-2021, 2021.
Xia, R., Luo, Y., Zhang, D. L., Li, M., Bao, X., and Sun, J.: On the diurnal cycle of heavy rainfall over the Sichuan Basin during 10–18 August 2020, Adv. Atmos. Sci., 38, 2183–2200, 2021.
Xu, X., Ge, B., and Lin, W.: Progresses in the research of ozone production efficiency (OPE), Adv. Earth Sci., 24, 845–853, https://doi.org/10.11867/j.issn.1001-8166.2009.08.0845, 2009.
Xue, L., Gu, R., Wang, T., Wang, X., Saunders, S., Blake, D., Louie, P. K. K., Luk, C. W. Y., Simpson, I., Xu, Z., Wang, Z., Gao, Y., Lee, S., Mellouki, A., and Wang, W.: Oxidative capacity and radical chemistry in the polluted atmosphere of Hong Kong and Pearl River Delta region: analysis of a severe photochemical smog episode, Atmos. Chem. Phys., 16, 9891–9903, https://doi.org/10.5194/acp-16-9891-2016, 2016.
Yang, X., Lu, K., Ma, X., Liu, Y., Wang, H., Hu, R., and Zhang, Y.: Observations and modeling of OH and HO2 radicals in Chengdu, China in summer 2019, Sci. Total Environ., 772, 144829, 144829.https://doi.org/10.1016/j.scitotenv.2020.144829, 2021.
Yang, X., Lu, K., Ma, X., Gao, Y., Tan, Z., Wang, H., Chen, X., Li, X., Huang, X., He, L., Tang, M., Zhu, B., Chen, S., Dong, H., Zeng, L., and Zhang, Y.: Radical chemistry in the Pearl River Delta: observations and modeling of OH and HO2 radicals in Shenzhen in 2018, Atmos. Chem. Phys., 22, 12525–12542, https://doi.org/10.5194/acp-22-12525-2022, 2022.
Yu, C., Wang, Z., Xia, M., Fu, X., Wang, W., Tham, Y. J., Chen, T., Zheng, P., Li, H., Shan, Y., Wang, X., Xue, L., Zhou, Y., Yue, D., Ou, Y., Gao, J., Lu, K., Brown, S. S., Zhang, Y., and Wang, T.: Heterogeneous N2O5 reactions on atmospheric aerosols at four Chinese sites: improving the model representation of uptake parameters, Atmos. Chem. Phys., 20, 4367–4378, https://doi.org/10.5194/acp-20-4367-2020, 2020.
Yu, D., Tan, Z., Lu, K., Ma, X., Li, X., Chen, S., and Zhang, Y.: An explicit study of local ozone budget and NOx-VOCs sensitivity in Shenzhen China, Atmos. Environ., 224, 117304, https://doi.org/10.1016/j.atmosenv.2020.117304, 2020.
Zaveri, R. A., Easter, R. C., Fast, J. D., and Peters, L. K.: Model for Simulating Aerosol Interactions and Chemistry (MOSAIC), J. Geophys. Res., 113, D13204, https://doi.org/10.1029/2007JD008782, 2008.
Zhang, Q., Streets, D. G., Carmichael, G. R., He, K. B., Huo, H., Kannari, A., Klimont, Z., Park, I. S., Reddy, S., Fu, J. S., Chen, D., Duan, L., Lei, Y., Wang, L. T., and Yao, Z. L.: Asian emissions in 2006 for the NASA INTEX-B mission, Atmos. Chem. Phys., 9, 5131–5153, https://doi.org/10.5194/acp-9-5131-2009, 2009.
Zhang, S., Sarwar, G., Xing, J., Chu, B., Xue, C., Sarav, A., Ding, D., Zheng, H., Mu, Y., Duan, F., Ma, T., and He, H.: Improving the representation of HONO chemistry in CMAQ and examining its impact on haze over China, Atmos. Chem. Phys., 21, 15809–15826, https://doi.org/10.5194/acp-21-15809-2021, 2021.
Zhang, Y., Wen, X. Y., Wang, K., Vijayaraghavan, K., and Jacobson, M. Z.: Probing into regional O3 and particulate matter pollution in the United States: 2. An examination of formation mechanisms through a process analysis technique and sensitivity study, J. Geophys. Res., 114, D22305, https://doi.org/10.1029/2009jd011900, 2009.
Zheng, B., Tong, D., Li, M., Liu, F., Hong, C., Geng, G., Li, H., Li, X., Peng, L., Qi, J., Yan, L., Zhang, Y., Zhao, H., Zheng, Y., He, K., and Zhang, Q.: Trends in China's anthropogenic emissions since 2010 as the consequence of clean air actions, Atmos. Chem. Phys., 18, 14095–14111, https://doi.org/10.5194/acp-18-14095-2018, 2018
Zhu, J., Wang, S., Wang, H., Jing, S., Lou, S., Saiz-Lopez, A., and Zhou, B.: Observationally constrained modeling of atmospheric oxidation capacity and photochemical reactivity in Shanghai, China, Atmos. Chem. Phys., 20, 1217–1232, https://doi.org/10.5194/acp-20-1217-2020, 2020.
- Abstract
- Introduction
- Theoretical considerations
- Model description and validation
- The budget of oxidants
- Effects of aerosols on oxidants
- Quantification of the oxidizing capacity of the atmosphere in China
- Summary and conclusions
- Code and data availability
- Author contributions
- Competing interests
- Disclaimer
- Acknowledgements
- Financial support
- Review statement
- References
- Supplement


