the Creative Commons Attribution 4.0 License.
the Creative Commons Attribution 4.0 License.
 | 14 Nov 2023
Sensitivity of cloud-phase distribution to cloud microphysics and thermodynamics in simulated deep convective clouds and SEVIRI retrievals
Martin Stengel
Quentin Coopman
Andrew Barrett
The formation of ice in clouds is an important process in mixed-phase clouds, and the radiative properties and dynamical developments of clouds strongly depend on their partitioning between the liquid and ice phases. In this study, we investigated the sensitivities of the cloud phase to the ice-nucleating particle (INP) concentration and thermodynamics. Moreover, passive satellite retrieval algorithms and cloud products were evaluated to identify whether they could detect cloud microphysical and thermodynamical perturbations. Experiments were conducted using the ICOsahedral Nonhydrostatic (ICON) model at the convection-permitting resolution of about 1.2 km on a domain covering significant parts of central Europe, and they were compared to two different retrieval products based on Spinning Enhanced Visible and InfraRed Imager (SEVIRI) measurements. We selected a day with multiple isolated deep convective clouds, reaching a homogeneous freezing temperature at the cloud top. The simulated cloud liquid pixel fractions were found to decrease with increasing INP concentration, both within clouds and at the cloud top. The decrease in the cloud liquid pixel fraction was not monotonic and was stronger in high-INP cases. Cloud-top glaciation temperatures shifted toward warmer temperatures with an increasing INP concentration by as much as 8 ∘C. Moreover, the impact of the INP concentration on cloud-phase partitioning was more pronounced at the cloud top than within the cloud. Furthermore, initial and lateral boundary temperature fields were perturbed with increasing and decreasing temperature increments from 0 to ±3 and ±5 K between 3 and 12 km, respectively. Perturbing the initial thermodynamic state was also found to systematically affect the cloud-phase distribution. However, the simulated cloud-top liquid pixel fraction, diagnosed using radiative transfer simulations as input to a satellite forward operator and two different satellite remote-sensing retrieval algorithms, deviated from one of the satellite products regardless of perturbations in the INP concentration or the initial thermodynamic state for warmer subzero temperatures while agreeing with the other retrieval scheme much better, in particular for the high-INP and high-CAPE (convective available potential energy) scenarios. Perturbing the initial thermodynamic state, which artificially increases the instability of the mid- and upper-troposphere, brought the simulated cloud-top liquid pixel fraction closer to the satellite observations, especially in the warmer mixed-phase temperature range.
- Article
(6528 KB) - Full-text XML
- BibTeX
- EndNote


-
Cloud properties are retrieved using a satellite forward operator and remote-sensing retrieval algorithms with ICON simulations as input. To our knowledge, it is the first time that this approach has been used to retrieve the cloud phase and other microphysical variables.
-
Glaciation temperature shifts towards a warmer temperature with increasing INP concentration, both within the cloud and at the cloud top. Initial thermodynamic states affect the cloud-phase distribution significantly as well.
-
The simulated cloud-top liquid pixel fraction matches the satellite observations in the high-INP and high-CAPE scenarios.
In the temperature range between 0 and −38 ∘C, ice particles and supercooled liquid droplets can coexist in mixed-phase clouds. Mixed-phase clouds are ubiquitous in Earth's atmosphere, occurring at all latitudes from the poles to the tropics. Because of their widespread nature, mixed-phase processes play a critical role in the life cycle of clouds, precipitation formation, cloud electrification, and the radiative energy balance on both regional and global scales (Korolev et al., 2017). Deep convective clouds are always mixed-phase clouds, and their cloud tops reach the homogeneous freezing temperature, −38 ∘C, in most cases. Despite the importance of mixed-phase clouds in shaping global weather and climate, microphysical processes for mixed-phase cloud formation and development are still poorly understood, especially ice formation processes. It is not surprising that the representation of mixed-phase clouds is one of the big challenges in weather and climate models (McCoy et al., 2016; Korolev et al., 2017; Hoose et al., 2018; Takeishi and Storelvmo, 2018; Vignon et al., 2021; Zhao et al., 2021).
The distribution of cloud phase has been found to impact cloud thermodynamics and Earth's radiation budget significantly (Korolev et al., 2017; Matus and L'Ecuyer, 2017; Hawker et al., 2021). The freezing of liquid droplets releases latent heat and, hence, affects the thermodynamic state of clouds. Moreover, distinct optical properties of liquid droplets and ice particles exert different impacts on cloud's shortwave and longwave radiation. Simulation and observation studies have reported that the cloud phase in the mixed-phase temperature range of convective clouds is influenced by aerosol and plays a significant role in the development into deeper convective systems (Li et al., 2013; Sheffield et al., 2015; Mecikalski et al., 2016). Observational studies have revealed that the cloud-phase distribution is highly temperature-dependent and influenced by multiple factors, for example, cloud type and cloud microphysics (Rosenfeld et al., 2011; Coopman et al., 2020). Analyzing passive satellite observations of mixed-phase clouds over the Southern Ocean, Coopman et al. (2021) found that the cloud ice fraction increases with increasing cloud effective radius. Analysis of both passive and active satellite datasets reveals an increase in the supercooled liquid fraction with cloud optical thickness (Bruno et al., 2021).
A number of in situ observations of mixed-phase clouds have been made in the past several decades, covering stratiform clouds (Pinto, 1998; Korolev and Isaac, 2006; Noh et al., 2013) and convective clouds (Rosenfeld and Woodley, 2000; Stith et al., 2004; Taylor et al., 2016). Aircraft-based observations of mixed-phase cloud properties have revealed that the frequency distribution of the ice water fraction has a U-shape with two explicit maxima, one for the ice water fraction smaller than 0.1 and the other for the ice water fraction larger than 0.9, and the frequency of occurrence of mixed-phase clouds is approximately constant when the ice water fraction is in the range between 0.2 and 0.5 (Korolev et al., 2003, 2017; Field et al., 2004). These findings are very useful constraints for numerical models (Lohmann and Hoose, 2009; Grabowski et al., 2019). However, in situ observations of mixed-phase cloud microphysics are technically difficult and sparse in terms of spatial and temporal coverage. Thus, understanding ice formation processes and determining the climatological significance of mixed-phase clouds have proved difficult using existing in situ observations only.
Both observations and simulations have revealed that ice-nucleating particles (INPs) impact deep convective cloud properties, including the persistence of deep convective clouds and precipitation (Twohy, 2015; Fan et al., 2016). However, the impact of INPs on precipitation from deep convective clouds is still uncertain and may depend on precipitation and cloud types (van den Heever et al., 2006; Min et al., 2009; Fan et al., 2010; Li and Min, 2010). Although the effects of INPs on convective precipitation are not conclusive, it is certain that the interactions between convective clouds and INPs affect cloud microphysical properties and, hence, cloud-phase distributions. In addition, previous numerical modeling studies on cloud–aerosol interactions have focused on the influences of aerosols acting as cloud condensation nuclei (CCN) (Fan et al., 2016), which are linked to the ice phase, e.g., through impacts on the riming efficiency (Barrett and Hoose, 2023). Given the limited knowledge on ice formation in deep convective clouds and significant uncertainties in ice nucleation parameterizations, it is necessary to conduct sensitivity simulations to investigate how ice formation processes are influenced by INP concentrations and thermodynamic states in deep convective clouds.
In this study, with the help of realistic convection-permitting simulations using two-moment microphysics, we address how and the extent to which the INP concentration and thermodynamic state affect the in-cloud and cloud-top phase distributions in deep convective clouds. In particular, cloud properties are retrieved using a satellite forward operator and remote-sensing retrieval algorithms with radiative transfer simulations as input for a fair comparison to observations from the Spinning Enhanced Visible and InfraRed Imager (SEVIRI). This method allows us to compare model-simulated cloud properties with remote-sensing cloud products directly, and this is, to our knowledge, the first time that this approach has been used for the cloud phase and related microphysical variables. We aim to evaluate the satellite retrieval algorithms and investigate whether passive satellite cloud products can detect cloud microphysical and thermodynamical perturbations.
This paper is structured as follows: in Sect. 2, we introduce our model setups and the experiment design, the satellite forward operator, remote-sensing retrieval algorithms, and datasets; simulation results for the sensitivity experiments are shown in Sect. 3; Sect. 4 presents discussions; and we summarize the study and draw conclusions in Sect. 5.
2.1 Model description
The ICOsahedral Nonhydrostatic (ICON) model (Zängl et al., 2015) is a state-of-the-art unified modeling system offering three physics packages that are dedicated to numerical weather prediction (NWP), climate simulation, and large-eddy simulation, respectively. ICON is a fully compressible model and has been developed collaboratively by the German Weather Service (DWD), the Max Planck Institute for Meteorology, the German Climate Computing Center (DKRZ), and the Karlsruhe Institute of Technology (KIT). In order to maximize the model performance and remove the singularity at the poles, ICON solves the prognostic variables suggested by Gassmann and Herzog (2008), on an unstructured triangular grid with C-type staggering based on a successive refinement of a spherical icosahedron (Wan et al., 2013). Governing equations are described in Wan et al. (2013) and Zängl et al. (2015). The DWD has operated the ICON model at a spatial resolution of about 13 km at a global scale since January 2015. In the global ICON, the higher-resolution ICON-EU (resolution 7 km) nesting area for Europe has been embedded since July 2015. In this study, ICON-2.6.4 with the NWP physics package is used, and initial and lateral boundary conditions are provided by the ICON-EU analyses.
For cloud microphysics, we use an updated version of the two-moment cloud microphysics scheme developed by Seifert and Beheng (2006). The two-moment scheme predicts the number and mass mixing ratios of two liquid (cloud and rain) and four solid (ice, graupel, snow, and hail) hydrometers. The cloud condensation nuclei (CCN) activation is described following the parameterization developed by Hande et al. (2016). Homogeneous freezing, including freezing of liquid water droplets and liquid aerosols, is parameterized according to Kärcher et al. (2006). Heterogeneous ice nucleation, including the immersion and deposition modes, is parameterized as a function of the temperature-dependent and ice-supersaturation-dependent INP concentration (Hande et al., 2015). The INP concentration due to immersion nucleation is described as follows:
where TK is the ambient temperature in kelvin, and A, B, and C are fitting constants with different values to represent seasonally varying dust INP concentrations. The parameterization for deposition INPs is simply scaled to the diagnosed relative humidity with respect to ice (RHice):
Here, CINP(TK) is given by Eq. (1), and a, b, c, and d are constants. More details are found in Hande et al. (2015).
2.2 Simulation setup and sensitivity experiments
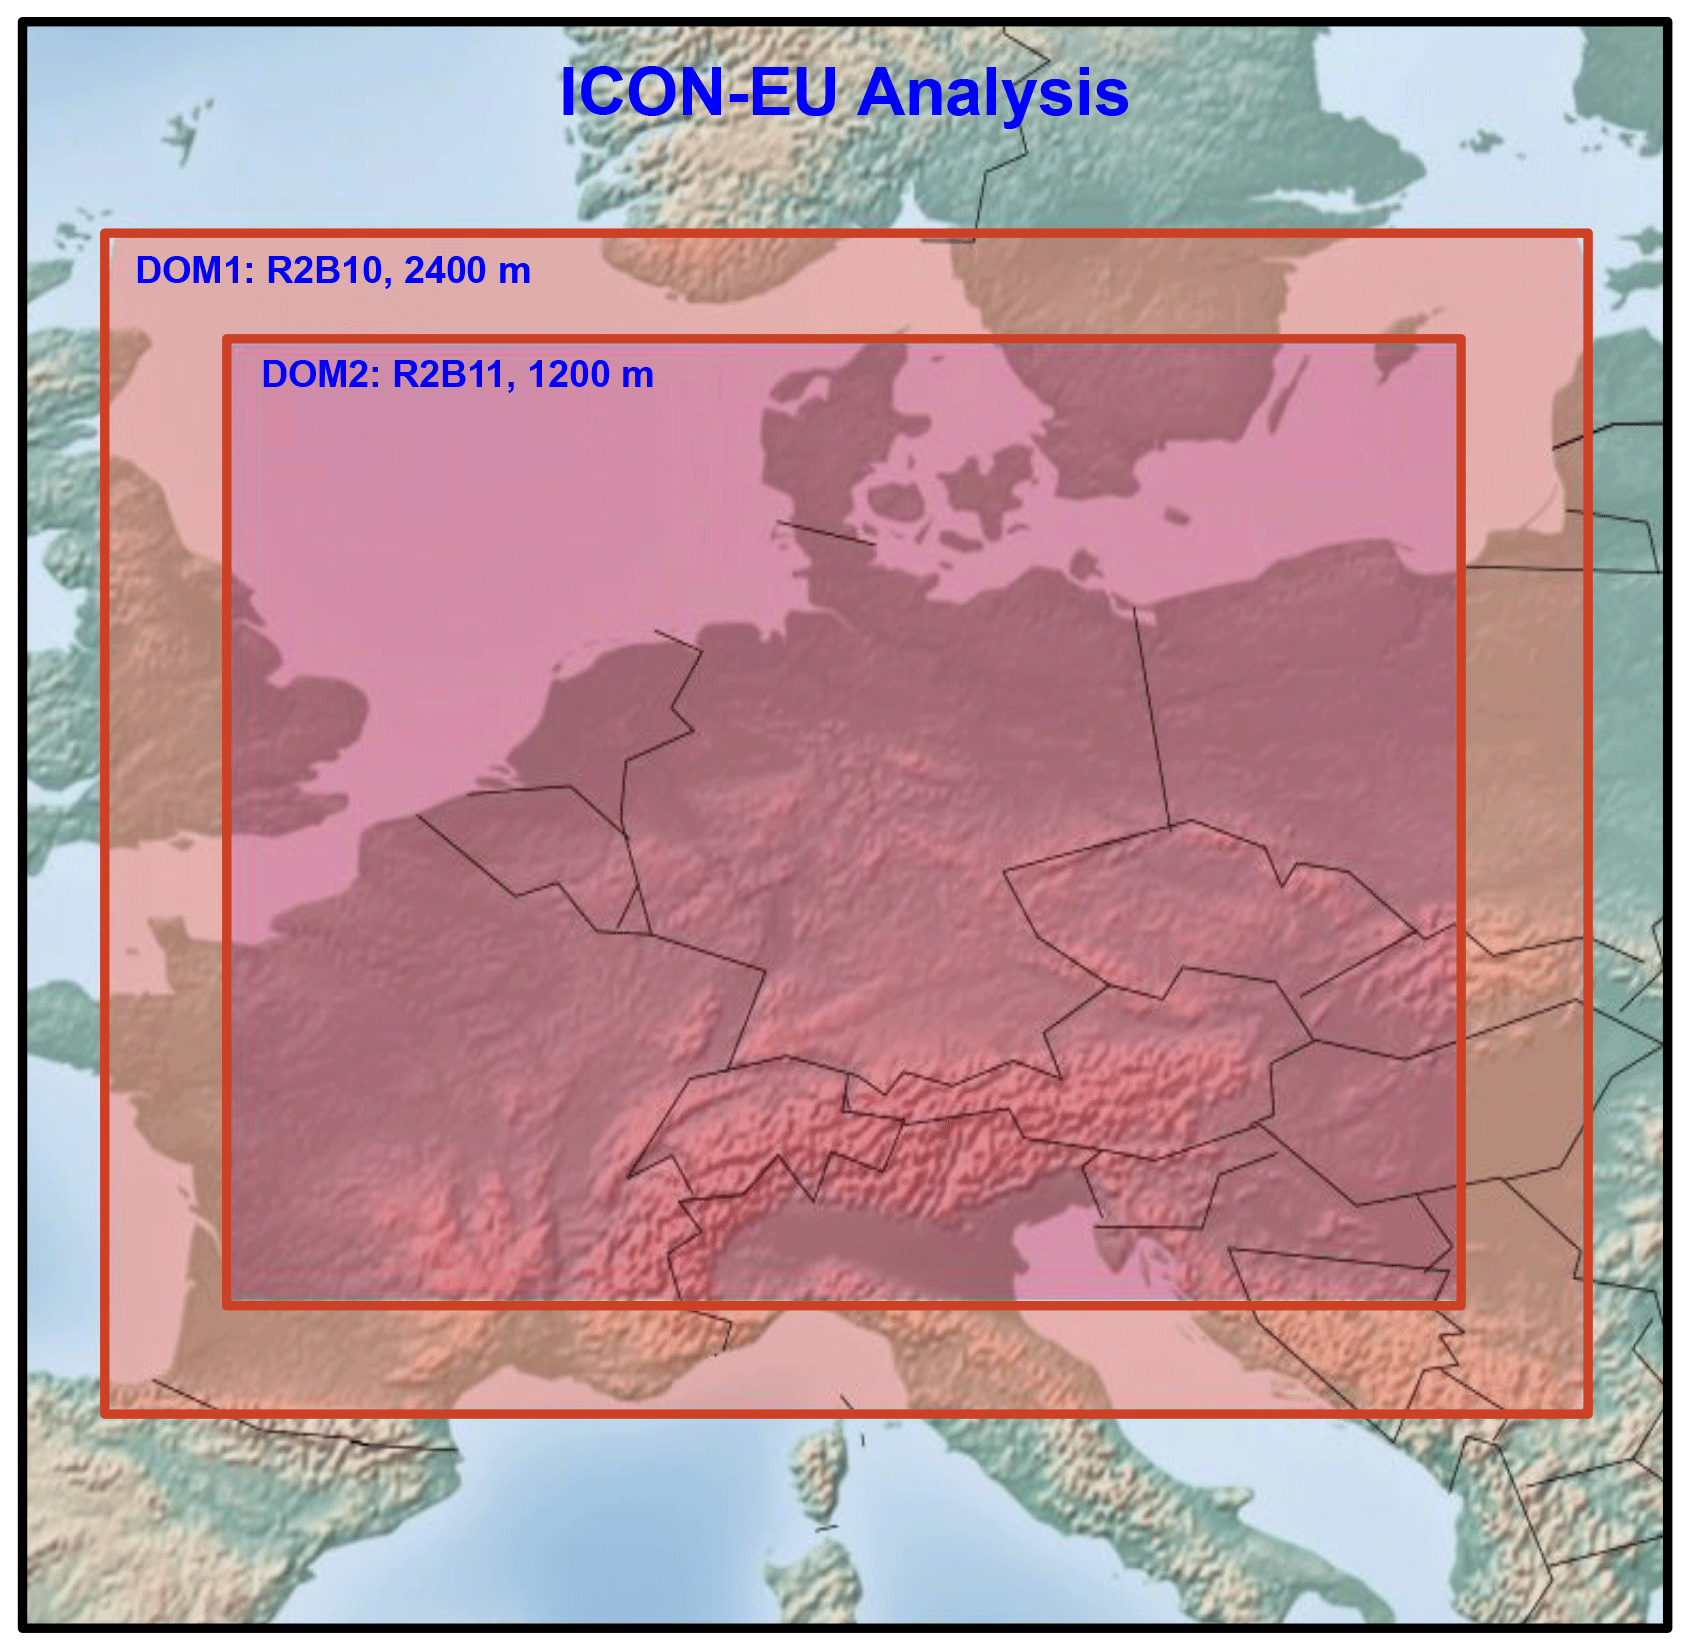
In this study, the setup consists of two different domains with one-way nesting covering a major part of central Europe (Fig. 1). The horizontal resolution for the nested domains is halved from 2400 to 1200 m in the innermost domain, and the time steps for the two domains are 12 and 6 s, respectively. A total of 150 vertical levels are used, with a grid stretching towards the model top at 21 km. The vertical resolution is the same for all horizontal resolutions, and the lowest 1000 m encompass 20 layers. A 1-D vertical turbulence diffusion and transfer scheme is used for the 2400 and 1200 m resolutions, referred to as NWP physics. Deep convection is assumed to be explicitly resolved, whereas shallow convection is parameterized for both domains. The simulations are initialized at 00:00 UTC on the study day from ICON-EU analyses and integrated for 24 h. Simulation results were saved every 15 min. At the lateral boundaries of the outer domain, the simulation of the model is updated with 3-hourly ICON-EU analyses. The nested domains are coupled online, and the outer domain provides lateral boundary conditions to the inner domain.
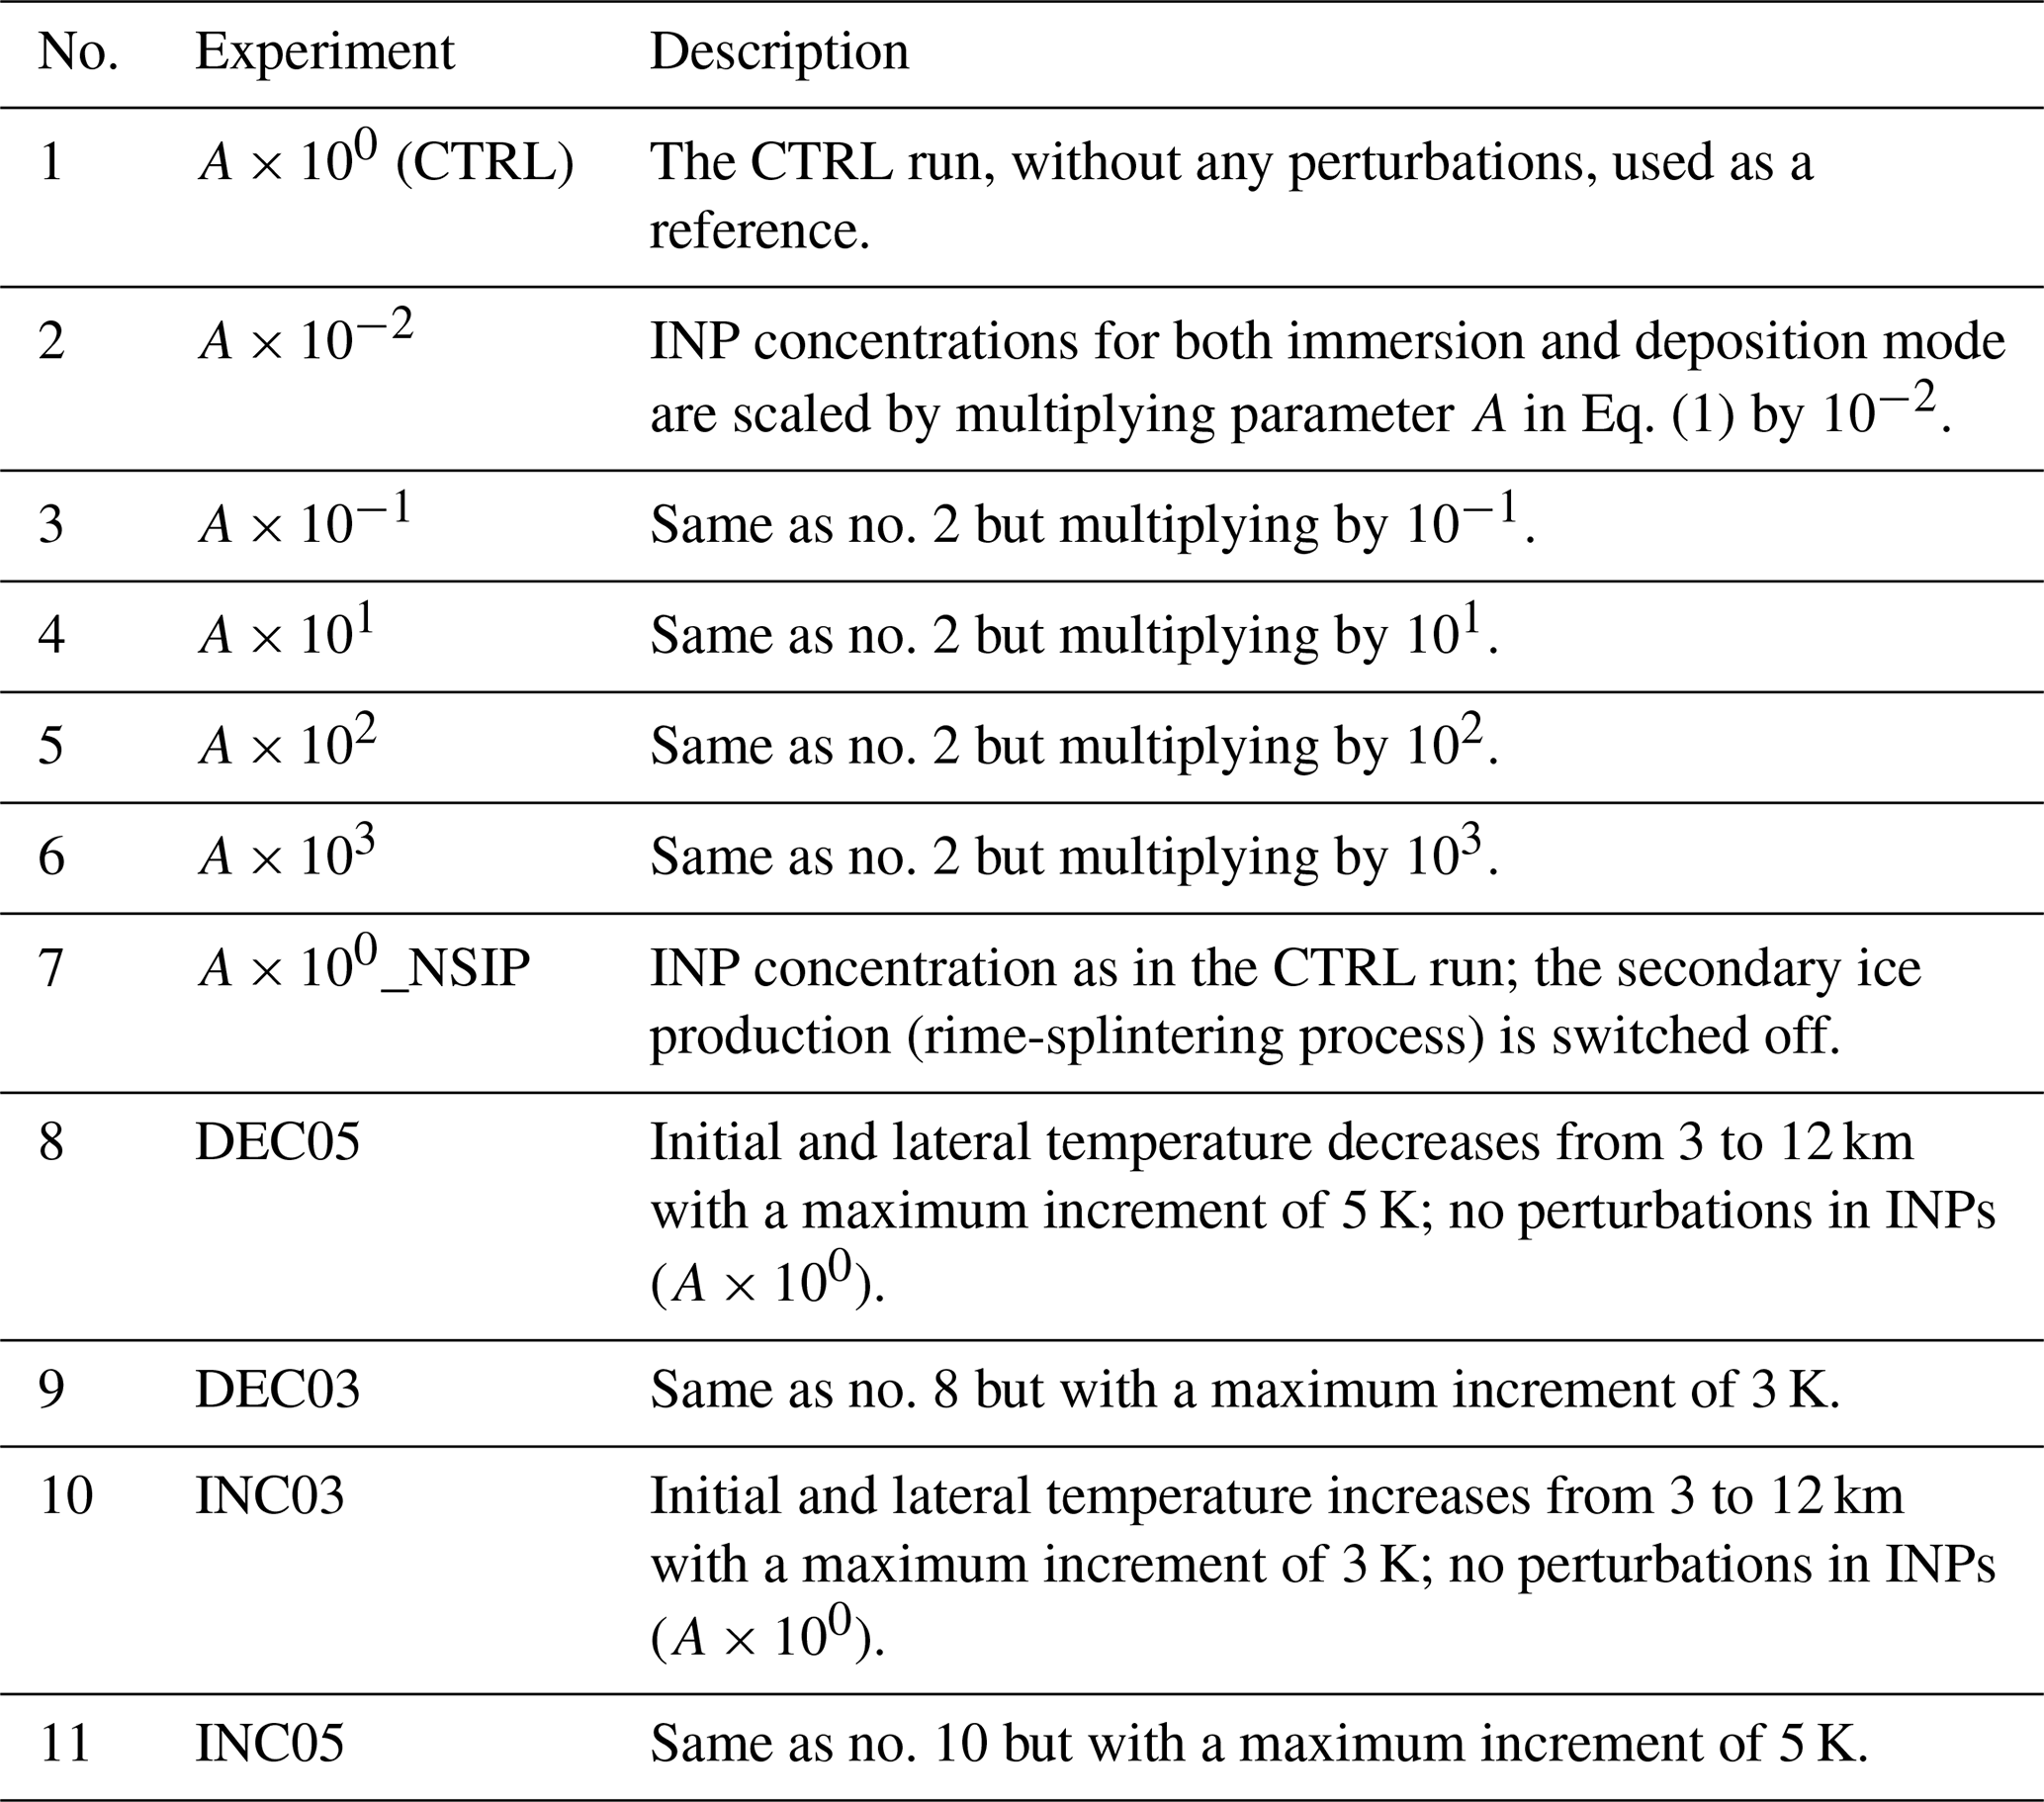
In nature, the INP concentration varies across multiple orders of magnitude (Hoose and Möhler, 2012; Kanji et al., 2017). Thus, in our sensitivity experiments, heterogeneous ice formation was scaled by multiplying the default INP concentration (Eq. 1) by a factor of 10−2, 10−1, 101, 102, and 103 for both immersion freezing and deposition ice nucleation. Along with a case with a default INP concentration (CTRL case) and one case switching off the secondary-ice production via a rime-splintering process (the so-called Hallett–Mossop process), seven cases were created in total to investigate the impact of primary and secondary ice formation on the cloud-phase distribution in deep convective clouds.
In order to assess the sensitivity of the cloud phase to thermodynamics, initial and lateral boundary temperature fields were modified with increasing and decreasing temperature increments, referred to as the INC and DEC experiments, respectively. The temperature increment is linearly increased/decreased with height from 0 K at 3 km to ±3 and ±5 K at 12 km, creating four sensitivity experiments: DEC03, DEC05, INC03, and INC05. Above 12 km, the increment is constant up to the model top. Initial temperature profiles are shown in Fig. 2. The increasing or decreasing environmental temperature leads to changes in the lapse rate and the stability of the atmosphere, thereby resulting in a decrease or increase in the convective available potential energy (CAPE), respectively (Barthlott and Hoose, 2018). Thus, the CAPE increases monotonically from the INC05 case (spatially averaged CAPE at 09:00 UTC: 413 J kg−1) to the CTRL case (724 J kg−1) and finally to the DEC05 case (1235 J kg−1). Note that the relative humidity increases/decreases with decreasing/increasing temperature, as the specific humidity is unperturbed. The perturbations of the INP concentration and initial/lateral temperature profiles are motivated by Hoose et al. (2018) and Barthlott and Hoose (2018), respectively. Complementary to these earlier studies, we now investigate an ensemble of several deep convective clouds and focus on the influences of INPs and thermodynamics on the cloud-phase distribution. Short descriptions of all of the sensitivity experiments performed in this study are given in Table 1.
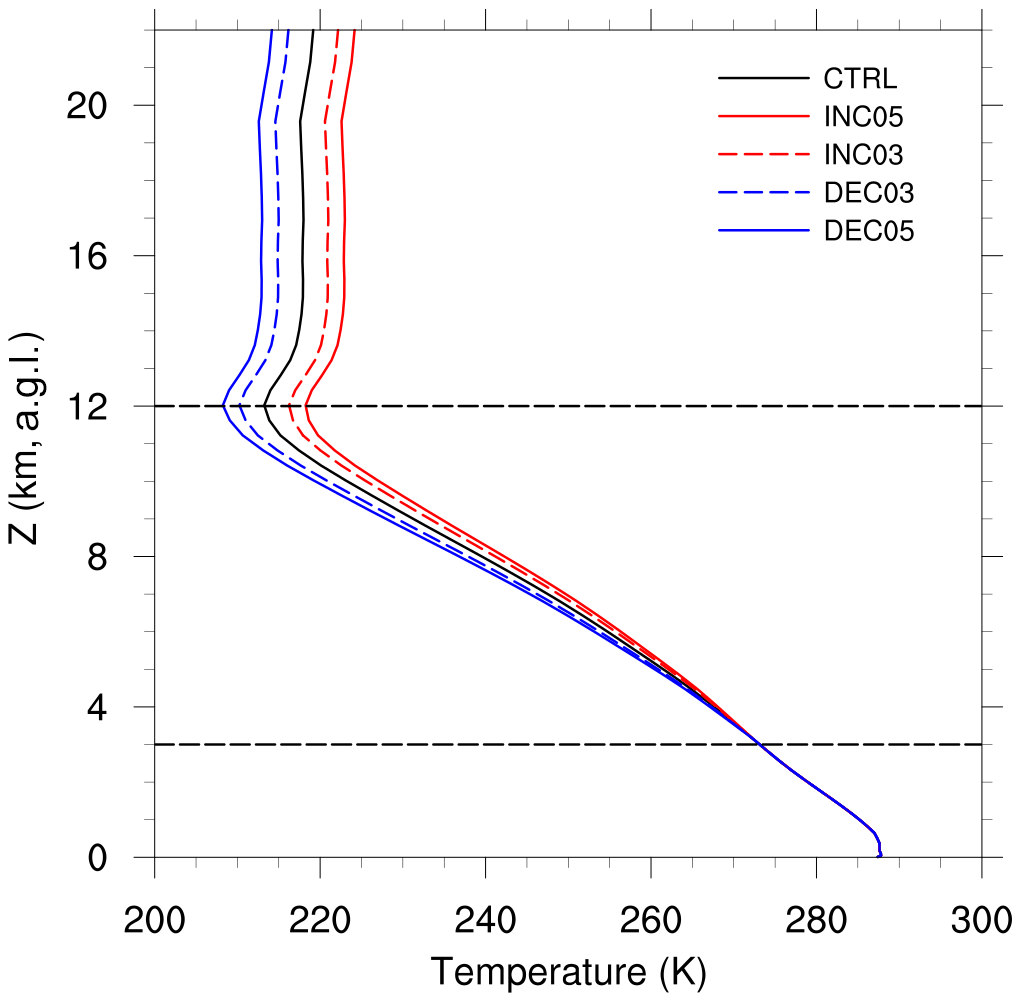
Figure 2Domain-averaged initial temperature profiles. The same modification was applied to the lateral boundary conditions.
2.3 Satellite observations and retrieval algorithms
SEVIRI is a 12-channel imager aboard the geostationary Meteosat Second Generation (MSG) satellites. SEVIRI has one high-spatial-resolution visible channel (HRV) and 11 spectral channels from 0.6 to 14 µm with a 15 min revisit cycle and a spatial resolution of 3 km at nadir (Schmetz et al., 2002). Based on the spectral measurements of SEVIRI, a cloud property data record, CLAAS-2 (CLoud property dAtAset using SEVIRI, Edition 2), has been generated within the framework of the European Organisation for the Exploitation of Meteorological Satellites (EUMETSAT) Satellite Application Facility on Climate Monitoring (CM SAF) (Benas et al., 2017). CLAAS-2 is the successor of CLAAS-1 (Stengel et al., 2014), for which retrieval updates have been implemented in the algorithm for the detection of clouds compared to CLAAS-1 (Benas et al., 2017) with the temporal coverage being extended to 2004–2015. Retrieval algorithms for parameters that are important for this study are introduced below. Detailed descriptions for the retrieval algorithms are found in Stengel et al. (2014) and Benas et al. (2017) with the main features being summarized in the following.
The MSGv2012 software package is employed to detect clouds and their vertical placement (Derrien and Le Gléau, 2005; Benas et al., 2017). Multispectral threshold tests, which depend on illumination and surface types, among other factors, are performed to detect cloud appearances. Each satellite pixel is assigned to one of the following categories: cloud-filled, cloud-free, cloud-water-contaminated, or snow-/ice-contaminated. Cloud-top pressure (CTP) is retrieved with different approaches using input from SEVIRI channels at 6.2, 7.3, 10.8, 12.0, and 13.4 µm (Menzel et al., 1983; Schmetz et al., 1993; Stengel et al., 2014; Benas et al., 2017). Cloud-top height (CTH) and cloud-top temperature (CTT) are derived from CTP using ancillary data for temperature and humidity profiles from ERA-Interim (Dee et al., 2011). The cloud-top phase (CPH) retrieval is based on a revised version of the multispectral algorithm developed by Pavolonis et al. (2005). Clouds are categorized initially into six types: liquid, supercooled, opaque ice, cirrus, overlap, and overshooting. Subsequently, the binary cloud phase (liquid or ice) is generated based on the six categories (Benas et al., 2017). Cloud optical and microphysical properties are retrieved using the Cloud Physical Properties (CPP) algorithm (Roebeling et al., 2006). SEVIRI visible (0.6 µm) and near-infrared (1.6 µm) measurements are used to calculate cloud optical thickness (COT) and cloud particle effective radius (re) by applying the Nakajima and King (1990) approach in the CPP algorithm (Stengel et al., 2014; Benas et al., 2017). Liquid water path (LWP) and ice water path (IWP) are then computed as a function of the liquid/ice water density, COT, and re of cloud water and cloud ice following the scheme developed by Stephens (1978).
In this study we used instantaneous CLAAS-2 data with a temporal resolution of 15 min and with a native SEVIRI projection and resolution. In addition to the CLAAS-2 dataset, the recently developed SEVIRI_ML software suite (code available on GitHub at https://github.com/danielphilipp/seviri_ml, last access: 12 November 2023) was applied to the SEVIRI measurements to obtain the cloud-top phase and cloud-top temperature for the selected case. SEVIRI_ML uses a machine learning approach calibrated against Cloud-Aerosol Lidar with Orthogonal Polarization (CALIOP) data. One feature of the SEVIRI_ML is that it also provides pixel-based uncertainties such that values with low reliability can be filtered out. We applied the retrieval algorithms to the model simulations in this study and compared the results to satellite observations. A similar strategy was used by Kay et al. (2018) for the evaluation of precipitation in a climate model with CloudSat observations and termed “scale-aware and definition-aware evaluation”.
2.4 Satellite forward operators
In order to compare simulation results and satellite observations directly, SEVIRI-like spectral reflectance and brightness temperatures are calculated using the radiative transfer model for TOVS (RTTOV, v12.3), where TOVS refers to the Television InfraRed Observation Satellite Operational Vertical Sounder (Saunders et al., 2018). RTTOV is a fast radiative transfer model for simulating top-of-atmosphere radiances from passive visible, infrared, and microwave downward-viewing satellite radiometers. It has been widely used to simulate synthetic satellite images and assimilate radiances in numerical models (Saunders et al., 2018; Pscheidt et al., 2019; Senf et al., 2020; Geiss et al., 2021; Rybka et al., 2021).
In this work, ICON-simulated surface skin temperature, near-surface pressure, temperature, specific humidity, wind velocity, total liquid water content, total ice water content, and effective radius of cloud liquid and cloud ice are used as input to drive the RTTOV model. Before inputting this information into the RTTOV model, ICON simulations are remapped onto SEVIRI's full-disk coordinate. Brightness temperatures from eight channels (at 3.9, 6.2, 7.3, 8.7, 9.7, 10.8, 12.0, and 13.4 µm) and reflectance from three channels (at 0.6, 0.8, and 1.6 µm) simulated by the RTTOV model are used as input to run the remote-sensing retrieval algorithms to derive CLAAS-2-like and SEVIRI_ML-like retrievals, which are named ICON_RTTOV_CLAAS-2 and ICON_RTTOV_SEVIRI_ML products, respectively.
2.5 Synoptic overview
The 6 June 2016, which was a day dominated by summertime deep convection located in central Europe, was selected for the analysis. The synoptic forcing was weak on the aforementioned day, and convection was triggered mainly by local thermal instabilities. This day has been discussed frequently in previous studies in terms of convection triggering, cloud microphysics, and its parameterizations (Keil et al., 2019; Geiss et al., 2021).
Perturbing INP concentration and temperature profiles directly affects the microphysical and thermodynamic processes of the developing deep convective clouds and, hence, impacts in-cloud and cloud-top phase distributions. The following section presents the results and a discussion of the sensitivities of cloud phase and cloud microphysics to the INP concentration and thermodynamic perturbations.
3.1 Spatial distribution of cloud properties
Before analyzing the results of sensitivity experiments, retrieved cloud properties via RTTOV and the CLAAS-2 retrieval scheme for the CTRL case are compared to CLAAS-2 products. Spatial distributions of derived LWP, IWP, and COT at 13:00 UTC for the CTRL case and CLAAS-2 satellite observations are shown in Fig. 3. Discrepancies are found between ICON simulation values and CLAAS-2 satellite observations in terms of spatial coverage and intensity. The ICON simulation overestimates the cloud coverage of low-level liquid clouds compared with CLAAS-2 satellite observations, while the LWP derived from the ICON simulation (CTRL case) is smaller and more homogeneously distributed than that from the CLAAS-2 observations (Fig. 3a, b). The spatial distributions of the IWP and COT represent the approximate location and spatial extent of deep convective clouds in this study. The ICON simulation could reproduce cores of deep convective clouds of a number and spacing comparable to observations, whereas the spatial extent and intensity of individual deep convective clouds are not simulated very well by the ICON model. The ICON simulation underestimates the spatial extent of deep convective clouds but overestimates the IWP and COT outside the convective cores compared with the CLAAS-2 observations (Fig. 3c–f).
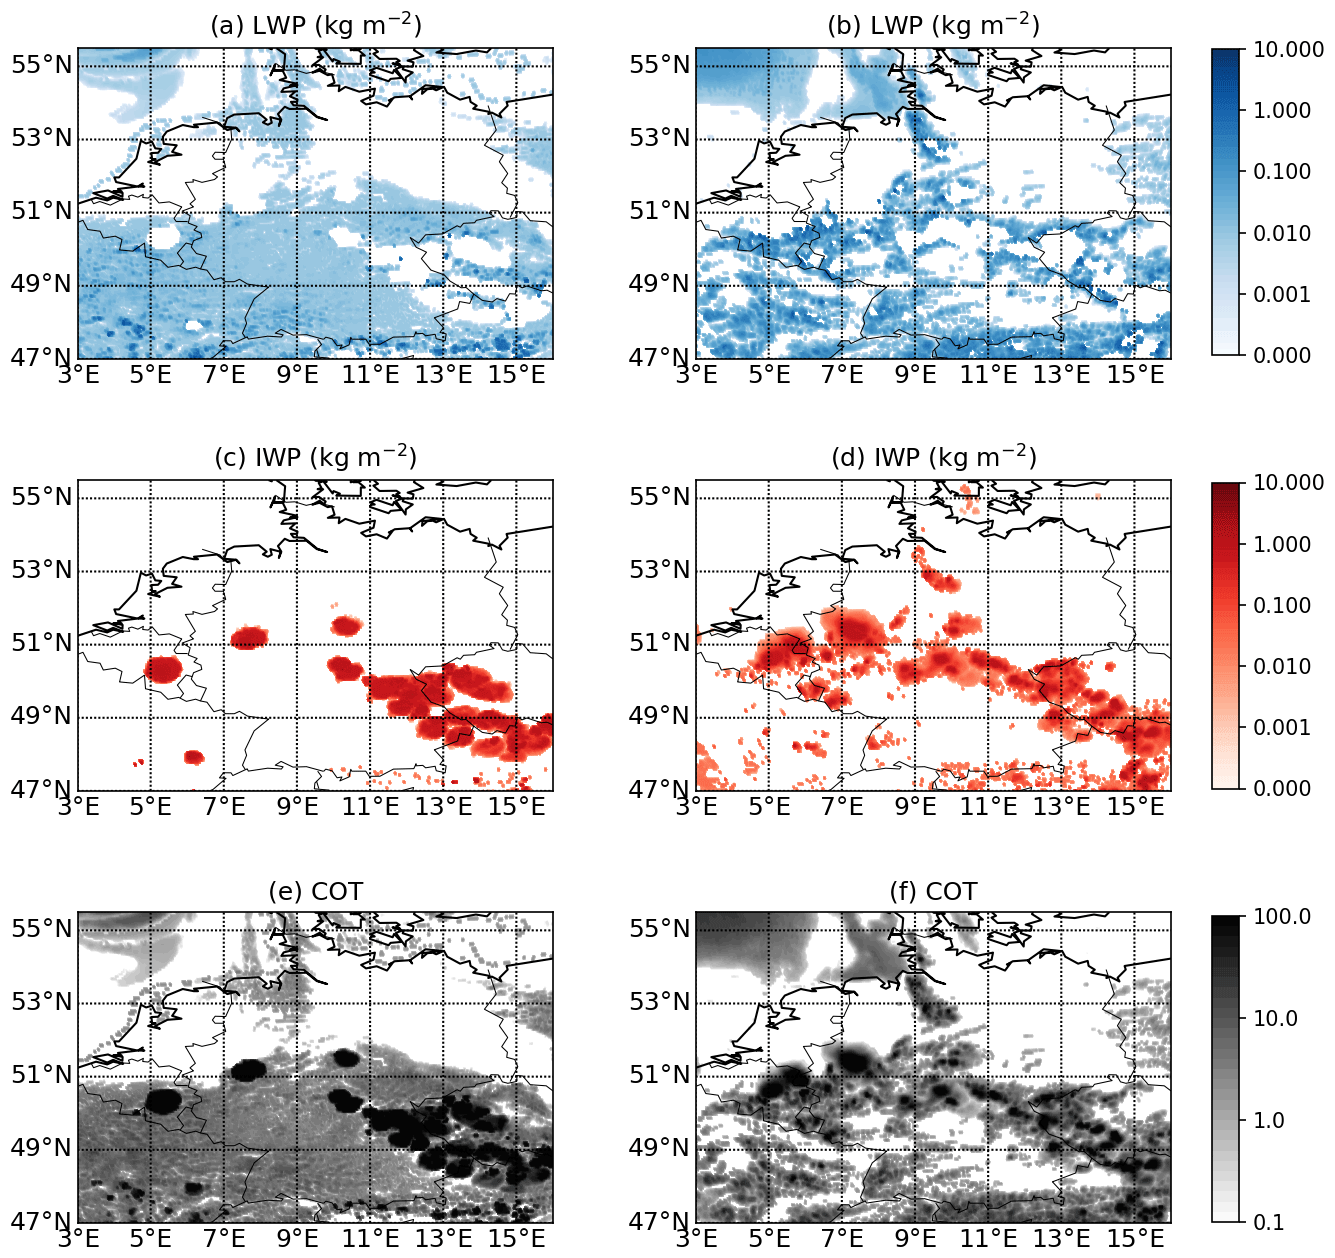
Figure 3Spatial distributions of the retrieved cloud liquid water path (LWP), ice water path (IWP), and cloud optical thickness (COT) at 13:00 UTC. The left column displays the CTRL case (a, c, e) and the right column shows the CLAAS-2 product (b, d, f).
Overall, the simulated clouds appear to be too homogeneous and lack a sufficient internal structure. Geiss et al. (2021) also reported significant deviations between model simulations and satellite observations. The error sources are manifold and may originate from the model physics as well as from the forward operator and the retrieval algorithm. Geiss et al. (2021) investigated the sensitivity of derived visible and infrared observation equivalents to model physics and operator settings. They found that the uncertainty in the visible forward operator is sufficiently low, while infrared channels could introduce errors in cloud-top variables. Geiss et al. (2021) concluded that the primary source of deviations is mainly from model physics, especially model assumptions on subgrid-scale clouds. In addition to the subgrid-scale cloud scheme, multiple critical cloud microphysical processes are missing from the model, introducing significant uncertainties into the simulation results. For example, the entrainment mixing process is not resolved nor parameterized in the model, which has essential influences on processes at cloud boundaries and, hence, the cloud properties (Mellado, 2017). Moreover, secondary-ice processes, including droplet shattering and collisional breakup due to ice particles collisions, are missing, which have significant impacts on the cloud ice microphysics (Sullivan et al., 2018; Sotiropoulou et al., 2021).
3.2 Sensitivity of microphysical properties to INP perturbation
Perturbing the INP concentration results in a direct influence on the heterogeneous freezing processes and, hence, impacts on cloud microphysical properties. Systematic variations have been found in the spatiotemporally averaged profiles of mass mixing ratios of cloud hydrometeors, as shown in Fig. 4. All profiles discussed here are averaged over cloudy pixels (defined as having a condensed mass of cloud water + total cloud ice > kg kg−1) and over the time period from 09:00 to 19:00 UTC, when convection was well developed. The mass concentration of ice crystals decreases with increasing INP concentration (Fig. 4a). However, the mass concentration of snow, graupel, and rainwater increase with increasing INP concentration, especially in the high-INP-concentration cases (cases A×102 and A×103).
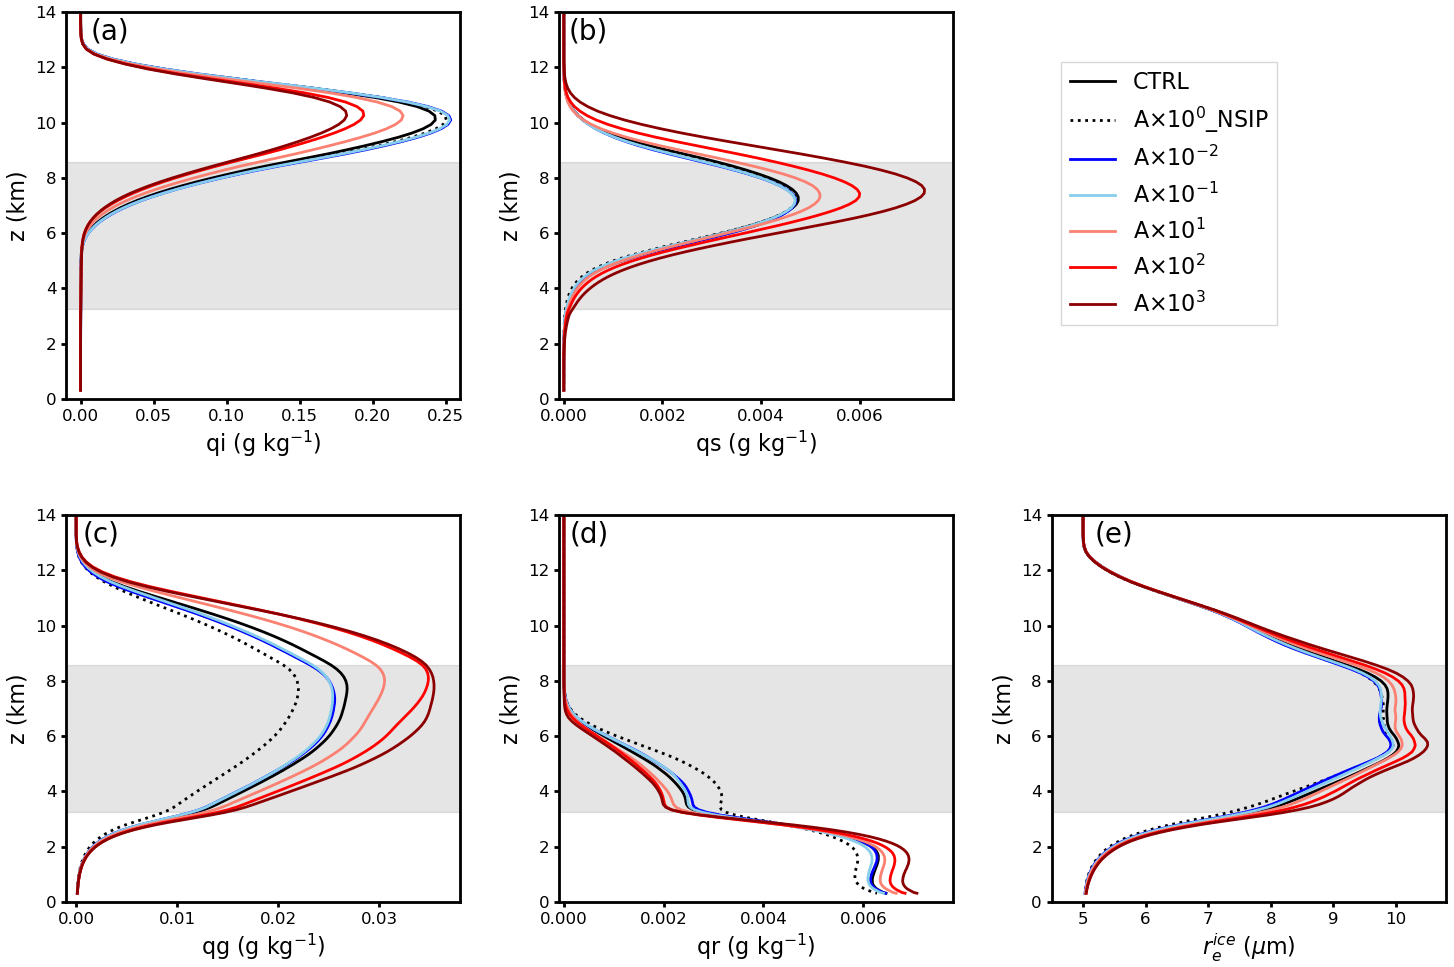
Figure 4Spatiotemporally averaged (09:00–19:00 UTC) profiles of cloud mass mixing ratios of (a) ice crystals, (b) snow, (c) graupel, (d) rainwater, and (e) ice crystal effective radius. The mass mixing ratio unit is grams per kilogram (g kg−1) and the ice crystal effective radius unit is micrometers (µm). Shaded areas indicate the spatiotemporally averaged mixed-phase regions.
In order to further reveal why ice crystal mass concentration decreases with increasing INP concentration, we investigate process rates related to ice particle nucleation and growth. Figure 5 shows spatiotemporally averaged (from 09:00 to 19:00 UTC) profiles of process rates for homogeneous freezing, heterogeneous freezing, secondary ice production via the rime-splintering process, cloud droplets rimed with ice crystals, rain droplets rimed with ice crystals, and collection between ice and ice crystals. Heterogeneous freezing (Fig. 5a) includes the processes of immersion freezing, deposition ice nucleation, and immersion freezing of liquid aerosols (Kärcher et al., 2006; Hande et al., 2015), see also Eqs. (1) and (2). Process rates of heterogeneous freezing increase significantly with increasing INP concentration compared with the CTRL (Fig. 5a). Compensating for the change in heterogeneous freezing, process rates of homogeneous freezing decrease significantly with increasing INP concentration (Fig. 5b). However, a decrease in the INP concentration (compared with the CTRL) does not have a strong influence on the heterogeneous freezing mass rate, which is already low compared with the other processes in the CTRL. Riming processes of cloud droplets and rain droplets onto ice crystals are greatly invigorated due to an enhanced INP concentration (Fig. 5d, e). Moreover, process rates of secondary ice production due to rime splintering are strengthened as well due to the increase in rimed ice, albeit much lower values. Figure 5f shows process rates of collection between ice and ice crystals. Process rates of collection between ice and ice particles increase with increasing INP concentration, especially in the high-INP-concentration cases (A×102 and A×103 cases). Process rates of collection of other ice particles all increase with increasing INP concentration, similar to the collection between ice and ice crystals (not shown). The increase in the riming of clouds and rain droplets onto ice crystals and collections between ice particles leads to the increase in the mass concentration of snow, graupel, and hail (Fig. 4b, c). However, the total mass increases in snow, graupel, and hail do not outbalance the decrease in the mass concentration of ice crystals (Fig. 4). The weakened homogeneous freezing is most likely the dominant factor leading to the decrease in the ice mass concentration in high-INP cases, considering the magnitude of the process rate of homogeneous freezing (Fig. 5b). Supercooled liquid and cloud droplets are converted into ice crystals before reaching the homogeneous freezing layer, leading to fewer supercooled droplets remaining for homogeneous freezing. Even though homogeneous freezing is weakened in high-INP cases, the process rate of homogeneous freezing is still larger than heterogeneous freezing, which means homogeneous freezing is the dominant ice formation process in the convective clouds discussed in this study. Moreover, the enhanced production of large ice particles (snow, graupel, and hail), which sediment more rapidly to lower levels, in the highest-INP case leads to increased surface precipitation by about 10 % in the A×103 case (not shown). Interestingly, the ice crystal effective radius () increases monotonically with increasing INP concentration, especially in the mixed-phase layer (Fig. 4e). Zhao et al. (2019) also reported an increased with polluted continental aerosols in their simulated moderate-convection cases, and they attributed this to enhanced heterogeneous freezing and prolonged ice crystal growth at higher INP loading.
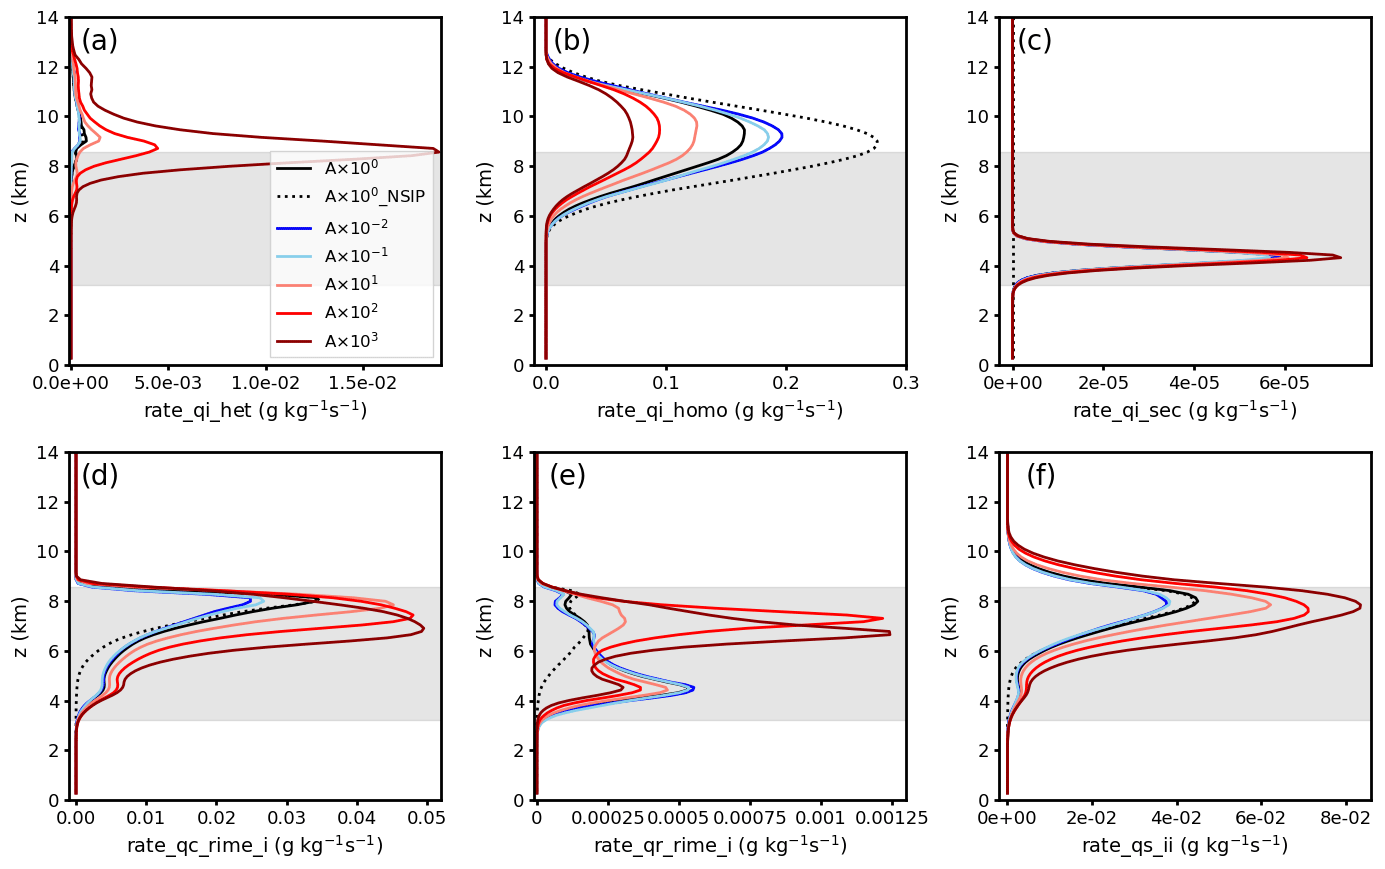
Figure 5Spatiotemporally averaged (09:00–19:00 UTC) profiles of process rates (in g kg−1 s−1) of (a) heterogeneous freezing (immersion and deposition nucleation), (b) homogeneous freezing, (c) secondary-ice production (rime splintering), (d) cloud droplets rimed with ice crystals, (e) rain droplets rimed with ice crystals, and (f) collection between ice and ice crystals. The average mixed-phase layer (0 to −38 ∘C) is roughly in between 3.2 and 8.6 km. Shaded areas indicate the spatiotemporally averaged mixed-phase regions.
This competition between homogeneous and heterogeneous freezing has been discussed in previous studies (Heymsfield et al., 2005; Deng et al., 2018; Takeishi and Storelvmo, 2018). In contrast, simulations of mixed-phase, moderately deep convective clouds by Miltenberger and Field (2021) indicate that the cloud ice mass concentration increases with increasing INP concentration, which is in opposition to the findings in this work. The main reason is that the CTT is about −18 ∘C in the study by Miltenberger and Field (2021), and heterogeneous freezing does not compete with homogeneous freezing. Thus, results regarding the effects of INPs on glaciation processes in convective clouds can be opposite under different conditions.
3.3 Cloud liquid mass fraction
Varying the INP concentration has a direct impact on primary ice formation. Thus, it affects the cloud liquid mass fraction within the clouds (directly for all cloudy layers where heterogeneous freezing is active and indirectly for warmer and colder temperatures) and at the cloud top. The cloud liquid mass fraction is defined as the ratio of the mass mixing ratio between cloud droplets (qc) and the sum of cloud droplets and cloud ice crystals (qi). The in-cloud liquid mass fraction, sampled at a time interval of 15 min between 09:00 and 19:00 UTC from all cloudy pixels, is shown as scatterplots versus temperature in Fig. 6a–d. The corresponding frequencies of the occurrence of the liquid fraction against temperature bins are shown in Fig. 6e–h. Similar analyses were carried out by Hoose et al. (2018) but for idealized simulations of deep convective clouds. In-cloud liquid mass fractions smaller than 0.5 are already quite common at a temperature just below −3 ∘C, except for in the case without the rime-splintering process (A×100_NSIP). The decrease in INP concentrations has limited effects on the in-cloud liquid mass fraction (Fig. 6c, g), while a stronger influence has been found in the case with an enhanced INP concentration (Fig. 6d, h). The number of pixels with high liquid mass fraction values at temperatures lower than −30 ∘C decreases with increasing INP concentration. In addition, more and more pixels with a liquid mass fraction smaller than 0.5 appear with increasing INP concentration and the number of pure ice pixels increases with increasing INP concentration as well. This is because a higher INP concentration intensifies the heterogeneous freezing processes (immersion freezing and deposition ice nucleation) and invigorates the rime-splintering process as well (as discussed in Sect. 3.4). Interestingly, at the lower end of the mixed-phase temperature range (−38 to −28 ∘C), there are fewer pixels with a high liquid mass fraction in the high-INP case, and those remaining are mainly the ones at high vertical velocities (above ∼10 m s−1). This is probably because supercooled droplets are more easily frozen in high-INP cases and stronger updrafts are needed to offset the Wegener–Bergeron–Findeisen (WBF) process to maintain the supersaturation with respect to water. When the secondary ice production via rime-splintering process is switched off, pixels with a liquid mass fraction smaller than 0.9 are reduced significantly at temperatures between −10 and 0 ∘C (Fig. 6b, f).
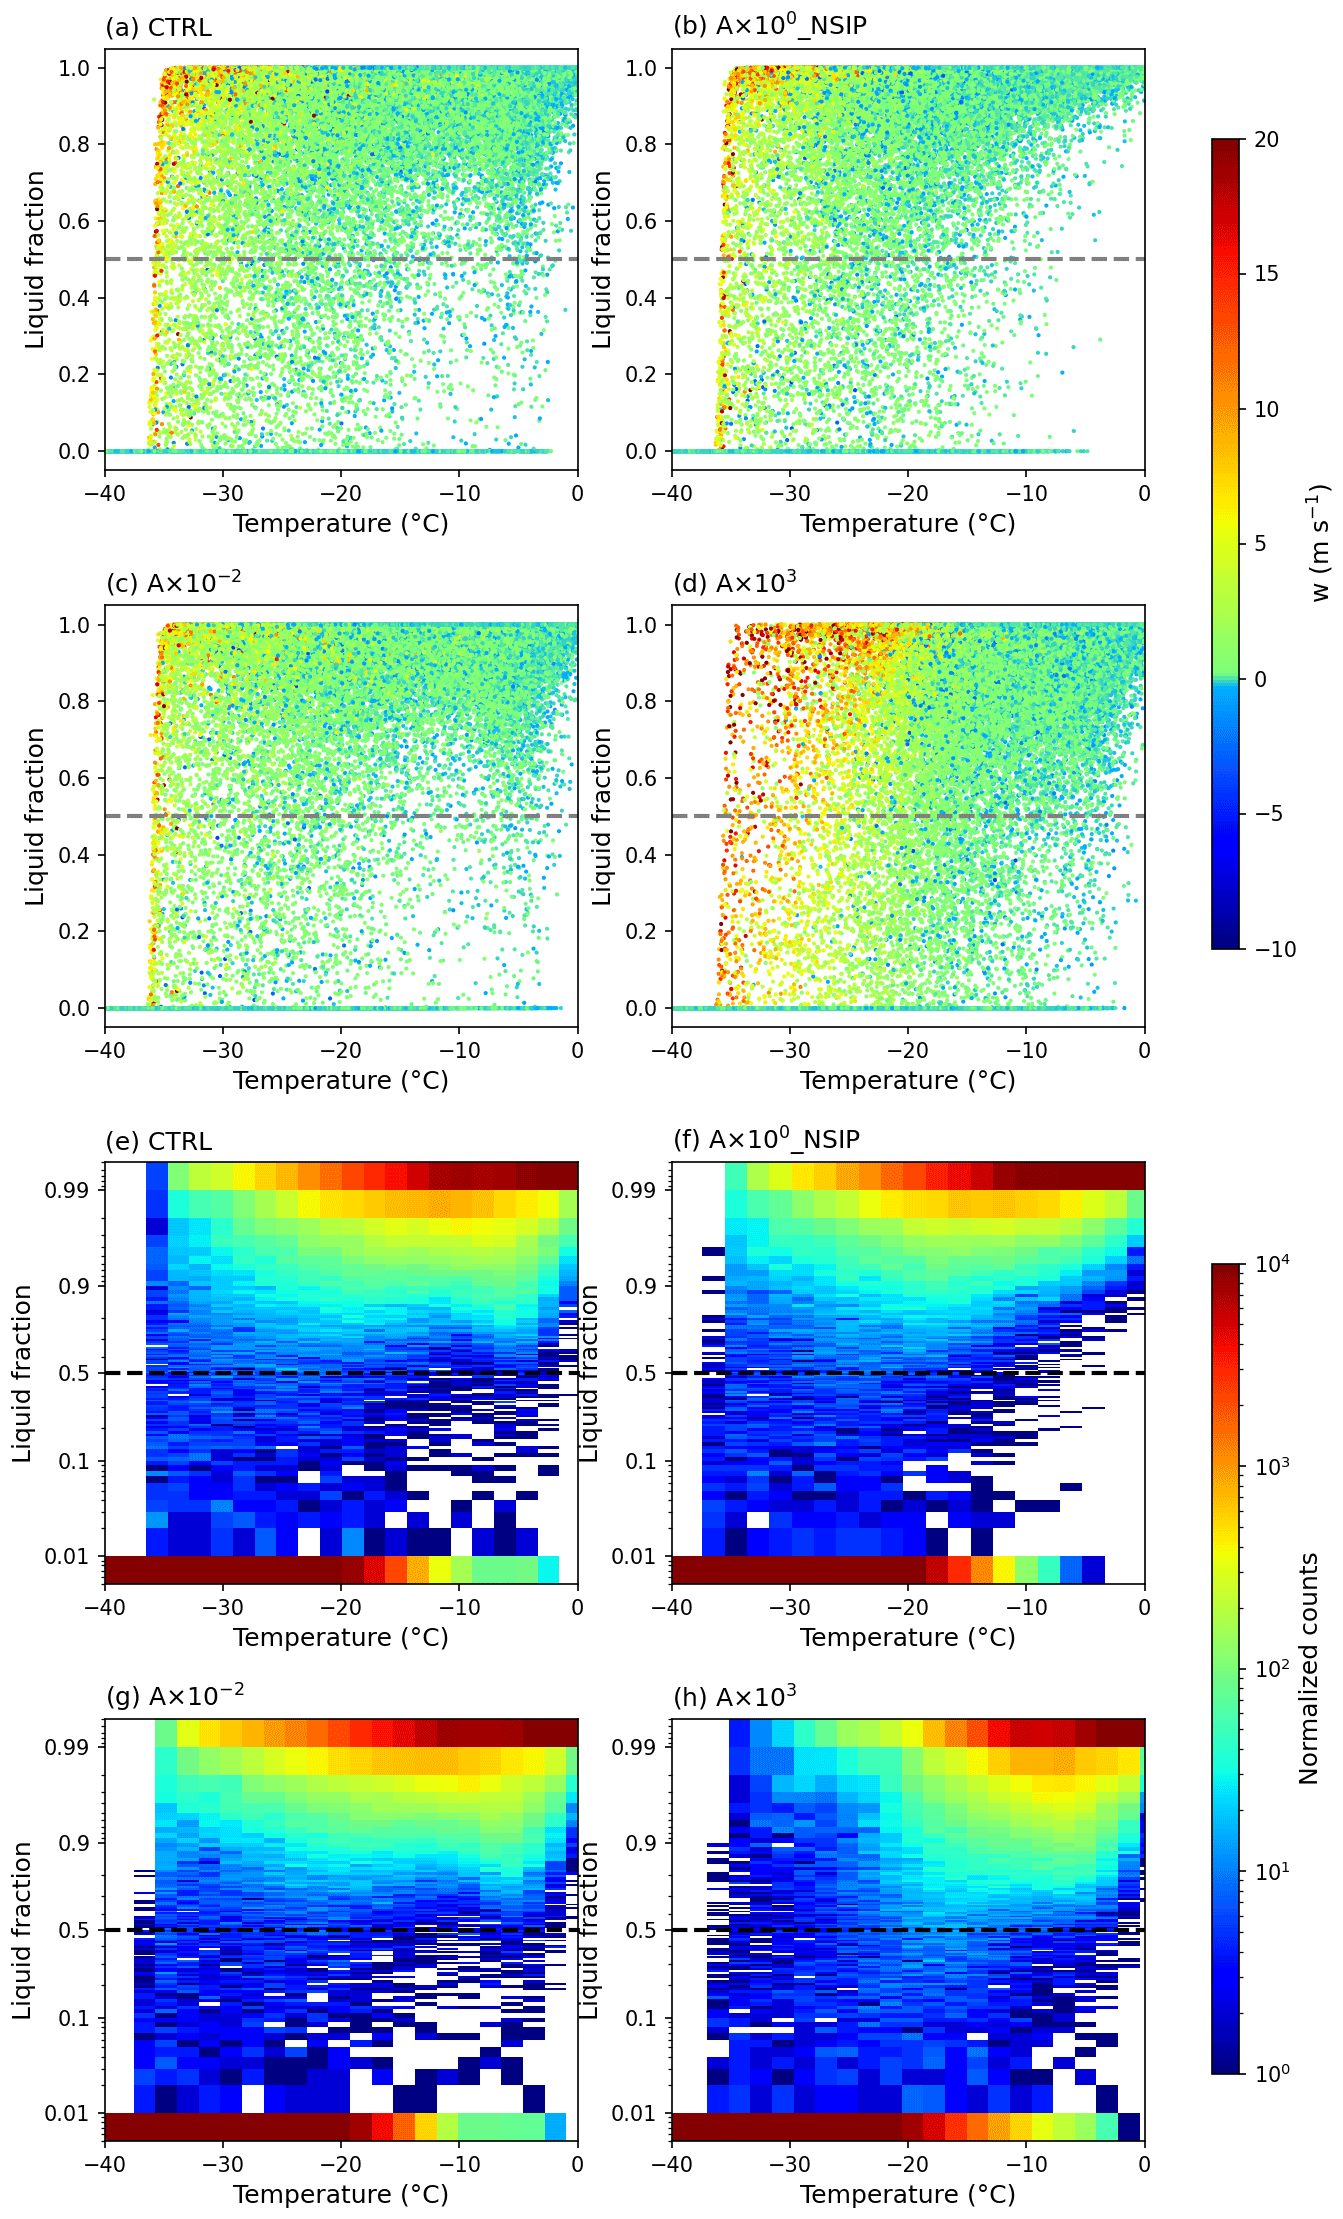
Figure 6In-cloud supercooled liquid mass fraction distribution as a function of temperature (binned by 1 ∘C) between 09:00 and 19:00 UTC (a–d) for the four cases (A×100, A×100_NSIP, , A×103); the color of points indicates the vertical wind velocity (in m s−1). A 2-D histogram of in-cloud liquid mass fraction versus temperature (e–h).
At the cloud top (Fig. 7), the number of pixels with a liquid mass fraction smaller than 0.5 increases with increasing INP concentration, which is the same as within the clouds. “Cloud top” is defined as the height of the uppermost cloud layer (which has a condensed mass of cloud water + cloud total cloud ice greater than a threshold of kg kg−1) in a pixel column. At the cloud top, the liquid mass fraction has a more polarized distribution, with either large values or small values, and intermediate values are less common than within the clouds. This is because the vertical velocities at the cloud top are significantly smaller compared with that within the cloud, leading to a more efficient WBF process at the cloud top.
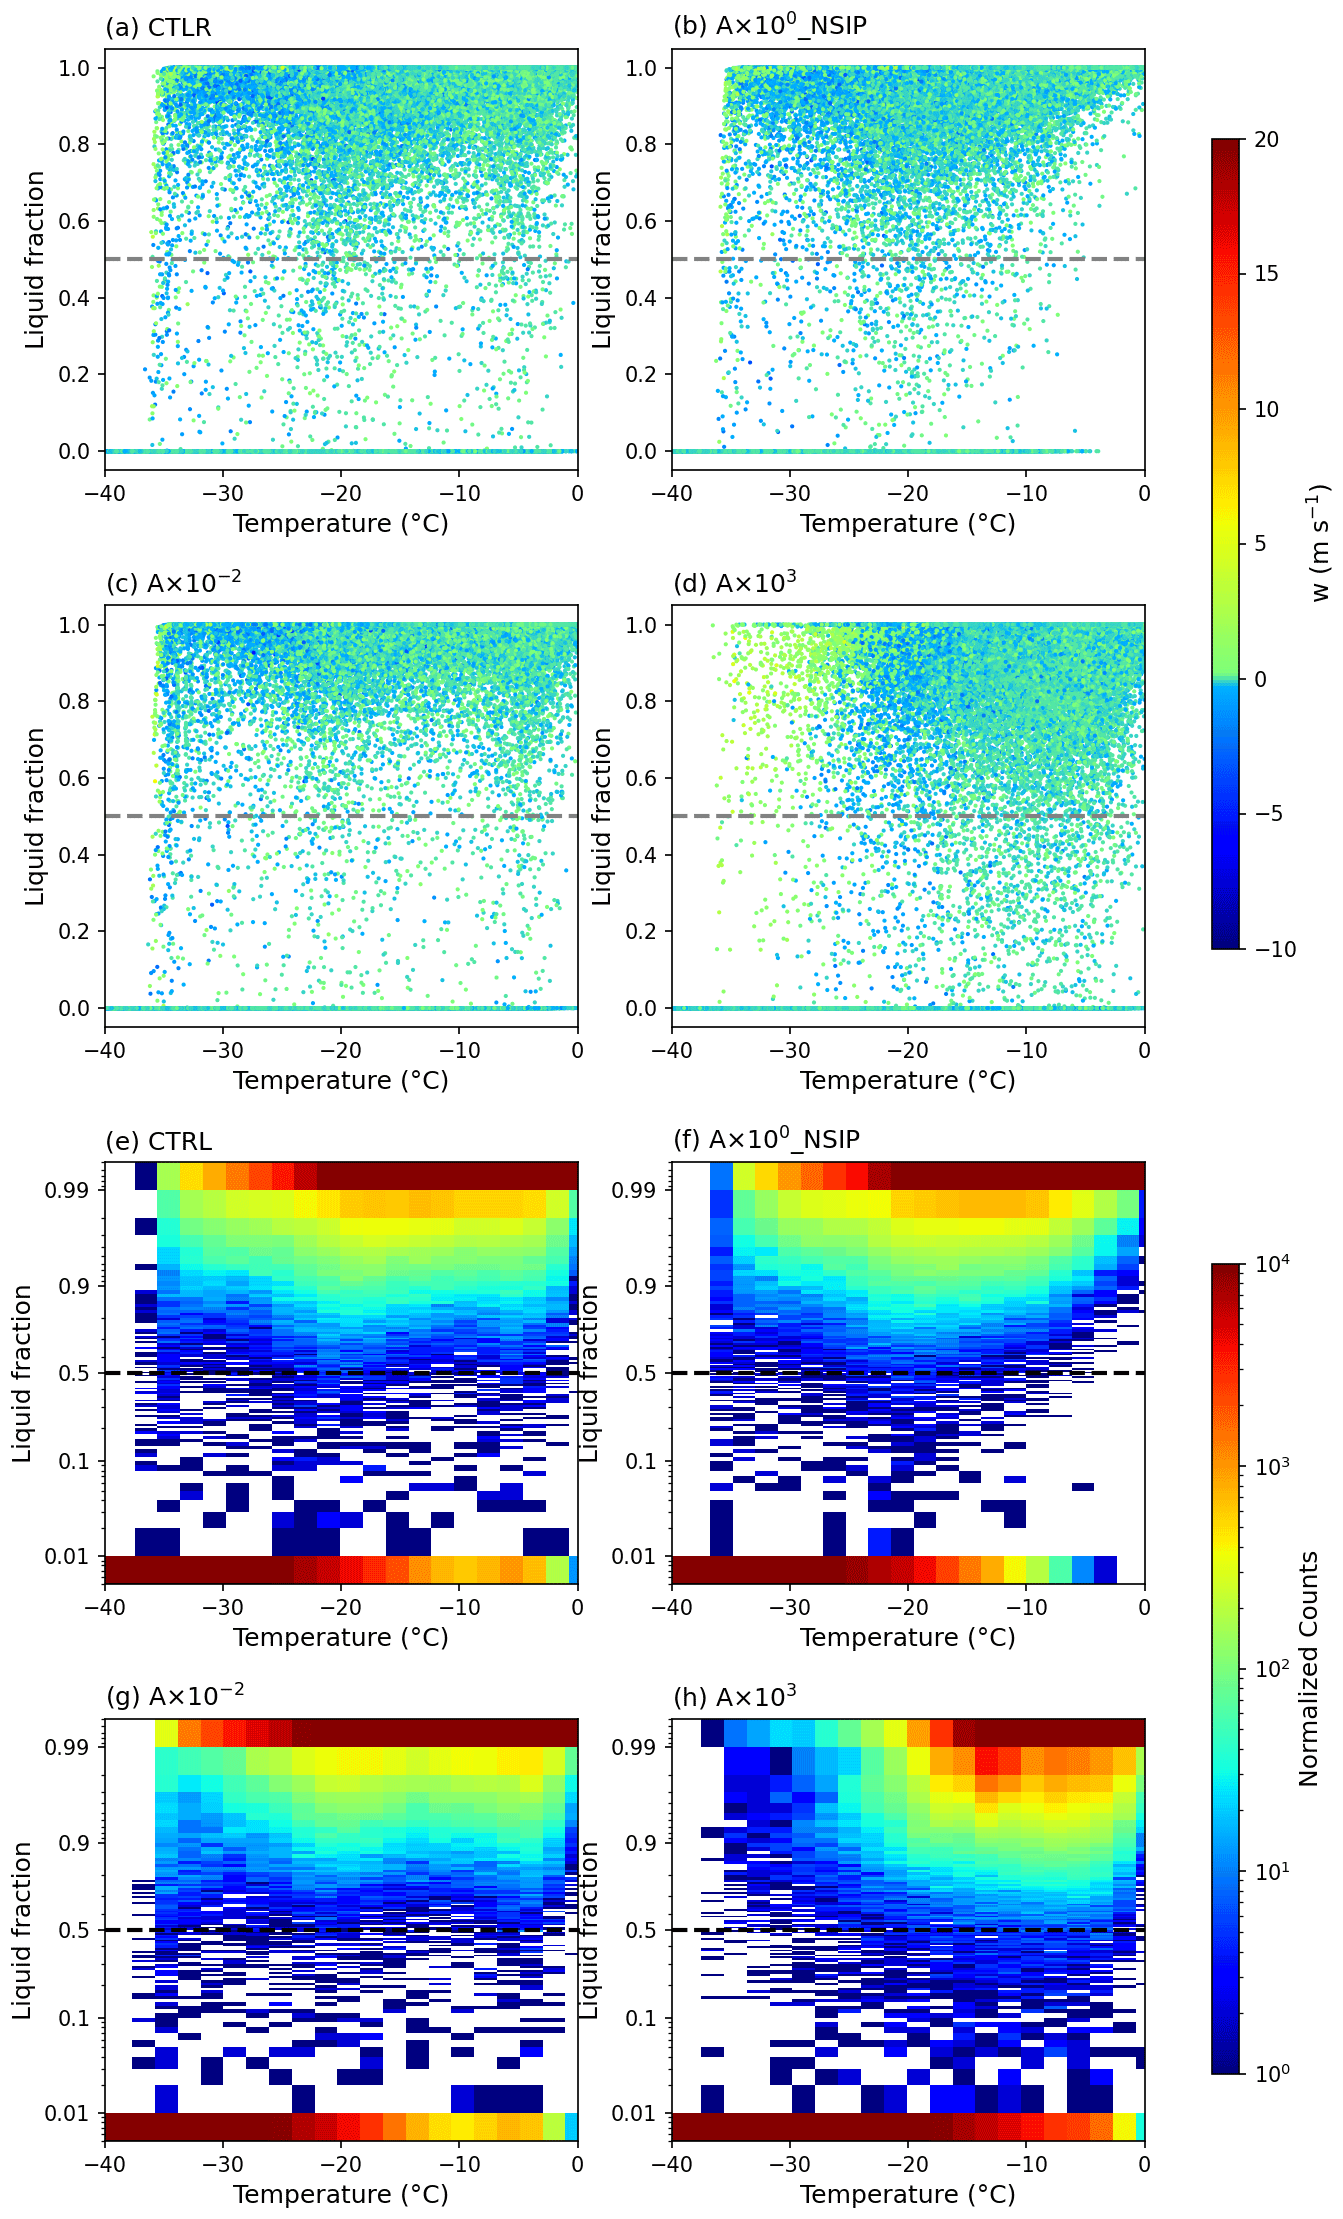
Figure 7Cloud-top supercooled liquid mass fraction distribution as a function of temperature (binned by 1 ∘C) between 09:00 and 19:00 UTC (a–d) for the four cases (A×100, A×100_NSIP, , A×103); the color of points indicates the vertical wind velocity (in m s−1). A 2-D histogram of cloud-top liquid mass fraction versus temperature (e–h).
3.4 Liquid cloud pixel fraction
Liquid cloud pixel fractions are calculated differently for model simulations and retrieved cloud products. For simulation results, a cloudy pixel with a cloud liquid mass fraction larger than 0.5 is counted as a liquid pixel, otherwise it is an ice pixel. Both CLAAS-2 and SEVIRI_ML products and the corresponding retrievals derived from ICON simulations by the satellite forward operators (see Sect. 2.4) provide binary cloud-phase information (liquid or ice) only. For these data, the liquid cloud pixel fraction is calculated as the ratio between the number of liquid cloud pixels and the sum of all cloudy pixels.
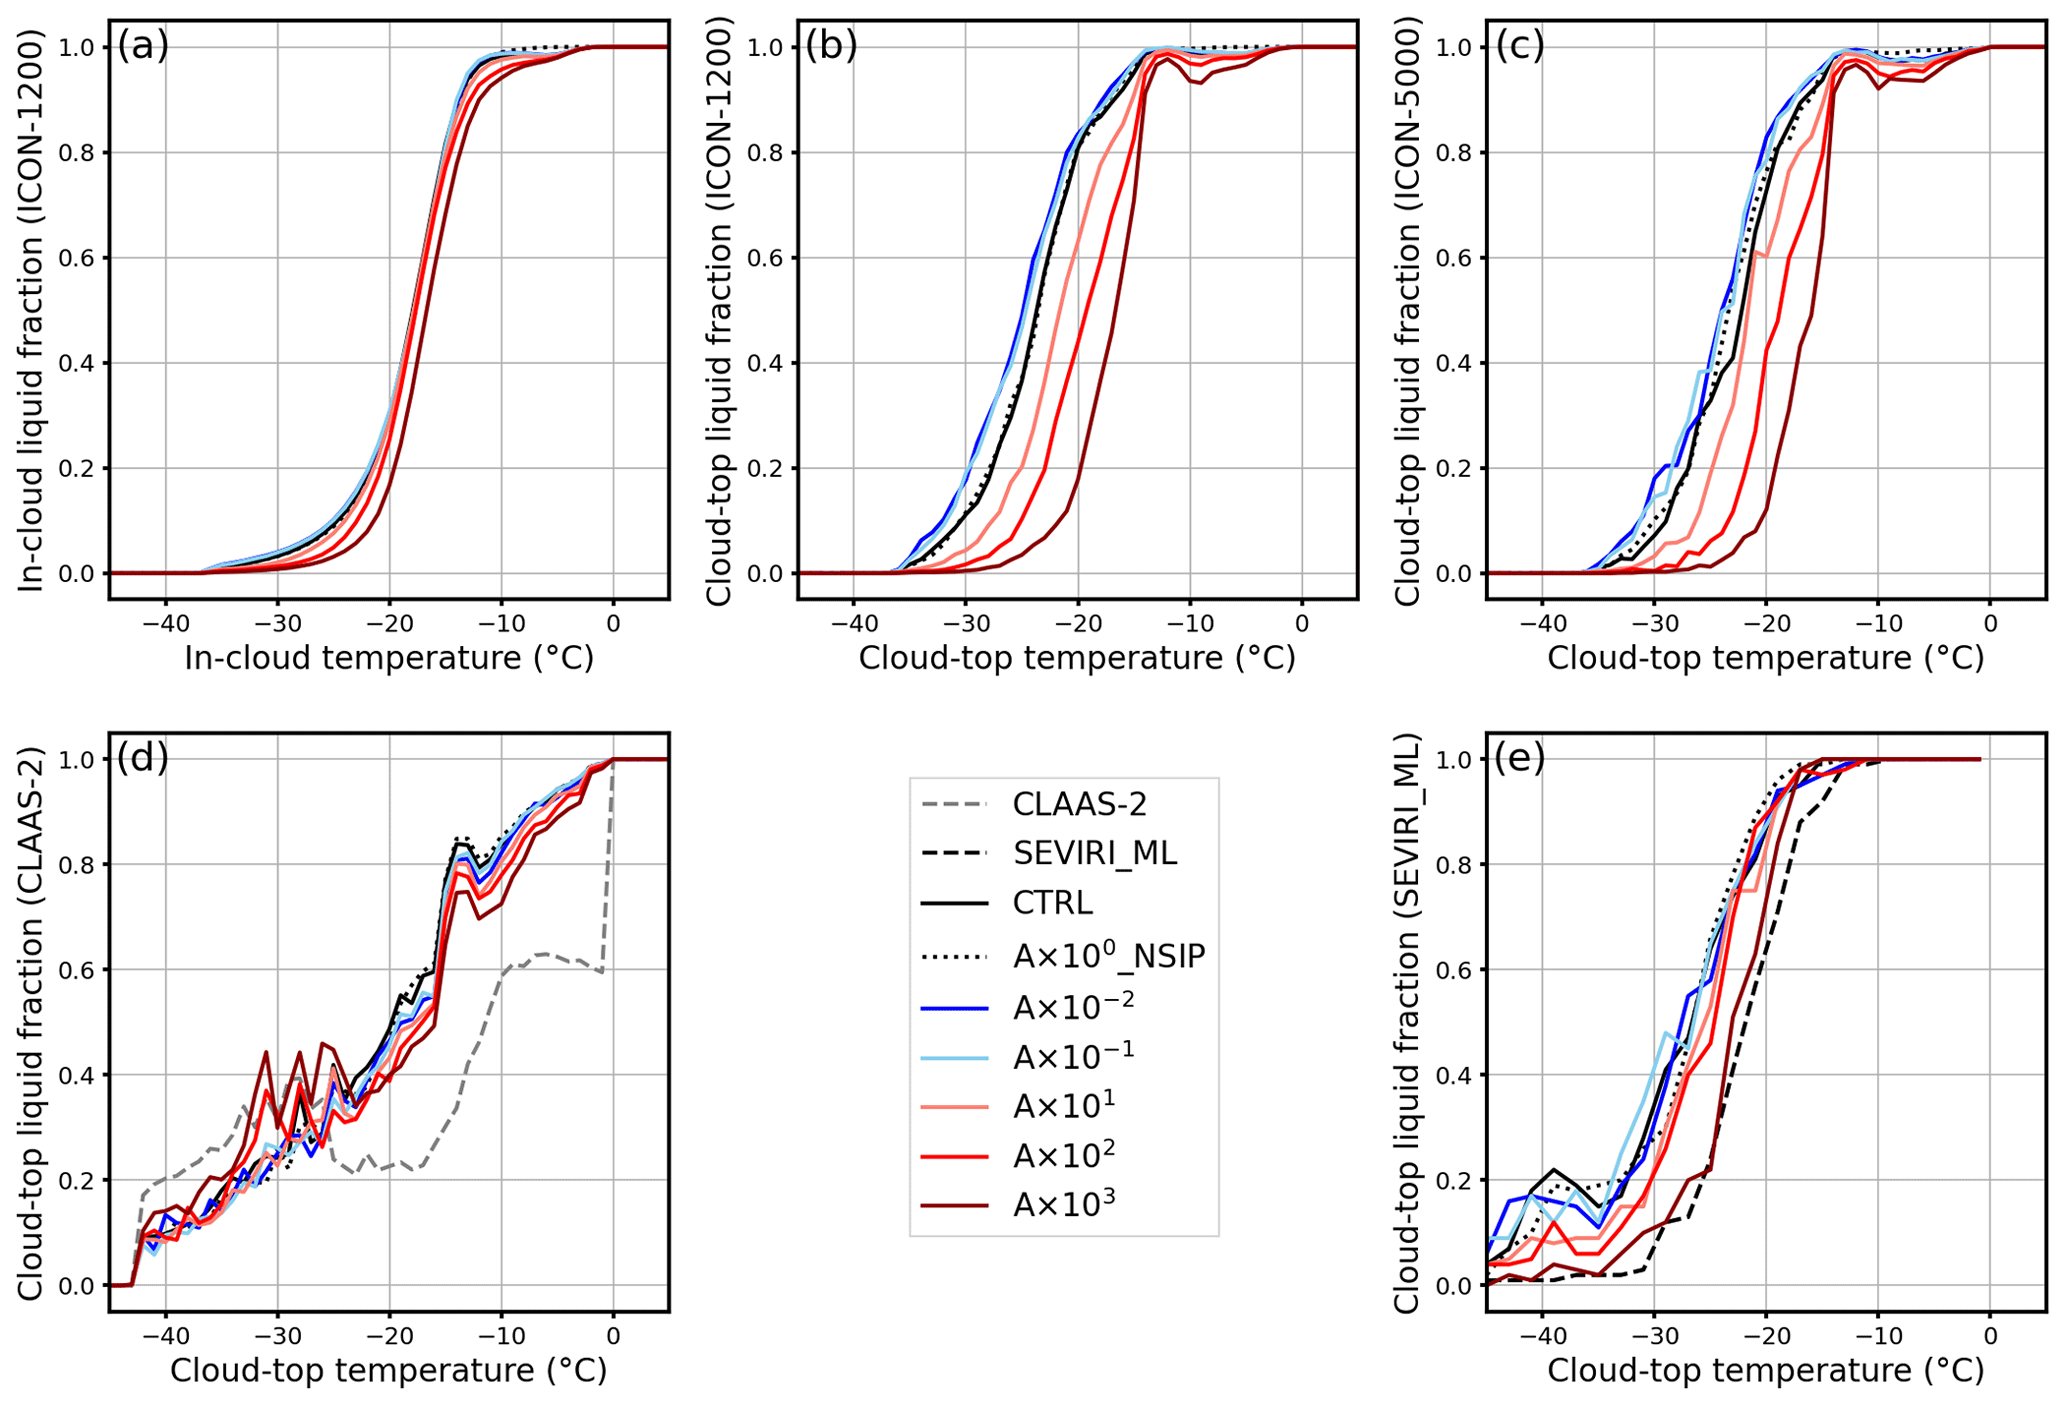
Figure 8Liquid cloud pixel fraction as a function of temperature from 09:00 to 19:00 UTC for the INP sensitivity experiments: (a) in-cloud fraction calculated from simulations on the ICON native grid (∼1200 m), (b) cloud-top fraction calculated from simulations on the ICON native grid (∼1200 m), (c) cloud-top fraction calculated from simulations on the SEVIRI grid (∼5000 m), (d) cloud-top fraction calculated by remote-sensing retrieval algorithms to produce the CLAAS-2 dataset, and (e) cloud-top fraction calculated by the SEVIRI_ML remote-sensing retrieval software suite. The temperature is binned by 1 ∘C in panels (a)–(d) and by 2 ∘C in panel (e).
Liquid cloud pixel fractions within clouds and at the cloud top are shown in Fig. 8. A decrease in the INP concentration has limited impacts on the liquid cloud pixel fraction for in-cloud layers. An increase in the INP concentration leads to a decrease in the liquid cloud pixel fraction but not monotonically (Fig. 8a). The decrease in the liquid cloud pixel fraction is significant in the highest-INP-concentration case (A×103 case), while decreases in intermediate-INP-concentration cases (A×101 and A×102 cases) are only obvious in temperature ranges from −30 to −20 ∘C and from −15 to −5 ∘C.
Moreover, the liquid mass fraction decreases monotonically with increasing INP concentration in the temperature range from about −15 to −35 ∘C, both within the cloud and at the cloud top (except for the lowest INP concentrations), and the decreasing trend is more significant at the cloud top compared with within the cloud (not shown). Switching off the rime-splintering process results in an increase in the liquid cloud pixel fraction in the temperature range between −10 and −3 ∘C, which is consistent with the strong decrease in pixels with a cloud liquid mass fraction lower than 0.9 in the same temperature range (Fig. 7b). The temperature at which the liquid cloud pixel fraction equals 0.5 is often termed the “glaciation temperature”. The glaciation temperature shifts slightly to a warmer temperature (by ∼2 ∘C) in the highest-INP-concentration case (A×103 case; Fig. 8a).
Sensitivities of the cloud phase to the INP concentration are more complex at the cloud top than inside the cloud. Liquid cloud pixel fractions at the cloud top calculated directly from ICON simulations on its native grid (∼1200 m) are shown in Fig. 8b. The cloud-top liquid pixel fraction decreases significantly with increasing INP concentration. In the temperature range between −35 and −15 ∘C, where heterogeneous freezing processes (immersion freezing and deposition nucleation) are dominant, the impact of INP is most pronounced. Above −15 ∘C, the impact of INPs does not disappear, especially in the highest-INP-concentration case (A×103 case). This is mostly likely due to the sedimentation of ice crystals from upper layers and the secondary ice production invigorated by the WBF process. Switching off the rime-splintering process increases the cloud-top liquid pixel fraction only slightly in the temperature range from −10 to −3 ∘C and is almost identical to the control run (CTRL case) outside this temperature range. Interestingly, the shift in the glaciation temperature with increasing INP concentration is about 8 ∘C (Fig. 8b) at the cloud top, which is stronger than that inside the clouds (∼2 ∘C; Fig. 8a). A possible explanation is that, typically, the vertical velocity at the cloud top is smaller than within the cloud, and the ice formation through the WBF process is expected to be more efficient. Thus, the WBF process is more sensitive to INP perturbation at the cloud top than within clouds, and it leads to the glaciation temperature shifting to be more significant at the cloud top.
Liquid cloud pixel fractions at the cloud top calculated directly from ICON simulations on SEVIRI's grid (∼5000 m) are shown in Fig. 8c. They are noisier and do not exhibit the small minimum between −10 and −3 ∘C related to rime splintering, but they are otherwise very similar to Fig. 8b. In contrast, the scale-aware and definition-aware ICON_RTTOV_CLAAS-2 cloud-top liquid pixel fractions shown in Fig. 8d differ markedly from the direct or regridded model output. Above −23 ∘C, an increase and decrease in the INP concentration both lead to a decrease in the cloud-top liquid pixel fraction at a certain temperature, but the high-INP-concentration cases (A×102 and A×103 cases) still exhibit the lowest liquid fractions, whereas the A×100_NSIP case exhibits the highest. Thus, the fingerprints of primary and secondary ice formation are retained in the ICON_RTTOV_CLAAS-2 liquid fraction in this temperature range only for very strong perturbations. At the same time, it must be noted that the decrease in the liquid pixel fraction to values of around 0.8 above −15 ∘C is not related to the rime-splintering process but rather to the application of the CLAAS-2 satellite simulator. Below −23 ∘C, in the high-INP A×102 and A×103 cases, cloud-top liquid pixel fractions even increase with increasing INP concentration. In moderate- and low-INP cases, the impacts of INP perturbation are not pronounced. Moreover, the shape of the cloud-top liquid pixel fraction decreasing with cloud-top temperature is different from that in Fig. 8b. Here, the fingerprints of the ice formation processes are completely lost. As demonstrated in Fig. 8c, remapping of simulation data onto SEVIRI's coarser grid is not the cause of the liquid pixel fraction difference between direct ICON output and the ICON_RTTOV_CLAAS-2 diagnostics, rather the CLAAS-2 retrieval algorithm itself is responsible.
The satellite-observed cloud-top liquid pixel fraction from CLAAS-2 is plotted as a dashed gray line in Fig. 8d. It does not reach 1.0 for all cases even as the cloud-top temperature is approaching 0 ∘C, and it shows a different temperature dependency than the simulated curves. No matter how strongly the INP concentration and rime splintering are perturbed, the retrieved cloud-top liquid pixel fractions from simulation data deviate strongly from the CLAAS-2 products. In this context, one should note that, in particular, cloud edges have been found to be problematic situations for the cloud retrievals, being to some extent responsible for biasing the liquid pixel fraction towards smaller values, in particular for the CLAAS-2 data.
Finally, the comparison to observations is repeated with the SEVIRI_ML retrieval scheme applied to both simulated radiances (ICON_RTTOV_SEVIRI_ML) and the SEVIRI observations themselves (Fig. 8e). As SEVIRI_ML provides uncertainty estimates, pixels for which either the cloud mask uncertainty or the cloud-phase uncertainty is larger than 10 % are filtered out. While this ensures that only very certain values are kept, it has a significant impact on the number of remaining values, as more than 90 % of the pixels are filtered out. The filtering affects pixels rather randomly; thus, we could not identify any patterns of pixels, such as cloud edges, that are primarily affected by the filtering. The resulting liquid pixel fractions ICON_RTTOV_SEVIRI_ML bear a much stronger similarity to the regridded model output in Fig. 8c. Remaining differences are a noisier behavior, a plateau of nonzero liquid pixel fractions even below −40 ∘C, and a general shift to lower temperatures. SEVIRI_ML applied to observations (dashed black line in Fig. 8e), with the same uncertainty criterion, exhibits the expected behavior, with a liquid fraction of approximately 1 above −10 ∘C and 0 below approximately −30 ∘C, and results in a very good agreement with the A×103 case. Generally, the SEVIRI_ML retrieval algorithm is assumed to perform better than the CLAAS-2 scheme for both cloud-top temperature and cloud phase. This is because SEVIRI_ML employs state-of-the-art neural networks to emulate CALIOP v4 data. Moreover, SEVIRI_ML provides uncertainty estimates that facilitate filtering out pixels with high uncertainties. Nevertheless, retrieval inaccuracies are unavoidable for passive satellite retrievals, which holds true for CLAAS-2 as well as for SEVIRI_ML.
3.5 Sensitivity of the cloud phase to atmospheric stability perturbations
In addition to the reference run (CTRL case), four cases with perturbations in the initial temperatures are analyzed. Mean updraft velocities increase gradually from the low-CAPE case INC05 to the high-CAPE case DEC05 (Fig. 9) and cause differences in cloud microphysics and cloud-phase distributions.
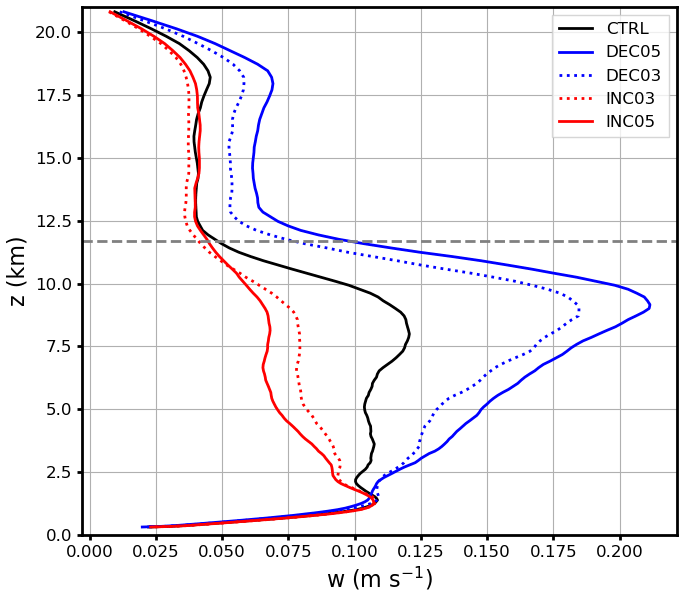
Figure 9Spatiotemporally averaged (09:00–19:00 UTC) profiles of vertical velocities (w values ≤ 0 m s−1 are excluded). The dashed gray line indicates the cloud-top height, which is about 11.7 km.
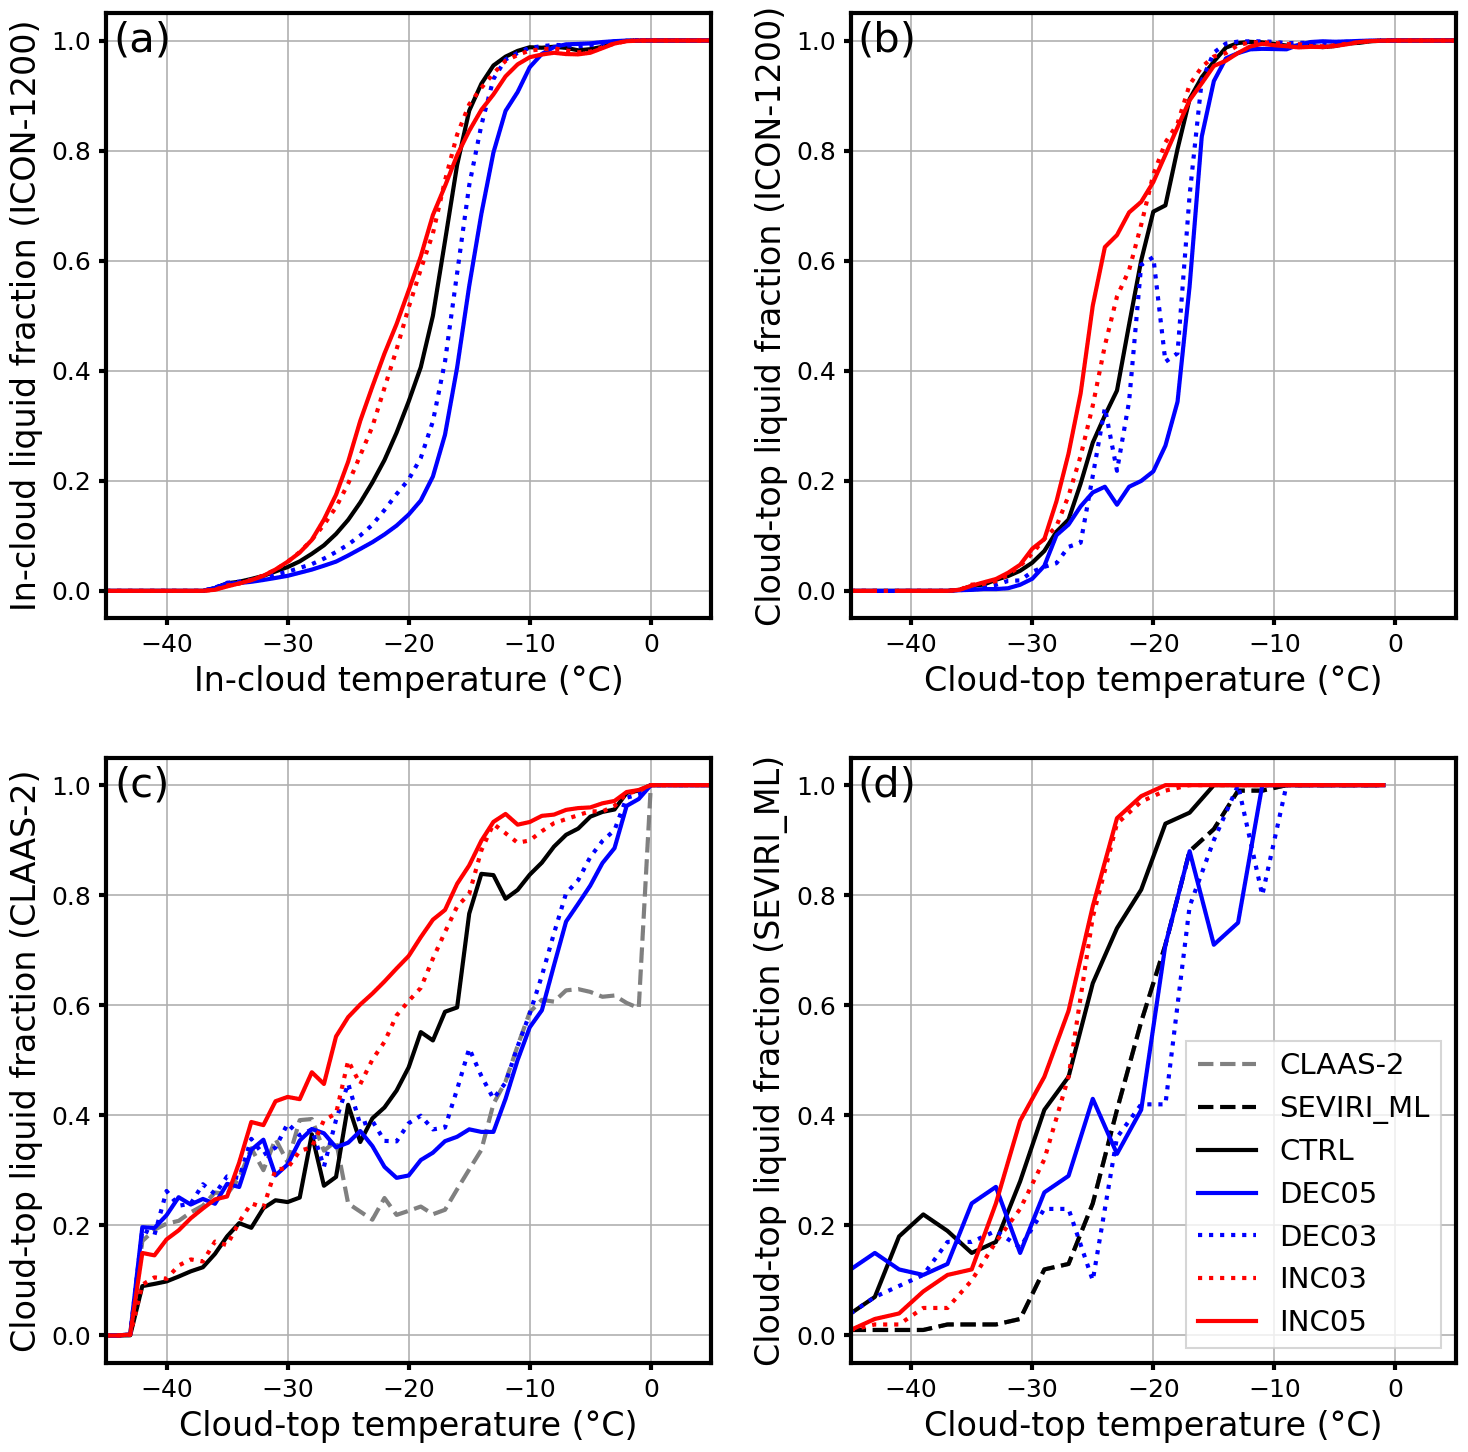
Figure 10Liquid cloud pixel fraction as a function of temperature from 09:00 to 19:00 UTC for the thermodynamic sensitivity experiments: (a) in-cloud fraction calculated directly from simulations, (b) cloud-top fraction calculated directly from simulations, (c) cloud-top fraction calculated by remote-sensing retrieval algorithms to produce the CLAAS-2 dataset, and (d) cloud-top fraction calculated by the SEVIRI_ML remote-sensing retrieval software suite. The temperature is binned by 1 ∘C in panels (a)–(c) and by 2 ∘C in panel (d).
The in-cloud and cloud-top liquid cloud pixel fractions for the five cases are shown in Fig. 10. Systematic shifting of liquid cloud pixel fractions is detected, both inside clouds and at the cloud top. The liquid cloud pixel fraction decreases with increasing CAPE from INC05 to DEC05. Both in-cloud and cloud-top glaciation temperatures shift toward warmer temperatures as the CAPE increases from the INC05 case to the DEC05 case. This is different from the results reported by Hoose et al. (2018), who found that cloud-top glaciation temperatures hardly changed (by 2 ∘C) with increasing temperature in the boundary layer, and appears to be contradictory to the expectation that stronger vertical velocities result in a lower glaciation temperature due to suppression of the WBF process (Korolev, 2007). Further analysis (not shown) revealed that the mass concentration of cloud ice particle increases while the mass concentration of cloud droplet decreases with the increase in CAPE from the INC05 case to the DEC05 case. Moreover, homogeneous and heterogeneous freezing are both enhanced in the high-CAPE cases (Fig. 11), possibly due to more transport of moisture to upper levels in the stronger updrafts (Fig. 9). With more ice generated, the WBF process can be stimulated, despite the higher updrafts. Interestingly, cloud-top liquid pixel fractions from the two high-CAPE cases (DEC03 and DEC05) are closer to SEVIRI observations, both using the CLAAS-2 retrieval (Fig. 10c) and the SEVIRI_ML retrieval (Fig. 10d), especially in the temperature range between −10 and −28 ∘C.
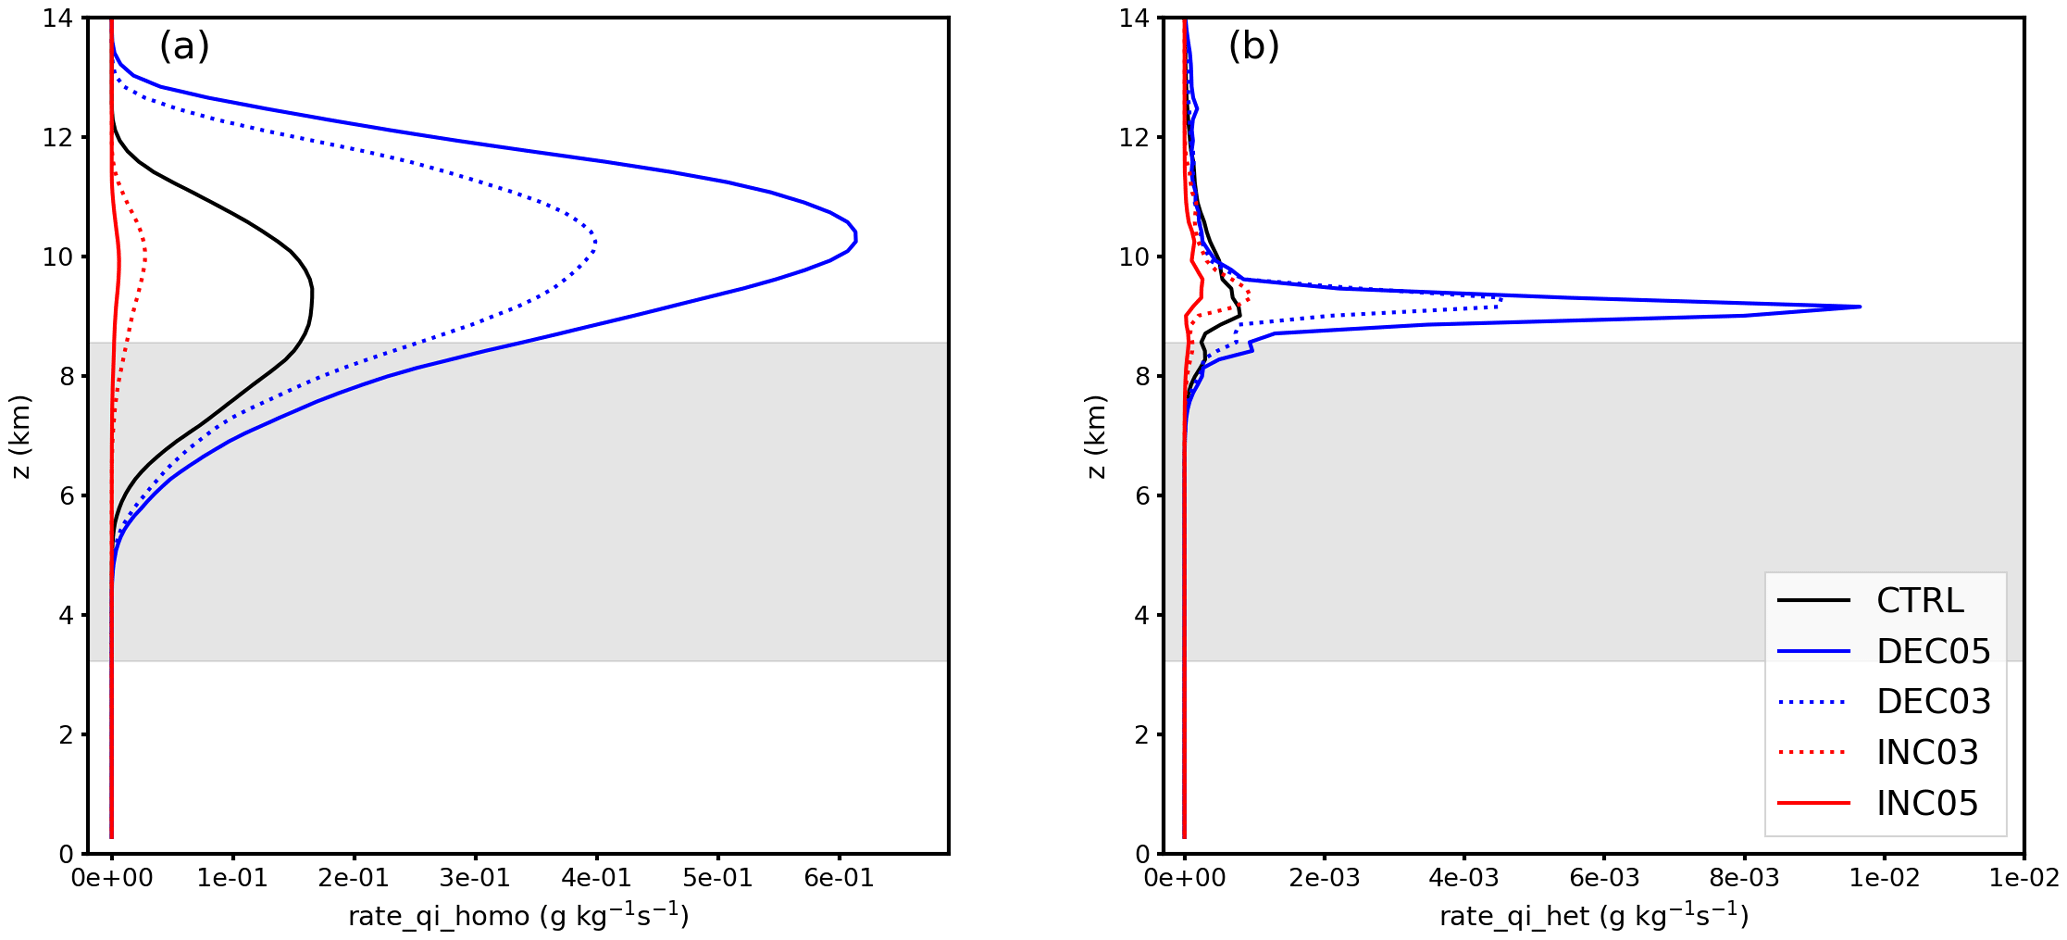
Figure 11Spatiotemporally averaged (09:00–19:00 UTC) profiles of process rates (in g kg−1 s−1) of (a) homogeneous freezing and (b) heterogeneous freezing (immersion and deposition nucleation) for cases with perturbed initial thermodynamic states. Shaded areas indicate the spatiotemporally averaged mixed-phase regions.
Compared with the INP perturbation, the impact of thermodynamical perturbation on the cloud-phase distribution is significantly stronger within the cloud (Figs. 8a, 10a). At the cloud top, the effect of perturbation in thermodynamics on the cloud-phase distribution is as large as the largest INP perturbation (A×103 case). Moreover, the impacts of thermodynamical perturbation on domain-averaged profiles of cloud hydrometeors and process rates related to the ice cloud process are also significantly stronger than the INP perturbation. Thus, the thermodynamical perturbation is stronger than the INP perturbation when the entire depth of the cloud is considered. Overall, perturbing the initial thermodynamic states or CAPE of convective clouds is equally important to, or possibly even more significant than, modifying cloud heterogeneous freezing parameterizations for determining cloud-phase distribution.
Remote-sensing products, which cover the entire globe, provide a unique opportunity to constrain the representation of cloud microphysics in global and regional numerical models. In this study, instead of comparing simulation results to satellite observations directly, we derived cloud properties using a radiative transfer model and two different satellite remote-sensing retrieval algorithms and then performed the comparison. This enables us to make apples-to-apples comparisons between model simulations and satellite observations. A series of numerical experiments were performed by applying convection-permitting simulations with perturbations in the INP concentrations and initial thermodynamic states to investigate their impacts on cloud-phase distributions in deep convective clouds. Moreover, cloud properties were derived using a satellite forward operator and retrieval algorithms with ICON simulations as input, and they were compared with CLAAS-2 and SEVIRI_ML satellite cloud products to evaluate whether satellite retrievals could detect perturbations in cloud microphysics and thermodynamics. Uncertainties in the forward operator were, however, not assessed in this study, which may influence the validity of corresponding results to some extent.
The INP concentration was found to have a significant role in shaping cloud-phase distributions, both within clouds and at the cloud top. The cloud liquid pixel fraction decreased with increasing INP concentration both within the cloud and at the cloud top, indicating a higher glaciation temperature and more intense heterogeneous freezing processes in enhanced-INP-concentration cases. Interestingly, the influences of INPs did not increase linearly: influences were more pronounced in the high-INP-concentration cases. In addition, the shifting of the glaciation temperature was more significant at the cloud top than within the cloud, which means that the impact of the INP concentration on the cloud-phase distribution is more pronounced at the cloud top. It was found that the INP sensitivity of the cloud-top phase distribution was not detectable with the CLAAS-2 retrieval scheme, while the SEVIRI_ML retrieval scheme, for which the most uncertain pixels could be excluded, resulted in a better agreement and retained the sensitivity to INPs. In contrast, secondary ice production via rime splintering did not have a detectable impact on the cloud-top phase distribution. Therefore, in future studies, we recommend using the SEVIRI_ML retrieval scheme and SEVIRI_ML satellite-based cloud products.
Ice crystal mass concentration did not increase, but rather decreased, with increasing INP concentrations in the simulated deep convective clouds. Process rate analyses revealed that heterogeneous freezing process rates increased with increasing INP concentration, whereas homogeneous freezing process rates decreased with increasing INP concentration. The competition between heterogeneous freezing and homogeneous freezing for water vapor suppressed ice formation via homogeneous freezing, which was the dominant nucleation process in the simulated deep convective clouds, and hence reduced the cloud ice mass concentration. The increase in heterogeneous nucleation in high-INP cases invigorated riming and collection processes of ice particles, making it easier for small ice crystals to grow into large ice aggregates and sediment to lower levels. This was the reason why precipitation increased in enhanced-INP cases.
Perturbations in initial thermodynamic states had a strong impact on the cloud-phase distribution, both within the cloud and at the cloud top, although the perturbations used might be rather large compared with the initial condition uncertainty in a weather forecasting context. Moreover, cloud thermodynamics can perturb the cloud-phase distribution more strongly than microphysics. To completely distinguish microphysical impacts from thermodynamic impacts, the application of a piggybacking approach (Grabowski, 2015; Thomas et al., 2023) is necessary in future simulations.
Utilizing satellite forward operator (the RTTOV radiative model) and remote-sensing retrieval algorithms enabled us to derive cloud-top microphysical properties and compare simulation results to satellite products more consistently. However, there were significant differences in retrieved cloud-top liquid fractions between model simulations and satellite products. The sources of errors were very complicated and may come from simulation results, satellite operators, and retrieval algorithms, which will be investigated in the future. Moreover, the cloud-top property analysis presented in this study was based on domain-wide statistics, including clouds of varying types. Statistical results could differ if individual clouds were tracked, as clouds vary in different experiments in terms of locations and extents. Although there are significant uncertainties in satellite forward operators and retrieval algorithms, passively remote-sensed cloud products provide potential opportunities to constrain microphysical processes in numerical models.
The simulation results of this study revealed a close dependence of heterogeneous freezing and cloud-phase distribution on INP concentrations. Despite this finding, the ice formation processes in deep convective clouds remain poorly understood. It is necessary to investigate how and the conditions under which the competition of heterogeneous freezing with homogeneous freezing for water vapor and cloud water depends on INP availability and vertical velocities in different types of deep convective clouds. Moreover, the importance of secondary ice production processes other than rime splintering (droplet shattering and collisional breakup) in deep convective clouds needs to be quantified in the future.
The codes and data supporting the findings of this study are available from the corresponding author upon reasonable request.
CHo and CHa conceptualized the study; CHa did the ICON simulation, ran the RTTOV model, and analyzed the results; MS ran the retrieval algorithms and analyzed the results; CHa wrote the paper with support from all co-authors; and CHa and CHo oversaw the review process.
At least one of the (co-)authors is a member of the editorial board of Atmospheric Chemistry and Physics. The peer-review process was guided by an independent editor, and the authors also have no other competing interests to declare.
Publisher's note: Copernicus Publications remains neutral with regard to jurisdictional claims made in the text, published maps, institutional affiliations, or any other geographical representation in this paper. While Copernicus Publications makes every effort to include appropriate place names, the final responsibility lies with the authors.
This project has received funding from the European Research Council (ERC) under the European Union's Horizon 2020 Research and Innovation program (grant agreement no. 714062; ERC Starting Grant “C2Phase”). The authors gratefully acknowledge the computing time allowed by the German Climate Computing Centre (DKRZ) on the Mistral HPC system and the Steinbuch Centre for Computing (SCC) on the ForHLR II HPC system. The contribution of Martin Stengel was supported by EUMETSAT and its member states through CM SAF.
The article processing charges for this open-access publication were covered by the Karlsruhe Institute of Technology (KIT).
This paper was edited by Yuan Wang and reviewed by two anonymous referees.
Barrett, A. I. and Hoose, C.: Microphysical pathways active within thunderstorms and their sensitivity to CCN concentration and wind shear, J. Geophys. Res.-Atmos., 128, e2022JD036965, https://doi.org/10.1029/2022JD036965, 2023.
Barthlott, C. and Hoose, C.: Aerosol effects on clouds and precipitation over central Europe in different weather regimes, J. Atmos. Sci., 75, 4247–4264, https://doi.org/10.1175/JAS-D-18-0110.1, 2018.
Benas, N., Finkensieper, S., Stengel, M., van Zadelhoff, G. J., Hanschmann, T., Hollmann, R., and Meirink, J. F.: The MSG-SEVIRI-based cloud property data record CLAAS-2, Earth Syst. Sci. Data, 9, 415–434, https://doi.org/10.5194/essd-9-415-2017, 2017.
Bruno, O., Hoose, C., Storelvmo, T., Coopman, Q., and Stengel, M.: Exploring the cloud top phase partitioning in different cloud types using active and passive satellite sensors, Geophys. Res. Lett., 48, e2020GL089863, https://doi.org/10.1029/2020GL089863, 2021.
Coopman, Q., Hoose, C., and Stengel, M.: Analysis of the thermodynamic phase transition of tracked convective clouds based on geostationary satellite observations, J. Geophys. Res.-Atmos., 125, e2019JD032146, https://doi.org/10.1029/2019JD032146, 2020.
Coopman, Q., Hoose, C., and Stengel, M.: Analyzing the thermodynamic phase partitioning of mixed phase clouds over the southern ocean using passive satellite observations, Geophys. Res. Lett., 48, e2021GL093225, https://doi.org/10.1029/2021GL093225, 2021.
Dee, D. P., Uppala, S. M., Simmons, A. J., Berrisford, P., Poli, P., Kobayashi, S., Andrae, U., Balmaseda, M. A., Balsamo, G., Bauer, P., Bechtold, P., Beljaars, A. C. M., van de Berg, L., Bidlot, J., Bormann, N., Delsol, C., Dragani, R., Fuentes, M., Geer, A. J., Haimberger, L., Healy, S. B., Hersbach, H., Hólm, E. V., Isaksen, L., Kållberg, P., Köhler, M., Matricardi, M., McNally, A. P., Monge-Sanz, B. M., Morcrette, J. J., Park, B. K., Peubey, C., de Rosnay, P., Tavolato, C., Thépaut, J. N., and Vitart, F.: The ERA-Interim reanalysis: configuration and performance of the data assimilation system, Q. J. Roy. Meteorol. Soc., 137, 553–597, https://doi.org/10.1002/qj.828, 2011.
Deng, X., Xue, H., and Meng, Z.: The effect of ice nuclei on a deep convective cloud in South China, Atmos. Res., 206, 1–12, https://doi.org/10.1016/j.atmosres.2018.02.013, 2018.
Derrien, M. and Le Gléau, H.: MSG/SEVIRI cloud mask and type from SAFNWC, Int. J. Remote Sens., 26, 4707–4732, https://doi.org/10.1080/01431160500166128, 2005.
Fan, J., Comstock, J. M., and Ovchinnikov, M.: The cloud condensation nuclei and ice nuclei effects on tropical anvil characteristics and water vapor of the tropical tropopause layer, Environ. Res. Lett., 5, 044005, https://doi.org/10.1088/1748-9326/5/4/044005, 2010.
Fan, J., Wang, Y., Rosenfeld, D., and Liu, X.: Review of aerosol–cloud interactions: Mechanisms, significance, and challenges, J. Atmos. Sci., 73, 4221–4252, https://doi.org/10.1175/JAS-D-16-0037.1, 2016.
Field, P. R., Hogan, R. J., Brown, P. R. A., Illingworth, A. J., Choularton, T. W., Kaye, P. H., Hirst, E., and Greenaway, R.: Simultaneous radar and aircraft observations of mixed-phase cloud at the 100 m scale, Q. J. Roy. Meteorol. Soc., 130, 1877–1904, https://doi.org/10.1256/qj.03.102, 2004.
Gassmann, A. and Herzog, H.-J.: Towards a consistent numerical compressible non-hydrostatic model using generalized Hamiltonian tools, Q. J. Roy. Meteorol. Soc., 134, 1597–1613, https://doi.org/10.1002/qj.297, 2008.
Geiss, S., Scheck, L., de Lozar, A., and Weissmann, M.: Understanding the model representation of clouds based on visible and infrared satellite observations, Atmos. Chem. Phys., 21, 12273–12290, https://doi.org/10.5194/acp-21-12273-2021, 2021.
Grabowski, W. W.: Untangling microphysical impacts on deep convection applying a novel modeling methodology, J. Atmos. Sci., 72, 2446–2464, https://doi.org/10.1175/JAS-D-14-0307.1, 2015.
Grabowski, W. W., Morrison, H., Shima, S.-I., Abade, G. C., Dziekan, P., and Pawlowska, H.: Modeling of cloud microphysics: Can we do better?, B. Am. Meteorol. Soc., 100, 655–672, https://doi.org/10.1175/BAMS-D-18-0005.1, 2019.
Hande, L. B., Engler, C., Hoose, C., and Tegen, I.: Seasonal variability of Saharan desert dust and ice nucleating particles over Europe, Atmos. Chem. Phys., 15, 4389–4397, https://doi.org/10.5194/acp-15-4389-2015, 2015.
Hande, L. B., Engler, C., Hoose, C., and Tegen, I.: Parameterizing cloud condensation nuclei concentrations during HOPE, Atmos. Chem. Phys., 16, 12059–12079, https://doi.org/10.5194/acp-16-12059-2016, 2016.
Hawker, R. E., Miltenberger, A. K., Wilkinson, J. M., Hill, A. A., Shipway, B. J., Cui, Z., Cotton, R. J., Carslaw, K. S., Field, P. R., and Murray, B. J.: The temperature dependence of ice-nucleating particle concentrations affects the radiative properties of tropical convective cloud systems, Atmos. Chem. Phys., 21, 5439–5461, https://doi.org/10.5194/acp-21-5439-2021, 2021.
Heymsfield, A. J., Miloshevich, L. M., Schmitt, C., Bansemer, A., Twohy, C., Poellot, M. R., Fridlind, A., and Gerber, H.: Homogeneous ice nucleation in subtropical and tropical convection and its influence on cirrus anvil microphysics, J. Atmos. Sci., 62, 41–64, https://doi.org/10.1175/JAS-3360.1, 2005.
Hoose, C. and Möhler, O.: Heterogeneous ice nucleation on atmospheric aerosols: a review of results from laboratory experiments, Atmos. Chem. Phys., 12, 9817–9854, https://doi.org/10.5194/acp-12-9817-2012, 2012.
Hoose, C., Karrer, M., and Barthlott, C.: Cloud top phase distributions of simulated deep convective clouds, J. Geophys. Res.-Atmos., 123, 10464–10476, https://doi.org/10.1029/2018JD028381, 2018.
Kanji, Z. A., Ladino, L. A., Wex, H., Boose, Y., Burkert-Kohn, M., Cziczo, D. J., and Krämer, M.: Overview of ice nucleating particles, Meteorol. Monogr., 58, 1.1–1.33, https://doi.org/10.1175/AMSMONOGRAPHS-D-16-0006.1, 2017.
Kärcher, B., Hendricks, J., and Lohmann, U.: Physically based parameterization of cirrus cloud formation for use in global atmospheric models, J. Geophys. Res.-Atmos., 111, D01205, https://doi.org/10.1029/2005JD006219, 2006.
Kay, J. E., L'Ecuyer, T., Pendergrass, A., Chepfer, H., Guzman, R., and Yettella, V.: Scale-aware and definition-aware evaluation of modeled near-surface precipitation frequency using CloudSat observations, J. Geophys. Res.-Atmos., 123, 4294–4309, https://doi.org/10.1002/2017JD028213, 2018.
Keil, C., Baur, F., Bachmann, K., Rasp, S., Schneider, L., and Barthlott, C.: Relative contribution of soil moisture, boundary-layer and microphysical perturbations on convective predictability in different weather regimes, Q. J. Roy. Meteorol. Soc., 145, 3102–3115, https://doi.org/10.1002/qj.3607, 2019.
Korolev, A.: Limitations of the Wegener–Bergeron–Findeisen mechanism in the evolution of mixed-phase clouds, J. Atmos. Sci., 64, 3372–3375, https://doi.org/10.1175/JAS4035.1, 2007.
Korolev, A. and Isaac, G. A.: Relative humidity in liquid, mixed-phase, and ice clouds, J. Atmos. Sci., 63, 2865–2880, https://doi.org/10.1175/JAS3784.1, 2006.
Korolev, A., McFarquhar, G., Field, P. R., Franklin, C., Lawson, P., Wang, Z., Williams, E., Abel, S. J., Axisa, D., Borrmann, S., Crosier, J., Fugal, J., Krämer, M., Lohmann, U., Schlenczek, O., Schnaiter, M., and Wendisch, M.: Mixed-phase clouds: Progress and challenges, Meteorol. Monogr., 58, 5.1–5.50, https://doi.org/10.1175/AMSMONOGRAPHS-D-17-0001.1, 2017.
Korolev, A. V., Isaac, G. A., Cober, S. G., Strapp, J. W., and Hallett, J.: Microphysical characterization of mixed-phase clouds, Q. J. Roy. Meteorol. Soc., 129, 39–65, https://doi.org/10.1256/qj.01.204, 2003.
Li, R. and Min, Q. L.: Impacts of mineral dust on the vertical structure of precipitation, J. Geophys. Res.-Atmos., 115, D09203, https://doi.org/10.1029/2009JD011925, 2010.
Li, X., Tao, W.-K., Masunaga, H., Masunaga, Gu, G., and Zeng, X.: Aerosol effects on cumulus congestus population over the tropical acific: A cloud-resolving modeling study, J. Meteorol. Soc. Jpn., 91, 817–833, https://doi.org/10.2151/jmsj.2013-607, 2013.
Lohmann, U. and Hoose, C.: Sensitivity studies of different aerosol indirect effects in mixed-phase clouds, Atmos. Chem. Phys., 9, 8917–8934, https://doi.org/10.5194/acp-9-8917-2009, 2009.
Matus, A. V. and L'Ecuyer, T. S.: The role of cloud phase in Earth's radiation budget, J. Geophys. Res.-Atmos., 122, 2559–2578, https://doi.org/10.1002/2016JD025951, 2017.
McCoy, D. T., Tan, I., Hartmann, D. L., Zelinka, M. D., and Storelvmo, T.: On the relationships among cloud cover, mixed-phase partitioning, and planetary albedo in GCMs, J. Adv. Model. Earth Syst., 8, 650–668, https://doi.org/10.1002/2015MS000589, 2016.
Mecikalski, J. R., Jewett, C. P., Apke, J. M., and Carey, L. D.: Analysis of Cumulus Cloud Updrafts as Observed with 1-Min Resolution Super Rapid Scan GOES Imagery, Mon. Weather Rev., 144, 811–830, https://doi.org/10.1175/MWR-D-14-00399.1, 2016.
Mellado, J. P.: Cloud-top entrainment in stratocumulus clouds, Annu. Rev. Fluid Mech., 49, 145–169, https://doi.org/10.1146/annurev-fluid-010816-060231, 2017.
Menzel, W. P., Smith, W. L., and Stewart, T. R.: Improved cloud motion wind vector and altitude assignment using VAS, J. Appl. Meteorol. Clim., 22, 377–384, https://doi.org/10.1175/1520-0450(1983)022<0377:ICMWVA>2.0.CO;2, 1983.
Miltenberger, A. K. and Field, P. R.: Sensitivity of mixed-phase moderately deep convective clouds to parameterizations of ice formation – an ensemble perspective, Atmos. Chem. Phys., 21, 3627–3642, https://doi.org/10.5194/acp-21-3627-2021, 2021.
Min, Q. L., Li, R., Lin, B., Joseph, E., Wang, S., Hu, Y., Morris, V., and Chang, F.: Evidence of mineral dust altering cloud microphysics and precipitation, Atmos. Chem. Phys., 9, 3223–3231, https://doi.org/10.5194/acp-9-3223-2009, 2009.
Nakajima, T. and King, M. D.: Determination of the optical thickness and effective particle radius of clouds from reflected solar radiation measurements. Part I: Theory, J. Atmos. Sci., 47, 1878–1893, https://doi.org/10.1175/1520-0469(1990)047<1878:DOTOTA>2.0.CO;2, 1990.
Noh, Y.-J., Seaman, C. J., Vonder Haar, T. H., and Liu, G.: In situ aircraft measurements of the vertical distribution of liquid and ice water content in midlatitude mixed-phase clouds, J. Appl. Meteorol. Clim., 52, 269–279, https://doi.org/10.1175/JAMC-D-11-0202.1, 2013.
Pavolonis, M. J., Heidinger, A. K., and Uttal, T.: Daytime global cloud typing from AVHRR and VIIRS: Algorithm description, validation, and comparisons, J. Appl. Meteorol., 44, 804–826, https://doi.org/10.1175/JAM2236.1, 2005.
Pinto, J. O.: Autumnal mixed-phase cloudy boundary layers in the Arctic, J. Atmos. Sci., 55, 2016–2038, https://doi.org/10.1175/1520-0469(1998)055<2016:AMPCBL>2.0.CO;2, 1998.
Pscheidt, I., Senf, F., Heinze, R., Deneke, H., Trömel, S., and Hohenegger, C.: How organized is deep convection over Germany?, Q. J. Roy. Meteorol. Soc., 145, 2366–2384, https://doi.org/10.1002/qj.3552, 2019.
Roebeling, R. A., Feijt, A. J., and Stammes, P.: Cloud property retrievals for climate monitoring: Implications of differences between Spinning Enhanced Visible and Infrared Imager (SEVIRI) on METEOSAT-8 and Advanced Very High Resolution Radiometer (AVHRR) on NOAA-17, J. Geophys. Res.-Atmos., 111, D20210, https://doi.org/10.1029/2005JD006990, 2006.
Rosenfeld, D. and Woodley, W. L.: Deep convective clouds with sustained supercooled liquid water down to −37.5 ∘C, Nature, 405, 440–442, https://doi.org/10.1038/35013030, 2000.
Rosenfeld, D., Yu, X., Liu, G., Xu, X., Zhu, Y., Yue, Z., Dai, J., Dong, Z., Dong, Y., and Peng, Y.: Glaciation temperatures of convective clouds ingesting desert dust, air pollution and smoke from forest fires, Geophys. Res. Lett., 38, L21804, https://doi.org/10.1029/2011GL049423, 2011.
Rybka, H., Burkhardt, U., Köhler, M., Arka, I., Bugliaro, L., Görsdorf, U., Horváth, Á., Meyer, C. I., Reichardt, J., Seifert, A., and Strandgren, J.: The behavior of high-CAPE (convective available potential energy) summer convection in large-domain large-eddy simulations with ICON, Atmos. Chem. Phys., 21, 4285–4318, https://doi.org/10.5194/acp-21-4285-2021, 2021.
Saunders, R., Hocking, J., Turner, E., Rayer, P., Rundle, D., Brunel, P., Vidot, J., Roquet, P., Matricardi, M., Geer, A., Bormann, N., and Lupu, C.: An update on the RTTOV fast radiative transfer model (currently at version 12), Geosci. Model Dev., 11, 2717–2737, https://doi.org/10.5194/gmd-11-2717-2018, 2018.
Schmetz, J., Holmlund, K., Hoffman, J., Strauss, B., Mason, B., Gaertner, V., Koch, A., and Van De Berg, L.: Operational cloud-motion winds from meteosat infrared images, J. Appl. Meteorol. Clim., 32, 1206–1225, https://doi.org/10.1175/1520-0450(1993)032<1206:OCMWFM>2.0.CO;2, 1993.
Schmetz, J., Pili, P., Tjemkes, S., Just, D., Kerkmann, J., Rota, S., and Ratier, A.: An introduction to meteosat second generation (MSG), B. Am. Meteorol. Soc., 83, 977–992, https://doi.org/10.1175/1520-0477(2002)083<0977:AITMSG>2.3.CO;2, 2002.
Seifert, A. and Beheng, K. D.: A two-moment cloud microphysics parameterization for mixed-phase clouds. Part 1: Model description, Meteorol. Atmos. Phys., 92, 45–66, https://doi.org/10.1007/s00703-005-0112-4, 2006.
Senf, F., Voigt, A., Clerbaux, N., Hünerbein, A., and Deneke, H.: Increasing resolution and resolving convection improve the simulation of cloud-radiative effects over the North Atlantic, J. Geophys. Res.-Atmos., 125, e2020JD032667, https://doi.org/10.1029/2020JD032667, 2020.
Sheffield, A. M., Saleeby, S. M., and van den Heever, S. C.: Aerosol-induced mechanisms for cumulus congestus growth, J. Geophys. Res.-Atmos., 120, 8941–8952, https://doi.org/10.1002/2015JD023743, 2015.
Sotiropoulou, G., Vignon, É., Young, G., Morrison, H., O'Shea, S. J., Lachlan-Cope, T., Berne, A., and Nenes, A.: Secondary ice production in summer clouds over the Antarctic coast: an underappreciated process in atmospheric models, Atmos. Chem. Phys., 21, 755–771, https://doi.org/10.5194/acp-21-755-2021, 2021.
Stengel, M., Kniffka, A., Meirink, J. F., Lockhoff, M., Tan, J., and Hollmann, R.: CLAAS: the CM SAF cloud property data set using SEVIRI, Atmos. Chem. Phys., 14, 4297–4311, https://doi.org/10.5194/acp-14-4297-2014, 2014.
Stephens, G. L.: Radiation profiles in extended water clouds. II: Parameterization schemes, J. Atmos. Sci., 35, 2123–2132, https://doi.org/10.1175/1520-0469(1978)035<2123:RPIEWC>2.0.CO;2, 1978.
Stith, J. L., Haggerty, J. A., Heymsfield, A., and Grainger, C. A.: Microphysical characteristics of tropical updrafts in clean conditions, J. Appl. Meteorol., 43, 779–794, https://doi.org/10.1175/2104.1, 2004.
Sullivan, S. C., Barthlott, C., Crosier, J., Zhukov, I., Nenes, A., and Hoose, C.: The effect of secondary ice production parameterization on the simulation of a cold frontal rainband, Atmos. Chem. Phys., 18, 16461–16480, https://doi.org/10.5194/acp-18-16461-2018, 2018.
Takeishi, A. and Storelvmo, T.: A study of enhanced heterogeneous ice nucleation in simulated deep convective clouds observed during DC3, J. Geophys. Res.-Atmos., 123, 13396–13420, https://doi.org/10.1029/2018JD028889, 2018.
Taylor, J. W., Choularton, T. W., Blyth, A. M., Liu, Z., Bower, K. N., Crosier, J., Gallagher, M. W., Williams, P. I., Dorsey, J. R., Flynn, M. J., Bennett, L. J., Huang, Y., French, J., Korolev, A., and Brown, P. R. A.: Observations of cloud microphysics and ice formation during COPE, Atmos. Chem. Phys., 16, 799–826, https://doi.org/10.5194/acp-16-799-2016, 2016.
Thomas, J., Barrett, A., and Hoose, C.: Temperature and cloud condensation nuclei (CCN) sensitivity of orographic precipitation enhanced by a mixed-phase seeder–feeder mechanism: a case study for the 2015 Cumbria flood, Atmos. Chem. Phys., 23, 1987–2002, https://doi.org/10.5194/acp-23-1987-2023, 2023.
Twohy, C. H.: Measurements of Saharan dust in convective clouds over the tropical eastern Atlantic ocean, J. Atmos. Sci., 72, 75–81, https://doi.org/10.1175/JAS-D-14-0133.1, 2015.
van den Heever, S. C., Carrió, G. G., Cotton, W. R., DeMott, P. J., and Prenni, A. J.: Impacts of nucleating aerosol on Florida storms. Part I: Mesoscale simulations, J. Atmos. Sci., 63, 1752–1775, https://doi.org/10.1175/JAS3713.1, 2006.
Vignon, É., Alexander, S. P., DeMott, P. J., Sotiropoulou, G., Gerber, F., Hill, T. C. J., Marchand, R., Nenes, A., and Berne, A.: Challenging and improving the simulation of mid-level mixed-phase clouds over the high-latitude southern ocean, J. Geophys. Res.-Atmos., 126, e2020JD033490, https://doi.org/10.1029/2020JD033490, 2021.
Wan, H., Giorgetta, M. A., Zängl, G., Restelli, M., Majewski, D., Bonaventura, L., Fröhlich, K., Reinert, D., Rípodas, P., Kornblueh, L., and Förstner, J.: The ICON-1.2 hydrostatic atmospheric dynamical core on triangular grids – Part 1: Formulation and performance of the baseline version, Geosci. Model Dev., 6, 735–763, https://doi.org/10.5194/gmd-6-735-2013, 2013.
Zängl, G., Reinert, D., Rípodas, P., and Baldauf, M.: The ICON (ICOsahedral Non-hydrostatic) modelling framework of DWD and MPI-M: Description of the non-hydrostatic dynamical core, Q. J. Roy. Meteorol. Soc., 141, 563–579, https://doi.org/10.1002/qj.2378, 2015.
Zhao, B., Wang, Y., Gu, Y., Liou, K.-N., Jiang, J. H., Fan, J., Liu, X., Huang, L., and Yung, Y. L.: Ice nucleation by aerosols from anthropogenic pollution, Nat. Geosci., 12, 602–607, https://doi.org/10.1038/s41561-019-0389-4, 2019.
Zhao, X., Liu, X., Burrows, S. M., and Shi, Y.: Effects of marine organic aerosols as sources of immersion-mode ice-nucleating particles on high-latitude mixed-phase clouds, Atmos. Chem. Phys., 21, 2305–2327, https://doi.org/10.5194/acp-21-2305-2021, 2021.