the Creative Commons Attribution 4.0 License.
the Creative Commons Attribution 4.0 License.
 | 10 Nov 2023
Tropical tropospheric ozone and carbon monoxide distributions: characteristics, origins, and control factors, as seen by IAGOS and IASI
Bastien Sauvage
Yasmine Bennouna
Romain Blot
Damien Boulanger
Hannah Clark
Eric Le Flochmoën
Philippe Nédélec
Valérie Thouret
Pawel Wolff
Brice Barret
The characteristics and seasonal variability in the tropical tropospheric distributions of ozone (O3) and carbon monoxide (CO) were analysed based on in situ measurements provided by the In-service Aircraft for a Global Observing System (IAGOS) programme since 1994 and 2002, respectively, combined with observations from the Infrared Atmospheric Sounding (IASI) instrument on board the MetOp-A satellite since 2008. The SOFT-IO (SOft attribution using FlexparT and carbon monoxide emission inventories for In-situ Observation database) model, which couples back trajectories with CO emission inventories, was used to explore the origins and sources of the tropical CO observed by IAGOS.
The highest O3 and CO mixing ratios occur over western Africa in the lower troposphere (LT: surface to 750 hPa) during the fire season (75 ppb of O3 at 2.5 km and 850 ppb of CO at 0.3 km over Lagos in January), mainly due to anthropogenic (AN) emissions and a major contribution from fires. The secondary maxima are observed in Asia in the mid-troposphere (MT: 750–300 hPa) and upper troposphere (UT: 300–200 hPa) in April for O3 and in the LT in January for CO, with larger contributions from AN emissions. The lowest O3 and CO mixing ratios occur over Caracas.
In the tropical LT, the majority of the location clusters are affected by local and regional AN emissions. The highest AN impact is found over Asia, Arabia and eastern Africa, and South America (>75 % of CO). Biomass burning (BB) emissions also originate from local or regional sources but with stronger seasonal dependence. The highest BB impact is found over southern tropical Africa (57 %–90 %), except in April, mostly due to local fires, but also from Northern Hemisphere Africa in January (45 %–73 %) and Southern Hemisphere South America in October (29 % over Windhoek).
In the MT and UT, AN emissions are more important and dominate in the eastern part of the tropics (from the Middle East to Asia). BB contributions are more important than in the LT, especially from the African fires in January and July and from South East and equatorial Asia in April and October.
The overall highest amount of CO is exported from Africa, with the main transport pathway from the dry-season African regions towards the wet-season ones. In contrast, the impact of the Asian emissions in the LT and MT is limited on a local or regional scale. The transport of polluted Asian air masses is important in the UT during the Asian summer monsoon and post-monsoon seasons, when convection is active.
- Article
(11076 KB) - Full-text XML
-
Supplement
(16586 KB) - BibTeX
- EndNote


Tropospheric ozone (O3) and carbon monoxide (CO) are key components in the atmosphere. O3 has a significant impact on human health close to the surface (Curtis et al., 2006; Jerrett et al., 2009) and on climate by being a powerful greenhouse gas (Gauss et al., 2003; IPCC, 2021). O3 is a secondary pollutant produced by photochemical oxidation of precursors such as CO and volatile organic compounds (VOCs) in the presence of nitrogen oxides (NOx) (Logan et al., 1981). Its distribution is controlled by transport processes at the intercontinental and hemispheric scale (Wild et al., 2004), emissions of precursors (natural and anthropogenic), destruction processes (photochemical and depositional) (Monks et al., 2015), and stratospheric transport (Stevenson et al., 2013). Due to its longer lifetime, CO is considered a powerful pollution tracer of combustion products at the hemispheric level (Logan et al., 1981). CO impacts the oxidation capacity of the atmosphere by being the major sink of OH radicals in a non-polluted atmosphere (Lelieveld et al., 2016) and the climate by producing greenhouse gases, such as CO2 and O3, during its oxidation (Myhre et al., 2013). CO is primarily emitted by incomplete combustion, thus by anthropogenic (AN) (including biogenic fuels) and biomass burning (BB) (wildfires) sources (Galanter et al., 2000; Granier et al., 2011), with contributions between 450–600 and 350–600 Tg CO yr−1, respectively (Lamarque et al., 2010; van der Werf et al., 2006). Its secondary sources include oxidation of VOCs and methane (450–1200 and 600–1000 Tg CO yr−1, respectively; Stein et al., 2014).
Recent studies (Gaudel et al., 2018, 2020; Zhang et al., 2016) have shown an increasing tropospheric O3 burden in the second half of the 20th century, mostly due to an increase in precursors in the tropics. Based on aircraft observations, Bourgeois et al. (2020) recently presented a global-scale distribution of O3 in the remote troposphere. However, uncertainties still remain in the global O3 distribution and sources of precursors due to paucity of observations in the free troposphere, especially over developing countries in the tropics (Gaudel et al., 2018; Tarasick et al., 2019).
The tropics are of particular interest regarding tropospheric O3 and CO. They combine (i) intense photochemistry due to high UV radiation and humidity; (ii) large active natural sources of CO and other O3 precursors through BB (Ziemke et al., 2009), biogenic (Aghedo et al., 2007), and lighting emissions (Sauvage et al., 2007b, c); (iii) increasing AN due to rapid industrialization (Duncan et al., 2016; Granier et al., 2011); (iv) large O3 net production potential because deep convection can transport surface emissions to higher altitudes, where their lifetime is increased due to lack of surface deposition and dilution with unpolluted background (Pickering et al., 1995); and (v) dynamic processes capable of redistributing chemical species at a regional and global scale (Zhang et al., 2016). Thus, the tropics are a region where O3 production is favoured.
Satellite observations from the OMI (Ozone Monitoring Instrument) and MLS (Microwave Limb Sounder) sensors (Ziemke et al., 2019) and simulations from the GEOS-Chem chemical transport model (Zhang et al., 2016, 2021) display the highest O3 burden increase in the tropics – mostly over India, East Asia, and South East Asia. Most studies tend to confirm an increase in O3 in the tropics, but they are mostly based on model simulations, sparse ground observations, or satellite data with little consistency, and it is not clear what can cause such an increase. Indeed the trends are attributed to different factors such as BB (Heue et al., 2016), dynamics (Lu et al., 2019; Thompson et al., 2021), or AN (Zhang et al., 2016; Gaudel et al., 2020). Thus, further investigation based on in situ observations is required in order to better constrain models, validate satellite retrievals, and reduce the uncertainties in the quantification of O3 and CO trends and source attribution over the tropics.
Measurements of tropical O3 and CO are available by satellite observations, but they have a coarse vertical resolution (e.g. Barret et al., 2008; Thompson et al., 2001). On short timescales, several field campaigns have been carried out in the tropics, yielding measurements of various species over Africa (from TROPOZ 1987 to CAFE-Africa), Asia (from INDOEX to EMerge-Asia), South America (CITE-1, CITE-2, CITE-3, TROCCiNOX), and the tropical Pacific (from PEM-WEST-A and PEM-WEST-B to CAST, CONTRAST, ATTREX, and Atom). These campaigns have provided invaluable insights into the atmospheric chemistry and dynamics of the tropics. On greater timescales, the Southern Hemisphere ADditional OZone Sounding (SHADOZ) programme (Thompson et al., 2003a) has provided long-term O3 observations over the tropics using ozonesondes since 1998. These measurements have allowed a better understanding of the vertical distribution and trends of tropical O3 (e.g. Thompson et al., 2021).
In a complementary way to these datasets, the IAGOS (In-service Aircraft for a Global Observing System) (Marenco et al., 1998; Petzold et al., 2015; Thouret et al., 2022) programme has provided O3 and CO measurements over the tropics since 1994 and 2002, respectively. Using equipped commercial aircraft, IAGOS samples vertical profiles at take-off and landing, along with the lower part of the upper tropical troposphere at cruise altitude between 300 and 185 hPa (UTcruise). Previous studies have documented the tropical composition over Africa (Lannuque et al., 2021; Sauvage et al., 2005, 2007a, d), South America (Yamasoe et al., 2015), and South Asia (Sahu et al., 2014; Sheel et al., 2014) using IAGOS data. However, they are focused on specific regions of the tropics and have limited temporal coverage, especially for CO, as fewer measurements were available at this time. Thus, the O3 and CO distributions and their interlocking in the entire tropics are still not well documented.
The SOFT-IO (SOft attribution using FlexparT and carbon monoxide emission inventories for In-situ Observation database) model (Sauvage et al., 2017a) was developed to supplement the analysis of the IAGOS dataset by estimating AN and BB contributions to the observed CO measurements. These measurements, along with the SOFT-IO output, allow us to trace the CO origin over the tropics. Further, global distributions provided by Infrared Atmospheric Sounding Interferometer (IASI) Software for a Fast Retrieval of IASI Data (SOFRID) (Barret et al., 2011; De Wachter et al., 2012) retrievals since 2008 complement the O3 and CO distributions provided by IAGOS. They allow us to understand the spatial extent of pollution plumes and explore intercontinental transport patterns.
In this article we take advantage of the unique IAGOS database to (i) document the characteristics and seasonal variability in these two atmospheric species over the whole tropical band for the last decade, (ii) explore the origin of the observed CO anomalies, and (iii) investigate transport processes driving the CO and O3 distributions in the tropics.
The observational (IAGOS and IASI) and model-based (SOFT-IO) datasets and methodology are introduced in Sect. 2. In Sect. 3, the IAGOS observations are analysed to document O3 and CO vertical profiles, along with the upper-tropospheric composition over the tropics. In addition, the sources of observed CO are explored with SOFT-IO.
2.1 IAGOS observations
The research infrastructure IAGOS (Petzold et al., 2015; Thouret et al., 2022) provides in situ measurements of trace gases (O3, CO, water vapour, and NOy between 2001 and 2005 – e.g. Gressent et al., 2014 – and more recently NOx, CH4, CO2, and cloud particles; see https://www.iagos.org/iagos-data/, last access: 16 October 2023) and meteorological parameters (temperature and winds) using equipped commercial aircraft. A full description of the instruments can be found in Nédélec et al. (2015). O3 (CO) is measured using a dual-beam ultraviolet absorption monitor (infrared analyser) with an overall uncertainty of ±2 ppbv ± 2 % (±5 ppbv ± 5 %) and a time resolution of 4 (30) s (Nédélec et al., 2015). IAGOS measures vertical profiles during ascend and descend phases and the UTcruise during cruise phases. Considering the aircraft speed (7–8 m s−1 during ascent and descent; 900 km h−1 during cruise), the time resolution of the instruments corresponds to a vertical resolution of 30 m (225 m) and a horizontal resolution of 1 km (7.5 km) for O3 (CO).
O3 (CO) observations have been collected since 1994 (2002) in the framework of the IAGOS research infrastructure and its predecessor MOZAIC (Marenco et al., 1998) programme, based on the same instrument technologies. Good consistency in the measurements between the two programmes (hereafter referred to as IAGOS) (Blot et al., 2021; Nédélec et al., 2015) leads to IAGOS temporal coverage of 26 (almost 20) years for O3 (CO), depending on the availability of the flights. IAGOS data provide robust O3 and CO climatologies, allowing studies of long-term trends (e.g. Cohen et al., 2018) along with validation of chemistry transport models (e.g. Gressent et al., 2016; Sauvage et al., 2007b) and satellite data retrievals (e.g. De Wachter et al., 2012) on a global scale. To complement the IAGOS observations, we use the potential vorticity (PV) field, which is part of the ancillary data (https://doi.org/10.25326/3) from the IAGOS database. The PV is calculated from the European Centre for Medium-Range Weather Forecast's (ECMWF) operational fields (horizontal resolution 1∘, time resolution 3 h), interpolated along IAGOS trajectories.
2.1.1 Data treatment
The tropical zone can be defined in several ways, such as by meteorological characteristics (e.g. location of the subtropical jets), climatic elements (e.g. precipitation rates), or geographical extent. Following the latter way, in the Tropospheric Ozone Assessment Report, Phase II (TOAR-II; https://igacproject.org/activities/TOAR/TOAR-II, last access: 16 October 2023) Ozone and Precursors in the Tropics working group, the tropics are defined as being between 20∘ S and 20∘ N. In our study, we consider the extended area between 25∘ S and 25∘ N in order to investigate interactions of pollution and the transport of air masses between the tropics and the subtropics. Only tropospheric measurements are taken into account, by applying a PV filter of 2 PV units (pvu) for each measurement during a cruise phase and for the measurements between 20–25∘ N and S during ascent and descent. The UTcruise climatologies are derived by averaging the cruise data on a 2∘ (latitude) × 2.5∘ (longitude) grid for the period 1994–2020 (2002–2020) for O3 (CO). For the same time periods, the climatologies over the vertical are derived by averaging the data into 10 hPa pressure bins from the surface up to 200 hPa. Data are selected within a 300 km radius circle centred on the airport location, similar to Petetin et al. (2016). This way we reduce uncertainties due to possible horizontal heterogeneity in the measurements, as the aircraft keeps moving in the horizontal plane during ascent and descent.
Table 1Description of individual locations and clusters used in this study. The locations are displayed in Fig. 1. P O3 and P CO indicate the total number of profiles for the IAGOS period.
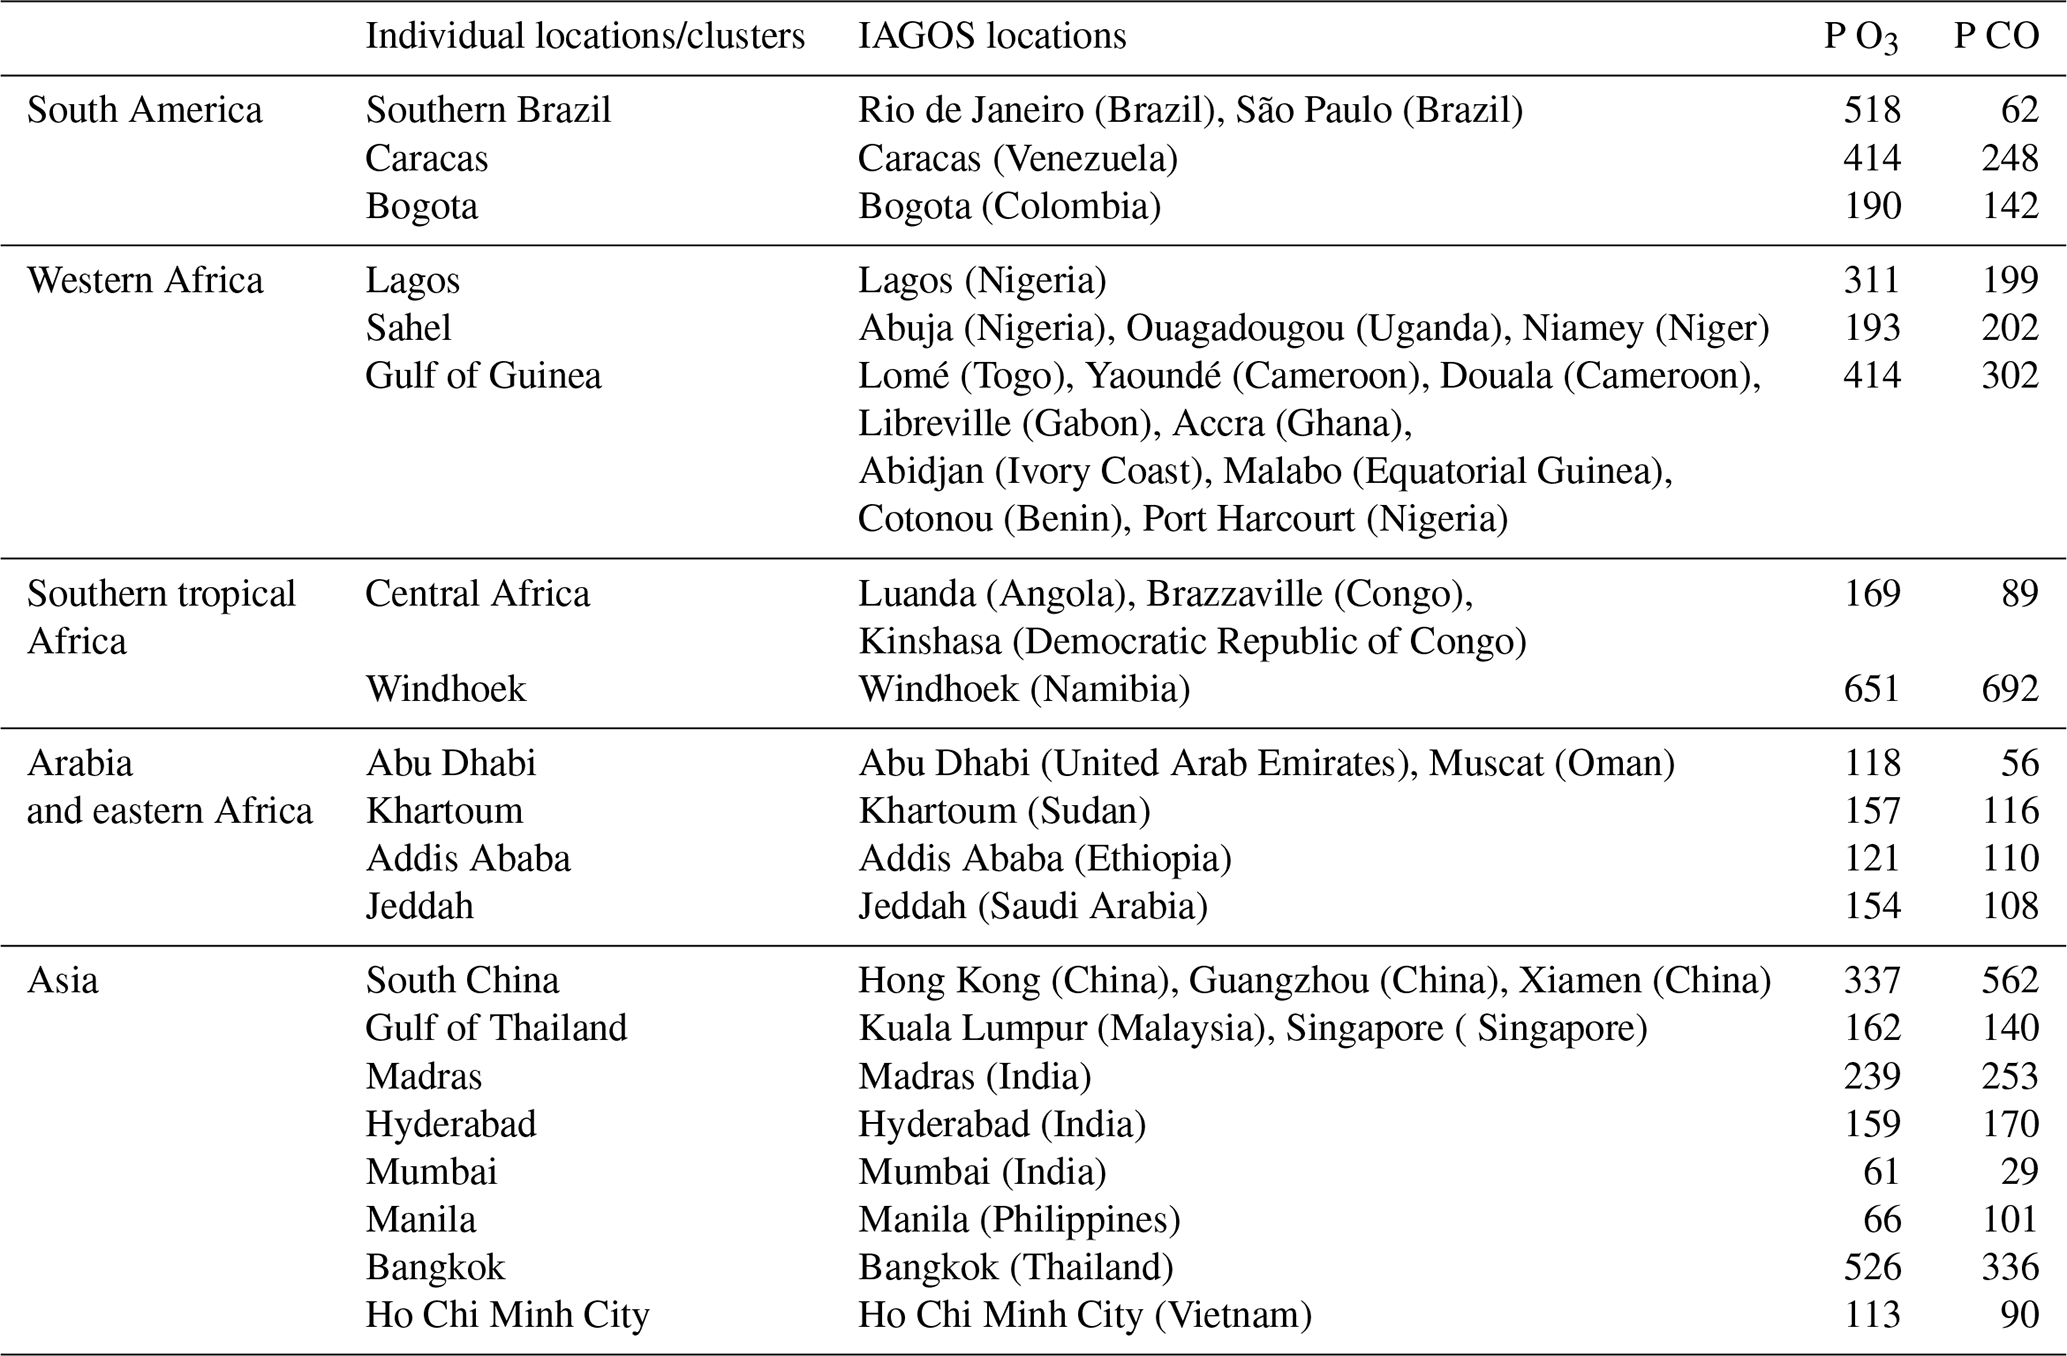
Table 1 shows the total number of profiles taken into account for this study for each location for the whole IAGOS period. The temporal availability of the measurements differs for each location and cluster, as it depends on the flight schedule of the aircraft (see Figs. S1 and S2 in the Supplement). For this reason, to determine a reliable climatological profile, we need to assess the statistical significance of the data. Similar to Logan (1999) and Sauvage et al. (2005), we compute the relative standard error (RSE) of the O3 (CO) monthly mean versus the number of flights per month. The RSE is defined as the ratio between the standard error (, with σ the square root of the sample variance and N the number of flights) and the O3 (CO) monthly mean. The minimum number of flights required for statistical significance corresponds to the number above which RSE≤10 %. We choose RSE of less than 10 % because RSE depends not only on the number of measurements, but also on the O3 (CO) variability, which is high over the tropics (Thompson et al., 2003b). For each location with an adequate number of flights per month, we consider an individual profile of O3 (CO). Otherwise, we combine locations in clusters in order to increase the amount of data and get statistically significant climatological profiles. Furthermore, the clusters can be useful for validation of models with a coarse horizontal resolution because they represent a wider area as resolved by the models, which are not expected to capture small-scale variations in the ozone field (e.g. Emmons et al., 2010). For clustering, the locations should (i) be at a relatively close distance from each other, (ii) be governed by similar meteorological conditions, and (iii) display similar characteristics in the vertical distribution of O3 (CO) (see Sect. 3.1).
The meteorological conditions in the tropics are peculiar, with different seasonal patterns depending on the region. For instance, in Africa there are two main seasons (dry and wet), with two intermediate seasons passing from wet to dry and vice versa (Lannuque et al., 2021; Sauvage et al., 2005). On the other hand, in Asia the seasons are defined by the Asian monsoon phases: Asian summer monsoon (wet season), Asian winter monsoon (dry season), and post-monsoon. Thus, we considered it more appropriate for our analysis to deviate from the classical definition of the seasons, which fits better to studies concerning higher latitudes. Instead, we analyse the profiles and horizontal distributions for months during the peak tropical seasons (January, April, July, and October) to highlight seasonal patterns.
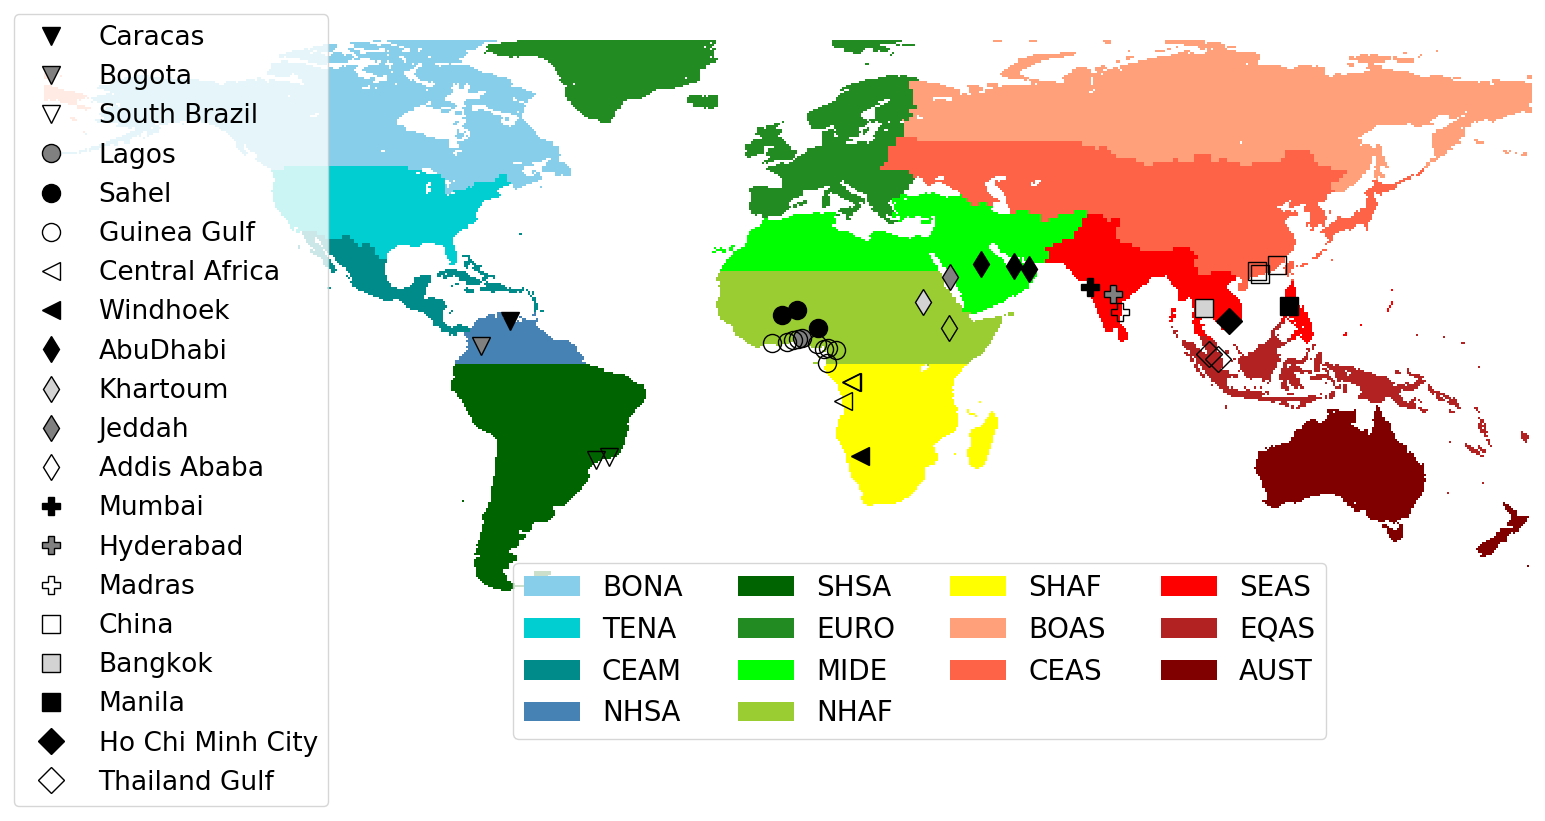
Figure 1Tropical locations served by IAGOS and geographical source regions used in the SOFT-IO model. BONA: boreal North America; TENA: temperate North America; CEAM: Central America; NHSA: Northern Hemisphere South America; SHSA: Southern Hemisphere South America; EURO: Europe; MIDE: Middle East; NHAF: Northern Hemisphere Africa; SHAF: Southern Hemisphere Africa; BOAS: boreal Asia; CEAS: Central Asia; SEAS: South East Asia; EQAS: equatorial Asia; AUST: Australia and New Zealand.
2.2 SOFT-IO model
The SOFT-IO tool (Sauvage et al., 2017a; https://doi.org/10.25326/2) was developed to investigate the origin of the observed IAGOS CO by coupling FLEXPART 20 d backward-transport simulations with emission inventories. For each point of the IAGOS trajectory, SOFT-IO estimates the CO contribution coming from 14 different geographical regions (see Fig. 1) for AN and BB origin separately. We use Community Emissions Data System (CEDS2) AN emissions (McDuffie et al., 2020) and the Global Fire Assimilation System (GFAS) BB emissions (Kaiser et al., 2012), which include fire injection heights, to discriminate sources of CO over different regions of interest. For the calculations, the AN (BB) emissions are updated on a monthly (daily) basis. The meteorological fields are based on ECMWF analysis and forecast with a time resolution of 6 and 3 h, respectively.
SOFT-IO estimates the contribution to anomalies in CO mixing ratios, i.e. CO emitted by primary sources during the last 20 d, while it does not calculate the background CO. The background CO can be emitted by primary sources older than 20 d and by secondary sources such as oxidation of methane and non-methane volatile organic compounds. In our study, CO anomalies (observed by IAGOS) are defined as the positive difference between the observed and the background CO mixing ratio. The background CO mixing ratio represents a reference value not affected by surface emission or pollution events. For this reason, it is computed as the monthly climatological median CO of a remote area away from polluted regions in the UTcruise (during the whole study period, 2002–2020). Overall in the tropics, depending on the month and region, an 80 to 100 ppb background has to be added to SOFT-IO for direct comparison with IAGOS observations.
Several studies (e.g. Cussac et al., 2020; Lannuque et al., 2021; Petetin et al., 2018b) have used SOFT-IO to track back the sources of CO measured by IAGOS. Sauvage et al. (2017a) validated SOFT-IO performance against IAGOS CO observations for several regions and tropospheric levels. As detailed in their study, SOFT-IO uncertainties and biases are mostly due to uncertainties in emission inventories and to a lesser extent to uncertainties concerning the meteorological fields and FLEXPART transport parameterizations (turbulence, convection). Their results show that SOFT-IO can simulate 95 % of the observed number of anomalies without any strong dependence on altitude or region of the CO plume. SOFT-IO captures the intensity of CO anomalies with a bias lower than 10–15 ppb with respect to observed anomalies for most of the regions and tropospheric layers. The bias is higher in extreme pollution events and might be related to uncertainties in the emission inventories.
We performed an evaluation of SOFT-IO for the lower troposphere (LT; surface–750 hPa), mid-troposphere (MT; 750–350 hPa), and upper troposphere (UT: 300–200 hPa). Our simulations detect CO anomalies at the same rates as Sauvage et al. (2017a). On average, SOFT-IO underestimates the observed CO anomalies by 10 ppb in the MT and UT and by 45 ppb in the LT. When looking at the differences between IAGOS and SOFT-IO anomalies (taking into account the background not simulated by the model), SOFT-IO reproduces on average more than 93 % of the observed anomalies for the three layers and 87 % in the LT. April is the month when the model gives the largest underestimation, with 78 % of the anomalies simulated on average over the 20 clusters (13 % standard deviation). The lowest performance is in the LT of Sahel in January, with 52 % of the anomaly simulated by SOFT-IO. Another source of uncertainty comes from the definition of background CO. To assess this source of uncertainty, we used an alternative definition for the background calculated as the median CO mixing ratio between 600 and 300 hPa for each location. The differences between this background and the one used in the study are within 2.5–60 ppbv. Nevertheless, using the alternative background did not make any difference in the anomaly source attribution and in the relative contributions.
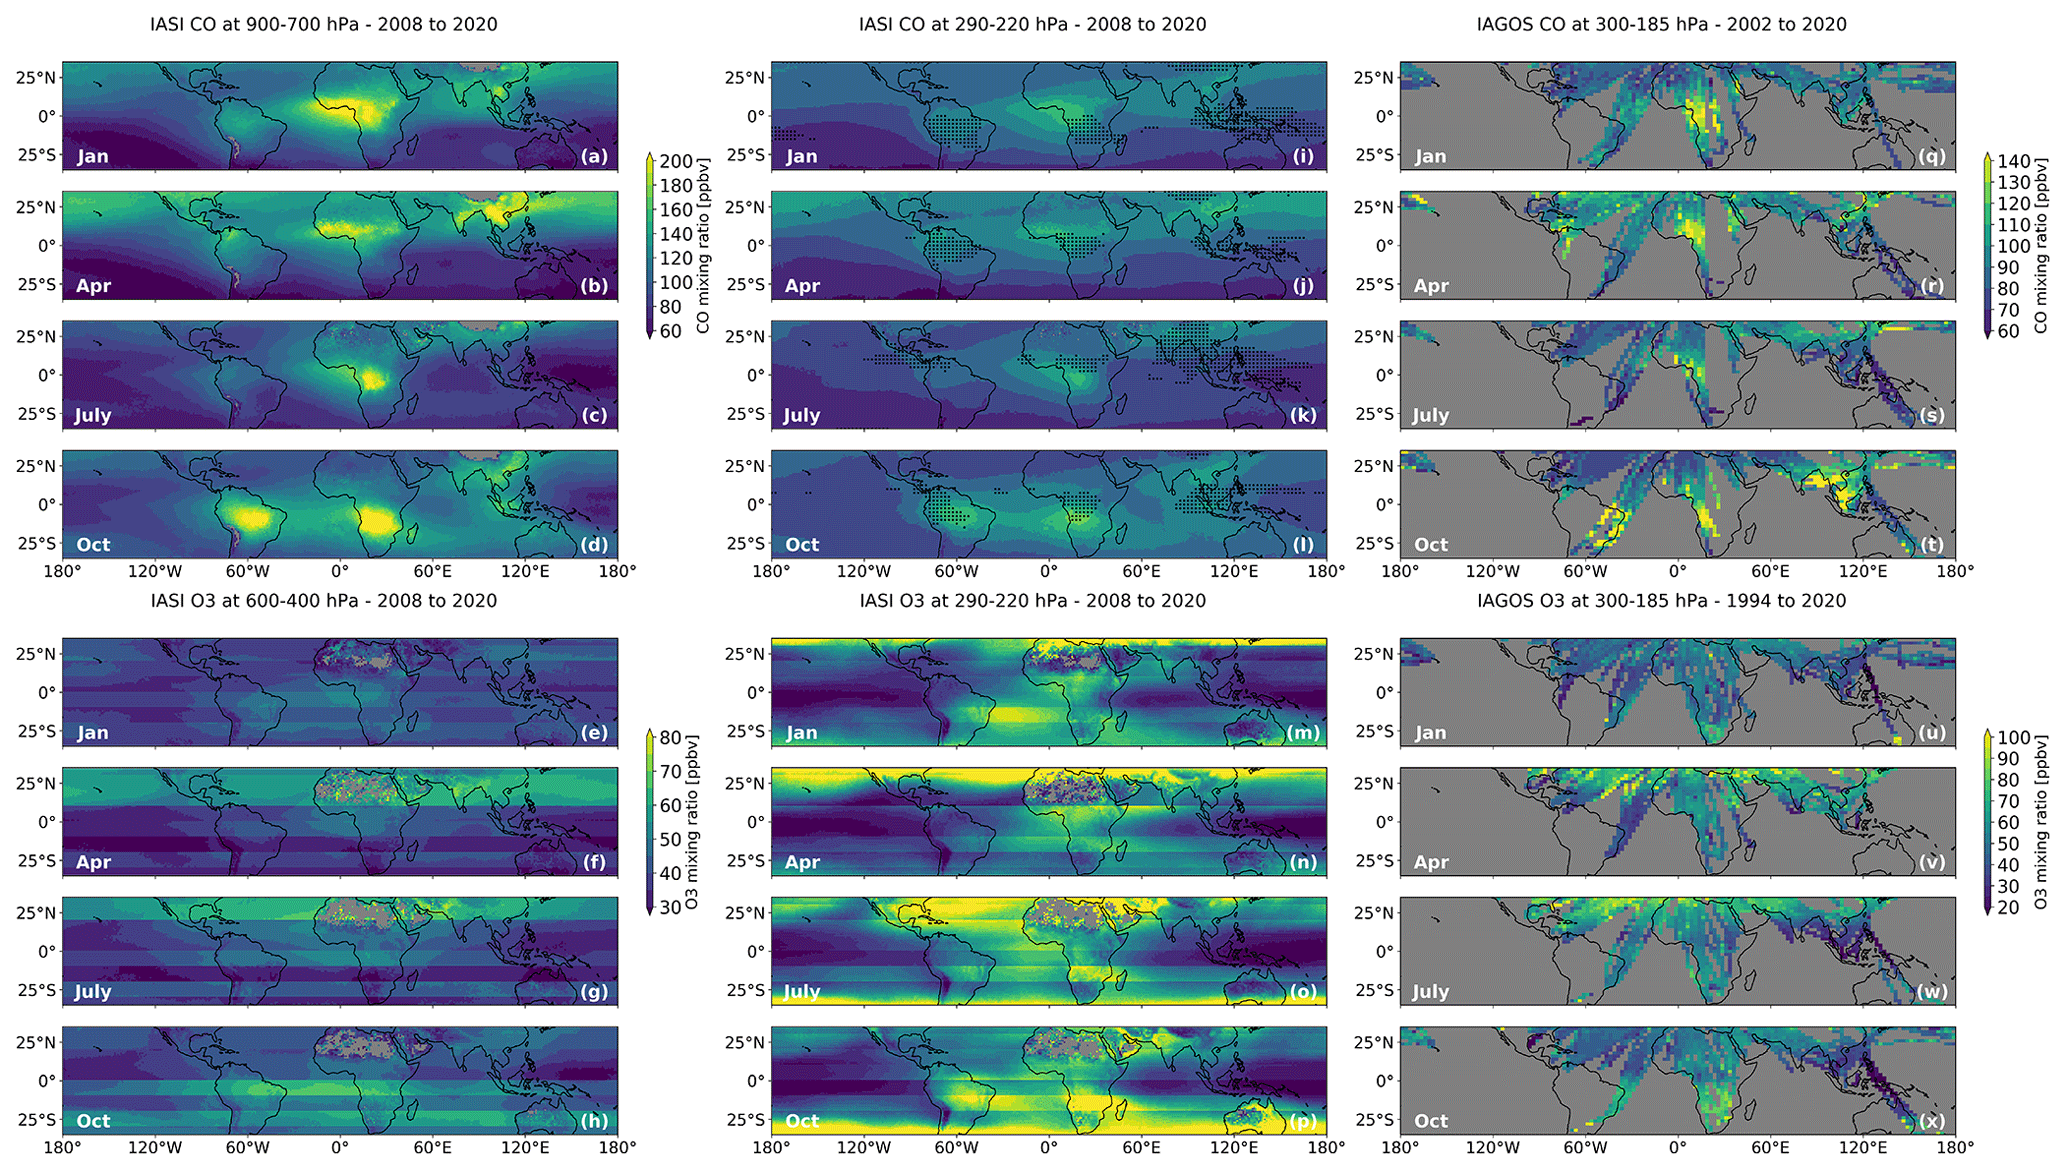
Figure 2Monthly mean lower-tropospheric IASI CO distributions (900–700 hPa; a–d), mid-tropospheric IASI O3 distributions (600–400 hPa; e–h), and upper-tropospheric CO and O3 distributions based on IASI (290–220 hPa; i–l and m–p, respectively) and IAGOS (300–185 hPa; q–t and u–x, respectively).
2.3 IASI-SOFRID observations
The IASI sensor on board MetOp-A (launched in 2006) has a 12 km footprint at nadir and a 2200 km swath, allowing an overpass twice daily, at 09:30 and 21:30 local solar time. IASI provides information for the atmospheric composition, e.g. content of trace gases such as O3 (Barret et al., 2011; Boynard et al., 2016; Eremenko et al., 2008), CO (De Wachter et al., 2012; George et al., 2009), and N2O (Barret et al., 2021). We use O3 (v3.5) and CO (v2.1 and v2.2 after 2014) IASI retrievals performed with SOFRID (Barret et al., 2020; De Wachter et al., 2012).
SOFRID O3 v3.5 retrievals use a dynamical a priori profile based on latitude, season, and the tropopause height (Barret et al., 2020). In the tropics, where the surface temperature, thermal contrast, and tropopause height are the highest, SOFRID O3 retrievals allow two independent pieces of information, one in the troposphere and one in the UTLS (upper troposphere–lower stratosphere) (Barret et al., 2020). Comparisons with ozonesonde measurements for the period 2008–2017 showed that SOFRID O3 is biased low in the tropical troposphere and UTLS by 3 ± 16 % and 12 ± 33 %, respectively, in the northern tropics (0–30∘ N) and by 8 ± 14 % and 21 ± 30 % in the southern tropics (0–30∘ S) (Barret et al., 2020). The measurements above northern Africa are erroneous due to retrieval problems in the presence of desert ground with sand emissivity interfering with the O3 signature (Boynard et al., 2018). The stripes along the 10∘ latitude bands in IASI O3 maps (Fig. 2e–h and q–t) are due to the use of a dynamical a priori profile, resulting in discontinuities between adjacent latitude bands with different a priori profiles. Nevertheless, the use of a dynamical a priori profile largely improves the retrieved O3 profiles in terms of biases, variability, and correlation relative to the previous version based on a single a priori profile (Barret et al., 2020).
For SOFRID CO (v2.1 and 2.2 after 2014), two independent pieces of information are provided in the lower and upper troposphere (De Wachter et al., 2012). IASI correctly captures the seasonal variability in CO over southern Africa (Windhoek) and European mid-latitudes (Frankfurt) in the lower (upper) troposphere relative to IAGOS data (correlation coefficients of 0.85 and 0.70, respectively). At Windhoek, SOFRID CO is biased low in the lower (upper) troposphere by 13 ± 20 % (4 ± 12 %).
We use monthly averaged SOFRID CO and O3 retrievals on a grid from 2008–2020. We focus on daytime measurements when larger thermal contrast between the surface and the atmosphere results in increased sensitivity of the instrument (Clerbaux et al., 2009) and on pressure levels corresponding approximately to the independent pieces of information: the lower troposphere, defined between 900–700 hPa; (LTIASI), the mid-troposphere, between 600–400 hPa (MTIASI); and the upper troposphere, between 290–220 hPa (UTIASI).
3.1 Regional characteristics of tropical O3 and CO
Figure 2 displays the horizontal distributions of CO in LTIASI (Fig. 2a–d), UTIASI (Fig. 2i–l) and UTcruise (Fig. 2q–t), and of O3 in the MTIASI (Fig. 2e–h), UTIASI (Fig. 2m–p) and UTcruise (Fig. 2u–x). The results shown in Fig. 2 motivated our choice in combining IAGOS locations in clusters when it is necessary to increase the number of measurements.
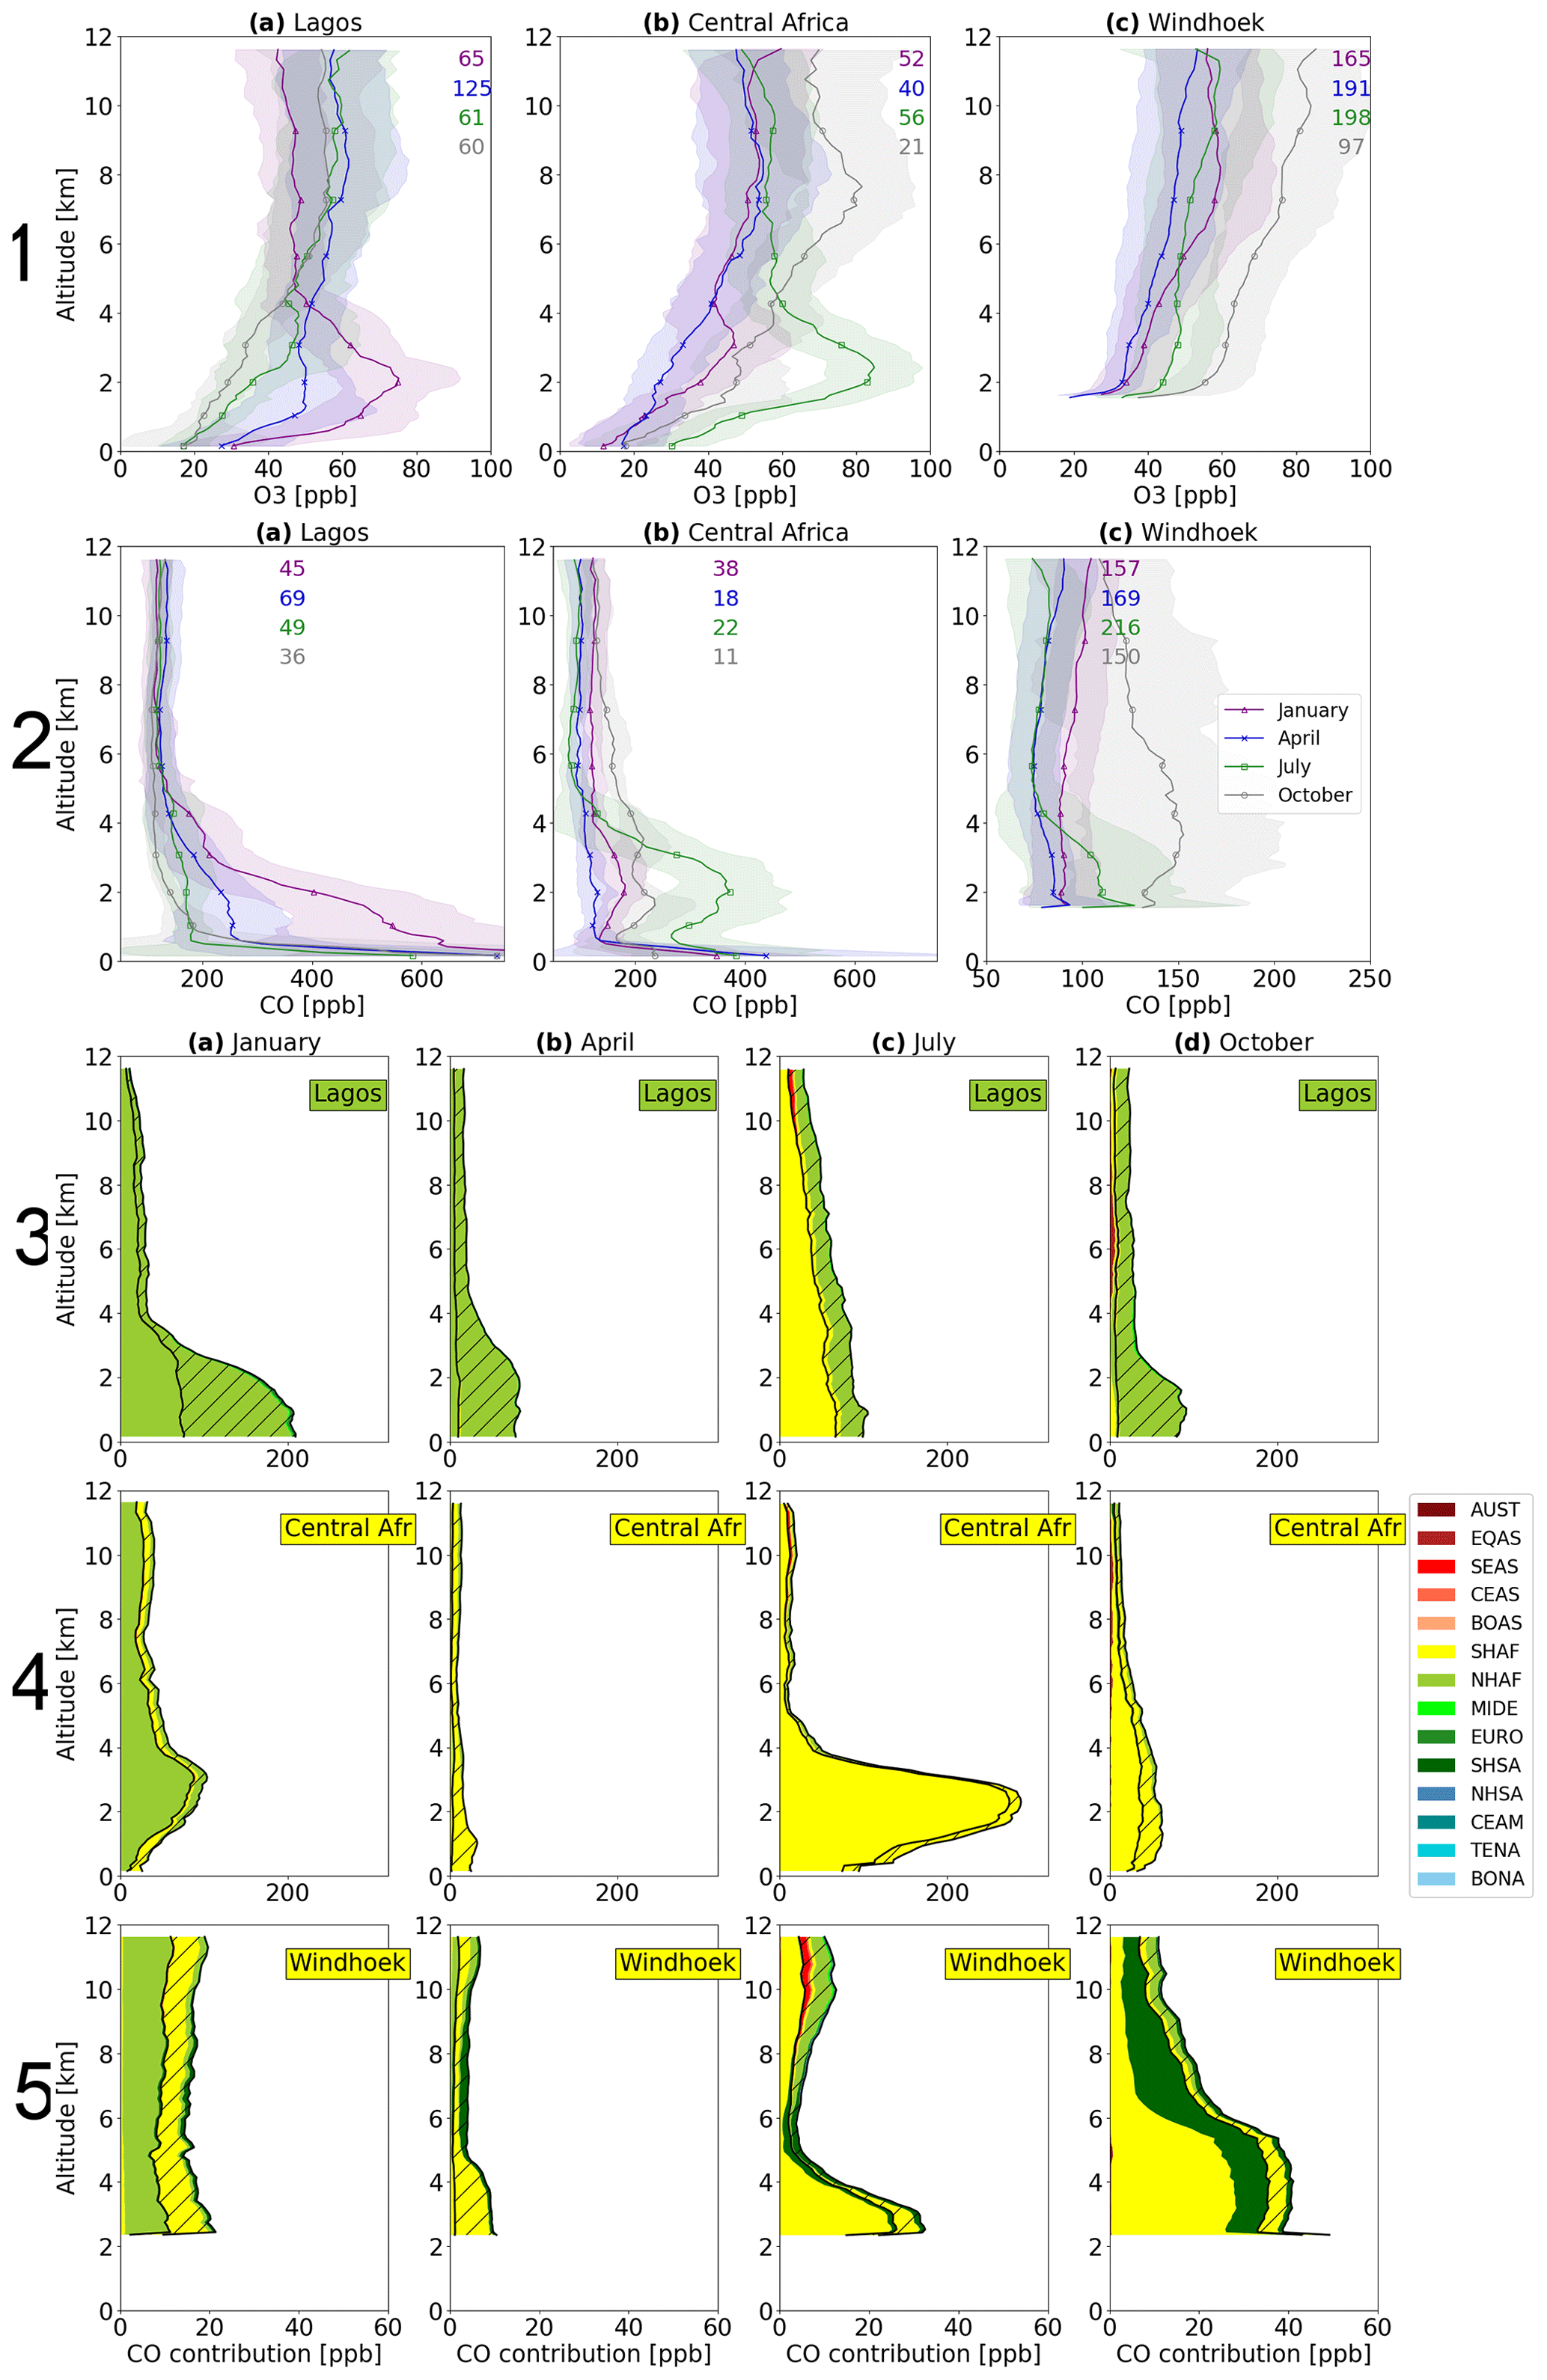
Figure 3IAGOS monthly mean O3 (panel 1) and CO (panel 2) vertical distributions. The annotated numbers correspond to the total number of flights per month for the IAGOS period (given in the same colour as in the legend). The shadowed part corresponds to ±1 standard deviation. Vertical distribution of CO contributions (ppb) (panels 3 to 5), with the hatched part showing AN contribution and the non-hatched part BB contribution. For clarity reasons the CO contribution for Sahel and Gulf of Guinea are displayed in Fig. S6.
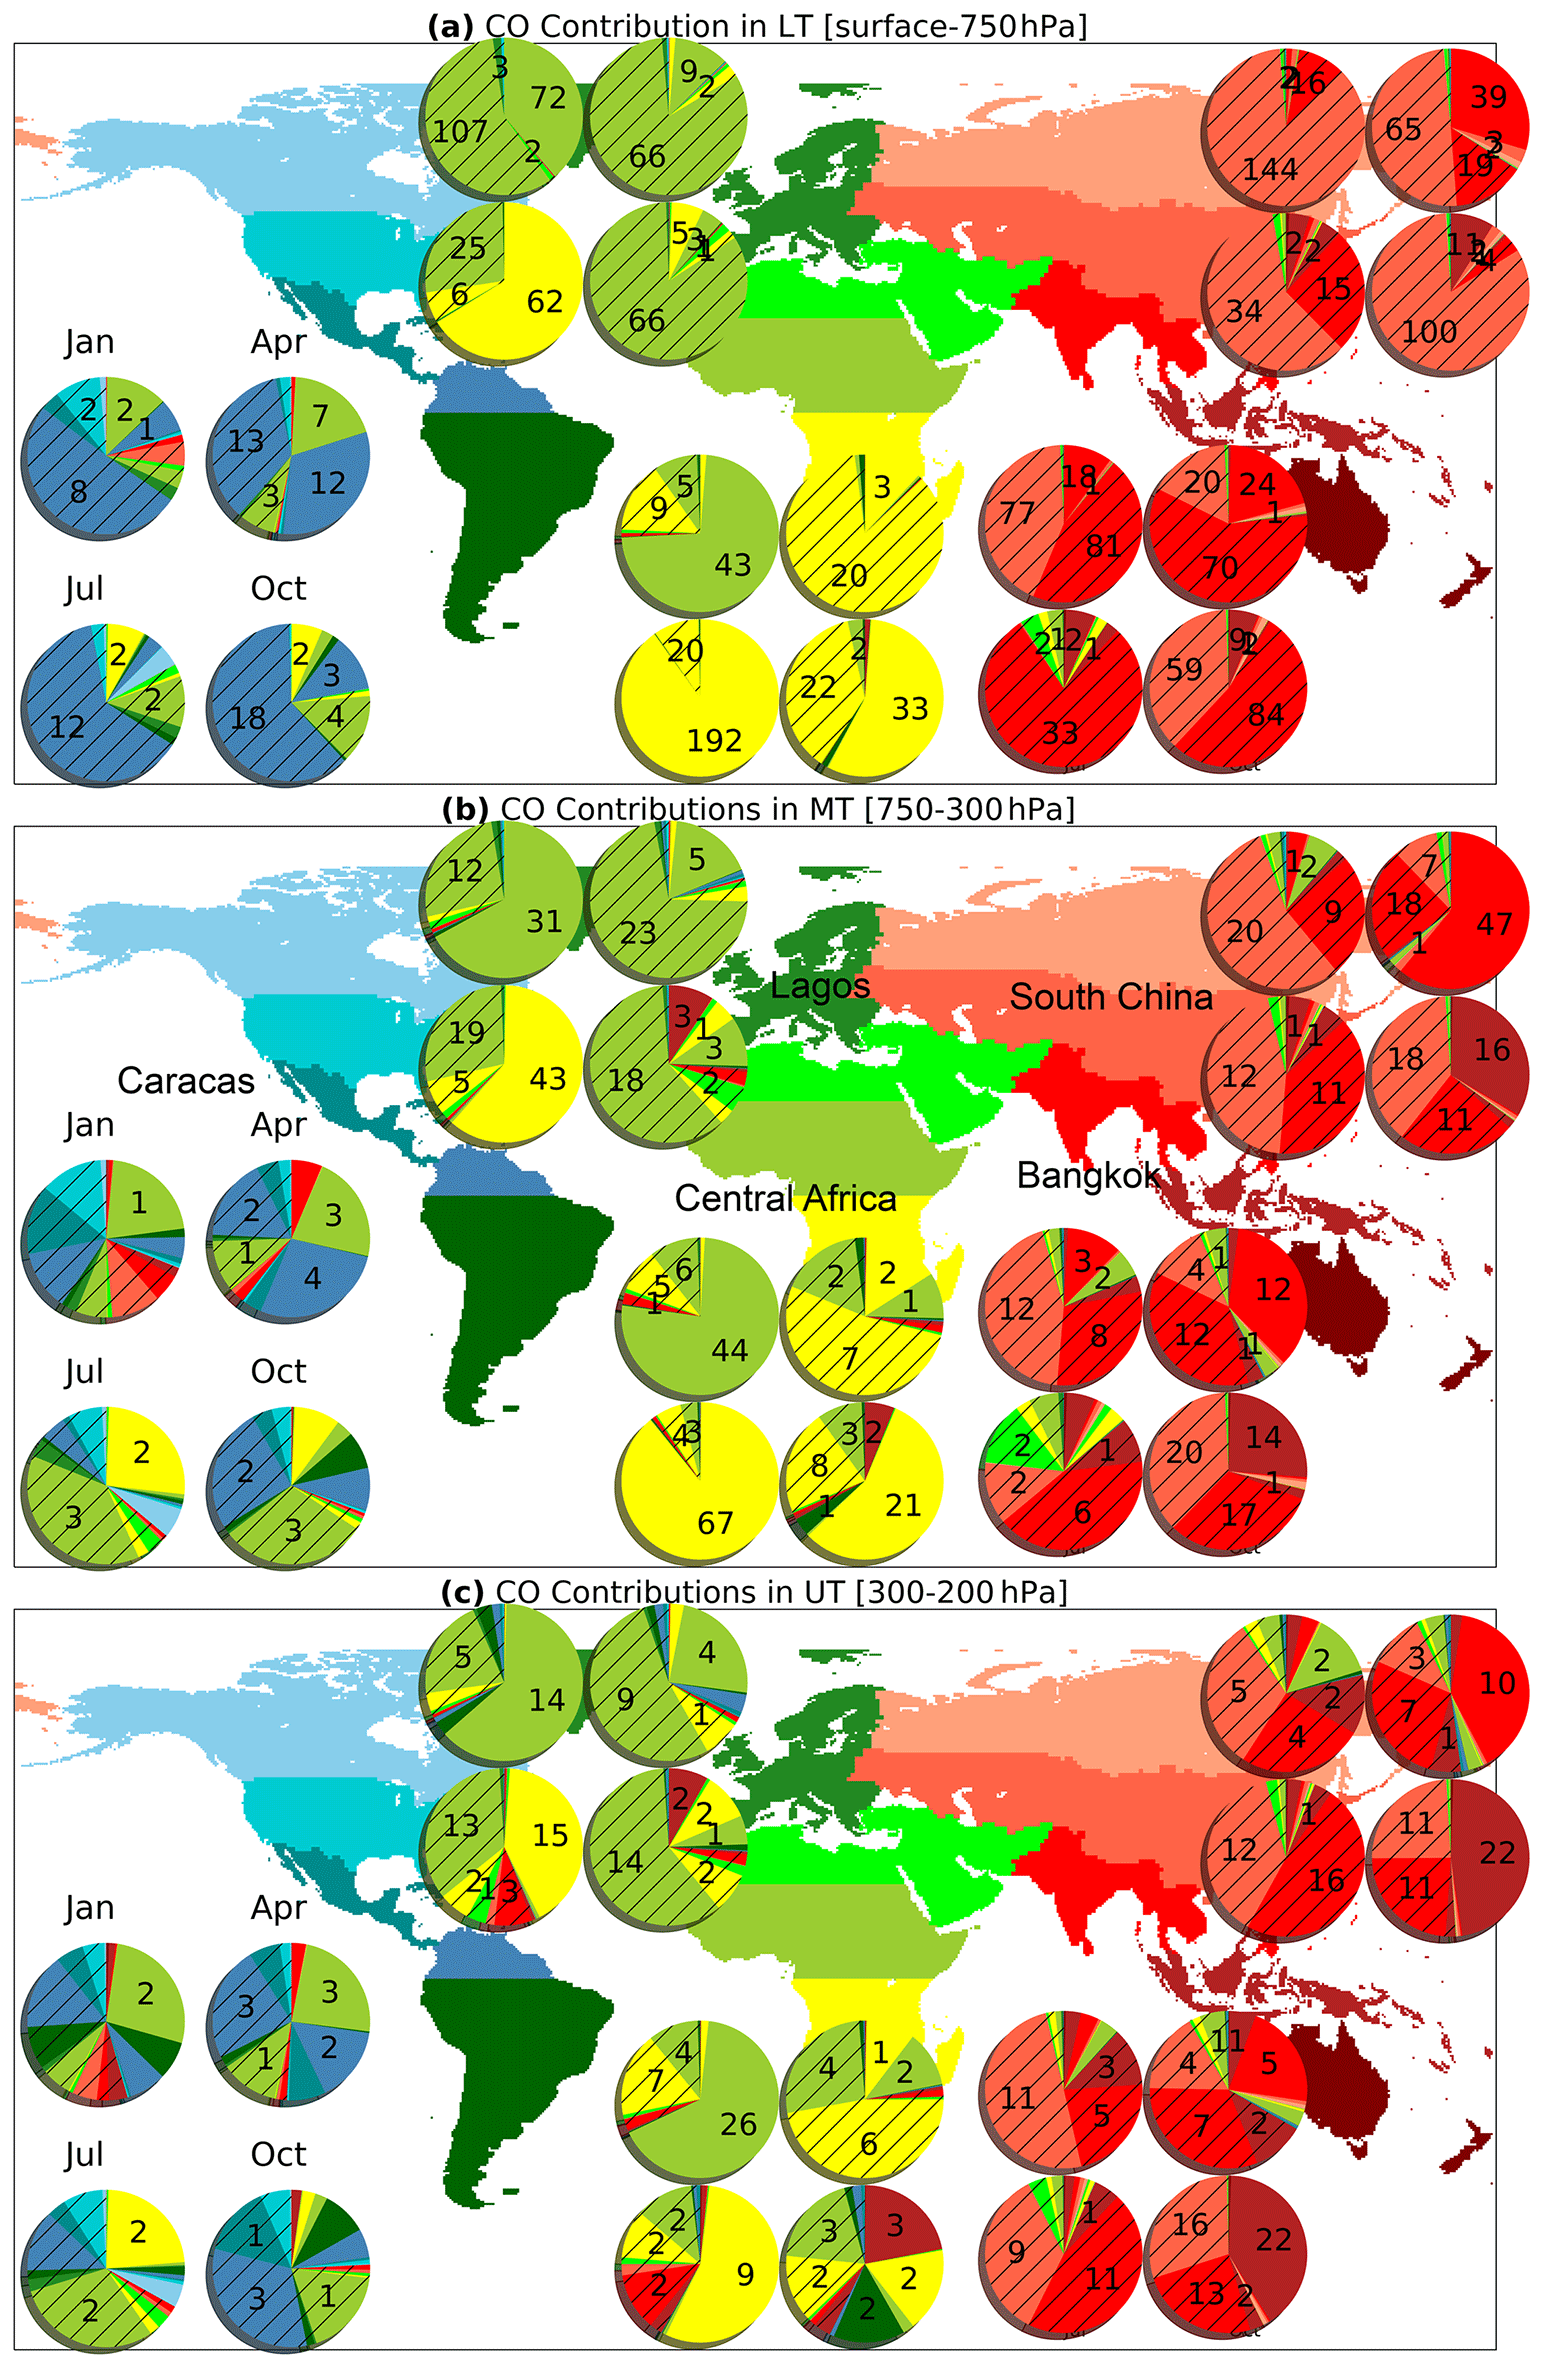
Figure 4Mean SOFT-IO contributions (ppb), averaged over all the positive CO anomalies for the tropical locations (Caracas, Lagos, central Africa, South China, and Bangkok) for LT (a), MT (b), and UT (c) for the AN (hatched) and BB (unhatched) contributions. Each pie corresponds to a different month, and each group of four pies refers to a different location (see panel b).

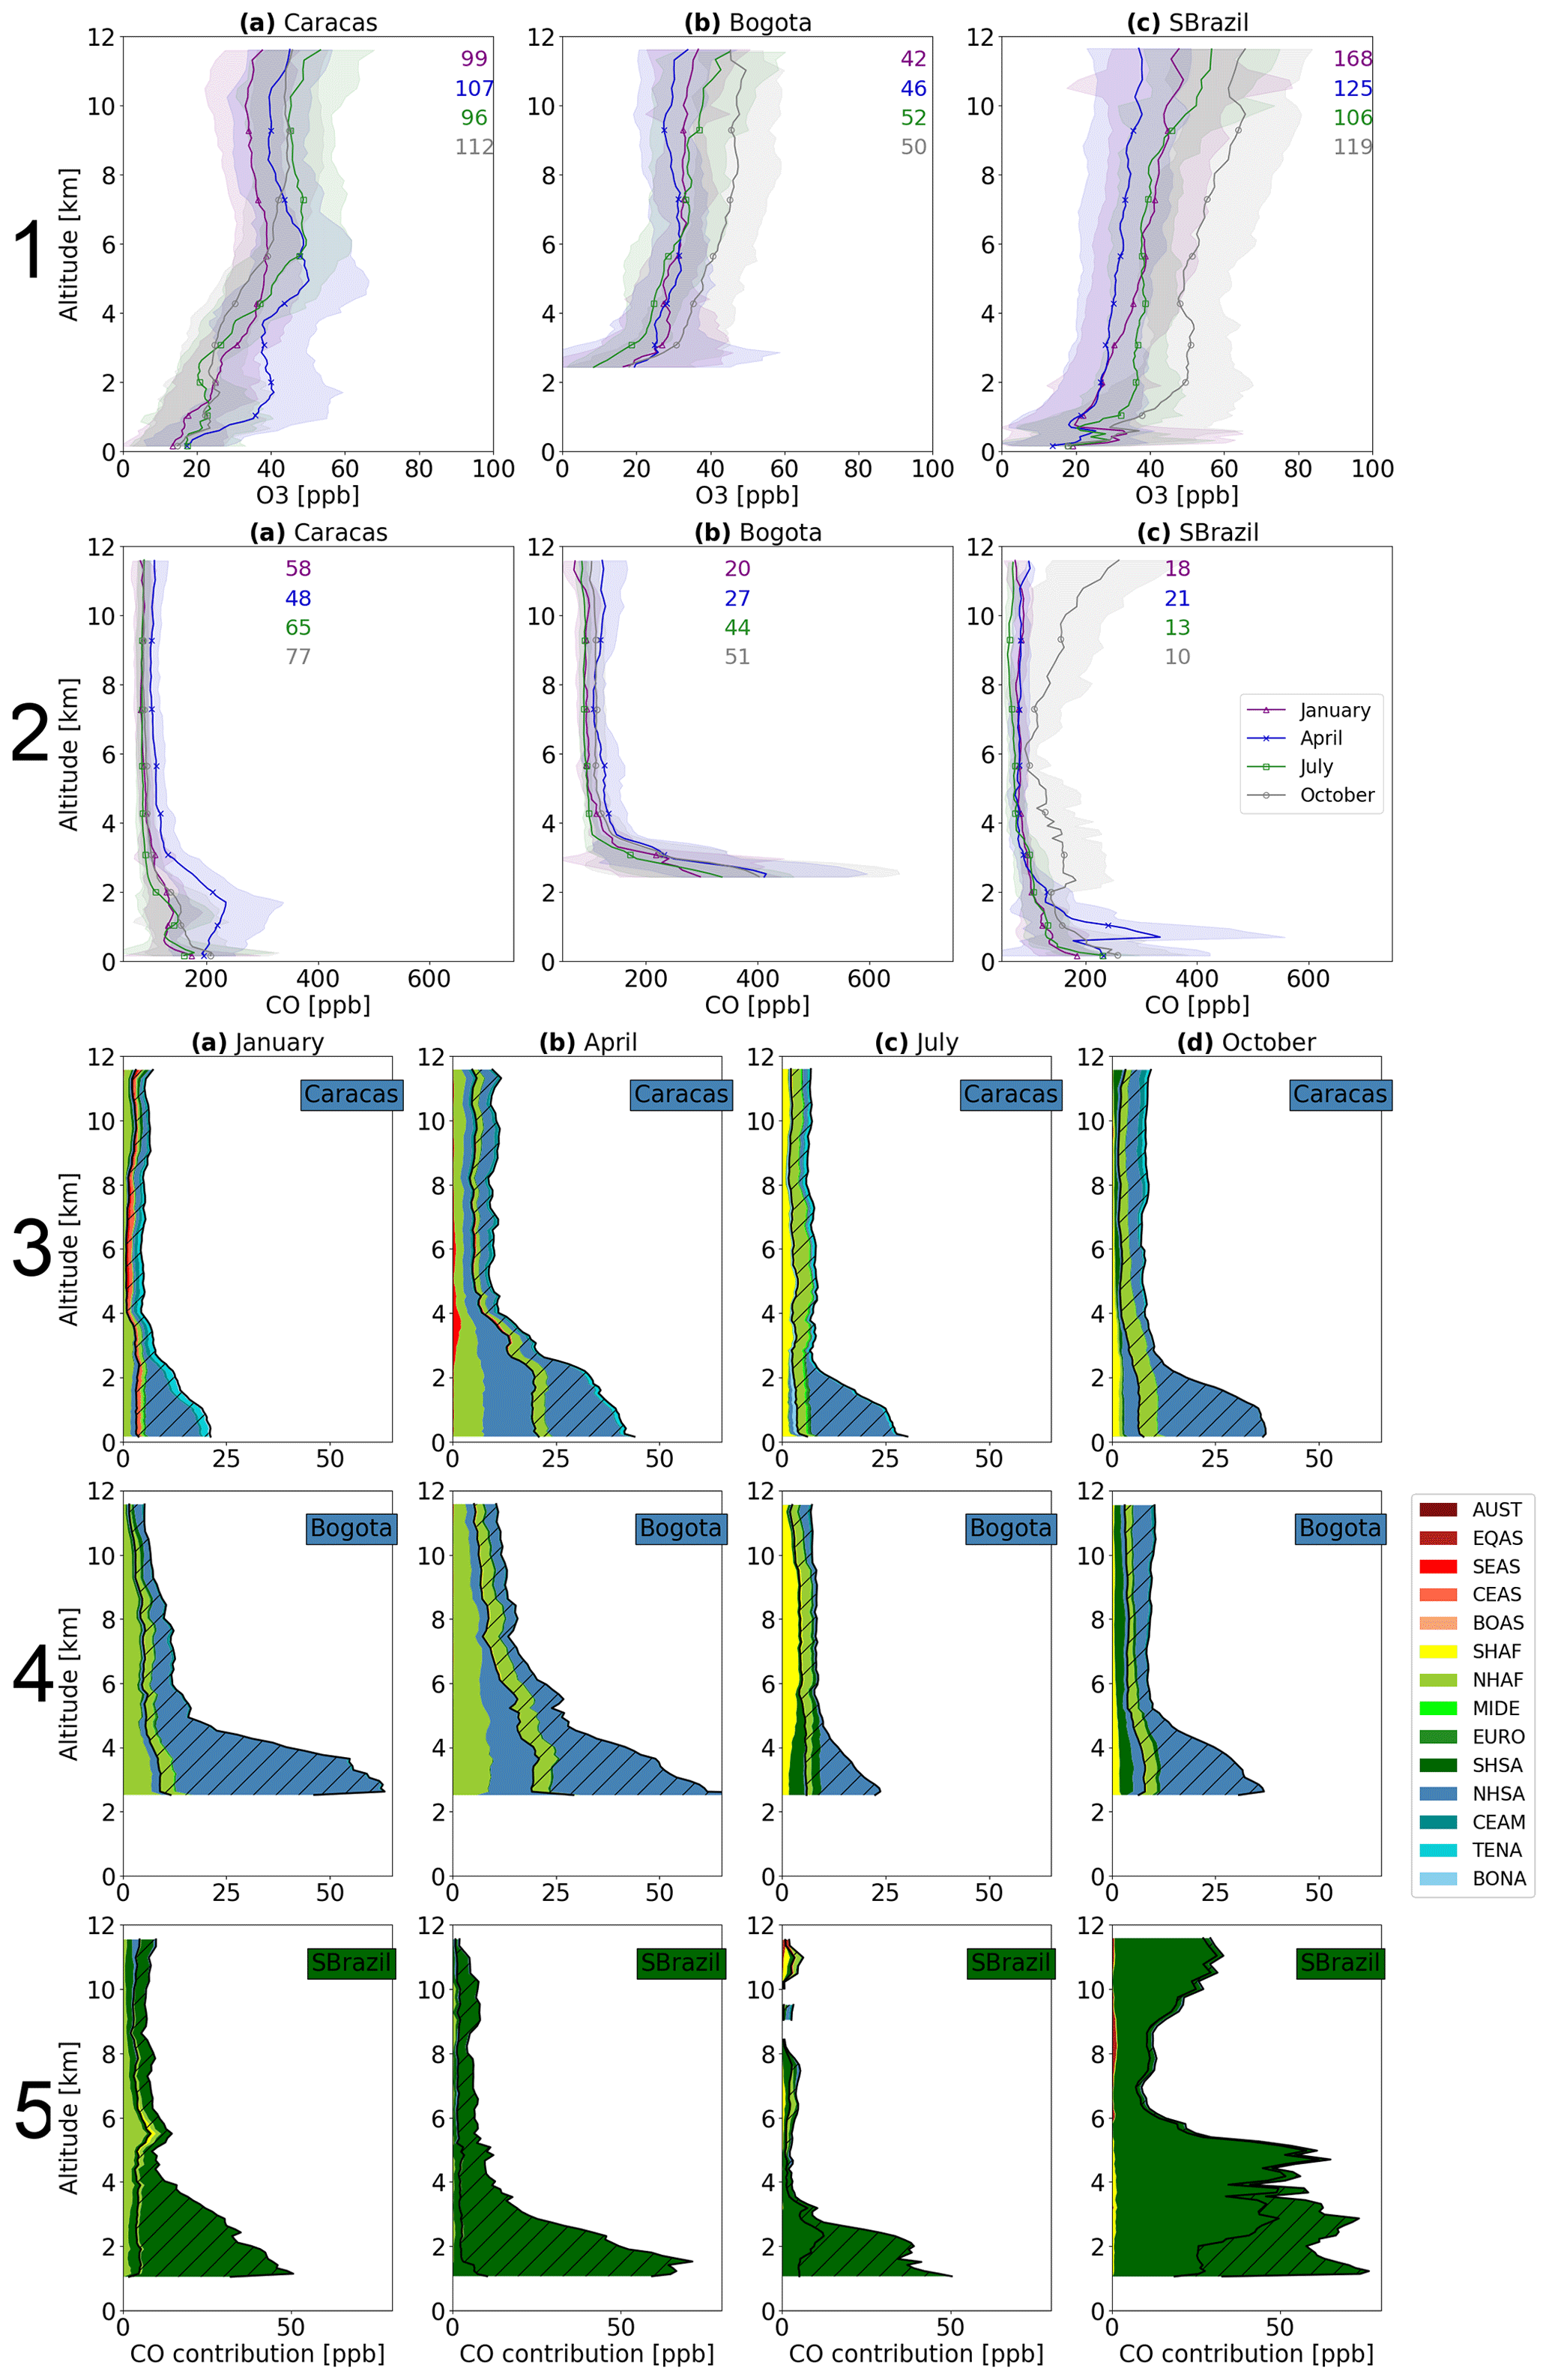
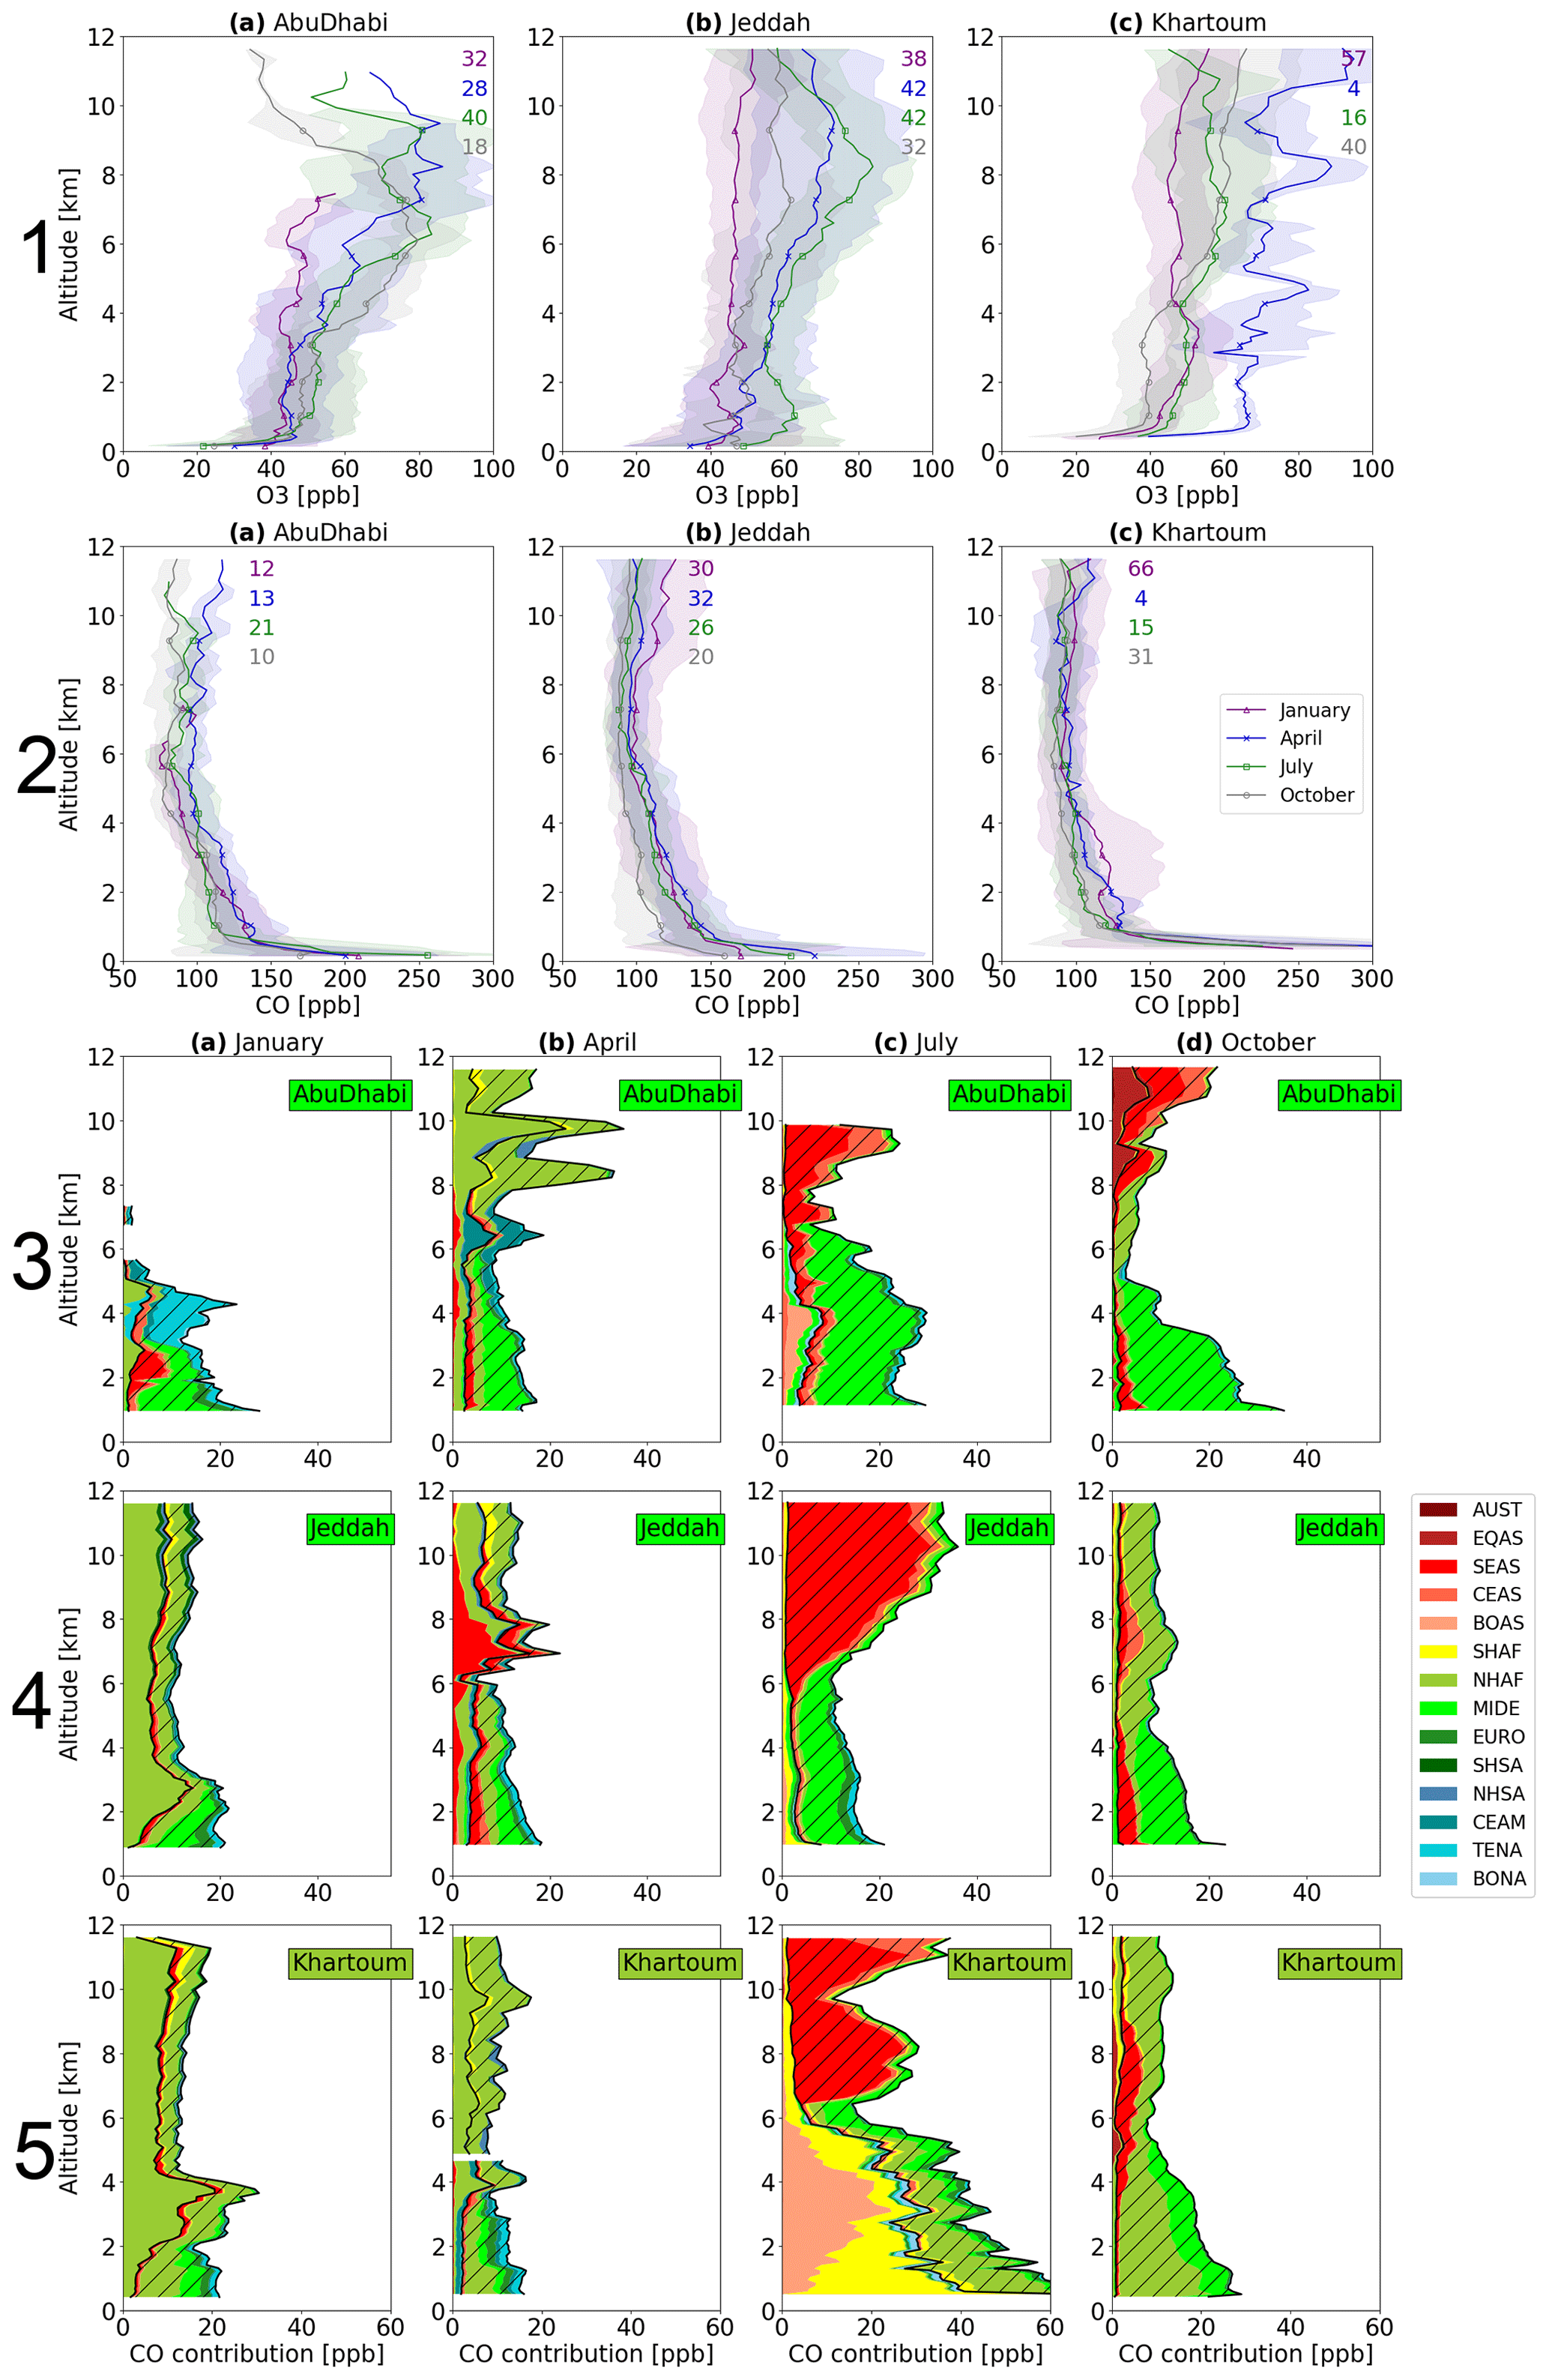
Figures 3 and 5–7 (panels 1 and 2) display the monthly average vertical distributions of O3 and CO based on IAGOS data for the African, Asian, South American, and Arabian and eastern African clusters. Panels 3 to 5 represent the mean recent contribution to CO mixing ratio anomalies (above the background) from AN and BB emissions as estimated by SOFT-IO, with information about their geographical origin (see Sect. 2.2 and Fig. 1). To better summarize O3 and CO anomalies, Fig. 4 displays the CO contributions for the most representative clusters in three tropospheric layers related to different dynamical regimes: LT, corresponding roughly to the planetary boundary layer; MT above; and UT, corresponding to the beginning of convective detrainment.
3.1.1 Africa
The striking feature of CO and O3 over the African tropical clusters (Sahel, Gulf of Guinea, Lagos, and central Africa) is the lower-tropospheric maxima during the dry season (January for the Northern Hemisphere and July for the Southern Hemisphere) below 4 km (Fig. 3 panels 1–2 and Fig. S3 panels 1–2). Above 4 km, CO and O3 display mixing ratios close to the background. Enhanced O3 and CO are confined in the lower troposphere due to the stability of dynamical circulations, which prevents vertical mixing (Sauvage et al., 2005). CO is at a maximum close to the surface, with larger mixing ratios over Lagos (850 ppb) than Sahel (500 ppb), the Gulf of Guinea, and central Africa (400 ppb). O3 displays a vertical gradient from the minimum at the surface, likely related to surface deposition and titration by highly concentrated nitrogen oxide (Monks, 2005), to the maximum near 2.5 km, likely indicating chemically processed air masses. At Windhoek, O3 and CO have different vertical distributions, with maxima in October at the end of the Southern Hemisphere dry season (Fig. 3 panels 1c and 2c). Windhoek CO enhancement has the smallest magnitude among the African clusters (150 ppb at 4 km), while the O3 peak is among the largest, reaching 80 ppb in the UT (11.5 km).
The annual minima of CO and O3 over the African clusters occur during the transition from the wet to the dry season (April and October), when the local fires are minimum (Fig. S4b and d).
Regional fires generally dominate CO contributions in the troposphere of central Africa and Windhoek (Fig. 3 panel 4 and 5, Figs. 4 and S5). For the clusters located over western Africa (Sahel, Gulf of Guinea, and Lagos), anthropogenic emissions dominate, but during fire seasons, the contribution from fires can be close to that from anthropogenic sources (for instance in January for the three clusters, in July for Lagos and Sahel) (Fig. 3 panel 3, Figs. 4 and S6 panels 1 and 2).
In January the Northern Hemisphere African fire contribution reaches 53 % over the Gulf of Guinea and also influences central Africa, with a maximum contribution between 2 and 4 km. During transport, the air masses impacted by BB are chemically processed, resulting in the formation of an O3 secondary maximum of 50 ppb coincident with the CO maximum (Fig. 3 panels 1d and 2d), as described in Sauvage et al. (2005). During this month, the AN contribution dominates over Lagos (58 %) and Sahel (57 %).
In July the Southern Hemisphere African fires are responsible for the CO anomalies over central Africa in the LT and MT by up to 90 % (Fig. 4a and b) and also influence Sahel, the Gulf of Guinea, and Lagos, accounting for up to 68 ppb in the LT of Lagos (Fig. S6 panels 1c and 2c, Figs. 4a and 3 panel 3c). The O3 LT mixing ratio is slightly higher over central Africa (85 ppb) in July than over northern Africa (in January), likely indicating rapid photochemical O3 production by BB precursors (Singh et al., 1996) during the Southern Hemisphere fires.
During each previous dry season, BB air mass transport from the fire hemisphere (Fig. S4a and c) (where the highest CO is measured) to the opposite hemisphere is allowed by either the north-easterly Harmattan flow (January) or the south-easterly winds and monsoon flow (July) (Sauvage et al., 2005). This transport is visible with IASI LTIASI CO (Fig. 2a and c) and seems to be more effective in the south-to-north direction (in July) than in the opposite direction (in January).
In October CO peaks over Windhoek because fires are localized further south in Africa during this month, contributing to 68 % versus 12 % for AN (Fig. S5a), but also because of the fire contribution from South America (20 %) (Fig. 3 panel 5d and Fig. S5a). These high CO mixing ratios in October are detected by IASI in the LTIASI (Fig. 2d) over the whole of southern Africa, reflecting the large extent of the impact of these emissions. The South American fire contribution increases with height (30 % contribution in MT and 50 % in UT), contributing to the O3 maxima observed in the UT (Fig. S5b and c) (Sauvage et al., 2006), also observed at 8 km over central Africa (80 ppb) (Fig. 3 panel 1b). Both O3 maxima are part of the South Atlantic maximum, which is visible on the IASI map (Fig. 2p). This maximum is also explained by intense lightning activity (Sauvage et al., 2007b, c).
In April, during the transition from dry to wet season, when the fires are reduced (Fig. S4b), secondary CO and O3 maxima (Fig. 3 panels 1 and 2 and Fig. S3) are observed below 4 km over the western African clusters (Lagos, Sahel, and Gulf of Guinea). These high CO mixing ratios in April are detected by IASI in the LTIASI (Fig. 2b) over the whole of western Africa. The annual CO surface maximum in central Africa also occurs in April. More than 85 % of LT CO is attributed to local AN emissions (Figs. 3 panel 4b and 4a) when few fires are detected by MODIS (Yamasoe et al., 2015, Fig. 7 therein). The measured CO anomaly reaches +200 ppb (after removing the background from the observed CO), while SOFT-IO attributes 40 to 80 ppb to AN. This indicates that African AN emissions might be underestimated. The enhanced LT O3 indicates possible O3 formation during the transport of the aforementioned emissions towards Sahel and the Gulf of Guinea but could also be explained by enhanced NOx mixing ratios, possibly due to soil emissions when rains start (Saunois et al., 2009), especially over Sahel (Fig. 3 panels 1a–c), because of higher NO2 mixing ratios above dry savannas than over wet savannas and forests (Adon et al., 2010).
3.1.2 Asia
Similarly to Africa, Asian clusters present a CO maximum in the LT, but below 2 km and with lower O3 enhancement. Above 2 km, CO is characteristic of the background, while O3 presents a strong seasonal variability (Fig. 5 panels 1 and 2 and Fig. S3).
Overall, AN emissions largely dominate CO contributions over fire ones throughout the troposphere (Fig. 5 panels 3–5 and Fig. S6 panels 3–7). The dominant AN region is South East Asia, followed by Central Asia, which has a great influence over the South China cluster. Biomass burning from South East and equatorial Asia bring a substantial contribution in April and October, respectively, but less important than the AN one.
In January, the annual CO maximum observed close to the surface for all the clusters (except over the Gulf of Thailand; Fig. 5 panel 2 and Fig. S3 panel 2) is related to local AN emissions (Fig. 5 panels 3a–5a and Fig. S6 panels 3a–7a) due to the low boundary layer height in winter. CO maxima are coincident with O3 enhancements also observed by IASI (Fig. 2f) and due to the chemical ageing favoured by the confinement of the CO-rich air masses due to the large-scale subsidence (Lelieveld et al., 2001) and by the cloud-free conditions. Central Asian emissions mainly control LT CO anomalies for South China, the Gulf of Thailand, and Manila, from 52 % to 95 % (over the Gulf of Thailand and South China, respectively; Fig. 4a, Figs. S5a and S7a) due to their advection by the north-easterly trade winds. South East Asian emissions dominate over the Indian clusters with an 85 % contribution (Fig. S7a). As in Africa, the CO-rich air masses accumulated in the LT are accompanied by a secondary LT O3 maximum, significantly lower (40–60 ppb) than the western African ones (65–75 ppb). It might be because the O3 enhancement over Asia is caused by AN-polluted air, while in Africa it is caused by mixed (AN and BB) polluted air. During the Atom campaign, Bourgeois et al. (2021) found that O3 levels are more enhanced in mixed air pollution because they are associated with greater NOx and peroxy acyl nitrates (a NOx reservoir compound), and thus increased O3 production, in comparison to BB- or AN-polluted air alone.
In April during the pre-monsoon season, CO and O3 are both enhanced above the boundary layer and below 4 to 6 km over most locations (Fig. 5 panels 1 and 2 and Fig. S3). Local South East Asian AN emissions dominate CO anomalies over the majority of the locations (Fig. 5 panels 3–5 and Fig. S6). South East Asian fires, especially located in the region of Myanmar, northern Thailand, and Laos (Fig. S4b), also contribute over South China, Bangkok, Ho Chi Minh City, and Manila by at least 20 %–30 % in the LT and MT (Figs. 4 and S7), leading to large CO mixing ratios captured by IASI (Fig. 2b). The BB outflow towards South China and the Pacific Ocean is due to westward lower- and mid-tropospheric winds (Fig. S8b and f). The enhanced MT O3 is attributable to the intense solar radiation associated with precursors from AN and BB emissions, which were previously evidenced. This is in agreement with the observed O3 maximum in spring over South China (Dufour et al., 2010) and Bangkok (Sahu et al., 2013). Mumbai is the only location showing a more distant influence of AN emissions, from the Middle East (36 %) in the LT, Northern Hemisphere Africa (30 %) in the MT, and Northern Hemisphere Africa (AN and BB) in the UT (54 %) (Fig. S7). This transport from Africa towards the Arabian Sea and southern India is captured by IASI (Fig. 2j and n), suggesting O3 photochemical production during the transport.
In October, during the post-monsoon season, either BB or AN can dominate depending on the cluster and the altitude. South East Asian AN emissions dominate the entire troposphere of the Indian clusters (Fig. S7), while Central Asia AN emissions dominate over South China (Fig. 5 panel 4d and Fig. 4). A mix of South East and Central Asian AN emissions have the largest influence over Bangkok, Ho Chi Minh City (LT and MT), and Manila (LT) (Figs. 4 and S7). Equatorial Asian BB emissions, principally from Indonesia (Fig. S4d), dominate CO anomalies over the entire troposphere of the Gulf of Thailand (Fig. S5) and also over Madras and Ho Chi Minh City (UT) and Manila (MT and UT) (Fig. S7). The same BB has a substantial influence (10 % on average) over the entire troposphere of South China and Bangkok (Fig. 4) and in the LT of Hyderabad and Manila (Fig. S7). BB CO-rich air mass advection towards the South East Asian coastal clusters is captured by IASI in the LT (Fig. 2d) and wind fields (Fig. S8d). The collocated O3 enhancement (below 2 km) over these clusters (Fig. 5 panel 1) indicates O3 production during transport. The equatorial Asian BB contribution generally intensifies in the UT (40 %–57 %) (Figs. 4, S5, and S7) and is also captured by IASI and IAGOS (Fig. 2). Livesey et al. (2013) also found an upper-tropospheric CO maximum over Indonesia and attributed it to episodically strong convection, in agreement with the low OLR (outgoing longwave radiation) in Fig. 2p. In contrast, the UTIASI and MTIASI O3 distributions show a SE–NW gradient (Fig. 2) with lower O3 levels over the Maritime Continent and the southern Indian Ocean and higher ones over India and the Arabian Sea as a result of convection over the first region and subsidence of precursors over the second one (Barret et al., 2011).
In July, during the monsoon season, LT O3 and CO mixing ratios are at a minimum for all the Asian clusters (Fig. 5 panels 1 and 2 and Fig. S3). The reversal of the north-easterly trades to the monsoon flow (Fig. S8c) results in the advection of O3- and CO-poor air masses from the Indian Ocean towards Asia. Furthermore, cloudy conditions reducing solar radiation and promoting the scavenging of O3 precursors result in lower O3 production than under clear-sky conditions (Mari et al., 2000; Safieddine et al., 2016). The steep CO gradient close to the surface (below 1 km) indicates the convective uplift of polluted boundary layer air masses towards the UT. The resulting enhancement of CO in the UT within the Asian monsoon anticyclone (AMA) analysed in Park et al. (2008) and Barret et al. (2016) is clear from IASI (Fig. 2). In contrast, the positive south–north O3 gradient between the Maritime Continent and northern South Asia and the Middle East (Fig. 2) is likely associated with the photochemical ageing of air masses while they are recirculating towards the Middle East (Lawrence and Lelieveld, 2010) and with the high insolation over the Middle East (Barret et al., 2016).
3.1.3 South America
South American clusters present a CO maximum in the LT, similarly to African and Asian ones (Fig. 6 panel 2). O3 is increasing from the surface to the MT/UT (Fig. 6 panel 1), probably due to the lack of depositional and chemical sinks above the LT, in combination with lower water vapour mixing ratios and lightning emissions, as discussed in Sect. 3.1.1. Local AN emissions generally dominate the CO anomalies, from either Northern Hemisphere South America (Caracas and Bogota) or Southern Hemisphere South America emissions (southern Brazil) (Fig. 6 panels 3–5). Local (South America) and intercontinental (Africa) emissions due to fires make a significant contribution, which can reach or exceed those of AN emissions.
In April CO is maximum in the LT (Fig. 6 panel 2), reaching 350 ppb below 1.5 km over southern Brazil, 400 ppb below 1 km over Bogota, and 200 ppb over Caracas below 2 km. For the last two locations CO anomalies are related to a mix of AN (35 %) and BB (32 %) emissions from Northern Hemisphere South America (Figs. 4 and 6 panels 3b and 4b), corroborated by the elevated IASI LTIASI CO (Fig. 2b) collocated with the strong AN emissions above Colombia and Venezuela and active fires above the latter (Figs. S4b and S9b). A total of 20 % of the anomalies are caused by transport of Northern Hemisphere African BB emissions (Fig. 4a). The O3 maximum collocated with the CO one at 2 km over Caracas (Fig. 6 panel 1) indicates O3 production during transport of Northern Hemisphere African air masses impacted by BB, while the second one above 5 km is attributed by Yamasoe et al. (2015) to local AN sources, followed by lightning. Contrary to Caracas and Bogota, the southern Brazil annual CO maximum is mostly due to local AN emissions located over the southern part of Brazil (Fig. S9b). Only 65 of the 260 ppb observed CO anomalies is simulated (Fig. 6 panel 5b), suggesting that Southern Hemisphere South American AN emissions are underestimated. The CO enhancement at 1.5 km (Fig. 6 panel 2c) not reported by Yamasoe et al. (2015) is related to increased local AN contributions for March–April–May 2014 relative to the previous years. This is in agreement with the CEDS2 inventory, which shows a peak in AN emissions over southern Brazil in 2014.
In January CO is minimum over the three clusters, with CO below 300 ppb (180 ppb) over Bogota (Caracas and southern Brazil) below 1 km (Fig. 6 panel 2).
In October, two CO maxima are observed over southern Brazil, between 2–4 km (150–200 ppb) and above 8 km (200–250 ppb) (Fig. 6 panel 2c). IASI detects the MTIASI and UTIASI maxima over most of tropical South America (Fig. 2). At the same time O3 peaks above 2 km over Bogota and southern Brazil, reaching 45 and 60 ppb in the UT (Fig. 6 panel 2). While CO enhancement below 1 km in southern Brazil is caused by local AN (52 %) and BB (44 %) emissions (Fig. 6), BB contribution exceeds 80 % in the MT and UT because of the strong convection moving over the BB regions (Liu et al., 2010), documented by low OLR (Fig. 2l). The uplifted BB products are trapped in an anticyclonic circulation developed over central South America (Fig. S8l). CO from Southern Hemisphere South American fires is transported over Bogota, at the edge of the anticyclone, but does not reach Caracas, which lies outside of the anticyclone (Fig. 6 panels 3d and 4d). Their photochemical processing contributes to the seasonal O3 enhancement over South America (Thompson et al., 2003b; Sauvage et al., 2006), highlighted by the collocation of IASI UTIASI CO (Fig. 2l) and O3 (Fig. 2p) maxima.
3.1.4 Arabia and eastern Africa (AEA)
AEA clusters present a CO maximum in the LT (Fig. 7 panel 2 and Fig. S3 panel 2e), similar to other tropical locations, mostly due to AN local (Middle East or Africa) emissions, except Addis Ababa and Khartoum in July, showing substantial African BB influence (Fig. 7 panels 3–5 and Fig. S6 panel 8).
In January, strong AN emissions from Northern Hemisphere Africa control the LT CO anomalies over Addis Ababa, with a contribution of 71 % in the LT and 58 % in the MT (Fig. S5). Influence from the Northern Hemisphere African fires is also evident (12 % in the LT and 20 % in the MT). The impact from these fires intensifies over Khartoum and Jeddah between 2 and 4 km, with contributions of around 55 % (Fig. 7 panels 4a and 5a).
In July, the CO LT maximum is again caused by local AN emissions, except over Khartoum, where air masses from Southern Hemisphere African fires are the dominant source of CO (Fig. 7 panel 5c). The combination of local AN (70 %) and Southern Hemisphere African BB (23 %) emissions is responsible for the annual CO maximum at the surface over Addis Ababa (Fig. S6 panel 8c and Fig. S5).
The striking feature is the elevated O3 around 8 km (70 ppb on average) for all the clusters during April and for Jeddah and Abu Dhabi during July (Fig. 7 panel 1 and Fig. S3 panel 1e). Low CO accompanying the O3 enhancements (Fig. 7 panel 2 and Fig. S3 panel 2e) points to a dynamical origin of O3. In July these features are also detected by IASI in the MTIASI and UTIASI (Fig. 2j, k, n, and o) and can be due to either (i) tropopause foldings in the vicinity of the subtropical jet stream associated with downward transport of stratospheric ozone (Stohl et al., 2003; Lelieveld et al., 2009; Safieddine et al., 2014; Tang et al., 2011) or (ii) emissions from South East Asia (50 %), with smaller contributions from the Middle East and Africa (30 %) (Jia et al., 2017) trapped in the AMA (Barret et al., 2016; Park et al., 2007). This last influence is in agreement with SOFT-IO, showing a significant contribution from South East Asia over Jeddah (29 % to 78 %), Khartoum (60 %), and Addis Ababa (46 %) (Fig. S5), affected by the tropical easterly jet transport. SOFT-IO also attributes large contributions from Northern Hemisphere African AN and BB emissions and also from American sources over Abu Dhabi (Fig. 7 panel 3a), related to eastward transport by the subtropical westerly jet in the UT, which is not present in the rest of the AEA clusters.
In July O3 is minimum over Addis Ababa (45–50 ppb) (Fig. S3 panel 1e), related to the Intertropical Convergence Zone located between 5 and 10∘ N (Lannuque et al., 2021).
In October, in the LT the long-range transport from Asia (South East Asian AN and equatorial Asian BB) plays a significant role in CO anomalies over the AEA locations (Fig. 7 panels 3d–5d and Fig. S6 panel 8d), especially over Addis Ababa and Jeddah. In the LTIASI, IASI captures the north-easterlies' (Fig. S8d) transport of CO-rich air masses from Asia towards eastern Africa (Fig. 2d). Above 4 km, O3 enhancements are observed over the AEA locations, especially over Abu Dhabi, which is the easternmost location of the AEA region (Fig. 7 panel 1). IASI detects a MTIASI O3 increase above the Arabian Sea and northern India (Fig. 2h), previously detected with ozone soundings during the INDOEX campaign (1999–2000) and attributed to Indian sources uplifted over the marine boundary layer by the sea breeze circulation (Lawrence and Lelieveld, 2010; Barret et al., 2011). The O3-rich air masses are further transported towards eastern Africa by the prevailing north-easterlies (Fig. S8h), as documented by the predominant South East Asian origin of MT and UT CO over the AEA locations (Fig. 7).
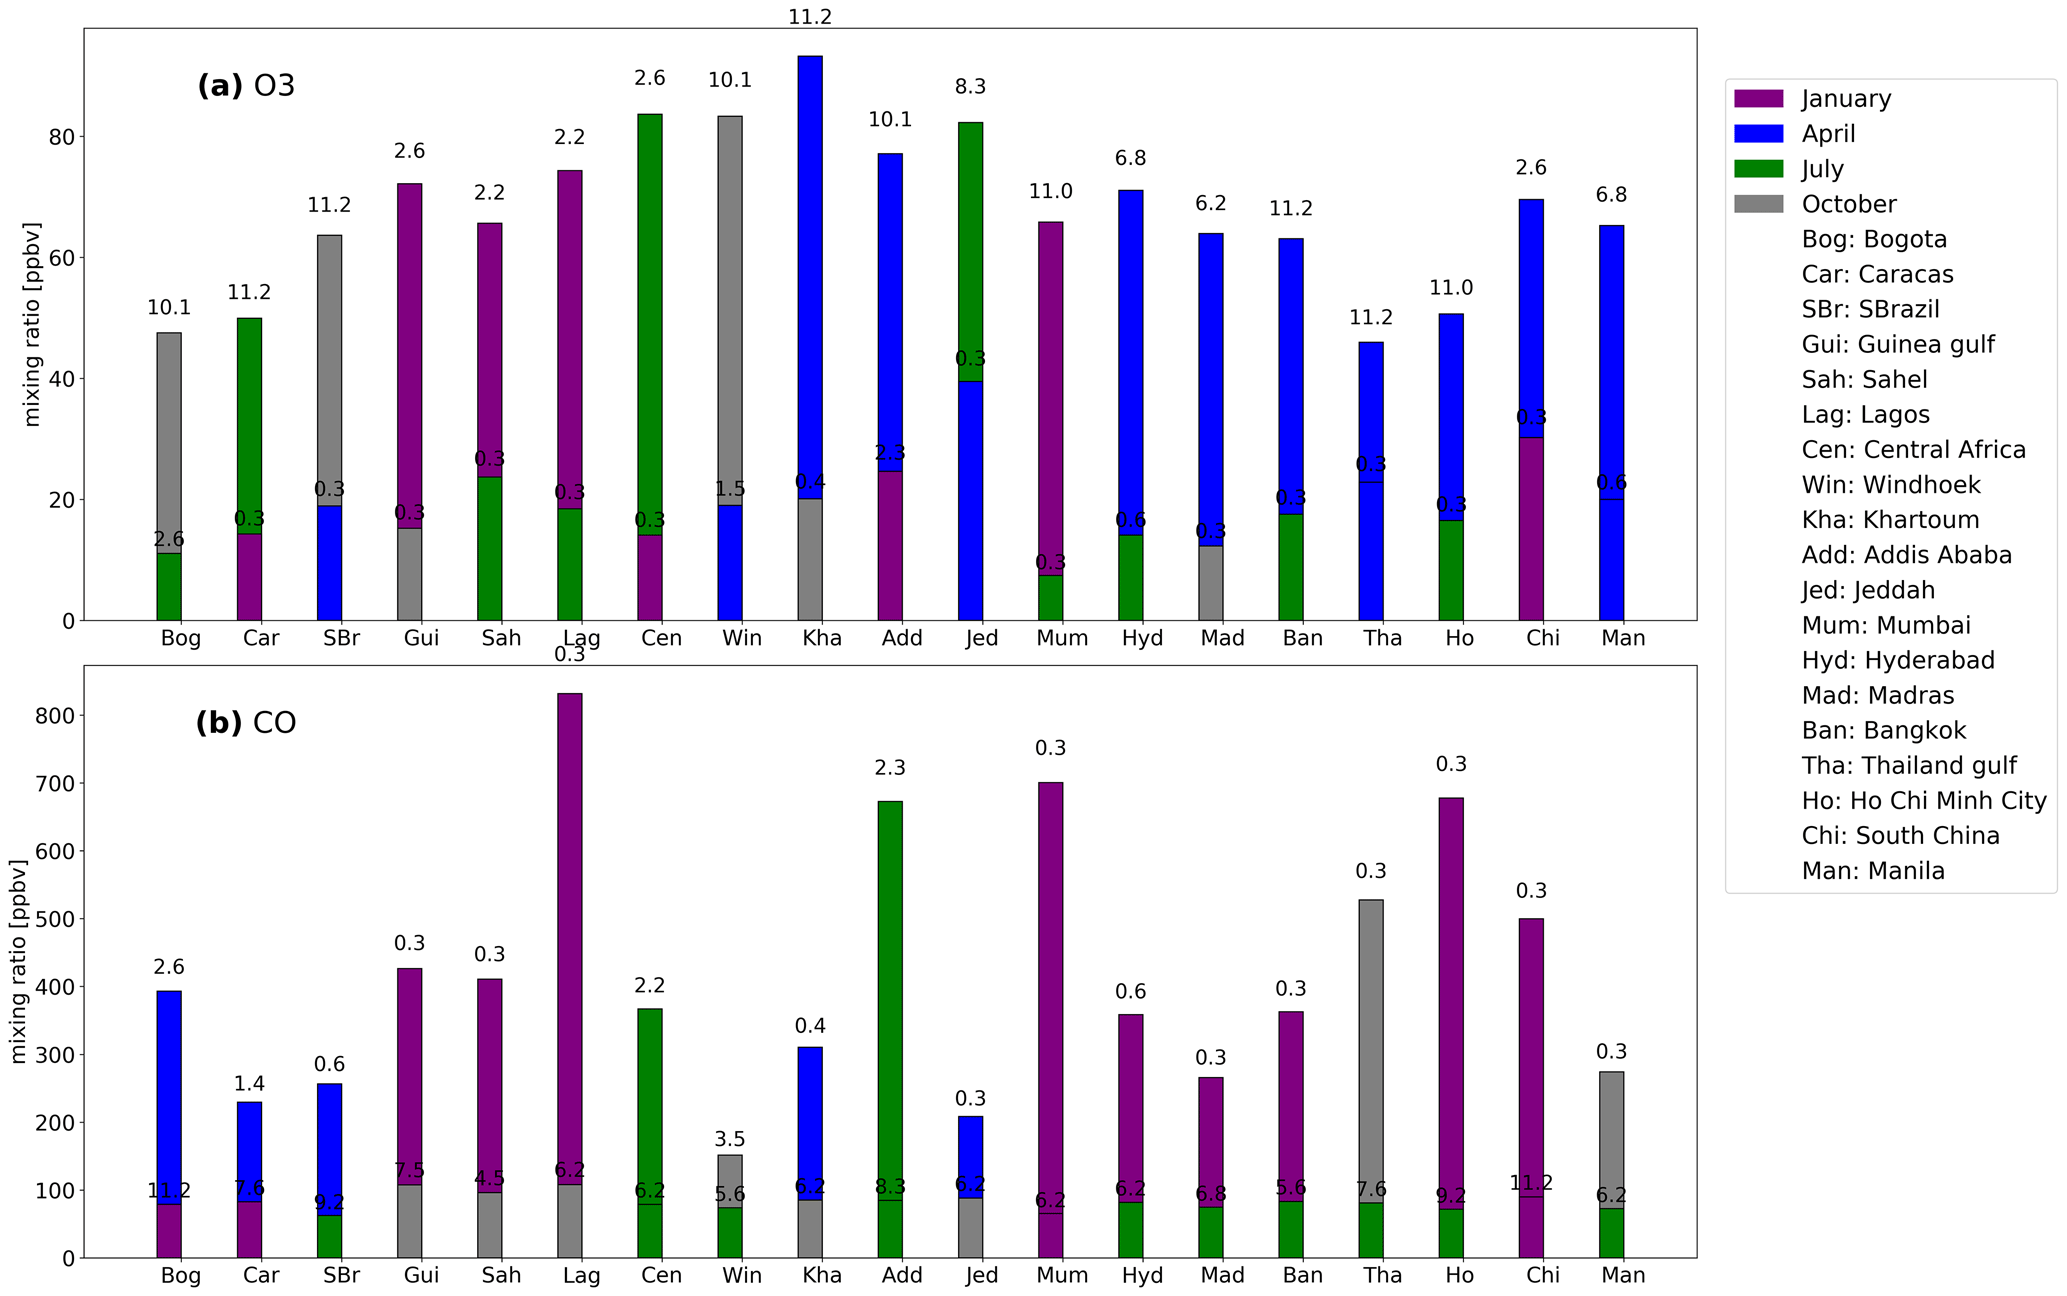
Figure 8O3 (a) and CO (b) annual maximum (higher bar) and minimum (lower bar) mixing ratio observed over the tropical clusters. The annotated number on top of each bar indicates the absolute altitude (km) of the observed annual maximum/minimum mixing ratio. The colour in the bar indicates the month of the maximum/minimum.
3.2 Control factors of tropical O3 and CO
First, we give an overview of the tropics, focusing on the extrema of O3 and CO of all clusters, then on AN and BB contributions in the upper troposphere. Finally, we look at tropical connections between emission source regions and CO and O3 distributions. Figure 8 displays the annual maxima and minima of O3 (a) and CO (b) mixing ratios and their corresponding mean height in terms of absolute altitude. The annual maxima and minima are calculated based on monthly averaged mixing ratios over vertical layers with 40 hPa thickness.
Overall, the CO profiles display an annual maximum close to the surface, at approximately 0.5 km (Fig. 8b), with strong magnitude variations. The minima are generally located in the free troposphere (MT or UT), in the absence of recent pollution, and where CO is chemically destroyed and are uniform in terms of mixing ratios, close to the background levels. Both maxima and minima present strong seasonality related to surface emissions and meteorological conditions.
For the majority of the northern tropical locations the CO maxima are mainly attributed to local AN emissions. However, for African locations and Caracas, the BB contribution is almost similar to or greater than AN (Fig. 3 panel 3, Fig. S6 panels 1 and 2, and Fig. 6 panel 3). This confirms the key role of AN emissions in the Northern Hemisphere, related to a larger population compared to the Southern Hemisphere and enhanced urban and industrial AN activity. The surface-layer pollution of the southern tropics is predominantly caused by BB over Africa (central Africa and Windhoek) during the dry season and by AN over southern Brazil (Fig. 3 panels 4 and 5 and Fig. 6 panel 5). The CO maxima over the latter occur before the burning season, in accordance with previous studies suggesting fossil fuels as the main CO source over São Paulo and Rio de Janeiro (Alonso et al., 2010) and decreasing BB over South America (Andela et al., 2017; Deeter et al., 2018) by more than 40 % due to the long-term declining deforestation rates, especially over forested areas and over savanna and shrublands (Naus et al., 2022).
Because of its complex chemistry, the situation for O3 is more complicated. Africa is the only region where the annual O3 maximum occurs in the LT (at 2.5 km) during the dry season (Sahel, Guinea Gulf, Lagos, and central Africa; Fig. 8a). The co-occurrence of maximum O3 with enhanced CO over Africa indicates the stronger dependency of O3 on the surface AN and BB CO emissions for these regions, in agreement with Sauvage et al. (2007b). South China is the only Asian cluster where the annual O3 maximum is observed in the LT (at 2.6 km) during the active local fires (April). In contrast, over the other regions, the annual O3 maximum is observed above 6 km (Fig. 8a). This indicates that O3 is likely associated with larger O3 production efficiency in the MT and UT (Sauvage et al., 2007c). In contrast, in regions such as southern Brazil and Windhoek, the co-occurrence of O3 and CO enhancement in the MT and UT indicates O3 production from surface sources with LiNOx emissions in October (Sects. 3.1.1 and 3.1.3).
The annual O3 minima for all the tropical clusters are observed close to the surface (below 0.5 km on average), likely related to deposition and titration by NO or because of lower O3 production in the presence of convective clouds relative to clear-sky conditions (Sect. 3.1.2).
Table 2Total (AN + BB) CO emission rates (10−10 ) based on CEDS2 and GFAS emission inventories over western Africa (0–12.5∘ N, 10∘ W–12.5∘ E), central Africa (2.5–20∘ S, 10–35∘ W), East Asia (10–27∘ N, 92.5–110∘ E), the Maritime Continent (10∘ S–10∘ N, 93–121∘ E), southern Brazil (0–20∘ S, 35–50∘ W), and Arabia and eastern Africa (5–25∘ N, 30–60∘ E).
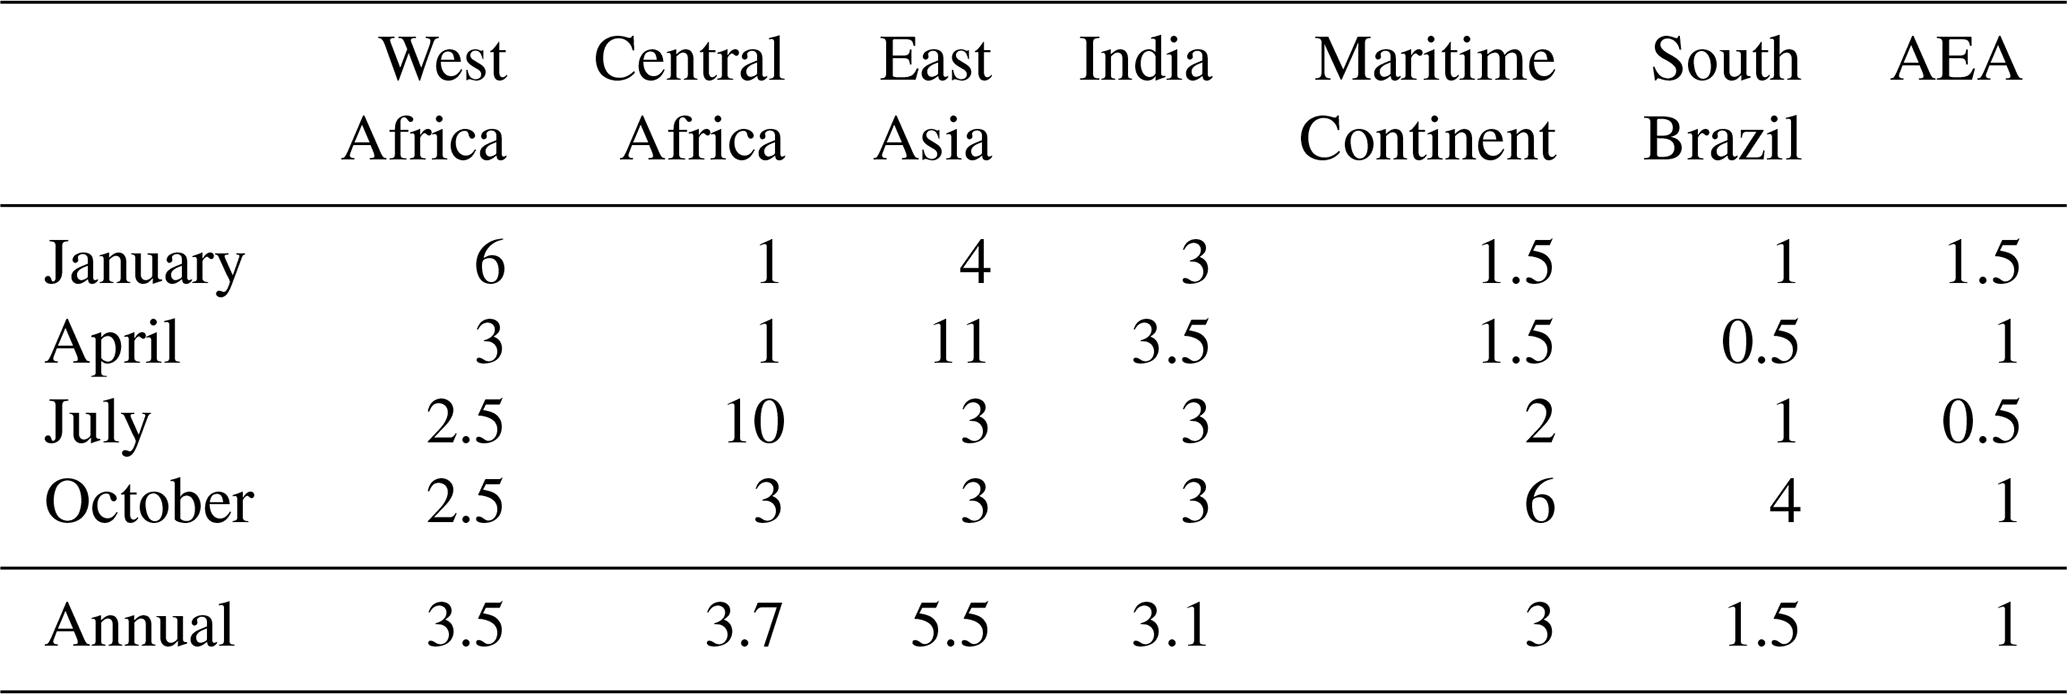
Throughout the tropics, the highest CO and O3 maxima occur over western Africa in the LT (Fig. 8) during the dry season (January). Table 2 displays the total (AN and BB) CO emission rates over several regions of interest based on the sum of CEDS2 and GFAS emission inventories. The NOx-limited O3 production regime over western Africa (Saunois et al., 2009; Zhang et al., 2016) likely explains the O3 maxima when the local emissions, and thus the NO2 mixing ratios, increase in the region (Jaeglé et al., 2004). The largest O3 and CO mixing ratio over Lagos is due to the strong Nigerian AN emissions and its location downwind of fire plumes through Harmattan, as confirmed by SOFT-IO (see Sect. 3.1.1).
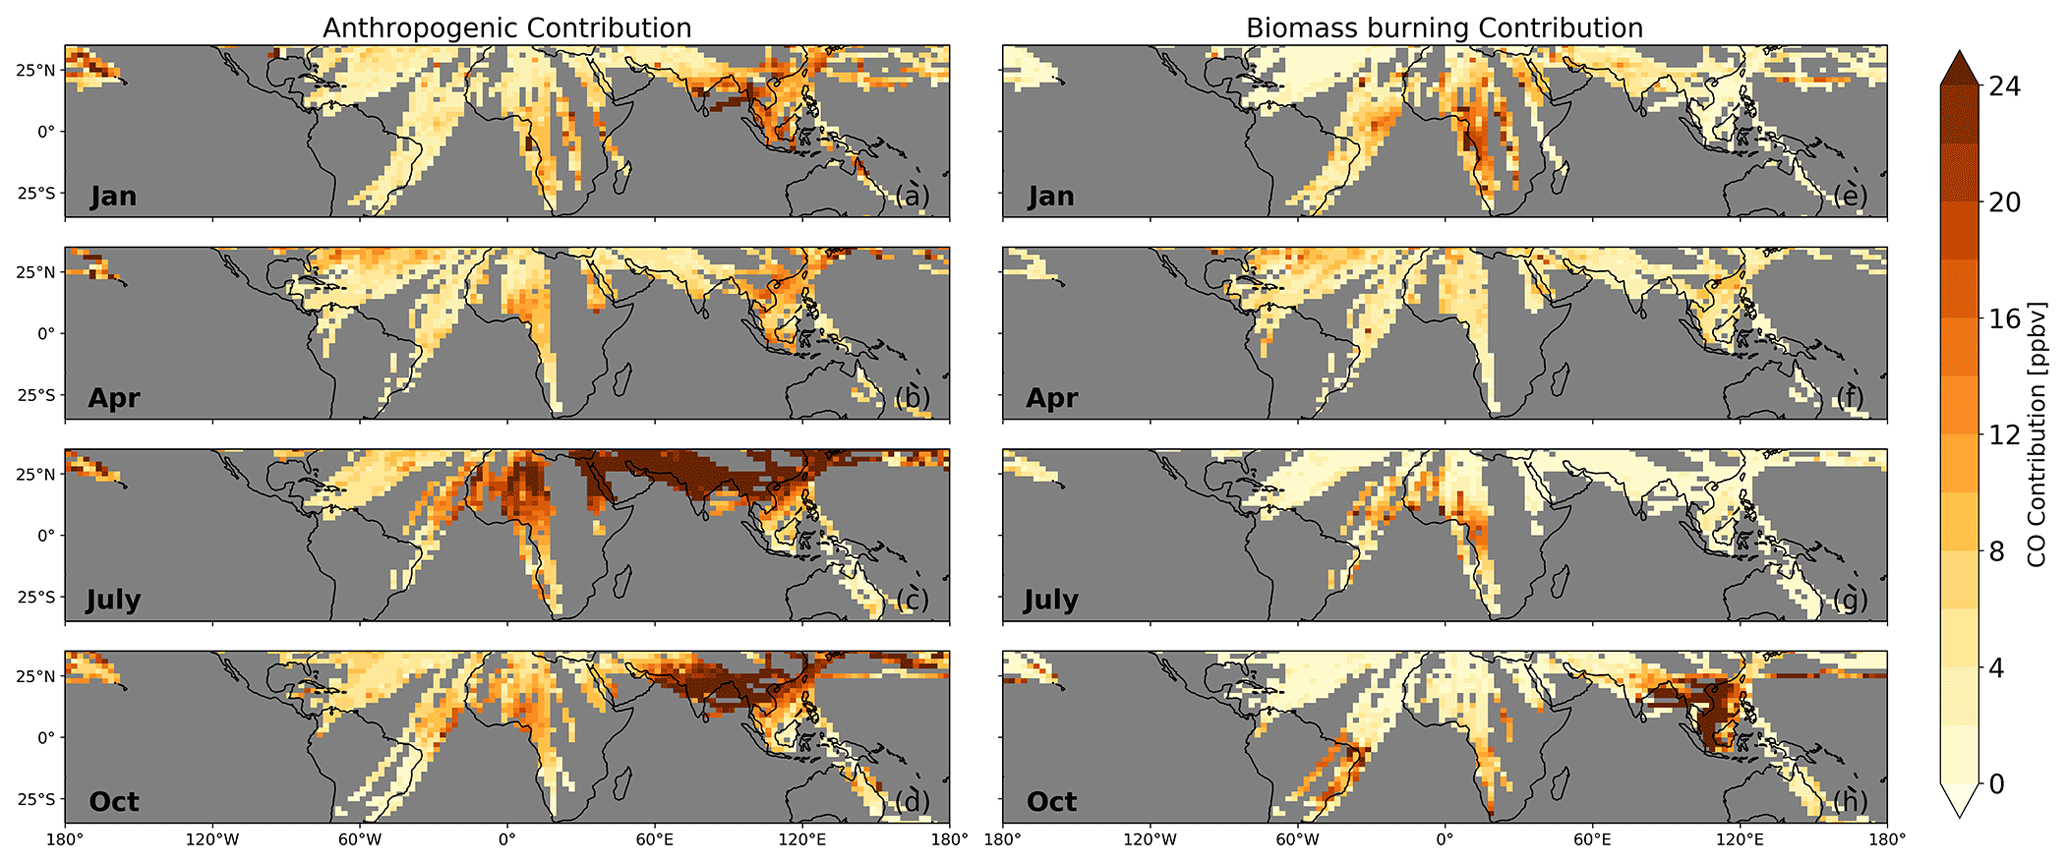
Figure 9Mean AN (a–d) and BB (e–h) contributions (ppb) between 300–185 hPa from 2002–2020.
The second-highest CO and O3 maxima over the tropics are observed over Asia (Fig. 8) in January, mostly due to AN emissions. According to Table 2, the CO emissions over East Asia and India are lower than the ones over western Africa in January, explaining the lower CO mixing ratios over Asia than over Lagos. SOFT-IO represents the Asian contributions better than the African ones. As mentioned in Sect. 3.1.1, the emissions over Africa are likely underestimated by the SOFT-IO computations. Previous studies have found mixing ratios of pollutants in western Africa comparable to those observed over Asian megacities (Assamoi and Liousse, 2010; Adon et al., 2016; Sauvage et al., 2007b). The rapid growth of African megacities is indeed responsible for increasing emissions from diffuse and inefficient combustion sources (Marais and Wiedinmyer, 2016), such as residential sources, mainly for cooking and heating (Zheng et al., 2019), and traffic emissions (related to a large number of two-stroke vehicles, poor fuel quality, and poorly maintained engines) (Assamoi and Liousse, 2010). In contrast, eastern China has had one of the largest decreases in CO emissions (Hedelius et al., 2021) due to technological changes with improved combustion efficiency (Zheng et al., 2018), such as replacing residential coal use with electricity and natural gas (Buchholz et al., 2021), reduction in NOx emissions from coal power plants since 2010 (Wang et al., 2017), and implementation of clean air policies (van der A et al., 2017) around 2010. Over South China, CO emissions have also been reduced in the last years, but the O3 levels remain relatively high (Fig. 8a). This is because the O3 production regime over South China is VOC-limited (Li et al., 2013), and the total non-methane volatile organic compound (NMVOC) emissions increased by a factor of 3.5 (1997–2017) because of activity increases in the solvent, energy, and industry sectors (Zheng et al., 2018). In India, on the other hand, the lack of efficient pollution regulations explains the highest CO mixing ratios among the Asian clusters (Fig. 8). Previous studies have already reported increasing CO emissions over India from 1996–2015 due to several factors, such as increases in residential and agricultural sources (Pandey et al., 2014), power production, and transport activities (Sadavarte and Venkataraman, 2014). Furthermore, Indian emissions are mostly associated with incomplete combustion processes from biofuel burning (Kumar et al., 2012) and are therefore characterized by higher NMVOC-to-NOx ratios than other Asian regions, leading to a NOx-limited O3 production regime (Lawrence and Lelieveld, 2010).
The smallest LT CO maxima over the northern tropics are observed over the AEA clusters and South America (Fig. 8) because of the smallest emission rates among the tropics (Table 2). The Middle East CO emissions are mainly related to electricity generation, water desalination, and industry supplied by oil and gas deposits with cheap but relatively clean fuels (Krotkov et al., 2016). O3 maxima in the MT and UT of the AEA and South American clusters are related to pollution transport and LiNOx emissions, respectively, at higher altitudes (Sects. 3.1.4 and 3.1.3).
From the previous analysis, all the tropical clusters are primarily influenced by local sources of CO. However, AN and BB emissions can be redistributed vertically and then carried horizontally aloft by zonal winds to influence the tropical upper troposphere. Figure 9 displays the AN and BB contributions to the CO anomalies (ppb) over the tropical UTcruise. AN emissions have the largest influence (Fig. 9), especially in the eastern part, from the Middle East to Asia in July and October. BB has a marked seasonal influence, less intense than that of AN. Fires strongly influence deep-convection outflow regions above the Intertropical Convergence Zone over Africa in January and July and above the South Atlantic Convergence over South America and the South Pacific Convergence Zone above Asia in October. For the latter, the influence of fire is of the same order as that of AN emissions (24 ppb simulated).
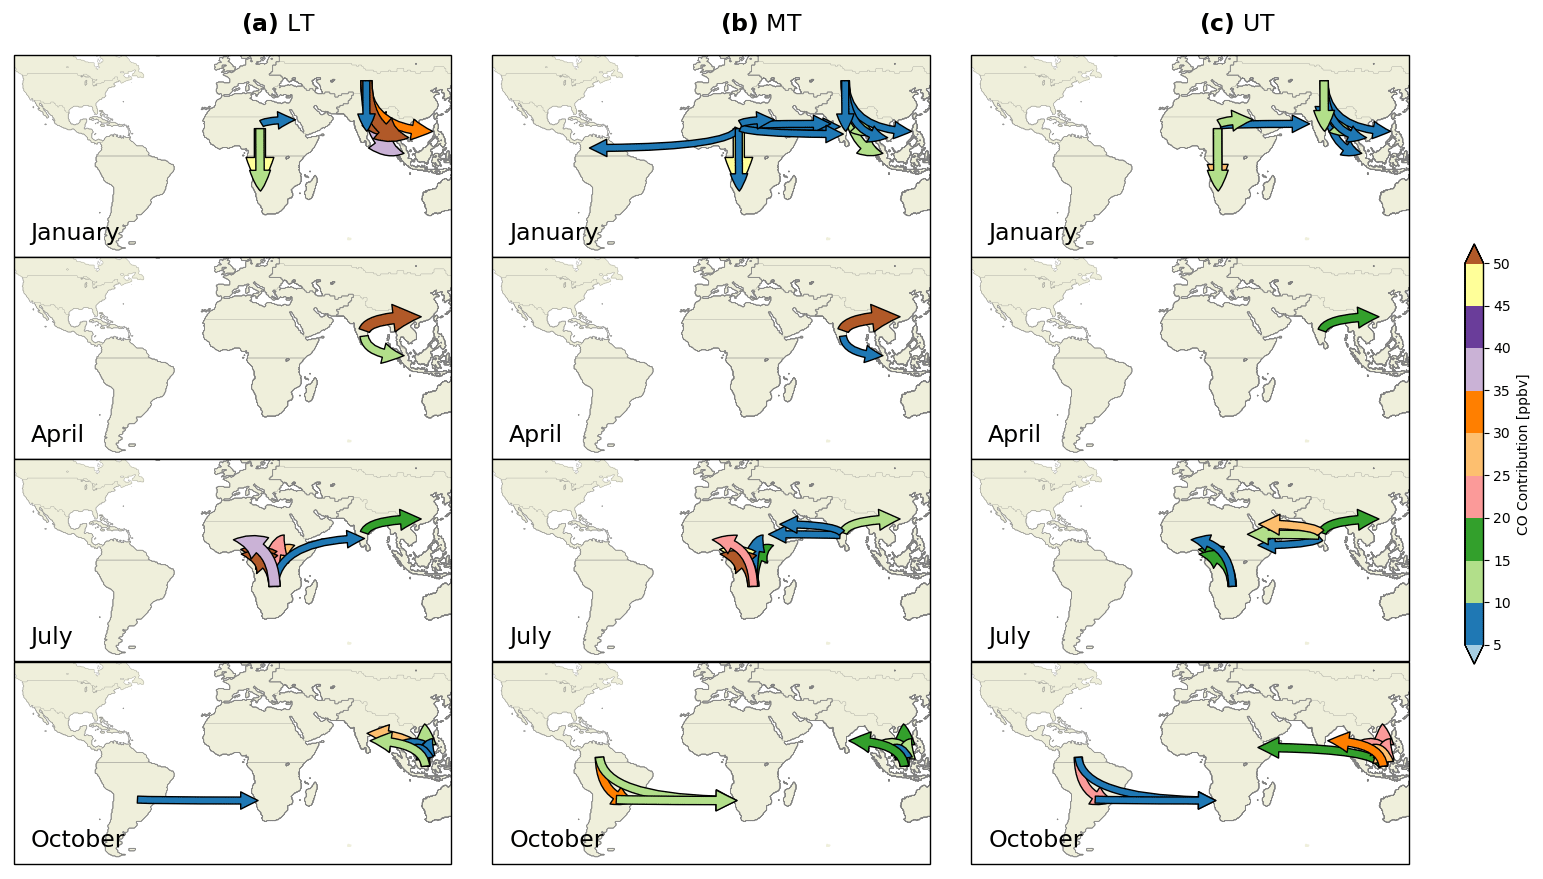
Figure 10Transport of CO (AN + BB) emissions from the African, South American, and Asian source regions towards the 20 tropical locations taken into account for this study. The colour bar shows the amount of CO transported (ppb).
In addition to the local influence, long-range transport plays an important role in the redistribution of these AN and BB emissions and, consequently, in the distribution of CO in the tropics. To illustrate this, Fig. 10 displays the transport pathways of CO emissions from the African, South American, and Asian source regions towards the 20 tropical IAGOS locations in the LT (Fig. 10a), MT (Fig. 10b), and UT (Fig. 10c). Only the source regions and the months corresponding to the largest amounts of transported CO (ppb) are depicted.
CO sources located over Africa show the largest influence on the regional tropical CO. Large amounts of CO are indeed transported inter-hemispherically from the dry-season region towards the wet-season region (Figs. 9 and 10) from the LT, with advection by the trade winds to the UT with the Hadley cells after vertical convective uplift in the convergence zone. As a result, CO contributions of 45–50 ppb (over 50 ppb) from Northern Hemisphere (Southern Hemisphere) Africa are found over southern (northern) Africa during the respective dry season in the entire troposphere. In the UT this explains why the Southern (Northern) Hemisphere African emissions are dominant in the wet-season hemisphere during July (January) (Fig. 9 and Figs. S12 and S10, respectively). During the dry season, the impact of the Northern Hemisphere African emissions is stronger and extends to a wider area over South America, the Middle East, and South Asia (NHAF; Fig. S10). Also, Northern Hemisphere African emissions are transported towards South America (10–15 ppb in MT, 5–10 ppb in the rest) in April (not shown) and significantly contribute to the local South American annual maximum (30 % and 50 % of CO anomalies over Caracas in the LT and MT, respectively) (Figs. 10 and 4a–b).
The contribution of Asian emissions in the tropical LT is limited to a regional scale, as they mostly impact neighbouring Asian regions (Fig. 10a). CO export from Asia is enhanced during the Asian summer monsoon and post-monsoon (July and October) in the UT, where transport is favoured due to stronger winds relative to the surface (Fig. S3). During the Asian summer monsoon, the CO-rich (and O3-poor) air masses from the boundary layer (Fig. 2c and g) are convectively uplifted to the UTcruise (Figs. 9c and S12) and trapped in the AMA circulation (see Sect. 3.1.2). Asian emissions are transported towards Arabia (25–30 ppb) and eastern Africa (10–15 ppb) in the UTcruise (SEAS and CEAS; Fig. 9c, Fig. 10 panel 3c, and Fig. S12). Subsidence of air masses from AMA above Arabia contributes to an O3 maximum above AEA (Fig. 8a) (Sect. 3.1.4). During the post-monsoon season (October), sporadic convection uplifts CO emitted by the equatorial Asian fires in the UTcruise (EQAS; Figs. 9g and S13) (see Sect. 3.1.2). At the same time, convection over continental Asia uplifts South East Asian AN emissions (SEAS; Figs. 9d and S13) to the UTcruise. As a result, Asian emissions impact CO anomalies in the UT over eastern Africa (15–20 ppb from equatorial Asia and 5–10 ppb from South East Asia; not shown).
South American emissions mostly influence the troposphere over the South Atlantic and South America in October (Fig. 10) through the South Atlantic Anticyclone circulation, accounting for around 25 % of the observed CO.
IAGOS O3 and CO observations since 1994 and 2002, respectively, were used to analyse tropospheric profiles over 20 tropical locations, along with the UTcruise distributions. Despite their sparse spatial coverage, these observations provide a good overview of the O3 and CO distributions in most tropical regions. They are indeed representative of both the urban background close to the ground and of the regional scale starting a few hundred metres above the surface (Petetin et al., 2018a). Furthermore, global IASI-SOFRID O3 and CO distributions allow us to complement IAGOS observations over the whole tropical band.
The results of the study indicate that the highest O3 and CO mixing ratios are observed over Africa during the fire season in January, with anomalies located in the LT (75 ppb at 2.5 km for O3 and 800 ppb at 0.3 km for CO over Lagos), and are explained mainly by anthropogenic emissions, but with a strong contribution from fires. The secondary O3 and CO maxima are observed over Asia, in the MT–UT in April for the first and in the LT in January for the second, with a larger contribution from AN emissions. The Asian distributions are largely controlled by meteorological conditions associated with the Asian monsoon phases. The lowest anomalies are measured over Caracas.
More specifically in the tropical LT, where the CO is maximum, the majority of the clusters are mostly influenced by local and regional AN contributions all year long. In particular, AN emissions have the greatest impact over Asia, Arabia and eastern Africa, and South America, where they account for more than 75 % of the CO. These results highlight the importance of the AN emissions over the tropical locations, in accordance with the global decreasing trends of BB and the increasing AN emissions. The impact of BB in the LT also has a predominantly local and regional influence with a strong seasonal dependence. BB contributions increase over South China (35 % in April) and dominate over the Gulf of Thailand (90 % in October) during the local fire season (South East and equatorial Asia, respectively). In contrast to the other continents, African LT, with the highest O3 and CO measured, is more impacted by BB during the dry seasons (January and July), with an influence of the same order as AN. This is also the case over Caracas (April) and southern Brazil (October). The highest BB impact is found over Southern Hemisphere Africa all year long (57 %–90 %), except in April, with BB emissions mostly originating from local fires, but also from Northern Hemisphere Africa in January (45 %–73 %) and Southern Hemisphere South America in October (29 % over Windhoek).
In the MT and UT, AN contributions are more important and dominate in the eastern part of the tropics, from the Middle East to Asia. BB contributions are increased compared to the LT and are higher in the outflow of the deep-convection regions, especially African fires over Africa in January and July and South East and equatorial Asian fires over the South East Asian coast (South China, Manila, Ho Chi Minh City) in April or October. Also, the contribution of long-range transport is more important than in the LT and allows connections between source regions and other continents.
Africa is the leading tropical region in terms of emission export to the tropical troposphere. The main export pathway is the inter-hemispheric transport of O3 and CO from the dry-season African regions to the wet-season ones. Northern (Southern) Hemisphere African fires are also the dominant source of CO over Arabia and eastern Africa (Khartoum and Jeddah) in the MT and UT, and they also reach the MT and UT of India, accounting for 20 % of the observed CO. Transport of African emissions from Africa occurs all year round towards northern South America in the entire troposphere, with the largest impact over Caracas in the MT and UT (30 % on average).
In contrast, the impact of Asian emissions is mostly limited on a regional or local scale, especially in the LT and MT. Nevertheless, long-range transport of Asian emissions is responsible for 60 % to 80 % of the CO anomalies in the UT over AEA in July and October. During the Asian summer monsoon, CO from South Asia is transported westwards within the AMA, while in October, the tropical easterly jet transports air masses impacted by Indonesian fires towards Africa.
Last, over South America the local CO contributions at the surface level are as low as over AEA. During the dry season (October), when the convection moves over the South American fires, CO and precursors are trapped in an anticyclonic circulation developed over central South America, resulting in the annual local maxima of O3 and CO. As a result, Northern and Southern Hemisphere South American emissions contributed 30 % of the CO observed in the MT over Windhoek after transport in the South Atlantic anticyclone.
The IAGOS data are available on the IAGOS data portal (https://doi.org/10.25326/20, Boulanger et al., 2019). The SOFT-IO v1.0 products are part of the ancillary products of IAGOS central database (https://doi.org/10.25326/2, Sauvage et al., 2017b; https://doi.org/10.25326/3, Sauvage et al., 2018). The SOFRID O3 and CO data are freely available on the IASI-SOFRID website (http://thredds.sedoo.fr/iasi-sofrid-o3-co/, SEDOO, 2014).
The supplement related to this article is available online at: https://doi.org/10.5194/acp-23-14039-2023-supplement.
MT, BS, and BB designed the research. All the co-authors contributed to acquisition of data. MT analysed the data. MT, BS, and BB interpreted the data. MT drafted the article. MT, BS, and BB revised the article. VT and HC commented on the article. ELF and BB are responsible for the SOFRID retrieval software. ELF is in charge of the production and quality control of SOFRID data.
The contact author has declared that none of the authors has any competing interests.
Publisher's note: Copernicus Publications remains neutral with regard to jurisdictional claims in published maps and institutional affiliations.
We acknowledge the strong support of the European Commission, Airbus, and the airlines (Deutsche Lufthansa, Air France, Austrian, Air Namibia, Cathay Pacific, Iberia, China Airlines, and Hawaiian Airlines) that have carried the MOZAIC or IAGOS equipment and performed the maintenance since 1994. IAGOS is funded by the European Union projects IAGOS–DS and IAGOS–ERI. Additionally, IAGOS is funded by INSU-CNRS (France), Météo-France, Université Paul Sabatier (Toulouse, France), and Research Center Jülich (FZJ, Jülich, Germany). The IAGOS database is supported in France by AERIS (https://www.aeris-data.fr, last access: 6 November 2023). IASI is a joint mission of EUMETSAT and the Centre National d'Etudes Spatiales (CNES, France). The authors acknowledge the CNES for financial support for the IASI activities.
This research has been supported by the Université Toulouse III – Paul Sabatier (Bonus Stratégique programme).
This paper was edited by Thomas Berkemeier and reviewed by three anonymous referees.
Adon, M., Galy-Lacaux, C., Yoboué, V., Delon, C., Lacaux, J. P., Castera, P., Gardrat, E., Pienaar, J., Al Ourabi, H., Laouali, D., Diop, B., Sigha-Nkamdjou, L., Akpo, A., Tathy, J. P., Lavenu, F., and Mougin, E.: Long term measurements of sulfur dioxide, nitrogen dioxide, ammonia, nitric acid and ozone in Africa using passive samplers, Atmos. Chem. Phys., 10, 7467–7487, https://doi.org/10.5194/acp-10-7467-2010, 2010. a
Adon, M., Yoboue, V., Galy-Lacaux, C., Liousse, C., Diop, B., Doumbia, E. H. T., Gardrat, E., Ndiaye, S. A., and Jarnot, C.: Measurements of NO2, SO2, NH3, HNO3 and O3 in West African urban environments, Atmos. Environ., 135, 31–40, https://doi.org/10.1016/j.atmosenv.2016.03.050, 2016. a
Aghedo, A. M., Schultz, M. G., and Rast, S.: The influence of African air pollution on regional and global tropospheric ozone, Atmos. Chem. Phys., 7, 1193–1212, https://doi.org/10.5194/acp-7-1193-2007, 2007. a
Alonso, M. F., Longo, K. M., Freitas, S. R., da Fonseca, R. M., Marécal, V., Pirre, M., and Klenner, L. G.: An urban emissions inventory for South America and its application in numerical modeling of atmospheric chemical composition at local and regional scales, Atmos. Environ., 44, 5072–5083, https://doi.org/10.1016/j.atmosenv.2010.09.013, 2010. a
Andela, N., Morton, D. C., Giglio, L., Chen, Y., van der Werf, G. R., Kasibhatla, P. S., DeFries, R. S., Collatz, G. L., Hantson, S., Kloster, S., Bachelet, D., Forrest, M., Lasslop, G., Li, F., Mangeon, S., Melton, J. R., Yue, C., and Randerson, J. T.: A human-driven decline in global burned area, Science, 356, 1356–1362, https://doi.org/10.1126/science.aal4108, 2017. a
Assamoi, E.-M. and Liousse, C.: A new inventory for two-wheel vehicle emissions in West Africa for 2002, Atmos. Environ., 44, 3985–3996, https://doi.org/10.1016/j.atmosenv.2010.06.048, 2010. a, b
Barret, B., Ricaud, P., Mari, C., Attié, J.-L., Bousserez, N., Josse, B., Le Flochmoën, E., Livesey, N. J., Massart, S., Peuch, V.-H., Piacentini, A., Sauvage, B., Thouret, V., and Cammas, J.-P.: Transport pathways of CO in the African upper troposphere during the monsoon season: a study based upon the assimilation of spaceborne observations, Atmos. Chem. Phys., 8, 3231–3246, https://doi.org/10.5194/acp-8-3231-2008, 2008. a
Barret, B., Le Flochmoen, E., Sauvage, B., Pavelin, E., Matricardi, M., and Cammas, J. P.: The detection of post-monsoon tropospheric ozone variability over south Asia using IASI data, Atmos. Chem. Phys., 11, 9533–9548, https://doi.org/10.5194/acp-11-9533-2011, 2011. a, b, c, d
Barret, B., Sauvage, B., Bennouna, Y., and Le Flochmoen, E.: Upper-tropospheric CO and O3 budget during the Asian summer monsoon, Atmos. Chem. Phys., 16, 9129–9147, https://doi.org/10.5194/acp-16-9129-2016, 2016. a, b, c
Barret, B., Emili, E., and Le Flochmoen, E.: A tropopause-related climatological a priori profile for IASI-SOFRID ozone retrievals: improvements and validation, Atmos. Meas. Tech., 13, 5237–5257, https://doi.org/10.5194/amt-13-5237-2020, 2020. a, b, c, d, e
Barret, B., Gouzenes, Y., Le Flochmoen, E., and Ferrant, S.: Retrieval of Metop-A/IASI N2O profiles and validation with NDACC FTIR data, Atmosphere, 12, 219, https://doi.org/10.3390/atmos12020219, 2021. a
Blot, R., Nedelec, P., Boulanger, D., Wolff, P., Sauvage, B., Cousin, J.-M., Athier, G., Zahn, A., Obersteiner, F., Scharffe, D., Petetin, H., Bennouna, Y., Clark, H., and Thouret, V.: Internal consistency of the IAGOS ozone and carbon monoxide measurements for the last 25 years, Atmos. Meas. Tech., 14, 3935–3951, https://doi.org/10.5194/amt-14-3935-2021, 2021. a
Boulanger, D., Thouret, V., and Petzold, A.: IAGOS Data Portal, AERIS [data set], https://doi.org/10.25326/20, 2019. a
Bourgeois, I., Peischl, J., Thompson, C. R., Aikin, K. C., Campos, T., Clark, H., Commane, R., Daube, B., Diskin, G. W., Elkins, J. W., Gao, R.-S., Gaudel, A., Hintsa, E. J., Johnson, B. J., Kivi, R., McKain, K., Moore, F. L., Parrish, D. D., Querel, R., Ray, E., Sánchez, R., Sweeney, C., Tarasick, D. W., Thompson, A. M., Thouret, V., Witte, J. C., Wofsy, S. C., and Ryerson, T. B.: Global-scale distribution of ozone in the remote troposphere from the ATom and HIPPO airborne field missions, Atmos. Chem. Phys., 20, 10611–10635, https://doi.org/10.5194/acp-20-10611-2020, 2020. a
Bourgeois, I., Peischl, J., Neuman, J. A., Brown, S. S., Thompson, C. R., Aikin, K. C., Allen, H. M., Angot, H., Apel, E. C., Baublitz, C. B., Brewer, J. F., Campuzano-Jost, P., Commane, R., Crounse, J. D., Daube, B. C., DiGangi, J. P., Diskin, G. S., Emmons, L. K., Fiore, A. M., Gkatzelis, G. I., Hills, A., Hornbrook, R. S., Huey, L. G., Jimenez, J. L., Kim, M., Lacey, F., McKain, K., Murray, L. T., Nault, B. A., Parrish, D. D., Ray, E., Sweeney, C., Tanner, D., Wofsy, S. C., and Ryerson, T. B.: Large contribution of biomass burning emissions to ozone throughout the global remote troposphere, P. Natl. Acad. Sci. USA, 118, e2109628118, https://doi.org/10.1073/pnas.2109628118, 2021. a
Boynard, A., Hurtmans, D., Koukouli, M. E., Goutail, F., Bureau, J., Safieddine, S., Lerot, C., Hadji-Lazaro, J., Wespes, C., Pommereau, J.-P., Pazmino, A., Zyrichidou, I., Balis, D., Barbe, A., Mikhailenko, S. N., Loyola, D., Valks, P., Van Roozendael, M., Coheur, P.-F., and Clerbaux, C.: Seven years of IASI ozone retrievals from FORLI: validation with independent total column and vertical profile measurements, Atmos. Meas. Tech., 9, 4327–4353, https://doi.org/10.5194/amt-9-4327-2016, 2016. a
Boynard, A., Hurtmans, D., Garane, K., Goutail, F., Hadji-Lazaro, J., Koukouli, M. E., Wespes, C., Vigouroux, C., Keppens, A., Pommereau, J.-P., Pazmino, A., Balis, D., Loyola, D., Valks, P., Sussmann, R., Smale, D., Coheur, P.-F., and Clerbaux, C.: Validation of the IASI FORLI/EUMETSAT ozone products using satellite (GOME-2), ground-based (Brewer–Dobson, SAOZ, FTIR) and ozonesonde measurements, Atmos. Meas. Tech., 11, 5125–5152, https://doi.org/10.5194/amt-11-5125-2018, 2018. a
Buchholz, R. R., Worden, H. M., Park, M., Francis, G., Deeter, M. N., Edwards, D. P., Emmons, L. K., Gaubert, B., Gille, J., Martınez-Alonso, S., Tang, W., Kumar, R., Drummond, J. R., Clerbaux, C., George, M., Coheur, P. F., Hurtmans, D., Bowman, K. W., Luo, M., Payne, V. H., Worden, J. R., Chin, M., Levy, R. C., Warner, J., Wei, Z., and Kulawik, S. S: Air pollution trends measured from Terra: CO and AOD over industrial, fire-prone, and background regions, Remote Sens. Environ., 256, 112275, https://doi.org/10.1016/j.rse.2020.112275, 2021. a
Clerbaux, C., Boynard, A., Clarisse, L., George, M., Hadji-Lazaro, J., Herbin, H., Hurtmans, D., Pommier, M., Razavi, A., Turquety, S., Wespes, C., and Coheur, P.-F.: Monitoring of atmospheric composition using the thermal infrared IASI/MetOp sounder, Atmos. Chem. Phys., 9, 6041–6054, https://doi.org/10.5194/acp-9-6041-2009, 2009. a
Cohen, Y., Petetin, H., Thouret, V., Marécal, V., Josse, B., Clark, H., Sauvage, B., Fontaine, A., Athier, G., Blot, R., Boulanger, D., Cousin, J.-M., and Nédélec, P.: Climatology and long-term evolution of ozone and carbon monoxide in the upper troposphere–lower stratosphere (UTLS) at northern midlatitudes, as seen by IAGOS from 1995 to 2013, Atmos. Chem. Phys., 18, 5415–5453, https://doi.org/10.5194/acp-18-5415-2018, 2018. a
Curtis, L., Rea, W., Smith-Willis, P., Fenyves, E., and Pan, Y.: Adverse health effects of outdoor air pollutants, Environ. Int., 32, 815–830, https://doi.org/10.1016/j.envint.2006.03.012, 2006. a
Cussac, M., Marécal, V., Thouret, V., Josse, B., and Sauvage, B.: The impact of biomass burning on upper tropospheric carbon monoxide: a study using MOCAGE global model and IAGOS airborne data, Atmos. Chem. Phys., 20, 9393–9417, https://doi.org/10.5194/acp-20-9393-2020, 2020. a
Deeter, M., Martínez-Alonso, S., Andreae, M. O., and Schlager, H.: Satellite-based analysis of CO seasonal and interannual variability over the Amazon Basin, J. Geophys. Res.-Atmos., 123, 5641–5656, https://doi.org/10.1029/2018JD028425, 2018. a
De Wachter, E., Barret, B., Le Flochmoën, E., Pavelin, E., Matricardi, M., Clerbaux, C., Hadji-Lazaro, J., George, M., Hurtmans, D., Coheur, P.-F., Nedelec, P., and Cammas, J. P.: Retrieval of MetOp-A/IASI CO profiles and validation with MOZAIC data, Atmos. Meas. Tech., 5, 2843–2857, https://doi.org/10.5194/amt-5-2843-2012, 2012. a, b, c, d, e
Dufour, G., Eremenko, M., Orphal, J., and Flaud, J.-M.: IASI observations of seasonal and day-to-day variations of tropospheric ozone over three highly populated areas of China: Beijing, Shanghai, and Hong Kong, Atmos. Chem. Phys., 10, 3787–3801, https://doi.org/10.5194/acp-10-3787-2010, 2010. a
Duncan, B. N., Lamsal, L. N., Thompson, A. M., Yoshida, Y., Lu, Z., Streets, D. G., Hurwitz, M. M., and Pickering, K. E.: A space-based, high-resolution view of notable changes in urban NOx pollution around the world (2005–2014), J. Geophys. Res.-Atmos., 121, 976–996, https://doi.org/10.1002/2015JD024121, 2016. a
Emmons, L. K., Walters, S., Hess, P. G., Lamarque, J.-F., Pfister, G. G., Fillmore, D., Granier, C., Guenther, A., Kinnison, D., Laepple, T., Orlando, J., Tie, X., Tyndall, G., Wiedinmyer, C., Baughcum, S. L., and Kloster, S.: Description and evaluation of the Model for Ozone and Related chemical Tracers, version 4 (MOZART-4), Geosci. Model Dev., 3, 43–67, https://doi.org/10.5194/gmd-3-43-2010, 2010. a
Eremenko, M., Dufour, G., Foret, G., Keim, C., Orphal, J., Beekmann, M., Bergametti, G., and Flaud, J.-M.: Tropospheric ozone distributions over Europe during the heat wave in July 2007 observed from infrared nadir spectra recorded by IASI, Geophys. Res. Lett., 35, L18805, https://doi.org/10.1029/2008GL034803, 2008. a
Galanter, M., Levy, H., and Carmichael, G. R.: Impacts of biomass burning on tropospheric CO, NOx, and O3, J. Geophys. Res.-Atmos., 105, 6633–6653, https://doi.org/10.1029/1999JD901113, 2000. a
Gaudel, A., Cooper, O. R., Ancellet, G., Barret, B., Boynard, A., Burrows, J. P., Clerbaux, C., Coheur, P. F., Cuesta, J., Cuevas, E., Doniki, S., Dufour, G., Ebojie, F., Foret, G., Garcia, O., Granados-Munoz, M. J., Hannigan, J. W., Hase, F., Hassler, B., Huang, G., Hurtmans, D., Jaffe, D., Jones, N., Kalabokas, P., Kerridge, B., Kulawik, S., Latter, B., Leblanc, T., Le Flochmoen, E., Lin, W., Liu, J., Liu, X., Mahieu, E., McClure-Begley, A., Neu, J. L., Osman, M., Palm, M., Petetin, H., Petropavlovskikh, I., Querel, R., Rahpoe, N., Rozanov, A., Schultz, M. G., Schwab, J., Siddans, R., Smale, D., Steinbacher, M., Tanimoto, H., Tarasick, D. W., Thouret, V., Thompson, A. M., Trickl, T., Weatherhead, E., Wespes, C., Worden, H. M., Vigouroux, C., Xu, X., Zeng, G., and Ziemke, J.: Tropospheric Ozone Assessment Report: Present-day distribution and trends of tropospheric ozone relevant to climate and global atmospheric chemistry model evaluation, Elementa: Science of the Anthropocene, 6, 39, https://doi.org/10.1525/elementa.291, 2018. a, b
Gaudel, A., Cooper, O. R., Chang, K.-L., Bourgeois, I., Ziemke, J. R., Strode, S. A., Oman, L. D., Sellitto, P., Nédélec, P., and Blot, R.: Aircraft observations since the 1990s reveal increases of tropospheric ozone at multiple locations across the Northern Hemisphere, Science Advances, 6, eaba8272, https://doi.org/10.1126/sciadv.aba8272, 2020. a, b
Gauss, M., Myhre, G., Pitari, G., Prather, M. J., Isaksen, I. S. A., Berntsen, T. K., Brasseur, G. P., Dentener, F. J., Derwent, R. G., Hauglustaine, D. A., Horowitz, L. W., Jacob, D. J., Johnson, M., Law, S., Mickley, L. J., Müller, J.-F., Plantevin, P.-H., Pyle, J. A., Rogers, H. L., Stevenson, D. S., Sundet, J. K., van Weele, M., and Wild, O.: M uller, J. F., Plantevin, P., Pyle, J. A., Rogers, H. L., Stevenson, D. S., Sundet, J. K., van Weele, M., and Wild, O.: Radiative forcing in the 21st century due to ozone changes in the troposphere and the lower stratosphere, J. Geophys. Res., 108, 4292, https://doi.org/10.1029/2002JD002624, 2003. a
George, M., Clerbaux, C., Hurtmans, D., Turquety, S., Coheur, P.-F., Pommier, M., Hadji-Lazaro, J., Edwards, D. P., Worden, H., Luo, M., Rinsland, C., and McMillan, W.: Carbon monoxide distributions from the IASI/METOP mission: evaluation with other space-borne remote sensors, Atmos. Chem. Phys., 9, 8317–8330, https://doi.org/10.5194/acp-9-8317-2009, 2009. a
Granier, C., Bessagnet, B., Bond, T., D’Angiola, A., Denier van der Gon, H., Frost, G. J., Heil, A., Kaiser, J. W., Kinne, S., Klimont, Z., Kloster, S., Lamarque, J.-F., Liousse, C., Masui, T., Meleux, F., Mieville, A., Ohara, R., Raut, J.-C., Riahi, K., Schultz, M. G., Smith, S. G., Thompson, A., van Aardenne, J., van der Werf, G. R., and van Vuuren, D. P.: Evolution of anthropogenic and biomass burning emissions of air pollutants at global and regional scales during the 1980–2010 period, Climatic Change, 109, 163–190, https://doi.org/10.1007/s10584-011-0154-1, 2011. a, b
Gressent, A., Sauvage, B., Defer, E., Pätz, H. W., Thomas, K., Holle, R., Cammas, J.-P., Nédélec, P., Boulanger, D., Thouret, V., and Volz-Thomas, A.: Lightning NOx influence on large-scale NOy and O3 plumes observed over the northern mid-latitudes, Tellus B, 66, 25544, https://doi.org/10.3402/tellusb.v66.25544, 2014. a
Gressent, A., Sauvage, B., Cariolle, D., Evans, M., Leriche, M., Mari, C., and Thouret, V.: Modeling lightning-NOx chemistry on a sub-grid scale in a global chemical transport model, Atmos. Chem. Phys., 16, 5867–5889, https://doi.org/10.5194/acp-16-5867-2016, 2016. a
Hedelius, J. K., Toon, G. C., Buchholz, R. R., Iraci, L. T., Podolske, J. R., Roehl, C. M., Wennberg, P. O., Worden, H. M., and Wunch, D.: Regional and urban column CO trends and anomalies as observed by MOPITT over 16 years, J. Geophys. Res.-Atmos., 126, e2020JD033967, https://doi.org/10.1029/2020JD033967, 2021. a
Heue, K.-P., Coldewey-Egbers, M., Delcloo, A., Lerot, C., Loyola, D., Valks, P., and van Roozendael, M.: Trends of tropical tropospheric ozone from 20 years of European satellite measurements and perspectives for the Sentinel-5 Precursor, Atmos. Meas. Tech., 9, 5037–5051, https://doi.org/10.5194/amt-9-5037-2016, 2016. a
IPCC: Climate change 2021: The physical science basis, Tech. rep., http://www.ipcc.ch/report/ar6/wg1/ (last access: 16 October 2023), 2021. a
Jaeglé, L., Martin, R., Chance, K., Steinberger, L., Kurosu, T., Jacob, D. J., Modi, A., Yoboué, V., Sigha-Nkamdjou, L., and Galy-Lacaux, C.: Satellite mapping of rain-induced nitric oxide emissions from soils, J. Geophys. Res.-Atmos., 109, D21310, https://doi.org/10.1029/2004JD004787, 2004. a
Jerrett, M., Burnett, R. T., Pope III, C. A., Ito, K., Thurston, G., Krewski, D., Shi, Y., Calle, E., and Thun, M.: Long-term ozone exposure and mortality, New Engl. J. Med., 360, 1085–1095, https://doi.org/10.1056/NEJMoa0803894, 2009. a
Jia, J., Ladstätter-Weißenmayer, A., Hou, X., Rozanov, A., and Burrows, J. P.: Tropospheric ozone maxima observed over the Arabian Sea during the pre-monsoon, Atmos. Chem. Phys., 17, 4915–4930, https://doi.org/10.5194/acp-17-4915-2017, 2017. a
Kaiser, J. W., Heil, A., Andreae, M. O., Benedetti, A., Chubarova, N., Jones, L., Morcrette, J.-J., Razinger, M., Schultz, M. G., Suttie, M., and van der Werf, G. R.: Biomass burning emissions estimated with a global fire assimilation system based on observed fire radiative power, Biogeosciences, 9, 527–554, https://doi.org/10.5194/bg-9-527-2012, 2012. a
Krotkov, N. A., McLinden, C. A., Li, C., Lamsal, L. N., Celarier, E. A., Marchenko, S. V., Swartz, W. H., Bucsela, E. J., Joiner, J., Duncan, B. N., Boersma, K. F., Veefkind, J. P., Levelt, P. F., Fioletov, V. E., Dickerson, R. R., He, H., Lu, Z., and Streets, D. G.: Aura OMI observations of regional SO2 and NO2 pollution changes from 2005 to 2015, Atmos. Chem. Phys., 16, 4605–4629, https://doi.org/10.5194/acp-16-4605-2016, 2016. a
Kumar, R., Naja, M., Pfister, G. G., Barth, M. C., Wiedinmyer, C., and Brasseur, G. P.: Simulations over South Asia using the Weather Research and Forecasting model with Chemistry (WRF-Chem): chemistry evaluation and initial results, Geosci. Model Dev., 5, 619–648, https://doi.org/10.5194/gmd-5-619-2012, 2012. a
Lamarque, J.-F., Bond, T. C., Eyring, V., Granier, C., Heil, A., Klimont, Z., Lee, D., Liousse, C., Mieville, A., Owen, B., Schultz, M. G., Shindell, D., Smith, S. J., Stehfest, E., Van Aardenne, J., Cooper, O. R., Kainuma, M., Mahowald, N., McConnell, J. R., Naik, V., Riahi, K., and van Vuuren, D. P.: Historical (1850–2000) gridded anthropogenic and biomass burning emissions of reactive gases and aerosols: methodology and application, Atmos. Chem. Phys., 10, 7017–7039, https://doi.org/10.5194/acp-10-7017-2010, 2010. a
Lannuque, V., Sauvage, B., Barret, B., Clark, H., Athier, G., Boulanger, D., Cammas, J.-P., Cousin, J.-M., Fontaine, A., Le Flochmoën, E., Nédélec, P., Petetin, H., Pfaffenzeller, I., Rohs, S., Smit, H. G. J., Wolff, P., and Thouret, V.: Origins and characterization of CO and O3 in the African upper troposphere, Atmos. Chem. Phys., 21, 14535–14555, https://doi.org/10.5194/acp-21-14535-2021, 2021. a, b, c, d
Lawrence, M. G. and Lelieveld, J.: Atmospheric pollutant outflow from southern Asia: a review, Atmos. Chem. Phys., 10, 11017–11096, https://doi.org/10.5194/acp-10-11017-2010, 2010. a, b
Lelieveld, J., Hoor, P., Jöckel, P., Pozzer, A., Hadjinicolaou, P., Cammas, J.-P., and Beirle, S.: Severe ozone air pollution in the Persian Gulf region, Atmos. Chem. Phys., 9, 1393–1406, https://doi.org/10.5194/acp-9-1393-2009, 2009. a
Lelieveld, J., Gromov, S., Pozzer, A., and Taraborrelli, D.: Global tropospheric hydroxyl distribution, budget and reactivity, Atmos. Chem. Phys., 16, 12477–12493, https://doi.org/10.5194/acp-16-12477-2016, 2016. a
Lelieveld, J., Crutzen, P. J., Ramanathan, V., Andreae, M. O., Brenninkmeijer, C. A. M., Campos, T., Cass, G. R., Dickerson, R. R., Fischer, H., de Gouw, J. A., Hansel, A., Jefferson, A., Kley, D., de Laat, A. T. J., Lal, S., Lawrence, M. G., Lobert, J. M., MayolBracero, O. L., Mitra, A. P., Novakov, T., Oltmans, S. J., Prather, K. A., Reiner, T., Rodhe, H., Scheeren, H. A., Sikka, D., and Williams, J.: The Indian Ocean experiment: widespread air pollution from South and Southeast Asia, Science, 291, 1031–1036, https://doi.org/10.1126/science.1057103, 2001. a
Li, Y., Lau, A. K., Fung, J. C., Zheng, J., and Liu, S.: Importance of NOx control for peak ozone reduction in the Pearl River Delta region, J. Geophys. Res.-Atmos., 118, 9428–9443, https://doi.org/10.1002/jgrd.50659, 2013. a
Liu, J., Logan, J. A., Jones, D. B. A., Livesey, N. J., Megretskaia, I., Carouge, C., and Nedelec, P.: Analysis of CO in the tropical troposphere using Aura satellite data and the GEOS-Chem model: insights into transport characteristics of the GEOS meteorological products, Atmos. Chem. Phys., 10, 12207–12232, https://doi.org/10.5194/acp-10-12207-2010, 2010. a
Livesey, N. J., Logan, J. A., Santee, M. L., Waters, J. W., Doherty, R. M., Read, W. G., Froidevaux, L., and Jiang, J. H.: Interrelated variations of O3, CO and deep convection in the tropical/subtropical upper troposphere observed by the Aura Microwave Limb Sounder (MLS) during 2004–2011, Atmos. Chem. Phys., 13, 579–598, https://doi.org/10.5194/acp-13-579-2013, 2013. a
Logan, J. A.: An analysis of ozonesonde data for the troposphere: Recommendations for testing 3-D models and development of a gridded climatology for tropospheric ozone, J. Geophys. Res.-Atmos., 104, 16115–16149, https://doi.org/10.1029/1998JD100096, 1999. a
Logan, J. A., Prather, M. J., Wofsy, S. C., and McElroy, M. B.: Tropospheric chemistry: A global perspective, J. Geophys. Res.-Oceans, 86, 7210–7254, https://doi.org/10.1029/JC086iC08p07210, 1981. a, b
Lu, X., Zhang L., Zhao, Y., Jacob, D.J., Hu, L., Gao, M., Liu, X., Petropavlovskikh, I., McClure-Begley, A., and Querel, R.: Surface and tropospheric ozone trends in the Southern Hemisphere since 1990: possible linkages to poleward expansion of the Hadley circulation, Sci. Bull., 64, 400–409, https://doi.org/10.1016/j.scib.2018.12.021, 2019. a
Marais, E. A. and Wiedinmyer, C.: Air quality impact of diffuse and inefficient combustion emissions in Africa (DICE-Africa), Environ. Sci. Technol., 50, 10739–10745, https://doi.org/10.1021/acs.est.6b02602, 2016. a
Marenco, A., Thouret, V., Nédélec, P., Smit, H. G., Helten, M., Kley, D., Karcher, F., Simon, P., Law, K., Pyle, J., Poschmann, G., Von Wrede, R., Hume, C., and Cook, T.: Measurement of ozone and water vapor by Airbus in-service aircraft: The MOZAIC airborne program, An overview, J. Geophys. Res.-Atmos., 103, 25631–25642, https://doi.org/10.1029/98JD00977, 1998. a, b
Mari, C., Jacob, D. J., and Bechtold, P.: Transport and scavenging of soluble gases in a deep convective cloud, J. Geophys. Res.-Atmos., 105, 22255–22267, https://doi.org/10.1029/2000JD900211, 2000. a
McDuffie, E. E., Smith, S. J., O'Rourke, P., Tibrewal, K., Venkataraman, C., Marais, E. A., Zheng, B., Crippa, M., Brauer, M., and Martin, R. V.: A global anthropogenic emission inventory of atmospheric pollutants from sector- and fuel-specific sources (1970–2017): an application of the Community Emissions Data System (CEDS), Earth Syst. Sci. Data, 12, 3413–3442, https://doi.org/10.5194/essd-12-3413-2020, 2020. a
Monks, P. S.: Gas-phase radical chemistry in the troposphere, Chem. Soc. Rev., 34, 376–395, https://doi.org/10.1039/B307982C, 2005. a
Monks, P. S., Archibald, A. T., Colette, A., Cooper, O., Coyle, M., Derwent, R., Fowler, D., Granier, C., Law, K. S., Mills, G. E., Stevenson, D. S., Tarasova, O., Thouret, V., von Schneidemesser, E., Sommariva, R., Wild, O., and Williams, M. L.: Tropospheric ozone and its precursors from the urban to the global scale from air quality to short-lived climate forcer, Atmos. Chem. Phys., 15, 8889–8973, https://doi.org/10.5194/acp-15-8889-2015, 2015. a
Myhre, G., Samset, B. H., Schulz, M., Balkanski, Y., Bauer, S., Berntsen, T. K., Bian, H., Bellouin, N., Chin, M., Diehl, T., Easter, R. C., Feichter, J., Ghan, S. J., Hauglustaine, D., Iversen, T., Kinne, S., Kirkevåg, A., Lamarque, J.-F., Lin, G., Liu, X., Lund, M. T., Luo, G., Ma, X., van Noije, T., Penner, J. E., Rasch, P. J., Ruiz, A., Seland, Ø., Skeie, R. B., Stier, P., Takemura, T., Tsigaridis, K., Wang, P., Wang, Z., Xu, L., Yu, H., Yu, F., Yoon, J.-H., Zhang, K., Zhang, H., and Zhou, C.: Radiative forcing of the direct aerosol effect from AeroCom Phase II simulations, Atmos. Chem. Phys., 13, 1853–1877, https://doi.org/10.5194/acp-13-1853-2013, 2013. a
Naus, S., Domingues, L. G., Krol, M., Luijkx, I. T., Gatti, L. V., Miller, J. B., Gloor, E., Basu, S., Correia, C., Koren, G., Worden, H. M., Flemming, J., Pétron, G., and Peters, W.: Sixteen years of MOPITT satellite data strongly constrain Amazon CO fire emissions, Atmos. Chem. Phys., 22, 14735–14750, https://doi.org/10.5194/acp-22-14735-2022, 2022. a
Nédélec, P., Blot, R., Boulanger, D., Athier, G., Cousin, J.-M., Gautron, B., Petzold, A., Volz-Thomas, A., and Thouret, V.: Instrumentation on commercial aircraft for monitoring the atmospheric composition on a global scale: the IAGOS system, technical overview of ozone and carbon monoxide measurements, Tellus B, 67, 27791, https://doi.org/10.3402/tellusb.v67.27791, 2015. a, b, c
Pandey, A., Sadavarte, P., Rao, A. B., and Venkataraman, C.: Trends in multi-pollutant emissions from a technology-linked inventory for India: II. Residential, agricultural and informal industry sectors, Atmos. Environ., 99, 341–352, https://doi.org/10.1016/j.atmosenv.2014.09.080, 2014. a
Park, M., Randel, W. J., Gettelman, A., Massie, S. T., and Jiang, J. H.: Transport above the Asian summer monsoon anticyclone inferred from Aura Microwave Limb Sounder tracers, J. Geophys. Res.-Atmos., 112, D16309, https://doi.org/10.1029/2006JD008294, 2007. a
Park, M., Randel, W. J., Emmons, L. K., Bernath, P. F., Walker, K. A., and Boone, C. D.: Chemical isolation in the Asian monsoon anticyclone observed in Atmospheric Chemistry Experiment (ACE-FTS) data, Atmos. Chem. Phys., 8, 757–764, https://doi.org/10.5194/acp-8-757-2008, 2008. a
Petetin, H., Thouret, V., Athier, G., Blot, R., Boulanger, D., Cousin, J.-M., Gaudel, A., Nédélec, P., and Cooper, O.: Diurnal cycle of ozone throughout the troposphere over Frankfurt as measured by MOZAIC-IAGOS commercial aircraftDiurnal cycle of ozone throughout the troposphere, Elementa: Science of the Anthropocene, 4, 000129, https://doi.org/10.12952/journal.elementa.000129, 2016. a
Petetin, H., Jeoffrion, M., Sauvage, B., Athier, G., Blot, R., Boulanger, D., Clark, H., Cousin, J. M., Gheusi, F., Nedelec, P., Steinbacher, M., and Thouret, V.: Representativeness of the IAGOS airborne measurements in the lower troposphere, Elementa: Science of the Anthropocene, 6, 23, https://doi.org/10.1525/elementa.280, 2018a. a
Petetin, H., Sauvage, B., Parrington, M., Clark, H., Fontaine, A., Athier, G., Blot, R., Boulanger, D., Cousin, J.-M., Nédélec, P., and Thouret, V.: The role of biomass burning as derived from the tropospheric CO vertical profiles measured by IAGOS aircraft in 2002–2017, Atmos. Chem. Phys., 18, 17277–17306, https://doi.org/10.5194/acp-18-17277-2018, 2018b. a
Petzold, A., Thouret, V., Gerbig, C., Zahn, A., Brenninkmeijer, C., Gallagher, M., Hermann, M., Pontaud, M., Ziereis, H., Boulanger, D., Marshall, J., Nédélec, P., Smit, H., Friess, U., Flaud, J.-M., Wahner, A., Cammas, J.-P., and Volz-Thomas, A.: Global-scale atmosphere monitoring by in-service aircraft–current achievements and future prospects of the European Research Infrastructure IAGOS, Tellus B, 67, 28452, https://doi.org/10.3402/tellusb.v67.28452, 2015. a, b
Pickering, K. E., Thompson, A. M., Tao, W.-K., Rood, R. B., McNamara, D. P., and Molod, A. M.: Vertical transport by convective clouds: Comparisons of three modeling approaches, Geophys. Res. Lett., 22, 1089–1092, https://doi.org/10.1029/95GL00889, 1995. a
Sadavarte, P. and Venkataraman, C.: Trends in multi-pollutant emissions from a technology-linked inventory for India: I. Industry and transport sectors, Atmos. Environ., 99, 353–364, https://doi.org/10.1016/j.atmosenv.2014.09.081, 2014. a
Safieddine, S., Boynard, A., Coheur, P.-F., Hurtmans, D., Pfister, G., Quennehen, B., Thomas, J. L., Raut, J.-C., Law, K. S., Klimont, Z., Hadji-Lazaro, J., George, M., and Clerbaux, C.: Summertime tropospheric ozone assessment over the Mediterranean region using the thermal infrared IASI/MetOp sounder and the WRF-Chem model, Atmos. Chem. Phys., 14, 10119–10131, https://doi.org/10.5194/acp-14-10119-2014, 2014. a
Safieddine, S., Boynard, A., Hao, N., Huang, F., Wang, L., Ji, D., Barret, B., Ghude, S. D., Coheur, P.-F., Hurtmans, D., and Clerbaux, C.: Tropospheric ozone variability during the East Asian summer monsoon as observed by satellite (IASI), aircraft (MOZAIC) and ground stations, Atmos. Chem. Phys., 16, 10489–10500, https://doi.org/10.5194/acp-16-10489-2016, 2016. a
Sahu, L., Sheel, V., Kajino, M., Gunthe, S. S., Thouret, V., Nedelec, P., and Smit, H. G.: Characteristics of tropospheric ozone variability over an urban site in Southeast Asia: A study based on MOZAIC and MOZART vertical profiles, J. Geophys. Res.-Atmos., 118, 8729–8747, https://doi.org/10.1002/jgrd.50662, 2013. a
Sahu, L., Sheel, V., Kajino, M., Deushi, M., Gunthe, S. S., Sinha, P., Sauvage, B., Thouret, V., and Smit, H. G.: Seasonal and interannual variability of tropospheric ozone over an urban site in India: A study based on MOZAIC and CCM vertical profiles over Hyderabad, J. Geophys. Res.-Atmos., 119, 3615–3641, https://doi.org/10.1002/2013JD021215, 2014. a
Saunois, M., Reeves, C. E., Mari, C. H., Murphy, J. G., Stewart, D. J., Mills, G. P., Oram, D. E., and Purvis, R. M.: Factors controlling the distribution of ozone in the West African lower troposphere during the AMMA (African Monsoon Multidisciplinary Analysis) wet season campaign, Atmos. Chem. Phys., 9, 6135–6155, https://doi.org/10.5194/acp-9-6135-2009, 2009. a, b
Sauvage, B., Thouret, V., Cammas, J.-P., Gheusi, F., Athier, G., and Nédélec, P.: Tropospheric ozone over Equatorial Africa: regional aspects from the MOZAIC data, Atmos. Chem. Phys., 5, 311–335, https://doi.org/10.5194/acp-5-311-2005, 2005. a, b, c, d, e, f
Sauvage, B., Thouret, V., Thompson, A., Witte, J., Cammas, J.-P., Nédélec, P., and Athier, G.: Enhanced view of the “tropical Atlantic ozone paradox” and “zonal wave one” from the in situ MOZAIC and SHADOZ data, J. Geophys. Res.-Atmos., 111, D01301, https://doi.org/10.1029/2005JD006241, 2006. a, b
Sauvage, B., Gheusi, F., Thouret, V., Cammas, J.-P., Duron, J., Escobar, J., Mari, C., Mascart, P., and Pont, V.: Medium-range mid-tropospheric transport of ozone and precursors over Africa: two numerical case studies in dry and wet seasons, Atmos. Chem. Phys., 7, 5357–5370, https://doi.org/10.5194/acp-7-5357-2007, 2007a. a
Sauvage, B., Martin, R. V., van Donkelaar, A., Liu, X., Chance, K., Jaeglé, L., Palmer, P. I., Wu, S., and Fu, T.-M.: Remote sensed and in situ constraints on processes affecting tropical tropospheric ozone, Atmos. Chem. Phys., 7, 815–838, https://doi.org/10.5194/acp-7-815-2007, 2007b. a, b, c, d, e
Sauvage, B., Martin, R. V., Van Donkelaar, A., and Ziemke, J.: Quantification of the factors controlling tropical tropospheric ozone and the South Atlantic maximum, J. Geophys. Res.-Atmos., 112, D11309, https://doi.org/10.1029/2006JD008008, 2007c. a, b, c
Sauvage, B., Thouret, V., Cammas, J.-P., Brioude, J., Nedelec, P., and Mari, C.: Meridional ozone gradients in the African upper troposphere, Geophys. Res. Lett., 34, L03817, https://doi.org/10.1029/2006GL028542, 2007d. a
Sauvage, B., Fontaine, A., Eckhardt, S., Auby, A., Boulanger, D., Petetin, H., Paugam, R., Athier, G., Cousin, J.-M., Darras, S., Nédélec, P., Stohl, A., Turquety, S., Cammas, J.-P., and Thouret, V.: Source attribution using FLEXPART and carbon monoxide emission inventories: SOFT-IO version 1.0, Atmos. Chem. Phys., 17, 15271–15292, https://doi.org/10.5194/acp-17-15271-2017, 2017a. a, b, c, d
Sauvage, B., Auby, A., and Fontaine, A.: Source attribution using FLEXPART and carbon monoxide emission inventories: SOFT-IO version 1.0, AERIS [data set], https://doi.org/10.25326/2, 2017b. a
Sauvage, B., Nédélec, P., and Boulanger, D.: IAGOS ancillary data (L4) – CO contributions to the aircraft measurements, AERIS [data set], https://doi.org/10.25326/3, 2018. a
SEDOO: IASI-SOFRID database, http://thredds.sedoo.fr/iasi-sofrid-o3-co/ (last access: 16 October 2023), 2014. a
Sheel, V., Sahu, L., Kajino, M., Deushi, M., Stein, O., and Nedelec, P.: Seasonal and interannual variability of carbon monoxide based on MOZAIC observations, MACC reanalysis, and model simulations over an urban site in India, J. Geophys. Res.-Atmos., 119, 9123–9141, https://doi.org/10.1002/2013JD021425, 2014. a
Singh, H. B., Herlth, D., Kolyer, R., Chatfield, R., Viezee, W., Salas, L. J., Chen, Y., Bradshaw, J. D., Sandholm, S. T., Talbot, R., Gregory, G. L., Anderson, B., Sachse, G. W., Browell, E., Bachmeier, A. S., Blake, D. R., Heikes, B., Jacob, D., and Fuelberg, H. E.: Impact of biomass burning emissions on the composition of the South Atlantic troposphere: Reactive nitrogen and ozone, J. Geophys. Res.-Atmos., 101, 24203–24219, https://doi.org/10.1029/96JD01018, 1996. a
Stein, O., Schultz, M. G., Bouarar, I., Clark, H., Huijnen, V., Gaudel, A., George, M., and Clerbaux, C.: On the wintertime low bias of Northern Hemisphere carbon monoxide found in global model simulations, Atmos. Chem. Phys., 14, 9295–9316, https://doi.org/10.5194/acp-14-9295-2014, 2014. a
Stevenson, D. S., Young, P. J., Naik, V., Lamarque, J.-F., Shindell, D. T., Voulgarakis, A., Skeie, R. B., Dalsoren, S. B., Myhre, G., Berntsen, T. K., Folberth, G. A., Rumbold, S. T., Collins, W. J., MacKenzie, I. A., Doherty, R. M., Zeng, G., van Noije, T. P. C., Strunk, A., Bergmann, D., Cameron-Smith, P., Plummer, D. A., Strode, S. A., Horowitz, L., Lee, Y. H., Szopa, S., Sudo, K., Nagashima, T., Josse, B., Cionni, I., Righi, M., Eyring, V., Conley, A., Bowman, K. W., Wild, O., and Archibald, A.: Tropospheric ozone changes, radiative forcing and attribution to emissions in the Atmospheric Chemistry and Climate Model Intercomparison Project (ACCMIP), Atmos. Chem. Phys., 13, 3063–3085, https://doi.org/10.5194/acp-13-3063-2013, 2013. a
Stohl, A., Bonasoni, P., Cristofanelli, P., Collins, W. J., Feichter, J., Frank, A., Forster, C., Gerasopoulos, E., Gäggeler, H., James, P., Kentarchos, T., Kromp-Kalb, H., Krüger, B., Land, C., Meloen, J., Papayannis, A., Priller, A., Seibert, P., Sprenger, M., Roelofs, G. J., Scheel, H. E., Schnabel, C., Siegmund, P., Tobler, L., Trickl, T., Wernli, H., Wirth, V., Zanis, P., and Zerefos, C.: Stratosphere-troposphere exchange: A review, and what we have learned from STACCATO, J. Geophys. Res.-Atmos., 108, 8516, https://doi.org/10.1029/2002JD002490, 2003. a
Tang, Q., Prather, M., and Hsu, J.: Stratosphere-troposphere exchange ozone flux related to deep convection, Geophys. Res. Lett., 38, L03806, https://doi.org/10.1029/2010GL046039, 2011. a
Tarasick, D. W., Carey-Smith, T. K., Hocking, W. K., Moeini, O., He, H., Liu, J., Osman, M., Thompson, A. M., Johnson, B., Oltmans, S. J., and Merrill, J. T.: Quantifying stratosphere-troposphere transport of ozone using balloon-borne ozonesondes, radar windprofilers and trajectory models, Atmos. Environ., 198, 496–509, https://doi.org/10.1016/j.atmosenv.2018.10.040, 2019. a
Thompson, A. M., Witte, J. C., Hudson, R. D., Guo, H., Herman, J. R., and Fujiwara, M.: Tropical tropospheric ozone and biomass burning, Science, 291, 2128–2132, https://doi.org/10.1126/science.291.5511.2128, 2001. a
Thompson, A. M., Witte, J. C., McPeters, R. D., Oltmans, S. J., Schmidlin, F. J., Logan, J. A., Fujiwara, M., Kirchhoff, V., Posny, F., Coetzee, G. J. R., Hoegger, B., Kawakami, S., Ogawa, T., Johnson, B. J., Vomel, H., and Labow, G.: Southern hemisphere additional Ozonesondes (SHADOZ) 1998–2000 tropical ozone climatology 1. Comparison with Total ozone mapping spectrometer (TOMS) and ground-based measurements, J. Geophys. Res.-Atmos., 108, 8238, https://doi.org/10.1029/2001JD000967, 2003a. a
Thompson, A. M., Witte, J. C., Oltmans, S. J., Schmidlin, F. J., Logan, J. A., Fujiwara, M., Kirchhoff, V., Posny, F., Coetzee, G. J. R., Hoegger, B., Kawakami, S. J., Ogawa, T., Fortuin, J. P. F., and Kelder, H. M.: Southern Hemisphere Additional Ozonesondes (SHADOZ) 1998–2000 tropical ozone climatology 2. Tropospheric variability and the zonal wave-one, J. Geophys. Res.-Atmos., 108, 8241, https://doi.org/10.1029/2002JD002241, 2003b. a, b
Thompson, A. M., Stauffer, R. M., Wargan, K., Witte, J. C., Kollonige, D. E., and Ziemke, J. R.: Regional and Seasonal trends in tropical ozone from SHADOZ profiles: Reference for models and satellite products, J. Geophys. Res.-Atmos., 126, e2021JD034691, https://doi.org/10.1029/2021JD034691, 2021. a, b
Thouret, V., Clark, H., Petzold, A., Nédélec, P., and Zahn., A.: IAGOS: Monitoring Atmospheric Composition for Air Quality and Climate by Passenger Aircraft, Springer Nature Singapore, Singapore, 1–14, https://doi.org/10.1007/978-981-15-2527-8_57-1, 2022. a, b
van der A, R. J., Mijling, B., Ding, J., Koukouli, M. E., Liu, F., Li, Q., Mao, H., and Theys, N.: Cleaning up the air: effectiveness of air quality policy for SO2 and NOx emissions in China, Atmos. Chem. Phys., 17, 1775–1789, https://doi.org/10.5194/acp-17-1775-2017, 2017. a
van der Werf, G. R., Randerson, J. T., Giglio, L., Collatz, G. J., Kasibhatla, P. S., and Arellano Jr., A. F.: Interannual variability in global biomass burning emissions from 1997 to 2004, Atmos. Chem. Phys., 6, 3423–3441, https://doi.org/10.5194/acp-6-3423-2006, 2006. a
Wang, T., Xue, L., Brimblecombe, P., Lam, Y. F., Li, L., and Zhang, L.: Ozone pollution in China: A review of concentrations, meteorological influences, chemical precursors, and effects, Sci. Total Environ., 575, 1582–1596, https://doi.org/10.1016/j.scitotenv.2016.10.081, 2017. a
Wild, O., Pochanart, P., and Akimoto, H.: Trans-Eurasian transport of ozone and its precursors, J. Geophys. Res.-Atmos., 109, D11302, https://doi.org/10.1029/2003JD004501, 2004. a
Yamasoe, M. A., Sauvage, B., Thouret, V., Nédélec, P., Le Flochmoen, E., and Barret, B.: Analysis of tropospheric ozone and carbon monoxide profiles over South America based on MOZAIC/IAGOS database and model simulations, Tellus B, 67, 27884, https://doi.org/10.3402/tellusb.v67.27884, 2015. a, b, c, d
Zhang, Y., Cooper, O. R., Gaudel, A., Thompson, A. M., Nédélec, P., Ogino, S.-Y., and West, J. J.: Tropospheric ozone change from 1980 to 2010 dominated by equatorward redistribution of emissions, Nat. Geosci., 9, 875–879, https://doi.org/10.1038/ngeo2827, 2016. a, b, c, d, e
Zhang, Y., West, J. J., Emmons, L. K., Flemming, J., Jonson, J. E., Lund, M. T., Sekiya, T., Sudo, K., Gaudel, A., Chang, K.-L., Nédélec, P., and Thouret, V.: Contributions of world regions to the global tropospheric ozone burden change from 1980 to 2010, Geophys. Res. Lett., 48, e2020GL089184, https://doi.org/10.1029/2020GL089184, 2021. a
Zheng, B., Chevallier, F., Ciais, P., Yin, Y., Deeter, M. N., Worden, H. M., Wang, Y., Zhang, Q., and He, K.: Rapid decline in carbon monoxide emissions and export from East Asia between years 2005 and 2016, Environ. Res. Lett., 13, 044007, https://doi.org/10.1088/1748-9326/aab2b3, 2018. a, b
Zheng, B., Chevallier, F., Yin, Y., Ciais, P., Fortems-Cheiney, A., Deeter, M. N., Parker, R. J., Wang, Y., Worden, H. M., and Zhao, Y.: Global atmospheric carbon monoxide budget 2000–2017 inferred from multi-species atmospheric inversions, Earth Syst. Sci. Data, 11, 1411–1436, https://doi.org/10.5194/essd-11-1411-2019, 2019. a
Ziemke, J., Chandra, S., Duncan, B., Schoeberl, M., Torres, O., Damon, M., and Bhartia, P.: Recent biomass burning in the tropics and related changes in tropospheric ozone, Geophys. Res. Lett., 36, L15819, https://doi.org/10.1029/2009GL039303, 2009. a
Ziemke, J. R., Oman, L. D., Strode, S. A., Douglass, A. R., Olsen, M. A., McPeters, R. D., Bhartia, P. K., Froidevaux, L., Labow, G. J., Witte, J. C., Thompson, A. M., Haffner, D. P., Kramarova, N. A., Frith, S. M., Huang, L.-K., Jaross, G. R., Seftor, C. J., Deland, M. T., and Taylor, S. L.: Trends in global tropospheric ozone inferred from a composite record of TOMS/OMI/MLS/OMPS satellite measurements and the MERRA-2 GMI simulation, Atmos. Chem. Phys., 19, 3257–3269, https://doi.org/10.5194/acp-19-3257-2019, 2019. a