the Creative Commons Attribution 4.0 License.
the Creative Commons Attribution 4.0 License.
 | 08 Nov 2023
Aerosol and dynamical contributions to cloud droplet formation in Arctic low-level clouds
Ghislain Motos
Gabriel Freitas
Paraskevi Georgakaki
Jörg Wieder
Guangyu Li
Wenche Aas
Chris Lunder
Radovan Krejci
Julie Thérèse Pasquier
Jan Henneberger
Robert Oscar David
Christoph Ritter
Claudia Mohr
Paul Zieger
Athanasios Nenes
The Arctic is one of the most rapidly warming regions of the globe. Low-level clouds and fog modify the energy transfer from and to space and play a key role in the observed strong Arctic surface warming, a phenomenon commonly termed “Arctic amplification”. The response of low-level clouds to changing aerosol characteristics throughout the year is therefore an important driver of Arctic change that currently lacks sufficient constraints. As such, during the NASCENT campaign (Ny-Ålesund AeroSol Cloud ExperimeNT) extending over a full year from October 2019 to October 2020, microphysical properties of aerosols and clouds were studied at the Zeppelin station (475 m a.s.l.), Ny-Ålesund, Svalbard, Norway. Particle number size distributions obtained from differential mobility particle sizers as well as chemical composition derived from filter samples and an aerosol chemical speciation monitor were analyzed together with meteorological data, in particular vertical wind velocity. The results were used as input to a state-of-the-art cloud droplet formation parameterization to investigate the particle sizes that can activate to cloud droplets, the levels of supersaturation that can develop, the droplet susceptibility to aerosol and the role of vertical velocity. We evaluate the parameterization and the droplet numbers calculated through a droplet closure with in-cloud in situ measurements taken during nine flights over 4 d. A remarkable finding is that, for the clouds sampled in situ, closure is successful in mixed-phase cloud conditions regardless of the cloud glaciation fraction. This suggests that ice production through ice–ice collisions or droplet shattering may have explained the high ice fraction, as opposed to rime splintering that would have significantly reduced the cloud droplet number below levels predicted by warm-cloud activation theory. We also show that pristine-like conditions during fall led to clouds that formed over an aerosol-limited regime, with high levels of supersaturation (generally around 1 %, although highly variable) that activate particles smaller than 20 nm in diameter. Clouds formed in the same regime in late spring and summer, but aerosol activation diameters were much larger due to lower cloud supersaturations (ca. 0.5 %) that develop because of higher aerosol concentrations and lower vertical velocities. The contribution of new particle formation to cloud formation was therefore strongly limited, at least until these newly formed particles started growing. However, clouds forming during the Arctic haze period (winter and early spring) can be limited by updraft velocity, although rarely, with supersaturation levels dropping below 0.1 % and generally activating larger particles (20 to 200 nm), including pollution transported over a long range. The relationship between updraft velocity and the limiting cloud droplet number agrees with previous observations of various types of clouds worldwide, which supports the universality of this relationship.
- Article
(3257 KB) - Full-text XML
-
Supplement
(1639 KB) - BibTeX
- EndNote


Greenhouse-gas-induced warming is affecting the Arctic more than any other region on the planet (Rantanen et al., 2022). Arctic aerosols have been shown to partially offset local surface warming (Najafi et al., 2015; Breider et al., 2017), which is already impacting the region (Vincent, 2020). Their capacity to form clouds and subsequently impact shortwave and longwave radiation fluxes can strongly influence the regional surface albedo, the surface radiation budget, and thus the melting of snow and sea ice (e.g., Curry et al., 1996; Maturilli et al., 2015). Low-level clouds influence the Arctic climate in a substantial but complex manner, with either a positive or a negative forcing depending on the season and the latitude (Intrieri et al., 2002; Shupe and Intrieri, 2004; Tjernström et al., 2014; Tan and Storelvmo, 2019). Arctic low-level clouds are frequently mixed-phase (e.g., Shupe et al., 2008a), which makes their representation in models and understanding of their response to cloud condensation nuclei (CCN) availability highly challenging, although it is critical for understanding Arctic change (e.g., Seinfeld et al., 2016; Sotiropoulou et al., 2016). Extensive long-term observations of aerosols and clouds have been performed in the Arctic (e.g., Platt et al., 2022; Koike et al., 2019); however, aerosol–cloud interactions, and in particular cloud droplet formation processes, have to be understood to comprehend the rapid changes occurring in this region of the world. Furthermore, droplet formation and concentrations in mixed-phase clouds (MPCs) are rarely evaluated, even though they can have a profoundly important impact on MPC properties and evolution.
Ny-Ålesund, a scientific settlement based in the Svalbard archipelago, offers a remarkable location for studying the Arctic atmosphere and processes related to aerosol–cloud interactions, with stations located both at sea level and on Zeppelin Mountain (475 m a.s.l.). As in the rest of the Arctic, clouds are ubiquitous at Ny-Ålesund, being present 81 % of the time (Nomokonova et al., 2019) with a majority of MPCs, as confirmed by Lawson et al. (2011) over the spring season using a tethered-balloon system. Of these MPCs, 90 % are located below an altitude of 3000 m (Mioche et al., 2015). A combination of ground-based remote sensing observations of cloud properties and the application of broadband radiative transfer simulations allowed us to conclude that clouds have an overall warming effect on the surface at Ny-Ålesund (annual average of 11.1 W m−2), although the net surface cloud radiative effect is negative in summer and positive for the rest of the year (Ebell et al., 2020). Ny-Ålesund, owing to both its orographic and its maritime landscapes, may also bear atmospheric characteristics that are different from the rest of the Arctic (Maturilli et al., 2019). For example, Mioche et al. (2015) showed that mixed-phase clouds (MPCs) are present around 55 % of the time above Ny-Ålesund, whereas in the rest of the Arctic, the mean frequency of occurrence is 30 % in the winter and 50 % for the rest of the year. Although these statistics can quickly shift owing to the fast warming of the Arctic, they reflect the recent past and give a good indication of the current conditions.
Regarding aerosol size distribution, although no site was shown to be representative of the whole Arctic, several features, such as number concentrations and the dominant mode of the size distribution throughout the year, are common to Zeppelin and other Arctic sites such as Nord (Greenland), Utqiaġvik (formerly Barrow, Alaska) or Tiksi (Siberia), as shown by Croft et al. (2016) or Freud et al. (2017). Differences from other Arctic stations can be partly related to Zeppelin being located close to the European and American continents, in a sector influenced by warm oceanic currents (Gulf Stream) and warm air intrusions, in contrast to other stations surrounded by ice-free ocean. Zeppelin is also often located in the free troposphere (FT; Ström et al., 2009). Nevertheless, a topography analysis suggested that Zeppelin is influenced to a large extent by planetary boundary layer (PBL) air masses (Collaud Coen et al., 2018). Di Liberto et al. (2012) have shown that over a spring day (with no sunset), the station resided in the PBL from 04:00 to 16:00 UTC and in the FT for the rest of the day. Such a diurnal cycle is typically observed in lower-latitude and higher-altitude sites (Collaud Coen et al., 2018).
Seasonal patterns of aerosol concentrations and size distributions at the Zeppelin station have been extensively investigated (e.g., Ström et al., 2003; Tunved et al., 2013; Croft et al., 2016). The results agree on a minimum in number concentration at the onset of fall due to efficient cloud scavenging, scarce transport from lower latitudes and limited new particle formation. Concentrations then increase constantly until they reach the spring Arctic haze maximum. The accumulation mode is dominant over this period, until it is efficiently scavenged in summer, and the Aitken mode then becomes dominant, due to active new particle formation favored by strong solar radiation and the absence of condensational sinks (Dall'Osto et al., 2017; Park et al., 2021).
The seasonality of CCN at Zeppelin tends to follow that of the aerosol particle number concentration (Jung et al., 2018; Koike et al., 2019). Using a counterflow virtual impactor inlet, Karlsson et al. (2021) showed that cloud residuals also follow the same seasonality, but negative temperatures cause cloud residual concentrations to drop compared to aerosol concentration. The dominant Aitken mode in summer does not cause a drop in the number of CCN and cloud residuals, suggesting that particles down to 20 nm in diameter can also activate to cloud droplets during this season (Leaitch et al., 2016; Karlsson et al., 2021). Using aircraft measurements over Alaska, Moore et al. (2011) also showed that most aerosols can act as CCN at supersaturations above 0.1 % in this region, i.e., where only particles larger than around 100 nm are generally able to activate to cloud droplets. Gramlich et al. (2023) came to the same conclusion by performing chemical analyses of aerosol particles and gases before, during and after clouds, without noting strong variations in chemical composition. CCN are typically associated with accumulation-mode particles; however, much smaller particles can activate to cloud droplets if the supersaturations developed in clouds are high enough. Using an adiabatic cloud parcel model, Pöhlker et al. (2021) proposed that in clean environments, such as the Arctic, Aitken-mode particles can act as CCN at low updraft velocities (below 1 m s−1). Similarly, Bulatovic et al. (2021) reported a strong influence of Aitken-mode particles on the subsistence of stratiform Arctic mixed-phase clouds.
In the atmosphere, supersaturated air associated with cloudy air masses leads to the unconstrained condensation of water vapor on CCN, leading to cloud droplet activation. The main mechanism driving this process is expansion cooling of ascending air parcels (e.g., Nenes et al., 2001). The droplet number, however, depends on a combination of the cooling and aerosols forming droplets, either of which can be a “limiting factor”, eventually controlling the cloud susceptibility to aerosol. If the factor limiting droplet formation is the lack of aerosol particles (this is the “aerosol-limited” regime), the droplet concentration is directly proportional to the aerosol number concentration and is effectively independent of updraft velocity. The opposite situation can occur, giving rise to an “updraft-limited” regime (e.g., Jensen and Charlson, 1984; Twomey and Jennings, 1993) during which cloud droplet formation is insensitive to any further increase in aerosol concentration. Between these two limiting cases, it is expected that a transitional regime also exists, for which cloud droplet formation is sensitive to both updraft velocity and aerosol properties (Reutter et al., 2009). Given the influence of the cloud droplet number on cloud radiative effects, knowledge of the prevalent droplet formation regime in various regions of the world and how it varies throughout the year is of primary importance because it determines the type of optimal constraints (dynamical or aerosol) required in models. Few studies have used this perspective to determine the best observational results for reducing model uncertainties. Regarding the aerosol–CCN–droplet link, several studies focusing on the Arctic have reported that periods of aerosol-limited regimes are frequently found (Garrett et al., 2004; Mauritsen et al., 2011; Eirund et al., 2019), but these studies do not cover a whole year and/or do not fully constrain the aerosol and updraft velocity characteristics and their relation to cloud supersaturation, activated aerosol size, aerosol source/processes and limiting cloud droplet number (i.e., an asymptotic upper limit of droplet number). The Swiss Alps have been the most extensively studied region in that regard so far, using high-altitude ground-based measurements (Hammer et al., 2015; Hoyle et al., 2016; Georgakaki et al., 2021). At other locations, aircraft flights have been used to investigate cloud formation at higher altitudes, e.g., over the United States of America (Bougiatioti et al., 2020) and the southeastern Atlantic Ocean (Kacarab et al., 2020).
The Ny-Ålesund AeroSol Cloud ExperimeNT (NASCENT) campaign took place from fall 2019 to fall 2020 over several sites located close to Ny-Ålesund, Svalbard. Pasquier et al. (2022b) comprehensively describe the meteorological context, aerosol climatology and instrumental setup as well as first results related to aerosol–cloud interactions (for liquid, ice and mixed-phase clouds). Here, we utilized in situ data collected during this campaign to feed a cloud droplet formation parameterization in order to unravel the sensitivity of the cloud droplet number to aerosol concentration and composition as well as updraft velocity. Section 2 describes the NASCENT campaign and the instrumentation used to provide the data for this study. These data serve as input to the cloud droplet parameterization detailed in Sect. 3, where additional analyses linked to specific instruments are also described. In Sect. 4, parameterization outputs are exposed, analyzed and discussed in the broader context of the Arctic seasonal aerosol cycle, together with a droplet closure. Section 5 provides concluding remarks.
2.1 Measurement site and period
The NASCENT campaign took place in the Svalbard archipelago (also known as Spitsbergen) close to the small seaside settlement of Ny-Ålesund from October 2019 to October 2020. Svalbard itself has very limited anthropogenic aerosol emissions, but it can be influenced by North Atlantic stormy air masses. In order to limit the influence of locally produced sea spray aerosols and make the results more regionally representative, a measurement station located on top of Mount Zeppelin (475 m a.s.l.; 78∘54′ N, 11∘53′ E), approximately 2 km south of Ny-Ålesund, served as a sampling site for all data presented in this study, unless explicitly stated otherwise.
2.2 Instrumentation
2.2.1 Particle number size distributions
Two differential mobility particle sizers (DMPSs) continuously measured particle number size distribution at the Zeppelin station. In the DMPS, the aerosol is first electrically charged by a 63Ni source, allowing selection by electrical mobility and thus mobility diameter by a differential mobility analyzer (DMA). Condensation particle counters (CPCs, TSI models 3010 for DMPS_1 and 3772 for DMPS_2) then measure the concentration of particles contained in the monodisperse flow. No particle impactor was used. The integration of the particle number size distribution between the boundaries of the measured size spectrum provides the integrated particle number concentration, Naer. The DMPSs were connected to a whole-air inlet heated to a temperature of 5–10 ∘C, following the guidelines of the Global Atmosphere Watch (GAW) program of the World Meteorological Organization (WMO). The size ranges measured by both DMPSs were 20 to 775 nm for DMPS_1 and 10 to 945 nm for DMPS_2. DMPS_1 and DMPS_2 had a scanning duration of 11 and 7 min, respectively. The size distributions were corrected for particle losses in the inlet using the software tool developed by von der Weiden et al. (2009). More details on the DMPS setup at the Zeppelin station can be found in the study of Karlsson et al. (2021).
2.2.2 Aerosol chemical composition
The mass concentration of non-refractory bulk aerosol (i.e., species that evaporate rapidly at a temperature of 600 ∘C under vacuum conditions) was measured by a time-of-flight aerosol chemical speciation monitor (ACSM; Fröhlich et al., 2013), whose technology is based on an aerosol mass spectrometer (AMS; Aerodyne Research Inc., Billerica, MA, USA). Measurements were also performed using a three-stage filter pack system manufactured by the Norwegian Institute for Air Research (NILU) and designed for sampling of particles and gaseous compounds. The filters have a diameter of 47 mm, and the flow rate is 12–16 L min−1 with a sampling duration of 24 h. First in the direction of the airflow is a Teflon filter (Millipore 3 µm) for collecting ions (SO, NH, NO, Ca2+, K+, Cl−, Na+). This is followed by alkaline-impregnated (KOH) and acid-impregnated (oxalic acid) filters (Whatman 40) to collect volatile acidic and alkaline components, respectively. These instruments sampled behind a whole-air inlet (with a size cut of around 10 µm, based on tests performed behind the inlet); note however that the ACSM uses an aerodynamic lens with particulate matter larger than 2.5 µm (PM2.5). Organic carbon mass concentration was derived from filter samples collected by a Digitel high-volume sampler with a PM10 inlet, which operated at a flow rate of 689 L min−1 over a whole week. The aerosol particles were collected on prefired (850 ∘C; 3 h) quartz fiber filters (Pallflex Tissuequartz 2500QAT-UP; 150 mm in diameter). Thermal–optical analysis (TOA) was performed using a Lab OC–EC (organic carbon–elemental carbon) aerosol analyzer (Sunset Laboratory Inc., Tigard, OR, USA), using transmission for charring correction and operated according to the EUSAAR-2 temperature program (Cavalli et al., 2010).
Equivalent black carbon (eBC) concentration was retrieved from a multi-angle absorption photometer (MAAP, model 5012, Thermo Fisher Scientific, Waltham, MA, USA). This instrument collects particles on a fiber filter and measures the transmission and back scattering of laser light at multiple angles to determine the aerosol absorption coefficient at a wavelength of 637 nm. eBC concentration, calculated from this coefficient using a mass absorption cross-section (MAC) value of 10.6 m2 g−1 (as suggested by Ohata et al., 2021), was used to complement both ACSM and filter pack data in order to retrieve aerosol hygroscopicity.
2.2.3 Meteorological data
Three-dimensional wind was continuously observed with a 1 Hz ultrasonic anemometer (model uSonic-3 Omni, METEK GmbH, Elmshorn, Schleswig-Holstein, Germany), which was placed close to the whole-air inlet. The uSonic measures the speed of sound in between three pairs of transducers and derives a three-dimensional (3D) wind vector from the differences in the travel path between the three pairs. We inferred updraft velocity from uSonic measurements and could compare it to Doppler wind lidar (light detection and ranging) data, which provide 3D profiles starting from around 150 m a.g.l. up to 10 km and beyond. The wind lidar (WindCube 200, Leosphere, Paris, France; property of the Alfred Wegener Institute, AWI) projects a laser beam (vertically for vertical velocity) and measures the Doppler shift between the reference and the backscattered radiation, enabling it to estimate the wind component along the beam propagation direction. Detailed information on the principle of operation as well as recent improvements of the Doppler wind lidar can be found in Liu et al. (2019). An overview of the system and the long-term wind pattern over Ny-Ålesund can be found in Graßl et al. (2022). The wind lidar was located on the roof of the atmospheric observatory of Ny-Ålesund, at an altitude close to sea level and around 2 km in horizontal distance from Zeppelin (Beck et al., 2017, 2018).
A meteorological station located on the roof the Zeppelin station provided data of wind speed and direction, temperature, and pressure.
2.2.4 Cloud droplet concentration
Cloud particle concentrations were sampled with the HOLographic cloud Imager for Microscopic Objects (HOLIMO; Beck et al., 2017; Ramelli et al., 2020) at a height of up to 1000 m above ground for 5 d in November 2019 and 1 d in April 2020. HOLIMO can image an ensemble of cloud droplets (with diameter above 6 µm) in a three-dimensional sample volume of about 15 cm3. A convolutional neural network trained and fine-tuned on cloud particles from holographic imagers is used to identify the cloud droplets from artifacts and ice crystals (Touloupas et al., 2020) based on their shape. The smallest detectable ice crystals are 25 µm, and all particles below this threshold are classified as cloud droplets. The holographic imager was attached below the tethered-balloon system HoloBalloon (Ramelli et al., 2020; Pasquier et al., 2022a). Detailed information about the data taken by the holographic imager on the tethered balloon can be found in Pasquier et al. (2022a).
3.1 Particle number size distribution, composition and aerosol hygroscopicity
Based on the comparison between both DMPSs given in Sect. 4.1, we utilized data from both DMPSs in the analysis of this study so that gaps in DMPS_1 data are filled with data from DMPS_2. All figures displaying aerosol number concentrations thus include data from both DMPSs.
Organic mass concentration was provided by the ACSM, while organic carbon concentration was measured by a high-volume sampler. The organic carbon concentration given by the filter analysis from this instrument was multiplied by a factor of 2.2 to obtain an estimation of the organic mass concentration, following the recommendations of Turpin and Lim (2001).
Among the species measured by the ACSM, chloride and sodium are assumed to be the only ones predominantly present in the coarse mode. However, the two DMPSs only measured in the submicron range, and the ACSM does not measure sea salt. This is an issue because the inputs of the cloud droplet parameterization should consider the size distribution and hygroscopicity of the same aerosol population. For that reason, chloride and sodium were not included in the calculation of aerosol hygroscopicity. However, we know that these compounds can contribute to the fine mode and increase submicron hygroscopicity at Zeppelin, mostly in winter, as shown by Zieger et al. (2010) and Adachi et al. (2022). To estimate the potential effect of these compounds on our droplet formation results, we performed a sensitivity study, detailed in Sect. 4.3.
Both the ACSM and the filter pack allow for the retrieval of inorganic nitrate, sulfate and ammonium mass concentration. Volume fractions of neutral salts and their hygroscopicity parameters are used as inputs to the volumetric mixing rule required to calculate the total hygroscopicity of the aerosol. For both datasets, we used the simplified ion-pairing scheme detailed in Gysel et al. (2007) to calculate the concentration of neutral salts from that of ions, using daily averaged data. From there, the total hygroscopicity parameter κ was introduced by Petters and Kreidenweis (2007) to describe aerosol hygroscopicity based on a semi-empirical parameterization of the Raoult effect. Knowing the hygroscopicity value of each neutral compound – we utilized values listed in Petters and Kreidenweis (2007), Carrico et al. (2010), and Zieger et al. (2017) – the mass-mixing rule enables us to estimate the overall aerosol hygroscopicity. We utilized filter-pack-derived hygroscopicity values as input to the cloud droplet parameterization described in the next section because the filter pack shows fewer data gaps than the ACSM over the duration of the NASCENT campaign. ACSM-derived hygroscopicity is thus only used as a validation of the filter-pack-derived hygroscopicity values retrieved (see the comparison of both in Fig. S3 in the Supplement).
3.2 Cloud droplet number concentration and cloud supersaturation
Knowledge of particle number size distribution and overall hygroscopicity parameter κ as well as of air temperature and pressure allows for the determination of the potential cloud droplet number concentration, Nd; the maximum available cloud supersaturation, Smax; and the minimum diameter required for an aerosol particle to activate to a cloud droplet, Dact, using a cloud droplet formation parameterization. Note that the term “potential” is used to describe these outputs because the parameterization results include periods when no clouds were effectively present at Zeppelin. Based on cloud parcel theory, this parameterization was initially developed by Nenes and Seinfeld (2003) and improved with new implementations successively by Fountoukis and Nenes (2005), Barahona et al. (2010), and Morales Betancourt and Nenes (2014). Results of Nd and Smax are then constrained by updraft velocity measurements, here given by a uSonic and a wind lidar (Sect. 2.2.3). The activation parameterization is based on cloud parcel theory and solves the equations that describe droplet formation in an ascending air parcel containing aerosols and water vapor, specifically at the point where supersaturation becomes equal to Smax; Nd is then equal to the number of CCN with critical supersaturation less than Smax. The parameterization uses as inputs the observed pressure and the temperature, the aerosol size distribution data, the hygroscopicity parameter κ, and the updraft velocities.
We extracted wind lidar data corresponding to the updraft velocity at 500 m above ground level to make them comparable to uSonic data from the Zeppelin station. We noticed surprisingly high values of vertical velocity measured by the uSonic during northern wind conditions (Fig. S1a and b), which we attribute to the presence of winds orographically lifted by Zeppelin Mountain. Based on Fig. S1a and b, we decided to discard uSonic data when the wind direction was between 335 and 15∘ so that any droplet calculation made is more representative of regional conditions than specific conditions at Zeppelin during strong orographically driven updrafts.
The high resolution of wind lidar and ultrasonic anemometer data reveals the highly variable nature of vertical velocity; to calculate droplet numbers relevant for the average cloud, we use the probabilistic approach detailed in Georgakaki et al. (2021): wind lidar data are grouped by hour, and each block of 1 h data is fitted to half-Gaussian probability density functions (PDFs) with a zero mean and a standard deviation σw. The cloud droplet formation parameterization is then applied for a characteristic velocity, σw, as this provides the average droplet number over the distribution of positive velocities in the domain. A comparison of the results of this analysis derived from the uSonic and the wind lidar is shown in Fig. S2. Several studies performed using this approach gave successful droplet closures for Nd and Smax in various types of clouds (e.g., Fountoukis et al., 2007; Kacarab et al., 2020; Georgakaki et al., 2021). Note that this approach is not valid for boundary layers that undergo deep convection but only for low vertical velocities typical of boundary layer ascent and descent over a diurnal cycle, which is the case for Zeppelin (Di Liberto et al., 2012; Collaud Coen et al., 2018).
4.1 Particle number concentration and size distribution
Figure 1a presents Naer time series, with values that show a minimum in October 2019 (20–60 cm−1) followed by a relatively constant increase until an upper plateau (100–1000 cm−1) reached between May and August 2020. A sharp decrease in Naer is then observed towards the October minimum. These measurements are in good agreement with the annual cycle of integrated particle concentration at Zeppelin reported by Tunved et al. (2013), who measured particle number size distribution between 20 and 630 nm before 2005 and between 10 and 790 nm after and averaged the results over 10 years from 2000 to 2010. However, we note a 1-month lag in the appearance of the high-concentration plateau (reported from April to July, whereas it appears from the beginning of May to the end of August in the present study). Aerosol levels measured at Zeppelin during the NASCENT campaign can thus be considered typical of this site. Overlapping periods of both DMPSs allow for a comparison of Naer (see Fig. 1b) and confirm the strong correlation between both instruments.
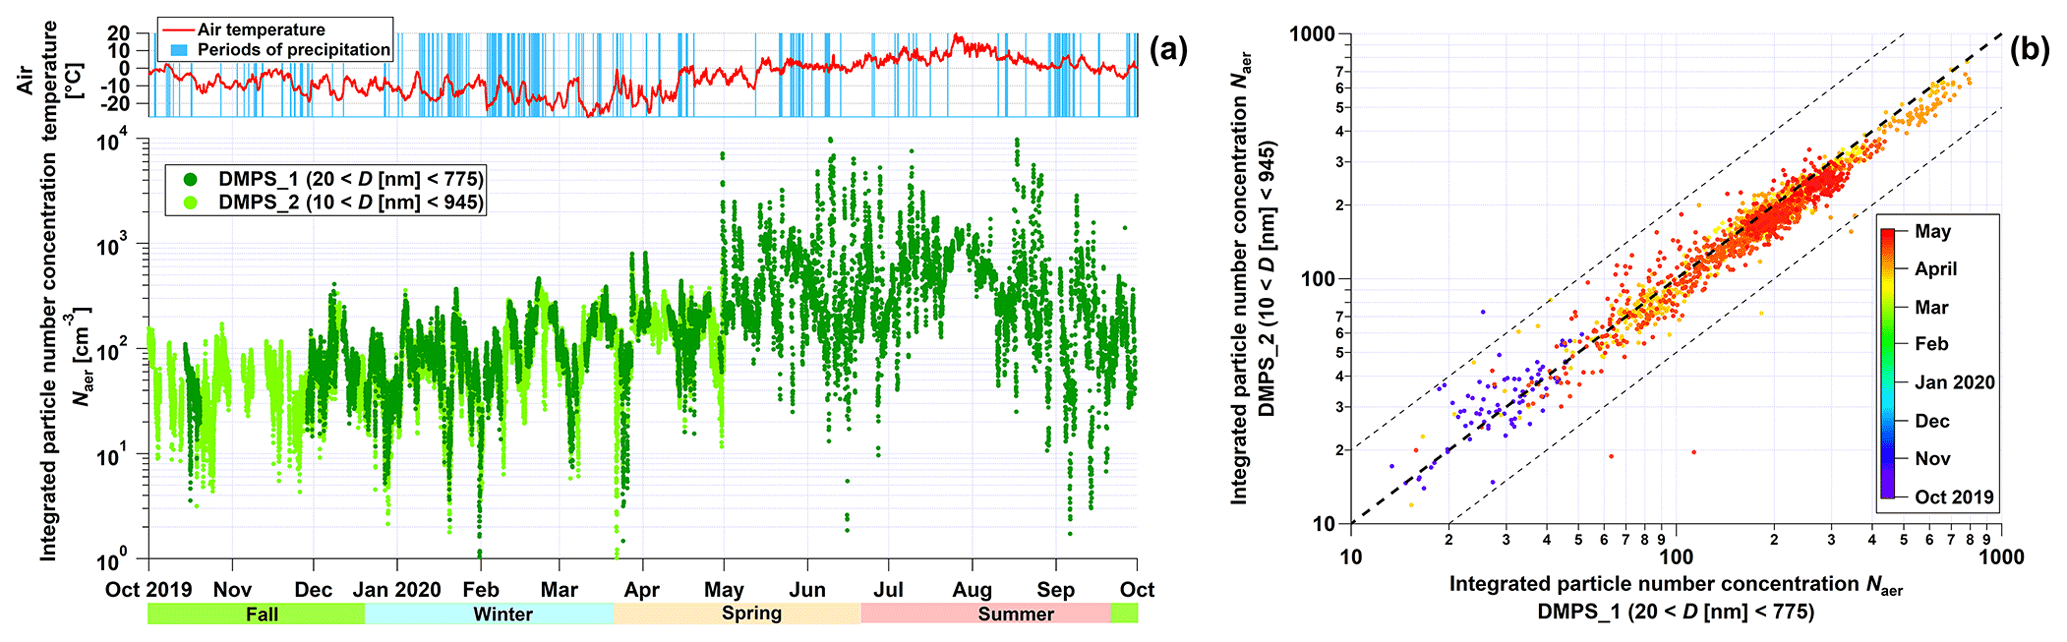
Figure 1(a) Air temperature measured by a probe (red curve), periods of precipitation (vertical blue bars) and integrated particle number concentration Naer (green dots) as measured by two DMPS systems at the Zeppelin station, displayed as time series. It should be noted that the two DMPSs have different size ranges: 20 to 775 nm for DMPS_1 and 10 to 945 nm for DMPS_2. (b) Comparison of integrated particle number concentration Naer as measured by two differential mobility particle sizer (DMPS) systems at Zeppelin, with the date as the color scale.
4.2 Aerosol hygroscopicity parameter κ
The time series of κ values derived from both the filter pack and the ACSM data is shown in Fig. S3a. Both instruments, despite being based on techniques with a different aerosol size cutoff (PM2.5 for the ACSM and PM10 for the filter pack), generally provide κ values that agree to within 50 % for the majority of data points (Fig. S3b). The mean hygroscopicity parameter κ value over the whole campaign was 0.40 when derived from the ACSM and 0.32 from the filter pack. The temporal trend shows a relatively constant κ value of around 0.3 in fall, winter and spring but a slightly lower value in summer, dropping to approximately 0.2, although rather variable.
A small number of field campaigns at Zeppelin have investigated aerosol hygroscopicity. In summer 2008, Zábori et al. (2015) utilized both bulk chemical composition and size-resolved CCN measurements, retrieving κ values of 0.5 and 0.3–0.4, respectively, slightly higher than our results. Zieger et al. (2010) measured wet and dry aerosol scattering from July to October 2008 using humidified and dry nephelometers. Using Mie theory, they were able to retrieve the hygroscopicity parameter κ and found a mean value of 0.57. This is also higher than the values we report in Fig. S3a, but the techniques used and the seasons studied are different. The median κ value of 0.23, retrieved by Jung et al. (2018) and based on 5 years of CCN-scanning mobility particle sizer (SMPS) measurements, however agree with our results. Year-round hygroscopic growth measurements by Rastak et al. (2014) led to the conclusion that the influence of hygroscopic growth on the direct radiative effect was higher in summer than during the Arctic haze period.
The hygroscopicity parameter has also been constrained in other locations in the Arctic, all of them combining a CCN counter and an instrument measuring particle number size distribution, either an ultra-high-sensitivity aerosol spectrometer (UHSAS), an SMPS or a DMPS, to provide input data for κ–Köhler theory calculations. Moore et al. (2011) and Herenz et al. (2018) both characterized springtime Arctic aerosol. The former reported values of around 0.4 for background air masses and of slightly below 0.6 for the Arctic boundary layer in aircraft flying over northern Alaska (USA); the latter retrieved a κ value of 0.23 at a station located in the Inuvik region in Canada. Martin et al. (2011) and Lathem et al. (2013) ran measurements in the summer season and found similar values (averages of 0.33 and 0.32, respectively), on an icebreaker on its way from Svalbard to the vicinity of the North Pole and on aircraft flights between Alberta (Canada) and Greenland. Also in summer but at a ground-based station in northern Sweden (68∘ N), Kammermann et al. (2010) retrieved lower κ values, between 0.07 and 0.21, but the close presence of the Stordalen mire, known to emit organic precursors, could have caused a local reduction in aerosol hygroscopicity. At the Villum station in northeastern Greenland, Massling et al. (2023) reported κ values very close to the present study using CCN SMPS measurements: 0.28–035 in spring and 0.23–0.35 in summer.
4.3 Potential cloud supersaturation, droplet number concentration and activation diameter
The cloud droplet formation parameterization outputs Smax, Nd and Dact are displayed in terms of their frequency of occurrence in Fig. 2 and as a time series in Fig. S4 with the measured values of σw, which are used to constrain the parameterization. During periods of rain (noted in Fig. 1a), the aerosol load was strongly reduced, directly implying sharp decreases in Nd and Dact, which impact the other parameters. As expected, Smax and σw covaried during the whole year, since turbulence and vertical velocity are primary drivers of cloud supersaturation generation. Values of Smax were highest in fall, centered at around 1 % and reaching up to 4 % (Fig. 1b). Except for a drop in early August, Smax values ranged between around 0.5 % and 1.5 % in the second half of spring and in summer.
Together with Bougiatioti et al. (2020), Kacarab et al. (2020) examined the conditions for which cloud formation is insensitive to any increase in Naer (i.e., updraft-limited regime) and found that it corresponds to when Smax is below 0.1 %. Subsequent studies (e.g., Georgakaki et al., 2021) also supported this criterion, which is the one we decided to use here as well. Figure S4b indicates that such conditions only occurred over short periods in winter and during the first half of spring. This shows that updraft-velocity-limited conditions can be found, although very rarely, in the Svalbard archipelago when aerosol concentrations approach the Arctic haze maximum in winter and early spring (Figs. 2a and S4b). This is an important result because when these conditions occur, cloud formation is not linearly influenced by these large aerosol loads but only until a certain threshold, which will be discussed in the following. The presence of very large particles, larger than the maximum diameter that can be detected by the DMPSs, could potentially scavenge water vapor and cause drops in Smax that are as low as those we observed. However, the mode diameter measured during the campaign was consistently between about 30 and 300 nm, and particles larger than 500 nm were very rare (not shown), in agreement with previous literature about the same site (Tunved et al., 2013; Pasquier et al., 2022b). We thus consider it very unlikely that low values of Smax are caused by this phenomenon.
Nd, however, is not clearly linked to Smax but follows the trend of Naer shown in Fig. 1a (this is confirmed by the scatterplots in Fig. 3) because a higher number of aerosol particles goes with a higher number of CCN on which water vapor can condense, as shown at Zeppelin by Jung et al. (2018). On the other hand, higher Naer also results in more intense competition for water vapor, leading to a decrease in Smax, which in turn tends to limit Nd. Measuring the annual cycle of cloud residual number concentration at the same site from November 2015 to February 2018 using a ground-based counterflow virtual impactor (GCVI) inlet, Karlsson et al. (2021) reported a similarly high and variable plateau between April and August as well as a minimum in fall. They however reported very low concentrations in January and February, followed by an extremely sharp increase from March to April. Our results show a steadier increase over the whole winter, in agreement with the increase in Naer (Fig. 1a).
Clear seasonal variations in Dact can also be seen: the pristine-like conditions in fall and early winter associated with high cloud supersaturations led to low values of Dact, with frequent occurrences below 20 nm (Figs. 2c and S4d). These are even lower diameters than the values reported by Koike et al. (2019) – minimum Dact of around 30 to 50 nm – using air parcel model calculations. Together with relatively high Smax values during this period of the year, the very low aerosol concentrations, mainly concentrated in the accumulation mode (Tunved et al., 2013), lead to the efficient activation of the aerosol particles to cloud droplets, in agreement with previous results from Siegel et al. (2022). Although anthropogenic pollution transported from lower latitudes during the Arctic haze period (late winter and spring; Rahn, 1981; Hirdman et al., 2010) controls the CCN and droplet population, only a fraction of it was activated to cloud droplets, as larger Dact values, centered around 50–100 nm, were in the range of accumulation-mode particles typically linked to this type of atmospheric transport. Such Dact values persisted over the summer with a particularly high peak between 100 and 200 nm at the beginning of August. Similarly, the dominant Aitken mode, originating from the intense new particle formation activity, likely stayed to a very large extent in the interstitial (unactivated) phase.
The comparison between uSonic-derived and wind-lidar-derived updraft velocity shown in Figs. S1 and S2 provides relatively accurate but not very precise results, which could be due not only to fine-scale variability in vertical motion but also to larger-scale differences related to the horizontal distance between both instruments. However, Figs. 2 and S4 provide a good indication of the second-order influence of the updraft velocity on the outputs of the cloud droplet formation parameterization, since the Nd, Smax and Dact results based on the wind lidar and on the uSonic strongly agree.
With a view to consistency with data from the DMPSs, the cloud droplet parameterization outputs shown in Figs. 2 and S4 are based on hygroscopicity calculations that do not include sodium and chloride, under the assumption that submicron aerosol particles do not contain these compounds. According to Adachi et al. (2022), this assumption may not be fully correct, as particles of 1 µm in winter are found to be composed of 50 % by mass of sea salt, with a decreasing proportion with decreasing particle diameter. To address any effects of sea salt on droplet formation, we performed a sensitivity analysis assuming the extreme case for which half of the measured aerosol mass was sea salt and repeated the analysis detailed above. Using a κ value of 1.1 for sea salt, as suggested by Zieger et al. (2017), the overall hygroscopicity shifted from values of 0.2–0.3 (see Fig. S3) to around 0.7. Figure S5 shows the seasonal percent change such an increase in aerosol hygroscopicity has on Nd, Smax and Dact. The two former parameters are very slightly affected in fall, winter and spring (up to ∼5 % for Nd). In summer they undergo a 20 % change, but this is the season when the effective sea salt fraction is the lowest, as shown by Adachi et al. (2022), making such an effective change particularly unlikely. Values of Dact are more affected, although moderately, with a reduction of around 30 % regardless of the season. Overall, this sensitivity analysis shows that aerosol hygroscopicity effects from sea salt may have a second-order influence on the cloud droplet parameterization outputs and, thus, would not significantly affect the results and conclusions based on the base-case hygroscopicity value.
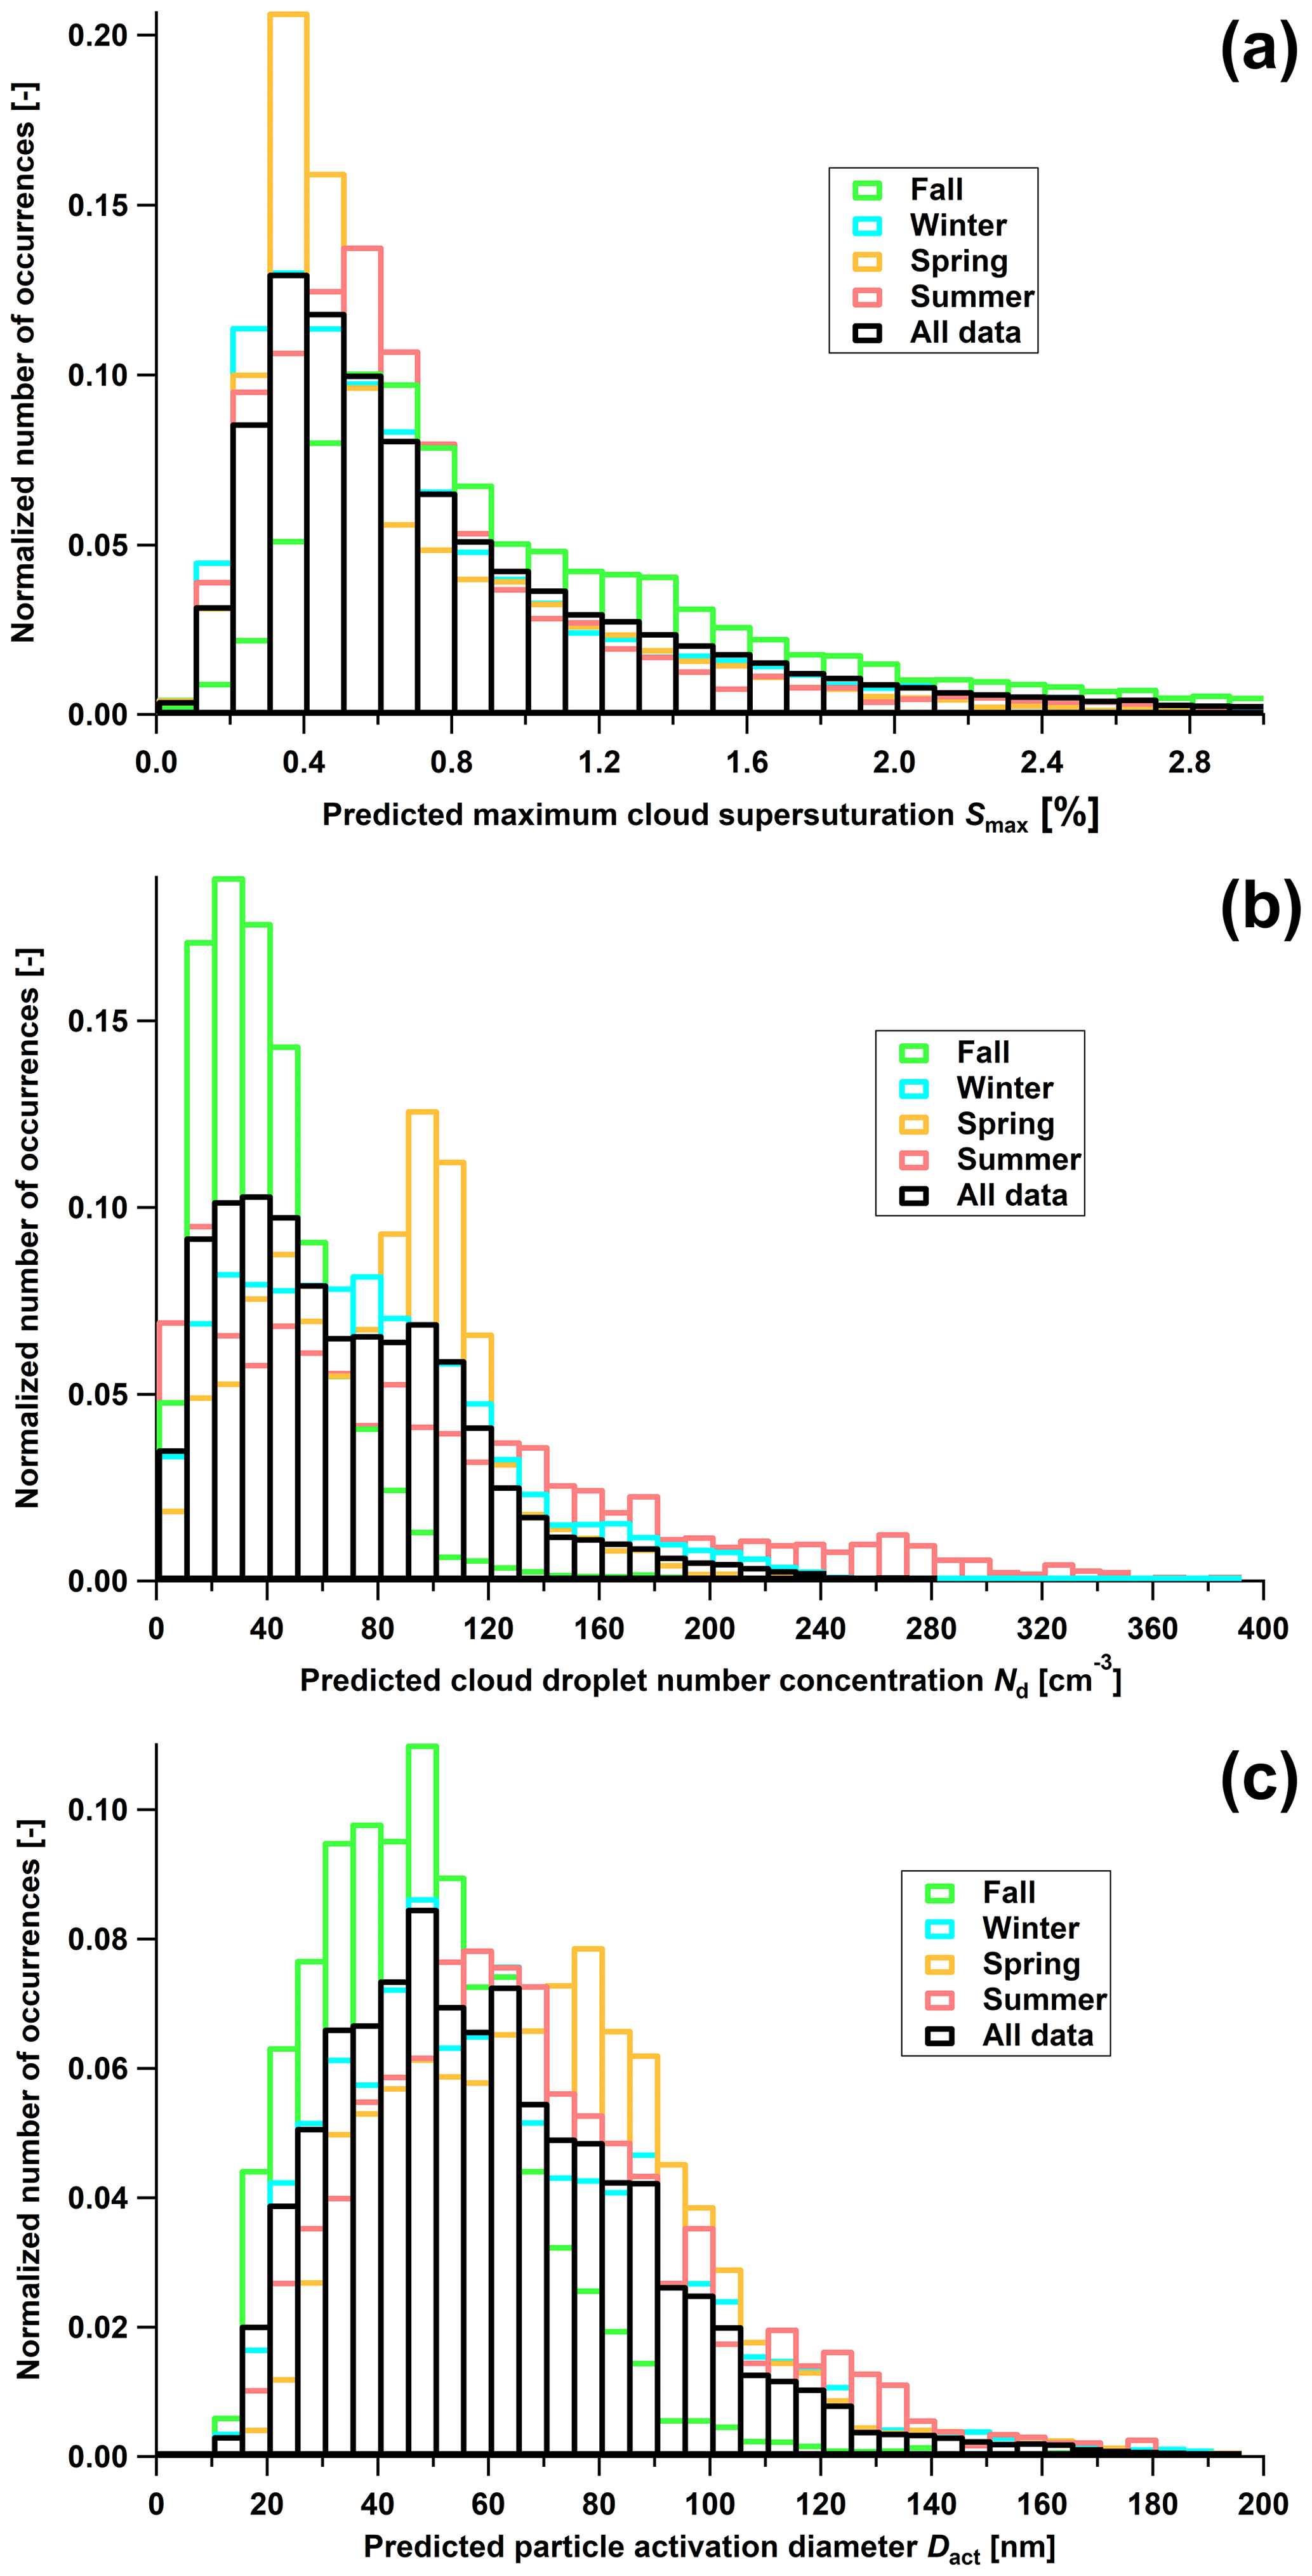
Figure 2Normalized number of occurrences of (a) Smax, (b) Nd and (c) Dact during the NASCENT campaign. The data are divided per season: fall (green), winter (light blue), spring (orange) and summer (red).
4.4 Limiting droplet number concentration
During updraft-limited cloud formation conditions, values of Nd reach an upper limit, independently of Naer, which Kacarab et al. (2020) suggested naming the limiting droplet number concentration, . This upper limit can be visualized as a plateau for which Smax drops below 0.1 % when plotting Nd as a function of Naer. This is shown in Fig. 3, where as a sensitivity analysis, we prescribed three different σw values, 0.1, 0.2 and 0.3 m s−1, for running the cloud droplet parameterization. Note that the three values of σw chosen here are representative of the stratiform cloud conditions that typically prevail in the Arctic (Shupe et al., 2008b). Based on the results in Sect. 4.3, updraft-limited conditions were observed in winter and early spring. Extracting mean plateau values corresponding to these seasons from Fig. 3, we retrieved values of 173 cm−3 for winter and 128 cm−3 for spring, when an updraft velocity σw=0.1 m s−1 is prescribed. These results are in good agreement with the 2-year-averaged peak concentration of cloud residuals measured by Karlsson et al. (2021) for April and May. This implies that when updraft velocity was low at the Zeppelin station in winter and early spring, only the fraction of the aerosol number concentration corresponding to these seasonal plateau values formed cloud droplets; any surplus of aerosol (very likely during Arctic haze conditions) remained in the interstitial phase.
Adding to the different regimes of cloud formation distinguished in Sect. 4.3., the plateau was almost never reached in fall and in summer. Short drops in Smax below 0.1 % occurred, e.g., at the beginning of December and August as shown in Fig. 1b, but over periods that are too short for them to be associated with updraft-velocity-limited conditions. For that reason, we do not consider the summer Smax values below 0.1 % in Fig. 3 relevant plateau values.
In addition, it is worth noting that when applying the same analysis with an assumption about σw being larger than 0.1 m s−1 (i.e., 0.2 or 0.3 m s−1; middle and right panels in Fig. 3) and even higher (not shown), the 0.1 % Smax threshold is not reached at all, neither in winter nor in spring, indicating that vertical-velocity-limited conditions cannot be found if the turbulence of the boundary layer is not extremely low.
Observing the shape of the plots displayed in Fig. 3 also provides information on the efficiency of cloud droplet formation and corroborates the results discussed above. The high Smax and corresponding low Dact in fall and winter are associated with the droplet activation of the whole aerosol population, leading to match Naer; these two parameters are thus represented in a scatterplot as a narrow band close to the 1:1 relationship. On the contrary, the scatterplot for the summer season shows a much larger spread with an offset from the 1:1 line, in agreement with a large proportion of Aitken-mode aerosol particles that did not activate to cloud droplets. Interestingly, the sharp transition between these two activation behaviors, also observed by Engvall et al. (2008) and which we have shown to occur in the middle of spring (Figs. 2a–c and S4b–d), results in a scatterplot where both staggered and matching Nd–Naer relationships can be observed.
Extracting the plateau values of from Fig. 3, we investigate their relationship with σw in different types of clouds located in various geographic locations using previous studies in which the same probabilistic analysis was performed (Fig. 4). Kacarab et al. (2020) measured from an aircraft in summer in the marine boundary layer over the southeastern Atlantic, a region that can be strongly influenced by biomass burning fires from the African continent. They retrieved values of σw of between 0.30 (relatively clean air mass) and 0.56 m s−1 (more polluted) for which was reached. Georgakaki et al. (2021) also reported σw values as high as 0.5 m s−1 at two mid-altitude stations located in the Swiss Alps in central Europe. The fact that they had winter measurements allowed them to reach values as low as 0.1 m s−1, making their results directly comparable to those shown here. They could link this value of σw to an plateau of 108.1 cm−3. At the other end of the spectrum, Bougiatioti et al. (2020) reached an plateau for σw values as high as 1.2 m s−1 thanks to late-spring and summer flights in the boundary layer over the southeastern United States. They proposed the following linear correlation between [cm−3] and σw [m s−1]: (R2=0.92). Georgakaki et al. (2021) updated this relationship, including the results from Kacarab et al. (2020) and their own, , and proved very strong agreement between all reported data (R2=0.94). The two additions from the present study, associated with winter and spring plateau values for σw=0.1 m s−1, also agree well with these previous results, although they were retrieved in a very different environment, i.e., relatively clean with clouds mainly originating from maritime air masses and uplifted in mountainous terrain. This provides another confirmation of the robustness of the empirically demonstrated σw– relationship regardless of the environment, type of clouds and aerosol sources.
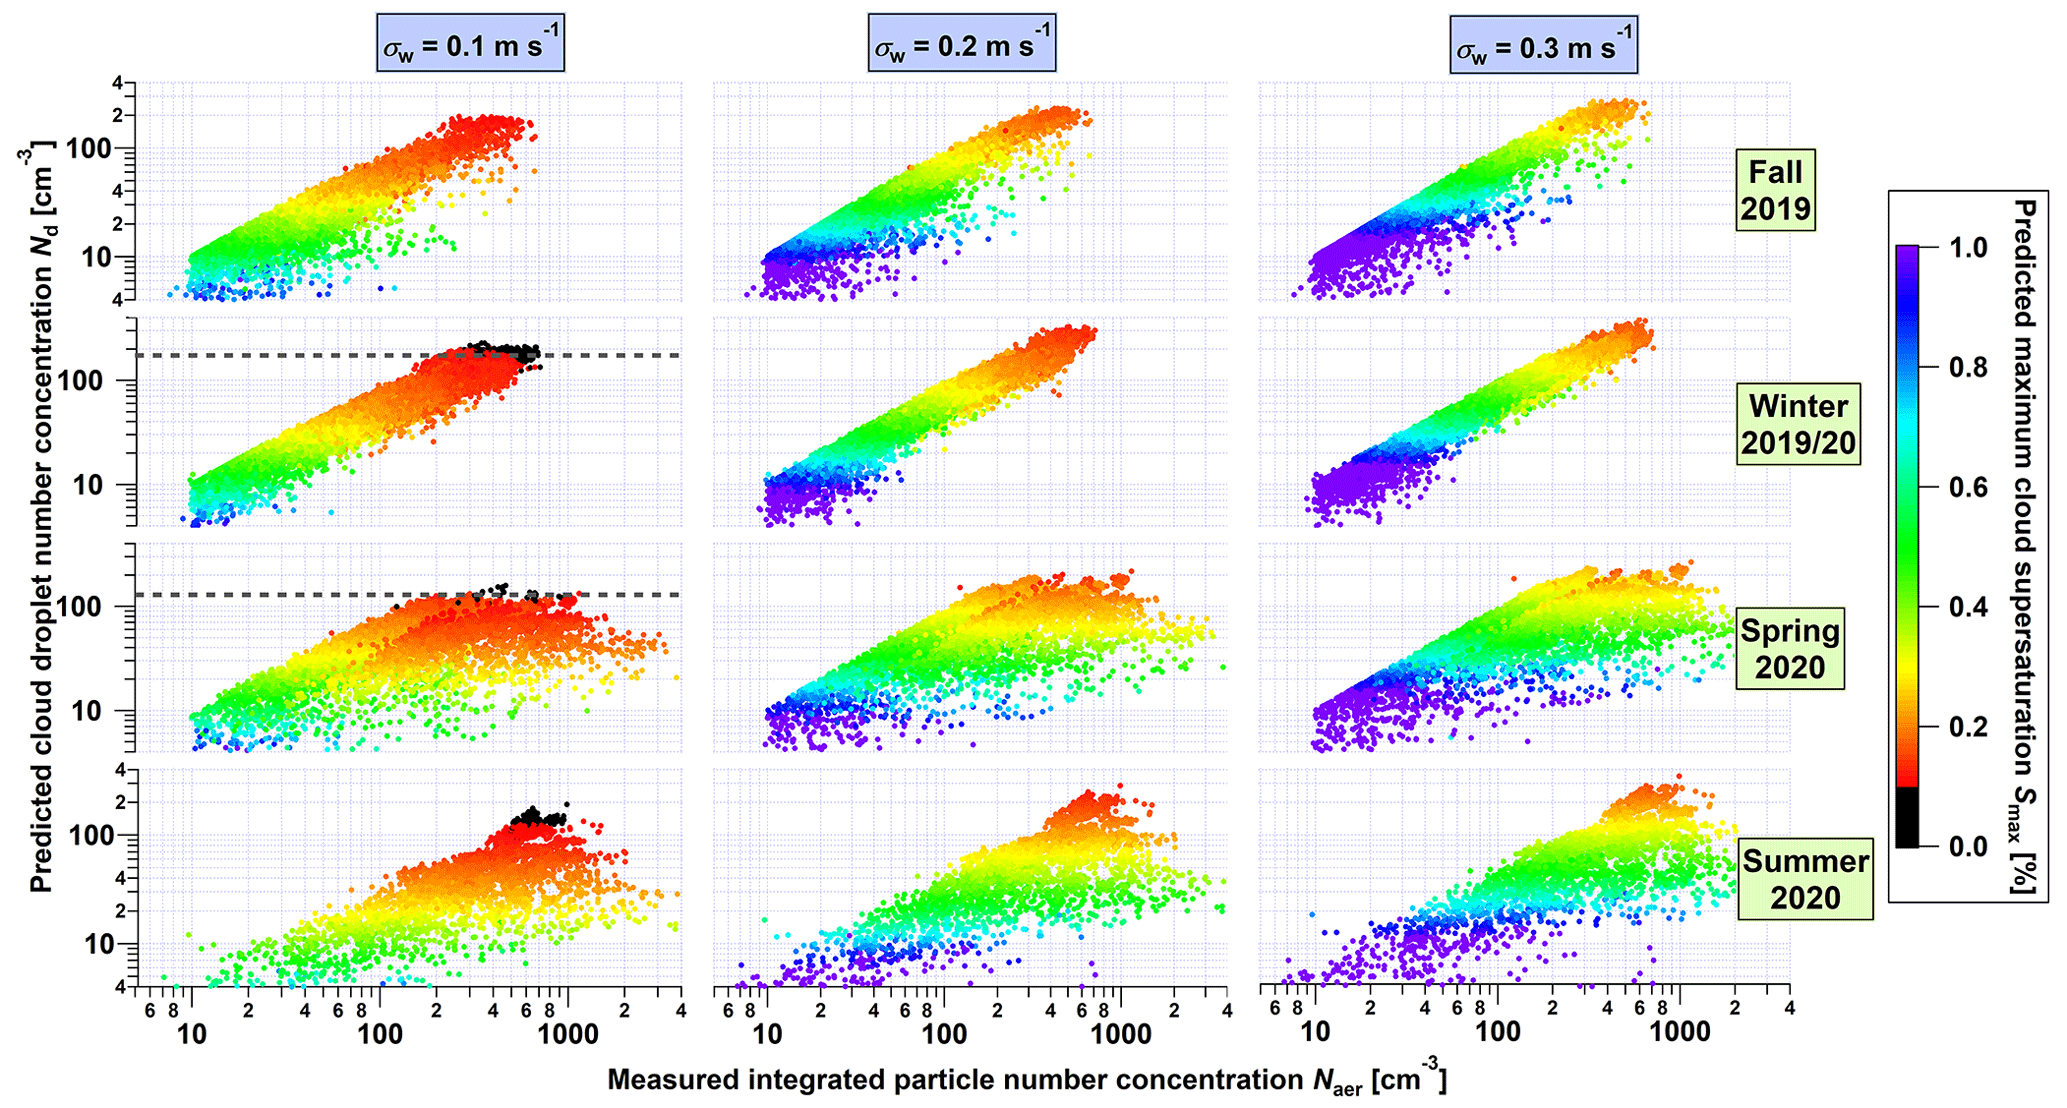
Figure 3Predicted potential droplet number concentration Nd compared to integrated particle number concentration Naer. Data are shown in 12 panels corresponding to four seasons and three different assumptions about updraft velocity σw: 0.1, 0.2 and 0.3 m s−1. Nd is an output of the cloud droplet formation parameterization, and Naer is measured by the DMPSs. The color scale is the maximum predicted cloud supersaturation Smax; note that data points for which Smax<0.1 % are shown in black. Plateau values of , calculated as the average value of data points for which Smax<0.1 %, are displayed as dashed grey lines.
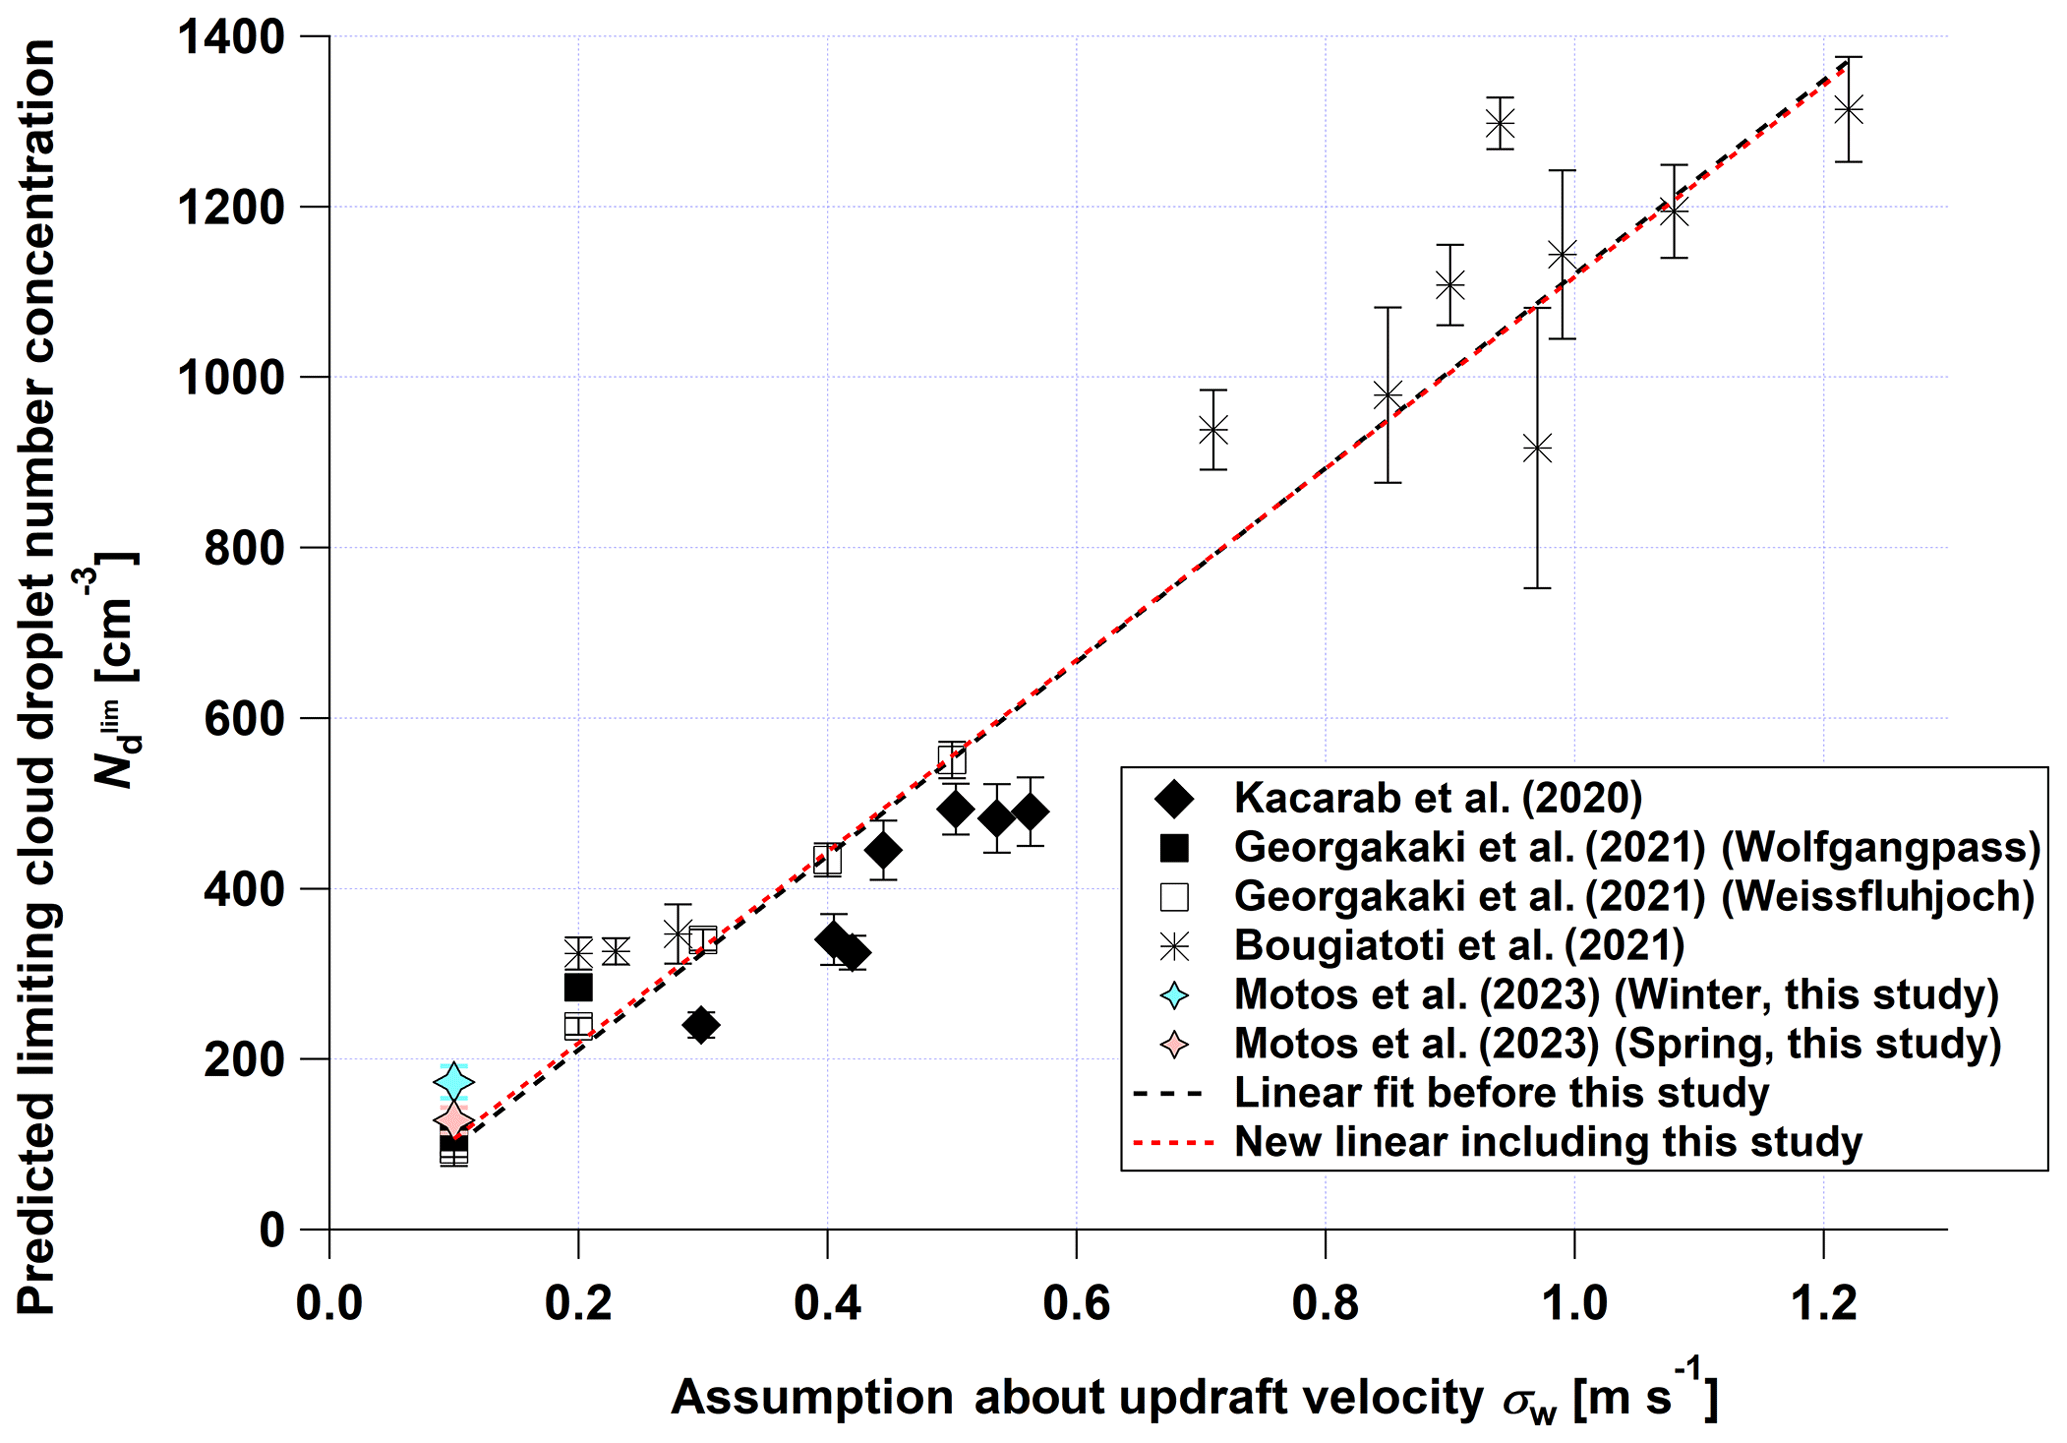
Figure 4Predicted limiting cloud droplet number concentration plotted against the corresponding assumption about the updraft velocity, comparing the present study with the existing literature. The linear fit displayed in black is the one given by Georgakaki et al. (2021); the red one includes results from the current study.
4.5 Droplet closure
Nd is one of the outputs provided by the cloud droplet formation parameterization utilized in the present study (see Figs. 2b and S4c). The availability of instruments measuring this parameter facilitates the validation of the cloud droplet parameterization by comparing in situ data with the parameterization output. This was achieved several times in past studies through successful droplet closures (e.g., Fountoukis et al., 2007; Kacarab et al., 2020) and can also be performed here using measurements from HOLIMO taken on nine HoloBalloon flights during the NASCENT campaign (Fig. 5; see Pasquier et al., 2022a for detailed descriptions of the atmospheric conditions during the flights; we note that, based on the radar measurements they performed, the clouds studied on 10, 11 and 12 November 2019 were monolayer clouds, but the 1 April case is a typical seeder–feeder configuration, with a synoptic cloud above the sampled cloud). The closure, which is assessed to be attained when predictions were within a factor of 2 of observations, appears successful for Nd>8–10 cm−3, thereby validating the use of the cloud droplet formation parameterization in the Arctic environment. Values of Nd below 8–10 cm−3 approach the minimum threshold concentration for which a cloud can still be defined as such, potentially including periods when droplet nucleation is not effectively occurring or has been followed by out-of-cloud scavenging.
Mixed-phase clouds tend to rapidly glaciate (i.e., convert to pure ice clouds) due to the Wegener–Bergeron–Findeisen (WBF) process or riming (Korolev et al., 2017), which can effectively transfer mass from the liquid to the ice phase. Nevertheless, Fig. 5 provides evidence that even for a degree of glaciation (i.e., the fraction of cloud water that is in the form of ice) as high as 90 %, cloud parcel activation theory can predict Nd to within 50 % of observations. This implies that significant amounts of glaciation over the duration of the HoloBalloon flights, and possibly over spring and fall, may have occurred through processes that do not deplete droplet number, e.g., WBF that is promoted by secondary ice production (SIP) through ice–ice collisions or droplet shattering (Field et al., 2017; Korolev and Leisner, 2020). SIP through rime splintering is unlikely as it would have reduced the available Nd. This hypothesis is in line with the findings of Pasquier et al. (2022a), where the effect of SIP was inferred in about 40 % of the in-cloud measurements.
Previous observations (Borys et al., 2003; Lance et al., 2011; Norgren et al., 2018) reported that large aerosol loadings could hamper the efficiency of riming in mixed-phase clouds. Here we show that even in the very pristine conditions during winter and spring, the amount of riming does not seem to affect the droplet number concentrations significantly compared to what is expected from warm-cloud activation theory.
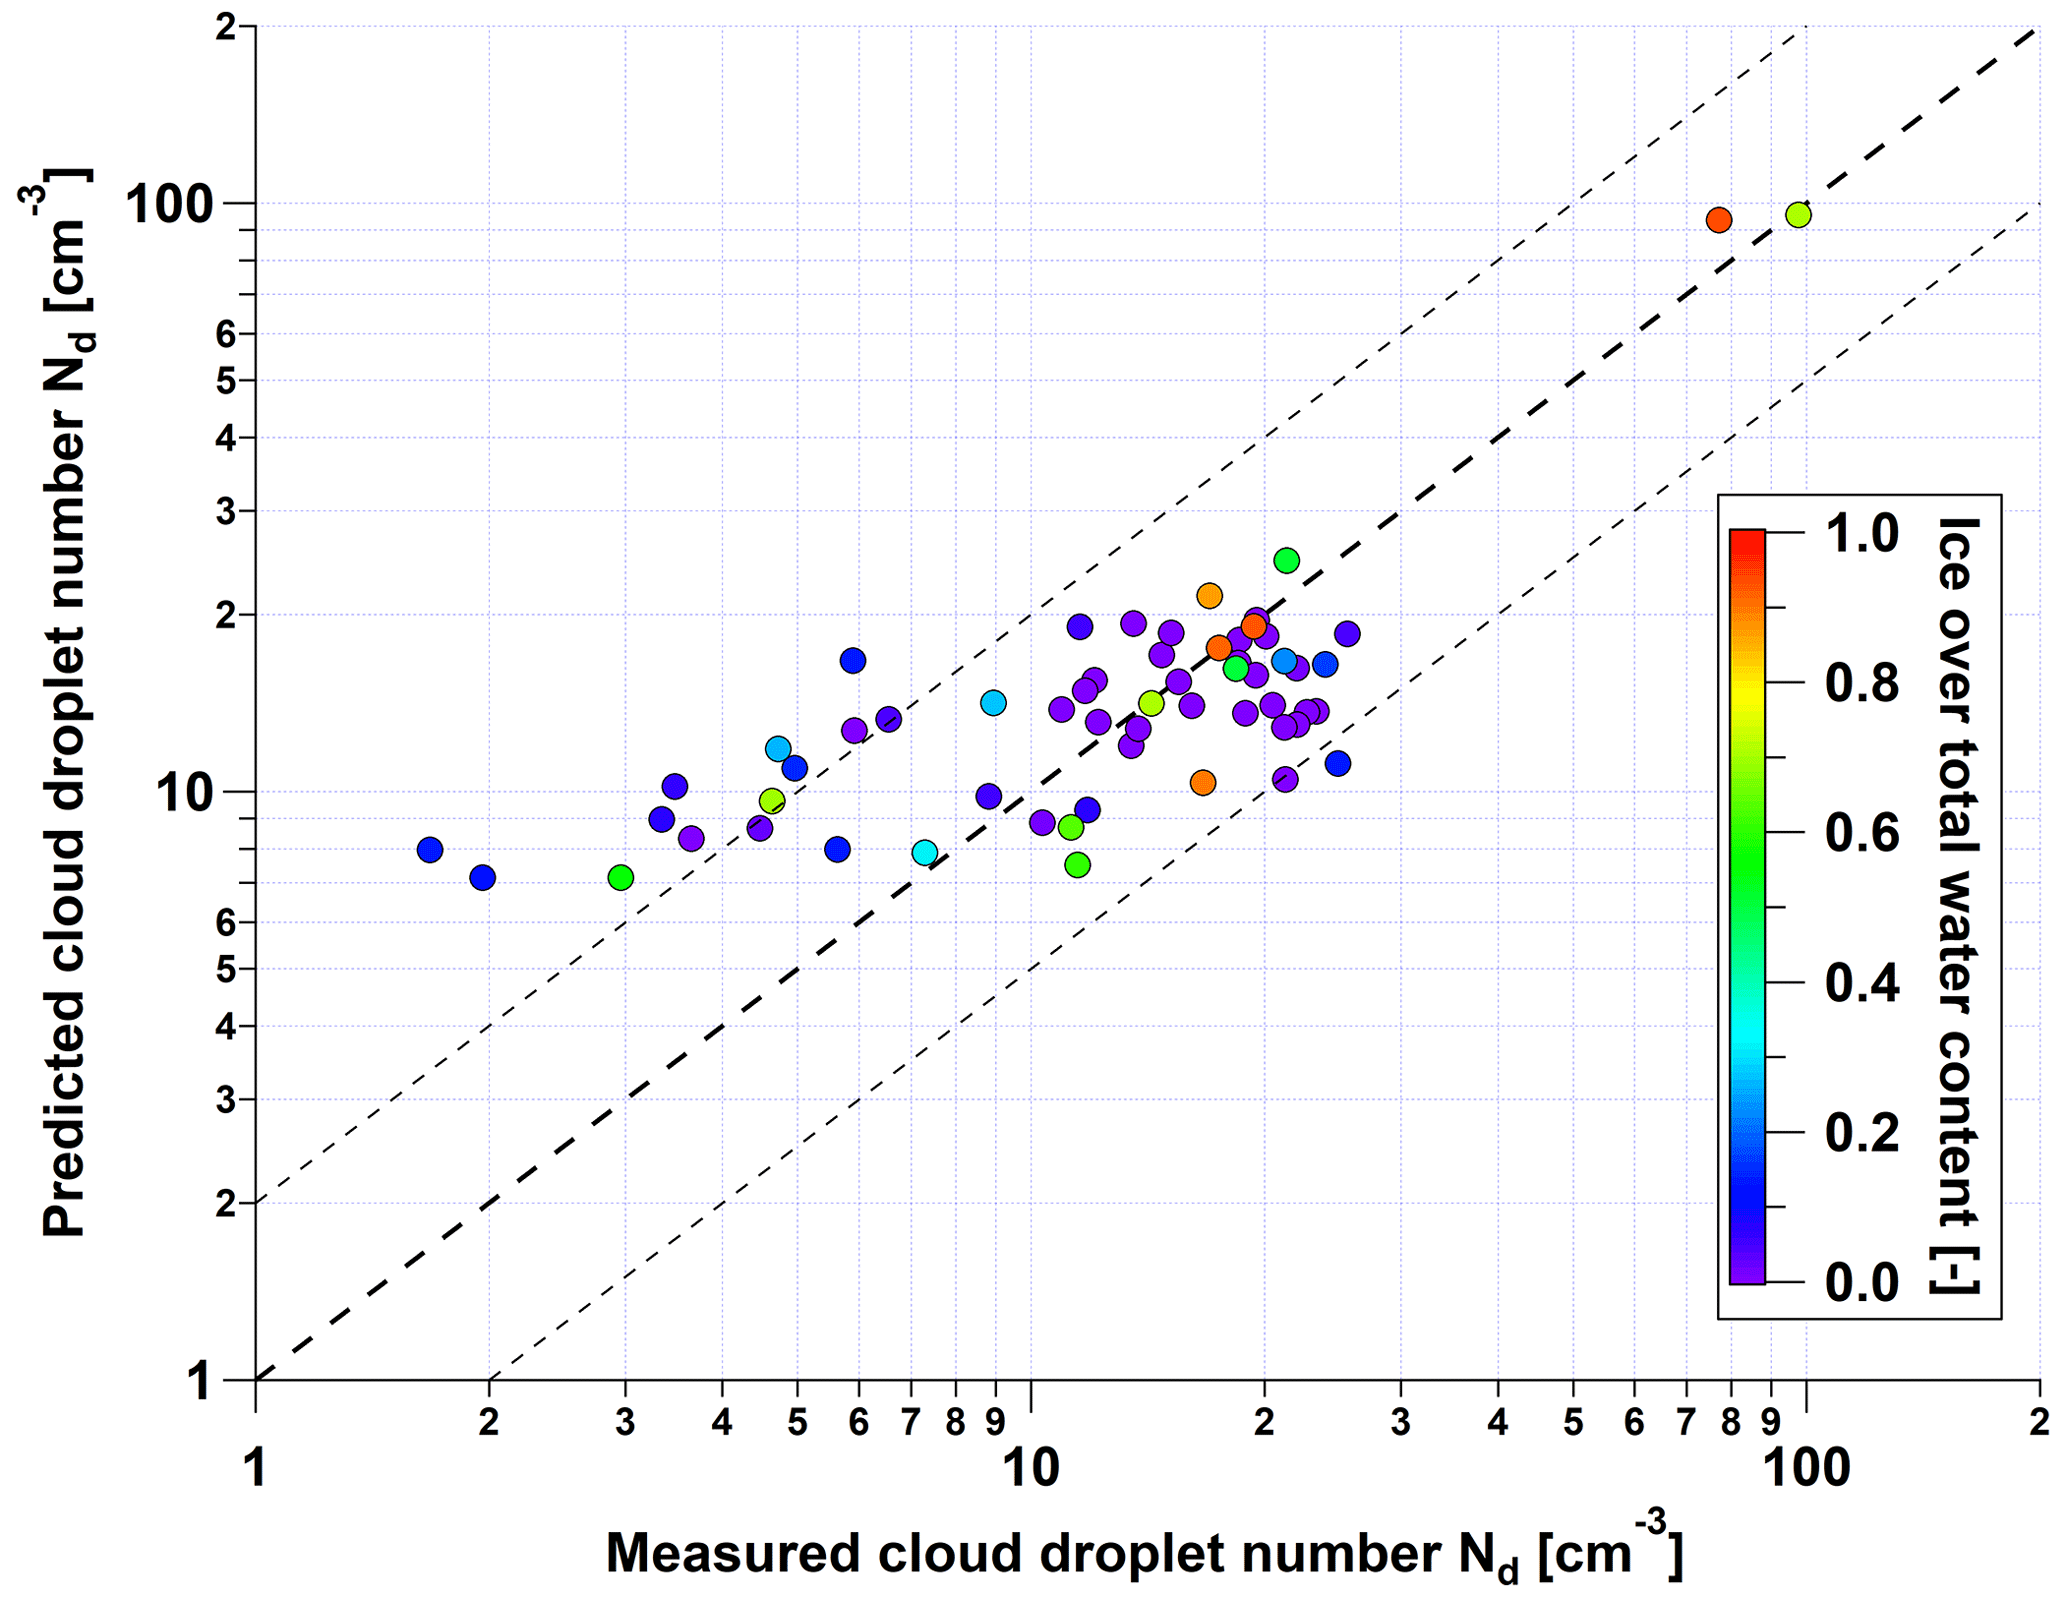
Figure 5Scatterplot of predicted against measured cloud droplet number Nd during nine HoloBalloon flights on 10, 11 and 12 November 2019 and 1 April 2020.
Measurements performed over a whole year at the Zeppelin station in the Svalbard archipelago, in the framework of the NASCENT campaign, served as inputs for a semi-empirical parameterization whose use was validated through a droplet closure. This led to the unraveling of different characteristics of cloud droplet formation in the Arctic environment:
-
Several recently published studies focusing on the factors limiting cloud droplet formation were able to distinguish periods of aerosol-limited or updraft-velocity-limited cloud droplet formation regimes not only in boundary layer clouds with high updraft velocities such as cumulus and stratocumulus clouds, but also in alpine mixed-phase clouds that can form in more stable air dynamics. The current study demonstrates that updraft-velocity cloud formation can also occur in a relatively unpolluted environment with weak convection of maritime air masses such as the Arctic, during winter and early spring.
-
During the fall and early-winter period, the high cloud supersaturations encountered allow the vast majority of the aerosol population to efficiently activate to cloud droplets. By late winter and spring (Arctic haze period), accumulation-mode particles transported over long-range pathways contribute to cloud formation, although cloud supersaturations, and hence activation diameters, are highly variable. Interestingly, the onset of intense new particle formation in summer coincides with an increase in activation diameters. Newly formed and dominant Aitken-mode particles thus barely participate in cloud formation before they grow to larger sizes over the course of summer and fall.
-
The recent interest in understanding the response of the limiting droplet number concentration to variations in updraft velocity has led to the description of a relationship between these two parameters that is shown to be strikingly similar across very diverse environments, intensities of atmospheric convection and types of clouds. We showed that, as unpolluted and weakly dynamic as it is, the Arctic environment is no exception. This is an important step towards the confirmation of the universality of the –σw relationship.
-
Insights into the mechanisms of secondary ice production in the Arctic spring and fall could be extracted from our droplet closure. Although the measurements were taken over 4 d only and may not be representative of the whole year, they suggest that riming was not taking place in any significant amount, leaving room for ice–ice collisions and droplet shattering (alongside with WBF) as the main mechanisms of glaciation, in addition to primary ice production. This also supports the argument that warm-cloud activation theory, such as described by well-established activation parameterizations (e.g., Morales and Nenes, 2014), is appropriate for application in mixed-phase cloud simulations.
The data used in this study are available for download at https://doi.org/10.16904/envidat.438 (Motos, 2023). The cloud droplet formation parameterization and the script used for the calculations of σw using half-Gaussian fitting are available upon request from the corresponding authors.
The supplement related to this article is available online at: https://doi.org/10.5194/acp-23-13941-2023-supplement.
GM and AN conceived and designed the study. GM, AN and PG developed the data analysis methods; AN developed the droplet calculation codes and performed the simulations with GM. GM authored the manuscript with input from AN and PG. CR provided the wind lidar data. CL and WA provided the chemical composition data (filter pack and ACSM) from Zeppelin. JW helped with the ground-based aerosol and the balloon-borne cloud measurements and contributed to the discussion and interpretation. ROD helped with the balloon-borne measurements and conducted the mountaintop cloud measurements. All co-authors commented on the manuscript and provided feedback. RK, PZ and GF provided aerosol microphysical and meteorological data from the Zeppelin station and contributed to the interpretation and manuscript editing and commenting.
At least one of the (co-)authors is a member of the editorial board of Atmospheric Chemistry and Physics. The peer-review process was guided by an independent editor, and the authors also have no other competing interests to declare.
Publisher’s note: Copernicus Publications remains neutral with regard to jurisdictional claims made in the text, published maps, institutional affiliations, or any other geographical representation in this paper. While Copernicus Publications makes every effort to include appropriate place names, the final responsibility lies with the authors.
We would like to thank the Norwegian Polar Institute (NPI) for logistical support at Ny-Ålesund and Zeppelin, as well as every person involved in the planning, measurements and data analysis of the NASCENT campaign (a project initiated by Stockholm University).
This work is supported by the European Research Council, CoG-2016 project PyroTRACH (726165) funded by H2020-EU.1.1. – Excellent Science, and the European Union Horizon 2020 project FORCeS under grant agreement no. 821205. Support was also provided by the Swedish Environmental Protection Agency (Naturvårdsverket); the Knut and Alice Wallenberg Foundation (WAF project CLOUDFORM, grant no. 2017.0165); the project ACAS (project no. 2016.0024); the funding agency Formas (IWCAA project no. 2016-01427); the European Research Council (ERC) through grant no. StG758005; the EEA and Norway Grants EEARO-NO-2019-0423/IceSafari, contract no. 31/2020; the Swedish Research Council (Vetenskapsrådet starting grant, project number 2018-05045); and the Swiss National Science Foundation (grant no. 200021_175824). Funding for the OC/EC and ACSM measurements is provided by the Norwegian Ministry of Climate and Environment, and the inorganic measurements from the filter pack are funded by the Norwegian Environment Agency.
This paper was edited by Zhanqing Li and reviewed by two anonymous referees.
Adachi, K., Tobo, Y., Koike, M., Freitas, G., Zieger, P., and Krejci, R.: Composition and mixing state of Arctic aerosol and cloud residual particles from long-term single-particle observations at Zeppelin Observatory, Svalbard, Atmos. Chem. Phys., 22, 14421–14439, https://doi.org/10.5194/acp-22-14421-2022, 2022.
Barahona, D., West, R. E. L., Stier, P., Romakkaniemi, S., Kokkola, H., and Nenes, A.: Comprehensively accounting for the effect of giant CCN in cloud activation parameterizations, Atmos. Chem. Phys., 10, 2467–2473, https://doi.org/10.5194/acp-10-2467-2010, 2010.
Beck, A., Henneberger, J., Schöpfer, S., Fugal, J., and Lohmann, U.: HoloGondel: in situ cloud observations on a cable car in the Swiss Alps using a holographic imager, Atmos. Meas. Tech., 10, 459–476, https://doi.org/10.5194/amt-10-459-2017, 2017.
Beck, A., Henneberger, J., Fugal, J. P., David, R. O., Lacher, L., and Lohmann, U.: Impact of surface and near-surface processes on ice crystal concentrations measured at mountain-top research stations, Atmos. Chem. Phys., 18, 8909–8927, https://doi.org/10.5194/acp-18-8909-2018, 2018.
Borys, R. D., Lowenthal, D. H., Cohn, S. A., and Brown, W. O. J.: Mountaintop and radar measurements of anthropogenic aerosol effects on snow growth and snowfall rate, Geophys. Res. Lett., 30, https://doi.org/10.1029/2002GL016855, 2003.
Bougiatioti, A., Nenes, A., Lin, J. J., Brock, C. A., de Gouw, J. A., Liao, J., Middlebrook, A. M., and Welti, A.: Drivers of cloud droplet number variability in the summertime in the southeastern United States, Atmos. Chem. Phys., 20, 12163–12176, https://doi.org/10.5194/acp-20-12163-2020, 2020.
Breider, T. J., Mickley, L. J., Jacob, D. J., Ge, C., Wang, J., Payer Sulprizio, M., Croft, B., Ridley, D. A., McConnell, J. R., Sharma, S., Husain, L., Dutkiewicz, V. A., Eleftheriadis, K., Skov, H., and Hopke, P. K.: Multidecadal trends in aerosol radiative forcing over the Arctic: Contribution of changes in anthropogenic aerosol to Arctic warming since 1980, J. Geophys. Res.-Atmos., 122, 3573–3594, https://doi.org/10.1002/2016JD025321, 2017.
Bulatovic, I., Igel, A. L., Leck, C., Heintzenberg, J., Riipinen, I., and Ekman, A. M. L.: The importance of Aitken mode aerosol particles for cloud sustenance in the summertime high Arctic – a simulation study supported by observational data, Atmos. Chem. Phys., 21, 3871–3897, https://doi.org/10.5194/acp-21-3871-2021, 2021.
Carrico, C. M., Petters, M. D., Kreidenweis, S. M., Sullivan, A. P., McMeeking, G. R., Levin, E. J. T., Engling, G., Malm, W. C., and Collett Jr., J. L.: Water uptake and chemical composition of fresh aerosols generated in open burning of biomass, Atmos. Chem. Phys., 10, 5165–5178, https://doi.org/10.5194/acp-10-5165-2010, 2010.
Cavalli, F., Viana, M., Yttri, K. E., Genberg, J., and Putaud, J.-P.: Toward a standardised thermal-optical protocol for measuring atmospheric organic and elemental carbon: the EUSAAR protocol, Atmos. Meas. Tech., 3, 79–89, https://doi.org/10.5194/amt-3-79-2010, 2010.
Collaud Coen, M., Andrews, E., Aliaga, D., Andrade, M., Angelov, H., Bukowiecki, N., Ealo, M., Fialho, P., Flentje, H., Hallar, A. G., Hooda, R., Kalapov, I., Krejci, R., Lin, N.-H., Marinoni, A., Ming, J., Nguyen, N. A., Pandolfi, M., Pont, V., Ries, L., Rodríguez, S., Schauer, G., Sellegri, K., Sharma, S., Sun, J., Tunved, P., Velasquez, P., and Ruffieux, D.: Identification of topographic features influencing aerosol observations at high altitude stations, Atmos. Chem. Phys., 18, 12289–12313, https://doi.org/10.5194/acp-18-12289-2018, 2018.
Croft, B., Martin, R. V., Leaitch, W. R., Tunved, P., Breider, T. J., D'Andrea, S. D., and Pierce, J. R.: Processes controlling the annual cycle of Arctic aerosol number and size distributions, Atmos. Chem. Phys., 16, 3665–3682, https://doi.org/10.5194/acp-16-3665-2016, 2016.
Curry, J. A., Schramm, J. L., Rossow, W. B., and Randall, D.: Overview of Arctic Cloud and Radiation Characteristics, J. Climate, 9, 1731–1764, https://doi.org/10.1175/1520-0442(1996)009<1731:OOACAR>2.0.CO;2, 1996.
Dall'Osto, M., Beddows, D. C. S., Tunved, P., Krejci, R., Ström, J., Hansson, H.-C., Yoon, Y. J., Park, K.-T., Becagli, S., Udisti, R., Onasch, T., O'Dowd, C. D., Simó, R., and Harrison, R. M.: Arctic sea ice melt leads to atmospheric new particle formation, Sci. Rep.-UK, 7, 3318, https://doi.org/10.1038/s41598-017-03328-1, 2017.
Di Liberto, L., Angelini, F., Pietroni, I., Cairo, F., Di Donfrancesco, G., Viola, A., Argentini, S., Fierli, F., Gobbi, G., Maturilli, M., Neuber, R., and Snels, M.: Estimate of the Arctic Convective Boundary Layer Height from Lidar Observations: A Case Study, Adv. Meteorol., 2012, e851927, https://doi.org/10.1155/2012/851927, 2012.
Ebell, K., Nomokonova, T., Maturilli, M., and Ritter, C.: Radiative Effect of Clouds at Ny-Ålesund, Svalbard, as Inferred from Ground-Based Remote Sensing Observations, J. Appl. Meteorol. Clim., 59, 3–22, https://doi.org/10.1175/JAMC-D-19-0080.1, 2020.
Eirund, G. K., Possner, A., and Lohmann, U.: Response of Arctic mixed-phase clouds to aerosol perturbations under different surface forcings, Atmos. Chem. Phys., 19, 9847–9864, https://doi.org/10.5194/acp-19-9847-2019, 2019.
Engvall, A.-C., Krejci, R., Ström, J., Treffeisen, R., Scheele, R., Hermansen, O., and Paatero, J.: Changes in aerosol properties during spring-summer period in the Arctic troposphere, Atmos. Chem. Phys., 8, 445–462, https://doi.org/10.5194/acp-8-445-2008, 2008.
Field, P. R., Lawson, R. P., Brown, P. R. A., Lloyd, G., Westbrook, C., Moisseev, D., Miltenberger, A., Nenes, A., Blyth, A., Choularton, T., Connolly, P., Buehl, J., Crosier, J., Cui, Z., Dearden, C., DeMott, P., Flossmann, A., Heymsfield, A., Huang, Y., Kalesse, H., Kanji, Z. A., Korolev, A., Kirchgaessner, A., Lasher-Trapp, S., Leisner, T., McFarquhar, G., Phillips, V., Stith, J., and Sullivan, S.: Secondary Ice Production: Current State of the Science and Recommendations for the Future, Meteorol. Monogr., 58, 7.1–7.20, https://doi.org/10.1175/AMSMONOGRAPHS-D-16-0014.1, 2017.
Fountoukis, C. and Nenes, A.: Continued development of a cloud droplet formation parameterization for global climate models, J. Geophys. Res.-Atmos., 110, https://doi.org/10.1029/2004JD005591, 2005.
Fountoukis, C., Nenes, A., Meskhidze, N., Bahreini, R., Conant, W. C., Jonsson, H., Murphy, S., Sorooshian, A., Varutbangkul, V., Brechtel, F., Flagan, R. C., and Seinfeld, J. H.: Aerosol–cloud drop concentration closure for clouds sampled during the International Consortium for Atmospheric Research on Transport and Transformation 2004 campaign, J. Geophys. Res.-Atmos., 112, https://doi.org/10.1029/2006JD007272, 2007.
Freud, E., Krejci, R., Tunved, P., Leaitch, R., Nguyen, Q. T., Massling, A., Skov, H., and Barrie, L.: Pan-Arctic aerosol number size distributions: seasonality and transport patterns, Atmos. Chem. Phys., 17, 8101–8128, https://doi.org/10.5194/acp-17-8101-2017, 2017.
Fröhlich, R., Cubison, M. J., Slowik, J. G., Bukowiecki, N., Prévôt, A. S. H., Baltensperger, U., Schneider, J., Kimmel, J. R., Gonin, M., Rohner, U., Worsnop, D. R., and Jayne, J. T.: The ToF-ACSM: a portable aerosol chemical speciation monitor with TOFMS detection, Atmos. Meas. Tech., 6, 3225–3241, https://doi.org/10.5194/amt-6-3225-2013, 2013.
Garrett, T. J., Zhao, C., Dong, X., Mace, G. G., and Hobbs, P. V.: Effects of varying aerosol regimes on low-level Arctic stratus, Geophys. Res. Lett., 31, https://doi.org/10.1029/2004GL019928, 2004.
Georgakaki, P., Bougiatioti, A., Wieder, J., Mignani, C., Ramelli, F., Kanji, Z. A., Henneberger, J., Hervo, M., Berne, A., Lohmann, U., and Nenes, A.: On the drivers of droplet variability in alpine mixed-phase clouds, Atmos. Chem. Phys., 21, 10993–11012, https://doi.org/10.5194/acp-21-10993-2021, 2021.
Gramlich, Y., Siegel, K., Haslett, S. L., Freitas, G., Krejci, R., Zieger, P., and Mohr, C.: Revealing the chemical characteristics of Arctic low-level cloud residuals – in situ observations from a mountain site, Atmos. Chem. Phys., 23, 6813–6834, https://doi.org/10.5194/acp-23-6813-2023, 2023.
Graßl, S., Ritter, C., and Schulz, A.: The Nature of the Ny-Ålesund Wind Field Analysed by High-Resolution Windlidar Data, Remote Sens.-Basel, 14, 3771, https://doi.org/10.3390/rs14153771, 2022.
Gysel, M., Crosier, J., Topping, D. O., Whitehead, J. D., Bower, K. N., Cubison, M. J., Williams, P. I., Flynn, M. J., McFiggans, G. B., and Coe, H.: Closure study between chemical composition and hygroscopic growth of aerosol particles during TORCH2, Atmos. Chem. Phys., 7, 6131–6144, https://doi.org/10.5194/acp-7-6131-2007, 2007.
Hammer, E., Bukowiecki, N., Luo, B. P., Lohmann, U., Marcolli, C., Weingartner, E., Baltensperger, U., and Hoyle, C. R.: Sensitivity estimations for cloud droplet formation in the vicinity of the high-alpine research station Jungfraujoch (3580 m a.s.l.), Atmos. Chem. Phys., 15, 10309–10323, https://doi.org/10.5194/acp-15-10309-2015, 2015.
Herenz, P., Wex, H., Henning, S., Kristensen, T. B., Rubach, F., Roth, A., Borrmann, S., Bozem, H., Schulz, H., and Stratmann, F.: Measurements of aerosol and CCN properties in the Mackenzie River delta (Canadian Arctic) during spring–summer transition in May 2014, Atmos. Chem. Phys., 18, 4477–4496, https://doi.org/10.5194/acp-18-4477-2018, 2018.
Hirdman, D., Burkhart, J. F., Sodemann, H., Eckhardt, S., Jefferson, A., Quinn, P. K., Sharma, S., Ström, J., and Stohl, A.: Long-term trends of black carbon and sulphate aerosol in the Arctic: changes in atmospheric transport and source region emissions, Atmos. Chem. Phys., 10, 9351–9368, https://doi.org/10.5194/acp-10-9351-2010, 2010.
Hoyle, C. R., Webster, C. S., Rieder, H. E., Nenes, A., Hammer, E., Herrmann, E., Gysel, M., Bukowiecki, N., Weingartner, E., Steinbacher, M., and Baltensperger, U.: Chemical and physical influences on aerosol activation in liquid clouds: a study based on observations from the Jungfraujoch, Switzerland, Atmos. Chem. Phys., 16, 4043–4061, https://doi.org/10.5194/acp-16-4043-2016, 2016.
Intrieri, J. M., Fairall, C. W., Shupe, M. D., Persson, P. O. G., Andreas, E. L., Guest, P. S., and Moritz, R. E.: An annual cycle of Arctic surface cloud forcing at SHEBA, J. Geophys. Res.-Oceans, 107, SHE 13-1–SHE 13-14, https://doi.org/10.1029/2000JC000439, 2002.
Jensen, J. B. and Charlson, R. J.: On the efficiency of nucleation scavenging, Tellus B, 36, 367–375, https://doi.org/10.3402/tellusb.v36i5.14917, 1984.
Jung, C. H., Yoon, Y. J., Kang, H. J., Gim, Y., Lee, B. Y., Ström, J., Krejci, R., and Tunved, P.: The seasonal characteristics of cloud condensation nuclei (CCN) in the arctic lower troposphere, Tellus B, 70, 1–13, https://doi.org/10.1080/16000889.2018.1513291, 2018.
Kacarab, M., Thornhill, K. L., Dobracki, A., Howell, S. G., O'Brien, J. R., Freitag, S., Poellot, M. R., Wood, R., Zuidema, P., Redemann, J., and Nenes, A.: Biomass burning aerosol as a modulator of the droplet number in the southeast Atlantic region, Atmos. Chem. Phys., 20, 3029–3040, https://doi.org/10.5194/acp-20-3029-2020, 2020.
Kammermann, L., Gysel, M., Weingartner, E., Herich, H., Cziczo, D. J., Holst, T., Svenningsson, B., Arneth, A., and Baltensperger, U.: Subarctic atmospheric aerosol composition: 3. Measured and modeled properties of cloud condensation nuclei, J. Geophys. Res.-Atmos., 115, https://doi.org/10.1029/2009JD012447, 2010.
Karlsson, L., Krejci, R., Koike, M., Ebell, K., and Zieger, P.: A long-term study of cloud residuals from low-level Arctic clouds, Atmos. Chem. Phys., 21, 8933–8959, https://doi.org/10.5194/acp-21-8933-2021, 2021.
Koike, M., Ukita, J., Ström, J., Tunved, P., Shiobara, M., Vitale, V., Lupi, A., Baumgardner, D., Ritter, C., Hermansen, O., Yamada, K., and Pedersen, C. A.: Year-Round In Situ Measurements of Arctic Low-Level Clouds: Microphysical Properties and Their Relationships With Aerosols, J. Geophys. Res.-Atmos., 124, 1798–1822, https://doi.org/10.1029/2018JD029802, 2019.
Korolev, A. and Leisner, T.: Review of experimental studies of secondary ice production, Atmos. Chem. Phys., 20, 11767–11797, https://doi.org/10.5194/acp-20-11767-2020, 2020.
Korolev, A., McFarquhar, G., Field, P. R., Franklin, C., Lawson, P., Wang, Z., Williams, E., Abel, S. J., Axisa, D., Borrmann, S., Crosier, J., Fugal, J., Krämer, M., Lohmann, U., Schlenczek, O., Schnaiter, M., and Wendisch, M.: Mixed-Phase Clouds: Progress and Challenges, Meteorol. Monogr., 58, 5.1–5.50, https://doi.org/10.1175/AMSMONOGRAPHS-D-17-0001.1, 2017.
Lance, S., Shupe, M. D., Feingold, G., Brock, C. A., Cozic, J., Holloway, J. S., Moore, R. H., Nenes, A., Schwarz, J. P., Spackman, J. R., Froyd, K. D., Murphy, D. M., Brioude, J., Cooper, O. R., Stohl, A., and Burkhart, J. F.: Cloud condensation nuclei as a modulator of ice processes in Arctic mixed-phase clouds, Atmos. Chem. Phys., 11, 8003–8015, https://doi.org/10.5194/acp-11-8003-2011, 2011.
Lathem, T. L., Beyersdorf, A. J., Thornhill, K. L., Winstead, E. L., Cubison, M. J., Hecobian, A., Jimenez, J. L., Weber, R. J., Anderson, B. E., and Nenes, A.: Analysis of CCN activity of Arctic aerosol and Canadian biomass burning during summer 2008, Atmos. Chem. Phys., 13, 2735–2756, https://doi.org/10.5194/acp-13-2735-2013, 2013.
Lawson, R. P., Stamnes, K., Stamnes, J., Zmarzly, P., Koskuliks, J., Roden, C., Mo, Q., Carrithers, M., and Bland, G. L.: Deployment of a Tethered-Balloon System for Microphysics and Radiative Measurements in Mixed-Phase Clouds at Ny-Ålesund and South Pole, J. Atmos. Ocean. Tech., 28, 656–670, https://doi.org/10.1175/2010JTECHA1439.1, 2011.
Leaitch, W. R., Korolev, A., Aliabadi, A. A., Burkart, J., Willis, M. D., Abbatt, J. P. D., Bozem, H., Hoor, P., Köllner, F., Schneider, J., Herber, A., Konrad, C., and Brauner, R.: Effects of 20–100 nm particles on liquid clouds in the clean summertime Arctic, Atmos. Chem. Phys., 16, 11107–11124, https://doi.org/10.5194/acp-16-11107-2016, 2016.
Liu, Z., Barlow, J. F., Chan, P.-W., Fung, J. C. H., Li, Y., Ren, C., Mak, H. W. L., and Ng, E.: A Review of Progress and Applications of Pulsed Doppler Wind LiDARs, Remote Sens.-Basel, 11, 2522, https://doi.org/10.3390/rs11212522, 2019.
Martin, M., Chang, R. Y.-W., Sierau, B., Sjogren, S., Swietlicki, E., Abbatt, J. P. D., Leck, C., and Lohmann, U.: Cloud condensation nuclei closure study on summer arctic aerosol, Atmos. Chem. Phys., 11, 11335–11350, https://doi.org/10.5194/acp-11-11335-2011, 2011.
Massling, A., Lange, R., Pernov, J. B., Gosewinkel, U., Sørensen, L.-L., and Skov, H.: Measurement report: High Arctic aerosol hygroscopicity at sub- and supersaturated conditions during spring and summer, Atmos. Chem. Phys., 23, 4931–4953, https://doi.org/10.5194/acp-23-4931-2023, 2023.
Maturilli, M., Herber, A., and König-Langlo, G.: Surface radiation climatology for Ny-Ålesund, Svalbard (78.9∘ N), basic observations for trend detection, Theor. Appl. Climatol., 120, 331–339, https://doi.org/10.1007/s00704-014-1173-4, 2015.
Maturilli, M., Hanssen-Bauer, I., Neuber, R., Rex, M., and Edvardsen, K.: The Atmosphere Above Ny-Ålesund: Climate and Global Warming, Ozone and Surface UV Radiation, in: The Ecosystem of Kongsfjorden, Svalbard, edited by: Hop, H. and Wiencke, C., Springer International Publishing, Cham, 23–46, https://doi.org/10.1007/978-3-319-46425-1_2, 2019.
Mauritsen, T., Sedlar, J., Tjernström, M., Leck, C., Martin, M., Shupe, M., Sjogren, S., Sierau, B., Persson, P. O. G., Brooks, I. M., and Swietlicki, E.: An Arctic CCN-limited cloud-aerosol regime, Atmos. Chem. Phys., 11, 165–173, https://doi.org/10.5194/acp-11-165-2011, 2011.
Mioche, G., Jourdan, O., Ceccaldi, M., and Delanoë, J.: Variability of mixed-phase clouds in the Arctic with a focus on the Svalbard region: a study based on spaceborne active remote sensing, Atmos. Chem. Phys., 15, 2445–2461, https://doi.org/10.5194/acp-15-2445-2015, 2015.
Moore, R. H., Bahreini, R., Brock, C. A., Froyd, K. D., Cozic, J., Holloway, J. S., Middlebrook, A. M., Murphy, D. M., and Nenes, A.: Hygroscopicity and composition of Alaskan Arctic CCN during April 2008, Atmos. Chem. Phys., 11, 11807–11825, https://doi.org/10.5194/acp-11-11807-2011, 2011.
Morales Betancourt, R. and Nenes, A.: Droplet activation parameterization: the population-splitting concept revisited, Geosci. Model Dev., 7, 2345–2357, https://doi.org/10.5194/gmd-7-2345-2014, 2014.
Motos, G.: NASCENT campaign data for Motos et al. 2023, EnviDat [data set], https://doi.org/10.16904/envidat.438, 2023.
Najafi, M. R., Zwiers, F. W., and Gillett, N. P.: Attribution of Arctic temperature change to greenhouse-gas and aerosol influences, Nat. Clim. Change, 5, 246–249, https://doi.org/10.1038/nclimate2524, 2015.
Nenes, A. and Seinfeld, J. H.: Parameterization of cloud droplet formation in global climate models, J. Geophys. Res.-Atmos., 108, https://doi.org/10.1029/2002JD002911, 2003.
Nenes, A., Ghan, S., Abdul-Razzak, H., Chuang, P. Y., and Seinfeld, J. H.: Kinetic limitations on cloud droplet formation and impact on cloud albedo, Tellus B, 53, 133–149, https://doi.org/10.3402/tellusb.v53i2.16569, 2001.
Nomokonova, T., Ebell, K., Löhnert, U., Maturilli, M., Ritter, C., and O'Connor, E.: Statistics on clouds and their relation to thermodynamic conditions at Ny-Ålesund using ground-based sensor synergy, Atmos. Chem. Phys., 19, 4105–4126, https://doi.org/10.5194/acp-19-4105-2019, 2019.
Norgren, M. S., de Boer, G., and Shupe, M. D.: Observed aerosol suppression of cloud ice in low-level Arctic mixed-phase clouds, Atmos. Chem. Phys., 18, 13345–13361, https://doi.org/10.5194/acp-18-13345-2018, 2018.
Ohata, S., Mori, T., Kondo, Y., Sharma, S., Hyvärinen, A., Andrews, E., Tunved, P., Asmi, E., Backman, J., Servomaa, H., Veber, D., Eleftheriadis, K., Vratolis, S., Krejci, R., Zieger, P., Koike, M., Kanaya, Y., Yoshida, A., Moteki, N., Zhao, Y., Tobo, Y., Matsushita, J., and Oshima, N.: Estimates of mass absorption cross sections of black carbon for filter-based absorption photometers in the Arctic, Atmos. Meas. Tech., 14, 6723–6748, https://doi.org/10.5194/amt-14-6723-2021, 2021.
Park, K.-T., Yoon, Y. J., Lee, K., Tunved, P., Krejci, R., Ström, J., Jang, E., Kang, H. J., Jang, S., Park, J., Lee, B. Y., Traversi, R., Becagli, S., and Hermansen, O.: Dimethyl Sulfide-Induced Increase in Cloud Condensation Nuclei in the Arctic Atmosphere, Global Biogeochem. Cy., 35, e2021GB006969, https://doi.org/10.1029/2021GB006969, 2021.
Pasquier, J. T., Henneberger, J., Ramelli, F., Lauber, A., David, R. O., Wieder, J., Carlsen, T., Gierens, R., Maturilli, M., and Lohmann, U.: Conditions favorable for secondary ice production in Arctic mixed-phase clouds, Atmos. Chem. Phys., 22, 15579–15601, https://doi.org/10.5194/acp-22-15579-2022, 2022a.
Pasquier, J. T., David, R. O., Freitas, G., Gierens, R., Gramlich, Y., Haslett, S., Li, G., Schäfer, B., Siegel, K., Wieder, J., Adachi, K., Belosi, F., Carlsen, T., Decesari, S., Ebell, K., Gilardoni, S., Gysel-Beer, M., Henneberger, J., Inoue, J., Kanji, Z. A., Koike, M., Kondo, Y., Krejci, R., Lohmann, U., Maturilli, M., Mazzolla, M., Modini, R., Mohr, C., Motos, G., Nenes, A., Nicosia, A., Ohata, S., Paglione, M., Park, S., Pileci, R. E., Ramelli, F., Rinaldi, M., Ritter, C., Sato, K., Storelvmo, T., Tobo, Y., Traversi, R., Viola, A., and Zieger, P.: The Ny-Ålesund Aerosol Cloud Experiment (NASCENT): Overview and First Results, B. Am. Meteor. Soc., 1, https://doi.org/10.1175/BAMS-D-21-0034.1, 2022b.
Petters, M. D. and Kreidenweis, S. M.: A single parameter representation of hygroscopic growth and cloud condensation nucleus activity, Atmos. Chem. Phys., 7, 1961–1971, https://doi.org/10.5194/acp-7-1961-2007, 2007.
Platt, S. M., Hov, Ø., Berg, T., Breivik, K., Eckhardt, S., Eleftheriadis, K., Evangeliou, N., Fiebig, M., Fisher, R., Hansen, G., Hansson, H.-C., Heintzenberg, J., Hermansen, O., Heslin-Rees, D., Holmén, K., Hudson, S., Kallenborn, R., Krejci, R., Krognes, T., Larssen, S., Lowry, D., Lund Myhre, C., Lunder, C., Nisbet, E., Nizzetto, P. B., Park, K.-T., Pedersen, C. A., Aspmo Pfaffhuber, K., Röckmann, T., Schmidbauer, N., Solberg, S., Stohl, A., Ström, J., Svendby, T., Tunved, P., Tørnkvist, K., van der Veen, C., Vratolis, S., Yoon, Y. J., Yttri, K. E., Zieger, P., Aas, W., and Tørseth, K.: Atmospheric composition in the European Arctic and 30 years of the Zeppelin Observatory, Ny-Ålesund, Atmos. Chem. Phys., 22, 3321–3369, https://doi.org/10.5194/acp-22-3321-2022, 2022.
Pöhlker, M. L., Zhang, M., Campos Braga, R., Krüger, O. O., Pöschl, U., and Ervens, B.: Aitken mode particles as CCN in aerosol- and updraft-sensitive regimes of cloud droplet formation, Atmos. Chem. Phys., 21, 11723–11740, https://doi.org/10.5194/acp-21-11723-2021, 2021.
Rahn, K. A.: Relative importances of North America and Eurasia as sources of arctic aerosol, Atmos. Environ., 15, 1447–1455, https://doi.org/10.1016/0004-6981(81)90351-6, 1981.
Ramelli, F., Beck, A., Henneberger, J., and Lohmann, U.: Using a holographic imager on a tethered balloon system for microphysical observations of boundary layer clouds, Atmos. Meas. Tech., 13, 925–939, https://doi.org/10.5194/amt-13-925-2020, 2020.
Rantanen, M., Karpechko, A. Y., Lipponen, A., Nordling, K., Hyvärinen, O., Ruosteenoja, K., Vihma, T., and Laaksonen, A.: The Arctic has warmed nearly four times faster than the globe since 1979, Commun. Earth Environ., 3, 1–10, https://doi.org/10.1038/s43247-022-00498-3, 2022.
Rastak, N., Silvergren, S., Zieger, P., Wideqvist, U., Ström, J., Svenningsson, B., Maturilli, M., Tesche, M., Ekman, A. M. L., Tunved, P., and Riipinen, I.: Seasonal variation of aerosol water uptake and its impact on the direct radiative effect at Ny-Ålesund, Svalbard, Atmos. Chem. Phys., 14, 7445–7460, https://doi.org/10.5194/acp-14-7445-2014, 2014.
Reutter, P., Su, H., Trentmann, J., Simmel, M., Rose, D., Gunthe, S. S., Wernli, H., Andreae, M. O., and Pöschl, U.: Aerosol- and updraft-limited regimes of cloud droplet formation: influence of particle number, size and hygroscopicity on the activation of cloud condensation nuclei (CCN), Atmos. Chem. Phys., 9, 7067–7080, https://doi.org/10.5194/acp-9-7067-2009, 2009.
Seinfeld, J. H., Bretherton, C., Carslaw, K. S., Coe, H., DeMott, P. J., Dunlea, E. J., Feingold, G., Ghan, S., Guenther, A. B., Kahn, R., Kraucunas, I., Kreidenweis, S. M., Molina, M. J., Nenes, A., Penner, J. E., Prather, K. A., Ramanathan, V., Ramaswamy, V., Rasch, P. J., Ravishankara, A. R., Rosenfeld, D., Stephens, G., and Wood, R.: Improving our fundamental understanding of the role of aerosol-cloud interactions in the climate system, P. Natl. Acad. Sci. USA, 113, 5781–5790, https://doi.org/10.1073/pnas.1514043113, 2016.
Shupe, M. D. and Intrieri, J. M.: Cloud Radiative Forcing of the Arctic Surface: The Influence of Cloud Properties, Surface Albedo, and Solar Zenith Angle, J. Climate, 17, 616–628, https://doi.org/10.1175/1520-0442(2004)017<0616:CRFOTA>2.0.CO;2, 2004.
Shupe, M. D., Daniel, J. S., Boer, G. de, Eloranta, E. W., Kollias, P., Long, C. N., Luke, E. P., Turner, D. D., and Verlinde, J.: A Focus On Mixed-Phase Clouds: The Status of Ground-Based Observational Methods, B. Am. Meteor. Soc., 89, 1549–1562, https://doi.org/10.1175/2008BAMS2378.1, 2008a.
Shupe, M. D., Kollias, P., Persson, P. O. G., and McFarquhar, G. M.: Vertical Motions in Arctic Mixed-Phase Stratiform Clouds, J. Atmos. Sci., 65, 1304–1322, https://doi.org/10.1175/2007JAS2479.1, 2008b.
Siegel, K., Neuberger, A., Karlsson, L., Zieger, P., Mattsson, F., Duplessis, P., Dada, L., Daellenbach, K., Schmale, J., Baccarini, A., Krejci, R., Svenningsson, B., Chang, R., Ekman, A. M. L., Riipinen, I., and Mohr, C.: Using Novel Molecular-Level Chemical Composition Observations of High Arctic Organic Aerosol for Predictions of Cloud Condensation Nuclei, Environ. Sci. Technol., 56, 13888–13899, https://doi.org/10.1021/acs.est.2c02162, 2022.
Sotiropoulou, G., Tjernström, M., Sedlar, J., Achtert, P., Brooks, B. J., Brooks, I. M., Persson, P. O. G., Prytherch, J., Salisbury, D. J., Shupe, M. D., Johnston, P. E., and Wolfe, D.: Atmospheric Conditions during the Arctic Clouds in Summer Experiment (ACSE): Contrasting Open Water and Sea Ice Surfaces during Melt and Freeze-Up Seasons, J. Climate, 29, 8721–8744, https://doi.org/10.1175/JCLI-D-16-0211.1, 2016.
Ström, J., Umegård, J., Tørseth, K., Tunved, P., Hansson, H.-C., Holmén, K., Wismann, V., Herber, A., and König-Langlo, G.: One year of particle size distribution and aerosol chemical composition measurements at the Zeppelin Station, Svalbard, March 2000–March 2001, Phys. Chem. Earth, 28, 1181–1190, https://doi.org/10.1016/j.pce.2003.08.058, 2003.
Ström, J., Engvall, A. C., Delbart, F., Krejci, R., and Treffeisen, R.: On small particles in the Arctic summer boundary layer: observations at two different heights near Ny-Ålesund, Svalbard, Tellus B, 61, 473–482, https://doi.org/10.3402/tellusb.v61i2.16845, 2009.
Tan, I. and Storelvmo, T.: Evidence of Strong Contributions From Mixed-Phase Clouds to Arctic Climate Change, Geophys. Res. Lett., 46, 2894–2902, https://doi.org/10.1029/2018GL081871, 2019.
Tjernström, M., Leck, C., Birch, C. E., Bottenheim, J. W., Brooks, B. J., Brooks, I. M., Bäcklin, L., Chang, R. Y.-W., de Leeuw, G., Di Liberto, L., de la Rosa, S., Granath, E., Graus, M., Hansel, A., Heintzenberg, J., Held, A., Hind, A., Johnston, P., Knulst, J., Martin, M., Matrai, P. A., Mauritsen, T., Müller, M., Norris, S. J., Orellana, M. V., Orsini, D. A., Paatero, J., Persson, P. O. G., Gao, Q., Rauschenberg, C., Ristovski, Z., Sedlar, J., Shupe, M. D., Sierau, B., Sirevaag, A., Sjogren, S., Stetzer, O., Swietlicki, E., Szczodrak, M., Vaattovaara, P., Wahlberg, N., Westberg, M., and Wheeler, C. R.: The Arctic Summer Cloud Ocean Study (ASCOS): overview and experimental design, Atmos. Chem. Phys., 14, 2823–2869, https://doi.org/10.5194/acp-14-2823-2014, 2014.
Touloupas, G., Lauber, A., Henneberger, J., Beck, A., and Lucchi, A.: A convolutional neural network for classifying cloud particles recorded by imaging probes, Atmos. Meas. Tech., 13, 2219–2239, https://doi.org/10.5194/amt-13-2219-2020, 2020.
Tunved, P., Ström, J., and Krejci, R.: Arctic aerosol life cycle: linking aerosol size distributions observed between 2000 and 2010 with air mass transport and precipitation at Zeppelin station, Ny-Ålesund, Svalbard, Atmos. Chem. Phys., 13, 3643–3660, https://doi.org/10.5194/acp-13-3643-2013, 2013.
Turpin, B. J. and Lim, H.-J.: Species Contributions to PM2.5 Mass Concentrations: Revisiting Common Assumptions for Estimating Organic Mass, Aerosol Sci. Technol., 35, 602–610, https://doi.org/10.1080/02786820119445, 2001.
Twomey, S. and Jennings, S. G. (Eds.): Radiative properties of clouds, United States: Univ of Arizona Press, 25006118, 25, 1993.
Vincent, W. F.: Arctic Climate Change: Local Impacts, Global Consequences, and Policy Implications, in: The Palgrave Handbook of Arctic Policy and Politics, edited by: Coates, K. S. and Holroyd, C., Springer International Publishing, Cham, 507–526, https://doi.org/10.1007/978-3-030-20557-7_31, 2020.
von der Weiden, S.-L., Drewnick, F., and Borrmann, S.: Particle Loss Calculator – a new software tool for the assessment of the performance of aerosol inlet systems, Atmos. Meas. Tech., 2, 479–494, https://doi.org/10.5194/amt-2-479-2009, 2009.
Zábori, J., Rastak, N., Yoon, Y. J., Riipinen, I., and Ström, J.: Size-resolved cloud condensation nuclei concentration measurements in the Arctic: two case studies from the summer of 2008, Atmos. Chem. Phys., 15, 13803–13817, https://doi.org/10.5194/acp-15-13803-2015, 2015.
Zieger, P., Fierz-Schmidhauser, R., Gysel, M., Ström, J., Henne, S., Yttri, K. E., Baltensperger, U., and Weingartner, E.: Effects of relative humidity on aerosol light scattering in the Arctic, Atmos. Chem. Phys., 10, 3875–3890, https://doi.org/10.5194/acp-10-3875-2010, 2010.
Zieger, P., Väisänen, O., Corbin, J. C., Partridge, D. G., Bastelberger, S., Mousavi-Fard, M., Rosati, B., Gysel, M., Krieger, U. K., Leck, C., Nenes, A., Riipinen, I., Virtanen, A., and Salter, M. E.: Revising the hygroscopicity of inorganic sea salt particles, Nat. Commun., 8, 15883, https://doi.org/10.1038/ncomms15883, 2017.