the Creative Commons Attribution 4.0 License.
the Creative Commons Attribution 4.0 License.
 | 07 Nov 2023
Assessing the destructiveness of tropical cyclones induced by anthropogenic aerosols in an atmosphere–ocean coupled framework
Jen-Shan Hsieh
Jonathan H. Jiang
Lijun Zhao
Michael Lavallee
Intense tropical cyclones (TCs) can cause catastrophic damage to coastal regions after landfall. Recent studies have linked the devastation associated with TCs to climate change, which induces favorable conditions, such as increasing sea-surface temperature, to supercharge storms. Meanwhile, environmental factors, such as atmospheric aerosols, also impact the development and intensity of TCs, but their effects remain poorly understood, particularly coupled with ocean dynamics. Here, we quantitatively assess the aerosol microphysical effects and aerosol-modified ocean feedbacks during Hurricane Katrina using a cloud-resolving atmosphere–ocean coupled model: Weather Research and Forecasting (WRF) in conjunction with the Regional Ocean Model System (ROMS). Our model simulations reveal that an enhanced storm destructive power, as reflected by larger integrated kinetic energy, heavier precipitation, and higher sea-level rise, is linked to the combined effects of aerosols and ocean feedbacks. These effects further result in an expansion of the storm circulation with a reduced intensity because of a decreasing moist static energy supply and enhancing vorticity Rossby wave outward propagation. Both accumulated precipitation and storm surge are enhanced during the mature stage of the TC with elevated aerosol concentrations, implying exacerbated flood damage over the polluted coastal region. The ocean feedback following the aerosol microphysical effects tends to mitigate the vertical mixing cooling in the ocean mixing layer and offsets the aerosol-induced storm weakening by enhancing cloud and precipitation near the eyewall region. Our results highlight the importance of accounting for the effects of aerosol microphysics and ocean-coupling feedbacks to improve the forecast of TC destructiveness, particularly near the heavily polluted coastal regions along the Gulf of Mexico.
- Article
(14562 KB) - Full-text XML
-
Supplement
(1708 KB) - BibTeX
- EndNote


The destructive power of Hurricane Katrina, which struck New Orleans, Louisiana, in late August 2005, was measured by the maximum wind speed at landfall and the hundreds of kilometers of coastal area affected by a severe storm surge of more than 3 m. Hurricane Katrina progressed inland as a category-3 storm (with sustained winds of 194 km h−1) and generated a significant storm surge exceeding 10 m on the Mississippi coast and up to 6 m southeast of New Orleans, with up to 2 m of additional wave run-up in the most exposed locations (Fritz et al., 2007; NWS, 2016). The catastrophic damage associated with hurricanes in recent decades has emerged as evidence of the increasing devastation of tropical cyclones (TCs) with climate change (Emanuel, 2005, 2017; Knutson et al., 2019; van Oldenborgh et al., 2017), which induces favorable environmental conditions (such as increasing sea-surface temperature – SST) to supercharge hurricanes and increase the risk of major damage (Trenberth et al., 2018). Another key feature of TCs is the efficient formation of hydrometeors and large latent heat release that fuel TC development and destructive power via strong winds, heavy precipitation, storm surges, and flooding (Pan et al., 2020). Currently, the effects of the abovementioned factors on the destructive power of TCs remain to be quantified and isolated.
Compelling evidence, from both observational and modeling perspectives, now exists that natural and anthropogenic aerosols play critical roles in the genesis and development of TCs (Khain et al., 2010; Herbener et al., 2014; Khain et al., 2016; Pan et al., 2018; Sun and Zhao, 2020; Rosenfeld et al., 2012; Wang et al., 2014). By acting as cloud condensation nuclei (CCN), aerosol particles can lower the supersaturation requirements for cloud formation (Fan et al., 2018; Wang et al., 2011). A previous modeling study demonstrated that high aerosol levels invigorate rainbands and increase precipitation, but they decrease the eyewall strength (Zhang et al., 2009; Khain et al., 2010; Rosenfeld et al., 2012; Wang et al., 2014). Particularly for Hurricane Katrina, Khain et al. (2008, 2010) and Wang et al. (2014) found that aerosols can enhance cloud formation at the hurricane periphery by enhancing the convection over the periphery, but they suppress the convection over the eyewall, and, therefore, weaken the hurricane intensity. Another recent observational analysis also corroborated that anthropogenic aerosols enlarge the rainfall area of TCs over the northwestern Pacific (Zhao et al., 2018). However, the aerosol microphysical effects are not represented in most operational forecast models, such as the Hurricane Weather Research and Forecasting (HWRF) model, as the number concentrations of CCN/cloud droplets are prescribed in the microphysics schemes for simulating cloud formation and development in TCs (Zhang et al., 2018). Additionally, the pristine maritime level of the CCN/cloud droplets prescribed in those models (Zhang et al., 2018) greatly underrepresented the aerosol condition over land (Zhang et al., 2015). In addition to being a major metropolitan area for New Orleans, the coastal areas along the Gulf of Mexico host many industrial facilities, i.e., power plants, chemical manufacturing plants, and petroleum refineries, that release large industrial emissions of anthropogenic aerosols (Fan et al., 2005, 2006; Levy et al., 2013) which have been shown to considerably influence convection, lightning, and precipitation (Orville et al., 2001; Fan et al., 2007a, b; Li et al., 2009). More recently, Souri et al. (2020) reported that the aerosols over Houston tend to cause a moderate increase in precipitation, but their reference simulation was not comprehensively evaluated by observations.
Air–sea interaction represents another crucial determining factor of TC storm intensity and structure (Black et al., 2007; Emanuel, 1986; Green and Zhang, 2013; Liu et al., 1979). One such typical air–sea interaction is sea-surface cooling due to vertical mixing, sometimes due to Ekman upwelling when storms move slowly (as TCs pass by the ocean), which can lead to a negative feedback on storm intensity because the cooler deep-ocean temperature underneath the TC suppresses heat and moisture transfer from the ocean surface to the storm circulation and eventually weakens the storm (Bender et al., 1993; Khain and Ginis, 1991; Ma et al., 2013; Schade and Emanuel, 1999). In addition to modulating storm intensity, the change in SST can also alter the storm size and precipitation features (Chavas et al., 2016; Lin et al., 2015). As such, the inclusion of air–sea interaction into models could have profound impacts on TC simulations (Bender and Ginis, 2000).
Most previous modeling studies have adopted either fixed or prescribed SST from reanalysis data to drive TC simulations (e.g., Zhang et al., 2009; Rosenfeld et al., 2011; Wang et al., 2014); this has likely led to significant biases with respect to evaluating aerosol effects on TC storms due to the absence of ocean feedbacks. Recently, Lynn et al. (2016) and Khain et al. (2016) reported that both aerosols and ocean coupling showed significant effects on the development of Hurricane Irene, particularly on the timing of the hurricane's intensity evolution; however, their use of a 1-D ocean model coupled with the Weather Research and Forecasting (WRF) model appears to underestimate the SST cooling produced by the hurricane by about 1∘C relative to observations. One plausible reason for this is that the 1-D ocean model may be unable to accurately represent 3-D physical processes in the ocean mixing layer, such as convergence and its associated upwelling as a TC passes (Yablonsky and Ginis, 2009). Therefore, a 3-D ocean model coupled with an atmosphere model is a more advanced tool to obtain more accurate vertical mixing and/or upwelling cooling and, thus, a more accurate aerosol effect on TC power.
Omitting the air–sea interaction introduces biases into TC simulations, and there is still lack of studies on the aerosol effect on TCs that include ocean coupling. Therefore, it is necessary to improve the understanding of how ocean coupling interacts with TC evolution under external forcing and, if it plays a role, the extent to which ocean coupling can modify the aerosol effect on TC development. Therefore, the primary purpose of this study is to evaluate the ocean feedbacks following aerosol microphysical effects, particularly from a storm damage perspective, including precipitation and storm surges. To address these questions, we need an advanced modeling tool to accurately capture air–sea interactions, particularly the SST response in simulations. In this regard, we employ a 3-D atmosphere–ocean coupled cloud-resolving model, i.e., version 3.6 of the Advanced Research WRF model (Skamarock and Klemp, 2008) coupled with the Regional Ocean Modeling System (ROMS) (Patricola et al., 2012) to simulate the evolution of Hurricane Katrina (2005) with full consideration of air–sea interactions. The aerosol microphysical effect on the TC destructiveness is explicitly evaluated using an aerosol-aware two-moment bulk microphysical scheme (Li et al., 2008). Moreover, we evaluate the role of ocean coupling in the aerosol–hurricane system and the aerosol-induced ocean feedback by comparing coupled simulations with delicately designed uncoupled simulations. Hurricane Katrina is selected as the case study for this modeling work because it can serve our research goals well; in short, we aim to (1) evaluate the combined effects of aerosol and ocean-coupling feedback on the destructiveness of a typical TC due to the most severe storm surge on record in the USA and (2) explore the individual role of ocean-coupling feedback in modulating the destructive power of the storm.
The aerosol-aware two-moment bulk microphysical scheme, developed at Texas A&M University (hereafter referred to as the TAMU scheme), is implemented into WRF to represent 32 microphysical processes and aerosol–cloud interactions (Li et al., 2008). The TAMU scheme has been employed to evaluate the aerosol microphysical effect on various systems, including the mesoscale convective system (Wang et al., 2011), the squall line (Li et al., 2009), TCs (Wang et al., 2014), and the continental cloud complex (Lin et al., 2016; Wang et al., 2018). The scheme contains five hydrometeor categories: cloud droplet, rain drop, ice crystal, snow, and graupel. The cloud droplet number concentration is prognostically predicted via the formation from aerosol activation based on the Köhler theory and the water vapor supersaturation computed by WRF. More detailed descriptions of the TAMU scheme can be found in Li et al. (2008). The effect of ice nuclei particles is not considered in the microphysical scheme used in our model.
Both WRF and ROMS are configured on the same Arakawa C grid at a 3 km resolution but with 50 and 35 vertical levels, respectively. The horizontal grid spacing of 3 km fulfills the minimum requirement to represent the dynamical and microphysical responses of hurricanes to aerosols (Rosenfeld et al., 2012). The WRF simulation domain covers the entire Gulf of Mexico and the southern portion of the USA (17–38∘ N, 75–100∘ W), whereas a slightly smaller domain is configured for ROMS (Fig. 1a). The atmospheric initial and boundary conditions for WRF are set up by interpolating the data of the 6-hourly National Centers for Environmental Prediction (NCEP) Climate Forecast System Reanalysis (CFSR) (Saha et al., 2010) to the 3 km WRF grid for the simulation period from 27 to 31 August 2005. The initial and boundary conditions for ROMS simulations of the same period of time are specified using the Hybrid Coordinate Ocean Model (HYCOM, https://www.hycom.org/, last access: 3 January 2023) Gulf of Mexico reanalysis dataset with a horizontal resolution of ∘. The same dataset is used to provide the SST over the oceanic regions outside of the ROMS domain.
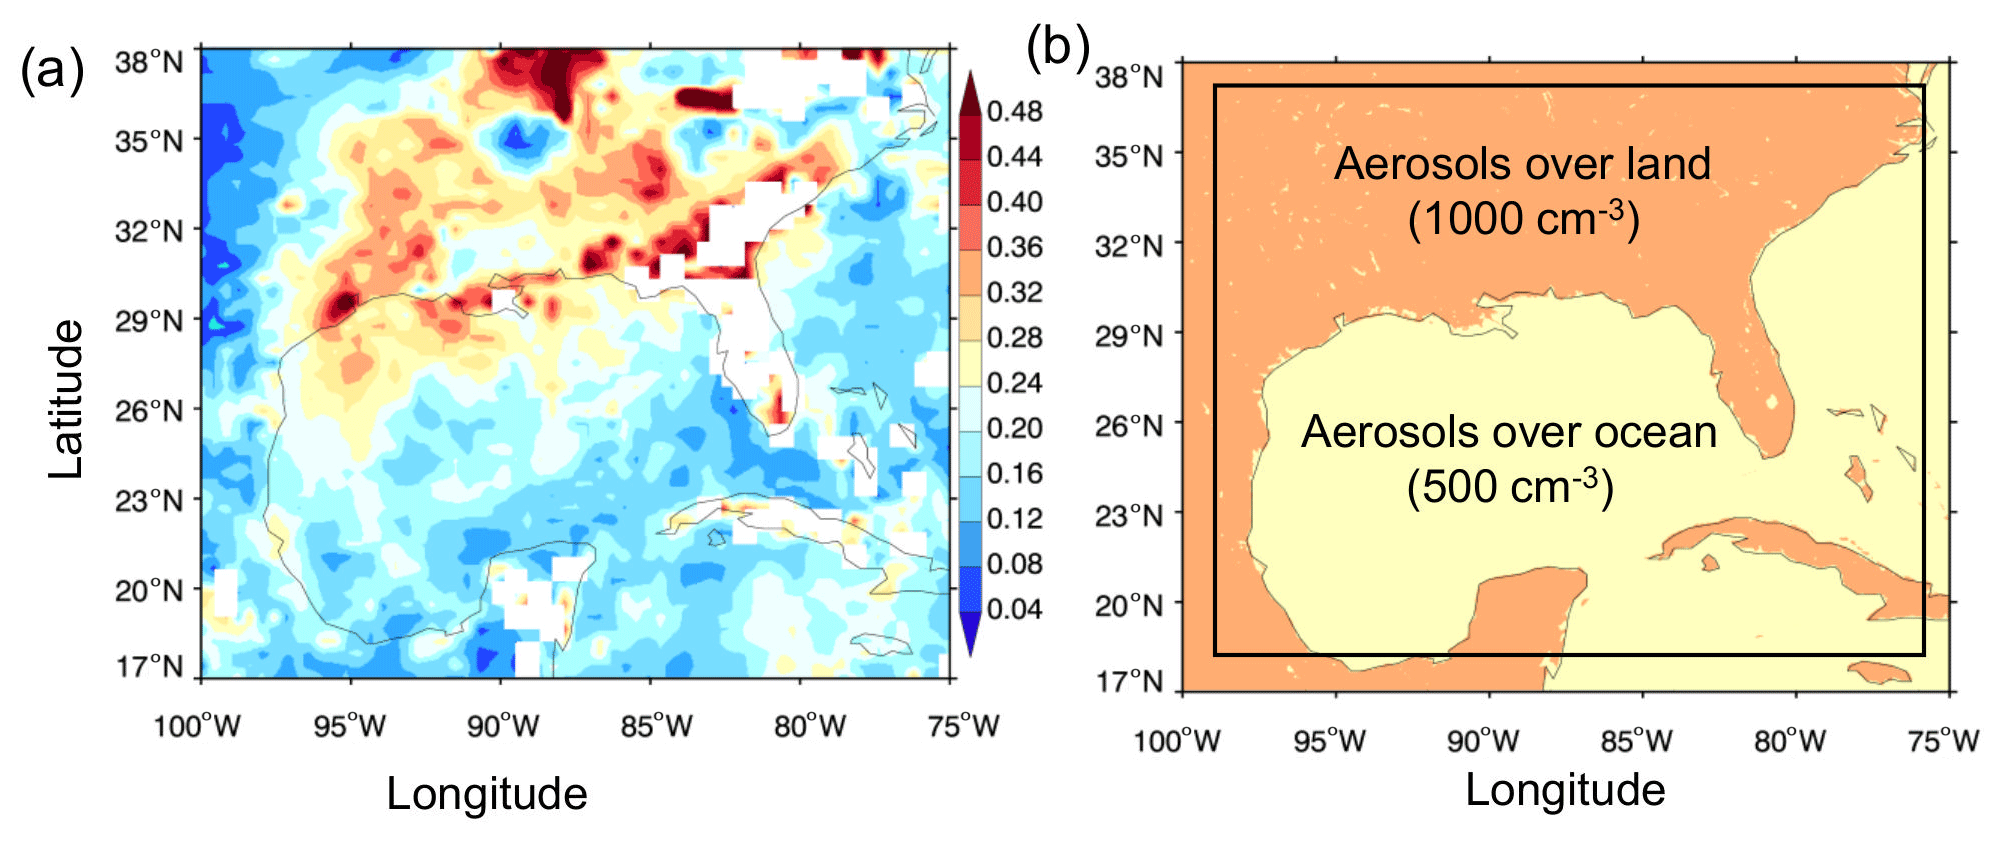
Figure 1(a) MODIS AOD distribution averaged over the period prior to and during the 2005 passage of Hurricane Katrina over the Gulf of Mexico (24–31 August). (b) The initial condition for aerosol concentrations with the land–ocean contrast for the polluted case in cloud-resolving Weather Research and Forecasting (CR-WRF). The black square in panel (b) denotes the ROMS model domain.
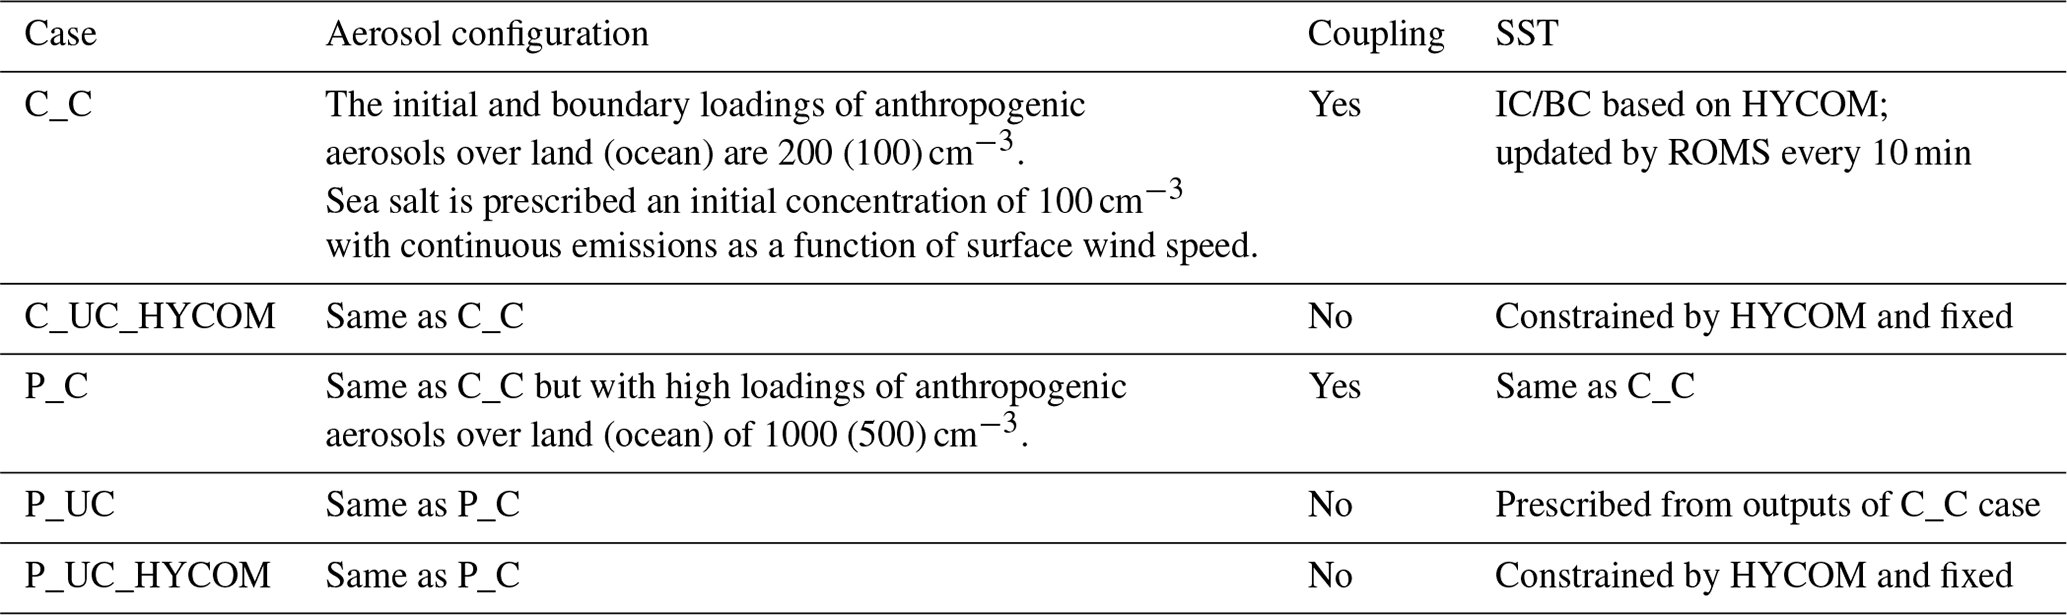
We carry out three primary experiments to examine the combined effects of aerosols and air–sea coupling and to compare their relative importance in an aerosol–hurricane–ocean coupled system. Based on Moderate Resolution Imaging Spectroradiometer (MODIS) aerosol optical depth (AOD) measurements, averaged over the periods prior to and during Hurricane Katrina's passage over the Gulf of Mexico (24–31 August) in 2005, it was found that there is a clear land–ocean contrast in the aerosol spatial distribution (Fig. 1a), i.e., the concentration over land is 2-fold that over the ocean. As such, the horizontal distribution of the initial aerosol number concentration in simulations mimics the land–ocean contrast as observed in the AOD distribution. Over land and ocean, the aerosol concentration was uniformly distributed. The initial and boundary aerosol concentration setups for both clean and polluted conditions follow Wang et al. (2014). The three experiments in this study are listed in Table 1 and are as follows: (1) a coupled experiment with an initial and boundary aerosol concentration of 200 cm−3 (100 cm−3) over land (ocean) at the surface level, representing a typical clean maritime environment (hereafter referred to as the C_C case); (2) a coupled experiment with an initial and boundary aerosol concentration of 1000 cm−3 (500 cm−3) over land (ocean) (hereafter referred to as the P_C case), as shown in Fig. 1b; and (3) an uncoupled experiment with prescribed SST obtained from the C_C case and with aerosol settings the same as the P_C case (hereafter referred to as the P_UC case), which is used together with the P_C case to isolate the aerosol-induced ocean feedbacks on TC development. As such, the initial aerosol concentrations in all polluted simulations are 5 times higher than those in all clean cases. With a similar model configuration, Wang et al. (2014) reported that this 5-fold aerosol concentration contrast between clean and polluted conditions shows a clear signature of aerosol effect in TC development. In order to evaluate the impacts of ocean coupling itself on TC responses to aerosol loadings, we perform an additional pair of uncoupled simulations, namely, C_UC_HYCOM and P_UC_HYCOM, in which the SST was fixed and constrained by the HYCOM dataset and in which the exactly same aerosol settings were used as in the pair of coupled simulations, i.e., C_C and P_C (Table 1). To mimic the emissions from the continent, aerosols can be continuously advected from the lateral boundaries (Khain et al., 2010). An exponentially decreasing profile is assumed for the initial aerosol vertical distribution, following Wang et al. (2014) and similar to Khain et al. (2016).
Ammonium sulfate ((NH4)2SO4) is assumed to be the chemical component of polluted continental aerosols. In addition, given that sea salt is an important source of giant CCN in the central zone of the storm (Rosenfeld et al., 2012), we parameterize the emissions of sea salt (NaCl) as a function of surface wind speed in this study, following Binkowski and Roselle (2003) and Zhang et al. (2005). The initial concentration of sea salt is set equal to 100 cm−3 for all simulations, consistent with Khain et al. (2016) and Lynn et al. (2016). As the hurricane develops, more sea salt particles are generated by surface wind turbulence in the vicinity of the storm eyewall than in the outside regions, as the strengthening wind near the hurricane eyewall leads to more sea salt spray. Recent studies have suggested that sea salt particles may play an appreciable role in altering TCs (Shpund et al., 2019; Shi et al., 2021). For instance, Shpund et al. (2019) revealed that sea salt particles can give rise to additional droplets in the eyewall and may lead to a positive feedback in which the TC intensifies with an increase in the maximum wind speed. However, this effect is not taken into account in this study yet, as our focus is on the effect of polluted continental aerosols. The simulated AOD in the polluted case is about 0.55 at the domain boundaries and about 0.20 averaged over the inner domain, which are comparable values to the MODIS measurements in the Gulf of Mexico and the nearby coastal regions. Furthermore, the observed aerosol mass concentration over the Gulf of Mexico region is reported to be about 7 g m−3 based on field measurements (Bates et al., 2008; Levy et al., 2013), which is consistent with the polluted cases in this study. In addition, during hurricane development, e.g., at around 18:00 UTC on 27 August 2005 when MODIS measurements are available (not shown), it is found that the simulation and the MODIS retrieval show similarity in the spatial pattern, both displaying clear aerosol bands from the continent intruding into the storm system over the ocean.
To properly isolate individual effects of aerosols and ocean feedback from their combined effect, we examine the aerosol effect on TCs with and without proper ocean feedback by comparing the coupled simulations (C_C and P_C) with the uncoupled simulation prescribed with the SST obtained from our coupled C_C case (hereafter referred to as the P_UC case). The combined effects of aerosol and ocean coupling can be manifested by the differences between P_C and C_C. The independent effect of aerosols can be estimated by contrasting P_UC and C_C, given that the SST is identical in these two cases. The aerosol-modified ocean feedback, i.e., the modified ocean response to TCs when the aerosol effect is present, can be assessed by the differences between the results of the P_C and P_UC cases. Besides the aerosol-induced ocean responses, we are also interested in how and the extent to which the ocean coupling can modify the aerosol effect on TCs. In this regard, we perform a comparison of the differences between the changes in the uncoupled simulations (i.e., P_UC_HYCOM − C_UC_HYCOM) and the changes in the coupled simulations (i.e., P_C − C_C).
3.1 Vertical mixing cooling and storm intensity
The WRF–ROMS model used in this study generally performs well with respect to modeling Hurricane Katrina, compared to the observations. For example, the simulated storm track of the hurricane shows good agreement with the best track from the National Hurricane Center (NHC), particularly on 28–29 August 2005 (Fig. S1a in the Supplement). The radius of maximum wind (RMW) of the polluted storms on 29 August 2005 falls within the observed range of between 45 and 55 km (Fig. S1b; NHC, 2023). The simulations generally reproduce the typical features of Hurricane Katrina's evolution in terms of minimal sea-level pressure (SLP) and maximum surface wind speed (Fig. 2a, b), but the peak time is somehow delayed in both coupled or uncoupled polluted cases.
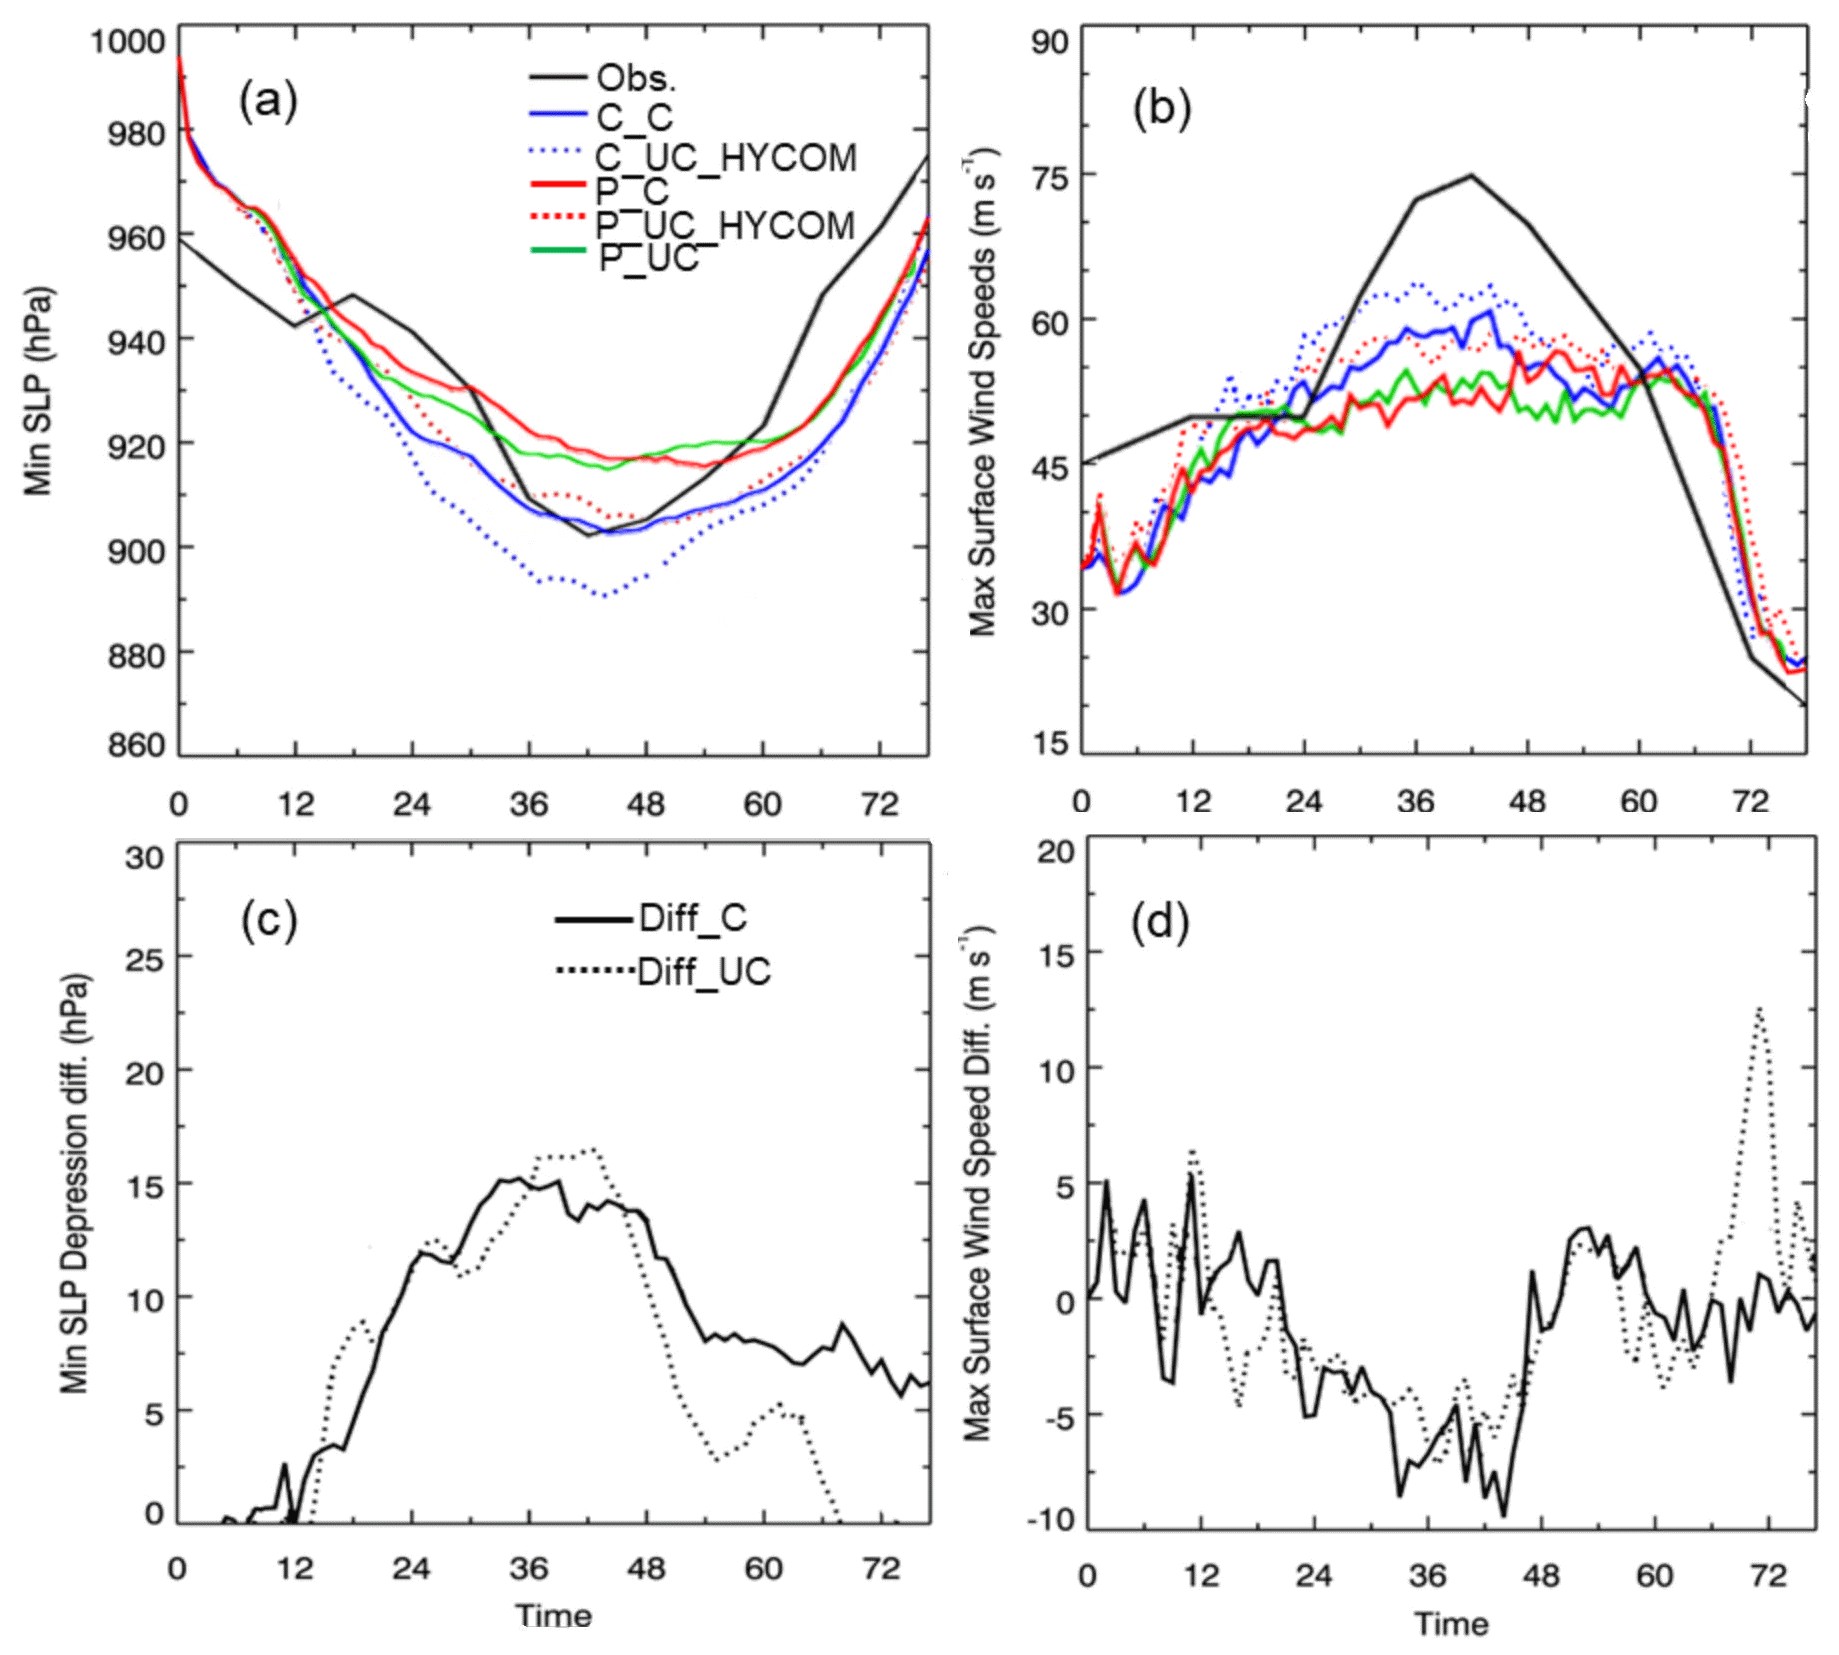
Figure 2The simulated and observed evolution of the hurricane in terms of (a) minimum sea-level pressure (SLP) and (b) maximum surface (10 m) wind speed for the coupled, i.e., C_C (solid blue lines) and P_C (solid red lines), and uncoupled, i.e., C_UC_HYCOM (dotted blue lines) and P_UC_HYCOM (dotted red lines), simulations as well the P_UC case (solid green line). The differences in minimum SLP (c) and maximum surface (10 m) wind speed (d) between clean and polluted simulation are shown for the coupled (Diff_C = P_C − C_C; solid lines) and uncoupled (Diff_UC = P_UC_HYCOM − C_UC_HYCOM; dotted lines) cases. The observations (black) in panels (a) and (b) are from the NHC Best Track Data.
The model also suitably captures the spatial shape of the cold band observed after Hurricane Katrina passed the Gulf of Mexico, as evident from the good match of the simulated SST cooling with the remote-sensing observations (Fig. S2). Moreover, it shows better performance than the reanalysis data of HYCOM (Fig. S2e, h). As the hurricane track of the polluted coupled case (P_C) generally follows that of the clean coupled case (C_C), the aerosol-modified ocean feedback in vertical mixing cooling can be approximately estimated by subtracting the simulated SST of the C_C case from that of the P_C case. Figure S2k displays the overall SST cooling difference between the P_C case and the C_C case just before landfall. The spatial pattern of the SST difference following the passages of the two simulated hurricanes demonstrates a slightly lagged ocean response, which shows that aerosols cause changes in the hurricane that induce less vertical mixing cooling (positive SST difference) near the storm inner core but more cooling away from the storm center. The vertical mixing cooling becomes discernible after 10 h in the coupled simulations with different aerosol concentrations (Fig. 3a, b). During the period of 10–30 h, the azimuthal mean SST difference between the P_C case and the C_C case shows weak positive and negative patches that change irregularly with time (Fig. 3c). Such an irregular pattern in the SST difference mainly results from the slightly southward shift (about 20–30 km) of a more wobbling hurricane track in the P_C case compared with the C_C case (Fig. S1a). In addition, the negative SST anomalies between 10 and 30 h are likely due to the track shift (blue and red solid curves in Fig. S2k) and the different storm translation speeds between the two cases (blue and red solid lines in Fig. 3c). The storm translation affects SST because vertical mixing and upwelling of cold deep-ocean water would be more sustained when the storm moved more slowly and, thus, the cooling could be stronger. As the storm moves forward, the SST responses induced by aerosols become more significant during 30–55 h, with notably less cooling over the region close to the storm's inner core (<50 km from the storm center) and more cooling over the region of the storm's periphery (100 km from the storm center).
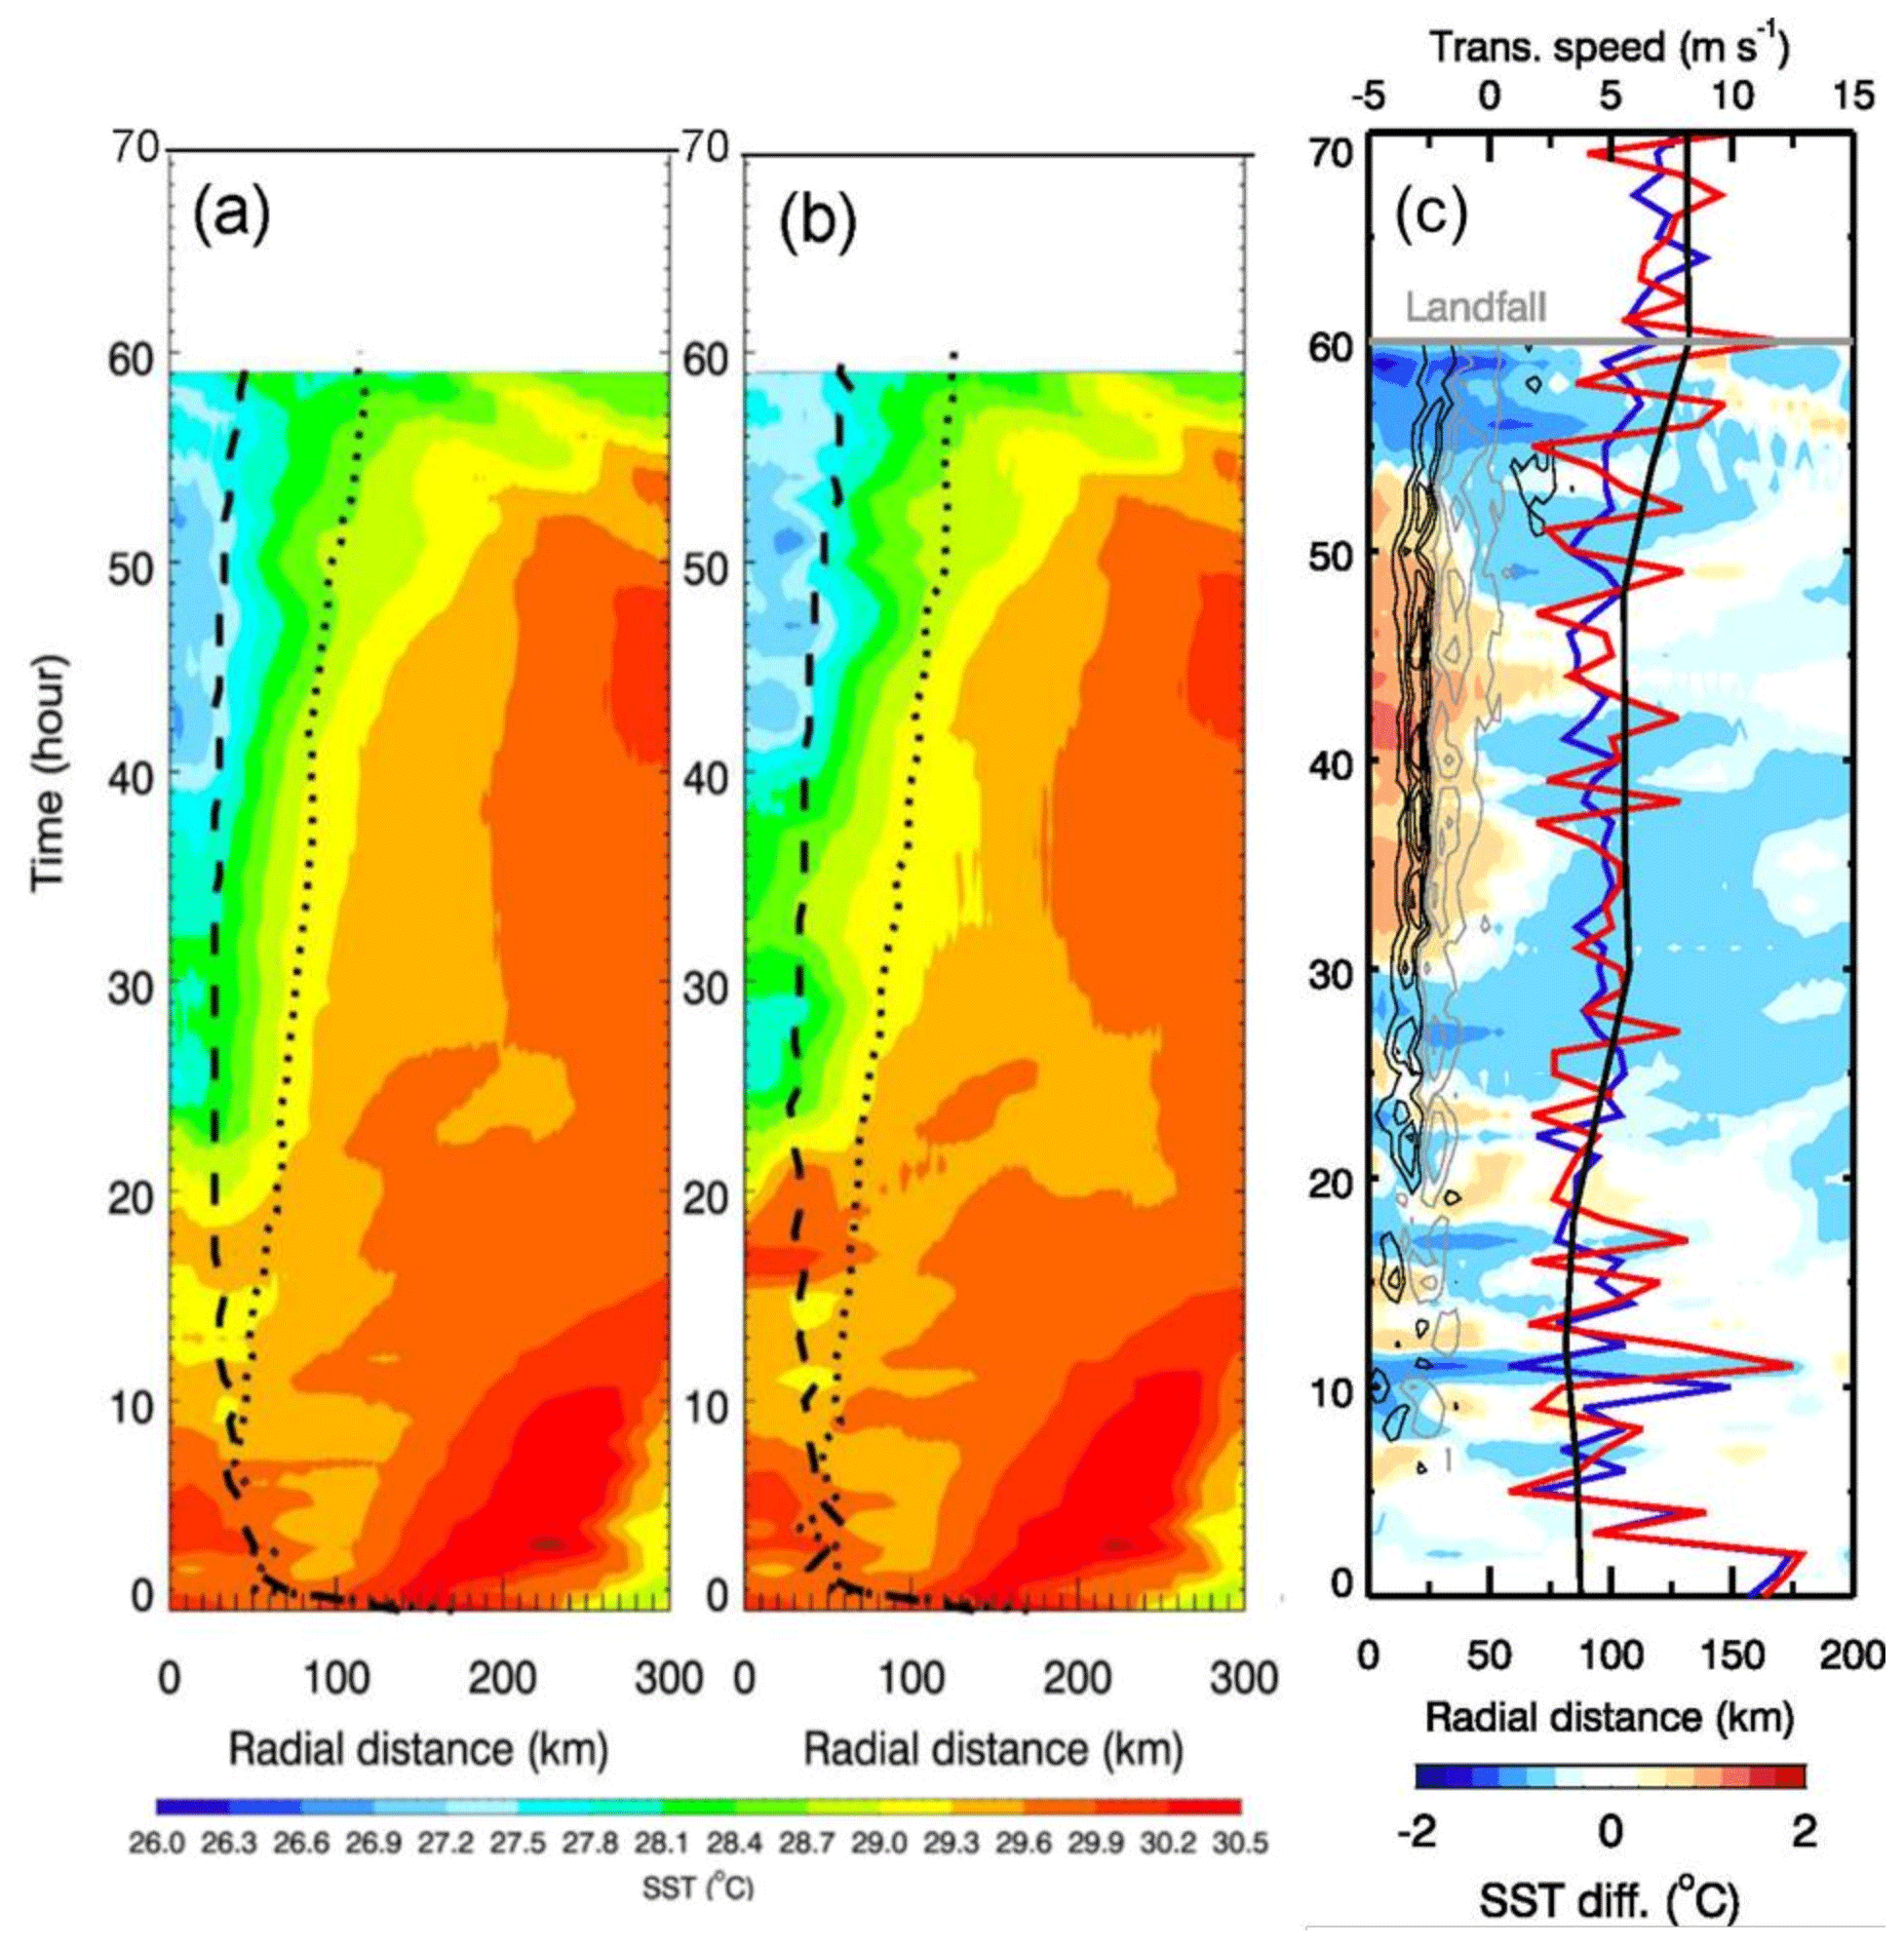
Figure 3Hovmöller diagrams of azimuthal mean SST fields for (a) C_C and (b) P_C as well as their differences (P_C − C_C). The solid and dashed lines throughout the entire hurricane lifecycle in panels (a)–(c) denote the RMW and the radii for the hurricane-force wind (>34 m s−1), respectively. Contour lines in panel (c) denote the changes in surface wind stress curl (with an interval of 0.25 N m−2; gray for positive and black for negative changes). The curves denote the hurricane translation speeds for the observations (black), C_C (blue), and P_C (red).
As for the storm intensity, the uncoupled clean case with prescribed HYCOM SST (i.e., C_UC_HYCOM) simulates the strongest storm. However, the storm intensity is then greatly reduced under polluted conditions even without ocean coupling (i.e., P_UC_HYCOM), which is associated with an aerosol weakening effect similar to that proposed previously (Khain et al., 2008, 2010; Rosenfeld et al., 2012; Wang et al., 2014). The advanced atmosphere–ocean coupled modeling framework enables us to assess the ocean-coupling effect and its feedback caused by the aerosol effect on TCs. Figure 3a and b show that the simulated storm intensity can be further significantly reduced by the ocean-coupling effect under both clean and polluted conditions. To quantify the ocean-coupling impact on the aerosol weakening effect, we derive the differences in minimal SLP and maximal surface wind speed between the clean and polluted simulations for both the uncoupled and coupled simulation pairs (Fig. 3c, d). It is found that the differences in minimal SLP and maximal surface wind speed for the coupled and uncoupled simulation pairs are similar before about 50 h, indicating that the ocean-coupling effect does not exert marked impacts on the storm intensity change caused by the aerosol effect during the developing and mature stages of the storm. As the storm starts to dissipate after 48 h (but before 60 h), the difference in minimal SLP (maximal surface wind speed) for the coupled simulation pair is larger (more negative) than for the uncoupled pair. In other words, the ocean-coupling effect during the storm dissipation stage (48–60 h) can sustain a longer and more significant aerosol weakening effect than the case without ocean coupling. In fact, the aerosol effect for the uncoupled simulations diminishes quickly as the TC dissipates, as the difference caused by the aerosol effect decreases to zero at a relatively fast rate (Fig. 3c).
The differences between the two polluted cases with and without ocean coupling (P_C and P_UC, respectively) denote the ocean-coupling feedbacks following aerosol microphysical effects, as both cases contain an aerosol weakening effect associated with a similar loading of aerosol pollution. Before the storm reaches its peak, the minimal SLP and maximal surface wind speed of P_UC are slightly larger than P_C, and this trend is reversed during the short period just after the storm peak. However, the relatively small differences in minimal SLP and maximal surface wind speed between P_UC and P_C indicate that the aerosol-modified ocean-coupling feedbacks do not play a major role in modulating the TC's peak intensity/strength.
3.2 Precipitation
The simulated TC exhibits distinct structures in terms of rainbands under the three aerosol and ocean-coupling scenarios (Fig. 4). The TC simulated in the two polluted cases (i.e., P_UC and P_C) exhibits invigorated rainbands at the developing stage (24 h), and these effects become more evident when the TC approaches land under higher aerosol concentrations, as shown in Fig. 4 at 46 and 52 h. The invigorated rainbands in the two polluted cases are associated with a weakened storm intensity and delayed storm intensification, as shown in the lower (higher) peak (nadir) maximum surface wind speed (minimum sea-level pressure) and the slower increase (decrease) in maximum surface wind speed (minimum sea-level pressure) in Fig. 2a and b. The intensification of the rainbands under polluted conditions also accelerates the formation of a double-eyewall structure, which is about 6 h earlier (at around 46 h) than in the C_C case (at 52 h; Fig. 5a). The inner eyewall in the two polluted cases eventually dissipates at the landfall (60 h) because most of the moisture and angular momentum are used to sustain the outer eyewall, resulting in a singular larger eye. Overall, the two polluted cases exhibit a noticeably enlarged storm size and an enhanced precipitation rate near the eyewall when the storms approach land, consistent with previous studies (e.g., Khain et al., 2010; Rosenfeld et al., 2012; Wang et al., 2014).
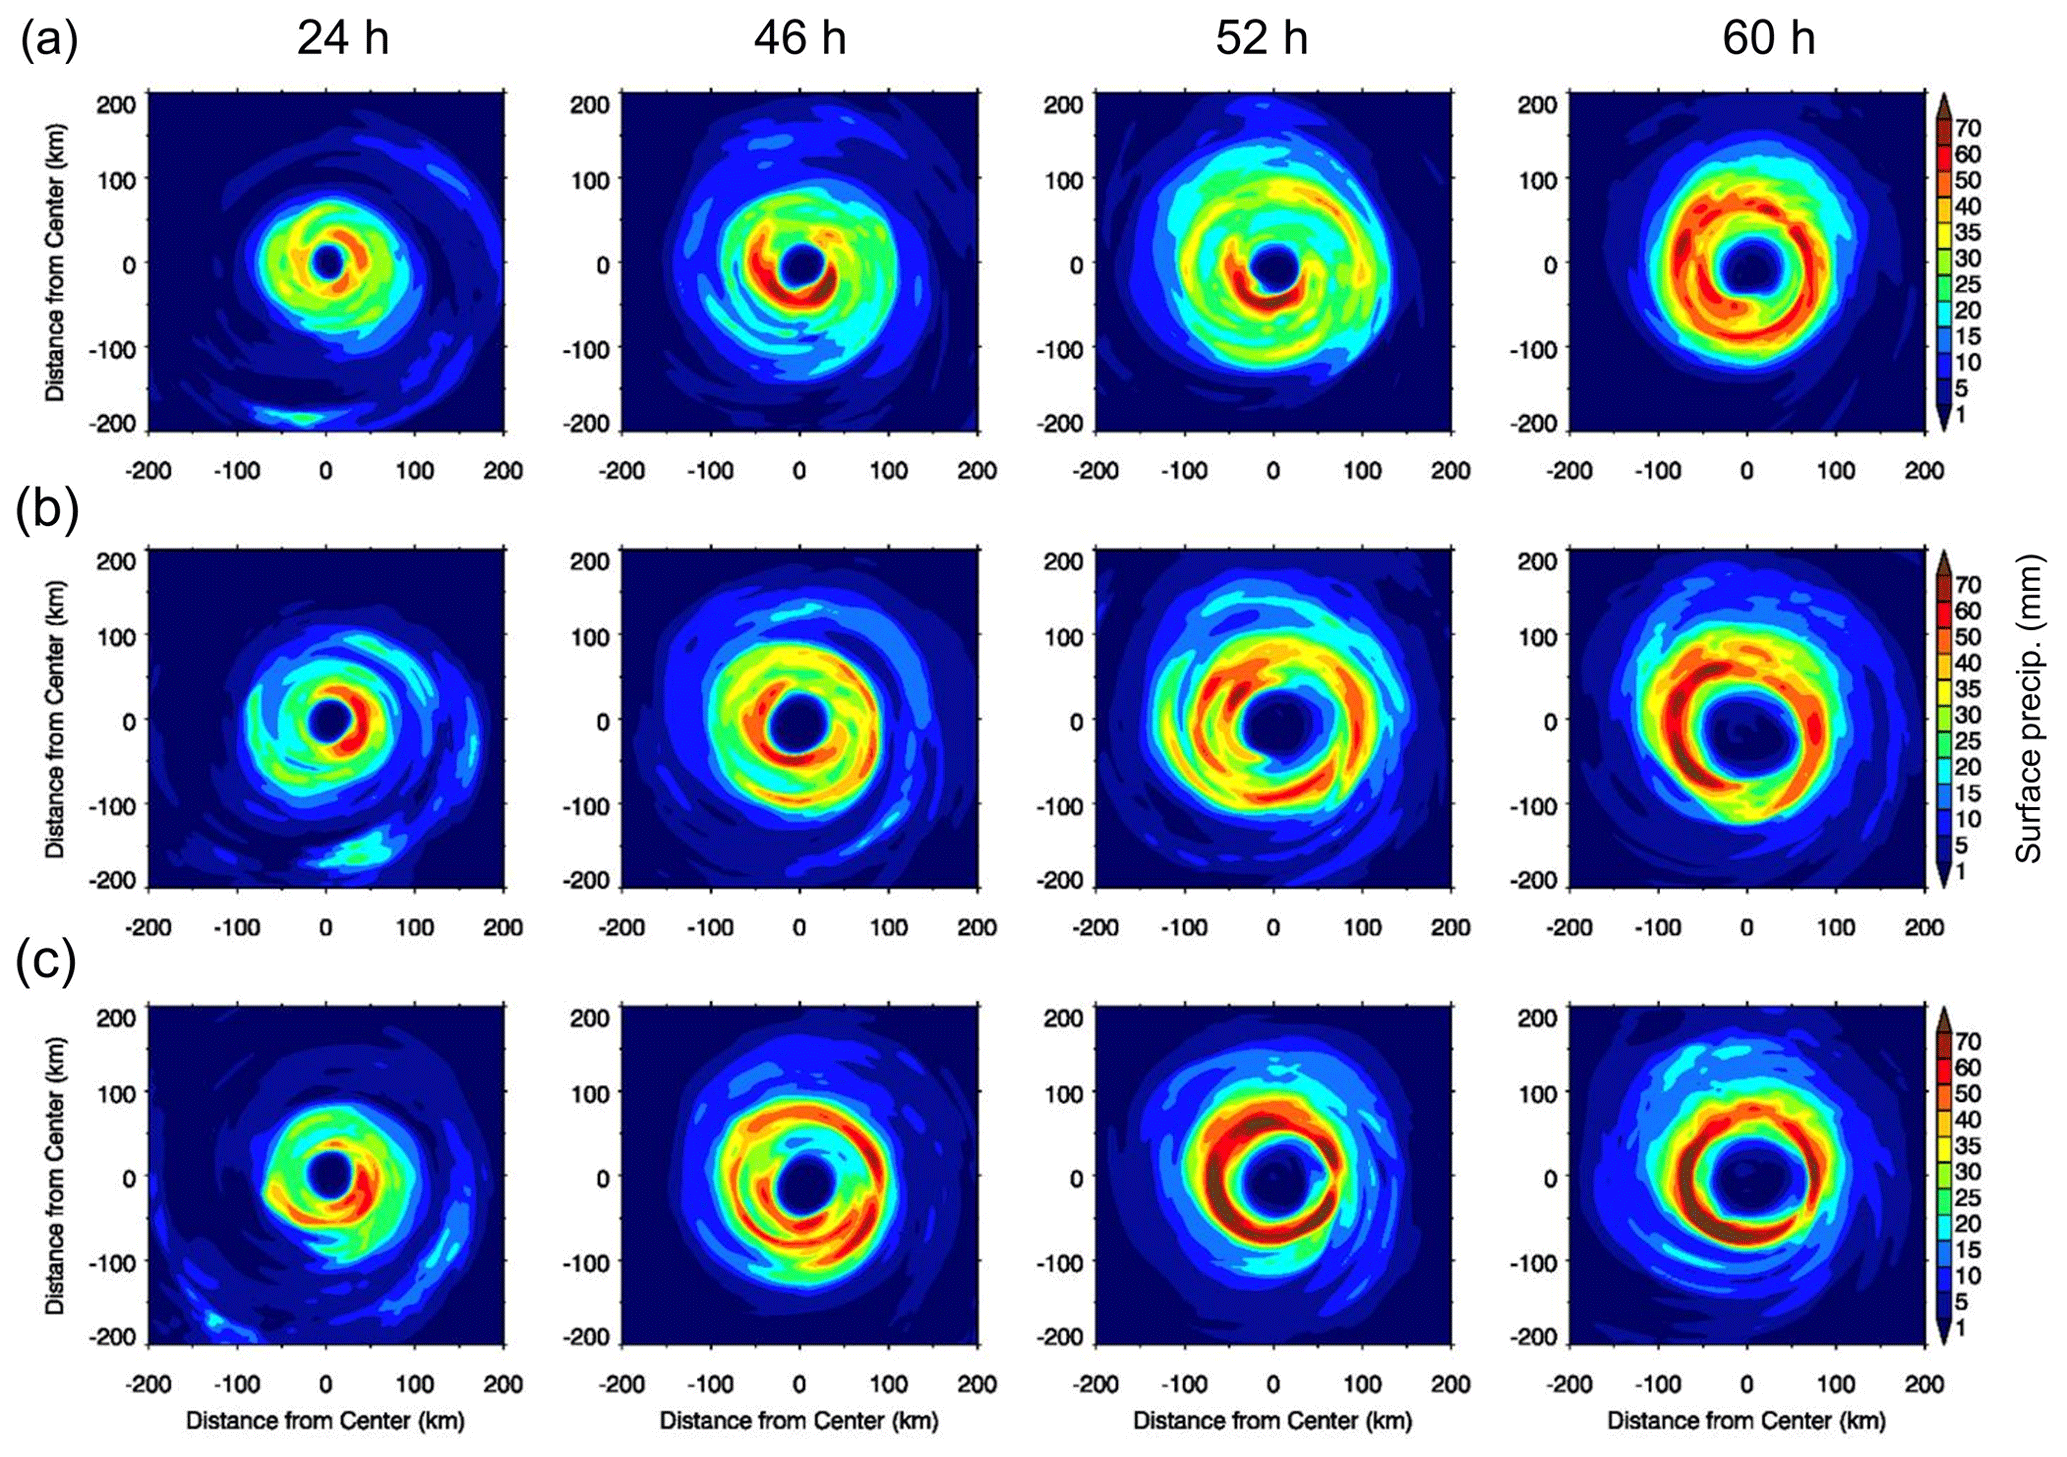
Figure 4Horizontal distribution of precipitation rates for (a) C_C, (b) P_UC, and (c) P_C. Snapshots at four times are displayed, including 24, 46, 52, and 60 h from the start of simulations, corresponding to the developing stage, two mature stages, and the dissipation stage of the TC, respectively.
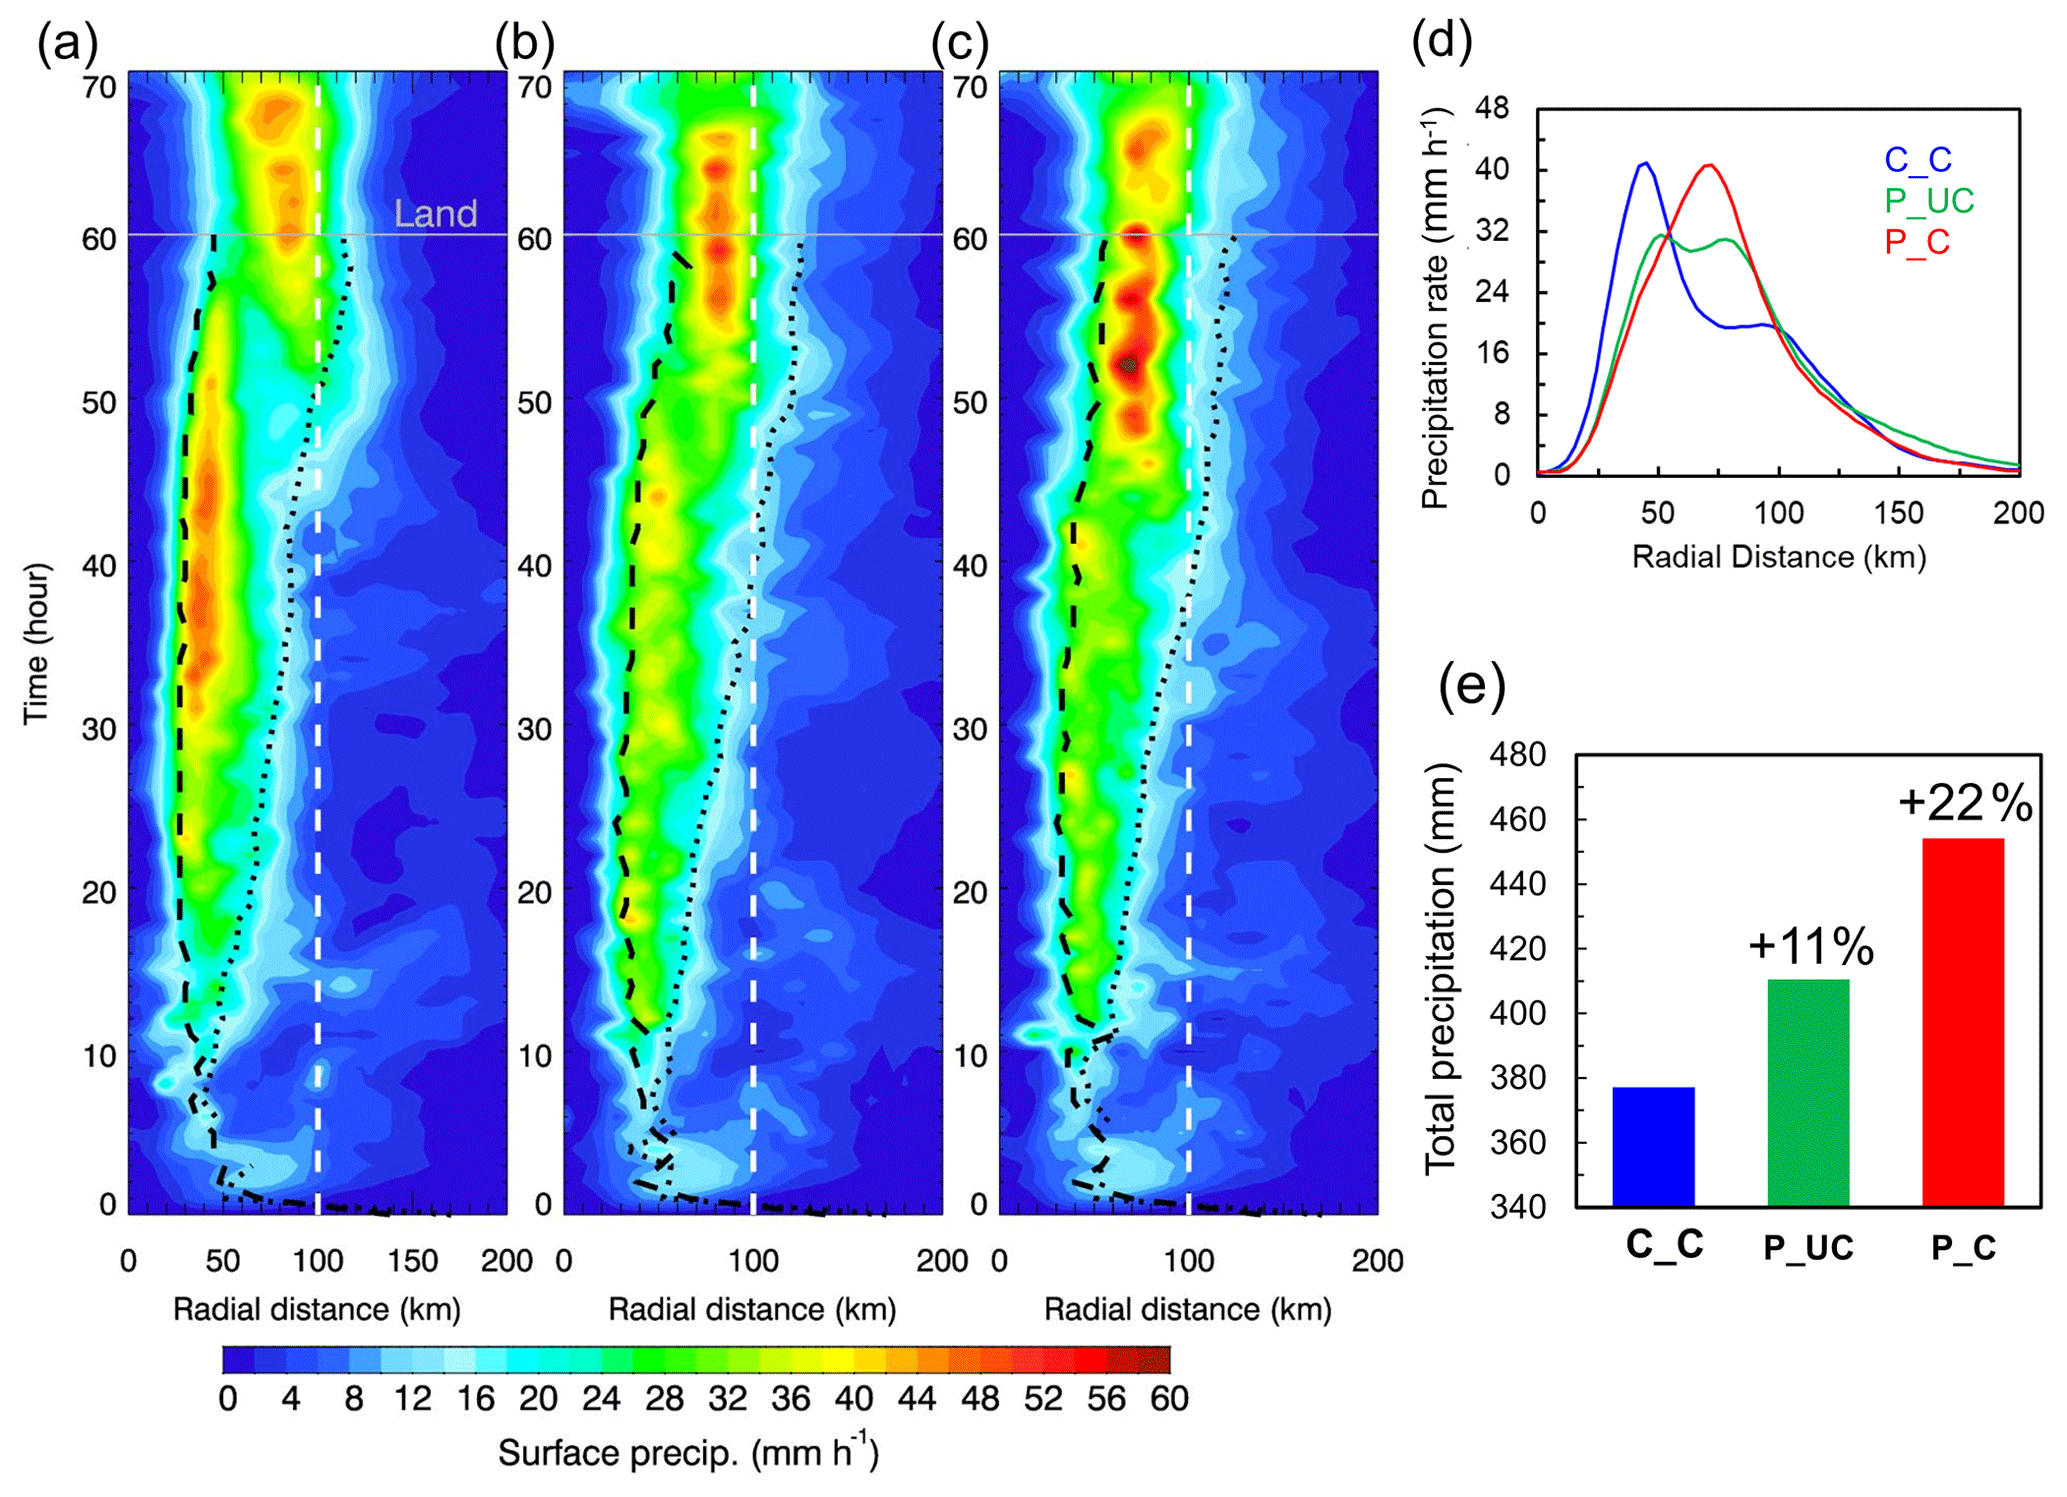
Figure 5Hovmöller diagrams of the azimuthal mean changes in precipitation rate for (a) C_C, (b) P_UC, and (c) P_C. The dashed white lines in panels (a)–(c) denote a distance of 100 km from the storm center. The solid and dashed black lines in panels (a)–(c) represent the radii of the maximum wind speed (RMW) and the hurricane-force wind (with wind speed >32 m s−1), respectively. (d) Azimuthally averaged radial profiles of precipitation rate and (e) total accumulated precipitation are given for C_C (blue), P_UC (green), and P_C (red) within 100 km of the storm center during the mature stage of the TC, corresponding to the time period of 40–55 h from the beginning of TC simulations.
Although aerosol-modified ocean-coupling feedbacks are a minor factor affecting a TC's peak intensity/strength, they significantly change the precipitation distribution, leading to a more contracted rainband and a further enhanced precipitation rate near the eyewall, e.g., an annular heavy-rain belt is located around 60–80 km from the TC center at landfall (60 h) in the P_C case (Fig. 4c).
A TC storm with a possible enhanced storm surge and precipitation rate near TC landfall can significantly increase the disastrous threat of coastal flooding, which is the most damaging aspect of TC impact in coastal regions (Woodruff et al., 2013). Further examination of the temporal and spatial evolution of the precipitation rate reveals that the aerosol-modified ocean-coupling effect can significantly change the precipitation distribution and enhance the precipitation rate within 100 km of the TC center when the TC approaches land (45–60 h; Fig. 5a, c). Both polluted cases exhibit an increased azimuthally averaged precipitation rate, primarily at 60–100 km from the TC's center, especially in the P_C case (Fig. 5d). Flooding is largely determined by accumulated precipitation within certain areas and times. To assess the flooding severity, we calculate the total accumulated precipitation within 100 km of the TC's center, particularly during the period in which the TC approaches land. As shown in Fig. 5e, the total precipitation during the mature TC stage increases by 22 % on average in the P_C case and by 11 % in the P_UC case relative to the C_C case, indicating a higher flooding potential under elevated aerosol conditions, especially with the consideration of ocean coupling.
3.3 Storm surge
To further assess the aerosol impact on storm surge and strong wind damage, the storm's destructive potential is calculated by taking both the TC intensity and TC-influenced marine wind fields into account. The integrated kinetic energy (IKETS) index is used here as a proxy for the hurricane's destructive potential (Emanuel, 2005). It is the summation of the squares of all grid cells with marine wind speeds greater than tropical storm-force wind (i.e., 18 m s−1) multiplied by the volume with a vertical depth of 1 m centered at the 10 m level layer. While high aerosol concentrations weaken the intensity of a storm (assessed by point values like maximum wind or minimum SLP), our simulations revealed an enhanced destructive power of the storm and an increased storm surge under elevated aerosol conditions (Figs. 6, 7). As shown in Fig. 6a, the polluted cases release more destructive energy than the clean case, particularly at Hurricane Katrina's landfall (at 60 h). For example, the P_C case releases 11 TJ more kinetic energy than the C_C case. On average, the IKETS for the P_C case is 18 % higher than for the C_C case over the entire hurricane lifecycle. The enhanced storm destructiveness is attributed to the expansion of the storm circulation (Figs. 6b), which produces higher surface winds beyond the eyewall region and a larger area of tropical storm force (Fig. 8a). With ocean coupling, the IKETS for the P_C case slightly decreases (by less than 5 %) relative to the P_UC case as the storm approaches land. From Fig. 8b, it is also found that the wind outside of the eyewall is stronger in the P_UC case than in the P_C case from hour 50 to 60, which is responsible for the higher destructiveness in the P_UC case during this time period. This also suggests that ocean coupling plays a minor role in modulating the damage corresponding to strong winds and storm surge.
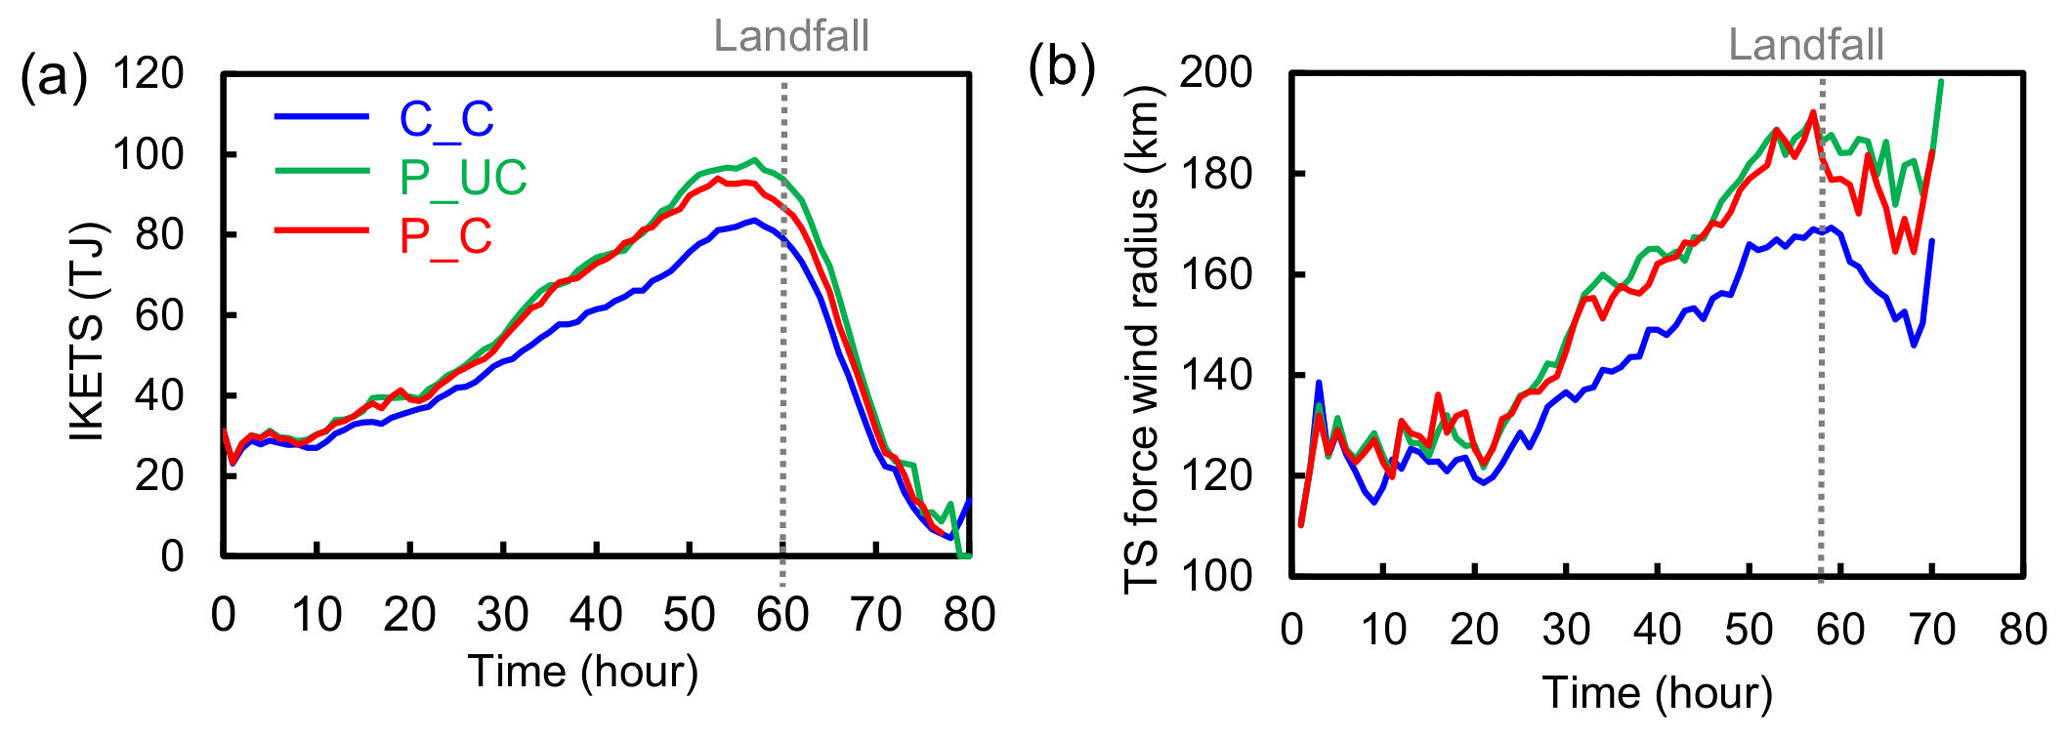
Figure 6Temporal evolution of (a) integrated kinetic energy (IKE) and (b) storm-force radius with winds higher than tropical storm force, i.e., 18 m s−1, for the C_C (blue), P_UC (green), and P_C (red) cases. The dotted gray lines denote the hurricane landfall time.
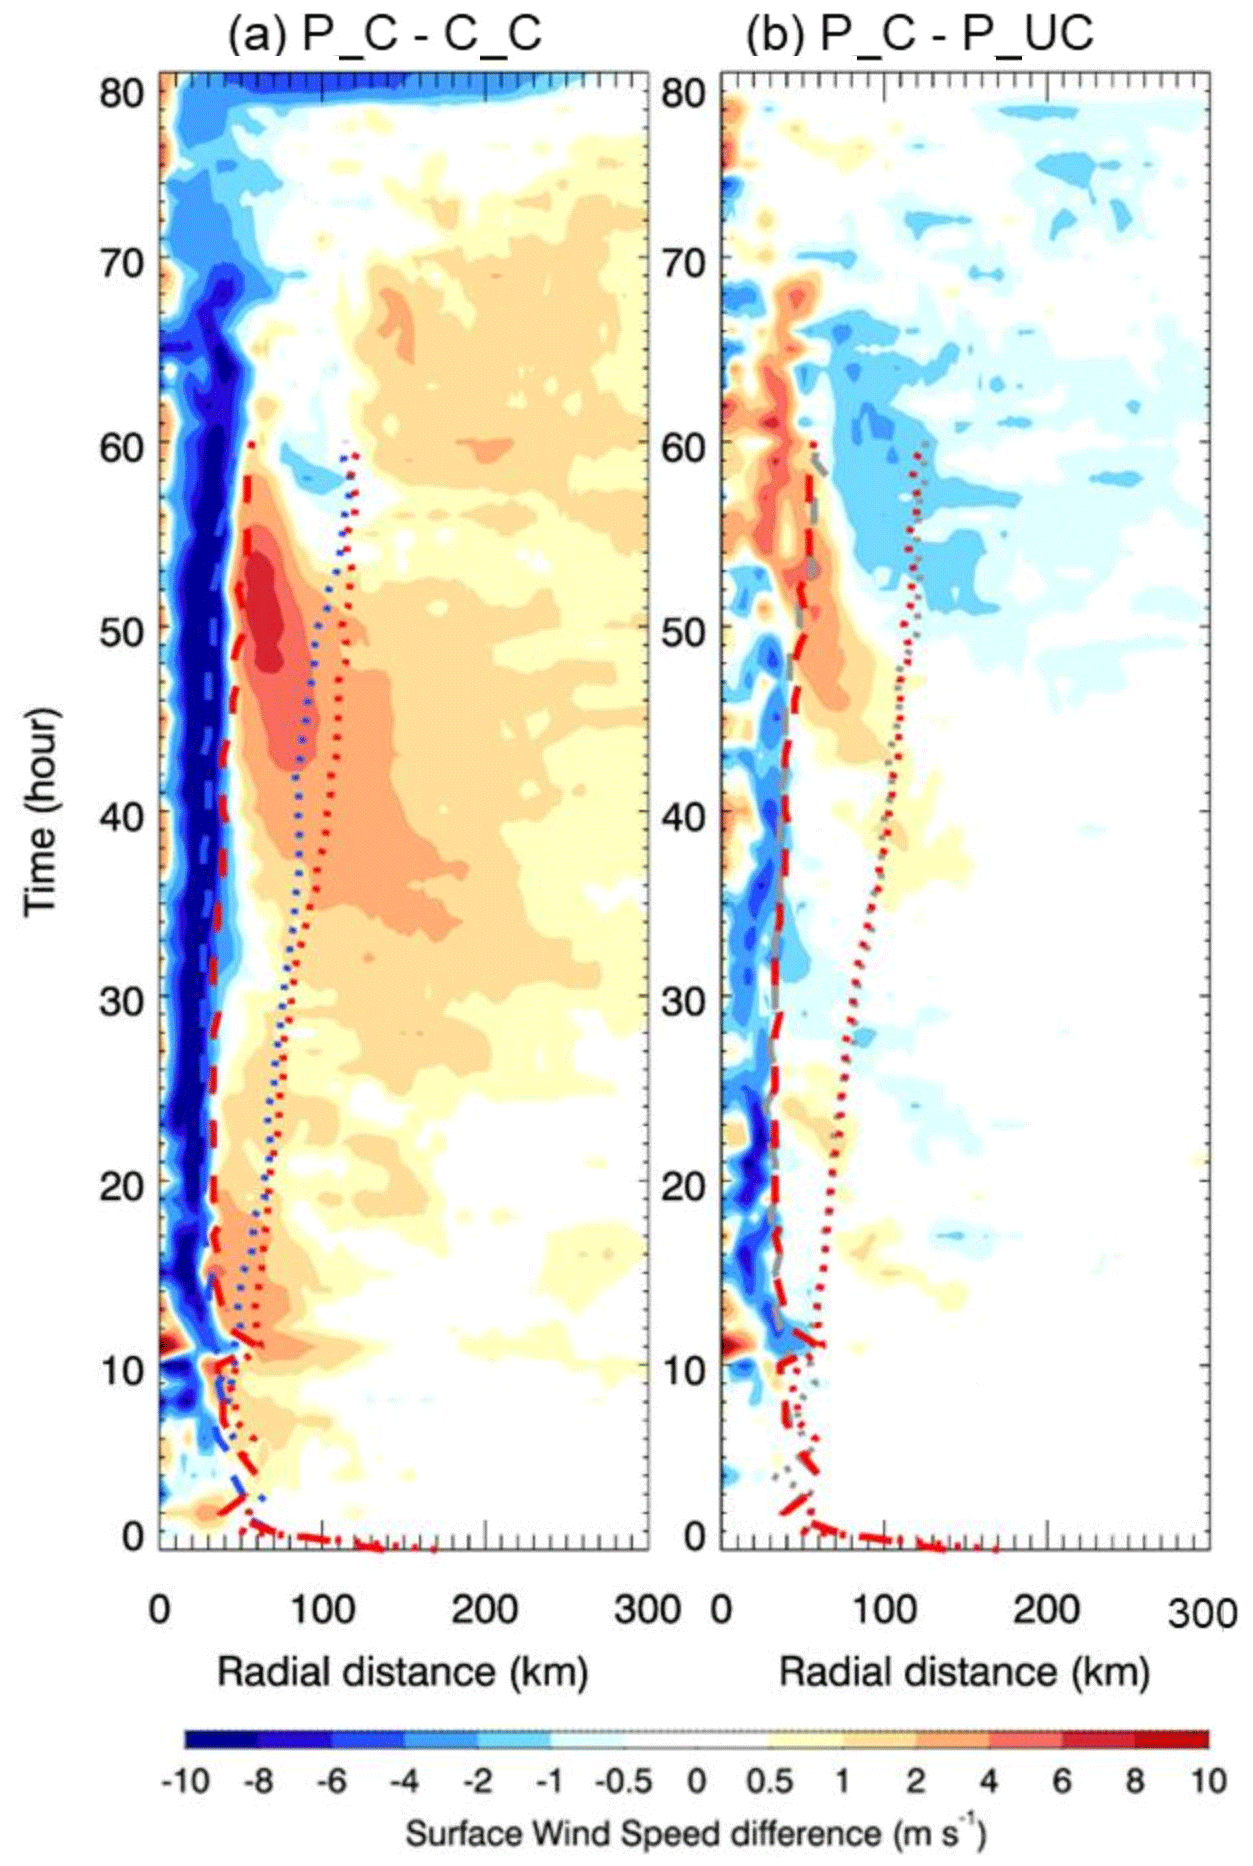
Figure 7Hovmöller diagrams of the changes in the azimuthal means of surface wind speed for (a) P_C – C_C and (b) P_C – P_UC. The dashed and dotted curves throughout the entire hurricane lifecycle denote the RMW and the radii for the hurricane-force wind, respectively, with different colors (blue, green, and red) representing different respective cases (C_C, P_UC, and P_C).
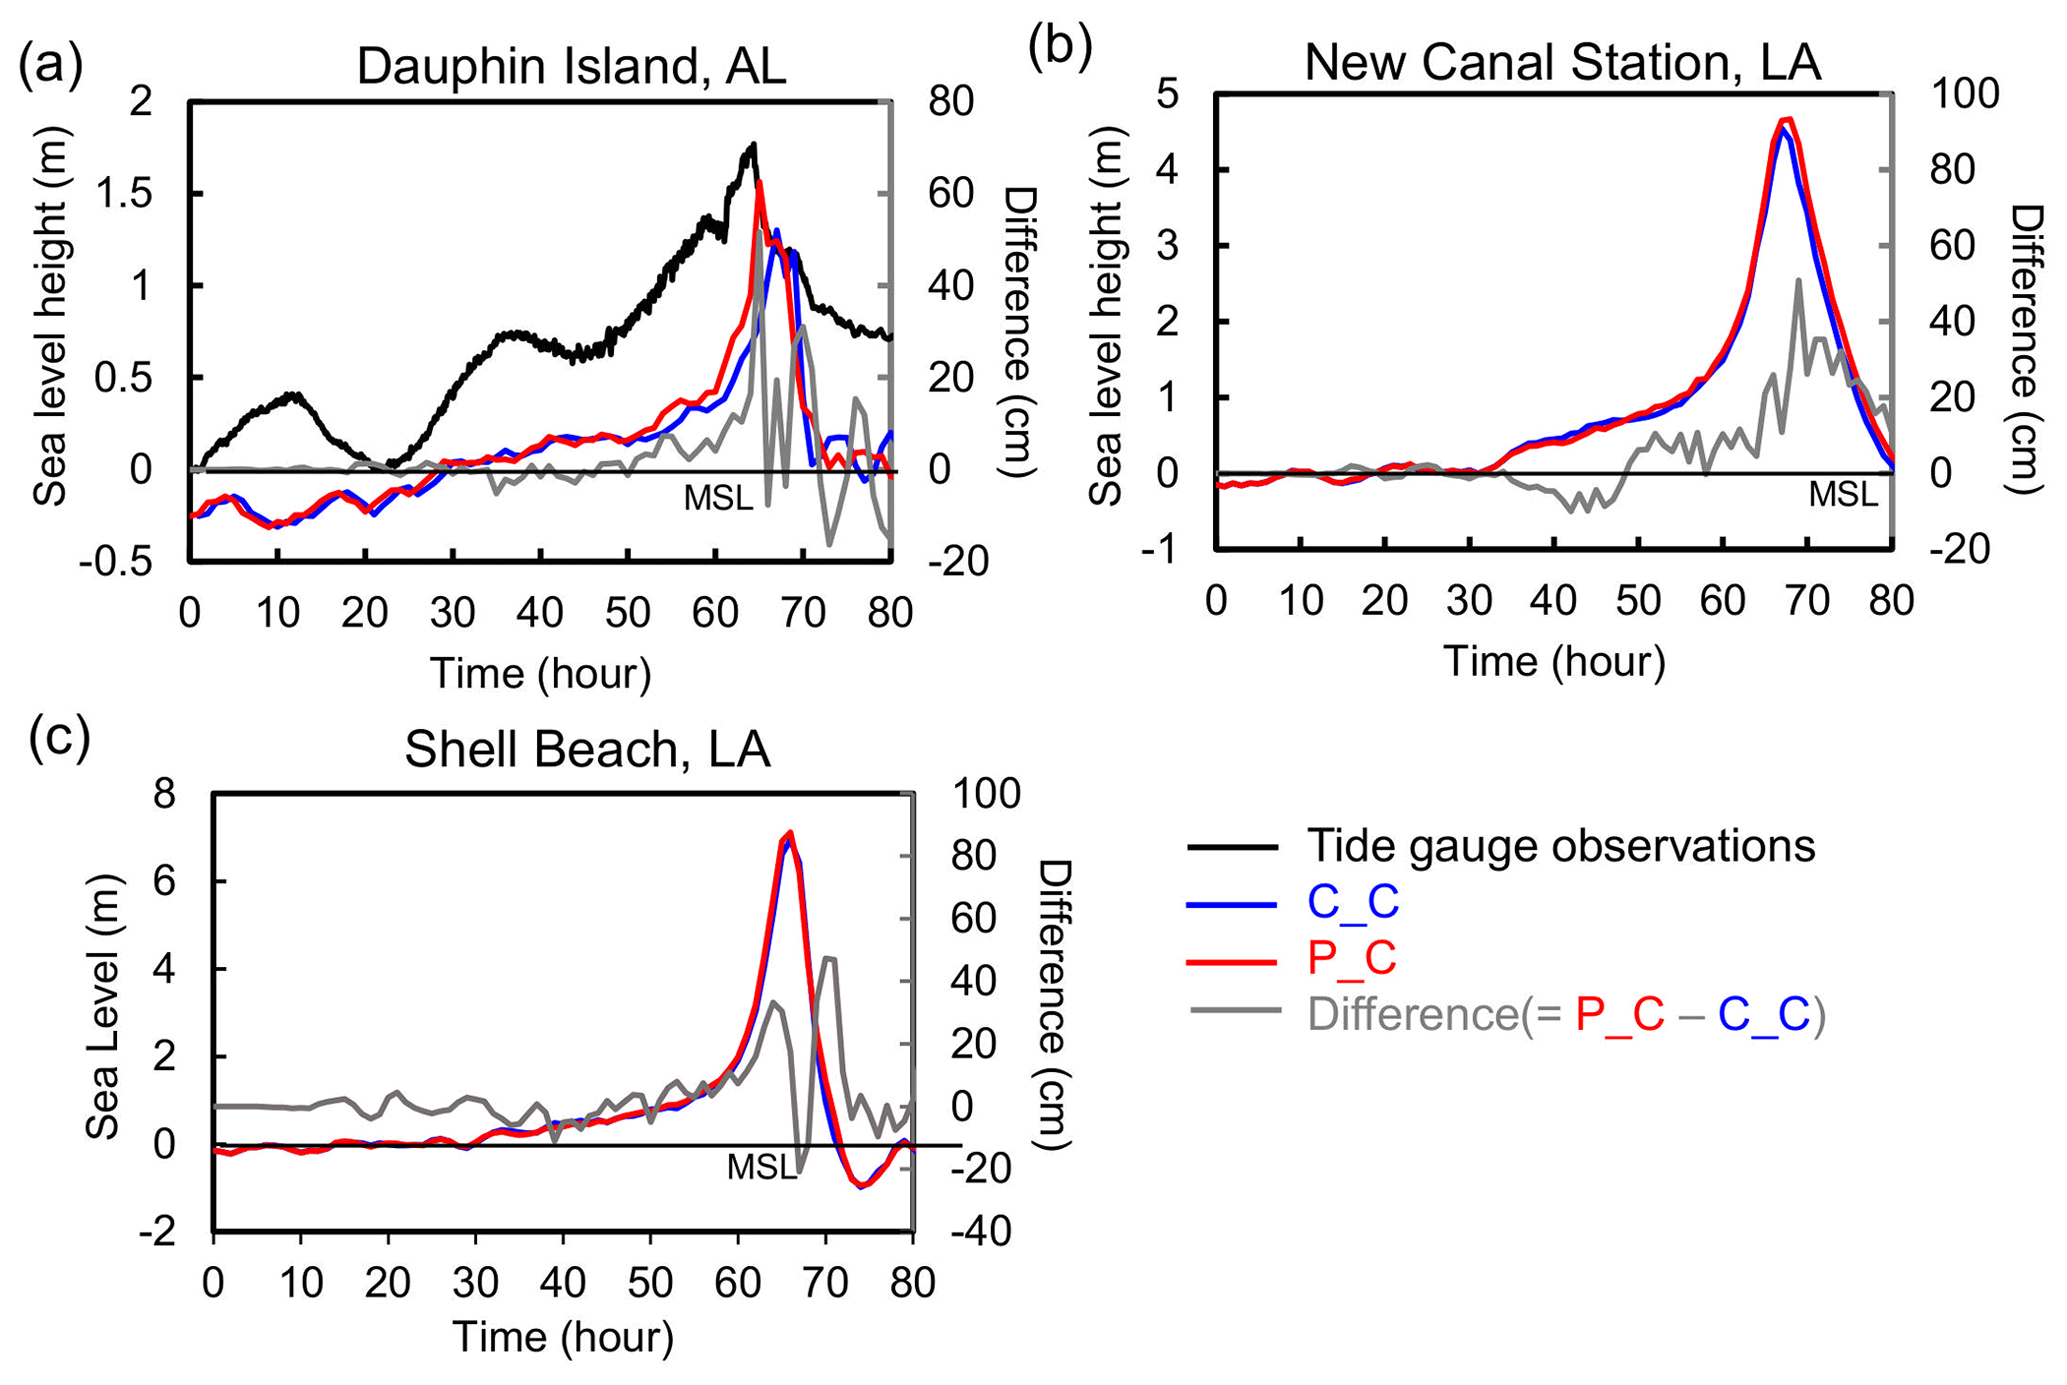
Figure 8Sea-level height at three coastal sites near New Orleans – (a) Dauphin Island, AL; (b) New Canal Station, LA; and (c) Shell Beach, LA – for the C_C (blue) and P_C (red) cases. The gauge observation (black line) is only available at the Dauphin site, shown in panel (a). The gray lines denote the differences between the P_C and C_C cases.
As a direct indicator of storm surge, the sea-level height is simulated with the integration of the 3-D ocean model ROMS (Fig. 7). Our simulation generally captures the peak timing and magnitude of observed sea-level height at Dauphin Island, AL (Fig. 7a). Although there are insufficient gauge measurements at other stations, the simulated peak sea-level heights are comparable to the recorded values at the New Canal and Shell Beach stations (Fritz et al., 2008). The polluted TC can produce a more than 50 cm higher storm surge compared with the clean one (Figs. 7, 9a), suggesting that a TC likely causes more severe damage due to a more severe storm surge along the coast under polluted conditions than under clean conditions. Given that the storm surge associated with TCs can be determined by both the strength and orientation of the winds relative to coastline, we derive and examine three snapshots of the wind speed difference between the coupled polluted and clean simulations (Fig. 9b) as well as the wind vectors for the two cases (Fig. 9c) over the New Orleans coastal area when Hurricane Katrina passed over the region. The alternating high and low sea-level height anomalies can be interpreted by the combined effects of the changes in wind intensity and orientation when the storm approaches coastal regions. For instance, stronger cyclonic surface winds are found (i.e., positive difference in wind speed) around the storm in certain shore regions, e.g., near Shell Beach at 64 h and Dauphin Island at 65 h. The enhanced wind can push more water toward the shore, and more water can pile up over the shore, eventually leading to a more severe storm surge under polluted conditions. As for the significant negative anomalies in sea-level height from clean to polluted aerosol conditions, e.g., at 65 h over the Mississippi–Alabama coast to the west of the Dauphin Island site (Fig. 9a), it was found that there were less perpendicular wind vectors to the coastline in the P_C case than in the C_C case, resulting in less efficient water pileup in the P_C case when winds push water to the shore.
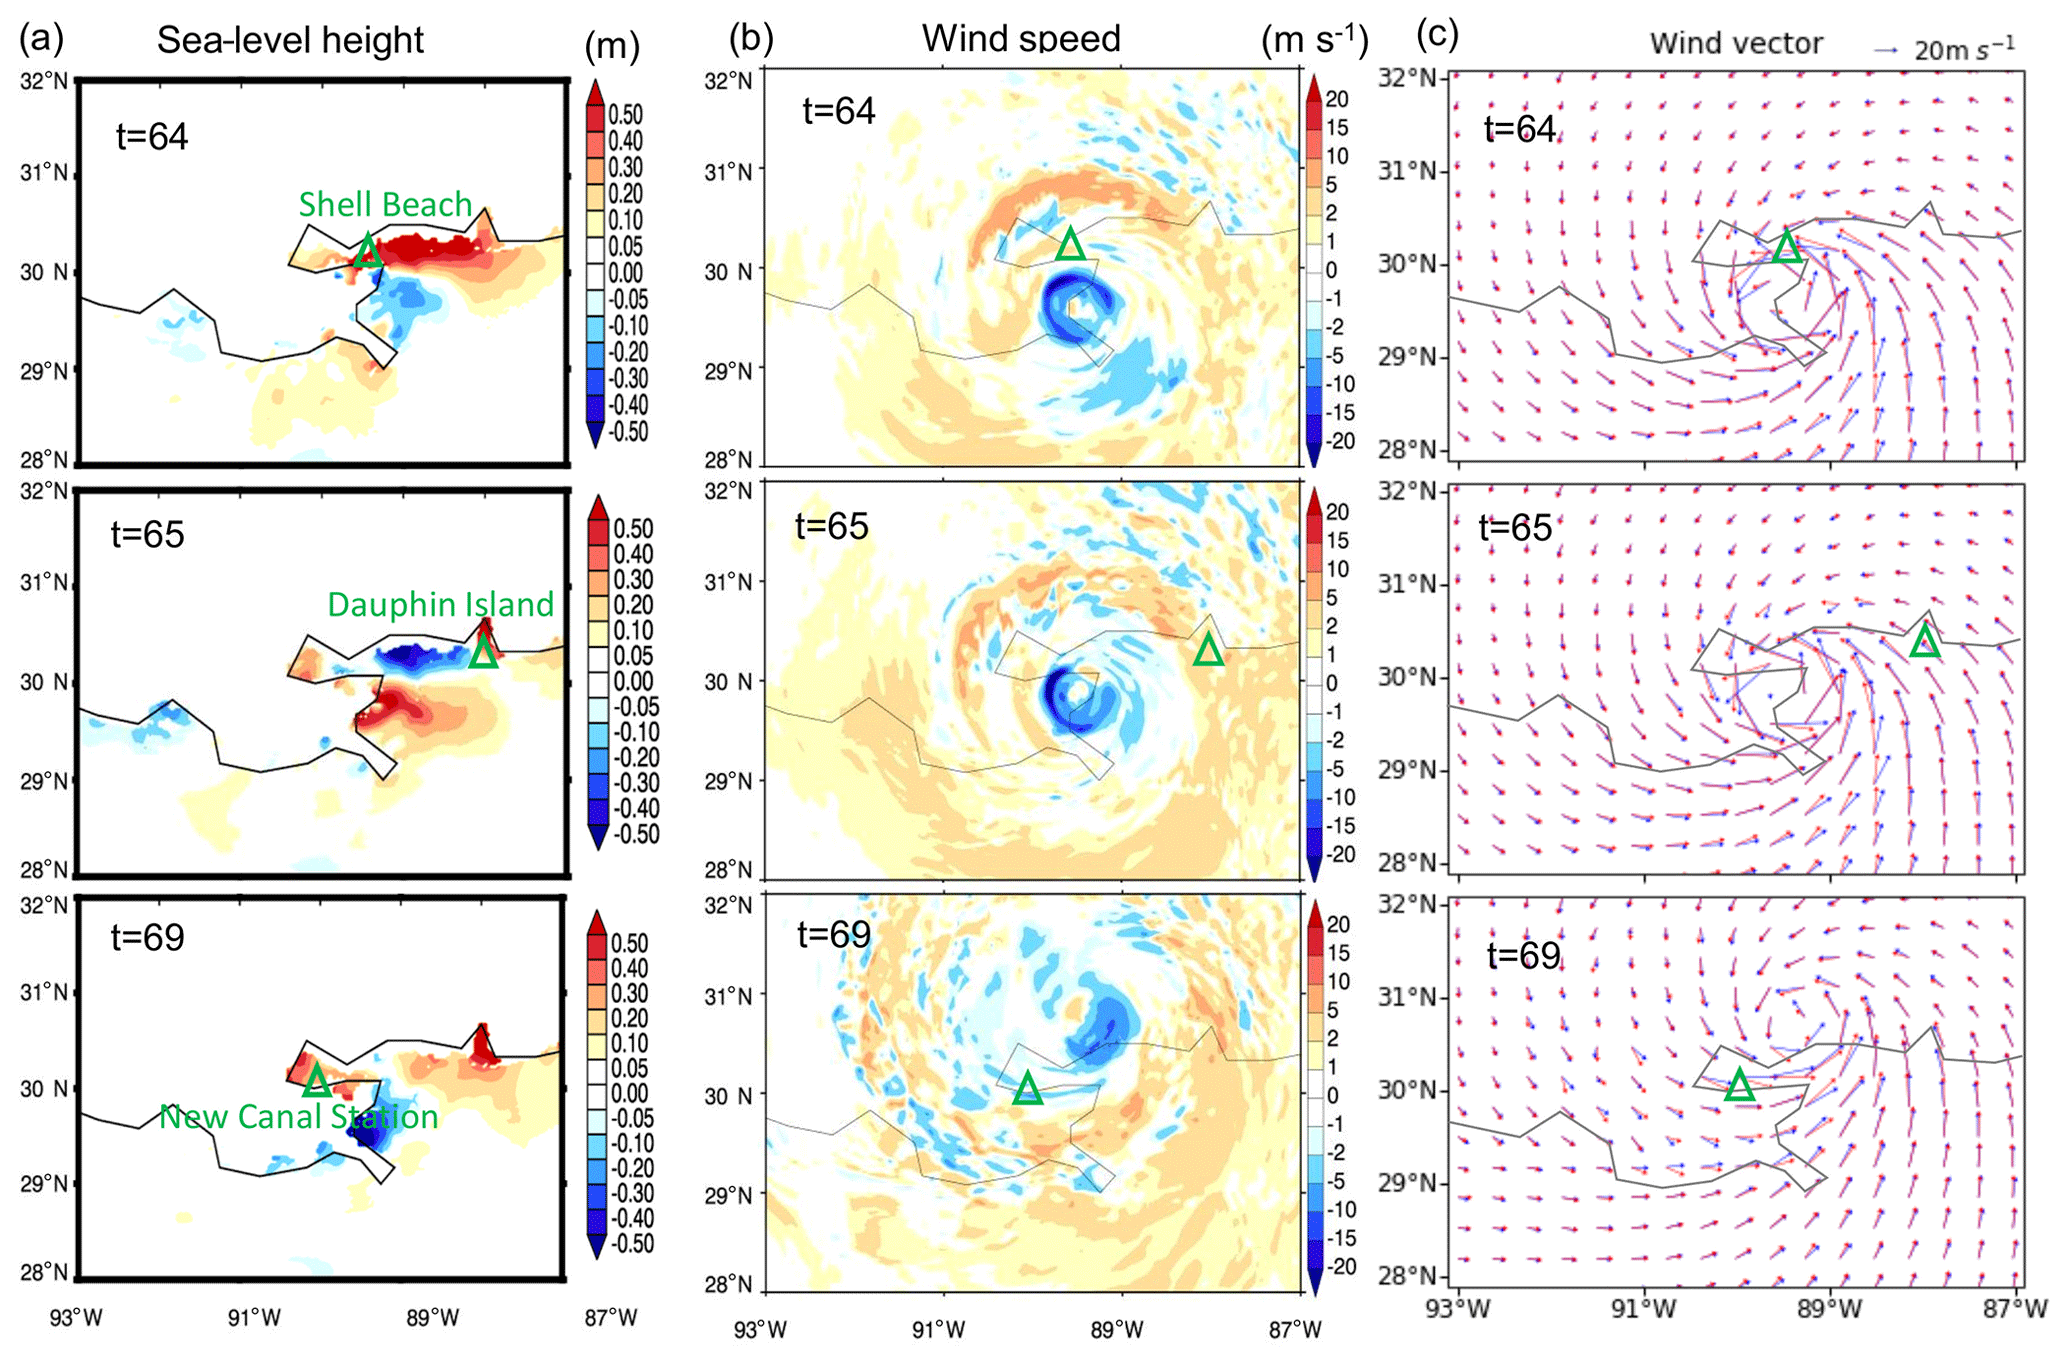
Figure 9The differences in (a) sea-level height and (b) wind speed between the P_C and C_C cases and (c) wind vectors for both the C_C (blue) and P_C (red) cases over the New Orleans coastal region at hour 64, 65, and 69 from the simulation start when Hurricane Katrina made landfall. The green triangles in column (a) denote the gauge stations, including Shell Beach, AL; Dauphin Island, AL; and New Canal Station, LA.
3.4 Storm structure redistribution
The modifications to precipitation characteristics and storm destructiveness by aerosols are mainly due to storm intensity changes and structural redistribution under high-aerosol scenarios. The underlying physical mechanism can be further revealed by examining the vertical–radial cross-sections of the dynamic and thermodynamic processes of the storm (Fig. 10). By serving as CCN, the elevated aerosols tend to suppress the warm-rain process, invigorate mixed- and ice-phase clouds in outer rainbands, and significantly change the latent heat distribution. As shown in Fig. 10a, the P_C case exhibits a higher ice water content (IWC) in the outer rainbands and a more divergent latent heat distribution, with reduced latent heating near the eyewall and enhanced latent heating over the area 40–100 km from the storm center.
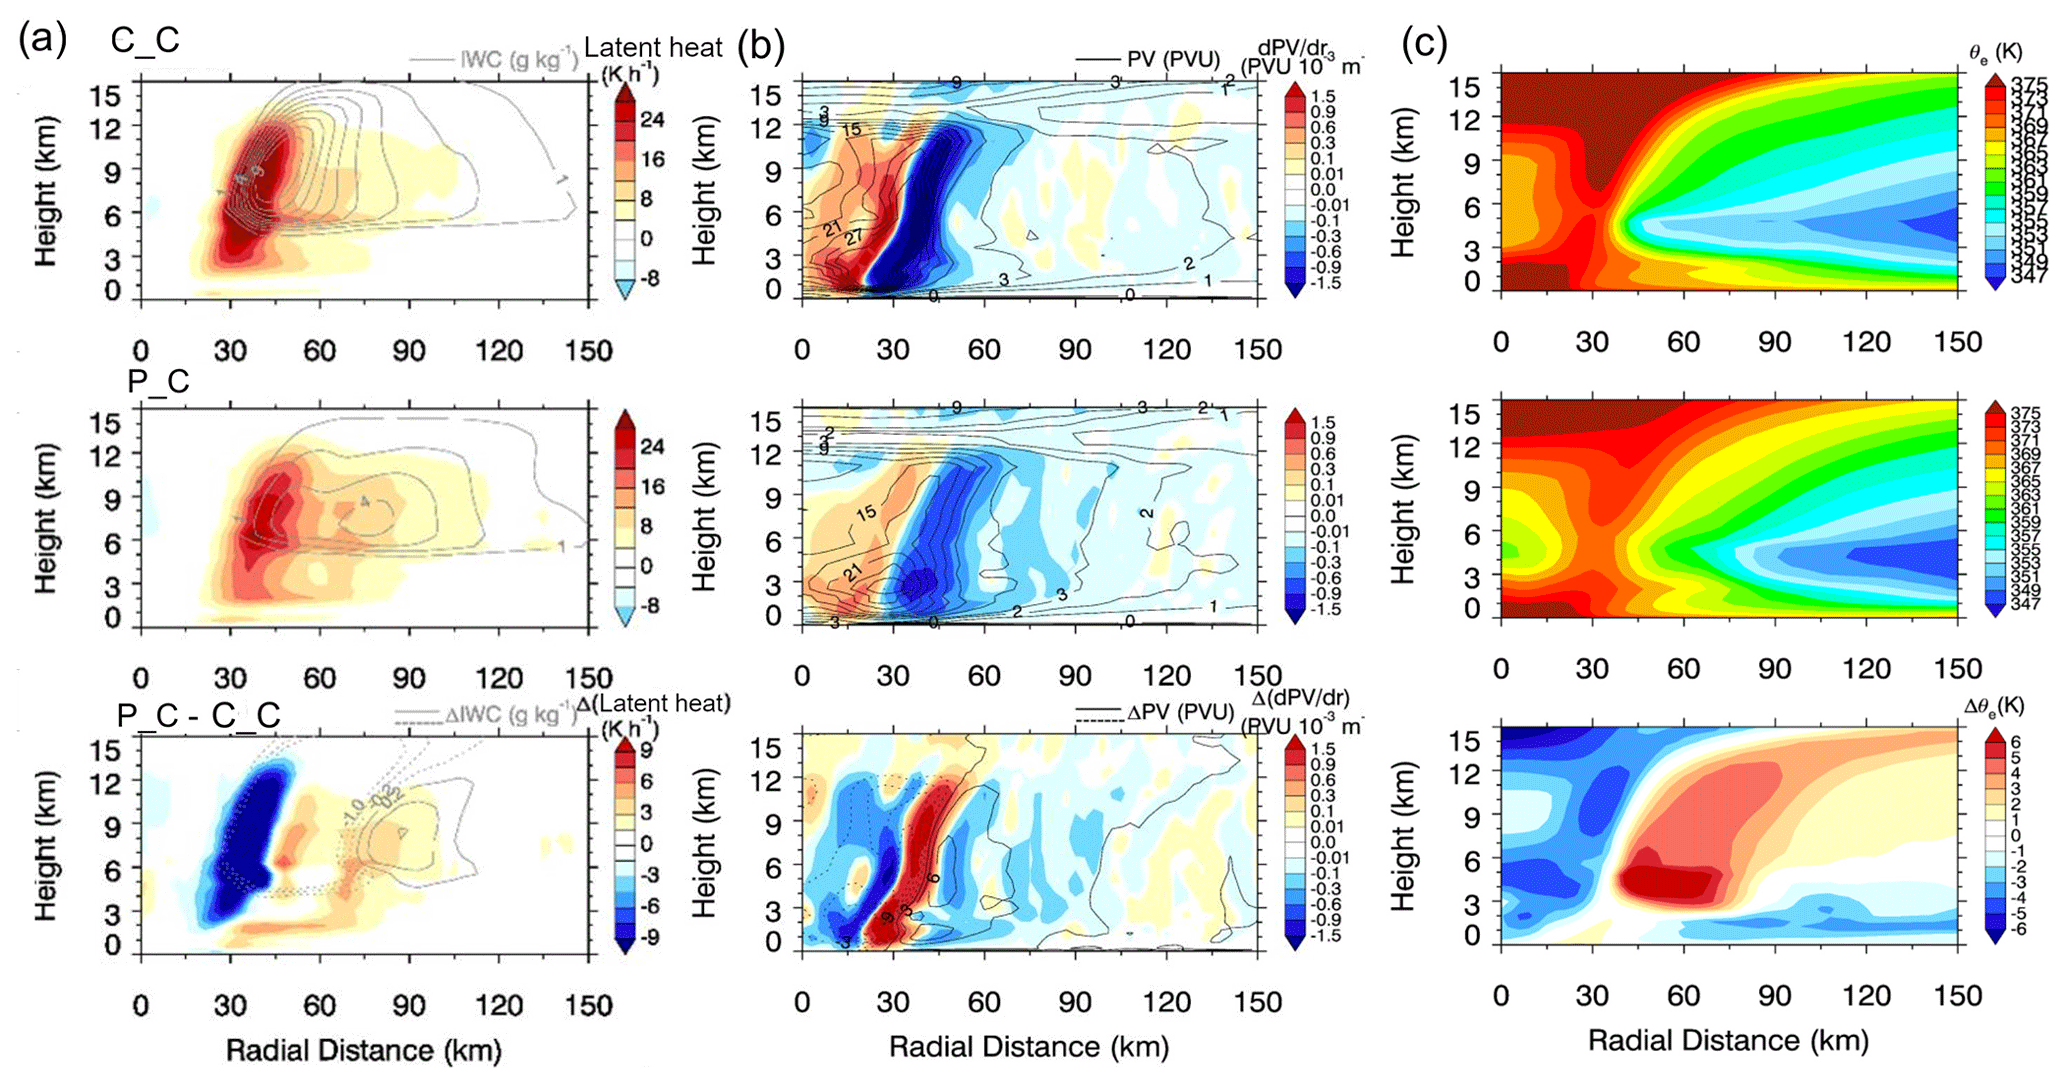
Figure 10Vertical–radial cross-sections of 20 h (32–52 h) azimuthal means of (a) latent heat overlaid with ice water content (IWC), (b) equivalent potential temperature (θe), and (c) potential vorticity (PV) and its gradient for the C_C case, the P_C case, and their difference (P_C − C_C), from top to bottom.
The enhanced heat flux outward from the eyewall is associated with the enhanced propagation of vortex Rossby waves (VRWs), which accelerate the tangential winds near the RMW of the polluted storm (Figs. 4, S3). VRW theories have been widely used to explain storm intensity and structural changes as well as the formation of a spiral rainband in TCs (Houze et al., 2007; Montgomery and Kallenbach, 1997; Wang, 2002). The enhanced outward propagation of VRWs under polluted conditions transports more angular momentum from the eyewall to the outer rainbands, accelerating tangential wind in the rainbands at the cost of decelerating the tangential wind in the eyewall (Figs. 4, S3). A further examination of the corresponding potential vorticity (PV) field shows that aerosols can significantly change the vortex structure by weakening its overall vorticity (Fig. 10b) and can subsequently reduce the β drift of the hurricane. To conserve angular momentum during the vorticity rearrangement, some of the high eyewall vorticity is also fluxed outward, taking on the form of outward-propagating VRWs. These waves rotate cyclonically with the high-PV core, propagate radially outward, and stagnate at radii of 70–90 km, where the radial PV gradient disappears or reverses its sign. In the polluted case, the large gradient of equivalent potential temperature (θe) between 6 and 9 km suggests a more stable condition, which favors VRW propagation outward in the radial direction (Fig. 10c). Moreover, the evaporative cooling of rainbands can result in significant downdrafts, which often bring cool and dry air (i.e., smaller moist static energy supply) into the inflow boundary layer. For example, a lower θe (by up to 3 K) is observed in outer rainbands (>45 km from the storm center) at a height of 0–3 km in the atmosphere in the polluted case than in the clean case. Airflow with this lower moist static energy might be transported and mixed into the eyewall, further contributing to the weakening of eyewall convection and, thus, a reduction in storm intensity.
As storm development is highly influenced by the energy gained from ocean water, it is necessary to examine the dynamic and thermodynamic processes occurring at the air–sea interface to further elucidate the mechanisms leading to storm structural modifications by the aerosol and ocean-coupling effects. To examine the aerosol effect on TC evolution without ocean feedback, we compare the polluted uncoupled case (P_UC) with the clean coupled case (C_C), both of which are forced with the same SST distribution in the model. Figure 11a shows the differences in the total surface heat flux and wind stress magnitudes between the P_UC and C_C cases. The most prominent feature is that the significant surface heat flux deficiency (surplus) is well correlated with a negative (positive) wind stress difference within about 25–50 km of the storm center throughout most periods of the simulation. This suggests that surface heat flux near the core region (approximately within the radius of maximum wind) is mainly driven by the magnitude of surface wind stress rather than the moisture flux difference. On the other hand, over 50 km from the center, the surface heat flux and wind stress differences in the polluted uncoupled case are all generally larger than those of the clean coupled case. The significant negative surface heat flux difference around 50–100 km from the center is associated with a higher surface heat flux in the clean coupled case, which arises due to the drier descending air in the moat area of the double eyewall forming between hours 57 and 60.
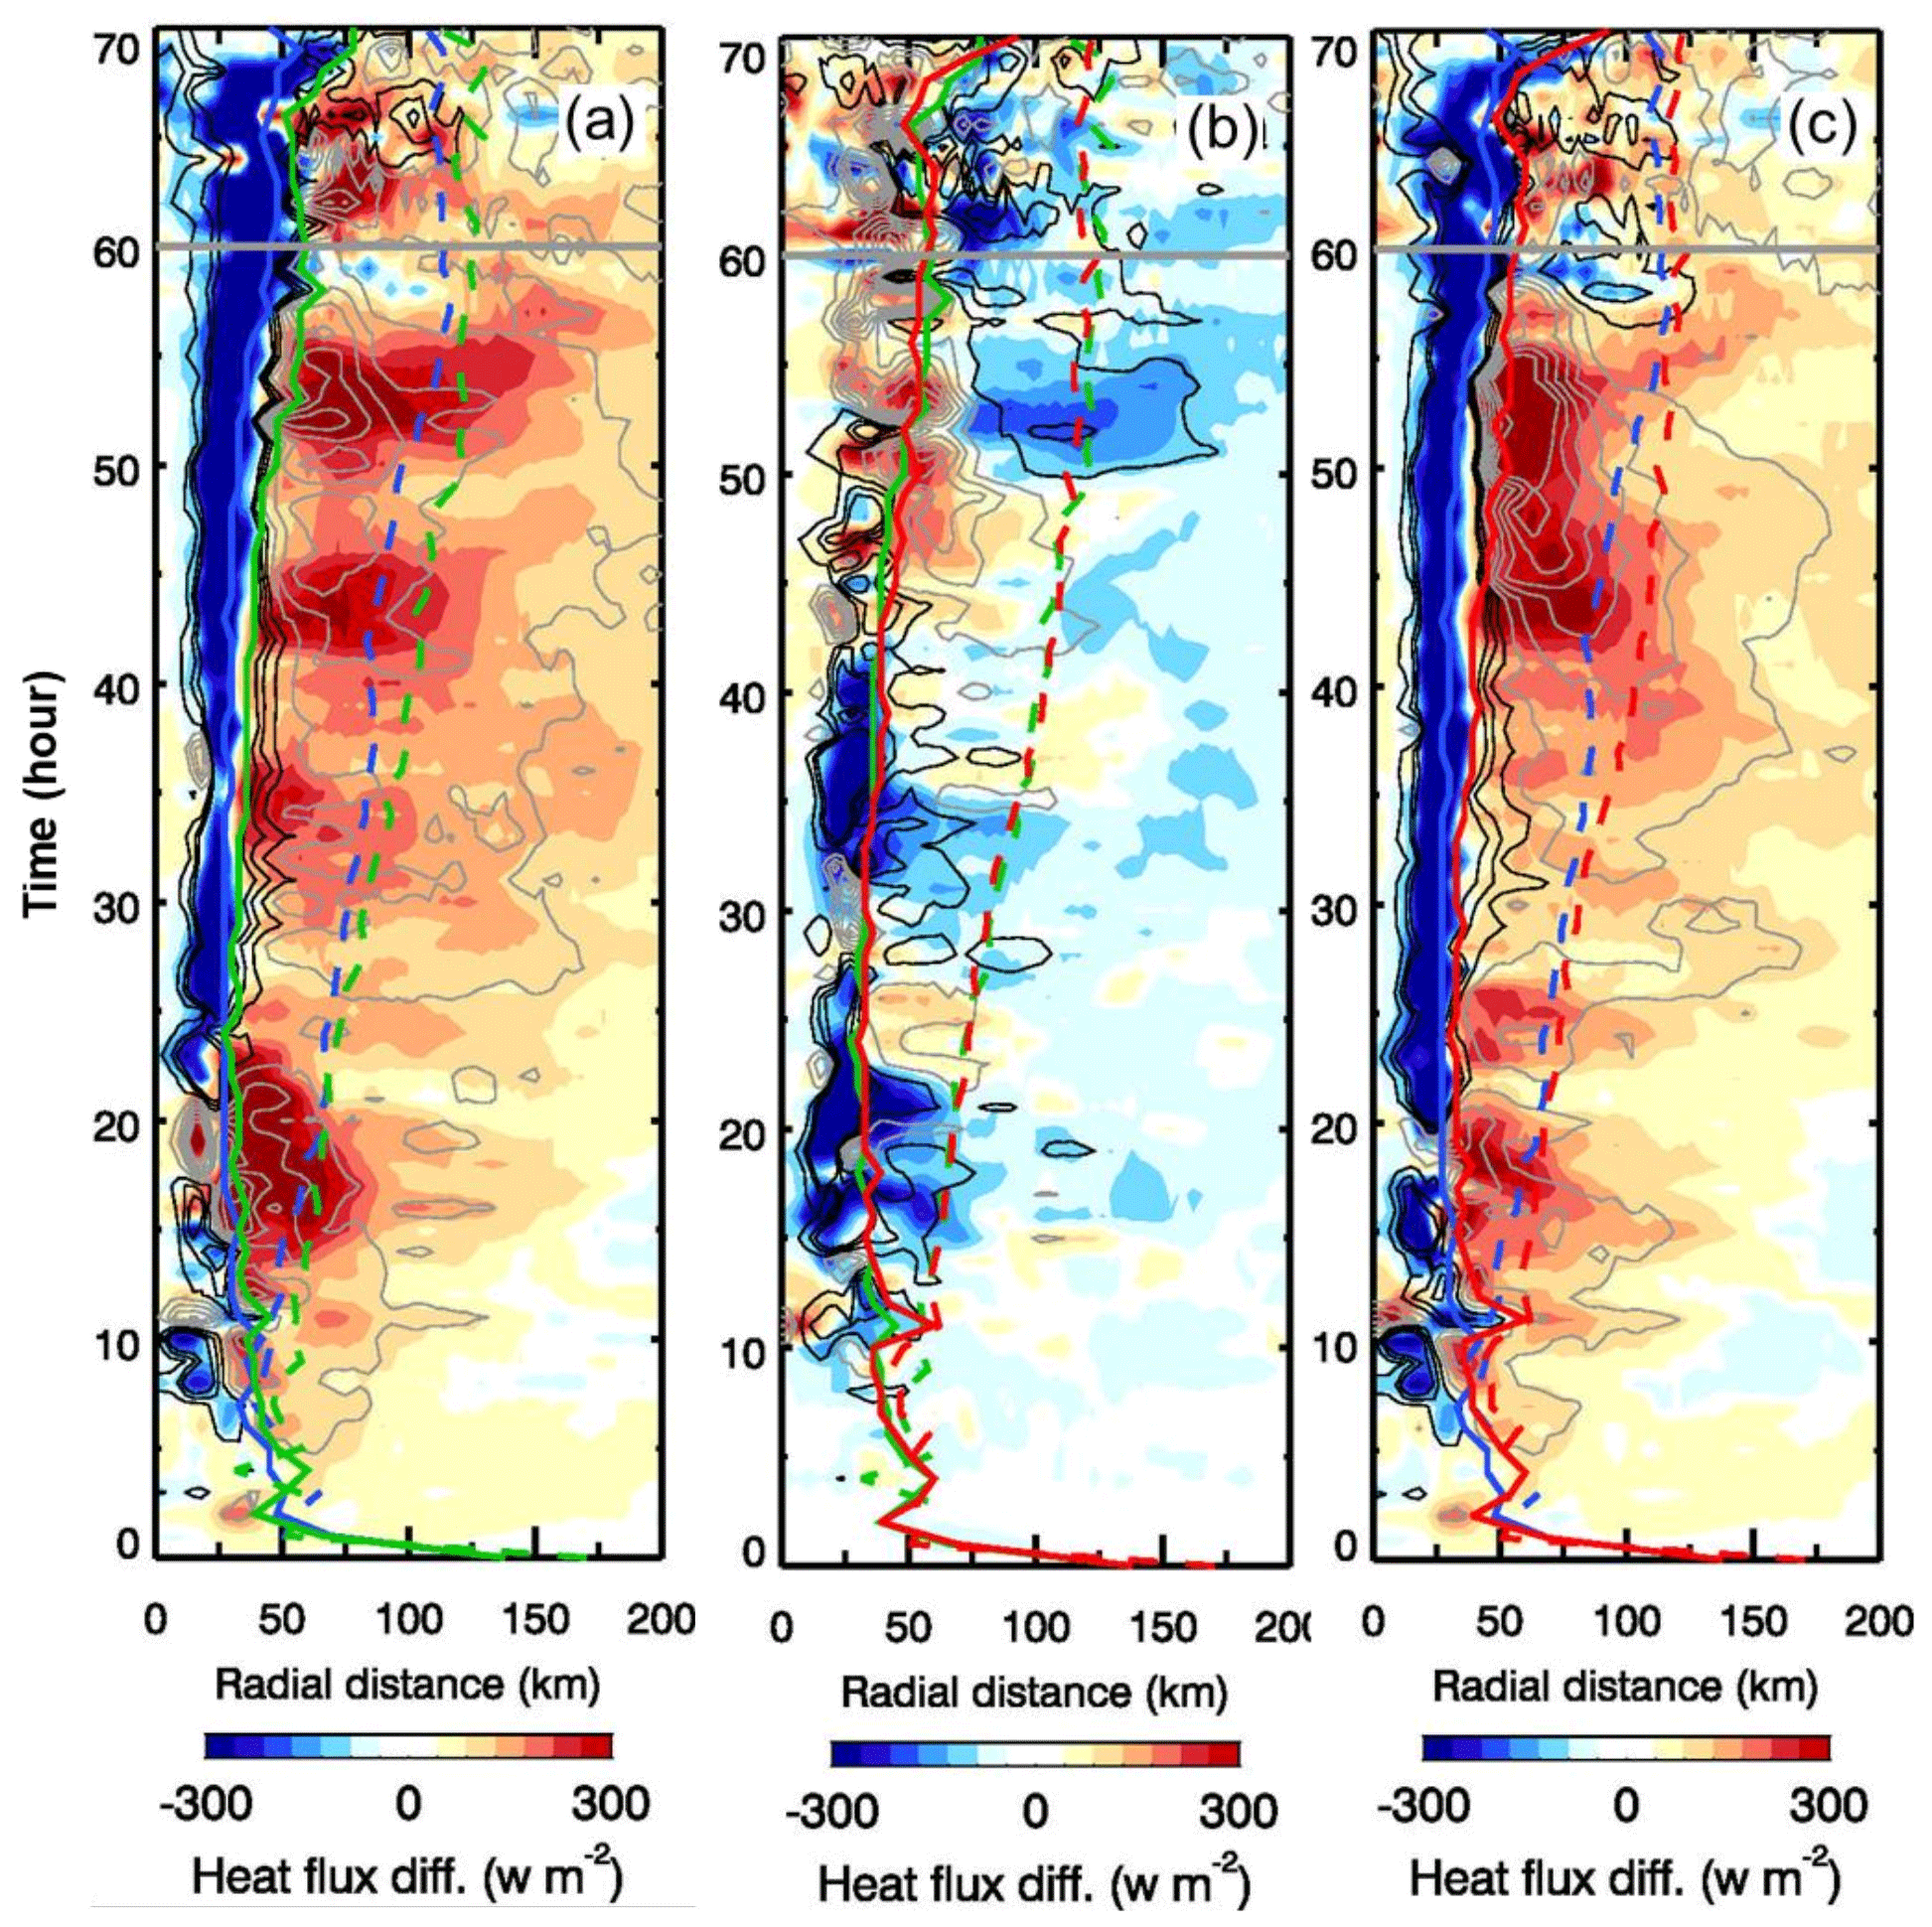
Figure 11Hovmöller diagrams of the changes in the azimuthal means of surface wind stress (contour lines, with an interval of 0.4 N m−2; gray for positive and black for negative changes) and surface total heat flux (colored shading) induced by the (a) aerosol-only effect (i.e., P_UC − C_C), (b) ocean-coupling effect (i.e., P_C − P_UC), and (c) combined effect (i.e., P_C − C_C). The solid and dashed curves throughout the entire hurricane lifecycle denote the RMW and the radii for the hurricane-force wind (>34 m s−1), respectively, with different colors (blue, green, and red) representing different respective cases (C_C, P_UC, and P_C). The positive (negative) perturbations denote the upward (downward) flux, i.e., from the ocean (the atmosphere) to the atmosphere (the ocean).
Here, we evaluate the impact of the SST difference induced by the aerosol-contaminated TC on the surface heat flux and wind stress distributions, which manifests the contributions of ocean feedback to the polluted TC. Figure 11b displays the surface heat flux and wind stress differences between the polluted coupled (P_C) and polluted uncoupled (P_UC) cases. In general, we expect to see a relatively higher SST in the wake of the TC in the polluted cases compared with the clean case due to a weaker vertical mixing response to a polluted TC. However, due to the discrepancy with respect to some slight track deviation between the polluted case and the clean coupled case, some relatively lower near-center SST values can also be experienced by the polluted TC core compared with the clean TC core, thereby contributing to the formation of negative surface heat flux and wind stress differences, as displayed in the Hovmöller diagram. This is the case for the significant surface heat flux deficit overlapping with the surface wind stress deficit between hour 12 and 42, which is associated with a slightly leftward deviation in the TC track in P_UC compared with that in P_C (see Fig. S1a), leading to the polluted TC of the uncoupled case being surrounded by relatively cooler SST values. After the TCs turn more northwards approaching the warm Loop Current eddy (around 27∘ N, 90.5∘ W), the tracks of both TCs nearly always overlap with each other until landfall, when a more symmetrically positive (negative) SST difference near (off) the TC cores can be observed (see Figs. 11b, S2). The co-location of both the positive and negative surface heat flux and wind stress differences after hour 42 manifests as a clear air–sea coupling signal: the warmer (cooler) SST not only causes more (less) surface heat flux but also increases (decreases) the magnitude of surface wind stress by enhancing (reducing) the turbulent momentum mixing downwards from the free atmosphere to ocean surface. This further indicates that a strong vertical mixing and Ekman upwelling tend to decouple the near-surface flow from the flow on the top of the boundary layer, reducing the dynamic and thermodynamic forcing of the TC to the ocean beneath.
Figure 11c shows the combined effect of aerosols and air–sea interaction on the surface heat flux and wind stress distributions of the TC. The surface heat flux and wind stress differences show some characteristics similar to those in Fig. 11a, but they demonstrate a better correlation with each other than the polluted case without proper ocean feedback, especially during the time from hour 42 to 60 before landfall. Note that the evident surface heat flux deficit before hour 60 is well correlated with the wind stress deficit under the combined effect of aerosols and air–sea coupling, in contrast with the result shown in Fig. 11a, in which the negative surface heat flux difference is co-located with the positive surface wind stress difference. Of particular interest is that the seemingly quasiperiodic bursts of high surface heat flux difference due to the aerosol effect (Fig. 11a) turn into sporadic bursts of heat flux and wind stress anomalies in Fig. 11c, suggesting that a proper air–sea coupling, as reflected by the strength of the ocean feedback modulated by an aerosol-contaminated TC, still plays a role in affecting the magnitudes of surface heat flux and wind stress of a polluted TC and, thus, its precipitation distribution moving with the TC.
To more clearly and quantitatively view the dynamic and thermodynamic processes occurring at the air–sea interface in response to aerosol and ocean coupling, we derive azimuthally averaged radial profiles at the ocean surface for the three aerosol and ocean-coupling scenarios over two periods: the typical storm development stage (15–28 h) and the typical mature storm stage (42–55 h) (Fig. 12). On average, the lower surface heat flux in the P_C case compared with the P_UC case during the developing stage (left column in Fig. 12a and b) is due to the relatively cooler near-center SST, which is caused by the slight deviation in the TC track in the two polluted cases compared with the clean case (Fig. S1). Without consideration of the track shift in the P_C case relative to C_C case, the vertical mixing cooling strength in the C_C case is actually very close to P_C at this stage (Fig. 12b), suggesting that the change in the ocean feedback strength due to the aerosol effect is still not strong enough at the beginning stage to significantly impact the TC aloft. This can be evidenced by the relatively small differences in surface wind stress and total water path formed in the storms among the three cases (Fig. 12c, d). This is further confirmed by little changes in precipitation (Fig. 5) or storm destructiveness (Fig. 6) in the P_C case compared with the P_UC case in the developing stage. However, as the TC approaches land with higher aerosol concentrations, the ocean feedback starts to affect the evolution of the TC. At the mature stage (42–55 h), the SST feedback shows a warm core with a time average of the azimuthal mean SST of up to 0.5 ∘C warmer in the P_C case than that in the C_C case and with a slightly colder periphery. The SST warming (cooling) near the inner core (the periphery) increases (reduces) the thermal energy transfer to the storm eyewall (outer rainbands). Thus, a weaker vertical mixing cooling near the center of the polluted TC reciprocally increases the coupling between the near-surface flow and the aloft free-atmosphere flow, providing relatively more surface heat flux near the eyewall of the polluted TC, resulting in a positive feedback to sustain the strength of the TC aloft. Consequently, the aerosol-modified ocean feedback significantly enhances cloud formation and the precipitation rate near the eyewall (Figs. 5d, 12d). In turn, the enhanced cloud formation results in larger latent heat release aloft over the region just outside of 50 km from the storm center (Fig. S5), which further strengthens cloud convection and may also contribute to the enhancement of cloud formation in the storm. It should also be noted that the peak winds shift farther from the center, suggesting that the eye of the polluted hurricane gets larger, which is evident in Fig. S1b as well.
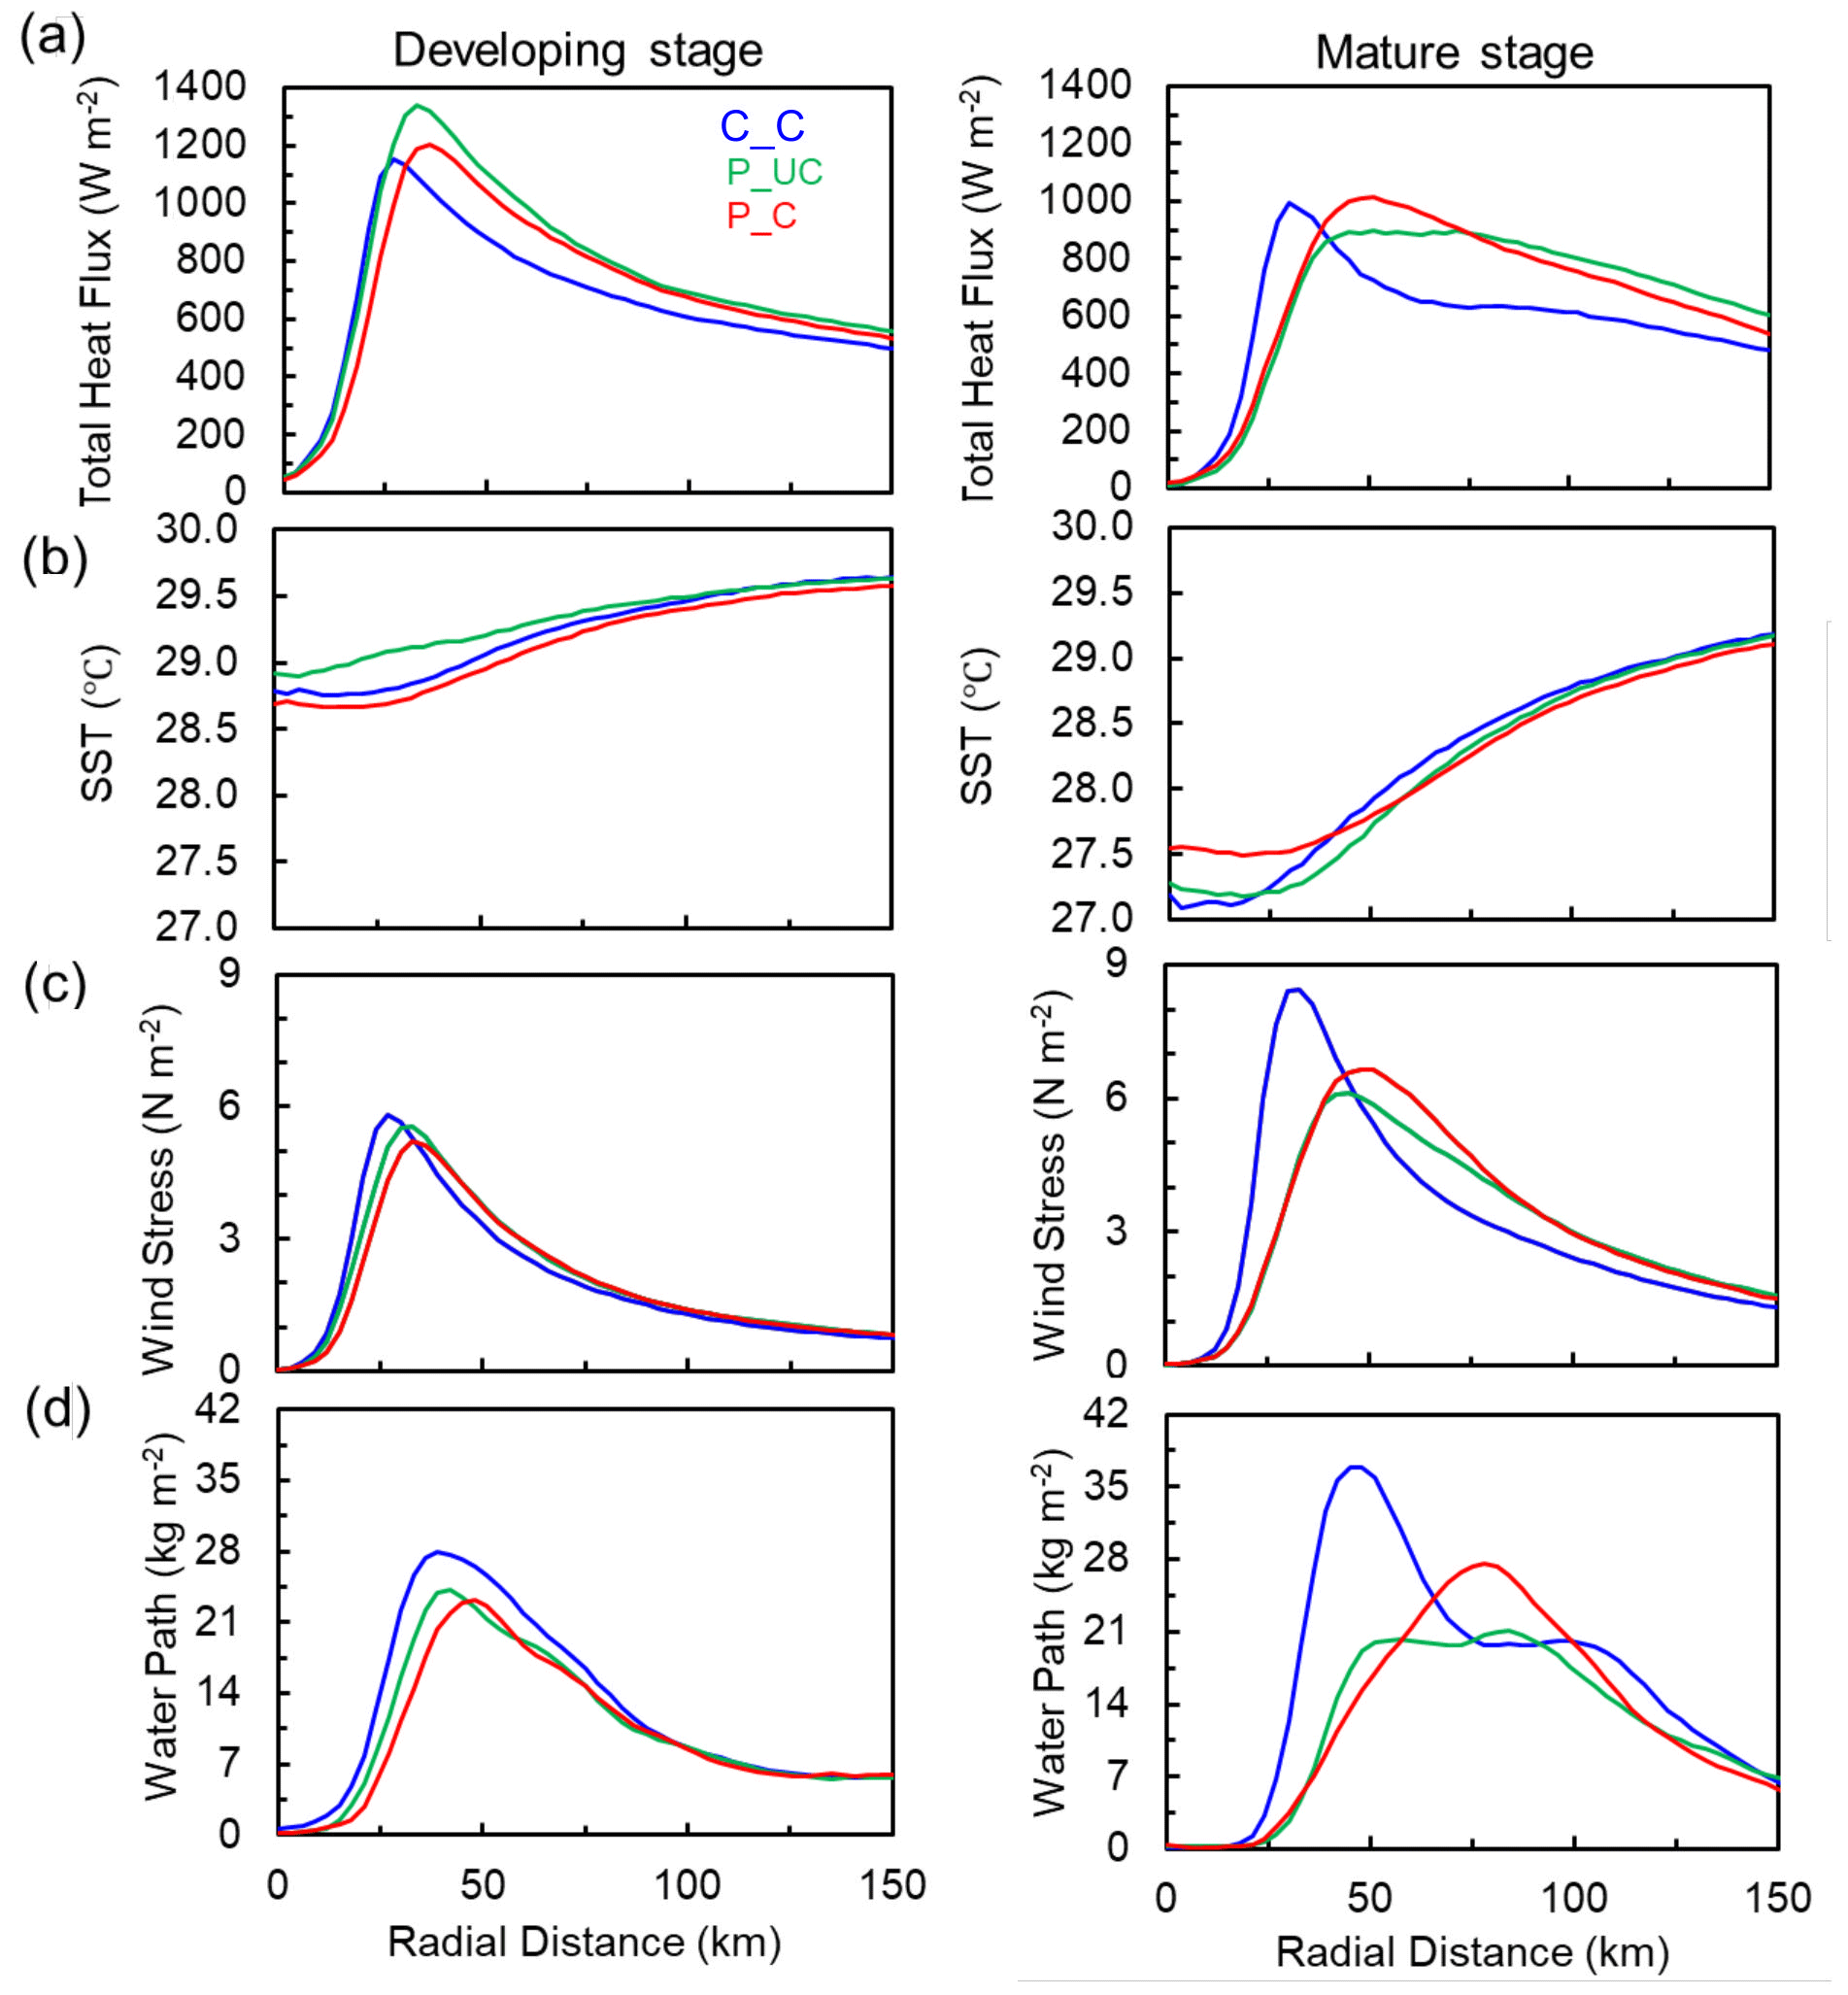
Figure 12Azimuthally averaged radial profiles for (a) total heat flux at the ocean surface, (b) SST, (c) wind stress, and (d) total condensate water path for the C_C (blue), P_UC (green), and P_C (red) cases for the developing stage (15–28 h, left column) and mature stage (42–55 h, right column).
In this study, we quantitatively assess the aerosol microphysical effect and aerosol-induced ocean feedback on the development and destructiveness of a tropical cyclone (TC). For the first time, a 3-D atmosphere–ocean fully coupled regional model (WRF–ROMS) at the cloud-resolving scale was used to simulate Hurricane Katrina in order to investigate the aerosol–TC system with the inclusion of air–sea interaction.
Our atmosphere–ocean coupled modeling framework clearly detects a significant ocean response in SST induced by the aerosol effect as the storm approaches its mature stage (e.g., after 30 h of the WRF–ROMS simulation). Moreover, our study reveals that anthropogenic aerosols enlarge the air circulation of the storm as well as the rainbands, resulting in weakened storm intensity and delayed storm intensification. Comparison of the aerosol weakening effect between the simulations with and without ocean coupling suggests that ocean coupling can sustain a more significant aerosol effect at the storm dissipation stage. With a 5-fold increase in the aerosol concentration, the total precipitation within 100 km of the TC center during the mature stage increases by 22 % and 11 % with and without ocean coupling, respectively, suggesting a high flooding potential under elevated aerosol conditions, especially with the consideration of air–sea interaction. The integrated kinetic energy, which is an indicator of storm surge and strong wind damage potential, increases by 18 % from clean to polluted aerosol conditions over the entire hurricane lifecycle. The ocean feedback due to the aerosol effect (i.e., aerosol-modified ocean-coupling effect) on the TC intensity is minimal at the beginning stage but plays a significant role in precipitation distribution, especially as the TC approaches land with higher aerosol concentrations.
Our work elucidates the underlying mechanisms via which aerosols and ocean coupling affect storm structure and intensity as well as the destructive power, as depicted in Fig. 13. When TCs approach landfall, aerosols can invigorate the mixed- and ice-phase clouds in their periphery by serving as CCN with additional latent heat release aloft at the rainbands, thereby enhancing the outward propagation of vortex Rossby waves (VRWs) from the eyewall regions. The aerosol effect also induces a lower equivalent potential temperature in the inflow within the boundary layer because of evaporative cooling of rainbands, leading to reduced moist static energy transport to the storm center. More significant outward propagation of VRWs and less moist static energy supply leads to weakening of the storm eyewall but enlargement of the storm circulation. With the inclusion of the ocean-coupling effect, the vertical mixing cooling near the eyewall reciprocally increases the interaction between the near-surface flow and the aloft free-atmosphere flow, thereby providing larger surface heat flux near the eyewall to sustain the strength of the TC aloft. Overall, the combined aerosol effects result in a noticeably enhanced precipitation rate and strengthened storm destructiveness with an enhanced storm surge and enlarged circulation, both significantly contributing to coastal flooding.
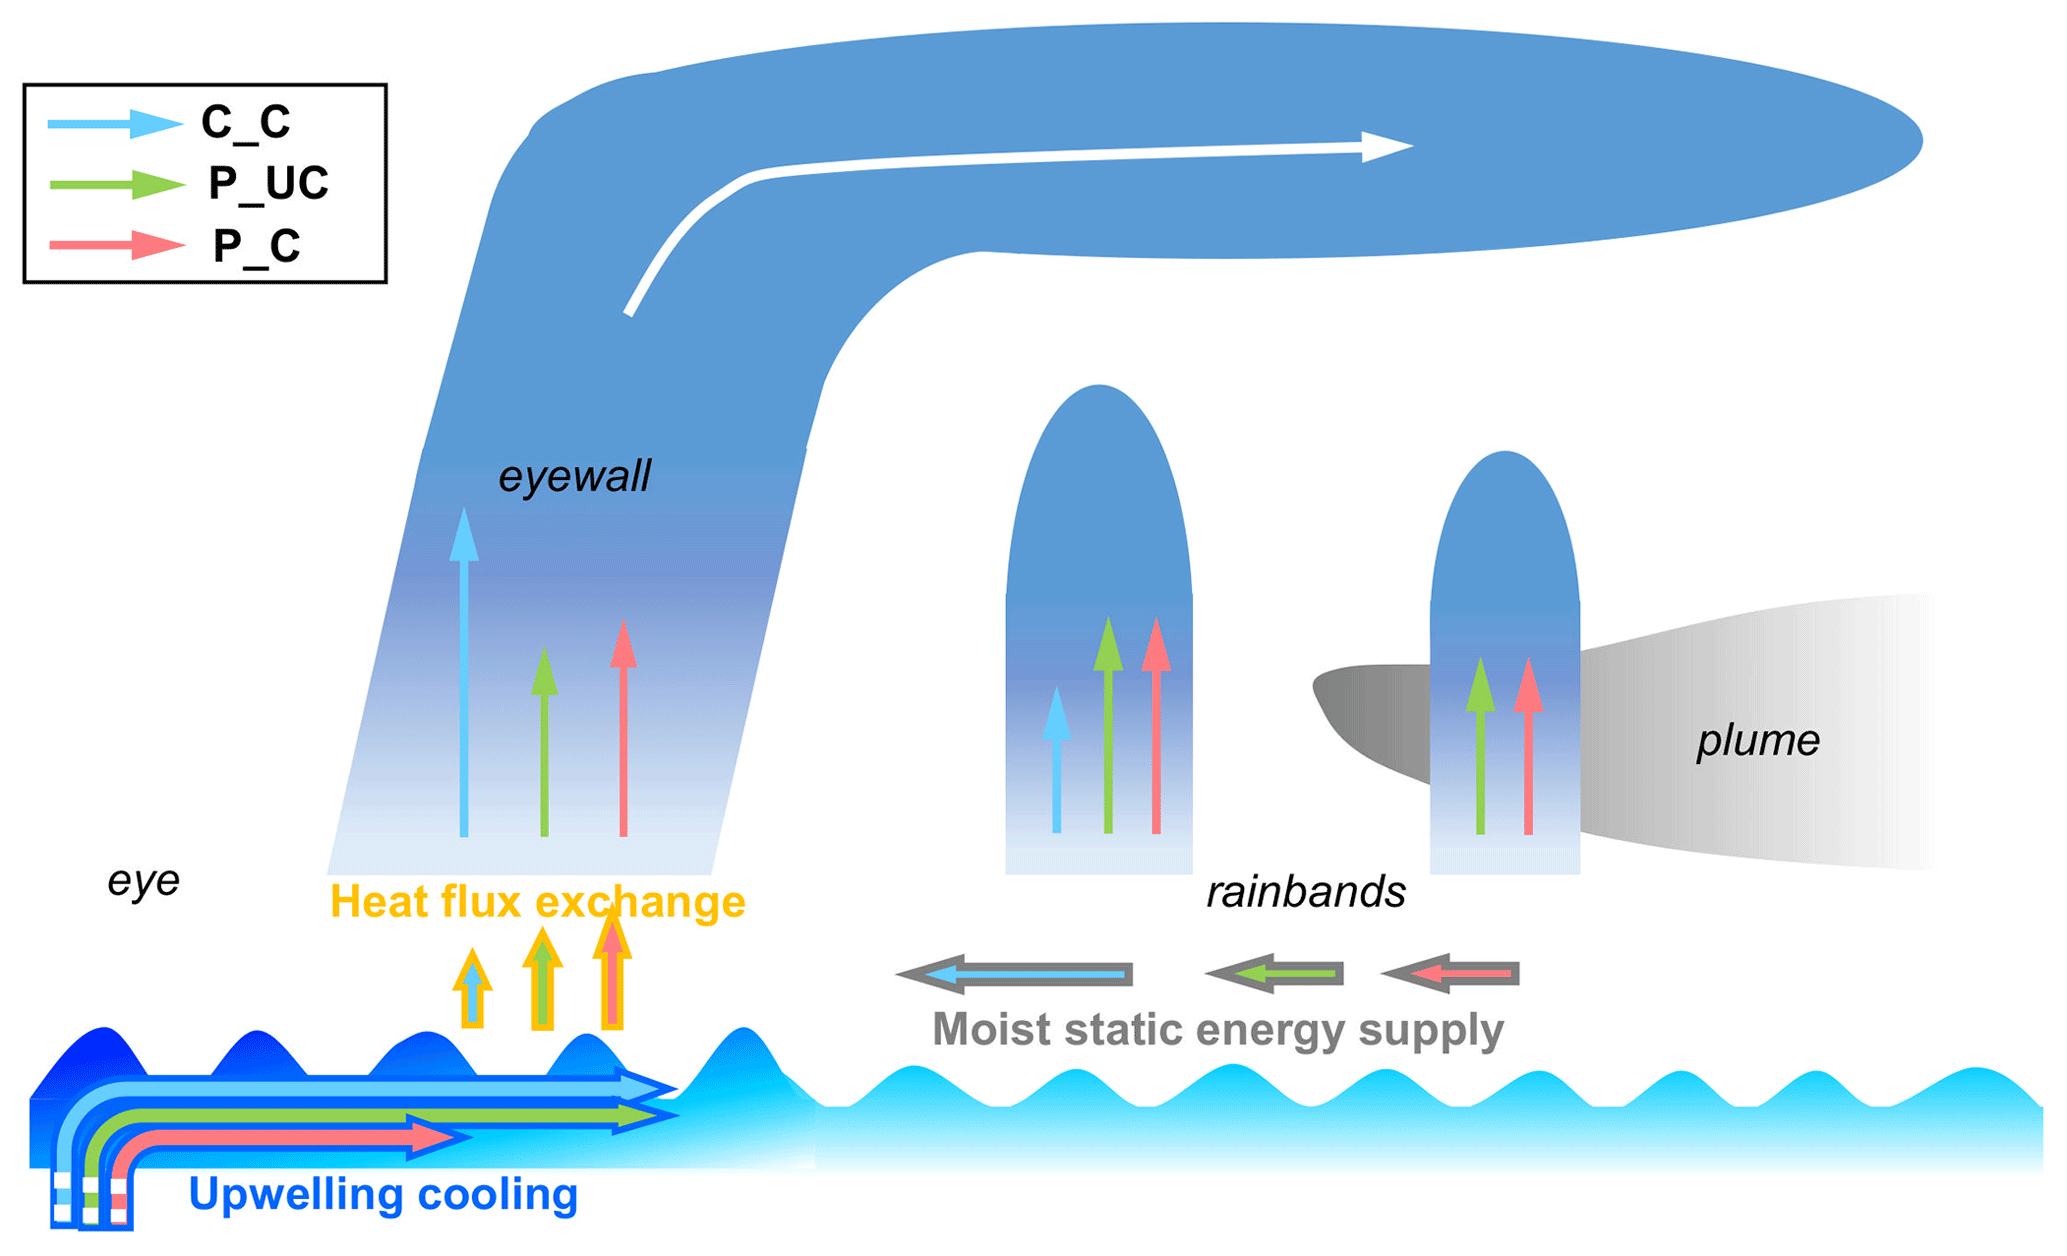
Figure 13A schematic of the effects of anthropogenic aerosols and ocean feedback on a hurricane. The development of a hurricane is characterized by convection in the outer rainbands and eyewall (vertical arrows). The moist static energy supply in the lower-level inflow (gray-edged horizontal arrows pointing from the outer rainbands to the storm core), the vertical mixing cooling in the ocean beneath the storm (blue-edged arrows starting in the deep ocean and pointing from the storm core to the outer rainbands), and the heat flux exchange between the ocean and the storm (orange-edged vertical arrows pointing from the ocean to the storm near the storm core) are depicted using different types of arrows. The aerosol microphysical effect in the polluted uncoupled case (P_UC, green arrows) enhances convection in outer rainbands by invigorating mixed-phase cloud processes, leading to drier and colder lower-level inflow to the storm core and a weakened eyewall. Comparing the polluted coupled case (P_C, red arrows) to the clean coupled case (C_C, blue arrows), the weakening of the storm intensity due to aerosols reduces the vertical mixing cooling in the ocean because of the smaller surface wind stress. Consequently, the increased sea-surface temperature further re-energizes storm circulation. Therefore, ocean coupling mitigates the aerosol weakening effect to some extent. The overall effect of aerosol microphysical effects and ocean coupling results in moderate enhancement of convection in the eyewall, stronger than that in the clean case (blue arrows) but weaker than that in the polluted uncoupled case.
Our study demonstrates that accurate prediction of TC development and destructiveness requires the representation of atmosphere–ocean coupling in hurricane forecast models, because of the significant vertical mixing cooling and its considerable feedbacks to the storm. Our results show that aerosols play a prominent role in modulating the TC storm intensity and structure with the inclusion of the ocean-coupling effect, corroborating the notion that the aerosol effects cannot be neglected in TC forecast models. Despite the case study conducted, the identified mechanisms and modeling technique used this study are generalizable to the study of aerosol–TC interactions. Specifically, the application of the 3D cloud-resolving, aerosol-aware atmosphere–ocean coupled modeling technique (i.e., WRF–ROMS) in this study paves the way for its utilization in investigating other case studies involving interactions between aerosols and TCs. Notably, our study showcases the superior performance of the WRF–ROMS model compared with a 1-D ocean model coupled with WRF with respect to accurately simulating vertical mixing and upwelling cooling under TC storms. Moreover, while acknowledging the case-specific nature of these relationships, it is conceivable that the elucidated physical mechanisms hold varying degrees of significance across diverse hurricane systems, contingent upon aerosol pollution conditions and thermodynamic contexts. Hence, the direct generalizability may vary, but the insights gleaned from our study can serve as a valuable reference point for future inquiries that seek to unravel the complexities of hurricane behavior under polluted oceanic conditions.
It is worth noting that our modeling study assumes no time-varying sources of aerosols during the model integration, which may introduce uncertainty in the simulated aerosol budget. In addition, the microphysical scheme used in our model does not link ice heterogeneous nucleation with the prognostic aerosols as ice-nucleating particles, and ice-nucleating particles have been shown to be crucial for ice-phase cloud simulations in convective storms (Jin et al., 2014; Zhao et al., 2019). Future improvements in the representations of the anthropogenic aerosols and their interactions with clouds in cloud-resolving models are necessary to advance the understanding of the aerosol–TC system with explicit representation of the air–sea interaction.
The code for the WRF model used in this study is available from https://www2.mmm.ucar.edu/wrf/users/download/get_source.html (Skamarock and Klemp, 2008). Instructions for acquiring the ROMS code can be found at https://www.myroms.org/ (Shchepetkin and McWilliams, 2005). A description of the coupling of WRF and ROMS can be found in Patricola et al. (2012, https://doi.org/10.1007/s00382-012-1320-5).
The hurricane Best Track Data were obtained from the Tropical Cyclone Report by the National Hurricane Center (https://www.nhc.noaa.gov/data/tcr/AL122005_Katrina.pdf, Knabb et al., 2023). The observed sea-level height data from the Dauphin Island, New Canal, and Shell Beach tide stations are available at https://tidesandcurrents.noaa.gov/stations.html?type=Water+Levels (NOAA, 2023). All of the WRF model simulation output used for this research can be downloaded from http://web.gps.caltech.edu/\textasciitildeyzw/share/LinY-2023-ACP (Wang, 2023).
The supplement related to this article is available online at: https://doi.org/10.5194/acp-23-13835-2023-supplement.
YW and RZ conceived and designed the research. YL, JH, and YW designed and performed the model simulation. All authors contributed to the model and observational data analyses and manuscript revision. YL and YW wrote the manuscript.
At least one of the (co-)authors is a member of the editorial board of Atmospheric Chemistry and Physics. The peer-review process was guided by an independent editor, and the authors also have no other competing interests to declare.
Publisher’s note: Copernicus Publications remains neutral with regard to jurisdictional claims made in the text, published maps, institutional affiliations, or any other geographical representation in this paper. While Copernicus Publications makes every effort to include appropriate place names, the final responsibility lies with the authors.
Jonathan H. Jiang acknowledges support from the Jet Propulsion Laboratory, California Institute of Technology, under contract with NASA. The authors also acknowledge computational support from the Texas A&M High Performance Research Computing (HPRC) facility.
Yuan Wang was supported by an NSF grant (grant no. AGS-2103714). Additional support was provided by the Welch A. Foundation (grant no. A-1417). Yun Lin was supported by an NSF grant (grant no. AGS-2103820) and a NASA CCST grant (grant no. 80NSSC23K0119).
This paper was edited by Hang Su and reviewed by two anonymous referees.
Bates, T. S., Quinn, P. K., Coffman, D., Schulz, K., Covert, D. S., Johnson, J. E., Williams, E. J., Lerner, B. M., Angevine, W. M., Tucker, S. C., Brewer, W. A., and Stohl, A.: Boundary layer aerosol chemistry during TexAQS/GoMACCS 2006: Insights into aerosol sources and transformation processes, J. Geophys. Res., 113, D00F01, https://doi.org/10.1029/2008JD010023, 2008.
Bender, M. A. and Ginis, I.: Real-case simulations of hurricane-ocean interaction using a high-resolution coupled model: Effects on hurricane intensity, Mon. Weather Rev., 128, 917–946, https://doi.org/10.1175/1520-0493(2000)128<0917:Rcsoho>2.0.Co;2, 2000.
Bender, M. A., Ginis, I., and Kurihara, Y.: Numerical simulations of tropical cyclone-ocean interaction with a high-resolution coupled model, J. Geophys. Res., 98, 23245–23263, https://doi.org/10.1029/93JD02370, 1993.
Binkowski, F. S. and Roselle, S. J.: Models-3 Community Multiscale Air Quality (CMAQ) model aerosol component 1. Model description, J. Geophys. Res., 108, 4183, https://doi.org/10.1029/2001JD001409, 2003.
Black, P. G., D'Asaro, E. A., Sanford, T. B., Drennan, W. M., Zhang, J. A., French, J. R., Niiler, P. P., Terrill, E. J., and Walsh, E. J.: Air–sea exchange in hurricanes: synthesis of observations from the coupled boundary layer air–sea transfer experiment, B. Am. Meteorol. Soc., 88, 357–374, https://doi.org/10.1175/BAMS-88-3-357, 2007.
Chavas, D. R., Lin, N., Dong, W., and Lin, Y.: Observed tropical cyclone size revisited, J. Climate, 29, 2923–2939, https://doi.org/10.1175/jcli-d-15-0731.1, 2016.
Emanuel, K.: Increasing destructiveness of tropical cyclones over the past 30 years, Nature, 436, 686–688, https://doi.org/10.1038/nature03906, 2005.
Emanuel, K.: Assessing the present and future probability of Hurricane Harvey's rainfall, P. Natl. Acad. Sci. USA, 114, 12681–12684, https://doi.org/10.1073/pnas.1716222114, 2017.
Emanuel, K. A.: An air-sea interaction theory for tropical cyclones. Part I: Steady-state maintenance, J. Atmos. Sci., 43, 585–605, https://doi.org/10.1175/1520-0469(1986)043<0585:aasitf>2.0.co;2, 1986.
Fan, J., Zhang, R. Y., Li, G. H., Nielsen-Gammon, J., and Li, Z. Q.: Simulations of fine particulate matter (PM2.5) in Houston, Texas, J. Geophys. Res., 110, D16203, https://doi.org/10.1029/2005jd005805, 2005.
Fan, J., Zhang, R. Y., Li, G. H., and Tao, W. K.: Effects of aerosols and relative humidity on cumulus clouds, J. Geophys. Res., 112, D14204, https://doi.org/10.1029/2006jd008136, 2007a.
Fan, J., Zhang, R., Li, G., Tao, W.-K., and Li, X.: Simulations of cumulus clouds using a spectral microphysics cloud-resolving model, J. Geophys. Res., 112, D04201, https://doi.org/10.1029/2006jd007688, 2007b.
Fan, J. W., Zhang, R. Y., Collins, D., and Li, G. H.: Contribution of secondary condensable organics to new particle formation: A case study in Houston, Texas, Geophys. Res. Lett., 33, L15802, https://doi.org/10.1029/2006gl026295, 2006.
Fan, J. W., Rosenfeld, D., Zhang, Y. W., Giangrande, S. E., Li, Z. Q., Machado, L. A. T., Martin, S. T., Yang, Y., Wang, J., Artaxo, P., Barbosa, H. M. J., Braga, R. C., Comstock, J. M., Feng, Z., Gao, W. H., Gomes, H. B., Mei, F., Pöhlker, C., Pöhlker, M. L., Pöschl, U., and de Souza, R. A. F.: Substantial convection and precipitation enhancements by ultrafine aerosol particles, Science, 359, 411–418, https://doi.org/10.1126/science.aan8461, 2018.
Fritz, H. M., Blount, C., Sokoloski, R., Singleton, J., Fuggle, A., McAdoo, B. G., Moore, A., Grass, C., and Tate, B.: Hurricane Katrina storm surge distribution and field observations on the Mississippi Barrier Islands, Estuar. Coast. Shelf S., 74, 12–20, https://doi.org/10.1016/j.ecss.2007.03.015, 2007.
Fritz, H. M., Blount, C., Sokoloski, R., Singleton, J., Fuggle, A., McAdoo, B. G., Moore, A., Grass, C., and Tate, B.: Hurricane Katrina storm surge reconnaissance, J. Geotech. Geoenviron., 134, 644–656, https://doi.org/10.1061/(Asce)1090-0241(2008)134:5(644), 2008.
Green, B. W. and Zhang, F.: Impacts of air–sea flux parameterizations on the intensity and structure of tropical cyclones, Mon. Weather Rev., 141, 2308–2324, https://doi.org/10.1175/MWR-D-12-00274.1, 2013.
Herbener, S. R., van den Heever, S. C., Carrió, G. G., Saleeby, S. M., and Cotton, W. R.: Aerosol indirect effects on idealized tropical cyclone dynamics, J. Atmos. Sci., 71, 2040–2055, https://doi.org/10.1175/jas-d-13-0202.1, 2014.
Houze, R. A., Chen, S. S., Smull, B. F., Lee, W.-C., and Bell, M. M.: Hurricane intensity and eyewall replacement, Science, 315, 1235–1239, https://doi.org/10.1126/science.1135650, 2007.
Jin, Y., Wang, S. P., Nachamkin, J., Doyle, J. D., Thompson, G., Grasso, L., Holt, T., Moskaitis, J., Jin, H., Hodur, R. M., Zhao, Q. Y., Liu, M., and DeMaria, M.: The Impact of Ice Phase Cloud Parameterizations on Tropical Cyclone Prediction, Mon. Weather Rev., 142, 606–625, https://doi.org/10.1175/Mwr-D-13-00058.1, 2014.
Khain, A., Cohen, N., Lynn, B., and Pokrovsky, A.: Possible aerosol effects on lightning activity and structure of hurricanes, J. Atmos. Sci., 65, 3652–3677, https://doi.org/10.1175/2008JAS2678.1, 2008.
Khain, A., Lynn, B., and Dudhia, J.: Aerosol effects on intensity of landfalling hurricanes as seen from simulations with the WRF model with spectral bin microphysics, J. Atmos. Sci., 67, 365–384, https://doi.org/10.1175/2009JAS3210.1, 2010.
Khain, A., Lynn, B., and Shpund, J.: High resolution WRF simulations of Hurricane Irene: Sensitivity to aerosols and choice of microphysical schemes, Atmos. Res., 167, 129–145, https://doi.org/10.1016/j.atmosres.2015.07.014, 2016.
Khain, A. P. and Ginis, I.: The mutual response of a moving tropical cyclone and the ocean, Beitr. Phys. Atmos., 64, 125–141, 1991.
Knabb, R. D., Rhome, J. R., and Brown, D. P.: Tropical Cyclone Report Hurricane Katrina 23–30 August 2005, National Hurricane Center, https://www.nhc.noaa.gov/data/tcr/AL122005_Katrina.pdf (last access: 16 August 2023), 2023.
Knutson, T., Camargo, S. J., Chan, J. C. L., Emanuel, K., Ho, C. H., Kossin, J., Mohapatra, M., Satoh, M., Sugi, M., Walsh, K., and Wu, L. G.: Tropical cyclones and climate change assessment: Part I: detection and attribution, B. Am. Meteorol. Soc., 100, 1987–2007, https://doi.org/10.1175/Bams-D-18-0189.1, 2019.
Levy, M. E., Zhang, R. Y., Khalizov, A. F., Zheng, J., Collins, D. R., Glen, C. R., Wang, Y., Yu, X. Y., Luke, W., Jayne, J. T., and Olaguer, E.: Measurements of submicron aerosols in Houston, Texas during the 2009 SHARP field campaign, J. Geophys. Res., 118, 10518–10534, https://doi.org/10.1002/jgrd.50785, 2013.
Li, G., Wang, Y., and Zhang, R.: Implementation of a two-moment bulk microphysics scheme to the WRF model to investigate aerosol-cloud interaction, J. Geophys. Res., 113, D15211, https://doi.org/10.1029/2007jd009361, 2008.
Li, G., Wang, Y., Lee, K.-H., Diao, Y., and Zhang, R.: Impacts of aerosols on the development and precipitation of a mesoscale squall line, J. Geophys. Res., 114, D17205, https://doi.org/10.1029/2008jd011581, 2009.
Lin, Y., Zhao, M., and Zhang, M.: Tropical cyclone rainfall area controlled by relative sea surface temperature, Nat. Commun., 6, 6591, https://doi.org/10.1038/ncomms7591, 2015.
Lin, Y., Wang, Y., Pan, B., Hu, J., Liu, Y., and Zhang, R.: Distinct Impacts of Aerosols on an Evolving Continental Cloud Complex during the RACORO Field Campaign, J. Atmos. Sci., 73, 3681–3700, https://doi.org/10.1175/jas-d-15-0361.1, 2016.
Liu, W. T., Katsaros, K. B., and Businger, J. A.: Bulk parameterization of air-sea exchanges of heat and water vapor including the molecular constraints at the interface, J. Atmos. Sci., 36, 1722–1735, https://doi.org/10.1175/1520-0469(1979)036<1722:bpoase>2.0.co;2, 1979.
Lynn, B. H., Khain, A. P., Bao, J. W., Michelson, S. A., Yuan, T., Kelman, G., Rosenfeld, D., Shpund, J., and Benmoshe, N.: The sensitivity of hurricane Irene to aerosols and ocean coupling: simulations with WRF spectral bin microphysics, J. Atmos. Sci., 73, 467–486, https://doi.org/10.1175/jas-d-14-0150.1, 2016.
Ma, Z., Fei, J., Liu, L., Huang, X., and Cheng, X.: Effects of the cold core eddy on tropical cyclone intensity and structure under idealized air–sea interaction conditions, Mon. Weather Rev., 141, 1285–1303, https://doi.org/10.1175/mwr-d-12-00123.1, 2013.
Montgomery, M. T. and Kallenbach, R. J.: A theory for vortex Rossby-waves and its application to spiral bands and intensity changes in hurricanes, Q. J. Roy. Meteor. Soc., 123, 435–465, https://doi.org/10.1002/qj.49712353810, 1997.
NOAA (National Oceanic and Atmospheric Administration): Water level data, NOAA Tides and Currents [data set], https://tidesandcurrents.noaa.gov/stations.html?type=Water+Levels (last access: 7 July 2023), 2023.
NWS (National Weather Service): A theory for vortex rossby-waves and its application to spiral bands and intensity changes in hurricanes, https://www.weather.gov/mob/katrina (last access: 3 January 2022), 2016.
Orville, R. E., Huffines, G., Nielsen-Gammon, J., Zhang, R. Y., Ely, B., Steiger, S., Phillips, S., Allen, S., and Read, W.: Enhancement of cloud-to-ground lightning over Houston, Texas, Geophys. Res. Lett., 28, 2597–2600, https://doi.org/10.1029/2001gl012990, 2001.
Pan, B., Wang, Y., Hu, J., Lin, Y., Hsieh, J.-S., Logan, T., Feng, X., Jiang, J. H., Yung, Y. L., and Zhang, R.: Impacts of Saharan dust on Atlantic regional climate and implications for tropical cyclones, J. Climate, 31, 7621–7644, https://doi.org/10.1175/jcli-d-16-0776.1, 2018.
Pan, B. W., Wang, Y., Logan, T., Hsieh, J. S., Jiang, J. H., Li, Y. X., and Zhang, R. Y.: Determinant role of aerosols from industrial sources in hurricane Harvey's catastrophe, Geophys. Res. Lett., 47, e2020GL090014, https://doi.org/10.1029/2020GL090014, 2020.
Patricola, C. M., Chang, P., Li, M., Saravanan, R., Xu, Z., and Hsieh, J.-S.: An investigation of tropical Atlantic bias in a high-resolution coupled regional climate model, Clim. Dynam., 39, 2443–2463, https://doi.org/10.1007/s00382-012-1320-5, 2012.
Rosenfeld, D., Clavner, M., and Nirel, R.: Pollution and dust aerosols modulating tropical cyclones intensities, Atmos. Res., 102, 66–76, https://doi.org/10.1016/j.atmosres.2011.06.006, 2011.
Rosenfeld, D., Woodley, W. L., Khain, A., Cotton, W. R., Carrió, G., Ginis, I., and Golden, J. H.: Aerosol effects on microstructure and intensity of tropical cyclones, B. Am. Meteorol. Soc., 93, 987–1001, https://doi.org/10.1175/BAMS-D-11-00147.1, 2012.
Saha, S., Moorthi, S., Pan, H.-L., Wu, X., Wang, J., Nadiga, S., Tripp, P., Kistler, R., Woollen, J., Behringer, D., Liu, H., Stokes, D., Grumbine, R., Gayno, G., Wang, J., Hou, Y.-T., Chuang, H.-y., Juang, H.-M. H., Sela, J., Iredell, M., Treadon, R., Kleist, D., Delst, P. V., Keyser, D., Derber, J., Ek, M., Meng, J., Wei, H., Yang, R., Lord, S., Dool, H. v. d., Kumar, A., Wang, W., Long, C., Chelliah, M., Xue, Y., Huang, B., Schemm, J.-K., Ebisuzaki, W., Lin, R., Xie, P., Chen, M., Zhou, S., Higgins, W., Zou, C.-Z., Liu, Q., Chen, Y., Han, Y., Cucurull, L., Reynolds, R. W., Rutledge, G., and Goldberg, M.: The NCEP climate forecast system reanalysis, B. Am. Meteorol. Soc., 91, 1015–1058, https://doi.org/10.1175/2010bams3001.1, 2010.
Schade, L. R. and Emanuel, K. A.: The ocean's effect on the intensity of tropical cyclones: Results from a simple coupled atmosphere–ocean model, J. Atmos. Sci., 56, 642–651, https://doi.org/10.1175/1520-0469(1999)056<0642:toseot>2.0.co;2, 1999.
Shchepetkin, A. F. and McWilliams, J. C.: The regional oceanic modeling system (ROMS): a split-explicit, free-surface, topography-following-coordinate oceanic model, Ocean Model., 9, 347–404, https://doi.org/10.1016/j.ocemod.2004.08.002, 2005 (code available at: https://www.myroms.org/, last access: 3 January 2022).
Shi, J. J., Braun, S. A., Tao, Z., and Matsui, T.: Influence of the Saharan Air Layer on Hurricane Nadine (2012). Part I: Observations from the Hurricane and Severe Storm Sentinel (HS3) Investigation and Modeling Results, Mon. Weather Rev., 149, 3541–3562, https://doi.org/10.1175/MWR-D-20-0344.1, 2021.
Shpund, J., Khain, A., and Rosenfeld, D.: Effects of Sea Spray on Microphysics and Intensity of Deep Convective Clouds Under Strong Winds, J. Geophys. Res., 124, 9484–9509, https://doi.org/10.1029/2018jd029893, 2019.
Skamarock, W. C. and Klemp, J. B.: A time-split nonhydrostatic atmospheric model for weather research and forecasting applications, J. Comput. Phys., 227, 3465–3485, https://doi.org/10.1016/j.jcp.2007.01.037, 2008 (code available at: https://www2.mmm.ucar.edu/wrf/users/download/get_source.html, last access: 3 January 2022).
Souri, A. H., Choi, Y., Kodros, J. K., Jung, J., Shpund, J., Pierce, J. R., Lynn, B. H., Khain, A., and Chance, K.: Response of Hurricane Harvey's rainfall to anthropogenic aerosols: A sensitivity study based on spectral bin microphysics with simulated aerosols, Atmos. Res., 242, 104965, https://doi.org/10.1016/j.atmosres.2020.104965, 2020.
Sun, Y. and Zhao, C.: Influence of Saharan Dust on the Large-Scale Meteorological Environment for Development of Tropical Cyclone Over North Atlantic Ocean Basin, J. Geophys. Res., 125, e2020JD033454, https://doi.org/10.1029/2020JD033454, 2020.
Trenberth, K. E., Cheng, L. J., Jacobs, P., Zhang, Y. X., and Fasullo, J.: Hurricane Harvey links to ocean heat content and climate change adaptation, Earths Future, 6, 730–744, https://doi.org/10.1029/2018ef000825, 2018.
van Oldenborgh, G. J., van der Wiel, K., Sebastian, A., Singh, R., Arrighi, J., Otto, F., Haustein, K., Li, S. H., Vecchi, G., and Cullen, H.: Attribution of extreme rainfall from Hurricane Harvey, August 2017, Environ. Res. Lett., 12, 124009, https://doi.org/10.1088/1748-9326/aa9ef2, 2017.
Wang, Y., Wan, Q., Meng, W., Liao, F., Tan, H., and Zhang, R.: Long-term impacts of aerosols on precipitation and lightning over the Pearl River Delta megacity area in China, Atmos. Chem. Phys., 11, 12421–12436, https://doi.org/10.5194/acp-11-12421-2011, 2011.
Wang, Y., Lee, K.-H., Lin, Y., Levy, M., and Zhang, R.: Distinct effects of anthropogenic aerosols on tropical cyclones, Nat. Clim. Change, 4, 368–373, https://doi.org/10.1038/nclimate2144, 2014.
Wang, Y., Vogel, J. M., Lin, Y., Pan, B., Hu, J., Liu, Y., Dong, X., Jiang, J. H., Yung, Y. L., and Zhang, R.: Aerosol microphysical and radiative effects on continental cloud ensembles, Adv. Atmos. Sci., 35, 234–247, https://doi.org/10.1007/s00376-017-7091-5, 2018.
Wang, Y.: WRF-ROMS model output, Caltech Server [dataset], http://web.gps.caltech.edu/~yzw/share/LinY-2023-ACP (last access: 18 August 2023), 2023.
Wang, Y. Q.: Vortex Rossby waves in a numerically simulated tropical cyclone. Part II: The role in tropical cyclone structure and intensity changes, J. Atmos. Sci., 59, 1239–1262, https://doi.org/10.1175/1520-0469(2002)059<1239:Vrwian>2.0.Co;2, 2002.
Woodruff, J. D., Irish, J. L., and Camargo, S. J.: Coastal flooding by tropical cyclones and sea-level rise, Nature, 504, 44–52, https://doi.org/10.1038/nature12855, 2013.
Yablonsky, R. M. and Ginis, I.: Limitation of one-dimensional ocean models for coupled hurricane–ocean model forecasts, Mon. Weather Rev., 137, 4410–4419, https://doi.org/10.1175/2009mwr2863.1, 2009.
Zhang, H., McFarquhar, G. M., Cotton, W. R., and Deng, Y.: Direct and indirect impacts of Saharan dust acting as cloud condensation nuclei on tropical cyclone eyewall development, Geophys. Res. Lett., 36, L06802, https://doi.org/10.1029/2009GL037276, 2009.
Zhang, K. M., Knipping, E. M., Wexler, A. S., Bhave, P. V., and Tonnesen, G. S.: Size distribution of sea-salt emissions as a function of relative humidity, Atmos. Environ., 39, 3373–3379, https://doi.org/10.1016/j.atmosenv.2005.02.032, 2005.
Zhang, R., Wang, G., Guo, S., Zamora, M. L., Ying, Q., Lin, Y., Wang, W., Hu, M., and Wang, Y.: Formation of urban fine particulate matter, Chem. Rev., 115, 3803–3855, https://doi.org/10.1021/acs.chemrev.5b00067, 2015.
Zhang, W., Villarini, G., Vecchi, G. A., and Smith, J. A.: Urbanization exacerbated the rainfall and flooding caused by hurricane Harvey in Houston, Nature, 563, 384–388, https://doi.org/10.1038/s41586-018-0676-z, 2018.
Zhao, B., Wang, Y., Gu, Y., Liou, K. N., Jiang, J. H., Fan, J., Liu, X., Huang, L., and Yung, Y. L.: Ice nucleation by aerosols from anthropogenic pollution, Nat. Geosci., 12, 602–607, https://doi.org/10.1038/s41561-019-0389-4, 2019.
Zhao, C. F., Lin, Y. L., Wu, F., Wang, Y., Li, Z. Q., Rosenfeld, D., and Wang, Y.: Enlarging rainfall area of tropical cyclones by atmospheric aerosols, Geophys. Res. Lett., 45, 8604–8611, https://doi.org/10.1029/2018gl079427, 2018.