the Creative Commons Attribution 4.0 License.
the Creative Commons Attribution 4.0 License.
 | 25 Jan 2023
Airborne glyoxal measurements in the marine and continental atmosphere: comparison with TROPOMI observations and EMAC simulations
Flora Kluge
Tilman Hüneke
Christophe Lerot
Simon Rosanka
Meike K. Rotermund
Domenico Taraborrelli
Benjamin Weyland
Klaus Pfeilsticker
We report on airborne limb and nadir measurements of vertical profiles and total vertical column densities (VCDs) of glyoxal (C2H2O2) in the troposphere, which were performed aboard the German research aircraft HALO (High Altitude and LOng Range) in different regions and seasons around the globe between 2014 and 2019. The airborne nadir and integrated limb profiles agree excellently among each other. Our airborne observations are further compared to collocated glyoxal measurements of the TROPOspheric Monitoring Instrument (TROPOMI), with good agreement between both data sets for glyoxal observations in (1) pristine terrestrial, (2) pristine marine, (3) mixed polluted, and (4) biomass-burning-affected air masses with high glyoxal concentrations. Exceptions to the overall good agreement are observations of (1) faint and aged biomass burning plumes over the oceans and (2) of low-lying biomass burning or anthropogenic plumes in the terrestrial or marine boundary layer, both of which contain elevated glyoxal that is mostly not captured by TROPOMI. These differences in airborne and satellite-detected glyoxal are most likely caused by the overall small contribution of plumes of a limited extent to the total glyoxal absorption in the atmosphere and the difficulty in remotely detecting weak absorbers located close to low reflective surfaces (e.g. the ocean in the visible wavelength range) or within dense aerosol layers. Observations of glyoxal in aged biomass burning plumes (e.g. observed over the tropical Atlantic off the coast of West Africa in summer 2018, off the coast of Brazil by the end of the dry season 2019, and the East China Sea in spring 2018) could be traced back to related wildfires, such as a plume crossing over the Drake Passage that originated from the Australian bushfires in late 2019. Our observations of glyoxal in such aged biomass burning plumes confirm recent findings of enhanced glyoxal and presumably secondary organic aerosol (SOA) formation in aged wildfire plumes from yet-to-be-identified, longer-lived organic precursor molecules (e.g. aromatics, acetylene, or aliphatic compounds) co-emitted in the fires. Furthermore, elevated glyoxal (median 44 ppt – parts per trillion), as compared to other marine regions (median 10–19 ppt), is observed in the boundary layer over the tropical oceans, which is well in agreement with previous reports. The airborne data sets are further compared to glyoxal simulations performed with the global atmosphere chemistry model EMAC (ECHAM/MESSy Atmospheric Chemistry). When using an EMAC set up that resembles recent EMAC studies focusing on complex chemistry, reasonable agreement is found for pristine air masses (e.g. the unperturbed free and upper troposphere), but a notable glyoxal overestimation of the model exists for regions with high emissions of glyoxal and glyoxal-producing volatile organic compounds (VOCs) from the biosphere (e.g. the Amazon). In all other investigated regions, the model underpredicts glyoxal to varying degrees, in particular when probing mixed emissions from anthropogenic activities (e.g. over continental Europe, the Mediterranean, and East China Sea) and potentially from the sea (e.g. the tropical oceans). Also, the model tends to largely underpredict glyoxal in city plumes and aged biomass burning plumes. The potential causes for these differences are likely to be multifaceted, but they all point to missing glyoxal sources from the degradation of the mixture of potentially longer-chained organic compounds emitted from anthropogenic activities, biomass burning, and from the organic microlayer of the sea surface.
- Article
(9903 KB) - Full-text XML
- BibTeX
- EndNote


Glyoxal (C2H2O2), the simplest α-dicarbonyl, has significant importance in air quality and climate due to its role as an intermediary in the oxidation of hydrocarbons (e.g. Finlayson-Pitts and Pitts, 1986; Volkamer et al., 2001; Fu et al., 2008; Myriokefalitakis et al., 2008; Vrekoussis et al., 2009; Nishino et al., 2010; Li et al., 2016; Chan Miller et al., 2017; Wennberg et al., 2018) and as an important precursor for secondary organic aerosol (SOA) formation and, thus, for the aerosol forcing of climate (e.g. Jang and Kamens, 2001; Liggio et al., 2005b; Volkamer et al., 2007; Lim et al., 2013; Knote et al., 2014; Kim et al., 2022).
The global sources of glyoxal are estimated to be 45 Tg a−1 (Fu et al., 2008), and the largest single source (∼47 %) is believed to be the oxidation of isoprene emitted by vegetation (e.g. Myriokefalitakis et al., 2008; Li et al., 2016; Chan Miller et al., 2017; Wennberg et al., 2018). Precursor molecules of glyoxal that are mostly (but not exclusively) anthropogenically emitted include alkenes, acetylene, various aromatics, monoterpenes, and other volatile organic compounds (VOCs) with different yields (Volkamer et al., 2001; Fu et al., 2008; Nishino et al., 2010; Taraborrelli et al., 2021). A recent study found that, below 2 km altitude, the production of glyoxal in the city plume of the Seoul metropolitan area (South Korea) was mainly (∼59 %) caused by the oxidation of aromatics initiated by hydroxyl radicals (Kim et al., 2022). Glyoxal is also directly emitted in considerable amounts by biomass burning, together with a suite of organic glyoxal precursor molecules in seasonally and regionally amounts with large variations (e.g. Andreae, 2019; Akagi et al., 2011; Stockwell et al., 2015; Zarzana et al., 2017, 2018; Kluge et al., 2020).
The predominant photochemical loss process of glyoxal is photolysis and, to a lesser degree, reactions with OH radicals (Koch and Moortgat, 1998; Volkamer et al., 2005a; Tadić et al., 2006; Fu et al., 2008; Wennberg et al., 2018). The uptake of glyoxal on aerosols in polluted environments and on cloud particles can eventually compete with its photochemical losses (e.g. Volkamer et al., 2007; Kim et al., 2022), primarily due to its high water solubility (e.g. Zhou and Mopper, 1990; Kroll et al., 2005; Ip et al., 2009; Kampf et al., 2013) and oligomerisation potential (e.g. Whipple, 1970; Liggio et al., 2005a; Loeffler et al., 2006; Galloway et al., 2009). While the global mean lifetime of glyoxal is less than a few hours, in the sunlit polluted atmosphere, it can be as short as half an hour due to photolysis, reactions with OH, and heterogeneous uptake (Volkamer et al., 2007; Kim et al., 2022).
Accordingly, due to the varying source strength of glyoxal and its short lifetime, in pristine air its mixing ratios may range from several parts per trillion (ppt) to a few tens of ppt. For example, 7–23 ppt of glyoxal were found over the South Pacific (Lawson et al., 2015) or up to 10 ppt at the Cape Verde Atmospheric Observatory (CVAO; São Vicente island) over the tropical Atlantic (Walker et al., 2022). Furthermore, Mahajan et al. (2014) reported an average glyoxal mixing ratio of 25 ppt from 10 ship missions over the open oceans in different parts of the world. Contrary to the low glyoxal mixing ratios observed in the pristine marine environment, in polluted air, glyoxal mixing ratios may reach several 100 ppt (e.g. Lee et al., 1998; Volkamer et al., 2005a, 2007; Fu et al., 2008; Sinreich et al., 2010; Washenfelder et al., 2011; Baidar et al., 2013; Kaiser et al., 2015; Volkamer et al., 2015; Chan Miller et al., 2017; Kluge et al., 2020; Kim et al., 2022, and others) or even up to 1.6 ppb (parts per billion), as found over a tropical rainforest with large emissions of isoprene in Southeast Asia (MacDonald et al., 2012).
Glyoxal is detectable from space by satellites applying a similar technique (differential optical absorption spectroscopy – DOAS; Platt and Stutz, 2008) to that used for the airborne data in this study. Accordingly, since the first glyoxal observations of UV-Vis nadir-observing spectrometers (e.g. from the SCanning Imaging Absorption spectroMeter for Atmospheric CHartographY – SCIAMACHY; Wittrock et al., 2006), numerous studies with ever-increasing observation capabilities and spatial resolution have been reported for spaceborne measurements of vertical column densities (VCDs) of glyoxal (e.g. from the instruments OMI, Ozone Monitoring Instrument, and TROPOMI, TROPOspheric Monitoring Instrument; Stavrakou et al., 2009a; Vrekoussis et al., 2009; Lerot et al., 2010; Vrekoussis et al., 2010; Chan Miller et al., 2014; Alvarado et al., 2020, 2014; Lerot et al., 2021, and many others). These spaceborne measurements provided a wealth of new information on the worldwide sources, occurrence, and abundance of glyoxal and its relation to the photochemistry of VOCs and aerosols (e.g. Fu et al., 2008).
Simultaneous measurements of formaldehyde (CH2O) and glyoxal by satellites and airborne instruments complemented by modelling have been exploited to study its different sources (e.g. Stavrakou et al., 2009b; Lerot et al., 2010; Boeke et al., 2011; Chan Miller et al., 2014; Bauwens et al., 2016; Stavrakou et al., 2016), to elucidate the secondary aerosol formation from carbonyls (typically in the background atmosphere) and its fate in biomass burning plumes (e.g. Knote et al., 2014; Li et al., 2016; Lim et al., 2019), and, even more recently, to estimate the organic aerosol abundance (Liao et al., 2019). Ground-based, airborne, and spaceborne simultaneous measurements of formaldehyde and glyoxal and of the ratio were further helpful to study the glyoxal yield from isoprene oxidation in relation to formaldehyde, to specify the various hydrocarbon glyoxal precursors, to investigate the anthropogenic impact on rural photochemistry, and, more recently, to investigate the sources of glyoxal and the chemical evolution of VOCs in biomass burning plumes (e.g. Lee et al., 1998; Wittrock et al., 2006; Vrekoussis et al., 2010; DiGangi et al., 2012; MacDonald et al., 2012; Kaiser et al., 2015; Bauwens et al., 2016; Li et al., 2016; Chan Miller et al., 2017; Zarzana et al., 2017; Hoque et al., 2018; Behrens et al., 2019; Alvarado et al., 2020; Kluge et al., 2020).
Together with respective photochemical model simulations, some of the glyoxal observations point to deficits in our present understanding of atmospheric glyoxal. This includes the observation of unexpected large glyoxal concentrations in the marine boundary layer of the eastern Pacific up to 3000 km from the continental coast by shipborne (up to 140 ppt; Sinreich et al., 2010) and airborne measurements (32–36 ppt; Volkamer et al., 2015). These measurements revealed an as yet unknown marine source of glyoxal, possibly from ozone-driven reactions with the organic microlayer at the sea surface, which, in idealised seawater laboratory experiments, have been shown to produce glyoxal (Zhou et al., 2014) and/or secondary formation from oxidised VOC (OVOC) precursor molecules, such as acetaldehyde, acetylene, and others (Wang et al., 2019). Furthermore, unlike for formaldehyde, the models had still varying success in reproducing the glyoxal VCDs (Myriokefalitakis et al., 2008; Stavrakou et al., 2009a; Lerot et al., 2010). Moreover, in comparisons of satellite measurements from SCIAMACHY and the Global Ozone Monitoring Experiment–2 (GOME-2), several studies have found that the models underestimate global glyoxal emissions when not considering additional biogenic sources (Myriokefalitakis et al., 2008; Stavrakou et al., 2009a; Lerot et al., 2010). Finally, a recent study by Alvarado et al. (2020) found (unexpected) large amounts of glyoxal (and formaldehyde) in several-days-old air masses originating from Canadian wildfires in August 2018, which can only be reconciled with the source strength and lifetime of glyoxal if considering the secondary formation of glyoxal from OVOCs that were co-emitted from the fires.
Here, we report on airborne measurements of glyoxal concentrations (limb) and total vertical column densities (nadir) performed during eight missions from the German research aircraft HALO (High Altitude and LOng Range) in different regions of the globe between 2014 and 2019. The measurements are able to provide novel information on the sources and fate of glyoxal in the atmosphere and address aspects on some open issues in glyoxal and VOC research, as outlined above. This includes novel insights into the amount and vertical distribution of glyoxal in the polluted terrestrial (South America, Europe, and East Asia), polluted marine (East China and Mediterranean Sea; South American and West African coastlines), pristine terrestrial (South America), and pristine marine (South and North Atlantic) atmosphere. The observations may thus not only serve for a cross-validation of respective satellite observations but also simulations of atmosphere chemistry models to better assess the global budget of glyoxal, the role of glyoxal for the atmospheric oxidation capacity, and its contribution to secondary aerosol formation. Finally, our glyoxal profiles and VCDs measured in different regions and seasons may also serve as input for air mass calculations necessary to better infer the total atmospheric column densities of glyoxal from the various satellite observations (e.g. GOME-2, SCIAMACHY, OMI, and TROPOMI).
In the present study, the airborne nadir glyoxal measurements are corroborated and cross-validated by near-collocated observations of the TROPOMI satellite instrument. The limb and nadir measurements are further compared to simulations of the global ECHAM/MESSy Atmospheric Chemistry (EMAC) model. The specific scientific questions addressed in this publication include (1) the marine and terrestrial background of glyoxal and its potential sources, (2) the sources of glyoxal in the polluted atmosphere, (3) secondarily formed glyoxal in biomass burning plumes, and (4) its potential contribution to secondary aerosol formation.
The paper is organised as follows. Section 2 briefly describes the measurement technique and involved methods used in the present study. Section 3 reports on the deployment and measurements of the mini-DOAS instrument on eight missions of the HALO research aircraft into different regions from 2014 until 2019. Section 4 presents the airborne concentration and VCD measurements of glyoxal. The latter are then compared to collocated total atmospheric column density observations of glyoxal made from the TROPOMI instrument. Finally, both airborne data sets – glyoxal concentrations and VCDs – are compared to simulations of the global atmosphere chemistry model EMAC. Section 5 discusses the major findings and results, and Sect. 6 concludes and summarises the study.
2.1 The airborne mini-DOAS measurements
The airborne mini-DOAS measurements of ultraviolet, visible, and near-infrared (UV, Vis, and near-IR) absorbing gases involve (1) the simultaneous measurements of limb and nadir scattered skylight, (2) the DOAS analysis of the measured skylight spectra for the target gases (Platt and Stutz, 2008), and (3) forward radiative transfer modelling of the observations using the Monte Carlo model McArtim (Deutschmann et al., 2011). In a last step, trace gas concentrations are inferred from the limb observations by scaling the measured slant column densities (SCDs), using simultaneously measured SCDs of a scaling gas of a known concentration (e.g. O3) or the calculated (clear-sky) extinction of the collisional complex O2−O2 (hereafter O4; e.g. Hüneke, 2016; Hüneke et al., 2017; Stutz et al., 2017; Werner et al., 2017; Kluge et al., 2020; Rotermund et al., 2021). For the nadir observations, air mass factors are simulated using the same radiative transfer model (McArtim) to infer VCDs from the measured SCDs.
The presented study focuses on the nadir and limb measurements of O4 and glyoxal by the mini-DOAS instrument made aboard the German research aircraft HALO during a total of 72 research flights on eight scientific missions covering different regions of the globe. The processing of the measured data is mainly based on our previous study on O4, formaldehyde, and glyoxal (Kluge et al., 2020). Since some aspects of the data processing have changed since then, necessary details on these changes and refinements are provided in the following.
2.1.1 The mini-DOAS instrument
The mini-DOAS instrument is a UV/Vis/near-IR six-channel optical spectrometer which has been operated on board the HALO research aircraft since 2011. It detects and spectrally analyses nadir and limb scattered sunlight in the UV (310–440 nm, full width at half maximum (FWHM) = 0.47 nm), Vis (420–640 nm, FWHM = 1.0 nm), and near-IR (1100–1680 nm, FWHM = 10 nm) wavelength ranges (Hüneke, 2016; Hüneke et al., 2017). The six telescopes (field of view (FOV) 0.5∘ × 3.15∘) collect the skylight from fixed nadir and limb viewing geometries each in the UV, VIS, and near-IR channel. The limb telescopes can be adjusted to varying elevation angles (+5 to −90∘) when commanded but are normally aligned with a rate of 10 Hz at −0.5∘ below the horizon to compensate for the changing roll angle of the aircraft. Glass fibre bundles transmit the collected skylight to six optical spectrometers assembled in an evacuated (10−5 mbar) and thermostated housing (∼1 ∘C) in the otherwise unpressurised and uninsulated boiler room of the aircraft. In the limb geometry, the mini-DOAS instrument probes air masses perpendicular to the aircraft's flight direction on the starboard side, with typical photon path lengths in the visible wavelength range ranging from ∼10 km (at 2 km altitude) to about ∼100 km at the maximum flight altitude of the aircraft at around 15 km, depending on the wavelength, aerosol concentration, and cloud cover (see Fig. 2 in Kluge et al., 2020, and below). In the nadir observation mode, the instrument receives light from the surface and atmosphere below the flight altitude (Fig. 2). It thus preferably measures glyoxal below the aircraft, with a rectangular footprint of ∼600 m cross-track and several kilometres along-track (FOV 3.15∘ × 0.38∘), depending on the flight altitude, cruising velocity (typically ∼200 m s−1 in the upper troposphere), and signal integration time (up to 1 min). Furthermore, an Imaging Development Systems GmbH uEye camera (FOV 46∘) aligned with the limb telescopes provides images of the sampled atmosphere at 1 Hz resolution.
More details of the instrument design, its major features, and the deployment on the HALO aircraft, the measurement method, the spectral retrieval, and the data processing can be found in Hüneke et al. (2017).
2.1.2 The spectral retrieval
The measured skylight spectra are analysed using the DOAS technique (Platt and Stutz, 2008). The retrieval details such as wavelength ranges, included trace gases, and fitting parameters for each gas are provided in Tables 1 and 2.
Thalman and Volkamer (2013)Thalman and Volkamer (2013)Serdyuchenko et al. (2014)Serdyuchenko et al. (2014)Serdyuchenko et al. (2014)Vandaele et al. (1998)Rothman et al. (2009)Polyansky et al. (2018)Pope and Fry (1997)Chance and Orphal (2011)Volkamer et al. (2005b)Table 1Trace gas absorption cross sections used for the spectral retrieval. For H2O, gas phase (g) and liquid phase (l), absorption cross sections are used.
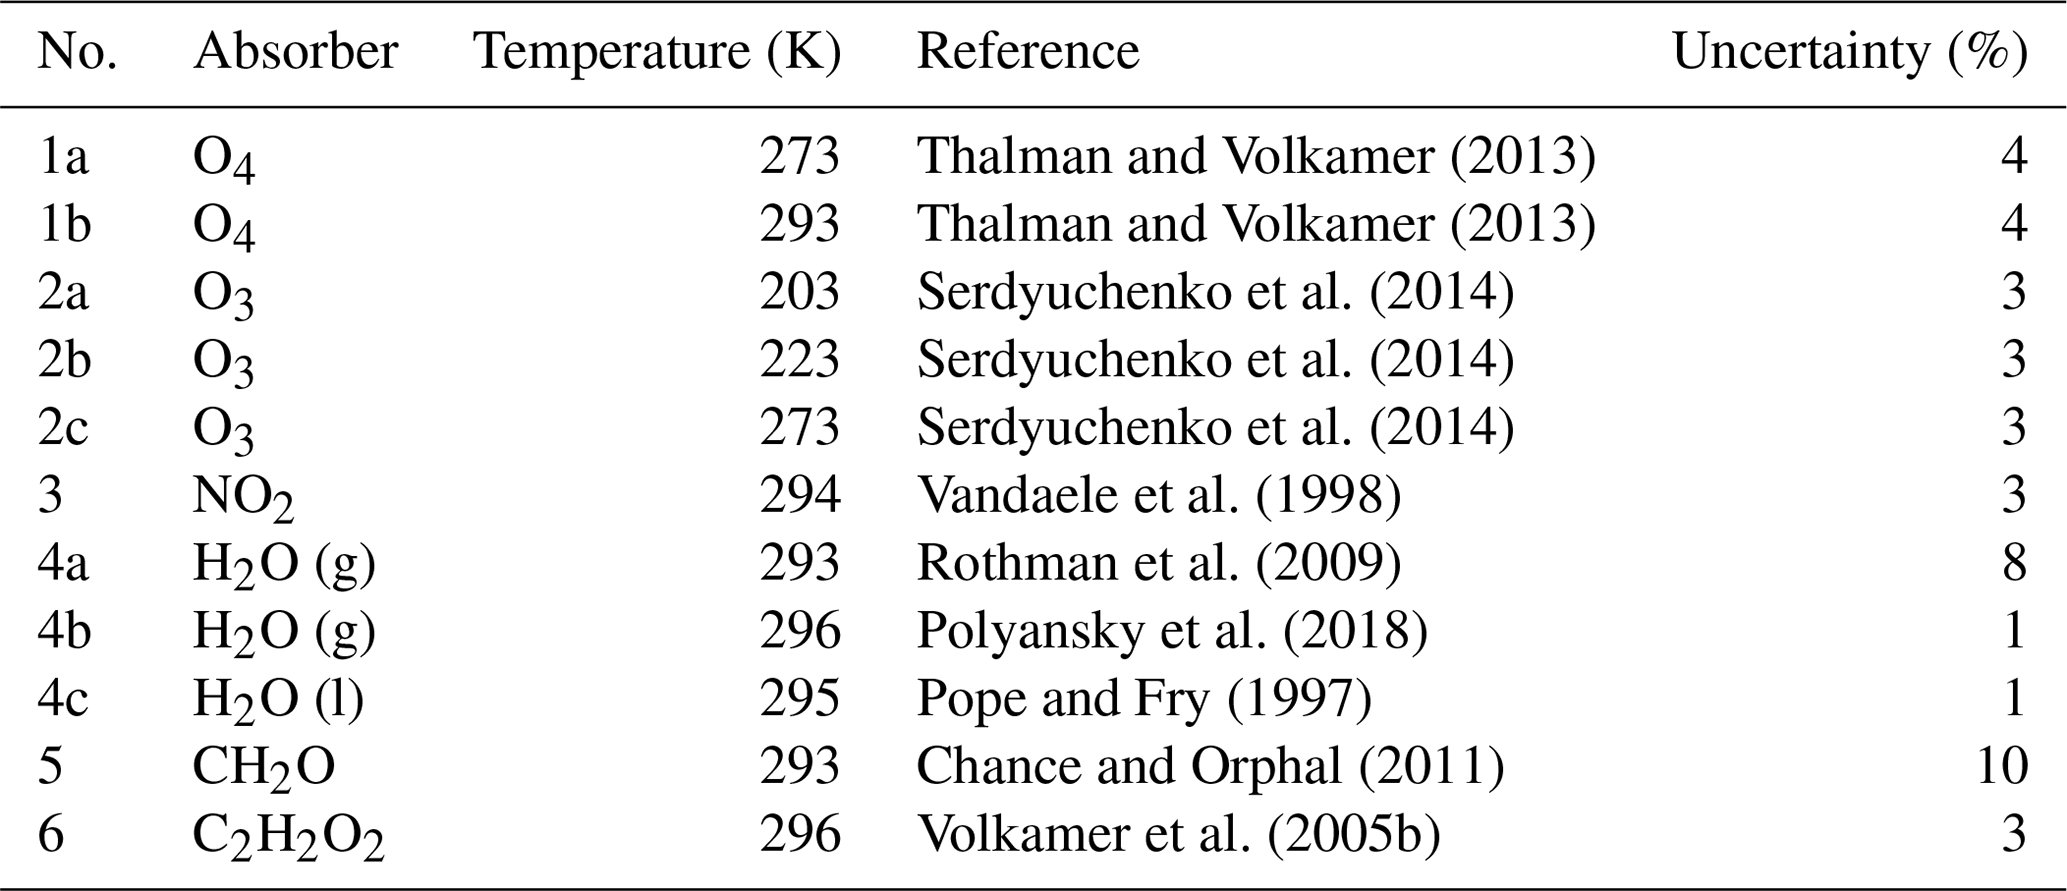
Table 2Details of the DOAS spectral analysis for the target trace gases.
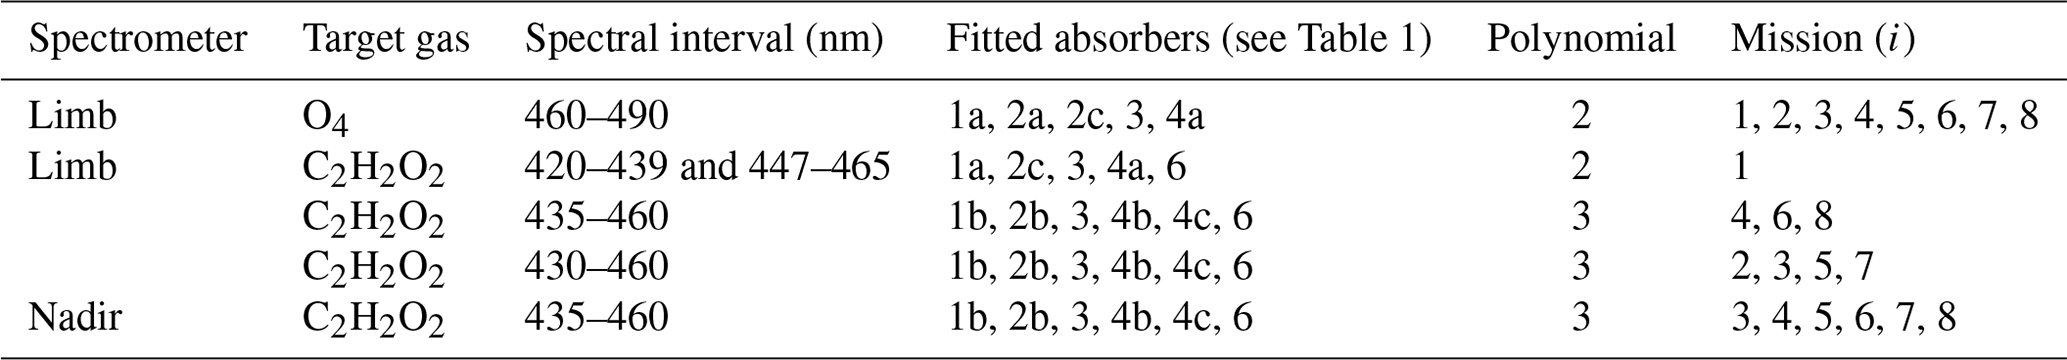
Additional parameters for all spectral retrievals are the (a) offset spectrum, (b) ring spectrum, and (c) ring spectrum multiplied by λ4. i represents ACRIDICON-CHUVA (1), OMO (2), EMeRGe-EU (3), WISE (4), EMeRGe-Asia (5), CoMet (6), CAFE-Africa (7), and SouthTRAC (8).
The spectral retrieval settings of the limb and nadir glyoxal observations are based on the recent TROPOMI glyoxal analysis from Lerot et al. (2021), in support of better comparability for both data sets (see Sect. 4.2). However, since the mini-DOAS measurements were not found to be significantly affected by changing NO2 concentrations, only a single NO2 absorption cross section (at a warmer temperature) is included in our analysis to account for the tropospheric NO2 absorption. A noteworthy difference in our recent glyoxal retrieval of the ACRIDICON (Aerosol, Cloud, Precipitation, and Radiation Interactions and Dynamics of Convective Cloud Systems)–CHUVA (Cloud Processes of the Main Precipitation Systems in Brazil) data is the use of a continuous fitting window ranging from 430 nm (or 435 nm for missions 4, 6, and 8 (numbering according to Sect. 3.1) and all nadir observations) to 460 nm instead of employing two simultaneous retrieval windows from 420 to 439 and 447 to 465 nm (Kluge et al., 2020). The comparison of both approaches (i.e. when performing the spectral analysis for each spectrum, with both based on one continuous and the two discrete wavelength ranges) yields an improvement in the spectral residuum by a factor of 3 when using the continuous retrieval window; however, there are comparable differential slant column density (dSCD) and signal-to-noise ratios from both approaches. For the processing of the data from different missions, minor adjustments to the retrieval settings (e.g. lower end of the analysed wavelength range or temperatures of the included absorption cross sections) are applied when needed. Primarily, these adjustments are necessary to compensate for mechanical modifications of the instrument and hence of the optical imaging (e.g. due to a fibre bundle replacement, which causes changes in the lower wavelength limit of the spectrometers) and due to the largely changing ambient conditions during the different research missions.
In particular for nadir observations in a moist atmosphere and above the ocean, the DOAS analysis of glyoxal is challenging due to its low optical density () and the proximity of the main absorption bands to the much stronger 7ν absorption band of water vapour (optical density of the order of 10−1; Wei et al., 2019). Therefore, for such observations, 5–150 consecutively measured skylight spectra are co-added in order to minimise potential spectral interferences, while optimising the signal-to-noise ratio, at the expense of enlarging the footprint of the affected measurements (as discussed in detail below).
Since the DOAS method infers a dSCD relative to a solar Fraunhofer reference spectrum (SCDref), the total slant column has to be inferred from the following:
For the glyoxal retrieval, SCDref is determined from a limb measurement which compromises between minimal solar zenith angle, minimal cloud fraction, and maximal flight altitude (above which insignificant or no glyoxal is expected). If a sufficient flight altitude was not reached during a particular flight (mostly EMeRGe-EU and EMeRGe-Asia missions), then a reference from a different research flight was chosen to fulfil the above conditions. For the retrieval of the O4 extinction, SCDref is determined using a high-resolution solar reference spectrum (Thuillier et al., 1998).
Based on an exposure time of 300 ms, a saturation of 60 %, and 100 co-added readouts (30 s integration time), the mini-DOAS detection limit for glyoxal is 2.6×10¹⁴ molec. cm−2 (Platt and Stutz, 2008). Depending on SCDref and the related air mass factors (Sect. 2.1.3) and hence the flight altitude for limb measurements, this results in a detection limit ranging from 1 ppt (during clear skies and for a light path of about 100 km at maximum cruising altitude of the aircraft) up to several 100 ppt (for very short line-of-sight photon paths, e.g. in dense clouds; Kluge et al., 2020). For the nadir measurements, the typical SCD detection limit is 1.5×10¹⁴ molec. cm−2, but depending on the flight altitude and cloud cover and thus the columnar air mass factor, it can be as low as 6.7×10¹³ molec. cm−2 or as large as 2.6×10¹⁴ molec. cm−2.
2.1.3 Retrieval of concentrations (limb) and vertical column densities (nadir)
The following section discusses the conversion of the inferred SCDs to mixing ratios (limb measurements) and to total vertical column densities (nadir measurements).
The limb-measured slant column densities (SCDlimb) are converted into trace gas mixing ratios using the O4 scaling method, as described in detail in Hüneke (2016), Hüneke et al. (2017), Stutz et al. (2017), Werner et al. (2017), and Kluge et al. (2020). Accordingly, the concentration of a trace gas [X] at flight altitude j is inferred from SCDlimb,X by comparing the measured optical depth SCD with the calculated clear-sky extinction and taking into account radiative-transfer-based correction factors and to quantify the optical characteristics (e.g. aerosol and cloud cover) of the radiative transfer during each single measurement, as follows:
This approach is justified based on the equivalence theorem in optics (Irvine, 1963), which states that, for a given wavelength, the photon path length distribution and hence the mean photon path lengths are the same for weak absorbers with similar atmospheric distributions. Evidently, this criterion is reasonably well approximated when using O4 as a scaling gas for all trace gases with sources at the ground level and sinks in the troposphere, such as glyoxal. The remaining differences in the profile shapes of the target (X) and scaling gas (O4) and their centre wavelengths of absorption are accounted for by the so-called α factors. The α factors express the fraction of absorption within the line of sight at the measurement altitude relative to the total atmospheric absorption, which may differ slightly for the gas of interest compared to the scaling gas due to their different profile shapes and absorption wavelengths. The α factors are simulated using the McArtim radiative transfer model (Deutschmann et al., 2011). For the simulation, as a first step, a priori profiles of glyoxal are used based on previous mini-DOAS measurements in similar atmospheric conditions (clean or polluted terrestrial air, remote marine air, etc.) and subsequently iterated until convergence is achieved. In the following, the robustness of this iterative approach is described and tested. As a first step, the radiative transfer (RT) model is run using an a priori glyoxal profile obtained during previous missions and assuming an exponentially decaying profile above the maximum flight altitude. Second, a modelled a priori glyoxal profile is used, which is based on simulations from the global chemical transport model (CTM) MAGRITTE (Model of Atmospheric composition at Global and Regional scales using Inversion Techniques for Trace gas Emissions). This model is used, for example, to calculate air mass factors for the TROPOMI retrieval (e.g. Bauwens et al., 2016; Lerot et al., 2021). Here, the simulated MAGRITTE glyoxal a priori profiles are averaged along a research flight track over central Europe on 15 May 2018. Both a priori profiles – simulated and measured – show notable differences in their absolute mixing ratios and in their profile shape (Fig. 1a and b). In the following, iterations of the radiative transfer simulation are performed for the flight on 15 May 2018 using consecutively resulting profiles from both approaches as new a priori profiles (Fig. 1a and b). Evidently, even strongly diverging a priori profiles converge well after the first iteration to a common profile constrained by the measured SCDs within the error margins. After four iterations, no notable changes are discernible in the obtained a priori profiles or in the resulting mixing ratios (Fig. 1c), thus demonstrating the robustness of the iteration with respect to the a priori profile assumptions. This insensitivity of the resulting profiles towards the assumed a priori profile is a direct consequence of the applied scaling method because all a priori profiles of the target gas are evaluated relative to the scaling gas (in this study O4) from which the atmospheric absorption is measured. Without iteration, the scaling method is therefore moderately sensitive to the relative differences in the assumed profile shapes (Fig. 1b) but not to the absolute concentrations assumed in the a priori profiles. As demonstrated above, this remaining sensitivity can sufficiently be reduced by performing a second iteration of the radiative transfer model when calculating the α factors.
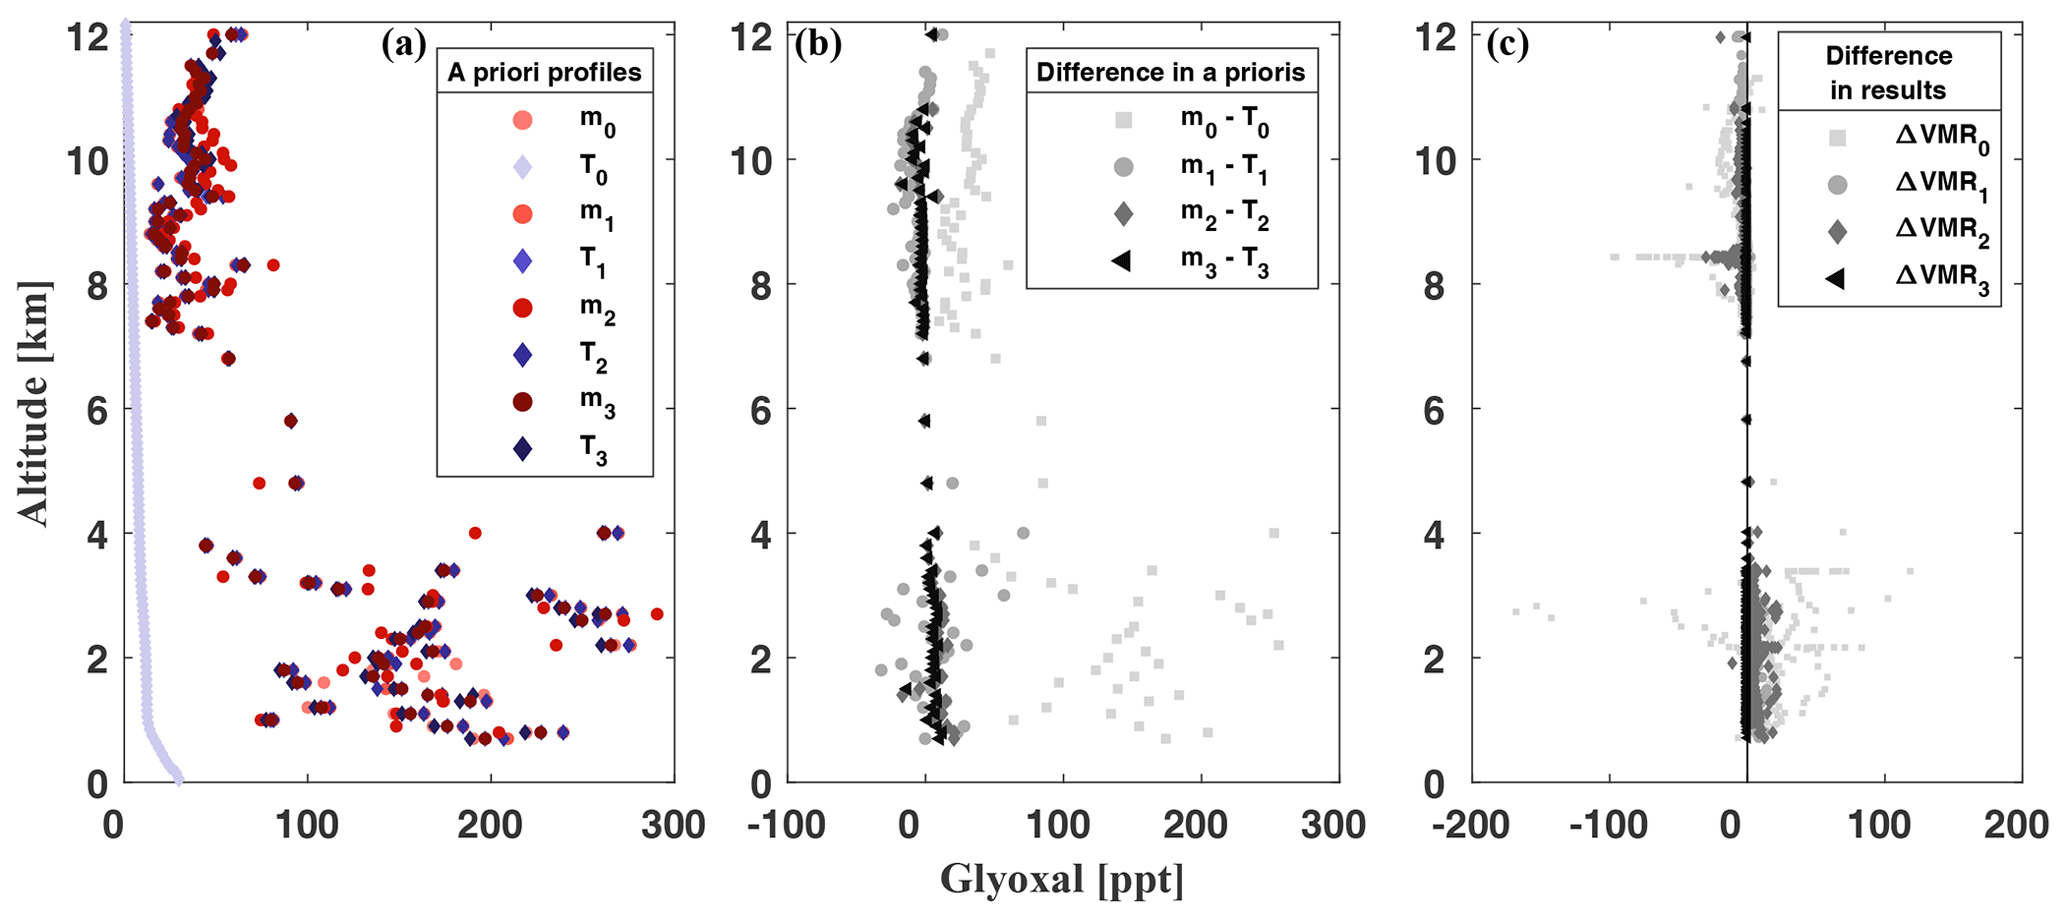
Figure 1Iterations of different a priori glyoxal profiles in α-factor calculations, shown here for the HALO flight on 15 May 2018 (CoMet mission). Starting a priori profiles are a mean glyoxal profile inferred from previous mini-DOAS measurements in polluted continental air (m0) and an averaged glyoxal profile simulated by the MAGRITTE model (T0) for a TROPOMI overpass over Europe at 13:30 UTC on 15 May 2018 (Lerot et al., 2021). These a priori profiles are used for the first iteration in the α-factor calculations. The resulting profiles are then used for the following i iterations to obtain the profiles mi and Ti, respectively (a). The differences mi−Ti in the a priori profiles after each iteration step are shown in panel (b). The differences in the resulting mixing ratios from each iteration step (based on the respective α-factor simulation) are shown in panel (c).
For the nadir measurements, the measured slant column densities (SCDnadir) of the trace gas X are converted into vertical column densities (VCDX), according to the following:
using box air mass factors Bj simulated by the McArtim model for each layer j of thickness zj, and equal a priori concentrations [X]j in each altitude bin j as used for the limb measurements.
The footprint (nadir) or average atmospheric volume (limb) analysed from each spectrum can be approximated based on the aircraft displacement (vertical and horizontal) during the spectrum integration time and the telescope's rectangular field of view (0.5∘ vertical; 3.15∘ horizontal) and the mean light path length. The latter two processes are considered in the evaluation and respective RT calculations.
In the nadir-viewing geometry, for flight altitudes above 8 km in a moderately humid to dry atmosphere, the typical footprint for a signal integration time of 14 s is 4.2×0.6 km2. For flights in a moist atmosphere or over the pristine oceans, occasionally up to 150 spectra were co-added (South Atlantic measurements), thus extending the median nadir along-track resolution in extreme cases up to 230 km. The median nadir along-track resolution over the South Atlantic is 32 km. While this spectral co-adding may enlarge the footprint, it favours the detection limit, which is helpful for monitoring glyoxal at low VCDs, i.e. far away from distinct sources such as over the open ocean. In the other regions, where less or no spectral co-adding was necessary, the median nadir along-track resolution is 4 km (Europe, Mediterranean, and East China Sea; tropical and North Atlantic).
2.1.4 Comparison of airborne and spaceborne nadir measurements
Quality filters already applied to the TROPOMI L3 data set (see Sects. 2.2 and 3.2 and Lerot et al., 2021), the different observation geometries of air- and spaceborne instruments, and, finally, the differences in the assumed a priori glyoxal profiles and the radiative transfer modelling may cause differences in the sensitivity of air- and spaceborne instruments when detecting glyoxal at different altitudes j. This sensitivity is expressed by the product of the box air mass factors Bj and the assumed concentration of glyoxal [X]j, which expresses the relative contribution of the absorption (or slant column density) of an altitude layer j to the total absorption (or slant column density; see Eq. 3 and Fig. 2). For the intercomparison, the available mini-DOAS data are therefore selected according to the following criteria.
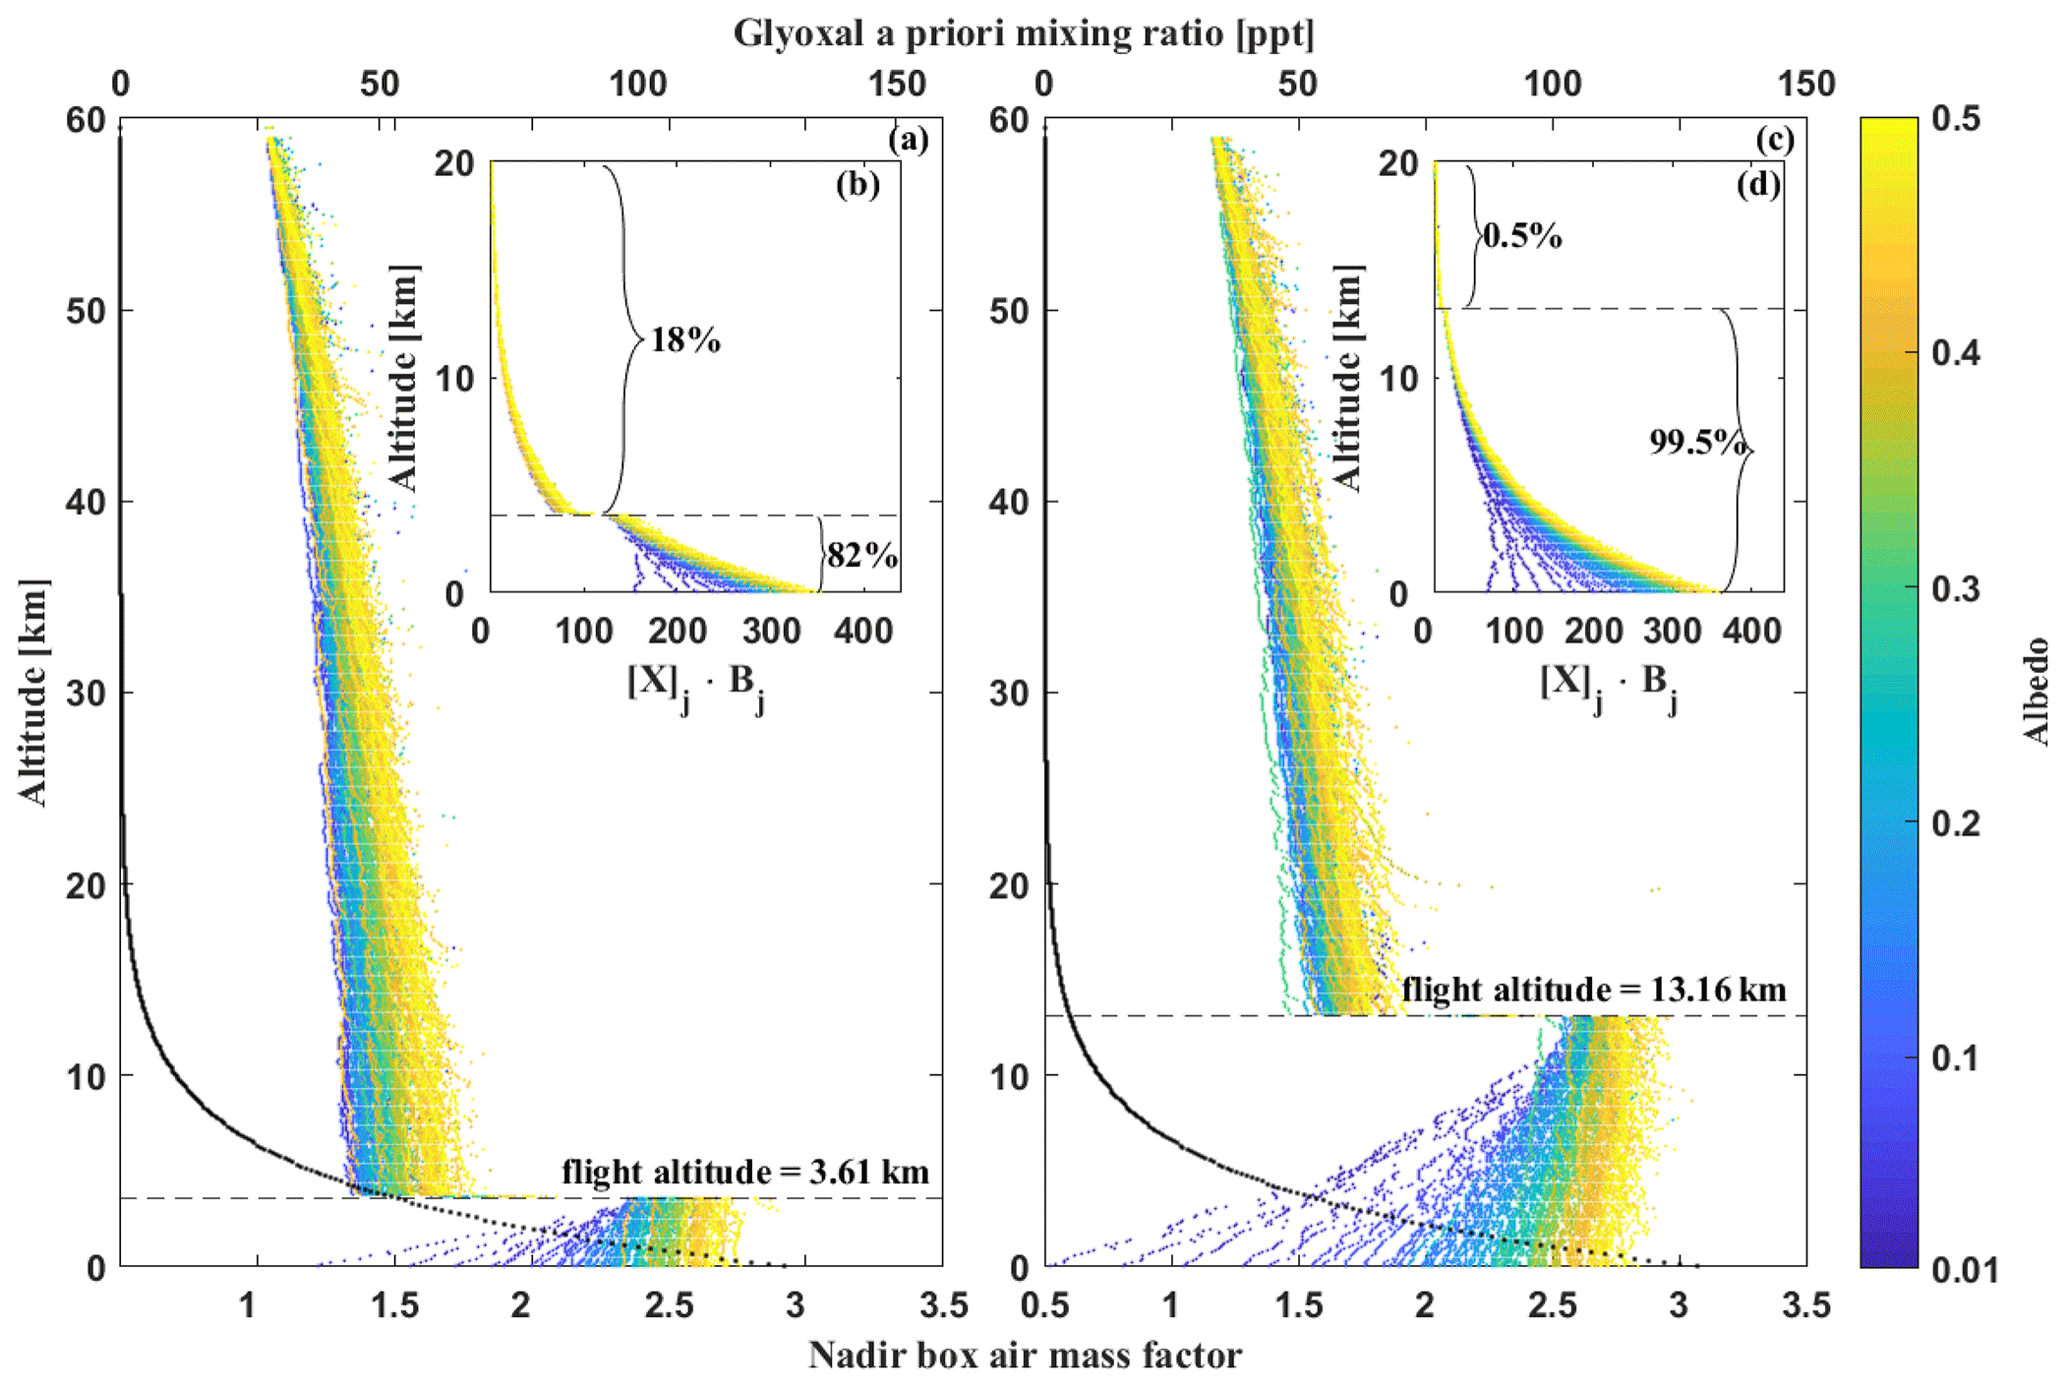
Figure 2Box air mass factors (Bj; lower x axis of panels a and c) of two mini-DOAS nadir measurements in the lower (a, b) and upper (c, d) troposphere for changing surface albedos between 0.1 and 0.5 (colour code). Both simulations were performed for the research flight from Oberpfaffenhofen (Germany) to Sal (Cabo Verde) on 7 August 2018. For the radiative transfer simulations, no clouds but rater aerosol profiles, as described in the text, are assumed (see Sect. 2.1.4). The product of Bj and the assumed a priori glyoxal concentration [X]j (upper x axis of panels a and c; black circles) yields the relative contribution of each altitude layer j (b, d). Evidently, even airborne nadir measurements at lower altitudes predominantly, but not exclusively, probe the atmosphere below the flight altitude. This causes the necessary restriction to upper tropospheric flight altitudes for the intercomparison of air- and spaceborne measurements, as discussed in Sect. 4.2.
Due to different assumptions for [X]j and Bj, the satellite and aircraft retrievals attribute different fractions of the total absorption to each altitude layer j (see Eq. 3 and Fig. 2). In particular, these differences in [X]j and Bj yield different relative fractions of the total absorption above the aircraft flight altitude j (Fig. 2b and d). For a high-flying aircraft, similar observation geometries of the aircraft and satellite result in a similar sum and, hence, in a similar detection sensitivity for glyoxal in the nadir direction (even though the products of single-altitude layers j may be different). However, for low flight altitudes, the contributions [X]j⋅Bj are largely different. The latter primarily results from the fact that, for nadir observations, Bj is larger (smaller) for altitudes j smaller (greater) than the aircraft flight altitude i, compared to those for the satellite, and is less due to differences in the assumed [X]j. Equally, airborne nadir observations from low altitudes tend to be more sensitive regarding the detection of trace gases in the lower atmosphere than those performed from the satellite. Consequently, for an optimal and biased minimised intercomparison between satellite and aircraft nadir observations (which respects the differences in the observation geometry and hence detection sensitivity), nadir observations from a high-flying aircraft need to be preferred over those performed from a low-flying aircraft. Therefore, we restrict the intercomparison of nadir-measured glyoxal to aircraft flight altitudes above 8 km. As a consequence of this altitude restriction, only the data collected during two research flights remain for the intercomparison of the EMeRGe-Asia mission (Figs. 7a and 10b).
As the TROPOMI L3 data are filtered for observations with solar zenith angles <70∘ (Lerot et al., 2021), the same filter is applied to the mini-DOAS data. This mostly affects the measurements over the South Atlantic as a consequence of the high geographic latitude and, consequently, low sun position in this region. Furthermore, provided that the satellite and the aircraft observations have a similarly sized footprint (see Sect. 2.1.3) and technical outline (e.g. FOV and photon-detection sensitivity) due to the largely different cruising velocities (7500 m s−1 for Sentinel-5P versus 200 m s−1 for the aircraft), the aircraft may observe a specific scene about a factor of 37.5 times longer than the satellite; hence, it integrates over, respectively, more photons. Given that the detection limit of both instruments is determined by the photon shot noise, the aircraft measurements are about 6 times more sensitive for the detection of glyoxal in individual spectra than those of the satellite. Accordingly, to obtain the same limit for glyoxal detection from both instruments, i.e. in order to reduce the noise in the satellite measurements, the TROPOMI glyoxal VCDs are averaged over a 0.25∘ × 0.25∘ grid (25 individual measurements). Each grid box is centred around the individual footprint of a single mini-DOAS measurement (Fig. 8b). Even though the footprints of TROPOMI and mini-DOAS geographically overlap well and only observations from the same day are chosen, the exact timing of the measurements may differ significantly, which has to be taken into account when comparing specific emission plumes. Finally, all satellite-detected VCDs are strictly filtered for potential cloud and aerosol interferences (Lerot et al., 2021). Since, for the airborne measurements, an equivalent filter is neither necessary (for the limb measurements) nor possible (for the nadir measurements), respectively, a larger all-sky albedo of 0.3 and climatological aerosol profiles based on data from SAGE III-ISS (Stratospheric Aerosol and Gas Experiment III on the International Space Station; NASA/LARC/SD/ASDC, 2017) and LIVAS (Amiridis et al., 2015) are assumed for the airborne radiative transfer simulations.
2.2 TROPOspheric Monitoring Instrument (TROPOMI)
The nadir-viewing TROPOspheric Monitoring Instrument (TROPOMI) was launched on board the Copernicus Sentinel-5 Precursor satellite platform on 13 October 2017 into an early afternoon sun-synchronous orbit, with a local Equator crossing time of 13:30 LT (Veefkind et al., 2012). It measures solar irradiance and earthshine radiance spectra in the ultraviolet, visible, and near- and shortwave infrared spectral ranges with a spectral resolution of about 0.5 nm (0.25 nm in the shortwave infrared). TROPOMI is a push broom instrument with a large swath of about 2600 km, which provides daily global coverage of the Earth's atmosphere with an unprecedented spatial resolution (up to 3.5 × 5.5 km2). The measurements not only allow the retrieval of vertical column densities (i.e. vertically integrated concentrations) for a series of key trace gases but also derive crucial information on clouds and aerosols. Since the beginning of the mission, TROPOMI has therefore provided essential information for air quality and climate applications, in particular via the distribution of operational products for ozone (O3), nitrogen dioxide (NO2), carbon monoxide (CO), sulfur dioxide (SO2), methane (CH4), and formaldehyde (CH2O). In addition, TROPOMI measurements can be exploited to infer information on other species, including glyoxal, as recently demonstrated by Lerot et al. (2021). More details on the satellite glyoxal retrievals are given in Sect. 3.2.
2.3 ECHAM/MESSy Atmospheric Chemistry (EMAC) model
The ECHAM/MESSy Atmospheric Chemistry (EMAC) model is a numerical chemistry and climate simulation system that includes submodels describing tropospheric and middle atmospheric processes and their interaction with oceans, land, and human influences (Jöckel et al., 2010). It uses the second version of the Modular Earth Submodel System (MESSy2) to link multi-institutional computer codes. The core atmospheric model is the fifth-generation European Centre Hamburg general circulation model (ECHAM5; Roeckner et al., 2003).
3.1 The mini-DOAS measurements
This study presents airborne glyoxal measurements from eight different research missions performed in the period between fall 2014 and fall 2019. In total, 72 research flights were performed with the German research aircraft HALO operated by the Deutsches Zentrum für Luft- und Raumfahrt (DLR) in Oberpfaffenhofen, Germany. The scientific flights covered a wide range of geographic areas reaching from the southern tip of South America and western Antarctica, over the Amazon Rainforest, the tropical and North Atlantic, and Europe to the East China Sea, Taiwan, and the southern Japanese islands (Fig. 3). The study combines nadir and limb measurements of glyoxal performed during the following scientific missions: (1) ACRIDICON-CHUVA (Aerosol, Cloud, Precipitation, and Radiation Interactions and Dynamics of Convective Cloud Systems – Cloud Processes of the Main Precipitation Systems in Brazil) over the Amazon in fall 2014 (Wendisch et al., 2016), (2) Oxidation Mechanism Observations (OMO) over the Mediterranean and Arabian seas and Indian Ocean in summer 2015 (Lelieveld et al., 2018), (3) the Effect of Megacities on the Transport and Transformation of Pollutants on the Regional to Global Scales in Europe (EMeRGe-EU) in summer 2017 (Andrés Hernández et al., 2022), (4) Wave-driven ISentropic Exchange (WISE) over the North Atlantic and Europe in fall 2017, (5) the Effect of Megacities on the Transport and Transformation of Pollutants on the Regional to Global Scales in Asia (EMeRGe-Asia) in early spring 2018, (6) the Carbon Dioxide and Methane Mission (CoMet) over Europe in late spring 2018 (Fix et al., 2018), (7) Chemistry of the Atmosphere: Field Experiment in Africa (CAFE-Africa) over the tropical Atlantic and West Africa in summer 2018, and (8) Transport and Composition of the Southern Hemisphere UTLS (SouthTRAC; where UTLS is the upper troposphere and lower stratosphere) in Patagonia/western Antarctica in fall 2019 (Rapp et al., 2021). Detailed descriptions of each mission, the deployed instruments, and research objectives can be found in the respective mission publications.

Figure 3The different geographical regions and the flight tracks covered during the eight missions. For simplicity, the missions are numbered according to their chronological order as follows: ACRIDICON-CHUVA (1), OMO (2), EMeRGe-EU (3), WISE (4), EMeRGe-Asia (5), CoMet (6), CAFE-Africa (7), and SouthTRAC (8). The operational bases for the individual missions were Manaus (Brazil) for ACRIDICON-CHUVA, Paphos (Cyprus) for OMO, Oberpfaffenhofen (Germany) for EMeRGe-Europe and CoMet, Shannon (Ireland) for WISE, Tainan (Taiwan) for EMeRGe-Asia, and Rio Grande (Argentina) for SouthTRAC. Only flight sections with mini-DOAS measurements are shown.
ACRIDICON-CHUVA (main operation base in Manaus, Brazil), OMO (operation base in Paphos, Cyprus), and EMeRGe-EU and CoMet (both operated from the home base in Oberpfaffenhofen, Germany) were predominantly conducted over land and the adjacent coastal regions. Most research flights from the other missions focused on remote marine measurements over the South Pacific and South Atlantic/Weddell Sea (SouthTRAC; operation base in Rio Grande, Argentina), the tropical Atlantic (CAFE-Africa; operation base in Sal, Cabo Verde), the North Atlantic (WISE; operation base in Shannon, Ireland), and the East China Sea (EMeRGe-Asia; operation base in Tainan, Taiwan; Fig. 3).
During the eight research missions, air masses of different origins and compositions, and thus largely different glyoxal sources and concentrations, were probed. This included (1) pristine marine air, (2) pristine continental air, (3) biomass-burning-affected air of different ages, and (4) air affected by fresh or aged anthropogenic emissions.
-
Pristine marine air was primarily probed over the North, tropical, and South Atlantic during the missions of WISE in 2017, CAFE-Africa in 2018, and SouthTRAC in 2019. During all three missions, long flight sections took place in the upper troposphere over the remote oceans, with occasional dives into the marine boundary layer and to the airports of Shannon (Ireland), Sal (Cabo Verde), or Rio Grande (Argentina). Combined, the three missions covered the Atlantic from Iceland and Scandinavia in the north, over the Azores and the equatorial latitudes, down to the South Atlantic, southeastern Pacific, and the Weddell Sea around the Antarctic Peninsula.
-
The most pristine terrestrial air masses were found over Patagonia, southern Argentina, and northern Antarctica during the SouthTRAC mission in austral spring 2019, with vertical profiling mostly performed during landward ascents from and descents into the Rio Grande and Buenos Aires airports (Argentina).
-
Air masses affected by biogenic emissions and biomass burning were intensively probed over the Amazon during the ACRIDICON-CHUVA mission in fall 2014, and the measurements of formaldehyde, glyoxal, and have been discussed in detail in Kluge et al. (2020). Additionally, aged biomass burning plumes advected from continental Africa and Brazil were detected during several flights of the CAFE-Africa mission over the tropical Atlantic and during several transfer flights of the SouthTRAC mission from Europe along the Brazilian coastline towards Patagonia (Argentina). On 12 November 2019, biomass-burning-affected air masses from the Australian bushfires in austral spring and summer 2019 were detected over the Drake Passage around 57∘ S and 67∘ W in the upper troposphere (e.g. Kloss et al., 2021).
-
Air masses affected by recent anthropogenic emissions were probed over the European continent and its northern islands (mostly Ireland and Great Britain) and over the adjacent marine regions (North, Baltic, and Mediterranean seas) during the missions of EMeRGe-EU in summer 2017, WISE in fall 2017, CoMet in spring 2018, and over Taiwan and the East China Sea during EMeRGe-Asia in spring 2018. The research flights targeted the emissions of major European and Asian cities, e.g. London, Paris, Rome, Marseille, Barcelona, Manila, and Osaka, as well as emissions from industrial areas (e.g. the Ruhr valley and the Upper Silesian Coal Basin). During the EMeRGe missions, the research flights focused on fresh pollution plumes in the planetary and marine boundary layer, whereas the CoMet flights provided measurements in the free and upper troposphere over the different cities, Scandinavia, and the Baltic and the Mediterranean seas. In addition to these detailed continental measurements, observations of the northern European coastal regions were completed during the WISE mission, including Ireland, Great Britain, and Iceland, with a special focus on fresh anthropogenic emissions over the Irish Sea and the North Channel.
-
Air masses affected by aged pollution were probed in all regions, especially along the coast of the Mediterranean Sea, Egypt, the Arabian Peninsula, and the Arabian Sea during the OMO mission in summer 2015 (Lelieveld et al., 2018), as well as in the outflow of mainland China, Japan, Korea, and the Philippines over the East China Sea, during EMeRGe-Asia, and during several flights along the Brazilian coastline.
During OMO, measurements were not only predominantly conducted in the upper troposphere but also included profiling into the boundary layer, i.e. over Cyprus and Bahrain. Due to operational reasons, during EMeRGe-Asia profiling from the free troposphere into the boundary layer could only be performed over Taiwan, south of Osaka (Japan), and Manila (Philippines), whereas free and upper tropospheric air was probed during flight sections between Taiwan and south Japan.
Glyoxal measurements are sometimes only available for a portion of the total flight time. This is mostly a result of (1) flight sections of recorded spectra with unfavourable sunlight conditions causing an oversaturation of the charge-coupled device (CCD) detector (e.g. when flying in and adjacent to bright clouds), (2) research flights during the night (e.g. during SouthTRAC), or (3) spectrometer temperatures being above 3 ∘C preventing a stable spectral imaging (e.g. during EMeRGe-Asia).
3.2 TROPOMI measurements
Glyoxal tropospheric vertical columns can be retrieved from the satellite TROPOMI observations by exploiting its absorption bands in the visible spectral range using a DOAS approach. Here we use the TROPOMI glyoxal product recently developed by BIRA-IASB (Royal Belgian Institute for Space Aeronomy; Lerot et al., 2021). The algorithm consists of three consecutive steps.
-
Glyoxal slant column densities are derived from a DOAS spectral fit of the measured optical depths performed in the window 435–460 nm. In addition to glyoxal, absorption cross sections are included to account for spectral signatures from ozone, NO2, O2−O2, water vapour, liquid water, inelastic scattering, and scene brightness heterogeneity. The glyoxal optical depth is generally weak, which makes the product noisy and sensitive to spectral interferences. The level of noise can be reduced by averaging observations in space and/or time. An empirical correction is also applied to the glyoxal slant columns in case of extreme NO2 absorption to reduce the impact of the resulting misfit. As described in detail in Lerot et al. (2021), this correction is based on a linear regression fit obtained by a representative sensitivity test for glyoxal measurements at NO2 SCDs larger than 2×10¹⁶ molec. cm2.
-
The slant column densities are converted into vertical column densities via air mass factor, which are computed by combining weighting functions and a priori glyoxal profile shapes (Palmer et al., 2001). The a priori profiles are provided over land by the CTM MAGRITTE, an update of the IMAGES model (Müller and Brasseur, 1995; Bauwens et al., 2016), while a single profile measured in 2012 over the Pacific Ocean (Volkamer et al., 2015) is used over oceanic regions. The impact of clouds is neglected, and a stringent filter is applied to reject cloud-contaminated scenes.
-
A background correction based on measurements over the remote Pacific Ocean is applied and aims at reducing the presence of biases originating from interferences with spectral signatures from other absorbers or calibration limitations. For example, this procedure is designed to reduce an identified row-dependent bias. Owing to the empirical nature of the correction, some remnants of this bias may nevertheless still be visible when maintaining the daily time resolution. The quality of this TROPOMI glyoxal product has been assessed in Lerot et al. (2021), based on comparisons with other glyoxal satellite data sets produced with a similar algorithm and with a series of multi-axis differential optical absorption spectroscopy (MAX-DOAS) data sets. A high level of consistency is found between the satellite data sets (within 20 %), and high correlation coefficients are found between TROPOMI and MAX-DOAS data sets, indicating that the glyoxal variability observed from space and ground level agree well. Enhanced glyoxal columns are also observed by TROPOMI over equatorial oceans. The respective contributions of physical processes and spectral interferences to those elevated columns have remained unclear for years. Additional comparisons with independent measurements, such as those presented in this study, are therefore crucial to provide insight into this issue.
3.3 EMAC simulations
In the present study, EMAC (ECHAM5 version 5.3.02; MESSy version 2.55.0) is used at T63L90MA resolution, i.e. with a spherical truncation of T63 (corresponding to a quadratic Gaussian grid of approximately 1.875∘ by 1.875∘ in latitude and longitude) with 90 vertical hybrid pressure levels up to 0.01 hPa. In order to reproduce the actual day-to-day meteorology in the troposphere, the dynamics have been weakly nudged (Jöckel et al., 2006) towards the European Centre for Medium-Range Weather Forecasts (ECMWF) Reanalysis v5 (ERA5; Hersbach et al., 2020) data.
Atmospheric gas-phase chemistry is calculated by employing the Module Efficiently Calculating the Chemistry of the Atmosphere (MECCA; Sander et al., 2019) using the gas-phase Mainz Organic Mechanism (MOM) recently evaluated by Pozzer et al. (2022). MOM contains an extensive oxidation scheme for isoprene (Taraborrelli et al., 2009, 2012; Nölscher et al., 2014; Novelli et al., 2020), monoterpenes (Hens et al., 2014), and aromatics (Cabrera-Perez et al., 2016). In addition, comprehensive reaction schemes are considered for the modelling of the chemistry of NOx, HOx, CH4, and anthropogenic linear hydrocarbons. VOCs are oxidised by OH, O3, and NO3, whereas RO2 reacts with HO2, NOx, and NO3 and undergoes self- and cross-reactions. All in all, MOM considers 43 primarily emitted VOCs and represents more than 600 species and 1600 reactions (Sander et al., 2019).
The SCAVenging submodel (SCAV; Tost et al., 2006) is used to simulate the removal of trace gases and aerosol particles by clouds and precipitation. SCAV calculates the transfer of species into and out of rain and cloud droplets using Henry's law in equilibrium, acid dissociation equilibria, oxidation–reduction reactions, heterogeneous reactions on droplet surfaces, and aqueous-phase photolysis reactions. In its basic set-up, SCAV is used to calculate EMAC's standard aqueous-phase mechanism, including the representation of more than 150 reactions, and even includes a simplified degradation scheme of methane oxidation products (Tost et al., 2007). The aqueous-phase representation of formaldehyde (CH2O) is updated following Franco et al. (2021).
Anthropogenic emissions are based on the Emissions Database for Global Atmospheric Research (EDGAR, v4.3.2; Crippa et al., 2018) and vertically distributed following Pozzer et al. (2009). The Model of Emissions of Gases and Aerosols from Nature (MEGAN; Guenther et al., 2006) is used to model biogenic VOC emissions. Global isoprene emissions are scaled to the best estimate of Sindelarova et al. (2014). Biomass burning emission fluxes are calculated using the MESSy submodel of BIOBURN, which calculates these fluxes based on biomass burning emission factors and dry matter combustion rates. For the latter, Global Fire Assimilation System (GFAS) data are used, which are based on satellite observations of fire radiative power from the Moderate Resolution Imaging Spectroradiometer (MODIS) satellite instruments (Kaiser et al., 2012). The biomass burning emission factors for VOCs are based on Akagi et al. (2011), excluding direct glyoxal emissions. The MESSy submodel of AIRSEA is used to represent the air–sea exchange of isoprene and methanol, following Pozzer et al. (2006).
The applied EMAC modelling set-up is representable for recent studies that have focused on a detailed representation of VOCs (e.g. by using MOM to represent gas-phase chemistry; Novelli et al., 2020; Rosanka et al., 2020; Taraborrelli et al., 2021; Franco et al., 2021; Rosanka et al., 2021a; Pozzer et al., 2022). Using MOM in EMAC at a resolution of T63L90MA comes at a high computational demand. Therefore, we perform an EMAC simulation focusing on the years 2017, 2018, and 2019, which covers most airborne missions, except ACRIDICON-CHUVA in 2014 and OMO in 2015. For these missions, simulation results of the year 2017 are used for the climatological comparison with observational data. All simulations were performed at the Jülich Supercomputing Centre using the Jülich Wizard for European Leadership Science (JUWELS) cluster (Krause, 2019).
Based on the data collected during all research missions, atmospheric glyoxal profiles are inferred in (1) recently polluted air both over continents (Europe, South America, and Southeast Asia) and adjacent marine regions (e.g. Mediterranean Sea, Irish Sea, and East/South China Sea), (2) biomass-burning-affected air (mostly off the coast of Africa and South America), and (3) pristine marine air (South, tropical, and North Atlantic). The following section first discusses the inferred vertical profiles of glyoxal and compares them to previous measurements before the nadir VCDs and integrated profiles are intercompared with collocated TROPOMI glyoxal VCD measurements. Finally, the airborne measurements of glyoxal concentrations and VCDs are compared to respective simulations from the EMAC model.
4.1 Glyoxal profiles
Figure 4 provides an overview of all glyoxal profiles inferred for the eight investigated regions. This includes glyoxal profiles measured over Patagonia and the Amazon Rainforest (Fig. 4a), the East China Sea and Taiwan (Fig. 4b), the European continent and its northern islands (Fig. 4c), the South Atlantic (Fig. 4d), the tropical Atlantic (Fig. 4e), the North Atlantic (Fig. 4f), and the Mediterranean Sea (Fig. 4g). The corresponding flight tracks as a function of altitude are shown in Fig. 5a, d, g, j, and m, together with the along-track inferred glyoxal mixing ratios (Fig. 4b, e, h, k, and n) and glyoxal VCDs (Fig. 4c, f, i, l, and o).
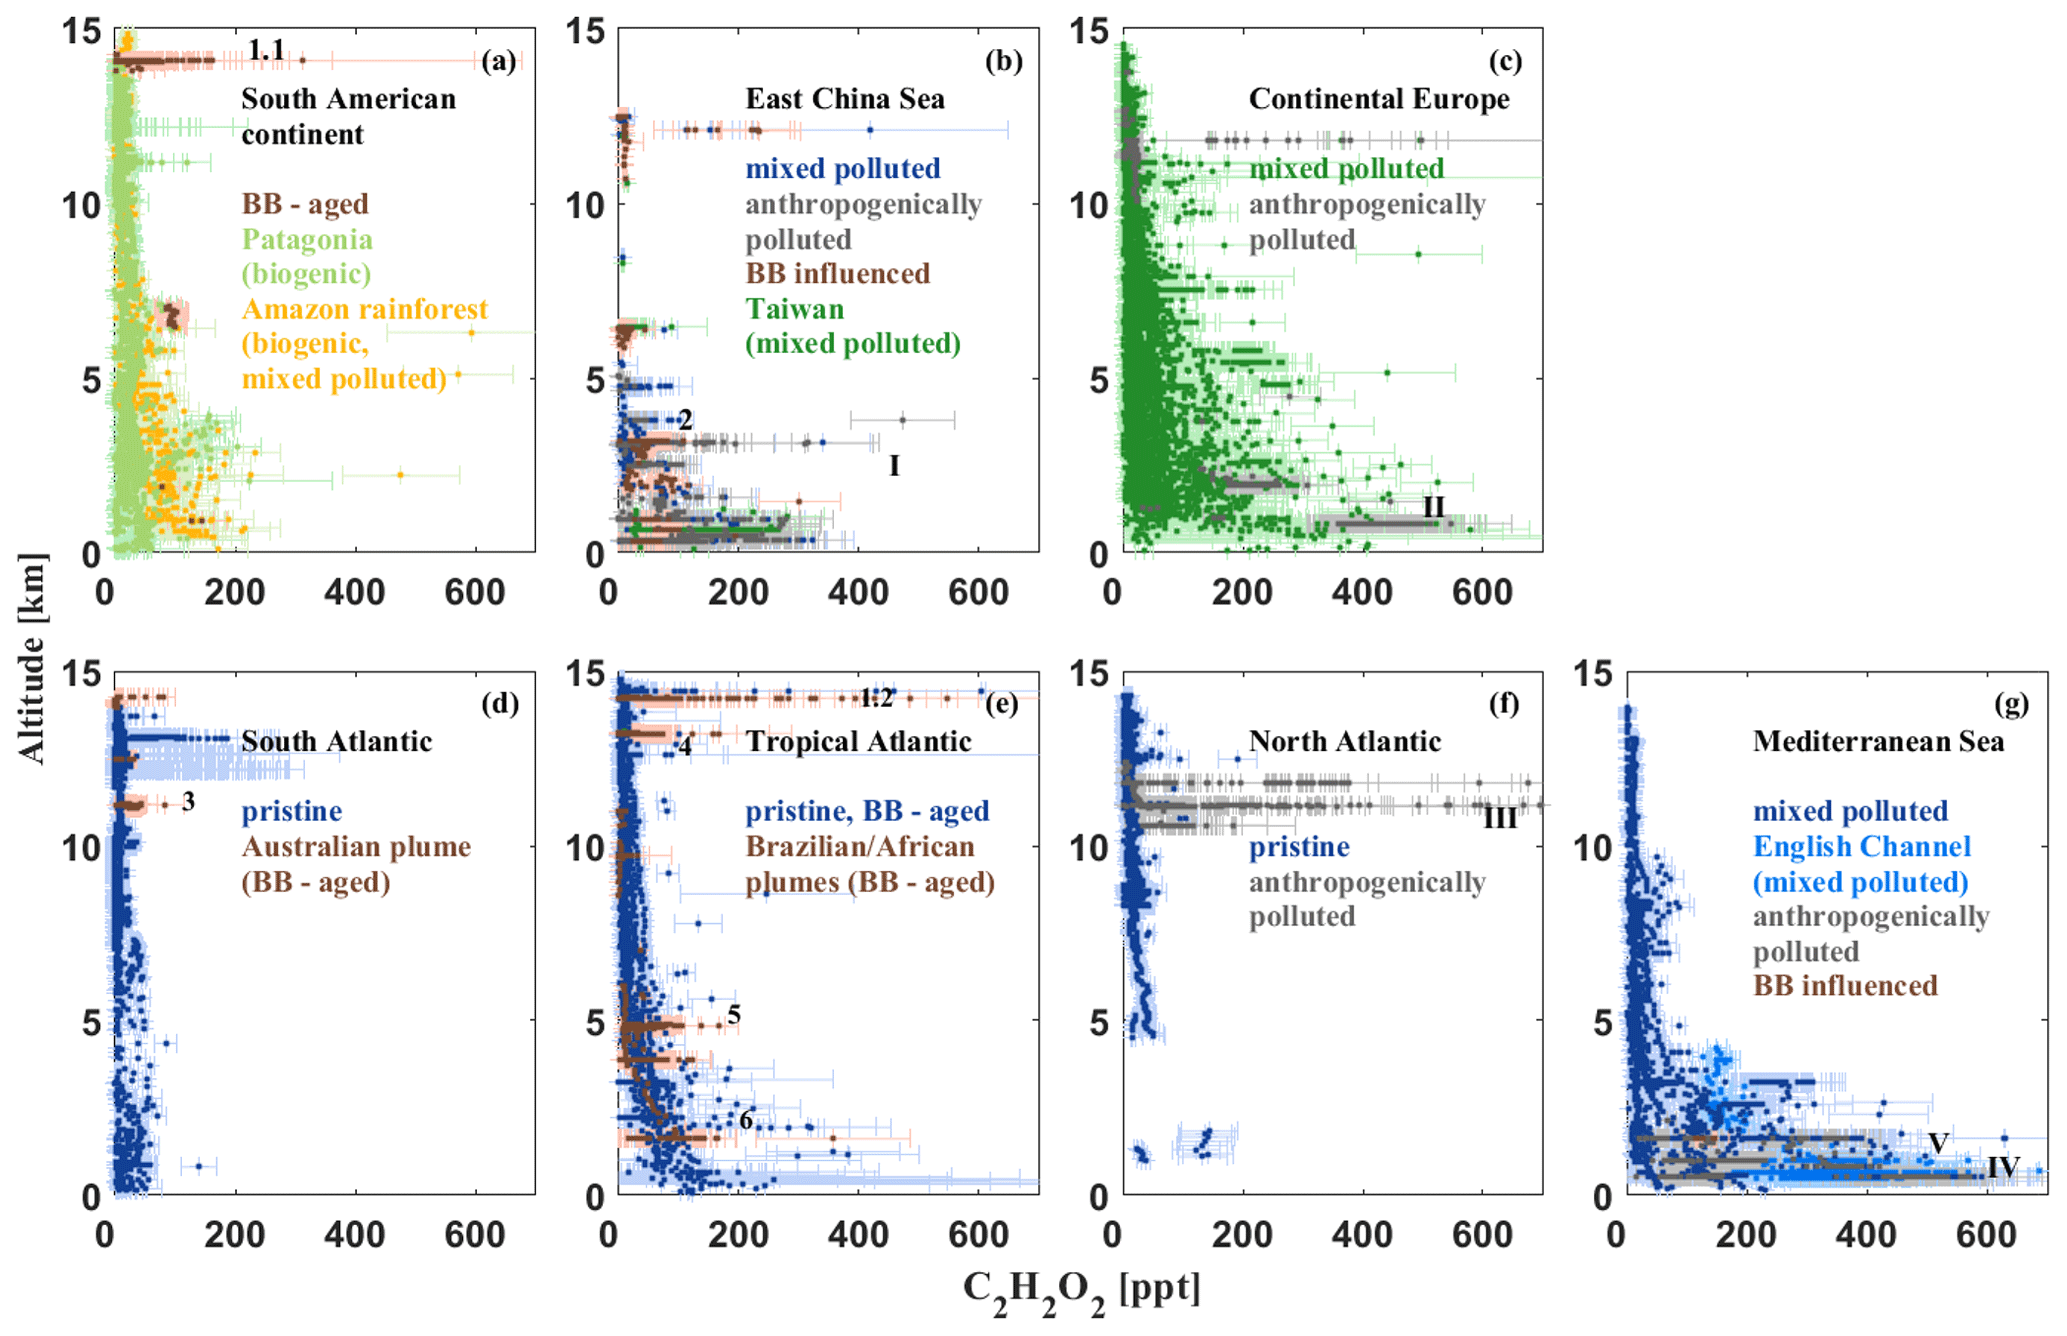
Figure 4Vertical profiles of glyoxal in the different regions, namely the South American continent in fall 2014 and austral spring in 2019 (a), Taiwan and the East China Sea in spring 2018 (b), the European continent in summer and fall 2017 and 2018 (c), the South Atlantic in austral spring 2019 (d), the tropical Atlantic and around the Cabo Verde islands in summer 2018 and austral spring 2019 (e), the North Atlantic and Irish Sea in fall 2017 (f), and the Mediterranean Sea, English Channel, and North Sea in summer 2015, 2017, and 2018 (g). The various marine environments are indicated in blue, terrestrial in green, and rainforest in yellow, while perturbations due to biomass burning (BB) plumes are indicated in brown and city plumes in grey. The numbers denote encounters with BB plumes and the Roman numerals with plumes of anthropogenic emissions (mostly city plumes). The three largest glyoxal plumes observed are plume 1.2 (e), with up to 3192 ppt, plume III, with 2970 ppt (f), and plumes IV and V, with 845 and 774 ppt, respectively (g). All four plumes are not shown in their full scale for better comparability with the other profiles. For better visibility of the different profile shapes, occasional negative measurements are not shown (compare with Fig. 11).
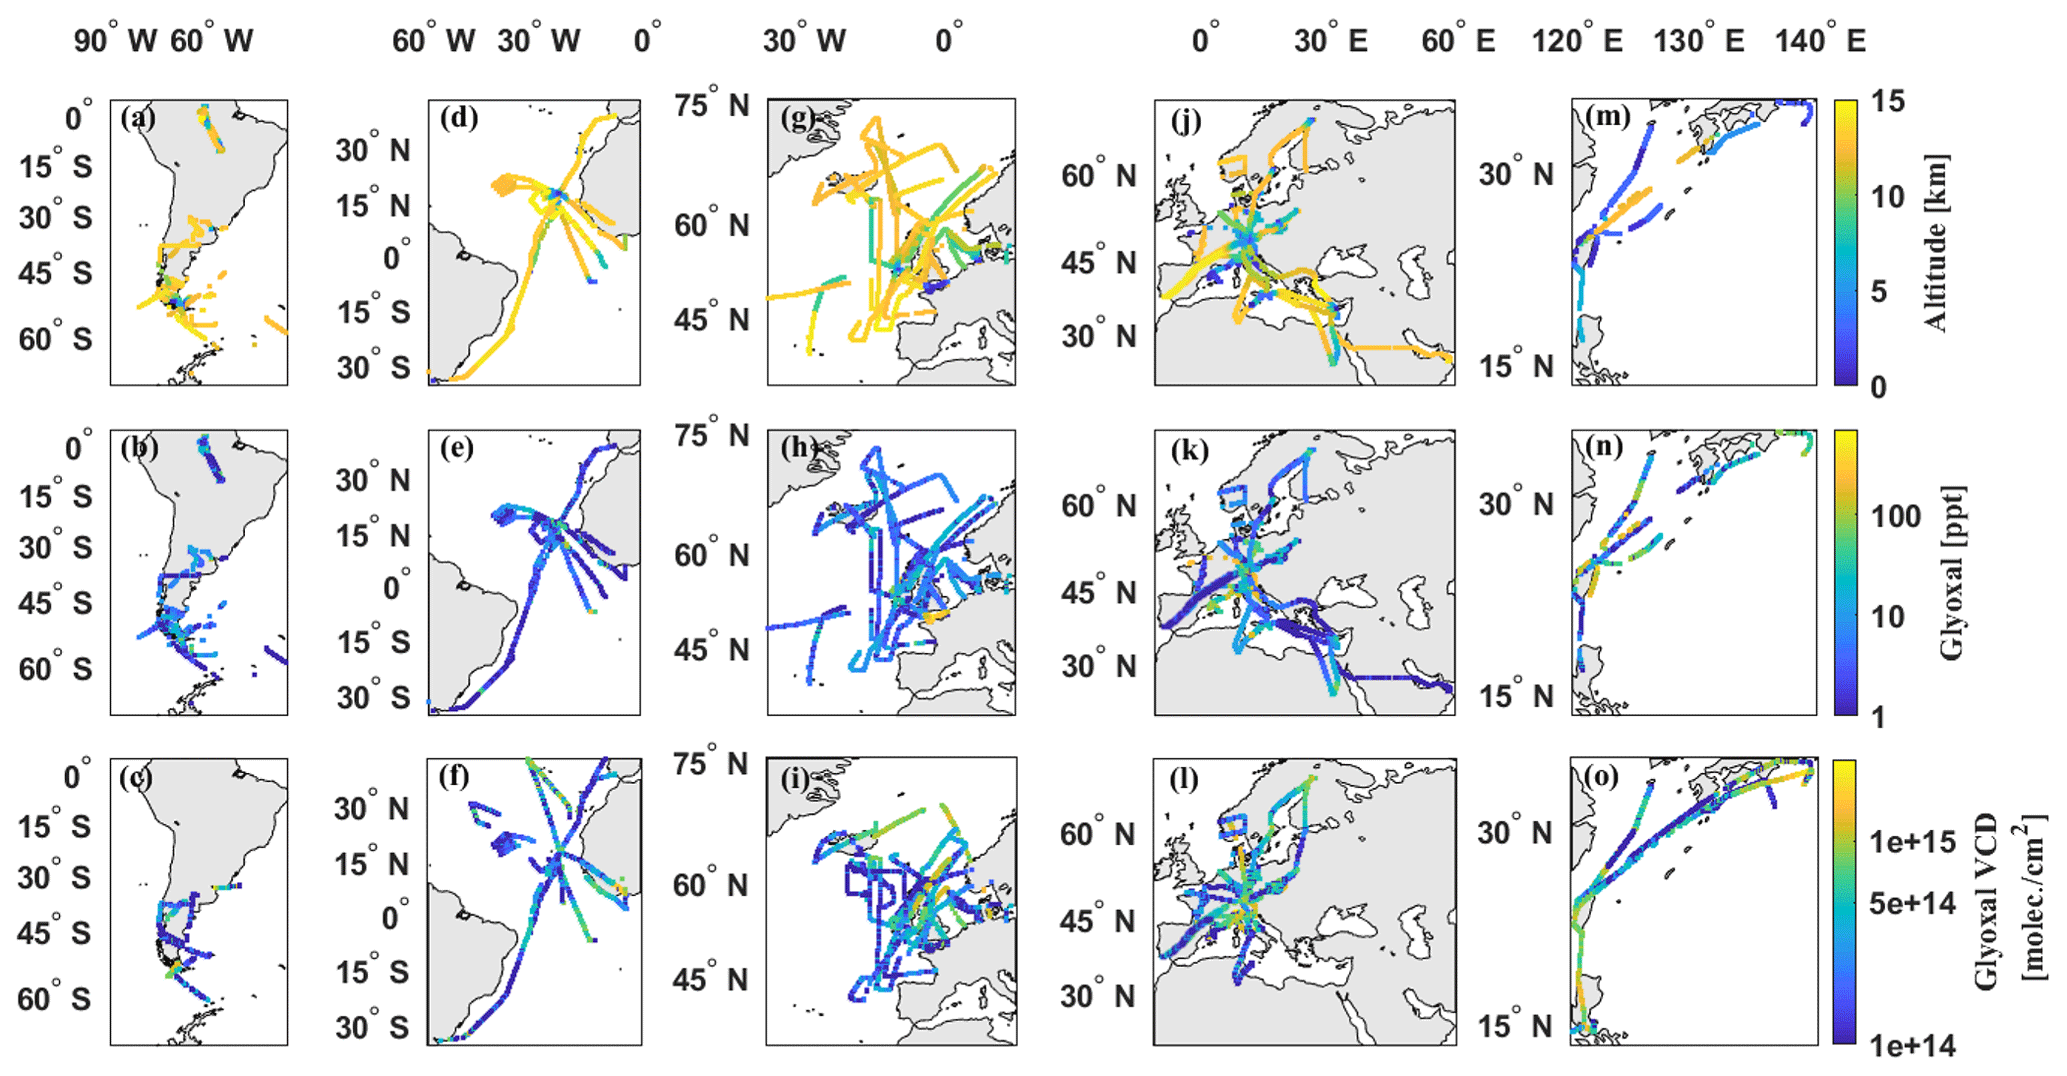
Figure 5Flight trajectories, measured glyoxal mixing ratios, and VCDs are displayed in the top, middle, and bottom rows, respectively, over South America (a–c), the tropical Atlantic (d–f), the North Atlantic (g–i), continental Europe (j–l), and Southeast Asia (m–o). Note the logarithmic colour scale in the two lower rows of the panels.
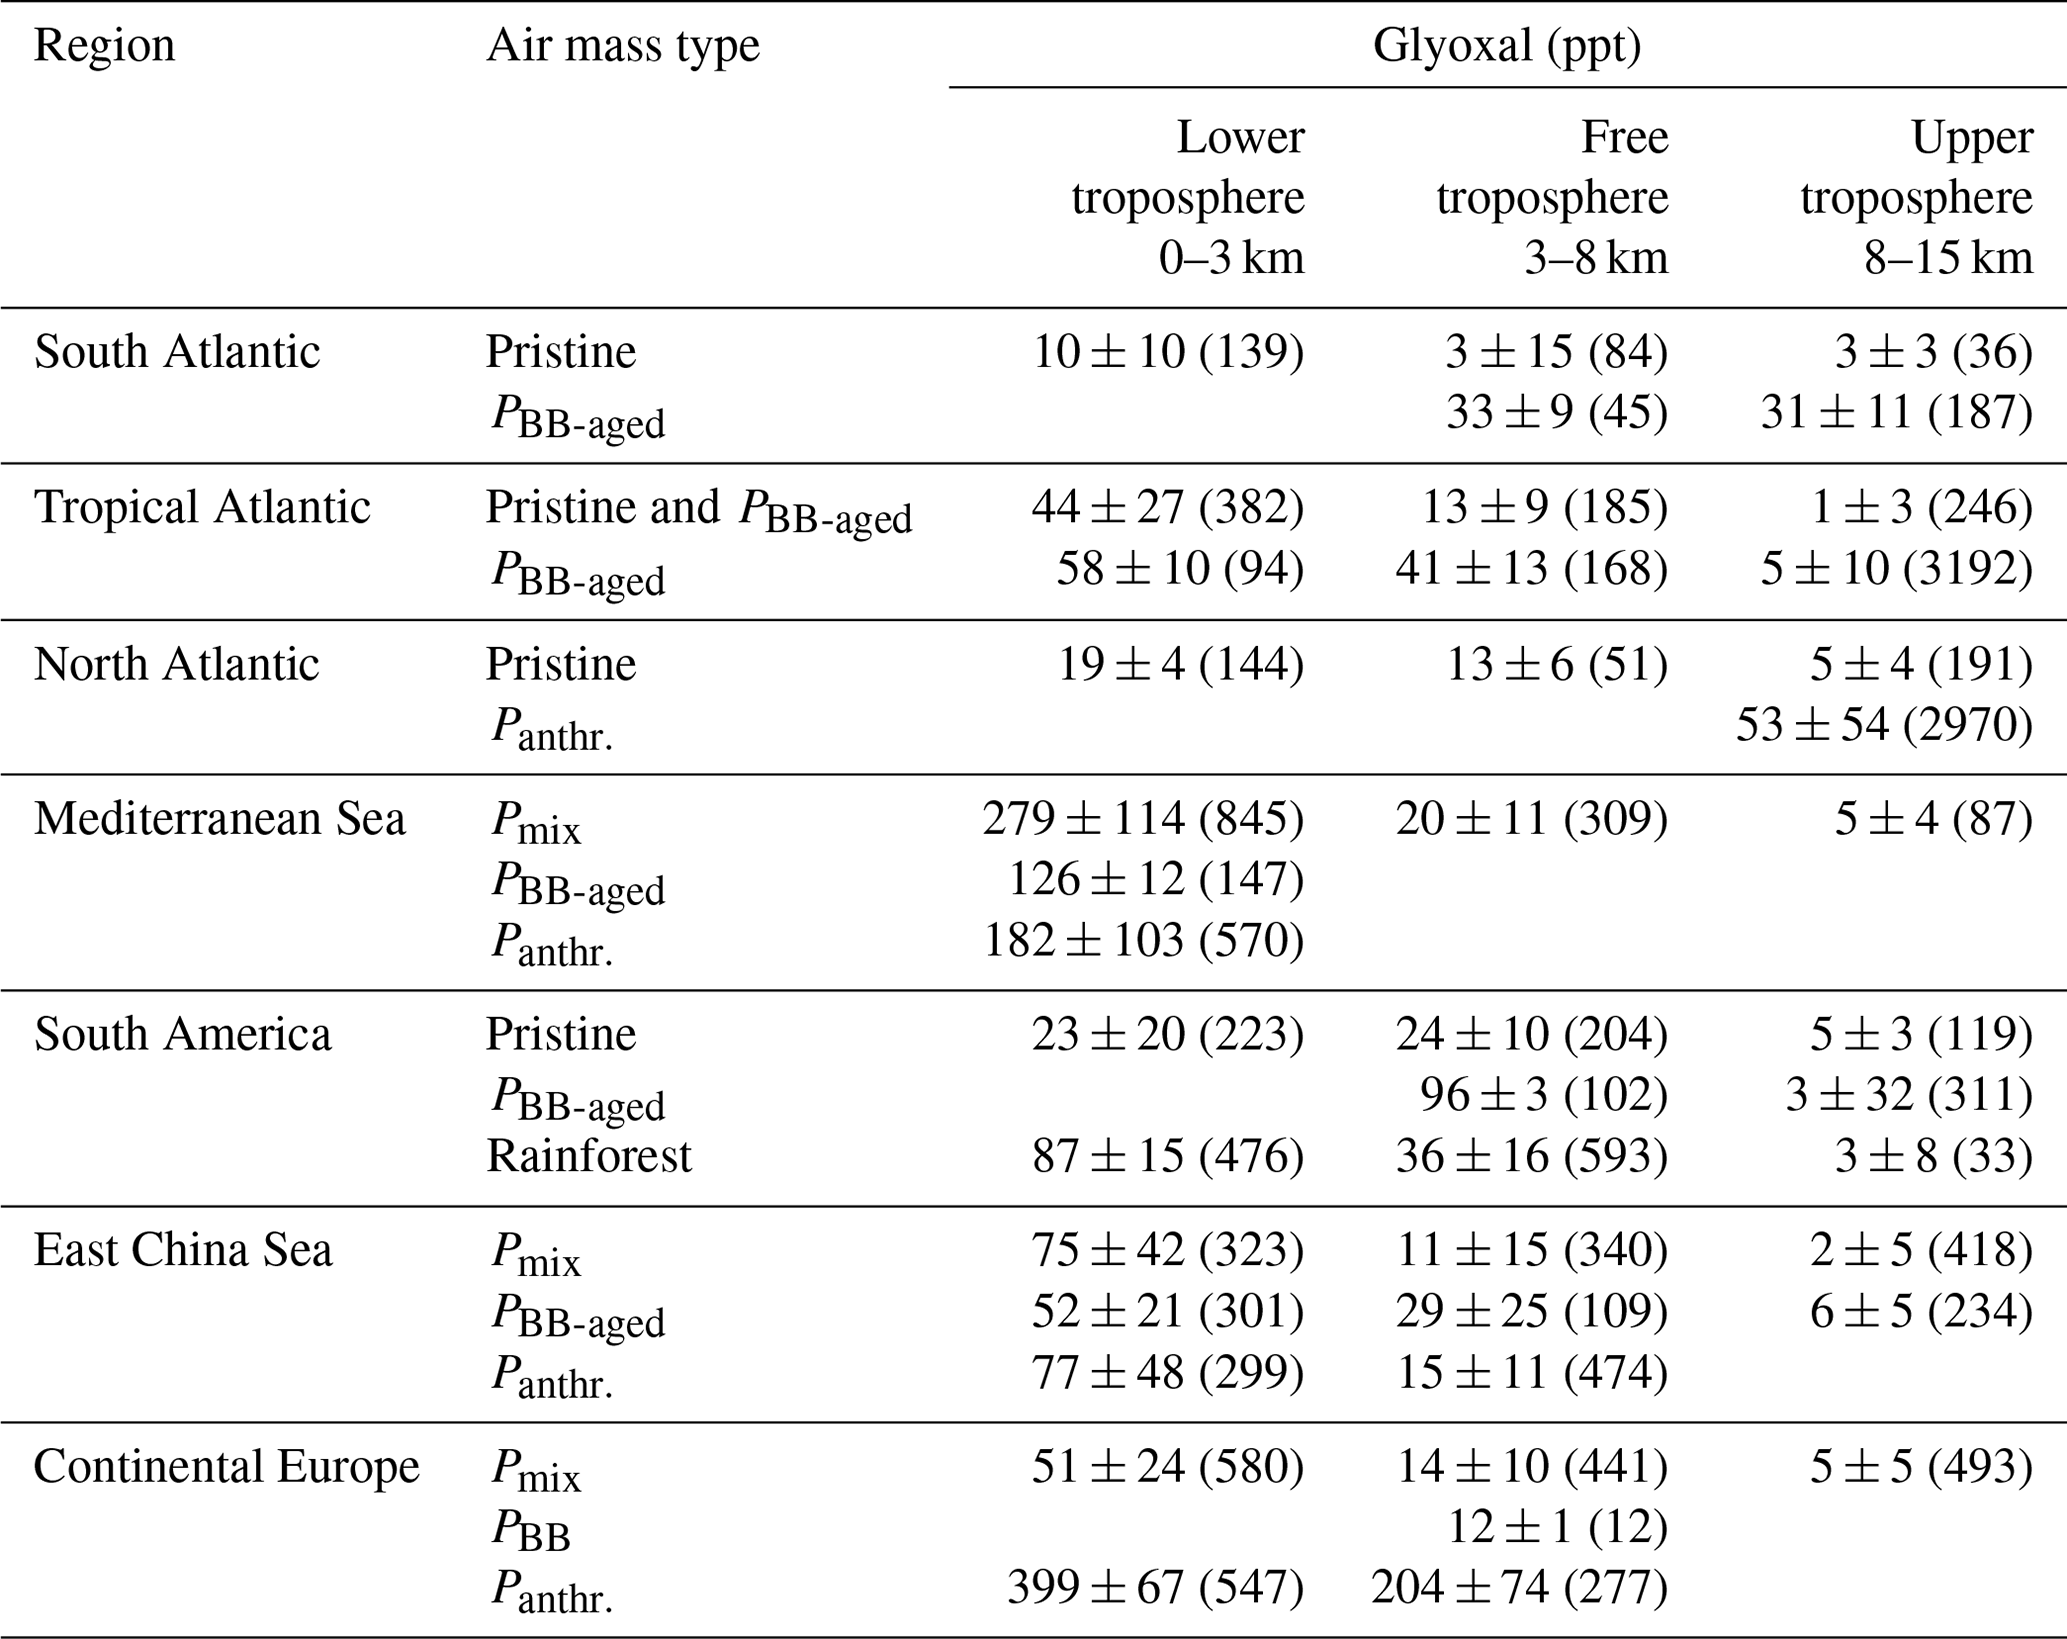
Table 3Observed median, median absolute deviation, and maximum (in parentheses) glyoxal mixing ratios (ppt) as a function of different geographic regions, air mass types, and altitude ranges. If available, chemical markers are used for the attribution of the air masses to the different regimes. Polluted air masses are differentiated into fresh or aged biomass burning (PBB-fresh/aged or PBB, in cases where the plume age is not known), anthropogenic pollution (Panthr.), and mixed pollution (Pmix). Further categories consist of air masses rich in biogenic volatile organic compound (bVOC) emissions (labelled “Rainforest”) and pristine air.
As can be seen in Fig. 5, lower altitudes were mostly probed in the vicinity of potential emission sources (e.g. large population centres and biomass burning events), whereas the remote oceans were predominantly probed from the upper troposphere (Fig. 5 and Sect. 4.2). This sampling was motivated by (1) the mission objectives, which often differed from those necessary for in-depth glyoxal monitoring, (2) flight track restrictions, which prohibited some of the intended soundings (e.g. over the remote South Atlantic), (3) the required aircraft tracks with narrow curves near airports, which prevented a reliable limb sounding, and (4) instrument malfunctions. Consequently, the marine observations in the lower troposphere over the South and tropical Atlantic and over the Mediterranean Sea contain a larger fraction of coastal rather than remote ocean soundings. Also, the vertical soundings over the Mediterranean Sea and North Atlantic were mostly performed near larger pollution sources (e.g. Marseille, Barcelona, and Shannon) rather than over the remote sea, leading to a larger fraction of pollution-affected observations in the planetary boundary layer compared to higher altitudes. However, this bias is expected to be small for vertical soundings in regions of widely polluted air (e.g. over polluted continental areas) and the East China Sea, where vertical profiles were also inferred over the remote ocean.
In spite of these observation-related limitations, the glyoxal profiles provide valuable information on the background of glyoxal in various environments around the globe, including marine (Fig. 4; blue colour) and terrestrial regions (Fig. 4; green colour) and the Amazon Rainforest (Fig. 4; yellow colour), as well as perturbations due to biomass burning (BB) plumes (Fig. 4; brown colour) and city plumes (Fig. 4; grey colour).
The attribution of the different air masses to the respective emission types is based on markers of typical chemicals emitted by anthropogenic activities and biomass burning. For the EMeRGe-EU and EMeRGe-Asia missions, benzene (C6H6), isoprene (C5H8), and acetonitrile (CH3CN) are used to detect and differentiate between anthropogenic pollution and biomass burning plumes (Andrés Hernández et al., 2022; Krüger et al., 2022). Biomass burning plumes are further identified based on simultaneous measurements of CO (Tadic et al., 2017) and black carbon (Holanda et al., 2020) during CAFE-Africa and of CO (Müller et al., 2015; Kunkel et al., 2019), peroxyacetyl nitrate (PAN), ethane (C2H6), formic acid (HCOOH), methanol (CH3OH), ethylene (C2H4) (Johansson et al., 2022), and acetylene (C2H2) (Sören Johansson, personal communication, February 2022) during the SouthTRAC mission and by visual inspection and air mass back-trajectory calculations for the ACRIDICON-CHUVA mission (Kluge et al., 2020).
Evidently, not all of the glyoxal observations can unambiguously be assigned to one of the four encountered air mass types (pristine, biogenic, polluted, or biomass burning affected) as described above, since either no markers for the different regimes were measured during individual flights or entire missions (e.g. CoMet) or a mixture of polluted air masses from different sources was probed, e.g. over continental Europe, the Mediterranean Sea, Taiwan, and the East China Sea (Lelieveld et al., 2018; Andrés Hernández et al., 2022).
Table 3 provides an overview of glyoxal mixing ratios (median, median absolute deviation, and maximum) inferred in the distinctive regimes in the lower, middle, and upper troposphere in the different global regions. As expected, most glyoxal is observed in the lower and middle troposphere over Europe, the Mediterranean Sea, and eastern Asia, and the smallest concentrations are found over pristine marine (South Atlantic) and terrestrial regions (Patagonia). In the upper troposphere, glyoxal mixing ratios are generally very small (a few ppt) in all regions, if not affected by biomass burning or other emission plumes.
Overall, the comparison of our glyoxal measurements with previous findings from varying altitudes, regions, and seasons around the globe shows a reasonable good agreement.
-
Pristine marine air masses. These were mostly probed over the South Atlantic, with median mixing ratios in the lower, middle, and free troposphere of 10, 3, and 3 ppt, respectively (Figs. 4d and 5a–c). Over the South Atlantic, glyoxal mixing ratios larger than 100 ppt are exclusively observed in aged biomass burning plumes or near the South American coastline below 3 km altitude, where the enhancements very likely resulted from the respective continental outflow of glyoxal and its precursors. Comparable glyoxal mixing ratios of 19 ppt (median) are observed in the planetary boundary layer over the North Atlantic, with slight glyoxal enhancements predominantly observed during ascents and descents into the Shannon airport (Ireland; Fig. 5g–i). Also, in the middle and free troposphere, the range of observed glyoxal mixing ratios above the pristine South and North Atlantic compares well if it not affected by specific emission events (biomass burning for the South Atlantic and mostly anthropogenic emissions for the North Atlantic; see Fig. 4d and f). Glyoxal observations in the remote marine free troposphere and in particular in the free troposphere over the North Atlantic are still sparse and thus deserve further investigations.
In the pristine marine boundary layer, our glyoxal measurements compare well with observations by Mahajan et al. (2014), who found average glyoxal mixing ratios of typically 25 ppt (upper limit 40 ppt), based on 10 oceanic cruises over the open oceans in different parts of the world. For the South Pacific boundary layer, Lawson et al. (2015) reported glyoxal mixing ratios ranging from 7 to 23 ppt, which is slightly smaller than our median observation in the boundary layer over the tropical Atlantic of 44 ppt.
In fact, compared to the measurements in pristine marine air (e.g. over the South Atlantic), glyoxal over the tropical Atlantic below 3 km is found to be, on average, 4 times larger (Figs. 4e and 5d–f). These observations of moderately elevated glyoxal in the marine lower troposphere in the tropics support previous findings of elevated glyoxal elsewhere in the remote marine tropics, e.g. in the lower atmosphere over the eastern Pacific (Sinreich et al., 2010; Volkamer et al., 2015).
-
Pristine terrestrial air masses. Glyoxal mixing ratios over Patagonia and southern Argentina (21 ppt) are only slightly higher than those inferred for the South Atlantic. In contrast to the other investigated terrestrial regions, in the lower and free troposphere over Patagonia, glyoxal mixing ratios appear approximately constant with altitude. Mixing ratios significantly larger than the median are only observed when approaching population centres, like Buenos Aires or Rio Grande (Argentina). In the upper troposphere, and distant from such emission sources of pollutants, glyoxal mixing ratios decrease further to a median of 5 ppt (Fig. 4a), which is comparable to all other investigated regions. The lack of significant ground-based emission sources and thus a rather small emission of glyoxal and its precursors results in a close-to-constant vertical glyoxal profile over southern Argentina, in contrast to the measurements over the Amazon Rainforest (Fig. 4a). There, glyoxal strongly decreases in the free and upper troposphere due to significant enhancements in the boundary layer and the lower middle troposphere that are caused by large direct emissions of glyoxal and its precursors by biomass burning and secondary formation from longer-lived precursors emitted from the rainforest (mostly isoprene; Kluge et al., 2020). Interestingly, glyoxal in the lower troposphere over the Amazon basin is considerably smaller (median 87±15 ppt) than reported from the tropical rainforest in a rural region of Southeast Asia (up to 1.6 ppb), which is likely due to the large emissions of isoprene there (MacDonald et al., 2012).
-
Air masses affected by biomass burning. Two of the probed biomass burning plumes (Fig. 4; brown colour) are documented in the literature. On 12 November 2019, an aged (3–4 d old) biomass burning filament was detected in the upper troposphere and lower stratosphere over the Drake Passage around 57∘ S and 67∘ W that most probably originated from Australian bushfires (Kloss et al., 2021; Mouat et al., 2022). On this day, elevated glyoxal up to 83±32 ppt was continuously measured during a 280 km long flight section around 11 km in altitude south of Patagonia (Fig. 4d; event 3). On 8 September 2019, an extended biomass burning plume was crossed along the southern Brazilian and Uruguayan coastlines towards Buenos Aires (Fig. 4a and e for events 1.1 and 1.2; Fig. 9c and d). Within this plume, the largest glyoxal mixing ratios among all biomass burning measurements were observed (up to 3192 ppt). The Fire Information for Resource Management System (FIRMS) fire map and air mass trajectory calculations show that the plume most probably originated from wildfires in southern Brazil, Uruguay, Paraguay, and northern Argentina (see Sect. 4.2, Fig. 9c, and Johansson et al., 2022).
Based on the chemical markers, at least five more extended biomass burning plumes can be identified from the measurements over the tropical Atlantic (Fig. 4 for events 4, 5, and 6) and over the East China Sea (Fig. 4 for event 2). Additionally, occasionally smaller plumes were probed over the Mediterranean Sea and continental Europe during several research flights (Fig. 4c and g). Also, the air masses probed over East Asia were frequently influenced by biomass burning plumes and anthropogenic emissions. This is exemplarily indicated for event 2 (Fig. 4b), which marks the crossing of polluted air masses off the coast of Taipei (Taiwan) on 19 March 2018. Around the Cabo Verde archipelago, extended biomass burning plumes were crossed, e.g. 400 km southwest of the islands on 17 August 2018 (event 4), later during the same flight between the islands of Sal and Praia (event 5), and ∼500 km off the coast of northeastern Brazil at 1.6 km altitude on 12 August 2018 (event 6). For all these encounters (except event 4), significant enhancements in black carbon and CO were simultaneously detected.
-
Air masses affected by anthropogenic activities. These were probed over the East China Sea, continental Europe, the English Channel, and the Irish Sea (Figs. 4b, c, f, and g and 5g–o). In these regions, large glyoxal enhancements were observed in predominantly anthropogenic (and occasionally biomass burning) polluted air masses at all altitudes. These most probably originated from fresh anthropogenic emissions of glyoxal and its precursor into the planetary boundary layer (e.g. plume II with up to 547 ppt; Fig. 4c), which were further transported into the upper troposphere (e.g. plume III with up to 2970 ppt; Fig. 4f). Plume III was crossed between 10.5 and 12.5 km in altitude above the Malin Sea, approximately 30 km north of Ireland on 28 September 2017 (Fig. 6a). This plume is remarkable because of its particularly high glyoxal mixing ratios despite the high observation altitude. Air mass trajectory calculations show that, 3 to 4 d prior to the observation, these air masses had been transported in a warm conveyor belt originating from the North American lower troposphere. The monitoring of a plume below 3 km in altitude above the English Channel on 17 July 2017, which is one of the densest ship routes worldwide, yielded glyoxal mixing ratios up to 774 ppt (Fig. 4g; plume V), which is a factor of 4 times less compared to the glyoxal enhancement in the presumably much older air in plume III. Anthropogenic pollution in the remaining but not categorised observations (Fig. 4; green) cannot be excluded, as the air masses are expected to be generally affected by pollution or biogenic emissions over Europe and East Asia (Andrés Hernández et al., 2022). These plumes can often not be unambiguously attributed to one of the three regimes, and thus we refrain from a specific categorisation.
Interestingly, the measurements in the boundary layer over continental Europe and the East China Sea yield smaller medians than those inferred over the Mediterranean Sea, where glyoxal even exceeds the observations over the Amazon Rainforest (Table 3, Fig. 4a, b, c, and g, and Kluge et al., 2020).
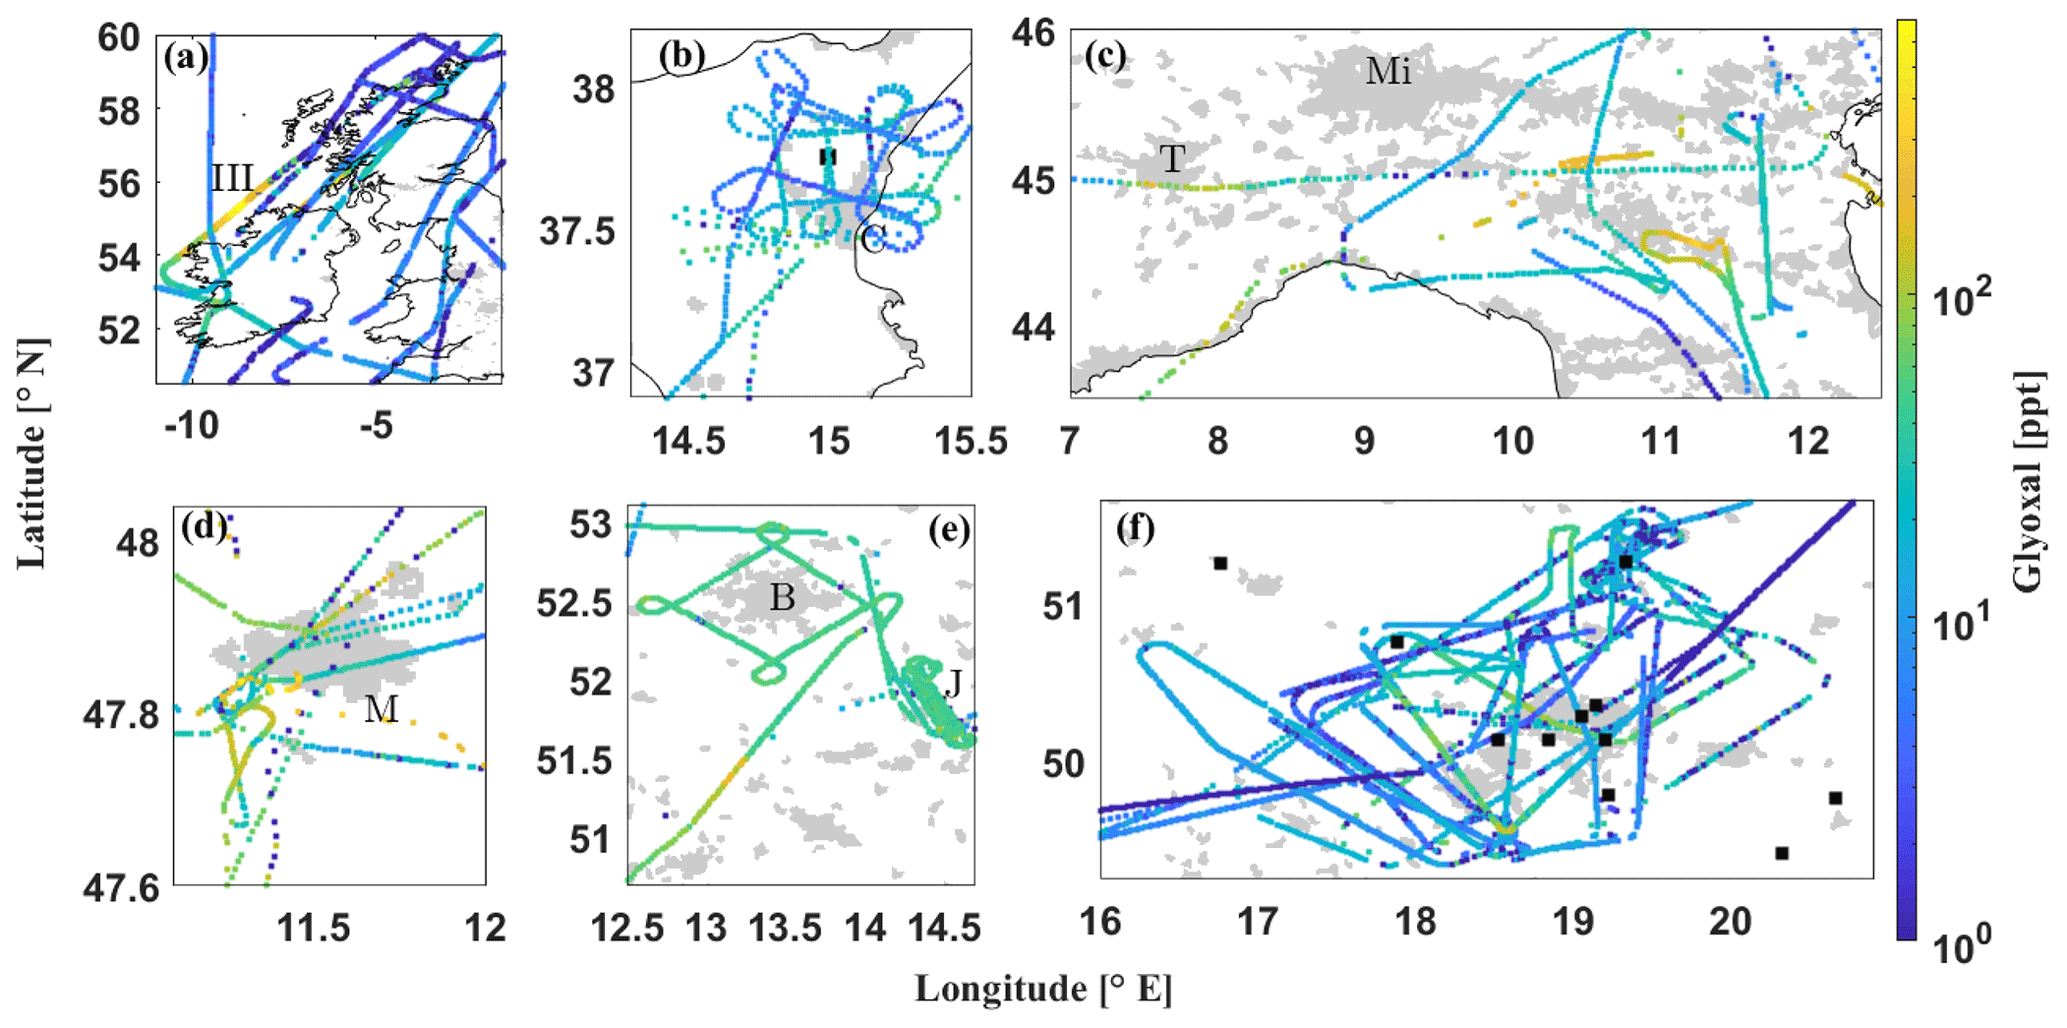
Figure 6Examples of glyoxal measurements displayed over select regions of Europe, namely (a) over Ireland and Great Britain, with the crossing of plume III during a flight leg between the Irish north coast and Scotland, (b) eastern Sicily (Italy) around Catania (C), with Mount Etna (black square), (c) the Po Valley (Italy), with Turin (T) and Milan (Mi), (d) the Munich (M; Germany) metropolitan area, (e) the Berlin (B; Germany) metropolitan area, with the Jänschwalde power plant (J) in the southeast, and (f) the Upper Silesian Coal Basin (Poland), with the coal-fired power plants marked by black squares. Note the logarithmic scale of the colour axis. Grey areas mark population centres based on 2002–2003 MODIS satellite images (made with Natural Earth data).
Over continental Europe, the largest mixing ratios of 580 ppt were observed while approaching Munich airport from the west at 671 m flight altitude on 20 July 2017. Constantly enhanced glyoxal mixing ratios were observed especially over northern Italy (Fig. 4c for event II; Fig. 6c), where glyoxal increased up to 522 ppt at 836 m altitude (20 July 2017). Based on all the research flights in this region, we infer a median of 395±71 ppt glyoxal in the lower troposphere in May–July 2017 and 2018. This is much larger than that observed in the boundary layer over other European regions, e.g. Catania or Munich, with a median glyoxal of 78 and 51 ppt, respectively (Fig. 6b and d). Glyoxal in the boundary layer over northern Italy also exceeded the observations over the Upper Silesian Coal Basin in Poland (41±17 ppt; Fig. 6f), which is known to be a large emitter of anthropogenic pollutants.
Apparently, over Europe, the emissions of glyoxal and its precursors from distinctive regional sources of anthropogenic pollutants are, while locally confined, potentially much stronger than those caused by widespread biogenic and biomass burning VOC emissions, e.g. over the Amazon Rainforest (Fig. 4a). Still, the median background (25 %–75 % of the data range) is 2 times larger over the Amazon Rainforest (4–65 ppt) compared to continental Europe (3–27 ppt), as expected due to the steadily larger number of biogenic emissions there.
The anthropogenic emissions from some larger European coastal cities (Barcelona, Marseille, and the Gulf of Venice) were probed during research flights along the Mediterranean coast on 11, 20, and 24 July 2017 (Fig. 4g). These soundings are the reason for the possible highly biased glyoxal profile in the lower troposphere over the Mediterranean Sea, since lower altitude measurements were not performed over the remote sea but within the plumes of coastal cities. During the measurements over the Gulf of Venice on 20 July 2017, median mixing ratios of 363±102 ppt were observed between 0.5 and 3.3 km in altitude, with a maximum of 845±206 ppt at 500 m in altitude presumably caused by VOC emissions from the nearby oil refinery and the oil rigs in the Adriatic Sea and/or ship traffic (Fig. 4g; plume IV). The soundings into the lower troposphere (0.5–3 km) near Barcelona on 24 July 2017 resulted in glyoxal mixing ratios up to 158 ppt (median 111 ppt). While, in the lower marine troposphere of the Mediterranean Sea, glyoxal mixing ratios are even larger than over continental Europe, the vertical profile decreases quickly over the remote ocean to a few ppt at higher altitudes. This is most likely a result of the limited vertical transport by the shallow convection over the sea and the limited lifetime of glyoxal and its major precursors.
The glyoxal profiles over Taiwan and the East China Sea (Fig. 4b) are dominated by the polluted air masses probed during the ascent/descent into Tainan (Taiwan) airport, the low-altitude soundings over Manila (Philippines), and those performed over the East China Sea between 17 March and 4 April 2018 (Figs. 4b and 5m–o). The identification of the various plume origins indicate encounters of both anthropogenic emissions (e.g. plume I) and from biomass burning during the flights (e.g. event 2 and Lin et al., 2022). On 19 March 2018, while flying towards the remote East China Sea, enhanced mixing ratios of benzene and toluene indicated the growing influence of anthropogenic pollutants in the probed air masses with a simultaneous increase in glyoxal up to 179 ppt. Different to the other marine measurements, lower-altitude observations over the East China Sea were obtained not only close to Taiwan but also over the more remote ocean. Given the larger emissions of pollutants by mainland China and South Korea, it is not surprising that, over the East China Sea, glyoxal mixing ratios in the lower troposphere significantly exceeded those above the South, tropical, and North Atlantic on average by 31 ppt (tropical Atlantic) up to 65 ppt (South Atlantic).
Overall, the glyoxal measurements in anthropogenically polluted air masses (Mediterranean Sea, continental Europe, and the East China Sea) fall into the range of previous studies in similarly polluted air masses around the globe (e.g. Lee et al., 1998; Volkamer et al., 2005a, 2007; Fu et al., 2008; Sinreich et al., 2010; Baidar et al., 2013; Kaiser et al., 2015; Volkamer et al., 2015; Min et al., 2016; Chan Miller et al., 2017; Kim et al., 2022).
4.2 Comparison of glyoxal VCDs from airborne and TROPOMI observations
Vertical column densities of glyoxal were detected with the nadir-observing spectrometers of the mini-DOAS instrument simultaneously to the limb measured glyoxal concentrations. In the following, these nadir observations and the integrated profiles are used for a detailed cross-validation of the mini-DOAS glyoxal measurements and collocated satellite observations from the TROPOMI instrument. The potential of each observation system, and its limitations regarding the detection of glyoxal, is analysed in the different atmospheric source regimes, i.e. (1) in predominantly pristine air, where both instruments operate close to their detection limits, (2) over largely extended emission events (e.g. during the South American biomass burning season), (3) in locally confined trace gas filaments in otherwise pristine air masses (e.g. small biomass burning plumes in the marine atmosphere), and (4) in air masses generally affected by differently aged biogenic and anthropogenic VOC emissions (e.g. over industrial agglomerations of continental Europe, like the Po Valley or Upper Silesian Coal Basin).
The airborne mini-DOAS nadir measurements are compared to respective same-day L3 processed glyoxal observations from the TROPOMI satellite instrument. Since the Sentinel-5P spacecraft was launched in October 2017, the comparison has focused on the mini-DOAS measurements from 2018 onward (EMeRGe-Asia, CoMet, and CAFE-Africa, all from 2018, and SouthTRAC in 2019). Additionally, the measurements over the North Atlantic (WISE in fall 2017) are included to extend the latitudinal coverage of the data set.
The glyoxal VCDs measured by both instruments generally agree well for all investigated regions (Fig. 7), even though the inferred VCDs show the expected statistical scatter, including the occurrence of negative VCDs due to the statistical noise of the glyoxal retrieval close to the individual detection limits. In the following, both data sets are more closely compared to highlight their strengths and limitations for the detection of glyoxal in different situations and ranges of VCDs.

Figure 7Distribution of individual glyoxal VCD measurements from the TROPOMI (blue) and mini-DOAS (black) instruments, after the latter is filtered for flight altitudes >8 km, and according to the TROPOMI data for solar zenith angles <70∘. The L3 TROPOMI data at a 0.05∘ resolution are averaged on a 0.25∘ × 0.25∘ grid around the mini-DOAS measurement locations (see Fig. 8b). Due to low number of airborne measurements above 8 km over East Asia, the altitude filter prevents a thorough statistical analysis of the region (a).
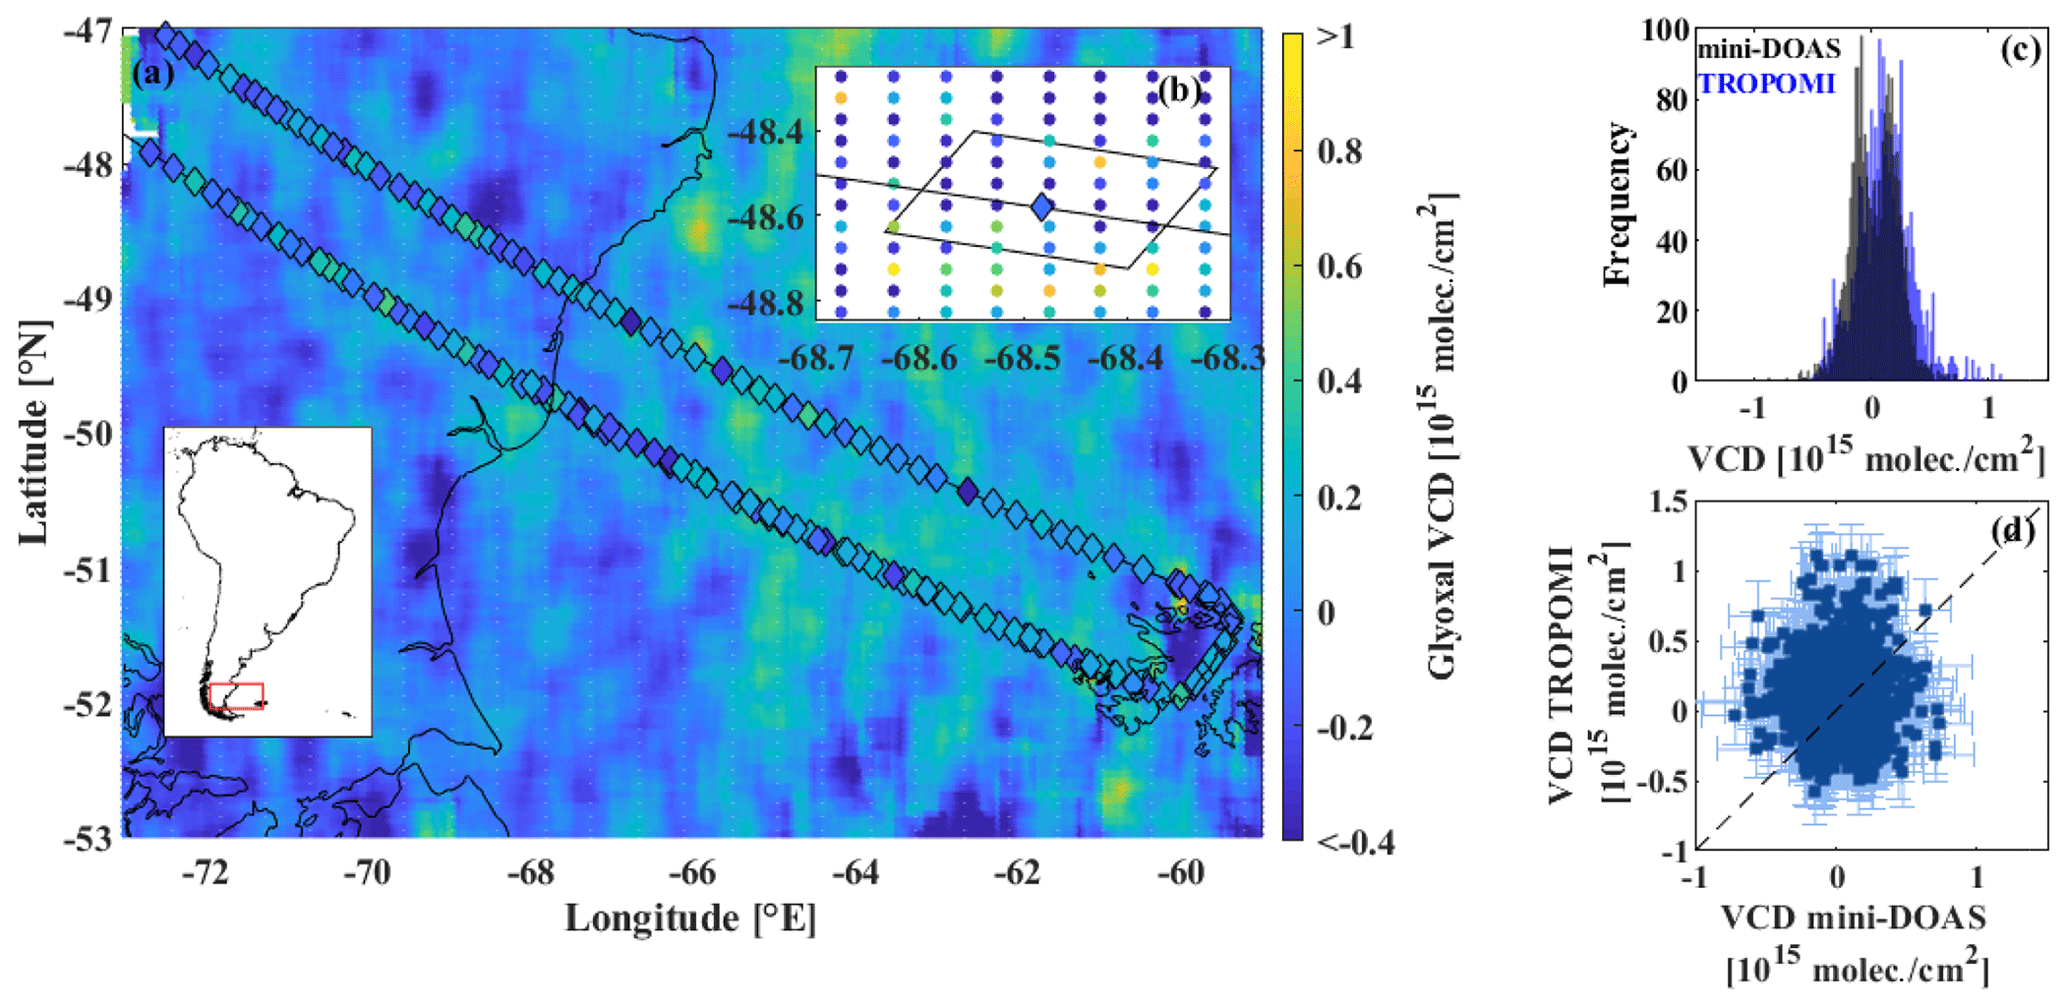
Figure 8Glyoxal measurements in the pristine marine atmosphere over the South Atlantic between southern Patagonia (Argentina) and the surrounding islands on 9 November 2019. (a) Along-track mini-DOAS glyoxal measurements (diamonds with black contours) with the collocated same-day L3 TROPOMI observations at 0.25∘ × 0.25∘ resolution. For better visibility, only every fifth mini-DOAS measurement is shown. (b) Spatial gridding of 25 high-resolution TROPOMI measurements around an individual mini-DOAS observation. (c, d) Frequency distribution and scatterplot of the inferred glyoxal VCDs from the mini-DOAS instrument versus TROPOMI L3 averaged on 0.25∘ × 0.25∘, according to panel (b).
-
The detection of glyoxal in pristine air masses (South Atlantic and southern Argentina). This shows a good agreement among both instruments, with a corresponding scatter around zero (Fig. 7d). In this region, TROPOMI and the mini-DOAS instrument measure slightly elevated median glyoxal VCDs of and molec. cm−2, respectively. Compared to TROPOMI, the mini-DOAS distribution shows a slightly larger right-hand-side tail (Fig. 7d). This is due to elevated glyoxal detected from the aircraft (and not captured by TROPOMI) in aged biomass burning plumes from over 20 smaller wildfires in the Chilean Biobío Region located about 100 km northeast of the HALO flight on 15 November 2019. Note that the scatter of TROPOMI data at the high resolution of 0.05∘ × 0.05∘ is significantly larger than of the mini-DOAS measurements, even though both instruments have comparable spatial resolutions. Evidently, this is a consequence of the much shorter observing time and, hence, number of collected photons from an individual pixel for TROPOMI compared to the mini-DOAS instrument (see Sect. 2.1.4). For daily TROPOMI data at 0.25∘ × 0.25∘ resolution, this scatter is largely smoothed out (Fig. 8a), thus demonstrating the need to spatially degrade the high-resolution TROPOMI glyoxal data in glyoxal intercomparison studies (Fig. 8c and d). The respective gridding of 25 high-resolution TROPOMI measurements around each mini-DOAS observation is shown for an example measurement in Fig. 8b.
-
The detection of glyoxal in largely extended biomass burning plumes. This shows generally good agreement among both instruments, even though the differing overpass times and resulting plume displacements may cause some discrepancy in the along-track comparison. Such large plumes were, for example, detected over the Gulf of Cádiz along the southern Portuguese coast on 7 August 2018 (Fig. 9a and b) and over southern Uruguay on 7 October 2019 (Fig. 9c and d). Satellite images from the MODIS instruments on the Terra and Aqua satellite taken over the Gulf of Cádiz on the same day show a well-confined biomass burning plume that was captured by both instruments with a respective increase in glyoxal (Fig. 9a). While the TROPOMI-detected glyoxal VCDs quickly decrease around the margins of the plume, the mini-DOAS instrument still measured slightly elevated glyoxal VCDs in the vicinity of the plume (Fig. 9b; data below the 1 : 1 line). This behaviour is especially pronounced towards the open Atlantic west of the plume and might be a result of the apparent degraded sensitivity of TROPOMI in the detection of small glyoxal enhancements in the lower troposphere over dark water surfaces such as the ocean (see Sect. 5).
The glyoxal enhancements over Uruguay on 7 October 2019 cannot be ascribed to one specific plume but instead to more dispersed plumes due to extended wildfires in central Uruguay and in northeastern Argentina. Here, the large scatter of the data in Fig. 9d is primarily a result of the temporal mismatch between the observations made over 6 h (overpass mini-DOAS around 10:45 UTC and TROPOMI at 17:00 UTC).
-
The detection of glyoxal in small or aged plumes over the oceans. This, together with moderately enhanced glyoxal, shows sizeable differences between both instruments. Such plumes predominantly originate from continental wildfires and were frequently observed in all regions during all research missions (Fig. 4). Over the oceans, such plume encounters can be well distinguished from the pristine surroundings with low glyoxal due to the resulting high local concentration gradients. In contrast, for observations over land with generally higher glyoxal concentration in the background, such plume encounters with only moderately enhanced glyoxal are less distinct (Fig. 9b, c, and g). During the South Atlantic and tropical Atlantic flights, the various smaller plumes detected from the aircraft in the upper troposphere were mostly not observed by TROPOMI, e.g. along the southern Chilean coast on 15 November 2019 (see Sect. 4.1). During the various encounters of biomass burning plumes over the Atlantic, TROPOMI thus detects generally smaller glyoxal VCDs than the mini-DOAS instrument. This causes the right-hand-side tail of the mini-DOAS distribution and, accordingly, a slight increase in the median of the VCD distributions (Fig. 7c and d). The same behaviour is observed for plume encounters at lower altitudes, e.g. within the marine boundary layer below 2 km over the East China Sea south of Kyushu island (Japan) on 30 March 2018 (Fig. 9e, f, and g) or at 1.6 km in altitude and ∼500 km northeast of the Brazilian coast over the tropical Atlantic on 15 August 2018 (see Sect. 4.1), which were both not detected by TROPOMI. Similar observations were made during multiple other occasions, e.g. during biomass burning plume encounters near the Canary Islands, Spain, on 7 and 15 August and 7 September 2018, off the coast of Brazil on 4 November 2019, along the West African coast on 10 and 31 August and 4 September 2018, and along the coast of Japan east of Osaka on 4 April 2018. Very likely, the undetected increase in glyoxal in such small or low-lying biomass burning plumes by TROPOMI is a result of (a) the potentially small vertical extent of some of the low-lying plumes and hence their relatively small contribution to the total atmospheric VCD, (b) the small horizontal extent of the plumes, which may just not be detectable by the satellite due to the lower spatial resolution of TROPOMI, or (c) it is simply missed due to the temporal mismatch with the airborne observations, (d) an incorrect a priori glyoxal profile in the air mass factor calculations, (e) a decreased sensitivity of the TROPOMI instrument to low-lying plumes over surfaces with low reflectivity (e.g. oceans), or a combination of all of these circumstances.
-
The detection of glyoxal in mixed polluted continental or coastal air masses (e.g. over continental Europe). This agrees well between both instruments for upper tropospheric measurements, even though glyoxal VCDs are sometimes underestimated by TROPOMI (e.g. over the Upper Silesian Coal Basin). While we generally restrict the comparison to aircraft observations in the upper troposphere, we additionally found the airborne instrument to generally measure more glyoxal than the satellite for measurements closely above and within the polluted boundary layer. This is primarily a consequence of the observation geometry, the different a priori assumptions, and the proximity of the measurements to the pollution. At lower flight altitudes, a relatively larger fraction of photons detected by the aircraft instrument will have travelled through the pollution layer than the photons detected by the satellite (Fig. 2). Second, the mostly larger assumed a priori glyoxal for the airborne observations, compared to MAGRITTE CTM simulations in polluted environments, leads to a larger detection sensitivity for glyoxal of the aircraft in low altitudes. This elevated sensitivity is particularly noticeable when the aircraft is close to or within the polluted lower atmosphere. For such measurements, the box air mass factors give even more weight to the glyoxal located below the aircraft than to the glyoxal fraction above the aircraft (to which the satellite relatively gives more weight).
Over continental Europe, both instruments detected median glyoxal VCDs roughly 2 to 5 times larger than over pristine marine environments, such as over the South, tropical, and North Atlantic (Fig. 10c, d, e, f, and g). When probing distinct (mostly anthropogenic) emissions of glyoxal and its precursors, such as over major population centres (e.g. Bologna) or industrial agglomerations (e.g. the Po Valley or the Upper Silesian Coal Basin), TROPOMI generally measures smaller VCDs than the mini-DOAS instrument (right-hand-side tail in the mini-DOAS distribution in Fig. 7b). Accordingly, over the Upper Silesian Coal Basin, a factor of 5 times larger glyoxal VCDs are detected by the mini-DOAS instrument ( molec. cm−2) than by TROPOMI ( molec. cm−2). The smaller VCDs reported by TROPOMI over populated and industrial areas with a correspondingly increased aerosol load in the boundary layer might be caused by the decreased detectability of glyoxal from space. Figure 10 shows the glyoxal VCDs inferred for collocated flight sections in the different regions and seasons, with the median, 25th, and 75th percentiles (box edges), and whiskers indicate the in-range minima and maxima. Additionally, the glyoxal VCDs inferred from the integrated limb profiles are compared to the nadir-inferred VCDs (Fig. 10; green squares). The VCDs obtained from the integrated vertical glyoxal profiles (IPs) are in good agreement with the nadir-measured VCDs, thus providing confidence in the consistency of the airborne glyoxal measurements. In general, a good agreement is found between the airborne and spaceborne glyoxal measurements for all regions and seasons, with the exceptions discussed above.
Even though (aged) biomass burning plumes often only extend over a limited altitude range in the lower and middle troposphere and therefore may only contribute a minor fraction to the total VCDs in background air, they are apparently discernible in airborne observations and in cases of more pronounced pollution or large vertical extent even from space (e.g. Figs. 9a and b and 10a and c).

Figure 9Collocated glyoxal VCDs from mini-DOAS observations (diamonds with black contours) and 0.25∘ × 0.25∘ resolution L3 TROPOMI observations (squares) in different regions (a, c, e, f), with corresponding scatterplots (b, d, g), where each TROPOMI observation is gridded around the mini-DOAS measurements, as shown in Fig. 8b. For better visibility of the underlying satellite image, the footprints are not to scale. (a, b) Monitoring of a glyoxal plume from wildfires in the Serra de Monchique (Algarve, Portugal) detected by TROPOMI and by the mini-DOAS instrument (13 km flight altitude) over the Gulf of Cádiz at 13:50 and 11:00 UTC, respectively, on 7 August 2018. (c, d) Overpass of extended biomass burning plumes near the Uruguayan coast region observed by TROPOMI (overpass at 17:00 UTC) and mini-DOAS (8–13 km flight altitude) at 10:45 UTC on 7 October 2019. (e, f, g) Monitoring of a glyoxal plume within the marine boundary layer above the East China Sea, southwest of Japan, on 30 March 2018 at 12:50 UTC (TROPOMI) and 01:40 UTC (mini-DOAS) with the geographic overview (e), magnification of the flight track (f), and respective scatterplot (g). The wildfire data (red circles; not to scale) are derived from MCD14 MODIS observations on the Terra and Aqua satellites. The MODIS satellite images are taken from NASA Worldview, based on the satellite overpasses on 13:48 UTC on 7 August 2018 (a), 17:23 UTC on 7 October 2019 (c), and 02:30 UTC on 30 March 2018 (e).

Figure 10Comparison of inferred glyoxal VCDs for TROPOMI (blue) and mini-DOAS measurements (black) for the different regions, namely the South American continent (a), East China Sea (b), continental Europe and its northern islands (c), South Atlantic (d), tropical Atlantic (e), North Atlantic (f), and the Mediterranean Sea (g). The whiskered boxes indicate the 25th to 75th percentile ranges and respective medians with in-range minima and maxima. For comparison, the integrated glyoxal limb profiles (IPs; see Sect. 4.1) for the different subsets of data (green squares) are also shown. For the South American continent, mini-DOAS VCD measurements are only available for the Patagonia and Argentina SouthTRAC deployments in fall 2019. For the measurements before 2018, TROPOMI data were not yet available.
4.3 Comparison of measured airborne and EMAC simulated glyoxal
In the following, the airborne glyoxal measurements are compared to EMAC model simulations. The simulations of glyoxal concentrations and VCDs are performed on a 10 min time grid resolution along the flight trajectories, based on the settings described in Sect. 3.3. For the measured versus modelled intercomparison, VCDs detected at all flight altitudes are included in the analysis. This comes with the advantage of a larger number of available VCD measurements than for the airborne to satellite comparison (in particular over the East China Sea), but at the same time, the flight medians slightly change from those compiled for the satellite comparison (Figs. 10 and 12). For the comparison, we distinguish between observations in background air (outside of identified emission events) and observations of elevated glyoxal due to specific emission plumes (see Fig. 4 and Sect. 4.1). The resulting profiles differentiate the characteristic background glyoxal in each region (green, yellow, and blue in Fig. 11) from local glyoxal enhancements due to biomass burning or anthropogenic pollution (brown and black colours, respectively, in Fig. 11).
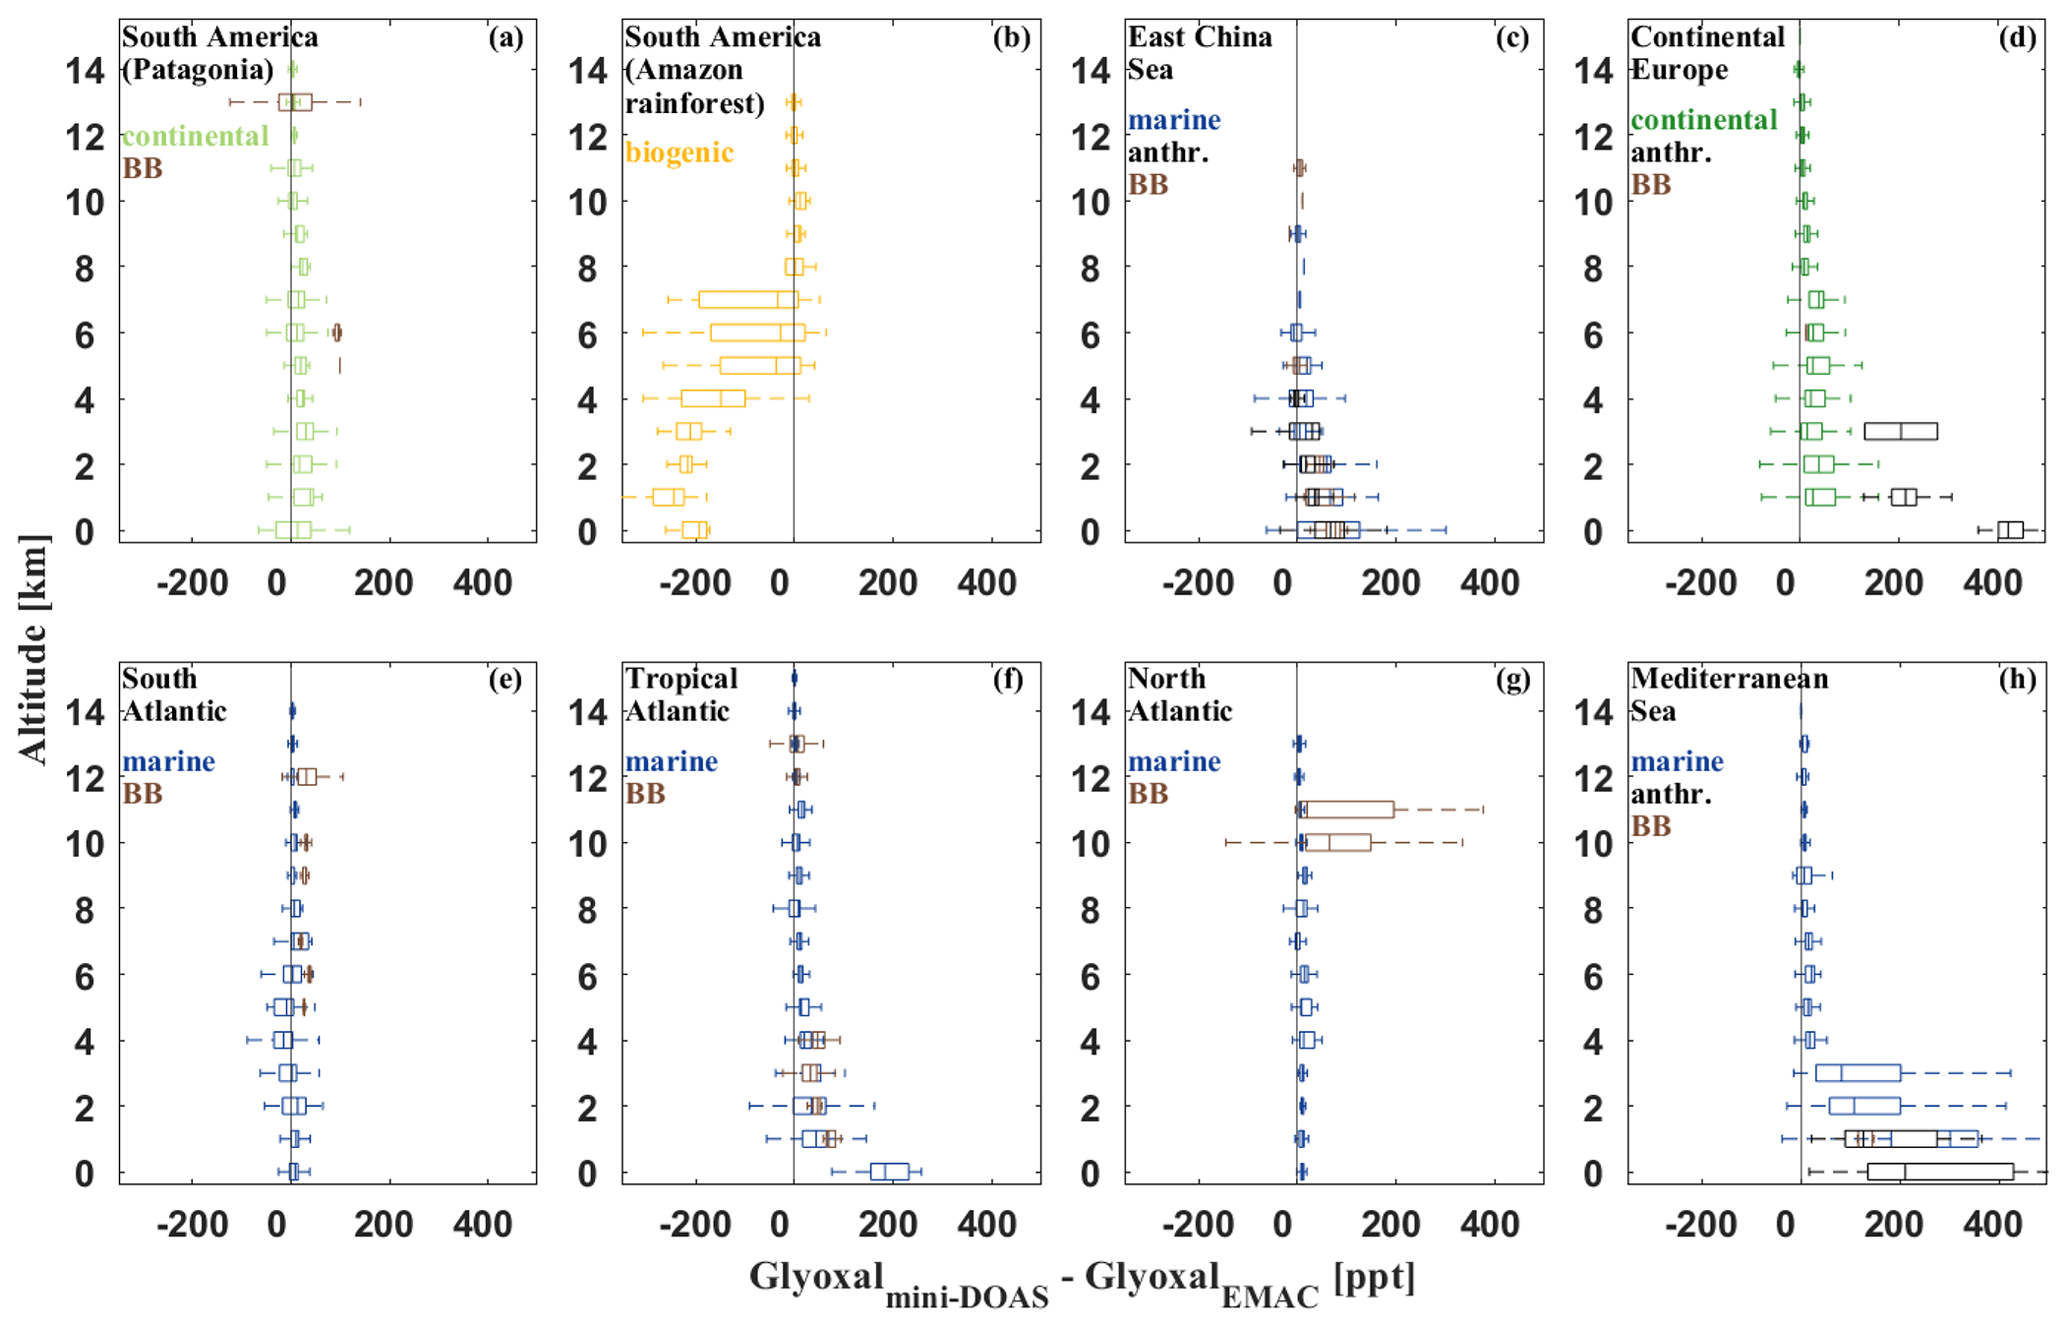
Figure 11Difference in measured airborne and EMAC simulated glyoxal for the different regions. Continental measurements are shown in green, measurements over the rainforest in yellow, and marine observations in blue. For the comparison, only positive valued measurements are considered due to the missing randomness of the model simulations (see the text). Since no EMAC simulations are available for the measurements over the Amazon Rainforest in 2014 and over the Mediterranean and Near East in 2015, simulations performed for the year 2017 are used instead (panel b and a minor part of the data in panel h). The data are plotted in 1 km altitude bins for the 25th to 75th percentiles (whiskered boxes) with respective medians and with in-range minima and maxima. Profiles for identified emission events (see Fig. 4 and Sect. 4.1) are calculated separately (biomass burning in brown and anthropogenic emissions in black).
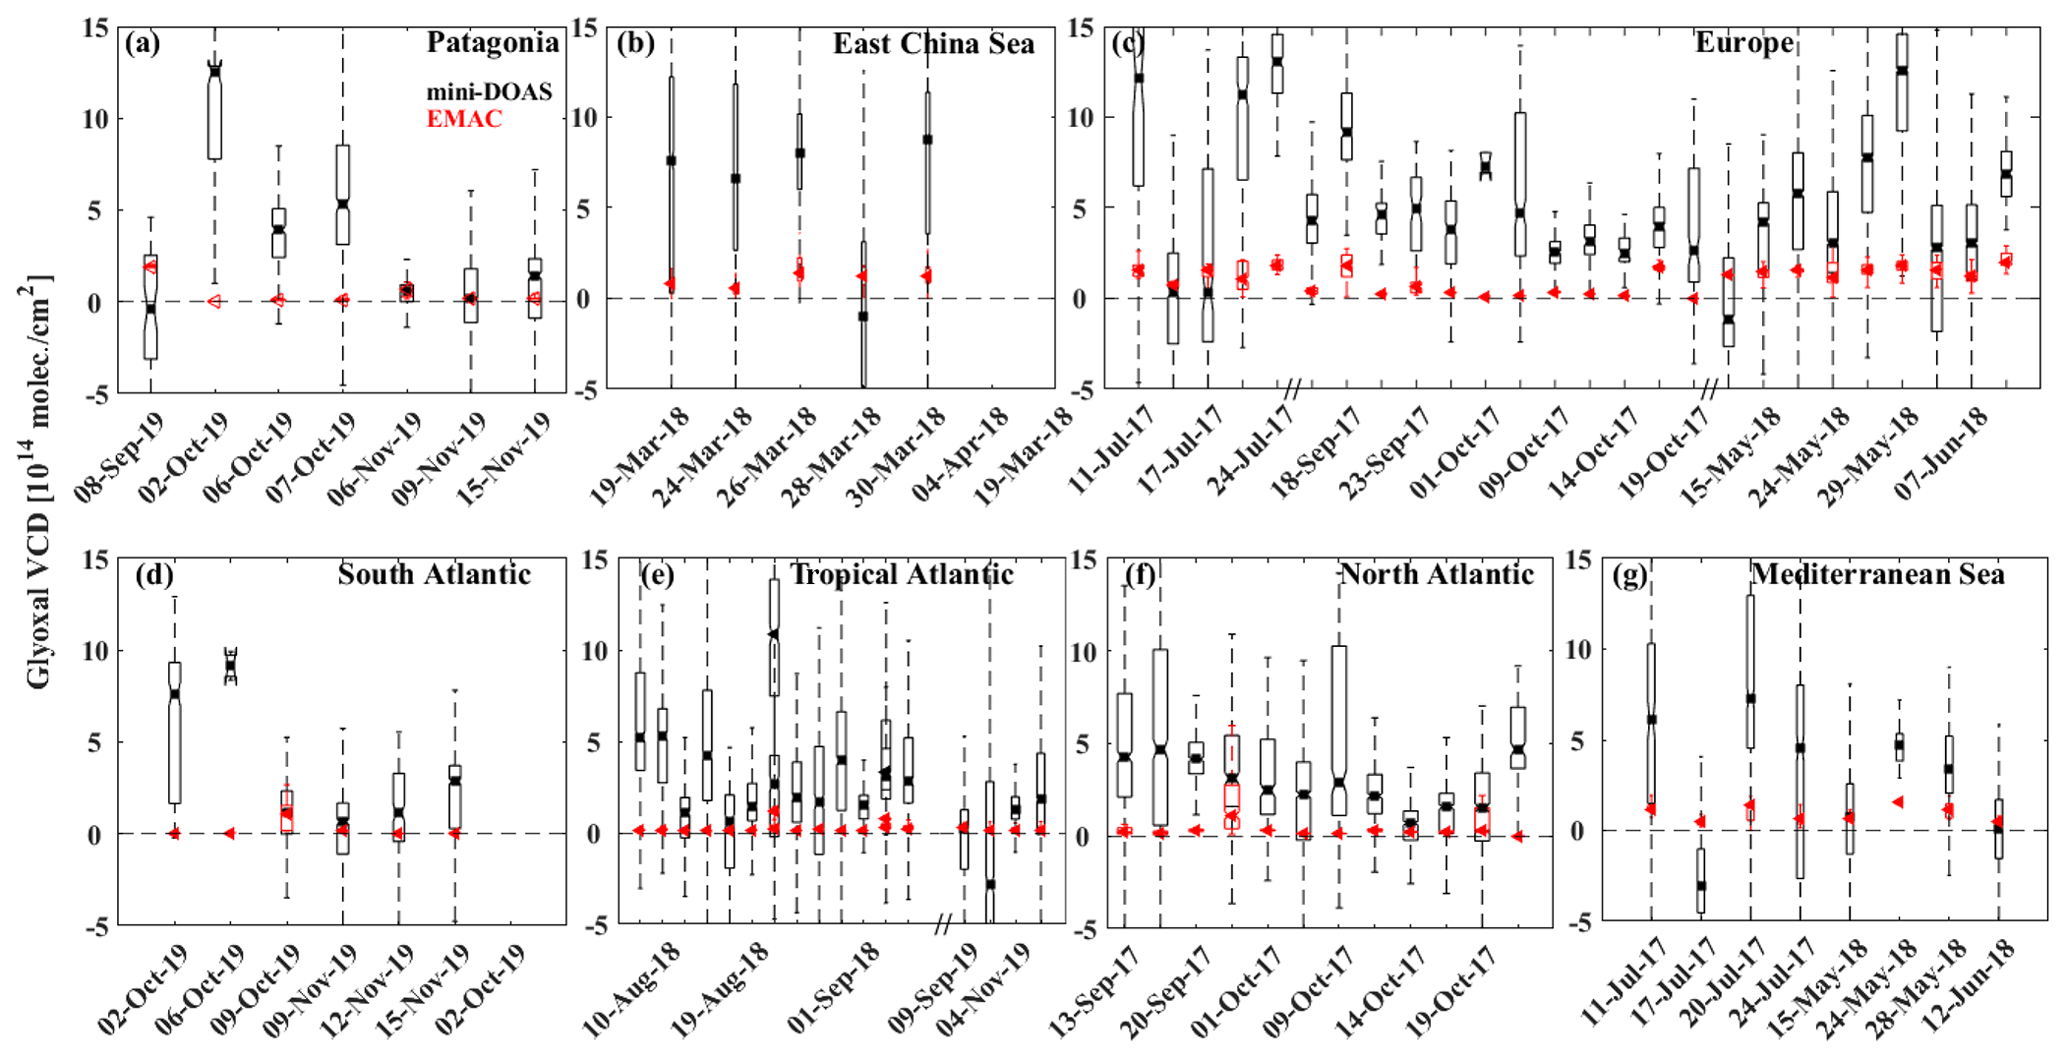
Figure 12Comparison of measured airborne (black) and simulated (red) glyoxal VCDs in the different regions and for all flight altitudes of the measured data.
For the employed EMAC set-up, simulated glyoxal underestimates measured glyoxal to varying degrees, in agreement with previous findings (e.g. Myriokefalitakis et al., 2008; Fu et al., 2008; Stavrakou et al., 2009a; Walker et al., 2022; Figs. 11 and 12). The best agreement between the model and measurement is generally found for the upper troposphere and in pristine regions with only a few surface emissions or expected long-range transport of glyoxal and its precursors, i.e. over Patagonia or the North Atlantic (Figs. 11a, e, and g and 12a, d, and f). Larger differences in modelled and measured glyoxal are found for regions with significant biogenic (e.g. tropical rainforests), anthropogenic (e.g. continental Europe, East China, or the Mediterranean Sea; Figs. 11c, d, and h and 12b, c, and g), or biomass-burning-related emissions of glyoxal and precursor VOCs (e.g. the tropical Atlantic; Figs. 11f and 12e). In the mixed polluted background atmosphere over continental Europe, the comparison shows a relatively small glyoxal underestimation by EMAC (Fig. 11d; green), whereas measured and modelled glyoxal differ significantly when probing local emission hotspots (e.g. city plumes; Fig. 11d; grey) and in the mixed polluted marine boundary layer over both the East China and Mediterranean seas (Fig. 11c, h).
The following three key findings are eminent.
-
Over the tropical rainforest, with its significant surface emissions of biogenic VOCs, the model overestimates glyoxal by a factor of 2–3 in the planetary boundary layer and free troposphere (Fig. 11b). At higher altitudes (>8 km), measured glyoxal exceeds the simulations, as also observed for the other investigated regions. This may indicate too strong emissions of short-lived biogenic VOCs (e.g. isoprene) from the rainforest and/or overestimated emissions of longer-lived glyoxal precursor molecules (e.g. aromatics or aliphatic compounds) within the model. Contrary to short-lived precursors, such longer-lived molecules are potential glyoxal precursors in the free and potentially even in the upper troposphere. In addition, the strong overestimation might point to missing glyoxal loss processes like uptake and oxidation in cloud droplets which have been recently represented in EMAC in the Jülich Aqueous-phase Mechanism of Organic Chemistry (JAMOC; Rosanka et al., 2021a, b).
-
In distinctive biomass burning or anthropogenic emission plumes (Fig. 11; brown and grey), the glyoxal underestimation from the model is found to be larger than outside of the plumes. For example, glyoxal enhancements due to city plumes over Europe are mostly reproduced by the model; however, the magnitude is underestimated on average by a factor of 8. Some of the underestimation of these specific plume events is related to the fact that EMAC does not represent any monthly variation in the anthropogenic VOC emissions and does not represent any daily temporal evolution of specific biomass burning events. At the same time, the coarse resolution used (about 209×209 km2) by EMAC smooths out specific plumes observed by the aircraft observations. Further reasons for the underestimated glyoxal in polluted air masses are presently unclear but may be related to incorrect assumptions regarding the strengths and composition of the anthropogenically emitted mixture of glyoxal-producing VOCs.
-
Our findings of enhanced glyoxal in the tropical marine boundary layer are in agreement with previous reports from the tropical Pacific and Atlantic (e.g. Sinreich et al., 2010; Walker et al., 2022) but are not reproduced by the model (Fig. 11f). Over the tropical Atlantic, EMAC simulates an approximately constant vertical profile with much smaller median glyoxal mixing ratios (4 ppt) than observed (44 ppt). In the free and upper troposphere, the simulations and observations outside of biomass burning plumes agree better. Again, this discrepancy may point to missing glyoxal sources related to the organic microlayer at the sea surface in the model (e.g. Chiu et al., 2017; Brüggemann et al., 2018).
As discussed in Sect. 4.2, the airborne mini-DOAS and satellite TROPOMI observations of glyoxal show a good agreement overall for measurements in (a) pristine air with low glyoxal concentrations near the detection limits of the instruments, (b) polluted air masses with high glyoxal concentrations (e.g. major emission plumes), and (c) continental air of mixed pollution sources. Exceptions to this overall good agreement are observations (a) over land with an increased aerosol load in the boundary layer, (b) of low-lying plumes (mostly biomass burning) over the ocean, with its low reflectivity in the visible wavelengths, and (c) of pollution plumes over the oceans with a limited vertical or horizontal extent irrespective of their altitude. For TROPOMI, this also leads to underestimated glyoxal in the marine surroundings of larger emission plumes.
A more systematic comparison of the mini-DOAS glyoxal measurements with previous air- or shipborne measurements in the same regions, seasons, and altitudes is complicated by the limited number of respective studies in the remote marine free and upper troposphere. In this respect, our observations provide a unique and novel data set of glyoxal measurements covering a large number of, so far, little explored (or even unexplored) regions and altitude ranges with different pollution levels around the globe. In particular, the data may provide new insights into the vertical profiles of glyoxal in different pristine marine regions. Moreover, they provide further evidence of elevated glyoxal in aged and long-range transported biomass burning plumes, similar to past studies that reported much larger glyoxal concentrations than expected. These two aspects of our measurements are discussed in more detail in the following.
- 1.
Our measurements confirm previous reports of (at least) occasionally elevated glyoxal (1–140 ppt) in the marine boundary layer over the remote ocean (e.g. Zhou and Mopper, 1990; Sinreich et al., 2010; Coburn et al., 2014; Mahajan et al., 2014; Lawson et al., 2015; Volkamer et al., 2015; Chiu et al., 2017; Walker et al., 2022).
The measurements further confirm observations of elevated glyoxal in the marine boundary layer over tropical oceans compared to the marine boundary layer at higher latitudes. In fact, we observe 2–4 times more glyoxal in the marine boundary layer of the tropics compared to the South or North Atlantic (Fig. 4 and Table 3). The comparable large range of observed glyoxal mixing ratios in different marine regions is indicative of the large variety of the types and transport history of the investigated air masses (Table 3). Yet, given the short lifetime of glyoxal in the sunlit atmosphere of ∼2 h (Koch and Moortgat, 1998; Volkamer et al., 2005a; Tadić et al., 2006; Fu et al., 2008; Wennberg et al., 2018), the observation of elevated glyoxal in the tropical marine atmosphere requires rather large and potentially variable sources in the range from 0.5 to 70 ppt h−1 if glyoxal is derived from the photochemical decay of its organic precursor substances. In the past, two major explanations for the as yet unexplained glyoxal over marine regions have been discussed, i.e. either (a) the transport of longer-lived glyoxal precursor species from land-based sources into the remote marine atmosphere and/or (b) the emissions of glyoxal and/or its organic precursors from the ocean.
- a.
Based on co-located measurements of glyoxal and some of its main known precursors like isoprene and the monoterpenes, Lawson et al. (2015) estimated their potential contribution to glyoxal in the marine boundary layer to be of the order of 10 %. Additional long-lived glyoxal precursor molecules (e.g. aromatics, acetylene, or larger VOCs) have been suggested to explain the discrepancy between observed and expected glyoxal in the pristine marine boundary layer, but conclusive answers have not yet been found (e.g. Sinreich et al., 2010; Rinaldi et al., 2011; Coburn et al., 2014; Mahajan et al., 2014; Lawson et al., 2015; Chiu et al., 2017; Walker et al., 2022). This finding is supported by the inferred vertical glyoxal profiles over the different marine regions. When comparing the vertical glyoxal profiles above the tropical Atlantic to those over the mid- and high-latitude Atlantic, the relative enhancement of glyoxal in the tropics appears restricted to the tropical marine boundary layer. At higher altitudes, the glyoxal profiles over different regions of the Atlantic are similar (see Table 3). This finding strongly points to a marine glyoxal (or glyoxal precursor) source in the tropics rather than the long-range transport of glyoxal and its precursors from terrestrial emissions. If the latter process was the dominant glyoxal source in the observed marine air masses, elevated glyoxal would also be expected at higher altitudes and latitudes and not exclusively in the tropical boundary layer.
- b.
Direct emissions of significant amounts of glyoxal from the oceans could also be convincingly ruled out, primarily because of its high water solubility (effective Henry's law coefficient of Hcp=4100 ; Sander, 2015) and the observation that the daytime flux of glyoxal is directed from the atmosphere into the ocean (Zhou and Mopper, 1990; Coburn et al., 2014; Chiu et al., 2017; Zhu and Kieber, 2019). Potentially relevant glyoxal precursor molecules include glycolaldehyde and acetaldehyde. However, their contribution to the atmospheric glyoxal budget is poorly constrained. For instance, acetaldehyde is largely produced in seawater (Zhu and Kieber, 2020), and a net flux to the atmosphere is expected (Zhu and Kieber, 2019). Estimates of the global oceanic source of acetaldehyde range from 34 to 57 Tg yr−1 (Millet et al., 2010; Wang et al., 2019). Usually, global atmospheric models neglect this source, as is the case in the EMAC simulation performed in this study. However, even when this acetaldehyde source is taken into account, atmospheric models still underestimate observations in the boundary layer and free troposphere (Wang et al., 2019). The implied that a significant and widespread missing source of acetaldehyde may therefore be relevant for the global glyoxal budget. Direct oceanic emissions of unsaturated aliphatic or additional aromatic glyoxal precursor species besides acetylene (e.g. benzene, toluene, ethylbenzene, or xylenes) have also been found to be insufficient to explain the observed glyoxal concentrations in the marine environment of the tropics (Xiao et al., 2007; Mahajan et al., 2014), even though their potential source strengths have recently been reported to be larger than previously thought (Rocco et al., 2021). At night, NO3 may oxidise some organic VOCs (e.g. toluene) and thus build up a certain glyoxal level until dawn, but the potential production rate is far too small to explain the observed glyoxal concentrations both at night and during the daytime (Coburn et al., 2014; Walker et al., 2022).
In contrast, recent laboratory experiments have shown that UV-light-initiated reactions at the sea surface organic microlayer involving DOC (dissolved organic carbon) may lead to the production of significant amounts of VOCs of low solubility, e.g. fatty (heptanoic and octanoic) and nonanoic (NA) acids, and thus of secondarily formed oxidised VOCs like glyoxal and its precursors (Ciuraru et al., 2015; Chiu et al., 2017). From their study, Chiu et al. (2017) concluded that the ozonolysis of 2-nonenal is most likely the primary chemical mechanism to produce significant amounts glyoxal in the marine atmosphere and that this source can potentially sustain tens of ppt glyoxal over the ocean. In addition, a recent study of Brüggemann et al. (2018) discusses an abiotic source of organic vapours emitted by photochemical reactions of the amphiphilic compounds forming surfactants at the sea surface. In their study, they determined global emissions to be 23.2–91.9 TgC yr−1 of these organic vapours due to interfacial photochemistry, of which 1.11 (0.70–1.52) Tg yr−1 are attributed to emissions of isoprene. Though potentially relevant for organic aerosol mass over the remote ocean (Brüggemann et al., 2018), at this point it is unclear how much this organic vapour may ultimately contribute to the elevated glyoxal observed over the tropical oceans.
In conclusion, the low-to-high latitudinal gradient of glyoxal and the comparably low concentrations in the free troposphere also above the biologically active tropics provide some evidence that indeed the emissions of DOC-related VOCs from the oceanic microlayer and their photochemical decay rather than long-range transport of long-lived glyoxal precursors from land are primarily responsible for the elevated glyoxal in the pristine marine atmosphere of the tropics.
- a.
- 2.
Furthermore, our observations of enhanced glyoxal in aged biomass burning plumes both over land and the ocean confirm recent reports of enhanced glyoxal in aged biomass burning plumes that have been transported for at least several days (e.g. Alvarado et al., 2020). Such plumes were observed on multiple occasions over the South (one event), North (one event), and tropical Atlantic (multiple events; see Sect. 4.1), within the framework of the present study. Again, due to the short atmospheric lifetime of glyoxal during the daytime, the glyoxal detected in these aged biomass burning plumes was necessarily secondarily formed from the direct or multi-generation oxidation of as yet unidentified longer-lived VOC precursor species (e.g. benzene, acetylene, or aromatics) which were co-emitted during the wildfires. Details on how the primary emitted and secondary formed glyoxal-producing VOCs evolve in aged biomass burning plumes still need to be explored before more firm conclusions on the fate of glyoxal and its potential to form secondary aerosols in these aged biomass burning plumes can be drawn. Nevertheless, significant amounts of glyoxal may be produced by the oxidation of aromatic compounds from the evaporation of organic aerosols in such air masses (Palm et al., 2020). Accounting for this process could also partially resolve the model underestimation of ozone production by biomass burning emissions (Bourgeois et al., 2021). Since biomass burning is much more frequent in the tropics than at higher latitudes, the glyoxal formed in these aged biomass burning plumes from long-lived precursors may also enhance the observed low- to high-latitude gradient of glyoxal in the lower marine atmosphere.
Our study confirms recent findings on glyoxal in the atmosphere, but it also offers new aspects on how widespread the occurrence of elevated glyoxal is in the atmosphere. This emphasises the potential role glyoxal may play in the oxidation of VOCs, the oxidative capacity of the atmosphere and hence ozone formation, and on its importance in secondary aerosol formation.
We report on spectroscopic glyoxal measurements in nadir and limb geometry performed during 72 research flights all around the globe aboard the German research aircraft HALO between 2014 and 2019. The directly measured and profile-integrated column densities of glyoxal are compared to near-collocated measurements from space by the TROPOMI instrument on the Copernicus Sentinel-5 Precursor satellite. Based on this unique data set with respect to geographical and seasonal coverage, an in-depth evaluation of the strengths and weaknesses of each observation technique is made. Overall, a good agreement is found among the two data sets, with the exception of airborne observations of faint glyoxal plumes occurring over surfaces of low reflectivity and plumes in lower altitudes (i.e. in the marine or planetary boundary layer).
The combined airborne nadir and limb data set is the first of its kind and may offer new information on the fate of atmospheric glyoxal in the global atmosphere. The limb measurements further allow us to infer and investigate different glyoxal profiles in the troposphere over different regions of the world. They are, however, not representative of climatological glyoxal studies due to their limited coverage in space and time. The integrals of the limb profiles compare well with the nadir total glyoxal column densities measured from the aircraft and from space. Both types of airborne measurements, i.e. total atmospheric column densities and the vertical profiles, are further compared to glyoxal simulations of the global atmosphere chemistry model EMAC. The comparison of measured and simulated glyoxal points to several deficits in the current representation of the photochemistry of glyoxal and its precursor species in respective models. The general underestimation of glyoxal found in the simulations over land and oceans has already been recognised in previous studies, most of which were based on past satellite observations (e.g. Fu et al., 2008; Myriokefalitakis et al., 2008; Stavrakou et al., 2009a).
Our airborne glyoxal observations confirm key findings related to atmospheric glyoxal reported in recent studies, specifically the occurrence of elevated glyoxal in aged biomass burning plumes (Alvarado et al., 2020) and in the marine boundary layer of the tropics (Sinreich et al., 2010; Rinaldi et al., 2011; Coburn et al., 2014; Mahajan et al., 2014; Lawson et al., 2015; Chiu et al., 2017; Walker et al., 2022). In addition, our measurements provide novel insights into various aspects of atmospheric glyoxal, e.g. its height distribution in rarely or as yet unprobed air mass types and/or those elusive for glyoxal detection from space.
Moreover, the study points to some major deficits in our current understanding of atmospheric glyoxal. When combined, these deficits reveal multiple causes for the current glyoxal underestimation, which do not result from the disregard of a single glyoxal precursor molecule, source, or single chemical pathway but potentially from a suite of glyoxal precursor molecules and formation processes. This conjecture is supported by the observed deficits in explaining the measured glyoxal in different types of air masses, i.e. in (a) anthropogenic plumes of larger agglomerations, (b) aged polluted air masses forming the continental glyoxal background, (c) pristine air masses of the marine boundary layer in the tropics, (d) the pristine marine atmosphere (e.g. South and North Atlantic), and (e) aged biomass burning plumes. Our observations provide novel information on the required emission strengths, concentration, and lifetimes of the possible different glyoxal-producing precursors and their intermediates necessary to close the apparent observation-to-model gap.
In this respect, it is noteworthy to acknowledge that deficits in understanding atmospheric glyoxal ultimately indicate a more fundamental deficiency in the current knowledge of the photochemistry and emissions of VOCs in the atmosphere, with a variety of consequences for the oxidative capacity and ozone in the atmosphere. Moreover, since glyoxal is known to support secondary organic aerosol (SOA) formation, our finding of overall larger glyoxal in both the polluted and pristine atmosphere provides evidence for an overall larger role that glyoxal may play in global SOA formation. Our study, in addition to previous research on atmospheric glyoxal, thus strongly motivates a re-evaluation of the current understanding of global VOC chemistry and its implications, e.g. for the oxidative capacity of the atmosphere, the formation of ozone and of secondary formed aerosols, both of which impact human health, the atmospheric radiative balance, and hence the global climate.
The mini-DOAS data are archived in the HALO data repository (https://doi.org/10.17616/R39Q0T; re3data.org, 2022) and can be accessed upon signing a data protocol. Access to TROPOMI glyoxal tropospheric column data is possible via the GLYRETRO website (https://doi.org/10.18758/71021069; Lerot et al., 2021). The EMAC simulation data are archived at the Jülich Supercomputing Centre (JSC) and are available upon request.
FK, TH, KP, MKR, and BW operated the mini-DOAS instrument. CL developed the TROPOMI glyoxal product. SR performed the EMAC simulations. CL, KP, SR, and DT contributed to the interpretation of the data analysis. FK performed the data analysis and wrote the paper, with contributions from KP, CL, SR, and DT.
The contact author has declared that none of the authors has any competing interests.
Publisher’s note: Copernicus Publications remains neutral with regard to jurisdictional claims in published maps and institutional affiliations.
This work contains modified Copernicus Sentinel-5 Precursor satellite data (2018–2019). We acknowledge the use of imagery from the NASA Worldview application (https://worldview.earthdata.nasa.gov/, last access: 19 May 2022), part of the NASA Earth Observing System Data and Information System (EOSDIS). We thank the Deutsches Zentrum für Luft- und Raumfahrt (DLR), for their support during the certification process of the mini-DOAS instrument. Special thanks are given to Lisa Kaser, Martina Hierle, Frank Probst, Andreas Minikin, Andrea Hausold, Michael Großrubatscher, Stefan Grillenbeck, and Marc Puskeiler, for flight coordination and planning, to Alexander Wolf and Thomas Leder, the flight engineers, and to the BAHAMAS team. We are grateful to our colleagues, for their support and coordination of the different research missions, namely Manfred Wendisch (University of Leipzig, Germany), Ulrich Pöschl, and Meinrat Andreae (both at the Max Planck Institute for Chemistry, Mainz, Germany), for the ACRIDICON-CHUVA mission, Hartwig Harder and Jos Lelieveld (both at the Max Planck Institute for Chemistry, Mainz, Germany), for OMO and CAFE-Africa, Maria Dolores Andrés Hernández and John Burrows (both at the University of Bremen, Germany), for EMeRGe-EU and EMeRGe-Asia, Peter Hoor (University of Mainz, Germany) and Martin Riese (Forschungszentrum Jülich, Germany), for WISE, Andreas Fix (DLR, Germany), for CoMet, and, finally, Martin Riese (Forschungszentrum Jülich, Germany), Peter Hoor (University of Mainz, Germany), and Markus Rapp (DLR, Germany), for SouthTRAC. We are grateful to Ulrich Schumann (DLR, Germany), for compiling and evaluating the measured data from the HALO-FAAM formation flight over southern Germany on 13 July 2017 (https://doi.org/10.5281/zenodo.4427965). We are grateful to Eric Förster, Peter Hoor, Heiko Bozem, Sören Johansson, Horst Fischer, Mira Pöhlker, Bruna Holanda, Ovid Krüger, Christopher Pöhlker, Thomas Klimach, Meinrat Andreae, and Ulrich Pöschl, for sharing their data with us. Special thanks are given to former students Dominique Lörks, Niels Leif Bracher, and Sreedev Sreekumar (all formerly at the Institute for Environmental Physics, University of Heidelberg, Germany), for assisting in the missions. We thank the editor Andreas Richter, the two anonymous reviewers, and Mriganka Sekhar Biswas, for their comments, which helped to improve the paper.
The funding of the HALO aircraft and the contributions to the various missions via the German Research Foundation (DFG; HALO-SPP 1294), the Max Planck Society (MPI), the Helmholtz-Gemeinschaft, and the Deutsches Zentrum für Luft- und Raumfahrt (DLR; all from Germany) are highly acknowledged. The authors have received funding from the Earth System Modelling (ESM) Project for this work through the provision of computing time on the ESM partition of the supercomputer JUWELS at the Jülich Supercomputing Centre. The scientific work of Flora Kluge, Klaus Pfeilsticker, Meike K. Rotermund, and Benjamin Weyland has been supported by the German Research Foundation (DFG; grant nos. PF-384/7-1, PF384/9-1, PF-384/16-1, PF-384/17, and PF-384/19). The S5P/TROPOMI glyoxal product has been supported by the European Space Agency via the GLYRETRO project, part of the Sentinel-5P+ Innovation programme (contract no. 4000127610/19/INS).
This paper was edited by Andreas Richter and reviewed by two anonymous referees.
Akagi, S. K., Yokelson, R. J., Wiedinmyer, C., Alvarado, M. J., Reid, J. S., Karl, T., Crounse, J. D., and Wennberg, P. O.: Emission factors for open and domestic biomass burning for use in atmospheric models, Atmos. Chem. Phys., 11, 4039–4072, https://doi.org/10.5194/acp-11-4039-2011, 2011. a, b
Alvarado, L. M. A., Richter, A., Vrekoussis, M., Wittrock, F., Hilboll, A., Schreier, S. F., and Burrows, J. P.: An improved glyoxal retrieval from OMI measurements, Atmos. Meas. Tech., 7, 4133–4150, https://doi.org/10.5194/amt-7-4133-2014, 2014. a
Alvarado, L. M. A., Richter, A., Vrekoussis, M., Hilboll, A., Kalisz Hedegaard, A. B., Schneising, O., and Burrows, J. P.: Unexpected long-range transport of glyoxal and formaldehyde observed from the Copernicus Sentinel-5 Precursor satellite during the 2018 Canadian wildfires, Atmos. Chem. Phys., 20, 2057–2072, https://doi.org/10.5194/acp-20-2057-2020, 2020. a, b, c, d, e
Amiridis, V., Marinou, E., Tsekeri, A., Wandinger, U., Schwarz, A., Giannakaki, E., Mamouri, R., Kokkalis, P., Binietoglou, I., Solomos, S., Herekakis, T., Kazadzis, S., Gerasopoulos, E., Proestakis, E., Kottas, M., Balis, D., Papayannis, A., Kontoes, C., Kourtidis, K., Papagiannopoulos, N., Mona, L., Pappalardo, G., Le Rille, O., and Ansmann, A.: LIVAS: a 3-D multi-wavelength aerosol/cloud database based on CALIPSO and EARLINET, Atmos. Chem. Phys., 15, 7127–7153, https://doi.org/10.5194/acp-15-7127-2015, 2015. a
Andreae, M. O.: Emission of trace gases and aerosols from biomass burning – an updated assessment, Atmos. Chem. Phys., 19, 8523–8546, https://doi.org/10.5194/acp-19-8523-2019, 2019. a
Andrés Hernández, M. D., Hilboll, A., Ziereis, H., Förster, E., Krüger, O. O., Kaiser, K., Schneider, J., Barnaba, F., Vrekoussis, M., Schmidt, J., Huntrieser, H., Blechschmidt, A.-M., George, M., Nenakhov, V., Harlass, T., Holanda, B. A., Wolf, J., Eirenschmalz, L., Krebsbach, M., Pöhlker, M. L., Kalisz Hedegaard, A. B., Mei, L., Pfeilsticker, K., Liu, Y., Koppmann, R., Schlager, H., Bohn, B., Schumann, U., Richter, A., Schreiner, B., Sauer, D., Baumann, R., Mertens, M., Jöckel, P., Kilian, M., Stratmann, G., Pöhlker, C., Campanelli, M., Pandolfi, M., Sicard, M., Gómez-Amo, J. L., Pujadas, M., Bigge, K., Kluge, F., Schwarz, A., Daskalakis, N., Walter, D., Zahn, A., Pöschl, U., Bönisch, H., Borrmann, S., Platt, U., and Burrows, J. P.: Overview: On the transport and transformation of pollutants in the outflow of major population centres – observational data from the EMeRGe European intensive operational period in summer 2017, Atmos. Chem. Phys., 22, 5877–5924, https://doi.org/10.5194/acp-22-5877-2022, 2022. a, b, c, d
Baidar, S., Oetjen, H., Coburn, S., Dix, B., Ortega, I., Sinreich, R., and Volkamer, R.: The CU Airborne MAX-DOAS instrument: vertical profiling of aerosol extinction and trace gases, Atmos. Meas. Tech., 6, 719–739, https://doi.org/10.5194/amt-6-719-2013, 2013. a, b
Bauwens, M., Stavrakou, T., Müller, J.-F., De Smedt, I., Van Roozendael, M., van der Werf, G. R., Wiedinmyer, C., Kaiser, J. W., Sindelarova, K., and Guenther, A.: Nine years of global hydrocarbon emissions based on source inversion of OMI formaldehyde observations, Atmos. Chem. Phys., 16, 10133–10158, https://doi.org/10.5194/acp-16-10133-2016, 2016. a, b, c, d
Behrens, L. K., Hilboll, A., Richter, A., Peters, E., Alvarado, L. M. A., Kalisz Hedegaard, A. B., Wittrock, F., Burrows, J. P., and Vrekoussis, M.: Detection of outflow of formaldehyde and glyoxal from the African continent to the Atlantic Ocean with a MAX-DOAS instrument, Atmos. Chem. Phys., 19, 10257–10278, https://doi.org/10.5194/acp-19-10257-2019, 2019. a
Boeke, N. L., Marshall, J. D., Alvarez, S., Chance, K. V., Fried, A., Kurosu, T. P., Rappenglück, B., Richter, D., Walega, J., Weibring, P., and Millet, D. B.: Formaldehyde columns from the Ozone Monitoring Instrument: Urban versus background levels and evaluation using aircraft data and a global model, J. Geophys. Res.-Atmos., 116, D05303, https://doi.org/10.1029/2010JD014870, 2011. a
Bourgeois, I., Peischl, J., Neuman, J. A., Brown, S. S., Thompson, C. R., Aikin, K. C., Allen, H. M., Angot, H., Apel, E. C., Baublitz, C. B., Brewer, J. F., Campuzano-Jost, P., Commane, R., Crounse, J. D., Daube, B. C., DiGangi, J. P., Diskin, G. S., Emmons, L. K., Fiore, A. M., Gkatzelis, G. I., Hills, A., Hornbrook, R. S., Huey, L. G., Jimenez, J. L., Kim, M., Lacey, F., McKain, K., Murray, L. T., Nault, B. A., Parrish, D. D., Ray, E., Sweeney, C., Tanner, D., Wofsy, S. C., and Ryerson, T. B.: Large contribution of biomass burning emissions to ozone throughout the global remote troposphere, P. Natl. Acad. Sci. USA, 118, e2109628118, https://doi.org/10.1073/pnas.2109628118, 2021. a
Brüggemann, M., Hayeck, N., and George, C.: Interfacial photochemistry at the ocean surface is a global source of organic vapors and aerosols, Nat. Commun., 9, 1–8, 2018. a, b, c
Cabrera-Perez, D., Taraborrelli, D., Sander, R., and Pozzer, A.: Global atmospheric budget of simple monocyclic aromatic compounds, Atmos. Chem. Phys., 16, 6931–6947, https://doi.org/10.5194/acp-16-6931-2016, 2016. a
Chan Miller, C., Gonzalez Abad, G., Wang, H., Liu, X., Kurosu, T., Jacob, D. J., and Chance, K.: Glyoxal retrieval from the Ozone Monitoring Instrument, Atmos. Meas. Tech., 7, 3891–3907, https://doi.org/10.5194/amt-7-3891-2014, 2014. a, b
Chan Miller, C., Jacob, D. J., Marais, E. A., Yu, K., Travis, K. R., Kim, P. S., Fisher, J. A., Zhu, L., Wolfe, G. M., Hanisco, T. F., Keutsch, F. N., Kaiser, J., Min, K.-E., Brown, S. S., Washenfelder, R. A., González Abad, G., and Chance, K.: Glyoxal yield from isoprene oxidation and relation to formaldehyde: chemical mechanism, constraints from SENEX aircraft observations, and interpretation of OMI satellite data, Atmos. Chem. Phys., 17, 8725–8738, https://doi.org/10.5194/acp-17-8725-2017, 2017. a, b, c, d, e
Chance, K. and Orphal, J.: Revised ultraviolet absorption cross sections of H2CO for the HITRAN database, J. Quant. Spectrosc. Ra., 112, 1509–1510, 2011. a
Chiu, R., Tinel, L., Gonzalez, L., Ciuraru, R., Bernard, F., George, C., and Volkamer, R.: UV photochemistry of carboxylic acids at the air-sea boundary: A relevant source of glyoxal and other oxygenated VOC in the marine atmosphere, Geophys. Res. Lett., 44, 1079–1087, 2017. a, b, c, d, e, f, g
Ciuraru, R., Fine, L., Pinxteren, M. v., D’Anna, B., Herrmann, H., and George, C.: Unravelling new processes at interfaces: photochemical isoprene production at the sea surface, Environ. Sci. Technol., 49, 13199–13205, 2015. a
Coburn, S., Ortega, I., Thalman, R., Blomquist, B., Fairall, C. W., and Volkamer, R.: Measurements of diurnal variations and eddy covariance (EC) fluxes of glyoxal in the tropical marine boundary layer: description of the Fast LED-CE-DOAS instrument, Atmos. Meas. Tech., 7, 3579–3595, https://doi.org/10.5194/amt-7-3579-2014, 2014. a, b, c, d, e
Crippa, M., Guizzardi, D., Muntean, M., Schaaf, E., Dentener, F., van Aardenne, J. A., Monni, S., Doering, U., Olivier, J. G. J., Pagliari, V., and Janssens-Maenhout, G.: Gridded emissions of air pollutants for the period 1970–2012 within EDGAR v4.3.2, Earth Syst. Sci. Data, 10, 1987–2013, https://doi.org/10.5194/essd-10-1987-2018, 2018. a
Deutschmann, T., Beirle, S., Frieß, U., Grzegorski, M., Kern, C., Kritten, L., Platt, U., Prados-Román, C., Puķı, J., Wagner, T., Werner, B., and Pfeilsticker, K.: The Monte Carlo atmospheric radiative transfer model McArtim: Introduction and validation of Jacobians and 3D features, J. Quant. Spectrosc. Ra., 112, 1119–1137, https://doi.org/10.1016/j.jqsrt.2010.12.009, 2011. a, b
DiGangi, J. P., Henry, S. B., Kammrath, A., Boyle, E. S., Kaser, L., Schnitzhofer, R., Graus, M., Turnipseed, A., Park, J.-H., Weber, R. J., Hornbrook, R. S., Cantrell, C. A., Maudlin III, R. L., Kim, S., Nakashima, Y., Wolfe, G. M., Kajii, Y., Apel, E. C., Goldstein, A. H., Guenther, A., Karl, T., Hansel, A., and Keutsch, F. N.: Observations of glyoxal and formaldehyde as metrics for the anthropogenic impact on rural photochemistry, Atmos. Chem. Phys., 12, 9529–9543, https://doi.org/10.5194/acp-12-9529-2012, 2012. a
Finlayson-Pitts, B. J. and Pitts Jr., J. N.: Atmospheric chemistry: fundamentals and experimental techniques, Wiley and Sons, New York, https://www.osti.gov/biblio/6379212 (last access: 20 January 2023), 1986. a
Fix, A., Amediek, A., Bovensmann, H., Ehret, G., Gerbig, C., Gerilowski, K., Pfeilsticker, K., Roiger, A., and Zöger, M.: CoMet: An airborne mission to simultaneously measure CO2 and CH4 using lidar, passive remote sensing, and in-situ techniques, in: EPJ Web of Conferences, Vol. 176, p. 02003, EDP Sciences, https://doi.org/10.1051/epjconf/201817602003, 2018. a
Franco, B., Blumenstock, T., Cho, C., Clarisse, L., Clerbaux, C., Coheur, P.-F., De Mazière, M., De Smedt, I., Dorn, H.-P., Emmerichs, T., Fuchs, G., Gkatzelis, H., Griffith, D. W. T., Gromov, S., Hannigan, J. W., Hase, F., Hohaus, T., Jones, N., Kerkweg, A., Kiendler-Scharr, A., Lutsch, E., Mahieu, E., Novelli, A., Ortega, I., Paton-Walsh, C., Pommier, M., Pozzer, A., Reimer, D., Rosanka, S., Sander, R., Schneider, M., Strong, K., Tillmann, R., Van Roozendael, M., Vereecken, L., Vigouroux, C., Wahner, A., and Taraborrelli, D.: Ubiquitous atmospheric production of organic acids mediated by cloud droplets, Nature, 593, 233–237, 2021. a, b
Fu, T.-M., Jacob, D. J., Wittrock, F., Burrows, J. P., Vrekoussis, M., and Henze, D. K.: Global budgets of atmospheric glyoxal and methylglyoxal, and implications for formation of secondary organic aerosols, J. Geophys. Res.-Atmos., 113, D15303. https://doi.org/10.1029/2007JD009505, 2008. a, b, c, d, e, f, g, h, i, j
Galloway, M. M., Chhabra, P. S., Chan, A. W. H., Surratt, J. D., Flagan, R. C., Seinfeld, J. H., and Keutsch, F. N.: Glyoxal uptake on ammonium sulphate seed aerosol: reaction products and reversibility of uptake under dark and irradiated conditions, Atmos. Chem. Phys., 9, 3331–3345, https://doi.org/10.5194/acp-9-3331-2009, 2009. a
Guenther, A., Karl, T., Harley, P., Wiedinmyer, C., Palmer, P. I., and Geron, C.: Estimates of global terrestrial isoprene emissions using MEGAN (Model of Emissions of Gases and Aerosols from Nature), Atmos. Chem. Phys., 6, 3181–3210, https://doi.org/10.5194/acp-6-3181-2006, 2006. a
Hens, K., Novelli, A., Martinez, M., Auld, J., Axinte, R., Bohn, B., Fischer, H., Keronen, P., Kubistin, D., Nölscher, A. C., Oswald, R., Paasonen, P., Petäjä, T., Regelin, E., Sander, R., Sinha, V., Sipilä, M., Taraborrelli, D., Tatum Ernest, C., Williams, J., Lelieveld, J., and Harder, H.: Observation and modelling of HOx radicals in a boreal forest, Atmos. Chem. Phys., 14, 8723–8747, https://doi.org/10.5194/acp-14-8723-2014, 2014. a
Hersbach, H., Bell, B., Berrisford, P., Hirahara, S., Horányi, A., Muñoz-Sabater, J., Nicolas, J., Peubey, C., Radu, R., Schepers, D., Simmons, A., Soci, C., Abdalla, S., Abellan, X., Balsamo, G., Bechtold, P., Biavati, G., Bidlot, J., Bonavita, M., De Chiara, G., Dahlgren, P., Dee, D., Diamantakis, M., Dragani, R., Flemming, J., Forbes, R., Fuentes, M., Geer, A., Haimberger, L., Healy, S., Hogan, R. J., Hólm, E., Janisková, M., Keeley, S., Laloyaux, P., Lopez, P., Lupu, C., Radnoti, G., de Rosnay, P., Rozum, I., Vamborg, F., Villaume, S., and Thépaut, J. N.: The ERA5 global reanalysis, Q. J. Roy. Meteor. Soc., 146, 1999–2049, https://doi.org/10.1002/qj.3803, 2020. a
Holanda, B. A., Pöhlker, M. L., Walter, D., Saturno, J., Sörgel, M., Ditas, J., Ditas, F., Schulz, C., Franco, M. A., Wang, Q., Donth, T., Artaxo, P., Barbosa, H. M. J., Borrmann, S., Braga, R., Brito, J., Cheng, Y., Dollner, M., Kaiser, J. W., Klimach, T., Knote, C., Krüger, O. O., Fütterer, D., Lavrič, J. V., Ma, N., Machado, L. A. T., Ming, J., Morais, F. G., Paulsen, H., Sauer, D., Schlager, H., Schneider, J., Su, H., Weinzierl, B., Walser, A., Wendisch, M., Ziereis, H., Zöger, M., Pöschl, U., Andreae, M. O., and Pöhlker, C.: Influx of African biomass burning aerosol during the Amazonian dry season through layered transatlantic transport of black carbon-rich smoke, Atmos. Chem. Phys., 20, 4757–4785, https://doi.org/10.5194/acp-20-4757-2020, 2020. a
Hoque, H., Irie, H., and Damiani, A.: First MAX-DOAS Observations of Formaldehyde and Glyoxal in Phimai, Thailand, J. Geophys. Res.-Atmos., 123, 9957–9975, 2018. a
Hüneke, T.: The scaling method applied to HALO measurements: Inferring absolute trace gas concentrations from airborne limb spectroscopy under all sky conditions, PhD, University of Heidelberg, Heidelberg, Germany, https://doi.org/10.11588/heidok.00022573, 2016. a, b, c
Hüneke, T., Aderhold, O.-A., Bounin, J., Dorf, M., Gentry, E., Grossmann, K., Grooß, J.-U., Hoor, P., Jöckel, P., Kenntner, M., Knapp, M., Knecht, M., Lörks, D., Ludmann, S., Matthes, S., Raecke, R., Reichert, M., Weimar, J., Werner, B., Zahn, A., Ziereis, H., and Pfeilsticker, K.: The novel HALO mini-DOAS instrument: inferring trace gas concentrations from airborne UV/visible limb spectroscopy under all skies using the scaling method, Atmos. Meas. Tech., 10, 4209–4234, https://doi.org/10.5194/amt-10-4209-2017, 2017. a, b, c, d
Ip, H. S., Huang, X. H., and Yu, J. Z.: Effective Henry's law constants of glyoxal, glyoxylic acid, and glycolic acid, Geophys. Res. Lett., 36, L01802, https://doi.org/10.1029/2008GL036212, 2009. a
Irvine, W. M.: The formation of absorption bands and the distribution of photon optical paths in a scattering atmosphere, B. Astron. I. Neth., 17, 266–279, 1963. a
Jang, M. and Kamens, R. M.: Atmospheric secondary aerosol formation by heterogeneous reactions of aldehydes in the presence of a sulfuric acid aerosol catalyst, Environ. Sci. Technol., 35, 4758–4766, 2001. a
Jöckel, P., Tost, H., Pozzer, A., Brühl, C., Buchholz, J., Ganzeveld, L., Hoor, P., Kerkweg, A., Lawrence, M. G., Sander, R., Steil, B., Stiller, G., Tanarhte, M., Taraborrelli, D., van Aardenne, J., and Lelieveld, J.: The atmospheric chemistry general circulation model ECHAM5/MESSy1: consistent simulation of ozone from the surface to the mesosphere, Atmos. Chem. Phys., 6, 5067–5104, https://doi.org/10.5194/acp-6-5067-2006, 2006. a
Jöckel, P., Kerkweg, A., Pozzer, A., Sander, R., Tost, H., Riede, H., Baumgaertner, A., Gromov, S., and Kern, B.: Development cycle 2 of the Modular Earth Submodel System (MESSy2), Geosci. Model Dev., 3, 717–752, https://doi.org/10.5194/gmd-3-717-2010, 2010. a
Johansson, S., Wetzel, G., Friedl-Vallon, F., Glatthor, N., Höpfner, M., Kleinert, A., Neubert, T., Sinnhuber, B.-M., and Ungermann, J.: Biomass burning pollution in the South Atlantic upper troposphere: GLORIA trace gas observations and evaluation of the CAMS model, Atmos. Chem. Phys., 22, 3675–3691, https://doi.org/10.5194/acp-22-3675-2022, 2022. a, b
Kaiser, J., Wolfe, G. M., Min, K. E., Brown, S. S., Miller, C. C., Jacob, D. J., deGouw, J. A., Graus, M., Hanisco, T. F., Holloway, J., Peischl, J., Pollack, I. B., Ryerson, T. B., Warneke, C., Washenfelder, R. A., and Keutsch, F. N.: Reassessing the ratio of glyoxal to formaldehyde as an indicator of hydrocarbon precursor speciation, Atmos. Chem. Phys., 15, 7571–7583, https://doi.org/10.5194/acp-15-7571-2015, 2015. a, b, c
Kaiser, J. W., Heil, A., Andreae, M. O., Benedetti, A., Chubarova, N., Jones, L., Morcrette, J.-J., Razinger, M., Schultz, M. G., Suttie, M., and van der Werf, G. R.: Biomass burning emissions estimated with a global fire assimilation system based on observed fire radiative power, Biogeosciences, 9, 527–554, https://doi.org/10.5194/bg-9-527-2012, 2012. a
Kampf, C. J., Waxman, E. M., Slowik, J. G., Dommen, J., Pfaffenberger, L., Praplan, A. P., Prévôt, A. S., Baltensperger, U., Hoffmann, T., and Volkamer, R.: Effective Henry’s law partitioning and the salting constant of glyoxal in aerosols containing sulfate, Environ. Sci. Technol., 47, 4236–4244, 2013. a
Kim, D., Cho, C., Jeong, S., Lee, S., Nault, B. A., Campuzano-Jost, P., Day, D. A., Schroder, J. C., Jimenez, J. L., Volkamer, R., Blake, D. R., Wisthaler, A., Fried, A., DiGangi, J. P., Diskin, G. S., Pusede, S. E., Hall, S. R., Ullmann, K., Huey, L. G., Tanner, D. J., Dibb, J., Knote, C. J., and Min, K.-E.: Field observational constraints on the controllers in glyoxal (CHOCHO) reactive uptake to aerosol, Atmos. Chem. Phys., 22, 805–821, https://doi.org/10.5194/acp-22-805-2022, 2022. a, b, c, d, e, f
Kloss, C., Sellitto, P., Von Hobe, M., Berthet, G., Smale, D., Krysztofiak, G., Xue, C., Qiu, C., Jégou, F., Ouerghemmi, I., and Legras, B.: Australian Fires 2019–2020: Tropospheric and Stratospheric Pollution Throughout the Whole Fire Season, Front. Environ. Sci., 9, 652024, https://doi.org/10.3389/fenvs.2021.652024, 2021. a, b
Kluge, F., Hüneke, T., Knecht, M., Lichtenstern, M., Rotermund, M., Schlager, H., Schreiner, B., and Pfeilsticker, K.: Profiling of formaldehyde, glyoxal, methylglyoxal, and CO over the Amazon: normalized excess mixing ratios and related emission factors in biomass burning plumes, Atmos. Chem. Phys., 20, 12363–12389, https://doi.org/10.5194/acp-20-12363-2020, 2020. a, b, c, d, e, f, g, h, i, j, k, l, m
Knote, C., Hodzic, A., Jimenez, J. L., Volkamer, R., Orlando, J. J., Baidar, S., Brioude, J., Fast, J., Gentner, D. R., Goldstein, A. H., Hayes, P. L., Knighton, W. B., Oetjen, H., Setyan, A., Stark, H., Thalman, R., Tyndall, G., Washenfelder, R., Waxman, E., and Zhang, Q.: Simulation of semi-explicit mechanisms of SOA formation from glyoxal in aerosol in a 3-D model, Atmos. Chem. Phys., 14, 6213–6239, https://doi.org/10.5194/acp-14-6213-2014, 2014. a, b
Koch, S. and Moortgat, G. K.: Photochemistry of methylglyoxal in the vapor phase, J. Phys. Chem. A, 102, 9142–9153, 1998. a, b
Krause, D.: JUWELS: Modular Tier-0/1 supercomputer at the Jülich supercomputing centre, Journal of large-scale research facilities, 5, 135, https://doi.org/10.17815/jlsrf-5-171, 2019. a
Kroll, J. H., Ng, N. L., Murphy, S. M., Varutbangkul, V., Flagan, R. C., and Seinfeld, J. H.: Chamber studies of secondary organic aerosol growth by reactive uptake of simple carbonyl compounds, J. Geophys. Res.-Atmos., 110, D23207, https://doi.org/10.1029/2005JD006004, 2005. a
Krüger, O. O., Holanda, B. A., Chowdhury, S., Pozzer, A., Walter, D., Pöhlker, C., Andrés Hernández, M. D., Burrows, J. P., Voigt, C., Lelieveld, J., Quaas, J., Pöschl, U., and Pöhlker, M. L.: Black carbon aerosol reductions during COVID-19 confinement quantified by aircraft measurements over Europe, Atmos. Chem. Phys., 22, 8683–8699, https://doi.org/10.5194/acp-22-8683-2022, 2022. a
Kunkel, D., Hoor, P., Kaluza, T., Ungermann, J., Kluschat, B., Giez, A., Lachnitt, H.-C., Kaufmann, M., and Riese, M.: Evidence of small-scale quasi-isentropic mixing in ridges of extratropical baroclinic waves, Atmos. Chem. Phys., 19, 12607–12630, https://doi.org/10.5194/acp-19-12607-2019, 2019. a
Lawson, S. J., Selleck, P. W., Galbally, I. E., Keywood, M. D., Harvey, M. J., Lerot, C., Helmig, D., and Ristovski, Z.: Seasonal in situ observations of glyoxal and methylglyoxal over the temperate oceans of the Southern Hemisphere, Atmos. Chem. Phys., 15, 223–240, https://doi.org/10.5194/acp-15-223-2015, 2015. a, b, c, d, e, f
Lee, Y.-N., Zhou, X., Kleinman, L., Nunnermacker, L., Springston, S., Daum, P., Newman, L., Keigley, W., Holdren, M., Spicer, C., Young, V., Fu, B., Parrish, D. D., Holloway, J., Williams, J., Roberts, J. M., Ryerson, T. B., and Fehsenfeld, F. C.: Atmospheric chemistry and distribution of formaldehyde and several multioxygenated carbonyl compounds during the 1995 Nashville/Middle Tennessee Ozone Study, J. Geophys. Res.-Atmos., 103, 22449–22462, 1998. a, b, c
Lelieveld, J., Bourtsoukidis, E., Brühl, C., Fischer, H., Fuchs, H., Harder, H., Hofzumahaus, A., Holland, F., Marno, D., Neumaier, M., Pozzer, A., Schlager, H., Williams, J., Zahn, A., and Ziereis, H.: The South Asian monsoon—pollution pump and purifier, Science, 361, 270–273, 2018. a, b, c
Lerot, C., Stavrakou, T., De Smedt, I., Müller, J.-F., and Van Roozendael, M.: Glyoxal vertical columns from GOME-2 backscattered light measurements and comparisons with a global model, Atmos. Chem. Phys., 10, 12059–12072, https://doi.org/10.5194/acp-10-12059-2010, 2010. a, b, c, d
Lerot, C., Hendrick, F., Van Roozendael, M., Alvarado, L. M. A., Richter, A., De Smedt, I., Theys, N., Vlietinck, J., Yu, H., Van Gent, J., Stavrakou, T., Müller, J.-F., Valks, P., Loyola, D., Irie, H., Kumar, V., Wagner, T., Schreier, S. F., Sinha, V., Wang, T., Wang, P., and Retscher, C.: Glyoxal tropospheric column retrievals from TROPOMI – multi-satellite intercomparison and ground-based validation, Atmos. Meas. Tech., 14, 7775–7807, https://doi.org/10.5194/amt-14-7775-2021, 2021 (data available at: https://doi.org/10.18758/71021069, login required). a, b, c, d, e, f, g, h, i, j, k, l
Li, J., Mao, J., Min, K.-E., Washenfelder, R. A., Brown, S. S., Kaiser, J., Keutsch, F. N., Volkamer, R., Wolfe, G. M., Hanisco, T. F., Ryerson, T. B., Graus, M., Gilman, J. B., Lerner, B. M., Warneke, C., de Gouw, J. A., Middlebrook, A. M., Liao, J., Welti, A., Henderson, B. H., McNeill, V. F., Hall, S. R., Ullmann, K., Donner, L. J., Paulot, F., and Horowitz, L. W.: Observational constraints on glyoxal production from isoprene oxidation and its contribution to organic aerosol over the Southeast United States, J. Geophys. Res.-Atmos., 121, 9849–9861, 2016. a, b, c, d
Liao, J., Hanisco, T. F., Wolfe, G. M., St. Clair, J., Jimenez, J. L., Campuzano-Jost, P., Nault, B. A., Fried, A., Marais, E. A., Gonzalez Abad, G., Chance, K., Jethva, H. T., Ryerson, T. B., Warneke, C., and Wisthaler, A.: Towards a satellite formaldehyde – in situ hybrid estimate for organic aerosol abundance, Atmos. Chem. Phys., 19, 2765–2785, https://doi.org/10.5194/acp-19-2765-2019, 2019. a
Liggio, J., Li, S.-M., and McLaren, R.: Heterogeneous reactions of glyoxal on particulate matter: Identification of acetals and sulfate esters, Environ. Sci. Technol., 39, 1532–1541, 2005a. a
Liggio, J., Li, S.-M., and McLaren, R.: Reactive uptake of glyoxal by particulate matter, J. Geophys. Res.-Atmos., 110, D10304, https://doi.org/10.1029/2004JD005113, 2005b. a
Lim, C. Y., Hagan, D. H., Coggon, M. M., Koss, A. R., Sekimoto, K., de Gouw, J., Warneke, C., Cappa, C. D., and Kroll, J. H.: Secondary organic aerosol formation from the laboratory oxidation of biomass burning emissions, Atmos. Chem. Phys., 19, 12797–12809, https://doi.org/10.5194/acp-19-12797-2019, 2019. a
Lim, Y. B., Tan, Y., and Turpin, B. J.: Chemical insights, explicit chemistry, and yields of secondary organic aerosol from OH radical oxidation of methylglyoxal and glyoxal in the aqueous phase, Atmos. Chem. Phys., 13, 8651–8667, https://doi.org/10.5194/acp-13-8651-2013, 2013. a
Lin, C.-Y., Chen, W.-C., Chien, Y.-Y., Chou, C. C. K., Liu, C.-Y., Ziereis, H., Schlager, H., Förster, E., Obersteiner, F., Krüger, O. O., Holanda, B. A., Pöhlker, M. L., Kaiser, K., Schneider, J., Bohn, B., Andrés Hernández, M. D., and Burrows, J. P.: Effects of transport on a biomass burning plume from Indochina during EMeRGe-Asia identified by WRF-Chem, Atmos. Chem. Phys. Discuss. [preprint], https://doi.org/10.5194/acp-2022-517, in review, 2022. a
Loeffler, K. W., Koehler, C. A., Paul, N. M., and De Haan, D. O.: Oligomer formation in evaporating aqueous glyoxal and methyl glyoxal solutions, Environ. Sci. Technol., 40, 6318–6323, 2006. a
MacDonald, S. M., Oetjen, H., Mahajan, A. S., Whalley, L. K., Edwards, P. M., Heard, D. E., Jones, C. E., and Plane, J. M. C.: DOAS measurements of formaldehyde and glyoxal above a south-east Asian tropical rainforest, Atmos. Chem. Phys., 12, 5949–5962, https://doi.org/10.5194/acp-12-5949-2012, 2012. a, b, c
Mahajan, A. S., Prados-Roman, C., Hay, T. D., Lampel, J., Pöhler, D., Großmann, K., Tschritter, J., Frieß, U., Platt, U., Johnston, P., Kreher, K., Wittrock, F., Burrows, J. P., Plane, J. M. C., and Saiz-Lopez, A.: Glyoxal observations in the global marine boundary layer, J. Geophys. Res.-Atmos., 119, 6160–6169, https://doi.org/10.1002/2013JD021388, 2014. a, b, c, d, e, f
Millet, D. B., Guenther, A., Siegel, D. A., Nelson, N. B., Singh, H. B., de Gouw, J. A., Warneke, C., Williams, J., Eerdekens, G., Sinha, V., Karl, T., Flocke, F., Apel, E., Riemer, D. D., Palmer, P. I., and Barkley, M.: Global atmospheric budget of acetaldehyde: 3-D model analysis and constraints from in-situ and satellite observations, Atmos. Chem. Phys., 10, 3405–3425, https://doi.org/10.5194/acp-10-3405-2010, 2010. a
Min, K.-E., Washenfelder, R. A., Dubé, W. P., Langford, A. O., Edwards, P. M., Zarzana, K. J., Stutz, J., Lu, K., Rohrer, F., Zhang, Y., and Brown, S. S.: A broadband cavity enhanced absorption spectrometer for aircraft measurements of glyoxal, methylglyoxal, nitrous acid, nitrogen dioxide, and water vapor, Atmos. Meas. Tech., 9, 423–440, https://doi.org/10.5194/amt-9-423-2016, 2016. a
Mouat, A. P., Paton-Walsh, C., Simmons, J. B., Ramirez-Gamboa, J., Griffith, D. W. T., and Kaiser, J.: Measurement report: Observations of long-lived volatile organic compounds from the 2019–2020 Australian wildfires during the COALA campaign, Atmos. Chem. Phys., 22, 11033–11047, https://doi.org/10.5194/acp-22-11033-2022, 2022. a
Müller, J.-F. and Brasseur, G.: IMAGES: A three-dimensional chemical transport model of the global troposphere, J. Geophys. Res.-Atmos., 100, 16445–16490, 1995. a
Müller, S., Hoor, P., Berkes, F., Bozem, H., Klingebiel, M., Reutter, P., Smit, H., Wendisch, M., Spichtinger, P., and Borrmann, S.: In situ detection of stratosphere-troposphere exchange of cirrus particles in the midlatitudes, Geophys. Res. Lett., 42, 949–955, 2015. a
Myriokefalitakis, S., Vrekoussis, M., Tsigaridis, K., Wittrock, F., Richter, A., Brühl, C., Volkamer, R., Burrows, J. P., and Kanakidou, M.: The influence of natural and anthropogenic secondary sources on the glyoxal global distribution, Atmos. Chem. Phys., 8, 4965–4981, https://doi.org/10.5194/acp-8-4965-2008, 2008. a, b, c, d, e, f
NASA/LARC/SD/ASDC: SAGE III/ISS L1B Solar Event Transmission Data (HDF-EOS) V051, NASA/LARC/SD/ASDC [data set], https://doi.org/10.5067/ISS/SAGEIII/SOLAR_HDF4_L2-V5.1, 2017. a
Nishino, N., Arey, J., and Atkinson, R.: Formation yields of glyoxal and methylglyoxal from the gas-phase OH radical-initiated reactions of toluene, xylenes, and trimethylbenzenes as a function of NO2 concentration, J. Phys. Chem. A, 114, 10140–10147, 2010. a, b
Nölscher, A., Butler, T., Auld, J., Veres, P., Muñoz, A., Taraborrelli, D., Vereecken, L., Lelieveld, J., and Williams, J.: Using total OH reactivity to assess isoprene photooxidation via measurement and model, Atmos. Environ., 89, 453–463, 2014. a
Novelli, A., Vereecken, L., Bohn, B., Dorn, H.-P., Gkatzelis, G. I., Hofzumahaus, A., Holland, F., Reimer, D., Rohrer, F., Rosanka, S., Taraborrelli, D., Tillmann, R., Wegener, R., Yu, Z., Kiendler-Scharr, A., Wahner, A., and Fuchs, H.: Importance of isomerization reactions for OH radical regeneration from the photo-oxidation of isoprene investigated in the atmospheric simulation chamber SAPHIR, Atmos. Chem. Phys., 20, 3333–3355, https://doi.org/10.5194/acp-20-3333-2020, 2020. a, b
Palm, B. B., Peng, Q., Fredrickson, C. D., Lee, B. H., Garofalo, L. A., Pothier, M. A., Kreidenweis, S. M., Farmer, D. K., Pokhrel, R. P., Shen, Y., Murphy, S. M., Permar, W., Hu, L., Campos, T. L., Hall, S. R., Ullmann, K., Zhang, X., Flocke, F., Fischer, E. V., and Thornton, J. A.: Quantification of organic aerosol and brown carbon evolution in fresh wildfire plumes, P. Natl. Acad. Sci. USA, 117, 29469–29477, https://doi.org/10.1073/pnas.2012218117, 2020. a
Palmer, P. I., Jacob, D. J., Chance, K., Martin, R. V., Spurr, R. J., Kurosu, T. P., Bey, I., Yantosca, R., Fiore, A., and Li, Q.: Air mass factor formulation for spectroscopic measurements from satellites: Application to formaldehyde retrievals from the Global Ozone Monitoring Experiment, J. Geophys. Res.-Atmos., 106, 14539–14550, 2001. a
Platt, U. and Stutz, J.: Differential Optical Absorption Spectroscopy (DOAS), Principle and Applications, Springer Verlag, Heidelberg, https://doi.org/10.1007/978-3-540-75776-4, 2008. a, b, c, d
Polyansky, O. L., Kyuberis, A. A., Zobov, N. F., Tennyson, J., Yurchenko, S. N., and Lodi, L.: ExoMol molecular line lists XXX: a complete high-accuracy line list for water, Monthly Notices of the Royal Astronomical Society, 480, 2597–2608, 2018. a
Pope, R. M. and Fry, E. S.: Absorption spectrum (380–700 nm) of pure water. II. Integrating cavity measurements, Appl. Optics, 36, 8710–8723, 1997. a
Pozzer, A., Jöckel, P., Sander, R., Williams, J., Ganzeveld, L., and Lelieveld, J.: Technical Note: The MESSy-submodel AIRSEA calculating the air-sea exchange of chemical species, Atmos. Chem. Phys., 6, 5435–5444, https://doi.org/10.5194/acp-6-5435-2006, 2006. a
Pozzer, A., Jöckel, P., and Van Aardenne, J.: The influence of the vertical distribution of emissions on tropospheric chemistry, Atmos. Chem. Phys., 9, 9417–9432, https://doi.org/10.5194/acp-9-9417-2009, 2009. a
Pozzer, A., Reifenberg, S. F., Kumar, V., Franco, B., Kohl, M., Taraborrelli, D., Gromov, S., Ehrhart, S., Jöckel, P., Sander, R., Fall, V., Rosanka, S., Karydis, V., Akritidis, D., Emmerichs, T., Crippa, M., Guizzardi, D., Kaiser, J. W., Clarisse, L., Kiendler-Scharr, A., Tost, H., and Tsimpidi, A.: Simulation of organics in the atmosphere: evaluation of EMACv2.54 with the Mainz Organic Mechanism (MOM) coupled to the ORACLE (v1.0) submodel, Geosci. Model Dev., 15, 2673–2710, https://doi.org/10.5194/gmd-15-2673-2022, 2022. a, b
Rapp, M., Kaifler, B., Dörnbrack, A., Gisinger, S., Mixa, T., Reichert, R., Kaifler, N., Knobloch, S., Eckert, R., Wildmann, N., Giez, A., Krasauskas, L., Preusse, P., Geldenhuys, M., Riese, M., Woiwode, W., Friedl-Vallon, F., Sinnhuber, B.-M., de la Torre, A., Alexander, P., Hormaechea, J. L., Janches, D., Garhammer, M., Chau, J. L., Conte, J. F., Hoor, P., and Engel, A.: SOUTHTRAC-GW: An airborne field campaign to explore gravity wave dynamics at the world’s strongest hotspot, B. Am. Meteorol. Soc., 102, E871–E893, https://doi.org/10.1175/BAMS-D-20-0034.1, 2021. a
re3data.org: HALO database, re3data.org – Registry of Research Data Repositories [data set], https://doi.org/10.17616/R39Q0T, 2022. a
Rinaldi, M., Decesari, S., Carbone, C., Finessi, E., Fuzzi, S., Ceburnis, D., O'Dowd, C. D., Sciare, J., Burrows, J. P., Vrekoussis, M., Ervens, B., Tsigaridis, K., and Facchini, M. C.: Evidence of a natural marine source of oxalic acid and a possible link to glyoxal, J. Geophys. Res.-Atmos., 116, D16204, https://doi.org/10.1029/2011JD015659, 2011. a, b
Rocco, M., Dunne, E., Peltola, M., Barr, N., Williams, J., Colomb, A., Safi, K., Saint-Macary, A., Marriner, A., Deppeler, S., Harnwell, J., Law, C., and Sellegri, K.: Oceanic phytoplankton are a potentially important source of benzenoids to the remote marine atmosphere, Communications Earth & Environment, 2, 1–8, 2021. a
Roeckner, E., Bäuml, G., Bonaventura, L., Brokopf, R., Esch, M., Giorgetta, M., Hagemann, S., Kirchner, I., Kornblueh, L., Manzini, E., Rhodin, A., Schlese, U., Schulzweida, U., and Tompkins, A.: The atmospheric general circulation model ECHAM 5. PART I: Model description, Max-Planck-Institut für Meteorologie, https://hdl.handle.net/11858/00-001M-0000-0012-0144-5 (last access: 20 January 2023), 2003. a
Rosanka, S., Vu, G. H. T., Nguyen, H. M. T., Pham, T. V., Javed, U., Taraborrelli, D., and Vereecken, L.: Atmospheric chemical loss processes of isocyanic acid (HNCO): a combined theoretical kinetic and global modelling study, Atmos. Chem. Phys., 20, 6671–6686, https://doi.org/10.5194/acp-20-6671-2020, 2020. a
Rosanka, S., Sander, R., Franco, B., Wespes, C., Wahner, A., and Taraborrelli, D.: Oxidation of low-molecular-weight organic compounds in cloud droplets: global impact on tropospheric oxidants, Atmos. Chem. Phys., 21, 9909–9930, https://doi.org/10.5194/acp-21-9909-2021, 2021a. a, b
Rosanka, S., Sander, R., Wahner, A., and Taraborrelli, D.: Oxidation of low-molecular-weight organic compounds in cloud droplets: development of the Jülich Aqueous-phase Mechanism of Organic Chemistry (JAMOC) in CAABA/MECCA (version 4.5.0), Geosci. Model Dev., 14, 4103–4115, https://doi.org/10.5194/gmd-14-4103-2021, 2021b. a
Rotermund, M. K., Bense, V., Chipperfield, M. P., Engel, A., Grooß, J.-U., Hoor, P., Hüneke, T., Keber, T., Kluge, F., Schreiner, B., Schuck, T., Vogel, B., Zahn, A., and Pfeilsticker, K.: Organic and inorganic bromine measurements around the extratropical tropopause and lowermost stratosphere: insights into the transport pathways and total bromine, Atmos. Chem. Phys., 21, 15375–15407, https://doi.org/10.5194/acp-21-15375-2021, 2021. a
Rothman, L. S., Gordon, I. E., Barbe, A., Benner, D. C., Bernath, P. F., Birk, M., Boudon, V., Brown, L. R., Campargue, A., Champion, J.-P., Chance, K., Coudert, L. H., Dana, V., Devi, V. M., Fally, S., Flaud, J.-M., Gamache, R. R., Goldman, A., Jacquemart, D., Kleiner, I., Lacome, N., Lafferty, W. J., Mandin, J.-Y., Massie, S. T., Mikhailenko, S. N., Miller, C. E., Moazzen-Ahmadi, N., Naumenko, O. V., Nikitin, A. V., Orphal, J., Perevalov, V. I., Perrin, A., Predoi-Cross, A., Rinsland, C. P., Rotger, M., Šimečková, M., Smith, M. A. H., Sung, K., Tashkun, S. A., Tennyson, J., Toth, R. A., Vandaele, A. C., and Vander Auwera, J.: The HITRAN 2008 molecular spectroscopic database, J. Quant. Spectrosc. Ra., 110, 533–572, https://doi.org/10.1016/j.jqsrt.2009.02.013, 2009. a
Sander, R.: Compilation of Henry's law constants (version 4.0) for water as solvent, Atmos. Chem. Phys., 15, 4399–4981, https://doi.org/10.5194/acp-15-4399-2015, 2015. a
Sander, R., Baumgaertner, A., Cabrera-Perez, D., Frank, F., Gromov, S., Grooß, J.-U., Harder, H., Huijnen, V., Jöckel, P., Karydis, V. A., Niemeyer, K. E., Pozzer, A., Riede, H., Schultz, M. G., Taraborrelli, D., and Tauer, S.: The community atmospheric chemistry box model CAABA/MECCA-4.0, Geosci. Model Dev., 12, 1365–1385, https://doi.org/10.5194/gmd-12-1365-2019, 2019. a, b
Serdyuchenko, A., Gorshelev, V., Weber, M., Chehade, W., and Burrows, J. P.: High spectral resolution ozone absorption cross-sections – Part 2: Temperature dependence, Atmos. Meas. Tech., 7, 625–636, https://doi.org/10.5194/amt-7-625-2014, 2014. a, b, c
Sindelarova, K., Granier, C., Bouarar, I., Guenther, A., Tilmes, S., Stavrakou, T., Müller, J.-F., Kuhn, U., Stefani, P., and Knorr, W.: Global data set of biogenic VOC emissions calculated by the MEGAN model over the last 30 years, Atmos. Chem. Phys., 14, 9317–9341, https://doi.org/10.5194/acp-14-9317-2014, 2014. a
Sinreich, R., Coburn, S., Dix, B., and Volkamer, R.: Ship-based detection of glyoxal over the remote tropical Pacific Ocean, Atmos. Chem. Phys., 10, 11359–11371, https://doi.org/10.5194/acp-10-11359-2010, 2010. a, b, c, d, e, f, g, h
Stavrakou, T., Müller, J.-F., De Smedt, I., Van Roozendael, M., Kanakidou, M., Vrekoussis, M., Wittrock, F., Richter, A., and Burrows, J. P.: The continental source of glyoxal estimated by the synergistic use of spaceborne measurements and inverse modelling, Atmos. Chem. Phys., 9, 8431–8446, https://doi.org/10.5194/acp-9-8431-2009, 2009a. a, b, c, d, e
Stavrakou, T., Müller, J.-F., De Smedt, I., Van Roozendael, M., van der Werf, G. R., Giglio, L., and Guenther, A.: Evaluating the performance of pyrogenic and biogenic emission inventories against one decade of space-based formaldehyde columns, Atmos. Chem. Phys., 9, 1037–1060, https://doi.org/10.5194/acp-9-1037-2009, 2009b. a
Stavrakou, T., Müller, J.-F., Bauwens, M., De Smedt, I., Lerot, C., Van Roozendael, M., Coheur, P.-F., Clerbaux, C., Boersma, K., Van Der A, R., and Song, Y.: Substantial underestimation of post-harvest burning emissions in the North China Plain revealed by multi-species space observations, Sci. Rep.-UK, 6, 1–11, https://doi.org/10.1038/srep32307, 2016. a
Stockwell, C. E., Veres, P. R., Williams, J., and Yokelson, R. J.: Characterization of biomass burning emissions from cooking fires, peat, crop residue, and other fuels with high-resolution proton-transfer-reaction time-of-flight mass spectrometry, Atmos. Chem. Phys., 15, 845–865, https://doi.org/10.5194/acp-15-845-2015, 2015. a
Stutz, J., Werner, B., Spolaor, M., Scalone, L., Festa, J., Tsai, C., Cheung, R., Colosimo, S. F., Tricoli, U., Raecke, R., Hossaini, R., Chipperfield, M. P., Feng, W., Gao, R.-S., Hintsa, E. J., Elkins, J. W., Moore, F. L., Daube, B., Pittman, J., Wofsy, S., and Pfeilsticker, K.: A new Differential Optical Absorption Spectroscopy instrument to study atmospheric chemistry from a high-altitude unmanned aircraft, Atmos. Meas. Tech., 10, 1017–1042, https://doi.org/10.5194/amt-10-1017-2017, 2017. a, b
Tadic, I., Parchatka, U., Königstedt, R., and Fischer, H.: In-flight stability of quantum cascade laser-based infrared absorption spectroscopy measurements of atmospheric carbon monoxide, Appl. Phys. B, 123, 1–9, 2017. a
Tadić, J., Moortgat, G. K., and Wirtz, K.: Photolysis of glyoxal in air, J. Photoch. Photobio. A, 177, 116–124, 2006. a, b
Taraborrelli, D., Lawrence, M. G., Butler, T. M., Sander, R., and Lelieveld, J.: Mainz Isoprene Mechanism 2 (MIM2): an isoprene oxidation mechanism for regional and global atmospheric modelling, Atmos. Chem. Phys., 9, 2751–2777, https://doi.org/10.5194/acp-9-2751-2009, 2009. a
Taraborrelli, D., Lawrence, M. G., Crowley, J., Dillon, T., Gromov, S., Groß, C., Vereecken, L., and Lelieveld, J.: Hydroxyl radical buffered by isoprene oxidation over tropical forests, Nat. Geosci., 5, 190–193, 2012. a
Taraborrelli, D., Cabrera-Perez, D., Bacer, S., Gromov, S., Lelieveld, J., Sander, R., and Pozzer, A.: Influence of aromatics on tropospheric gas-phase composition, Atmos. Chem. Phys., 21, 2615–2636, https://doi.org/10.5194/acp-21-2615-2021, 2021. a, b
Thalman, R. and Volkamer, R.: Temperature dependent absorption cross-sections of O2–O2 collision pairs between 340 and 630 nm and at atmospherically relevant pressure, Phys. Chem. Chem. Phys., 15, 15371–15381, 2013. a, b
Thuillier, G., Hersé, M., Simon, P., Labs, D., Mandel, H., and Gillotay, D.: Solar Radiometry and Solar Spectral Irradiance-Observation of the solar spectral irradiance from 200 nm to 870 nm during the ATLAS 1 and ATLAS 2 missions by the SOLSPEC spectrometer, Metrologia-Sevres, 35, 689–696, 1998. a
Tost, H., Jöckel, P., Kerkweg, A., Sander, R., and Lelieveld, J.: Technical note: A new comprehensive SCAVenging submodel for global atmospheric chemistry modelling, Atmos. Chem. Phys., 6, 565–574, https://doi.org/10.5194/acp-6-565-2006, 2006. a
Tost, H., Jöckel, P., Kerkweg, A., Pozzer, A., Sander, R., and Lelieveld, J.: Global cloud and precipitation chemistry and wet deposition: tropospheric model simulations with ECHAM5/MESSy1, Atmos. Chem. Phys., 7, 2733–2757, https://doi.org/10.5194/acp-7-2733-2007, 2007. a
Vandaele, A. C., Hermans, C., Simon, P. C., Carleer, M., Colin, R., Fally, S., Merienne, M.-F., Jenouvrier, A., and Coquart, B.: Measurements of the NO2 absorption cross-section from 42 000 cm−1 to 10 000 cm−1 (238–1000 nm) at 220 K and 294 K, J. Quant. Spectrosc. Ra., 59, 171–184, 1998. a
Veefkind, J., Aben, I., McMullan, K., Förster, H., De Vries, J., Otter, G., Claas, J., Eskes, H., De Haan, J., Kleipool, Q., Van Weele, M., Hasekamp, O., Hoogeveen, R., Landgraf, J., Snel, R., Tol, P., Ingmann, P., Voors, R., Kruizinga, B., Vink, R., Visser, H., and Lvelt, P. F.: TROPOMI on the ESA Sentinel-5 Precursor: A GMES mission for global observations of the atmospheric composition for climate, air quality and ozone layer applications, Remote Sens. Environ., 120, 70–83, https://doi.org/10.1016/j.rse.2011.09.027, 2012. a
Volkamer, R., Platt, U., and Wirtz, K.: Primary and secondary glyoxal formation from aromatics: experimental evidence for the bicycloalkyl- radical pathway from benzene, toluene, and p-xylene, J. Phys. Chem. A, 105, 7865–7874, 2001. a, b
Volkamer, R., Molina, L. T., Molina, M. J., Shirley, T., and Brune, W. H.: DOAS measurement of glyoxal as an indicator for fast VOC chemistry in urban air, Geophys. Res. Lett., 32, 8, https://doi.org/10.1029/2005GL022616, 2005a. a, b, c, d
Volkamer, R., Spietz, P., Burrows, J., and Platt, U.: High-resolution absorption cross-section of glyoxal in the UV–vis and IR spectral ranges, J. Photoch. Photobio. A, 172, 35–46, 2005b. a
Volkamer, R., San Martini, F., Molina, L. T., Salcedo, D., Jimenez, J. L., and Molina, M. J.: A missing sink for gas-phase glyoxal in Mexico City: Formation of secondary organic aerosol, Geophys. Res. Lett., 34, 19, https://doi.org/10.1029/2007GL030752, 2007. a, b, c, d, e
Volkamer, R., Baidar, S., Campos, T. L., Coburn, S., DiGangi, J. P., Dix, B., Eloranta, E. W., Koenig, T. K., Morley, B., Ortega, I., Pierce, B. R., Reeves, M., Sinreich, R., Wang, S., Zondlo, M. A., and Romashkin, P. A.: Aircraft measurements of BrO, IO, glyoxal, NO2, H2O, O2–O2 and aerosol extinction profiles in the tropics: comparison with aircraft-/ship-based in situ and lidar measurements, Atmos. Meas. Tech., 8, 2121–2148, https://doi.org/10.5194/amt-8-2121-2015, 2015. a, b, c, d, e, f
Vrekoussis, M., Wittrock, F., Richter, A., and Burrows, J. P.: Temporal and spatial variability of glyoxal as observed from space, Atmos. Chem. Phys., 9, 4485–4504, https://doi.org/10.5194/acp-9-4485-2009, 2009. a, b
Vrekoussis, M., Wittrock, F., Richter, A., and Burrows, J. P.: GOME-2 observations of oxygenated VOCs: what can we learn from the ratio glyoxal to formaldehyde on a global scale?, Atmos. Chem. Phys., 10, 10145–10160, https://doi.org/10.5194/acp-10-10145-2010, 2010. a, b
Walker, H., Stone, D., Ingham, T., Hackenberg, S., Cryer, D., Punjabi, S., Read, K., Lee, J., Whalley, L., Spracklen, D. V., Carpenter, L. J., Arnold, S. R., and Heard, D. E.: Observations and modelling of glyoxal in the tropical Atlantic marine boundary layer, Atmos. Chem. Phys., 22, 5535–5557, https://doi.org/10.5194/acp-22-5535-2022, 2022. a, b, c, d, e, f, g
Wang, S., Hornbrook, R. S., Hills, A., Emmons, L. K., Tilmes, S., Lamarque, J.-F., Jimenez, J. L., Campuzano-Jost, P., Nault, B. A., Crounse, J. D., Wennberg, P. O., Kim, M., Allen, H., Ryerson, T. B., Thompson, C. R., Peischl, J., Moore, F., Nance, D., Hall, B., Elkins, J., Tanner, D., Huey, L. G., Hall, S. R., Ullmann, K., Orlando, J. J., Tyndall, G. S., Flocke, F. M., Ray, E., Hanisco, T. F., Wolfe, G. M., St. Clair, J., Commane, R., Daube, B., Barletta, B., Blake, D. R., Weinzierl, B., Dollner, M., Conley, A., Vitt, F., Wofsy, S. C., Riemer, D. D., and Apel, E. C.: Atmospheric acetaldehyde: Importance of air-sea exchange and a missing source in the remote troposphere, Geophys. Res. Lett., 46, 5601–5613, https://doi.org/10.1029/2019GL082034, 2019. a, b, c
Washenfelder, R., Young, C., Brown, S., Angevine, W., Atlas, E., Blake, D., Bon, D., Cubison, M., De Gouw, J., Dusanter, S., Flynn, J., Gilman, J. B., Graus, M., Griffith, S., Grossberg, N., Hayes, P. L., Jimenez, J. L., Kuster, W. C., Lefer, B. L., Pollack, I. B., Ryerson, T. B., Stark, H., Stevens, P. S., and Trainer, M. K.: The glyoxal budget and its contribution to organic aerosol for Los Angeles, California, during CalNex 2010, J. Geophys. Res.-Atmos., 116, D00V02, https://doi.org/10.1029/2011JD016314, 2011. a
Wei, P.-S., Chiu, H.-H., Hsieh, Y.-C., Yen, D.-L., Lee, C., Tsai, Y.-C., and Ting, T.-C.: Absorption coefficient of water vapor across atmospheric troposphere layer, Heliyon, 5, e01145, https://doi.org/10.1016/j.heliyon.2019.e01145, 2019. a
Wendisch, M., Pöschl, U., Andreae, M. O., Machado, L. A., Albrecht, R., Schlager, H., Rosenfeld, D., Martin, S. T., Abdelmonem, A., Afchine, A., Alessandro, C. A., Artaxo, P., Aufmhoff, H., Barbosa, H. M. J., Borrmann, S., Braga, R., Buchholz, B., Cecchini, M. A., Costa, A., Curtius, J., Dollner, M., Dorf, M., Dreiling, V., Ebert, V., Ehrlich, A., Ewald, F., Fisch, G., Fix, A., Frank, F., Fütterer, D., Heckl, C., Heidelberg, F., Hüneke, T., Jäkel, E., Järvinen, E., Jurkat, T., Kanter, S., Kästner, U., Kenntner, M., Kesselmeier, J., Klimach, T., Knecht, M., Kohl, R., Kölling, T., Krämer, M., Krüger, M., Krisna, T. C., Lavric, J. V., Longo, K., Mahnke, C., Manzi, A. O., Mayer, B., Mertes, S., Minikin, A., Molleker, S., Münch, S., Nillius, B., Pfeilsticker, K., Pöhlker, C., Roiger, A., Rose, D., Rosenow, D., Sauer, D., Schnaiter, M., Schneider, J., Schulz, C., de Souza, R. A. F., Spanu, A., Stock, P., Vila, D., Voigt, C., Walser, A., Walter, D., Weigel, B., Weinzierl, B., Werner, F., Yamasoe, M. A., Ziereis, H., Zinner, T., and Zöger, M.: ACRIDICON–CHUVA campaign: Studying tropical deep convective clouds and precipitation over Amazonia using the new German research aircraft HALO, B. Am. Meteorol. Soc., 97, 1885–1908, https://doi.org/10.1175/BAMS-D-14-00255.1, 2016. a
Wennberg, P. O., Bates, K. H., Crounse, J. D., Dodson, L. G., McVay, R. C., Mertens, L. A., Nguyen, T. B., Praske, E., Schwantes, R. H., Smarte, M. D., St Clair, Jason, M., Teng, A. P., Zhang, X., and Seinfeld, J. H.: Gas-phase reactions of isoprene and its major oxidation products, Chem. Rev., 118, 3337–3390, https://doi.org/10.1021/acs.chemrev.7b00439, 2018. a, b, c, d
Werner, B., Stutz, J., Spolaor, M., Scalone, L., Raecke, R., Festa, J., Colosimo, S. F., Cheung, R., Tsai, C., Hossaini, R., Chipperfield, M. P., Taverna, G. S., Feng, W., Elkins, J. W., Fahey, D. W., Gao, R.-S., Hintsa, E. J., Thornberry, T. D., Moore, F. L., Navarro, M. A., Atlas, E., Daube, B. C., Pittman, J., Wofsy, S., and Pfeilsticker, K.: Probing the subtropical lowermost stratosphere and the tropical upper troposphere and tropopause layer for inorganic bromine, Atmos. Chem. Phys., 17, 1161–1186, https://doi.org/10.5194/acp-17-1161-2017, 2017. a, b
Whipple, E. B.: Structure of glyoxal in water, J. Am. Chem. Soc., 92, 7183–7186, 1970. a
Wittrock, F., Richter, A., Oetjen, H., Burrows, J. P., Kanakidou, M., Myriokefalitakis, S., Volkamer, R., Beirle, S., Platt, U., and Wagner, T.: Simultaneous global observations of glyoxal and formaldehyde from space, Geophys. Res. Lett., 33, L16804, https://doi.org/10.1029/2006GL026310, 2006. a, b
Xiao, Y., Jacob, D. J., and Turquety, S.: Atmospheric acetylene and its relationship with CO as an indicator of air mass age, J. Geophys. Res.-Atmos., 112, D12305, https://doi.org/10.1029/2006JD008268, 2007. a
Zarzana, K. J., Min, K.-E., Washenfelder, R. A., Kaiser, J., Krawiec-Thayer, M., Peischl, J., Neuman, J. A., Nowak, J. B., Wagner, N. L., Dubè, W. P., St Clair, J. M., Wolfe, G. M., Hanisco, T. F., Keutsch, F. N., Ryerson, T. B., and Brown, S. S.: Emissions of glyoxal and other carbonyl compounds from agricultural biomass burning plumes sampled by aircraft, Environ. Sci. Technol., 51, 11761–11770, https://doi.org/10.1021/acs.est.7b03517, 2017. a, b
Zarzana, K. J., Selimovic, V., Koss, A. R., Sekimoto, K., Coggon, M. M., Yuan, B., Dubé, W. P., Yokelson, R. J., Warneke, C., de Gouw, J. A., Roberts, J. M., and Brown, S. S.: Primary emissions of glyoxal and methylglyoxal from laboratory measurements of open biomass burning, Atmos. Chem. Phys., 18, 15451–15470, https://doi.org/10.5194/acp-18-15451-2018, 2018. a
Zhou, S., Gonzalez, L., Leithead, A., Finewax, Z., Thalman, R., Vlasenko, A., Vagle, S., Miller, L. A., Li, S.-M., Bureekul, S., Furutani, H., Uematsu, M., Volkamer, R., and Abbatt, J.: Formation of gas-phase carbonyls from heterogeneous oxidation of polyunsaturated fatty acids at the air–water interface and of the sea surface microlayer, Atmos. Chem. Phys., 14, 1371–1384, https://doi.org/10.5194/acp-14-1371-2014, 2014. a
Zhou, X. and Mopper, K.: Apparent partition coefficients of 15 carbonyl compounds between air and seawater and between air and freshwater; implications for air-sea exchange, Environ. Sci. Technol., 24, 1864–1869, 1990. a, b, c
Zhu, Y. and Kieber, D. J.: Concentrations and photochemistry of acetaldehyde, glyoxal, and methylglyoxal in the Northwest Atlantic Ocean, Environ. Sci. Technol., 53, 9512–9521, 2019. a, b
Zhu, Y. and Kieber, D. J.: Global model for depth-dependent carbonyl photochemical production rates in seawater, Global Biogeochem. Cy., 34, e2019GB006431, https://doi.org/10.1029/2019GB006431, 2020. a