the Creative Commons Attribution 4.0 License.
the Creative Commons Attribution 4.0 License.
 | 02 Nov 2023
New particle formation leads to enhanced cloud condensation nuclei concentrations on the Antarctic Peninsula
Jiyeon Park
Hyojin Kang
Yeontae Gim
Eunho Jang
Ki-Tae Park
Sangjong Park
Chang Hoon Jung
Darius Ceburnis
Colin O'Dowd
Young Jun Yoon
Few studies have investigated the impact of new particle formation (NPF) on cloud condensation nuclei (CCN) in remote Antarctica, and none has elucidated the relationship between NPF and CCN production. To address that knowledge gap, we continuously measured the number size distribution of 2.5–300 nm particles and CCN number concentrations at King Sejong Station on the Antarctic Peninsula from 1 January to 31 December 2018. Ninety-seven NPF events were detected throughout the year. Clear annual and seasonal patterns of NPF were observed: high concentration and frequency of nucleation-mode particles in summer (December–February: 53 NPF cases) and undetected nucleation-mode particles in winter (June–August: no NPF cases). We estimated the spatial scale of NPF by multiplying the time during which a distinct nucleation mode can be observed at the sampling site by the locally measured wind speed. The estimated median spatial scale of NPF around the Antarctic Peninsula was found to be approximately 155 km, indicating the large scale of NPF events. Air back-trajectory analysis revealed that 80 cases of NPF events were associated with air masses originating over the ocean, followed by sea-ice (12 cases), multiple (3 cases), and land (2 cases) regions. We present and discuss three major NPF categories: (1) marine NPF, (2) sea-ice NPF, and (3) multiple NPF. Satellite estimates for sea-surface dimethylsulfoniopropionate (DMSP; a precursor of gaseous dimethyl sulfide) data showed that the production of oceanic biogenic precursors could be a key component in marine NPF events, whereas halogen compounds released from ice-covered areas could contribute to sea-ice NPF events. Terrestrial sources (wildlife colonies, vegetation, and meltwater ponds) from Antarctica could affect aerosol production in multiple air masses. Out of 97 observed NPF events, 83 cases were characterized by the simultaneous increase in the CCN concentration by 2 %–270 % (median 44 %) in the following 1 to 36 h (median 8 h) after NPF events. Overall, Antarctic NPF events were found to be a significant source of particles with different physical characteristics and related to biogenic sources in and around the Antarctic Peninsula, which subsequently grew to cloud condensation nuclei.
- Article
(3080 KB) - Full-text XML
-
Supplement
(2408 KB) - BibTeX
- EndNote


The Antarctic Peninsula is warming more rapidly than Earth's global mean rate (Chen et al., 2009; Vaughan et al., 2003), leading to shrinking sea-ice coverage and consequent sea-level rise (Pritchard et al., 2009). In the Antarctic region, ambient aerosols play a crucial role in governing radiative transfer, directly by the scattering and absorption of solar radiation and indirectly by acting as cloud condensation nuclei (CCN) (IPCC, 2013). The magnitude of the radiative forcing caused by the interactions between aerosols and CCN remains highly uncertain due to a poor understanding of pristine natural aerosols (Carslaw et al., 2013). To reduce this uncertainty, the physicochemical properties of aerosol particles (e.g., number concentrations, size distributions, chemical compositions, and hygroscopicity) have been studied at several Antarctic stations including King Sejong Station (Kim et al., 2019), Aboa (Asmi et al., 2010; Virkkula et al., 2006), Dome C (Järvinen et al., 2013), Halley (Lachlan-Cope et al., 2020; O'Dowd et al., 1997), Kohnen (Weller et al., 2018), McMurdo (Giordano et al., 2018; Liu et al., 2018), Neumayer (Teinilä et al., 2014; Weller et al., 2015), Princess Elisabeth (Herenz et al., 2019), and Syowa (Hara et al., 2011; Ito, 1993). Furthermore, open-ocean and coastal Antarctic expeditions such as SIPEXII (Sea Ice Physics and Ecosystems eXperiment, 2012; Humphries et al., 2015, 2016), PEGASO (Plankton-derived Emissions of trace Gases and Aerosols in the Southern Ocean, 2015; Dall'Osto et al., 2017a; Decesari et al., 2020; Fossum et al., 2018), ACE-SPACE (Antarctic Circumnavigation Expedition: Study of Pre-industrial-like Aerosol Climate Effects, 2017; Schmale et al., 2019; Walton and Thomas, 2018), PCAN (Polar Cell Aerosol Nucleation, 2017; Simmons et al., 2021), and PI-ICE (Polar atmosphere-ice-ocean Interactions: Impact on Climate and Ecology, 2019; Brean et al., 2021; Dall'Osto et al., 2022) have produced studies on the influences of marine aerosols on climate and ecology. Overall, aerosol particle number concentrations follow a clear annual trend, being much higher in austral summer than in other seasons (Järvinen et al., 2013; Kerminen et al., 2018; Weller et al., 2011). For instance, Kim et al. (2017) found that summertime concentrations on the Antarctic Peninsula were ∼ 20 times higher than in winter. This pattern can be largely explained by new particle formation (NPF) events.
Precursor gases for NPF in this region can originate from the ocean, sea ice, meltwater ponds, terrestrial animal colonies, anthropogenic activity, and continental ecosystem. Oceanic emissions of dimethyl sulfide (DMS) represent the largest natural sulfur source in the Antarctic atmosphere (Simó, 2001), and DMS photooxidation is a key process contributing to NPF (Giordano et al., 2017; Jang et al., 2019, 2022). For instance, in situ (Saiz-Lopez et al., 2007) and satellite (Schönhardt et al., 2008) measurements have shown Antarctica to be an iodine emission hotspot, particularly from the sea ice in the Weddell Sea during spring (Atkinson et al., 2012). Indeed, Sipilä et al. (2016) measured iodic acid (HIO3) in Antarctica and found that the Antarctic oceanic regions may be strong sources of molecular iodine, which is then converted to HIO3 in gas-phase reactions. Dall'Osto et al. (2017b) reported that microbiota in sea ice were associated with atmospheric organic nitrogen formation in the Southern Ocean near Antarctica. According to Kyrö et al. (2013), the precursor vapors responsible for NPF and subsequent growth could originate from the cyanobacteria, which are abundant in Antarctic meltwater ponds. In addition, continental Antarctica is a habitat for various types of seabirds and penguins, with guano species acting as a crucial source of ammonia and organic compounds that may contribute to NPF in coastal Antarctic areas (Schmale et al., 2013; Weber et al., 1998; Zhu et al., 2011). At the continental South Pole, NPF events are commonly associated with the local anthropogenic pollution during calm weather conditions (Park et al., 2004). In addition, the biomass burning aerosol from South American continental outflow has been observed at the Troll research station (Fiebig et al., 2009). During the daytime, higher radiation enhances photo-active emissions from land ecosystems (mosses, grasses, and lichens) of the Antarctic Peninsula and can lead to NPF and aerosol growth (Decesari et al., 2020; Quéléver et al., 2022; Schmale et al., 2013). However, land sources are rather unlikely due to a small footprint of emerging land and the associated short overpass over the sparse vegetation.
In recent years, long-term records of aerosol size distribution have become an important aspect of investigations into the sources and dynamical processes of NPF. The majority of Antarctic field studies have focused on the annual and spatial patterns of the number size distribution of particles > 10 nm (Belosi et al., 2012; Järvinen et al., 2013; Kim et al., 2019; Kyrö et al., 2013; Lachlan-Cope et al., 2020). Although NPF events are typically characterized by a rapid increase in the number concentration of clusters from 1–3 nm (Kulmala et al., 2004), datasets for these types of aerosol size distributions remain rare. To date, the number size distribution of particles > 3 nm has been reported by Asmi et al. (2010) at Aboa from 29 December 2006 to 29 January 2007, by Pant et al. (2011) at Maitri from 1 January to 28 February 2015, by Weller et al. (2015) at Neumayer from 20 January to 26 March 2012, by Jokinen et al. (2018) at Aboa from November 2014 to February 2015, by Weller et al. (2018) at Kohnen during January 2015 and 2016, by Quéléver et al. (2022) at Marambio during the austral summer between 15 January and 25 February 2018, and by Brean et al. (2021) during the PI-ICE cruise from 25 January to 4 February 2019. However, all of these measurements were made during the Antarctic summer due to restricted access and, therefore, give limited information on seasonal cycles.
Newly formed particles can grow into larger sizes that act as CCN, becoming relevant for cloud formation (O'Dowd, 2002; Williamson et al., 2019). In a highly pristine atmosphere such as Antarctica, where CCN concentration is extremely low (Kim et al., 2017), NPF may be a significant phenomenon controlling the CCN budget (Kyrö et al., 2013). For instance, Herenz et al. (2019) showed that an elevated CN2.5 (total number concentration of particles > 2.5 nm) during NPF events was accompanied by an increase in CCN concentrations at Princess Elisabeth during austral summer (December to February, 2013–2016). Ship-based observations during ACE-SPACE found that the fraction of particles serving as CCN was higher near the coast of Antarctica compared to the open ocean, resulting from multiple processing cycles of dissipating and condensing clouds and/or the more available condensable gases originating from marine microbial activity (Schmale et al., 2019). In addition, seasonal variability in CN2.5−10 (number concentration of particles within the 2.5 and 10 nm range and attributed to NPF) and CCN concentrations at King Sejong Station from March 2009 to December 2016 were investigated by Kim et al. (2019), who concluded that CCN concentrations during NPF events increased by ∼ 11 % compared to the background concentration. However, to date, only one study (Kim et al., 2019) has reported the contribution of NPF to CCN on the Antarctic Peninsula, and that study did not consider aerosol number size distribution.
In this study, we continuously recorded the number size distribution of 2.5–300 nm particles and CCN number concentrations at King Sejong Station on the Antarctic Peninsula from 1 January to 31 December 2018. Our primary goals were to (1) characterize the seasonal variation and occurrence of NPF events from the perspective of aerosol physical properties (total number concentration, number size distribution, formation and growth rates, and condensation sink), (2) improve our understanding of the major sources (including open ocean, sea ice, and land) and processes influencing NPF and particle growth, and (3) estimate the contribution of atmospheric NPF to CCN activity in this pristine environment. To our knowledge, this is the first study to present direct evidence of CCN production associated with NPF and growth events on the Antarctic Peninsula, using simultaneous measurements of particle number size distributions (down to 3 nm) and CCN properties for a full year.
2.1 Sampling site and instrumentation
Continuous measurements of the physical properties of aerosol particles were conducted from January 2018 to December 2018 at King Sejong Station on the Antarctic Peninsula (62.22∘ S, 58.78∘ W). Full details of the sampling site and measurement setup are given in Kim et al. (2017). In brief, a cylindrical stainless inlet (0.1 m diameter and 5.2 m length; total flow rate of the sampled air was 150 L min−1) was placed on the observatory roof following Global Atmosphere Watch aerosol measurement guidelines and recommendations. Two condensation particle counters (TSI model 3776 CPC and TSI model 3772 CPC) were used to measure the total number concentration of particles larger than 2.5 (corresponding data CN2.5) and 10 nm (corresponding data CN10), respectively, every 1 s. The aerosol sample flow rates of TSI model 3776 CPC and TSI model 3772 CPC were 1.5 and 1.0 L min−1, respectively. A nano-scanning mobility particle sizer (nano-SMPS) consisting of a nano-differential mobility analyzer (nano-DMA) (TSI model 3085, USA) and an ultrafine condensation particle counter (TSI model 3776, USA) was used to measure the number size distribution of particles from 2.5–64 nm every 3 min. The aerosol flow rate was 1.5 L min−1 and the sheath flow rate was 15 L min−1 inside the nano-DMA.
The particle number size distribution (from 10–300 nm every 3 min) was measured with a standard SMPS consisting of a long DMA (TSI model 3081, USA) and a CPC (TSI model 3772, USA). The aerosol flow rate was 1.0 L min−1 and the sheath flow rate was 10 L min−1 inside the long DMA. To obtain the number size distribution of particles from 2.5–300 nm, the nano-SMPS and standard SMPS were merged. For particle diameters of 2.5–20 nm, nano-SMPS data were chosen because these were optimized to operate with a smaller particle diameter. In the nano-DMA, the aerosol residence time can be reduced by shortening the inlet transport passage (5.0 cm) and increasing the inlet flow (up to 16.5 L min−1) (< 10 nm) (Chen et al., 1998). Hence, the number size distribution data from both the nano-SMPS and the standard SMPS were merged at a diameter of 20 nm. Furthermore, a three-point median filter and five-point moving average were applied upon merging the number size distribution data to remove nano-SMPS noise, as suggested by Kulmala et al. (2012).
The black carbon (BC) concentration was measured using an Aethalometer (AE22, Magee Scientific Co., USA) every 5 min to examine long-range polluted aerosol transport from other continents and to assess the influence of local pollution from the station. The flow rate through a sharp-cut 2.5 µm cyclone (BGI, Inc., USA) was set to 5 L min−1. The CCN counter (CCNC: CCN-100, Droplet Measurement Technologies, USA) measured CCN number concentrations at five different supersaturation levels of 0.2 %, 0.4 %, 0.6 %, 0.8 %, and 1 % every 30 min. The total flow rate in the CCN counter was 0.5 L min−1. The sample and sheath flow rates of the CCN counter were 0.05 and 0.45 L min−1, respectively. In addition, basic meteorological parameters (temperature, pressure, relative humidity (RH), wind speed, wind direction, and solar radiation intensity) were measured using an automatic weather station (Vaisala HMP45).
2.2 Data evaluation
As the observatory is located ∼ 400 m southwest of the main station buildings and several kilometers away from other research stations, measurement data were impacted by local emissions from station activities (e.g., power generators and incineration) or anthropogenic pollution near the observatory (e.g., plumes from other research station several kilometers away, vessels providing research station supply, and commercial cruise vessels). To obtain an unperturbed aerosol population of a pristine Antarctic environment, contaminated measurements were removed manually based on wind direction, wind speed, BC concentration, and total particle number concentration. The following data elimination procedure was applied, discarding measurements taken under the following conditions: (1) a wind sector of 355 to 55∘ because this was directly impacted by local pollution sources; (2) relative wind speed below 2.0 m s−1, as stagnant conditions would have facilitated contaminated particle propagation to the measurement location; (3) equivalent BC mass concentrations exceeding 50 ng m−3, because elevated BC concentration unambiguously pointed at polluted particles; and (4) a sharp increase in the total number concentration over the entire particle diameter range in a short timescale of less than an hour, as such abrupt peaks and spikes are related to potential contamination or instrumental malfunctions. For instance, CPC and SMPS data were removed for time periods when particle number concentrations suddenly increased to more than twice the background values.
Based on a 4-year (2016–2019) BC dataset, six types of Antarctic Peninsula air-pollution levels were identified (Grigas et al., 2017): (1) pristine air with BC concentrations < 15 ng m−3, (2) clean air with BC levels of 15–50 ng m−3, (3) slightly polluted air with BC levels of 50–100 ng m−3, (4) moderately polluted air with BC levels of 100–300 ng m−3, (5) polluted air with BC levels of 300–1000 ng m−3, and (6) extremely polluted air with BC concentrations > 1000 ng m−3 (Fig. 1). Previously, BC data were used as indicators for local contamination in Antarctica when the BC concentration level exceeded 50 ng m−3 (Herenz et al., 2019) or 100 ng m−3 (Jang et al., 2019; Kim et al., 2017, 2019; Weller et al., 2011, 2015). Hara et al. (2019) measured BC concentration at Syowa Station, Antarctica, from February 2005 until December 2016. They found that the daily median BC concentrations were from below the detection limit (0.2 ng m−3) to 63.8 ng m−3 at Syowa Station (median, 1.8 ng m−3; mean, 2.7 ng m−3 during the measurement period). During the ACE-SPACE expedition, BC concentration reached its background levels of 19.2 ng m−3 (Schmale et al., 2019). Arctic shipborne observations measured BC concentration throughout the Arctic Ocean and Pacific Ocean during the summer of 2017, with all observations pointing to pristine clean marine air masses with BC values of approximately 20 ± 10 ng m−3 (Park et al., 2020).
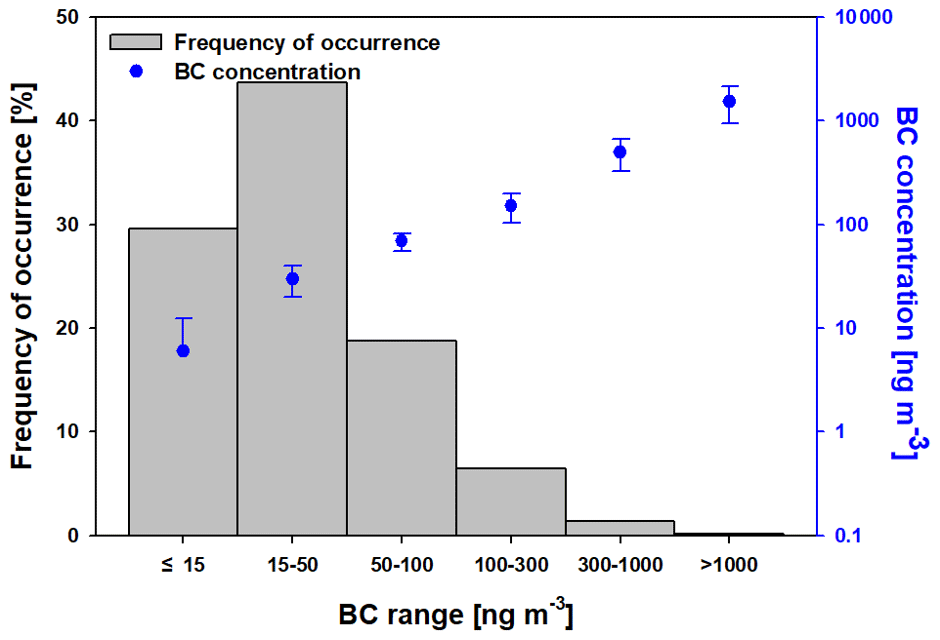
Figure 1Frequency of occurrence of BC mass concentration for six types of Antarctic Peninsula air-pollution levels classified from 4-year BC data.
Of the total time period assessed, pristine air conditions represented 30 % (mean value of BC: 6 ± 6 ng m−3), clean 44 % (mean value of BC: 30 ± 10 ng m−3), lightly polluted 19 % (mean value of BC: 69 ± 14 ng m−3), moderately polluted 6 % (mean value of BC: 150 ± 47 ng m−3), polluted 1 % (mean value of BC: 499 ± 174 ng m−3), and extremely polluted less than 1 % (mean value of BC: 1537 ± 595 ng m−3). Together, pristine and clean air conditions accounted for ∼ 74 % of the time, with the remaining 26 % (BC > 50 ng m−3) removed prior to data analysis.
2.3 Definition of NPF and growth events
NPF events were visually identified by the particle number size distribution based on the protocol described by Dal Maso et al. (2005) and Kulmala et al. (2012). Here, these were defined when a distinct new mode of particles (initially < 25 nm), appearing in the particle number size distribution at nucleation-mode size (3–25 nm), prevailed for more than an hour. Using these criteria, the particle size distribution data showed that in some cases, there was only a short burst of nucleation-mode particles without clearly discernible particle growth, whereas in other cases, particle formation with subsequent particle growth lasted for several hours, representing a regional-scale phenomenon (Ström et al., 2009). This enabled us to determine the particle growth rate (GR), which is not possible during short bursts of nucleation-mode particles.
The particle growth and formation rates along with the condensation sink were calculated from the measured particle number size distribution. The GR was determined using the maximum concentration and mode-fitting methods (Dal Maso et al., 2005; Yli-Juuti et al., 2009). The GR was calculated by a linear fit through the geometric mean diameter of the nucleation-mode particles as a function of time during NPF. The formation rate (FR) of nucleation-mode particles (J3−25) was calculated by taking into account the time evolution of the particle number concentration in this size range and particle losses due to the coagulation sink and condensational growth out of the size range (Kulmala et al., 2012). The surface area of particles available for the condensation of gaseous molecules can be characterized by a condensation sink (CS), which determines how rapidly vapor molecules condense onto pre-existing particles (Collins et al., 2017; Dal Maso et al., 2002).
2.4 Backward trajectory analysis and potential source regions
Air mass back trajectories were obtained using the HYSPLIT model to investigate their relationships with the physical characteristics of aerosol particles (Draxler and Hess, 1998). The 2 d air mass back trajectories (48 h) were determined at hourly intervals and combined with satellite-derived geographical information to estimate the transport history of the air masses arriving at the observation site (Jang et al., 2022; Park et al., 2021). The potential origins of the aerosols were divided into three categories based on the retention time of the 2 d back trajectories over three major domains: ocean (including the Weddell and Bellingshausen seas), sea ice, and land (including the Antarctic Peninsula). Daily geographical information on ocean, sea-ice, and land area was obtained from the Sea Ice Index (25 km resolution) provided by the National Snow and Ice Data Center (NSIDC). The sea-ice zone was defined as the area with a sea-ice coverage > 15 % (Stroeve et al., 2016). Air masses that passed over the Weddell and Bellingshausen Sea regions were categorized as originating from the ocean (i.e., > 50 % retention over the ocean region). The air masses that frequently advected over the sea-ice region were categorized as originating over the sea ice (i.e., > 50 % retention over the sea-ice domain). Air masses that traveled through the Antarctic Peninsula were categorized as originating from the land (i.e., > 50 % retention over the land). Finally, the air masses which passed over the ocean, sea-ice, and land regions simultaneously were categorized as originating from multiple regions (i.e., 20 %–40 % retention each over the ocean, sea-ice, and land domains).
To evaluate the influence of oceanic biological characteristics on NPF properties, the phytoplankton biomass of the ocean domains was estimated by calculating their chlorophyll concentration from the Moderate Resolution Imaging Spectroradiometer on the Aqua (MODIS Aqua) satellite at 4 km resolution during the entire study period. Phytoplankton produces dimethylsulfoniopropionate (DMSP, a precursor of gaseous DMS) and other organic vapors, all of which are potential precursors to new particle formation. Thus, the spatiotemporal distribution of sea-surface DMSP could be an indicator of contemporary DMS emissions. The total DMSP concentration on the sea surface was estimated using the algorithm developed by Galí et al. (2015). The algorithm for the total DMSP concentration was based on the satellite-derived chlorophyll concentration and photosynthetic radiation exposure. To calculate the air mass exposures to ocean chlorophyll and DMSP (Jang et al., 2019), hourly back-trajectory position was combined with satellite-derived chlorophyll concentration and total DMSP concentration, providing a good measure for quantitatively investigating the biological exposure history of sampled air over several days before its arrival at the observation site (Park et al., 2018, 2021). However, satellites are not typically used to directly measure the biomass of sea-ice algae because satellite sensors cannot penetrate through thick layers of sea ice to directly measure the biomass of algae beneath it (Lee et al., 2015; Lange et al., 2017). Thus, calculated chlorophyll exposures (i.e., satellite estimates of biological activity) cannot account for the biological activities thriving within and beneath of the sea ice.
3.1 General features and annual cycle
We investigated the overall seasonality of particle number size distributions focusing on NPF events. In addition, local meteorological parameters (e.g., temperature, RH, wind speed, wind direction, pressure, and solar radiation) and air mass back trajectories were used to support the interpretation of the seasonal trends of the particle number size distribution and the dynamics of NPF events observed at the station.
3.1.1 Particle number concentrations and size distributions
Figure 2 shows a time series of the 1 h average total particle number concentration and size-segregated particle number concentrations over the entire measurement period conforming to pristine (BC < 15 ng m−3) and clean (BC: 15–50 ng m−3) conditions. In addition, monthly medians for the total number concentration of particles, size-segregated particle number concentration, CCN number concentration at supersaturation of 0.4 %, and meteorological parameters are included in Table 1. The CN2.5 and CN10 ranged from 60 to 3982 and 30 to 3304 cm−3, respectively. The annual median number concentrations of particles for the nucleation mode (NNUC; 2.5–25 nm in diameter), Aitken mode (NAIT; 25–100 nm in diameter), and accumulation mode (NACC; 100–300 nm in diameter) were 46.8, 53.5, and 21.7 cm−3, respectively. The highest median NNUC, NAIT, and NACC values were recorded in December (193.5 cm−3), December (227.6 cm−3), and January (83.8 cm−3), respectively (Table 1). The lowest NNUC, NAIT, and NACC values were recorded during austral winter in June: 12.2, 12.5, and 9.2 cm−3, respectively. Overall, clear annual and seasonal patterns of particle number concentrations in all size classes were observed: high concentrations in summer (December–February) and low concentrations in winter (June–August), similar to those observed at Marambio Station on the Antarctic Peninsula (Asmi et al., 2018), at the coastal Neumayer Station (Weller et al., 2011), at Concordia Station Dome C (Järvinen et al., 2013), and at Troll Station (Fiebig et al., 2014). Furthermore, the hourly average CN10 value was positively correlated with the hourly average NNUC (R= 0.88; not shown), implying that the summer maximum of total particle number concentrations was largely influenced by newly formed particles in the Antarctic atmosphere.
Table 1Monthly medians for the total particle number concentration > 10 nm (CN10); particle number concentrations of the nucleation mode (NNUC), Aitken mode (NAIT), and accumulation mode (NACC); CCN number concentration at supersaturation of 0.4 % (CCN0.4 %); and meteorological parameters such as solar radiation, temperature, RH, pressure, wind speed, and wind direction for 2018, after data filtering (BC < 50 ng m−3 indicating pristine and clean conditions), measured at King Sejong Station on the Antarctic Peninsula from 1 January to 31 December 2018.
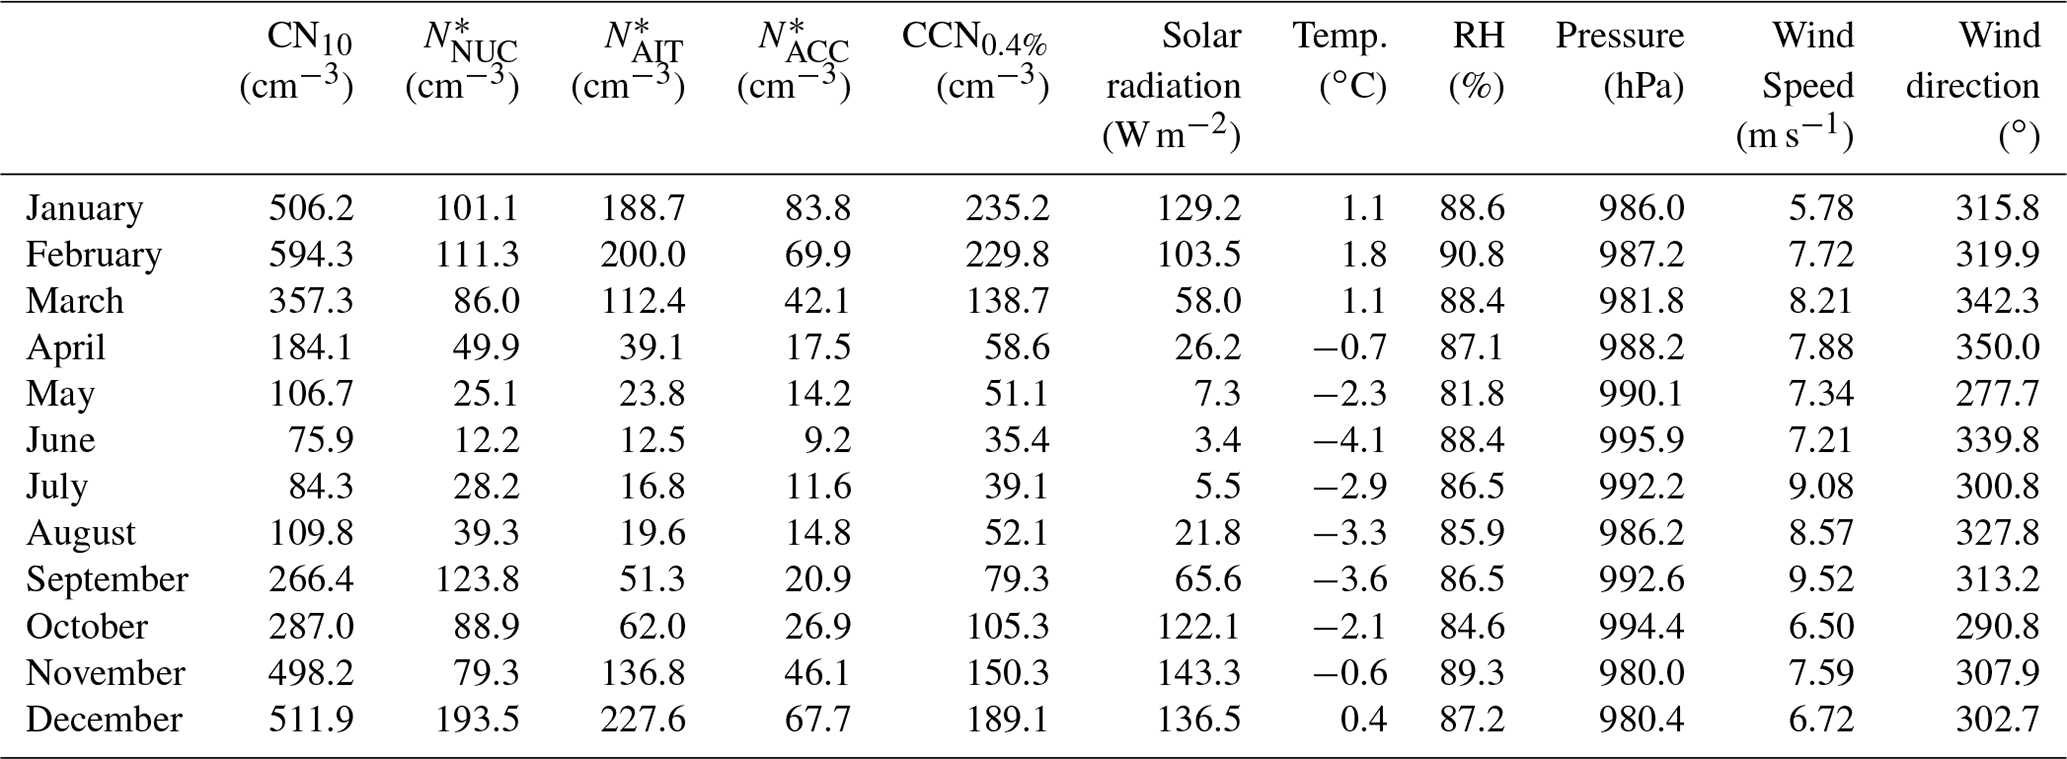
* NNUC, NAIT, and NACC represent the particle number concentrations in the nucleation mode (2.5–25 nm), Aitken mode (25–100 nm), and accumulation mode (100–300 nm).
3.1.2 Influence of meteorological parameters on NPF events
The meteorological parameters after data filtering (BC < 50 ng m−3 indicating pristine and clean conditions) were characterized by a solar radiation range of 0–919 W m−2 (median 10.7 W m−2), a temperature range of −20 to 6 ∘C (median −1.2 ∘C), an RH range of 52 %–98 % (median 88 %), a pressure range of 950–1022 hPa (median 988 hPa), a wind speed range of 0.3–21 m s−1 (median 7.4 m s−1), and a wind direction range of 3–357∘ (median 296∘) (Fig. S1 in the Supplement). To understand impacts on the particle number size distributions, we determined the relationships between the size-segregated particle number concentrations and meteorological parameters (Fig. S2). CN10, NNUC, NAIT, and NACC were positively correlated with both solar radiation intensity and temperature. In particular, NNUC had the highest correlation with solar radiation intensity (R= 0.39) of any meteorological condition, suggesting that solar radiation is one of the most important factors influencing NPF events, as it can drive photochemical reactions that lead to the production and further reaction of precursor gases. In contrast, there was a weak anticorrelation between RH and NNUC, supporting the view that NPF occurs preferentially at low RH (Dada et al., 2017; Hamed et al., 2011; Jeong et al., 2010; Laaksonen et al., 2008). Field observations have reported that during NPF events, RH was negatively related to the number concentration of freshly formed particles (Jeong et al., 2004; Lachlan-Cope et al., 2020; Weber et al., 1997) because of the enhanced coagulation from scavenging effect of sub-3 nm nanoparticles at high RH and the diminished solar radiation at high RH. Previously, some NPF events were associated with high wind speeds at various Antarctic stations, such as Neumayer (Weller et al., 2015) and Aboa (Asmi et al., 2010; Virkkula et al., 2007). These studies found an enhanced particle number concentration < 10 nm during stormy weather and suggested ion production by frictional processes in fast-moving snow and ice crystals, followed by subsequent ion-mediated nucleation during strong winds. However, in our study, wind speed was not correlated with NNUC (R= −0.18), NAIT (R= −0.04), or NACC (R= −0.05), as recently suggested by Liu et al. (2018). Our results indicated that wind speed did not affect NPF events. A possible explanation for the wind speed independence is that an increase in wind speed contributes to the increase in cluster size ion number concentrations by friction processes (Virkkula et al., 2007), but it was also accompanied by cloudy conditions. In summary, the elevated NNUC values (i.e., indicator of NPF events) at King Sejong Station were more likely to be accompanied by high solar radiation, high temperature, and low RH, regardless of wind speed. Recent studies concluded that Antarctic NPF occurred under combined high-solar-radiation, high-temperature, and low-RH conditions, such as a previous study that conducted measurements at the Marambio Antarctic research station (Quéléver et al., 2022). Quéléver et al. (2022) found all NPF events were observed during the daytime with high solar radiation (clear-sky conditions), mostly with above-freezing temperature and with low RH.
3.1.3 Characteristics of NPF events
NPF events in this study were identified based on the size distribution data measured using the standard SMPS (Fig. 2e) and nano-SMPS (Fig. 2f). During the pristine and clean periods (comprising 355 observation days and 169 166 size distribution spectra for the standard SMPS and 349 observation days and 165 259 size distribution spectra for the nano-SMPS), NPF events were frequently observed at King Sejong Station, as shown by the size distribution data (Fig. 2f). A total of 97 events (26 % of observation days) with elevated NNUC were observed when taking place in pristine (BC < 15 ng m−3) and clean (BC: 15–50 ng m−3) conditions. The median value of BC concentrations during NPF events was 21.0 ng m−3, which is similar to that of the whole measurement period after data filtering (median BC value: 18.8 ng m−3) (Sect. 2.2). This indicated that NPF events are independent of occasional increases in BC during clean periods. The NPF events were classified into the following: (1) burst events and (2) nucleation with growth events according to the classification by Dal Maso et al. (2005) as seen in Fig. S3. The burst events and nucleation with growth events were observed on 1 January 2018 and 16 December 2018, respectively. NPF events were more frequently observed in summer (∼ 55 %) than in any other season (Fig. 4), with the highest frequency in January (22 %) and December (22 %) followed by spring (September–November, 34 %) and autumn (March–May, 11 %). Similar results were reported by Järvinen et al. (2013) based on observations from Dome C and by Kim et al. (2019) based on observations from King Sejong Station. Although Järvinen et al. (2013) reported winter events that occurred in the absence of sunlight, we did not detect NPF events during austral winter from May through to August.
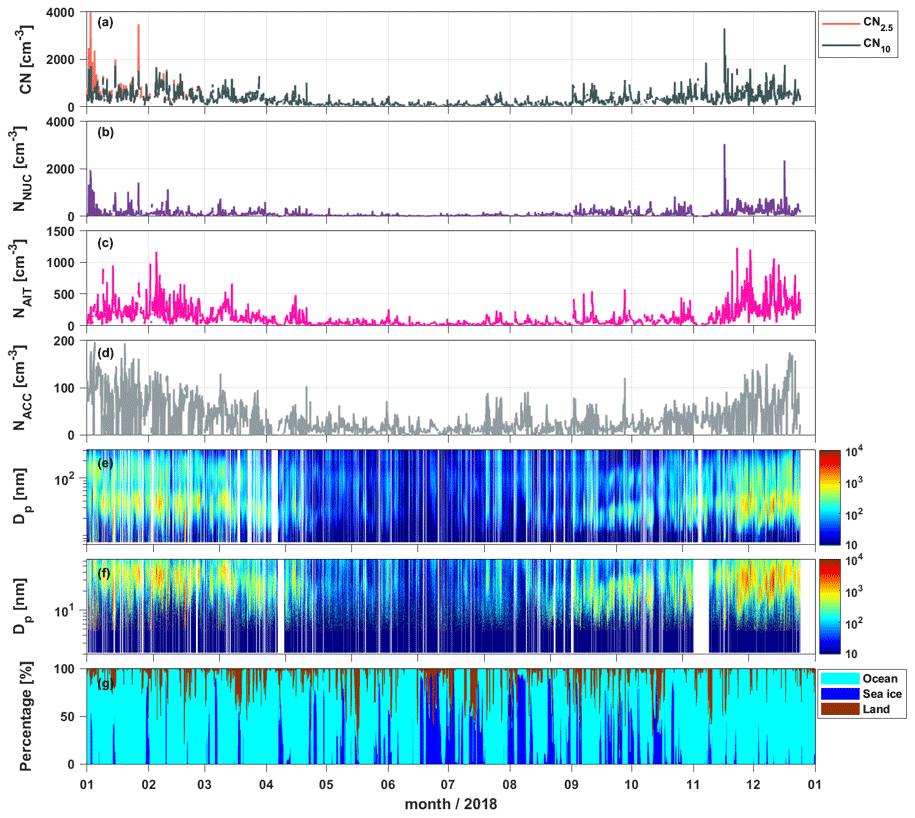
Figure 2Time series of 1 h averages for (a) CN2.5 and CN10, (b) the nucleation mode (NNUC; 2.5–25 nm), (c) the Aitken mode (NAIT; 25–100 nm), and (d) the accumulation mode (NACC; 100–300 nm); contour plots of the size distributions measured using the (e) standard SMPS and (f) nano-SMPS; and (g) residence time of air masses passing over ocean, sea ice, and land. CN2.5 data are only available from January to March due to the instrumental malfunctions.
In order to investigate the seasonal characteristics of NPF events, we compared mean size distributions of aerosol particles for summer, spring (transition period of the melting ocean), and autumn (transition period of refreezing of the ocean) (Fig. S4). Trimodal distributions were presented in all seasons except winter, when the nucleation mode or particle formation was not observed. For instance, a trimodal distribution was seen at 7, 30, and 122 nm during summer months. The number concentration of nucleation and Aitken modes were higher than the accumulation modes, indicating that NPF events regulate the aerosol processes on the Antarctic Peninsula. The largest mode at 126 or 103 nm may be due to a combination of primary (produced by bubble-bursting processes) and secondary (produced by gas-to-particle conversion processes) aerosol components. Results are broadly in line with previous results published from the Arctic and Antarctic regions. A shipborne field campaign over the Arctic Ocean found a trimodal distribution at 18, 53, and 150 nm for open-ocean marine Arctic NPF events (Park et al., 2020). Lachlan-Cop et al. (2020) presented k-means cluster analysis of particle size distribution measured at Halley, Antarctica, showing a nucleation peak at 15 nm for the “nucleation” ultrafine category and a nucleation peak at 27 nm for “bursting” ultrafine category.
Air mass back trajectories were calculated at hourly intervals to investigate possible source regions for the observed NPF events. Figure 2g shows the residence times of air masses over the three domains. Based on 2 d air mass transport history analysis, air masses allocated to ocean, sea ice, and land account for 83 %, 12 %, and 5 %, respectively, during the study period. A total of 97 cases were identified as NPF events, 80 of which were observed when the air mass originated over the ocean domain (Fig. 4). A total of 12 NPF events were observed in air masses originating over the sea-ice domain, and the remaining 5 events were associated with a multi-regional origin (3 cases) and land origin (2 cases). A multi-regional origin indicated air masses simultaneously influenced by all three domains. Median BC concentrations for ocean, sea-ice, and multiple air masses were found to be 23.8, 12.7, and 9.8 ng m−3, respectively (Fig. S5), indicating pristine clean air masses with minimum influence from anthropogenic pollution during each NPF event case. Our results indicated that NPF events were more common in air masses originating over the ocean and sea ice compared to those originating from the land. Precursors released by both ocean and sea ice could play an important role in the formation of new particles in the Antarctic atmosphere.
3.1.4 Spatial extension of regional nucleation event
Many previous studies have reported that key steps of the nucleation process (e.g., cluster stabilization) occur in the size range ∼ 2 nm, in line with recent direct observations of atmospheric molecular clusters (Kerminen et al., 2018; Kulmala et al., 2013). However, during NPF events, we did not observe particle formation starting directly from the lower end of the particle size spectrum (2.5 nm), showing that the formation of freshly nucleated particles could not have actually taken place at the site. Indeed, the initial diameter of particles that arrived at the measurement site during the NPF ranged from 4 to 16 nm (Fig. 3a). Median values of the NPF event duration (Fig. 3b) and growth rate (Fig. 3c) were 4.0 h and 0.83 nm h−1, respectively. We assumed that the new particles observed at the measurement site were transported from elsewhere or produced aloft and detected the appearance of an already-grown mode. Consistent with these studies, NPF events can be a regional-scale phenomenon extending over spatial scales of tens to hundreds of kilometers in several regions, such as in the remote marine boundary layer (Zheng et al., 2021) and Canadian high Arctic (Eureka, Nunavut, on Ellesmere Island in the Canadian Arctic Archipelago) (Tremblay et al., 2019) and from Arctic ship-based observations.
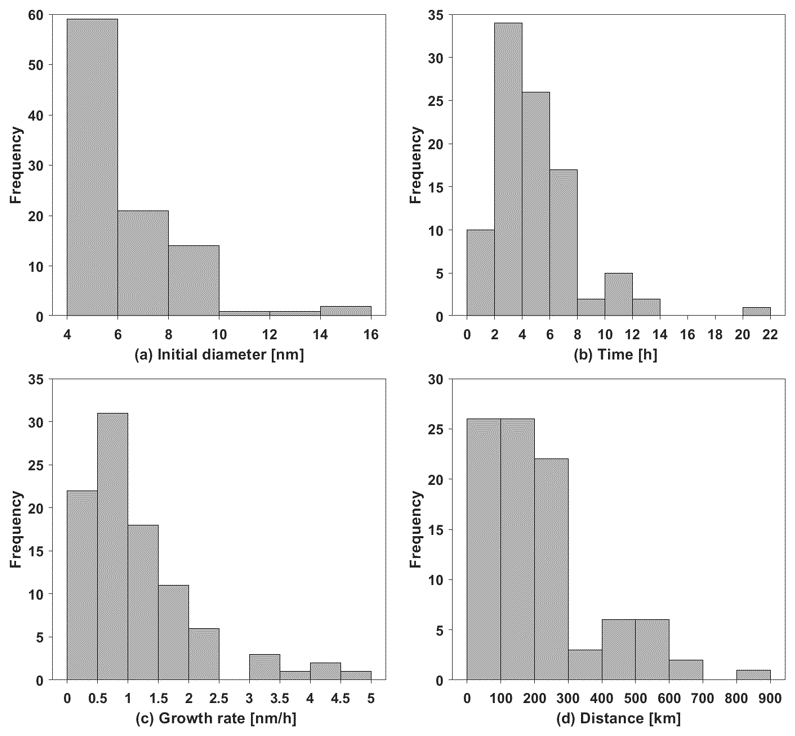
Figure 3Frequency of the (a) initial diameter of particles, (b) duration time, (c) growth rate, and (d) extension for the NPF event. Two NPF cases were excluded when the wind speed was higher than 10 m s−1.
Assuming the region is characterized by homogenous meteorological conditions, we estimated the spatial scale of NPF by multiplying the time during which a distinct nucleation mode can be observed at the sampling site by the locally measured wind speed (Birmili et al., 2003; Crippa and Pryor, 2013). As shown in Fig. 3d, the spatial extent of NPF events associated with substantial particle growth can be 16–816 km (median value: 155 km), indicating large-scale NPF events. Weller et al. (2015) measured size distributions at the coastal Antarctic station Neumayer during two summer campaigns (from 20 January to 26 March 2012 and 1 February to 30 April 2014). They found that the spatial extent of NPF events was estimated to be around 170 ± 85 km, taking into account the prevailing wind velocity (around 8 ± 4 m s−1) and the confined NPF duration (around 6 h).
3.2 Case studies
This section presents a detailed overview of the ocean, sea-ice, and multi-regional NPF events.
3.2.1 Marine NPF event
A striking series of NPF events took place over 7 d (Fig. 6), starting at approximately 00:00 LST (UTC−4) on 9 December 2018. Events starting at midnight can likely indicate their formation a few hours earlier during afternoon sunlight because the events are observed with an already-grown nucleation mode. Time series of meteorological parameters, air mass origins, oceanic biological activity (estimated by chlorophyll and DMSP exposures), particle size distribution (measured by nano-SMPS and standard SMPS), and CCN concentrations are shown in Fig. 6. During this time, the prevailing northerly winds (median 307∘) were stable at 7.7 m s−1. Air temperature varied from −1.5 to 2.1 ∘C (median 0.5 ∘C), and RH varied from 75 %–97 % (median 89 %). There were no data for solar radiation during these events. Air masses predominantly traveled over the Antarctic Ocean (46.9, 0.7, and 0.4 h over ocean, land, and sea ice, respectively) and could be categorized as originating from the Antarctic Ocean. Specifically, the air mass originated mainly from Bellingshausen Sea (Fig. 5a). During this event, the median total DMSP and chlorophyll exposures in the surface sea were 18 nmol L−1 and 0.26 mg m−3, respectively.
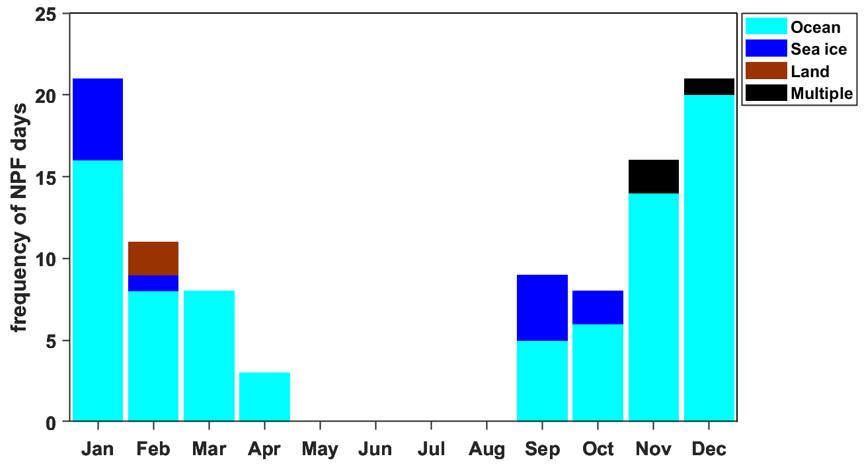
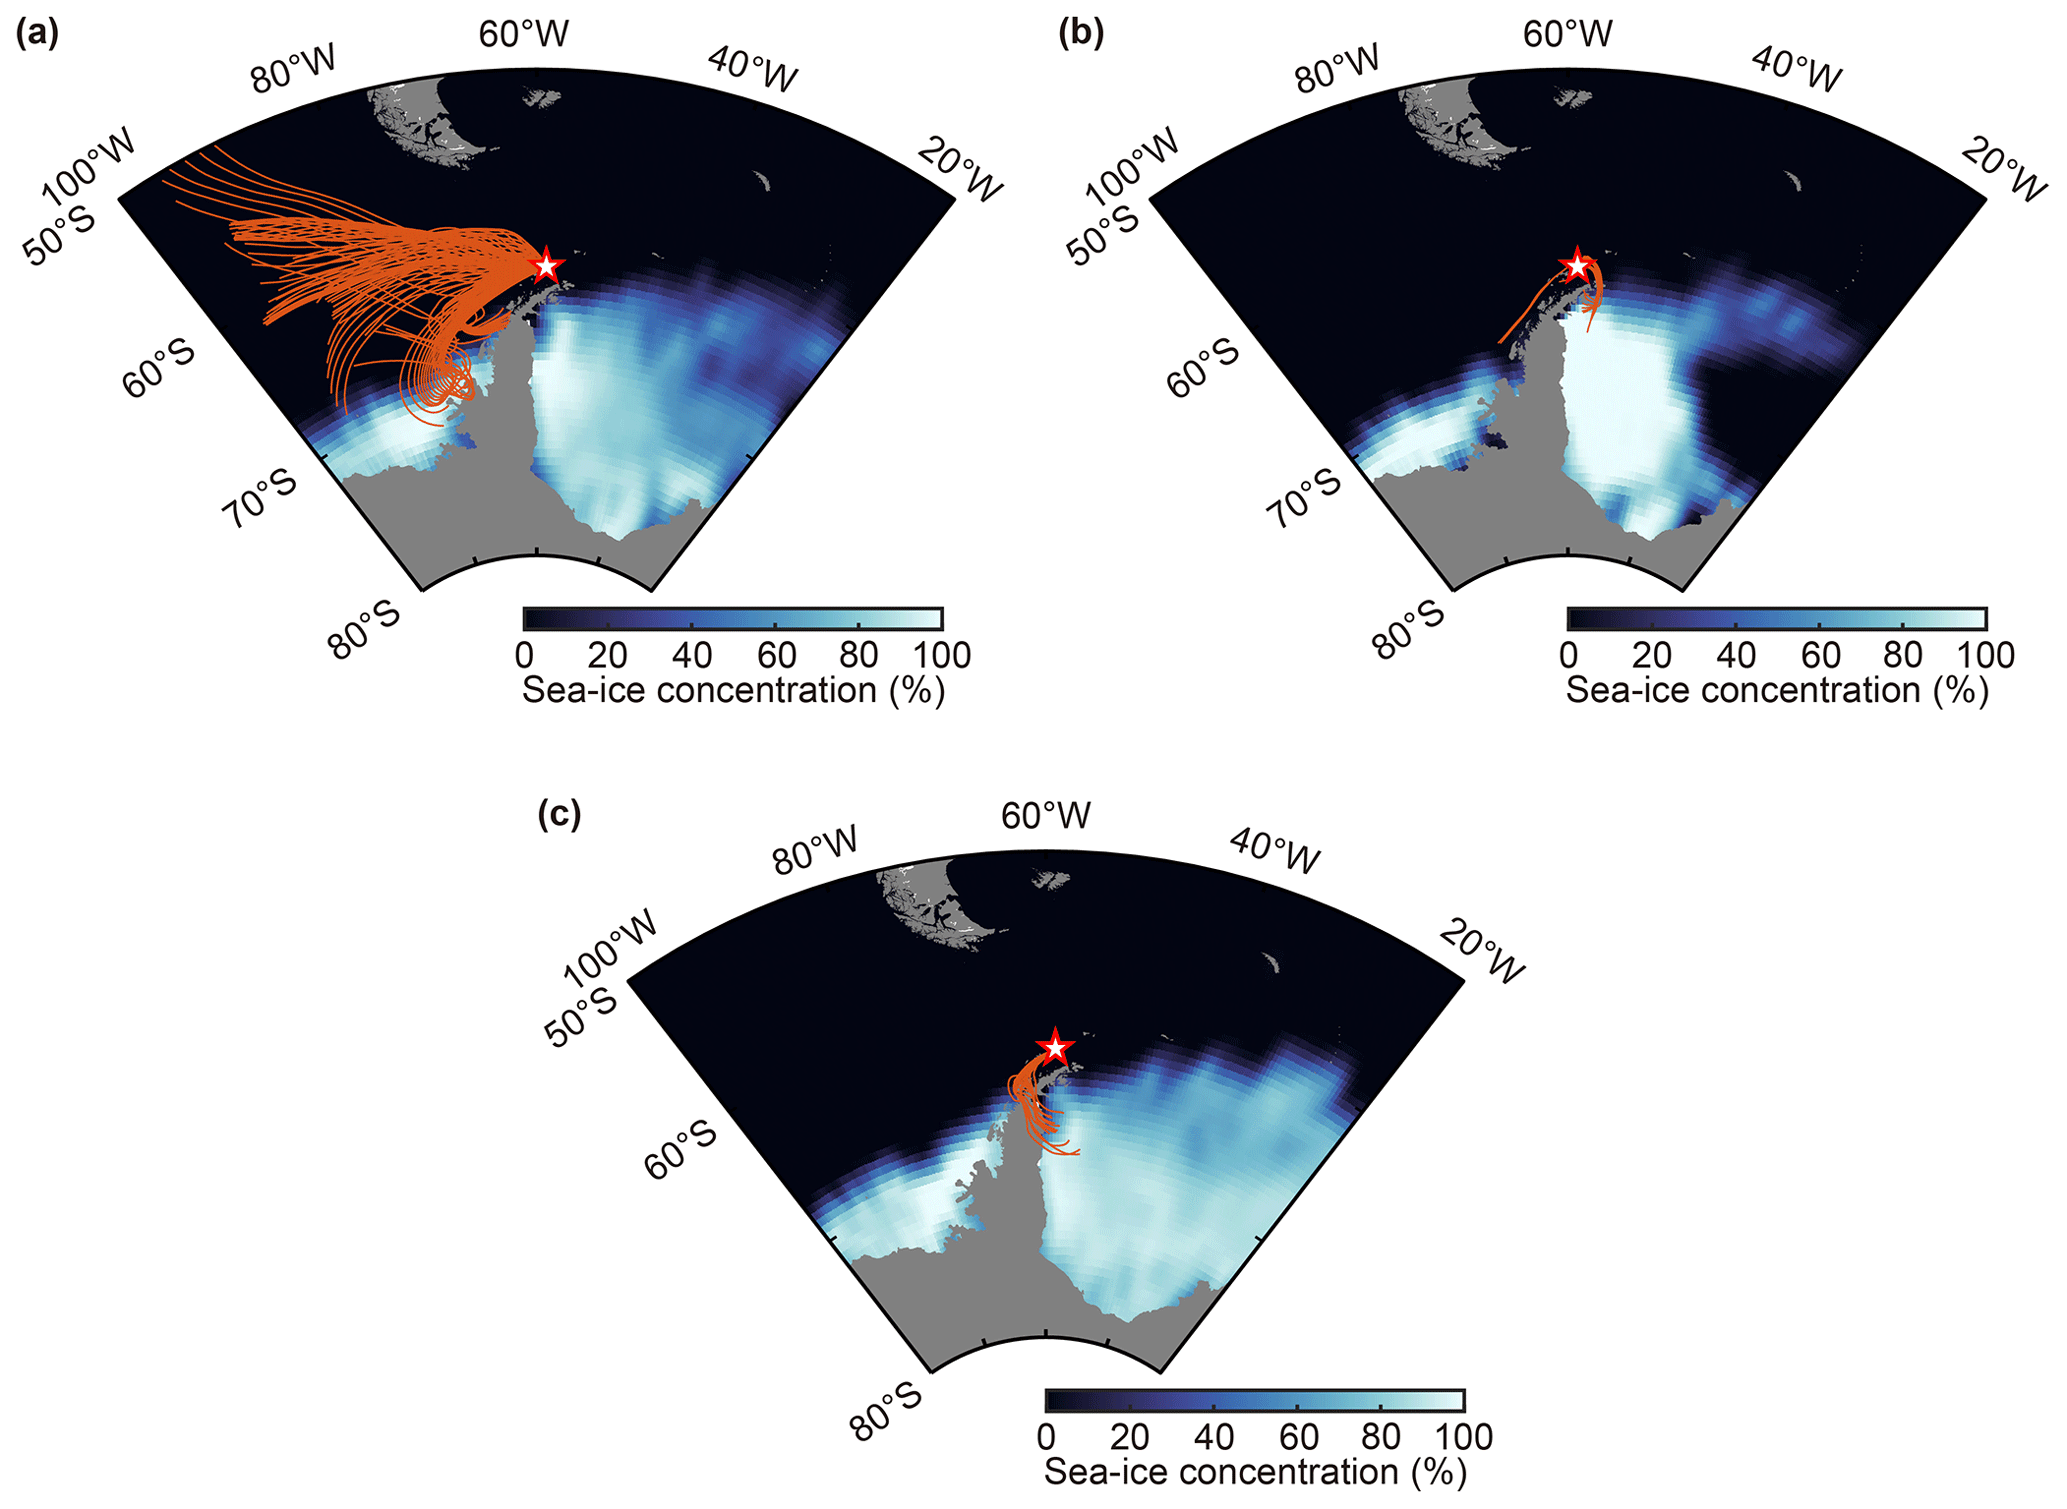
Figure 5Air mass back trajectories for arrival at 50 m for the three case study NPF events: (a) marine, (b) sea ice, and (c) multiple.
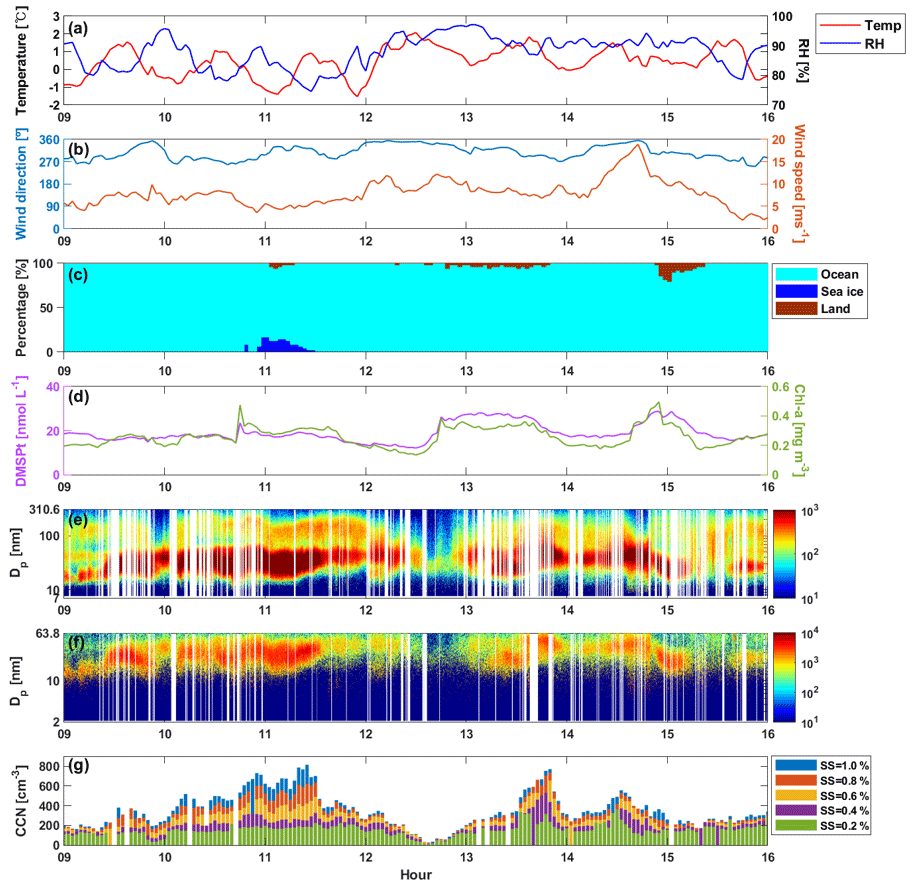
Figure 6Marine NPF event observed from 9–15 December 2018: (a–b) meteorological variables; (c) the residence time of air masses that passed over the ocean, sea-ice, and land areas; (d) total DMSP (DSMPt) and chlorophyll exposures; (e–f) number size distribution with the standard SMPS and nano-SMPS; and (g) CCN number concentration. The x axis represents local time.
Between 00:00 and 20:00 LST on 9 December, NNUC increased from 196 to 688 cm−3. At the same time, CCN concentrations at 0.4 % supersaturation gradually increased from 138 (00:00 LST on 9 December) to 326 cm−3 (12:00 LST on 11 December), an increase of 135 %. In addition, elevated NNUC occurred at 00:00 LST on 13 December, ranging from 118–522 cm−3. CCN number concentration at 0.4 % supersaturation began to increase at this time (95 cm−3) and reached its maximum at 18:00 LST (503 cm−3), with a concentration increase of 431 %.
3.2.2 Sea-ice NPF event
An NPF event with subsequent particle growth was detected from around 19:00 LST on 13 January 2018 to around 08:00 LST on 14 January 2018 (Fig. 7). Air temperature and RH during the event were 0.1 ∘C and 85 %, respectively, while solar radiation decreased from 131.7 to 0.2 W m−2. Winds were mild and stable (1.9–5.7 m s−1), with a prevailing northwesterly (262–350∘) direction and air masses predominantly coming from sea ice. The average retention times of the 2 d back trajectories traveling over ocean, sea ice, and land were 20.0, 20.9, and 7.1 h, respectively, indicating sea-ice-influenced air masses (Fig. 5b). During the NPF event, both total DMSP and chlorophyll exposure values are stable, with median exposures of 13.3 nmol L−1 and 0.2 mg m−3, respectively.
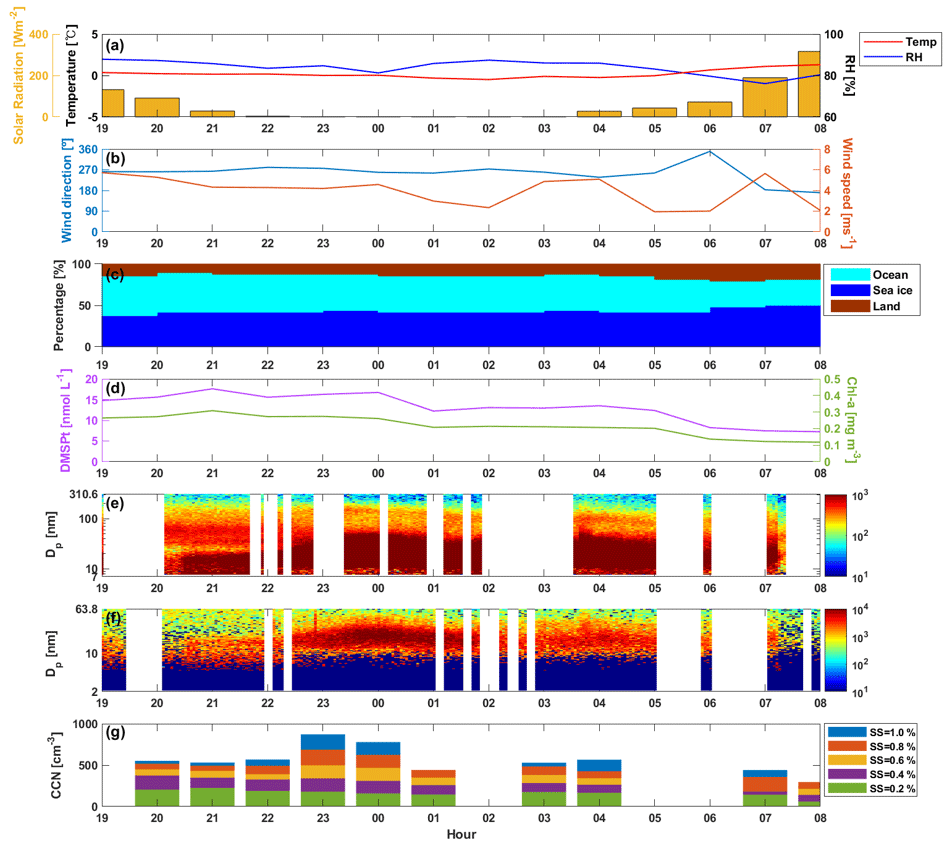
Figure 7Sea-ice NPF event observed from 13–14 January 2018: (a–b) meteorological variables; (c) the residence time of air masses that passed over the ocean, sea-ice, and land areas; (d) total DMSP and chlorophyll exposures; (e–f) number size distribution with the standard SMPS and nano-SMPS; and (g) CCN number concentration. The x axis represents local time.
During the event, CN2.5 and CN10 increased to 5669 and 5097 cm−3, respectively. Furthermore, the median NNUC, NAIT, and NACC values were 508, 376, and 66 cm−3, respectively. Elevated CCN concentrations at 0.2 % and 0.4 % supersaturations were not observed, whereas CCN concentrations at 0.6 %, 0.8 %, and 1.0 % supersaturations slightly increased during the event. For instance, CCN concentration at 0.8 % supersaturation was 517 cm−3 at 20:00 LST on 13 January and then increased to 688 cm−3 until 23:00 LST on 13 January. The CCN concentration at 0.6 %, 0.8 %, and 1.0 % supersaturations increased by 11 %, 33 %, and 58 %, respectively.
3.2.3 Multiple NPF event
An intensive NPF event occurred from 16 to 17 November 2018 (Fig. 8). Air temperature during the event ranged from −2.5 to −0.1 ∘C (median −1.3 ∘C). RH ranged from 70 %–95 % (median 79 %), slightly lower than that for the marine and sea-ice NPF events described above. During the NPF event observed from 20:00 LST on 16 November to 02:00 LST on 17 November, solar radiation decreased from 30 to 0 W m−2. This suggests that the actual formation and growth occurred during daylight hours upwind of the measurement location, but very slow growth continued over the Antarctic Peninsula, allowing the detection of an observed grown mode at ∼ 7 nm after the sunset. Wind speed ranged from 4.3–9.5 m s−1 with a constant direction from the southwest (median 239∘). Air mass back trajectories showed multiple origins before reaching the station, passing over ocean (25.7 h, 53 % of residence time), sea ice (12.4 h, 26 % of residence time), and land (10.0 h, 21 % of residence time) (Fig. 5c). During the event, the median total DMSP and chlorophyll exposures at the sea surface were 6.0 nmol L−1 and 0.2 mg m−3, respectively.
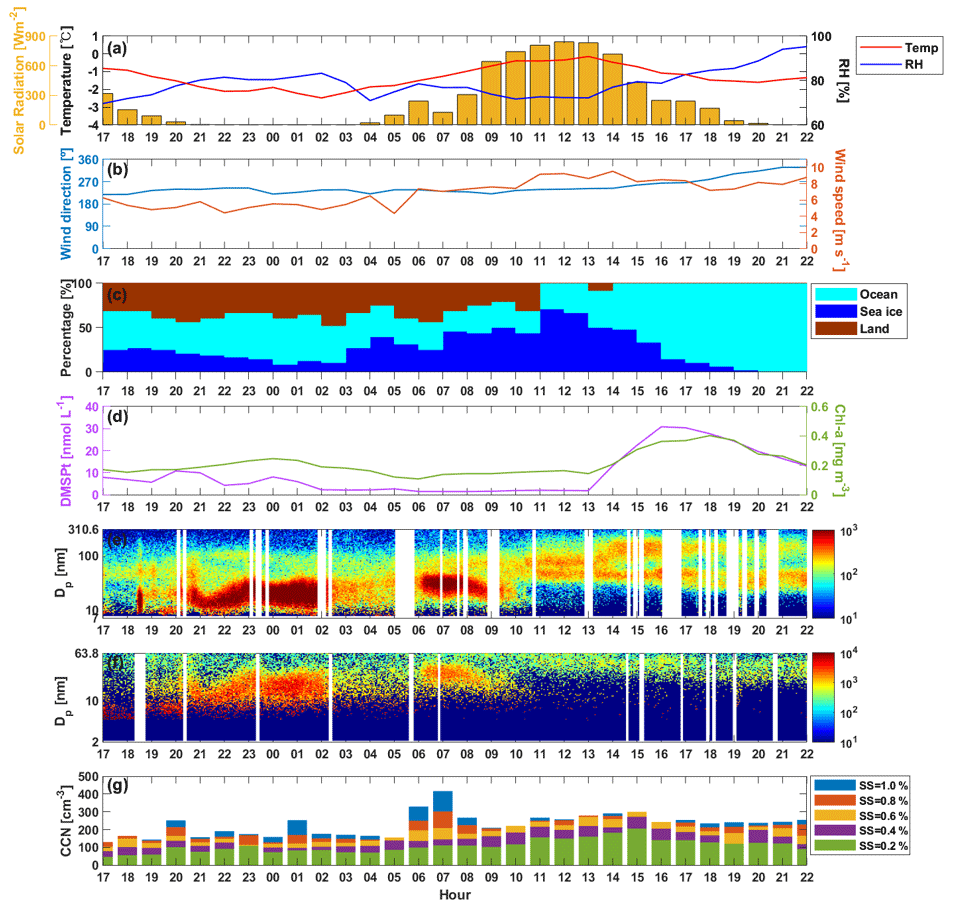
Figure 8Multiple NPF event observed from 16–17 November 2018: (a–b) meteorological variables; (c) the residence time of air masses that passed over the ocean, sea-ice, and land areas; (d) total DMSP and chlorophyll exposures; (e–f) number size distribution with the standard SMPS and nano-SMPS; and (g) CCN number concentration. The x axis represents local time.
At the start of the event (17:00 LST on 16 November), NNUC, NAIT, and NACC were 687, 83, and 13 cm−3, respectively. The particle number concentration of the nucleation mode sharply increased to 1610 cm−3 at the NPF time, and its peak concentration occurred 7 h after the start of the event (00:00 LST on 17 November), indicating the spatial extent of the formation region. The peak concentration of Aitken-mode particles and accumulation-mode particles successively appeared 14 h (07:00 LST on 17 November) and 22 h (15:00 LST on 17 November), respectively, after the start of the event. The values in the Aitken- and accumulation-mode ranges were 448 and 92 cm−3, respectively. We also observed a gradual increase in CCN concentration for 23 h. CCN concentration at 0.4 % supersaturation increased from 78 (17:00 LST on 16 November) to 272 cm−3 (15:00 LST on 17 November). This NPF event may have been a source of CCN, which enhanced CCN concentrations by 248 %.
3.3 Influence of air mass origin on the NPF event
3.3.1 Parameters related to NPF
Our results show that NPF and its growth events had largely different features depending on air mass origin (Fig. S6). Although only three cases of multi-regional NPF events occurred during the pristine and clean periods (not included in Fig. 9), the most intense NPF event was observed with the multi-regional source region. Here, we compared NNUC, the FR, the GR, and CS, for the ocean and sea-ice air masses (Fig. 9a–d). The FR, GR, and CS values agreed well with those reported in previous studies at other Antarctic sites (Järvinen et al., 2013; Kim et al., 2019; Kyrö et al., 2013; Weller et al., 2015) but were significantly lower than the values reported by Quéléver et al. (2022), who showed the average FR and GR were 0.686 cm−3 s−1 and 4.2 nm h−1, respectively. The median NNUC and FR values for the ocean air mass (NNUC: 220 cm−3; FR: 1.2 × 10⁻² cm−3 s−1) were 1.6 and 3.0 times lower than those of the sea-ice air mass (NNUC: 343 cm−3; FR: 3.6 × 10⁻² cm−3 s−1), respectively. This implies that marine NPF events are frequent but weak in terms of NNUC and FR values. Unlike NNUC and the FR, there were no marked differences between the median values of the GR and CS by air mass category. The median particle GR values for ocean, sea-ice, and multiple air masses were 0.8, 0.7, and 0.9 nm h−1, respectively. In comparison, Jokinen et al. (2018) reported that GR values ranged from 0.3 to 1.3 nm h−1 at Aboa, and Brean et al. (2021) showed a GR of 0.4 to 0.6 nm h−1 measured during the PI-ICE cruise. To examine the effects of oceanic biological activity on NPF properties, we examined solar radiation intensity, chlorophyll exposure, and DMSP exposure for the two air mass (or source region) categories (Fig. 9e–g). There was no difference in the median value for solar radiation, while the median values for chlorophyll exposure and DMSP exposure were higher in air masses originating from the ocean than in air masses originating from the sea ice. The median chlorophyll exposure in ocean-influenced air masses (0.2 mg m−3) was roughly twice that of the sea-ice-influenced air mass (0.1 mg m−3). Total DMSP exposure for the ocean-influenced air mass was ∼ 2.7 times that of the sea-ice air mass.
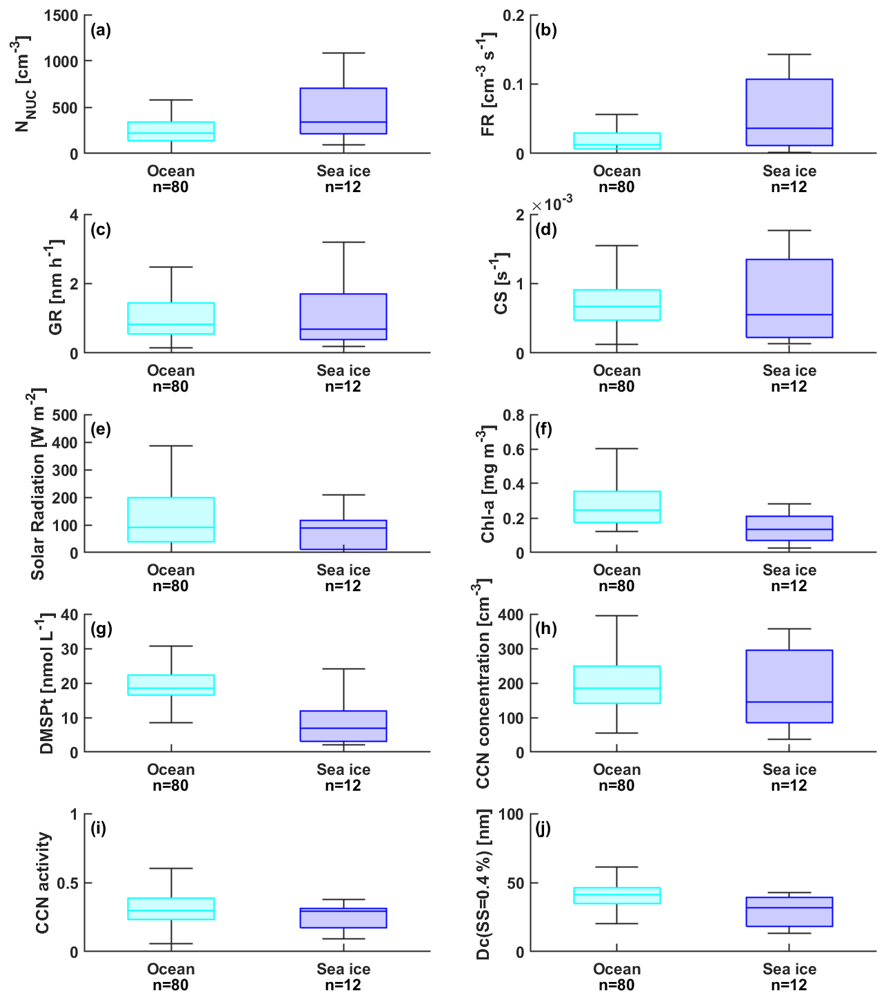
Figure 9Box plots for the (a) number concentration of nucleation-mode particles (NNUC), (b) formation rate (FR), (c) growth rate (GR), (d) condensation sink (CS), (e) solar radiation, (f) chlorophyll exposure, (g) DMSP exposure, (h) CCN number concentration, (i) CCN activity, and (j) critical diameter (Dc) for ocean, sea-ice, and multiple air masses. Upper/lower box limits and solid lines indicate the 75th/25th percentiles and median, respectively.
3.3.2 Potential sources facilitating new particle formation
The chlorophyll exposure and DMSP exposure during marine NPF events were higher than those during sea-ice NPF events, suggesting a large chance to carry biologically derived organic compounds from the open-ocean areas to the observation site. DMSP, a metabolite of oceanic phytoplankton, is partly converted into gaseous DMS through enzymatic cleavage (Simó, 2001), which is the largest natural sulfur source in the atmosphere (Barnes et al., 2006). Hence, the photooxidation products of biogenic DMS in the Antarctic atmosphere (e.g., sulfuric acid and methane sulfonic acid) could be a major contributor to NPF and its growth when the air mass originates from the ocean. Jang et al. (2019) reported that NPF events were more frequent in air masses originating from the Bellingshausen Sea than the Weddell Sea during the biologically productive austral summer, and it is likely that the taxonomic composition of phytoplankton can be related to the formation of new particles in the Antarctic Ocean. Biogenic DMS was found to be a precursor of NPF in coastal Antarctica (Yu and Luo, 2010).
The air mass exposures to chlorophyll and DMSP for sea-ice NPF events were 1.8 and 2.7 times lower than those of marine NPF events. This could be explained by volatile iodine compounds released from ice-covered areas in Antarctica (Jokinen et al., 2018; Saiz-Lopez et al., 2007; Sipilä et al., 2016); however, iodine compounds were not measured during our study period. Previously, iodine compounds were found in large concentrations in and above the sea ice of the Weddell Sea in Antarctica during spring and summer (Atkinson et al., 2012). Roscoe et al. (2015) also confirmed that iodine compounds may contribute to the secondary production of a significant number of particles measured at Halley and Neumayer on the Antarctic coast.
In our study, sea-ice NPF events occurred frequently in January (middle of austral summer) and September (early austral spring) (Fig. 4). We compared the FR, GR, and CS values for the sea-ice NPF cases observed between January and September (Fig. S7) because of their notable differences in ice coverage. In Antarctica, the minimum ice coverage is observed in February and the maximum in September (Parkinson and Cavalieri, 2012). Our results showed that FR, GR, and CS values were much higher in January than in September, indicating different NPF processes. The January events occurred under low-ice-coverage conditions, similarly to previous studies from polar areas such as Svalbard (Dall'Osto et al., 2017b) and Greenland (Dall'Osto et al., 2018). Both of these studies showed that NPF events are related to biogenic precursors released by open water and melting sea-ice regions, particularly during the summer. In contrast, the September events occurred under high-ice-coverage conditions. The monthly median values of solar radiation showed that solar radiation intensity was very low from May to August and then started to increase from September (Table 1). During the September events, median solar radiation intensity was found to be 63 W m−2. It is therefore possible that elevated sea-ice concentrations under sufficient solar radiation around Antarctica lead to an increase in the concentration of halogen species, resulting in the production of newly formed particles.
The most intensive NPF event was observed in multiple air masses, although the oceanic biological activity was lower than that in the oceanic air mass. This indicated that terrestrial sources from continental Antarctica, in addition to both DMS (mainly from the ocean) and iodine (mainly from sea ice), may have contributed to NPF. First, previous studies have reported that precursors emitted from seabird colonies are linked to NPF (Schmale et al., 2013; Weber et al., 1998). The Chottaebawi area in the southwestern part of King George Island (around 2 km away from our observation site) is an important penguin colony in the Antarctic region (Lee et al., 2009), while the cape area near King Sejong Station is abundantly populated by flying seabirds such as skua. Given the proximity and abundance of seabird colonies at King Sejong Station, seabird-colony emissions are the likely sources of precursor gases to NPF (e.g., ammonia and amine) (Quéléver et al., 2022). In fact, two NPF events (4 February 2018 for marine air mass origin and 18 February 2018 for multiple air mass origin) were observed when winds were seen to originate from the southern sector where there was strong emission from the penguin colonies (southeast sector of 106–140∘). Figure S8 shows the contour plots of the size distributions and wind roses during those days. Although we did not directly measure the precursor gases such as ammonia and amine that can trigger the NPF, we can speculate that the fauna on the land or at the shore such as penguin and seabird colonies could not be excluded as the potential source of NPF events locally although high productivity and ice melting in the Weddell Sea coincide with the southeast direction too. Previous studies reported that precursor gases for NPF (e.g., ammonia) can originate from the decomposition of excreta from seabirds and penguins (Lachlan-Cope et al., 2020; Legrand et al., 1998; Liu et al., 2018; Schmale et al., 2013). More recently, Quéléver et al. (2022) proposed that nitrogen-containing species could be land-sourced (e.g., from a high penguin population during the summertime) or marine-sourced (e.g., from the biological activity of plankton in the ocean and melting sea ice). The ammonia from seabird-colony guano is a key factor contributing to bursts of newly formed particles, which are observed in the summertime Arctic (Croft et al., 2016). Second, biogenic emissions from vegetation on the Antarctic Peninsula, mainly composed of relatively small and sparse patches of lichens and mosses (Miranda et al., 2020), could be associated with NPF and growth. Kim et al. (2007) studied plant communities on the Barton Peninsula around King Sejong Station in the maritime Antarctic and concluded that ∼ 47 % of the investigated area was covered by vegetation although it was generally sparse. Finally, biogenic precursors from meltwater ponds in continental Antarctica have also been suggested (Kyrö et al., 2013) as a possible source of aerosol production (Weller et al., 2018). Overall, our data suggest that complex interconnected ecosystems across ocean, sea ice, and land can lead to an enhancement in Antarctic NPF.
3.3.3 NPF as a source of CCN
For a given supersaturation (SS) of 0.4 %, the median CCN number concentrations were rather similar: 184, 144, and 178 cm−3 for ocean, sea-ice, and multiple air masses, respectively (Fig. 9h). The values are in line with previous studies published from the Antarctic regions. Humphries et al. (2023) reported CCN concentrations near East Antarctic observations from Macquarie Island and Kennaook / Cape Grim as well as recent ship voyages of the RSV Aurora Australis and the RV Investigator in the region. The median CCN value at an SS of 0.5 % was in the ranges of 88–145 cm−3 at Macquarie Island, 57–158 cm−3 at Kennaook / Cape Grim, and 40–230 cm−3 during the voyages (no voyage data exist for the winter months). In the PCAN project, a median particle number concentration larger than 3 nm of 354 cm−3 was observed from the voyage and median CCN at 0.55 % supersaturation were 167 cm−3, implying approximately half the particles measured as CN3 could be activated as CCN (Simmons et al., 2021). Recently, several ship-based measurements over the Southern Ocean found significantly increased methanesulfonic acid (MSA) concentrations in air masses originating close to the Antarctic coastline, alongside enhancements in CCN concentration (Humphries et al., 2021). Of the 83 NPF events, CCN concentrations increased by 2 %–268 % (median 44 %) in the following 1 to 36 h (median 8 h) after NPF events. The median increase in CCN concentrations was 44 %, 34 %, and 107 % for ocean, sea-ice, and multiple air masses, respectively. NPF can be an important source of CCN in Antarctica, and the highest CCN enhancement was observed when air masses passed through multiple regions, followed by ocean and sea-ice regions. Our results provide the first direct evidence of CCN production resulting from an NPF event in the Antarctic atmosphere, based on simultaneous measurements of particle number size distribution (e.g., diameter ranges of 2.5–300 nm) and CCN number concentrations in real time throughout the year.
We also compared CCN activity and critical diameter for the three selected periods (Fig. 9i and j). The median values of CCN activity, i.e., the ratio of the number concentration of particles that were activated and became CCN at a given supersaturation to the total number concentration or particles larger than 10 nm (CN10), were similar (about 5 %) in three different air masses. The critical diameter (Dc), the diameter at which the integration of aerosol size distribution from the largest particle diameter to the lowest one matches the measured CCN concentration, was determined using the measured aerosol size distribution, CN10, and CCN concentrations (Furutani et al., 2018). The median Dc value at 0.4 % supersaturation was estimated to be 41, 32, and 37 nm for ocean, sea-ice, and multiple air masses, respectively. These results agreed well with those reported in previous studies that determined Dc at the Finnish Antarctic research station, Aboa (Kyrö et al., 2013), a clean subarctic background site (Komppula et al., 2005), and over the remote Southern Ocean around Antarctica (Fossum et al., 2018, 2020). For instance, Kyrö et al. (2013) found the smallest Dc at 48 nm. The median Dc, as suggested by Komppula et al. (2005), varied from 50–128 nm (average 80 nm). The Dc values for maritime polar and marine modified continental Antarctic air masses were 71 and 59 nm, respectively (Fossum et al., 2020).
A time series of daily mean CCN concentrations at five different supersaturation ratios of 0.2, 0.4, 0.6, 0.8, and 1 is illustrated in Fig. S10. To understand the contribution of growing particles to the CCN concentrations during NPF events, we determined the increase in CCN concentration during growth periods (i.e., growth to smaller than 40 nm particles and growth to larger than 40 nm particles) compared to baseline values under different supersaturation conditions (Fig. 10), according to the method suggested by Chang et al. (2022). When particle growth was smaller than to 40 nm (growth ≤ 40 nm), the mean CCN concentrations increased by 59–178 cm−3 for an SS of 0.2 %–1.0 %, representing a 172 %–217 % increase compared to the values during baseline conditions. When particle growth was larger than to 40 nm (growth > 40 nm), the mean CCN concentrations increased by 57–227 cm−3 for an SS of 0.2 %–1.0 %, representing a 170 %–249 % increase compared to baseline values. Our results indicate that particles formed from NPF events can lead to the significantly enhanced CCN concentration in the Antarctic Peninsula, and this effect is more pronounced if we consider particle growth larger than 40 nm, consistent with ship-based observations (Chang et al., 2022) and aircraft-based observation (Willis et al., 2016) in the Canadian Arctic during summer.
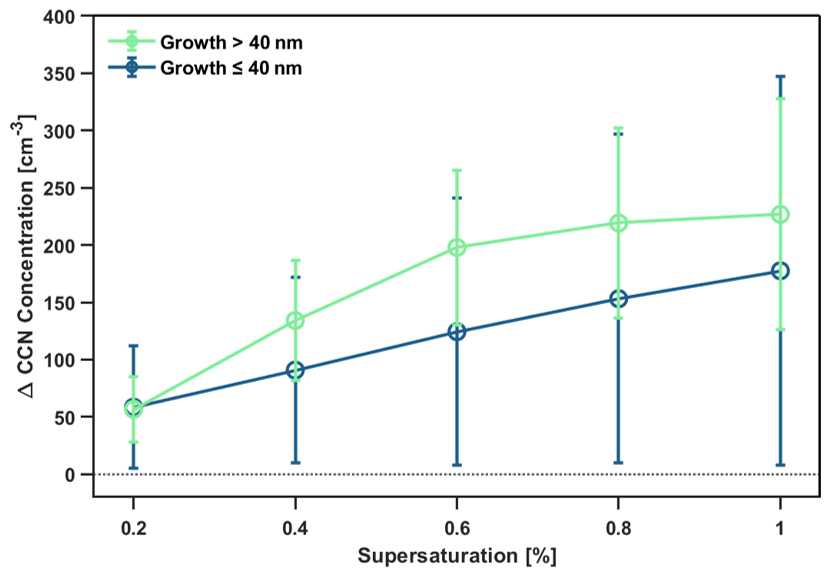
Figure 10The increase in CCN concentration during times of growth to particles larger than 40 nm (green) and smaller than 40 nm (blue) compared with background times at five different supersaturations.
We measured the number size distribution of 2.5–300 nm particles and CCN number concentrations at King Sejong Station on the Antarctic Peninsula continuously from 1 January to 31 December 2018. The annual median values of NNUC, NAIT, and NACC were 46.8, 53.5, and 21.7 cm−3, respectively. Overall, clear annual and seasonal patterns of particle number concentrations in all size classes were observed (high concentrations in summer and low concentrations in winter). Furthermore, the monthly CN10 value was positively correlated with the monthly NNUC, implying that summer maximum particle concentrations could be largely influenced by newly formed particles in the Antarctic atmosphere. Among meteorological parameters, the elevated NNUC values (i.e., indicators of NPF events) were more likely to be accompanied by high solar radiation, high temperature, and low RH, regardless of wind speed.
NPF events were identified based on size distribution data measured using two SMPSs. During the pristine and clean periods, 97 events (26 % of observation days) with elevated NNUC were observed. NPF events occurred more frequently in summer than in any other season. Based on air mass back-trajectory analysis, we distinguished three different types of NPF events: marine (80 cases), sea ice (12 cases), and multiple (3 cases). Marine NPF events were frequent and weak (NNUC, 220 cm−3; FR = 1.2 × 10⁻² cm−3 s−1; GR = 0.8 nm h−1) and occurred when the air mass exposure to oceanic phytoplankton was high (chlorophyll, 0.2 mg m−3; DMSP, 18 nmol L−1). The photooxidation of biogenic DMS in the Antarctic atmosphere could be a major contributor to marine NPF events. In contrast, sea-ice NPF events (NNUC, 343 cm−3; FR, 3.6 × 10⁻² cm−3 s−1; GR, 0.7 nm h−1) were observed when the air mass exposure to oceanic phytoplankton was relatively low (chlorophyll, 0.1 mg m−3; DMSP, 7 nmol L−1), which may be due to volatile iodine compounds released from ice-covered areas. Strong NPF events (NNUC, 516 cm−3; FR, 3.2 × 10⁻² cm−3 s−1; GR, 0.9 nm h−1) were associated with multiple air masses, indicating complex interconnected ecosystems that lead to an enhancement in Antarctic NPF.
To investigate the connection between newly formed particles and CCN production, we compared CCN properties for the three air mass categories. The median CCN number concentrations at a given SS of 0.4 % were 184, 144, and 178 cm−3 for ocean, sea-ice, and multiple air masses, respectively. Of the 83 events, an increase in CCN concentrations after the NPF events was detected, ranging from 2 %–268 % (median 44 %). The median increase in CCN concentrations was 44 %, 34 %, and 107 % for ocean, sea-ice, and multiple air masses, respectively. NPF events led to increased CCN concentrations at King Sejong Station. The median value of Dc at a supersaturation of 0.4 % was estimated to be 41, 32, and 37 nm for ocean, sea-ice, and multiple air masses, respectively. This study is the first to report CCN production resulting from Antarctic NPF events on the Antarctic Peninsula. However, further detailed measurements of the chemical properties of aerosol particles and precursor gases (e.g., ammonia) during NPF events are required to better understand the contribution of these compounds to the formation and growth of aerosol particles and to explore their impacts on CCN formation in the remote Antarctic environment.
The data analyzed in this publication will be readily provided upon request to the corresponding author (yjyoon@kopri.re.kr).
The supplement related to this article is available online at: https://doi.org/10.5194/acp-23-13625-2023-supplement.
JP and YJY designed the study. JP, HK, YG, EJ, KTP, SP, and YJY analyzed data. JP wrote the manuscript. CHJ, DC, and CO'D all commented on and discussed the manuscript.
The contact author has declared that none of the authors has any competing interests.
Publisher’s note: Copernicus Publications remains neutral with regard to jurisdictional claims made in the text, published maps, institutional affiliations, or any other geographical representation in this paper. While Copernicus Publications makes every effort to include appropriate place names, the final responsibility lies with the authors.
We would like to thank the many technicians and scientists of the overwintering crews. This work was supported by the KOPRI project (PE23030).
This research has been supported by the KOPRI project (grant no. PE23030).
This paper was edited by Tuukka Petäjä and reviewed by two anonymous referees.
Asmi, E., Frey, A., Virkkula, A., Ehn, M., Manninen, H. E., Timonen, H., Tolonen-Kivimäki, O., Aurela, M., Hillamo, R., and Kulmala, M.: Hygroscopicity and chemical composition of Antarctic sub-micrometre aerosol particles and observations of new particle formation, Atmos. Chem. Phys., 10, 4253–4271, https://doi.org/10.5194/acp-10-4253-2010, 2010.
Asmi, E., Neitola, K., Teinila, K., Rodriguez, E., Virkkula, A., Backman, J., Bloss, M., Jokela, J., Lihavainen, H., De Leeuw, G., Paatero, J., Aaltonen, V., Mei, M., Gambarte, G., Copes, G., Albertini, M., Fogwill, G. P., Ferrara, J., Barlasina, M. E., and Sanchez, R.: Primary sources control the variability of aerosol optical properties in the Antarctic Peninsula, Tellus B, 70, 1–16, 2018.
Atkinson, H. M., Huang, R.-J., Chance, R., Roscoe, H. K., Hughes, C., Davison, B., Schönhardt, A., Mahajan, A. S., Saiz-Lopez, A., Hoffmann, T., and Liss, P. S.: Iodine emissions from the sea ice of the Weddell Sea, Atmos. Chem. Phys., 12, 11229–11244, https://doi.org/10.5194/acp-12-11229-2012, 2012.
Barnes, I., Hjorth, J., and Mihalopoulos, N.: Dimethyl sulfide and dimethyl sulfoxide and their oxidation in the atmosphere, Chem. Rev., 106, 940–975, 2006.
Belosi, F., Contini, D., Donateo, A., Santachiara, G., and Prodi, F.: Aerosol size distribution at Nansen Ice Sheet Antarctica, Atmos. Res., 107, 42–50, 2012.
Birmili, W., Berresheim, H., Plass-Dülmer, C., Elste, T., Gilge, S., Wiedensohler, A., and Uhrner, U.: The Hohenpeissenberg aerosol formation experiment (HAFEX): a long-term study including size-resolved aerosol, H2SO4, OH, and monoterpenes measurements, Atmos. Chem. Phys., 3, 361–376, https://doi.org/10.5194/acp-3-361-2003, 2003.
Brean, J., Dall'Osto, M., Simó, R., Shi, Z., Beddows, D. C. S., and Harrison, R. M.: Open ocean and coastal new particle formation from sulfuric acid and amines around the Antarctic Peninsula, Nat. Geosci., 14, 383–388, https://doi.org/10.1038/s41561-021-00751-y, 2021.
Carslaw, K. S., Lee, L. A., Reddington, C. L., Pringle, K. J., Rap, A., Forster, P. M., Mann, G. W., Spracklen, D. V., Woodhouse, M. T., Regayre, L. A., and Pierce, J. R.: Large contribution of natural aerosols to uncertainty in indirect forcing, Nature, 503, 67–71, https://doi.org/10.1038/nature12674, 2013.
Chang, R. Y.-W., Abbatt, J. P. D., Boyer, M. C., Chaubey, J. P., and Collins, D. B.: Characterizing the hygroscopicity of growing particles in the Canadian Arctic summer, Atmos. Chem. Phys., 22, 8059–8071, https://doi.org/10.5194/acp-22-8059-2022, 2022.
Chen, D. R., Pui, D. Y. H., Hummes, D., Fissan, H., Quant, F. R., and Sem, G. J.: Design and evaluation of a nanometer aerosol differential mobility analyzer (Nano-DMA), J. Aerosol. Sci., 29, 497–509, https://doi.org/10.1016/S0021-8502(97)10018-0, 1998.
Chen, J. L., Wilson, C. R., Blankenship, D., and Tapley, B. D.: Accelerated Antarctic ice loss from satellite gravity measurements, Nat. Geosci., 2, 859–862, 2009.
Collins, D. B., Burkart, J., Chang, R. Y.-W., Lizotte, M., Boivin-Rioux, A., Blais, M., Mungall, E. L., Boyer, M., Irish, V. E., Massé, G., Kunkel, D., Tremblay, J.-É., Papakyriakou, T., Bertram, A. K., Bozem, H., Gosselin, M., Levasseur, M., and Abbatt, J. P. D.: Frequent ultrafine particle formation and growth in Canadian Arctic marine and coastal environments, Atmos. Chem. Phys., 17, 13119–13138, https://doi.org/10.5194/acp-17-13119-2017, 2017.
Croft, B., Wentworth, G. R., Martin, R. V., Leaitch, W. R., Murphy, J. G., Murphy, B. N., Kodros, J. K., Abbatt, J. P. D., and Pierce, J. R.: Contribution of Arctic seabird-colony ammonia to atmospheric particles and cloud-albedo radiative effect, Nat. Commun., 7, 13444, https://doi.org/10.1038/ncomms13444, 2016.
Crippa, P. and Pryor, S. C.: Spatial and temporal scales of new particle formation events in eastern North America, Atmos. Environ., 75, 257–264, https://doi.org/10.1016/j.atmosenv.2013.04.051, 2013
Dada, L., Paasonen, P., Nieminen, T., Buenrostro Mazon, S., Kontkanen, J., Peräkylä, O., Lehtipalo, K., Hussein, T., Petäjä, T., Kerminen, V.-M., Bäck, J., and Kulmala, M.: Long-term analysis of clear-sky new particle formation events and nonevents in Hyytiälä, Atmos. Chem. Phys., 17, 6227–6241, https://doi.org/10.5194/acp-17-6227-2017, 2017.
Dall'Osto, M., Ovadnevaite, J., Paglione, M., Beddows, D. C. S., Ceburnis, D., Cree, C., Cortes, P., Zamanillo, M., Nunes, S. O., Perez, G. L., Ortega-Retuerta, E., Emelianov, M., Vaque, D., Marrase, C., Estrada, M., Sala, M. M., Vidal, M., Fitzsimons, M. F., Beale, R., Airs, R., Rinaldi, M., Decesari, S., Facchini, M. C., Harrison, R. M., O'Dowd, C., and Simo, R.: Antarctic sea ice region as a source of biogenic organic nitrogen in aerosols, Sci. Rep., 7, 6047, https://doi.org/10.1038/s41598-017-06188-x, 2017a.
Dall'Osto, M., Beddows, D. C. S., Tunved, P., Krejci, R., Ström,J., Hansson, H.-C., Yoon, Y. J., Park, K.-T., Becagli, S., Udisti, R., Onasch, T., O'Dowd, C. D., Simó, R., and Harrison, R. M.: Arctic sea ice melt leads to atmospheric new particle formation, Sci. Rep., 7, 3318, https://doi.org/10.1038/s41598-017-03328-1, 2017b.
Dall'Osto, M., Geels, C., Beddows, D. C. S., Boertmann, D., Lange, R., Nøjgaard, J. K., Harrison Roy, M., Simo, R., Skov, H., and Massling, A.: Regions of open water and melting sea ice drive new particle formation in North East Greenland, Sci. Rep., 8, 6109, https://doi.org/10.1038/s41598-018-24426-8, 2018.
Dall'Osto, M., Sotomayor-Garcia, A., Cabrera-Brufau, M., Berdalet, E., Vaqué, D., Zeppenfeld, S., van Pinxteren, M., Herrmann, H., Wex, H., Rinaldi, M., Paglione, M., Beddows, D., Harrison, R., Avila, C., Martin-Martin, R. P., Park, J., and Barbosa, A.: Leaching material from Antarctic seaweeds and penguin guano affects cloud-relevant aerosol production, Sci. Total Environ., 831, 154772, https://doi.org/10.1016/j.scitotenv.2022.154772, 2022.
Dal Maso, M.: Condensation and coagulation sinks and formation of nucleation mode particles in coastal and boreal forest boundary layers, J. Geophys. Res., 107, 8097, https://doi.org/10.1029/2001jd001053, 2002.
Dal Maso, M., Kulmala, M., Riipinen, I., Wagner, R., Hussein T., Aalto, P. P., and Lehtinen, K. E. J.: Formation and growth of fresh atmospheric aerosols: eight years of aerosol size distribution data from SMEAR II, Hyytiälä, Finland, Boreal Environ. Res., 10, 323–336, 2005.
Decesari, S., Paglione, M., Rinaldi, M., Dall'Osto, M., Simó, R., Zanca, N., Volpi, F., Facchini, M. C., Hoffmann, T., Götz, S., Kampf, C. J., O'Dowd, C., Ceburnis, D., Ovadnevaite, J., and Tagliavini, E.: Shipborne measurements of Antarctic submicron organic aerosols: an NMR perspective linking multiple sources and bioregions, Atmos. Chem. Phys., 20, 4193–4207, https://doi.org/10.5194/acp-20-4193-2020, 2020.
Draxler, R. R. and Hess, G. D.: An overview of the HYSPLIT_4 modelling system for trajectories, Aust. Meteorol. Mag., 47, 295–308, 1998.
Fiebig, M., Hirdman, D., Lunder, C. R., Ogren, J. A., Solberg, S., Stohl, A., and Thompson, R. L.: Annual cycle of Antarctic baseline aerosol: controlled by photooxidation-limited aerosol formation, Atmos. Chem. Phys., 14, 3083–3093, https://doi.org/10.5194/acp-14-3083-2014, 2014.
Fiebig, M., Lunder. C. R., and Stohl, A.: Tracing biomass burning aerosol from South America to Troll Research Station, Antarctica, Geophys. Res. Lett., 36, L14815, https://doi.org/10.1029/2009GL038531, 2009.
Fossum, K. N., Ovadnevaite, J., Ceburnis, D., Dall'Osto, M., Marullo, S., Bellacicco, M., Simó, R., Liu, D., Flynn, M., Zuend, A., and O'Dowd, C.: Summertime primary and secondary contributions to Southern Ocean cloud condensation nuclei, Sci. Rep., 8, 13844, https://doi.org/10.1038/s41598-018-32047-4, 2018.
Fossum, K. N., Ovadnevaite, J., Ceburnis, D., Preißler, J., Snider, J. R., Huang, R.-J., Zuend, A., and O'Dowd, C.: Sea-spray regulates sulfate cloud droplet activation over oceans, NPJ Clim. Atmos. Sci., 3, 14, https://doi.org/10.1038/s41612-020-0116-2, 2020.
Furutani, H., Dall'osto, M., Roberts, G. C., and Prather, K. A.: Assessment of the relative importance of atmospheric aging on CCN activity derived from field observations, Atmos. Environ., 42, 3130–3142, 2008.
Galí, M., Devred, E., Levasseur, M., Royer, S.-J., and Babin, M.: A remote sensing algorithm for planktonic dimethylsulfoniopropionate (an analysis of global patterns, Remote Sens. Environ., 171, 171–184, https://doi.org/10.1016/j.rse.2015.10.012, 2015.
Giordano, M. R., Kalnajs, L. E., Avery, A., Goetz, J. D., Davis, S. M., and DeCarlo, P. F.: A missing source of aerosols in Antarctica – beyond long-range transport, phytoplankton, and photochemistry, Atmos. Chem. Phys., 17, 1–20, https://doi.org/10.5194/acp-17-1-2017, 2017.
Giordano, M. R., Kalnajs, L. E., Goetz, J. D., Avery, A. M., Katz, E., May, N. W., Leemon, A., Mattson, C., Pratt, K. A., and DeCarlo, P. F.: The importance of blowing snow to halogen-containing aerosol in coastal Antarctica: influence of source region versus wind speed, Atmos. Chem. Phys., 18, 16689–16711, https://doi.org/10.5194/acp-18-16689-2018, 2018.
Grigas, T., Ovadnevaite, J., Ceburnis, D., Moran, E., McGovern, F. M., Jennings, S. G., and O'Dowd, C.: Sophisticated clean air strategies required to mitigate against particulate organic pollution, Sci. Rep., 7, 44737, https://doi.org/10.1038/srep44737, 2017.
Hamed, A., Korhonen, H., Sihto, S.-L., Joutsensaari, J., Jarvinen, H., Petaja, T., Arnold, F., Nieminen, T., Kulmala, M., Smith, J. N., Lehtinen, K. E. J., and Laaksonen, A.: The role of relative humidity in continental new particle formation, J. Geophys. Res., 116, D03202, https://doi.org/10.1029/2010JD014186, 2011.
Hara, K., Osada, K., Nishita-Hara, C., and Yamanouchi, T.: Seasonal variations and vertical features of aerosol particles in the Antarctic troposphere, Atmos. Chem. Phys., 11, 5471–5484, https://doi.org/10.5194/acp-11-5471-2011, 2011.
Hara, K., Sudo, K., Ohnishi, T., Osada, K., Yabuki, M., Shiobara, M., and Yamanouchi, T.: Seasonal features and origins of carbonaceous aerosols at Syowa Station, coastal Antarctica, Atmos. Chem. Phys., 19, 7817–7837, https://doi.org/10.5194/acp-19-7817-2019, 2019.
Herenz, P., Wex, H., Mangold, A., Laffineur, Q., Gorodetskaya, I. V., Fleming, Z. L., Panagi, M., and Stratmann, F.: CCN measurements at the Princess Elisabeth Antarctica research station during three austral summers, Atmos. Chem. Phys., 19, 275–294, https://doi.org/10.5194/acp-19-275-2019, 2019.
Humphries, R. S., Schofield, R., Keywood, M. D., Ward, J., Pierce, J. R., Gionfriddo, C. M., Tate, M. T., Krabbenhoft, D. P., Galbally, I. E., Molloy, S. B., Klekociuk, A. R., Johnston, P. V., Kreher, K., Thomas, A. J., Robinson, A. D., Harris, N. R. P., Johnson, R., and Wilson, S. R.: Boundary layer new particle formation over East Antarctic sea ice – possible Hg-driven nucleation?, Atmos. Chem. Phys., 15, 13339–13364, https://doi.org/10.5194/acp-15-13339-2015, 2015.
Humphries, R. S., Klekociuk, A. R., Schofield, R., Keywood, M., Ward, J., and Wilson, S. R.: Unexpectedly high ultrafine aerosol concentrations above East Antarctic sea ice, Atmos. Chem. Phys., 16, 2185–2206, https://doi.org/10.5194/acp-16-2185-2016, 2016.
Humphries, R. S., Keywood, M. D., Gribben, S., McRobert, I. M., Ward, J. P., Selleck, P., Taylor, S., Harnwell, J., Flynn, C., Kulkarni, G. R., Mace, G. G., Protat, A., Alexander, S. P., and McFarquhar, G.: Southern Ocean latitudinal gradients of cloud condensation nuclei, Atmos. Chem. Phys., 21, 12757–12782, https://doi.org/10.5194/acp-21-12757-2021, 2021.
Humphries, R. S., Keywood, M. D., Ward, J. P., Harnwell, J., Alexander, S. P., Klekociuk, A. R., Hara, K., McRobert, I. M., Protat, A., Alroe, J., Cravigan, L. T., Miljevic, B., Ristovski, Z. D., Schofield, R., Wilson, S. R., Flynn, C. J., Kulkarni, G. R., Mace, G. G., McFarquhar, G. M., Chambers, S. D., Williams, A. G., and Griffiths, A. D.: Measurement report: Understanding the seasonal cycle of Southern Ocean aerosols, Atmos. Chem. Phys., 23, 3749–3777, https://doi.org/10.5194/acp-23-3749-2023, 2023.
IPCC: Climate change 2013: The physical science basis, Intergovernmental panel on Climate Change, Cambridge University Press, New York, USA, 571–740, https://www.ipcc.ch/report/ar5/wg1/ (last access: 19 October 2023), 2013.
Ito, T.: Size distribution of Antarctic submicron aerosols, Tellus B, 45, 145–159, 1993.
Jang, E., Park, K.-T., Yoon, Y. J., Kim, T.-W., Hong, S.-B., Becagli, S., Traversi, R., Kim, J., and Gim, Y.: New particle formation events observed at the King Sejong Station, Antarctic Peninsula – Part 2: Link with the oceanic biological activities, Atmos. Chem. Phys., 19, 7595–7608, https://doi.org/10.5194/acp-19-7595-2019, 2019.
Jang, E., Park, K.-T., Yoon, Y. J., Kim, K., Gim, Y., Chung, H. Y., Lee, K., Choi, J., Park, J., Park, S.-J., Koo, J.-H., Fernandez, R. P., and Saiz-Lopez, A.: First-year sea ice leads to an increase in dimethyl sulfide-induced particle formation in the Antarctic Peninsula, Sci. Total Environ., 803, 150002, https://doi.org/10.1016/j.scitotenv.2021.150002, 2022.
Jeong, C. H., Hopke, P. K., Chalupa, D., and Utell, M.: Characteristics of nucleation and growth events of ultrafine particles measured in Rochester, N.Y., Environ. Sci. Technol., 38, 1933–1940, 2004.
Jeong, C.-H., Evans, G. J., McGuire, M. L., Chang, R. Y.-W., Abbatt, J. P. D., Zeromskiene, K., Mozurkewich, M., Li, S.-M., and Leaitch, W. R.: Particle formation and growth at five rural and urban sites, Atmos. Chem. Phys., 10, 7979–7995, https://doi.org/10.5194/acp-10-7979-2010, 2010.
Järvinen, E., Virkkula, A., Nieminen, T., Aalto, P. P., Asmi, E., Lanconelli, C., Busetto, M., Lupi, A., Schioppo, R., Vitale, V., Mazzola, M., Petäjä, T., Kerminen, V.-M., and Kulmala, M.: Seasonal cycle and modal structure of particle number size distribution at Dome C, Antarctica, Atmos. Chem. Phys., 13, 7473–7487, https://doi.org/10.5194/acp-13-7473-2013, 2013.
Jokinen, T., Sipilä, M., Kontkanen, J., Vakkari, V., Tisler, P., Duplissy, E.-M., Junninen, H., Kangasluoma, J., Manninen, H. E., Petäjä, T., Kulmala, M., Worsnop, D. R., Kirkby, J., Virkkula, A., and Kerminen, V.-M.: Ion-induced sulfuric acid–ammonia nucleation drives particle formation in coastal Antarctica, Sci. Adv., 4, eaat9744, https://doi.org/10.1126/sciadv.aat9744, 2018.
Kerminen, V.-M., Chen, X., Vakkari, V., Petäjä, T., Kulmala, M., and Bianchi, F.: Atmospheric new particle formation and growth: review of field observations, Environ. Res. Lett., 13, 103003, https://doi.org/10.1088/1748-9326/aadf3c, 2018.
Kim, J., Yoon, Y. J., Gim, Y., Kang, H. J., Choi, J. H., Park, K.-T., and Lee, B. Y.: Seasonal variations in physical characteristics of aerosol particles at the King Sejong Station, Antarctic Peninsula, Atmos. Chem. Phys., 17, 12985–12999, https://doi.org/10.5194/acp-17-12985-2017, 2017.
Kim, J., Yoon, Y. J., Gim, Y., Choi, J. H., Kang, H. J., Park, K.-T., Park, J., and Lee, B. Y.: New particle formation events observed at King Sejong Station, Antarctic Peninsula – Part 1: Physical characteristics and contribution to cloud condensation nuclei, Atmos. Chem. Phys., 19, 7583–7594, https://doi.org/10.5194/acp-19-7583-2019, 2019.
Kim, J. H., Ahn, I.-Y., Lee, K. S., Chung, H., and Choi, H.-G.: Vegetation of Barton Peninsula in the neighbourhood of King Sejong Station (King George Island, maritime Antarctic), Polar Biol., 30, 903–916, https://doi.org/10.1007/s00300-006-0250-2, 2007.
Komppula, M., Lihavainen, H., Kerminen, V.-M., Kulmala, M., and Viisanen, Y.: Measurements of cloud droplet activation of aerosol particles at a clean subarctic background site, J. Geophys. Res., 110, D06204, https://doi.org/10.1029/2004JD005200, 2005.
Kulmala, M., Vehkamäki, H., Petäjä, T., Dal Maso, M., Lauri, A., Kerminen, V. M., Birmili, W., and McMurry, P. H.: Formation and growth rates of ultrafine atmospheric particles: a review of observations, J. Aerosol Sci., 35, 143–176, https://doi.org/10.1016/j.jaerosci.2003.10.003, 2004.
Kulmala, M., Petäjä, T., Nieminen, T., Sipilä, M., Manninen, H. E., Lehtipalo, K., Dal Maso, M., Aalto, P. P., Junninen, H., Paasonen, P., Riipinen, I., Lehtinen, K. E. J., Laaksonen, A., and Kerminen, V.-M.: Measurement of the nucleation of atmospheric aerosol particles, Nat. Protoc., 7, 1651–1667, 2012.
Kulmala, M., Kontkanen, J., Junninen, H., Lehtipalo, K., Manninen, H., Nieminen, T., Petaja, T., Sipila, M., Schobesberger, S., Rantala, P., Franchin, A., Jokinen, T., Jarvinen, E., Aijala, M., Kangasluoma, J., Hakala, J., Aalto, P., Paasonen, P., Mikkila, J., Vanhanen, J., Aalto, J., Hakola, H., Makkonen, U., Ruuskanen, T., Mauldin, R., Duplissy, J., Vehkamaki, H., Back, J., Kortelainen, A., Riipinen, I., Kurten, T., Johnston, M., Smith, J., Ehn, M., Mentel, T., Lehtinen, K., Laaksonen, A., Kerminen, V., and Worsnop, D.: Direct Observations of Atmospheric Aerosol Nucleation, Science, 339, 943–946, https://doi.org/10.1126/science.1227385, 2013
Kyrö, E.-M., Kerminen, V.-M., Virkkula, A., Dal Maso, M., Parshintsev, J., Ruíz-Jimenez, J., Forsström, L., Manninen, H. E., Riekkola, M.-L., Heinonen, P., and Kulmala, M.: Antarctic new particle formation from continental biogenic precursors, Atmos. Chem. Phys., 13, 3527–3546, https://doi.org/10.5194/acp-13-3527-2013, 2013.
Laaksonen, A., Kulmala, M., O'Dowd, C. D., Joutsensaari, J., Vaattovaara, P., Mikkonen, S., Lehtinen, K. E. J., Sogacheva, L., Dal Maso, M., Aalto, P., Petäjä, T., Sogachev, A., Yoon, Y. J., Lihavainen, H., Nilsson, D., Facchini, M. C., Cavalli, F., Fuzzi, S., Hoffmann, T., Arnold, F., Hanke, M., Sellegri, K., Umann, B., Junkermann, W., Coe, H., Allan, J. D., Alfarra, M. R., Worsnop, D. R., Riekkola, M.-L., Hyötyläinen, T., and Viisanen, Y.: The role of VOC oxidation products in continental new particle formation, Atmos. Chem. Phys., 8, 2657–2665, https://doi.org/10.5194/acp-8-2657-2008, 2008.
Lachlan-Cope, T., Beddows, D. C. S., Brough, N., Jones, A. E., Harrison, R. M., Lupi, A., Yoon, Y. J., Virkkula, A., and Dall'Osto, M.: On the annual variability of Antarctic aerosol size distributions at Halley Research Station, Atmos. Chem. Phys., 20, 4461–4476, https://doi.org/10.5194/acp-20-4461-2020, 2020.
Lange, B. A., Katlein, C., Castellani, G., Fernández-Méndez, M., Nicolaus, M., Peeken, I., and Flores, H.: Characterizing spatial variability of ice algal chlorophyll a and net primary production between sea ice habitats using horizontal profiling platforms, Front. Mar. Sci., 4, 349, https://doi.org/10.3389/fmars.2017.00349, 2017.
Lee, Y. I., Lim, H. S., and Yoon, H. I.: Carbon and nitrogen isotope composition of vegetation on King George Island, maritime Antarctic, Polar Biol., 32, 1607–1615, https://doi.org/10.1007/s00300-009-0659-5, 2009.
Lee, Y. J., Matrai, P. A., Friedrichs, M. A., Saba, V. S., Antoine, D., Ardyna, M., Asanuma, I., Babin, M., Bélanger, S., and Benoît-Gagné, M.: An assessment of phytoplankton primary productivity in the Arctic Ocean from satellite ocean color/in situ chlorophyll-a based models, J. Geophys. Res., 120, 6508–6541, https://doi.org/10.1002/2015JC011018, 2015.
Legrand, M., Ducroz, F., Wagenbach, D., Mulvaney, R., and Hall, J.: Ammonium in coastal Antarctic aerosol and snow: Role of polar ocean and penguin emissions, J. Geophys. Res., 103, 11043–11056, 1998.
Liu, J., Dedrick, J., Russell, L. M., Senum, G. I., Uin, J., Kuang, C., Springston, S. R., Leaitch, W. R., Aiken, A. C., and Lubin, D.: High summertime aerosol organic functional group concentrations from marine and seabird sources at Ross Island, Antarctica, during AWARE, Atmos. Chem. Phys., 18, 8571–8587, https://doi.org/10.5194/acp-18-8571-2018, 2018.
Miranda, V., Pina, P., Heleno, S., Vieira, G., Mora, C., and Schaefer, C. E.: Monitoring recent changes of vegetation in Fildes Peninsula (King George Island, Antarctica) through satellite imagery guided by UAV surveys, Sci. Total Environ., 704, 135295, https://doi.org/10.1016/j.scitotenv.2019.135295, 2020.
O'Dowd, C. D.: On the spatial extent and evolution of coastal aerosol plumes, J. Geophys. Res.-Atmos., 107, 8105, https://doi.org/10.1029/2001JD000422, 2002
O'Dowd, C. D, Lowe, J. A., Smith, M. H., Davison, B., Hewitt, C. N., and Harrison, R. M.: Biogenic sulphur emissions and inferred non-sea-salt-sulphate cloud condensation nuclei in and around Antarctica, J. Geophys. Res.-Atmos., 102, 12839–12854, 1997.
Pant, V., Siingh, D., and Kamra, A. K.: Size distribution of atmospheric aerosols at Maitri, Antarctica, Atmos. Environ., 45, 5138–5149, 2011.
Park, J., Sakurai, H., Vollmers, K., and McMurry, P. H.: Aerosol size distributions measured at South Pole during ISCAT, Atmos. Environ., 38, 5493–5500, https://doi.org/10.1016/j.atmosenv.2002.12.001, 2004.
Park, J., Dall'Osto, M., Park, K., Gim, Y., Kang, H. J., Jang, E., Park, K.-T., Park, M., Yum, S. S., Jung, J., Lee, B. Y., and Yoon, Y. J.: Shipborne observations reveal contrasting Arctic marine, Arctic terrestrial and Pacific marine aerosol properties, Atmos. Chem. Phys., 20, 5573–5590, https://doi.org/10.5194/acp-20-5573-2020, 2020.
Park, K. T., Lee, K., Kim, T. W., Yoon, Y. J., Jang, E. H., Jang, S., Lee, B., Y., and Hermansen, O.: Atmospheric DMS in the Arctic Ocean and its relation to phytoplankton biomass, Global Biogeochem. Cy., 32, 351–359, https://doi.org/10.1002/2017GB005805, 2018.
Park, K.-T., Yoon, Y. J., Lee, K., Tunved, P., Krejci, R., Ström, J., Jang, E., Kang, H. J., Jang, S., Park, J., Lee, B. Y., Traversi, R., Becagli, S., and Hermansen, O.: Dimethyl Sulfide-Induced Increase in Cloud Condensation Nuclei in the Arctic Atmosphere, Global Biogeochem. Cy., 35, e2021GB006969, https://doi.org/10.1029/2021GB006969, 2021.
Parkinson, C. L. and Cavalieri, D. J.: Antarctic sea ice variability and trends, 1979–2010, The Cryosphere, 6, 871–880, https://doi.org/10.5194/tc-6-871-2012, 2012.
Pritchard, H. D., Arthern, R. J., Vaughan, D. G., and Edwards, L. A.: Extensive dynamic thinning on the margins of the Greenland and Antarctic ice sheets, Nature, 461, 971–975, 2009.
Quéléver, L. L. J., Dada, L., Asmi, E., Lampilahti, J., Chan, T., Ferrara, J. E., Copes, G. E., Pérez-Fogwill, G., Barreira, L., Aurela, M., Worsnop, D. R., Jokinen, T., and Sipilä, M.: Investigation of new particle formation mechanisms and aerosol processes at Marambio Station, Antarctic Peninsula, Atmos. Chem. Phys., 22, 8417–8437, https://doi.org/10.5194/acp-22-8417-2022, 2022.
Roscoe, H. K., Jones, A. E., Brough, N., Weller, R., Saiz-Lopez, A., Mahajan, A. S., Schoenhardt, A., Burrows, J. P., and Fleming, Z. L.: Particles and iodine compounds in coastal Antarctica, J. Geophys. Res.-Atmos., 120, 7144–7156, https://doi.org/10.1002/2015JD023301, 2015.
Saiz-Lopez, A., Mahajan, A. S., Salmon, R. A., Bauguitte, S. J. B., Jones, A. E., Roscoe, H. K., and Plane, J. M. C.: Boundary layer halogens in coastal Antarctica, Science, 317, 348–351, https://doi.org/10.1126/science.1141408, 2007.
Schmale, J., Schneider, J., Nemitz, E., Tang, Y. S., Dragosits, U., Blackall, T. D., Trathan, P. N., Phillips, G. J., Sutton, M., and Braban, C. F.: Sub-Antarctic marine aerosol: dominant contributions from biogenic sources, Atmos. Chem. Phys., 13, 8669–8694, https://doi.org/10.5194/acp-13-8669-2013, 2013.
Schmale, J., Baccarini, A., Thurnherr, I., Henning, S., Efraim, A., Regayre, L., Bolas, C., Hartmann, M., Welti, A., Lehtipalo, K., Aemisegger, F., Tatzelt, C., Landwehr, S., Modini, R. L., Tummon, F., Johnson, J., Harris, N., Schnaiter, M., Toffoli, A., Derkani, M., Bukowiecki, N., Stratmann, F., Dommen, J., Baltensperger, U., Wernli, H., Rosenfeld, D., Gysel-Beer, M., and Carslaw, K.: Overview of the Antarctic Circumnavigation Expedition: Study of Preindustrial-like Aerosols and Their Climate Effects (ACE-SPACE), B. Am. Meteorol. Soc., 100, 2260–2283, https://doi.org/10.1175/BAMS-D-18-0187.1, 2019.
Schönhardt, A., Richter, A., Wittrock, F., Kirk, H., Oetjen, H., Roscoe, H. K., and Burrows, J. P.: Observations of iodine monoxide columns from satellite, Atmos. Chem. Phys., 8, 637–653, https://doi.org/10.5194/acp-8-637-2008, 2008.
Simó, R.: Production of atmospheric sulfur by oceanic plankton: biogeochemical, ecological and evolutionary links, Trends Ecol. Evol., 16, 287–294, https://doi.org/10.1016/S0169-5347(01)02152-8, 2001.
Simmons, J. B., Humphries, R. S., Wilson, S. R., Chambers, S. D., Williams, A. G., Griffiths, A. D., McRobert, I. M., Ward, J. P., Keywood, M. D., and Gribben, S.: Summer aerosol measurements over the East Antarctic seasonal ice zone, Atmos. Chem. Phys., 21, 9497–9513, https://doi.org/10.5194/acp-21-9497-2021, 2021.
Sipilä, M., Sarnela, N., Jokinen, T., Henschel, H., Junninen, H., Kontkanen, J., Richters, S., Kangasluoma, J., Franchin, A., Peräkylä, O., Rissanen, M. P., Ehn, M., Vehkamäki, H., Kurten, T., Berndt, T., Petäjä, T., Worsnop, D., Ceburnis, D., Kerminen, V. M., Kulmala, M., and O'Dowd, C.: Molecular-scale evidence of aerosol particle formation via sequential addition of HIO3, Nature, 537, 532–534, https://doi.org/10.1038/nature19314, 2016.
Stroeve, J. C., Jenouvrier, S., Campbell, G. G., Barbraud, C., and Delord, K.: Mapping and assessing variability in the Antarctic marginal ice zone, pack ice and coastal polynyas in two sea ice algorithms with implications on breeding success of snow petrels, The Cryosphere, 10, 1823–1843, https://doi.org/10.5194/tc-10-1823-2016, 2016.
Ström, J., Engvall, A. C., Delbart, F., Krejci, R., and Treffeisen, R.: On small particles in the Arctic summer boundary layer: observations at two different heights near Ny-Ålesund, Svalbard, Tellus B, 61, 473–482, 2009.
Teinilä, K., Frey, A., Hillamo, R., Tülp, H. C., and Weller, R.: A study of the sea-salt chemistry using size-segregated aerosol measurements at coastal Antarctic station Neumayer, Atmos. Environ., 96, 11–19, 2014.
Tremblay, S., Picard, J.-C., Bachelder, J. O., Lutsch, E., Strong, K., Fogal, P., Leaitch, W. R., Sharma, S., Kolonjari, F., Cox, C. J., Chang, R. Y.-W., and Hayes, P. L.: Characterization of aerosol growth events over Ellesmere Island during the summers of 2015 and 2016, Atmos. Chem. Phys., 19, 5589–5604, https://doi.org/10.5194/acp-19-5589-2019, 2019.
Vaughan, D. G., Marshall, G. J., Connolley, W. M., Parkinson, C., Mulvaney, R., Hodgson, D. A., King, J. C., Pudsey, C. J., and Turner, J.: Recent rapid regional climate warming on the Antarctic Peninsula, Clim. Change, 60, 243–274, https://doi.org/10.1023/a:1026021217991, 2003.
Virkkula, A., Teinilä, K., Hillamo, R., Kerminen, V.-M., Saarikoski, S., Aurela, M., Viidanoja, J., Paatero, J., Koponen, I. K., and Kulmala, M.: Chemical composition of boundary layer aerosol over the Atlantic Ocean and at an Antarctic site, Atmos. Chem. Phys., 6, 3407–3421, https://doi.org/10.5194/acp-6-3407-2006, 2006.
Virkkula, A., Hirsikko, A., Vana, M., Aalto, P. P., Hillamo, R., and Kulmala, M.: Charged particle size distributions and analysis of particle formation events at the Finnish Antarctic research station Aboa, Boreal Environ. Res., 12, 397–408, 2007.
Walton, D. W. H. and Thomas, J.: Cruise Report – Antarctic Circumnavigation Expedition (ACE) 20th December 2016–19th March 2017, Tech. rep., Zenodo, https://doi.org/10.5281/zenodo.1443511, 2018.
Weber, R. J., Marti, J. J., McMurry, P. H., Eisele, F. L., Tanner, D. J., and Jefferson, A.: Measurements of new particle formation and ultrafine particle growth rates at a clean continental site, J. Geophys. Res., 102, 4375–4385, 1997.
Weber, R. J., McMurry, P. H., Mauldin, L., Tanner, D. J., Eisele, F. L., Brechtel, F. J., Kreidenweis, S. M., Kok, G. L., Schillawski, R. D., and Baumgardner, D.: A study of new particle formation and growth involving biogenic and trace gas species measured during ACE 1, J. Geophys. Res.-Atmos., 103, 16385–16396, https://doi.org/10.1029/97jd02465, 1998.
Weller, R., Minikin, A., Wagenbach, D., and Dreiling, V.: Characterization of the inter-annual, seasonal, and diurnal variations of condensation particle concentrations at Neumayer, Antarctica, Atmos. Chem. Phys., 11, 13243–13257, https://doi.org/10.5194/acp-11-13243-2011, 2011.
Weller, R., Schmidt, K., Teinilä, K., and Hillamo, R.: Natural new particle formation at the coastal Antarctic site Neumayer, Atmos. Chem. Phys., 15, 11399–11410, https://doi.org/10.5194/acp-15-11399-2015, 2015.
Weller, R., Legrand, M., and Preunkert, S.: Size distribution and ionic composition of marine summer aerosol at the continental Antarctic site Kohnen, Atmos. Chem. Phys., 18, 2413–2430, https://doi.org/10.5194/acp-18-2413-2018, 2018.
Williamson, C. J., Kupc, A., Axisa, A., Kelsey R., Bilsback, K. R., Bui, T. P., Campuzano-Jost, P., Dollner, M., Froyd, K. D., Hodshire, A. L., Jimenez, J. L., Kodros, J. K., Luo, G., Murphy, D. M., Nault, B. A., Ray, E. A., Weinzierl, B., Wilson, J. C., Yu, F., Yu, P., Pierce, J. R., and Brock, C. A.: A large source of cloud condensation nuclei from new particle formation in the tropics, Nature, 574, 399–403, https://doi.org/10.1038/s41586-019-1638-9, 2019.
Willis, M. D., Burkart, J., Thomas, J. L., Köllner, F., Schneider, J., Bozem, H., Hoor, P. M., Aliabadi, A. A., Schulz, H., Herber, A. B., Leaitch, W. R., and Abbatt, J. P. D.: Growth of nucleation mode particles in the summertime Arctic: a case study, Atmos. Chem. Phys., 16, 7663–7679, https://doi.org/10.5194/acp-16-7663-2016, 2016.
Yli-Juuti, T., Riipinen, I., Aalto, P. P., Nieminen, T., Maenhaut, W., Janssens, I. A., Claeys, M., Salma, I., Ocskay, R., Hoffer, A., Imre, K., and Kulmala, M.: Characteristics of new particle formation events and cluster ions at K-puszta, Hungary, Boreal Environ. Res., 14, 683–698, 2009.
Yu, F. and Luo, G.: Oceanic dimethyl sulfide emission and new particle formation around the coast of Antarctica: a modeling study of seasonal variations and comparison with measurements, Atmosphere, 1, 34–50, 2010
Zheng, G., Wang, Y., Wood, R., Jensen, M. P., Kuang, C., McCoy, I. L., Matthews, A., Mei, F., Tomlinson, J. M., Shilling, J. E., Zawadowicz, M. A., Crosbie, E., Moore, R., Ziemba, L., Andreae, M. O., and Wang, J.: New particle formation in the remote marine boundary layer. Nat Commun., 12, 527, https://doi.org/10.1038/s41467-020-20773-1, 2021.
Zhu, R. B., Sun, J. J., Liu, Y. S., Gong, Z. J., and Sun, L. G.: Potential ammonia emissions from penguin guano, ornithogenic soils and seal colony soils in coastal Antarctica: effects of freezing thawing cycles and selected environmental variables, Antarct. Sci., 23, 78–92, https://doi.org/10.1017/s0954102010000623, 2011.