the Creative Commons Attribution 4.0 License.
the Creative Commons Attribution 4.0 License.
 | 19 Oct 2023
Investigation of the summer 2018 European ozone air pollution episodes using novel satellite data and modelling
Richard J. Pope
Brian J. Kerridge
Martyn P. Chipperfield
Richard Siddans
Barry G. Latter
Lucy J. Ventress
Matilda A. Pimlott
Wuhu Feng
Edward Comyn-Platt
Garry D. Hayman
Stephen R. Arnold
Ailish M. Graham
In the summer of 2018, Europe experienced an intense heatwave which coincided with several persistent large-scale ozone (O3) pollution episodes. Novel satellite data of lower-tropospheric column O3 from the Global Ozone Monitoring Experiment-2 (GOME-2) and Infrared Atmospheric Sounding Interferometer (IASI) on the MetOp satellite showed substantial enhancements in 2018 relative to other years since 2012. Surface observations also showed ozone enhancements across large regions of continental Europe in summer 2018 compared to 2017. Enhancements to surface temperature and the O3 precursor gases carbon monoxide and methanol in 2018 were co-retrieved from MetOp observations by the same scheme. This analysis was supported by the TOMCAT chemistry transport model (CTM) to investigate processes driving the observed O3 enhancements. Through several targeted sensitivity experiments we show that meteorological processes, and emissions to a secondary order, were important for controlling the elevated O3 concentrations at the surface. However, mid-tropospheric (∼ 500 hPa) O3 enhancements were dominated by meteorological processes. We find that contributions from stratospheric O3 intrusions ranged between 15 %–40 %. Analysis of back trajectories indicates that the import of O3-enriched air masses into Europe originated over the North Atlantic, substantially increasing O3 in the 500 hPa layer during summer 2018.
- Article
(12765 KB) - Full-text XML
-
Supplement
(6112 KB) - BibTeX
- EndNote


Over the past few decades there have been several intense summertime heatwaves over Europe (e.g. 2003 over continental Europe, Scott et al., 2004; 2006 over north-western Europe, Rebetez et al., 2008; and 2010 across eastern Europe and Russia, Matsueda, 2011). With current and future climate change, increasing average global surface temperature is expected to trigger more frequent and intense heatwaves (Lhotka et al., 2017; Guerreiro et al., 2018). The summertime 2018 heatwave across predominantly north-western and central Europe and Scandinavia generated temperature anomalies of approximately 2.0–4.0 K (Li et al., 2020; Drouard et al., 2020). Dynamically, it was caused by a combination of intense anticyclonic blocking systems, Rossby wave dynamics and the positive phase of the summertime North Atlantic Oscillation (NAO+) (Li et al., 2020; Liu et al., 2020; Drouard et al., 2020). Environmentally, the summer 2018 heatwave caused severe drought conditions with decreased precipitation and soil moisture content (Bastos et al., 2020; Dirmeyer et al., 2020) while negatively impacting natural vegetation (e.g. decreased gross primary productivity (Smith et al., 2020; Bastos et al., 2020)). From a human health perspective, the 2018 heatwave caused 863 temperature-related excess deaths in the UK (PHE, 2019).
As well as meteorological and vegetation responses, enhancements in atmospheric pollutants from heatwaves can lead to a degradation in air quality (AQ) across Europe. Blocking systems (anticyclonic conditions) have been shown to increase the level of air pollution such as carbon monoxide (CO; Thomas and Devasthale, 2014), nitrogen dioxide (NO2; Pope et al., 2014) and particulate matter (i.e. PM2.5; Graham et al., 2020) to hazardous levels. Pope et al. (2016) focused on the 2006 UK heatwave and detected enhancements in surface O3 through the accumulation of pollutants (i.e. atmospheric blocking) but also the higher temperatures yielding more active atmospheric chemistry (i.e. ozone formation). Papanastasiou et al. (2015) found that Greek heatwave conditions (2001–2010) typically yielded an increase in NO2, PM2.5 and O3 by 14 %–29 %, 25 %–38 % and 12 %, respectively. Rasilla et al. (2019) found that heatwaves in Madrid only moderately increased NO2 and O3 but significantly increased PM10 concentrations. However, they associated this with enhanced long-range transport of African dust and then accumulation under heatwave conditions. García-Herrera et al. (2020) provided a review of the 2003 European heatwave, finding that the Alpine region had substantially elevated surface ozone levels (peaking at 417 µg m−3 with 68 % of sites from 23 countries reaching concentrations above 180 µg m−3) when compared with the previous 12 summers. Biogenic volatile organic compound (BVOC) emissions from vegetation are known to increase under drought conditions from temperature stress (e.g. in the 2003 European heatwave; Rennenberg et al., 2006). Churkina et al. (2017) found that heatwave conditions (2006) in Berlin yielded an increase in BVOC emissions which contributed up to 12 % of the surface ozone formation. Heatwaves can also trigger wildfires, which emit primary air pollution and can form secondary gases such as surface ozone on a regional and hemispheric scale (Honrath et al., 2004). Overall, elevated surface O3 is associated with adverse health impacts (Doherty et al., 2017; Heal et al., 2013; Jerrett et al., 2009) with ailments such as asthma, reduced lung function and disease (WHO, 2021). It also has adverse impacts on the natural biosphere (Sitch et al., 2007) and agriculture (Hollaway et al., 2012; van Dingenen et al., 2009), in turn reducing deposition of surface ozone on vegetation. In this study, we use surface and satellite observations of O3, in combination with the well-evaluated TOMCAT global chemical transport model (CTM), to investigate the impact of the summer 2018 heatwave on European AQ and determine the key processes driving observed surface/tropospheric O3 enhancements. We describe the observations and model we have used in Sect. 2. Sections 3 and 4 contain our results and discussion/conclusions, respectively.
2.1 Satellite and surface observations
We use satellite observations of lower-tropospheric O3 (i.e. subcolumn O3 (SCO3) between the surface and 450 hPa) from the Global Ozone Monitoring Experiment (GOME-2) and the Infrared Atmospheric Sounding Interferometer (IASI) instruments on board ESA's MetOp-A satellite, which was launched in 2006 into a sun-synchronous polar orbit with Equator crossing times of 09:30 LT (day) and 21:30 LT (night). GOME-2 is a nadir-viewing spectrometer with spectral coverage in the ultraviolet–visible (UV–Vis) of 240–790 nm (Riese et al., 2012) and a ground footprint of 40 km × 80 km in the first part of the mission and 40 km × 40 km from 2013 (once MetOp-B was commissioned). IASI is a Michelson interferometer which observes the infrared spectral range 645 to 2760 cm−1 with a spectral sampling of 0.25 cm−1 (Illingworth et al., 2011). It measures simultaneously in four fields of view (circular at nadir with a diameter of 12 km) which are scanned across track to sample a 2200 km wide swath (Clerbaux et al., 2009).
For GOME-2, the Rutherford Appleton Laboratory (RAL) scheme uses an optimal estimation algorithm (Rodgers, 2000) to retrieve height-resolved ozone distributions spanning the stratosphere and troposphere (Miles et al., 2015). The scheme applied to GOME-2 has been developed from that used first for GOME-1 on board ERS-2 (Munro et al., 1998; Forster et al., 2007). This is a multi-step scheme in which profile information is first retrieved in the stratosphere by exploiting wavelength-dependent absorption in the O3 Hartley band (270–307 nm) and is then extended into the troposphere by exploiting temperature-dependent spectral structure in the O3 Huggins bands (325–335 nm). For IASI, O3 profiles are retrieved using an extended version of RAL's Infrared Microwave Sounding (IMS) scheme, which is described in Pope et al. (2021), Palmer et al. (2022) and Pimlott et al. (2022). The IMS core scheme was originally developed to retrieve temperature, water vapour and stratospheric O3 profiles along with surface spectral emissivity and cloud jointly from co-located measurements by IASI, the Microwave Humidity Sounder (MHS) and the Advanced Microwave Sounding Unit (AMSU-A) on MetOp (RAL Space, 2015). GOME-2 and IMS O3 data were filtered for a geometric cloud fraction less than 0.2, a solar zenith angle less than 80∘, a cost function less than 200.0 and a convergence flag equal to 1.0. Examples of the vertical sensitivity to retrieving ozone (i.e. averaging kernels) from GOME-2 and IMS are shown in SM 1 in the Supplement.
We also use surface O3 observations from the European Monitoring and Evaluation Programme (EMEP) network for May–August 2017 and 2018. The EMEP network contains > 100 surface measurement sites measuring information on a range of air pollution types (e.g. ozone, NO2 and PM2.5). EMEP surface data can be used for multiple scientific applications such as trend analysis (Yan et al., 2018) and atmospheric chemistry model evaluation (Schultz et al., 2017; Archibald et al., 2020) and are hosted by the EBAS database infrastructure, developed by the Norwegian Institute for Air Research. In total, we used 125 spatial collocated EMEP sites in both years across Europe. Here, data at individual sites were selected where the corresponding data flag was set to 0.0.
2.2 Modelling and sensitivity experiments
In this study, the TOMCAT CTM (Chipperfield, 2006) is forced by European Centre for Medium-Range Weather Forecasts (ECMWF) ERA-Interim reanalysis meteorology (Dee et al., 2011) and is run at a horizontal resolution of 2.8∘ × 2.8∘. The model has with 31 vertical levels from the surface to 10 hPa with 5–7 (approximately 10) levels in the boundary layer (mid-troposphere), depending on latitude. The model includes detailed tropospheric chemistry, including 229 gas-phase reactions and 82 advected tracers (Monks et al., 2017), and heterogeneous chemistry driven by size-resolved aerosol from the GLOMAP (Global Model of Aerosol Processes) module (Mann et al., 2010). Anthropogenic emissions used in this study come from MACCity (Granier et al., 2011). The original data set in Granier et al. (2011) derived emissions up to 2010. Therefore, the Representative Concentration Pathway 8.5 (RCP 8.5) was used by Granier et al. (2011) to generate emissions for later years (e.g. 2017 and 2018 as used in this study). Fire emissions are from the Global Fire Assimilation System (GFAS, Kaiser et al., 2012) for 2017 and 2018. Year-specific offline biogenic volatile organic compound (VOC) emissions for acetone, methanol, isoprene and monoterpenes were simulated by the Joint UK Land Environment Simulator (JULES – Pacifico et al., 2011; Best et al., 2011; Clark et al., 2011). All other biogenic VOC emissions are climatological values and provided by the Chemistry-Climate Model Initiative (CCMI) (Morgenstern et al., 2017). The global budgets of the JULES VOC emissions are low in comparison to the climatological CCMI emissions, so they were scaled up on a regional basis while retaining the 2017–2018 step change related to the 2018 summer heatwave. The full details of JULES VOC emissions scaling can be found in SM 4 in the Supplement. Lightning emissions of NOx are coupled to convection in the model, which is derived from the meteorological reanalyses. Therefore, they vary in space and time according to the seasonality and spatial pattern of convective activity (Stockwell et al.,1999). The model was run for 2017 and 2018 with output at 6-hourly intervals (i.e. 00:00, 06:00, 12:00 and 18:00 LT). Here, each year was run with its respective meteorology and emissions and given the labels Met17_Emis17 (representing 2017) and Met18_Emis18 (representing 2018).
To explore the importance of emission and meteorological processes behind the elevated European summer 2018 tropospheric O3 levels, a 1-year model sensitivity experiment was performed using 2018 meteorology but 2017 emissions (i.e. Met18_Emis17). Therefore, the difference between Met18_Emis17 and Met17_Emis17 highlights the impact of fixed emissions (i.e. 2017 emissions for both years including BVOC emissions), while the Met18_Emis18 minus Met18_Emis17 highlights the impact of fixed meteorology (i.e. 2018 meteorology for both years). These are compared with the control differences for 2018–2017 (Met18_Emis18–Met17_Emis17). From here on in, we refer to the control differences, fixed emission differences and the fixed meteorology differences as CTL_DIFF, FIXED_EMIS_DIFF and FIXED_MET_DIFF, respectively. TOMCAT also includes a stratospheric O3 tracer, a common approach to tag stratospheric O3 (e.g. Roelofs et al., 2003; Akritidis et al., 2019), which can be used to investigate the impact of stratospheric O3 intrusion into the troposphere. The tracer is set equal to the model-calculated O3 in the stratosphere. The only tropospheric source of O3S is transport from the stratosphere, while its sinks are via photolysis, reactions with HO2, OH and H2O through O(1D) produced from O3S and surface deposition (Monks et al., 2017). The tracer does not have a fixed lifetime, but the loss rate in the troposphere depends on the modelled local OH, HO2, H2O and photolysis. Any O3 that gets into the stratosphere will be labelled as stratospheric before it returns. This was used to investigate the impact of stratospheric O3 intrusion into the troposphere.
TOMCAT has been used in a number of previous studies to investigate air quality and tropospheric composition (e.g. Richards et al., 2013; Emmons et al., 2015; Pope et al., 2018; Pope et al., 2020) whose results give confidence in the model's ability to simulate European tropospheric O3 in this study. Overall, when compared with observations, TOMCAT has good spatial agreement with both GOME-2 and IASI and can reasonably reproduce the 2018 SCO3 enhancement in 2018 versus 2017 (SM 5). The model also has good agreement, both in magnitude and seasonality, with the EMEP-observed surface concentrations (SM 5). TOMCAT surface ozone was also compared with higher-resolution modelling (reanalysis) data from the Copernicus Atmosphere Monitoring Service (CAMS), which showed good spatial agreement between the modelling data sets and in the simulated surface ozone absolute values during the European summer 2018 pollution episode (SM 5).
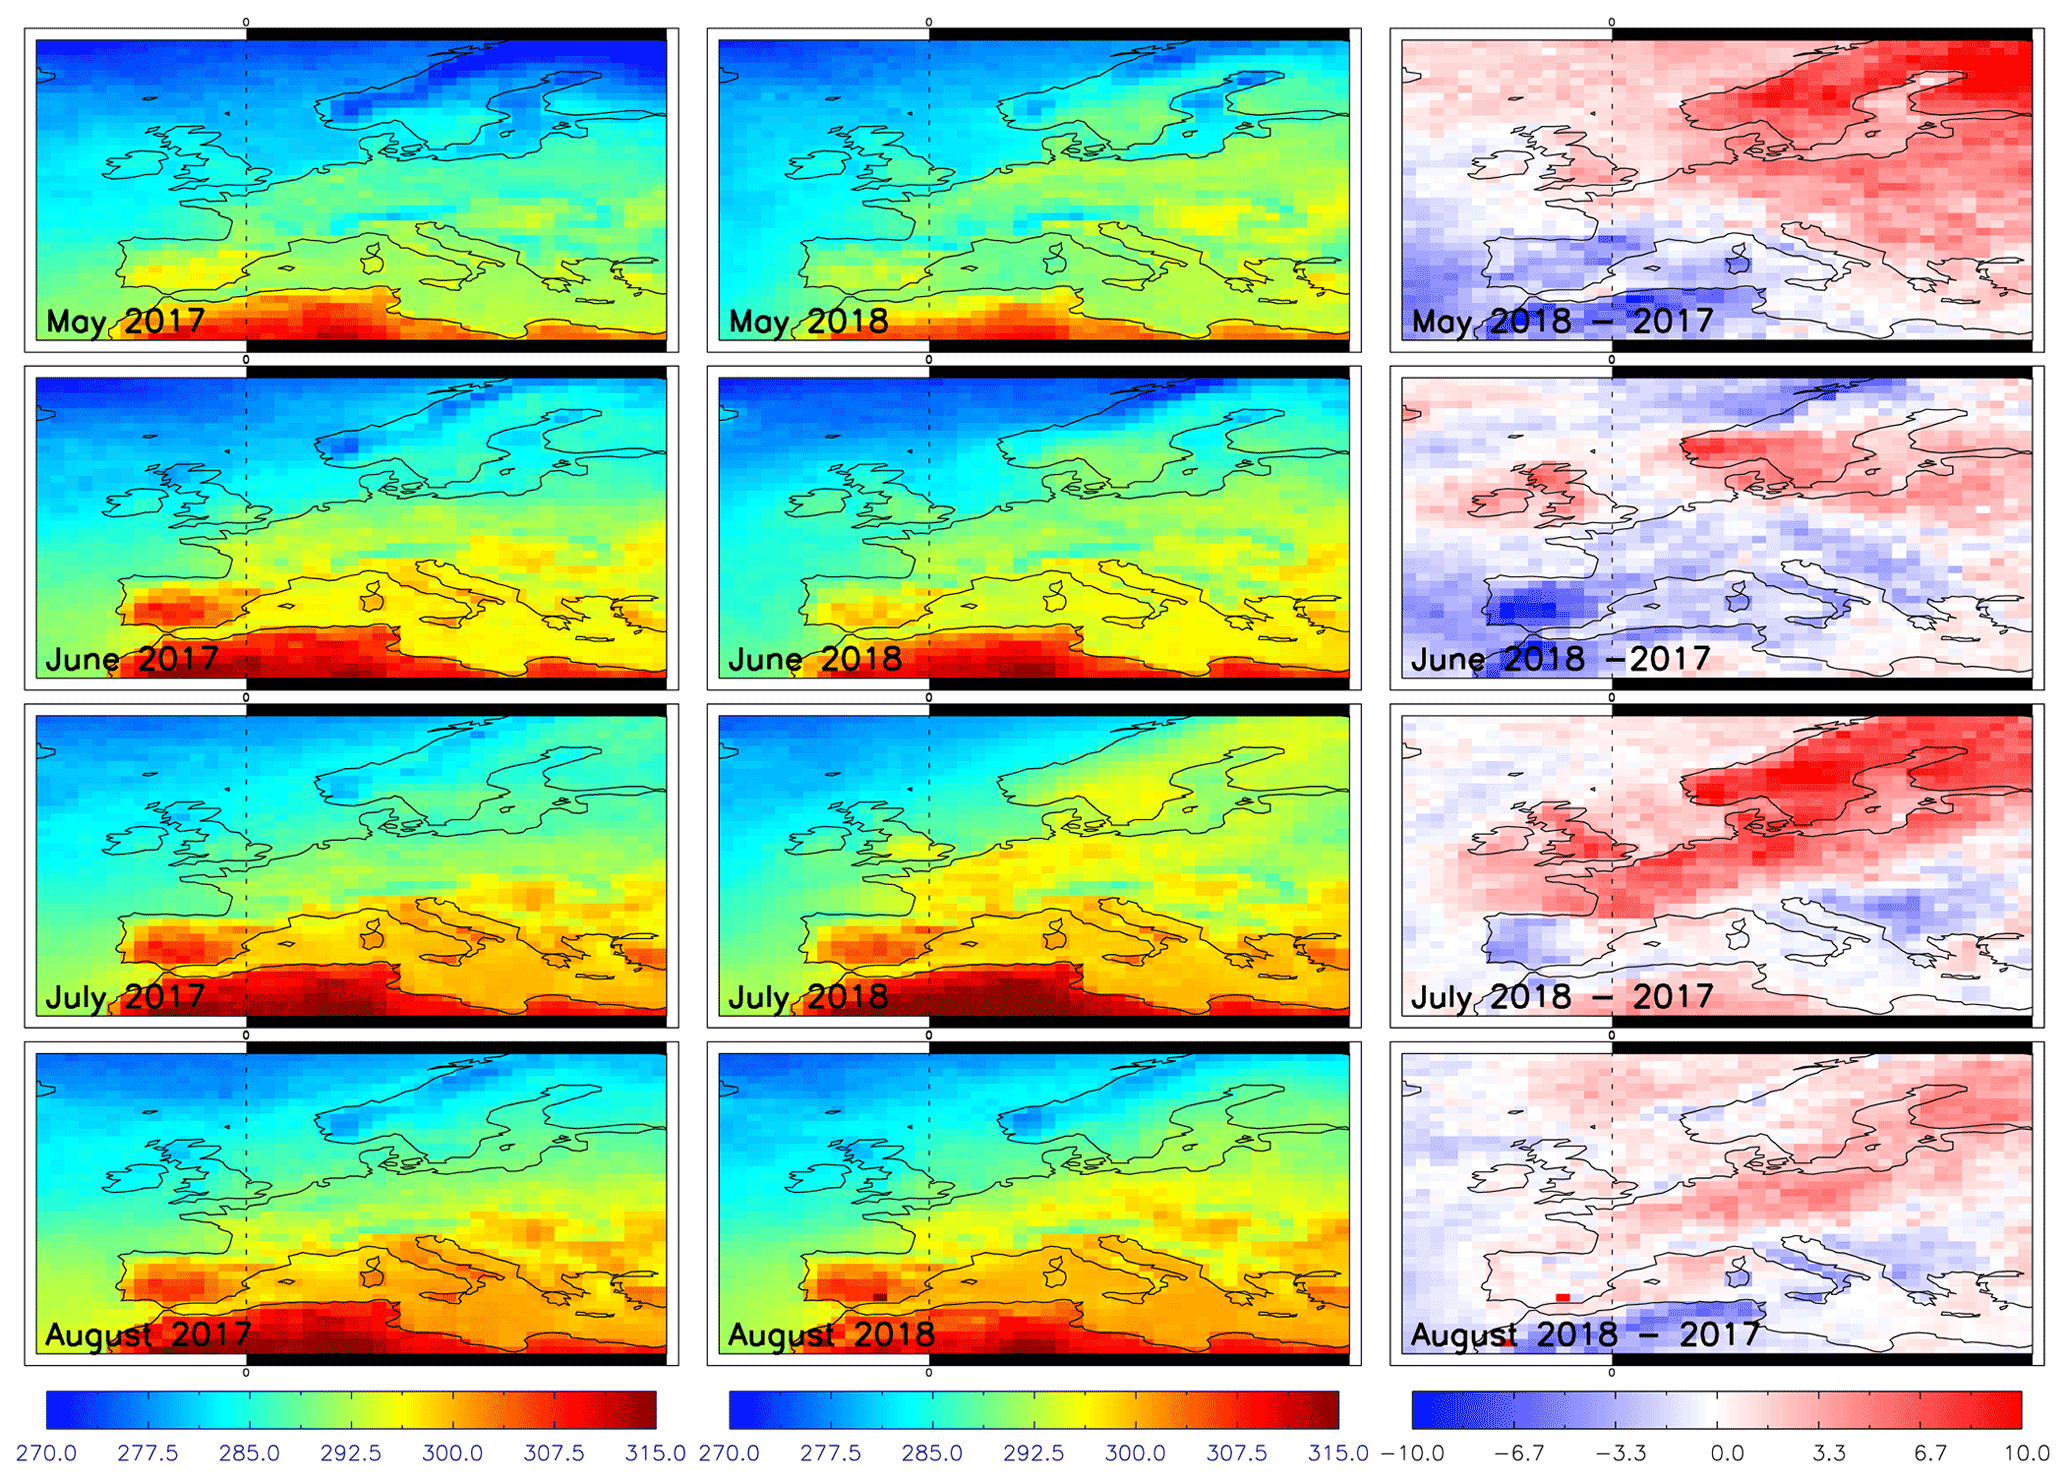
Figure 1Surface temperature (K) over Europe for May to August in 2017 (left column), 2018 (centre column) and 2018–2017 difference (right column) retrieved from MetOp-A IASI, MHS and AMSU by the IMS scheme.
2.3 ROTRAJ back-trajectories
We use the Reading Offline Trajectory Model (ROTRAJ) to generate air mass back-trajectories (Methven et al., 2003) to assess the import of tropospheric O3 into Europe. ROTRAJ is a Lagrangian atmospheric transport model driven by meteorology from the same ECMWF ERA-Interim reanalyses (horizontal resolution of 1.0125∘) as used by TOMCAT. Velocity fields at the Lagrangian particle positions are determined by cubic Lagrange interpolation in the vertical, bilinear interpolation in the horizontal and linear interpolation in time. This method accounts for large-scale advection since the winds are resolved, but it does not resolve small-scale subgrid turbulent transport. Kinematic back-trajectories were released at 6-hourly intervals (i.e. at 00:00, 06:00, 12:00 and 18:00 LT) from Paris and Berlin, both central locations over Europe in the region of summertime 2018 O3 enhancements, between 1 May and 31 August for both 2017 and 2018. The trajectories were released at the surface and at approximately 500 hPa and integrated for 10 d with 6-hourly output (i.e. 41 trajectory points including the starting location) to investigate the origin of air masses arriving in these altitude regions of enhanced summertime O3 in 2018. In total, ROTRAJ was therefore run eight times (2 years × 2 altitudes × 2 locations).
To quantify the import of tropospheric O3 into Europe, for each trajectory, all the trajectory points were co-located with corresponding TOMCAT O3 mixing ratio values (i.e. the horizontal and vertical grid box the trajectory point sits within and corresponding time stamp) and then the average O3-weighted back-trajectory (O3-WBT) determined (i.e. back-trajectories with larger O3-WBT values come from air masses with larger O3 content). This follows a similar approach to Graham et al. (2020) and Stirling et al. (2020), though using a model chemical tracer and not emission inventories.
3.1 Surface temperature
Several studies (e.g. Li et al., 2020; Liu et al., 2020; Drouard et al., 2020) have documented the intense heatwave across Europe in the summer of 2018. This is further shown in Fig. 1, which compares surface temperature, co-retrieved with ozone and other variables from MetOp-A by the IMS scheme, between 2017 and 2018. In May, higher temperatures occur across Scandinavia (5.0–10.0 K), eastern Europe (3.0–7.0 K) and the UK (1.0–3.0 K), but temperatures are lower (−3.0 to −1.0 K) across the Iberian Peninsula. In June, a similar spatial distribution occurs, but the magnitude of the differences is smaller. In July, the largest temperature increases range from 6.0–8.0 K in Scandinavia to 2.0–6.0 K in the UK and France. The Iberian Peninsula continued to experience temperatures lower by −2.0 to 0.0 K. In August, there are near-zero differences over the UK, the Iberian Peninsula and most of Scandinavia but with increases of 1.0–3.0 K over eastern Europe and Finland.

Figure 2Subcolumn ozone (SCO3, surface – 450 hPa), in Dobson units (DU), retrieved from GOME-2 on MetOp-A averaged across May to August between 2012 and 2018 (top left panel) and the corresponding difference from the 2012–2018 mean for each year, respectively. The green-polygon-outlined regions show where the year-specific seasonal average is significantly different (95 % confidence level based on the Wilcoxon rank test, WRT) from the long-term (2012–2018) seasonal average. The “Sig Pixel %” label indicates the number of pixels in the domain with significant differences.
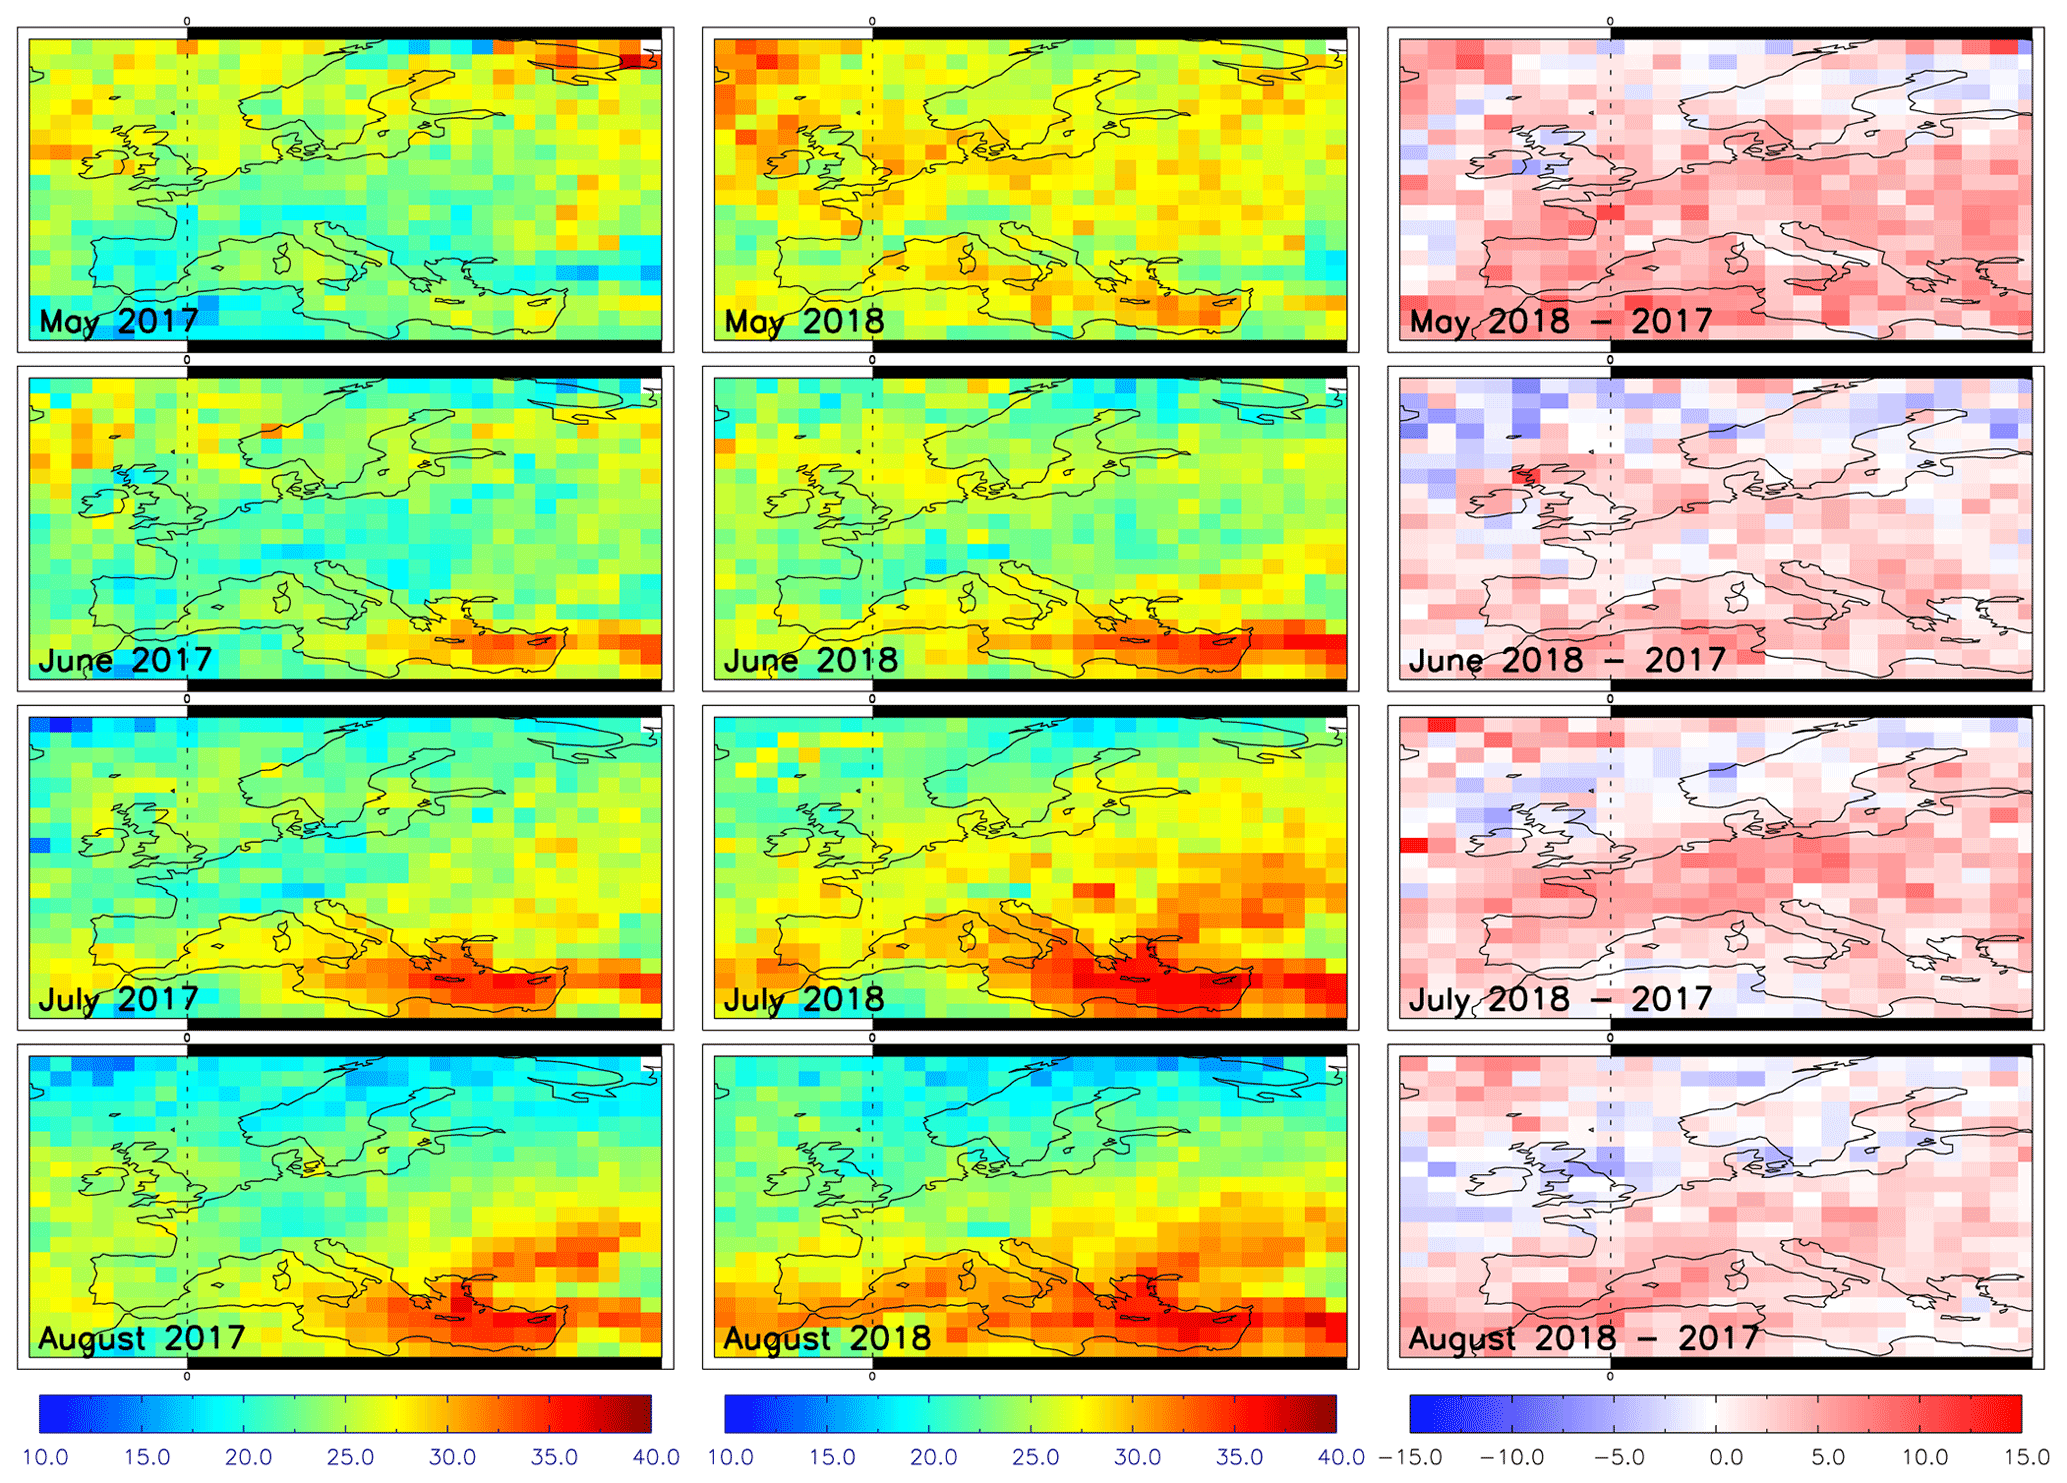
Figure 3SCO3 (DU) from GOME-2 over Europe for May to August in 2017 (left column), 2018 (centre column) and 2018–2017 difference (right column).
3.2 Satellite ozone
We investigate the longer-term variability in tropospheric O3 (i.e. SCO3) to determine whether 2017 is a suitable comparator for the 2018 summer O3 enhancements as it is for temperature. Figure 2 shows the 2012–2018 SCO3 average between May and August for a domain over the Atlantic and Europe and the difference for the same season between specific years and the 2012–2018 average. In 2012 and 2013, there are significant positive differences from the average between 1.0 and 5.0 DU over much of the domain. Over continental Europe, the differences are smaller. Here, the significance of differences between the year-specific and long-term averages are determined using the Wilcoxon rank test (Pirovano et al., 2012) at the 95 % confidence level. In 2014 and 2015, there are negative differences across Europe (−4.0 to −1.0 DU). In 2016, similar negative differences are primarily across the north and south-east of the domain. In 2017, there are near-zero differences across the Atlantic, UK and western Europe. Over eastern Europe and Mediterranean, there are significant negative differences of between −2.0 and −1.0 DU. In 2018, across continental Europe there are significant positive differences between 2.0 and 4.0 DU. As the 2017 differences are relatively small in magnitude with a low proportion of significant pixels (i.e. Sig Pixels % = 32.7 is the lowest across the 7 years), it is representative of average conditions for comparison with 2018. For 2018, the summer SCO3 enhancements across continental Europe are the largest for the years shown with a coherent cluster of significant differences. This illustrates that the summer 2018 SCO3 enhancements are a substantial deviation from the average conditions (which we represent as 2017 herein) and that this is an intense O3 event.
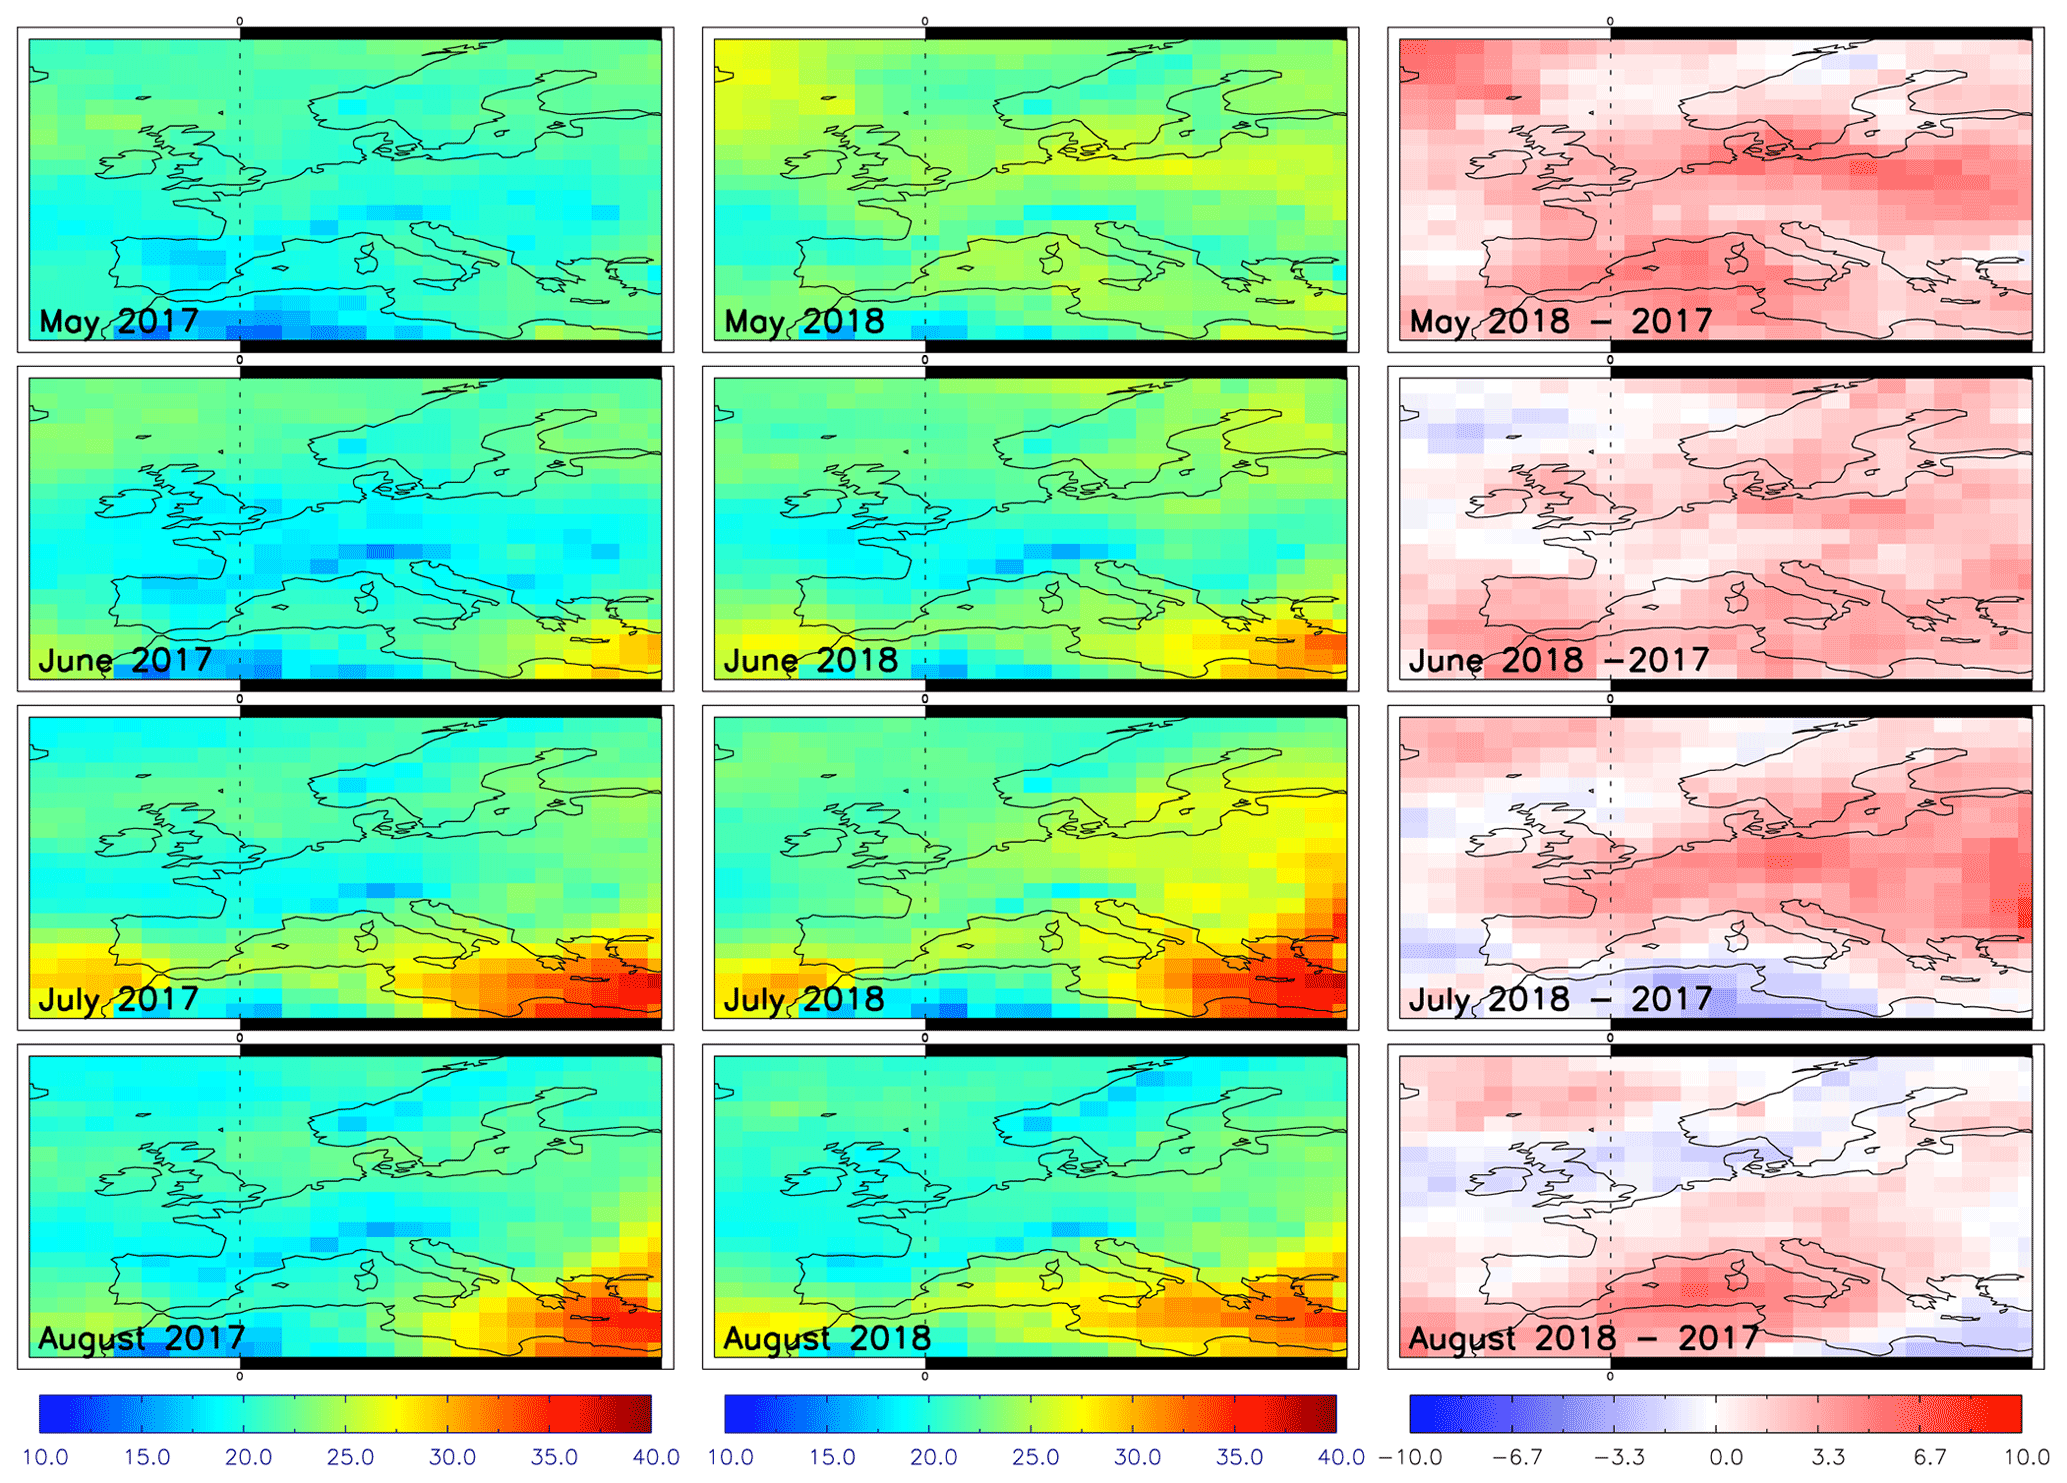
Figure 4SCO3 (DU) for May to August in 2017 (left column), 2018 (centre column) and 2018–2017 difference (right column) over Europe retrieved from MetOp-A IASI, MHS and AMSU by the IMS scheme.
Investigation of SCO3 retrieved from both GOME-2 (Fig. 3) and the IMS scheme (Fig. 4) shows consistent enhancements in summer 2018. In 2017, between May and August, GOME-2 typically observed SCO3 values between 20.0–30.0 DU across continental Europe. Peak SCO3 values occurred over the Mediterranean (30.0–38.0 DU); relatively high ozone is a typical feature of the Mediterranean in summer (Richards et al., 2013). In 2018, the seasonality is consistent with 2017, but the continental European SCO3 values ranged between 25.0 and 35.0 DU. For the 2018–2017 difference, SCO3 enhancements occur across continental Europe in all 4 months but peaked in May and July between 3.0 and 8.0 DU while typically 1.0–5.0 DU in June and August. The spatial distribution of IMS-retrieved SCO3 is similar to that of GOME-2 in 2017 and 2018, although the absolute values tend to be systematically lower by 3.0–4.0 DU. However, despite this systematic offset, the 2018–2017 differences are reasonably consistent with GOME-2. Across continental Europe, IMS SCO3 shows 2018 enhancements in all months investigated but peaks in May and July, like GOME-2, between 3.0 and 6.0 DU. The differences range from 1.0 to 3.0 DU in June and are approximately 1.0 DU in August (though a peak enhancement of 3.0–5.0 DU occurs over the Mediterranean). Spatial correlations between the GOME-2 and IASI difference (i.e. 2018–2017) maps for the months investigated ranged between 0.21 and 0.47 (see SM 5 in the Supplement).
The GOME-2 and IASI instruments observe UV–Vis and IR wavelengths, with peak vertical sensitivities to tropospheric O3 in the lower and mid/upper troposphere, respectively. Consistency in the 2018 enhancements in SCO3 indicates that these extend over the bulk of the troposphere and increases confidence in the detected enhancements for both sensors.
Investigation of several satellite-retrieved O3 precursor gases (see SM 2) showed enhancements in total column methanol (TCCH3OH, Fig. S2), especially linked to May and July temperature enhancements (Fig. 1), minor increases in tropospheric column NO2 (TCNO2, Fig. S3) in May and July over central Europe, and widespread enhancements (weakest in July and strongest in August) in total column carbon monoxide (TCCO, Fig. S4). Investigation of the GOME-2 and IASI total column O3 (TCO3) differences between 2017 and 2018 (Figs. S5 and S6) showed these to be in close agreement. Some spatial structure is similar to that of the SCO3 difference patterns (Figs. 3 and 4), with correlations of approximately 0.5 between TCO3 and SCO3 for each instrument (see SM 3). Given the complex relationship between tropospheric O3, precursor gases, atmospheric chemistry (e.g. NOx or VOC-limited regimes), surface deposition and meteorological conditions (e.g. atmospheric temperatures and transport), a detailed chemistry transport model is required to assess the key processes leading to the observed SCO3 enhancements over Europe.
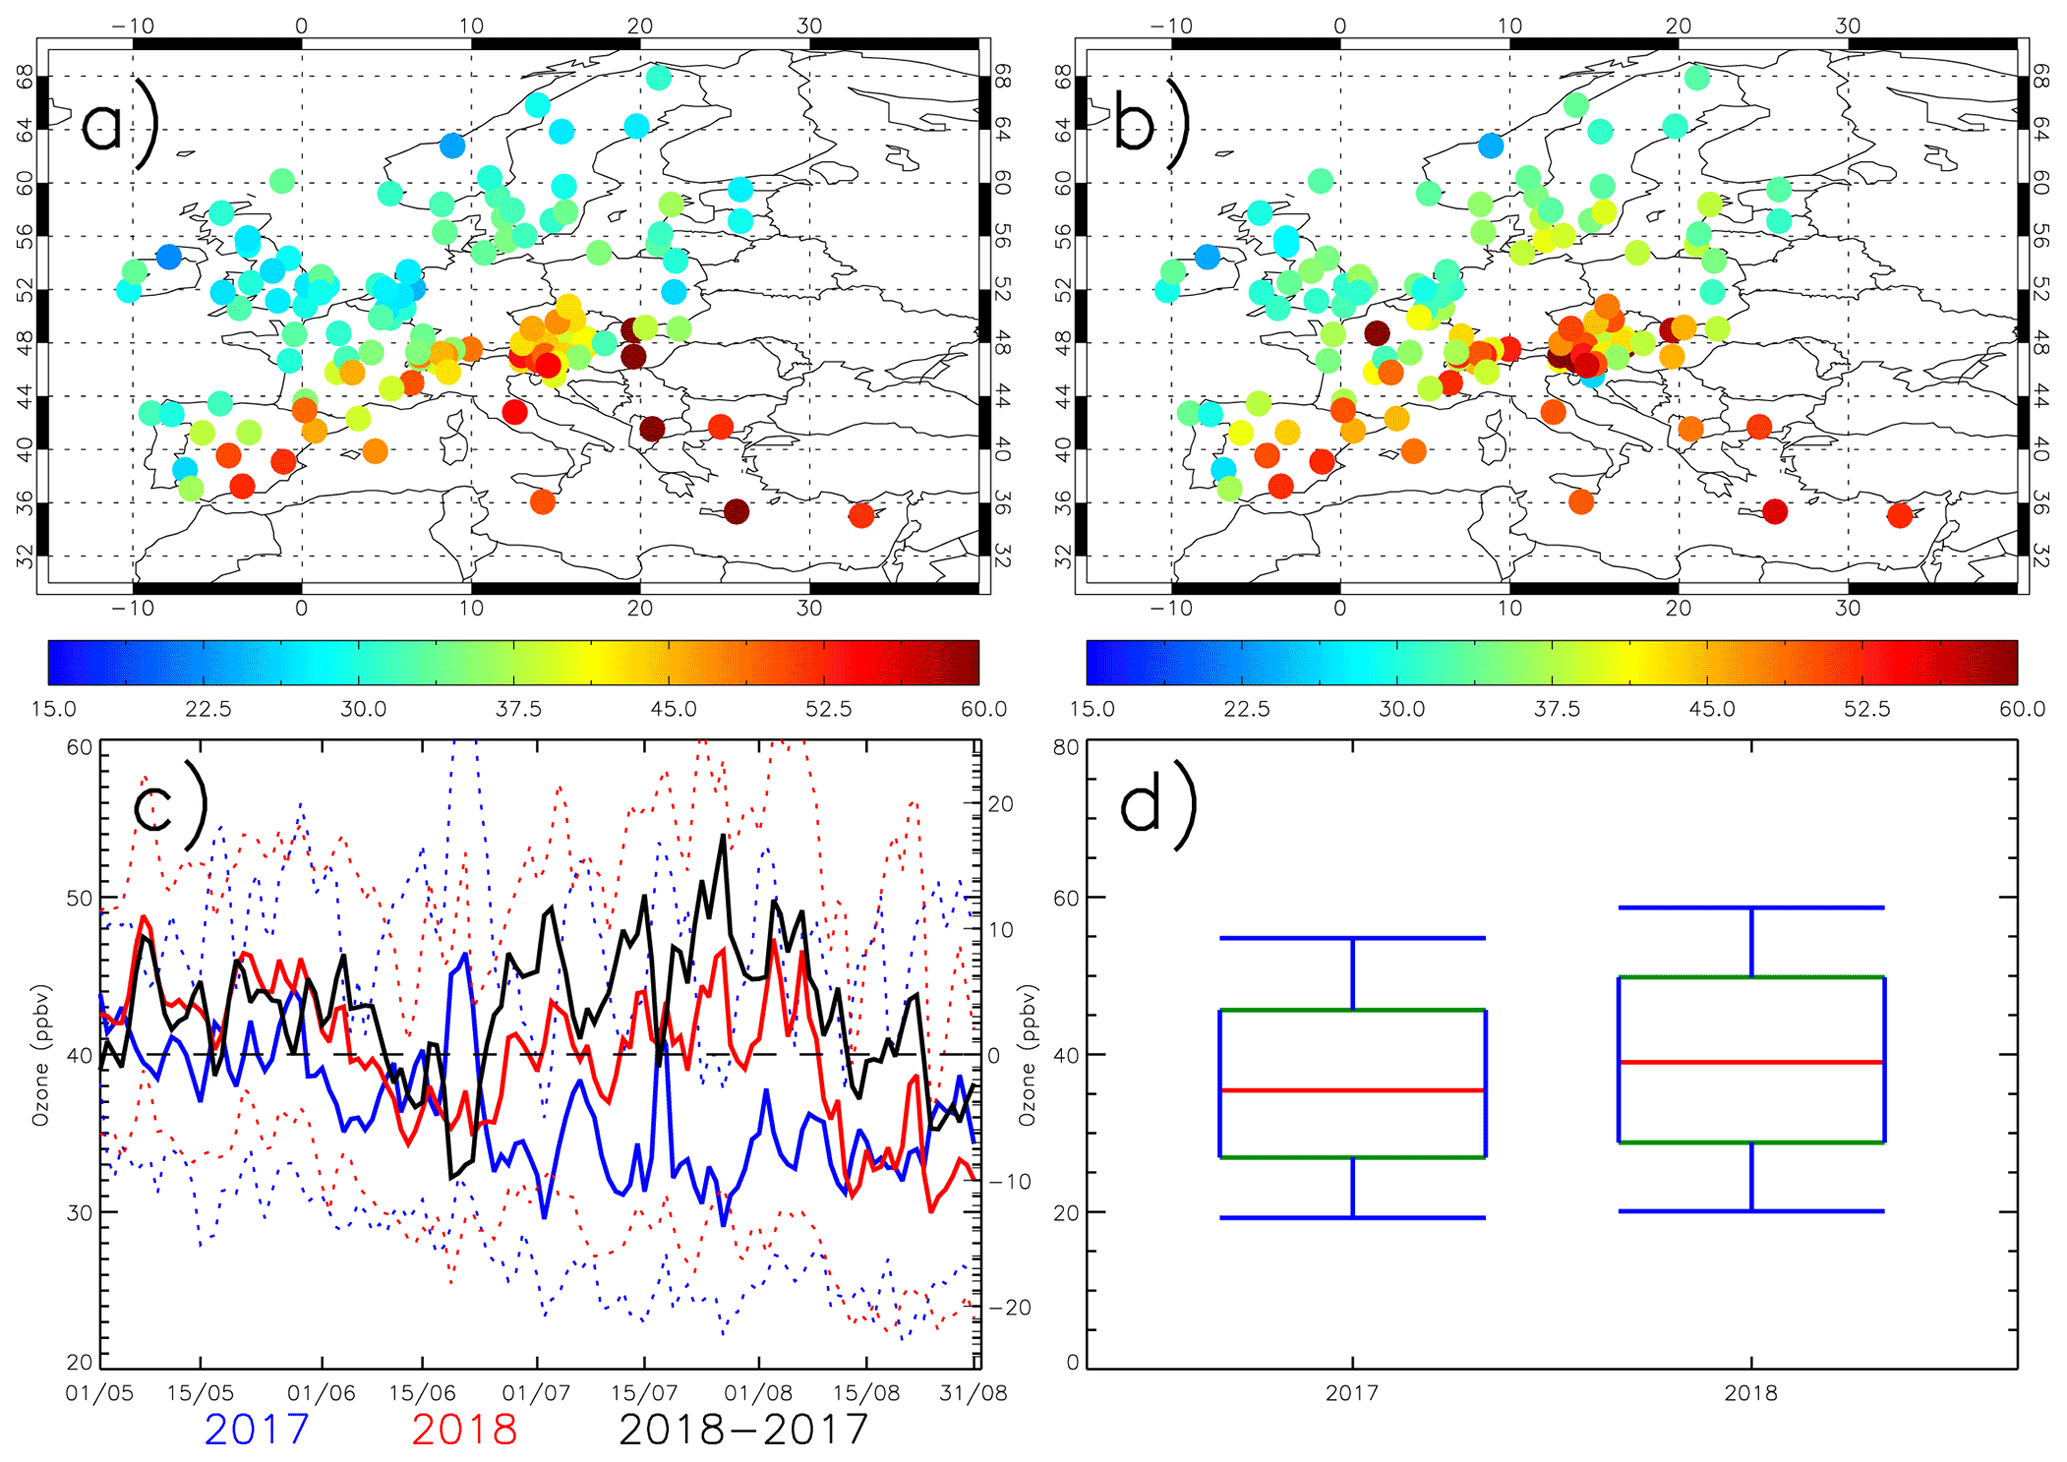
Figure 5European surface ozone (ppbv) for (a) May–June–July–August (MJJA) 2017, (b) MJJA 2018, (c) regional mean time series (dotted lines show mean ± standard deviation) for MJJA 2017 (blue), MJJA 2018 (red) and the 2018–2017 difference (black) and (d) box-and-whisker plots for MJJA 2017 and 2018. In panel (d) the median, 25th and 75th percentiles and 10th and 90th percentiles are shown by the red, green and blue lines, respectively.
3.3 Surface ozone
Increased temperatures during heatwaves have been shown to enhance surface O3 concentrations (e.g. Jacob and Winner, 2009; Vieno et al., 2010; Pyrgou et al., 2018). In the summer (May–June–July–August, MJJA) of 2018, EMEP recorded larger O3 mixing ratios across most of Europe in comparison to 2017 (Fig. 5a and b). Over central Europe, surface O3 mixing ratios ranged from approximately 45.0 ppbv to over 60.0 ppbv, while in 2017 it was 35.0 to 50.0 ppbv. Over the UK and north-western Europe, surface O3 mixing ratios ranged from 20.0 to 30.0 ppbv and then 25.0 to 35.0 ppbv in MJJA 2017 and 2018, respectively. In Scandinavia and eastern Europe, surface O3 mixing ratios ranged from 20.0 to 35.0 ppbv in MJJA 2017 while increasing to 25.0 ppbv to approximately 40.0 ppbv in MJJA 2018. Figure 5c highlights these widespread enhancements where domain-average surface O3 mixing ratios are larger by typically 5.0–10.0 ppbv in May and from mid-June to mid-August in 2018. Figure 5d shows that the domain median surface O3 concentration across MJJA was larger by 2.0–3.0 ppbv in 2018, but the 2018 extremes were greater with 75th and 95th percentiles of 45.0 and 55.0 ppbv in 2017 and 48.0 and 59.0 ppbv in 2018. Therefore, surface observations of O3 recorded widespread enhancements in MJJA 2018 compared to 2017 with peak site differences > 10.0 ppbv. This is generally consistent with the 2018 layer-averaged enhancements in the satellite-retrieved SCO3 for regions where both data sets have spatial coverage.
3.4 Model simulations
We use the TOMCAT model to investigate different factors potentially driving the observed enhancements in tropospheric O3. In comparison with the observations (see SM 5 in the Supplement), the model reproduces the sign and spatial distribution of observed 2018–2017 differences reasonably well. Although it has a tendency to underestimate the absolute magnitude, we are confident in the model's ability to simulate the tropospheric O3 enhancements relative to 2017.
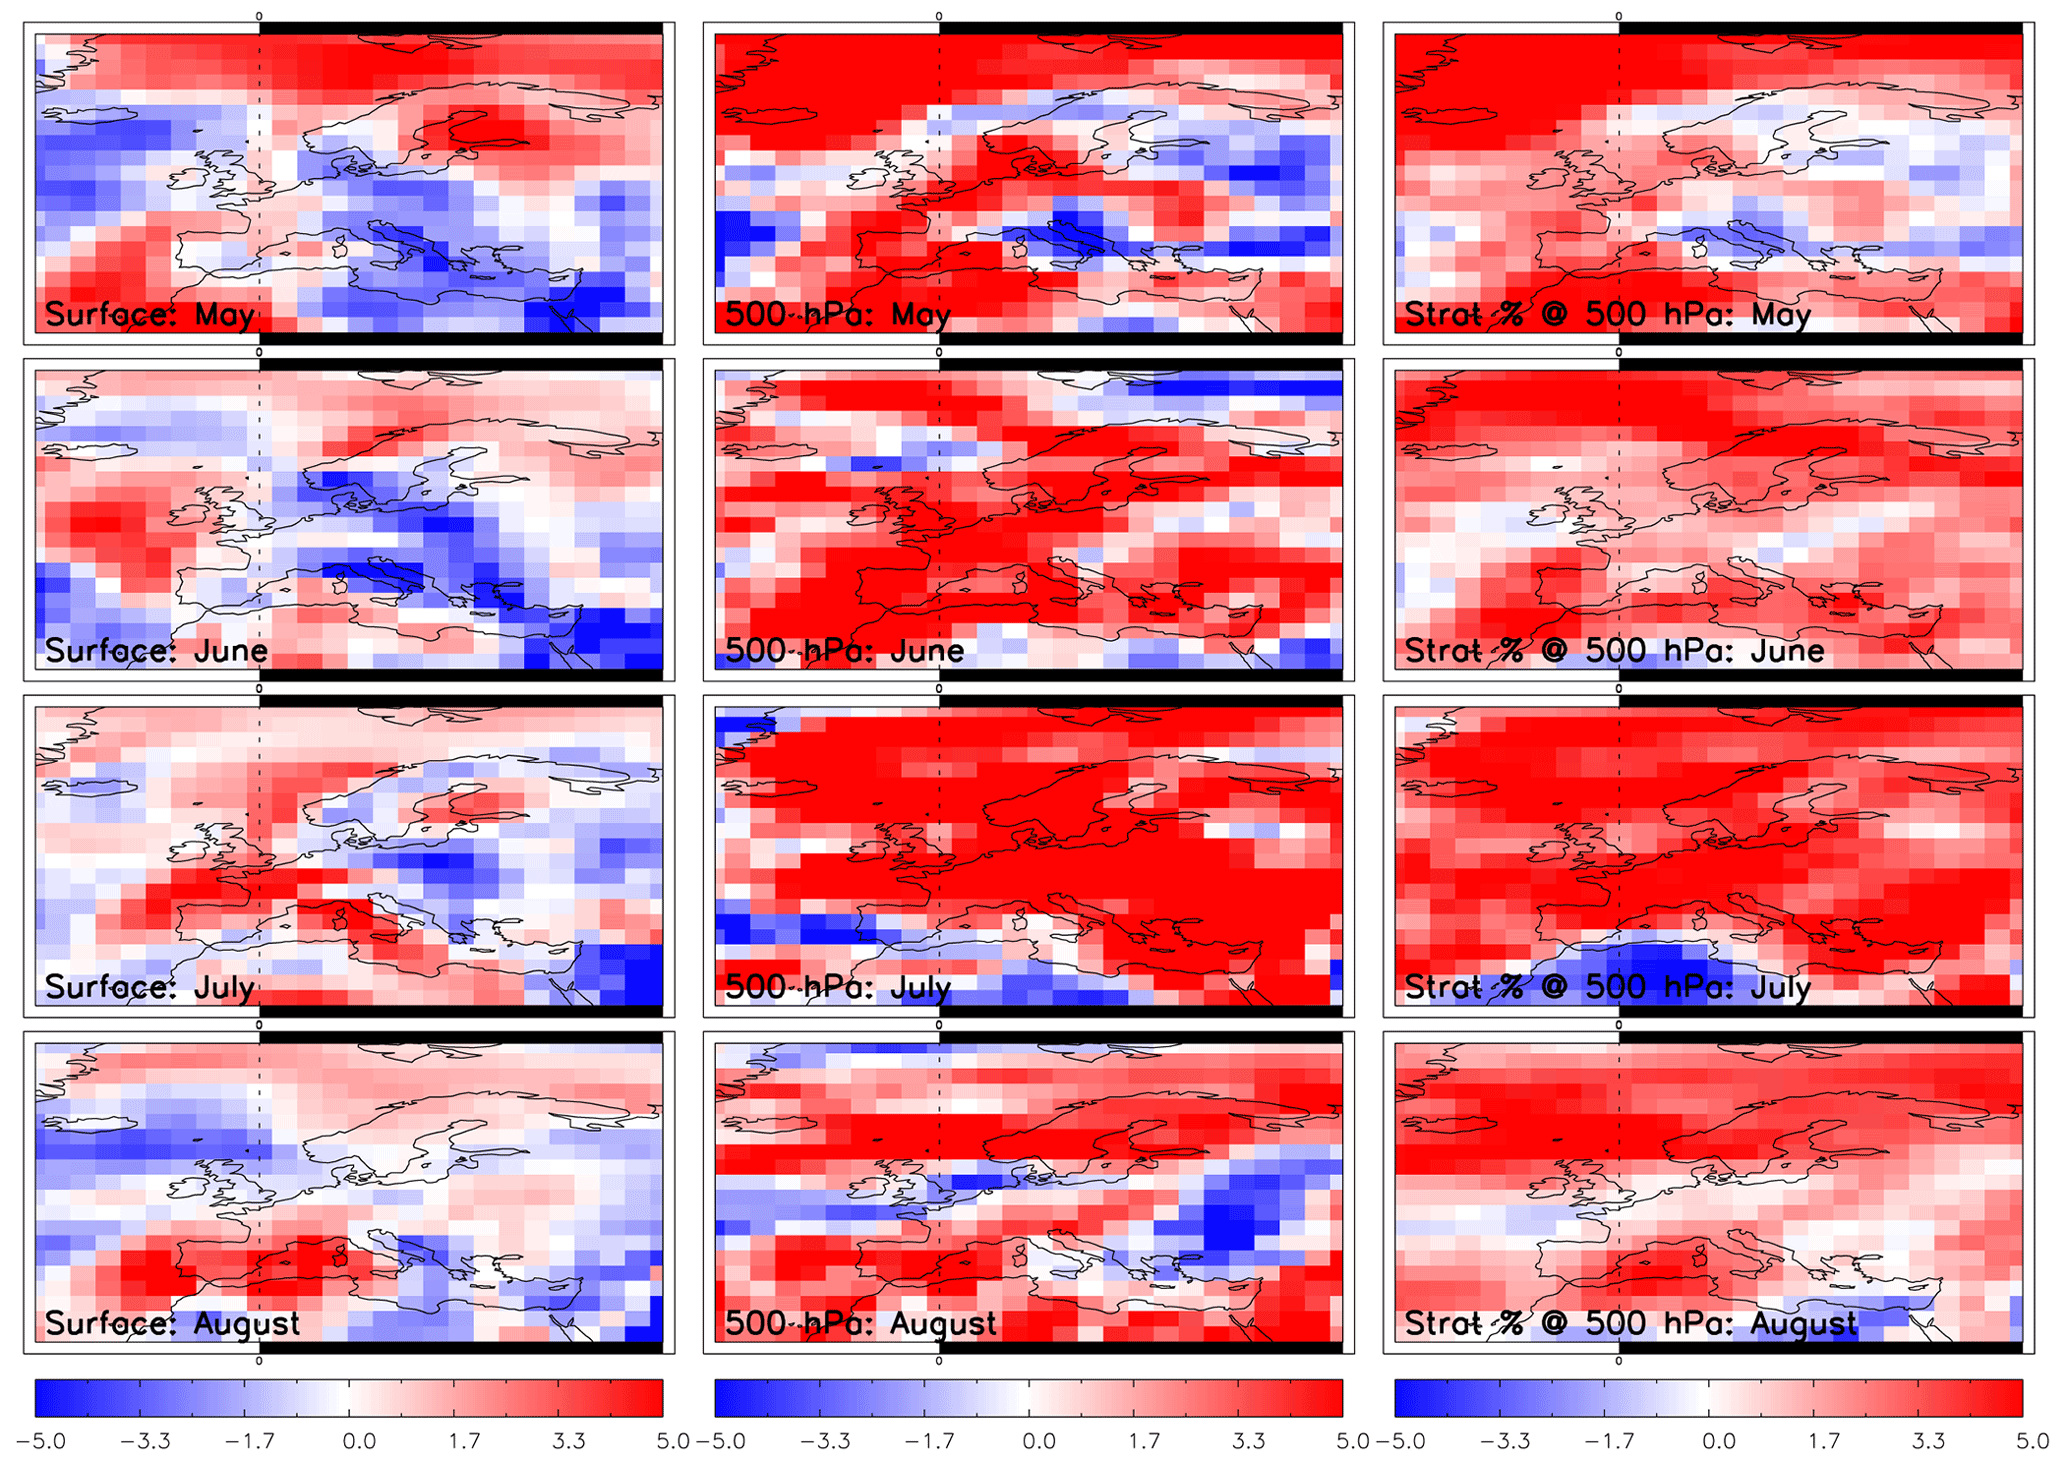
Figure 6TOMCAT ozone (ppbv) 2018–2017 differences for May to August for the surface (left column), 500 hPa (centre column) and the stratospheric contribution (%) to the 500 hPa layer (right column).
At the surface (Fig. 6), TOMCAT CTL_DIFF (i.e. Met18_Emis18–Met17_Emis17) suggests that O3 is enhanced in May over Scandinavia (2.0 to > 5.0 ppbv), north-western Europe (0.0–2.0 ppbv), the Arctic Ocean (> 5.0 ppbv) and off the coast of the Iberian Peninsula (3.0–5.0 ppbv). However, negative values exist over eastern Europe (−3.0 ppbv to −1.0 ppb) and the Atlantic west of Ireland (−3.0 ppbv to −1.0 ppb). In June, the negative differences persist in eastern Europe (−3.0 ppbv to −1.0 ppb), but positive differences are located over northern Scandinavia (1.0–2.0 ppbv) and the North Atlantic (2.0–4.0 ppbv). For July, CTL_DIFF shows the largest enhancements over continental Europe (i.e. Po Valley, France, Benelux region and Iberian Peninsula) and the UK (> 5.0 ppbv). Negative differences of between −3.0 and −1.0 ppbv remain over eastern Europe. In August, the only clear differences are over the Iberian Peninsula and the western Mediterranean, ranging between 3.0 and > 5.0 ppbv. Overall, TOMCAT simulates subregional surface O3 enhancements over Europe, which are generally consistent with EMEP observations apart from several sites over eastern Europe.
At 500 hPa, TOMCAT CTL_DIFF shows larger-scale O3 enhancements in 2018 compared to 2017 (> 5.0 ppbv) throughout May to August. In May and August, there are, however, a few negative differences (−5.0 to −3.0 ppbv) over far eastern Europe. In June and July, the full domain is more or less dominated by O3 enhancements in 2018. In Figs. 3 and 4 (and SM 5 in the Supplement), GOME-2 and IASI (and TOMCAT with the instrument averaging kernels (AKs) applied to account for the vertical sensitivity of the retrievals; see SM 5 in the Supplement for more information) show SCO3 enhancements during these months of 2018. Given the vertical extents and peak heights of their retrieval sensitivities and consistency in spatial patterns (Figs. S9 and S11), it is evident that the O3 enhancements detected by GOME-2 and IASI extend over the free troposphere. The model shows large-scale O3 enhancements in the free troposphere and similar patterns to GOME-2 and IASI when averaging kernels applied. So, the model corroborates this finding from the satellite retrievals. Signals from EMEP and TOMCAT at the surface, on the other hand, are more mixed across the domain.
The right-hand column of Fig. 6 shows the relative difference in the stratospheric O3 contribution to the 500 hPa O3 layer (i.e. Strat % at 500 hPa), from CTL_DIFF, between 2017 and 2018. Here, the percentage of stratospheric O3 contributing to the O3 concentration at the 500 hPa is calculated for 2017 and 2018 and then the 2018–2017 difference determined. The largest enhancement to the 500 hPa layer was in July where the stratospheric O3 contribution increased by 3.0 % to > 5.0 % across Europe. In June and August, the spatial patterns are similar with stratospheric O3 contribution enhancements of 3.0 %–5.0 % across southern Europe, Scandinavia and the North Atlantic (above the UK). In the North Atlantic, UK and northern Europe, there are near-zero changes in June and August. In May, there are enhancements > 5.0 % across the northern region of the domain and northern Africa, while there are smaller enhancements (1.0 %–3.0 %) over the UK and near-zero changes over eastern Europe. This is partially supported by analysis of TCO3 (see SM 3 in the Supplement) where there are reasonable spatial correlations (∼ 0.5 to 0.6) between the SCO3 2017–2018 summer differences and the equivalent for TCO3. Therefore, these results indicate a potentially enhanced contribution of stratospheric O3 into the mid-troposphere during the summer of 2018 across Europe.
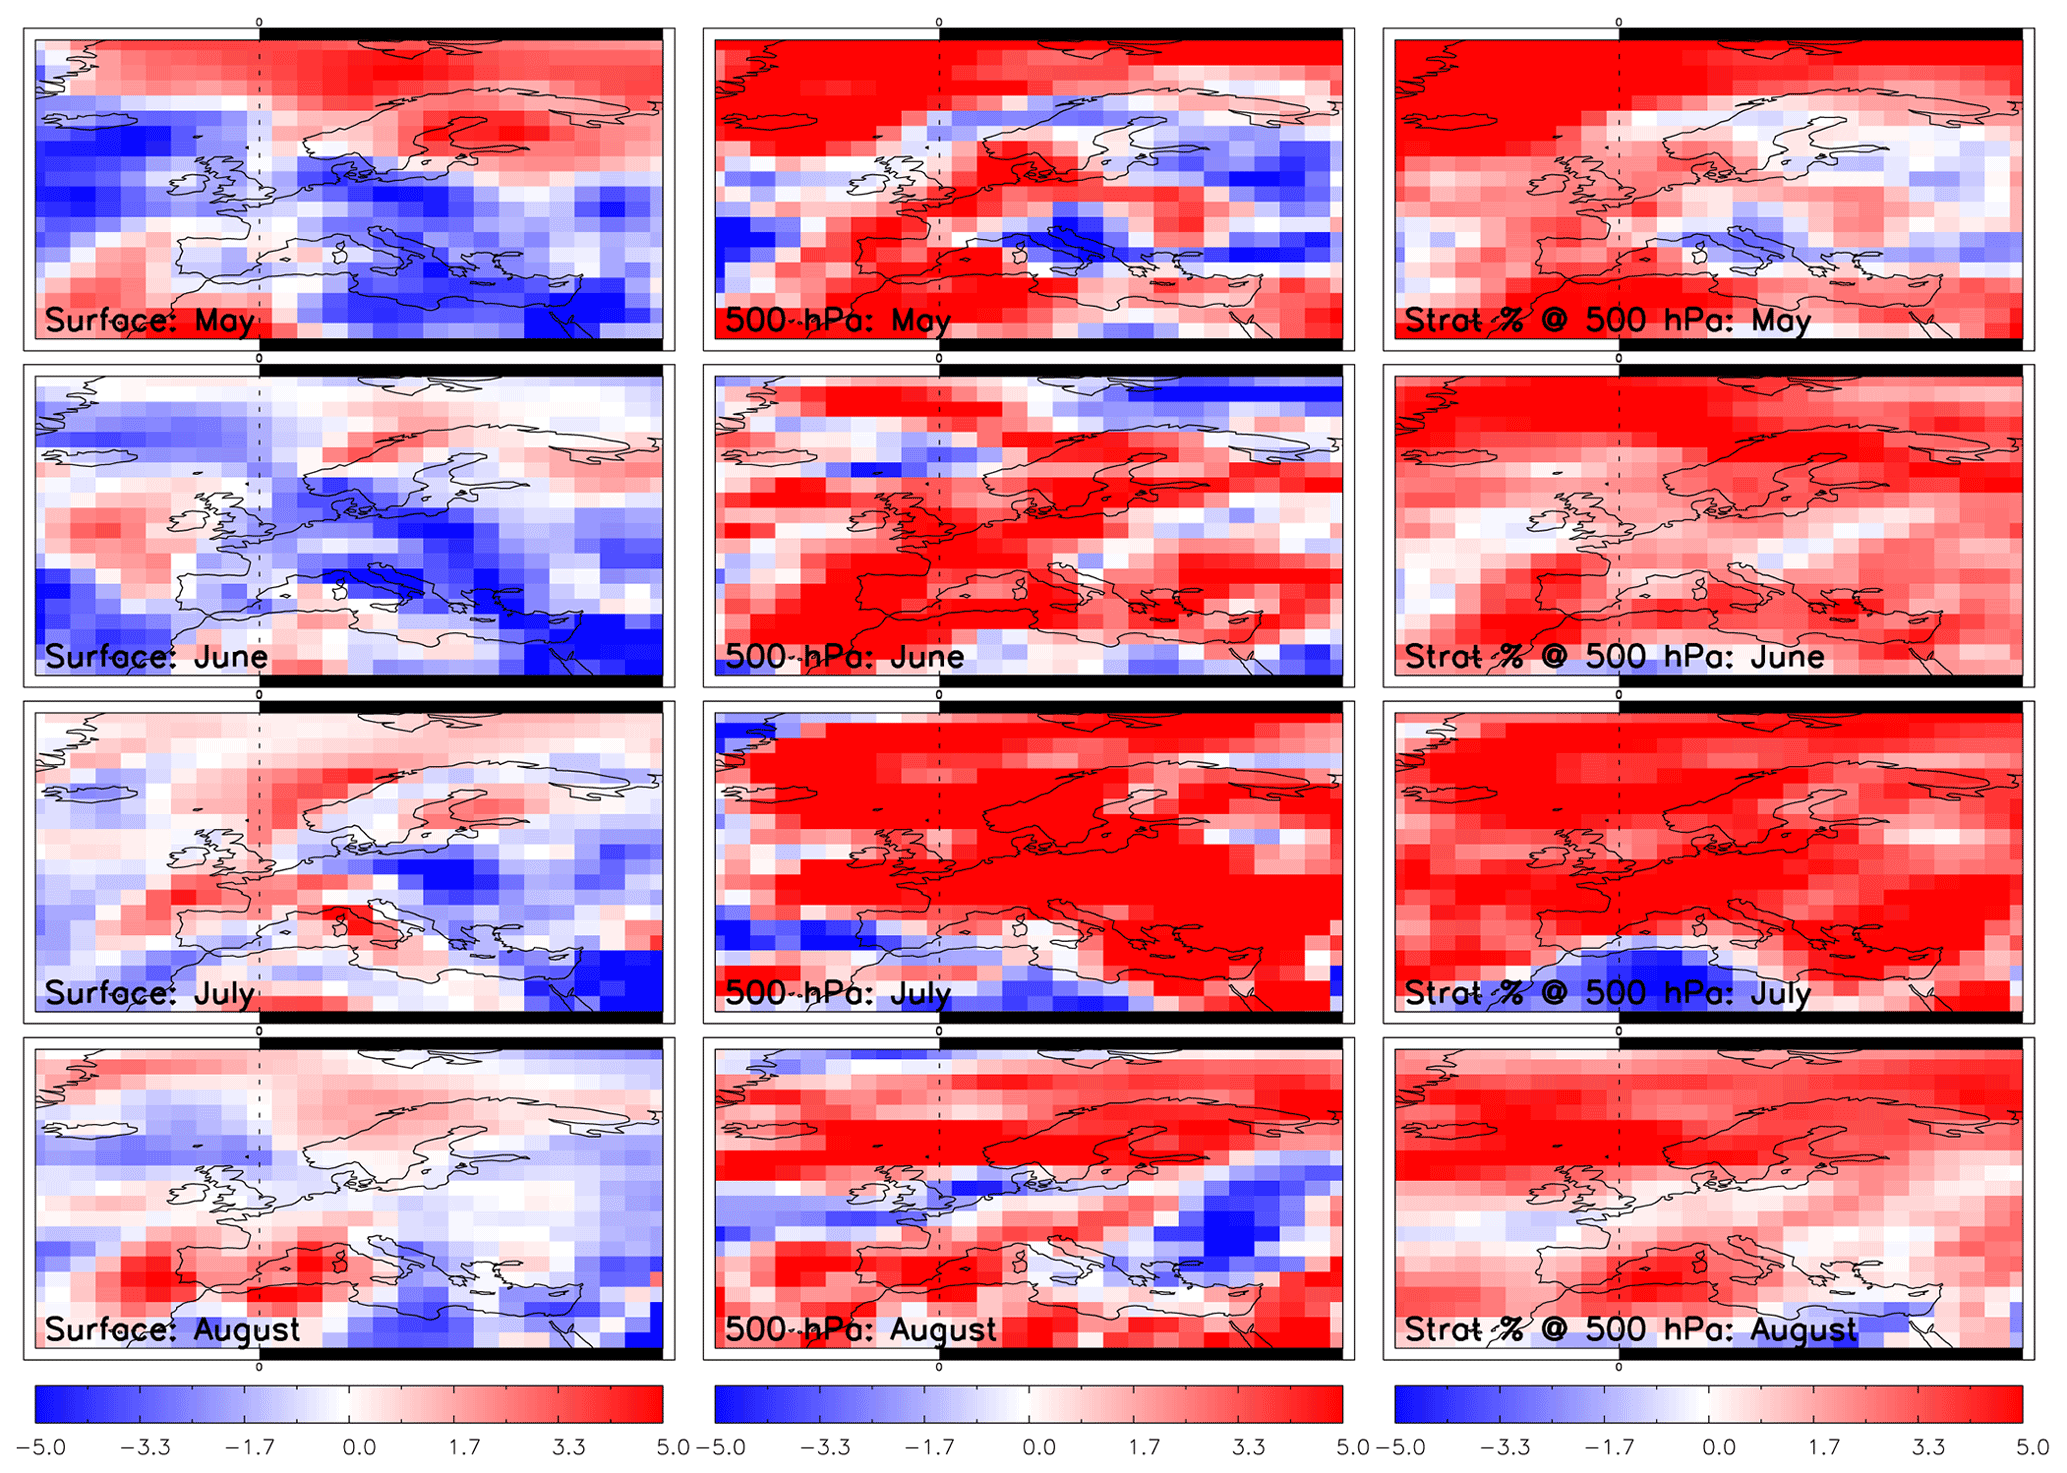
Figure 7TOMCAT ozone (ppbv) 2018–2017 differences for May to August for the fixed emissions simulation (Fixed_EMIS) for the surface (left column), 500 hPa (centre column) and the stratospheric contribution (%) to the 500 hPa layer (right column).

Figure 8TOMCAT ozone (ppbv) 2018–2017 differences for May to August for the fixed meteorology simulation (Fixed_MET) for the surface (left column), 500 hPa (centre column) and the stratospheric contribution (%) to the 500 hPa layer (right column).
To quantify the separate importance of precursor emissions and meteorology in governing the summer 2018 O3 enhancements, we compare the sensitivity experiments with the control runs. Figure 7 (left column) shows the results for the fixed emissions differences (i.e. FIXED_EMIS_DIFF) between years (i.e. Met18_Emis17 – Met17_Emis17). At the surface, the FIXED_EMIS_DIFF shows similar spatial patterns to that of CTL_DIFF (Fig. 6 – left column). The domain spatial difference correlations between these simulations are greater than 0.96 for all months considered. However, FIXED_EMIS_DIFF (Fig. 7 – left column) tends to be lower than CTL_DIFF (Fig. 6 – left column) by approximately 0.0–2.9 ppbv (i.e. positive red regions are weaker and negative blue regions stronger in intensity). Therefore, the Met18_Emis17 run struggles to reproduce the absolute surface O3 enhancements in the Met18_Emis18 run. When the fixed meteorology differences (FIXED_MET_DIFF, i.e. Met18_Emis18 – Met18_Emis17; Fig. 8 – left column) are compared with CTL_DIFF, the surface 2018–2017 differences are substantially different.
Surface FIXED_MET_DIFF ranges between 0.0 and 2.0 ppbv across the domain in May and June and is more confined to continental Europe in July and August. This shows that TOMCAT simulates lower 2018 summertime O3 when 2017 emissions are used and indicates that emissions do have some role in controlling O3 levels at the surface. However, as the spatial difference pattern for FIXED_MET_DIFF (Fig. 8 – left column) is different to that of CTL_DIFF (Fig. 6 – left column), spatial correlations between them range from −0.53 to 0.54 over the 4 months, which suggests that meteorology is important in governing the spatial distribution of CTL_DIFF. This is supported by the fact that FIXED_MET_DIFF–CTL_DIFF (Fig. 8 left column – Fig. 6 left column) yields absolute domain variations between 0.0 and 12.2 ppbv. Therefore, the two sensitivity experiments suggest meteorology and emissions both play important roles in controlling surface O3 during the summer of 2018, but meteorology predominantly governs the spatial pattern and absolute magnitude of the O3 enhancements.
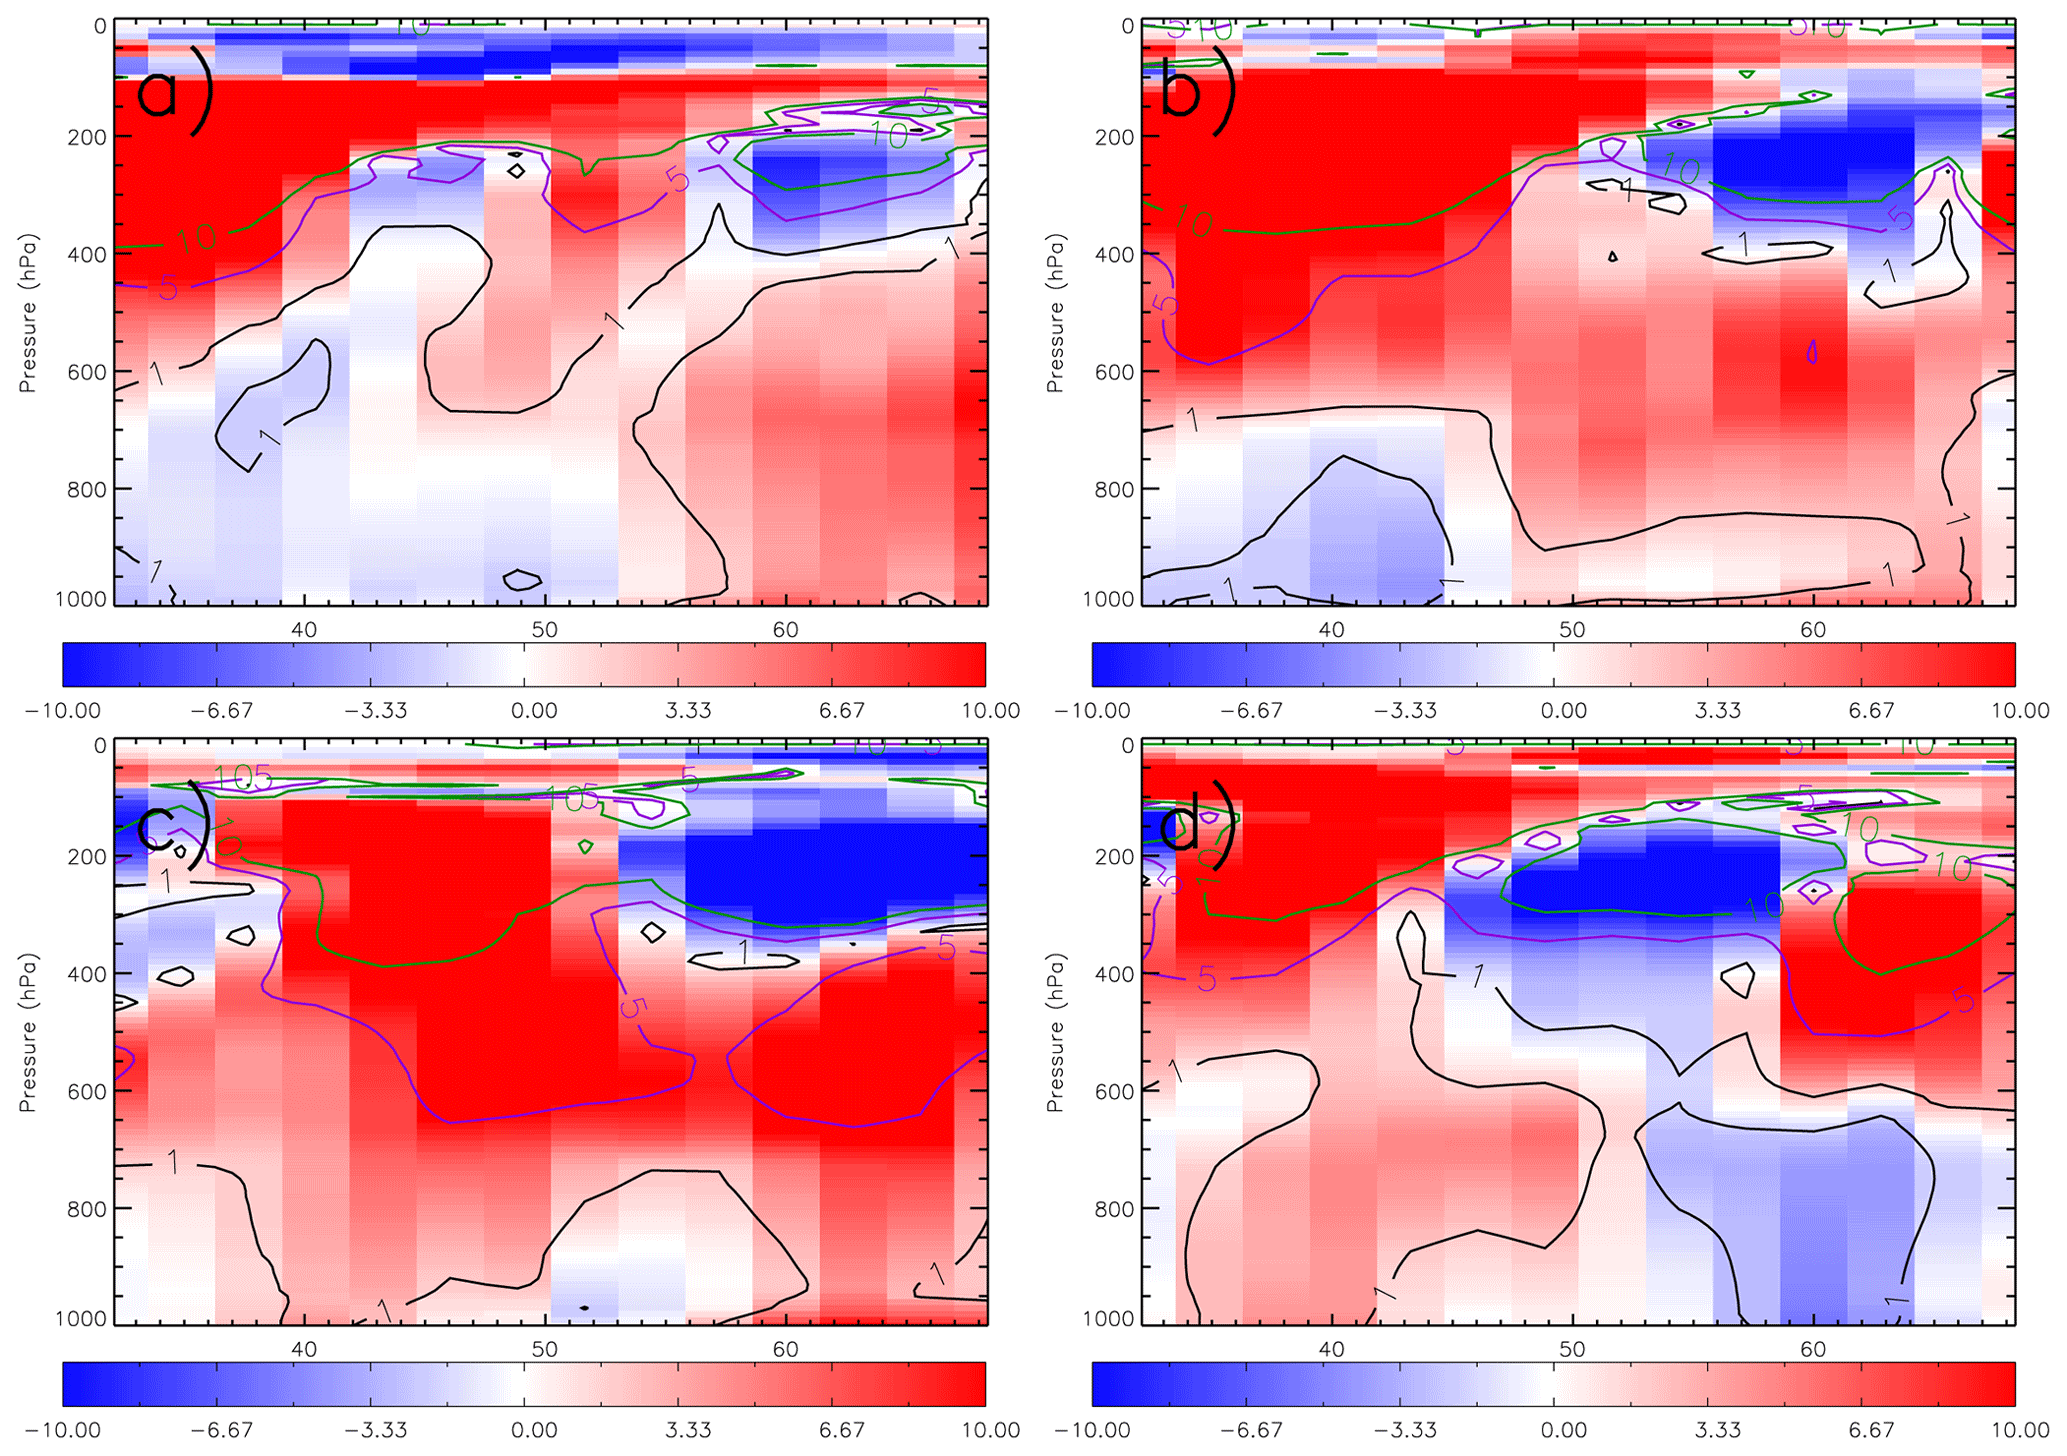
Figure 9TOMCAT ozone, zonally averaged between 20∘ W and 40∘ E, 2018–2017 percentage differences (absolute difference (ppbv) shown as solid lines) from the control simulation. Panels (a–d) represent the monthly averages for May, June, July and August.
At 500 hPa, comparison of FIXED_EMIS_DIFF and CTL_DIFF shows very consistent spatial patterns across the 4 months with correlations all above 0.98. In terms of the absolute differences between FIXED_EMIS_DIFF and CTL_DIFF (i.e. Fig. 7 centre column – Fig. 6 centre column), it peaks at approximately 2.8 ppbv. For FIXED_MET_DIFF, the spatial correlation with CTL_DIFF, as for the surface, is variable with values between −0.38 and 0.43. The absolute differences between FIXED_MET_DIFF and CTL_DIFF (i.e. Fig. 8 centre column – Fig. 6 centre column) range from 0.0 to 14.8 ppbv. Therefore, emissions have a secondary role in controlling the O3, while meteorology is by far the dominant factor. For Strat % at 500 hPa, the spatial correlations between CTL_DIFF and FIXED_EMIS_DIFF are above 0.95 for all months, and the absolute differences between them (i.e. Fig. 7 right column – Fig. 6 right column) are near-zero. Comparison of FIXED_MET_DIFF and TC_CTL shows spatial difference correlations ranging between −0.33 and 0.71 and absolute differences (i.e. Fig. 8 right column – Fig. 6 right column) peaking at 12.9 %. Therefore, as expected, meteorological processes are dominating the influence of the stratospheric O3 contribution (i.e. through stratosphere–troposphere exchanges) to the 500 hPa layer during the summer 2018 O3 enhancements over Europe.
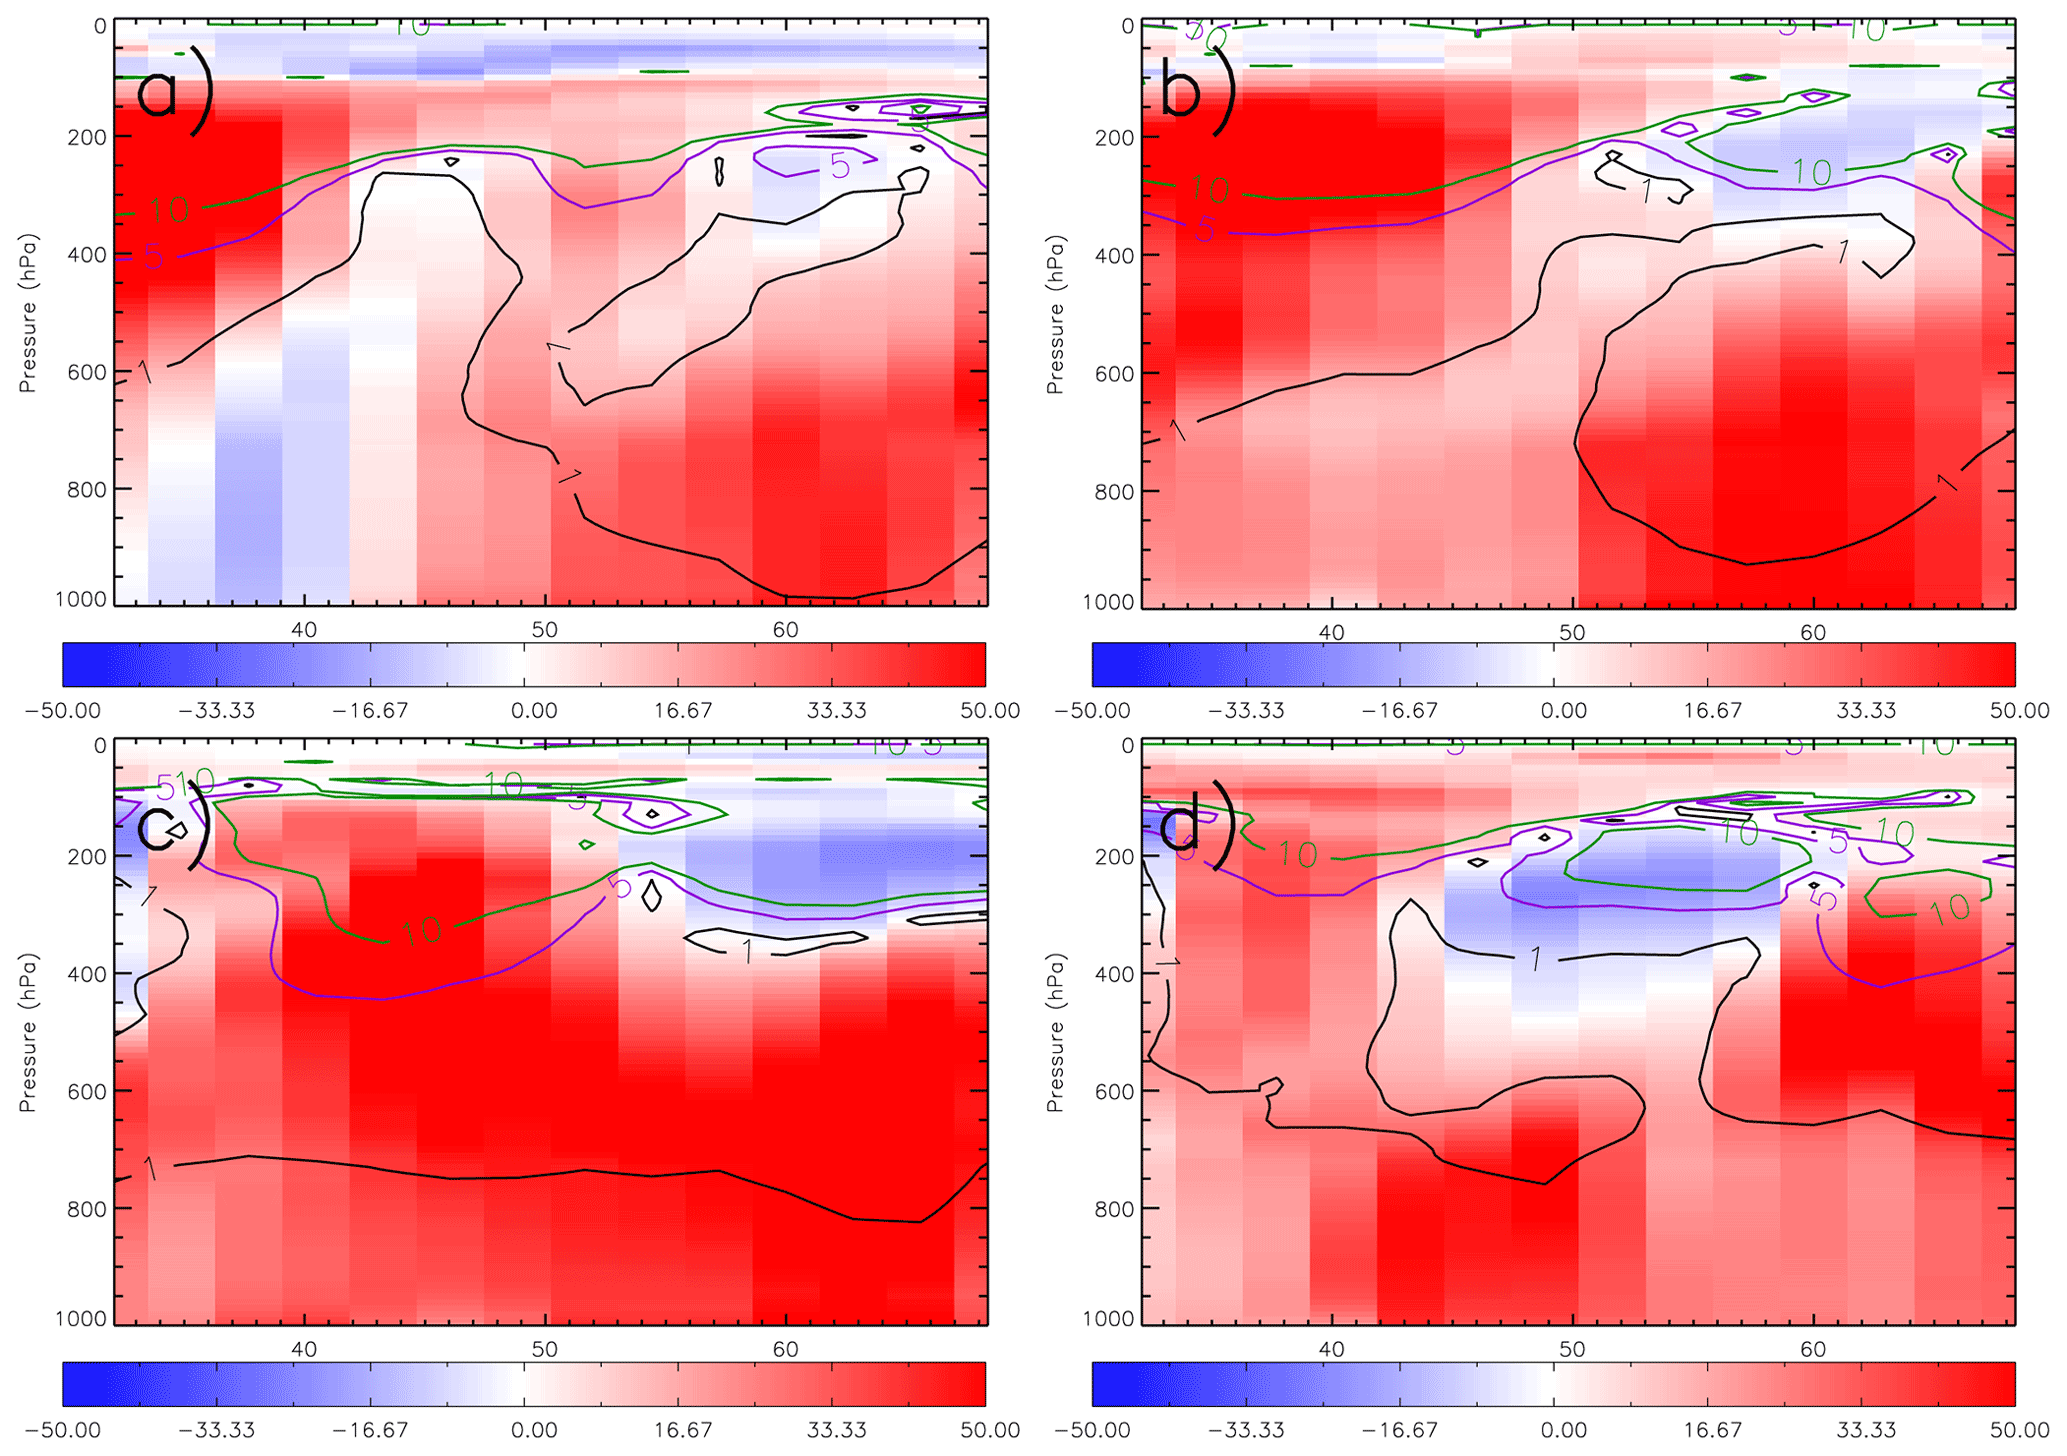
Figure 10TOMCAT stratospheric ozone tracer, zonally averaged between 20∘ W and 40∘ E, 2018–2017 percentage differences (absolute difference (ppbv) shown as solid lines) from the control simulation. Panels (a–d) represent the monthly averages for May, June, July and August.
To investigate the importance of stratospheric–troposphere exchange to the middle troposphere enhancement (i.e. as shown in the TOMCAT 500 hPa layer and the satellite SCO3 data), Figs. 9 and 10 show TOMCAT control run zonal 2018–2017 difference cross-sections (for the domain longitudes) of O3 profiles and the stratospheric O3 contribution to each pressure layer. In May and June, in the lower troposphere (approximately surface to 800 hPa), there are negative (−3.0 % to 0.0 %) and positive (0.0 % to 3.0 %) differences between 30–50∘ N and 50–70∘ N, respectively. During June, there are positive differences (0.0 % to 5.0 %) across most latitudes, and in August the opposite occurs to that of May/June. In the mid-troposphere (800–300 hPa), positive differences occur in most months (0.0 %–5.0 % in May, 0.0 %–7.0 % in June, > 10 % in July and 5.0 %–10.0 % in August), though in May and August negative differences (−5.0 % to 0.0 %) exist around 40 and 55∘ N. This is consistent with the 500 hPa O3 differences in Fig. 6 (centre panels). In the upper troposphere–lower stratosphere (UTLS, approximately 300–100 hPa), there are limbs of positive O3 differences (i.e. > 10 %, 5.0–10.0 ppbv) propagating into the mid-troposphere (30–40∘ N in May, 30–50∘ N in June, 40–50∘ N in July and 30–40∘ N and 60–70∘ N in August), suggestive of stratospheric intrusion into the mid-troposphere. Using the stratospheric O3 tracer in TOMCAT, Fig. 10 shows the enhanced proportion of O3 originating from the stratosphere in the summer of 2018. Interestingly, for all months (apart from May between 30–45∘ N), there are enhanced contributions of stratospheric O3 (15.0 % to > 50.0 %) in the lower–mid-troposphere (i.e. below 500 hPa). In absolute terms, this is only a minor contribution typically < 1.0 ppbv below 800 hPa. Between 800–400 hPa, this increases to 1.0–5.0 ppbv (remains relatively consistent in percentage terms) in most months and latitude bands. In the UTLS, it increases to 5.0 %–10.0 % enhancements in stratospheric O3 contributions, which is consistent with its proximity to the stratosphere. Where there are enhancements in the stratospheric O3 contribution but negative differences in O3 (e.g. in July in the lower troposphere between 50 and 55∘ N – Figs. 9 and 10), this is indicative of competing processes influencing the O3 concentrations (e.g. descent of relatively small stratospheric O3 contributions but advection of tropospheric O3 away from the region). Overall though, in the mid-troposphere, where there are larger enhancements in O3, there are similar responses in the stratospheric O3 contribution. For June, the mid-troposphere O3 enhancement is approximately 5.0–7.0 ppbv with a signal of 1.0–2.0 ppbv in the stratospheric tracer. Therefore, in the more extreme cases, the stratospheric O3 contribution is approximately 15.0 %–40.0 % to the mid-tropospheric O3 enhancements in summer 2018 over Europe. However, a separate study would be required to undertake a detailed assessment of the meteorological processes controlling the enhanced stratospheric intrusion of ozone in the summer of 2018 and how it compares to other years (how does it compare with years other than 2017?).
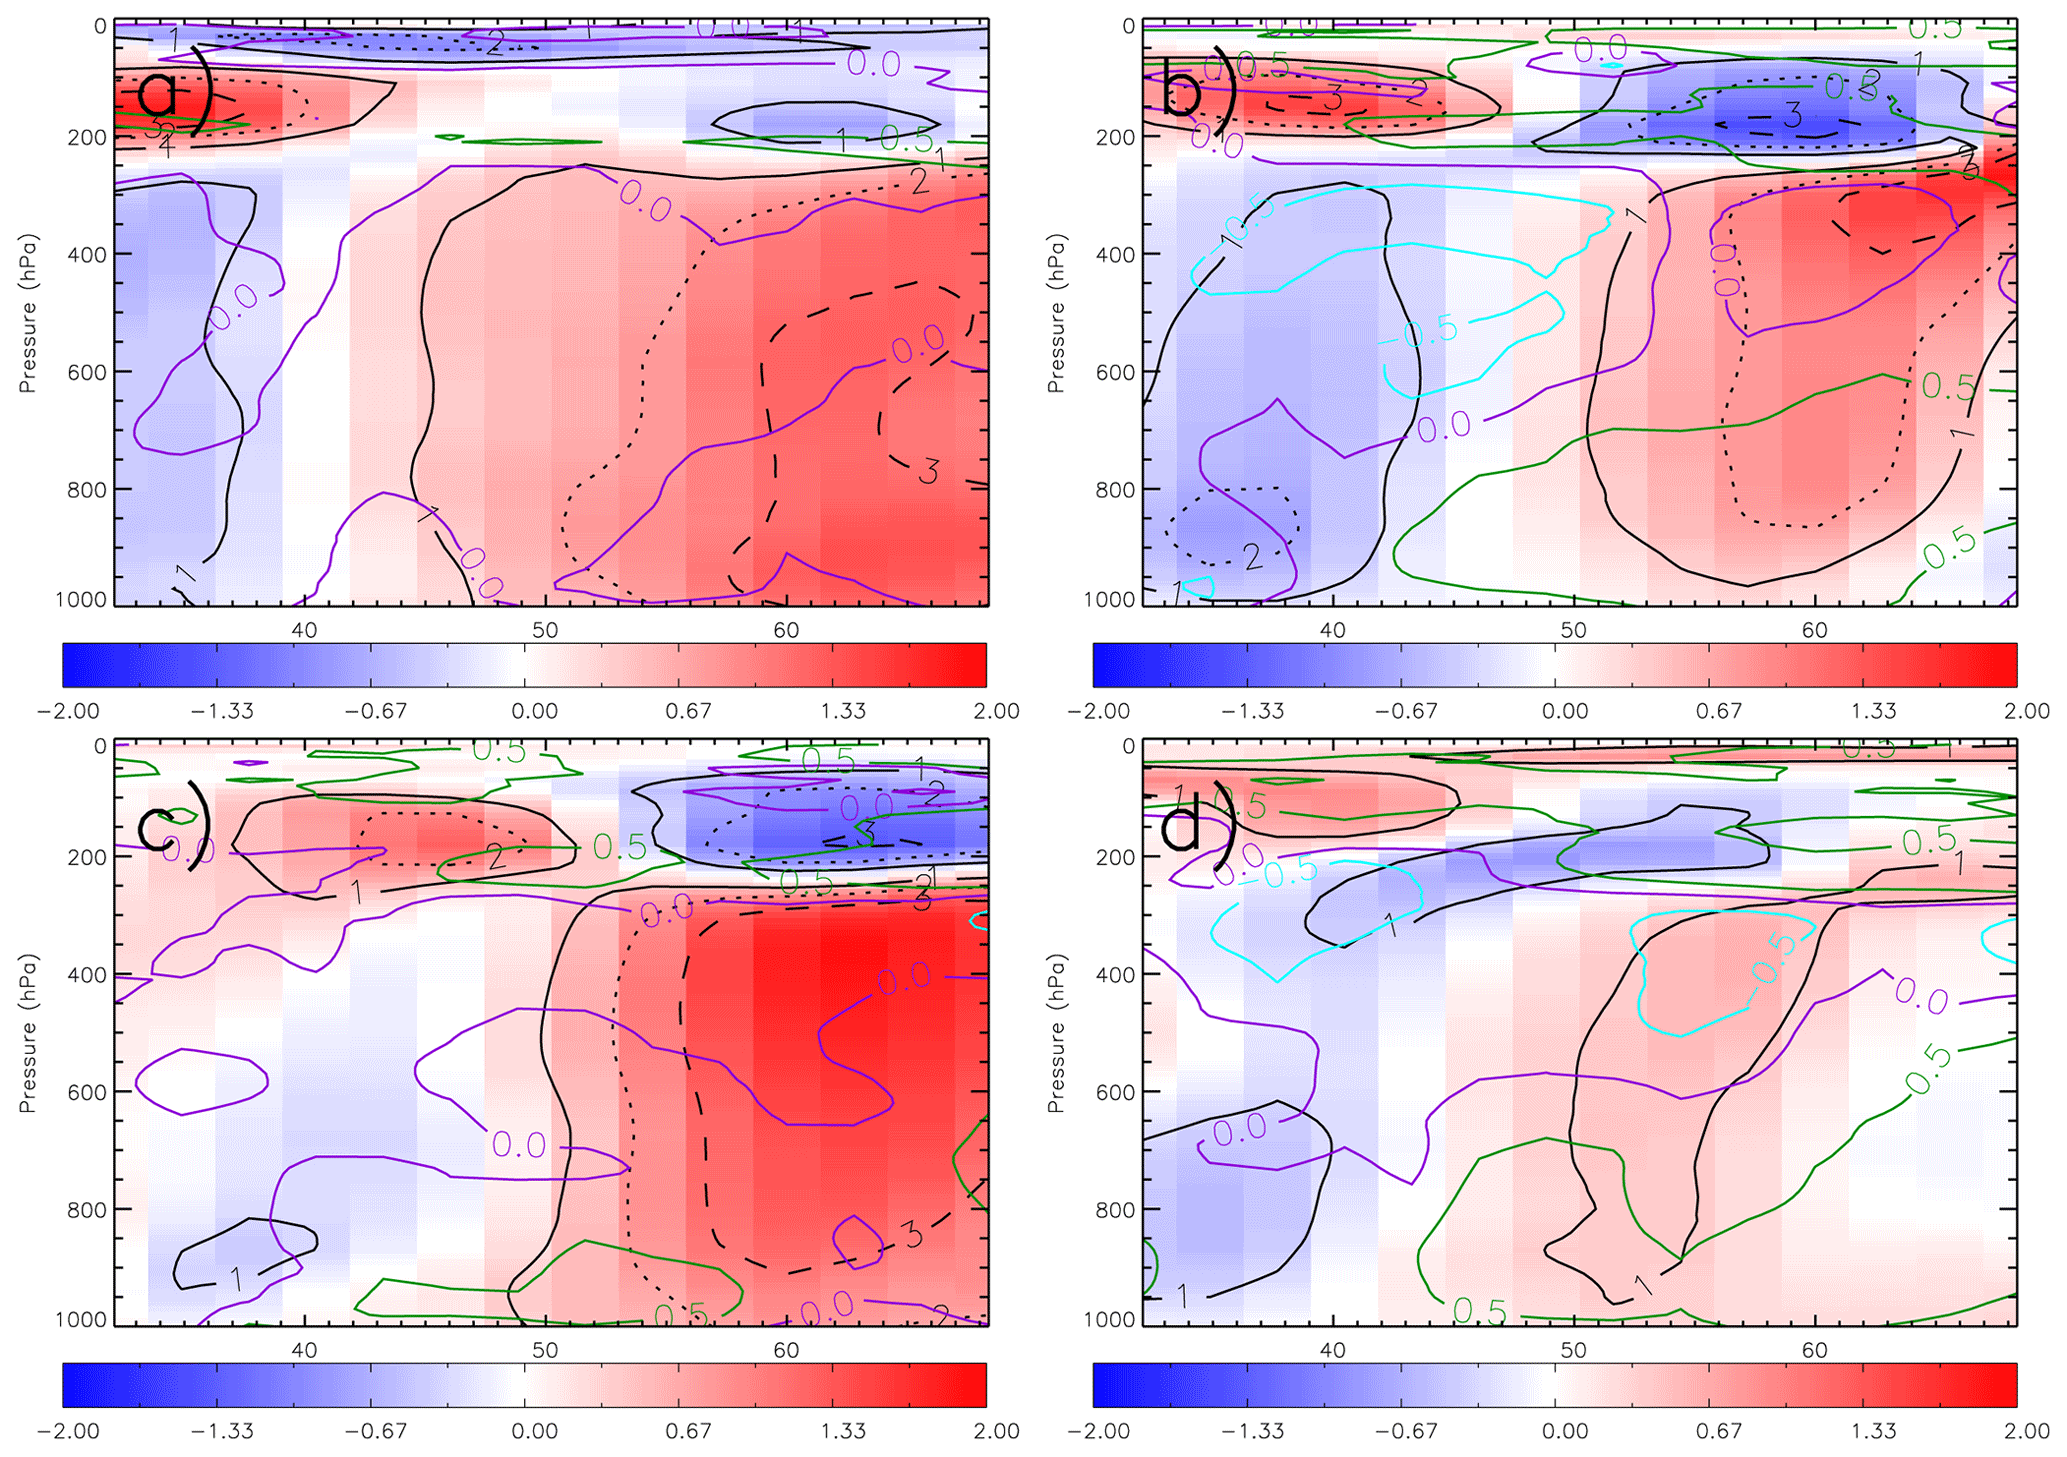
Figure 11TOMCAT temperature, zonally averaged between 20∘ W and 40∘ E, 2018–2017 percentage differences (absolute difference (K) shown by black solid, dotted and dashed lines) from the control simulation. Overplotted are contours of the temporal correlation (i.e. within each grid box) between the temperature and ozone 2018–2017 differences. Panels (a–d) represent the monthly averages for May, June, July and August.
The two remaining factors, linked to meteorological processes (as suggested above), which may affect the O3 enhancements in 2018, are increased summer temperatures (e.g. through enhanced kinetic rates) and the import of tropospheric O3 from upwind (e.g. North America from the prevailing winds). Figure 11 shows the 2017–2018 zonal temperature differences (i.e. same as Fig. 9 but for temperature) with the correlation between the 2017 and 2018 temperature and O3 differences overplotted. Qualitatively, the zonal differences in O3 and temperature have some similarities. There are positive differences (temperature differences of 0.0 %–1.0 %) between 50–60∘ N at the surface and 400 hPa in May and June. Then in July, collocated positive differences (peaking at 2.0 % or 3.0 K) exist between 50–70∘ N from the surface to 300 hPa. In August, there is no clear relationship between temperature and O3 enhancements. In all months (to a lesser extent in August), in the UTLS, there are spatial agreements with positive differences between approximately 30–45∘ N and negative differences between 50/55–70∘ N. In terms of correlations (i.e. temporal correlation in each grid box using the TOMCAT 6-hourly time series), the spatial agreement is relatively weak. In all months, most of domain has relatively small values ranging between −0.5 and 0.5. There are only a few locations with strong correlations (i.e. > 0.5), which are in the UTLS or in the lower–mid-troposphere between 50–70∘ N (June and August) and 45–55∘ N in July near the surface. Overall, the relationship between increased temperatures and enhanced kinetic rates yielding more ozone formation is non-linear, so it is unsurprising that the direct comparisons of temperature and ozone 2018–2017 differences above show no clear pattern. Therefore, future work could include a further sensitivity experiment running TOMCAT for 2018, but with 2017 temperatures used in the chemistry routines to quantify the role of temperature in the summer 2018 O3 enhancements.
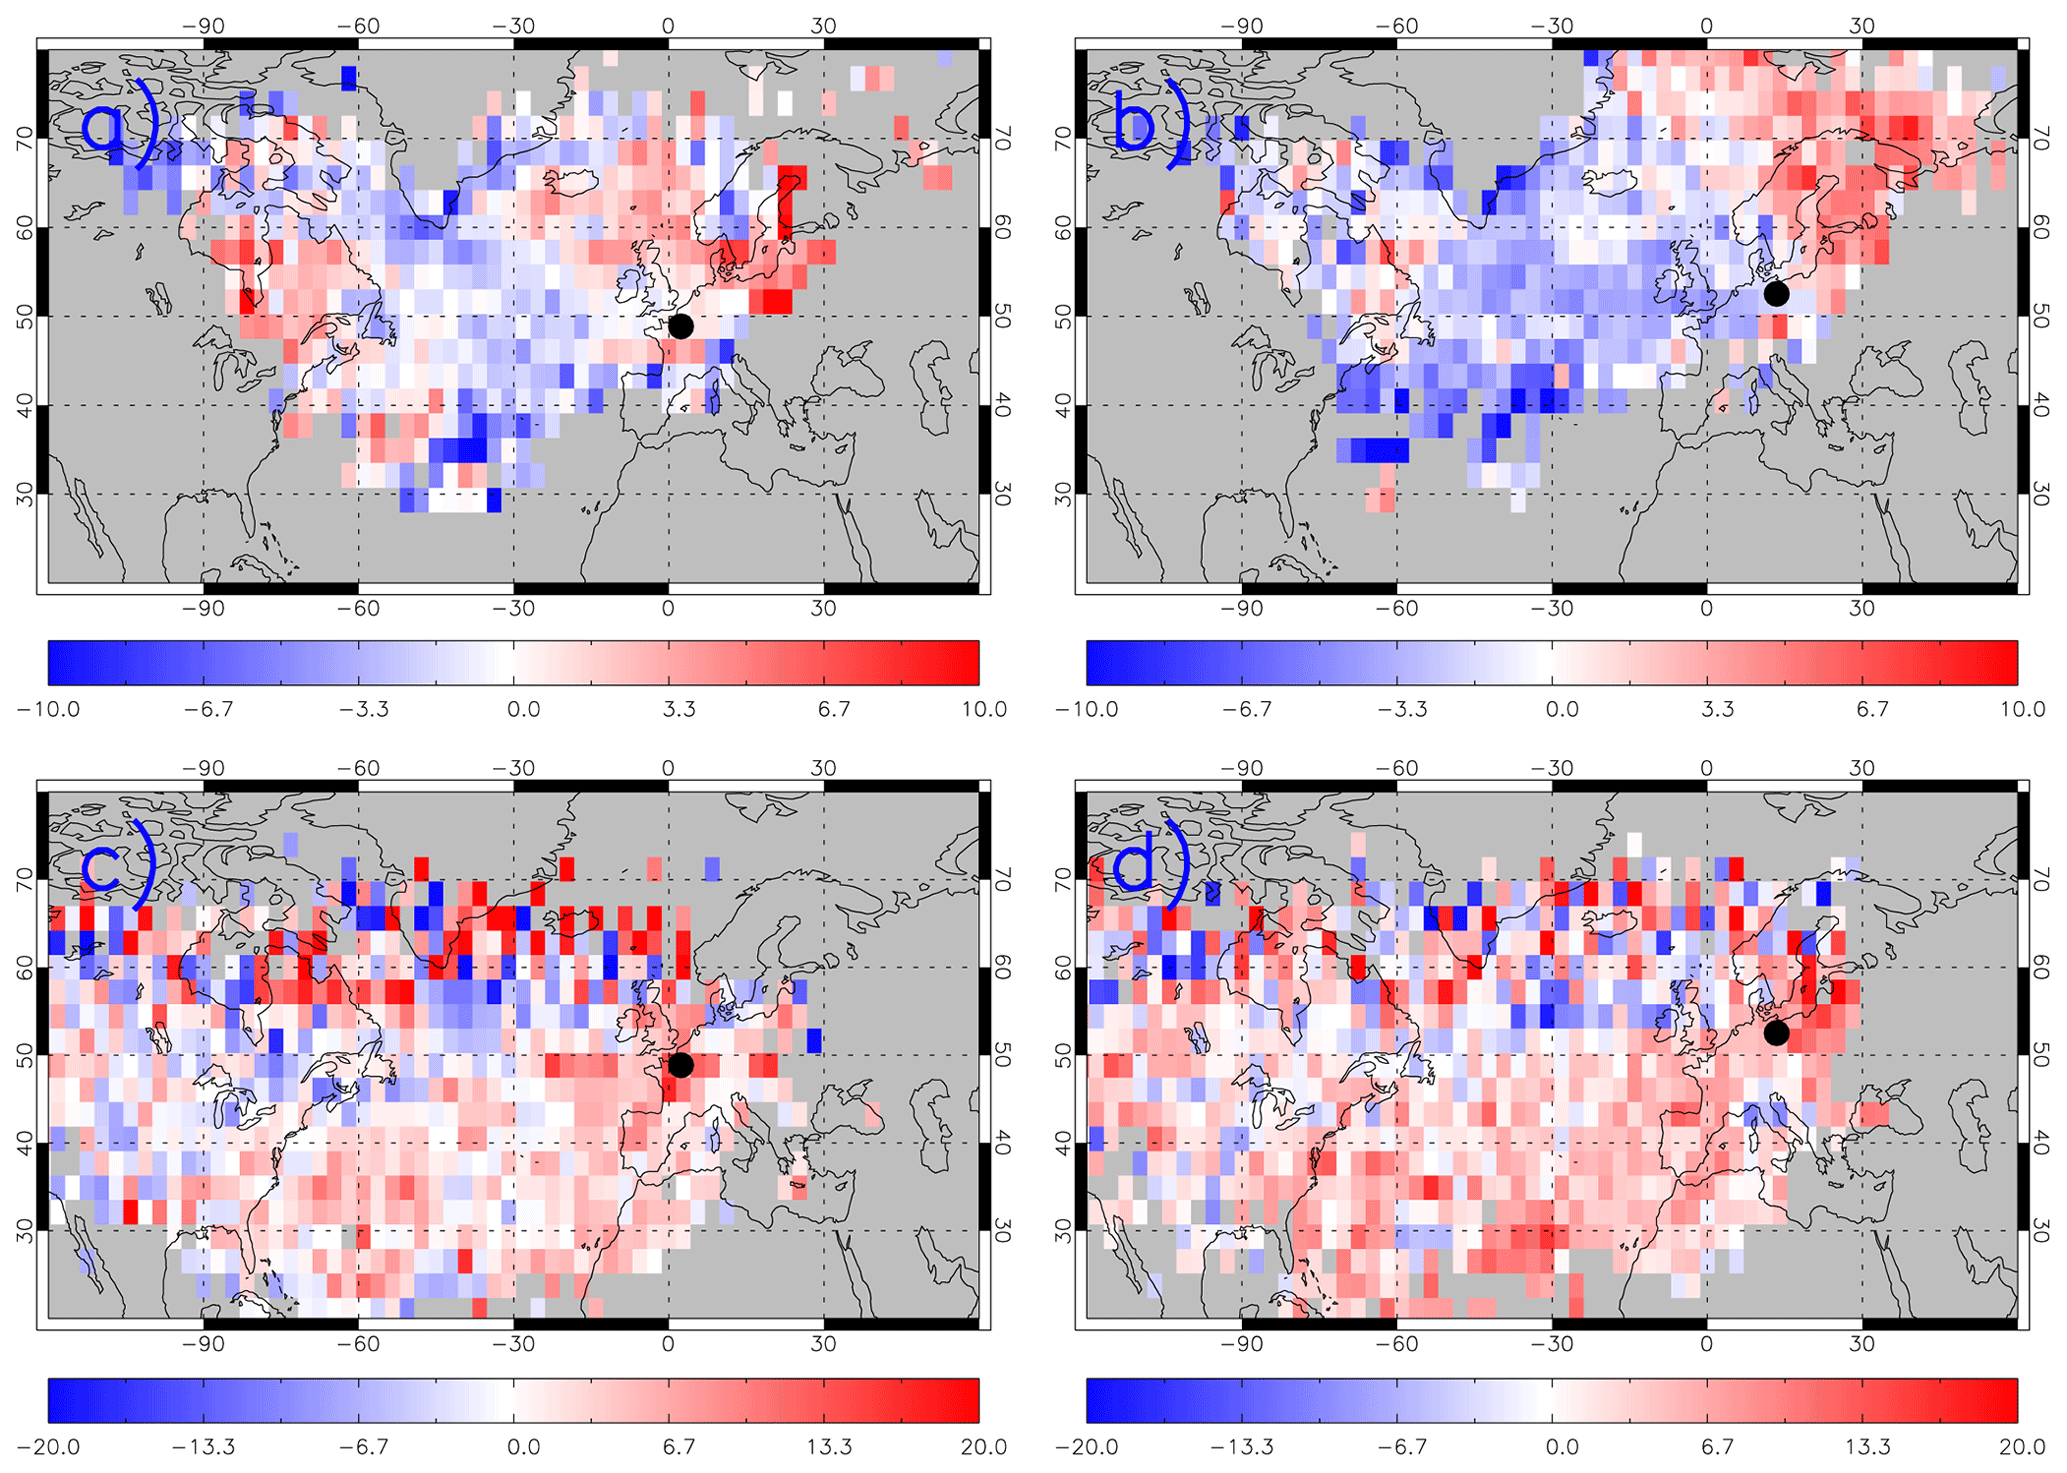
Figure 12The difference between May–August 2018 and May–August 2017 (i.e. 2018–2017) ROTRAJ back-trajectories (10 d), weighted by the average TOMCAT O3 (ppbv) concentration along each trajectory path, gridded onto the TOMCAT horizontal resolution for (a) Paris at the surface, (b) Berlin at the surface, (c) Paris at approximately 500 hPa and (d) Berlin at approximately 500 hPa. The black circles represent the location of Paris or Berlin, where the trajectories were released from.
To investigate the potential advection of tropospheric O3-rich air masses into Europe, we have used ROTRAJ back-trajectories to determine the O3-WBTs (i.e. an indicator of air mass O3 content). As shown in SM 6, there is large variability in the O3-WBT values and spatial distribution (i.e. Figs. S13 and S14), so they have to be gridded onto the TOMCAT horizontal resolution (see Figs. S15 and S16). While this approach does not directly account for the frequency of trajectory points in each grid box, Figs. S13 and S14 show there is widespread coverage across the North Atlantic. This results in > 500 trajectory points near the receptor sites (i.e. Paris and Berlin), ∼ 100 trajectory points around the edge of Europe and 25–50 trajectory points in the North Atlantic (not shown here). Overall, this spatial distribution is relatively consistent and does not change substantially between years (typically 10 %); thus this approach is suitable in this study. Figure 12 shows the differences (2018–2017) between the gridded O3-WBTs where the back-trajectories have been released at the surface from Paris (Fig. 12a), at the surface from Berlin (Fig. 12b), at approximately 500 hPa from Paris (Fig. 12c) and at approximately 500 hPa from Berlin (Fig. 12d). We selected Paris and Berlin as they are situated in central Europe, where the summer 2018 O3 enhancements were observed, while the surface and 500 hPa are the altitudes of primary focus in the modelling work.
At the surface, Paris and Berlin show consistent patterns. Over the North Atlantic (i.e. origin of the prevailing winds into Europe), there are typically negative O3-WBT values between −5.0 and −1.0 ppbv suggesting that advection of O3 into Europe during the summer (i.e. May–August) was predominantly larger in 2017 and did not strongly contribute to the 2018 observed surface O3 enhancements. Advection of O3-rich air in 2018 did originate from Scandinavia into continental Europe, though the number of trajectories is relatively low (see Fig. S13). As both locations show similar relationships, it provides confidence in this methodology. At 500 hPa, the 50–60∘ N spatial pattern is less defined with values typically between −5.0 and 5.0 ppbv for both locations. However, in the southern North Atlantic (30–50∘ N) there are positive differences of approximately 3.0–10.0 ppbv for both release locations. Note that as free-tropospheric winds tend to have larger horizontal velocities, the back-trajectories generally start from further away, closer to North America. Again, given the broad similarity in differences between both release locations, it provides confidence in this approach. Overall, our results indicate a larger transport of O3 to the surface of continental Europe in 2017, while at approximately 500 hPa the import of O3 into Europe is larger in 2018. Here, the positive differences originate from the southern North Atlantic (i.e. a larger range of locations, absolute values and homogeneous signal than the mixed differences between 50–60∘ N).
One potentially important factor is dry deposition of O3 to the land surface. Due to the heatwave, stress on the biosphere and the associated dieback of vegetation could potentially reduce the efficiency of O3 deposition, decreasing the O3 sink (i.e. O3 is more likely to deposit onto land covered by vegetation than bare soil). Investigation of the normalized difference vegetation index (NDVI), from the IMS scheme, between the summers of 2017 and 2018 did not highlight any spatially coherent changes (not shown here). As a result, there is no obvious large-scale spatial vegetation dieback in 2018 due to the heatwave and thus the impact this would have on ozone deposition in TOMCAT. Therefore, we ran two further experiments where the bare-soil fraction for each grid box over Europe was increased and decreased by 25 % in summer 2018. This was to investigate the sensitivity of surface ozone deposition to changes in the land surface. For the increase in bare-soil fraction there was a moderate systematic increase in European summer ozone by 0.0–1.5 ppbv (i.e. less ozone deposition). When the bare-soil fraction was decreased by 25 %, this yielded a small decrease in surface ozone by approximately 0.5 ppbv. Overall, a sizable level of vegetation dieback would be required for decreased ozone dry deposition to substantially contribute to the summer 2018 surface ozone enhancements.
The summer of 2018 produced an intense heatwave across most of Europe with a substantial impact on tropospheric temperatures, droughts, stress on vegetation and human mortality. Observations of surface temperature, precursor gases and total column O3 (TCO3) experienced enhancements in 2018 relative to 2017. In this paper, we have demonstrated a strong enhancement in surface and tropospheric O3 during the heatwave between May and August 2018. The EMEP surface data suggest an average European enhancement, relative to 2017, peaking at approximately 10.0 ppbv in July and August. Investigation of lower-tropospheric O3 (i.e. surface – 450 hPa sub-column O3 – SCO3) from the GOME-2 and IASI instruments also showed enhancements, peaking at 5.0–10.0 DU, relative to 2017. Analysis of the long-term GOME-2 SCO3 record indicates 2017 to be a suitably neutral/average reference year and the enhancement in 2018 to be anomalously large. Our comparisons were therefore made between the summers of 2017 and 2018.
Consistency between the UV (GOME-2) and IR (IASI) sounders was important to our analysis because their vertical sensitivities peak in the lower and mid-upper troposphere, respectively. The similar patterns of SCO3 enhancement detected by the two sounders therefore indicate that these extend over the bulk of the troposphere, supportive of surface/lower-tropospheric ozone enhancements. This consistency also provides confidence that the complementary vertical sensitivities of GOME-2 and IASI ozone retrievals could be exploited in further investigations of tropospheric ozone in the future (e.g. long-term trends from multiple platforms/retrieval schemes have shown large-scale inconsistencies in other studies; e.g. Gaudel et al., 2018).
Tropospheric O3 behaviour is complex, and the summer 2018 enhancements over Europe could potentially have been caused by various factors: atmospheric chemistry, meteorology (e.g. temperature, advection of O3-rich air masses), anthropogenic and natural precursor emissions, dry deposition, and stratospheric intrusion. To investigate the interactions between these processes, potentially leading to the summer 2018 O3 enhancements, we used the well-evaluated TOMCAT 3D CTM. Evaluation of the model in this study showed that it could accurately capture the spatial pattern, temporal evolution and sign (i.e. positive 2018–2017 O3 differences) of the O3 enhancements and that, although it underestimated the observed enhancements, TOMCAT is an adequate tool to investigate them.
The results of several model simulations showed that the surface ozone enhancements (mainly in north-western Europe) in the summer of 2018 were predominantly driven by meteorological processes with emissions acting as a secondary factor. As the ROTRAJ back-trajectories suggest that advection of summertime O3 was larger in 2017, the 2018 European O3 enhancements at surface level were likely from in situ processes. The TOMCAT stratospheric O3 tracer indicated a negligible contribution of stratospheric O3 to these surface enhancements. At 500 hPa, the enhancement in tropospheric O3 is much larger spatially across Europe and dominated by meteorological processes. Intrusion of stratospheric O3 into the mid-troposphere has a moderate influence on the observed/modelled O3 enhancements with contributions of up to 15.0 %–40.0 %. Correlations between TOMCAT temperature and O3 enhancements show broad agreement at some latitudes (e.g. 50–70∘ N in the lower–mid-troposphere). However, this relationship is non-linear and difficult to quantify without further simulations/model tracers, which was beyond the scope of this study. ROTRAJ back-trajectories suggest that in 2018, relative to 2017, there is the advection of more O3-rich air masses into the European mid-troposphere contributing to the summer 2018 O3 enhancements at this altitude. Therefore, in the summer of 2018 over Europe, in situ meteorological processes appear to be predominantly driving surface O3 enhancements over Europe, while advection of tropospheric O3-rich air and stratospheric intrusion are driving the corresponding tropospheric O3 enhancements
Overall, through our study focusing on the European summer 2018 air pollution episode, we have demonstrated the use of novel satellite data sets and a modelling framework (i.e. targeted sensitivity experiments and model tracers) suitable to investigate the air quality impacts from future European heatwaves such as that which occurred in summer 2022.
The EMEP surface O3 data were obtained from http://ebas-data.nilu.no/default.aspx (EMEP, 2023). The GOME-2 tropospheric column NO2 data were downloaded from EUMETSAT at https://acsaf.org/nrt_access.php (ACSAF, 2023). The TOMCAT and RAL Space satellite data have been uploaded to the Zenodo open-access portal (https://doi.org/10.5281/zenodo.10001068, Pope and RAL Space, 2023).
The supplement related to this article is available online at: https://doi.org/10.5194/acp-23-13235-2023-supplement.
RJP, MPC and BJK conceptualized and planned the research study. RJP performed the TOMCAT model simulations with support from MPC and WF. The JULES BVOC emissions were provided by ECP and GDH. RJP analysed the satellite data provided by RAL Space (BJK, RS, BGL and LJV) with support from BJK, RS and BGL. RJP undertook the EMEP analysis. RJP ran ROTRAJ with technical support from SRA and AMG. RJP prepared the manuscript with contributions from all co-authors.
The contact author has declared that none of the authors has any competing interests.
Publisher's note: Copernicus Publications remains neutral with regard to jurisdictional claims in published maps and institutional affiliations.
This work was funded by the UK Natural Environment Research Council (NERC) by providing funding for the National Centre for Earth Observation (NCEO, award reference NE/R016518/1).
This research has been supported by the National Centre for Earth Observation (grant no. NE/R016518/1).
This paper was edited by Tim Butler and reviewed by two anonymous referees.
ACSAF: Access information of near real-time products, https://acsaf.org/nrt_access.php (last access: 12 August 2023), 2023.
Akritidis, D., Pozzer, A., and Zanis, P.: On the impact of future climate change on tropopause folds and tropospheric ozone, Atmos. Chem. Phys., 19, 14387–14401, https://doi.org/10.5194/acp-19-14387-2019, 2019.
Archibald, A. T., O'Connor, F. M., Abraham, N. L., Archer-Nicholls, S., Chipperfield, M. P., Dalvi, M., Folberth, G. A., Dennison, F., Dhomse, S. S., Griffiths, P. T., Hardacre, C., Hewitt, A. J., Hill, R. S., Johnson, C. E., Keeble, J., Köhler, M. O., Morgenstern, O., Mulcahy, J. P., Ordóñez, C., Pope, R. J., Rumbold, S. T., Russo, M. R., Savage, N. H., Sellar, A., Stringer, M., Turnock, S. T., Wild, O., and Zeng, G.: Description and evaluation of the UKCA stratosphere–troposphere chemistry scheme (StratTrop vn 1.0) implemented in UKESM1, Geosci. Model Dev., 13, 1223–1266, https://doi.org/10.5194/gmd-13-1223-2020, 2020.
Bastos, A., Ciais, P., Friedlingstein, P., Sitch, S., Pongratz, J., Fan, L., Wigneron, J. P., Weber, U., Reichstein, M., Fu, Z., Anthoni, P., Arneth, A., Haverd, V., Jain, A. K., Joetzjer, E., Knauer, J., Lienert, S., Loughran, T., McGuire, C., Tian, H., Viovy, N., and Zaehle, S.: Direct and seasonal legacy effects of the 2018 heat wave and drought on European ecosystem productivity, Science Advances, 6, eaba2724, https://doi.org/10.1126/sciadv.aba2724, 2020.
Best, M. J., Pryor, M., Clark, D. B., Rooney, G. G., Essery, R. L. H., Ménard, C. B., Edwards, J. M., Hendry, M. A., Porson, A., Gedney, N., Mercado, L. M., Sitch, S., Blyth, E., Boucher, O., Cox, P. M., Grimmond, C. S. B., and Harding, R. J.: The Joint UK Land Environment Simulator (JULES), model description – Part 1: Energy and water fluxes, Geosci. Model Dev., 4, 677–699, https://doi.org/10.5194/gmd-4-677-2011, 2011.
Chipperfield, M. P.: New version of the TOMCAT/SLIMCAT off-line chemistry transport model: Intercomparison of stratospheric trace experiments, Q. J. Roy. Meteor. Soc., 132, 1179–1203, https://doi.org/10.1256/qj.05.51, 2006.
Churkina, G., Kuik, F., Bonn, B., Laurer, A., Grote, R., Tomiak, K., and Butler, T. M.: Effect of VOC Emissions from Vegetation on Air Quality in Berlin during a Heatwave, Environ. Sci. Technol., 51, 6120–6130, https://doi.org/10.1021/acs.est.6b06514, 2017.
Clark, D. B., Mercado, L. M., Sitch, S., Jones, C. D., Gedney, N., Best, M. J., Pryor, M., Rooney, G. G., Essery, R. L. H., Blyth, E., Boucher, O., Harding, R. J., Huntingford, C., and Cox, P. M.: The Joint UK Land Environment Simulator (JULES), model description – Part 2: Carbon fluxes and vegetation dynamics, Geosci. Model Dev., 4, 701–722, https://doi.org/10.5194/gmd-4-701-2011, 2011.
Clerbaux, C., Boynard, A., Clarisse, L., George, M., Hadji-Lazaro, J., Herbin, H., Hurtmans, D., Pommier, M., Razavi, A., Turquety, S., Wespes, C., and Coheur, P.-F.: Monitoring of atmospheric composition using the thermal infrared IASI/MetOp sounder, Atmos. Chem. Phys., 9, 6041–6054, https://doi.org/10.5194/acp-9-6041-2009, 2009.
Dee, D. P., Uppala, S. M., Simmons, A. J., Berrisford, P., Poli, P., Kobayashi, S., Andrae, U., Balmaseda, M. A., Balsamo, G., Bauer, P., Bechtold, P., Beliaars, A. C. M., van de Berg, L.,Bidlot, J., Bormann, N., Delsol, C., Dragani, R., Fuentes, M., Geer, A. J., Haimberger, L., Healy, S. B., Hersbach, H., Holm, E. V., Isaksen, L., Kallberg, P., Kohler, M., Matricardi, M., McNally, A. P., Monge-Sanz, B. M., Morcrette, J. J., Park, B. K., Peubey, C., de Rosnay, P., Tavolato, C., Thepaut, J. N., and Vitart, E.: The ERA-Interim reanalysis: Configuration and performance of the data assimilation system, Q. J. Roy. Meteor. Soc., 137, 553–597, https://doi.org/10.1002/qj.828, 2011.
Dirmeyer, P. A., Balsamo, G., Blyth, E. M., Morrison, R., and Cooper, H. M.: Land-Atmosphere Interactions Exacerbated the Drought and Heatwave Over Northern Europe During Summer 2018, AGU Advances, 2, e2020AV000283, https://doi.org/10.1029/2020AV000283, 2020.
Doherty, R. M., Heal, M. R., and O'Connor, F. M.: Climate change impacts on human health over Europe through its effect on air quality, Environ. Health, 16, 33–44, https://doi.org/10.1186/s12940-017-0325-2, 2017.
Drouard, M., Kornhuber, K., and Woollings, T.: Disentangling Dynamical Contributions to Summer 2018 Anomalous Weather Over Europe, Geophys. Res. Lett., 46, 12537–12546, https://doi.org/10.1029/2019GL084601, 2020.
EMEP: Ebas Home, https://ebas-data.nilu.no/Default.aspx (last access: 12 August 2023), 2023.
Emmons, L. K., Arnold, S. R., Monks, S. A., Huijnen, V., Tilmes, S., Law, K. S., Thomas, J. L., Raut, J.-C., Bouarar, I., Turquety, S., Long, Y., Duncan, B., Steenrod, S., Strode, S., Flemming, J., Mao, J., Langner, J., Thompson, A. M., Tarasick, D., Apel, E. C., Blake, D. R., Cohen, R. C., Dibb, J., Diskin, G. S., Fried, A., Hall, S. R., Huey, L. G., Weinheimer, A. J., Wisthaler, A., Mikoviny, T., Nowak, J., Peischl, J., Roberts, J. M., Ryerson, T., Warneke, C., and Helmig, D.: The POLARCAT Model Intercomparison Project (POLMIP): overview and evaluation with observations, Atmos. Chem. Phys., 15, 6721–6744, https://doi.org/10.5194/acp-15-6721-2015, 2015.
Forster, P., Ramaswamy, V., Artaxo, P., Berntsen, T., Betts, R., Fahey, D., Haywood, J., Lean, J., Lowe, D., Myhre, G., Nganga, J., Prinn, R., Raga, G., Schulz, M., Dorland, R., Bodeker, G., Boucher, O., Collins, W., Conway, T., and Whorf, T.: Changes in Atmospheric Constituents and in Radiative Forcing, in: Climate Change 2007: The Physical Science Basis. Contribution of Working Group I to the Fourth Assessment Report of the Intergovernmental Panel on Climate Change, Cambridge University Press, Cambridge, United Kingdom and New York, NY, USA, 2007.
García-Herrera, R., Díaz, J., Trigo, R. M., and Fisher, E. M.: A Review of the European Summer Heat Wave of 2003. Critical Reviews in Environ. Sci. Technol., 40, 267–306, https://doi.org/10.1080/10643380802238137, 2020.
Gaudel, A., Cooper, O. R., Ancellet, G., Barret, B., Boynard, A., Burrows, J. P., Clerbaux, C., Coheur, P. F., Cuesta, J., Cuevas, E., Doniki, S., Dufour, G., Ebojie, F., Foret, G., Garia, O., Granados-Munoz, M. J., Hannigan, J. W., Hase, F., Hassler, B., Huang, G., Hurtmans, D., Jaffe, D., Jones, N., Kalabokas, P., Kerridge, B., Kulwaik, S., Latter, B., Leblanc, T., Le Flochmoen, E., Lin, W., Liu, J., Liu, X., Mahieu, E., McClure-Begley, A., Neu, J. L., Osman, M., Palm, M., Petetin, H., Petropavlovskikh, I., Querel, R., Rahpoe, N., Rozanov, A., Schultz, M. G., Schwab, J., Siddans, R., Smale, D., Steinbacher, M., Tanimoto, H., Tarasick, D. W., Thouret, V., Thompson, A. M., Trickl, T., Weatherhead, E., Wespes, C., Worden, H. M., Vigouroux, C., Xu, X., Zeng, G., and Ziemke, J.: Tropospheric Ozone Assessment Report: Present day distribution and trends of tropospheric ozone relevant to climate and global atmospheric chemistry model evaluation, Elementa – Science of the Anthropocene, 6, 1–58, https://doi.org/10.1525/elementa.291, 2018.
Graham, A. M., Pringle, K. J., Pope, R. J., Arnold, S. R., Conibear, L. A., Burns, H., Rigby, R., Borchers-Arriagada, N., Butt, E. W., Kiely, L., Reddington, C., Spracklen, D. V., Woodhouse, M. T., Knote, C., and McQuaid, J. B.: Impact of the 2019/2020 Australian megafires on air quality and health, GeoHealth, 5, e2021GH000454, https://doi.org/10.1029/2021GH000454, 2020.
Granier, C., Bessagnet, B., Bond, T., D'Angiola, A., van der Gon, H. D., Frost, G. J., Heil, A., Kaiser, J. W., Kinne, S., Klimont, Z., Kloster, S., Lamarque, J. F., Liousse, C., Masui, T., Meleux, F., Mieville, A., Ohara, T., Raut, J. C., Riahi, K., Schultz, M. G., Smith, S. J., Thompson, A., van Aardenne, J., van der Werf, G. R., and van Vuuren, D. P.: Evolution of anthropogenic and biomass burning emissions of air pollutants at global and regional scales during the 1980–2010 period, Climatic Change, 109, 163–190, https://doi.org/10.1007/s10584-011-0154-1, 2011.
Guerreiro, S. B., Dawson, R. J., Kilsby, C., Lewis, E., and Ford, A.: Future heat-waves, droughts and floods in 571 European cities, Environ. Res. Lett., 13, 034009, https://doi.org/10.1088/1748-9326, 2018.
Heal, M. R., Heaviside, C., Doherty, R. M., Vieno, M., Stevenson, D. S., and Vardoulakis, S.: Health burdens of surface ozone in the UK for a range of future scenarios, Environ. Int., 61, 36–44, https://doi.org/10.1016/j.envint.2013.09.010, 2013.
Hollaway, M. J., Arnold, S. R., Challinor, A. J., and Emberson, L. D.: Intercontinental trans-boundary contributions to ozone-induced crop yield losses in the Northern Hemisphere, Biogeosciences, 9, 271–292, https://doi.org/10.5194/bg-9-271-2012, 2012.
Honrath, R. E., Owen, R. C., Val Martin, M., Reid, J. S., Lapina, K., Fialho, P., Dziobak, M. P., Kleissl, J., and Westphal, D. L.: Regional and hemispheric impacts of anthropogenic and biomass burning emissions on summertime CO and O3 in the North Atlantic lower free troposphere, J. Geophys. Res.-Atmos., 109, D24310, https://doi.org/10.1029/2004JD005147, 2004.
Illingworth, S. M., Remedios, J. J., Boesch, H., Moore, D. P., Sembhi, H., Dudhia, A., and Walker, J. C.: ULIRS, an optimal estimation retrieval scheme for carbon monoxide using IASI spectral radiances: Sensitivity analysis, error budget and simulations, Atmos. Meas. Tech., 4, 269–288, https://doi.org/doi:10.5194/amt-4-269-2011, 2011.
Jacob, D. J. and Winner, D. A.: Effect of climate change on air quality, Atmos. Environ., 43, 51–63, https://doi.org/10.1016/j.atmosenv.2008.09.051, 2009.
Jerrett, M., Burnett, R. T., Pope, C. A., Kazuhiko, I., Thurston, G., Krewski, D., Shi, Y., Calle, E., and Thun, M.: Long-term ozone exposure and mortality, New Engl. J. Med., 360, 1085–1095, https://doi.org/10.1056/NEJMoa0803894, 2009.
Kaiser, J. W., Heil, A., Andreae, M. O., Benedetti, A., Chubarova, N., Jones, L., Morcrette, J.-J., Razinger, M., Schultz, M. G., Suttie, M., and van der Werf, G. R.: Biomass burning emissions estimated with a global fire assimilation system based on observed fire radiative power, Biogeosciences, 9, 527–554, https://doi.org/10.5194/bg-9-527-2012, 2012.
Lhotka, O., Kysely, J., and Farda, A.: Climate change scenarios of heat waves in Central Europe and their uncertainties, Theor. Appl. Climatol., 131, 1043–1054, https://doi.org/10.1007/s00704-016-2031-3, 2017.
Li, M., Yao, Y., Simmonds, I., Luo, D., Zhong, L., and Chen, X.: Collaborative impact of the NAO and atmospheric blocking on European heat waves, with a focus on the hot summer of 2018, Environ. Res. Lett., 15, 114003, https://doi.org/10.1088/1748-9326/aba6ad, 2020.
Liu, X., He, B., Guo, L., Huang, L., and Chen, D.: Similarities and differences in the mechanisms causing the European summer heat waves in 2003, 2010 and 2018, Earths Future, 8, e2019EF001386, https://doi.org/10.1029/2019EF001386, 2020.
Mann, G. W., Carslaw, K. S., Spracklen, D. V., Ridley, D. A., Manktelow, P. T., Chipperfield, M. P., Pickering, S. J., and Johnson, C. E.: Description and evaluation of GLOMAP-mode: a modal global aerosol microphysics model for the UKCA composition-climate model, Geosci. Model Dev., 3, 519–551, https://doi.org/10.5194/gmd-3-519-2010, 2010.
Matsueda, M.: Predictability of Euro-Russian blocking in summer of 2010, Geophys. Res. Lett., 38, L06801, https://doi.org/10.1029/2010GL046557, 2011.
Methven, J., Arnold, S. R., O'Connor, F. M., Barjat, H., Dewey, K., Kent, J., and Brough, N.: Estimating photochemically produced ozone throughout a domain using flight data and a Lagrangian model, J. Geophys. Res.-Atmos., 108, 4271, https://doi.org/10.1029/2002JD002955, 2003.
Miles, G. M., Siddans, R., Kerridge, B. J., Latter, B. G., and Richards, N. A. D.: Tropospheric ozone and ozone profiles retrieved from GOME-2 and their validation, Atmos. Meas. Tech., 8, 385–398, https://doi.org/10.5194/amt-8-385-2015, 2015.
Monks, S. A., Arnold, S. R., Hollaway, M. J., Pope, R. J., Wilson, C., Feng, W., Emmerson, K. M., Kerridge, B. J., Latter, B. L., Miles, G. M., Siddans, R., and Chipperfield, M. P.: The TOMCAT global chemical transport model v1.6: description of chemical mechanism and model evaluation, Geosci. Model Dev., 10, 3025–3057, https://doi.org/10.5194/gmd-10-3025-2017, 2017.
Morgenstern, O., Hegglin, M. I., Rozanov, E., O'Connor, F. M., Abraham, N. L., Akiyoshi, H., Archibald, A. T., Bekki, S., Butchart, N., Chipperfield, M. P., Deushi, M., Dhomse, S. S., Garcia, R. R., Hardiman, S. C., Horowitz, L. W., Jöckel, P., Josse, B., Kinnison, D., Lin, M., Mancini, E., Manyin, M. E., Marchand, M., Marécal, V., Michou, M., Oman, L. D., Pitari, G., Plummer, D. A., Revell, L. E., Saint-Martin, D., Schofield, R., Stenke, A., Stone, K., Sudo, K., Tanaka, T. Y., Tilmes, S., Yamashita, Y., Yoshida, K., and Zeng, G.: Review of the global models used within phase 1 of the Chemistry–Climate Model Initiative (CCMI), Geosci. Model Dev., 10, 639–671, https://doi.org/10.5194/gmd-10-639-2017, 2017.
Munro, R., Siddans, R., Reburn, W. J., and Kerridge, B. J.: Direct measurement of tropospheric ozone distributions from space, Nature, 392, 168–171, https://doi.org/10.1038/32392, 1998.
Pacifico, F., Harrison, S. P., Jones, C. D., Arneth, A., Sitch, S., Weedon, G. P., Barkley, M. P., Palmer, P. I., Serça, D., Potosnak, M., Fu, T.-M., Goldstein, A., Bai, J., and Schurgers, G.: Evaluation of a photosynthesis-based biogenic isoprene emission scheme in JULES and simulation of isoprene emissions under present-day climate conditions, Atmos. Chem. Phys., 11, 4371–4389, https://doi.org/10.5194/acp-11-4371-2011, 2011.
Palmer, P., I., Marvin, M., R., Siddans, R., Kerridge, B. J., and Moore, D. P.: Nocturnal survival of isoprene linked to formation of upper tropospheric organic aerosol, Science, 375, 562–566, https://doi.org/10.1126/science.abg4506, 2022.
Papanastasiou, D. K., Melas, D., and Kambezidis, H. D.: Air quality and thermal comfort levels under extreme hot weather, Atmos. Res., 152, 4–13, https://doi.org/10.1016/j.atmosres.2014.06.002, 2015.
PHE: PHE heatwave mortality monitoring, Publica Health England, https://assets.publishing.service.gov.uk/government/uploads/system/uploads/attachment_data/file/942648/PHE_heatwave_report_2018.pdf (last access: 3 February 2022), 2019.
Pimlott, M. A., Pope, R. J., Kerridge, B. J., Latter, B. G., Knappett, D. S., Heard, D. E., Ventress, L. J., Siddans, R., Feng, W., and Chipperfield, M. P.: Investigating the global OH radical distribution using steady-state approximations and satellite data, Atmos. Chem. Phys., 22, 10467–10488, https://doi.org/10.5194/acp-22-10467-2022, 2022.
Pirovano, G., Balzarini, A., Bessagnet, B., Emery, C., Kallos, G., Meleux, F., Mitsakou, C., Nopmongcol, U., Riva, G. M., and Yarwood, G.: Investigating impacts of chemistry and transport model formulation on model performance at European scale, Atmos. Environ., 53, 93–109, https://doi.org/10.1016/j.atmosenv.2011.12.052, 2012.
Pope, R. and RAL Space: Investigation of the summer 2018 European ozone air pollution episodes using novel satellite data and modelling – Dataset, Zenodo [data set], https://doi.org/10.5281/zenodo.10001068, 2023.
Pope, R. J., Savage, N. H., Chipperfield, M. P., Arnold, S. R., and Osborn, T. J.: The influence of synoptic weather regimes on UK air quality: analysis of satellite column NO2, Atmos. Sci. Lett., 15, 211– 217, https://doi.org/10.1002/asl22.492, 2014.
Pope, R. J., Butt, E. W., Chipperfield, M. P., Doherty, R. M., Fenech, S., Schmidt, A., Arnold, S. R., and Savage, N. H.: The impact of synoptic weather on UK surface ozone and implications for premature mortality, Environ. Res. Lett., 11, 124004, https://doi.org/10.1088/1748-9326/11/12/124004, 2016.
Pope, R. J., Chipperfield, M. P., Arnold, S. R., Glatthor, N., Feng, W., Dhomse, S. S., Kerridge, B. J., Latter, B. G., and Siddans, R.: Influence of the wintertime North Atlantic Oscillation on European tropospheric composition: an observational and modelling study, Atmos. Chem. Phys., 18, 8389–8408, https://doi.org/10.5194/acp-18-8389-2018, 2018.
Pope, R. J., Arnold, S. R., Chipperfield, M. P., Reddington, C. L. S., Butt, E. W., Keslake, T. D., Feng, W., Latter, B. G., Kerridge, B. J., Siddans, R., Rizzo, L., Artazo, P., Sadiq, M., and Tai, A. P. K.: Substantial Increases in Eastern Amazon and Cerrado Biomass Burning-Sourced Tropospheric Ozone, Geophys. Res. Lett., 47, e2019GL084143, https://doi.org/10.1029/2019GL084143, 2020.
Pope, R. J., Kerridge, B. J., Siddans, R., Latter, B. G., Chipperfield, M. P., Arnold, S. R., Ventress, L. J., Pimlott, M. A., Graham, A. M., Knappett, D. S., and Rigby, R.: Large enhancements in Southern Hemisphere satellite-observed trace gases due to the 2019/2020 Australian wildfires, J. Geophys. Res.-Atmos., 126, e2021JD034892, https://doi.org/10.1029/2021jd034892, 2021.
Pyrgou, A., Hadjinicolaou, P and Santamouris, M.: Enhanced near-surface ozone under heatwave conditions in a Mediterranean island, Sci. Rep.-UK, 8, 9191, https://doi.org/10.1038/s41598-018-27590-z, 2018.
RAL Space: Optimal Estimation Method retrievals with IASI, AMSU and MHS – Final Report Version 5.2, http://cedadocs.ceda.ac.uk/1377/1/iasi_mhs_final_report_v5p2.pdf (last access: 17 August 2020), 2015.
Rasilla, D., Allende, F., Martilli, A., and Fernandez, F.: Heat Waves and Human Well-Being in Madrid (Spain), Atmosphere, 10, 288–309, https://doi.org/10.3390/atmos10050288, 2019.
Rebetez, M., Dupont, O., and Giroud, M.: An analysis of July 2006 heatwave extent in Europe compared to the record year of 2003, Theor. Appl. Climatol., 95, 1–7, https://doi.org/10.1007/s00704-007-0370-9, 2008.
Rennenberg, H., Loreto, F., Polle, A., Brilli, F., Fares, S., Beniwal, R. S., and Gessler, A.: Physiological Responses of Forest Trees to Heat and Drought, Plant Biol., 8, 556–571, https://doi.org/10.1055/s-2006-924084, 2006.
Richards, N. A. D., Arnold, S. R., Chipperfield, M. P., Miles, G., Rap, A., Siddans, R., Monks, S. A., and Hollaway, M. J.: The Mediterranean summertime ozone maximum: global emission sensitivities and radiative impacts, Atmos. Chem. Phys., 13, 2331–2345, https://doi.org/10.5194/acp-13-2331-2013, 2013.
Riese, M., Ploeger, F., Rap, A., Vogel, B., Konopka, P., Dameris, M., and Forster, P.: Impacts of uncertainties in atmospheric mixing on simulated UTLS composition and related radiative effects, J. Geophys. Res.-Atmos., 117, D16305, https://doi.org/10.1029/2012jd017751, 2012.
Rodgers, C. D.: Inverse methods for atmospheric sounding: Theory and practice, World Science, New Jersey, USA, ISBN 978-981-02-2740-1, 2000.
Schultz, M. G., Schroder, S., Lyapina, O., Cooper, O. R., Galbally, I., Petropalovskikh, I., Schneidemesser, E., Tanimoto, H., Elshorbany, Y., Naja, M., Seguel, R. J., Dauert, U., Eckhardt, P., Feigenspan, S., Fiebig, M., Hjellbrekke, A., Hong, Y. D., Kjeld, P. C., Koide, H., Lear, G., Tarasick, D., Ueno, M., Wallasch, M., Baumgardner, D., Chuang, M. T., Gillett, R., Lee, M., Molloy, S., Moolla, R., Wang, T., Sharps, K., Adame, J. A., Ancellet, G., Apadula, F., Artaxo, P., Barlasina, M. E., Bogucka, M., Bonasoni, P., Chang, L., Colomb, A., Cuevas-Agullo, E., Cupeiro, M., Degorska, A., Ding, A., Frohlich, M., Frolova, M., Gadhavi, H., Gheusi, F., Gilge, S., Gonzalez, M. Y., Gros, V., Hamad, S. H., Helmig, D., Henriques, D., Hermansen, O., Holla, R., Hueber, J., Im, U., Jaffe, D. A., Komala, N., Kubistin, D., Lam, K. S., Laurila, T., Lee, H., Levy, I., Mazzonleni, C., Mazzoleni, L. R., McClure-Begley, A., Mohamad, M., Murovec, M., Navarro-Comas, M., Nicodim, F., Parrish, D., Read, K. A., Reid, N., Reis, L., Saxena, P., Schwab, J. J., Scorgie, Y., Senik, I., Simmonds, P., Sinha, V., Skorokhod, A.I, Spain, G., Spangl, W., Spoor, R., Springston, S. R., Steer, K., Steinbacher, M., Suharguniyawan, E., Torre, P., Trickl, T., Weili, L., Weller, R., Xiaobin, X., Xue, L., and Zhiqiang, M.: Tropospheric Ozone Assessment Report: Database and metrics data of global surface ozone observations, Elementa, 5, 58, https://doi.org/10.1525/elementa.244, 2017.
Scott, P. A., Stone, D. A., and Allen, M. R.: Human contributions to the European heatwave of 2003, Nature, 432, 610–614, https://doi.org/10.1038/nature03089, 2004.
Sitch, S., Cox, P. M., Collins, W. J., and Huntingford, C.: Indirect radiative forcing of climate change through ozone effects on the land carbon sink, Nature, 448, 791–795, https://doi.org/10.1038/nature06059, 2007.
Smith, N. E., Kooijmans, L. M. J., Koren, G., van Schaik, E., van der Woude, A. M., Wanders, N., Ramonet, M., Xueref-Remy, I., Siebicke, L., Manac, G., Brummer, C., Baker, I. T., Haynes, K. D., Luijkx, I. T., and Peters, W.: Spring enhancements and summer reduction in carbon uptake during the 2018 drought in Northwestern Europe, Philos. T. Roy. Soc. B, 375, 20190509, https://doi.org/10.1098/rstb.2019.0509, 2020.
Stirling, E. L., Pope, R. J., Graham, A. M., Chipperfield, M. P., and Arnold, S. R.: Quantifying the transboundary contribution of nitrogen oxides to UK air quality, Atmos. Sci. Lett., 21, e955, https://doi.org/10.1002/asl2.955, 2020.
Stockwell, D., Giannakopoulos, C., Plantevin, P.-H., Carver, G. D., Chipperfield, M. P., Law, K. S., Pyle, J. A., Shallcross, D. E., and Wang, K.-Y.: Modelling NOx from lightning and its impacton global chemical fields. Atmos. Environ., 33, 4477–4493, https://doi.org/10.1016/S1352-2310(99)00190-9, 1999.
Thomas, M. A. and Devasthale, A.: Sensitivity of free tropospheric carbon monoxide to atmospheric weather states and their persistency: an observational assessment over the Nordic countries, Atmos. Chem. Phys., 14, 11545–11555, https://doi.org/10.5194/acp-14-11545-2014, 2014.
Van Dingenen, R., Dentener, F. J., Raes, F., Krol, M. C., Emberson, L., and Cofala, J.: The global impact of ozone on agriculture crop yields under current and future air quality legislation. Atmos. Environ., 43, 604–618, https://doi.org/10.1016/j.atmosenv.2008.10.033, 2009.
Vieno, M., Dore, A. J., Stevenson, D. S., Doherty, R., Heal, M. R., Reis, S., Hallsworth, S., Tarrason, L., Wind, P., Fowler, D., Simpson, D., and Sutton, M. A.: Modelling surface ozone during the 2003 heat-wave in the UK, Atmos. Chem. Phys., 10, 7963–7978, https://doi.org/10.5194/acp-10-7963-2010, 2010.
WHO: Ambient (outdoor) air pollution, World Health Organisation, https://www.who.int/news-room/fact-sheets/detail/ambient-(outdoor)-air-quality-and-health (last access: 3 February 2022), 2021.
Yan, Y., Pozzer, A., Ojha, N., Lin, J., and Lelieveld, J.: Analysis of European ozone trends in the period 1995–2014, Atmos. Chem. Phys., 18, 5589–5605, https://doi.org/10.5194/acp-18-5589-2018, 2018.