the Creative Commons Attribution 4.0 License.
the Creative Commons Attribution 4.0 License.
 | 19 Oct 2023
Bridging the spatial gaps of the Ammonia Monitoring Network using satellite ammonia measurements
Da Pan
Xuehui Guo
Lieven Clarisse
Martin Van Damme
Pierre-François Coheur
Cathy Clerbaux
Melissa Puchalski
Mark A. Zondlo
Ammonia (NH3) is a key precursor to fine particulate matter (PM2.5) and a primary form of reactive nitrogen. The limited number of NH3 observations hinders the further understanding of its impacts on air quality, climate, and biodiversity. Currently, NH3 ground monitoring networks are few and sparse across most of the globe, and even in the most established networks, large spatial gaps exist between sites and only a few sites have records that span longer than a decade. Satellite NH3 observations can be used to discern trends and fill spatial gaps in networks, but many factors influence the syntheses of the vastly different spatiotemporal scales between surface network and satellite measurements. To this end, we intercompared surface NH3 data from the Ammonia Monitoring Network (AMoN) and satellite NH3 total columns from the Infrared Atmospheric Sounding Interferometer (IASI) in the contiguous United States (CONUS) and then performed trend analyses using both datasets. We explored the sensitivity of correlations between the two datasets to factors such as satellite data availability and distribution over the surface measurement period, as well as agreement within selected spatial and temporal windows. Given the short lifetime of atmospheric ammonia and consequently sharp gradients, smaller spatial windows show better agreement than larger ones except in areas of relatively uniform, low concentrations where large windows and more satellite measurements improve the signal-to-noise ratio. A critical factor in the comparison is having satellite measurements across most of the measurement period of the monitoring site. When IASI data are available for at least 80 % of the days of AMoN's 2-week sampling period within a 25 km spatial window of a given site, IASI NH3 column concentrations and the AMoN NH3 surface concentrations have a correlation of 0.74, demonstrating the feasibility of using satellite NH3 columns to bridge the spatial gaps existing in the surface network NH3 concentrations. Both IASI and AMoN show increasing NH3 concentrations across the CONUS (median: 6.8 % yr−1 versus 6.7 % yr−1) in the last decade (2008–2018), suggesting the NH3 will become a greater contributor to nitrogen deposition. NH3 trends at AMoN sites are correlated with IASI NH3 trends (r = 0.66) and show similar spatial patterns, with the highest increases in the Midwest and eastern US. In spring and summer, increases in NH3 were larger than 10 % yr−1 in the eastern US and Midwest (cropland dominated) and the western US (pastureland dominated), respectively. NH3 hotspots are defined as regions where the IASI NH3 column is larger than the 95th percentile of the 11-year CONUS map (6.7 × 10¹⁵ ), they also experience increasing concentrations over time, with a median of NH3 trend of 4.7 % yr−1. IASI data show large NH3 increases in urban areas (8.1 % yr−1), including 8 of the top 10 most populous regions in the CONUS, where AMoN sites are sparse. A comparison between IASI NH3 concentration trends and state-level NH3 emission trends is then performed to reveal that positive correlations exist in states with strong agricultural NH3 emissions, while there are negative correlations in states with low NH3 emissions and large NOx emissions, suggesting the different roles of emission and partitioning in NH3 increases. The increases in NH3 could have detrimental effects on nearby eco-sensitive regions through nitrogen deposition and on aerosol chemistry in the densely populated urban areas, and therefore they should be carefully monitored and studied.
- Article
(5582 KB) - Full-text XML
- BibTeX
- EndNote


Gas-phase ammonia (NH3) is the most abundant alkaline gas in the atmosphere, mainly emitted from agricultural activities such as nitrogen fertilizer applications and livestock waste volatilization (Bouwman et al., 1997; Paulot et al., 2014). As a major precursor to fine particulate matter (PM2.5), NH3 critically affects aerosol heterogeneous chemistry, air quality, visibility, human health, and climate (Hauglustaine et al., 2014; Hill et al., 2019; Lawal et al., 2018; Malm et al., 2004). Ammonia neutralizes sulfuric acid (H2SO4) and nitric acid (HNO3) in the atmosphere to form ammoniated aerosols, ammonium sulfate ((NH4)2SO4), and ammonium nitrate (NH4NO3), which in total can contribute to more than 50 % of total PM2.5 mass (Feng et al., 2020). NH4NO3 is critical during wintertime haze periods because the cold and humid condition favor its formation (Shah et al., 2018; Zhai et al., 2021). Moreover, NH3 plays an important role in the nitrogen cycle. Wet deposition of dominates the wet inorganic nitrogen deposition at nearly 70 % of monitoring sites in the United States (Li et al., 2016). Total NHx (≡ NH3 (g) + ) deposition is expected to become even more dominant in the future because NOx emissions are decreasing under new pollution controls, while NH3 emissions are predicted to continue to increase with the rising global food demands (Erisman et al., 2008; Goldberg et al., 2021; Pinder et al., 2008). Excessive NH3 deposition in the non-agricultural ecosystems can reduce biodiversity, result in soil acidification, and increase eutrophication, especially in sensitive ecosystems (Ellis et al., 2013; Phoenix et al., 2006).
Although NH3's importance has been well recognized, routine NH3 observations are lacking even in countries with comprehensive monitoring networks, partly due to the difficulty of measuring gas-phase NH3 (von Bobrutzki et al., 2010; Fehsenfeld et al., 2002). The Ammonia Monitoring Network (AMoN) (Puchalski et al., 2015) is the only routine set of NH3 measurements in the United States, with 110 active AMoN sites in the contiguous United States (CONUS) in 2021, providing high-quality surface observations of NH3. AMoN data have been used widely for model evaluation and long-term trend analysis (Butler et al., 2016; Nair et al., 2019; Yao and Zhang, 2016, 2019). AMoN only provides biweekly NH3 observations, in contrast to monitoring networks for two other important gas-phase precursors of PM2.5, SO2 and NO2, which provide hourly- or daily-scale observations. PM2.5, SO2, and NO2 are directly regulated as criteria pollutants; however, contributions from NH3 emissions sources must be considered in State Implementation Plan (SIP) demonstrations for areas out of attainment for PM2.5, which can be a challenge for areas lacking NH3 measurements (EPA, 2023a).
Population-weighted PM2.5 concentrations are widely used to estimate the health effects of PM2.5; however, the sparse number of NH3 sites with only biweekly or monthly resolution makes it difficult to derive population-weighted PM2.5 precursor datasets. Gas-phase NH3 is critical to determine the partitioning of the total NHx (Hennigan et al., 2015), and the lack of gas-phase NH3 observations hampers the evaluation of chemistry models. The ISORROPIA II thermodynamic model has been extensively adopted to compute the equilibrium composition for the inorganic aerosol systems (Fountoukis and Nenes, 2007) and requires both gas- and aerosol-phase data as input to provide accurate and robust results (Hennigan et al., 2015). However, the limited number of NH3 ground monitoring sites currently prevents synthesizing the AMoN NH3 data with other ground monitoring networks, e.g., the Interagency Monitoring of Protected Visual Environments (IMPROVE), as input for ISORROPIA II (Pan et al., 2020). GEOS-Chem implemented with ISORROPIA II was found to significantly underestimate gas-phase NH3 and overestimate in winter (Holt et al., 2015; Nair et al., 2019; Walker et al., 2012), with the normalized mean biases as high as 86 % in January at sites for IMPROVE (Holt et al., 2015). The lifetime of NH3 ranges from hours to days; hence large spatiotemporal variability exists (Golston et al., 2020; Miller et al., 2015; Wang et al.; 2021), and large spatial gaps exist in the current AMoN. Currently there are no AMoN sites in some states, e.g., North Dakota and South Dakota, and only 12 sites are within the characteristic length scale (12 km) of NH3 hotspot regions (Wang et al., 2021). A total of 10 national parks in the US are within 100 km of an NH3 hotspot, and more observations are needed to quantify the impacts of these hotspots on dry NH3 deposition in these regions (Pan et al., 2021). A lack of long-term AMoN data also hinders the possibility of investigating NH3 trends in the CONUS. Increasing NH3 concentrations are observed using AMoN data, yet all of the previous trend analyses are limited to fewer than 20 AMoN sites that may not be representative of NH3 trends in the CONUS (Butler et al., 2016; Yao and Zhang, 2016, 2019).
Satellite NH3 observations are on a global and daily basis, providing long-term trends and ubiquitous coverage. Instruments that measure NH3 include the Infrared Atmospheric Sounding Interferometer (IASI) on the MetOp satellites, the Cross-track Infrared Sounder (CrIS) on the NOAA and NASA Suomi National Polar-orbiting Partnership (S-NPP) and on the Joint Polar Satellite System-1 and System-2 (JPSS-1 and JPSS-2) satellites, the Tropospheric Emission Spectrometer (TES) on the NASA Aura satellite, the Atmospheric Infrared Sounder (AIRS) on the NASA EOS Aqua satellite, and the Thermal and Near Infrared Sensor for Carbon Observations – Fourier Transform Spectrometer (TANSO-FTS) on the Greenhouse Gases Observing SATellite (GOSAT) (Clarisse et al., 2009; Shephard et al., 2011; Shephard and Cady-Pereira, 2015; Someya et al., 2020; Warner et al., 2016). Satellite NH3 data have been widely used to constrain NH3 emissions, estimate NH3 deposition, and analyze NH3 trends (H. Cao et al., 2020, 2022; Chen et al., 2021; Kharol et al., 2018; Van Damme et al., 2021). Van Damme et al. (2021) utilized 11-year IASI NH3 observations and found a worldwide NH3 increase (12.8 ± 1.3 %) from 2008 to 2018 with especially large increases in east Asia (75.7 ± 6.3 %) and North America (26.8 ± 4.5 %). Warner et al. (2017) used 14-year AIRS NH3 measurements and found a statistically significant NH3 increase (2.61 % yr−1) in the US from 2002 to 2016.
The global daily coverage and long-term data record make it possible for satellite observations to fill the spatial and temporal gaps of the current ground monitoring networks. Although limited in numbers, the validations of satellite NH3 observations with in situ measurements provide confidence in integrating the two datasets (Guo et al., 2021; Sun et al., 2015). Sun et al. (2015) performed the first daily- and pixel-scale satellite NH3 validations using TES NH3 columns and airborne NH3 observations in the San Joaquin Valley of California, USA, showing that the differences between the total NH3 column and the in situ total column were within 6 %. However, the validation included only 9 TES pixels, and TES is no longer in operation. Guo et al. (2021) showed that IASI NH3 columns and NH3 columns derived from airborne and ground-based NH3 observations were indistinguishable from one another on a daily and pixel basis in Colorado, USA, in summer. All of these validation works were carried out in specific seasons and were limited to source regions with high NH3 concentrations (Guo et al., 2021; Sun et al., 2015; Warner et al., 2016). Ground-based FTIR NH3 observations provided a better temporal coverage for evaluating IASI and CrIS NH3 retrievals; however, low-concentration sites were excluded from the evaluation, and only ∼ 10 sites were included across the globe (Dammers et al., 2016; Dammers et al., 2017). Furthermore, FTIR-based measurements also have not been directly validated against in situ measurements of NH3 vertical profiles.
To capitalize on the benefits of both surface and satellite observations and synthesize these datasets, a detailed understanding of the comparison between IASI NH3 column concentrations and AMoN NH3 surface concentrations is necessary. Here we focus on IASI NH3 measurements because it offers the longest data record (2008–present) among the satellite NH3-measuring instruments. The comparison between AMoN and IASI is complex because AMoN is a ground-based point measurement integrated over 14 d, whereas IASI is a space-borne volumetric measurement averaged over the pixel footprint at the instantaneous overpass time. There are several factors that need to be taken into consideration.
-
The extent to which the IASI NH3 column represents the surface AMoN NH3 concentration. Knowledge of NH3 vertical profiles in the atmosphere is limited due to the lack of observational data, and model-simulated NH3 vertical profiles are often biased compared with the airborne measurements (Schiferl et al., 2016). Ammonia is mostly concentrated in the planetary boundary layer (PBL) because of its short lifetime (∼ hours to days) and surface emission sources (Dentener and Crutzen, 1994; Guo et al., 2021; Sun et al., 2015; Seinfeld and Pandis, 2016). Sun et al. (2015) showed that NH3 was almost well mixed in the lower PBL, and the TES NH3 columns were strongly correlated (R2 = 0.82) with the median NH3 mixing ratios measured at the surface, demonstrating that satellite NH3 columns could represent the ground NH3 concentrations. Van Damme et al. (2015) converted IASI NH3 columns to surface NH3 concentrations using fixed NH3 profiles generated by GEOS-Chem and then performed monthly comparisons with ground monitoring networks. IASI-derived surface NH3 observations are in fair agreement with ground observations in Europe, China, and Africa but are limited to a small number of sites in each region for a short time range, e.g., 27 sites in Europe in 2011 (Van Damme et al., 2015). Furthermore, the latest IASI NH3 products have switched to a new algorithm and no longer use a fixed NH3 profile (Whitburn et al., 2016; Van Damme et al., 2017).
-
Optimal spatial window for comparing and integrating satellite pixels and AMoN sites. Previous comparisons of satellite NH3 retrievals with observations from ground monitoring networks simply averaged the data from the monitoring site within a coarse model grid (∼ 100 km) with the averaged modeling/satellite NH3 concentration of the whole grid (Kharol et al., 2018; Nair et al., 2019; Van Damme et al., 2015). If NH3 concentrations are uniformly distributed within the spatial window, increasing the spatial window will increase the number of IASI pixels and decrease the signal-to-noise ratio. However, the spatial heterogeneity of NH3 is quite large near hotspots due to its short lifetime (Golston et al., 2020; Miller et al., 2015; Wang et al., 2021; Warner et al., 2016). The relationship between spatial window size and satellite and surface measurement agreement needs to be examined in more detail.
-
Temporal distribution of satellite measurements across the 2-week AMoN sampling period. Previous comparisons of model or satellite products against surface observations did not consider the distribution of IASI measurements during the 2-week sampling period (Kharol et al., 2018; Nair et al., 2019; Van Damme et al., 2015). AMoN measures continuously, whereas a series of cloudy days would preclude any valid satellite measurements. Therefore, any AMoN and satellite comparison is intrinsically biased towards clear-sky days on the satellite side but includes all conditions for the AMoN site.
-
Number of available IASI pixels in the comparison. Guo et al. (2021) have shown that, even at low column amounts, IASI NH3 has no known biases. AMoN is an extremely sensitive measurement of NH3, far more precise than any satellite NH3 product (NADP, 2023; Van Damme et al., 2017). Therefore, increasing the number of satellite measurements within a certain spatiotemporal window is expected to improve the signal-to-noise ratio in the satellite measurements and may lead to improved agreements with AMoN under clean conditions.
-
Regional and seasonal variabilities. Different regional and seasonal patterns are expected to influence the comparison. The performances of thermal infrared sounders are highly affected by the thermal contrast between the surface air temperature and skin temperature (Clarisse et al., 2010). In winter, low thermal contrast results in low sensitivity, which explains the low number of IASI pixels in winter compared to summer (Clarisse et al., 2010; Guo et al., 2021). Kharol et al. (2018) showed that CrIS surface NH3 concentrations had an overall mean CrIS–AMoN difference of ∼ +15 %; however, they only averaged CrIS data over the warm season in 2013.
In this study, to demonstrate the capabilities of using IASI NH3 observations to augment the ground monitoring network, we performed a comprehensive comparison between IASI and AMoN on biweekly and seasonal scales. We directly compare the correlation between IASI NH3 columns with AMoN surface NH3. We avoided converting column NH3 into surface concentrations because of possible biases introduced by assuming vertical profiles, boundary layer heights at local sites, and gas-phase and aerosol partitioning. The impacts of the different factors on the comparison are examined in the context of the points raised above. After identifying the most optimal method for comparison, we examined NH3 trends over AMoN sites and the larger applicability of using satellite retrievals to discern NH3 trends over regions and seasons lacking AMoN data.
2.1 Satellite NH3 observations
IASI is an infrared sounder deployed on board the MetOp-A, MetOp-B, and MetOp-C platforms in sun-synchronous orbits since October 2006, September 2012, and November 2018, respectively. IASI has a swath of 2200 km and provides global coverage twice per day at around 09:30 and 21:30 mean local solar time. At nadir, the IASI footprint has a 12 km diameter. The first IASI NH3 product was developed by Clarisse et al. (2009) by converting the brightness temperature differences into total NH3 columns. Later on, a flexible and robust retrieval algorithm based on an artificial neural network for IASI (ANNI) (Whitburn et al., 2016) was developed. The latest version is a reanalyzed dataset that uses the European Centre for Medium-Range Weather Forecasts Reanalysis v5 (ERA5) as its meteorological input (Van Damme et al., 2017; Van Damme et al., 2021). Because these meteorological data are coherent in time, the reanalysis dataset is the most appropriate dataset to study trends. For the present analyses, we used IASI version 3.1 reanalysis (v3.1r) retrieval product data from the MetOp-A (2008–2018) and MetOp-B (2013–2018) satellites (limited to cloud fraction ≤ 25 %). Only the morning orbits were analyzed because of higher sensitivity than the evening overpasses (Clarisse et al., 2010).
2.2 Ground-based observations
AMoN is the only network providing a consistent, long-term record of NH3 gas concentrations across the United States. AMoN was established by the National Atmospheric Deposition Program (NADP) in October 2007 and expanded to 19 sites in 2010 and 105 sites in 2018. AMoN deploys Radiello® passive samplers that rely upon diffusion theory, where gas-phase NH3 is adsorbed onto a cylindrical interior filter and extracted as to be analyzed by flow injection analysis (FIA). AMoN provides biweekly surface NH3 concentrations, and the network detection limit is 0.083 (∼ 0.078 µg NH3 m−3) for the 2-week samples in 2020 (NADP, 2023). The Radiello® passive samplers were found to be biased low by 37 % against denuders used as the reference method (Puchalski et al., 2011). In this study, we are comparing the relative variations instead of absolute concentrations of IASI and AMoN; therefore, the low bias of AMoN measurements is not as relevant to the outcome.
We incorporated data from all AMoN sites with one notable exception. Using satellite imagery, we determined that the AMoN site in Logan, Utah (UT01), is located only ∼ 100 m away from a livestock farm. Ammonia concentrations downwind of a beef/dairy feedlot at this distance are far above background levels and unrepresentative of those at the local–regional scales (1–10 km) (Golston et al., 2020; Miller et al., 2015; Sun et al., 2018). Concentrations at UT01 are expected to be strongly dependent upon the extent to which local winds blow directly from that farm to the AMoN site throughout the 2-week integration period. Not surprisingly, the UT01 site has the highest annual mean concentration (16.2 µg m−3) in the entire AMoN network (3 times higher than the next one). Furthermore, this AMoN site may be particularly susceptible to trends in animal operations or management practices at the farm. While it is possible the measurements of UT01 are representative of the local region, it is beyond the scope of this work to make such an assessment of its representativeness. For trend analyses, we only include AMoN sites with full-year coverage during 2008–2018 (N=13).
2.3 Trend analyses
2.3.1 Oversampled NH3 maps for trend analysis
From 2008 to 2018, a 0.02∘ × 0.02∘ (∼ 2 km) annual mean NH3 map of the CONUS was created each year based on a physical oversampling algorithm that represents the satellite spatial response functions as generalized 2-D super-Gaussian functions (Sun et al., 2018). This algorithm weighs IASI measurements by their uncertainties, which include varying sensitivities to thermal contrast as described in Sun et al. (2018) and Wang et al. (2021). To evaluate the seasonal trends, for each year, seasonally averaged oversampling maps were also generated for spring (March, April, and May, MAM), summer (June, July, and August, JJA), autumn (September, October, and November, SON), and winter (December, January, and February, DJF). For each season, we were able to achieve sufficiently overlapped IASI pixels through calculating the sum of the unnormalized spatial response function (SRF) of the oversampling results. A large sum of unnormalized SRF means the level 3 grid is covered by more level 2 pixels. Sun et al. (2018) and Wang et al. (2021) have a detailed description of SRF. The oversampling products are only used for the trend analyses in Sect. 4 to achieve a high spatial resolution. For IASI and AMoN comparison results in Sect. 3, the oversampling products are not used, since it sacrifices the temporal resolution.
2.3.2 Mann–Kendall test and Theil–Sen's slope estimator for trend analysis
We use the Mann–Kendall (MK) test and Theil–Sen's slope estimator for NH3 trend analyses. The non-parametric Mann–Kendall test and Theil–Sen's slope estimator are widely used in detecting trends of variables in meteorological and hydrological fields (Ahn and Merwade, 2014; Kendall, 1975; Yue and Wang, 2004). The Kendall rank correlation coefficient, commonly referred to as Kendall's τ coefficient, is a statistic used to measure the rank correlation. An MK test is a non-parametric hypothesis test for statistical dependence based on Kendall's τ coefficient. The Theil–Sen's slope estimator is commonly used to fit a line to data points by calculating the median of the slopes of all lines through pairs of points.
Unlike simple linear regression, the Mann–Kendall test and Theil–Sen's slope estimator do not require the data to follow normal distribution and therefore are more robust to any outliers (Yue and Wang, 2004). This method is computationally efficient and is insensitive to outliers. For skewed and heteroscedastic data, the Theil–Sen estimator can be significantly more accurate than linear least squares regression. For normally distributed data, the Theil–Sen estimator competes well against the least squares in terms of statistical power (Yue and Wang, 2004).
In this study, Theil–Sen's slope was used to estimate 2008–2018 NH3 trends, and the MK test was used to derive the significance level of trends.
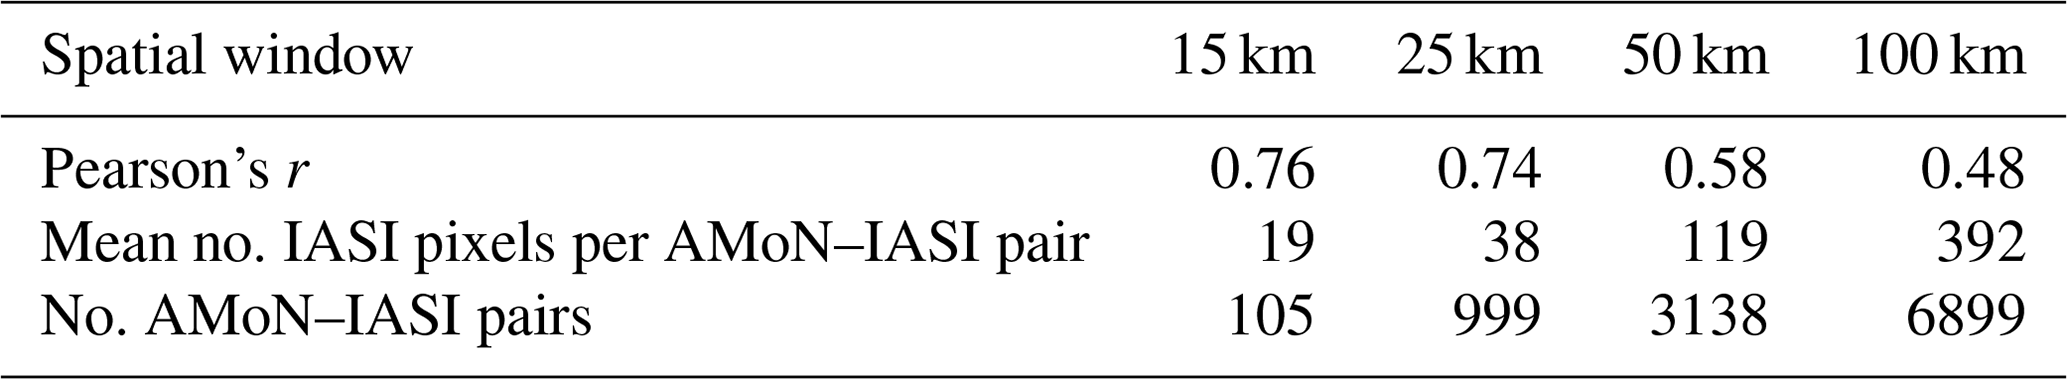
Table 1AMoN and IASI comparison results for different spatial windows.
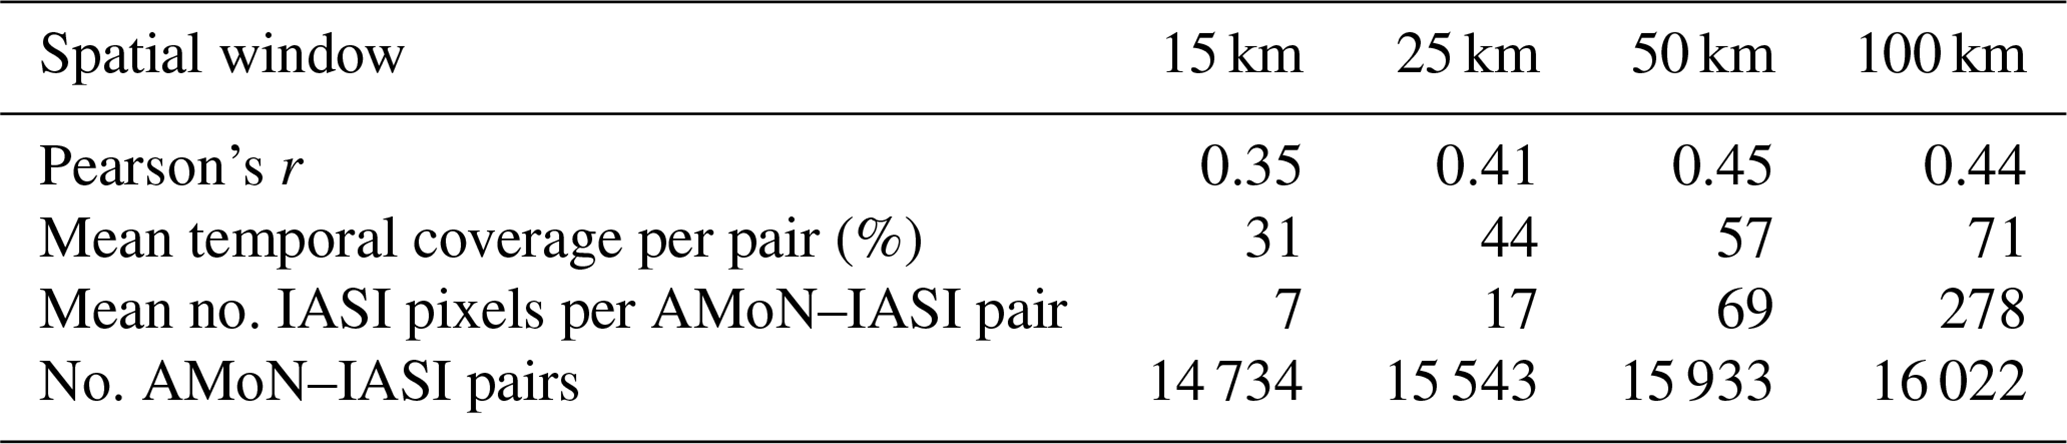
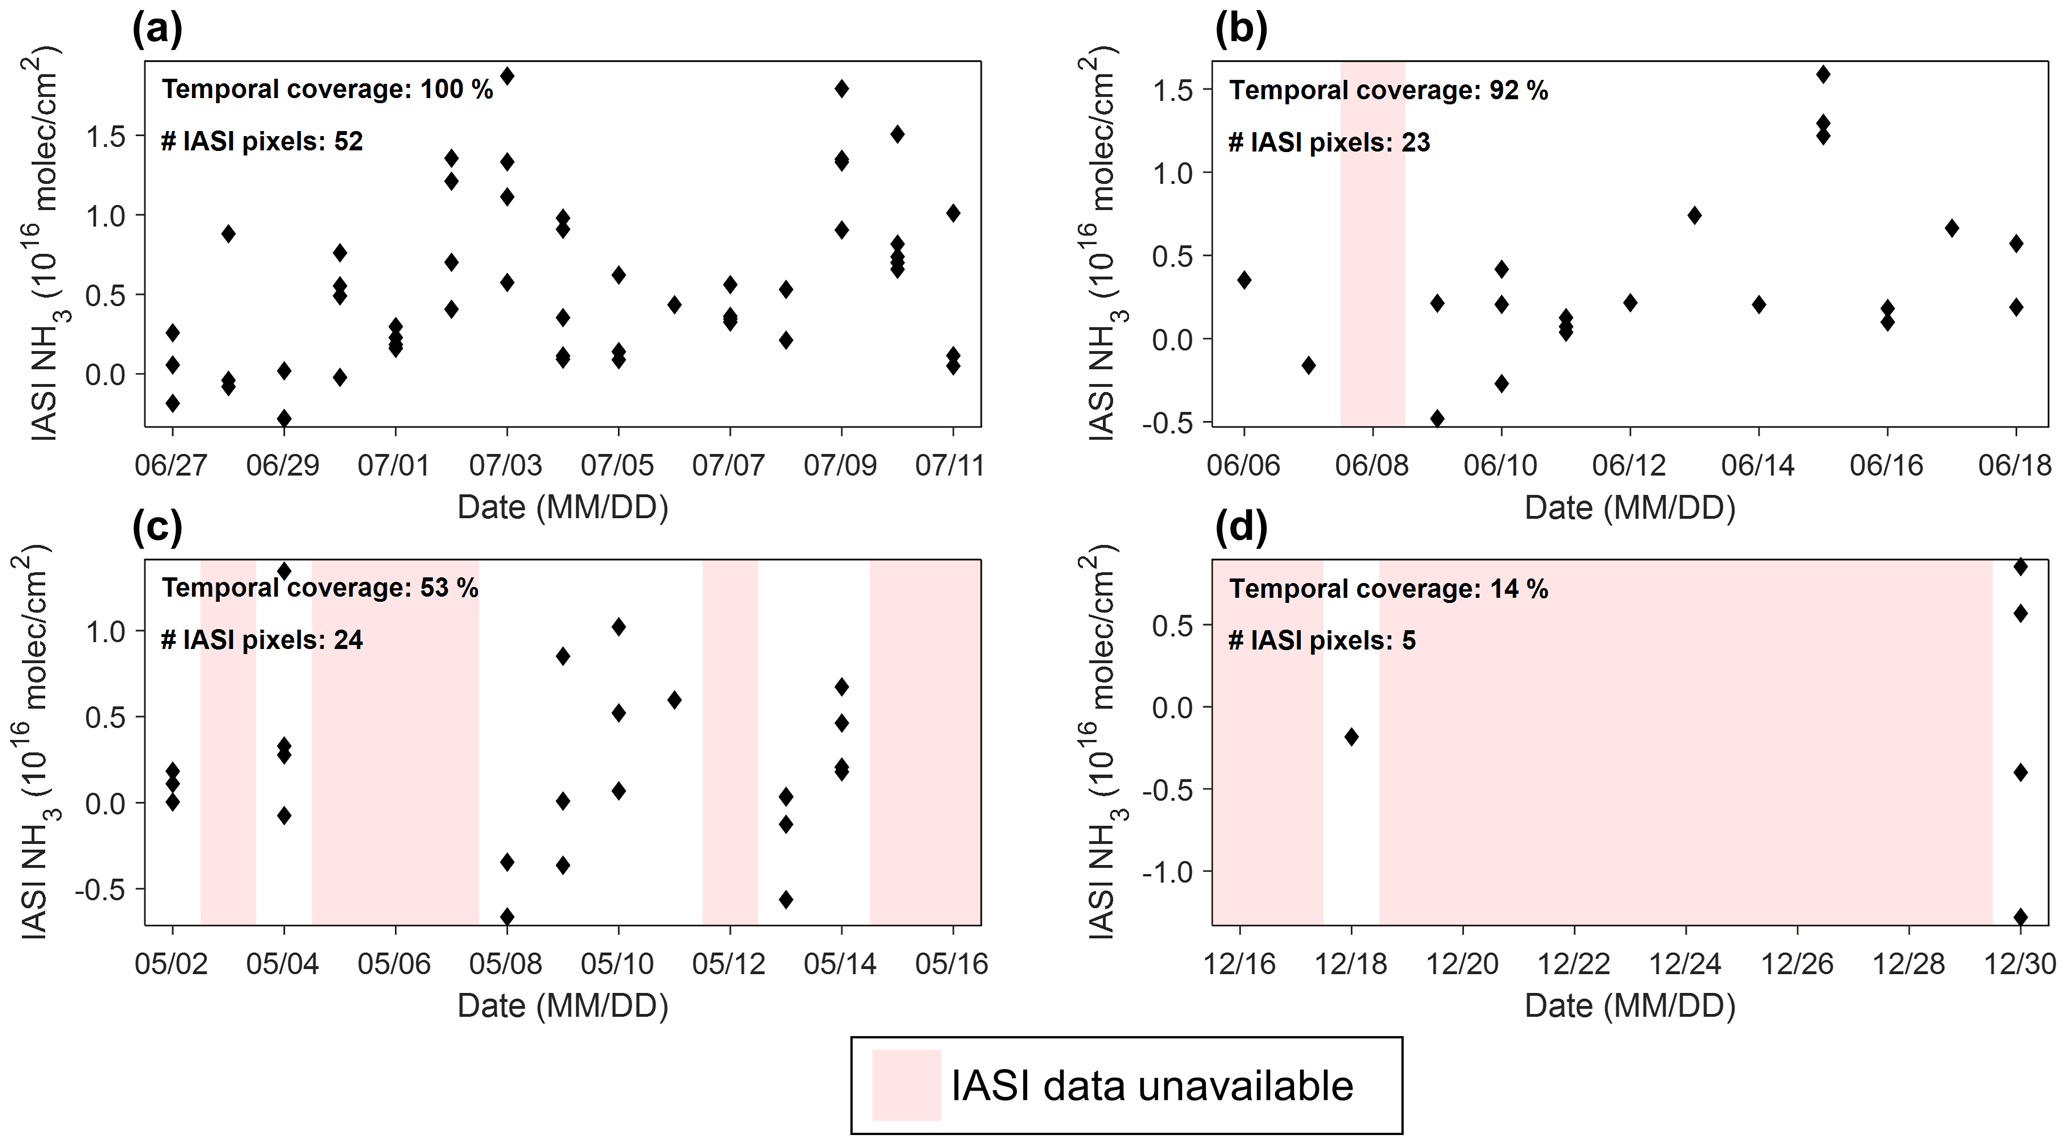
Figure 1Examples of IASI data temporal coverage over the biweekly AMoN sampling period for an AMoN site in Yosemite National Park, California (CA 44): (a) several IASI measurements every day during the 2-week sampling period, (b) a few IASI measurements for most days of the 2-week sampling period, (c) many IASI measurements but only on several days during the 2-week sampling period, and (d) sparse IASI measurements for only several days during the 2-week sampling period.
3.1 Sensitivity to spatial windows
For the initial analysis, we first used the simplest method for comparing the satellite measurements with ground observations. In other words, for each AMoN site, we average all IASI observations within a given radius of the AMoN site during the sampling time frame (2 weeks) for comparison and refer to that radius as a spatial window. We define each AMoN sample with co-located IASI pixels as an AMoN–IASI pair. If the distribution of NH3 pixels is spatially uniform, increasing the spatial window may improve the correlation between the two datasets because of a larger number of IASI pixels. Larger spatial windows include more IASI pixels than smaller spatial windows but at the expense of potentially not being representative of the AMoN site. In addition, a larger region is likely to encompass NH3 spatial gradients. In contrast, small spatial windows may only include a limited number of IASI pixels, encompassing more inherent noise in the satellite measurements, especially if close to the detection limit. Each integrated 2-week AMoN measurement for each site was correlated with any relevant satellite data within the spatial window (total of 104 AMoN sites with 16 093 measurements). Correlations between IASI and AMoN for different spatial windows (15, 25, 50, and 100 km) are summarized in Table 1. The minimum spatial window radius of 15 km is based upon an approximate scale for NH3 hotspots (Wang et al., 2021).
As the spatial window becomes larger, mean temporal coverage (defined as the percentage of days with available IASI data of the 2-week AMoN sampling period) and the number of IASI pixels both have significant increases, but Pearson's r coefficient only increases slightly from 0.35 at a 15 km spatial window to 0.44 at a 100 km spatial window. Indeed, doubling the spatial window from 50 to 100 km yields an almost tripled mean number of IASI pixels, yet it maintains almost the same correlation with r = 0.45 and r = 0.44, respectively. This indicates that including IASI pixels at longer distances from the AMoN site may not be representative of the AMoN site, especially near sources or in regions with complex topography. The slightly increased r value over spatial window range may result from a tradeoff between averaging spatial gradients versus integrating a larger number of IASI pixels to improve the signal-to-noise ratio of the satellite measurements. To balance these competing effects, we select 25 km as the nominal spatial window for the further comparisons.
Table 2The impact of IASI data's temporal coverage for the 2-week AMoN sampling period (25 km spatial window).
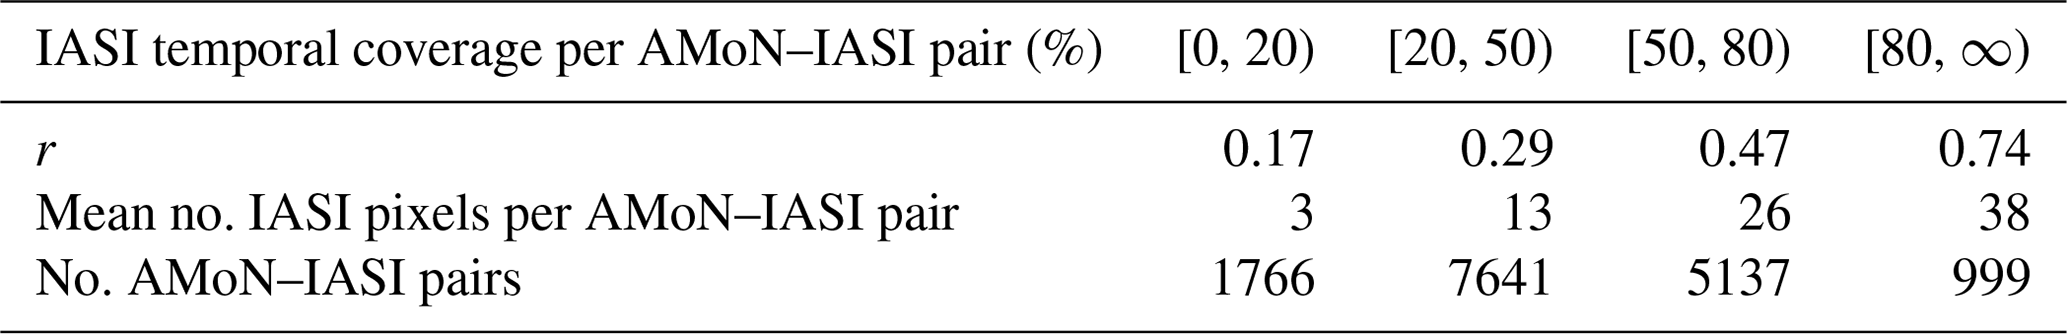
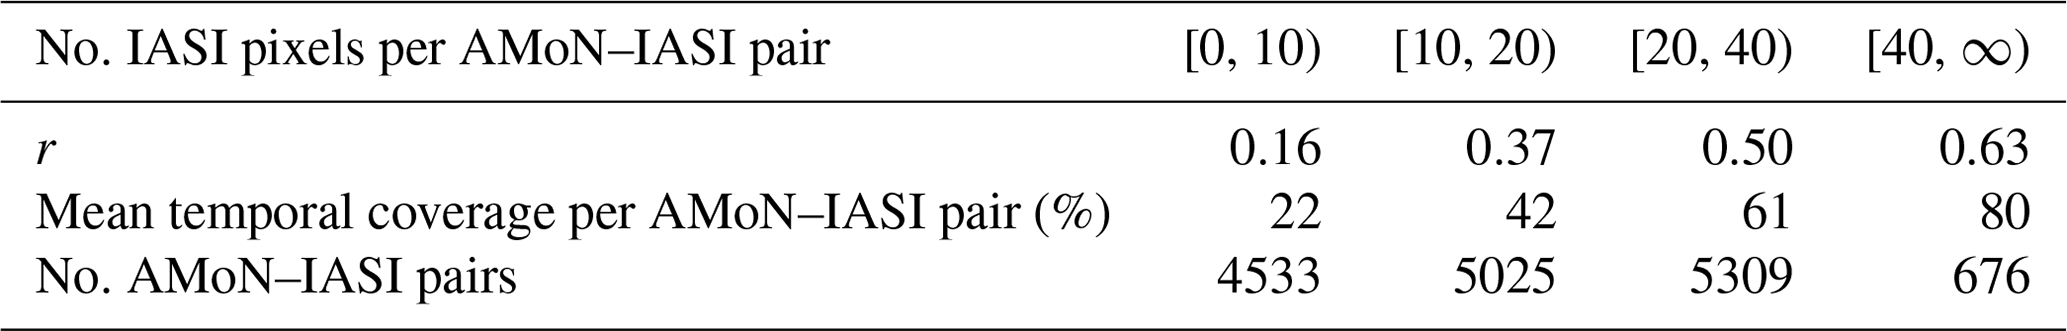
Table 3The impact of the number of IASI pixels (25 km spatial window).
3.2 Sensitivities to temporal coverage and the number of IASI pixels
NH3 is a short-lived species with a complicated diurnal profile (Nair and Yu, 2020) and the potential for large day-to-day concentration changes because of the variability in emissions, wind speed, temperature, PBL height, and aerosol partitioning (Golston et al., 2020; Miller et al., 2015). Thus, the temporal distribution of satellite measurements within the AMoN measurement period may impact the comparison. Figure 1 illustrates four examples where the number of IASI pixels and their relative distribution throughout the 2-week AMoN integration period (using a 25 km spatial window) could affect the results. An ideal comparison case would have a uniform number of IASI measurements on each day during the approximate 14 d AMoN measurement period, similar to the case shown in Fig. 1a. In this case, there is no specific day having more weight than the other when calculating the biweekly mean. More common, however, are cases where some days have no satellite measurements due to clouds or low thermal contrast. For example, Fig. 1b has 1 missing day (N=23 satellite measurements) but with an otherwise even distribution throughout the remainder of the period, while Fig. 1c (N=24) has nearly the same number of satellite measurements as Fig. 1b but clustered on only 8 of the 15 d. Finally, there are also many cases where selected day(s) have few or no IASI measurements at all (Fig. 1d). When neither temporal coverage nor the number of IASI pixels is high, one can still calculate the matched IASI NH3 column for this AMoN sample, but the result is unlikely to be as representative as a more temporally distributed comparison.
To this end, we explore the dependence of the correlation between IASI and AMoN on IASI data's temporal coverage of the 2-week sampling period and total number of IASI pixels within the 2-week AMoN sampling period, using the 25 km spatial window. For example, the temporal coverages for Fig. 1 are 100 %, 92 %, 53 %, and 14 % and the number of IASI pixels are 52, 23, 24, and 5, respectively. The impact of different temporal averaging and the number of IASI pixel requirements are summarized in Tables 2 and 3, respectively. Increasing temporal coverage and the number of IASI pixels both yield higher r values than any of the simple spatial windows alone. Table 2 shows that the correlation improves to r = 0.74 when the temporal coverage is ≥ 80 %, suggesting a significant impact of temporal coverage of the IASI data. The IASI and AMoN correlations also increase over a simple spatial window with increasing numbers of IASI pixels, yet the impact is not as strong (r = 0.63 for N ≥ 40) as the sensitivity to temporal coverage.
Because the temporal coverage and number of IASI pixels are not independent variables, additional analyses are conducted to study the sensitivity of these two effects using the Monte Carol method. First, the available dataset is filtered to cases when at least 1 of the 14 d have multiple IASI measurements per AMoN measurement, at least 7 d of the 14 d sampling period had at least one IASI measurement, and the total number of IASI pixels is at least 20. The number of days with available IASI measurements is denoted by T. Two opposite approaches are explored for 104 qualified AMoN sites:
-
For maximized temporal coverage (TC_max), only one IASI pixel is randomly selected to represent that day, and the total number of IASI pixels equals T (T ≤ 14). In this case, the temporal coverage is maximized.
-
For minimized temporal coverage (TC_min), only days with the largest number of IASI pixels are selected until the total number of IASI pixels equals T (T ≤ 14). In this case, the temporal coverage is minimized, and the total number of selected IASI pixels is the same as TC_max.
For each AMoN site, we repeated the two different sampling strategies 100 times and then calculated the median r value to represent each site using the maximum and minimum coverage approaches. Figure 2a shows the histogram and normalized fit of change in r (Δr = TC_max-TC_min) for each site between the two scenarios with the number of bins determined by Sturges' rule. The increased correlation of Δr = 0.45 ± 0.28 shows the large impact of temporal coverage. The total number of IASI pixels used for the two strategies was identical.
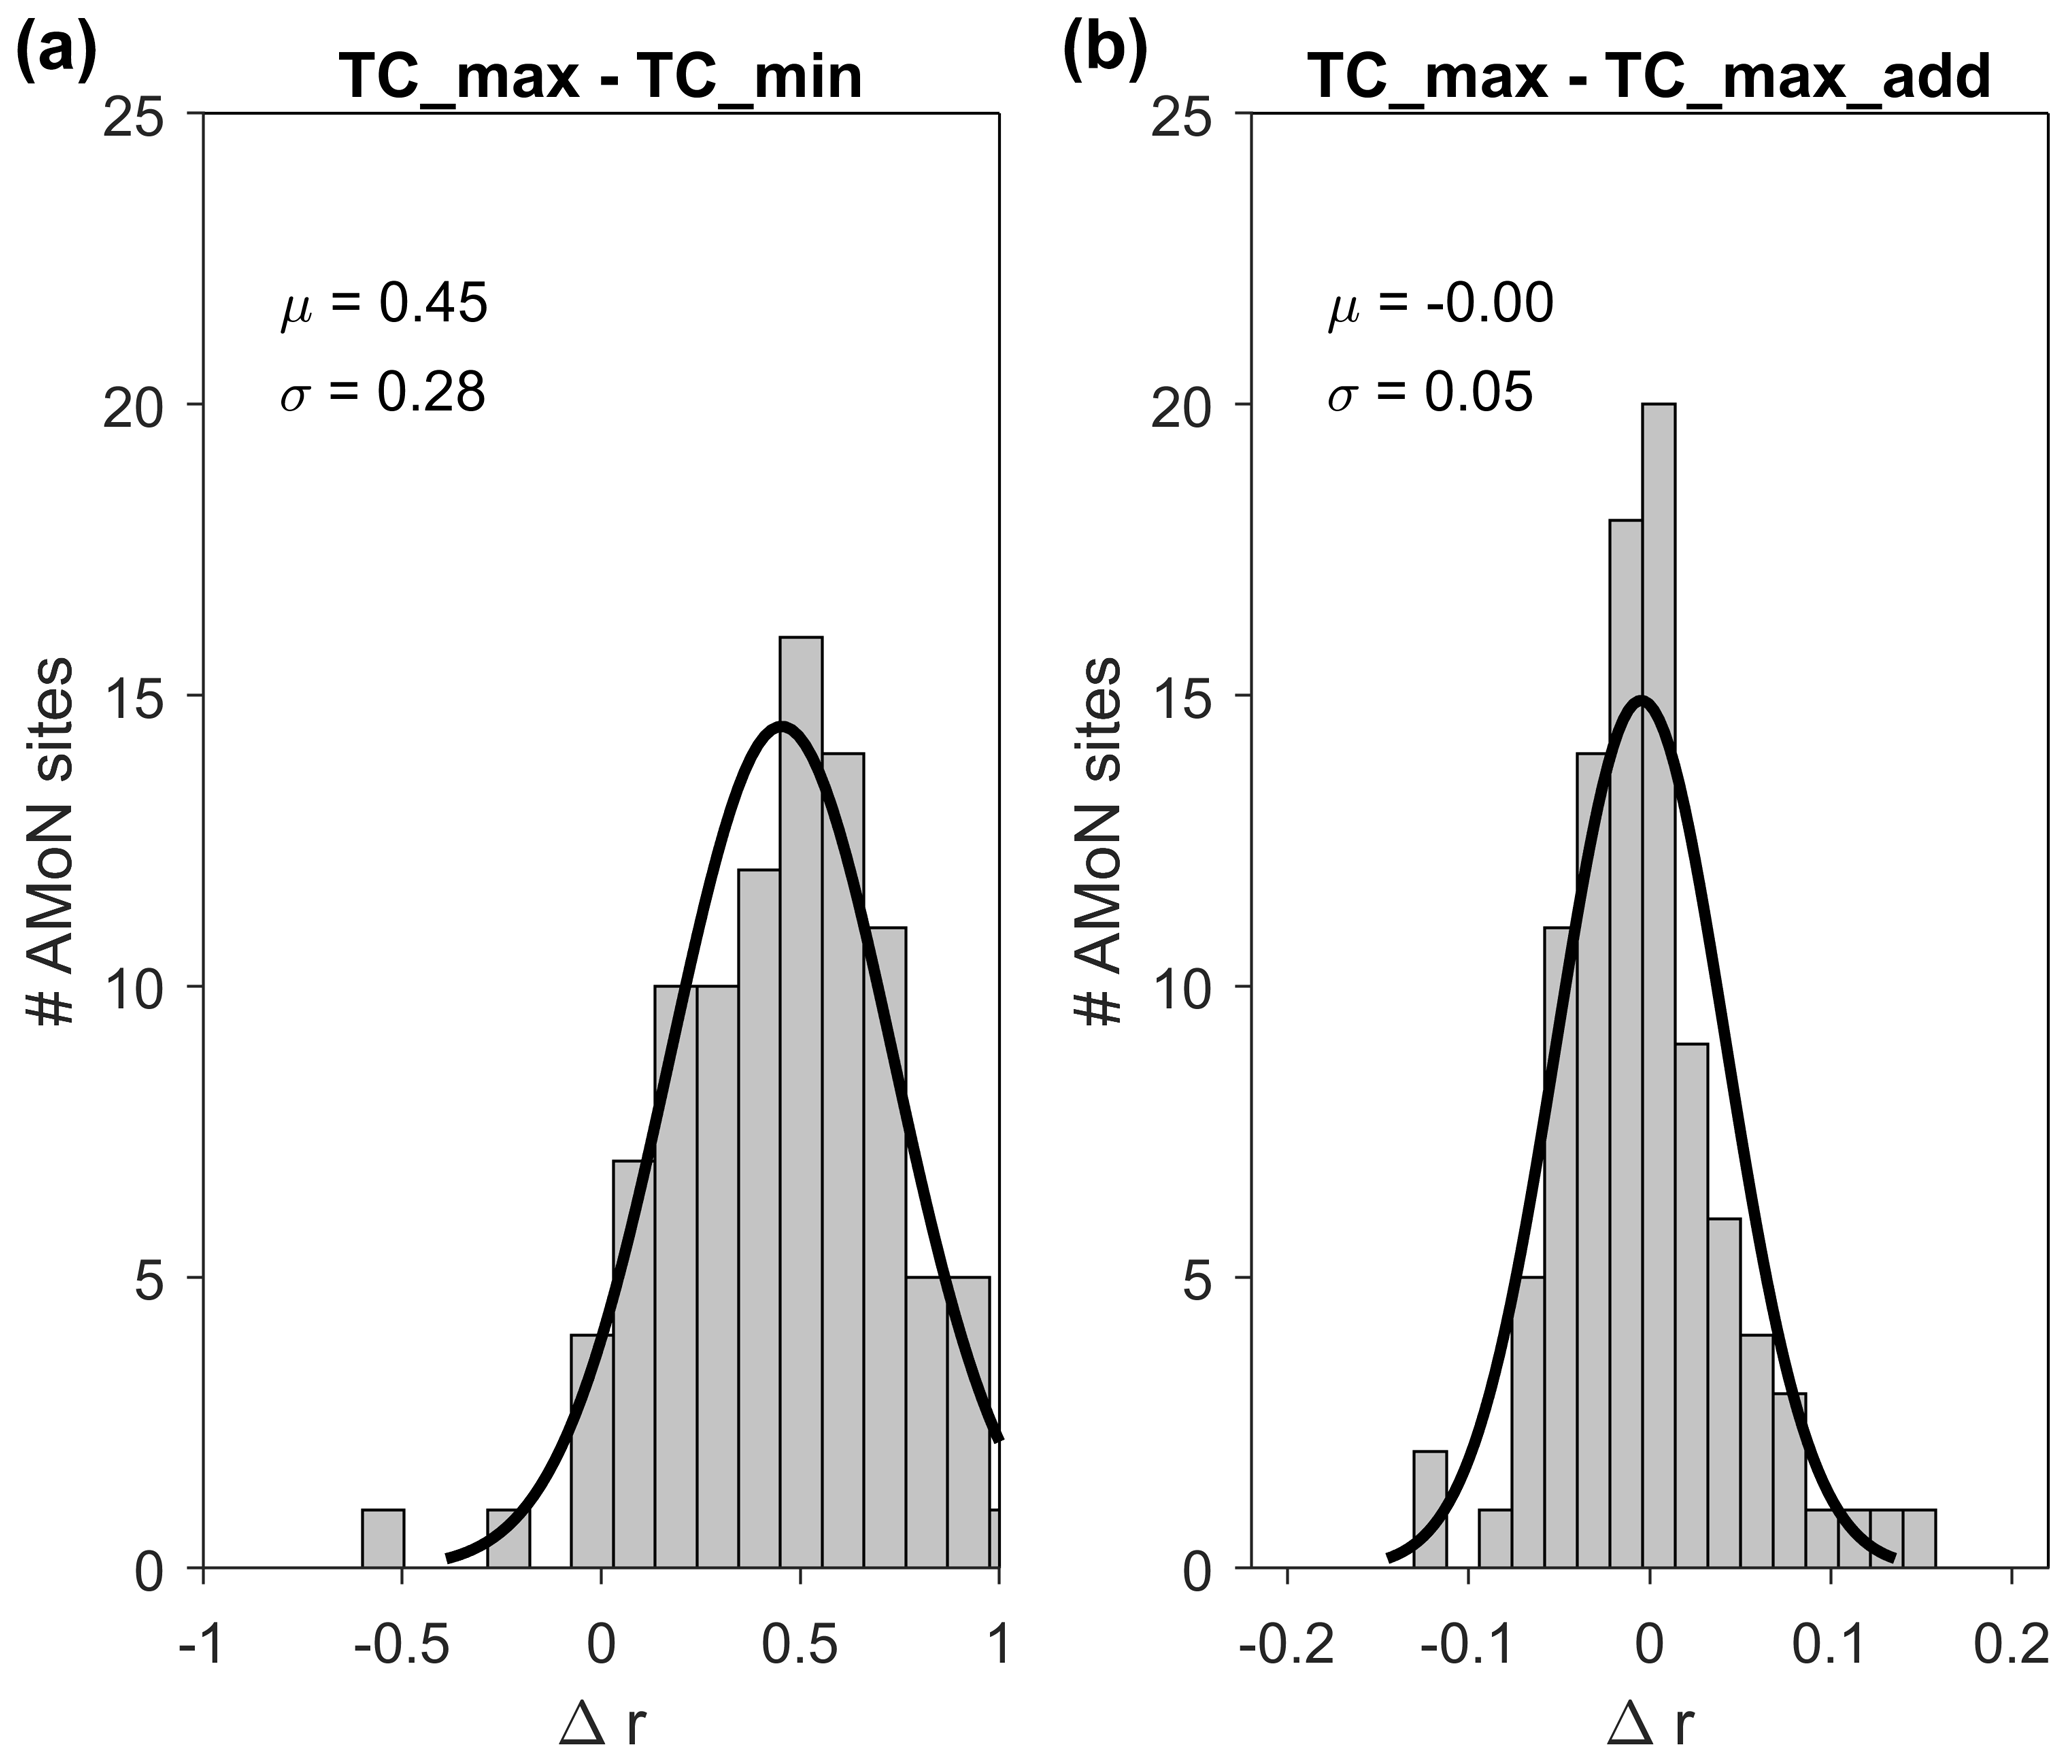
Figure 2The change in r values for individual AMoN sites using different sampling strategies: (a) maximized temporal coverage (TC_max) and minimized temporal coverage (TC_min) and (b) maximized temporal coverage and randomly adding more pixels (TC_max_add).
To further investigate the impact of including more IASI pixels after maximizing temporal coverage, we also test the process described in (1) and then randomly added (20-T) more IASI pixels from the remaining IASI pixels and referred to it as TC_max_add. Figure 2b shows that the changes Δr between TC_max and TC_max_add are small (−0.00 ± 0.05). For the TC_max strategy, the initial number of IASI pixels was between 7 and 14, which means that using the TC_max_add strategy results in a 43 ∼ 186 % increase in the number of IASI pixels compared to TC_max alone. Adding more IASI pixels does not have a significant impact on the r values, indicating that maximized temporal coverage alone is the most important factor when comparing IASI to AMoN stations.
Table 4AMoN and IASI comparison results for different spatial windows (temporal coverage ≥ 80 %).
After applying a temporal coverage requirement (temporal coverage ≥ 80 %) to filter the overall dataset, we revisit the sensitivity of the agreement between spatial windows. The smaller spatial window now yields better agreement than the larger spatial windows (Table 4). Compared with Table 1, which has no filter for temporal coverage, the r values in Table 4 increase for all spatial windows. The correlations are clearly better for smaller spatial windows (r = 0.74 for 25 km versus r = 0.48 for 100 km). In this way, the use of a larger spatial window is indeed a tradeoff between the increasing temporal coverage versus incorporating a larger spatial gradient. The results further demonstrate that the IASI pixels far from the AMoN sites may not be representative of the AMoN site.
3.3 Sensitivity to seasons and temporal averaging
AMoN has similar numbers of measurements in spring (March, April, May), summer (June, July, August), autumn (September, October, November), and winter (December, January, February), while the mean number of IASI pixels (no. IASI pixels) per pair in winter is only around half that of the other seasons (Fig. 3). In winter, low thermal contrasts result in a low sensitivity of the thermal infrared sounder, which explains the low number of IASI pixels in winter (Clarisse et al., 2010; Guo et al., 2021). The lower sensitivity of the infrared thermal sounder measurements in winter results in higher uncertainties, and thus comparisons between IASI and AMoN are especially important. When temporal coverage is at least 80 %, IASI wintertime data still have good agreement with AMoN (r = 0.61), although the comparison is limited to only a few AMoN and IASI pairs (N=33). The r values for spring, summer, and autumn when temporal coverage is ≥ 80 % are 0.60 (N=181), 0.76 (N=502), and 0.70 (N=283), respectively. IASI in general only provides a small number of pixels in winter; however, it indeed has the capability of reflecting surface NH3 variations even in winter.
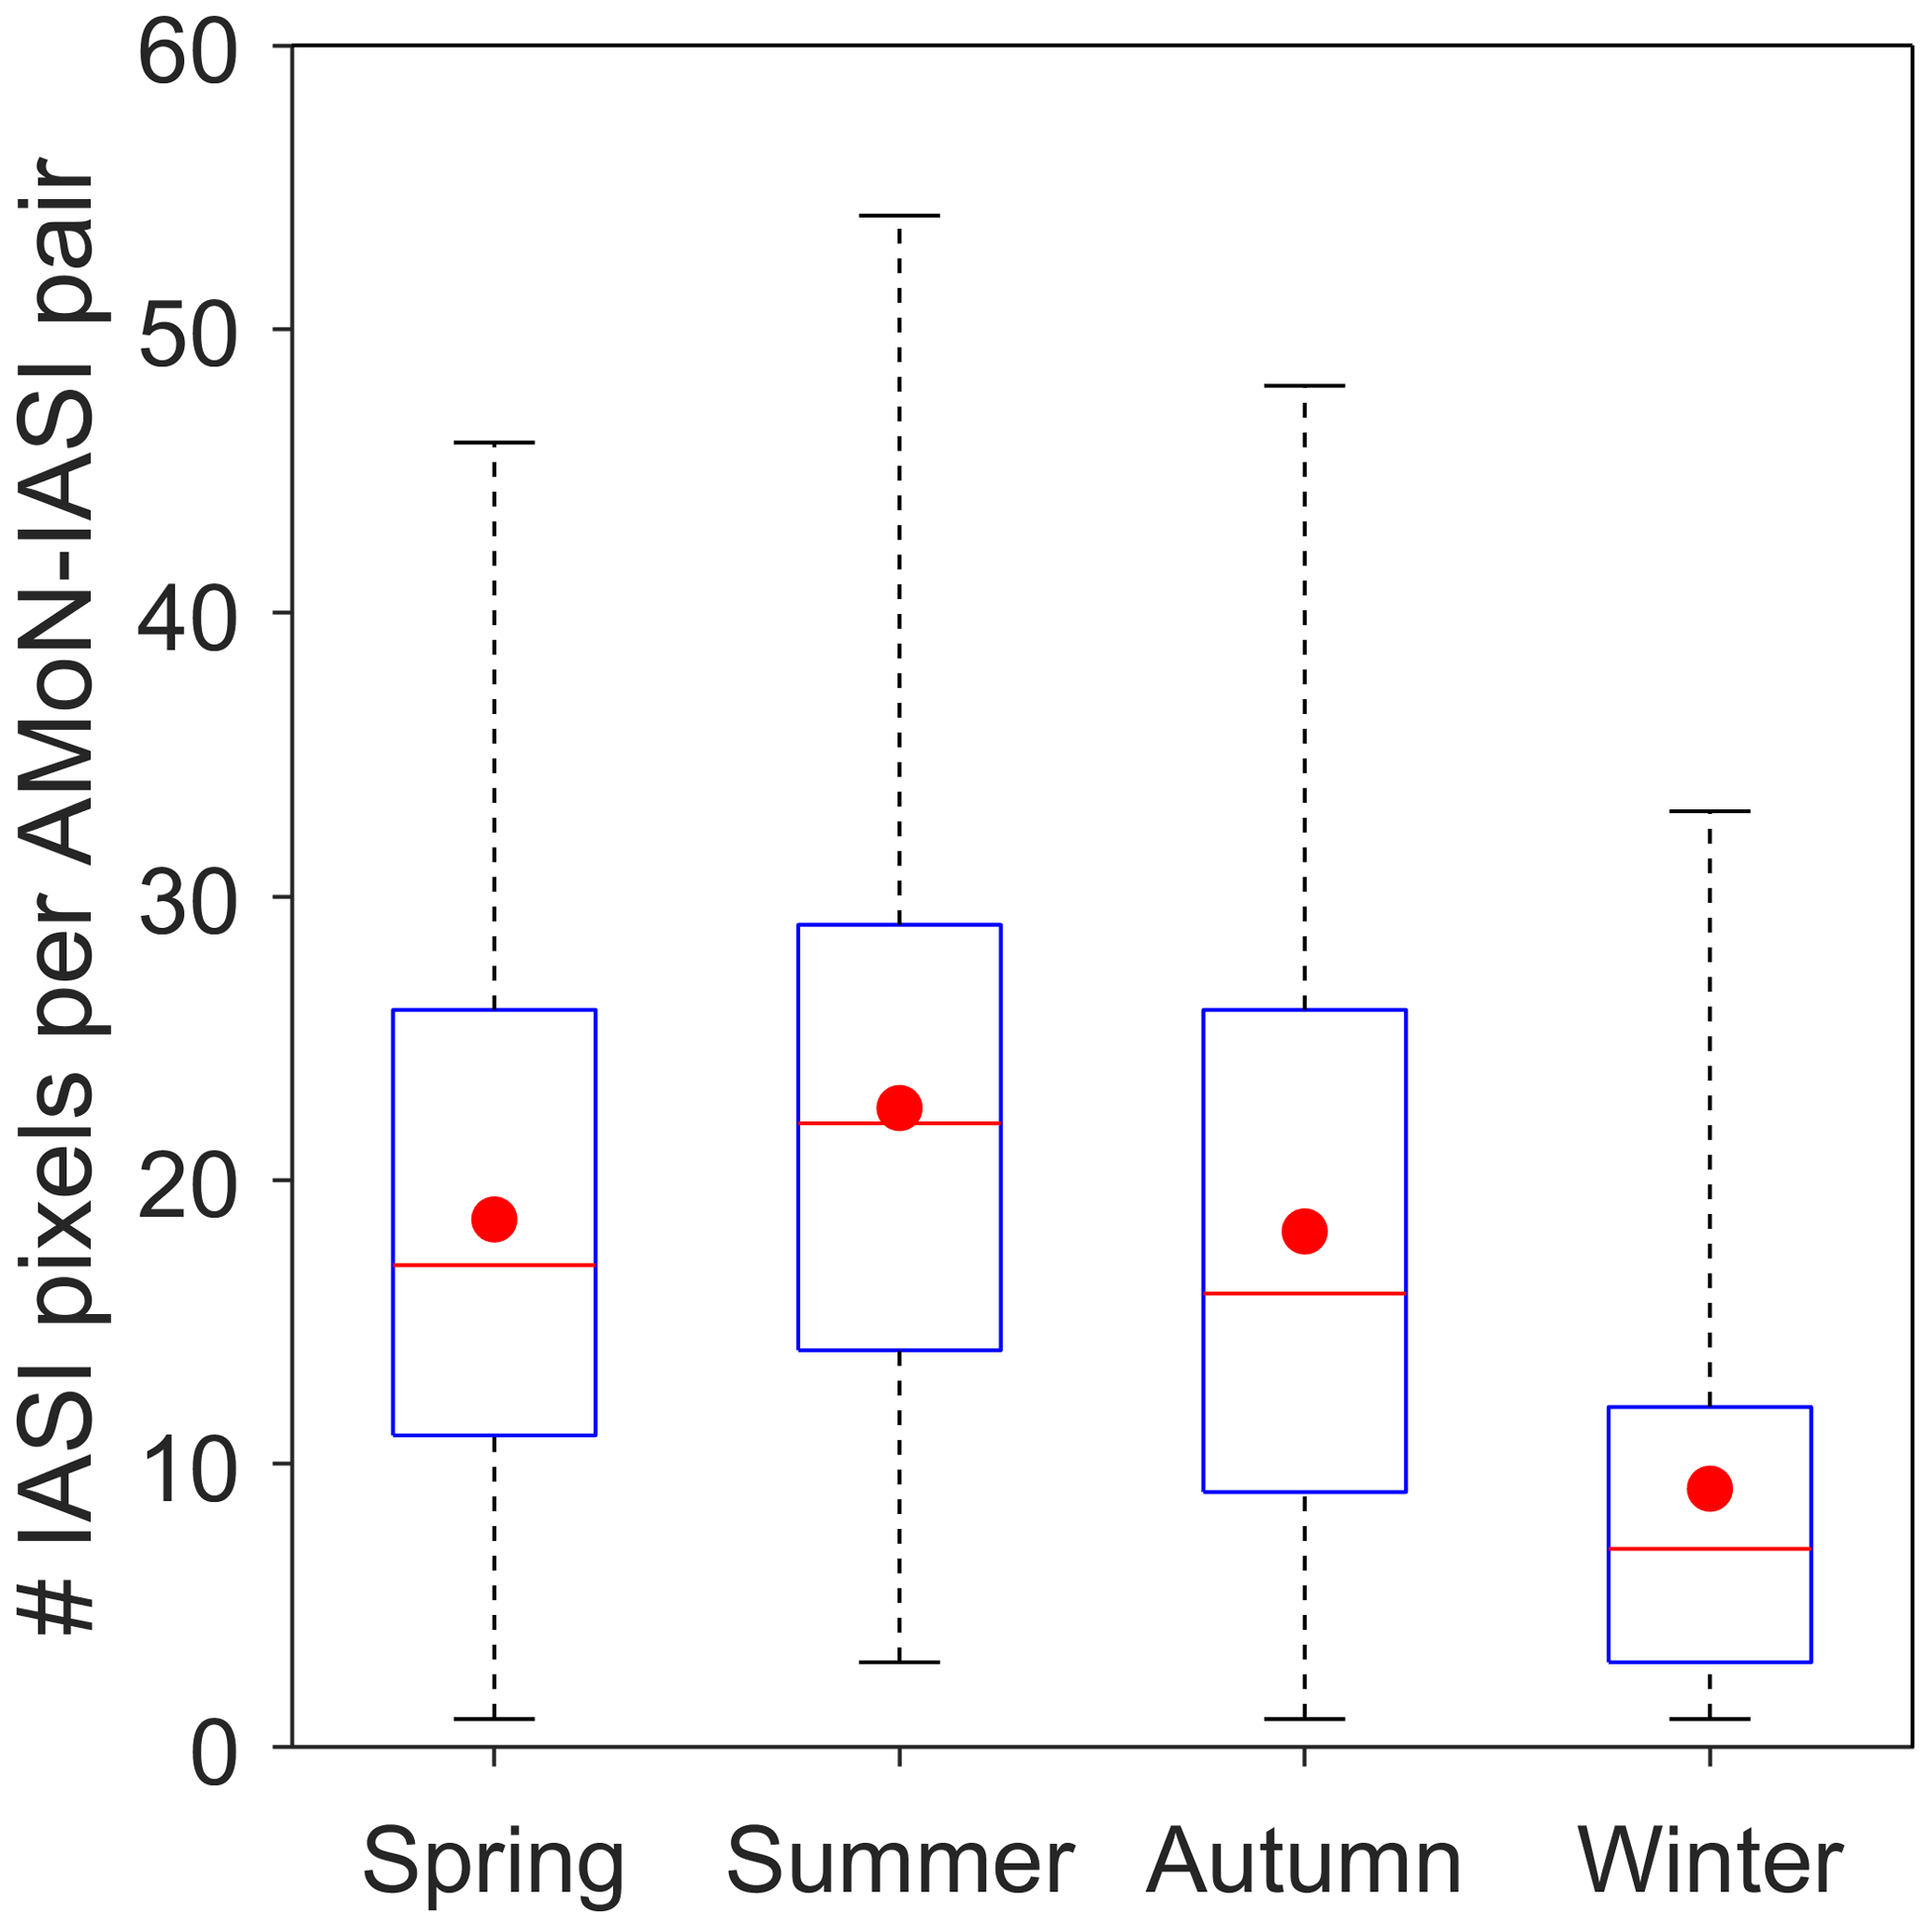
Figure 3Boxplot of number of IASI pixels per AMoN–IASI pair for spring, summer, autumn, and winter. The boxes denote the 25th and 75th percentiles, the whiskers denote the 1st and 99th percentiles, and the red dot denotes the mean.
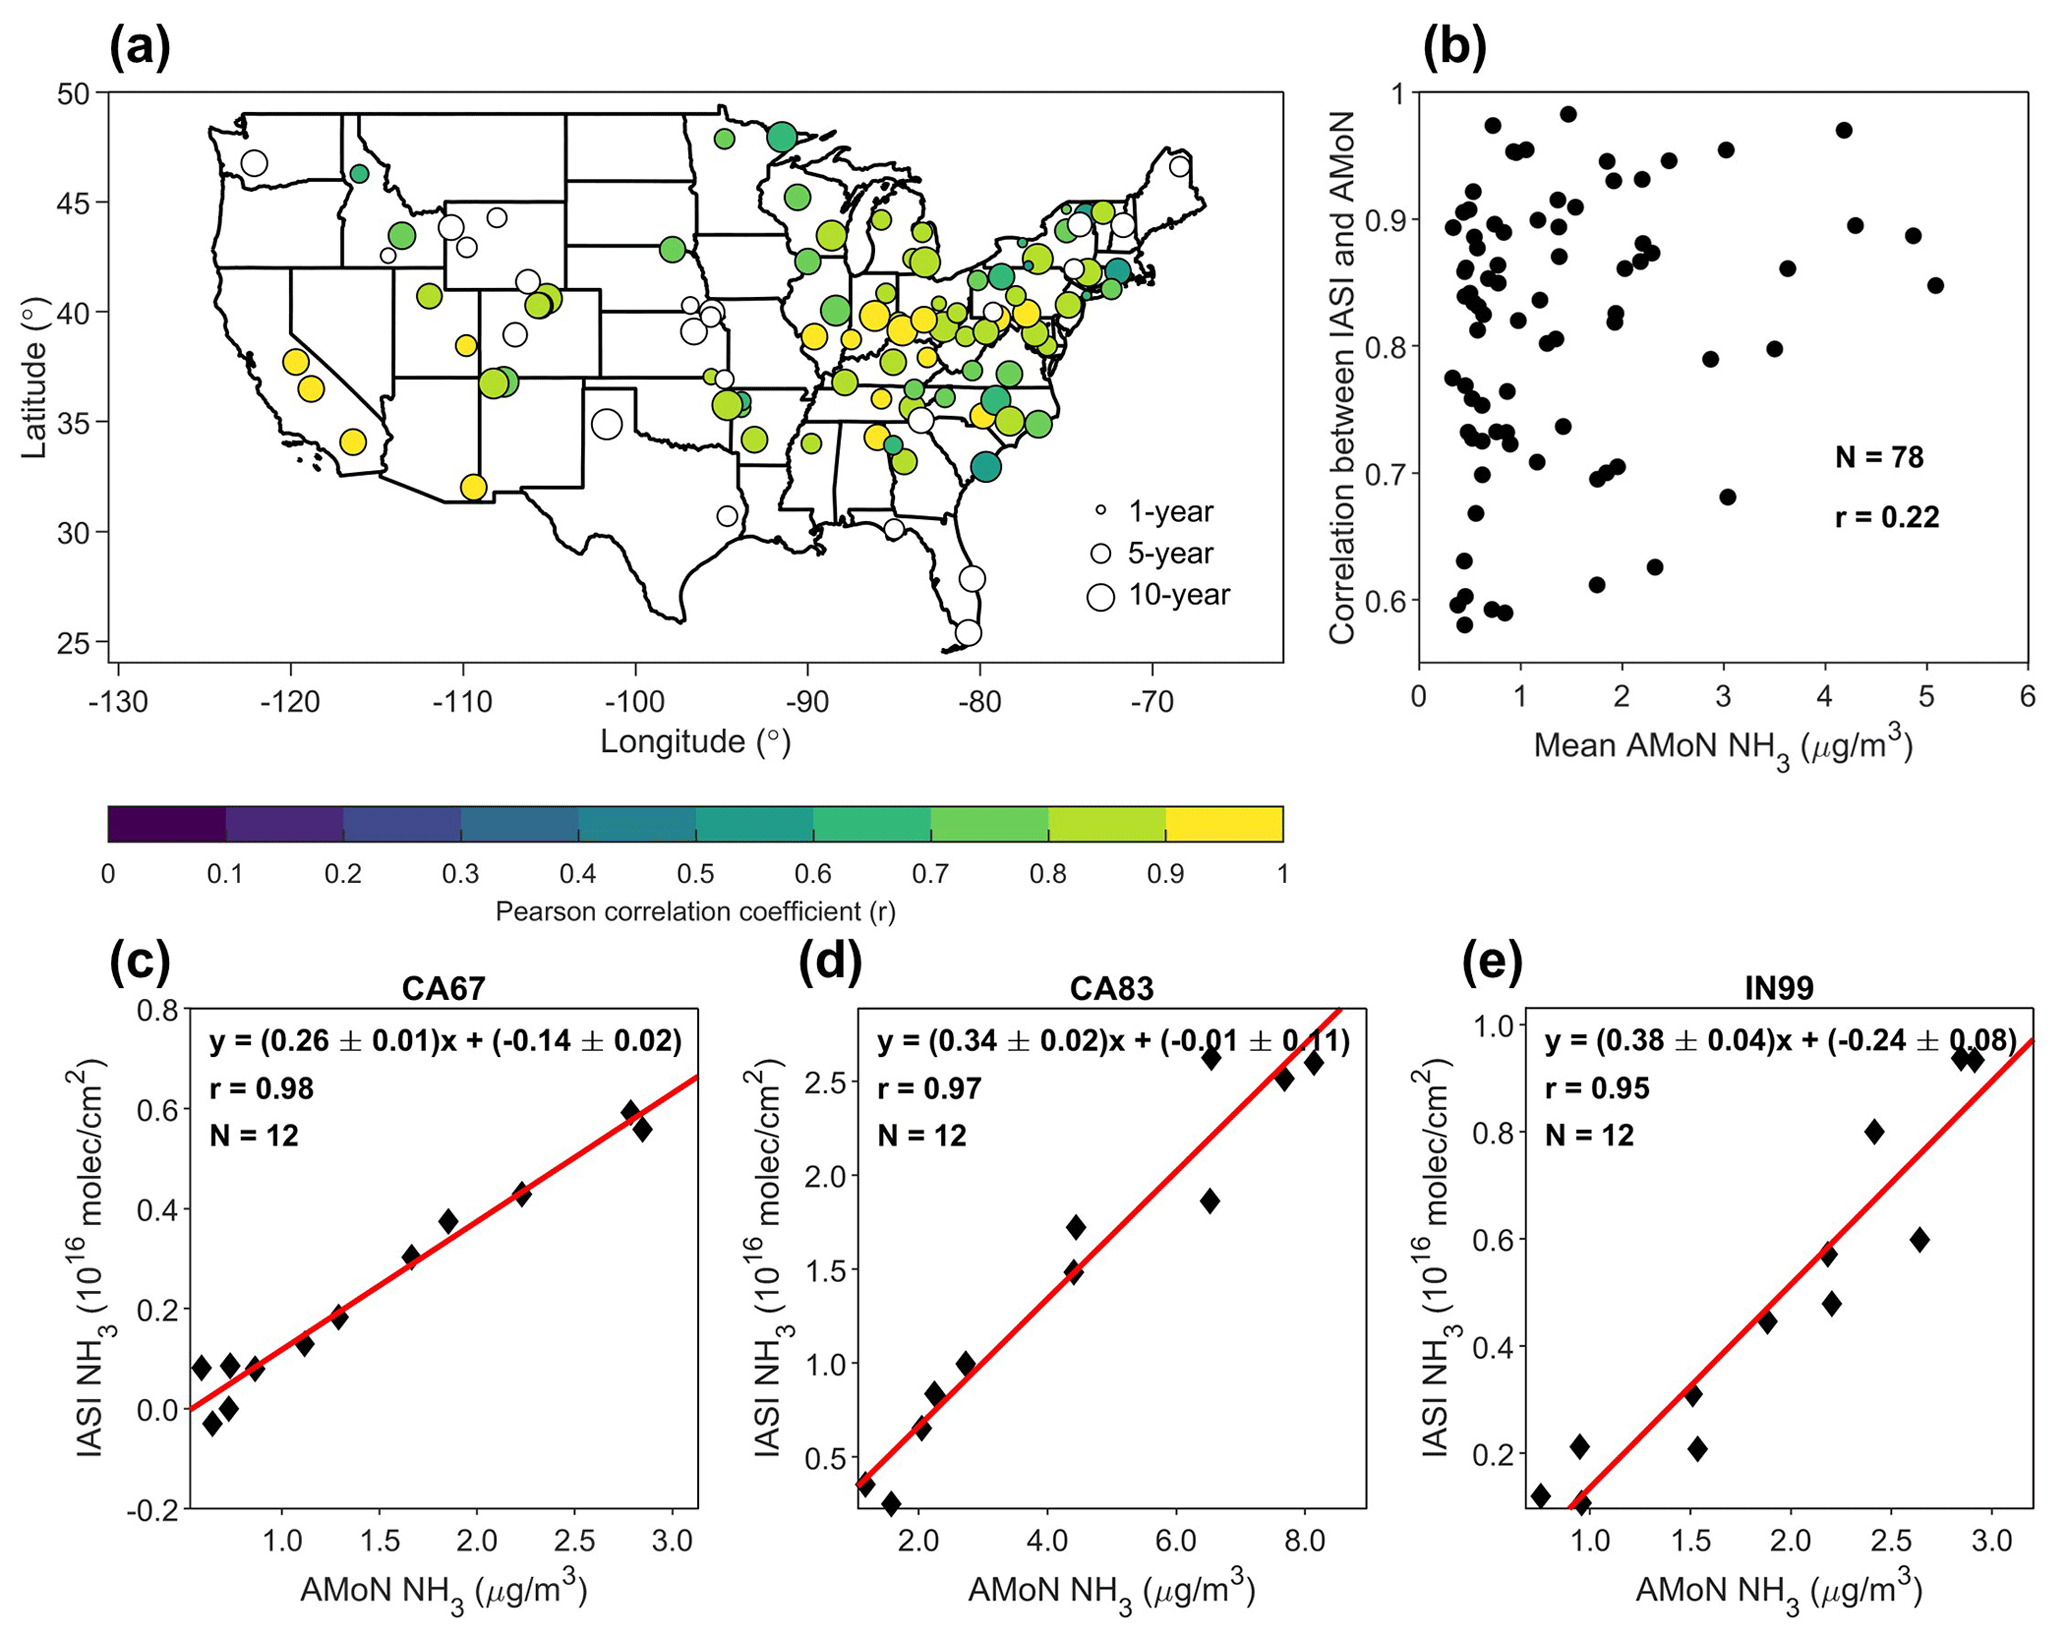
Figure 4(a) Multiyear-averaged NH3 seasonality comparison results between AMoN sites and the IASI observations within 25 km of the AMoN sites at monthly resolution. Circles without filled color denote the AMoN sites with no statistically significant correlation with IASI (α = 0.05). The circle sizes denote the length of AMoN data record. (b) The relationship between mean AMoN NH3 concentrations and the correlation between AMoN and IASI seasonality. The regression between IASI- and AMoN-observed NH3 seasonality for (c) the AMoN site in Joshua Tree National Park, California (CA67); (d) the AMoN site in Sequoia National Park, California; and (e) the AMoN site in Indianapolis, Indiana (IN99).
The results in Sect. 3.1 and 3.2 have already shown the importance of spatial window and temporal coverage. The temporal averaging and regridding approaches, such as the tessellation oversampling and physical oversampling, are common methods to achieve higher spatial resolution by sacrificing the temporal resolution (Sun et al., 2018; Van Damme et al., 2018; Wang et al., 2021). Here we neglect the interannual variability in NH3 seasonality and calculate averaged IASI and AMoN NH3 seasonality during 2008–2018 using the 25 km spatial window. By averaging the multiyear IASI data, the impacts of temporal coverage are alleviated because both temporal coverage and number of IASI pixels increase. Among the 101 AMoN sites with at least 1 full year of data and available IASI v3.1r NH3 data, 49 sites show strong agreement with IASI with r > 0.8, 29 sites have moderate agreement of 0.5 < r ≤ 0.8, and 23 sites do not have statistically significant agreements (Fig. 4a). If taking all data into consideration, the overall r value for the CONUS is 0.69. The AMoN sites with higher NH3 concentrations tend to show better agreements between AMoN and IASI (Fig. 4b). The median AMoN NH3 annual mean concentrations for all sites is 0.86 µg m−3. Most sites with no statistically significant agreements have a low NH3 concentration (median: 0.48 µg m−3). Currently, most AMoN sites are located in regions with low or moderate NH3 concentrations with a lack of sites in the NH3 hotspots (Wang et al., 2021) and urban areas, complicating the comparison between AMoN and IASI.
The above agreement demonstrates that the IASI NH3 column reflects the variation in the surface NH3 concentration at seasonal resolution. For regions without any available ground measurements, IASI NH3 observations can be used to help us better understand the NH3 variations. However, large differences exist among the relationships between IASI and AMoN NH3 concentrations over different AMoN sites (an example of linear regression plot in Fig. 5b). Even for AMoN sites with excellent correlation (r > 0.8), the slopes vary a lot, ranging from 0.08–1.4 × 10¹⁶ per microgram per cubic meter. For instance, two AMoN sites in California, Joshua Tree National Park (CA 67) and Sequoia and Kings Canyon National Park (CA 83), both exhibit great seasonality agreements with IASI (r = 0.98 and r = 0.97, respectively), but the slope for CA 83 (Fig. 4d) is 31 % higher than CA 67 (Fig. 4c). The difference between the slopes suggests that although IASI is able to capture the general seasonality, the relationship between NH3 column and surface NH3 is distinctly different due to complicated topography, meteorology, and other factors at different AMoN sites.
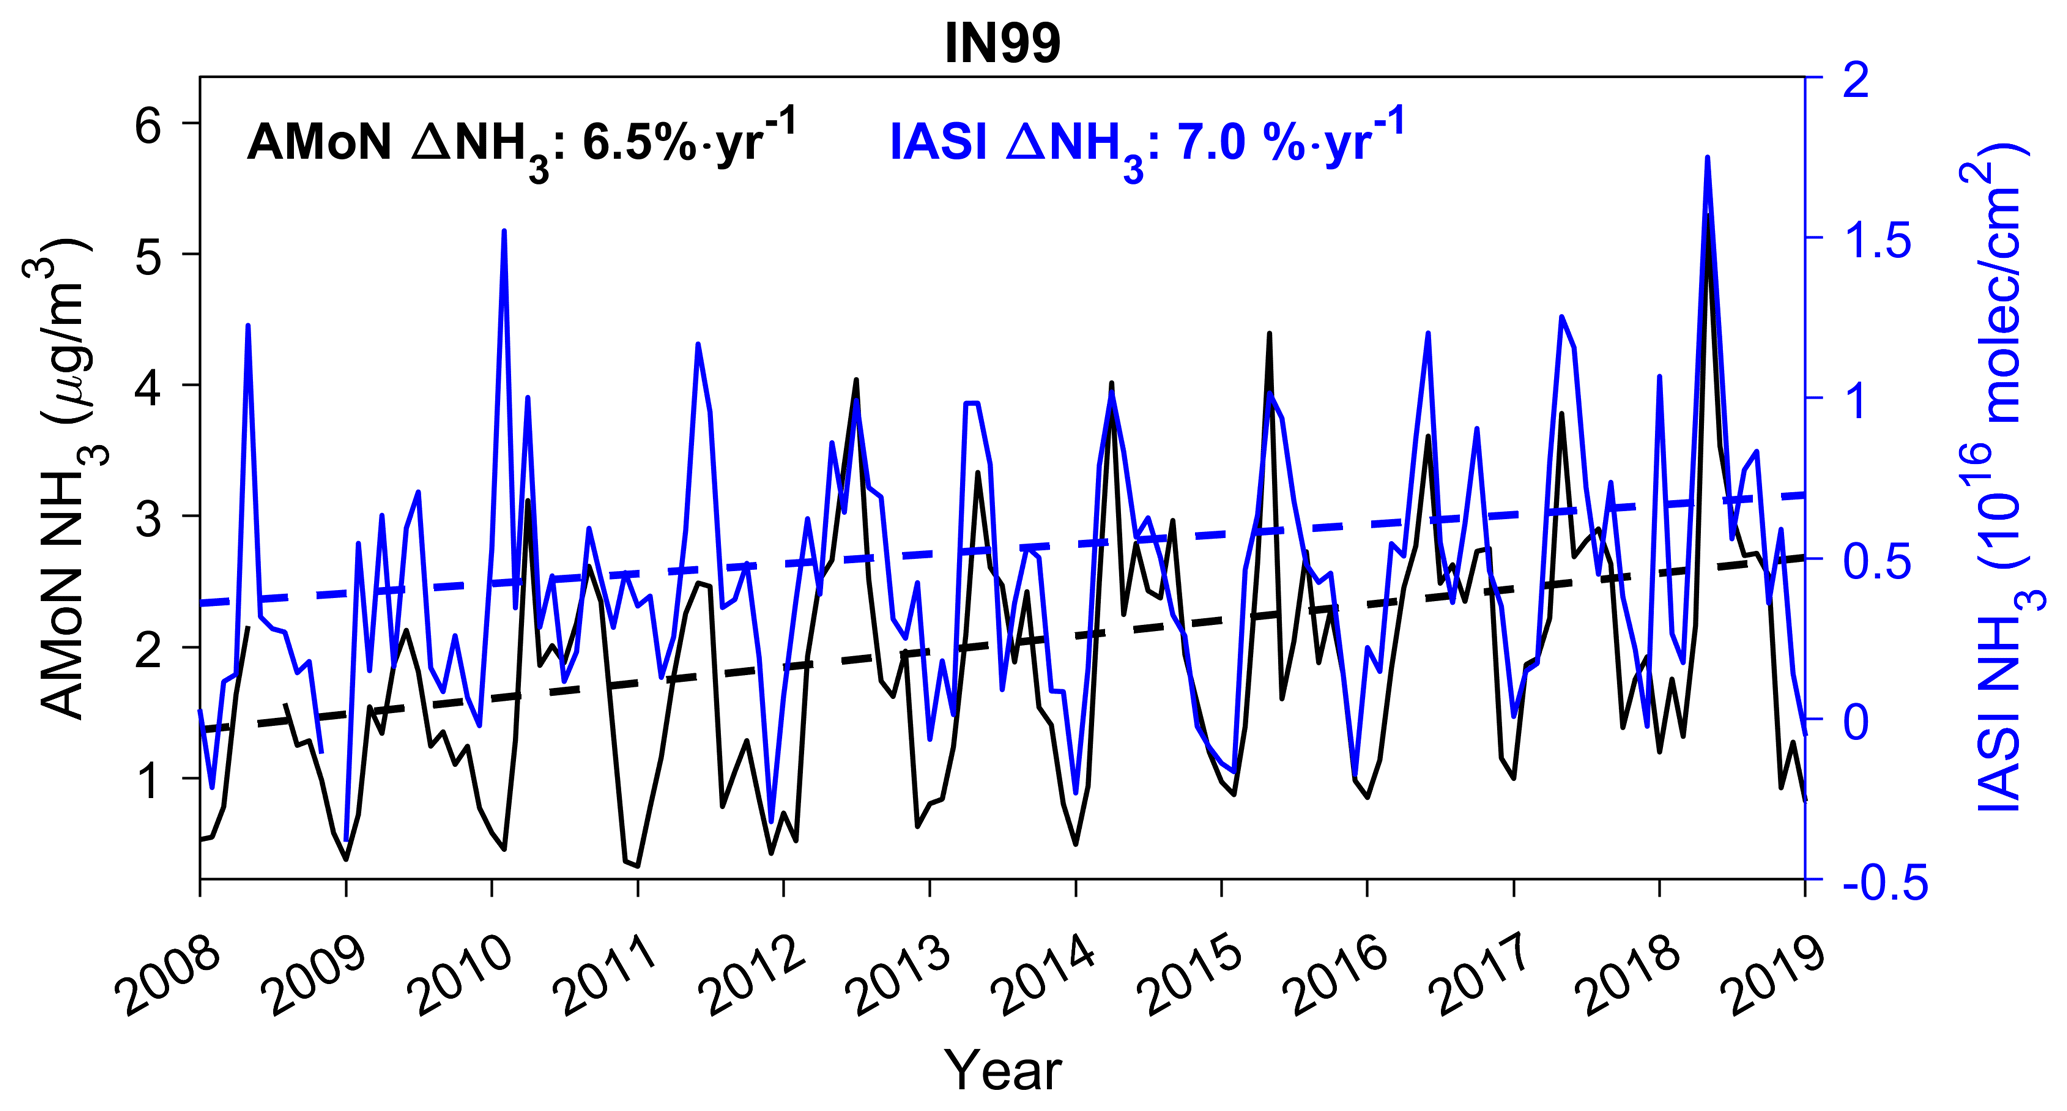
Figure 5The 2008–2018 trends in monthly averaged NH3 for the AMoN site in Indianapolis, Indiana, US (IN 99), and IASI NH3 observations within 25 km of IN 99.
4.1 Trend in the CONUS
Strong evidence of increasing NH3 concentrations in the US comes from both ground-based observations and satellite measurements (Van Damme et al., 2021; Warner et al., 2017; Yao and Zhang, 2016; Yao and Zhang, 2019; Yu et al., 2018). The methodology and comparison results in Sect. 3 demonstrate that IASI NH3 can be used to verify and augment regional NH3 trends over the last decade. Figure 5 shows monthly averaged IASI and AMoN time series from Indianapolis, Indiana, USA (IN 99). The strong correlation (r = 0.96) between the two measurements is shown in Fig. 5b. Although the NH3 seasonality remains consistent from 2008 to 2018 – namely spring maxima and secondary maxima in autumn with the lowest values in winter – both AMoN and IASI also show increasing trends of NH3 concentrations over the entire time series. AMoN shows a trend of 6.5 % yr−1, while IASI shows a trend of 7.0 % yr−1.
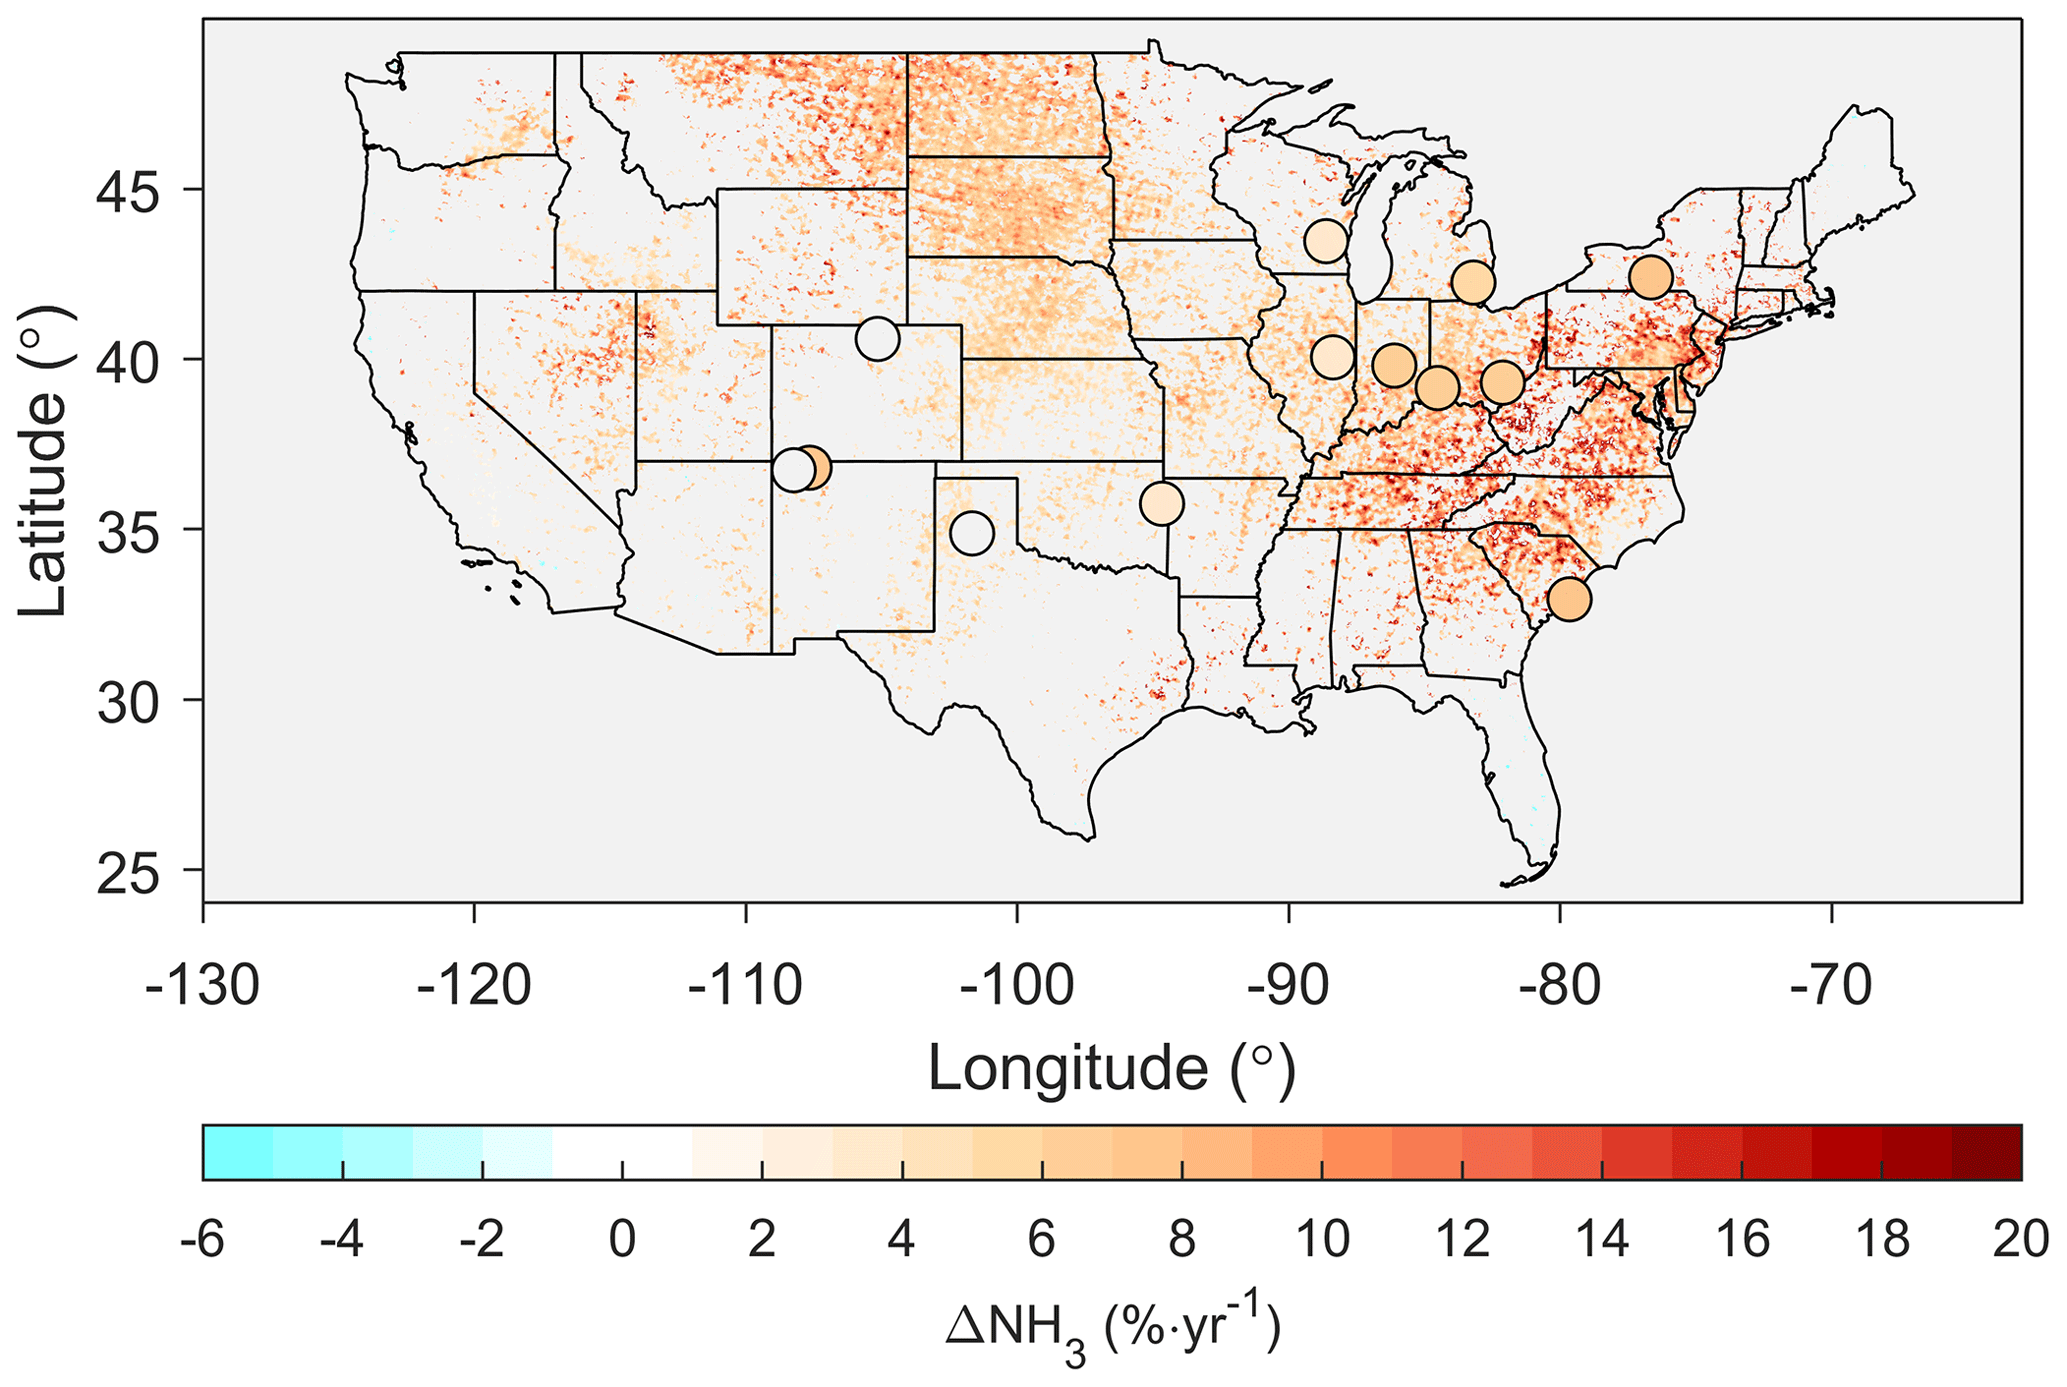
Figure 6Trend analysis for IASI NH3 (2008–2018) and AMoN NH3 measurements in the contiguous US. The gray color indicates no statistically significant change (α = 0.05).
Here we will compare IASI NH3 trends with the AMoN-observed NH3 trends in the CONUS over the last decade. We include AMoN trend analysis only for sites with full-year coverage during 2008–2018 (N=13). To achieve a higher spatial resolution, in the following study, we used the oversampled IASI NH3 maps to calculate the NH3 trend for each 2 km grid box. A long-term trend analysis was then performed using AMoN and IASI oversampled data (Sun et al., 2018; Wang et al., 2021) by Theil–Sen's slope estimator and the MK test to examine the agreement between the datasets and explore any regional differences. IASI NH3 columns smaller than the 5th percentile (0.5 × 10¹⁵ ) of the 11-year NH3 average in the CONUS region were excluded to avoid spurious trend results caused by the higher noise in these measurements. To perform the interannual trend analysis, we require each region or site to have at least one valid measurement in each season to alleviate the possible bias due to seasonal variations. Figure 6 shows the annual percentage change for both IASI and AMoN. Most regions in the CONUS have increasing NH3 concentrations based on the 11-year IASI observations (median: 6.8 % yr−1), including the eastern US, Midwest, and parts of the western US. A total of 10 out of 13 AMoN sites have statistically significant NH3 increases. AMoN data in general suggest similar increases (median: 6.7 % yr−1). When plotting the trends of AMoN sites against the median of IASI trends within a 25 km spatial window (Fig. 7), a moderate correlation (r = 0.66) was found between IASI and AMoN NH3 trends. IASI in general suggested a higher NH3 increase compared to AMoN (slope: 1.26 ± 0.51), with the ratio larger than 1 for most sites.
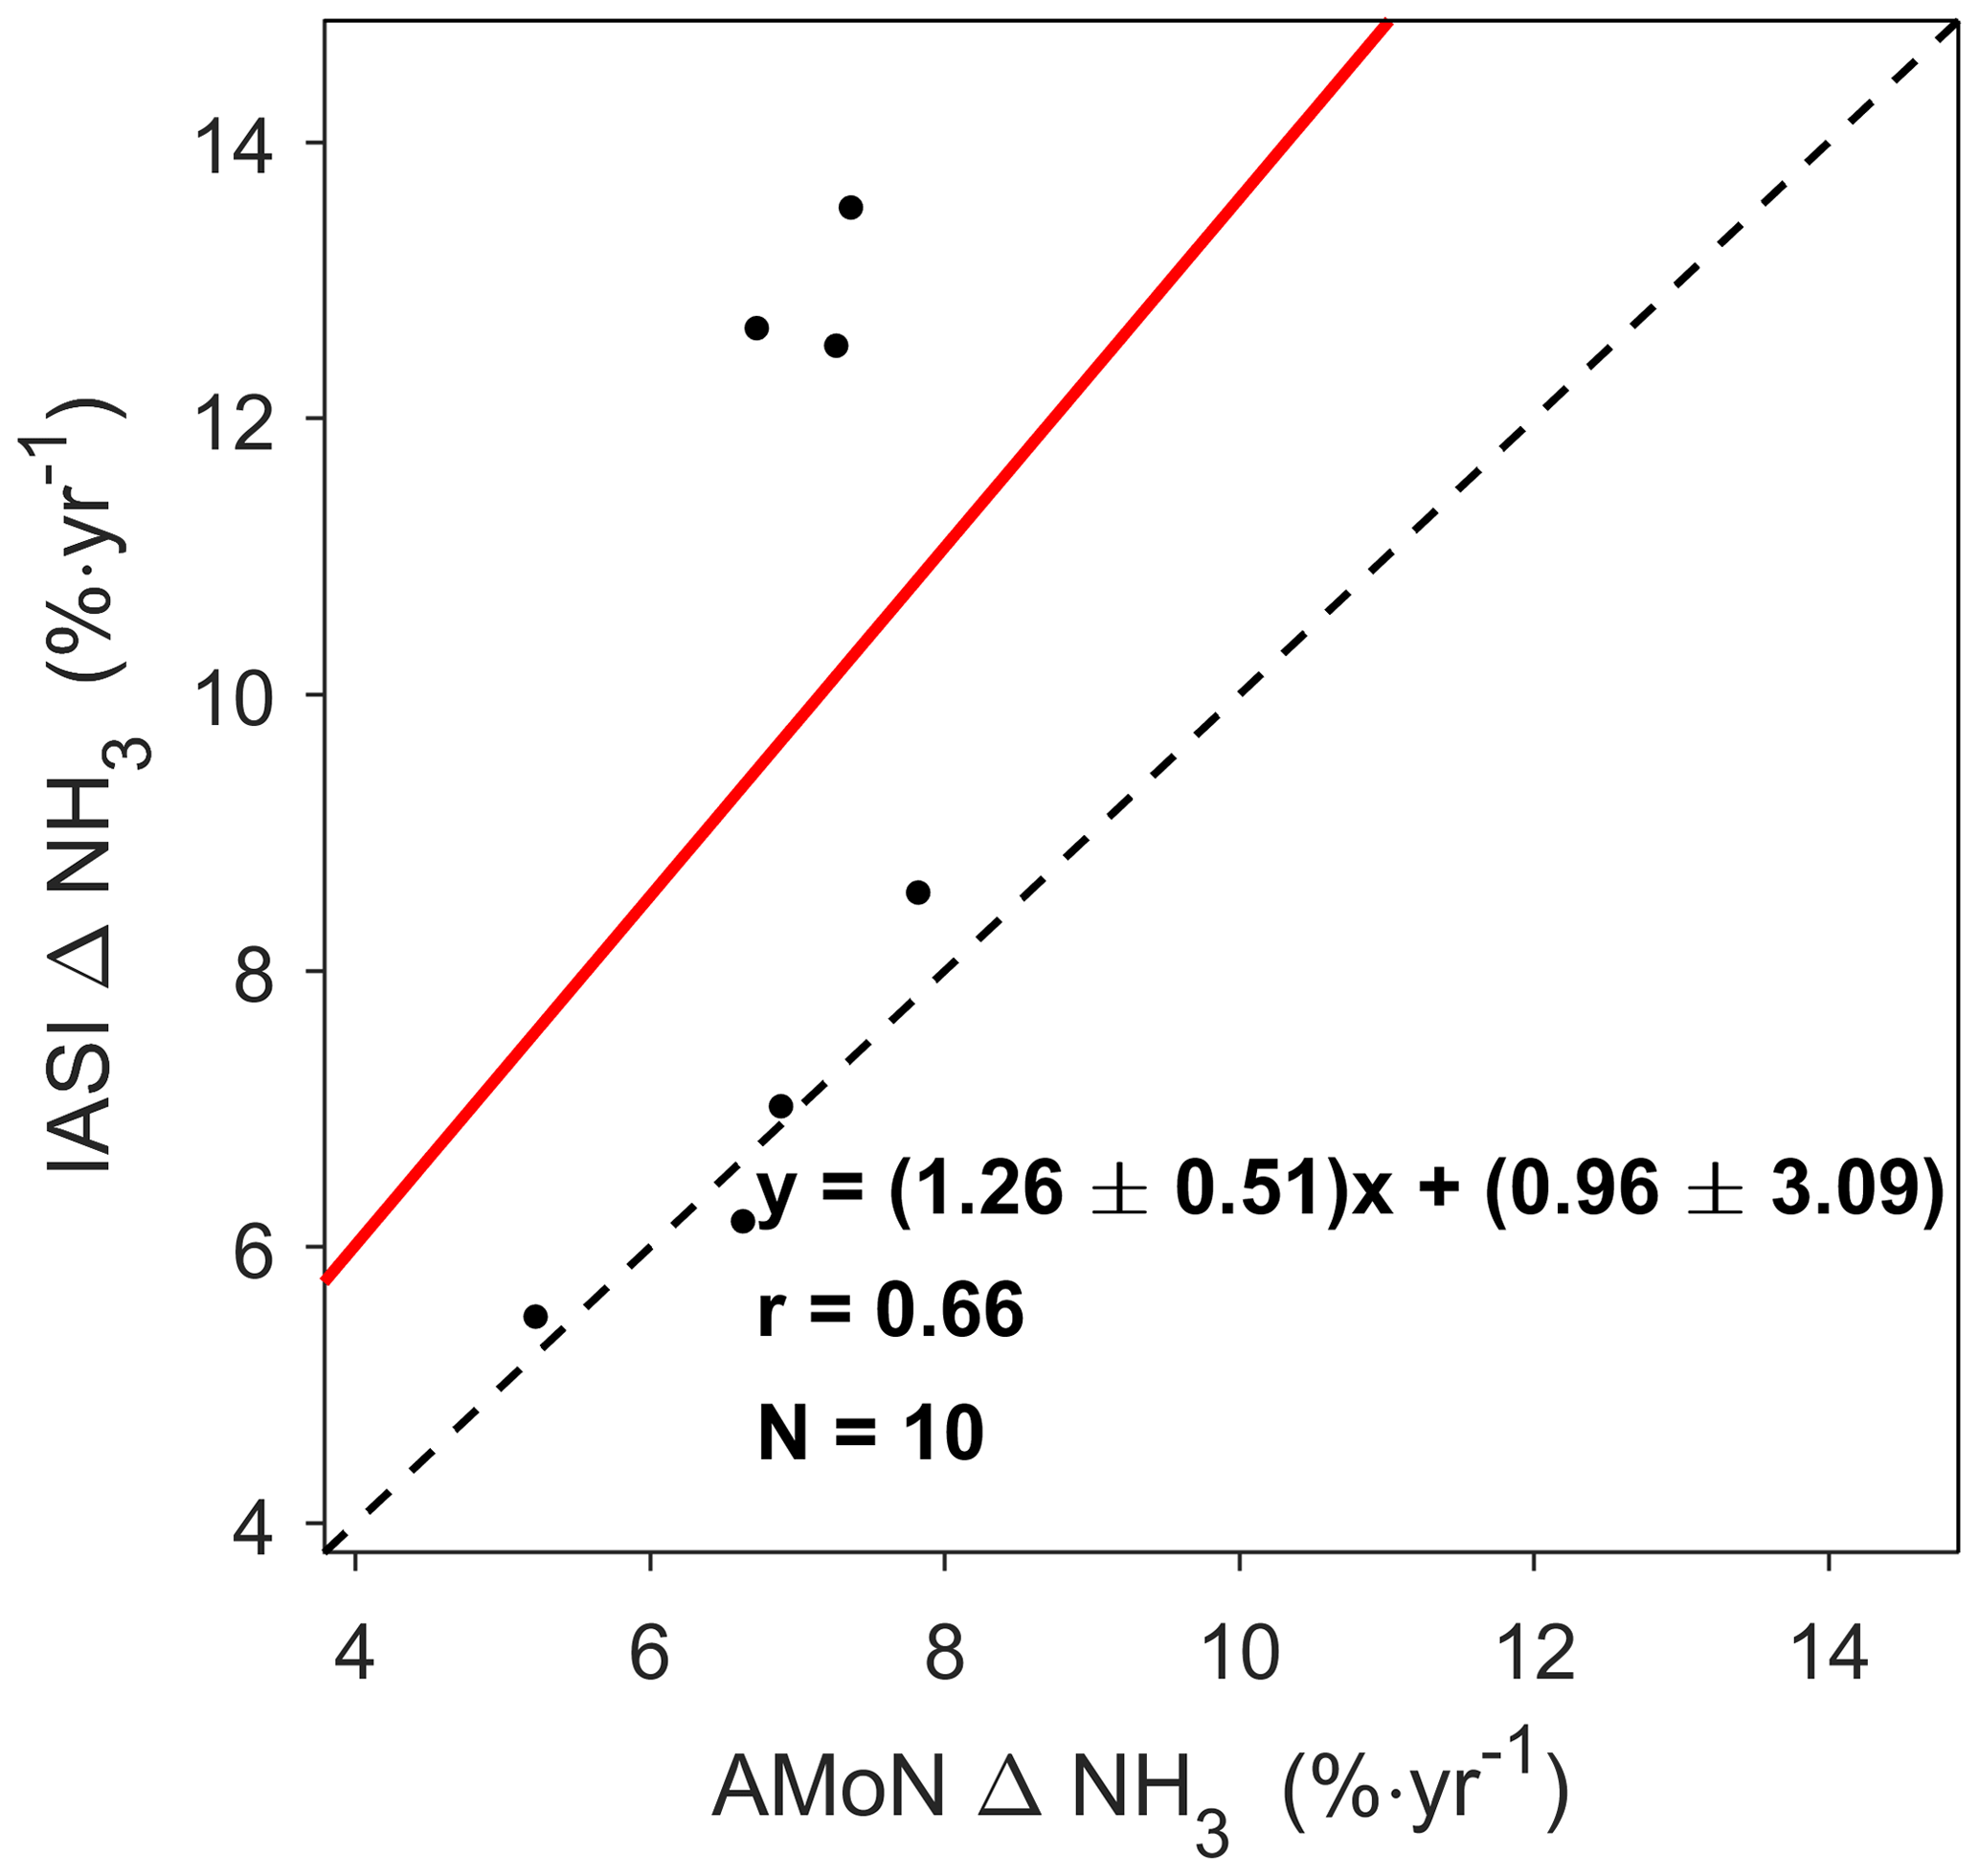
Figure 7Comparison between 2008–2018 AMoN and IASI NH3 trends (25 km spatial window) for AMoN sites with available nearby IASI trend data.
The spatial consistency across the datasets differs significantly. Both AMoN and IASI suggest ∼ 5 % yr−1 NH3 increases in the Great Lakes region, while IASI suggests a higher NH3 increase in the eastern US compared with AMoN. The IASI trend analysis results suggest a significant NH3 increase in the northern Great Plains, e.g., North Dakota, South Dakota, and Montana, yet there are no AMoN sites in this region. Furthermore, the trends are consistent with the NH3 emissions increases caused by increased N fertilizer usage in the northern Great Plains (P. Cao et al., 2020). McHale et al. (2021) showed that wet-precipitation concentrations based on NADP observations suggested the highest increases in the Great Plains, the Rocky Mountain region, and the Great Lakes region from 2000 to 2017, which is geographically consistent with the NH3 trends observed by both AMoN and IASI. Here we note that the spatial resolution could affect the results of trend analyses. The trend 6.8 % yr−1 was derived as the median of trends for each 2 km grid box. If considering the CONUS as a whole and calculating the annual mean NH3 for the whole CONUS during 2008–2018 to derive the overall trend in the CONUS, the IASI NH3 change for 2008–2018 is (3.9 ± 2.2) % yr−1 and (1.3 ± 0.8) × 1014 , similar to the trend in the previous study of (3.4 ± 0.6) % yr−1 and (1.1 ± 0.4) × 1014 (Van Damme et al., 2021).
We use the Hoshen–Kopelman algorithm to cluster adjacent grid points above the 95th percentile threshold of the 11-year CONUS oversampling map (6.7 × 10¹⁵ ) as a NH3 hotspot (Hoshen and Kopelman, 1976; Wang et al., 2021), and the median area of identified hotspots is ∼ 150 km2 (Wang et al., 2021). Analyzing NH3 hotspots, the median of the NH3 trend is 4.7 % yr−1, indicating that the regions of the largest emissions sources are also seeing increasing concentrations over time. Although the percent changes in the regions with the highest concentrations are smaller than the trend in the CONUS median (6.8 % yr−1), in terms of the absolute changes, the median trends of NH3 columns over these NH3 hotspots are higher than the trend in the CONUS median (3.7 × 10¹⁴ versus 2.8 × 10¹⁴ ). The top 10 NH3 hotspots in the CONUS regarding column–areal weighting (NH3 column times the area) all exhibit increasing NH3 concentrations from 2008 to 2018 (Table 5). Within these hotspots, the central Great Plains experience the largest NH3 increase (median: 5.0 % yr−1, 4.0 × 10¹⁴ ), while the San Joaquin Valley (median: 2.0 % yr−1, 1.6 × 10¹⁴ ) and Imperial County, California (median: 2.1 % yr−1, 1.9 × 10¹⁴ ), see the smallest changes.
Table 5The 2008–2018 IASI-observed NH3 trend in the top 10 NH3 hotspots (column–areal weighting) in the CONUS.
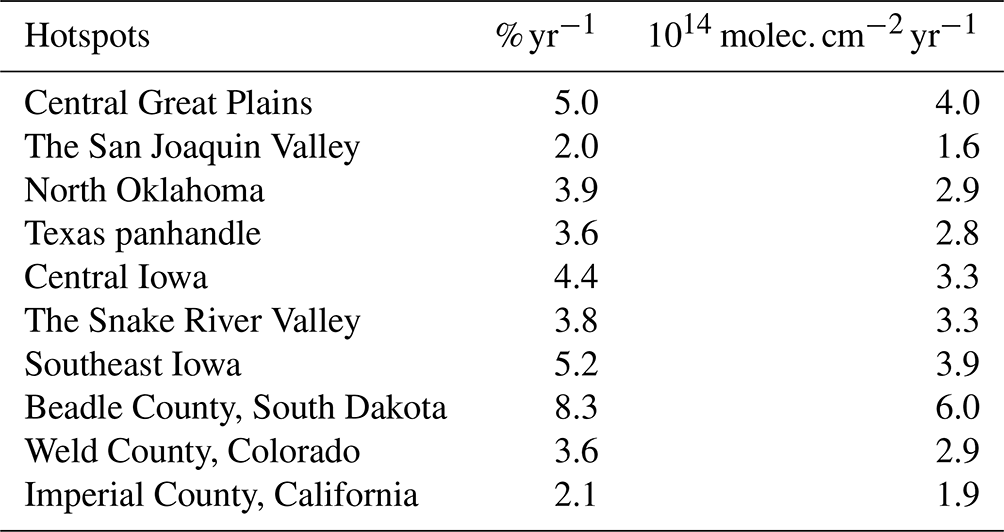
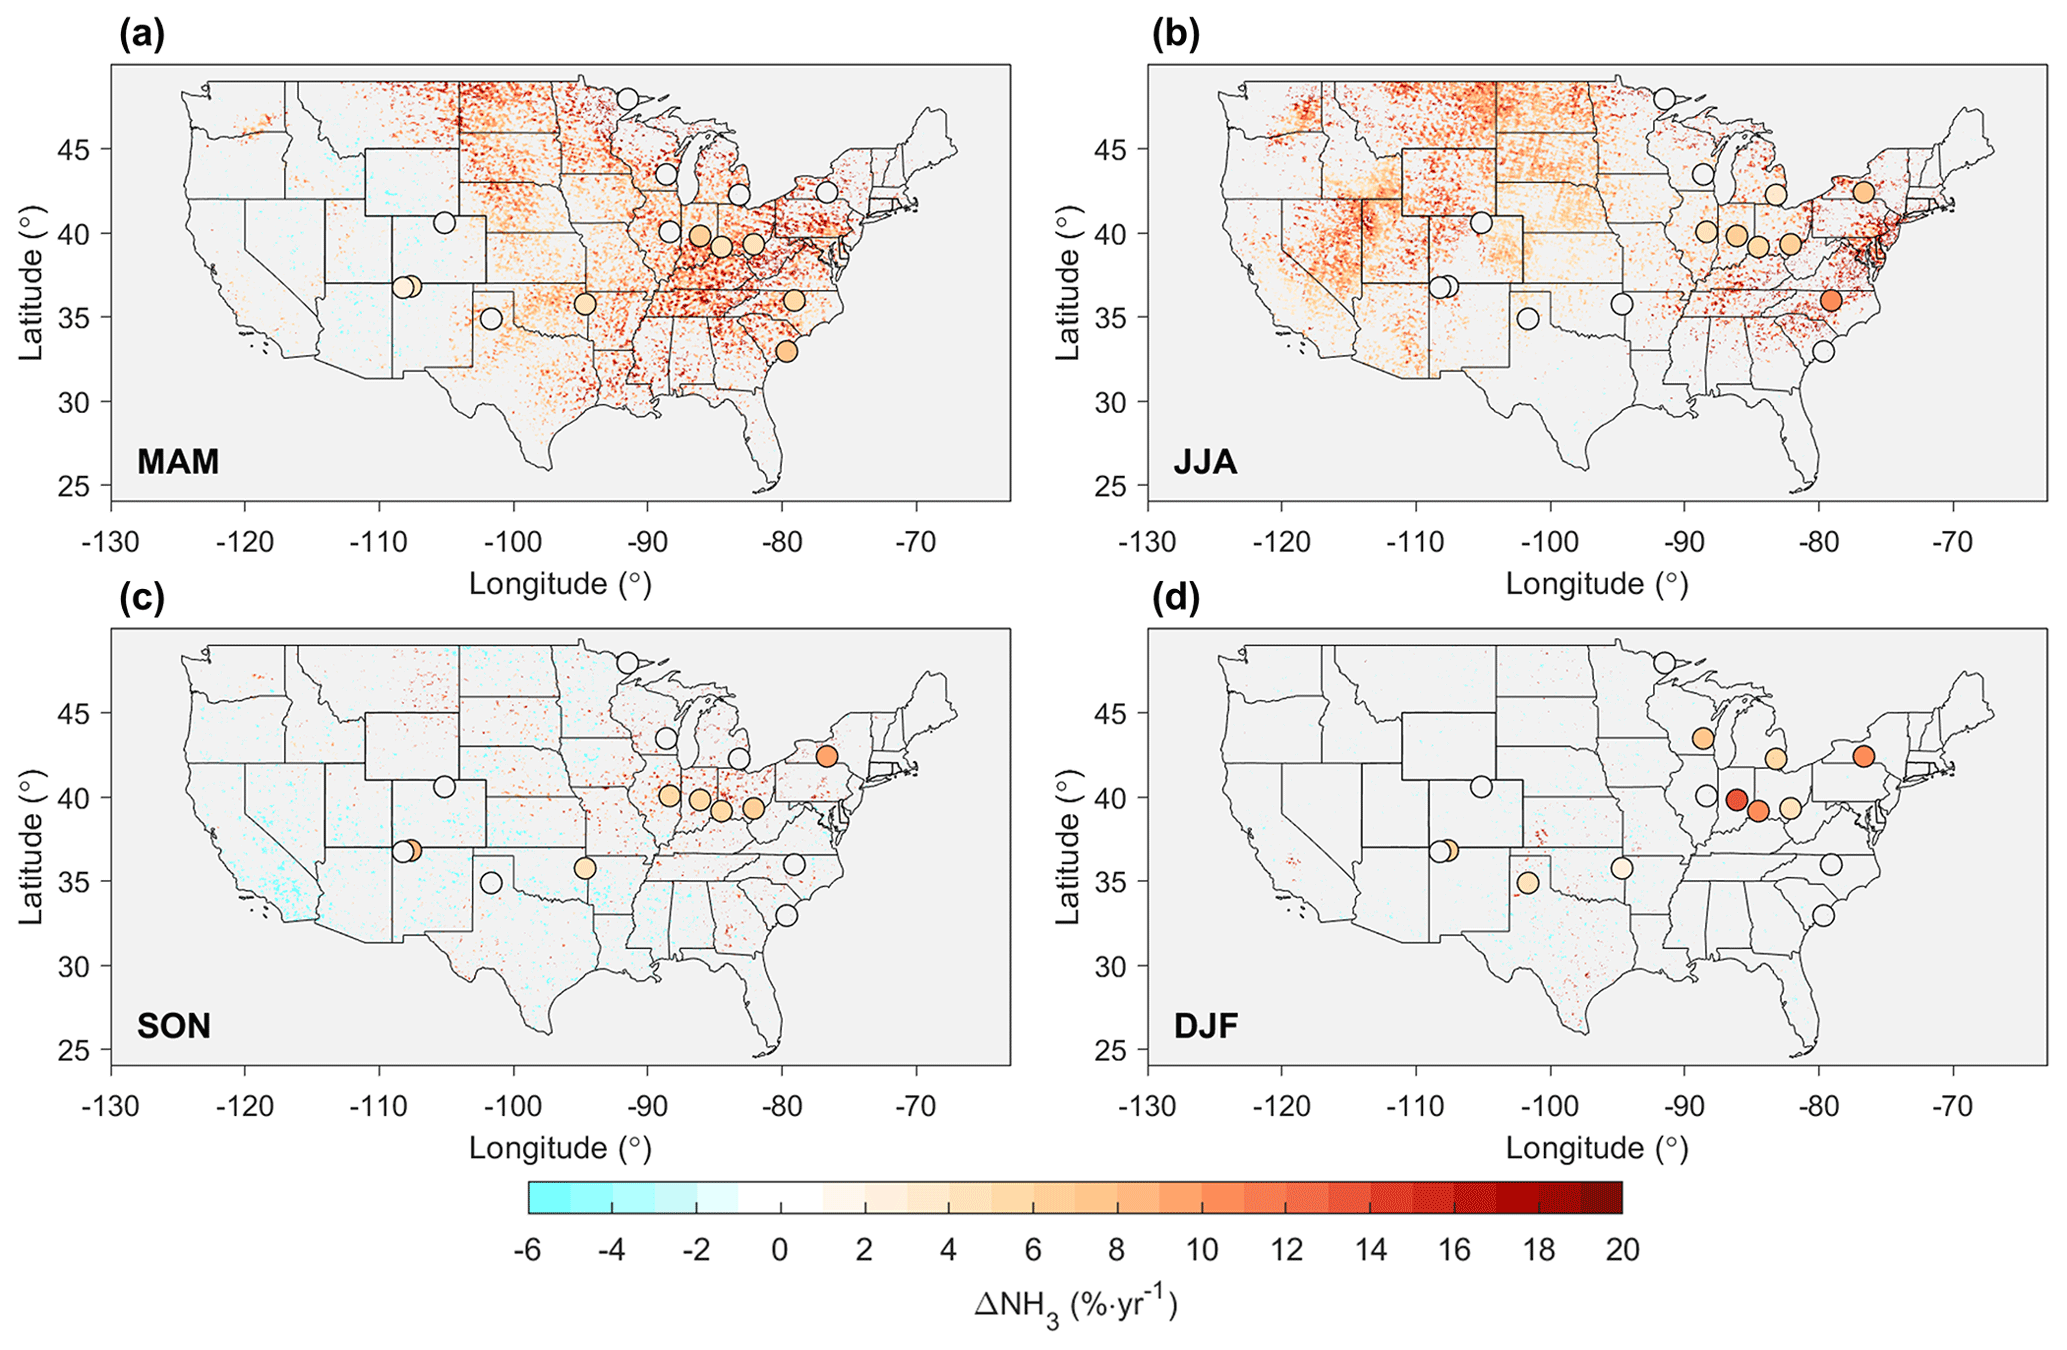
Figure 8The 2008–2018 NH3 trend for different seasons based on IASI NH3 measurements in the contiguous US. (a) Spring (March, April, May); (b) summer (June, July, August); (c) autumn (September, October, November); (d) winter (December, January, February). The gray color indicates no statistically significant change (α = 0.05).
To provide a detailed insight of the increasing NH3 over the CONUS, we further perform trend analyses for different seasons (Fig. 8). In spring, significant NH3 increases are found in the Midwest and in the eastern US. In summer, NH3 increases shift to the western US and the northeast US. AMoN and IASI seasonality clustering results show that the Midwest and eastern US, dominated by fertilizer NH3 emissions, have a broad spring maximum of NH3, while the western United States, dominated by volatilization of livestock waste NH3 emissions, in contrast, shows a narrower midsummer peak (Wang et al., 2021). The spatial patterns of spring and summer NH3 trends are in agreement with the seasonality clustering results, indicating that increasing NH3 emissions caused by agricultural activities may contribute to an NH3 concentration increase. The increasing wildfire activities in the western US may also contribute to NH3 increases (Lindaas et al., 2021a, b). In autumn and winter, most regions in the US do not have statistically significant IASI NH3 trends, and a decreasing NH3 trend is observed by IASI in the southwest US in autumn. In contrast, AMoN data suggest a notable NH3 increase in the northeast and the Corn Belt region in winter. Again, IASI data are susceptible to low thermal contrasts in winter, which to some extent explains the disagreement between IASI and AMoN in winter, as discussed in Sect. 3.3.
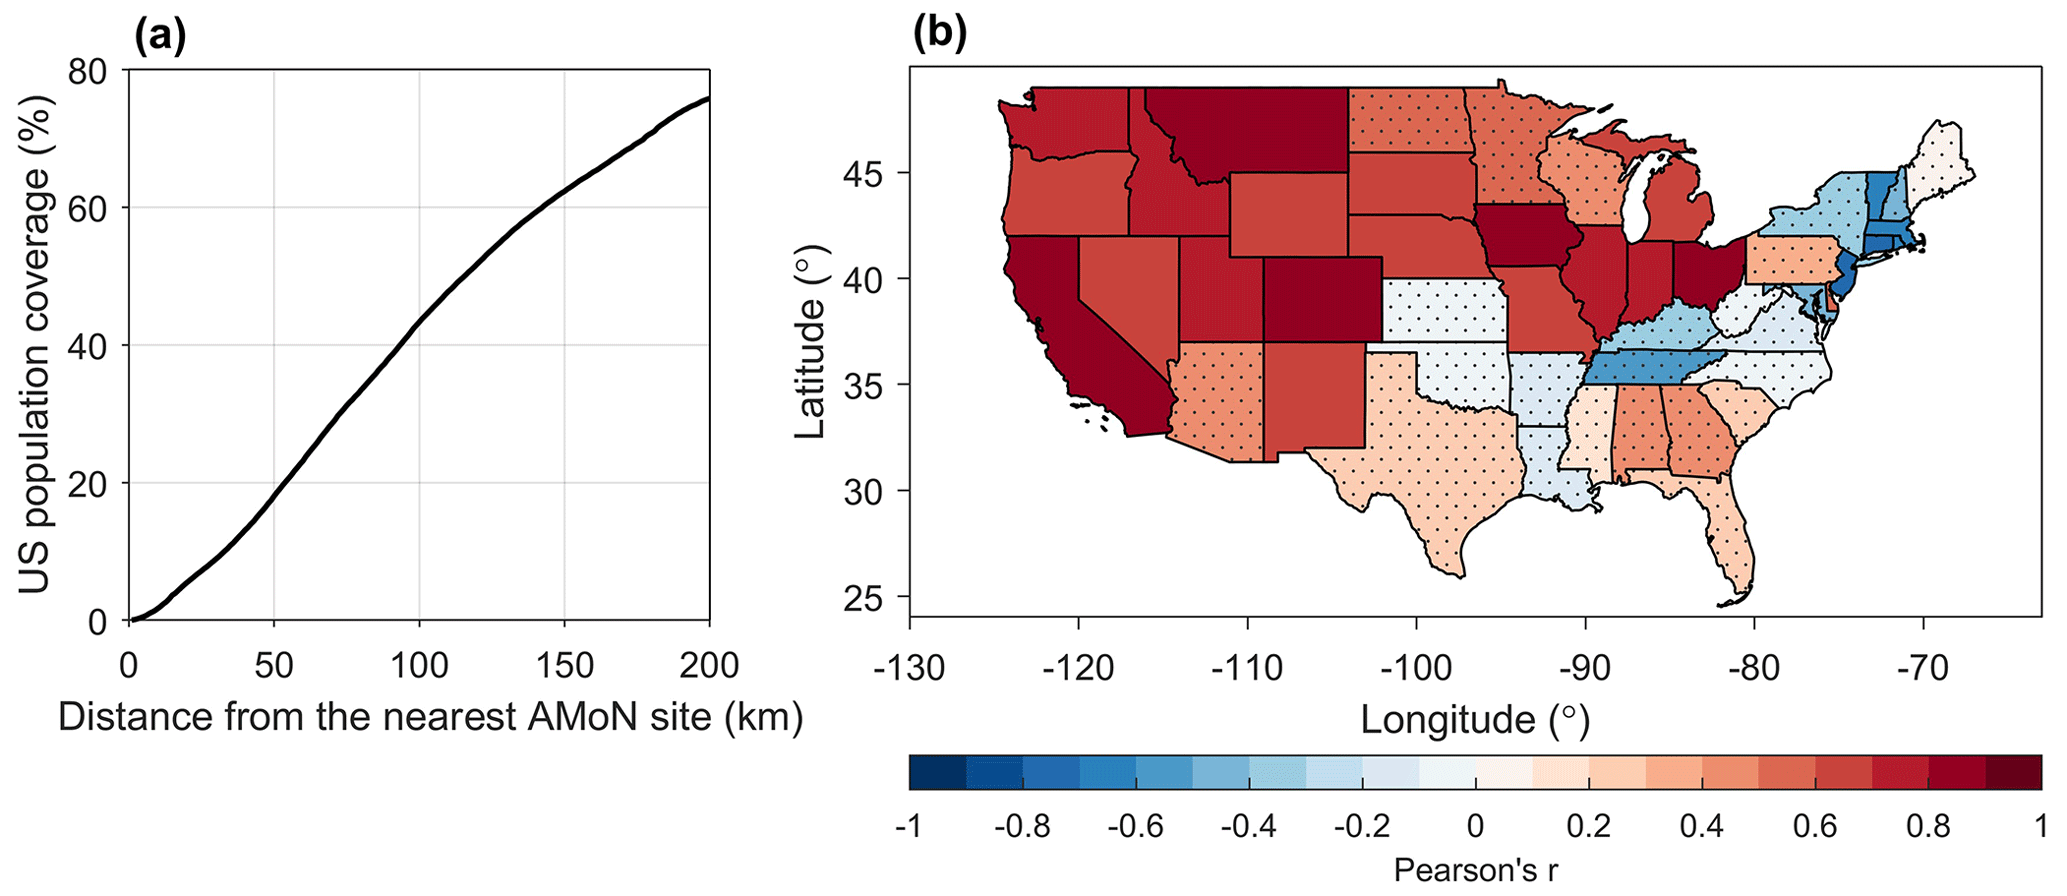
Figure 9(a) Cumulative distribution of the CONUS population as a function of distance from the nearest AMoN site; (b) correlation between EPA NH3 emissions and IASI-observed mean NH3 concentrations at state level during 2008–2018. The gray dots represent states without statistically significant correlations (α = 0.05).
Wintertime NH3 plays an important role in haze episodes through the formation of aerosol-phase NH4NO3 (Shah et al., 2018; Zhai et al., 2021), and increasing NH3 concentrations in winter may affect aerosol acidity and aerosol chemistry (Lawal et al., 2018; Zheng et al., 2020). In the past decades, NOx and SO2 emissions reductions have resulted in less NHx partitioning into particle-phase (Shah et al., 2018); however, the partitioning alone is not able to fully explain the significant NH3 concentration increases (Yao and Zhang, 2019; Yu et al., 2018). The change in meteorological conditions, such as increasing air temperatures, may also contribute to the increasing NH3 trends (Warner et al., 2017; Yao and Zhang, 2019). No matter the reason for increasing NH3 concentrations across the CONUS regions, the fact that both NH3 surface concentrations and NH3 column concentrations have been increasing during the past decade will have significant impacts on air quality and nitrogen deposition. EPA is reviewing the 2020 PM2.5 National Ambient Air Quality Standard (NAAQS) currently set at 12.0 µg m−3, and if the NAAQS is lowered, NH3 controls will become increasingly important for meeting the standard. Additionally, Pan et al. (2021) demonstrate that NH3 transported from Colorado significantly increased the dry NH3 deposition in the Rocky Mountain National Park. Increasing gas-phase NH3 may result in longer spatiotemporal scales for dry nitrogen deposition, leading to adverse impacts on remote regions and sensitive ecosystems (Phoenix et al., 2006). A reduction in NH3 emissions is critical to protect human health and the biodiversity in sensitive ecosystems (Ellis et al., 2013; Hill et al., 2019).
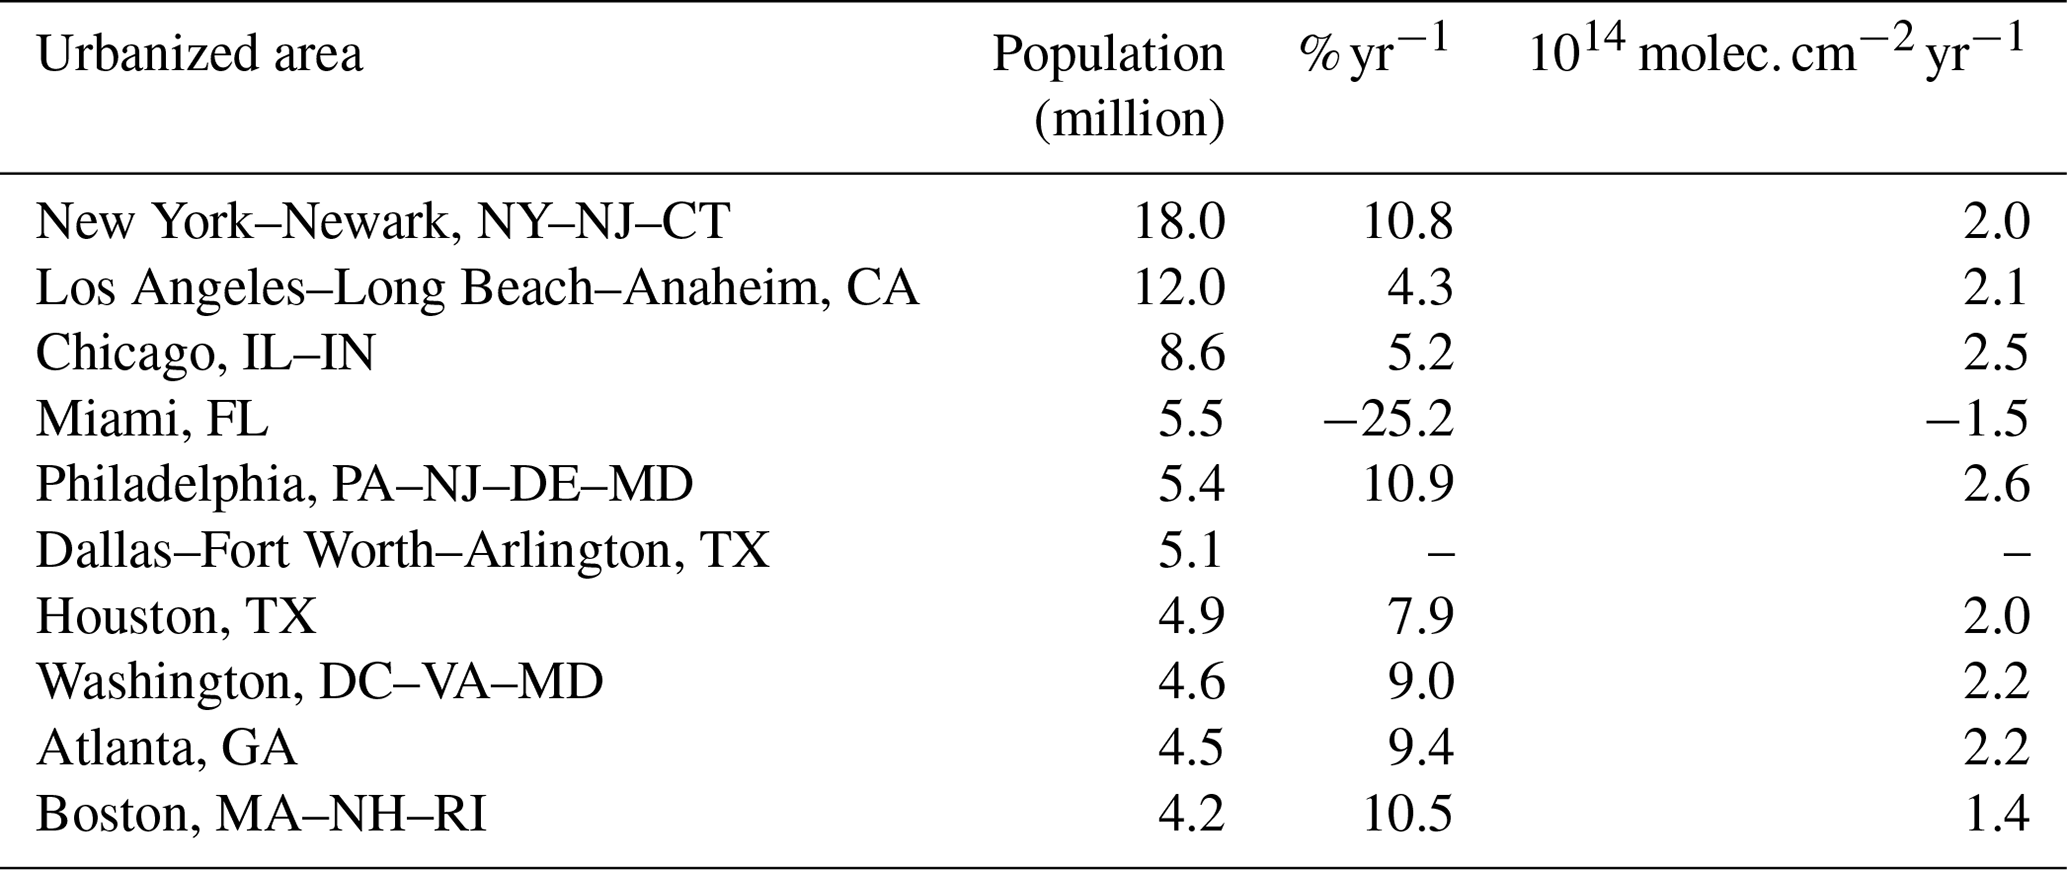
Table 6The 2008–2018 IASI NH3 trend in the top 10 most populous urbanized areas.
4.2 Trend in the urbanized areas
The short lifetime of NH3 leads to strong spatial variabilities in NH3 concentrations, and most AMoN sites are not located in highly populated urban regions (Wang et al., 2021), a gap that IASI data can fill. Figure 9a shows the cumulative distribution of the US population as a function of the distance from an AMoN site. Population data were retrieved from the Gridded Population of the World, Version 4 (GPWv4) (Center for International Earth Science Information Network – Columbia University, 2018). More than half of the CONUS population is at least 100 km away from an AMoN site. As mentioned in the previous discussion of spatial windows, AMoN may best represent the NH3 variations for regions within a ∼ 10 km radius, and less than 2 % of the CONUS population is within 10 km of an AMoN site. More urban AMoN sites are needed to represent the urban areas and better quantify NH3 emissions from mobile sources and trends in population centers. Satellite observations are the only dataset that can currently be used to investigate source contributions and trends in population centers (Cao et al., 2022).
We retrieved urban area data from the 2010 US Census, which includes two different types of urban areas: urbanized areas (UAs) of 50 000 or more people and urban clusters (UCs) of at least 2500 and less than 50 000 people (US Census Bureau, 2012). The urban areas have a similar NH3 trend compared with the CONUS (8.1 versus 6.8 % yr−1), suggesting a simultaneous NH3 increase in both urban and rural areas. The top 10 most populous urbanized areas almost all exhibit significant NH3 increases with the exception of Miami, Florida, which has a negative trend, and Dallas, Texas, without any significant trend (Table 6). These 10 areas in total account for more than 70 million people, making up more than one-fifth of the total population in the CONUS. The urban environment with abundant HNO3 and NH3 emissions from vehicles favors the formation of NH4NO3. Recent studies suggest that gas-phase NH3 hinders the scavenging of NH4NO3 by slowing down the deposition process of total inorganic nitrate (Zhai et al., 2021) and promotes new atmospheric particle formation by directly nucleating with HNO3 to form NH4NO3 in winter in urban areas (Wang et al., 2020). However, ultimately the sensitivity to PM2.5 from increases in NH3 in any urban area will be a complex function of trends of NOx and SO2 as well (Feng et al., 2020). The NH3 increase in these densely populated areas and its impact on aerosol chemistry need to be further addressed. For example, Fig. 9b shows the relationship between NH3 trends versus emissions trends (EPA, 2023b) on the state level. For agricultural areas with high NH3 (excess NH3 relative to NH4NO3 equilibrium), one would expect an increase in emissions to correlate very well with increasing NH3 columns. In contrast, in areas with more NOx, increases in emissions may result in NH3 going into NH4NO3 and thereby show little or even negative correlations. To this end, Fig. 9b shows that at state level, states with strong agricultural emissions show strong correlations between emissions and concentration trends, e.g., Iowa, while northeast states show weak or negative correlations, e.g., New Jersey. Ultimately, co-located aerosol-phase and gas-phase precursor measurements are needed to fully deduce what is happening at each urban area and should be a focus of future air quality network integration.
Under favorable conditions, IASI NH3 columns correlate with AMoN NH3 surface concentrations even at the 2-week scale and for low-concentration regions (r = 0.74 when temporal coverage ≥ 80 %). The temporal coverage of IASI data during the 2-week AMoN sampling period is the controlling factor of the correlation between IASI and AMoN measurements, presumably because of the large day-to-day variability in NH3. The agreement demonstrates the strong potential for using IASI NH3 columns to bridge the spatial gaps of the AMoN network. The global coverage of satellite measurements enables the IASI NH3 product to serve as an alternative dataset in countries and regions that do not have any NH3 monitoring networks, particularly in developing countries. For example, India is the second most populated country in the world with a sixth of the world's population, and a recent study has shown the unique role of NH3 in forming massive chloride aerosols (up to 40 µg m−3) in India (Gunthe et al., 2021). However, there are currently no long-term NH3 ground monitoring networks in India, impeding the efforts to estimate and control NH3 emissions (Beale et al., 2022). IASI's low sensitivity to wintertime NH3 shows the value of the more sensitive AMoN sites. Extra attention is needed when using IASI data in such circumstances.
The increasing NH3 in the CONUS (median: 6.8 % yr−1, 2.8 × 10¹⁴ ), including the hotspot regions (median: 4.7 % yr−1, 3.7 × 10¹⁴ ), highlights the more important role of NH3 in PM2.5 formation and nitrogen deposition in the future. AMoN suggests a similar NH3 increase (6.7 % yr−1), as well as similar spatial patterns with IASI. Both IASI and AMoN show the largest NH3 increases in the Midwest and eastern US, with a moderate correlation between the IASI and AMoN trends for the entire CONUS (r = 0.66). More co-located measurements of PM2.5 mass and NH3 concentrations would help in assessing the impact that increasing trends of NH3 will have on human health. The integrated satellite and ground-based measurements are already playing a role in our understanding of under-represented NH3 emissions sources in the inventories. NH3 already dominates the reactive nitrogen deposition in most regions in the US; because of the continuing efforts on NOx emission reductions, NH3 is expected to become the key species for nitrogen deposition (Li et al., 2016), which will have adverse impacts on the nearby ecosystem regions, e.g., the national parks (Benedict et al., 2013; Pan et al., 2021). The changing partitioning of NHx between NH3 and is likely to impact the lifetime of NHx due to differences between the removal velocity of gas-phase NH3 via dry deposition and particle-phase wet deposition. The trends vary in different seasons, with NH3 increases mainly in spring in the Midwest and eastern US (cropland dominated) and in summer in the western US (feedlot dominated), suggesting the impacts from agricultural activities and the necessity of developing regionally specific emission control strategies.
Because of the scarcity of ground monitoring sites in the urban areas, satellite NH3 measurements are extremely valuable for characterizing NH3 magnitude, seasonality, and trends in densely populated areas. Satellite observations suggests NH3 increases across the US urban areas (median: 8.1 %). New York–Newark, NY–NJ–CT, alone has a population of more than 18 million, experiencing a 10.8 % yr−1 NH3 increase. Measurements from satellites will help inform where ground-based NH3 samplers could be located to better understand local air quality in overburdened communities with limited resources for continuous monitors. In addition, NH3 sources in the urban areas and the related atmospheric chemistry are both poorly understood (Gu et al., 2022; Sun et al., 2017) and could be constrained by satellite NH3 observations (Cao et al., 2022). However, satellite observations alone are not able to answer all questions under the complex urban atmospheric conditions. For instance, gas-phase NH3 and HNO3 can nucleate directly to form NH4NO3 particles in cold atmospheric conditions and is likely to result in the rapid growth of new atmospheric particles in winter in urban areas (Wang et al., 2020). The comparison between NH3 emission trends and IASI-observed NH3 concentration trends suggests that strong correlations exist in states with large NH3 emissions from agricultural activities, e.g., Iowa, while there are weak or negative correlations in northeast states, e.g., New Jersey, indicating the different contribution from emissions and partitioning. To provide accurate and fine-spatial-scale NH3 observations in the urban areas, more routine ground monitoring sites are needed in both urban areas and high-NH3 emission source regions.
The AMoN data were downloaded from the National Atmospheric Deposition Program/National Trends Network (NADP/NTN): https://nadp.slh.wisc.edu/networks/ammonia-monitoring-network/ (NADP, 2023). The authors acknowledge the AERIS data infrastructure (https://iasi.aeris-data.fr/NH3/, AERIS Data and Services for the Atmosphere, 2022) for providing access to the IASI Level 2 NH3 data used in this study. Population data were retrieved from the Center for International Earth Science Information Network, Columbia University: https://sedac.ciesin.columbia.edu/data/collection/gpw-v4/ (Center for International Earth Science Information Network, Columbia University, 2018). The urban areas data are downloaded from the US Census Bureau: https://www.census.gov/geographies/mapping-files.html (US Census Bureau, 2012). The emission trend data are downloaded from the US Environmental Protection Agency's Air Pollutant Emissions Trends Data: https://www.epa.gov/air-emissions-inventories/air-pollutant-emissions-trends-data (EPA, 2023b).
MAZ and RW designed the research; RW led the analysis; KS, DP, and XG contributed to data analysis; LC, MVD, PFC, and CC helped with the usage of IASI data; MP helped with the usage of AMoN data; and RW wrote the paper with contributions from all co-authors.
The contact author has declared that none of the authors has any competing interests.
The research presented was not performed or funded by EPA and was not subject to EPA’s quality system requirements. The views expressed in this article are those of the author(s) and do not necessarily represent the views or the policies of the US Environmental Protection Agency.
Publisher's note: Copernicus Publications remains neutral with regard to jurisdictional claims in published maps and institutional affiliations.
Mark A. Zondlo and Rui Wang would like to gratefully acknowledge support from the NASA Health and Air quality Applied Sciences (HAQAST) team. Mark A. Zondlo acknowledges support as a visiting scientist at ULB from the EUMETSAT Satellite Application Facility on Atmospheric Chemistry Monitoring. Xuehui Guo gratefully acknowledges the support from the NASA Earth and Space Science Fellowship. Kang Sun wants to thank the NASA Atmospheric Composition Modeling and Analysis Program for their support. Cathy Clerbaux is grateful to CNES for scientific collaboration. The authors acknowledge the AERIS data infrastructure for providing access to the IASI data in this study.
This research has been supported by the NASA Health and Air Quality Applied Sciences (HAQAST) team (grant no. NNX16AQ90G); the NASA Earth and Space Science Fellowship (grant no. 80NSSC17K0377); the NASA Atmospheric Composition Modeling and Analysis Program (grant no. 80NSSC19K0988); the Belgian State Federal Office for Scientific, Technical and Cultural Affairs (Prodex HIRS); and the Fondation Air Liquide, France (TAPIR project). This work is also partly supported by the FED-tWIN project ARENBERG (“Assessing the Reactive Nitrogen Budget and Emissions at Regional and Global Scales”) funded via the Belgian Federal Science Policy Office (BELSPO); the Centre national d'études spatiales (CNES); and the Belgian State Federal Office for Scientific, Technical and Cultural Affairs.
This paper was edited by Leiming Zhang and reviewed by two anonymous referees.
Ahn, K. H. and Merwade, V.: Quantifying the relative impact of climate and human activities on streamflow, J. Hydrol., 515, 257–266, https://doi.org/10.1016/j.jhydrol.2014.04.062, 2014.
AERIS Data and Services for the Atmosphere: IASI NH3 version 3 reanalysis product, AERIS IASI [data set], https://iasi.aeris-data.fr/NH3/, last access: December 2022.
Beale, C. A., Paulot, F., Randles, C. A., Wang, R., Guo, X., Clarisse, L., Van Damme, M., Coheur, P.-F., Clerbaux, C., Shephard, M. W., Dammers, E., Cady-Pereira, K., and Zondlo, M.: Large sub-regional differences of ammonia seasonal patterns over India reveal inventory discrepancies, Environ. Res. Lett., 17, 104006, https://doi.org/10.1088/1748-9326/AC881F, 2022.
Benedict, K. B., Day, D., Schwandner, F. M., Kreidenweis, S. M., Schichtel, B., Malm, W. C., and Collett, J. L.: Observations of atmospheric reactive nitrogen species in Rocky Mountain National Park and across northern Colorado, Atmos. Environ., 64, 66–76, https://doi.org/10.1016/j.atmosenv.2012.08.066, 2013.
Bouwman, A. F., Lee, D. S., Asman, W. A. H., Dentener, F. J., van der Hoek, K. W., and Olivier, J. G. J.: A global high-resolution emission inventory for ammonia, Global Biogeochem. Cy., 11, 561–587, https://doi.org/10.1029/97GB02266, 1997.
Butler, T., Vermeylen, F., Lehmann, C. M., Likens, G. E., and Puchalski, M.: Increasing ammonia concentration trends in large regions of the USA derived from the NADP/AMoN network, Atmos. Environ., 146, 132–140, https://doi.org/10.1016/j.atmosenv.2016.06.033, 2016.
Cao, H., Henze, D. K., Shephard, M. W., Dammers, E., Cady-Pereira, K., Alvarado, M., Lonsdale, C., Luo, G., Yu, F., Zhu, L., Danielson, C. G., and Edgerton, E. S.: Inverse modeling of NH3 sources using CrIS remote sensing measurements, Environ. Res. Lett., 15, 104082, https://doi.org/10.1088/1748-9326/abb5cc, 2020.
Cao, H., Henze, D. K., Cady-Pereira, K., Mcdonald, B. C., Harkins, C., Sun, K., Bowman, K. W., Fu, T. M., and Nawaz, M. O.: COVID-19 Lockdowns Afford the First Satellite-Based Confirmation That Vehicles Are an Under-recognized Source of Urban NH3Pollution in Los Angeles, Environ. Sci. Technol. Lett., 9, 3–9, https://doi.org/10.1021/ACS.ESTLETT.1C00730, 2022.
Cao, P., Lu, C., Zhang, J., and Khadilkar, A.: Northwestward cropland expansion and growing urea-based fertilizer use enhanced NH3 emission loss in the contiguous United States, Atmos. Chem. Phys., 20, 11907–11922, https://doi.org/10.5194/acp-20-11907-2020, 2020.
Center for International Earth Science Information Network (CIESIN), Columbia University: Documentation for the Gridded Population of the World, Version 4 (GPWv4), Revision 11 Data Sets, NASA Socioeconomic Data and Applications Center (SEDAC), Palisades, NY, https://doi.org/10.7927/H45Q4T5F, 2018 (data available at: https://sedac.ciesin.columbia.edu/data/collection/gpw-v4/, last access: July 2022).
Chen, Y., Shen, H., Kaiser, J., Hu, Y., Capps, S. L., Zhao, S., Hakami, A., Shih, J.-S., Pavur, G. K., Turner, M. D., Henze, D. K., Resler, J., Nenes, A., Napelenok, S. L., Bash, J. O., Fahey, K. M., Carmichael, G. R., Chai, T., Clarisse, L., Coheur, P.-F., Van Damme, M., and Russell, A. G.: High-resolution hybrid inversion of IASI ammonia columns to constrain US ammonia emissions using the CMAQ adjoint model, Atmos. Chem. Phys., 21, 2067–2082, https://doi.org/10.5194/acp-21-2067-2021, 2021.
Clarisse, L., Clerbaux, C., Dentener, F., Hurtmans, D., and Coheur, P.-F.: Global ammonia distribution derived from infrared satellite observations, Nat. Geosci., 2, 479–483, https://doi.org/10.1038/ngeo551, 2009.
Clarisse, L., Shephard, M. W., Dentener, F., Hurtmans, D., Cady-Pereira, K., Karagulian, F., van Damme, M., Clerbaux, C., and Coheur, P. F.: Satellite monitoring of ammonia: A case study of the San Joaquin Valley, J. Geophys. Res.-Atmos., 115, 1–15, https://doi.org/10.1029/2009JD013291, 2010.
Dammers, E., Palm, M., Van Damme, M., Vigouroux, C., Smale, D., Conway, S., Toon, G. C., Jones, N., Nussbaumer, E., Warneke, T., Petri, C., Clarisse, L., Clerbaux, C., Hermans, C., Lutsch, E., Strong, K., Hannigan, J. W., Nakajima, H., Morino, I., Herrera, B., Stremme, W., Grutter, M., Schaap, M., Wichink Kruit, R. J., Notholt, J., Coheur, P.-F., and Erisman, J. W.: An evaluation of IASI−NH3 with ground-based Fourier transform infrared spectroscopy measurements, Atmos. Chem. Phys., 16, 10351–10368, https://doi.org/10.5194/acp-16-10351-2016, 2016.
Dammers, E., Shephard, M. W., Palm, M., Cady-Pereira, K., Capps, S., Lutsch, E., Strong, K., Hannigan, J. W., Ortega, I., Toon, G. C., Stremme, W., Grutter, M., Jones, N., Smale, D., Siemons, J., Hrpcek, K., Tremblay, D., Schaap, M., Notholt, J., and Erisman, J. W.: Validation of the CrIS fast physical NH3 retrieval with ground-based FTIR, Atmos. Meas. Tech., 10, 2645–2667, https://doi.org/10.5194/amt-10-2645-2017, 2017.
Dentener, F. J. and Crutzen, P. J.: A three-dimensional model of the global ammonia cycle, J. Atmos. Chem., 19, 331–369, https://doi.org/10.1007/BF00694492, 1994.
EPA: Air Quality Implementation Plans, United States Environmental Protection Agency, https://www.epa.gov/air-quality-implementation-plans (last access: January 2023), 2023a.
EPA: Air Pollutant Emissions Trends Data, United States Environmental Protection Agency, EPA [data set], https://www.epa.gov/air-emissions-inventories/air-pollutant-emissions-trends-data (last access: August 2023), 2023b.
Ellis, R. A., Jacob, D. J., Sulprizio, M. P., Zhang, L., Holmes, C. D., Schichtel, B. A., Blett, T., Porter, E., Pardo, L. H., and Lynch, J. A.: Present and future nitrogen deposition to national parks in the United States: critical load exceedances, Atmos. Chem. Phys., 13, 9083–9095, https://doi.org/10.5194/acp-13-9083-2013, 2013.
Erisman, J. W., Sutton, M. A., Galloway, J., Klimont, Z., and Winiwarter, W.: How a century of ammonia synthesis changed the world, Nat. Geosci., 1, 636–639, https://doi.org/10.1038/ngeo325, 2008.
Fehsenfeld, F. C., Huey, L. G., Leibrock, E., Dissly, R., Williams, E., Ryerson, T. B., Norton, R., Sueper, D. T., and Hartsell, B.: Results from an informal intercomparison of ammonia measurement techniques, J. Geophys. Res.-Atmos., 107, 4812, https://doi.org/10.1029/2001JD001327, 2002.
Feng, J., Chan, E., and Vet, R.: Air quality in the eastern United States and Eastern Canada for 1990–2015: 25 years of change in response to emission reductions of SO2 and NOx in the region, Atmos. Chem. Phys., 20, 3107–3134, https://doi.org/10.5194/acp-20-3107-2020, 2020.
Fountoukis, C. and Nenes, A.: ISORROPIA II: a computationally efficient thermodynamic equilibrium model for K+–Ca2+–Mg2+–NH4+–Na+–––Cl−–H2O aerosols, Atmos. Chem. Phys., 7, 4639–4659, https://doi.org/10.5194/acp-7-4639-2007, 2007.
Goldberg, D. L., Anenberg, S. C., Lu, Z., Streets, D. G., Lamsal, L. N., E McDuffie, E., and Smith, S. J.: Urban NOx emissions around the world declined faster than anticipated between 2005 and 2019, Environ. Res. Lett., 16, 115004, https://doi.org/10.1088/1748-9326/AC2C34, 2021.
Golston, L. M., Pan, D., Sun, K., Tao, L., Zondlo, M. A., Eilerman, S. J., Peischl, J., Neuman, J. A., and Floerchinger, C.: Variability of Ammonia and Methane Emissions from Animal Feeding Operations in Northeastern Colorado, Environ. Sci. Technol., 54, 11015–11024, https://doi.org/10.1021/acs.est.0c00301, 2020.
Gu, M., Pan, Y., Sun, Q., Walters, W. W., Song, L., and Fang, Y.: Is fertilization the dominant source of ammonia in the urban atmosphere, Sci. Total Environ., 838, 155890, https://doi.org/10.1016/J.SCITOTENV.2022.155890, 2022.
Gunthe, S. S., Liu, P., Panda, U., Raj, S. S., Sharma, A., Darbyshire, E., Reyes-Villegas, E., Allan, J., Chen, Y., Wang, X., Song, S., Pöhlker, M. L., Shi, L., Wang, Y., Kommula, S. M., Liu, T., Ravikrishna, R., McFiggans, G., Mickley, L. J., Martin, S. T., Pöschl, U., Andreae, M. O., and Coe, H.: Enhanced aerosol particle growth sustained by high continental chlorine emission in India, Nat. Geosci., 14, 77–84, https://doi.org/10.1038/s41561-020-00677-x, 2021.
Guo, X., Wang, R., Pan, D., Zondlo, M. A., Clarisse, L., van Damme, M., Whitburn, S., Coheur, P. F., Clerbaux, C., Franco, B., Golston, L. M., Wendt, L., Sun, K., Tao, L., Miller, D., Mikoviny, T., Müller, M., Wisthaler, A., Tevlin, A. G., Murphy, J. G., Nowak, J. B., Roscioli, J. R., Volkamer, R., Kille, N., Neuman, J. A., Eilerman, S. J., Crawford, J. H., Yacovitch, T. I., Barrick, J. D., and Scarino, A. J.: Validation of IASI Satellite Ammonia Observations at the Pixel Scale Using In Situ Vertical Profiles, J. Geophys. Res.-Atmos., 126, e2020JD033475, https://doi.org/10.1029/2020JD033475, 2021.
Hauglustaine, D. A., Balkanski, Y., and Schulz, M.: A global model simulation of present and future nitrate aerosols and their direct radiative forcing of climate, Atmos. Chem. Phys., 14, 11031–11063, https://doi.org/10.5194/acp-14-11031-2014, 2014.
Hennigan, C. J., Izumi, J., Sullivan, A. P., Weber, R. J., and Nenes, A.: A critical evaluation of proxy methods used to estimate the acidity of atmospheric particles, Atmos. Chem. Phys., 15, 2775–2790, https://doi.org/10.5194/acp-15-2775-2015, 2015.
Hill, J., Goodkind, A., Tessum, C., Thakrar, S., Tilman, D., Polasky, S., Smith, T., Hunt, N., Mullins, K., Clark, M., and Marshall, J.: Air-quality-related health damages of maize, Nat. Sustain., 2, 397–403, https://doi.org/10.1038/s41893-019-0261-y, 2019.
Holt, J., Selin, N. E., and Solomon, S.: Changes in inorganic fine particulate matter sensitivities to precursors due to large-scale us emissions reductions, Environ Sci Technol, 49, 4834–4841, https://doi.org/10.1021/acs.est.5b00008, 2015.
Hoshen, J. and Kopelman, R.: Percolation and cluster distribution. I. Cluster multiple labeling technique and critical concentration algorithm, Phys. Rev. B, 14, 3438, https://doi.org/10.1103/PhysRevB.14.3438, 1976.
Kendall, M.: Rank correlation methods, 4th Edn., Charles Griffin, San Francisco, CA, ISBN 978-0852641996, 1975.
Kharol, S. K., Shephard, M. W., McLinden, C. A., Zhang, L., Sioris, C. E., O'Brien, J. M., Vet, R., Cady-Pereira, K. E., Hare, E., Siemons, J., and Krotkov, N. A.: Dry Deposition of Reactive Nitrogen From Satellite Observations of Ammonia and Nitrogen Dioxide Over North America, Geophys. Res. Lett., 45, 1157–1166, https://doi.org/10.1002/2017GL075832, 2018.
Lawal, A. S., Guan, X., Liu, C., Henneman, L. R. F., Vasilakos, P., Bhogineni, V., Weber, R. J., Nenes, A., and Russell, A. G.: Linked Response of Aerosol Acidity and Ammonia to SO2 and NOx Emissions Reductions in the United States, Environ. Sci. Technol., 52, 9861–9873, https://doi.org/10.1021/acs.est.8b00711, 2018.
Li, Y., Schichtel, B. A., Walker, J. T., Schwede, D. B., Chen, X., Lehmann, C. M. B., Puchalski, M. A., Gay, D. A., and Collett, J. L.: Increasing importance of deposition of reduced nitrogen in the United States, P. Natl. Acad. Sci. USA, 113, 5874–5879, https://doi.org/10.1073/pnas.1525736113, 2016.
Lindaas, J., Pollack, I. B., Garofalo, L. A., Pothier, M. A., Farmer, D. K., Kreidenweis, S. M., Campos, T. L., Flocke, F., Weinheimer, A. J., Montzka, D. D., Tyndall, G. S., Palm, B. B., Peng, Q., Thornton, J. A., Permar, W., Wielgasz, C., Hu, L., Ottmar, R. D., Restaino, J. C., Hudak, A. T., Ku, I. T., Zhou, Y., Sive, B. C., Sullivan, A., Collett, J. L., and Fischer, E. v.: Emissions of Reactive Nitrogen From Western U. S. Wildfires During Summer 2018, J. Geophys. Res.-Atmos., 126, e2020JD032657, https://doi.org/10.1029/2020JD032657, 2021a.
Lindaas, J., Pollack, I. B., Calahorrano, J. J., O'Dell, K., Garofalo, L. A., Pothier, M. A., Farmer, D. K., Kreidenweis, S. M., Campos, T., Flocke, F., Weinheimer, A. J., Montzka, D. D., Tyndall, G. S., Apel, E. C., Hills, A. J., Hornbrook, R. S., Palm, B. B., Peng, Q., Thornton, J. A., Permar, W., Wielgasz, C., Hu, L., Pierce, J. R., Collett, J. L., Sullivan, A. P., and Fischer, E. v.: Empirical Insights Into the Fate of Ammonia in Western U. S. Wildfire Smoke Plumes, J. Geophys. Res.-Atmos., 126, e2020JD033730, https://doi.org/10.1029/2020JD033730, 2021b.
Malm, W. C., Schichtel, B. A., Pitchford, M. L., Ashbaugh, L. L., and Eldred, R. A.: Spatial and monthly trends in speciated fine particle concentration in the United States, J. Geophys. Res.-Atmos., 109, D03306, https://doi.org/10.1029/2003JD003739, 2004.
Miller, D. J., Sun, K., Tao, L., Pan, D., Zondlo, M. A., Nowak, J. B., Liu, Z., Diskin, G., Sachse, G., Beyersdorf, A., Ferrare, R., and Scarino, A. J.: Ammonia and methane dairy emission plumes in the San Joaquin valley of California from individual feedlot to regional scales, J. Geophys. Res.-Atmos., 120, 9718–9738, https://doi.org/10.1002/2015JD023241, 2015.
McHale, M. R., Ludtke, A. S., Wetherbee, G. A., Burns, D. A., Nilles, M. A., and Finkelstein, J. S.: Trends in precipitation chemistry across the U. S. 1985–2017: Quantifying the benefits from 30 years of Clean Air Act amendment regulation, Atmos. Environ., 247, 118219, https://doi.org/10.1016/J.ATMOSENV.2021.118219, 2021.
NADP: The Ammonia Monitoring Network, National Atmospheric Deposition Program, NADP [data set], https://nadp.slh.wisc.edu/networks/ammonia-monitoring-network/, last access: January 2023.
Nair, A. A. and Yu, F.: Quantification of atmospheric ammonia concentrations: A review of its measurement and modeling, 11, 1092, https://doi.org/10.3390/atmos11101092, 2020.
Nair, A. A., Yu, F., and Luo, G.: Spatioseasonal Variations of Atmospheric Ammonia Concentrations Over the United States: Comprehensive Model-Observation Comparison, J. Geophys. Res.-Atmos., 124, 6571–6582, https://doi.org/10.1029/2018JD030057, 2019.
Pan, D., Mauzerall, D. L., Benedict, K. B., Wang, R., Golston, L., Collett, J. L., Jr., Tao, L., Sun, K., Guo, X., Schichtel, B. A., Ham, J. M., Prenni, A. J., Puchalski, M., Mikoviny, T., Müller, M., Wisthaler, A., and Zondlo, M. A.: A Paradigm Shift in Sulfate-Nitrate-Ammonium Aerosol Formation in the United States and its Implications for Reactive Nitrogen Deposition, American Geophysical Union Fall Meeting 2020, Online, 1–17 December 2020, A074-06, https://agu.confex.com/agu/fm20/meetingapp.cgi/Paper/679051, last access: December 2020.
Pan, D., Benedict, K. B., Golston, L. M., Wang, R., Collett, J. L., Tao, L., Sun, K., Guo, X., Ham, J., Prenni, A. J., Schichtel, B. A., Mikoviny, T., Müller, M., Wisthaler, A., and Zondlo, M. A.: Ammonia Dry Deposition in an Alpine Ecosystem Traced to Agricultural Emission Hotpots, Environ. Sci. Technol., 55, 7785, https://doi.org/10.1021/acs.est.0c05749, 2021.
Paulot, F., Jacob, D. J., Pinder, R. W., Bash, J. O., Travis, K., and Henze, D. K.: Ammonia emissions in the United States, european union, and China derived by high-resolution inversion of ammonium wet deposition data: Interpretation with a new agricultural emissions inventory (MASAGE_NH3), J. Geophys. Res.-Atmos., 119, 4343–4364, https://doi.org/10.1002/2013JD021130, 2014.
Phoenix, G. K., Hicks, W. K., Cinderby, S., Kuylenstierna, J. C. I., Stock, W. D., Dentener, F. J., Giller, K. E., Austin, A. T., Lefroy, R. D. B., Gimeno, B. S., Ashmore, M. R., and Ineson, P.: Atmospheric nitrogen deposition in world biodiversity hotspots: The need for a greater global perspective in assessing N deposition impacts, Glob. Change. Biol., 12, 470–476, https://doi.org/10.1111/j.1365-2486.2006.01104.x, 2006.
Pinder, R. W., Gilliland, A. B., and Dennis, R. L.: Environmental impact of atmospheric NH3 emissions under present and future conditions in the eastern United States, Geophys. Res. Lett., 35, 1–6, https://doi.org/10.1029/2008GL033732, 2008.
Puchalski, M. A., Sather, M. E., Walker, J. T., Lehmann, C. M. B., Gay, D. A., Mathew, J., and Robarge, W. P.: Passive ammonia monitoring in the United States: Comparing three different sampling devices, J. Environ. Monitor., 13, 3156–3167, https://doi.org/10.1039/C1EM10553A, 2011.
Puchalski, M. A., Rogers, C. M., Baumgardner, R., Mishoe, K. P., Price, G., Smith, M. J., Watkins, N., and Lehmann, C. M.: A statistical comparison of active and passive ammonia measurements collected at Clean Air Status and Trends Network (CASTNET) sites, Environ. Sci. Proc. Imp., 40, 358–369, https://doi.org/10.1039/c4em00531g, 2015.
Schiferl, L. D., Heald, C. L., Van Damme, M., Clarisse, L., Clerbaux, C., Coheur, P.-F., Nowak, J. B., Neuman, J. A., Herndon, S. C., Roscioli, J. R., and Eilerman, S. J.: Interannual variability of ammonia concentrations over the United States: sources and implications, Atmos. Chem. Phys., 16, 12305–12328, https://doi.org/10.5194/acp-16-12305-2016, 2016.
Seinfeld, J. H. and Pandis, S. N.: Atmospheric chemistry and physics: from air pollution to climate change, John Wiley & Sons, ISBN 978-1118947401, 2016.
Shah, V., Jaeglé, L., Thornton, J. A., Lopez-Hilfiker, F. D., Lee, B. H., Schroder, J. C., Campuzano-Jost, P., Jimenez, J. L., Guo, H., Sullivan, A. P., Weber, R. J., Green, J. R., Fiddler, M. N., Bililign, S., Campos, T. L., Stell, M., Weinheimer, A. J., Montzka, D. D., and Brown, S. S.: Chemical feedbacks weaken the wintertime response of particulate sulfate and nitrate to emissions reductions over the eastern United States, P. Natl. Acad. Sci. USA, 115, 8110–8115, https://doi.org/10.1073/pnas.1803295115, 2018.
Shephard, M. W. and Cady-Pereira, K. E.: Cross-track Infrared Sounder (CrIS) satellite observations of tropospheric ammonia, Atmos. Meas. Tech., 8, 1323–1336, https://doi.org/10.5194/amt-8-1323-2015, 2015.
Shephard, M. W., Cady-Pereira, K. E., Luo, M., Henze, D. K., Pinder, R. W., Walker, J. T., Rinsland, C. P., Bash, J. O., Zhu, L., Payne, V. H., and Clarisse, L.: TES ammonia retrieval strategy and global observations of the spatial and seasonal variability of ammonia, Atmos. Chem. Phys., 11, 10743–10763, https://doi.org/10.5194/acp-11-10743-2011, 2011.
Someya, Y., Imasu, R., Shiomi, K., and Saitoh, N.: Atmospheric ammonia retrieval from the TANSO-FTS/GOSAT thermal infrared sounder, Atmos. Meas. Tech., 13, 309–321, https://doi.org/10.5194/amt-13-309-2020, 2020.
Sun, K., Cady-Pereira, K., Miller, D. J., Tao, L., Zondlo, M. A., Nowak, J. B., Neuman, J. A., Mikoviny, T., Müller, M., Wisthaler, A., Scarino, A. J., and Hostetler, C. A.: Validation of TES ammonia observations at the single pixel scale in the san joaquin valley during DISCOVER-AQ, J. Geophys. Res.-Atmos., 120, 5140–5154, https://doi.org/10.1002/2014JD022846, 2015.
Sun, K., Tao, L., Miller, D. J., Pan, D., Golston, L. M., Zondlo, M. A., Griffin, R. J., Wallace, H. W., Leong, Y. J., Yang, M. M., Zhang, Y., Mauzerall, D. L., and Zhu, T.: Vehicle Emissions as an Important Urban Ammonia Source in the United States and China, Environ. Sci. Technol., 51, 2472–2481, https://doi.org/10.1021/acs.est.6b02805, 2017.
Sun, K., Zhu, L., Cady-Pereira, K., Chan Miller, C., Chance, K., Clarisse, L., Coheur, P.-F., González Abad, G., Huang, G., Liu, X., Van Damme, M., Yang, K., and Zondlo, M.: A physics-based approach to oversample multi-satellite, multispecies observations to a common grid, Atmos. Meas. Tech., 11, 6679–6701, https://doi.org/10.5194/amt-11-6679-2018, 2018.
US Census Bureau: 2010 US Census Mapping Files, US Census Bureau [data set], https://www.census.gov/geographies/mapping-files.html (last access: July 2022), 2012.
Van Damme, M., Clarisse, L., Dammers, E., Liu, X., Nowak, J. B., Clerbaux, C., Flechard, C. R., Galy-Lacaux, C., Xu, W., Neuman, J. A., Tang, Y. S., Sutton, M. A., Erisman, J. W., and Coheur, P. F.: Towards validation of ammonia (NH3) measurements from the IASI satellite, Atmos. Meas. Tech., 8, 1575–1591, https://doi.org/10.5194/amt-8-1575-2015, 2015.
Van Damme, M., Whitburn, S., Clarisse, L., Clerbaux, C., Hurtmans, D., and Coheur, P.-F.: Version 2 of the IASI NH3 neural network retrieval algorithm: near-real-time and reanalysed datasets, Atmos. Meas. Tech., 10, 4905–4914, https://doi.org/10.5194/amt-10-4905-2017, 2017.
Van Damme, M., Clarisse, L., Whitburn, S., Hadji-Lazaro, J., Hurtmans, D., Clerbaux, C., and Coheur, P. F.: Industrial and agricultural ammonia point sources exposed, Nature, 564, 99–103, https://doi.org/10.1038/s41586-018-0747-1, 2018.
Van Damme, M., Clarisse, L., Franco, B., Sutton, M. A., Erisman, J. W., Wichink Kruit, R., van Zanten, M., Whitburn, S., Hadji-Lazaro, J., Hurtmans, D., Clerbaux, C., and Coheur, P. F.: Global, regional and national trends of atmospheric ammonia derived from a decadal (2008–2018) satellite record, Environ. Res. Lett., 42, 055017, https://doi.org/10.1088/1748-9326/abd5e0, 2021.
von Bobrutzki, K., Braban, C. F., Famulari, D., Jones, S. K., Blackall, T., Smith, T. E. L., Blom, M., Coe, H., Gallagher, M., Ghalaieny, M., McGillen, M. R., Percival, C. J., Whitehead, J. D., Ellis, R., Murphy, J., Mohacsi, A., Pogany, A., Junninen, H., Rantanen, S., Sutton, M. A., and Nemitz, E.: Field inter-comparison of eleven atmospheric ammonia measurement techniques, Atmos. Meas. Tech., 3, 91–112, https://doi.org/10.5194/amt-3-91-2010, 2010.
Walker, J. M., Philip, S., Martin, R. V., and Seinfeld, J. H.: Simulation of nitrate, sulfate, and ammonium aerosols over the United States, Atmos. Chem. Phys., 12, 11213–11227, https://doi.org/10.5194/acp-12-11213-2012, 2012.
Wang, M., Kong, W., Marten, R., He, X. C., Chen, D., Pfeifer, J., Heitto, A., Kontkanen, J., Dada, L., Kürten, A., Yli-Juuti, T., Manninen, H. E., Amanatidis, S., Amorim, A., Baalbaki, R., Baccarini, A., Bell, D. M., Bertozzi, B., Bräkling, S., Brilke, S., Murillo, L. C., Chiu, R., Chu, B., de Menezes, L. P., Duplissy, J., Finkenzeller, H., Carracedo, L. G., Granzin, M., Guida, R., Hansel, A., Hofbauer, V., Krechmer, J., Lehtipalo, K., Lamkaddam, H., Lampimäki, M., Lee, C. P., Makhmutov, V., Marie, G., Mathot, S., Mauldin, R. L., Mentler, B., Müller, T., Onnela, A., Partoll, E., Petäjä, T., Philippov, M., Pospisilova, V., Ranjithkumar, A., Rissanen, M., Rörup, B., Scholz, W., Shen, J., Simon, M., Sipilä, M., Steiner, G., Stolzenburg, D., Tham, Y. J., Tomé, A., Wagner, A. C., Wang, D. S., Wang, Y., Weber, S. K., Winkler, P. M., Wlasits, P. J., Wu, Y., Xiao, M., Ye, Q., Zauner-Wieczorek, M., Zhou, X., Volkamer, R., Riipinen, I., Dommen, J., Curtius, J., Baltensperger, U., Kulmala, M., Worsnop, D. R., Kirkby, J., Seinfeld, J. H., El-Haddad, I., Flagan, R. C., and Donahue, N. M.: Rapid growth of new atmospheric particles by nitric acid and ammonia condensation, Nature, 581, 184–189, https://doi.org/10.1038/s41586-020-2270-4, 2020.
Wang, R., Guo, X., Pan, D., Kelly, J. T., Bash, J. O., Sun, K., Paulot, F., Clarisse, L., van Damme, M., Whitburn, S., Coheur, P. F., Clerbaux, C., and Zondlo, M. A.: Monthly Patterns of Ammonia Over the Contiguous United States at 2-km Resolution, Geophys. Res. Lett., 48, e2020GL090579, https://doi.org/10.1029/2020GL090579, 2021.
Warner, J. X., Wei, Z., Strow, L. L., Dickerson, R. R., and Nowak, J. B.: The global tropospheric ammonia distribution as seen in the 13-year AIRS measurement record, Atmos. Chem. Phys., 16, 5467–5479, https://doi.org/10.5194/acp-16-5467-2016, 2016.
Warner, J. X., Dickerson, R. R., Wei, Z., Strow, L. L., Wang, Y., and Liang, Q.: Increased atmospheric ammonia over the world's major agricultural areas detected from space, Geophys. Res. Lett., 44, 2875–2884, https://doi.org/10.1002/2016GL072305, 2017.
Whitburn, S., van Damme, M., Clarisse, L., Bauduin, S., Heald, C. L., Hadji-Lazaro, J., Hurtmans, D., Zondlo, M. A., Clerbaux, C., and Coheur, P.-F.: A flexible and robust neural network IASI-NH 3 retrieval algorithm, J. Geophys. Res.-Atmos., 121, 6581–6599, https://doi.org/10.1002/2016JD024828, 2016.
Yao, X. and Zhang, L.: Trends in atmospheric ammonia at urban, rural, and remote sites across North America, Atmos. Chem. Phys., 16, 11465–11475, https://doi.org/10.5194/acp-16-11465-2016, 2016.
Yao, X. and Zhang, L.: Causes of Large Increases in Atmospheric Ammonia in the Last Decade across North America, ACS Omega, 4, 22133–22142, https://doi.org/10.1021/acsomega.9b03284, 2019.
Yu, F., Nair, A. A., and Luo, G.: Long-Term Trend of Gaseous Ammonia Over the United States: Modeling and Comparison With Observations, J. Geophys. Res.-Atmos., 123, 8315–8325, https://doi.org/10.1029/2018JD028412, 2018.
Yue, S. and Wang, C. Y.: The Mann–Kendall test modified by effective sample size to detect trend in serially correlated hydrological series, Water Resour. Manag., 44, 201–218, https://doi.org/10.1023/B:WARM.0000043140.61082.60, 2004.
Zhai, S., Jacob, D. J., Wang, X., Liu, Z., Wen, T., Shah, V., Li, K., Moch, J. M., Bates, K. H., Song, S., Shen, L., Zhang, Y., Luo, G., Yu, F., Sun, Y., Wang, L., Qi, M., Tao, J., Gui, K., Xu, H., Zhang, Q., Zhao, T., Wang, Y., Lee, H. C., Choi, H., and Liao, H.: Control of particulate nitrate air pollution in China, Nat. Geosci., 14, 389–395, https://doi.org/10.1038/s41561-021-00726-z, 2021.
Zheng, G., Su, H., Wang, S., Andreae, M. O., Pöschl, U., and Cheng, Y.: Multiphase buffer theory explains contrasts in atmospheric aerosol acidity, Science (1979), 369, 1374–1377, https://doi.org/10.1126/SCIENCE.ABA3719, 2020.