the Creative Commons Attribution 4.0 License.
the Creative Commons Attribution 4.0 License.
 | 18 Oct 2023
Differences in microphysical properties of cirrus at high and mid-latitudes
Elena De La Torre Castro
Tina Jurkat-Witschas
Armin Afchine
Volker Grewe
Valerian Hahn
Simon Kirschler
Martina Krämer
Johannes Lucke
Nicole Spelten
Heini Wernli
Martin Zöger
Christiane Voigt
Despite their proven importance for the atmospheric radiative energy budget, the effect of cirrus on climate and the magnitude of their modification by human activity is not well quantified. Besides anthropogenic pollution sources on the ground, aviation has a large local effect on cirrus microphysical and radiative properties via the formation of contrails and their transition to contrail cirrus. To investigate the anthropogenic influence on natural cirrus, we compare the microphysical properties of cirrus measured at mid-latitude (ML) regions (<60∘ N) that are often affected by aviation and pollution with cirrus measured in the same season in comparatively pristine high latitudes (HLs; ≥60∘ N). The number concentration, effective diameter, and ice water content of the observed cirrus are derived from in situ measurements covering ice crystal sizes between 2 and 6400 µm collected during the CIRRUS-HL campaign (Cirrus in High Latitudes) in June and July 2021. We analyse the dependence of cirrus microphysical properties on altitude and latitude and demonstrate that the median ice number concentration is an order of magnitude larger in the measured mid-latitude cirrus, with 0.0086 cm−3, compared to the high-latitude cirrus, with 0.001 cm−3. Ice crystals in mid-latitude cirrus are on average smaller than in high-latitude cirrus, with a median effective diameter of 165 µm compared to 210 µm, and the median ice water content in mid-latitude cirrus is higher (0.0033 g m−3) than in high-latitude cirrus (0.0019 g m−3). In order to investigate the cirrus properties in relation to the region of formation, we combine the airborne observations with 10 d backward trajectories to identify the location of cirrus formation and the cirrus type, i.e. in situ or liquid origin cirrus, depending on whether there is only ice or also liquid water present in the cirrus history, respectively. The cirrus formed and measured at mid-latitudes (M–M) have a particularly high ice number concentration and low effective diameter. This is very likely a signature of contrails and contrail cirrus, which is often observed in the in situ origin cirrus type. In contrast, the largest effective diameter and lowest number concentration were found in the cirrus formed and measured at high latitudes (H–H) along with the highest relative humidity over ice (RHi). On average, in-cloud RHi was above saturation in all cirrus. While most of the H–H cirrus were of an in situ origin, the cirrus formed at mid-latitudes and measured at high latitudes (M–H) were mainly of liquid origin. A pristine Arctic background atmosphere with relatively low ice nuclei availability and the extended growth of few nucleated ice crystals may explain the observed RHi and size distributions. The M–H cirrus are a mixture of the properties of M–M and H–H cirrus (preserving some of the initial properties acquired at mid-latitudes and transforming under Arctic atmospheric conditions). Our analyses indicate that part of the cirrus found at high latitudes is actually formed at mid-latitudes and therefore affected by mid-latitude air masses, which have a greater anthropogenic influence.
- Article
(6303 KB) - Full-text XML
-
Supplement
(511 KB) - BibTeX
- EndNote


Cirrus clouds are ice clouds at high altitudes (>8 km at mid-latitudes and >12 km in the tropics) and cover about one-third of the Earth's surface (Sassen et al., 2008). On the global average, cirrus and, in particular, thin cirrus exert a net warming effect on the atmosphere by absorbing thermal-infrared radiation from the Earth's surface and re-emitting it back to the surface (Liou, 1986; Gasparini et al., 2018). In addition, cirrus reflect solar radiation. This implies that less radiation reaches the surface, which leads to a cooling effect (Hong and Liu, 2015; Gasparini et al., 2018; Marsing et al., 2023). In the absence of solar radiation (e.g. during nights and polar winter seasons), cirrus exert a greenhouse effect and warm the atmosphere (A. J. Heymsfield et al., 2017; Gasparini et al., 2018; Marsing et al., 2023). In contrast to thin cirrus, thicker cirrus reflect more solar radiation back to space and thereby tend to have a net cooling effect on the atmosphere (Choi and Ho, 2006). In addition, regional and seasonal variations modulate the cirrus radiative forcing. On average, cirrus at high latitudes have a net warming effect throughout the year and cirrus at mid-latitudes tend to warm during the winter and cool during the summer (Hong and Liu, 2015).
The cirrus impact on the radiative energy budget depends on their macrophysical and microphysical properties, namely number concentration (N), effective diameter (ED), ice water content (IWC), and the shape of the ice crystals (Liou, 1986; Wendisch et al., 2005, 2007). These properties display a large variability. The properties of cirrus are affected by thermodynamic (temperature and relative humidity) and dynamic conditions (updraft velocity), as well as aerosol load and chemical composition, including anthropogenic influences (Hendricks et al., 2011; Patnaude and Diao, 2020; Maciel et al., 2022). The combination of these factors determines the nucleation process and the number, size, and shape of the ice crystals in the cloud.
Cirrus are generally formed by air cooling from rising air masses or by radiative cooling, either by homogeneous nucleation of soluble aerosol particles or water droplets or heterogeneous nucleation of insoluble ice-nucleating particles (Kärcher and Lohmann, 2002; Hoose and Möhler, 2012). Homogeneous nucleation of soluble aerosol particles occurs most frequently at strong cooling rates and high supersaturations with respect to ice (RHi∼150 %). Gravity waves, for example, can trigger the nucleation of homogeneously formed ice crystals, which can reach concentrations from 1 to 10 cm−3 (Kärcher and Lohmann, 2002; Hendricks et al., 2011; Jensen et al., 2013). However, in the presence of ice-nucleating particles (INPs), heterogeneous nucleation takes place at lower RHi than homogeneous freezing. The competition between both nucleation mechanisms together with sedimentation processes and temperature fluctuations control the cirrus microstructure (Spichtinger and Gierens, 2009; Kärcher et al., 2022).
Another classification, based on the Lagrangian origin of the air in which the cirrus form, was applied in several studies (Krämer et al., 2016, 2020; Luebke et al., 2016; Wernli et al., 2016; A. J. Heymsfield et al., 2017; Voigt et al., 2017). In situ origin cirrus form most likely below −38 ∘C in strong updrafts by homogeneous nucleation (Kärcher and Lohmann, 2002) and potentially at higher temperatures in slow updrafts by heterogeneous nucleation (Kärcher and Lohmann, 2003). Liquid origin cirrus form from mixed-phase clouds at lower altitudes that glaciate as they ascend and rise to the cirrus heights. Usually, liquid origin cirrus have higher IWCs than in situ origin cirrus (Krämer et al., 2016; Luebke et al., 2016).
Cirrus at mid-latitudes have been an important object of study over the last decade (Heymsfield et al., 2013; Krämer et al., 2016, 2020; Luebke et al., 2016; Voigt et al., 2017), and measurements of Arctic cirrus have become an urgent topic to be addressed in recent years (Wolf et al., 2018; Marsing et al., 2023). Such measurements are particularly relevant for understanding the regional and seasonal variations in the Arctic cirrus and their relationship with the phenomenon of Arctic amplification (Schmale et al., 2021; Shupe et al., 2022; Wendisch et al., 2023). The rapid and continuous warming of the Arctic is expected to reduce the temperature gradient between mid- and high latitudes, with disputed consequences on mid-latitude extreme weather (Wendisch et al., 2017). Additionally, the possibility of geoengineering the Arctic through cirrus seeding to revert climate change has been discussed in the last decade (Storelvmo et al., 2014; Muri et al., 2014). Thus, understanding the processes affecting the microphysical properties of cirrus at high latitudes is essential for answering current and future urgent questions in climate research.
The number concentration of ice crystals is strongly dependent on the updraft and supersaturation driving the nucleation process of ice crystals on different INP types (Kärcher and Lohmann, 2003). These parameters are mainly determined by the prevalent meteorological conditions (Muhlbauer et al., 2014). Balloon-borne measurements of ice crystal shapes and the number concentrations of Arctic cirrus close to Kiruna (Sweden) were analysed by Wolf et al. (2018), who found lower concentrations compared to the measurements at mid-latitudes (Krämer et al., 2016; Luebke et al., 2016). Gayet et al. (2004) compared microphysical properties of cirrus in the Northern and Southern hemispheres and found higher particle concentrations and lower effective diameters in the more polluted Northern Hemisphere. However, it has not been confirmed by the global distributions of N from satellite retrievals of recent studies (Sourdeval et al., 2018; Krämer et al., 2020).
The ice water content of cirrus in the Arctic, mid-latitude, and tropical regions varies over several orders of magnitude within the same temperature ranges (Schiller et al., 2008; Luebke et al., 2013; A. Heymsfield et al., 2017; Krämer et al., 2020; Marsing et al., 2023). Studies with direct comparisons of N, ED, and IWC from dedicated measurements at high and mid-latitudes are scarce but necessary to better understand the different processes driving cirrus formation. In addition, seasonal changes in cirrus and variability in the dynamical processes in the troposphere complicate direct comparisons between data from different field campaigns.
Aircraft emissions can influence natural cloudiness not only through the injection of aerosols in the upper troposphere but also through the direct formation of contrails (Voigt et al., 2010, 2011; Burkhardt and Kärcher, 2011; Tesche et al., 2016; Marjani et al., 2022; Li et al., 2022). While contrail cirrus produced from global aviation have a net warming effect (Lee et al., 2021), contrails warm the atmosphere during nighttime and have a larger cooling contribution during daytime (Frömming et al., 2021; Teoh et al., 2022). Hence, it is of great importance to understand their interaction with water vapour, atmospheric radiation, and natural cirrus. The atmospheric conditions necessary for the persistence of contrails and cirrus are the same, and processes leading to cirrus formation often allow contrail formation, although contrails can also form ahead of cirrus. Therefore, contrails and cirrus frequently coexist in the same regions (Schumann, 1996; Gierens, 2012). Contrail formation and growth processes are driven by ambient water vapour causing dehydration at the flight levels and enrichment at lower levels (Schumann et al., 2015). This influences the formation and life cycle of natural cloudiness.
The way in which contrails and natural cirrus interact is an object of current research. Microphysical properties of contrails have been measured in many studies (e.g. Baumgardner et al., 1998; Voigt et al., 2010, 2011; Chauvigné et al., 2018; Li et al., 2022). Young contrails initially have ice crystal concentrations larger than 100 cm−3 and ice crystal sizes of a few micrometres (Petzold et al., 1997; Gayet et al., 2012; Jeßberger et al., 2013; Kleine et al., 2018). Large tropospheric water vapour concentrations promote the growth of the ice crystals (Bräuer et al., 2021a, b), which leads to an overall higher optical thickness of the contrail (Wilhelm et al., 2022). If the supersaturation sustains, then the contrails can live longer and both effects lead to a higher contrail radiative forcing at lower altitudes. During the transition from contrail to cirrus, the ice crystals grow by the uptake of water vapour, and the ice number concentration decreases due to mixing with ambient dry air and the increasing fall velocity of the ice crystals (Schröder et al., 2000; Unterstrasser and Gierens, 2010; Kübbeler et al., 2011; Voigt et al., 2017; Schumann et al., 2017; Grewe et al., 2017). Voigt et al. (2017) showed that the ice crystal number of aged contrail cirrus is still enhanced when compared to natural cirrus.
Embedded contrails in natural cirrus and contrail cirrus have also been investigated with active and passive remote sensing. Tesche et al. (2016) found an increase in cloud optical thickness following the formation of a contrail in an existing cirrus. Following the same methodology, Marjani et al. (2022) focused on the number concentration and found an increase within a few hundred metres behind the aircraft and below its flight track. In line with airborne observations, Verma and Burkhardt (2022) simulated contrail formation within pre-existing cirrus and found that contrails increased the ice crystal number concentration of cirrus by a few orders of magnitude, and not only is the ice number concentration modified but also the effective diameter. A reduction in the ED was observed from measurements near flight corridors by Kristensson et al. (2000). Recent studies also showed a reduction in the effective radius of contrails embedded in natural cirrus (Wang et al., 2023; Li et al., 2022). However, depending on atmospheric conditions, when contrails are embedded in natural cirrus, the evolution of the contrail is perturbed by the cirrus, and ice crystals from contrail and cirrus coexist, making it difficult to distinguish between them (Unterstrasser et al., 2017a, b).
Anthropogenic ice-nucleating particles can influence ice crystal numbers and thereby the radiative properties of cirrus (Forster et al., 2021). INPs can increase the cirrus occurrence and can partially or completely suppress homogeneous freezing (Spichtinger and Cziczo, 2010; Kärcher et al., 2022). Regional differences between the concentrations, sources, and types of INPs may thus influence the cirrus microphysics. For instance, Beer et al. (2022) found lower concentrations of INPs in the high latitudes with less human influence in the Northern Hemisphere in their model simulations. Aviation soot can also act as INPs and indirectly affect the cirrus microphysical properties (Kanji et al., 2017; Urbanek et al., 2018; Groß et al., 2022). The emissions of aviation soot at cruise altitudes are the largest in mid-latitudes in the Northern Hemisphere and have the potential to significantly alter cirrus. However, their impact and even sign depend on the ice nucleation efficiency of aviation soot (Righi et al., 2021).
This work provides a statistical analysis of the differences in microphysical properties of cirrus measured during the CIRRUS-HL campaign (CIRRUS in High Latitudes) at high and mid-latitudes with the German research aircraft HALO (High Altitude and LOng range research aircraft). The measurements have been performed in June and July 2021 above Europe in latitudes from 38 and 76∘ N. The data sampled during this campaign at mid-latitudes extend the ML-CIRRUS (Mid-Latitude CIRRUS) data set (Voigt et al., 2017) and incorporate high-latitude cirrus, which offers the rare opportunity to contrast mid- and high-latitude cirrus properties in the same season. The summer season data are of particular interest because in this period of the year the radiative effects of the cirrus are different at mid- (cooling) and high (warming) latitudes (Hong and Liu, 2015). In addition, the tropopause region above Europe was particularly supersaturated in summer 2021, which favours the formation of persistent contrails in the upper troposphere (Dischl et al., 2022).
An overview of the campaign is given in Sect. 2, and details on the instrumentation and data evaluation are explained in Sect. 3.1 and 3.2.1. In Sect. 3.2.2, we describe the approach of combining our cloud particle measurements from HALO with air parcel trajectories (Wernli and Davies, 1997; Wernli et al., 2016; Luebke et al., 2016) in order to relate cirrus properties to the meteorological conditions at the location of cloud formation and to classify the cirrus according to their origin (Krämer et al., 2016; Luebke et al., 2016; Wernli et al., 2016). An overview of the differences between mid- and high-latitude cirrus is described in Sect. 4.1, and in Sect. 4.2, we compare the microphysical properties of cirrus sampled at mid- and high latitudes and in relation to the location of cloud formation in order to investigate a potential anthropogenic influence, which is mainly from aviation. The differences are also analysed, depending on the cirrus origin type, in Sect. 4.3. Finally, the results are further discussed in Sect. 5, and a summary of the findings is given in Sect. 6.
Cirrus at mid- and high latitudes were measured with cloud probes on the research aircraft HALO during the CIRRUS-HL campaign in June and July 2021. The mission was based in Oberpfaffenhofen (Germany), and a total of 24 flights (22 science flights in cirrus) were performed between 24 June and 29 July 2021, covering regions in the Arctic, North Atlantic, and central Europe. The objective of the campaign was to investigate cirrus formation and microphysical properties, as well as the radiative impact of cirrus at high latitudes, and to contrast those with cirrus at mid-latitudes. To this end, we measured cirrus in different weather regimes, including warm conveyor belt cirrus, high-pressure in situ origin cirrus, and convective cirrus. In addition, contrail cirrus and cirrus affected by aviation aerosol were targeted (Urbanek et al., 2018; Groß et al., 2022). Over western Europe, the unusually frequent occurrence of upper-level troughs and cutoff lows led to statically unstable situations, with many thunderstorms and hail over western and central Europe. Over the eastern North Atlantic, several extratropical cyclones with warm conveyor belts occurred, in particular on 7 and 12 July 2021 (according to ECMWF weather forecasts and flight reports). In July 2021, air traffic was reduced due to the COVID-19 pandemic (Voigt et al., 2022); compared to 2019, there were −46.5 % available seat kilometres (ASKs), according to the International Civil Aviation Organization (ICAO, 2021), but we still expect an influence of aviation in our observations of ML cirrus.
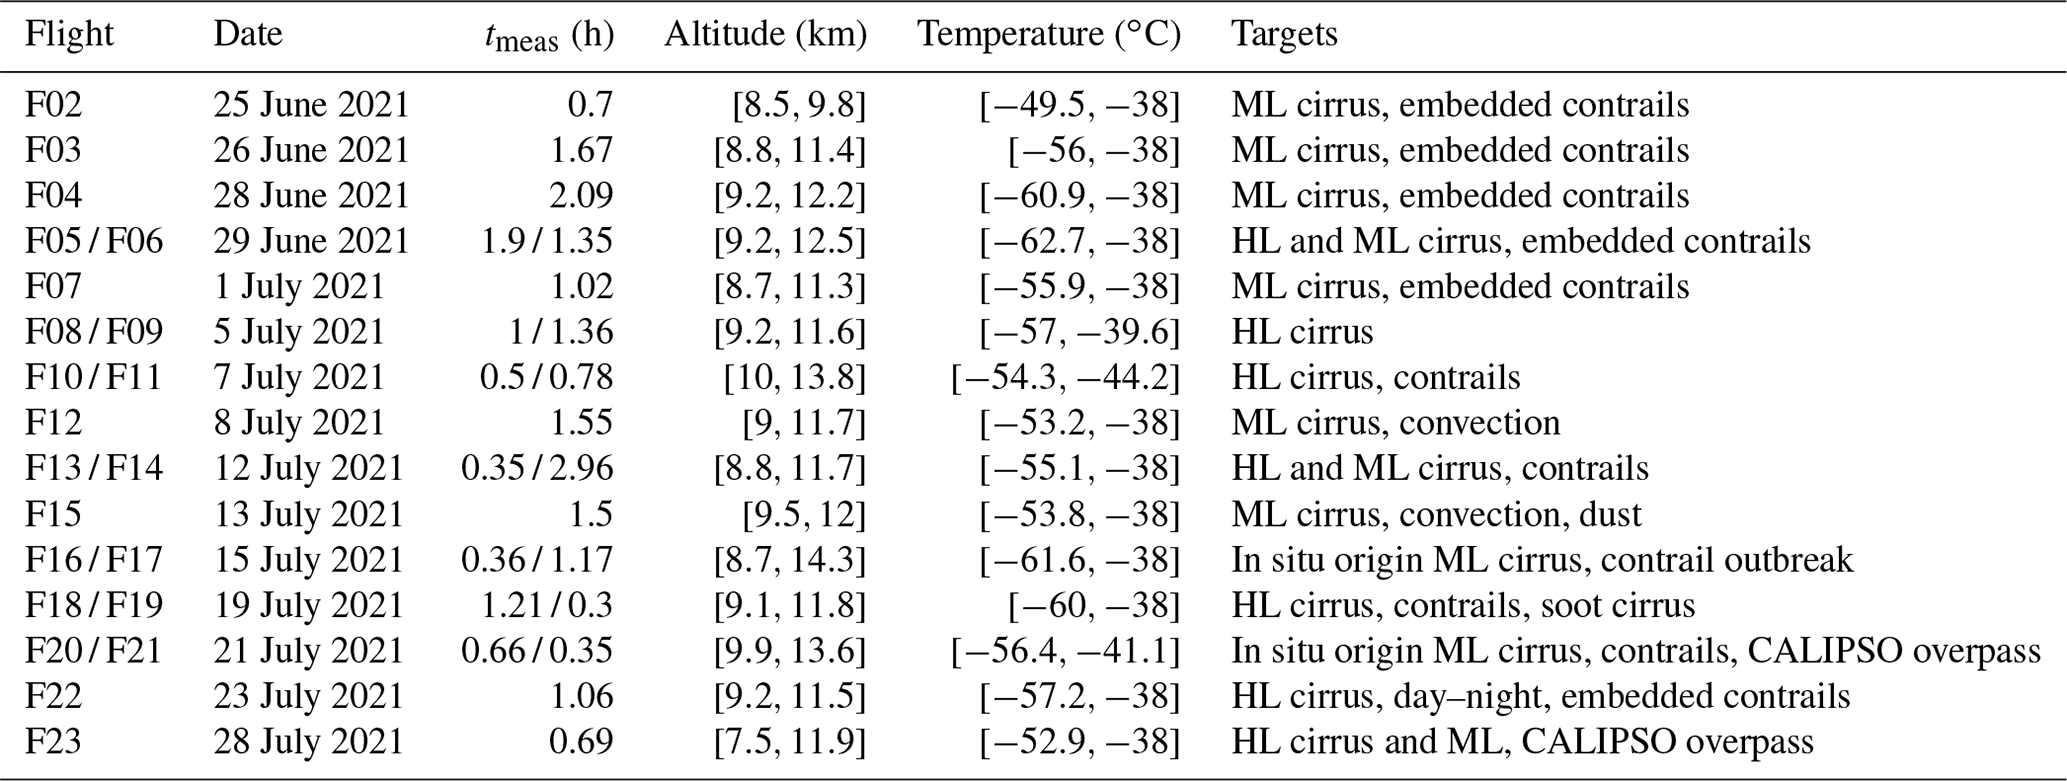
An overview of the flights during CIRRUS-HL is given in Fig. 1, and specific details of each flight are provided in Table 1. Targets specified as “ML” or “HL” cirrus stand for cirrus at mid-latitudes and cirrus at high latitudes, respectively. The flights targeted in convective cirrus (F12 and F15) are marked in green in Fig. 1 and have been excluded from the present analysis, since convection is not an objective of this study. However, during some return transfers, outflows of single convective systems were encountered over Germany. These isolated events have not been excluded, as they are inseparable from the surrounding cirrus deck. A total of 34 h (17.7 h in mid-latitude cirrus, 7.8 in high-latitude cirrus, and the remaining time in mixed-phase and liquid clouds) of in situ cloud particle measurements were achieved at different latitudes between 38 and 76∘ N at temperatures down to −63 ∘C and altitudes up to 14.3 km.
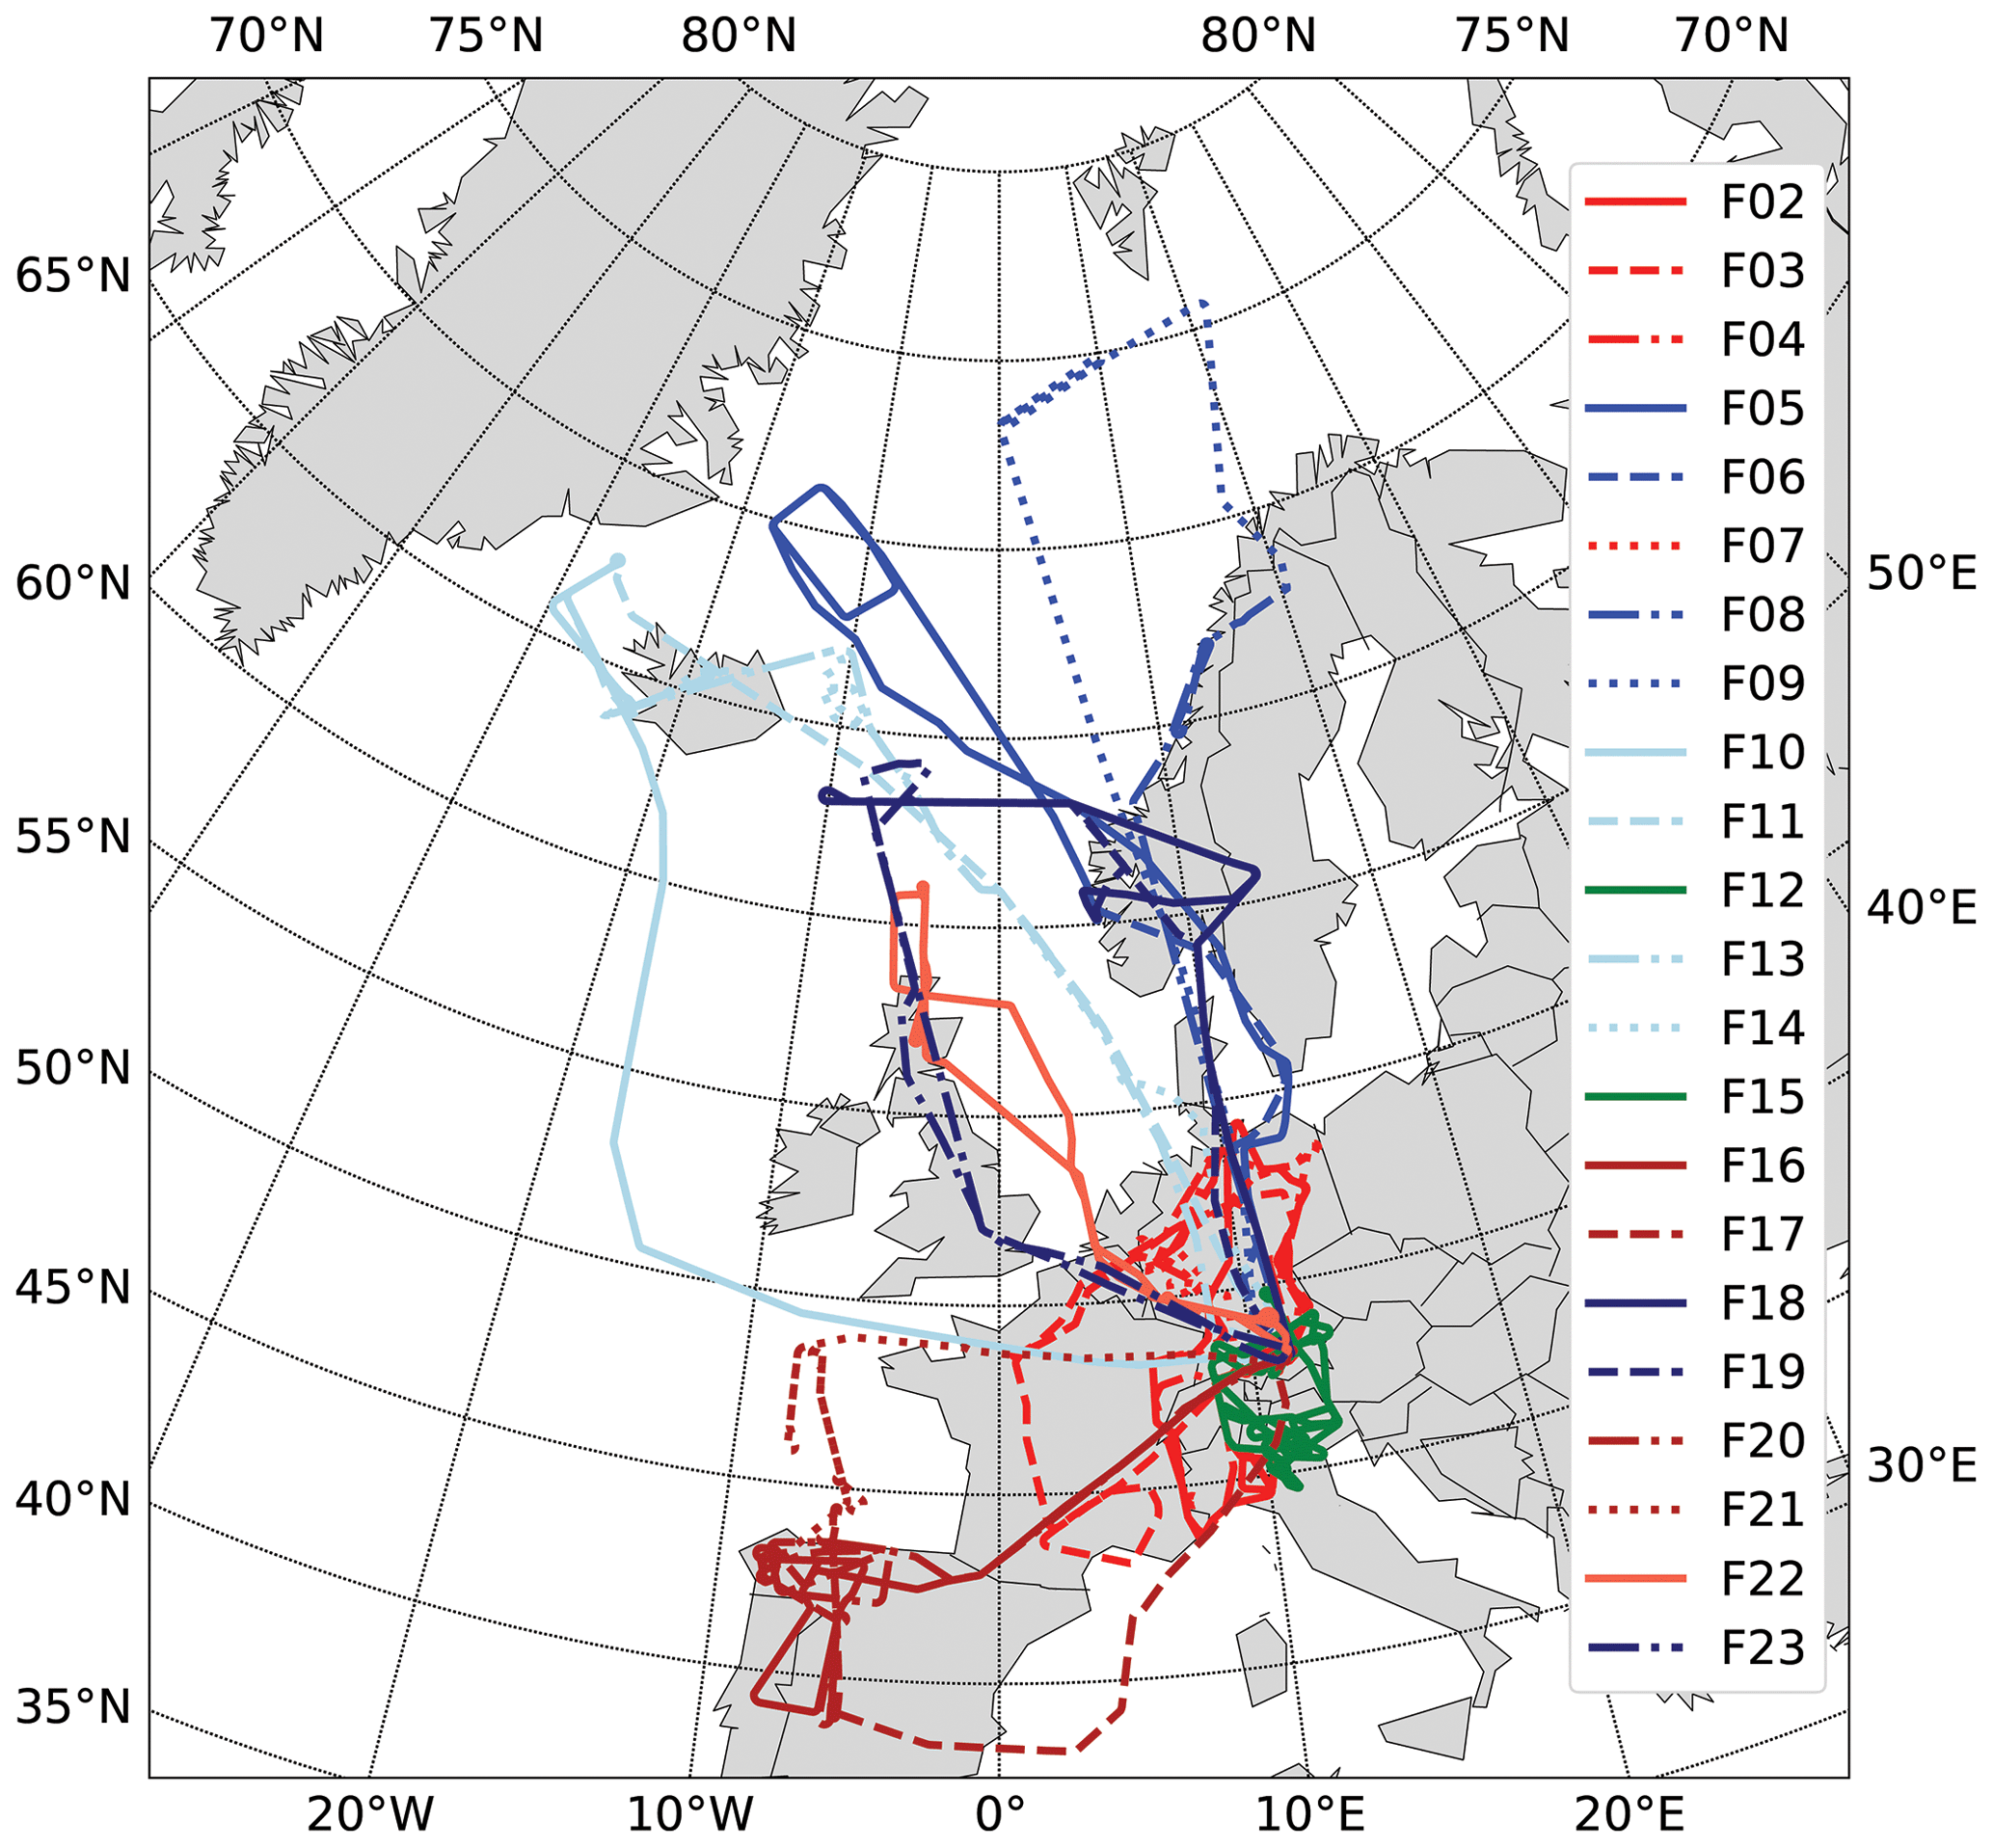
Figure 1Map of the study region in the Arctic, North Atlantic, and central Europe during the CIRRUS-HL mission in 2021. Each flight is labelled and drawn in a different colour and line style. Flights at high latitudes are indicated with blue colours, red colours represent flights at mid-latitudes, and green is applied for flights in convection.
Table 1Summary and objectives of the CIRRUS-HL science flights in June and July 2021. Measurement time, altitude, and temperature ranges are indicated only for the cirrus regime.
3.1 Instrumentation
During the campaign, HALO was equipped with a wide variety of in situ and remote sensing instruments to measure cloud particles, aerosols, trace gases (H2O, NO, NOy, CO, CO2, CH4, and O3), radiation, and basic meteorological parameters (pressure, temperature, position, wind direction, and velocity). The data used in this study were collected by the Cloud Combination Probe (CCP) and the Precipitation Imaging Probe (PIP) mounted under the wings of the HALO aircraft, and they are presented below. Detailed information about the other cloud probes and instrumentation installed for this campaign is given in Voigt et al. (2017).
3.1.1 The Cloud Droplet Probe
The Cloud Droplet Probe (CDP) is part of the CCP from Droplet Measurement Technologies (DMT LLC., USA; Baumgardner et al., 2011, 2017; Klingebiel et al., 2015; Weigel et al., 2016) and is a forward-scattering probe that can size and count particles in a diameter range of 2–50 µm that is passing through the laser beam. The amplitude of the converted signal is related to the size of the particle applying Mie theory (Mie, 1908) or T-matrix method (Waterman, 1971) for spherical and aspherical particles, respectively. While the size bin edges indicated by the manufacturer are calculated for spherical particles, ice crystals have different habits (Jang et al., 2022). The complexity of the ice crystals and the variety of aspect ratios make it difficult to obtain a standard solution with the T-matrix method. Borrmann et al. (2000) compared both methods for a FSSP-300 (Forward-Scattering Spectrometer Probe; model 300) and did not find substantial differences for small particles. Here, we only consider recordings of the CDP between 2 and 37.5 µm, and we assume Mie theory and use the nominal bins from the manufacturer for simplification. The instrument was calibrated using glass beads (Lance et al., 2010).
The sample area of the CDP is 0.27 ± 0.025 mm2, according to Klingebiel et al. (2015). The probe air speed (PAS) used to calculate the sampling volume of the CDP was measured by the pitot tube of the Cloud Aerosol Spectrometer with Depolarization Option (CAS-DPOL; Kleine et al., 2018 mounted on the opposite wing at the same position as the CCP and not by the pitot tube of the CCP, due to technical issues of the tube. With this quantity, the particle number concentration was determined in a time resolution of 1 s.
The probe has two aerodynamic arms with pointed asymmetric tips upstream of the laser beam that reduce or prevent shattering in the CDP data (McFarquhar et al., 2007; Lance et al., 2010; Korolev et al., 2013). In addition, the interarrival time analyses from the CDP data recorded during CIRRUS-HL did not reveal the presence of shattering. McFarquhar et al. (2007, 2011) compared the shattering effects in the CDP with other cloud probes (CAS-DPOL and FSSP) and found the CDP to be less susceptible to it. Owing to the low particle concentrations in cirrus (), errors induced by coincidence are considered negligible (Lance et al., 2010). The effects of the limited sampling volumes in the scattering probes were extensively explained by Krämer et al. (2020) in their Appendix A2.3, with a focus on the CAS-DPOL. In our case, the CDP has a lower N limit ∼0.025 cm−3 when only one particle is recorded in one second. These so-called “single-particle events” cause an increase in the frequency of the low N range of the CDP. We mitigated this effect by eliminating the single-particle events due to their low statistics and inaccuracy.
3.1.2 The Cloud Imaging Probe and the Precipitation Imaging Probe
The Cloud Imaging Probe (CIPgs, with gs for greyscale), the second part of the CCP, and the PIP are optical array probes (DMT LLC., USA; Baumgardner et al., 2001; Weigel et al., 2016; Voigt et al., 2017). Both probes consist of 64 photodiodes illuminated by a laser beam. When a particle passes through the laser beam, it projects a shadow on the diode array, and each pixel is triggered if the light intensity falls below a threshold value (Knollenberg, 1970). The images are constructed by appending consecutive slices corresponding to the diode array state as the particle crosses the beam. The monoscale cloud probe PIP has only two light intensity levels, and particles are recorded when at least one pixel of the image is 50 % obscured. On the contrary, the CIPgs is a greyscale probe and includes two more shadow intensity levels (25 %, 50 %, and 75 %; nominal thresholds) that define four pixel states, namely no shadow and at least 25 %, 50 %, or 75 % obscured. This functionality allows us to record images already at 25 % dimming, which helps to constrain the depth of field (DoF) and adds details for the particle shape analysis. The threshold values used in this campaign were 35 %, 50 %, and 65 %. We only considered images with at least one pixel at 50 % shadow intensity in order to assure a better agreement with the monoscale PIP and achieve a compromise between reducing the impact of out-of-focus particles (O'Shea et al., 2019, 2021) and keeping enough statistics. In addition, the size of the ice particles is calculated considering pixels with 50 % or more shadow intensity. The size is calculated as the diameter of the minimum enclosing circle, which corresponds to the particle maximum dimension (Heymsfield et al., 2002). The CIPgs (PIP) has a nominal pixel size of 15 µm (100 µm) that allows us to measure particles from 15–960 µm (100–6400 µm).
The PAS measured by the pitot tube attached to each instrument is applied as the sampling rate for image recording. The true air speed (TAS) is measured by the Basic HALO Measurement and Sensor System (BAHAMAS). In this case, the CIPgs was set to record the images at a higher fixed sampling rate than the real PAS (due to the technical issues with its pitot tube), which systematically generates artificial elongated particles. The images are corrected by applying, as a narrowing factor, the ratio between PAS (measured by the CAS-DPOL) and the specified sampling rate. Further corrections of the images are also necessary due to alterations in the PAS data (e.g. icing on the pitot tube), leading to distorted particles. Erroneous PAS measurement sequences are reconstructed using a PAS TAS ratio, and the deformed images can be corrected by applying the ratio of “corrected PAS” to “wrong PAS” (Weigel et al., 2016).
Particles were rejected if at least one of the end diodes was obscured, and the sample volume was adapted accordingly, following the all-in method described by Knollenberg (1970) and Heymsfield and Parrish (1978). In addition, particles with only one pixel were excluded, and various pixel errors were identified and removed. The coincidence of particles was found to be irrelevant in the cirrus regime, due to the low particle concentrations. The CIPgs has modified triangular tips that deflect the artefacts generated by the shattering of large ice crystals to avoid entering the sample volume. This modification is very efficient at reducing shattering effects (Korolev et al., 2013); however, an interarrival time analysis helped to identify and remove the remaining shattering events, which were not significant (Field et al., 2006). Although the PIP does not include the anti-shattering tips, we found a lesser influence of shattering in the PIP than in the CIPgs, since the PIP can only detect particles from 100 µm, and shattered particles are usually smaller. Baumgardner et al. (2017) estimated the error in sizing in ±20 % for ice particles of diameters larger than 100–200 µm and the error in concentration in ±50 %. For smaller particles, the error is larger and increases inversely proportional to the diameter.
3.2 Methodology
3.2.1 Cloud particle, relative humidity, and aircraft reference measurements
The size ranges of the three instruments overlap, and thus, it is necessary to calculate a combined size distribution. From 2 to 37.5 µm, the CDP instrument is used; in the size range from 37.5 to 247.5 µm, the CIPgs is used; in the range from 247.5 to 637.5 µm, the mean concentration between the CIPgs and PIP is calculated; and from 637.5 to 6400 µm, the PIP data were used to derive the total combined distribution. We based this strategy on a particle shape analysis of the CIPgs and PIP, which determined a size underestimation of complex ice crystal shapes in the lower size range of the PIP. An average particle distribution between 247.5 and 637.5 µm was found to be the optimal solution that also compensated for a slight size overestimation from the upper range of the CIPgs, due to uncorrected out-of-focus ice crystals and the use of the maximum dimension as the sizing method, which leads to a higher overestimation when pixel errors are present.
The combined distribution of particle concentration in size bins for the whole cloud diameter range allows us to calculate the microphysical cirrus parameters. Even though ice clouds can exist at higher temperatures, we consider only measurements below −38 ∘C to ensure completely glaciated clouds and calculate the N, ED, and IWC. This might exclude some cirrus measurements above the threshold but guarantees that no liquid water is present. We use the mass–dimension relationship from Heymsfield et al. (2010) to determine the IWC, and the ED is computed as the ratio of the third to the second moment of the cloud spectrum (Parol et al., 1991; Schumann et al., 2011). For the calculations of IWC and ED, we use the diameters that correspond to the centre of the size bins. We derive the extinction coefficient (βext) from the projected area of the CIPgs and PIP particle images and spheres with the arithmetic mean diameters of the CDP particle size distribution (PSD; Schumann et al., 2011; Mitchell et al., 2011). The extinction efficiency Qext is approximated to 2, assuming short wavelengths relative to the particles dimension (Thornberry et al., 2017).
In this study, we investigate the microphysical cirrus properties from 20 flights. As mentioned in Sect. 2, data from the flights in convection were removed. In general, studies usually use data directly in a 1 Hz sample rate. We apply a 2 s mean in order to improve the statistical significance of the low particle concentrations. A larger averaging interval (e.g. 5 or 10 s) corresponds to a large horizontal extension (≈2 km for 10 s averages) where local inhomogeneities can be present, and therefore, it excessively attenuates certain features that are of interest, such as contrails.
The pressure, temperature, and wind field measurements were performed by the BAHAMAS system operated by the DLR (German Aerospace Center) Flight Experiments department (Giez et al., 2021). This system also provides the basic aircraft position data, of which we use longitude, latitude, and height. For the calculation of the RHi, we use the water vapour mixing ratio measurements from the Sophisticated Hygrometer for Atmospheric ResearCh (SHARC), which is also developed and operated by DLR Flight Experiments. The measurement range is between 2 and 50 000 ppm, and the overall relative and absolute uncertainty is 5 % and ±1 ppm, respectively (Kaufmann et al., 2015, 2018).
3.2.2 Air mass trajectories
Calculations of 10 d backward trajectories were performed from the flight tracks with the Lagrangian analysis tool LAGRANTO (Wernli and Davies, 1997; Sprenger and Wernli, 2015) and using wind, temperature, and cloud fields from the operational European Centre for Medium-Range Weather Forecasts (ECMWF) analyses. Starting from the HALO flight paths, the hourly backward evolution of the IWC and liquid water content (LWC) along the trajectories was evaluated to estimate the time of cloud formation and distinguish between in situ and liquid origin cirrus, following the approach described in Wernli et al. (2016). The formation point corresponds to the last time step along the trajectory before IWC=0 occurs for the first time (going backward in time). However, if IWC=0 only occurs at a 1 h time step, then we consider this to be “noise”, ignore this instance with IWC=0, and repeat the criterion for the next point with IWC=0. Once the formation point is determined, the corresponding in situ measurement is classified as being of “liquid origin” if liquid water was present along the trajectory between cloud formation and the measurement (LWC>0). If this was not the case, and the air parcel only contained ice water during this time period, then it is classified as being “in situ origin” cirrus. In addition to the cirrus origin classification, we also analysed the updraft speed along the backward trajectories to better understand the formation process.
4.1 Overview and differences in the microphysical properties of cirrus (N, ED, and IWC) at mid- and high latitudes
The cirrus measurements are classified by latitude in order to investigate and compare microphysical properties of cirrus at mid- and high latitudes. For this first classification, we consider the latitude at the measurement point. Data obtained at latitudes <60∘ N are considered to be mid-latitude (ML) cirrus, and data collected at ≥60∘ N are considered to be high-latitude (HL) cirrus. This differentiation is somewhat arbitrary, as there is no universally accepted definition of the three general latitude zones. Perry (1987), for example, defined the mid-latitude in the Northern Hemisphere as the zone between 35 and 56∘ N, but the limits vary according to the month and year. In Sect. 5.1, we discuss the variation in the latitude threshold, and we find no major influence on the conclusions of this work (see also Fig. S4 in the Supplement).
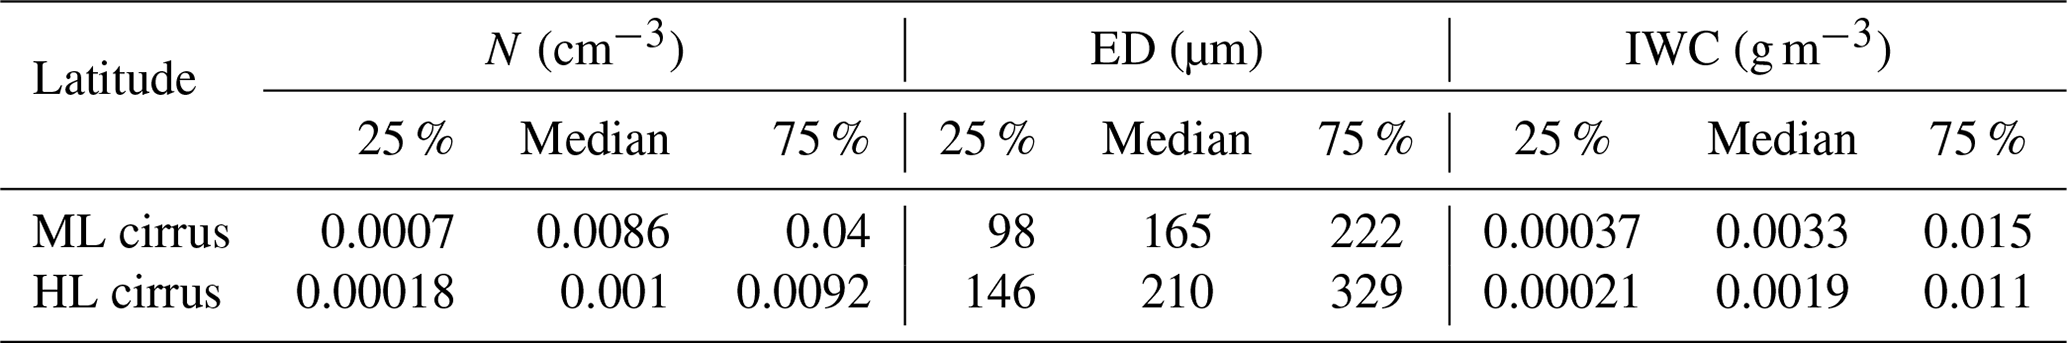
Figure 2 shows an overview of the frequency distribution of the measured cirrus microphysical properties with respect to latitude. The normalized frequencies of occurrence allow the comparison between latitudes, regardless of the number of observations in each bin. All together, we provide a cirrus data set from 41 564 cloud samples in 2 s time resolution, of which 15 211 samples are HL cirrus and 26 353 samples are ML cirrus. Overall medians of N, ED, and IWC (denoted with a tilde) for ML and HL cirrus are indicated in Fig. 2 and Table 2. We consider the median instead of the mean, since the mean is more affected by outliers. The overall median N for ML cirrus (0.0086 cm−3) is higher than for HL cirrus (0.001 cm−3) by an order of magnitude. The median ED in ML cirrus is 165 µm, which is smaller than the HL cirrus at 210 µm, and the median IWC does not differ much between ML and HL cirrus, as it represents a combined effect of N and ED. A similar behaviour is observed in the normalized frequency distribution of βext, which is shown in Fig. S5 in the Supplement.
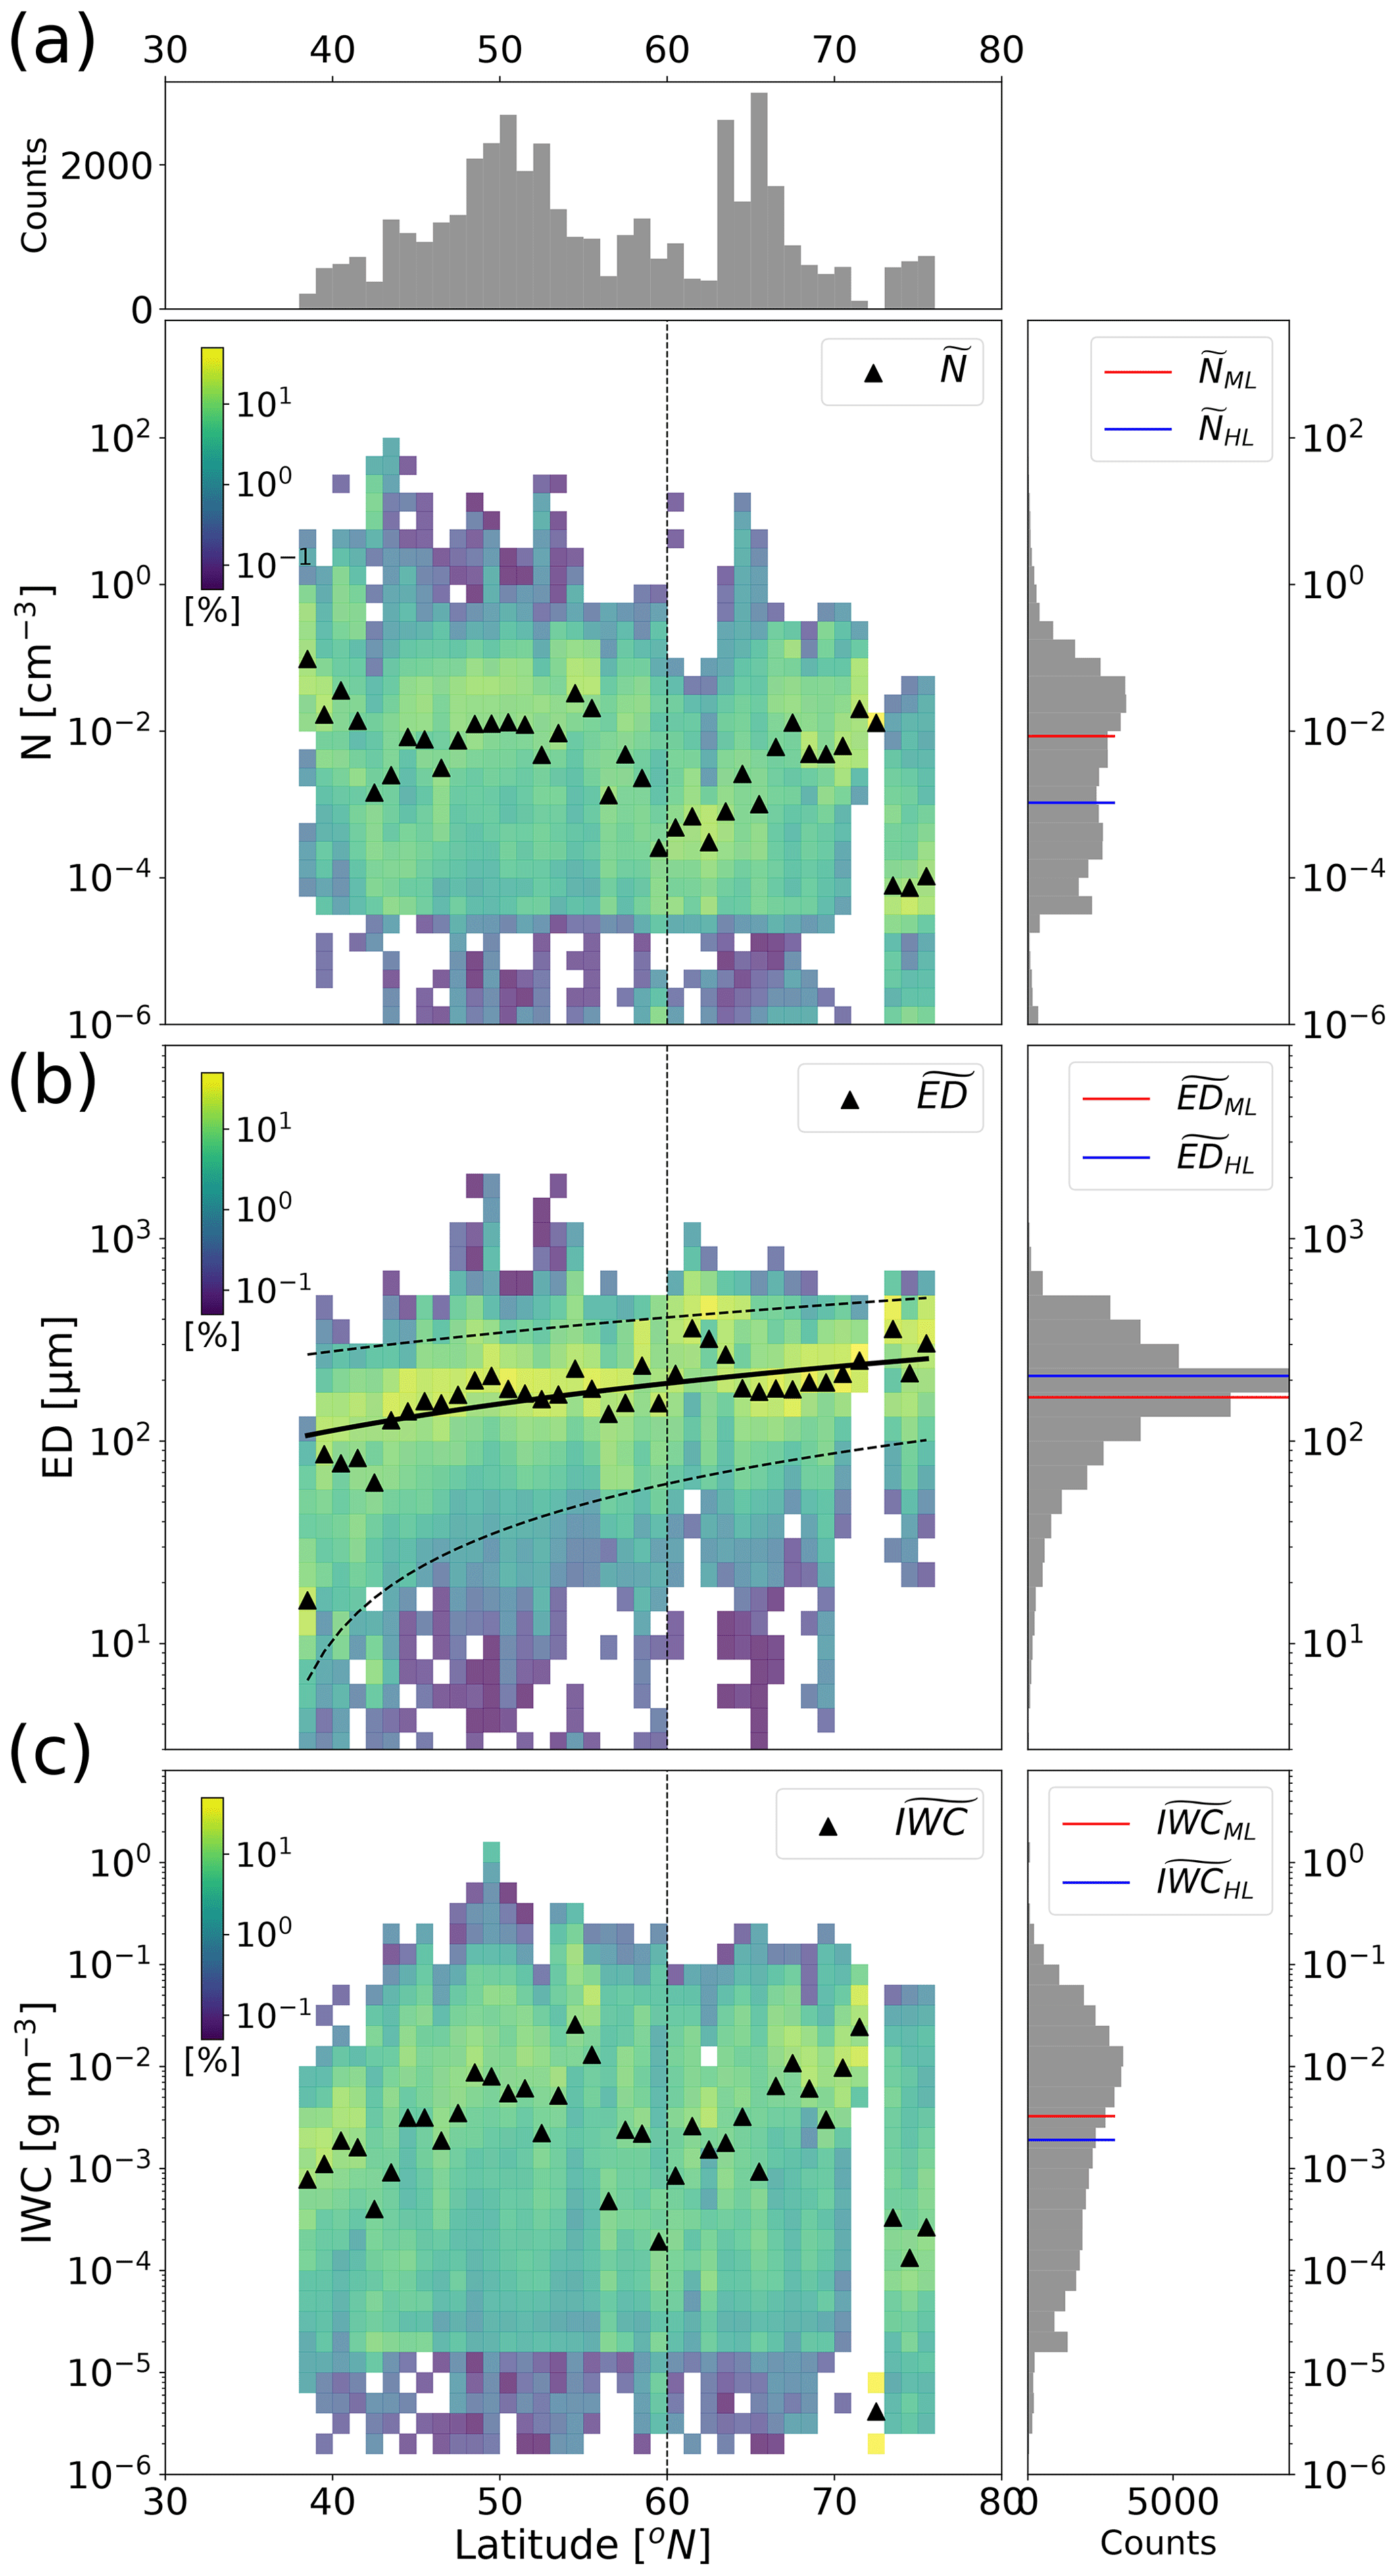
Figure 2Normalized frequency distribution of (a) N, (b) ED, and (c) IWC observations as a function of the latitude of the measurement during CIRRUS-HL. Latitude bins are 1∘ wide, and vertical bins are logarithmic. The colour code indicates the frequency of occurrence in percent (%) per 1∘ latitude bin, which is normalized by the total counts per latitude bin. The vertical dashed line marks the threshold of 60∘ N for the differentiation of ML and HL cirrus. Triangular markers are medians per latitude bin (, , and ). The top-most panel and right column contain histograms of the corresponding variables. The solid black line in panel (b) is a linear fit of the ED medians, and the dashed lines are the corresponding linear fits of the 5th and 95th percentiles.
Table 2Median, 25th percentile, and 75th percentile of the microphysical properties N, ED, and IWC in mid- and high latitudes during CIRRUS-HL.
Cirrus measured at mid-latitudes are characterized by higher than those measured at high latitudes. in HL cirrus mostly takes values between 0.0001 and 0.01 cm−3. The central range of the ML cirrus measurements is shifted to values that are 1 order of magnitude larger (0.001–0.1 cm−3). In addition, Fig. 2a also indicates that high particle number concentrations () were more frequently observed at mid-latitudes. A linear correlation of the s is drawn in Fig. 2b and exhibits a slight and clear positive slope of ≈4 µm per degree. The correlations of the 5th and 95th percentiles show that the distribution of ED in ML cirrus is broader, and smaller EDs are more frequently observed with decreasing latitude. HL cirrus contain a lower IWC; however, no significant correlation with latitude is noticed in Fig. 2c. The range of values agree well with the findings by Schiller et al. (2008) for the Arctic and mid-latitudes. Voigt et al. (2017) also reported IWC between 10−6 and 0.2 g m−3, with a high variability during the ML-CIRRUS campaign at mid-latitudes in spring.
The cirrus properties from our measurements agree well with observations from previous campaigns. Brown and Francis (1995) and Heymsfield et al. (2010, 2013) found, in general, similar median values of N and IWC (mainly at mid-latitudes and the tropics). However, Brown and Francis (1995), for example, only included data from forward-scattering probes. Here we use also the CIPgs and PIP, which have higher sample volumes. For this reason, we also measure lower IWC than 0.001 g m−3. In general, our results also agree with those reported by Krämer et al. (2016, 2020) and Luebke et al. (2016) at mid-latitudes, but the larger EDs that result from our analysis are due to the addition of the PIP data and due to different sizing methods applied in the calculation of the diameter from the CIPgs images. Here, we consider the maximum dimension of the ice crystals and not the area-equivalent diameter. The lower N observed in HL cirrus compared to ML cirrus is consistent with the observations from Wolf et al. (2018). Marsing et al. (2023) showed averaged IWCs (0.003 and 0.005 g m−3) of two case studies during the POLSTRACC (Polar Stratosphere in a Changing Climate) campaign, which is in line with our measurements at high latitudes.
According to our measurements, the combination of higher N and smaller ED ice crystals is characteristic for ML cirrus. The cause of that can be manifold; more anthropogenic activities, including aviation, at mid-latitudes result in higher aerosol and ice nuclei loads in the upper troposphere. Gayet et al. (2004) also found higher N and lower ED in the more anthropogenically influenced Northern Hemisphere with respect to the more pristine Southern Hemisphere. Aviation-induced cirrus tend to have high number concentrations and lower ED for several hours after their formation (Voigt et al., 2017; Schumann and Heymsfield, 2017; Schumann et al., 2017). In general, it is difficult to distinguish aged contrails from thin natural cirrus unaffected by aviation (Li et al., 2022) or embedded contrails in natural cirrus (Unterstrasser et al., 2017a, b), in particular, as the influence of air traffic over Europe is omnipresent (Voigt et al., 2017; Schumann and Heymsfield, 2017).
In contrast to the ML cirrus, we often find that HL cirrus have lower N but larger ED, which could be attributed to the uptake of the ambient water vapour by few INPs and the further growth of a smaller number ice crystals that thus allow larger sizes. The resulting number concentration of the ice crystals depends on the temperature, the updraft, and the number of INPs, as well as their capability to nucleate ice (Kärcher et al., 2006). Wolf et al. (2018) also found lower N at high latitudes and identified higher concentrations of INPs at the mid-latitudes compared to the Arctic as a possible explanation. Beer et al. (2022) analysed global model simulations under cirrus formation conditions and showed higher number concentrations of INPs (about 0.1 cm−3) and higher number concentrations of newly formed ice crystals (about 0.001 cm−3) between 30–60∘ N compared to 60–90∘ N. However, a confirmation from airborne measurements of INPs is very challenging, as measurements in the cirrus regime with temperatures lower than −38 ∘C are very scarce. DeMott et al. (2003, 2010) reported different measurements of ice particle residuals at temperatures and showed a large variability in INP number concentrations, depending on regional and seasonal changes in the aerosol sources. Typically, mineral dust particles are found to have a high nucleation efficiency (DeMott et al., 2003), and black carbon (BC) particles from anthropogenic sources also act as INPs. In particular, the importance of aviation soot particles as ice nuclei is not yet well determined. A number of studies investigated the aviation soot impact on cirrus and showed a large range of possible model results, evidencing the uncertainty that exists in this regard (Hendricks et al., 2011; Gettelman et al., 2012; Zhu and Penner, 2020; Righi et al., 2021).
A comparison between the temperature profiles of ED and N in ML (red) and HL (blue) cirrus is presented in Fig. 3 and sorted in 2.5 ∘C temperature bins. We show the temperature along the vertical axis as a representation of altitude. In Fig. 3a, we observe a clear decrease in the ED with decreasing temperature for both ML and HL cirrus. Both profiles cover a similar temperature range and correspond to altitudes between 8.5 and 13.5 km, with fewer measurements at high latitudes. The same decrease in the ED is also observed as a function of altitude. This effect has already been observed in previous studies and can be explained by reduced atmospheric water content at lower temperatures (or higher altitude), together with the different altitudes at which in situ and liquid origin cirrus exist (Luebke et al., 2016; Wernli et al., 2016). With increasing altitude (decreasing temperature), cirrus origins change from cirrus dominated by the liquid origin regime with larger ice particles to in situ origin cirrus with smaller particles (see also Voigt et al., 2017). This is expected, due to the low-altitude origin of the liquid origin cirrus (Luebke et al., 2016). Larger particles can also be found at higher temperatures (lower altitude) resulting from sedimentation processes.
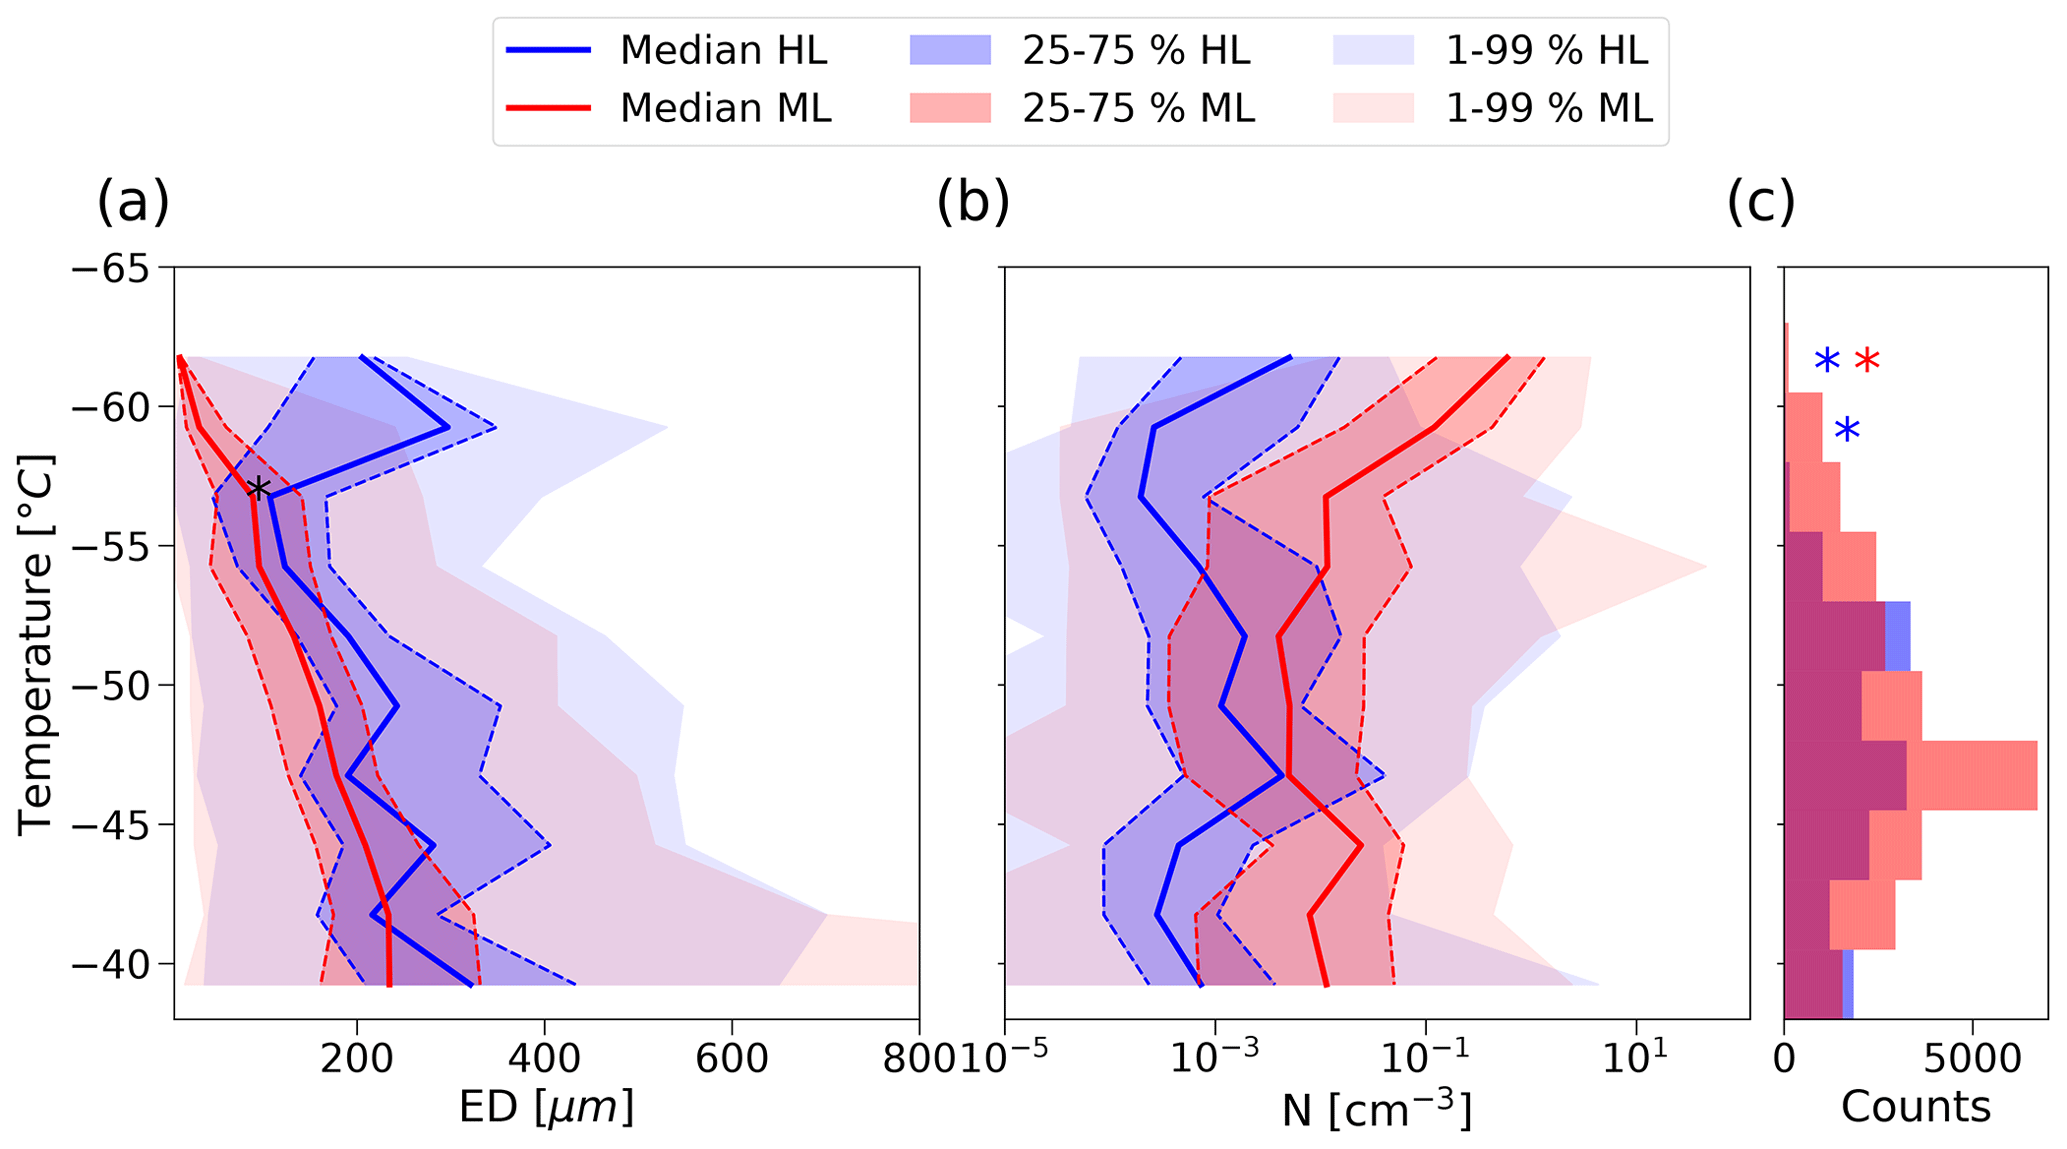
Figure 3Distribution of (a) ED and (b) N observations sorted in temperature bins of 2.5 ∘C for ML (red) and HL cirrus (blue) and (c) a histogram of the total frequency of observations per temperature bin for each group. The thicker solid lines correspond to the median values per temperature bin. The dark shaded areas between the dashed lines comprise the 25th and 75th percentiles of the population. The lighter shaded areas mark the extension between the 1st and 99th percentiles. The black asterisk indicates a low statistically significant difference between medians. Blue and red asterisks indicate low statistics in HL and ML data, respectively (see the text for further details).
Between −50 and −38 ∘C, we find a remarkable difference between the 25th and 75th percentiles in the ED between ML and HL cirrus. This fact probably indicates a more dominant influence of liquid origin cirrus at the high latitudes with enhanced sedimentation as a result of the larger particles at these latitudes. From the temperature profiles, we can confirm the larger EDs observed at high latitudes in the general picture of Fig. 2b. Higher EDs in HL cirrus compared to ML cirrus are observed in almost all temperatures. To confirm this finding, we use the U test according to Wilcoxon, Mann, and Whitney (mannwhitneyu function from the Python sub-package scipy.stats) to assess whether there is a statistically significant difference between the ML and HL medians per temperature bin for ED (and also for N). The null hypothesis that the distributions are equal was rejected for all cases with p value , except for the ED medians between −58 and −55.5 ∘C with a p value =0.028. Therefore, we conclude that the observed differences are statistically significant. Between −45 and −38 ∘C at mid-latitudes, we observe high ED values in the 1st to 99th percentiles. These events are connected to isolated convective systems over Germany, with an enhanced growth of the ice particles.
Contrary to the ED, N does not show a clear tendency with decreasing temperature in either case. However, the N in ML and HL cirrus differ at all temperatures by about an order of magnitude, which is more pronounced at lower temperatures. However, the ML cirrus coldest temperature bin, which mostly contains high N, has reduced statistics with a total of 119 2 s samples measured from four different cloud sequences. Between −62 and −55 ∘C, there is an enhancement of N in ML cirrus associated with a steeper decrease in ED, which is probably connected to contrail formation. According to Bräuer et al. (2021a), contrail conditions are favourable between −50 and −60 ∘C. Here contrails have the highest extinction coefficients. This corresponds to altitudes between 9.5 and 11 km, where short- and medium-range commercial flights are typically located. Contrails are frequently present in ML cirrus above central Europe. Here, we mostly find high N and low ED around −55 and −60 ∘C in our data set. High N values () in the other temperature ranges are rare and represented by the outliers, which do not impact the medians. Measurements of HL cirrus below −55.5 ∘C are less representative, with 210 counts in total. In particular, between −63 and −60.5 ∘C, we find 22 2 s consecutive samples from the same cloud sequence. Between −60.5 and −58 ∘C three different cloud sequences were probed, with a total of 40 counts. Fluctuations in ED in HL in these temperature ranges in Fig. 3a can thus be explained by the reduced statistics.
In addition, we examined whether part of the cirrus were measured in the stratosphere, as stratosphere-penetrating extratropical convection is most likely to occur during summer (Dessler, 2009). In addition, the tropopause (TP) height vary strongly between 35 and 50∘ N, and the cirrus measurements of high and mid-latitudes could be differently distributed with respect to the TP height (Dessler, 2009). In order to derive the altitude of the cirrus measurements with respect to the TP, the TP height was extracted from the data set Hoffmann and Spang (2021), and the definition used was from the WMO (World Meteorological Organization), which includes the first TP height from ECMWF's reanalysis ERA5 data (Hoffmann and Spang, 2022). The absolute frequency distribution of the HL and ML cirrus altitudes with respect to the TP is shown in Fig. S2 and reveals similar profiles between mid- and high latitudes. From all data points, 2.6 % were measurements above the TP, with only 0.2 % belonging to HL cirrus, and most of the measurements were performed in the upper troposphere at around 1 km below the TP. We do not observe a substantial influence of stratospheric clouds, and there is an even smaller contribution at high latitudes.
4.2 Relating ice cloud microphysical properties to the location of cloud formation
The main approach of this study is the analysis of cirrus microphysical properties, depending on their latitude. So far, we have classified the data in ML and HL cirrus using a latitude threshold at 60∘ N regarding the measurement point. Now, we investigate the meteorological conditions at the time of cirrus formation and how they affect the observed microphysical properties. Following this strategy, we obtain the following four categories: cirrus formed and measured at mid-latitudes (M–M), cirrus formed at mid-latitudes and measured at high latitudes (M–H), cirrus formed at high latitudes and measured at mid-latitudes (H–M), and cirrus formed and measured at high latitudes (H–H). Examples of backward trajectories for each group are shown in Fig. 4. The H–M cirrus is excluded from the analysis, as it only contains 36 data points, and all of them are just at the limits of the boundaries (see Fig. 5). In Fig. 4, the points with IWC>0 in the trajectory before the purple star indicate a previous formation of ice within the air parcel which evaporated later.
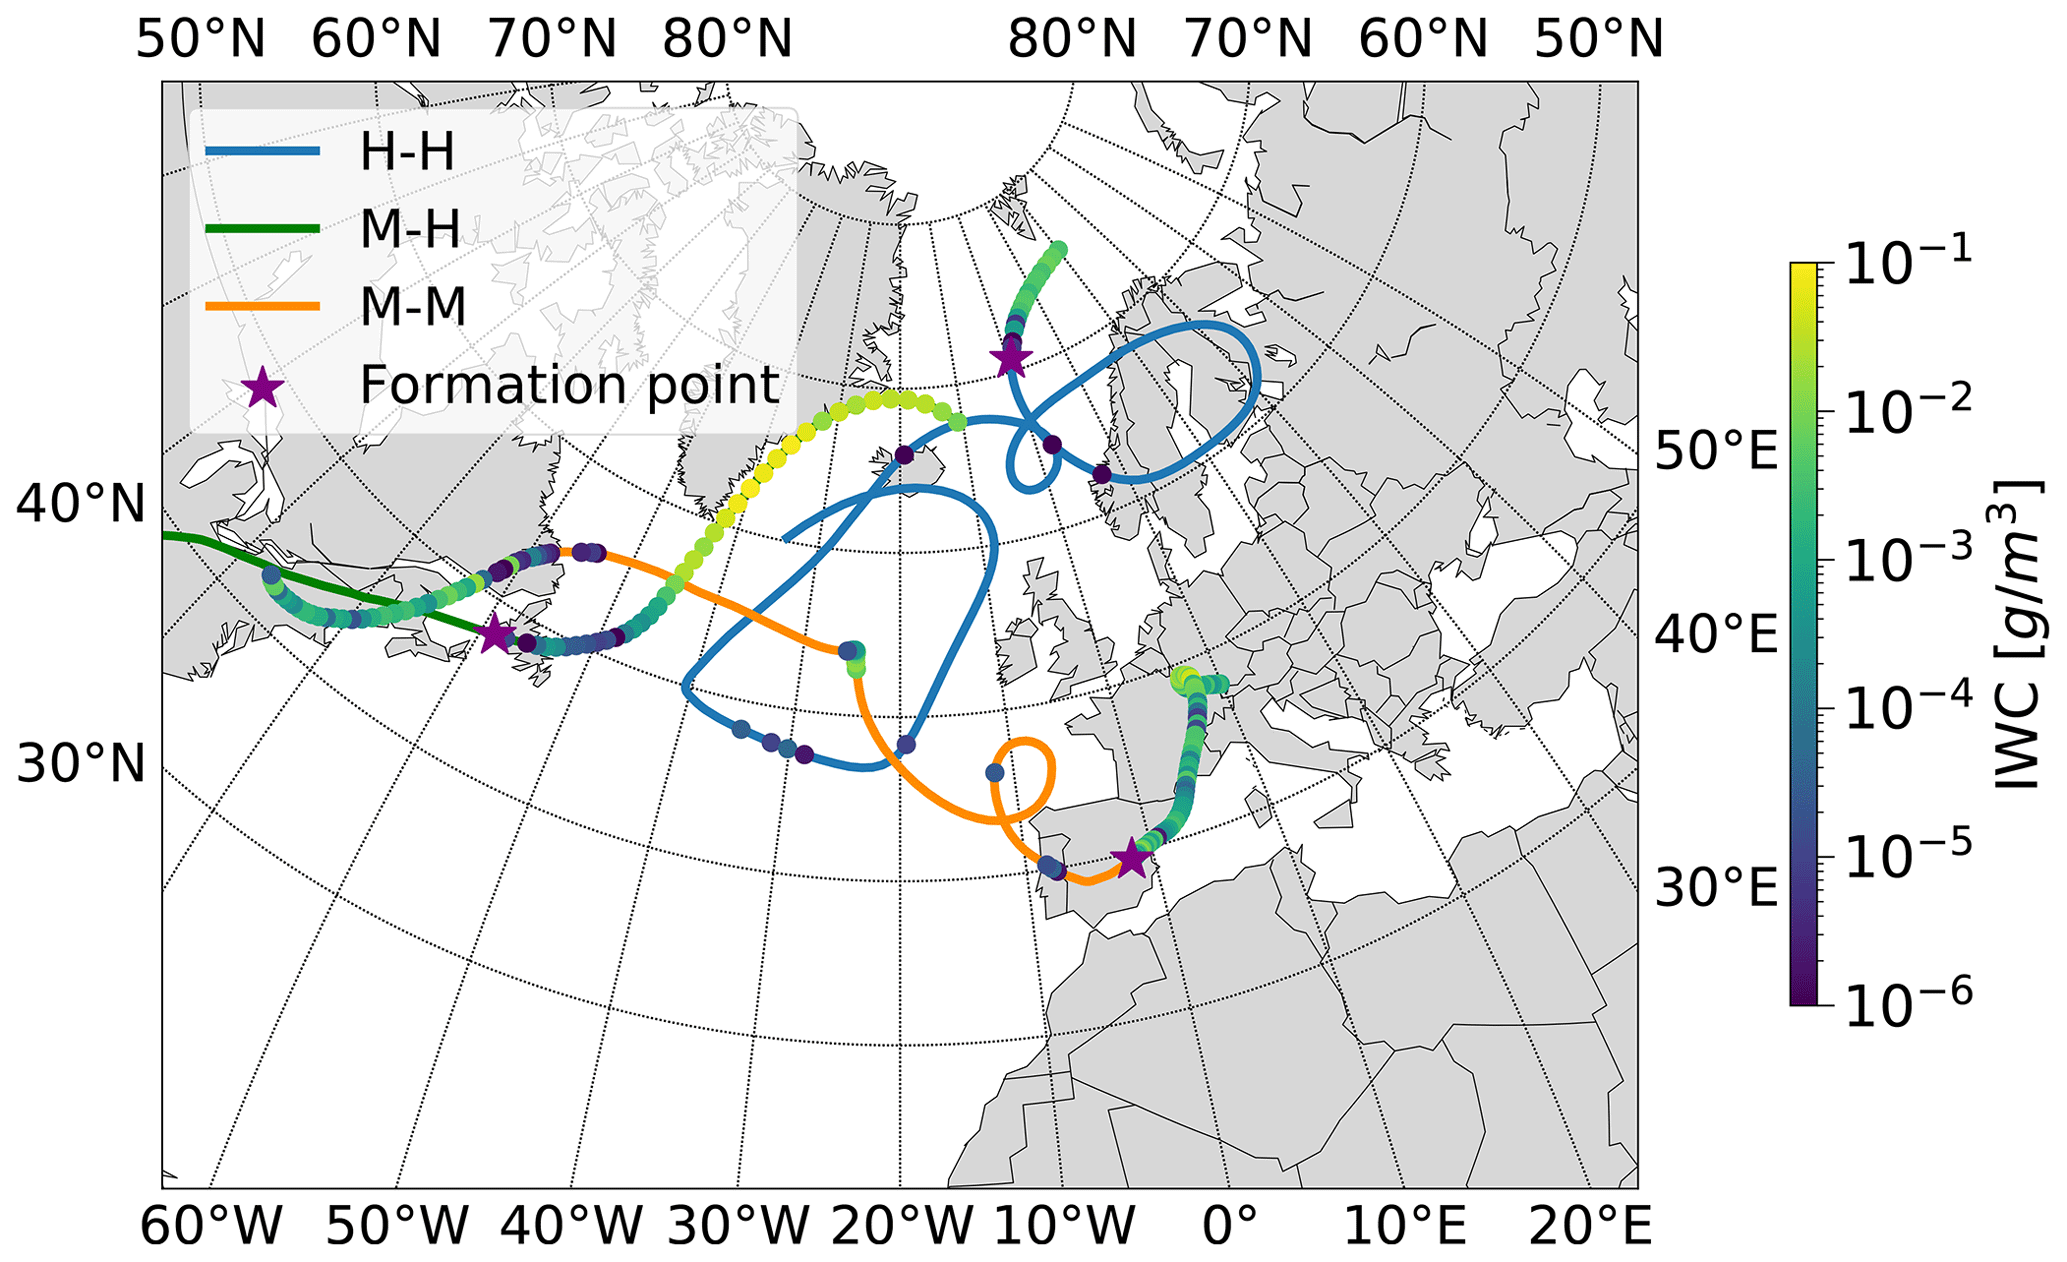
Figure 4IWC (colour coded) along three example trajectories from the cirrus classifications of formation and measurement at high latitudes (H–H, blue); formation at mid-latitudes and measurement at high latitudes (M–H, green); and formation and measurement at mid-latitudes (M–M, orange). The formation point is indicated with a purple star.
Figure 5 shows the distribution of 2 s measurements for the four categories delimited by the 60∘ N threshold and colour coded according to ED. The three important categories are M–M in the bottom left, M–H in the bottom right, and H–H in the upper right. Using this categorization, we separate the measurements previously classified as HL cirrus into cirrus formed at high latitudes (H–H) and cirrus formed at mid-latitudes and transported to high latitudes (M–H). The number of data points found in each category (4450 for H–H and 10 753 for M–H) indicates that the category M–H contributes more frequently to the Arctic cirrus observed in our measurement campaign.
It becomes evident that the distribution of the measured ED is connected with the latitude at the measurement point. Yellow colours represent high EDs of up to 1000 µm, and the dark purple dots represent EDs of about 10 µm. Higher occurrences of smaller particles are measured in ML cirrus and higher occurrences of larger particle sizes are found in HL cirrus. The differences are smaller when looking at the latitude of the formation of cirrus measured in high latitudes. We can conclude that the measurement location has a larger influence on the particle size than the formation region.
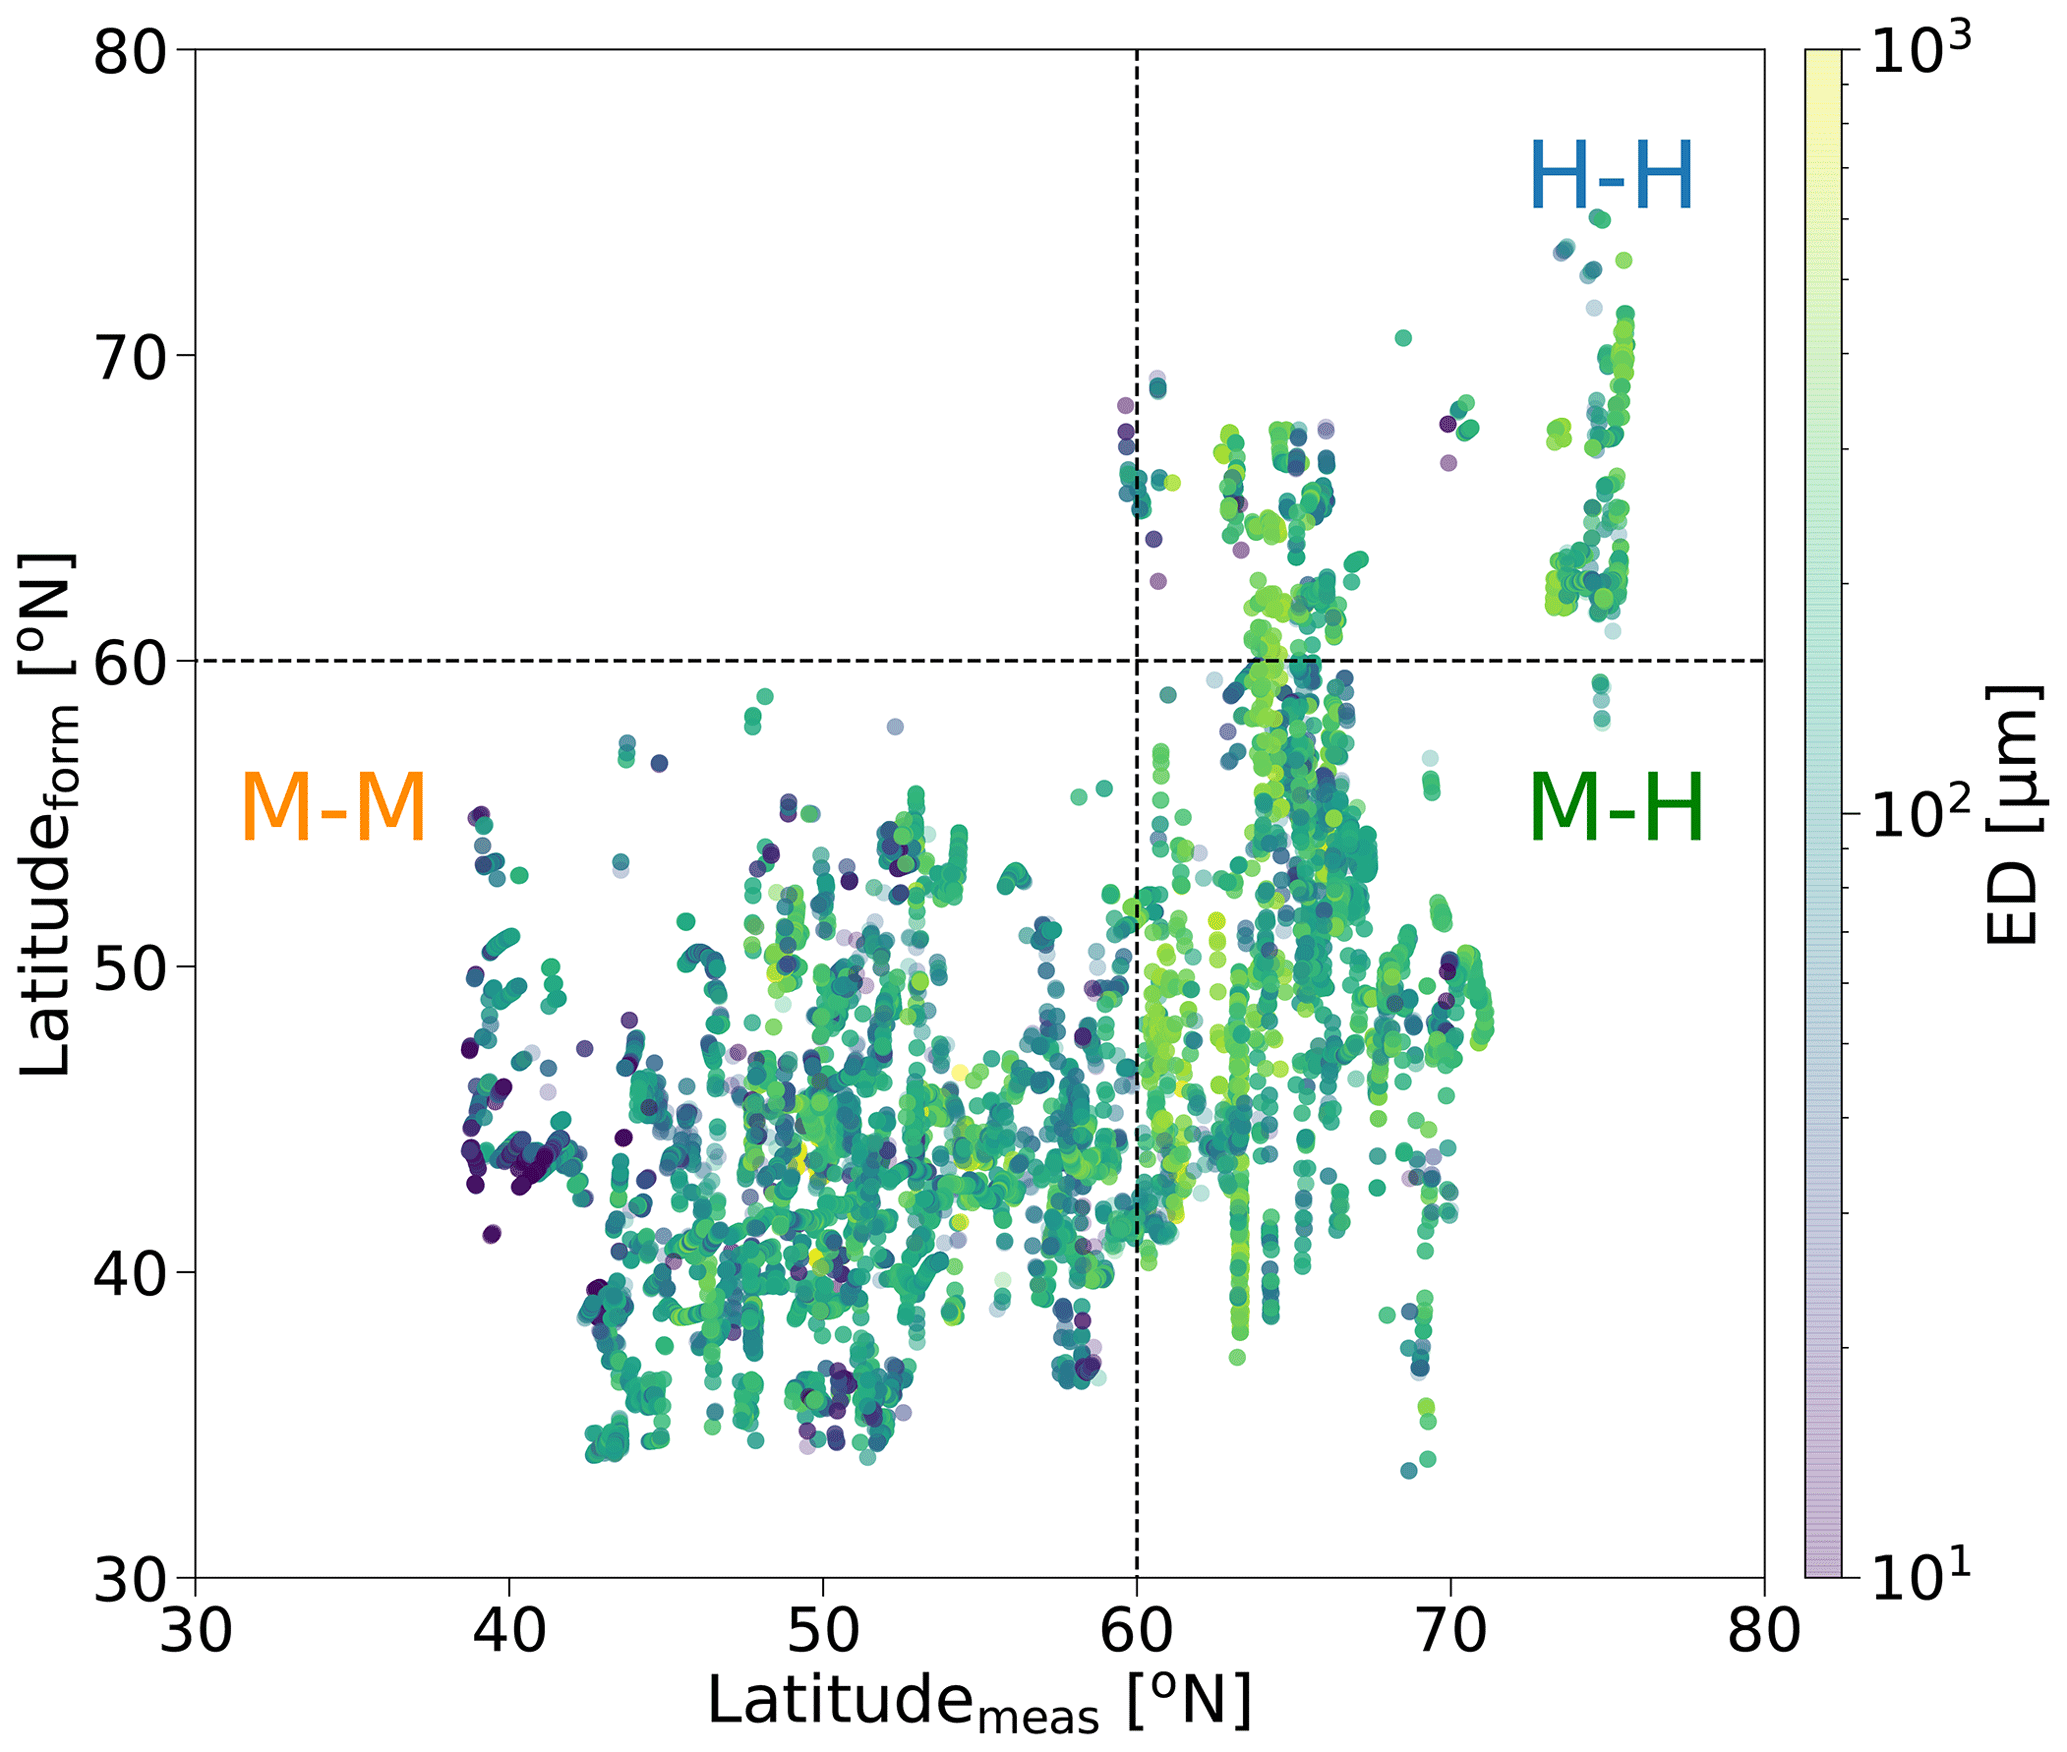
Figure 5Correlation of latitude at the formation and latitude at the measurement for 2 s measurement points. The colour indicates the associated ED. Four regions are delimited with dashed black lines and define the groups of H–H, M–H, and M–M (see the text for details).
In order to investigate in more detail how the cirrus properties depend on their source region, Fig. 6 illustrates the normalized frequency distributions of N, ED, and RHi of the three categories. The maximum of the N distribution of the M–M cirrus lies between 0.01 and 0.1 cm−3. In contrast, the highest probability in the H–H cirrus is shifted to significantly lower values between 0.0001 and 0.001 cm−3. The M–H cirrus distribution exhibits an intermediate behaviour. The medians reflect the same observation, with 0.0086, 0.0018, and 0.0004 cm−3 for the M–M, M–H, and H–H cirrus, respectively. The ED profiles in Fig. 6b show the opposite trend, as do the medians (164, 206, and 225 µm for M–M, M–H, and H–H cirrus, respectively).
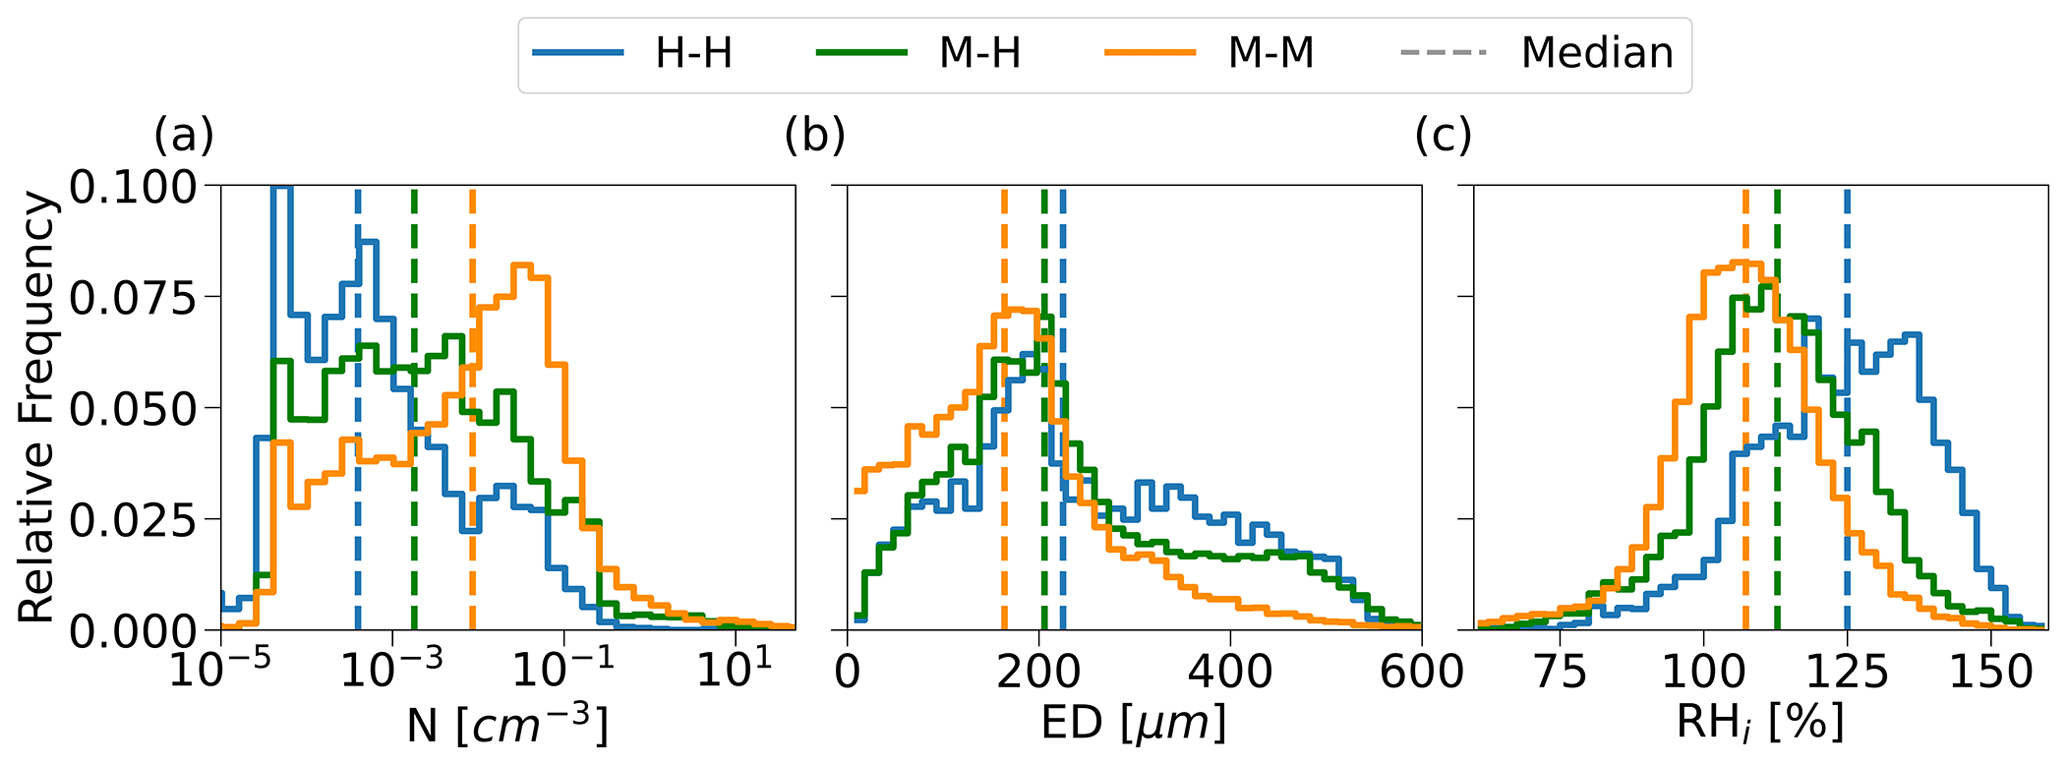
Figure 6Relative frequency distributions of (a) N, (b) ED, and (c) RHi of the cirrus formed and measured at high latitudes (H–H in blue), cirrus formed at mid-latitudes and measured at high latitudes (M–H in green), and cirrus formed and measured at mid-latitudes (M–M in orange). The distribution of N is given in logarithmic bins. Linear bins of 15 µm and 2.5 % width have been chosen for ED and RHi, respectively. The corresponding median values of each variable and category are depicted with dashed lines.
In addition, Fig. 6c shows the measured RHi for the three categories. In general, the tropopause region in summer 2021 had a high occurrence of supersaturation both at mid- and high latitudes. We observe a clear difference in the RHi distribution with lower RHi in M–M cirrus, with a median of 107 %, and higher values in the H–H cirrus, with a median of 125 %. This can be explained by the lower ice crystal concentrations at high latitudes due to the reduced availability of INPs. The relative humidity is not sufficient to homogeneously nucleate new particles, and instead, the small number of ice crystals available takes up the abundant water vapour that increases their size. On the contrary, water vapour at mid-latitudes is rapidly consumed by the availability of many ice particles present in the upper troposphere, which only leads to a moderate growth.
The M–M cirrus is 57 % of liquid origin and 43 % of in situ origin in our data set. Regarding HL cirrus, on the one hand we find that 90 % of the measurements corresponding to the M–H cirrus have a liquid origin with a larger cloud age. On the other hand, 86 % of the H–H cirrus data points are classified as in situ origin cirrus. Therefore, M–H cirrus were formed from the liquid phase in a ML environment rich in nucleating particles. Here many small particles were nucleated in a first stage. Then, the air parcels are advected northwards to high latitudes, bringing the clouds into a highly supersaturated atmosphere and allowing the formed ice particles to grow. Cirrus measured at high latitudes can be clearly distinguished from ML cirrus by the bimodality of the ED distribution. The bimodality of the ED distribution of M–H and H–H cirrus can be understood by two different processes; these are higher ice crystal growth at high latitudes due to the increased supersaturation, leading to the sedimentation of large ice crystals from the upper layers, or different nucleation times during their lifetime with an enhanced growth of the larger mode, due to fewer INPs and high supersaturation.
These findings together clearly show an influence of the ML origin in the development of cirrus at high latitudes, which conserves the microphysical properties of the ML cirrus while being transported to higher latitudes. In this way, the formation region influences and defines the initial ice crystal properties, which then mix or are modified during their lifetime due to the different atmospheric conditions. Thus, the largest fraction of clouds observed during CIRRUS-HL originate from the mid-latitudes and, through long-range transport, modify the HL cirrus. Opposite influences from high to mid-latitudes have not been observed.
We can conclude that latitudinal differences in microphysical parameters are better understood when looking at both the location of the ice crystal formation and the location of the measurement. The region in which the ice crystals are formed influences the initial cirrus properties, in particular the initial N. The latitude at which the cloud particles were measured determines the resulting state of the measured ice crystal properties, which is strongly influenced by the RHi throughout the cirrus life cycle and mainly affects the measured ED. Both processes are largely influenced by the updraft on small and large scales, which are discussed below.
4.3 Liquid and in situ origin cirrus at mid- and high latitudes
Some of the differences in the microphysics of the cirrus measured during CIRRUS-HL discussed in Sect. 4.1 could be attributed to a greater or lesser presence of in situ or liquid origin cirrus at mid- or high latitudes. Here, we classify the measurements making use of the information on LWC and IWC along the backward trajectories after the formation of ice in the cloud, as described in Sect. 3.2.2. We obtain the following four groups with this division: in situ origin HL cirrus, liquid origin HL cirrus, in situ origin ML cirrus, and liquid origin ML cirrus.
The frequency of measurements of each group and their microphysical properties in terms of ED and N are presented in Fig. 7. Liquid origin cirrus were frequently measured at mid-latitudes and were also the dominant type at high latitudes. Liquid origin HL cirrus were observed almost as frequently as the in situ origin ML cirrus. In situ origin HL cirrus, in turn, were the least measured. However, isolated rare events are not well represented in the diagrams, due to the calculation of contours by interpolation.
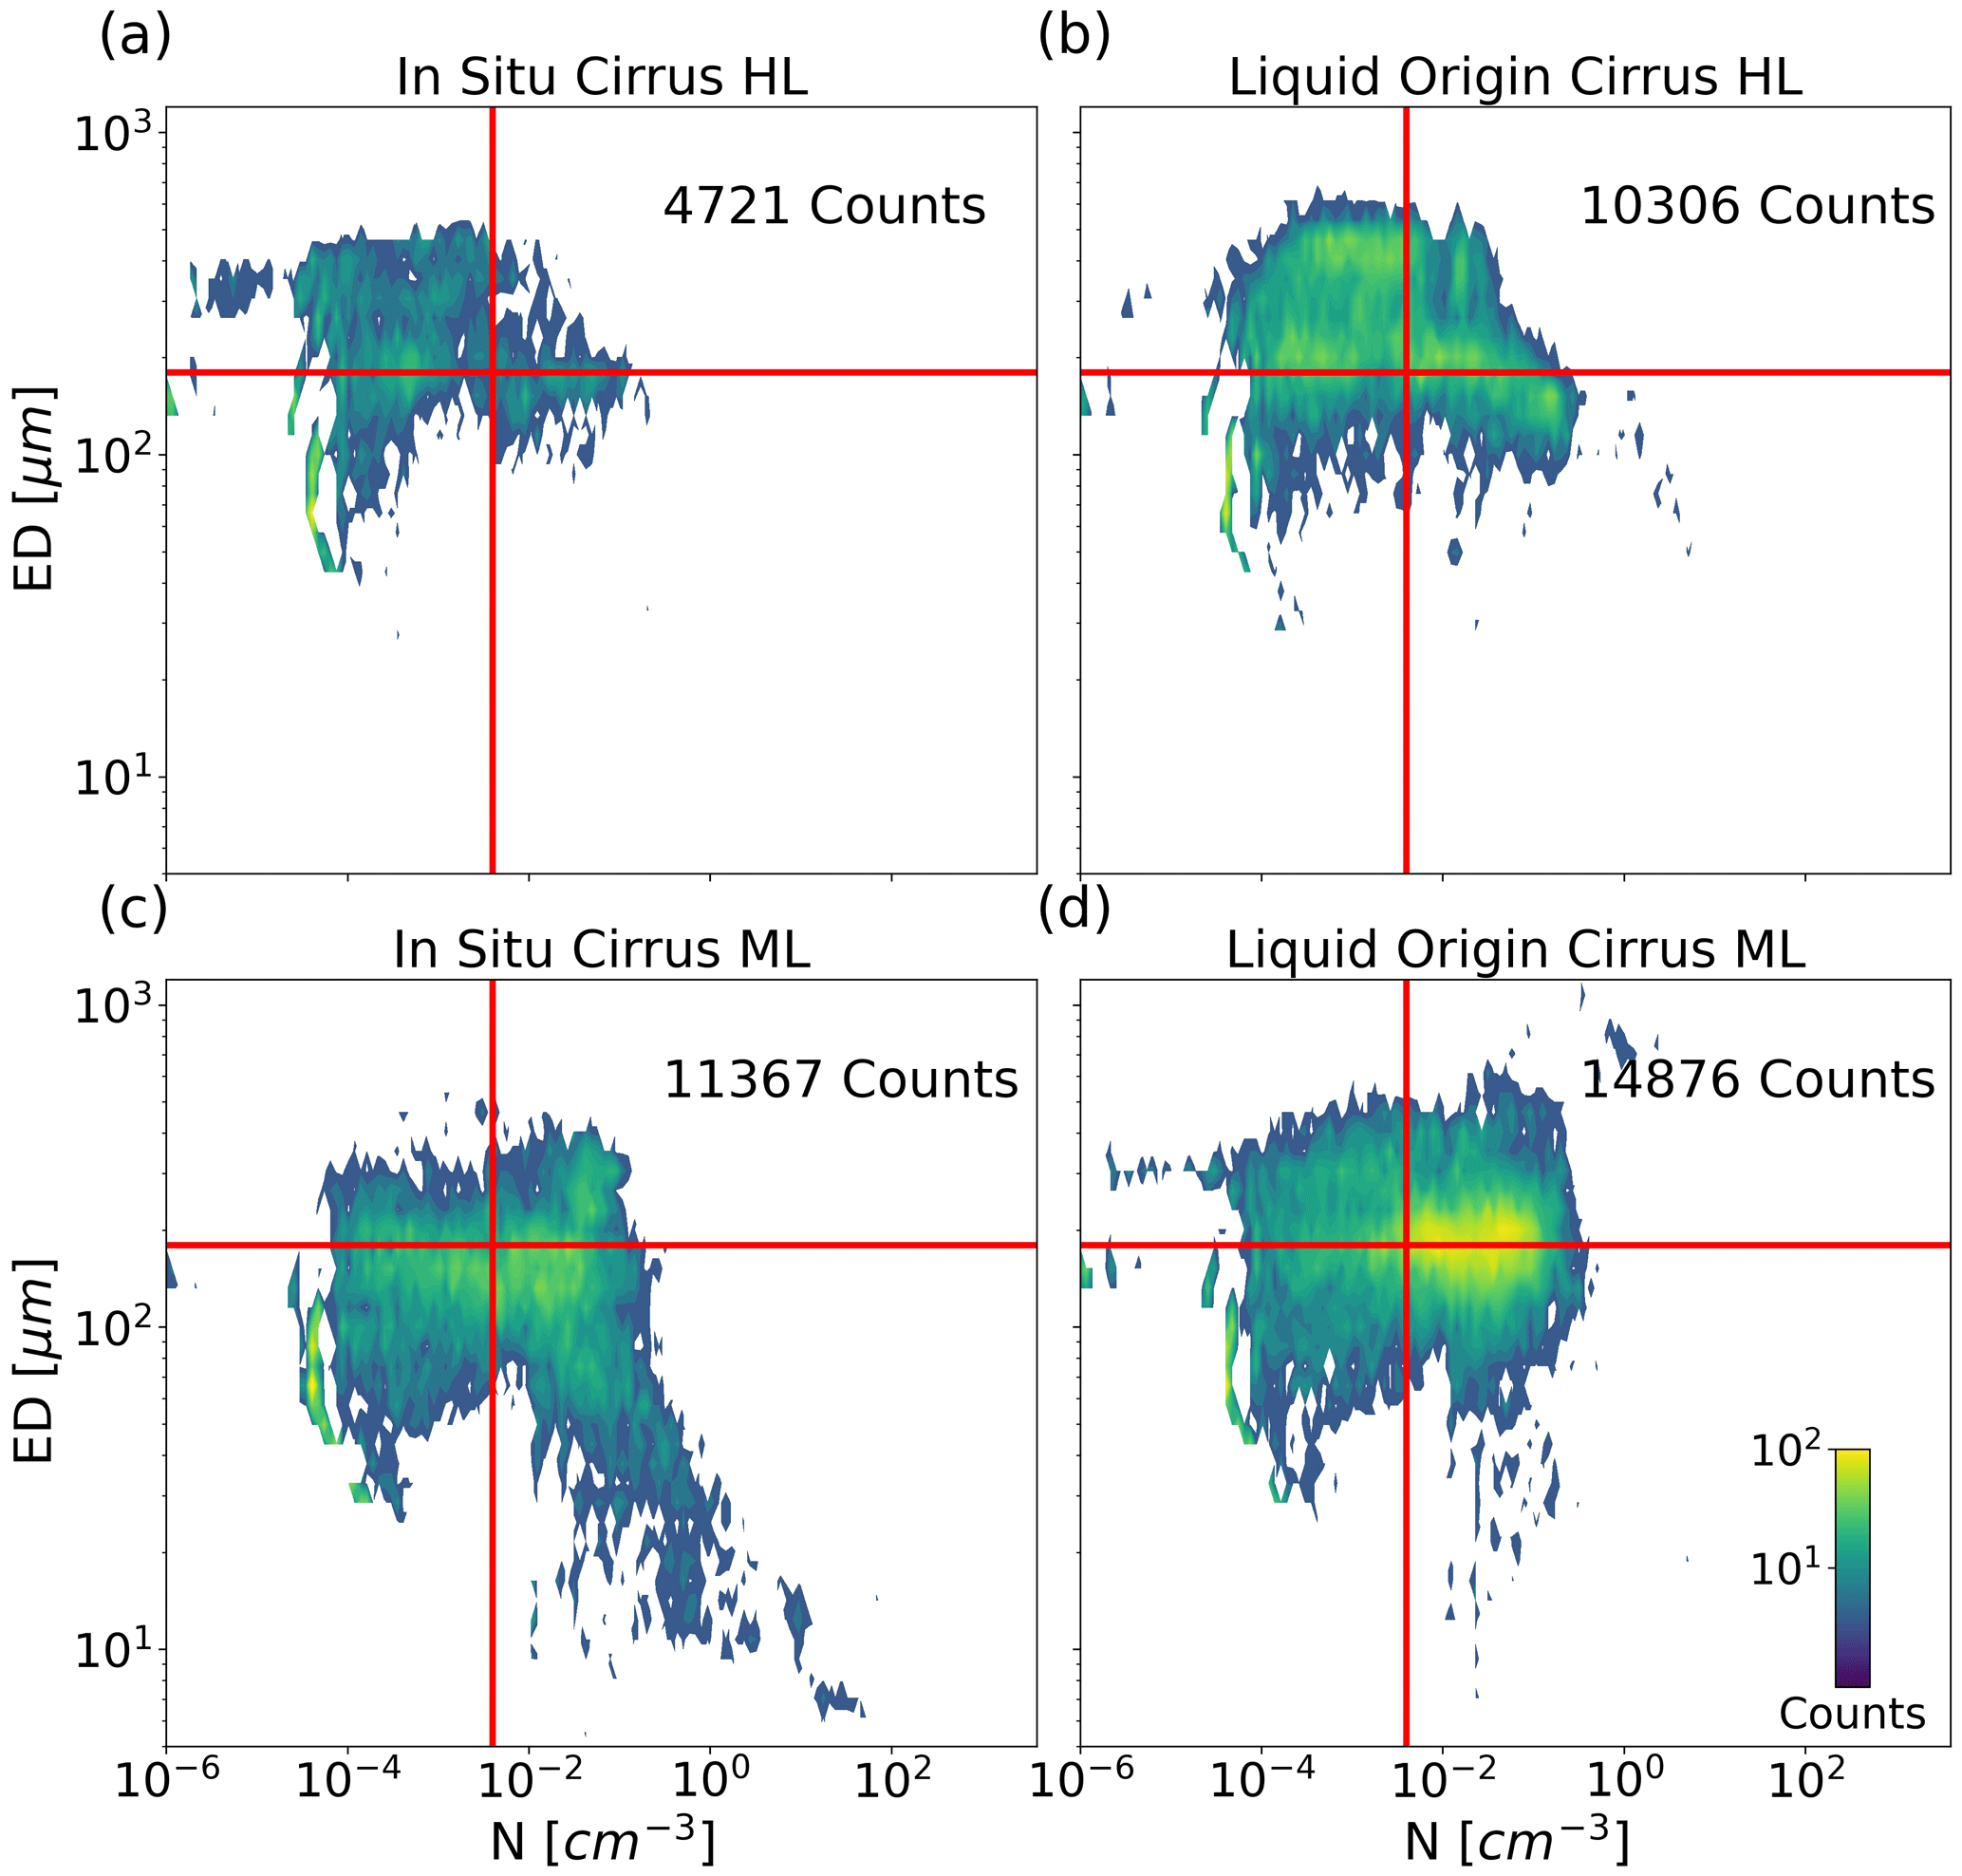
Figure 7Frequency of ED observations in counts as a function of N. The observations are separated into (a) in situ origin HL cirrus, (b) liquid origin HL cirrus, (c) in situ origin ML cirrus, and (d) liquid origin ML cirrus. The method to draw the contours uses a marching squares algorithm. Vertical and horizontal solid red lines indicate the overall median values of ED and N, respectively, and are shown to better illustrate differences. The total number of 2 s data points are given in the upper right corner of each panel.
Larger particles than the total ED median value (180 µm) were found in both cirrus types at high latitudes, with larger values for liquid origin cirrus. In situ origin HL cirrus were rather thin, with N often under 0.004 cm−3, which is the median value of all data. The ED distribution of both cirrus types at high latitudes exhibits two distinct maxima, as seen in the M–H and H–H cirrus in Fig. 6b. Large EDs representative of liquid origin cirrus are present in mid-latitudes, with some outliers of high EDs and high N in convective cells also involving precipitation particles. However, smaller EDs than the median, even for the liquid origin cirrus, are more frequent at mid-latitudes.
The observations at high latitudes generally agree well with the measurements in the Arctic from Wolf et al. (2018). However, high number concentrations are not found in our in situ origin HL cirrus, in contrast to Wolf et al. (2018). The reason is that their measurements of Arctic in situ origin cirrus were dominated by homogeneous nucleation events driven by high updraft motions. Our analysis of the updraft speed along the backward trajectories and the measured vertical velocities indicate rather low vertical velocities. Specific information on the updraft speeds along the backward trajectories of each of the four categories can be found in Fig. S3. In addition, orographic cirrus were not a target of the campaign, and therefore, we do not expect mountain wave cirrus with high number concentrations. We assume that mainly heterogeneous nucleation defined the cloud formation in our data set. However, it should be noted that the temporal resolution of the parameters calculated along the trajectories is 1 h, and therefore, the effects on the updrafts from small-scale fluctuations and turbulence are not taken into account here. The prevalence of heterogeneous freezing was also shown by Froyd et al. (2022) at mid- and high latitudes in the Northern Hemisphere during spring and summer, due to the suppression of homogeneous nucleation by intense dust emissions. Saharan dust emissions were forecasted and reported during the campaign, but their influence on cirrus formation have not been investigated in this work.
Greater differences are found among the in situ origin cirrus. While in situ origin ML cirrus have higher N with smaller ED, mainly between 70 and 250 µm, in situ origin HL cirrus are mostly composed of low number concentrations that have large particles with ED between 150 and 450 µm. As for the ED medians, the values of liquid origin cirrus change from 188 µm at mid-latitudes to 220 at high latitudes, while the in situ origin cirrus change from 128 at mid-latitudes to 189 µm at high latitudes. We also draw the reader's attention to a feature in the bottom-right square of Fig. 7c of in situ origin ML cirrus, which differs from the in situ origin HL cirrus observations. Although we did not quantify the contribution, we identified high concentrations of small particles connected to young contrails, aged contrails, contrail cirrus, or embedded contrails in natural cirrus. This feature is also weakly present in Fig. 7d of liquid origin ML cirrus but substantially less pronounced. We discuss the aviation influence in more detail in Sect. 5.2.
Our previous analysis in Sect. 4.1 already suggested that ML cirrus are more affected by contrail cirrus. As in Li et al. (2022), we observe that in situ origin cirrus are more strongly influenced by contrails than liquid origin clouds. Liquid origin clouds are formed at lower altitudes, where liquid droplets and ice crystals can coexist. Ascending motion, isobaric mixing, or radiative cooling can reduce the temperature in the cloud with a subsequent increase in relative humidity. The Wegener–Bergeron–Findeisen (WBF) process leads to the growth of the ice crystals by water vapour uptake from the evaporated liquid droplets and finally to the complete glaciation of the cloud (Korolev, 2007; Costa et al., 2017). The evolution of the liquid origin cirrus has sufficient time to consume the available water vapour when the cloud reaches the cirrus regime. Li et al. (2022) found that the Schmidt–Appleman criterion for contrail formation (SAC) is mostly not fulfilled in liquid origin clouds due to the warmer temperatures at which they are located. Therefore, it is more difficult to find the appropriate conditions for a contrail to develop within a liquid origin cloud.
On the contrary, in situ origin cirrus form directly at high altitudes, where air traffic is also present. If we imagine a scenario in which an in situ origin cloud starts forming heterogeneously by the deposition of water vapour on INPs and an aircraft exhaust jet is introduced, then the natural ice particles to be formed would be substituted by the freshly formed contrail that will severely affect the resulting microphysical properties. Contrail formation within cirrus can increase the cirrus ice crystal number by a few orders of magnitude (Schröder et al., 2000; Voigt et al., 2017; Schumann et al., 2017), in particular if the pre-existing cirrus has high ice water content and the supersaturation is low (Verma and Burkhardt, 2022). In this sense, we can expect an influence of contrail formation and growth on the formation process of in situ origin cirrus at cruise altitudes by an increase in the N and reduction in ED.
Additional information on the properties of the cirrus groups is given by their particle size distributions (PSDs). Knowing the ice crystal size distribution is vital, in order to derive the radiative impact of cirrus. The representation of PSDs of the four groups is not a trivial task in this case. We usually find, in other publications, the mean PSD being representative of a considered data set. However, our campaign deals with a wide variety of situations, including outliers, which were in fact infrequently observed but that strongly dominate the mean. These events are, in our case, contrails and convection encounters. This implies that the mean PSD fails to identify the averaged behaviour in the group, and the use of medians appears to be a better choice for this case. However, due to the low concentrations in cirrus and the lower sampling efficiency of the CDP compared to the CIPgs and PIP, the lower bins are frequently empty in the 2 s sampling rate and do not allow a median value calculation. Therefore, we increase the averaging intervals to 180 s to calculate the median concentration in each size bin. Sensitivity analyses were performed to select the 180 s averaging interval.
The calculated PSD median values are shown for each cirrus group in Fig. 8a and the means in Fig. 8b are also included for comparison. The median concentrations in each bin of the liquid origin cirrus are higher than for the in situ origin cirrus for particles >20 µm at both mid- and high latitudes, and the former covers a larger size range than the latter, which is consistent with previous observations (Krämer et al., 2016; Luebke et al., 2016). The median PSDs of liquid and in situ origin ML cirrus have higher concentrations than HL cirrus. Both ML cirrus profiles have the same behaviour in the smaller bin range (2–100 µm), and they differ in the larger sizes. The liquid origin cirrus reveal a second mode, which is slightly less pronounced than at high latitudes, and the in situ origin ML profile decays fast without a second mode.
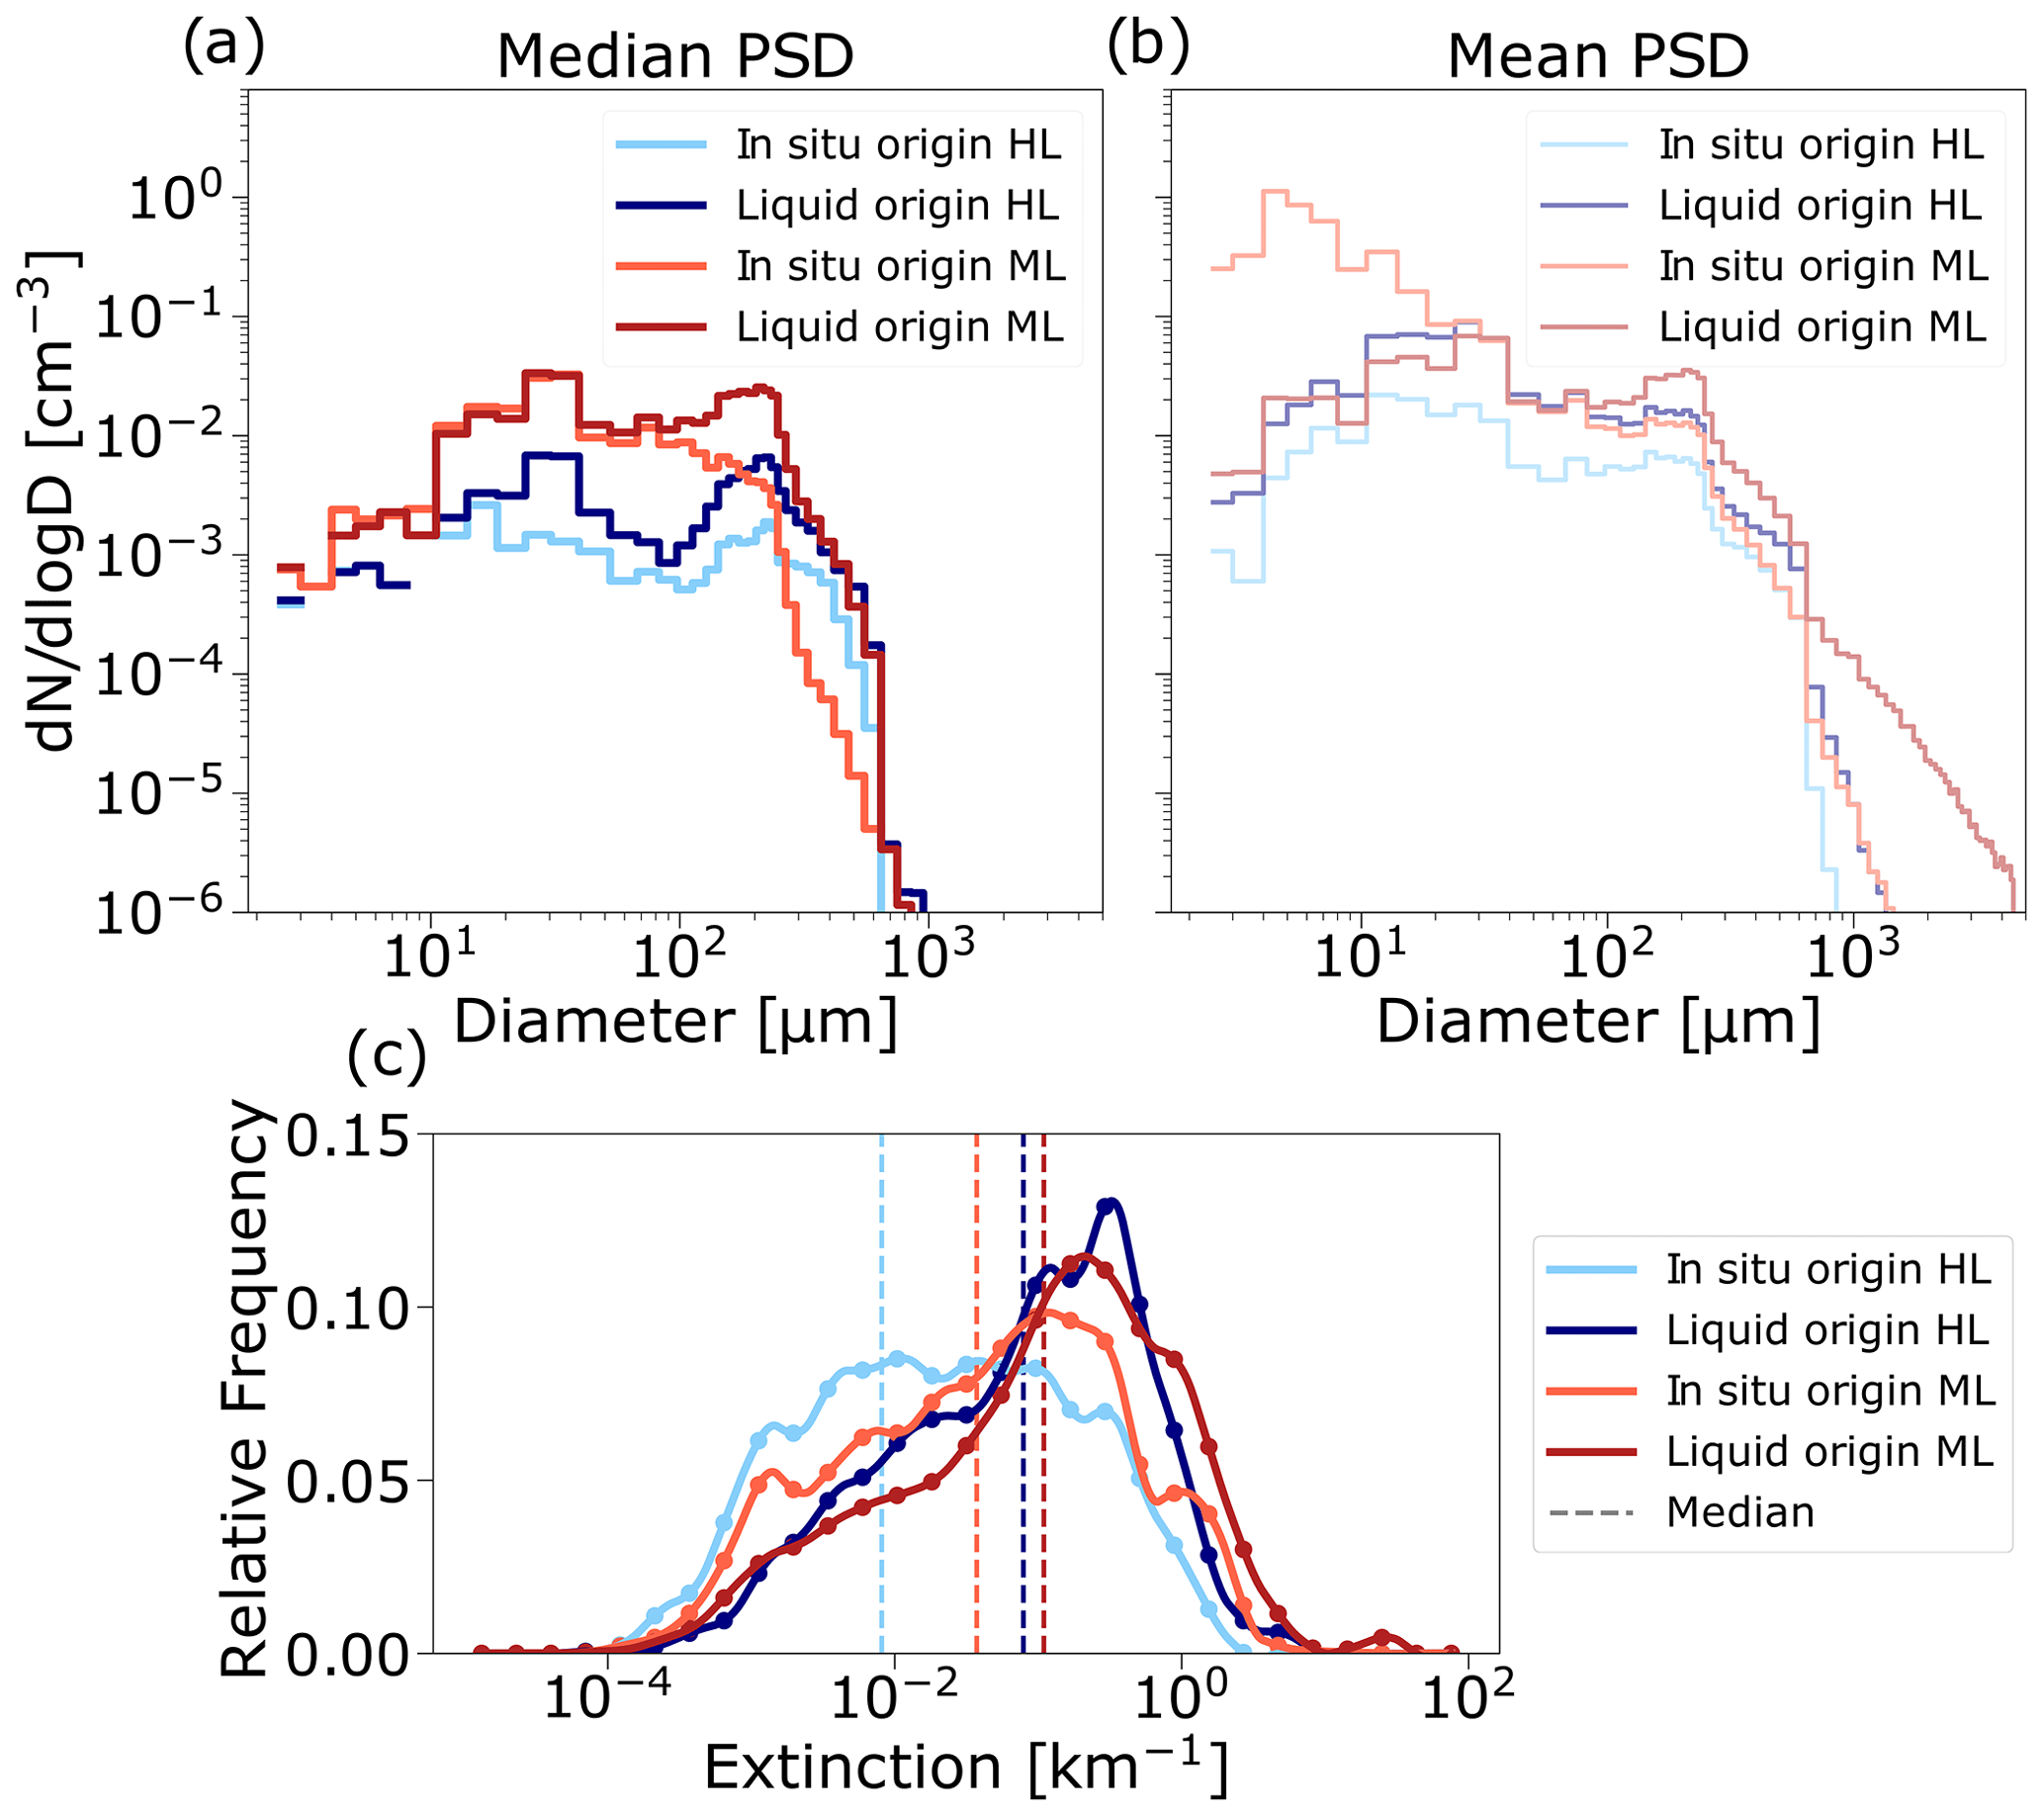
Figure 8(a) Median, (b) mean particle size distributions (PSD), and (c) extinction coefficient (βext) of the following groups: in situ origin HL cirrus (light blue), liquid origin HL cirrus (navy), in situ origin ML cirrus (light red), and liquid origin ML cirrus (dark red). Median PSDs are indicated with thick lines and means with thinner lines. The frequency of occurrence of βext was calculated in logarithmic bins and fitted with B splines.
As for the mean values, we detect two clear outlying features. First, the size range in liquid origin ML cirrus is larger, which is a consequence of the isolated convective events that were encountered. Second, the large number concentrations of small crystals for the in situ origin ML cirrus clearly show that the microphysics of in situ origin ML cirrus were affected by contrails. The difference in the concentration of the lower bins (from 2 to 10 µm) between the median and the mean is about 2 orders of magnitude. Then, the mean concentration decays and almost converges with the median at about 40 µm. In general, the median PSDs exhibit lower concentrations than the means in all bins for the four groups, which is expected due to the right skewness of the lognormal distribution. The mean and median show that the larger the differences, the more outliers there are in the distribution. The PSDs of the in situ and liquid origin HL cirrus show a weaker influence of outliers, as the medians profiles do not differ much from the means.
In Fig. 8c, we show another way to represent the radiative impact of cirrus through βext, which is often used to assess the climate impact of contrails (Bräuer et al., 2021a; Voigt et al., 2021). For a certain IWC, the extinction is larger when the ice mass is distributed in smaller crystals (Unterstrasser and Gierens, 2010). We observe higher extinction coefficients for the liquid origin cirrus at HL and ML, with a slightly higher median for ML, when compared to the in situ origin cirrus. This is expected, due to the higher IWC of the liquid origin cirrus. The lowest extinction corresponds to the in situ origin HL cirrus, since the N is lower, and the ice particles are larger, which reduces the extinction and the radiative impact. In line with the PSDs, here we also see a stronger difference between the in situ cirrus at HL and ML with a shift to larger extinctions at ML. In addition, both frequency distributions of ML cirrus show a small mode at 1 km−1, which is frequently observed in young contrails (Febvre et al., 2009; Voigt et al., 2011; Gayet et al., 2012; Bräuer et al., 2021a).
The increased humidity in the upper troposphere during the campaign period can contribute to more persistent contrails, which can be particularly warming (Wilhelm et al., 2022; Teoh et al., 2022; Wang et al., 2023). However, the potential contrail cirrus cover is the lowest during summer over Europe (Dischl et al., 2022). The increase in air temperature in summer hinders the formation and persistence of contrails, and their radiative effect is mostly cooling because of the increased Sun hours in summer in the North Atlantic corridor (Teoh et al., 2022). Our study confirms a low frequency of direct observations of contrail encounters. Even though they do not dominate the campaign observations, and therefore are not representative of the general picture, the mean PSD of in situ origin ML cirrus shows how strongly contrail encounters can affect the cirrus microphysics with an enhancement of smaller particles. More importantly, our analyses indicate that the higher number concentration and smaller particles indeed describe the microphysical properties of ML cirrus compared to lower concentrations and larger ice crystals at the more pristine high latitudes.
5.1 Influence of the method
The selection of the latitude threshold of 60∘ N is a critical aspect in our study, as it determines the differentiation between mid- and high latitudes and, at the same time, our cirrus classification. We performed a sensitivity study and varied the threshold between 55 and 65∘ N (see Fig. S4). Here, we show that the variation in the threshold does not alter the existence of the described differences between the three cirrus groups, even though it influences the absolute values of the medians. In addition, Fig. 2b shows a continuous tendency of increasing effective diameter from mid- to high latitudes, which shows that the differences between ML and HL cirrus are continuous and do not depend on the threshold.
The classification of cirrus origins of our in situ measurements is susceptible to uncertainties, as trajectories were initiated along the flight track every 10 s, which corresponds to ≈2 km in horizontal scale. We assume that cirrus measured in this interval have the same origin. In addition, the model parameters calculated along the trajectories are averages of grid points in a domain that does not capture the smallest local variations. We use the vertical motion along trajectories to separate processes connected to our measurements. However, our trajectory approach excludes the analysis of the impact of small-scale temperature and wind fluctuations on cirrus formation. The accuracy of the approach is difficult to assess, as the associated uncertainty is very inhomogeneous; it depends on the location and the meteorological situation. Nevertheless, we yield convincing results from our classification method, which are in line with previous publications (Krämer et al., 2016, 2020; Luebke et al., 2016; Wernli et al., 2016).
5.2 Aviation influence
Even though the conditions for contrail formation are not as favourable in summer compared to winter (Dischl et al., 2022), and even though the air traffic was still reduced in 2021 due to the COVID-19 pandemic (ICAO, 2022; Schumann et al., 2021; Voigt et al., 2022), we could identify an influence of contrail formation and interaction with natural cirrus in our data set. We did not focus on a methodical approach to differentiate contrails or contrail cirrus from natural cirrus (Li et al., 2022), but we considered nonnatural cirrus to have measurements with and ED>40 µm (lower right section of Fig. 7c). In general, we did not observe high updraft speeds during the campaign – neither from the trajectories nor from the in situ measurements (see Fig. S3). In particular, the events with high N and low ED were also not associated with high updraft speeds that could lead naturally to strong cooling rates and an outburst of small ice crystals. Additionally, we supported the analysis with flight reports and contrail cirrus predictions. With this information, we are able to indicate the existence of an aviation influence and identify this influence on the properties of the described cirrus groups.
5.3 Representativeness
This study analyses the differences in the properties of the cirrus that we measured during the CIRRUS-HL campaign according to the latitude. The results are representative of summer 2021; of the regions measured over the Arctic, North Atlantic, and central Europe; and of the meteorological situations observed during the campaign. In this context, our cirrus observations cover a wide range of latitudes between 38 and 76∘ N and temperatures between −38 and −63 ∘C. The statistical tests we performed indicate a sufficient statistical significance of the differences that we found in these ranges, but conclusions drawn on the coldest temperatures (between −58 and −63 ∘C for HL cirrus and −60.5 and −63 ∘C for ML cirrus) have to be viewed with caution, as the number of observations is limited, and the samples are mainly from the same cloud sequence. This implies that the observations are correlated to some extent, as they are measured at approximately the same temperature and height. However, each 2 s sample is horizontally separated by ≈800 m, and thus, the cloud properties are not necessarily connected. In any case, our measurements can be combined with future observations to build a larger data set and gain a broader perspective.
In this study, we provide new insights into the microphysical properties of the rarely observed Arctic cirrus and support our analysis by backward trajectories of the cirrus air parcels to investigate cirrus formation and evolution. Even though other campaigns have been previously performed in this region (Schiller et al., 2008; Heymsfield et al., 2013; Krämer et al., 2016; Wolf et al., 2018; Marsing et al., 2023), in situ data on the full range of cirrus particle sizes remain limited at high latitudes. Contrary to other campaigns at high latitudes, we also measured cirrus at mid-latitudes during the same mission with the same instrumentation, which provided us with a unique opportunity for comparison. The main findings are stated and discussed in the following:
-
High-latitude cirrus measured during summer 2021 are characterized by lower concentrations and higher effective diameters than mid-latitude cirrus. Similar differences in high-latitude cirrus were also observed by Wolf et al. (2018), when compared to measurements at mid-latitudes (Krämer et al., 2016; Luebke et al., 2016). Similar to Wolf et al. (2018), we also suggest that the reduced number of available ice-nucleating particles at high latitudes could be possible explanation for these findings. In situ measurements of INPs from Arctic cirrus are urgently needed in order to shed more light on this issue.
-
The upper troposphere in the summer 2021 was characterized by high ice supersaturation, especially in high-latitude cirrus ( %). Contrary to wintertime observations in the Arctic by Wolf et al. (2018), which included fast updraft lee wave cirrus, we often analysed in situ origin high-latitude cirrus formed at lower updrafts. Different to the findings in Wolf et al. (2018), the analysis of updraft speeds along the backward trajectories indicates that heterogeneous freezing dominates cirrus formation during this campaign.
-
The Arctic cirrus originate from two processes. First, the cirrus formed and measured at high latitudes consisted mainly of heterogeneously formed in situ origin cirrus nucleated in slow updrafts. Few ice-nucleating particles and high relative humidity over ice produced low ice number concentrations and larger effective diameters. The high-latitude cirrus that had formed at mid-latitudes were dominated by liquid origin cirrus formed at mid-latitudes with higher number concentrations and transported to high latitudes with a subsequent growth of the ice crystals. This category is a mixture of the cirrus properties at mid- and high latitudes and represents how the mid-latitudes influence the properties of cirrus at high latitudes. Both cirrus categories contribute to the larger effective diameter and smaller number concentration measured at high-latitude cirrus compared to mid-latitude cirrus.
-
We discuss the selection of the latitude threshold of 60∘ N and the possible influence on the results. We found slight variations in the microphysical properties of the investigated cirrus groups, but the differences between them remain consistent, regardless of the chosen threshold.
-
Although both liquid and in situ origin cirrus at mid-latitudes exhibit lower effective diameters more frequently than at high latitudes, the differences between in situ origin cirrus at mid- and high latitudes are more substantial. We point out the contribution of contrail formation within the in situ origin cirrus in flight corridors at mid-latitudes to the differences observed between the in situ origin cirrus in mid- and high latitudes (Voigt et al., 2017).
-
We discuss the influence of aviation in the data set and its representativeness. Our results show a possible contribution of contrail formation in the changes in the cirrus properties.
-
We introduce the median particle size distribution as a more suitable alternative representation than the mean for our case, in order to obtain particle size distribution that represent the typical values of sample groups with high variability and strong outliers.
The introduction of the new cirrus classification by taking into account not only the measurement location but also the location at cirrus formation is an important insight for future studies. As we show from our measurements, part of the cirrus considered to be high-latitude cirrus are actually influenced by mid-latitude air masses that change their properties. In situ measurements of ice-nucleating particles in the cirrus regime are needed to clarify the cause of the different cirrus properties at high latitudes compared to mid-latitudes. Combining in situ observations with modelling studies could provide further insights into the underlying processes influencing cirrus formation and cirrus cloud properties. The present study aims to contribute to and enhance our knowledge of cirrus formation processes and their microphysical properties in high and mid-latitudes in order to compile a database for studies on their climate impact.
Processed data from the CIRRUS-HL campaign are available at https://halo-db.pa.op.dlr.de/mission/125 from the HALO database (DLR, 2023).
The supplement related to this article is available online at: https://doi.org/10.5194/acp-23-13167-2023-supplement.
EDLTC conducted the analysis and wrote the paper. TJW and CV supervised the study, provided intensive feedback on the paper, and coordinated the CIRRUS-HL mission. EDLTC, TJW, VH, JL, MZ, and CV conducted the in-flight measurements. TJW, AA, VH, SK, MK, JL, NS, and CV supported the particle data evaluation. HW performed the backward trajectories calculation. VG supported the statistical analysis. All authors contributed to and commented on the paper.
At least one of the (co-)authors is a member of the editorial board of Atmospheric Chemistry and Physics. The peer-review process was guided by an independent editor, and the authors also have no other competing interests to declare.
Publisher’s note: Copernicus Publications remains neutral with regard to jurisdictional claims made in the text, published maps, institutional affiliations, or any other geographical representation in this paper. While Copernicus Publications makes every effort to include appropriate place names, the final responsibility lies with the authors.
We would like to express our gratitude to the flight department and weather forecast teams for their excellent support during the campaign.
This research has been supported by the Deutsche Forschungsgemeinschaft (SPP-1294 HALO, grant nos. VO1504/6-1, VO1504/7-1, and VO1504/9-1; TRR 301, project ID 428312742).
This paper was edited by Odran Sourdeval and reviewed by Andrew Heymsfield and Darrel Baumgardner.
Baumgardner, D., Miake-Lye, R. C., Anderson, M. R., and Brown, R. C.: An evaluation of the temperature, water vapor, and vertical velocity structure of aircraft contrails, J. Geophys. Res.-Atmos., 103, 8727–8736, https://doi.org/10.1029/98JD00205, 1998. a
Baumgardner, D., Jonsson, H., Dawson, W., O'Connor, D., and Newton, R.: The cloud, aerosol and precipitation spectrometer: a new instrument for cloud investigations, Atmos. Res., 59–60, 251–264, https://doi.org/10.1016/S0169-8095(01)00119-3, 2001. a
Baumgardner, D., Brenguier, J.-L., Bucholtz, A., Coe, H., DeMott, P., Garrett, T., Gayet, J.-F., Herrmann, M., Heymsfield, A., Korolev, A., Krämer, M., Petzold, A., Strapp, W., Pilewskie, P., Taylor, J., Twohy, C., Wendisch, M., Bachalo, W., and Chuang, P.: Airborne instruments to measure atmospheric aerosol particles, clouds and radiation: A cook's tour of mature and emerging technology, Atmos. Res., 102, 10–29, https://doi.org/10.1016/j.atmosres.2011.06.021, 2011. a
Baumgardner, D., Abel, S. J., Axisa, D., Cotton, R., Crosier, J., Field, P., Gurganus, C., Heymsfield, A., Korolev, A., Krämer, M., Lawson, P., McFarquhar, G., Ulanowski, Z., and Um, J.: Cloud Ice Properties: In Situ Measurement Challenges, Meteor. Mon., 58, 9.1–9.23, https://doi.org/10.1175/AMSMONOGRAPHS-D-16-0011.1, 2017. a, b
Beer, C. G., Hendricks, J., and Righi, M.: A global climatology of ice-nucleating particles under cirrus conditions derived from model simulations with MADE3 in EMAC, Atmos. Chem. Phys., 22, 15887–15907, https://doi.org/10.5194/acp-22-15887-2022, 2022. a, b
Borrmann, S., Luo, B., and Mishchenko, M.: Application of the T-Matrix method to the measurement of aspherical (ellipsoidal) particles with forward scattering optical particle counters, J. Aerosol Sci., 31, 789–799, https://doi.org/10.1016/S0021-8502(99)00563-7, 2000. a
Brown, P. R. A. and Francis, P. N.: Improved Measurements of the Ice Water Content in Cirrus Using a Total-Water Probe, J. Atmos. Ocean. Tech., 12, 410–414, https://doi.org/10.1175/1520-0426(1995)012<0410:IMOTIW>2.0.CO;2, 1995. a, b
Bräuer, T., Voigt, C., Sauer, D., Kaufmann, S., Hahn, V., Scheibe, M., Schlager, H., Diskin, G. S., Nowak, J. B., DiGangi, J. P., Huber, F., Moore, R. H., and Anderson, B. E.: Airborne Measurements of Contrail Ice Properties–Dependence on Temperature and Humidity, Geophys. Res. Lett., 48, e2020GL092166, https://doi.org/10.1029/2020GL092166, 2021a. a, b, c, d
Bräuer, T., Voigt, C., Sauer, D., Kaufmann, S., Hahn, V., Scheibe, M., Schlager, H., Huber, F., Le Clercq, P., Moore, R. H., and Anderson, B. E.: Reduced ice number concentrations in contrails from low-aromatic biofuel blends, Atmos. Chem. Phys., 21, 16817–16826, https://doi.org/10.5194/acp-21-16817-2021, 2021b. a
Burkhardt, U. and Kärcher, B.: Global radiative forcing from contrail cirrus, Nat. Clim. Change, 1, 54–58, https://doi.org/10.1038/nclimate1068, 2011. a
Chauvigné, A., Jourdan, O., Schwarzenboeck, A., Gourbeyre, C., Gayet, J. F., Voigt, C., Schlager, H., Kaufmann, S., Borrmann, S., Molleker, S., Minikin, A., Jurkat, T., and Schumann, U.: Statistical analysis of contrail to cirrus evolution during the Contrail and Cirrus Experiment (CONCERT), Atmos. Chem. Phys., 18, 9803–9822, https://doi.org/10.5194/acp-18-9803-2018, 2018. a
Choi, Y.-S. and Ho, C.-H.: Radiative effect of cirrus with different optical properties over the tropics in MODIS and CERES observations, Geophys. Res. Lett., 33, L21811, https://doi.org/10.1029/2006GL027403, 2006. a
Costa, A., Meyer, J., Afchine, A., Luebke, A., Günther, G., Dorsey, J. R., Gallagher, M. W., Ehrlich, A., Wendisch, M., Baumgardner, D., Wex, H., and Krämer, M.: Classification of Arctic, midlatitude and tropical clouds in the mixed-phase temperature regime, Atmos. Chem. Phys., 17, 12219–12238, https://doi.org/10.5194/acp-17-12219-2017, 2017. a
DeMott, P. J., Cziczo, D. J., Prenni, A. J., Murphy, D. M., Kreidenweis, S. M., Thomson, D. S., Borys, R., and Rogers, D. C.: Measurements of the concentration and composition of nuclei for cirrus formation, P. Natl. Acad. Sci. USA, 100, 14655–14660, https://doi.org/10.1073/pnas.2532677100, 2003. a, b
DeMott, P. J., Prenni, A. J., Liu, X., Kreidenweis, S. M., Petters, M. D., Twohy, C. H., Richardson, M. S., Eidhammer, T., and Rogers, D. C.: Predicting global atmospheric ice nuclei distributions and their impacts on climate, P. Natl. Acad. Sci. USA, 107, 11217–11222, https://doi.org/10.1073/pnas.0910818107, 2010. a
Dessler, A. E.: Clouds and water vapor in the Northern Hemisphere summertime stratosphere, J. Geophys. Res.-Atmos., 114, D00H09, https://doi.org/10.1029/2009JD012075, 2009. a, b
Dischl, R., Kaufmann, S., and Voigt, C.: Regional and Seasonal Dependence of the Potential Contrail Cover and the Potential Contrail Cirrus Cover over Europe, Aerospace, 9, 485, https://doi.org/10.3390/aerospace9090485, 2022. a, b, c
DLR: CIRRUS-HL mission data, Mission: CIRRUS-HL, HALO database [data set], https://halo-db.pa.op.dlr.de/mission/125 (last access: 15 January 2023), 2023. a
Febvre, G., Gayet, J.-F., Minikin, A., Schlager, H., Shcherbakov, V., Jourdan, O., Busen, R., Fiebig, M., Kärcher, B., and Schumann, U.: On optical and microphysical characteristics of contrails and cirrus, J. Geophys. Res.-Atmos., 114, D02204, https://doi.org/10.1029/2008JD010184, 2009. a
Field, P. R., Heymsfield, A. J., and Bansemer, A.: Shattering and Particle Interarrival Times Measured by Optical Array Probes in Ice Clouds, J. Atmos. Ocean. Tech., 23, 1357–1371, https://doi.org/10.1175/JTECH1922.1, 2006. a
Forster, P., Storelvmo, T., Armour, K., Collins, W., Dufresne, J.-L., Frame, D., Lunt, D., Mauritsen, T., Palmer, M., Watanabe, M., Wild, M., and Zhang, H.: The Earth's Energy Budget, Climate Feedbacks, and Climate Sensitivity, Cambridge University Press, Cambridge, United Kingdom and New York, NY, USA, 923–1054, https://doi.org/10.1017/9781009157896.009, 2021. a
Frömming, C., Grewe, V., Brinkop, S., Jöckel, P., Haslerud, A. S., Rosanka, S., van Manen, J., and Matthes, S.: Influence of weather situation on non-CO2 aviation climate effects: the REACT4C climate change functions, Atmos. Chem. Phys., 21, 9151–9172, https://doi.org/10.5194/acp-21-9151-2021, 2021. a
Froyd, K., Yu, P., Schill, G., Brock, C., Kupc, A., Williamson, C., Jensen, E., Ray, E., Rosenlof, K., Bian, H., Darmenov, A., Colarco, P., Diskin, G., Bui, T., and Murphy, D.: Dominant role of mineral dust in cirrus cloud formation revealed by global-scale measurements, Nat. Geosci., 15, 1–7, https://doi.org/10.1038/s41561-022-00901-w, 2022. a
Gasparini, B., Meyer, A., Neubauer, D., Münch, S., and Lohmann, U.: Cirrus Cloud Properties as Seen by the CALIPSO Satellite and ECHAM-HAM Global Climate Model, J. Climate, 31, 1983–2003, https://doi.org/10.1175/JCLI-D-16-0608.1, 2018. a, b, c
Gayet, J.-F., Ovarlez, J., Shcherbakov, V., Ström, J., Schumann, U., Minikin, A., Auriol, F., Petzold, A., and Monier, M.: Cirrus cloud microphysical and optical properties at southern and northern midlatitudes during the INCA experiment, J. Geophys. Res.-Atmos., 109, D20206, https://doi.org/10.1029/2004JD004803, 2004. a, b
Gayet, J.-F., Shcherbakov, V., Voigt, C., Schumann, U., Schäuble, D., Jessberger, P., Petzold, A., Minikin, A., Schlager, H., Dubovik, O., and Lapyonok, T.: The evolution of microphysical and optical properties of an A380 contrail in the vortex phase, Atmos. Chem. Phys., 12, 6629–6643, https://doi.org/10.5194/acp-12-6629-2012, 2012. a, b
Gettelman, A., Liu, X., Barahona, D., Lohmann, U., and Chen, C.: Climate impacts of ice nucleation, J. Geophys. Res.-Atmos., 117, D20201, https://doi.org/10.1029/2012JD017950, 2012. a
Gierens, K.: Selected topics on the interaction between cirrus clouds and embedded contrails, Atmos. Chem. Phys., 12, 11943–11949, https://doi.org/10.5194/acp-12-11943-2012, 2012. a
Giez, A., Mallaun, C., Nenakhov, V., and Zöger, M.: Calibration of a Nose Boom Mounted Airflow Sensor on an Atmospheric Research Aircraft by Inflight Maneuvers, Tech. rep., https://elib.dlr.de/145969/ (last access: 20 October 2022), 2021. a
Grewe, V., Dahlmann, K., Flink, J., Frömming, C., Ghosh, R., Gierens, K., Heller, R., Hendricks, J., Jöckel, P., Kaufmann, S., Kölker, K., Linke, F., Luchkova, T., Lührs, B., Van Manen, J., Matthes, S., Minikin, A., Niklaß, M., Plohr, M., Righi, M., Rosanka, S., Schmitt, A., Schumann, U., Terekhov, I., Unterstrasser, S., Vázquez-Navarro, M., Voigt, C., Wicke, K., Yamashita, H., Zahn, A., and Ziereis, H.: Mitigating the Climate Impact from Aviation: Achievements and Results of the DLR WeCare Project, Aerospace, 4, 34, https://doi.org/10.3390/aerospace4030034, 2017. a
Groß, S., Jurkat-Witschas, T., Li, Q., Wirth, M., Urbanek, B., Krämer, M., Weigel, R., and Voigt, C.: Investigating an indirect aviation effect on mid-latitude cirrus clouds – linking lidar-derived optical properties to in situ measurements, Atmos. Chem. Phys., 23, 8369–8381, https://doi.org/10.5194/acp-23-8369-2023, 2023. a, b
Hendricks, J., Kärcher, B., and Lohmann, U.: Effects of ice nuclei on cirrus clouds in a global climate model, J. Geophys. Res.-Atmos., 116, D18206, https://doi.org/10.1029/2010JD015302, 2011. a, b, c
Heymsfield, A., Krämer, M., Wood, N. B., Gettelman, A., Field, P. R., and Liu, G.: Dependence of the Ice Water Content and Snowfall Rate on Temperature, Globally: Comparison of in Situ Observations, Satellite Active Remote Sensing Retrievals, and Global Climate Model Simulations, J. Appl. Meteorol. Clim., 56, 189–215, https://doi.org/10.1175/JAMC-D-16-0230.1, 2017. a
Heymsfield, A. J. and Parrish, J. L.: A Computational Technique for Increasing the Effective Sampling Volume of the PMS Two-Dimensional Particle Size Spectrometer, J. Appl. Meteorol. Clim., 17, 1566–1572, https://doi.org/10.1175/1520-0450(1978)017<1566:ACTFIT>2.0.CO;2, 1978. a
Heymsfield, A. J., Lewis, S., Bansemer, A., Iaquinta, J., Miloshevich, L. M., Kajikawa, M., Twohy, C., and Poellot, M. R.: A General Approach for Deriving the Properties of Cirrus and Stratiform Ice Cloud Particles, J. Atmos. Sci., 59, 3–29, https://doi.org/10.1175/1520-0469(2002)059<0003:AGAFDT>2.0.CO;2, 2002. a
Heymsfield, A. J., Schmitt, C., Bansemer, A., and Twohy, C. H.: Improved Representation of Ice Particle Masses Based on Observations in Natural Clouds, J. Atmos. Sci., 67, 3303–3318, https://doi.org/10.1175/2010JAS3507.1, 2010. a, b
Heymsfield, A. J., Schmitt, C., and Bansemer, A.: Ice Cloud Particle Size Distributions and Pressure-Dependent Terminal Velocities from In Situ Observations at Temperatures from 0∘ to −86 ∘C, J. Atmos. Sci., 70, 4123–4154, https://doi.org/10.1175/JAS-D-12-0124.1, 2013. a, b, c
Heymsfield, A. J., Krämer, M., Luebke, A., Brown, P., Cziczo, D. J., Franklin, C., Lawson, P., Lohmann, U., McFarquhar, G., Ulanowski, Z., and Tricht, K. V.: Cirrus Clouds, Meteor. Mon., 58, 2.1–2.26, https://doi.org/10.1175/AMSMONOGRAPHS-D-16-0010.1, 2017. a, b
Hoffmann, L. and Spang, R.: Reanalysis Tropopause Data Repository, Version V1, Jülich DATA [data set], https://doi.org/10.26165/JUELICH-DATA/UBNGI2, 2021. a
Hoffmann, L. and Spang, R.: An assessment of tropopause characteristics of the ERA5 and ERA-Interim meteorological reanalyses, Atmos. Chem. Phys., 22, 4019–4046, https://doi.org/10.5194/acp-22-4019-2022, 2022. a
Hong, Y. and Liu, G.: The Characteristics of Ice Cloud Properties Derived from CloudSat and CALIPSO Measurements, J. Climate, 28, 3880–3901, https://doi.org/10.1175/JCLI-D-14-00666.1, 2015. a, b, c
Hoose, C. and Möhler, O.: Heterogeneous ice nucleation on atmospheric aerosols: a review of results from laboratory experiments, Atmos. Chem. Phys., 12, 9817–9854, https://doi.org/10.5194/acp-12-9817-2012, 2012. a
ICAO: Air Transport Monitor, https://www.icao.int/sustainability/pages/air-traffic-monitor.aspx (last access: 20 October 2022), 2021. a
Jang, S., Kim, J., McFarquhar, G. M., Park, S., Lee, S. S., Jung, C. H., Park, S. S., Cha, J. W., Lee, K., and Um, J.: Theoretical Calculations of Directional Scattering Intensities of Small Nonspherical Ice Crystals: Implications for Forward Scattering Probes, Remote Sens.-Basel, 14, 2795, https://doi.org/10.3390/rs14122795, 2022. a
Jensen, E. J., Lawson, R. P., Bergman, J. W., Pfister, L., Bui, T. P., and Schmitt, C. G.: Physical processes controlling ice concentrations in synoptically forced, midlatitude cirrus, J. Geophys. Res.-Atmos., 118, 5348–5360, https://doi.org/10.1002/jgrd.50421, 2013. a
Jeßberger, P., Voigt, C., Schumann, U., Sölch, I., Schlager, H., Kaufmann, S., Petzold, A., Schäuble, D., and Gayet, J.-F.: Aircraft type influence on contrail properties, Atmos. Chem. Phys., 13, 11965–11984, https://doi.org/10.5194/acp-13-11965-2013, 2013. a
Kanji, Z. A., Ladino, L. A., Wex, H., Boose, Y., Burkert-Kohn, M., Cziczo, D. J., and Krämer, M.: Overview of Ice Nucleating Particles, Meteor. Mon., 58, 1.1–1.33, https://doi.org/10.1175/AMSMONOGRAPHS-D-16-0006.1, 2017. a
Kärcher, B. and Lohmann, U.: A parameterization of cirrus cloud formation: Homogeneous freezing of supercooled aerosols, J. Geophys. Res.-Atmos., 107, AAC 4–1–AAC 4–10, https://doi.org/10.1029/2001JD000470, 2002. a, b, c
Kärcher, B. and Lohmann, U.: A parameterization of cirrus cloud formation: Heterogeneous freezing, J. Geophys. Res.-Atmos., 108, 4402, https://doi.org/10.1029/2002JD003220, 2003. a, b
Kärcher, B., Hendricks, J., and Lohmann, U.: Physically based parameterization of cirrus cloud formation for use in global atmospheric models, J. Geophys. Res.-Atmos., 111, D01205, https://doi.org/10.1029/2005JD006219, 2006. a
Kärcher, B., DeMott, P. J., Jensen, E. J., and Harrington, J. Y.: Studies on the Competition Between Homogeneous and Heterogeneous Ice Nucleation in Cirrus Formation, J. Geophys. Res.-Atmos., 127, e2021JD035805, https://doi.org/10.1029/2021JD035805, 2022. a, b
Kaufmann, S., Voigt, C., Jurkat, T., Thornberry, T., Fahey, D. W., Gao, R.-S., Schlage, R., Schäuble, D., and Zöger, M.: The airborne mass spectrometer AIMS – Part 1: AIMS-H2O for UTLS water vapor measurements, Atmos. Meas. Tech., 9, 939–953, https://doi.org/10.5194/amt-9-939-2016, 2016. a
Kaufmann, S., Voigt, C., Heller, R., Jurkat-Witschas, T., Krämer, M., Rolf, C., Zöger, M., Giez, A., Buchholz, B., Ebert, V., Thornberry, T., and Schumann, U.: Intercomparison of midlatitude tropospheric and lower-stratospheric water vapor measurements and comparison to ECMWF humidity data, Atmos. Chem. Phys., 18, 16729–16745, https://doi.org/10.5194/acp-18-16729-2018, 2018. a
Kleine, J., Voigt, C., Sauer, D., Schlager, H., Scheibe, M., Jurkat, T., Kaufmann, S., Kärcher, B., and Anderson, B.: In Situ Observations of Ice Particle Losses in a Young Persistent Contrail, Geophys. Res. Lett., 45, 13553–13561, https://doi.org/10.1029/2018GL079390, 2018. a, b
Klingebiel, M., de Lozar, A., Molleker, S., Weigel, R., Roth, A., Schmidt, L., Meyer, J., Ehrlich, A., Neuber, R., Wendisch, M., and Borrmann, S.: Arctic low-level boundary layer clouds: in situ measurements and simulations of mono- and bimodal supercooled droplet size distributions at the top layer of liquid phase clouds, Atmos. Chem. Phys., 15, 617–631, https://doi.org/10.5194/acp-15-617-2015, 2015. a, b
Knollenberg, R. G.: The Optical Array: An Alternative to Scattering or Extinction for Airborne Particle Size Determination, J. Appl. Meteorol. Clim., 9, 86–103, https://doi.org/10.1175/1520-0450(1970)009<0086:TOAAAT>2.0.CO;2, 1970. a, b
Korolev, A.: Limitations of the Wegener–Bergeron–Findeisen Mechanism in the Evolution of Mixed-Phase Clouds, J. Atmos. Sci., 64, 3372–3375, https://doi.org/10.1175/JAS4035.1, 2007. a
Korolev, A., Emery, E., Strapp, J., Cober, S., and Isaac, G.: Quantification of the Effects of Shattering on Airborne Ice Particle Measurements, J. Atmos. Ocean. Tech., 30, 2527–2553, https://doi.org/10.1175/JTECH-D-13-00115.1, 2013. a, b
Krämer, M., Rolf, C., Luebke, A., Afchine, A., Spelten, N., Costa, A., Meyer, J., Zöger, M., Smith, J., Herman, R. L., Buchholz, B., Ebert, V., Baumgardner, D., Borrmann, S., Klingebiel, M., and Avallone, L.: A microphysics guide to cirrus clouds – Part 1: Cirrus types, Atmos. Chem. Phys., 16, 3463–3483, https://doi.org/10.5194/acp-16-3463-2016, 2016. a, b, c, d, e, f, g, h, i, j
Krämer, M., Rolf, C., Spelten, N., Afchine, A., Fahey, D., Jensen, E., Khaykin, S., Kuhn, T., Lawson, P., Lykov, A., Pan, L. L., Riese, M., Rollins, A., Stroh, F., Thornberry, T., Wolf, V., Woods, S., Spichtinger, P., Quaas, J., and Sourdeval, O.: A microphysics guide to cirrus – Part 2: Climatologies of clouds and humidity from observations, Atmos. Chem. Phys., 20, 12569–12608, https://doi.org/10.5194/acp-20-12569-2020, 2020. a, b, c, d, e, f, g
Kristensson, A., Gayet, J. F., Ström, J., and Auriol, F.: In situ observations of a reduction in effective crystal diameter in cirrus clouds near flight corridors, Geophys. Res. Lett., 27, 681–684, https://doi.org/10.1029/1999GL010934, 2000. a
Kübbeler, M., Hildebrandt, M., Meyer, J., Schiller, C., Hamburger, Th., Jurkat, T., Minikin, A., Petzold, A., Rautenhaus, M., Schlager, H., Schumann, U., Voigt, C., Spichtinger, P., Gayet, J.-F., Gourbeyre, C., and Krämer, M.: Thin and subvisible cirrus and contrails in a subsaturated environment, Atmos. Chem. Phys., 11, 5853–5865, https://doi.org/10.5194/acp-11-5853-2011, 2011. a
Lance, S., Brock, C. A., Rogers, D., and Gordon, J. A.: Water droplet calibration of the Cloud Droplet Probe (CDP) and in-flight performance in liquid, ice and mixed-phase clouds during ARCPAC, Atmos. Meas. Tech., 3, 1683–1706, https://doi.org/10.5194/amt-3-1683-2010, 2010. a, b, c
Lee, D., Fahey, D., Skowron, A., Allen, M., Burkhardt, U., Chen, Q., Doherty, S., Freeman, S., Forster, P., Fuglestvedt, J., Gettelman, A., De León, R., Lim, L., Lund, M., Millar, R., Owen, B., Penner, J., Pitari, G., Prather, M., Sausen, R., and Wilcox, L.: The contribution of global aviation to anthropogenic climate forcing for 2000 to 2018, Atmos. Environ., 244, 117834, https://doi.org/10.1016/j.atmosenv.2020.117834, 2021. a
Li, Y., Mahnke, C., Rohs, S., Bundke, U., Spelten, N., Dekoutsidis, G., Groß, S., Voigt, C., Schumann, U., Petzold, A., and Krämer, M.: Upper-tropospheric slightly ice-subsaturated regions: frequency of occurrence and statistical evidence for the appearance of contrail cirrus, Atmos. Chem. Phys., 23, 2251–2271, https://doi.org/10.5194/acp-23-2251-2023, 2023. a, b, c, d, e, f, g
Liou, K.-N.: Influence of Cirrus Clouds on Weather and Climate Processes: A Global Perspective, Mon. Weather Rev., 114, 1167–1199, https://doi.org/10.1175/1520-0493(1986)114<1167:IOCCOW>2.0.CO;2, 1986. a, b
Luebke, A. E., Avallone, L. M., Schiller, C., Meyer, J., Rolf, C., and Krämer, M.: Ice water content of Arctic, midlatitude, and tropical cirrus – Part 2: Extension of the database and new statistical analysis, Atmos. Chem. Phys., 13, 6447–6459, https://doi.org/10.5194/acp-13-6447-2013, 2013. a
Luebke, A. E., Afchine, A., Costa, A., Grooß, J.-U., Meyer, J., Rolf, C., Spelten, N., Avallone, L. M., Baumgardner, D., and Krämer, M.: The origin of midlatitude ice clouds and the resulting influence on their microphysical properties, Atmos. Chem. Phys., 16, 5793–5809, https://doi.org/10.5194/acp-16-5793-2016, 2016. a, b, c, d, e, f, g, h, i, j, k, l
Maciel, F. V., Diao, M., and Patnaude, R.: Examination of aerosol indirect effects during cirrus cloud evolution, Atmos. Chem. Phys., 23, 1103–1129, https://doi.org/10.5194/acp-23-1103-2023, 2023. a
Marjani, S., Tesche, M., Bräuer, P., Sourdeval, O., and Quaas, J.: Satellite Observations of the Impact of Individual Aircraft on Ice Crystal Number in Thin Cirrus Clouds, Geophys. Res. Lett., 49, e2021GL096173, https://doi.org/10.1029/2021GL096173, 2022. a, b
Marsing, A., Meerkötter, R., Heller, R., Kaufmann, S., Jurkat-Witschas, T., Krämer, M., Rolf, C., and Voigt, C.: Investigating the radiative effect of Arctic cirrus measured in situ during the winter 2015–2016, Atmos. Chem. Phys., 23, 587–609, https://doi.org/10.5194/acp-23-587-2023, 2023. a, b, c, d, e, f
McFarquhar, G. M., Um, J., Freer, M., Baumgardner, D., Kok, G. L., and Mace, G.: Importance of small ice crystals to cirrus properties: Observations from the Tropical Warm Pool International Cloud Experiment (TWP-ICE), Geophys. Res. Lett., 34, L13803, https://doi.org/10.1029/2007GL029865, 2007. a, b
McFarquhar, G. M., Ghan, S., Verlinde, J., Korolev, A., Strapp, J. W., Schmid, B., Tomlinson, J. M., Wolde, M., Brooks, S. D., Cziczo, D., Dubey, M. K., Fan, J., Flynn, C., Gultepe, I., Hubbe, J., Gilles, M. K., Laskin, A., Lawson, P., Leaitch, W. R., Liu, P., Liu, X., Lubin, D., Mazzoleni, C., Macdonald, A.-M., Moffet, R. C., Morrison, H., Ovchinnikov, M., Shupe, M. D., Turner, D. D., Xie, S., Zelenyuk, A., Bae, K., Freer, M., and Glen, A.: Indirect and Semi-direct Aerosol Campaign: The Impact of Arctic Aerosols on Clouds, B. Am. Meteorol. Soc., 92, 183–201, https://doi.org/10.1175/2010BAMS2935.1, 2011. a
Mie, G.: Beiträge zur Optik trüber Medien, speziell kolloidaler Metallösungen, Ann. Phys., 330, 377–445, https://doi.org/10.1002/andp.19083300302, 1908. a
Mitchell, D. L., Lawson, R. P., and Baker, B.: Understanding effective diameter and its application to terrestrial radiation in ice clouds, Atmos. Chem. Phys., 11, 3417–3429, https://doi.org/10.5194/acp-11-3417-2011, 2011. a
Muhlbauer, A., Ackerman, T. P., Comstock, J. M., Diskin, G. S., Evans, S. M., Lawson, R. P., and Marchand, R. T.: Impact of large-scale dynamics on the microphysical properties of midlatitude cirrus, J. Geophys. Res.-Atmos., 119, 3976–3996, https://doi.org/10.1002/2013JD020035, 2014. a
Muri, H., Kristjánsson, J. E., Storelvmo, T., and Pfeffer, M. A.: The climatic effects of modifying cirrus clouds in a climate engineering framework, J. Geophys. Res.-Atmos., 119, 4174–4191, https://doi.org/10.1002/2013JD021063, 2014. a
O'Shea, S., Crosier, J., Dorsey, J., Gallagher, L., Schledewitz, W., Bower, K., Schlenczek, O., Borrmann, S., Cotton, R., Westbrook, C., and Ulanowski, Z.: Characterising optical array particle imaging probes: implications for small-ice-crystal observations, Atmos. Meas. Tech., 14, 1917–1939, https://doi.org/10.5194/amt-14-1917-2021, 2021. a
O'Shea, S. J., Crosier, J., Dorsey, J., Schledewitz, W., Crawford, I., Borrmann, S., Cotton, R., and Bansemer, A.: Revisiting particle sizing using greyscale optical array probes: evaluation using laboratory experiments and synthetic data, Atmos. Meas. Tech., 12, 3067–3079, https://doi.org/10.5194/amt-12-3067-2019, 2019. a
Parol, F., Buriez, J., Brogniez, G., and Fouquart, Y.: Information Content of AVHRR Channels 4 and 5 with Respect to the Effective Radius of Cirrus Cloud Particles, J. Appl. Meteorol., 30, 973–984, https://doi.org/10.1175/1520-0450-30.7.973, 1991. a
Patnaude, R. and Diao, M.: Aerosol Indirect Effects on Cirrus Clouds Based on Global Aircraft Observations, Geophys. Res. Lett., 47, e2019GL086550, https://doi.org/10.1029/2019GL086550, 2020. a
Perry, A.: Middle latitude climates, Springer US, Boston, MA, 581–583, https://doi.org/10.1007/0-387-30749-4_116, 1987. a
Petzold, A., Busen, R., Schröder, F. P., Baumann, R., Kuhn, M., Ström, J., Hagen, D. E., Whitefield, P. D., Baumgardner, D., Arnold, F., Borrmann, S., and Schumann, U.: Near-field measurements on contrail properties from fuels with different sulfur content, J. Geophys. Res.-Atmos., 102, 29867–29880, https://doi.org/10.1029/97JD02209, 1997. a
Righi, M., Hendricks, J., and Beer, C. G.: Exploring the uncertainties in the aviation soot–cirrus effect, Atmos. Chem. Phys., 21, 17267–17289, https://doi.org/10.5194/acp-21-17267-2021, 2021. a, b
Sassen, K., Wang, Z., and Liu, D.: Global distribution of cirrus clouds from CloudSat/Cloud-Aerosol Lidar and Infrared Pathfinder Satellite Observations (CALIPSO) measurements, J. Geophys. Res.-Atmos., 113, D00A12, https://doi.org/10.1029/2008JD009972, 2008. a
Schiller, C., Krämer, M., Afchine, A., Spelten, N., and Sitnikov, N.: Ice water content of Arctic, midlatitude, and tropical cirrus, J. Geophys. Res.-Atmos., 113, D24208, https://doi.org/10.1029/2008JD010342, 2008. a, b, c
Schmale, J., Zieger, P., and Ekman, A. M. L.: Aerosols in current and future Arctic climate, Nat. Clim. Change, 11, 95–105, 2021. a
Schröder, F., Kärcher, B., Duroure, C., Ström, J., Petzold, A., Gayet, J.-F., Strauss, B., Wendling, P., and Borrmann, S.: On the Transition of Contrails into Cirrus Clouds, J. Atmos. Sci., 57, 464–480, https://doi.org/10.1175/1520-0469(2000)057<0464:OTTOCI>2.0.CO;2, 2000. a, b
Schumann, U.: On Conditions for Contrail Formation from Aircraft Exhausts, Meteorol. Z. 5, 4–23, 1996. a
Schumann, U. and Heymsfield, A. J.: On the Life Cycle of Individual Contrails and Contrail Cirrus, Meteor. Mon., 58, 3.1–3.24, https://doi.org/10.1175/AMSMONOGRAPHS-D-16-0005.1, 2017. a, b
Schumann, U., Mayer, B., Gierens, K., Unterstrasser, S., Jessberger, P., Petzold, A., Voigt, C., and Gayet, J.-F.: Effective Radius of Ice Particles in Cirrus and Contrails, J. Atmos. Sci., 68, 300–321, https://doi.org/10.1175/2010JAS3562.1, 2011. a, b
Schumann, U., Penner, J. E., Chen, Y., Zhou, C., and Graf, K.: Dehydration effects from contrails in a coupled contrail–climate model, Atmos. Chem. Phys., 15, 11179–11199, https://doi.org/10.5194/acp-15-11179-2015, 2015. a
Schumann, U., Baumann, R., Baumgardner, D., Bedka, S. T., Duda, D. P., Freudenthaler, V., Gayet, J.-F., Heymsfield, A. J., Minnis, P., Quante, M., Raschke, E., Schlager, H., Vázquez-Navarro, M., Voigt, C., and Wang, Z.: Properties of individual contrails: a compilation of observations and some comparisons, Atmos. Chem. Phys., 17, 403–438, https://doi.org/10.5194/acp-17-403-2017, 2017. a, b, c
Schumann, U., Poll, I., Teoh, R., Koelle, R., Spinielli, E., Molloy, J., Koudis, G. S., Baumann, R., Bugliaro, L., Stettler, M., and Voigt, C.: Air traffic and contrail changes over Europe during COVID-19: a model study, Atmos. Chem. Phys., 21, 7429–7450, https://doi.org/10.5194/acp-21-7429-2021, 2021. a
Shupe, M. D., Rex, M., Blomquist, B., Persson, P. O. G., Schmale, J., Uttal, T., Althausen, D., Angot, H., Archer, S., Bariteau, L., Beck, I., Bilberry, J., Bucci, S., Buck, C., Boyer, M., Brasseur, Z., Brooks, I. M., Calmer, R., Cassano, J., Castro, V., Chu, D., Costa, D., Cox, C. J., Creamean, J., Crewell, S., Dahlke, S., Damm, E., de Boer, G., Deckelmann, H., Dethloff, K., Dütsch, M., Ebell, K., Ehrlich, A., Ellis, J., Engelmann, R., Fong, A. A., Frey, M. M., Gallagher, M. R., Ganzeveld, L., Gradinger, R., Graeser, J., Greenamyer, V., Griesche, H., Griffiths, S., Hamilton, J., Heinemann, G., Helmig, D., Herber, A., Heuzé, C., Hofer, J., Houchens, T., Howard, D., Inoue, J., Jacobi, H.-W., Jaiser, R., Jokinen, T., Jourdan, O., Jozef, G., King, W., Kirchgaessner, A., Klingebiel, M., Krassovski, M., Krumpen, T., Lampert, A., Landing, W., Laurila, T., Lawrence, D., Lonardi, M., Loose, B., Lüpkes, C., Maahn, M., Macke, A., Maslowski, W., Marsay, C., Maturilli, M., Mech, M., Morris, S., Moser, M., Nicolaus, M., Ortega, P., Osborn, J., Pätzold, F., Perovich, D. K., Petäjä, T., Pilz, C., Pirazzini, R., Posman, K., Powers, H., Pratt, K. A., Preußer, A., Quéléver, L., Radenz, M., Rabe, B., Rinke, A., Sachs, T., Schulz, A., Siebert, H., Silva, T., Solomon, A., Sommerfeld, A., Spreen, G., Stephens, M., Stohl, A., Svensson, G., Uin, J., Viegas, J., Voigt, C., von der Gathen, P., Wehner, B., Welker, J. M., Wendisch, M., Werner, M., Xie, Z., and Yue, F.: Overview of the MOSAiC expedition: Atmosphere, Elementa: Science of the Anthropocene, 10, 00060, https://doi.org/10.1525/elementa.2021.00060, 2022. a
Sourdeval, O., Gryspeerdt, E., Krämer, M., Goren, T., Delanoë, J., Afchine, A., Hemmer, F., and Quaas, J.: Ice crystal number concentration estimates from lidar–radar satellite remote sensing – Part 1: Method and evaluation, Atmos. Chem. Phys., 18, 14327–14350, https://doi.org/10.5194/acp-18-14327-2018, 2018. a
Spichtinger, P. and Cziczo, D. J.: Impact of heterogeneous ice nuclei on homogeneous freezing events in cirrus clouds, J. Geophys. Res.-Atmos., 115, D14208, https://doi.org/10.1029/2009JD012168, 2010. a
Spichtinger, P. and Gierens, K. M.: Modelling of cirrus clouds – Part 1b: Structuring cirrus clouds by dynamics, Atmos. Chem. Phys., 9, 707–719, https://doi.org/10.5194/acp-9-707-2009, 2009. a
Sprenger, M. and Wernli, H.: The LAGRANTO Lagrangian analysis tool – version 2.0, Geosci. Model Dev., 8, 2569–2586, https://doi.org/10.5194/gmd-8-2569-2015, 2015. a
Storelvmo, T., Boos, W., and Herger, N.: Cirrus cloud seeding: A climate engineering mechanism with reduced side effects?, Philos. T. Roy. Soc. A, 372, 20140116, https://doi.org/10.1098/rsta.2014.0116, 2014. a
Teoh, R., Schumann, U., Gryspeerdt, E., Shapiro, M., Molloy, J., Koudis, G., Voigt, C., and Stettler, M. E. J.: Aviation contrail climate effects in the North Atlantic from 2016 to 2021, Atmos. Chem. Phys., 22, 10919–10935, https://doi.org/10.5194/acp-22-10919-2022, 2022. a, b, c
Tesche, M., Achtert, P., Glantz, P., and Noone, K. J.: Aviation effects on already-existing cirrus clouds, Nat. Commun., 7, 12016, https://doi.org/10.1038/ncomms12016, 2016. a, b
Thornberry, T. D., Rollins, A. W., Avery, M. A., Woods, S., Lawson, R. P., Bui, T. V., and Gao, R.-S.: Ice water content-extinction relationships and effective diameter for TTL cirrus derived from in situ measurements during ATTREX 2014, J. Geophys. Res.-Atmos., 122, 4494–4507, https://doi.org/10.1002/2016JD025948, 2017. a
Unterstrasser, S. and Gierens, K.: Numerical simulations of contrail-to-cirrus transition – Part 2: Impact of initial ice crystal number, radiation, stratification, secondary nucleation and layer depth, Atmos. Chem. Phys., 10, 2037–2051, https://doi.org/10.5194/acp-10-2037-2010, 2010. a, b
Unterstrasser, S., Gierens, K., Sölch, I., and Lainer, M.: Numerical simulations of homogeneously nucleated natural cirrus and contrail-cirrus. Part 1: How different are they?, Meteorol. Z., 26, 621–642, https://doi.org/10.1127/metz/2016/0777, 2017a. a, b
Unterstrasser, S., Gierens, K., Sölch, I., and Wirth, M.: Numerical simulations of homogeneously nucleated natural cirrus and contrail-cirrus. Part 2: Interaction on local scale, Meteorol. Z., 26, 643–661, https://doi.org/10.1127/metz/2016/0780, 2017b. a, b
Urbanek, B., Groß, S., Wirth, M., Rolf, C., Krämer, M., and Voigt, C.: High Depolarization Ratios of Naturally Occurring Cirrus Clouds Near Air Traffic Regions Over Europe, Geophys. Res. Lett., 45, 13166–13172, https://doi.org/10.1029/2018GL079345, 2018. a, b
Verma, P. and Burkhardt, U.: Contrail formation within cirrus: ICON-LEM simulations of the impact of cirrus cloud properties on contrail formation, Atmos. Chem. Phys., 22, 8819–8842, https://doi.org/10.5194/acp-22-8819-2022, 2022. a, b
Voigt, C., Schumann, U., Jurkat, T., Schäuble, D., Schlager, H., Petzold, A., Gayet, J.-F., Krämer, M., Schneider, J., Borrmann, S., Schmale, J., Jessberger, P., Hamburger, T., Lichtenstern, M., Scheibe, M., Gourbeyre, C., Meyer, J., Kübbeler, M., Frey, W., Kalesse, H., Butler, T., Lawrence, M. G., Holzäpfel, F., Arnold, F., Wendisch, M., Döpelheuer, A., Gottschaldt, K., Baumann, R., Zöger, M., Sölch, I., Rautenhaus, M., and Dörnbrack, A.: In-situ observations of young contrails – overview and selected results from the CONCERT campaign, Atmos. Chem. Phys., 10, 9039–9056, https://doi.org/10.5194/acp-10-9039-2010, 2010. a, b
Voigt, C., Schumann, U., Jeßberger, P., Jurkat, T., Petzold, A., Gayet, J.-F., Krämer, M., Thornberry, T., and Fahey, D.: Extinction and optical depth of contrails, Geophys. Res. Lett., 38, 1–5, https://doi.org/10.1029/2011GL047189, 2011. a, b, c
Voigt, C., Schumann, U., Minikin, A., Abdelmonem, A., Afchine, A., Borrmann, S., Boettcher, M., Buchholz, B., Bugliaro, L., Costa, A., Curtius, J., Dollner, M., Dörnbrack, A., Dreiling, V., Ebert, V., Ehrlich, A., Fix, A., Forster, L., Frank, F., and Zoeger, M.: ML-CIRRUS: The Airborne Experiment on Natural Cirrus and Contrail Cirrus with the High-Altitude Long-Range Research Aircraft HALO, B. Am. Meteorol. Soc., 98, 271–288, https://doi.org/10.1175/BAMS-D-15-00213.1, 2017. a, b, c, d, e, f, g, h, i, j, k, l, m
Voigt, C., Kleine, J., Sauer, D., Moore, R. H., Bräuer, T., Le Clercq, P., Kaufmann, S., Scheibe, M., Jurkat-Witschas, T., Aigner, M., Bauder, U., Boose, Y., Borrmann, S., Crosbie, E., Diskin, G. S., DiGangi, J., Hahn, V., Heckl, C., Huber, F., Nowak, J. B., Rapp, M., Rauch, B., Robinson, C., Schripp, T., Shook, M., Winstead, E., Ziemba, L., Schlager, H., and Anderson, B. E.: Cleaner burning aviation fuels can reduce contrail cloudiness, Commun. Earth Environ., 2, 1–10, https://doi.org/10.1038/s43247-021-00174-y, 2021. a
Voigt, C., Lelieveld, J., Schlager, H., Schneider, J., Curtius, J., Meerkötter, R., Sauer, D., Bugliaro, L., Bohn, B., Crowley, J., Erbertseder, T., Groß, S., Hahn, V., Li, Q., Mertens, M., Pöhlker, M., Pozzer, A., Schumann, U., Tomsche, L., and Rapp, M.: Cleaner skies during the COVID-19 lockdown, B. Am. Meteorol. Soc., 103, E1796–E1827, https://doi.org/10.1175/BAMS-D-21-0012.1, 2022. a, b
Wang, Z., Bugliaro, L., Jurkat-Witschas, T., Heller, R., Burkhardt, U., Ziereis, H., Dekoutsidis, G., Wirth, M., Groß, S., Kirschler, S., Kaufmann, S., and Voigt, C.: Observations of microphysical properties and radiative effects of a contrail cirrus outbreak over the North Atlantic, Atmos. Chem. Phys., 23, 1941–1961, https://doi.org/10.5194/acp-23-1941-2023, 2023. a, b
Waterman, P. C.: Symmetry, Unitarity, and Geometry in Electromagnetic Scattering, Phys. Rev. D, 3, 825–839, https://doi.org/10.1103/PhysRevD.3.825, 1971. a
Weigel, R., Spichtinger, P., Mahnke, C., Klingebiel, M., Afchine, A., Petzold, A., Krämer, M., Costa, A., Molleker, S., Reutter, P., Szakáll, M., Port, M., Grulich, L., Jurkat, T., Minikin, A., and Borrmann, S.: Thermodynamic correction of particle concentrations measured by underwing probes on fast-flying aircraft, Atmos. Meas. Tech., 9, 5135–5162, https://doi.org/10.5194/amt-9-5135-2016, 2016. a, b, c
Wendisch, M., Pilewskie, P., Pommier, J., Howard, S., Yang, P., Heymsfield, A. J., Schmitt, C. G., Baumgardner, D., and Mayer, B.: Impact of cirrus crystal shape on solar spectral irradiance: A case study for subtropical cirrus, J. Geophys. Res.-Atmos., 110, D03202, https://doi.org/10.1029/2004JD005294, 2005. a
Wendisch, M., Yang, P., and Pilewskie, P.: Effects of ice crystal habit on thermal infrared radiative properties and forcing of cirrus, J. Geophys. Res.-Atmos., 112, D08201, https://doi.org/10.1029/2006JD007899, 2007. a
Wendisch, M., Brückner, M., Burrows, J., Crewell, S., Dethloff, K., Ebell, K., Lüpkes, C., Macke, A., Notholt, J., Quaas, J., Rinke, A., and Tegen, I.: Understanding Causes and Effects of Rapid Warming in the Arctic, Eos, 98, https://doi.org/10.1029/2017EO064803, 17 January 2017. a
Wendisch, M., Brückner, M., Crewell, S., Ehrlich, A., Notholt, J., Lüpkes, C., Macke, A., Burrows, J. P., Rinke, A., Quaas, J., Maturilli, M., Schemann, V., Shupe, M. D., Akansu, E. F., Barrientos-Velasco, C., Bärfuss, K., Blechschmidt, A.-M., Block, K., Bougoudis, I., Bozem, H., Böckmann, C., Bracher, A., Bresson, H., Bretschneider, L., Buschmann, M., Chechin, D. G., Chylik, J., Dahlke, S., Deneke, H., Dethloff, K., Donth, T., Dorn, W., Dupuy, R., Ebell, K., Egerer, U., Engelmann, R., Eppers, O., Gerdes, R., Gierens, R., Gorodetskaya, I. V., Gottschalk, M., Griesche, H., Gryanik, V. M., Handorf, D., Harm-Altstädter, B., Hartmann, J., Hartmann, M., Heinold, B., Herber, A., Herrmann, H., Heygster, G., Höschel, I., Hofmann, Z., Hölemann, J., Hünerbein, A., Jafariserajehlou, S., Jäkel, E., Jacobi, C., Janout, M., Jansen, F., Jourdan, O., Jurányi, Z., Kalesse-Los, H., Kanzow, T., Käthner, R., Kliesch, L. L., Klingebiel, M., Knudsen, E. M., Kovács, T., Körtke, W., Krampe, D., Kretzschmar, J., Kreyling, D., Kulla, B., Kunkel, D., Lampert, A., Lauer, M., Lelli, L., von Lerber, A., Linke, O., Löhnert, U., Lonardi, M., Losa, S. N., Losch, M., Maahn, M., Mech, M., Mei, L., Mertes, S., Metzner, E., Mewes, D., Michaelis, J., Mioche, G., Moser, M., Nakoudi, K., Neggers, R., Neuber, R., Nomokonova, T., Oelker, J., Papakonstantinou-Presvelou, I., Pätzold, F., Pefanis, V., Pohl, C., van Pinxteren, M., Radovan, A., Rhein, M., Rex, M., Richter, A., Risse, N., Ritter, C., Rostosky, P., Rozanov, V. V., Donoso, E. R., Garfias, P. S., Salzmann, M., Schacht, J., Schäfer, M., Schneider, J., Schnierstein, N., Seifert, P., Seo, S., Siebert, H., Soppa, M. A., Spreen, G., Stachlewska, I. S., Stapf, J., Stratmann, F., Tegen, I., Viceto, C., Voigt, C., Vountas, M., Walbröl, A., Walter, M., Wehner, B., Wex, H., Willmes, S., Zanatta, M., and Zeppenfeld, S.: Atmospheric and Surface Processes, and Feedback Mechanisms Determining Arctic Amplification: A Review of First Results and Prospects of the (AC)3 Project, B. Am. Meteorol. Soc., 104, E208–E242, https://doi.org/10.1175/BAMS-D-21-0218.1, 2023. a
Wernli, H. and Davies, H.: A Lagrangian-based analysis of extratropical cyclones. I: The method and some applications, Q. J. Roy. Meteor. Soc., 123, 467–489, https://doi.org/10.1002/qj.49712353811, 1997. a, b
Wernli, H., Boettcher, M., Joos, H., Miltenberger, A. K., and Spichtinger, P.: A trajectory-based classification of ERA-Interim ice clouds in the region of the North Atlantic storm track, Geophys. Res. Lett., 43, 6657–6664, https://doi.org/10.1002/2016GL068922, 2016. a, b, c, d, e, f
Wilhelm, L., Gierens, K., and Rohs, S.: Meteorological Conditions That Promote Persistent Contrails, Appl. Sci.-Basel, 12, 4450, https://doi.org/10.3390/app12094450, 2022. a, b
Wolf, V., Kuhn, T., Milz, M., Voelger, P., Krämer, M., and Rolf, C.: Arctic ice clouds over northern Sweden: microphysical properties studied with the Balloon-borne Ice Cloud particle Imager B-ICI, Atmos. Chem. Phys., 18, 17371–17386, https://doi.org/10.5194/acp-18-17371-2018, 2018. a, b, c, d, e, f, g, h, i, j, k
Zhu, J. and Penner, J. E.: Radiative forcing of anthropogenic aerosols on cirrus clouds using a hybrid ice nucleation scheme, Atmos. Chem. Phys., 20, 7801–7827, https://doi.org/10.5194/acp-20-7801-2020, 2020. a