the Creative Commons Attribution 4.0 License.
the Creative Commons Attribution 4.0 License.
 | 16 Oct 2023
Quantified effect of seawater biogeochemistry on the temperature dependence of sea spray aerosol fluxes
Karine Sellegri
Theresa Barthelmeß
Jonathan Trueblood
Antonia Cristi
Evelyn Freney
Clémence Rose
Neill Barr
Mike Harvey
Karl Safi
Stacy Deppeler
Karen Thompson
Wayne Dillon
Anja Engel
Cliff Law
Future change in sea surface temperature may influence climate via various air–sea feedbacks and pathways. In this study, we investigate the influence of surface seawater biogeochemical composition on the temperature dependence of number-based sea spray emission fluxes. The dependence of sea spray fluxes was investigated in different water masses (i.e., subantarctic, subtropical and frontal bloom) with contrasting biogeochemical properties across a temperature range from ambient (13–18 ∘C) to 2 ∘C using seawater circulating in a plunging jet sea spray generator. We observed a significant increase in the sea spray total concentration at temperatures below 8 ∘C. Specifically, at 2 ∘C, there was an average 4-fold increase compared to the initial concentration at ambient temperatures. This temperature dependence was more pronounced for smaller-sized sea spray particles (i.e., nucleation and Aitken modes). Moreover, the temperature dependence varied based on the seawater type and its biogeochemical properties. While the sea spray flux at moderate temperatures (8–11 ∘C) was highest in frontal-bloom waters, the effect of low temperature on the sea spray flux was highest in subtropical seawaters. The temperature dependence of the sea spray flux was found to be inversely proportional to the abundance of the cyanobacterium Synechococcus in seawater. This relationship allows for parameterizing the temperature dependence of sea spray emission fluxes based on Synechococcus, which may be utilized in future modeling exercises.
- Article
(1767 KB) - Full-text XML
-
Supplement
(810 KB) - BibTeX
- EndNote


In the open ocean, bursting bubbles generated by breaking waves cause particles to be ejected into the atmosphere in the form of sea spray aerosols (SSAs) that may influence climate either via scattering solar radiation (Schulz et al., 2006; Bates et al., 2006) or by forming cloud droplets (Pierce and Adams, 2006) or ice crystals (Burrows et al., 2013). Recent modeling studies have highlighted large knowledge gaps related to sea spray emissions, particularly with regard to the submicron size and effect of organic matter (Bian et al., 2019; Regayre et al., 2020). Sea spray emission fluxes mainly depend on wind speed, which determines the presence of breaking waves, with a threshold of 4 m s−1, above which sea spray is emitted to the atmosphere. Another important parameter is surface seawater temperature (SST) as the size of bubbles rising to the surface, as well as physical parameters such as the thickness of the breaking bubble films, depends on surface tension, viscosity and density, which are all a function of seawater temperature. Also, organic matter in surface seawater influences the bubble-bursting process as organics may alter sea spray mass, number and size and so affect sea spray cloud condensation nuclei (CCN) properties (Fuentes et al., 2010b; Sellegri et al., 2021). Number-based emission fluxes are especially important for cloud formation as the CCN number is more important than mass for cloud properties. Fossum et al. (2018) calculate that, for high wind speeds, sea salt number concentrations may contribute 100 % of the CCN concentrations at realistic marine boundary layer cloud supersaturations in the Southern Ocean.
A number of sea salt aerosol emission parameterizations have been developed, but the resulting size-dependent sea spray fluxes range over 1 order of magnitude or more (de Leeuw et al., 2011; Ovadnevaite et al., 2014), particularly for sizes lower than 150 nm or larger than 1 µm (Grythe et al., 2014). This large discrepancy in sea spray emission flux parameterizations may reflect the different methods used to measure fluxes in ambient air and also the biophysical properties in different studies. For example, although fluxes are always parameterized as a function of wind speed, they are not always harmonized for a given seawater temperature or biological content, and when they are, they show contradicting results.
Using in situ and remote sensing (aerosol optical depth) measurements to constrain a global model, Jaeglé et al. (2011) derived a parameterization with sea spray flux increasing with temperature over the full temperature range investigated (0–30 ∘C). Consistently with these observations, Ovadnevaite et al. (2014) reported a positive relationship between sea spray mass fluxes and SST, derived from the observation of in situ coastal sea spray aerosol concentrations and meteorological parameters. Also, Grythe et al. (2014) generated a similar positive linear relationship between sea spray mass and SST from a large data set of fixed station and ship-borne aerosol measurements using sodium and a source receptor approach combined with a model. Lastly, Liu et al. (2021) derive a SST dependence of sea spray fluxes, expressed as sea spray mass for different wind speed ranges that agree with the previously mentioned trends. In summary, the majority of studies using ambient aerosol mass have identified a positive relationship between SSA and SST.
Laboratory experiments using a plunging-jet sea spray generator provide a means to investigate the temperature dependence of sea spray number flux (in contrast to sea spray mass flux) across various ranges of sea spray size and temperature. Usually, relationships derived from number concentration flux measurements in the laboratory, dominated by submicron sea spray aerosols, differ considerably from those obtained from optical ambient measurements such as those described above. Martensson et al. (2003) provide two different temperature dependences of the sea spray flux over the SST range 0–25 ∘C: one for submicron sea spray, showing an increase of the flux with decreasing temperature, and one for the supermicron size range of sea spray, with increasing flux of sea spray with SST. Similar opposing behavior between submicron and supermicron particles was reported by Bowyer et al. (1990). Salter et al. (2014) also found differences in the sea spray fluxes when considering small and larger sizes of sea spray, but they additionally showed different dependences on either side of a temperature threshold of 10 ∘C, i.e., increasing fluxes with increasing SST above 10 ∘C and decreasing fluxes with increasing SST below this limit. Schwier et al. (2017) found an increase in submicron sea spray fluxes with Mediterranean seawater at temperatures in the range of 22–29 ∘C, confirming the results from Salter et al. (2014). Recently, Christiansen et al. (2019) provided a detailed study on the impact of air entrainment and water temperature. Their work confirmed the physical impact of temperature on synthetic seawater with an increase in sub-micrometer sea-spray aerosol with decreasing temperature below 6–10 ∘C and an increase of sub-micrometer sea-spray aerosol with increasing temperature above this range.
Temperature has an impact on seawater viscosity, density and surface tension, with all these parameters increasing when temperature decreases, and it also impacts the evaporation rate of the bubble film. Thorpe et al. (1992) used a numerical model that showed a significant decrease of the mean bubble concentration with increasing temperature, with a halving for every 10 ∘C for bubbles with radii in the 10–150 µm range. However, Christiansen et al. (2019) reported little change with temperature in air entrainment flows via a plunging-jet system over the temperature range of −2 to 35 ∘C, and Zábori et al. (2012) did not detect any change with temperature of the bubble size distribution in natural seawater over the range of −2 to 10 ∘C.
It appears from the large discrepancies between temperature dependences of the sea spray flux derived from these different approaches that the factors controlling the SSA fluxes are not fully understood and so are not well conceptualized and represented. In their study, Forestieri et al. (2018) highlight that the seawater temperature sensitivity of SSA produced in plunging-jet experiments differs greatly between synthetic and natural seawaters. Unlike experiments using synthetic salt solutions that show a monotonic increase of the sea spray fluxes with seawater temperature, the dependence of sea spray fluxes on temperature in natural seawaters showed substantial inconsistencies. The authors hypothesize that biological processes induce variations in the surface-active species in the seawater that drive changes in the sea spray fluxes.
Surfactants influence the bubble-bursting mechanism by decreasing or increasing bubble lifetime and size (Modini et al., 2013; Tyree et al., 2007). The presence of surfactants in seawater can cause a decrease in the average SSA size (Sellegri et al., 2006) and an increase or decrease in the number-based production flux of particles ejected (Tyree et al., 2007; Zábori, et al., 2012) depending on the type of surfactant. Surfactants in the seawater may originate from phytoplankton exudates in the form of dissolved organic matter (carboxylic acids, lipids, amino acids, carbohydrates, etc.) (Aluwihare and Repeta, 1999; Barthelmeß and Engel, 2022). Surfactant production has been demonstrated with healthy cells of different phytoplankton groups (Ẑutić et al., 1981) and also during the grazing of heterotrophic flagellates and ciliates on bacteria (Kujawinski et al., 2002). In Sellegri et al. (2021), it was shown that the SSA number production flux was a function of the nanophytoplankton cell abundances in surface seawater for a given temperature. In the same study, sea spray production fluxes were related to seawater fatty acid concentrations and were associated with a change in seawater surface tension. A clear relationship between nanophytoplankton abundance, the release of labile organic matter and surface activity was also recently confirmed by Barthelmeß and Engel (2022). The role that surfactants play in determining seawater surface tension and the resulting bubbles at low temperatures is, however, unclear and may depend on the nature of the surfactants present. To address these uncertainties, we investigate the temperature dependence of sea spray aerosols generated from the natural seawater of contrasting water masses of the southwestern Pacific Ocean under a temperature gradient equivalent to the 25-year average summer seawater temperature range of the Southern Ocean (Auger et al., 2021) and relate this to the biogeochemical properties of the surface water.
Measurements were performed during the Sea2Cloud voyage that took place in March 2020 east of New Zealand on board the R/V Tangaroa (Sellegri et al., 2022). The region east of the New Zealand South Island provides an ideal platform for investigating variability in SSA and its relationship with surface ocean biogeochemistry due to the close proximity of different water masses (Law et al., 2018). The Sea2Cloud voyage occupied frontal water from 17 March, 11:00 NZDT, to 20 March 2020, 17:00 NZDT; then subantarctic water (SAWs) until 24 March 2020, 04:00 NZDT; then subtropical waters (STWs) until 25 March 2020, 08:00 NZDT; and finally mixed-shelf water until 27 March 2020. The Subtropical Front which runs along 43–43.5∘ S separates subtropical and subantarctic water and is evident year-round in ocean color images as an area of elevated phytoplankton biomass relative to the low-biomass water masses on either side.
Sea spray was continuously generated with a plunging-jet system, as described in detail in Sellegri et al. (2023) and previously used in Schwier et al. (2015, 2017), Trueblood et al. (2021), Freney et al. (2021) and Sellegri et al. (2021). The 10 L tank was operated with a 10 cm seawater depth; thus, jet and film drops did not interact with the tank's top, located 15 cm above the seawater level. Given the jets total flow rate of 1.2 L min−1, this relatively small seawater volume results in a low residence time (4 min), thus preventing changes to the biology or sedimentation of large species that occur in larger chambers (Dall'Osto et al., 2022). The small dimensions of our system also correspond to a short residence time of air in the headspace (12 s), preventing potential gas-phase reactions with lab air. Eight plunging jets were created by flushing seawater through 1 µm orifices that were equally spaced along a stainless-steel tube, located at 5 cm below the tank's top in the chamber diagonal. Jets penetrate the seawater volume at a depth of 7 cm and therefore do not interact with the chamber bottom. Free-floating bubbles could occasionally meet the tank's wall as they floated away from the center of the tank. For this reason and others such as the continuous jets vs. intermittent wave-breaking process, fluxes derived from our experiments, similarly to all controlled lab experiments, are necessarily different from the ones obtained from the natural wave breaking in the open ocean. Natural conditions were, however, mimicked as much as was possible. The sea spray generation system was operated at a near-constant jet flow rate and reproduced sea spray size distributions of similar shape to those reported for other plunging-jet devices (Fuentes et al., 2010a). The system was fed continuously with seawater sampled from a depth of ∼6 m by the underway seawater supply. Once a day, the flow-through seawater system of the plunging-jet system was switched from seawater directly coming from the ship's underway seawater system to cooled seawater that had been stored in a 50 L temperature-controlled reservoir immediately before the temperature experiments started (filling time less than 5 min – Fig. 1). Temperature gradients between 2 and 15 ∘C were applied to the seawater over approximately 1 h, with an initial decreasing temperature ramp, followed by an increasing temperature ramp. The experiments were stopped when the temperature-controlled reservoir had emptied. These relatively fast temperature changes were applied so that the seawater biology did not have the time to evolve, our goal being to investigate the physical dependence of fluxes on instant biogeochemistry. Temperature experiments were performed every morning around 11:00 NZDT from 18 to 26 March 2020, with an additional experiment in the afternoon of 26 March 2020.
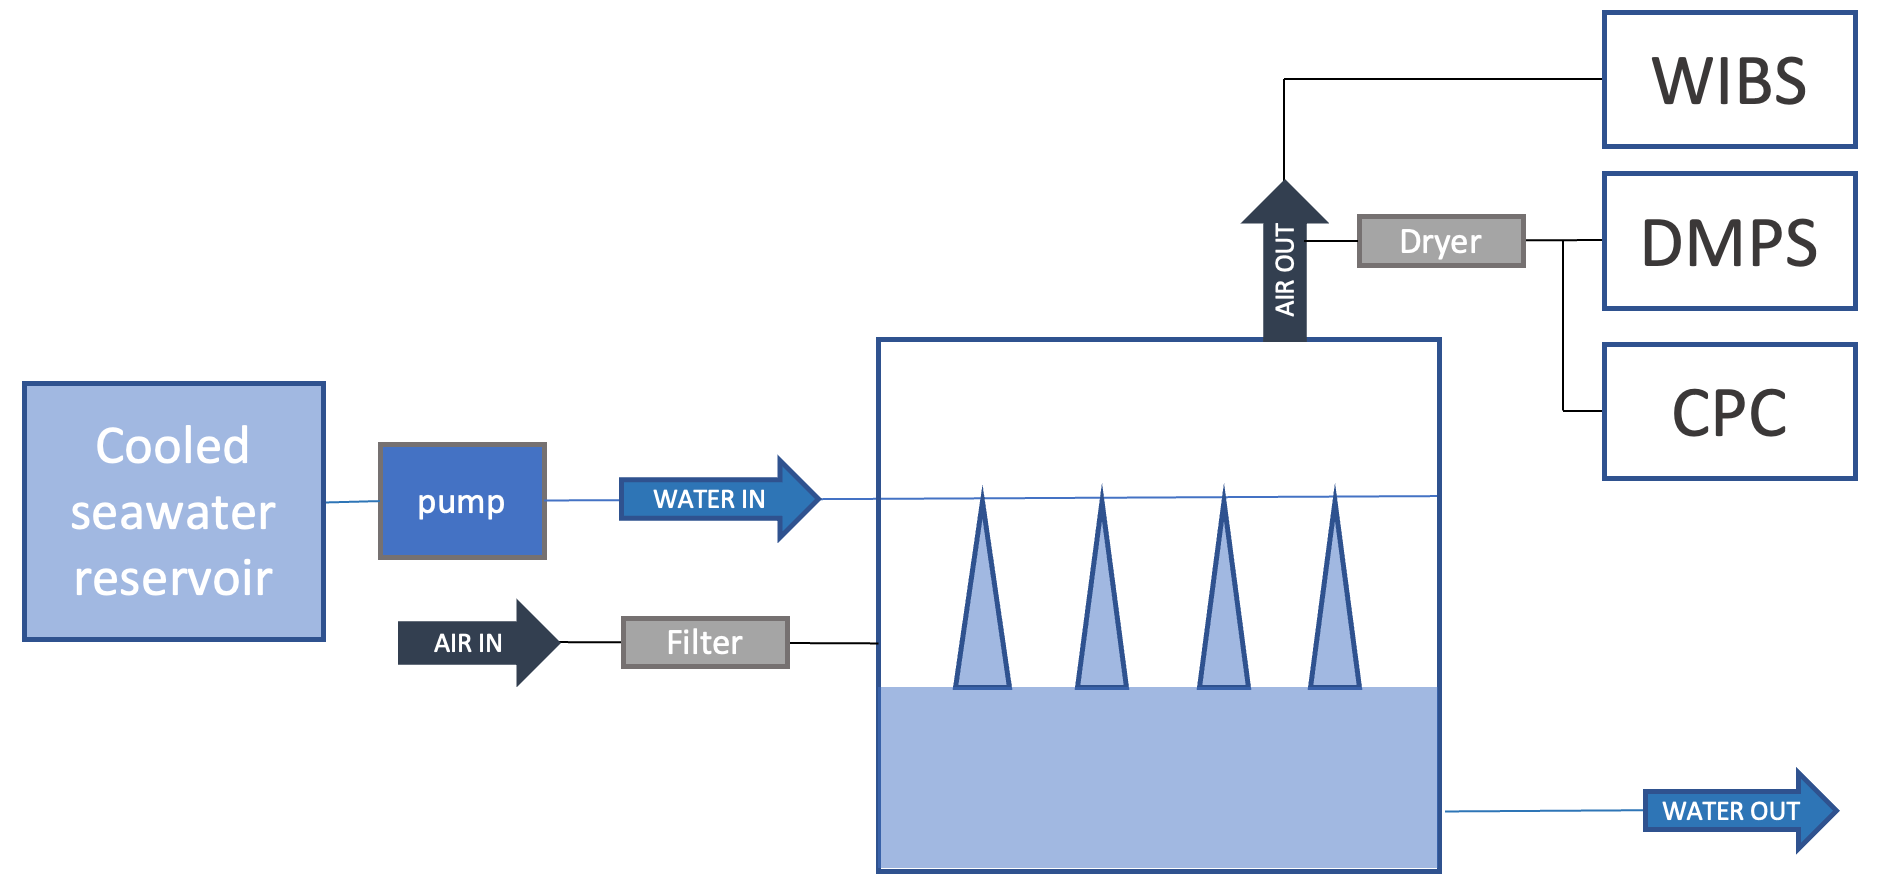
Figure 1Schematics of the experimental setup used to characterize the temperature dependence of SSA fluxes.
For submicron particles, SSAs were taken through a stainless-steel line to a 1 m long silica gel diffusion drier followed by an impactor with PM1 diameter cutoff. Particle size distributions were monitored by a differential mobility particle sizer system (DMPS) at 1 L min−1, with a separate line to a condensation particle counter (MAGIC CPC – flow rate 0.3 L min−1) connected in parallel for validation. The DMPS system was preceded by a soft X-ray aerosol neutralizer (TSI model 3088) and consisted of a TSI-type custom-built differential mobility analyzer (length of 44 cm) operated at a sheath flow rate of 5.0 L min−1 for selecting the particle size range of 10–500 nm across 26 size bins during a 13 min, 40 s scan and a TSI CPC model 3010. Relative humidity at the inlet was monitored and kept below 35 % at all times. Another short, smooth curvature antistatic Teflon line brought the generated SSA to a Waveband Integrated Bioaerosol Sensor (WIBS) for diameters ranging from 500 nm up to 4500 nm.
The flux of SSAs was calculated from the SSA total number concentration as follows:
where CNtot is the concentration of SSAs measured from the MAGIC CPC, Qflush is the flushing air flow rate inside the tank's headspace, and Stank is the surface of seawater inside the tank. In Sellegri et al. (2021), hereafter referred to as SELL21, the concentration of >100 nm particles was used as a proxy for CCN concentration. For comparison to SELL21, we also calculated fluxes of SSAs larger than 100 nm. The flux of CN100 () was calculated in a similar manner to Eq. (1):
where CN100 is the concentration of SSAs with diameters larger than 100 nm. Calibration experiments performed following the procedure of Salter et al. (2014) enabled us to established that the air entrainment flow rate (Fent) in our system is 4.5 L air per minute under the jet operational conditions (seawater flow rate of 1.25 L min−1, orifices' diameters, jet distance to seawater surface). The setup used to measure (Fent) reproduced one of the eight plunging jets set in a separate, larger tank with the same distance to seawater and the same seawater depth as in the main experimental setup. For the air entrainment measurements, the jet was enclosed in a vertical plunging tubing (at 1 cm depth) connected to a TSI flow meter. The seawater flow rate was varied from 150 to 400 mL min−1, and the relationship between seawater flow rate and entrainment air flow rate was fitted to obtain a calibration curve of our setup. Air entrainment flow rate calibrations were performed at moderate temperatures around 20 ∘C and also at lower temperatures that showed the undetectable influence of the seawater temperature on the air entrainment flow rate.
Given that, according to Long et al. (2011), the flux of air entrained (Fent) during wave breaking can be related to wind speed at 10 m (U10) following
With the above, we calculate that our plunging-jet system simulated a bubble volume distribution equivalent to that produced at a wind speed of 9 m s−1. For the data acquired with a seawater flow rate that deviated from 1.25 L min−1, fluxes were normalized to the 9 m s−1 equivalent wind speed with the following relationship:
where QSW is the seawater flow rate. Equation (4) was obtained by varying QSW over a short period (less than an hour) and fitting the flux dependence to QSW. Normalization resulted in a change of less than 30 % in the fluxes for 80 % of the data. The seawater surface tension was measured from the ship's underway seawater line at 08:00, 12:00, 16:00 and 20:00 NZDT using the bubble lifetime method with a DynoTester along a temperature gradient from 2 to 15 ∘C. The temperature gradient for surface tension measurements was achieved on board the ship with fresh seawater samples by first freezing 25 mL seawater sampled in Falcon tubes, with surface tension measured while the sample slowly warmed to ambient temperatures; this took less than 1 h, which limited the time for any seawater biogeochemistry changes to occur. A bias may exist in the surface tension measured here after samples have been frozen compared to the surface tension of a sample that would have not experienced freezing due to the impact of freezing on, for example, the rupture of phytoplankton cells releasing organic matter. Future studies should investigate how freezing may impact surface tension.
For the analysis of the seawater biogeochemical properties, discrete water samples were collected from the ship's underway seawater line into an acid-cleaned 10 L plastic carboy at 4 h intervals (00:00, 04:00, 08:00, 12:00, 16:00, 20:00 NZDT). Sample bottles were either processed immediately or stored in the dark in Engel portable fridge or freezer units at in situ temperature for the water mass (max. operating temperature: 9 ∘C) and processed within 8 h of collection. Sample volumes for filtering were determined from the ECO Triplet fluorescence data noted during sample collection. Seawater aliquots were taken from the carboy for chlorophyll a (Chl a), macronutrients, total organic carbon (TOC) and microbial community composition (flow cytometry and microscopy), all of which were analyzed on land post-voyage.
For chlorophyll a analysis, 250 mL of seawater was filtered through 25 mm GF/F filters, and the pigment retained on the filters was extracted with 90 % acetone and measured by spectrofluorometry using a Varian Cary spectrofluorometer. For macronutrient analysis, 250 mL of seawater was filtered through 25 mm GF/F filters into 250ml plastic bottles, and nutrients (ammonia, nitrate and nitrite, dissolved reactive phosphorus, and silica) were measured on a SEAL AA3 AutoAnalyzer (Law et al., 2011). The TOC content of samples was analyzed by catalytic oxidation (TOC-VCSH analyzer, Shimadzu) after the modified protocol of Sugimura and Suzuki (1988) (Engel and Galgani, 2016). Samples were filled into 20 mL pre-combusted glass ampules (8 h at 500 ∘C), acidified with 20 µL of 32 % HCl, subsequently sealed and stored at 4 ∘C until the analysis.
For flow cytometry, duplicated 1.5 mL seawater samples were preserved with a solution containing 0.5 % glutaraldehyde (Naik and Anil, 2017), flash frozen and stored at −80 ∘C. Samples were analyzed with a BD FACSCalibur instrument, and Synechococcus and picoeukaryote cells were quantified using Trucount™ beads (Becton Dickinson, Mountain 108 View, CA), as described in Hall and Safi (2001). Total numbers of heterotrophic bacteria, eukaryotic nanophytoplankton (2–20 µm), and prokaryotic and eukaryotic picophytoplankton (<2 µm) were determined by flow cytometry using a BD Accuri™ C6 Plus instrument (BD Biosciences). Bacteria samples were stained with Sybr Green II, and a minimum of 20 000 bacteria events were analyzed using an SSC (single scattering coefficient) vs. FL1 (the signal obtained of the fluorescence channel 1) plot. For the phytoplankton analyses, 250 µL of sample was analyzed, and the eukaryotic plankton populations were identified using a SSC vs. FL3 plot, while the prokaryotic picoplankton (Synechococcus sp.) population was identified using a FL % with Lugol's iodine solution, and phytoplankton community composition and cell numbers for species > 5 µm were determined using optical microscopy, as described in Safi et al. (2007) and references therein.
3.1 General feature of the seawaters investigated
The subtropical water north of the Front is warmer and saltier, relative to the colder, fresher, subantarctic water, with lower dissolved inorganic nutrients, particularly nitrogen and TOC. This variation in physical properties and nutrient availability results in different biological communities in the three water masses, with the Front characterized by blooms of different phytoplankton groups in spring and summer (Delizo et al., 2007; Law et al., 2017). Frontal waters contained higher cell abundances of nanophytoplankton (2–20 µm) than any other water masses sampled during the voyage, whereas cell abundances of the picoplankton (<2 µm) Synechococcus were conversely higher in subantarctic and mixed or shelf water relative to frontal water (Fig. 2). Diatom abundance was correlated with nanophytoplankton cell abundances (R2=0.57, p<0.01). Differences in biological communities subsequently influence the biogeochemical properties of these water masses, resulting in differential effects upon aerosol precursors (Law et al., 2018; Sellegri et al., 2023; Rocco et al., 2023).
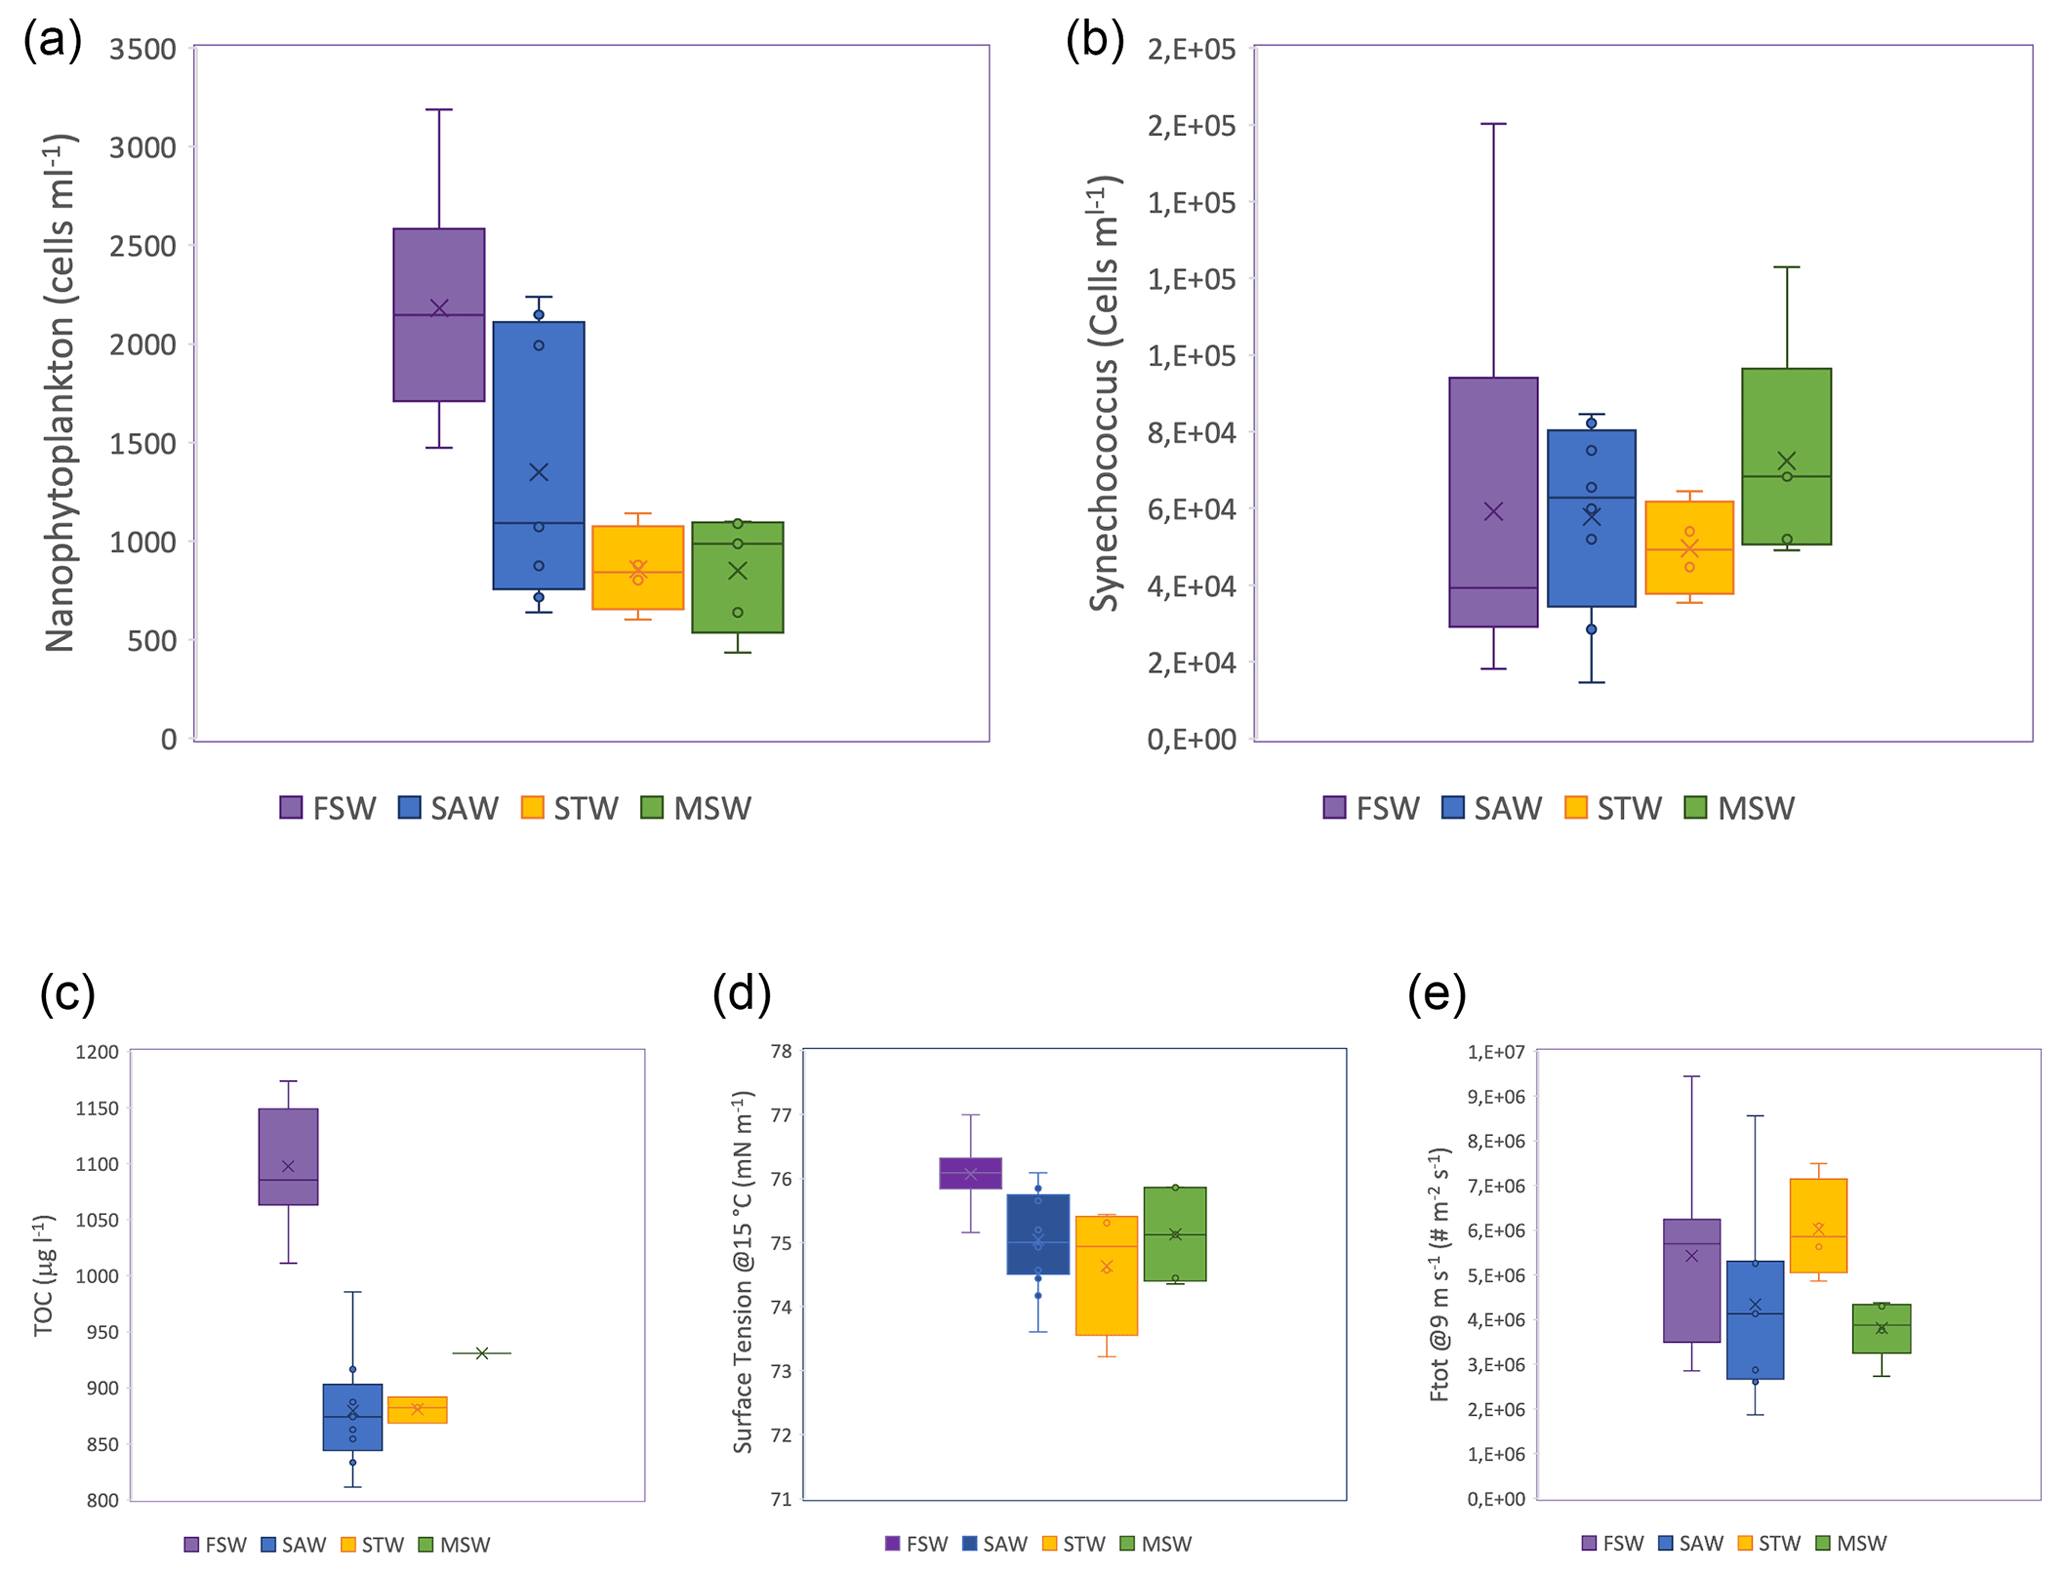
Figure 2Boxplot for the different seawater types of (a) TOC content, (b) nanophytoplankton, (c) Synechococcus cell abundances, (d) surface tension of seawater samples for SST of 15 ∘C (right axis) and (e) total SSA flux measured at ambient SST (ranging from 13 to 15 ∘C) and normalized for 9 m s−1 (left axis). Color-shaded areas represent the different water masses, as indicated by the labels in (a), sampled during the Sea2Cloud voyage (Sellegri et al., 2023).
3.2 Sea spray fluxes at moderate ambient temperatures
The SSA fluxes measured at ambient SST (13–18 ∘C) for the different seawater types are reported in Fig. 2d. We observed that the SSA flux decreased from biologically rich frontal waters to subantarctic seawaters that contained lower phytoplankton abundance, reflected by the nanophytoplankton cell abundance (NanoPhyto) (Fig. 2b and Sellegri et al., 2023). In Sellegri et al. (2021), a relationship was found between the flux of SSA > 100 nm in size and the NanoPhyto. Recently, Dall'Osto et al. (2022) also found increased SSA number production fluxes from nanophytoplankton-rich seawater but did not quantify the SSA flux-to-nanophytoplankton cell abundance relationship.
Figure 3 presents this relationship between and NanoPhyto for the Sea2Cloud data in comparison with data sets from other regions (SELL21). NanoPhyto during Sea2Cloud were higher on average and spanned a larger range (1490±732 cells per milliliter) than in oligotrophic Mediterranean waters (546±148 cells per milliliter) and springtime Arctic waters, in which NanoPhyto were almost absent (4.2±4.3 cells per milliliter); however, they were lower than in a nutrient-enriched mesocosm experiment in New Zealand coastal waters (4880±2390 cells per milliliter). When combining these five data sets, the showed a weaker dependence than reported in SELL21 but still confirmed the linear dependence of on NanoPhyto, with a significant correlation (R2=0.78, p<0.05). The coefficients of the revised fit differ only slightly compared to SELL21, with a greater statistical significance than for the individual data sets (R2=0.78 vs. 0.31 for the Sea2Cloud data set). Following the SELL21 approach, the relationship was reformulated with expressed as a function of both NanoPhyto and , with corresponding to in the absence of biological activity (i.e., solely inorganic chemical components), and hence shown as the intercept of the y axis (2.41×10⁵ m−2 s−1):
The primary motivation for this reformulation was to allow a simpler implementation of the parameterization in models that already include the calculation of . As a reminder, the fluxes used to derive Eq. (5) were normalized to U10=9 m s−1 and SST = 15 ∘C. We cannot exclude that the dependence of on NanoPhyto changes for different wind regimes, but not having this information, we assume here that Eq. (1) applies to the calculation of regardless of U10.
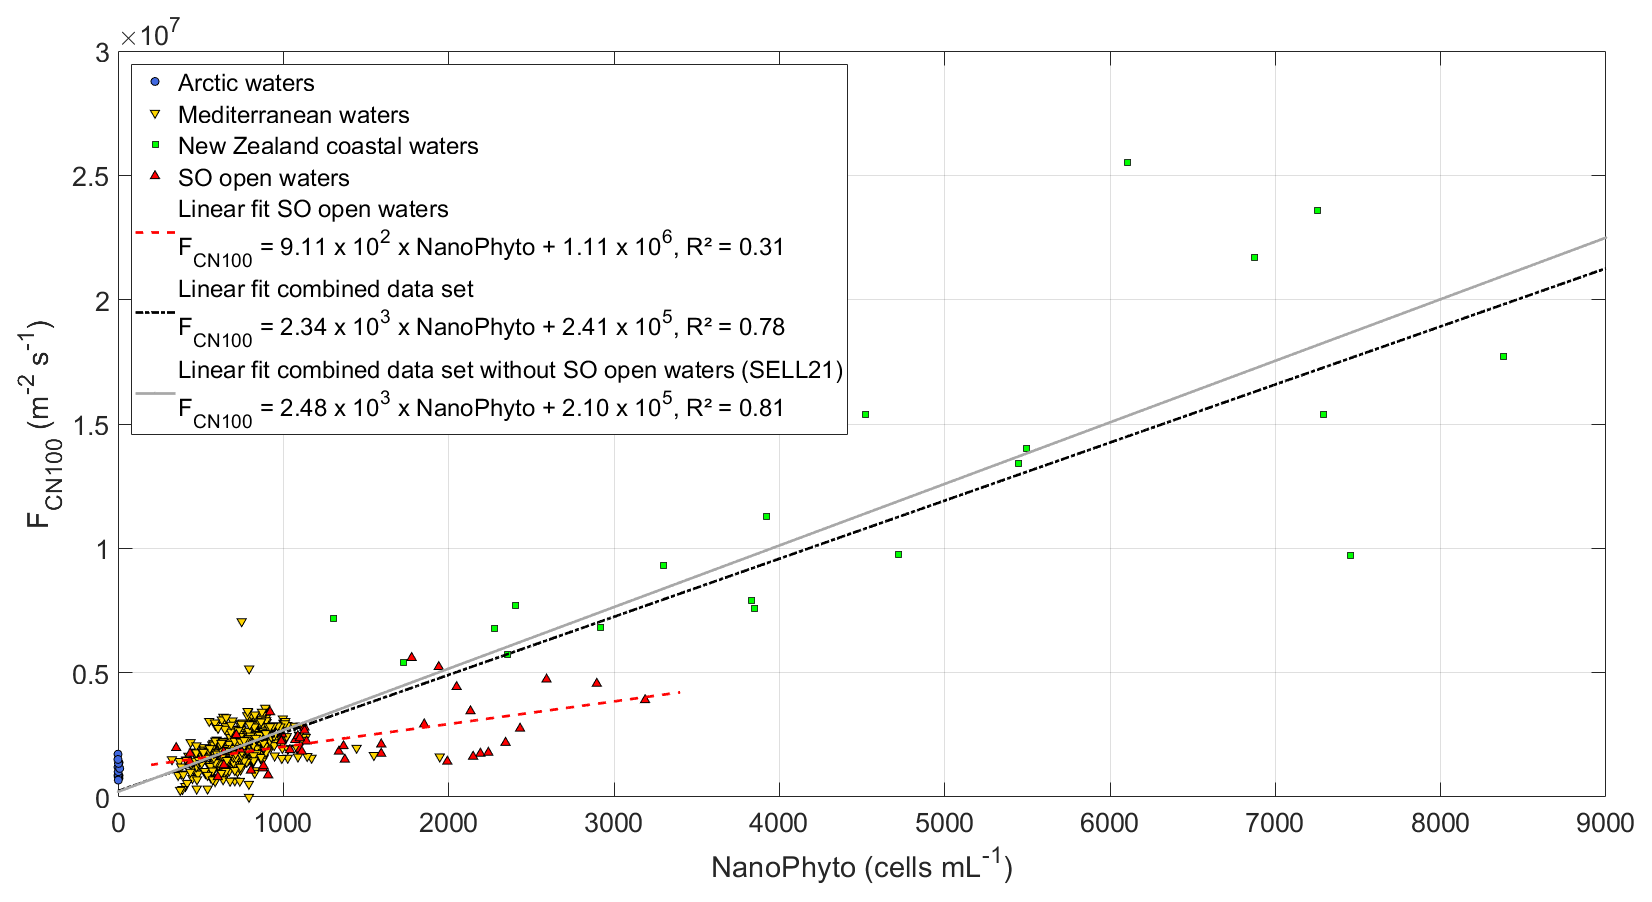
Figure 3SSA-derived CN100 number fluxes as a function of NanoPhyto (nanophytoplankton cell abundance) for the four regional data sets (Sea2Cloud data set indicated as SO for Southern Ocean), normalized to an equivalent wind speed of 9 m s−1 and SST of 15 ∘C. The linear fits to the Sea2Cloud data and combined data set are shown with their corresponding equations and R2, with the previously reported SELL21 relationship shown for comparison.
Surface tensions of the seawater show large differences between water types for a given temperature at moderate temperatures > 8 ∘C (Fig. 2d). Given that both salinity and temperature influence surface tension, we performed a sensitivity test on the potential impact of salinity on the differences in surface tension observed for different seawater types. Salinity ranges of the different seawater types were 34.2–34.4 g L−1 in SAWs, 34.4–34.8 g L−1 in frontal and mixed seawaters, 34.8–35.3 g L−1 in STWs, and 34.4–34.8 g L−1 in mixed seawaters. We calculate that these salinity ranges correspond to ideal surface tension ranges of seawater at 15 ∘C (Nayar et al., 2014) of 74.500–74.502 nN m−1 in SAWs, 74.502–74.514 nN m−1 in frontal and mixed seawaters, and 74.514–74.523 nN m−1 in STWs. Consequently, there is a negligible impact on surface tension within the range of salinities observed. We observe that surface tension is highest for the biologically rich frontal seawaters and lowest for the STWs. This result is somewhat different from the results of Poulain and Barouiba (2018), who suggest that the presence of heterotrophic bacteria and their released surfactants induce the prolongation of lifetime (and therefore lower surface tension). Barthelmeß and Engel (2022) reported a dependence of surfactant release on nanophytoplankton abundance in the Baltic Sea.
Figure 2d also shows that the surface tension of the different seawater types at 15 ∘C mostly follow the SSA fluxes at ambient temperatures close to 15 ∘C. In our system, increased surface tension corroborates higher SSA number fluxes. Lower surface tension induces higher bubble lifetime and therefore thinner bubble films due to increased drainage and increased evaporation. Upon natural bubble bursting (i.e., if no external force is applied on the bubble film), thinner bubble films may generate a higher number of smaller droplets (Lhuissier and Villermaux, 2012; Poulain and Bourouiba, 2018). In our system, bubble films are prematurely broken by external forces. These external forces are (1) flushing air flow at the surface of the tank seawater surface (similarly to the action of wind), (2) seawater jets continuously splashing over the newly formed bubbles and (3) other bubbles reaching the surface where preexisting bubbles are present. Therefore, bubbles in our system likely do not reach a critical thickness such as the ones described in Lhuissier and Villermaux (2012) or Poulain and Bourouiba (2018).
3.3 Temperature dependence on total spray emission fluxes
For all low-temperature-gradient experiments, we observed an increase in sea spray total number fluxes with decreasing temperature in all seawater types (Fig. 4a). There was no or little change in sea spray flux with an increasing temperature ramp above 8–10 ∘C but a sharp, negative correlation of sea spray flux with increasing temperature below that threshold. This feature was previously observed by Salter et al. (2014) with inorganic seawater and also by Hultin et al. (2011) using Baltic seawater and a sea spray generation system similar to that in this study, although Hultin et al. (2011) reported an SSA emission flux increase with decreasing temperature below 12 ∘C already. We now discuss the potential factors that may constitute the origin of this SSA flux temperature dependence.
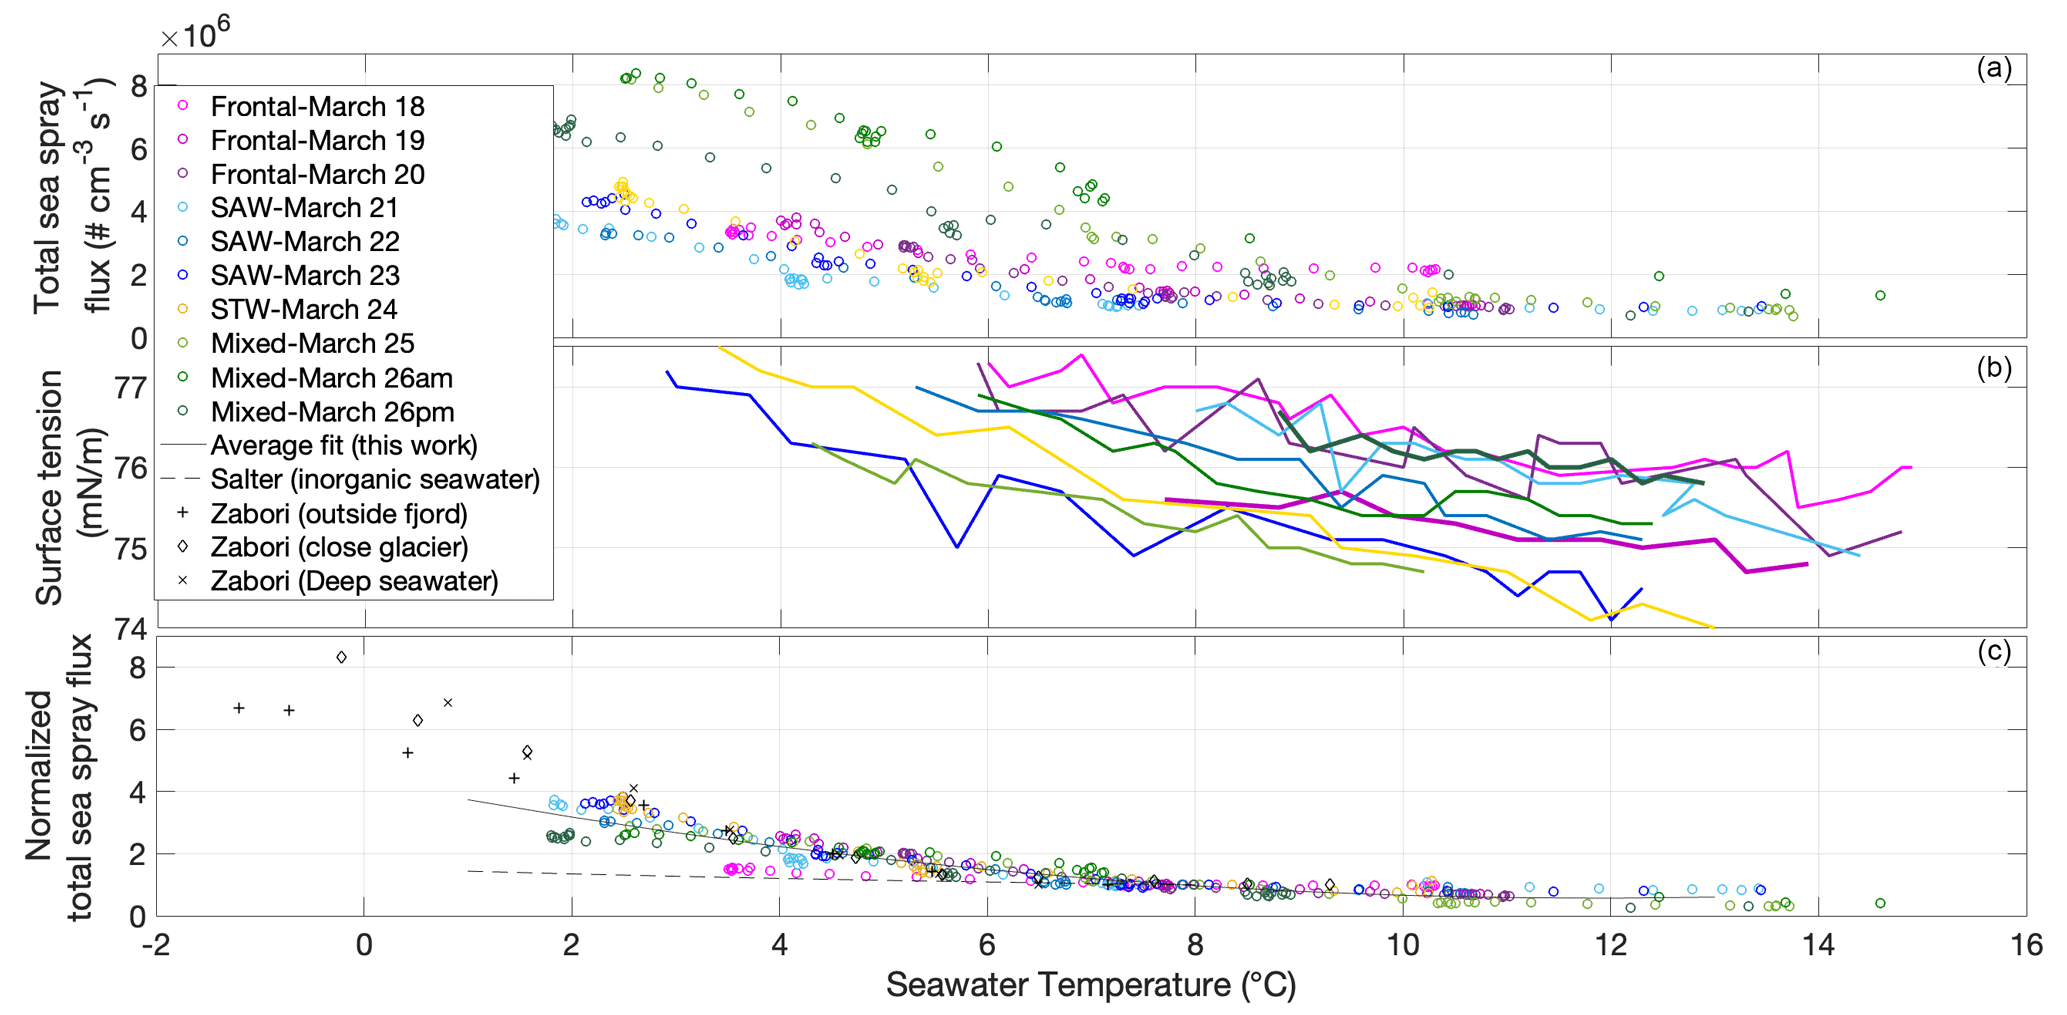
Figure 4(a) Sea spray number flux calculated using Eq. (1) as a function of seawater temperature during experiments performed in different water types. Color code corresponds to water type and dates of sampling, as in Fig. 1. (b) Surface tension of the surface seawater sampled at 12:00 NZDT for different dates and seawater types, measured as a function of seawater temperature. (c) Sea spray number flux normalized to sea spray flux measured at 8 ∘C () as a function of seawater temperature at different dates, with a comparison to the normalized fluxes () reported in Salter et al. (2014) for inorganic seawater and in Zábori et al. (2012) for natural arctic seawaters.
Our experiments were performed with ambient air temperature and therefore relatively constant air temperature and RH of the incoming flushing air. Hence, there is likely to be a change in the evaporation rate of the bubble film when the SST is decreased. However, the lower the SST is in comparison to the air temperature above, the lower the evaporation of the film would be. Moreover, film thinning due to evaporation becomes more important relative to film thinning due to drainage only for very thin films (Miguet et al., 2021). In our system, it is likely that bubble films are broken by external forces before they reach these very thin films at which evaporation matters (below 1 µm for millimetric bubbles, achieved after a lifetime of several tens of seconds; Miguet et al., 2021).
The results of surface tension measurements as a function of sample temperature during unfreezing are shown in Fig. 4b. Surface tension also showed a clear increase with decreasing temperature; therefore, higher surface tension corroborates higher SSA fluxes. However, the temperature dependence of surface tension is relatively monotonous (Fig. 4b), while the temperature dependence of the SSA flux is exponential (Fig. 4a). Also, the slope of surface tension in relation to temperature does not differ from one sample to the other. This is expected as the Eötvös' equation states that the temperature dependence of the surface tension is the same for almost all liquids. SST dependence of the evaporation rates should also be the same for all samples. One relevant variable that has varied with temperature in relation to the chemical composition of the solution is viscosity. Viscosity sensitivity to temperature depends not only on the concentration of organics but also on the ionic strength of the solution (pH, salinity), and it also increases exponentially with decreasing temperature (Mallet et al., 2020). An increase in viscosity implies an increase in the characteristic viscous time, which leads to the decrease in the bubble-film-cap-thinning rate (drainage) (Miguet et al., 2021). The average lifetimes of bubbles were found to be very sensitive to viscosity, especially when impurities are present (Miguet et al., 2021). Again, our results would suggest that thicker bubble film caps lead to higher concentrations of sea spray when bubbles are mainly broken by external forces. Observed differences in thermal behaviors between seawater types would possibly be explained by differences in the sensitivity of different organic compounds' viscosities in relation to temperature.
In order to decouple the biological impact on SSA fluxes at temperatures in the 8–15 ∘C range from the influence of lower temperatures, we normalized the sea spray flux at a given temperature (FT) with the sea spray flux at 8 ∘C (F8). As presented in Fig. 4c, this enabled an evaluation of the relative increase of the corresponding sea spray flux with respect to F8 for a given temperature in the same experiment. The normalization also facilitates a comparison of the flux–temperature relationship with that observed in the literature.
The best fit for the normalized sea spray flux temperature dependence is a polynomial fit of the second order of the following form:
When fitting each daily temperature experiment individually, we obtain a time series of coefficients p1 and p2, and, as p1 and p2 are highly correlated to p3, it can be expressed as a function of p3 in a final relationship:
When the fit is performed on all data together, p3=4.343. Therefore, on average, for a temperature of 1 ∘C, the sea spray flux is increased by a factor of approximately 4 relative to the flux at 8 ∘C. This parameterization is only valid for temperatures below 8 ∘C, whereas fluxes can be considered to be independent of temperature above 15 ∘C.
The different sensitivities to temperature of the SSA fluxes of different seawater types is obviously due to their different biogeochemical properties. The temporal variability of the fitting parameter p3 of Eq. (3) can be studied as a function of the seawater biogeochemical properties. We searched for correlations between p3 and the different phytoplankton communities (including nanophytoplankton, flagellates, diatoms and dinoflagellates), bacteria or biogeochemical variables (TOC, amino acids and carbohydrates). No relationship was found, except for a significant anticorrelation with Synechococcus cell abundance (R2=0.72, n=10, p<0.00001), with the following relationship showing the temperature dependence of SSA as a function of Synechococcus cell abundance, expressed in cells per milliliter:
The reason for this anticorrelation is not clear. Synechococcus spp. are autotrophic prokaryotes (bacteria) which are ubiquitously present throughout oceanic regimes (Zwirglemaier et al., 2008; Six et al., 2021). Synechococcus spp. occur within a wide temperature range from 0 to 30 ∘C but favor conditions around 10 ∘C on a global scale (Flombaum et al., 2013). While low temperatures can induce stress in Synechococcus spp. acclimated to higher temperatures, differences occurring in metabolite production can only be expected over the course of several hours (therefore over longer times than those of our experiments), while lowered temperatures are hypothesized to immediately slow down metabolic rates (Guyet et al., 2020). We therefore expect a relatively stable concentration and composition of organic matter and cell abundance during the temperature ramp experiments. As a consequence, the effect of lowered temperature on SSA fluxes is due to a physical impact of temperature on the properties of chemical components already present in the seawater at the beginning of each temperature experiment.
Synechococcus-derived dissolved organic matter (SOM) is released via secretion, natural cell death, viral lysis and predation (Jiao et al., 2010; Fiore et al., 2015; Xiao et al., 2020) and contributes to the marine dissolved organic matter pool (Jiao et al., 2011; Gontikaki et al., 2013). The presence of Synechococcus spp. was reported to increase organic carbon content in SSA particles relative to artificial seawater by a factor of 34 (Moore et al., 2011). Rich in nitrate, the largest proportion of SOM is labile and quickly consumed by heterotrophic bacteria, which release exoenzymes to cleave biopolymers (Christie-Oleza et al., 2015; Zheng et al., 2021). Surfactants released by bacteria may facilitate substrate degradation; however, they also replenish the pool of surfactants present in seawater (Sekelsky and Shreve, 2000).
The anticorrelation with Synechococcus that we observe could indicate a release of SOM during their decay, arising from mortality, viral lysis or predation rather than secretion (which would be positively related to Synechococcus cell abundance). Surfactant release was also anticorrelated to Synechococcus abundance in the Baltic Sea and was interpreted as the grazing of nanophytoplankton on Synechococcus cells (Barthelmeß and Engel, 2022). In theory, we could thus explain the enhanced SSA flux within the lower-temperature regimes by (a) SOM released at the expense of Synechococcus cell abundance (release during cell destruction), (b) SOM secreted by Synechococcus with higher viscosity than other organic matter types since viscosity prevents drainage and results in larger bubble film thickness, (c) bacterial release of exoenzymes and/or surfactants following the destruction of Synechococcus spp. cells to facilitate SOM degradation, and/or (d) the products of this process (i.e., the surfactant pool is replenished due to cleaved biopolymers from heterotrophic prokaryotes enzymatic activity). Bacterial abundance does not represent their metabolic activity or secretion rate as bacterial cells can also remain inactive (Lebaron et al., 2001), and so a lack of correlation with bacterial abundance does not necessarily falsify hypotheses (c) and (d). However, we cannot exclude that the observed anticorrelation with Synechococcus is coincidental rather than causal, and clearly, more work is needed to test these different hypotheses. Next, we investigate if seawater biogeochemistry also influences the size of SSA emissions at low temperatures.
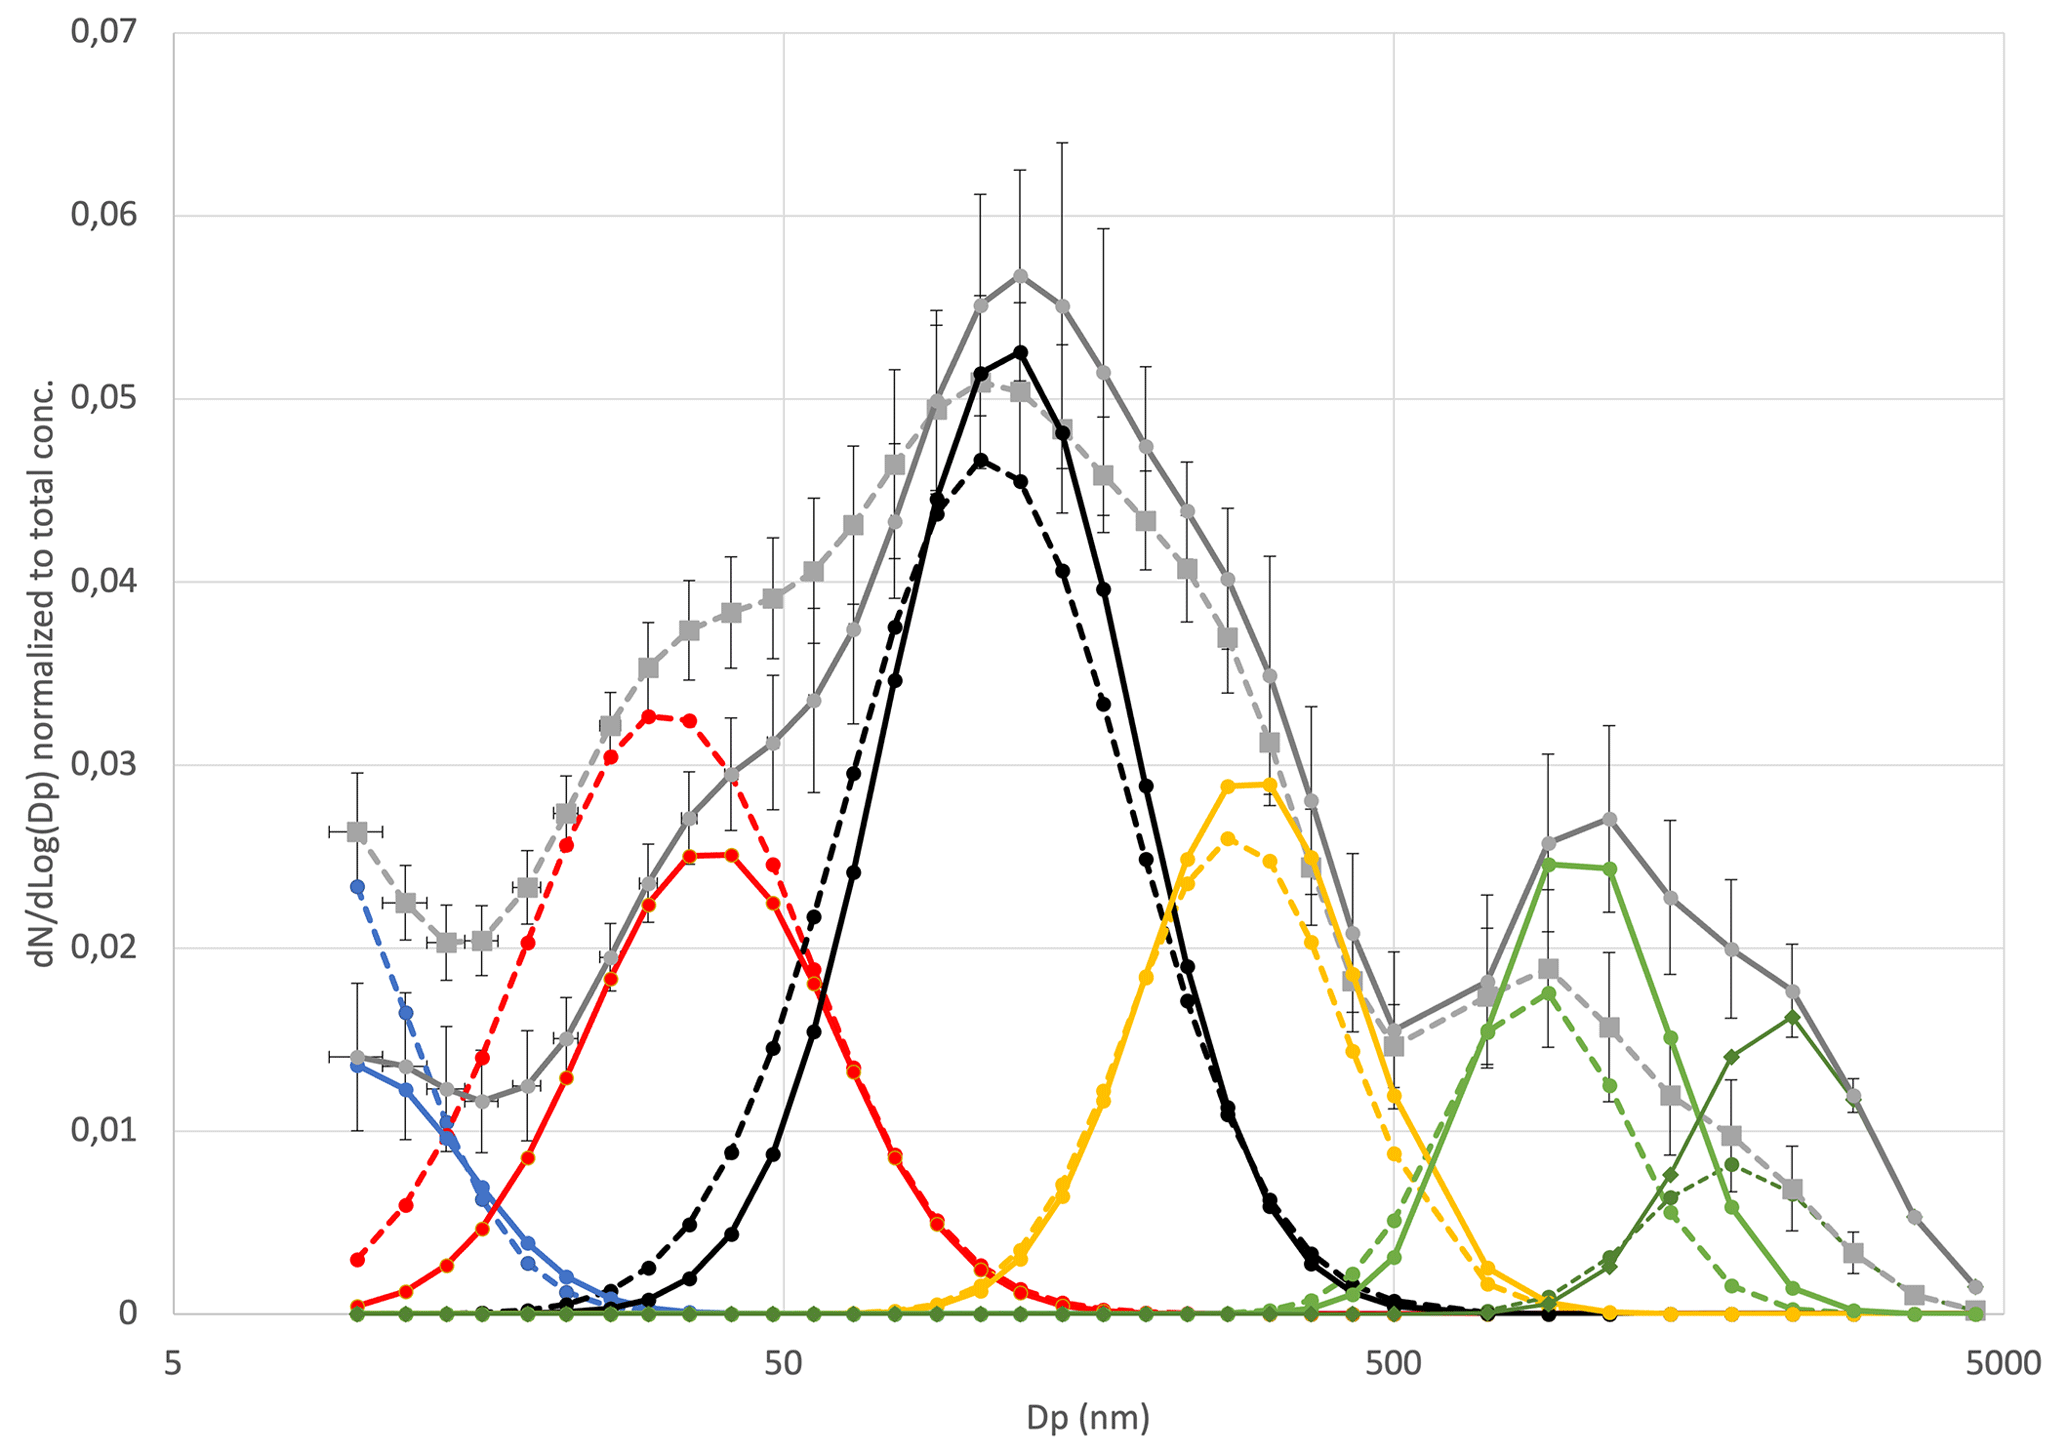
Figure 5Average sea spray size distributions normalized to the total sea spray concentrations for the temperature range 7–9 ∘C (plain lines) and 2–3 ∘C (dash lines), reconstructed from their decomposition in a combination of single log-normal modes (nucleation mode (blue), Aitken mode (red), first accumulation mode (black), second accumulation mode (yellow) and the two coarse modes (light and dark green). Error bars are from the standard deviation of the averaged measured size distributions.
3.4 Size-segregated sea spray fluxes
The aerosol size distributions in the 10–4000 nm range, from merged DMPS and WIBS size distributions, were normalized to the total sea spray concentrations in order to investigate changes in size distribution shape rather than number (studied Sect. 2.3). These were averaged over two different temperatures ranges, 2–3 and 7–9 ∘C, and were fitted with a combination of single log-normal modes (Fig. S1 and S2 in the Supplement). In the moderate-temperature range (7–9 ∘C), we found four modes in the submicron range and two modes in the supermicron range that best characterize the sea spray aerosol, with characteristics summarized in Table 1. These characteristics are very similar to those reported for sea spray generated with the same device using Mediterranean water (Schwier et al., 2017; Sellegri et al., 2021) and also for sea spray size distributions generated with other jet-based approaches that showed a dominant mode centered around 100 nm (Sellegri et al., 2006; Fuentes et al., 2010a; Christiansen et al., 2019). Christiansen et al. (2019) report that the shapes of the particle size distributions and mode contributions are only slightly affected by the addition of algae. We also find that the variability of the SSA size distributions at moderate temperatures is low between samples, as also pointed out by Sellegri et al. (2021) for seawater from various geographical origins.
Table 1Geometric mean diameter (Dp), normalized number concentration (N) and standard deviation (σ) of the six modes comprising the median number size distribution at moderate (7–9 ∘C) and low (2–3 ∘C) SST.
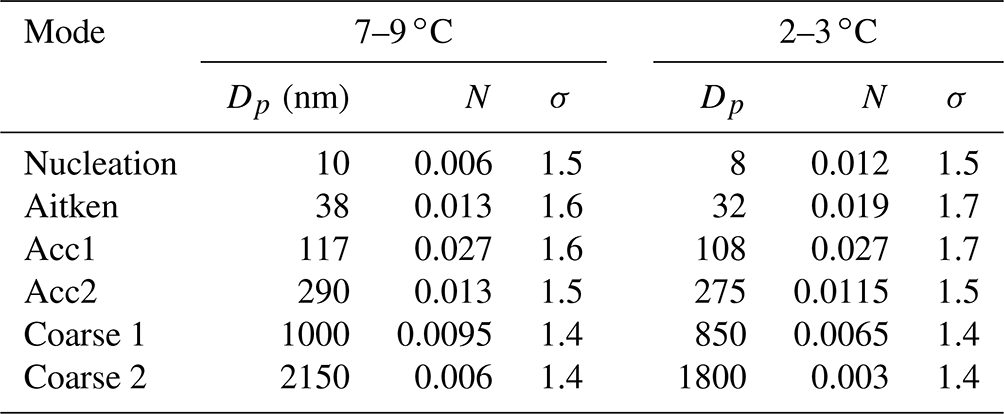
When comparing size distributions in the two temperature ranges (Fig. 5), we find that the shape of the size distribution is not preserved at 2–3 ∘C relative to 7–9 ∘C. We observe an average 15 % decrease in the modal diameters at the low temperatures compared to at the moderate temperatures, which is consistent for all modes (Table 1). Also, the fraction of the smaller particle sizes (nucleation and Aitken modes) relative to the total sea spray concentration increases at cold temperatures compared to warmer ones, whereas it decreases for the largest sizes. The average ratio of number concentrations of SSAs smaller than 50 nm to the total SSA concentration was 0.19±0.03 in the 7–9 ∘C range, while it was 0.35±0.04 in the 2–3 ∘C range, indicating that the size distribution variation due to low temperatures significantly exceeded the variability of size distributions due to seawater types at moderate temperatures.
In order to quantify changes in sea spray concentrations per size range, we calculated modal concentrations by summing particle concentrations in particle size bins within each mode: nucleation mode (11–15 nm), Aitken mode (20–44 nm), accumulation mode 1 (68–142 nm), accumulation mode 2 (267–430 nm) and coarse mode (710–4485 nm). The relation to temperature of each modal concentration normalized to its concentration at 8–10 ∘C was then plotted for each individual mode and linearly fitted over the 3 to 10 ∘C temperature range for each experiment. A polynomial fit, as with Eq. (2), could not be obtained, and instead a linear fit provided the optimal fit given the small number of data points obtained within the 13 min scanning time necessary for each size distribution. The slope of the linear fit between modal concentration and temperature gives the relative increase in each modal concentration per SST degree relative to its 8–10 ∘C modal concentration. The linear fit was performed for each mode and each daily temperature experiment. Statistics for all experiments are shown Fig. 6.
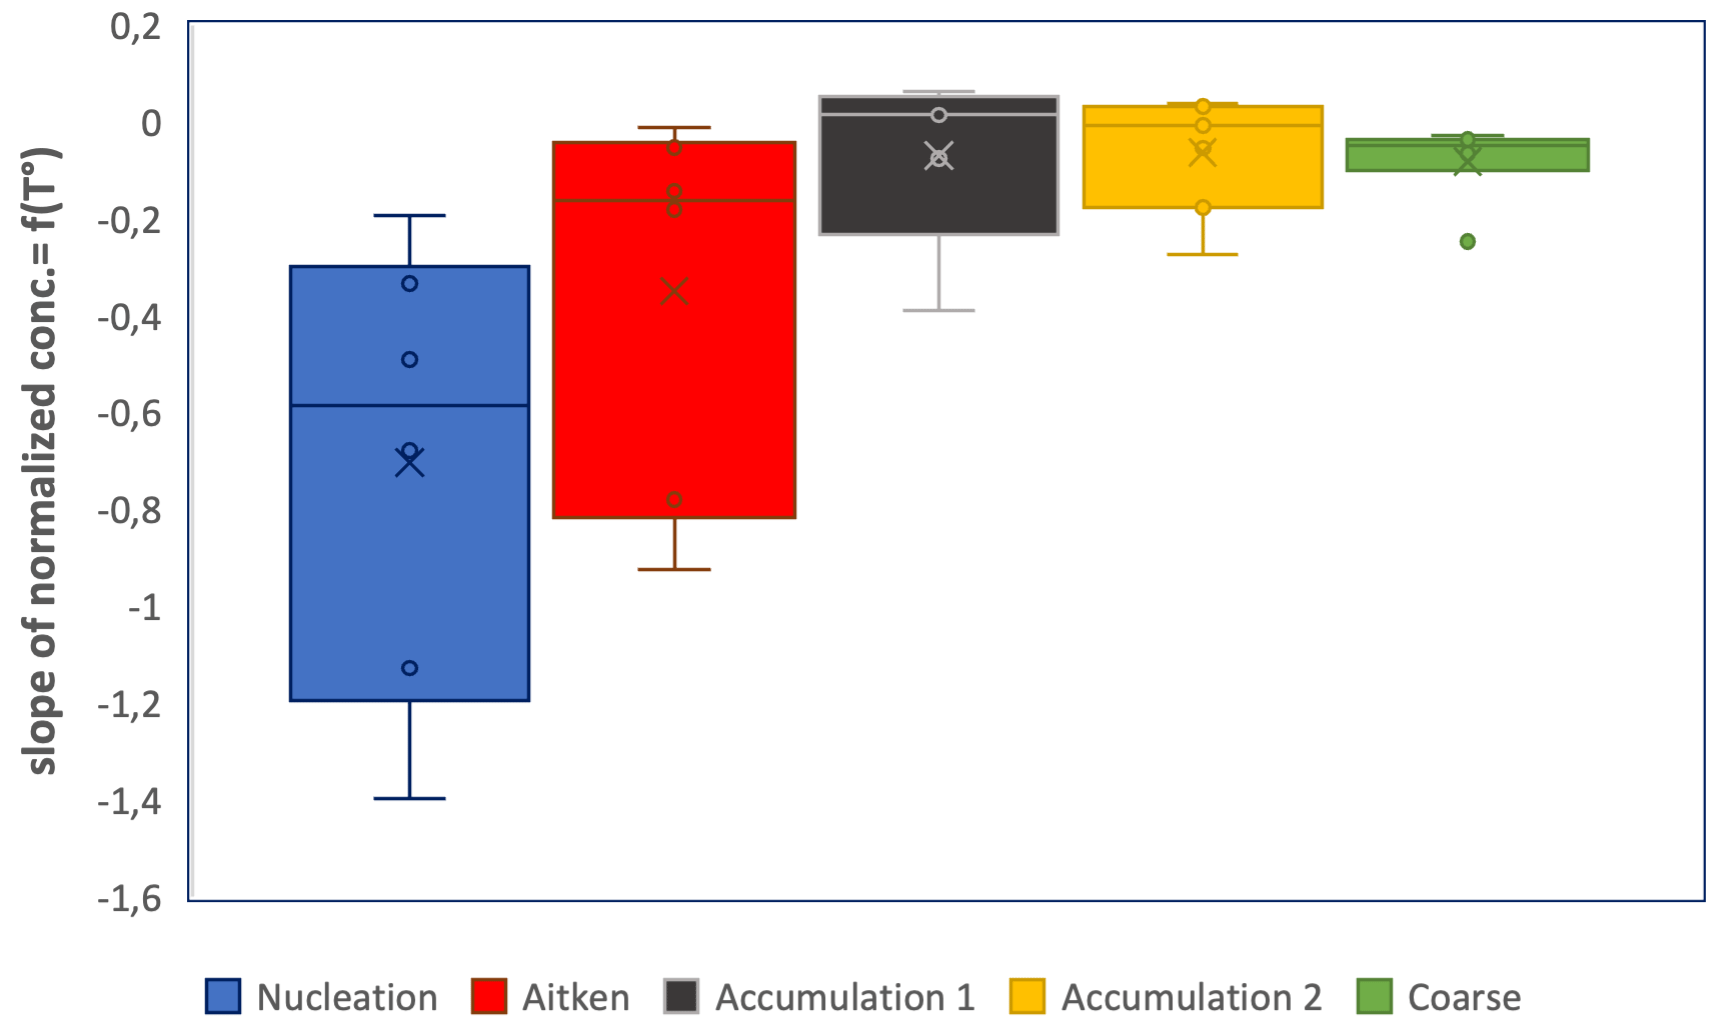
Figure 6Boxplot illustrating the dependence of sea spray fluxes on temperature for segregated sea spray size ranges: first, for each size range, the ratios (sea spray concentrations at T to sea spray concentration at 8–10 ∘C) were plotted as a function of seawater temperature for each of the 10 experiments, then slopes were derived from the linear fitting between these two variables, and finally, statistics were performed on the slopes obtained.
We observe that sea spray concentrations in all modal sizes increased with decreasing temperature, but the sea spray concentrations in the nucleation mode showed, on average, the largest relative increase, followed by concentrations in the Aitken mode. Small particles are therefore most sensitive to the temperature of the ocean surface water. Christiansen et al. (2019) also observed that the relative amount of small (<40 nm) particles increased at the coldest temperatures using synthetic seawater, indicating that this is at least partly due to physical parameters. However, contrarily to our observations, they observed that larger (>300 nm) particles increased at the lowest temperatures. Using natural seawaters from a fjord in the Arctic, Zaábori et al. (2012) found that the ratio of smaller (180 nm) to larger (570 nm) sea spray particles increased at seawater temperatures colder than 3 ∘C relative to temperatures above 3 ∘C, which is consistent with our observations.
When a film breaks into a higher number of film drops, those are smaller (Lhuissier and Villermaux, 2012; Poulain and Bourouiba, 2018), and therefore a decrease in size is expected from the higher numbers of SSA generated at colder temperatures. Additionally, when the main bubble bursts at the air–sea interface, numerous daughter bubbles of smaller diameter form at the edge of the main bubble (Bird et al., 2010; Miguet et al., 2021), which may be the origin of additional drops of smaller sizes ejected into the atmosphere. The formation of daughter bubbles increases with the ratio of density to viscosity and further with the ratio of viscosity to surface tension. All of these variables increase with decreasing temperature, but it is difficult to quantify how their ratio evolves in the presence of unknown active chemicals.
We have observed a substantial increase in SSA flux as seawater temperature decreases. This finding aligns with previous observations from laboratory-based experiments using synthetic and natural seawaters (Hultin et al., 2011; Zábori et al., 2012; Salter et al., 2014; Christiansen et al., 2019). However, it contradicts the seawater temperature dependence of SSA fluxes inferred from ambient concentrations (Jaegle et al., 2011; Grythe et al., 2014). The reported temperature dependences inferred from ambient concentrations were performed using either optical depth measurements (Jaegle et al., 2011) or sodium-containing particles (Grythe et al., 2014), mostly represented by large accumulation-mode particles that do not necessarily follow the same trends as the SSA number concentrations, mostly represented by smaller particles. We do find that larger SSA particle fluxes are not as sensitive to temperature as smaller ones. Also, in ambient air, it is difficult to discriminate between primary sea spray production and secondary aerosol formation that either forms new particles or grows pre-existing particles and may also be dependent on temperature. Therefore, the apparent contradiction between laboratory-based and ambient-air sea spray fluxes studies may be due to these two types of studies addressing differing aerosol sizes and processing or mixing states.
A comparison with results obtained from synthetic seawater in the literature is not straightforward as different conclusions are obtained in different studies. For example, Forestieri et al. (2018) report a monotonic increase of sea spray with increasing temperature, while Christiansen et al. (2019) report a minimum in the sea spray flux in the range of 6–10 ∘C, with both studies using synthetic sea spray and plunging-jet systems over the same range of temperature. As noted by Forestieri et al. (2018), variability between repeated experiments in their study (and so between different studies) could result from trace impurities of surfactants in the commercial synthetic salt solutions. For example, Christiansen et al. (2019) report a baseline TOC content in Sigma-Aldrich sea salt of < 0.003 % by mass, which corresponds to a significant amount of organic carbon of around 1.2 mg L−1 in a 35 g L−1, which is of the same order of magnitude as the amount of TOC in the rich frontal waters of the present study (Fig. 2a). Moreover, our sample with the lowest temperature dependence (18 March, high Chl a and TOC frontal seawaters) compares well with the temperature dependence flux model from Salter et al. (2014) and with the synthetic seawater reported by Christiansen et al. (2019), while our highest temperature dependence samples (23 and 24 March, low Chl a and TOC subantarctic seawaters) compare well with the temperature dependence experiments performed by Zábori et al. (2012) using arctic seawaters of different origins (Fig. 4c). This indicates that neither Chl a nor TOC is a good proxy for predicting the sea spray flux temperature dependence.
Nanophytoplankton abundance was a major determinant of sea spray number fluxes for sizes larger than 100 nm at moderate temperatures (SELL21), which was attributed to fatty acid concentration and surface tension effects. This is further supported in the present study, although the relationship to nanophytoplankton is not as strong as in SELL21. Here, we show that the seawater temperature effect is inversely dependent on another phytoplankton group, the genus Synechococcus spp., which, if not coincidental, could indicate a link to SOM release during decay. However, there is a taxonomic heterogeneity within the Synechococcus genus and within the picophytoplankton in general. Our results might be specific to the Synechococcus spp. population of the southwestern Pacific Ocean, and further work is required to investigate if the present relationship is applicable at a larger regional scale. In addition, more work is required to investigate the process by which Synechococcus spp. are related to the release of organic matter that specifically influences SSA flux at low temperatures.
The dependence of SSA fluxes on water temperature is highest for nucleation- and Aitken-mode particles but remains high for SSA sizes in the 100–200 nm size, which dominate the total SSA flux and are active as CCN. As a result, this phenomenon is expected to impact the seasonal fluctuations of sea spray particles originating from cold surface waters, particularly in regions like the Southern Ocean. It may be also be relevant with respect to the cool-skin effect at the ocean–atmosphere interface. Average surface cooling by 0.2 K with global mean wind regimes (6 m s−1) relative to depths > 1 cm (Donlon et al., 2002) may occur and may be greater under lower wind regimes or at night (Donlon et al., 2002; Marmarino and Smith, 2006). As SSA fluxes are generated at this interface, they are influenced by the biophysical conditions encountered; i.e., they are often characterized by an enrichment in biosurfactants (Wurl et al., 2011).
The IPCC report estimates an increase in average ocean surface temperature of 2.5 ∘C by 2100, with consequences for marine biology (Bindoff et al., 2019), and future projections for the southwestern Pacific also indicate a +2.5 ∘C increase in surface temperature by the end of the century, with consequences for marine microbes and biogeochemistry (Law et al., 2018). Ocean warming is expected to expand the distribution range and cell abundance of Synechococcus (Morán et al., 2010; Flombaum et al., 2013). Based on our findings, it appears that higher seawater temperatures and increased abundance of Synechococcus would result in reduced sea spray fluxes at low temperatures. The combined effect of these factors could be additive or even synergistic, potentially amplifying the impact compared to each individual effect alone. However, higher temperatures and an increased release of labile SOM could have an effect on bacterial metabolism (Piontek et al., 2015) that potentially favors the secretion of biosurfactants by heterotrophic bacteria. Potential changes in the abundance of Synechococcus spp. in response to temperature changes associated with climate change and the resulting impact on CCN fluxes to the atmosphere and cloud formation should be investigated using regional models run under future climate conditions to account for other climate-sensitive factors that influence sea spray fluxes. The quantification of process-based relationships between seawater biogeochemistry and sea spray cloud-forming properties derived from the present study should enable improved actual simulations of cloud formation over the oceans of the Southern Hemisphere.
Data are available at https://doi.org/10.6096/4002 (Sellegri and Freney, 2023), https://doi.org/10.6096/4003 (Sellegri and Trueblood, 2023a), https://doi.org/10.6096/4005 (Sellegri and Trueblood, 2023b) and https://doi.org/10.6096/4004 (Sellegri and Trueblood, 2023c).
The supplement related to this article is available online at: https://doi.org/10.5194/acp-23-12949-2023-supplement.
KSe and CL designed the Sea2Cloud voyage. KSe designed the experiments with contributions from NB, and MH and KSe and JT carried them out. TB, AC, KSa, SD and WD sampled seawater for the biogeochemical analysis, and AC, KSa, SD and KT analyzed the samples. AE supervised the work of TB. EF and CR contributed to aerosol measurement analysis. KSe prepared the paper with contributions from all the co-authors.
The contact author has declared that none of the authors has any competing interests.
Publisher's note: Copernicus Publications remains neutral with regard to jurisdictional claims in published maps and institutional affiliations.
This article is part of the special issue “Sea2Cloud (ACP/OS inter-journal SI)”. It is not associated with a conference.
We acknowledge the support and expertise of the officers and crew of the R/V Tangaroa. The Sea2Cloud project is endorsed by SOLAS (Surface Ocean Lower Atmospheric Study).
This research has been supported by the European Research Council, H2020 European Research Council (grant no. 771369), and the New Zealand SSIF (Strategic Science Investment Fund) funding to NIWA (National Institute of Water and Atmospheric Research) in the Ocean-Climate Interactions program and the Coast and Oceans Flows and Productivity program.
This paper was edited by Timothy Bertram and reviewed by two anonymous referees.
Aluwihare, L. I. and Repeta, D. J.: A comparison of the chemical characteristics of oceanic DOM and extracellular DOM produced by marine algae, Mar. Ecol. Prog. Ser., 186, 105–117, 1999.
Auger, M., Morrow, R., Kestenare, E., Sallée, J.-B., and Cowley R.: Southern Ocean in-situ temperature trends over 25 years emerge from interannual variability, Nat. Commun., 12, 514, https://doi.org/10.1038/s41467-020-20781-1, 2021.
Barthelmeß, T. and Engel, A.: How biogenic polymers control surfactant dynamics in the surface microlayer: insights from a coastal Baltic Sea study, Biogeosciences, 19, 4965–4992, https://doi.org/10.5194/bg-19-4965-2022, 2022.
Bates, T. S., Anderson, T. L., Baynard, T., Bond, T., Boucher, O., Carmichael, G., Clarke, A., Erlick, C., Guo, H., Horowitz, L., Howell, S., Kulkarni, S., Maring, H., McComiskey, A., Middlebrook, A., Noone, K., O'Dowd, C. D., Ogren, J., Penner, J., Quinn, P. K., Ravishankara, A. R., Savoie, D. L., Schwartz, S. E., Shinozuka, Y., Tang, Y., Weber, R. J., and Wu, Y.: Aerosol direct radiative effects over the northwest Atlantic, northwest Pacific, and North Indian Oceans: estimates based on in-situ chemical and optical measurements and chemical transport modeling, Atmos. Chem. Phys., 6, 1657–1732, https://doi.org/10.5194/acp-6-1657-2006, 2006.
Bian, H., Froyd, K., Murphy, D. M., Dibb, J., Darmenov, A., Chin, M., Colarco, P. R., da Silva, A., Kucsera, T. L., Schill, G., Yu, H., Bui, P., Dollner, M., Weinzierl, B., and Smirnov, A.: Observationally constrained analysis of sea salt aerosol in the marine atmosphere, Atmos. Chem. Phys., 19, 10773–10785, https://doi.org/10.5194/acp-19-10773-2019, 2019.
Bindoff, N. L., Cheung, W. W. L., Kairo, J. G., Arístegui, J., Guinder, V. A., Hallberg, R., Hilmi, N., Jiao, N., Karim, M. S., Levin, L., O'Donoghue, S., Purca Cuicapusa, S. R., Rinkevich, B., Suga, T., Tagliabue, A., and Williamson, P.: Changing Ocean, Marine Ecosystems, and Dependent Communities, in: IPCC Special Report on the Ocean and Cryosphere in a Changing Climate, edited by: Pörtner, H.-O., Roberts, D. C., Masson-Delmotte, V., Zhai, P., Tignor, M., Poloczanska, E., Mintenbeck, K., Alegría, A., Nicolai, M., Okem, A., Petzold, J., Rama, B., and Weyer, N. M., Cambridge University Press, Cambridge, UK and New York, NY, USA, 447–587, https://doi.org/10.1017/9781009157964.007, 2019.
Bird, J. C., de Ruiter, R., Courbin, L., and Stone, H. A.: Daughter bubble cascades produced by folding of ruptured thin films, Nature, 465, 759–762, 2010.
Bowyer, P. A., Woolf, D. K., and Monahan, E. C.: Temperature dependence of the charge and aerosol production associated with a breaking wave in a whitecap simulation tank, J. Geophys. Res.-Oceans, 95, 5313–5319, https://doi.org/10.1029/JC095iC04p05313, 1990.
Burrows, S. M., Hoose, C., Pöschl, U., and Lawrence, M. G.: Ice nuclei in marine air: biogenic particles or dust?, Atmos. Chem. Phys., 13, 245–267, https://doi.org/10.5194/acp-13-245-2013, 2013.
Christiansen, S., Salter, M. E., Gorokhova, E., Nguyen, Q. T., and Bilde, M.: Sea Spray Aerosol Formation: Laboratory Results on the Role of Air Entrainment, Water Temperature, and Phytoplankton Biomass, Environ. Sci. Technol., 19, 13107–13116, https://doi.org/10.1021/acs.est.9b04078, 2019.
Christie-Oleza, J. A., Scanlan, D. J., and Armengaud, J.: “You produce while I clean up”, a strategy revealed by exoproteomics during Synechococcus-Roseobacter interactions, Proteomics, 15, 3454–3462, https://doi.org/10.1002/pmic.201400562, 2015.
Dall'Osto, M., Vaqué, D., Sotomayor-Garcia, A., Cabrera-Brufau, M., Estrada, M., Buchaca, T., Soler, M., Nunes, S., Zeppenfeld, S., van Pinxteren, M,, Herrmann, H., Wex, H., Rinaldi, M., Paglione, M., Beddows, D. C. S., Harrison, R. M., and Berdalet, E.: Sea Ice Microbiota in the Antarctic Peninsula Modulates Cloud-Relevant Sea Spray Aerosol Production, Front. Mar. Sci., 9, 827061., https://doi.org/10.3389/fmars.2022.827061, 2022.
de Leeuw, G., Andreas, E. L., Anguelova, M. D., Fairall, C. W., Lewis, E. R., ODowd, C. D., Schulz, M., and Schwartz, S. E.: Production flux of sea spray aerosol, Rev. Geophys., 49, RG2001, https://doi.org/10.1029/2010RG000349, 2011.
Delizo, L., Smith, W. O., and Hall, J.: Taxonomic composition and growth rates of phytoplankton assemblages at the Subtropical Convergence east of New Zealand, J. Plankt. Res., 29, 655–670, https://doi.org/10.1093/plankt/fbm047, 2007.
Donlon, C. J., Minnett, P. J., Gentemann, C., Nightingale, T. J., Barton, I. J., Ward, B., and Murray, M. J.: Toward improved validation of satellite sea surface skin temperature measurements for climate research, J. Climate, 15, 353–369, https://doi.org/10.1175/1520-0442(2002)015<0353:TIVOSS>2.0.CO;2, 2002.
Engel, A. and Galgani, L.: The organic sea-surface microlayer in the upwelling region off the coast of Peru and potential implications for air–sea exchange processes, Biogeosciences, 13, 989–1007, https://doi.org/10.5194/bg-13-989-2016, 2016/
Fiore, C. L., Longnecker, K., Soule, M., and Kujawinski, E. B.: Release of ecologically relevant metabolites by the cyanobacterium Synechococcus elongatusCCMP 1631, Environ. Microbiol., 17, 3949–3963, https://doi.org/10.1111/1462-2920.12899, 2015.
Flombaum, P., Gallegos, J. L., Gordillo, R. A., Rincón, J., Zabala, L. L., Jiao, N., Karl, D. M., Li, W. K., Lomas, M. W., Veneziano, D., and Vera, C. S.: Present and future global distributions of the marine Cyanobacteria Prochlorococcus and Synechococcus, P. Natl. Acad. Sci. USA, 110, 9824–9829, 2013.
Forestieri, S. D., Moore, K. A., Martinez Borrero, R., Wang, A., Stokes, M. D., and Cappa, C. D.: Temperature and composition dependence of sea spray aerosol production, Geophys. Res. Lett., 45, 7218–7225, 2018.
Fossum, K. N., Ovadnevaite, J., Ceburnis, D., Dall’Osto, M., Marullo, S., Bellacicco, M., Simó, R., Liu, D., Flynn, M., Zuend, A., and O’Dowd, C.: Summertime Primary and Secondary Contributions to Southern Ocean Cloud Condensation Nuclei, Sci. Rep.-UK, 8, 13844, https://doi.org/10.1038/s41598-018-32047-4, 2018.
Freney E., Sellegri, K., Nicosia, A., Trueblood, J. T., Rinaldi, M., Williams, L. R., Prévôt, A. S. H., Thyssen, M., Grégori, G., Haëntjens, N. Dinasquet, J., Obernosterer, I. Van-Wambeke, F., Engel, A., Zäncker, B., Desboeufs, K., Asmi, E., Timmonen, H., and Guieu, C.: Mediterranean nascent sea spray organic aerosol and relationships with seawater biogeochemistry, Atmos. Chem. Phys., 21, 10625–10641, https://doi.org/10.5194/acp-21-10625-2021, 2021.
Fuentes, E., Coe, H., Green, D., de Leeuw, G., and McFiggans, G.: Laboratory-generated primary marine aerosol via bubble-bursting and atomization, Atmos. Meas. Tech., 3, 141–162, https://doi.org/10.5194/amt-3-141-2010, 2010a.
Fuentes, E., Coe, H., Green, D., de Leeuw, G., and McFiggans, G.: On the impacts of phytoplankton-derived organic matter on the properties of the primary marine aerosol – Part 1: Source fluxes, Atmos. Chem. Phys., 10, 9295–9317, https://doi.org/10.5194/acp-10-9295-2010, 2010b.
Gontikaki, E., Thornton, B., Huvenne, V. A. I., and Witte, U.: Negative Priming Effect on Organic Matter Mineralisation in NE Atlantic Slope Sediments, PLoS One, 8, e67722, https://doi.org/10.1371/journal.pone.0067722, 2013.
Grythe, H., Ström, J., Krejci, R., Quinn, P., and Stohl, A.: A review of sea-spray aerosol source functions using a large global set of sea salt aerosol concentration measurements, Atmos. Chem. Phys., 14, 1277–1297, https://doi.org/10.5194/acp-14-1277-2014, 2014.
Guyet, U., Nguyen, N. A., Doré, H., Haguait, J., Pittera, J., Conan, M., Ratin, M., Corre, E., Le Corguillé, G., Brillet-Guéguen, L., Hoebeke, M., Six, C., Steglich, C., Siegel, A., Eveillard, D., Partensky, F., and Garczarek, L.: Synergic Effects of Temperature and Irradiance on the Physiology of the Marine Synechococcus Strain WH7803, Front. Microbiol., 24; 1707, https://doi.org/10.3389/fmicb.2020.01707, 2020.
Hall, J. A. and Safi, K.: The impact of in situ Fe fertilisation on the microbial food web in the Southern Ocean, Deep-Sea Res. P. II, 48, 2591–2613, 2001.
Hultin, K. A. H., Krejci, R., Pinhassi, J., Gomez-Consarnau, L., Mårtensson, E. M., Hagström, A., and Nilsson, E. D.: Aerosol and bacterial emissions from Baltic seawater, Atmos. Res., 99, 1–14, https://doi.org/10.1016/j.atmosres.2010.08.018, 2011.
Jaeglé, L., Quinn, P. K., Bates, T. S., Alexander, B., and Lin, J.-T.: Global distribution of sea salt aerosols: new constraints from in situ and remote sensing observations, Atmos. Chem. Phys., 11, 3137–3157, https://doi.org/10.5194/acp-11-3137-2011, 2011.
Jiao, N., Herndl, G., Hansell, D. A., Benner, R., Kattner, G., Wilhelm, S. W., Kirchman, D. L., Weinbauer, M. G., Luo, T., Chen, F., and Azam, F.: Microbial production of recalcitrant dissolved organic matter: long-term carbon storage in the global ocean, Nat. Rev. Microbiol., 8, 593–599, 2010.
Jiao, N., Herndl, G., Hansell, D. A., Benner, R., Kattner, G., Wilhelm, S. W., Kirchman, D. L., Weinbauer, M. G., Luo, T., Chen, F. and Azam, F.: The microbial carbon pump and the oceanic recalcitrant dissolved organic matter pool, Nat. Rev. Microbiol., 9, 555, https://doi.org/10.1038/nrmicro2386-c5, 2011.
Kujawinski, E. B., Farrington, J. W., and Moffett, J. W.: Evidence for grazing-mediated production of dissolved surface-active material by marine protists, Mar. Chem., 77, 133–142, 2002.
Law, C. S., Smith, M., Stevens, C., Abraham, E. R., Ellwood, M., Hill, P., Nodder, S., Peloquin, J., Pickmere, S., Safi, K., and Walkington, M.: Did dilution limit the phytoplankton response to iron addition in HNLCLSi Sub-Antarctic waters during SAGE?, Deep-Sea Res. Pt. II, 58, 786–799, 2011.
Law, C. S., Smith, M. J., Harvey, M. J., Bell, T. G., Cravigan, L. T., Elliott, F. C., Lawson, S. J., Lizotte, M., Marriner, A., McGregor, J., Ristovski, Z., Safi, K. A., Saltzman, E. S., Vaattovaarra, P., and Walker, C. F.: Overview and preliminary results of the Surface Ocean Aerosol Production (SOAP) campaign, Atmos. Chem. Phys., 17, 13645–13667, https://doi.org/10.5194/acp-17-13645-2017, 2017.
Law, C. S., Rickard, G. J., Mikaloff-Fletcher, S. E., Pinkerton, M. H., Behrens, E., Chiswell, S. M., and Currie, K.: Climate Change projections for the surface ocean around New Zealand, NZ J. Mar. Freshwater Res., 52, 309–335, https://doi.org/10.1080/00288330.2017.1390772, 2018.
Lebaron, P., Servais, P., Agogué, H., Courties, C., and Joux, F.: Does the High Nucleic Acid Content of Individual Bacterial Cells Allow Us to Discriminate between Active Cells and Inactive Cells in Aquatic Systems?, Appl. Environ. Microbiol., 67, 1775–1782, https://doi.org/10.1128/AEM.67.4.1775-1782.2001, 2001.
Lhuissier, H. and Villermaux, E.: Bursting bubble aerosols, J. Fluid Mech., 696, 5–44, https://doi.org/10.1017/jfm.2011.418, 2012.
Liu, S., Liu, C.-C., Froyd, K. D., Schill, G. P., Murphy, D. M., Bui, T. P., Dean-Day, J. M., Weinzierl, B., Dollner, M., Diskin, G. S., Chen, G., and Gao, R.-S.: Sea spray aerosol concentration modulated by sea surface temperature, P. Natl. Acad. Sci. USA, 118, e2020583118, https://doi.org/10.1073/pnas.2020583118, 2021.
Long, M. S., Keene, W. C., Kieber, D. J., Frossard, A. A., Russell, L. M., Maben, J. R., Kinsey, J. D., Quinn, P. K., and Bates, T. S.: Light-enhanced primary marine aerosol production from biologically productive seawater, Geophys. Res. Lett., 41, 2661–2670, https://doi.org/10.1002/2014GL059436, 2014.
Long, M. S., Keene, W. C., Kieber, D. J., Erickson, D. J., and Maring, H.: A sea-state based source function for size- and composition-resolved marine aerosol production, Atmos. Chem. Phys., 11, 1203–1216, https://doi.org/10.5194/acp-11-1203-2011, 2011.
Marmorino, G. O. and Smith, G. B.: Reduction of surface temperature in ocean slicks, Geophys. Res. Lett., 33, L14603, https://doi.org/10.1029/2006GL026502, 2006.
Martensson, E. M., Nilsoon, E. D., de Leeuw, G., Cohen, L. H., and Hansson, H.-C.: Laboratory simulations and parameterization of the primary marine aerosol production, J. Geophys. Res., 108, 4297, https://doi.org/10.1029/2002JD002263, 2003.
Miguet, J., Rouyer, F., and Rio, E.: The Life of a Surface Bubble, Molecules, 26, 1317, https://doi.org/10.3390/molecules26051317, 2021.
Modini, R. L., Russell, L. M., Deane, G. B., and Stokes, M. D.: Effect of soluble surfactant on bubble persistence and bubble-produced aerosol particles, J. Geophys. Res., 118, 1388–1400, https://doi.org/10.1002/jgrd.50186, 2013.
Moore, M. J. K., Furutani, H., Roberts, G. C., Moffet, R. C., Gilles, M. K., Palenik, B., and Prather, K. A.: Effect of organic compounds on cloud condensation nuclei (CCN) activity of sea spray aerosol produced by bubble bursting, Atmos. Environ., 45, 7462–7469, https://doi.org/10.1016/j.atmosenv.2011.04.034, 2011.
Morán, X., Lopez-Urrutia, A., Calvo-Díaz, A., and Li, W. K. W.: Increasing importance of small phytoplankton in a warmer ocean, Global Change Biol., 16, 1137–1144., https://doi.org/10.1111/J.1365-2486.2009.01960.X, 2010.
Naik, S. M. and Anil, A. C.: Long-term preservation of Tetraselmis indica (Chlorodendrophyceae, Chlorophyta) for flow cytometric analysis: Influence of fixative and storage temperature, J. Microbiolo. Meth., 139, 123–129, 2017.
Nayar K. G., Panchanathan, D., McKinley, G. H., and Lienhard, J. H.: Surface Tension of Seawater, J. Phys. Chem. Ref. Data, 43, 043103, https://doi.org/10.1063/1.4899037, 2014.
Ovadnevaite, J., Manders, A., de Leeuw, G., Ceburnis, D., Monahan, C., Partanen, A.-I., Korhonen, H., and O'Dowd, C. D.: A sea spray aerosol flux parameterization encapsulating wave state, Atmos. Chem. Phys., 14, 1837–1852, https://doi.org/10.5194/acp-14-1837-2014, 2014.
Pierce, J. R. and Adams, P. J.: Global evaluation of CCN formation by direct emission of sea salt and growth of ultrafine sea salt, J. Geophys. Res., 111, D06203, https://doi.org/10.1029/2005JD006186, 2006.
Piontek, J., Sperling, M., Nöthig, E. M., and Engel, A.: Multiple environmental changes induce interactive effects on bacterial degradation activity in the arctic ocean, Limnol. Oceanogr., 60, 1392–1410, https://doi.org/10.1002/lno.10112, 2015.
Poulain, S. and Bourouiba, L.: Biosurfactants Change the Thinning of Contaminated Bubbles at Bacteria-Laden Water Interfaces, Phys. Rev. Lett., 121, 204502, https://doi.org/10.1103/PhysRevLett.121.204502, 2018.
Regayre, L. A., Schmale, J., Johnson, J. S., Tatzelt, C., Baccarini, A., Henning, S., Yoshioka, M., Stratmann, F., Gysel-Beer, M., Grosvenor, D. P., and Carslaw, K. S.: The value of remote marine aerosol measurements for constraining radiative forcing uncertainty, Atmos. Chem. Phys., 20, 10063–10072, https://doi.org/10.5194/acp-20-10063-2020, 2020.
Rocco, M., Dunne, E., Saint-Macary, A., Peltola, M., Barthelmeß, T., Barr, N., Safi, K., Marriner, A., Deppeler, S., Harnwell, J., Engel, A., Colomb, A., Saiz-Lopez, A., Harvey, M., Law, C. S., and Sellegri, K.: Air-Sea fluxes of dimethyl sulphide and methanethiol in the South-West Pacific, EGUsphere [preprint], https://doi.org/10.5194/egusphere-2023-516, 2023.
Safi, K. A., Brian Griffiths, F., and Hall, J. A.: Microzooplankton composition, biomass and grazing rates along the WOCE SR3 line between Tasmania and Antarctica, Deep-Sea Res. Pt. I, 54, 1025–1041, https://doi.org/10.1016/j.dsr.2007.05.003, 2007.
Salter, M. E., Nilsson, E. D., Butcher, A., and Bilde, M.: On the sea- water temperature dependence of the sea spray aerosol generated by a continuous plunging jet, J. Geophys. Res.-Atmos., 119, 9052–9072, https://doi.org/10.1002/2013JD021376, 2014.
Schulz, M., Textor, C., Kinne, S., Balkanski, Y., Bauer, S., Berntsen, T., Berglen, T., Boucher, O., Dentener, F., Guibert, S., Isaksen, I. S. A., Iversen, T., Koch, D., Kirkevåg, A., Liu, X., Montanaro, V., Myhre, G., Penner, J. E., Pitari, G., Reddy, S., Seland, Ø., Stier, P., and Takemura, T.: Radiative forcing by aerosols as derived from the AeroCom present-day and pre-industrial simulations, Atmos. Chem. Phys., 6, 5225–5246, https://doi.org/10.5194/acp-6-5225-2006, 2006.
Schwier, A. N., Rose, C., Asmi, E., Ebling, A. M., Landing, W. M., Marro, S., Pedrotti, M.-L., Sallon, A., Iuculano, F., Agusti, S., Tsiola, A., Pitta, P., Louis, J., Guieu, C., Gazeau, F., and Sellegri, K.: Primary marine aerosol emissions from the Mediterranean Sea during pre-bloom and oligotrophic conditions: correlations to seawater chlorophyll-a from a mesocosm study, Atmo. Chem. Phys., 15, 7961–7976, https://doi.org/10.5194/acp-15-7961-2015, 2015.
Schwier, A. N., Sellegri, K., Mas, S., Charrière, B., Pey, J., Rose, C., Temime-Roussel, B., Parin, D., Jaffrezo, J.-L., Picard, D., Sempéré, R., Marchand, N., and D'Anna, B.: Primary marine aerosol physical and chemical emissions during a nutriment enrichment experiment in mesocosms of the Mediterranean Sea, Atmos. Chem. Phys., 17, 14645–14660, https://doi.org/10.5194/acp-17-14645-2017, 2017.
Sekelsky, A. M. and Shreve, G. S.: Kinetic model of biosurfactant-enhanced hexadecane biodegradation by Pseudomonas aeruginosa, Biotechnol. Bioeng., 63, 401–409, https://doi.org/10.1002/(SICI)1097-0290(19990520)63:4<401::AID-BIT3>3.0.CO;2-S, 2000.
Sellegri, K. and Freney, E.: WIBS size distributions, Sea2Cloud [data set], https://doi.org/10.6096/4002, 2023.
Sellegri, K. and Trueblood, J.: SMPS size distributions, Sea2Cloud [data set], https://doi.org/10.6096/4003, 2023a.
Sellegri, K. and Trueblood, J.: Seaspray generator seawater temperature, Sea2Cloud [data set], https://doi.org/10.6096/4005, 2023b.
Sellegri, K. and Trueblood, J.: MAGIC CPC total count, Sea2Cloud [data set], https://doi.org/10.6096/4004, 2023c.
Sellegri, K., O'Dowd, C. D., Yoon, Y. J., Jennings, S. G., and de Leeuw, G.: Surfactants and submicron sea spray generation, J. Geophys. Res., 111, D22215, https://doi.org/10.1029/2005JD006658, 2006.
Sellegri, K., Nicosia, A., Freney, E., Uitz, J., Thyssen, M., Grégori, G., Engel, A., Zäncker, B., Haëntjens, N., Mas, S., Picard, D., Saint-Macary, A., Peltola, M., Rose, C., Trueblood, J., Lefevre, D., D'Anna, B., Desboeuf, K., Meskhidze, N., Guieu, C., and Law, C. S.: Surface ocean microbiota determine cloud precursors, Sci. Rep., 11, 281, https://doi.org/10.1038/s41598-020-78097-5, 2021.
Sellegri, K., Harvey, M., Peltola, M., Trueblood, J., Saint-Macary, A., Barthelmess, T., Rocco, M., Moore, K. A., Cristi, A., Peyrin, F., Barr, N., Labonnote, L., Marriner, A., McGregor, J., Safi, K., Deppeler, S., Archer, S., Picard, D., Dunne, E., Harnwell, J., Delanoe, J., Colomb, A., Freney, E., Saiz Lopez, A., Quintanilla-López, J. E., Lebrón-Aguilar, R., Rinaldi, M., Banson, S., Rose, C., Planche, C., Joseph, R., Lupascu, A., Jourdan, O., Mioche, G., Olivares, G., Querel, R., McDonald, A., Plank, G., Dillon, W., Blarel, L., Pelon, J., Donnadieu, F., Tridon, F., Baray, J.-L., Szczap, F., Engel, A., DeMott, P. J., and Law, C.: Sea2Cloud: From Biogenic Emission Fluxes to Cloud Properties in the Southwest Pacific. B. Am. Meteorol. Soc., 104, E1017–E1043, https://doi.org/10.1175/BAMS-D-21-0063.1, 2023.
Six, C., Ratin, M., Marie, D., and Corre, E.: Marine Synechococcus picocyanobacteria: Light utilization across latitudes, P. Natl. Acad. Sci. USA, 118, 1–11, https://doi.org/10.1073/pnas.2111300118, 2021.
Sugimura, Y. and Suzuki, Y.: A high-temperature catalytic oxidation method for the determination of non-volatile dissolved organic carbon in seawater by direct injection of a liquid sample, Mar. Chem., 24, 105–131, https://doi.org/10.1016/0304-4203(88)90043-6, 1988.
Thorpe, S. A., Bowyer, P., and Woolf, D. K.: Some factors affecting the size distributions of oceanic bubbles, J. Phys. Oceanogr., 22, 382–389, https://doi.org/10.1175/1520-0485(1992)022<0382:SFATSD>2.0.CO;2, 1992.
Trueblood, J. V., Nicosia, A., Engel, A., Zäncker, B., Rinaldi, M., Freney, E., Thyssen, M., Obernosterer, I., Dinasquet, J., Belosi, F., Tovar-Sánchez, A., Rodriguez-Romero, A., Santachiara, G., Guieu, C., and Sellegri, K.: A Two-Component Parameterization of Marine Ice Nucleating Particles Based on Seawater Biology and Sea Spray Aerosol Measurements in the Mediterranean Sea, Atmos. Chem. Phys., 21, 4659–4676, https://doi.org/10.5194/acp-21-4659-2021, 2021.
Tyree, C. A., Hellion, V. M., Alexandrova, O. A., and Allen, J. O.: Foam droplets generated from natural and artificial seawaters, J. Geophys. Res., 112, D12204, https://doi.org/10.1029/2006JD007729, 2007.
Wurl, O., Wurl, E., Miller, L., Johnson, K., and Vagle, S.: Formation and global distribution of sea-surface microlayers, Biogeosciences, 8, 121–135, https://doi.org/10.5194/bg-8-121-2011, 2011.
Xiao, X., Guo, W., Li, X., Wang, C., and Zhang, R.: Viral lysis alters the optical properties and biological availability of dissolved organic matter derived from picocyanobacteria Prochlorococcus, Appl. Environ. Microb., 87, e02271–20, https://doi.org/10.1128/AEM.02271-20, 2020.
Zábori, J., Matisāns, M., Krejci, R., Nilsson, E. D., and Ström, J.: Artificial primary marine aerosol production: a laboratory study with varying water temperature, salinity, and succinic acid concentration, Atmos. Chem. Phys., 12, 10709–10724, https://doi.org/10.5194/acp-12-10709-2012, 2012.
Zheng, Q., Lin, W., Wang, Y., Li, Y., He, C., Shen, Y., Guo, W., Shi, Q., and Jiao, N.: Highly enriched N-containing organic molecules of Synechococcus lysates and their rapid transformation by heterotrophic bacteria, Limnol. Oceanogr., 66, 335–348, https://doi.org/10.1002/lno.11608, 2021.
Ẑutić, V., Ćosović, B., Marčenko, E., Bihari, N., and Kršinić, F. :Surfactant production by marine phytoplankton, Mar. Chem., 10, 505–520, 1981.
Zwirglmaier, K., Jardillier, L., Ostrowski, M., Mazard, S., Garczarek, L., Vaulot, D., Not, F., Massana, R., Ulloa, O., and Scanlan, D. J.: Global phylogeography of marine Synechococcus and Prochlorococcus reveals a distinct partitioning of lineages among oceanic biomes, Environ. Microbiol., 10, 147–161, https://doi.org/10.1111/j.1462-2920.2007.01440.x, 2008.