the Creative Commons Attribution 4.0 License.
the Creative Commons Attribution 4.0 License.
 | 12 Oct 2023
Annual cycle of aerosol properties over the central Arctic during MOSAiC 2019–2020 – light-extinction, CCN, and INP levels from the boundary layer to the tropopause
Kevin Ohneiser
Ronny Engelmann
Martin Radenz
Hannes Griesche
Julian Hofer
Dietrich Althausen
Jessie M. Creamean
Matthew C. Boyer
Daniel A. Knopf
Sandro Dahlke
Marion Maturilli
Henriette Gebauer
Johannes Bühl
Cristofer Jimenez
Patric Seifert
Ulla Wandinger
The MOSAiC (Multidisciplinary drifting Observatory for the Study of Arctic Climate) expedition was the largest Arctic field campaign ever conducted. MOSAiC offered the unique opportunity to monitor and characterize aerosols and clouds with high vertical resolution up to 30 km height at latitudes from 80 to 90∘ N over an entire year (October 2019 to September 2020). Without a clear knowledge of the complex aerosol layering, vertical structures, and dominant aerosol types and their impact on cloud formation, a full understanding of the meteorological processes in the Arctic, and thus advanced climate change research, is impossible. Widespread ground-based in situ observations in the Arctic are insufficient to provide these required aerosol and cloud data. In this article, a summary of our MOSAiC observations of tropospheric aerosol profiles with a state-of-the-art multiwavelength polarization Raman lidar aboard the icebreaker Polarstern is presented. Particle optical properties, i.e., light-extinction profiles and aerosol optical thickness (AOT), and estimates of cloud-relevant aerosol properties such as the number concentration of cloud condensation nuclei (CCN) and ice-nucleating particles (INPs) are discussed, separately for the lowest part of the troposphere (atmospheric boundary layer, ABL), within the lower free troposphere (around 2000 m height), and at the cirrus level close to the tropopause. In situ observations of the particle number concentration and INPs aboard Polarstern are included in the study. A strong decrease in the aerosol amount with height in winter and moderate vertical variations in summer were observed in terms of the particle extinction coefficient. The 532 nm light-extinction values dropped from >50 Mm−1 close to the surface to <5 Mm−1 at 4–6 km height in the winter months. Lofted, aged wildfire smoke layers caused a re-increase in the aerosol concentration towards the tropopause. In summer (June to August 2020), much lower particle extinction coefficients, frequently as low as 1–5 Mm−1, were observed in the ABL. Aerosol removal, controlled by in-cloud and below-cloud scavenging processes (widely suppressed in winter and very efficient in summer) in the lowermost 1–2 km of the atmosphere, seems to be the main reason for the strong differences between winter and summer aerosol conditions. A complete annual cycle of the AOT in the central Arctic could be measured. This is a valuable addition to the summertime observations with the sun photometers of the Arctic Aerosol Robotic Network (AERONET). In line with the pronounced annual cycle in the aerosol optical properties, typical CCN number concentrations (0.2 % supersaturation level) ranged from 50–500 cm−3 in winter to 10–100 cm−3 in summer in the ABL. In the lower free troposphere (at 2000 m), however, the CCN level was roughly constant throughout the year, with values mostly from 30 to 100 cm−3. A strong contrast between winter and summer was also given in terms of ABL INPs which control ice production in low-level clouds. While soil dust (from surrounding continents) is probably the main INP type during the autumn, winter, and spring months, local sea spray aerosol (with a biogenic aerosol component) seems to dominate the ice nucleation in the ABL during the summer months (June–August). The strong winter vs. summer contrast in the INP number concentration by roughly 2–3 orders of magnitude in the lower troposphere is, however, mainly caused by the strong cloud temperature contrast. A unique event of the MOSAiC expedition was the occurrence of a long-lasting wildfire smoke layer in the upper troposphere and lower stratosphere. Our observations suggest that the smoke particles frequently triggered cirrus formation close to the tropopause from October 2019 to May 2020.
- Article
(13761 KB) - Full-text XML
- BibTeX
- EndNote


The Arctic, as part of the highly polluted Northern Hemisphere, can no longer be regarded as a pristine environment that is widely decoupled from the pollution centers of Asia, Europe, and North America (Abbatt et al., 2019; Willis et al., 2018, 2019; Schmale et al., 2021, 2022). The increasing number of extreme wildfires associated with long-distance transport of smoke towards all latitudes from the tropics to the North Pole is a new aspect that contributes in addition to strong changes in the environmental conditions in the Arctic (Xian et al., 2022a, b), even up to the stratosphere (Ohneiser et al., 2021a; Ansmann et al., 2023). In order to consider these changes in climate modeling, especially in simulations of aerosol–cloud–precipitation interactions, an improved knowledge of the aerosol conditions as a function of height and season is required. However, vertically resolved observations of aerosol properties in the Arctic are scarce and are almost absent for the winter half year.
The MOSAiC (Multidisciplinary drifting Observatory for the Study of Arctic Climate) expedition offered the unique opportunity to collect a dense data set of aerosol profiles in the North Pole region throughout a full year (Engelmann et al., 2021; Ohneiser et al., 2021a). MOSAiC was the largest Arctic research initiative in history and took place from September 2019 to October 2020. Observations were mostly performed at latitudes >80∘ N. The goal of the MOSAiC expedition was to take the closest look ever at the Arctic as the epicenter of global warming and to gain fundamental insights; these insights are key to better understand global climate change. A rather detailed monitoring of the atmosphere, cryosphere, and biosphere in the central Arctic was realized (see the overview articles in the MOSAiC special issue in Elementa: Science of the Anthropocene) (Rex et al., 2022). The German icebreaker Polarstern (Knust, 2017) served as the main MOSAiC platform for advanced active remote sensing of the atmosphere with several lidar and cloud radar instruments (Shupe et al., 2022). Polarstern was trapped in the ice and drifted through the Arctic Ocean from 4 October 2019 to 16 May 2020; however, it was then forced to leave the ice zone for logistical reasons at the beginning of June and August 2020. The observations in ice at latitudes >85∘ N could be continued from 21 August to 20 September 2020.
A state-of-the-art multiwavelength aerosol–cloud Raman lidar (Engelmann et al., 2016; Jimenez et al., 2020) aboard Polarstern was continuously operated side by side with the ARM (Atmospheric Radiation Measurement) mobile facility 1 (AMF1) and collected tropospheric and stratospheric aerosol and cloud profile data throughout the expedition period. Our role in the MOSAiC consortium was to provide a seasonally resolved and height-resolved characterization of aerosols and clouds in the North Pole region from the surface up to 30 km height (Engelmann et al., 2021). MOSAiC was not only the longest Arctic field campaign ever, it also provided the unique opportunity to perform, for the first time, aerosol profiling at extreme northern latitudes during the winter months (in January–February 2020 at >87∘ N).
Ohneiser et al. (2021a) focused on the lidar observations of the aerosol in the upper troposphere and lower stratosphere (UTLS). A lofted aerosol layer was continuously observed from about 5 to 20 km height for more than 7 months (October 2019 to mid-May 2020). The aerosol consisted of Siberian wildfire smoke in the lower part and Raikoke volcanic sulfate aerosol in the upper part of the UTLS aerosol layer (Ohneiser et al., 2021a; Ansmann et al., 2023). In this article, we present part 2 of our MOSAiC aerosol lidar observations aboard Polarstern and summarize our findings regarding the optical and cloud-relevant properties of tropospheric aerosols (from 0 to 10 km height) observed between 80 and 90∘ N during the MOSAiC year.
Let us briefly outline several gaps in our knowledge about Arctic aerosols with emphasis on aerosol–cloud interaction and how the MOSAiC lidar and in situ observations aboard Polarstern may contribute to this field of atmospheric research. As stated by Shupe et al. (2022), a main MOSAiC science question is “What are the processes that regulate the formation, properties, precipitation, and lifetime of Arctic clouds and what is the impact of aerosols in these processes?”.
To answer this question, ground-based in situ aerosol characterization all over the Arctic (complemented by sporadic aircraft measurements during the spring and summer months) is of great value (see, e.g., Willis et al., 2018; Abbatt et al., 2019; Wex et al., 2019), although clearly insufficient. In terms of aerosol and ice nucleation conditions, at least three height regimes need to be distinguished:
- 1.
The near-surface layer (atmospheric boundary layer, ABL) contains mainly local aerosol particles in summer (June–August), originating from marine sources (Creamean et al., 2018, 2019, 2022; Zeppenfeld et al., 2019; Wex et al., 2019; Hartmann et al., 2021; Alpert et al., 2022; Li et al., 2022; Sze et al., 2023; Carlsen and David, 2022) and Arctic haze, i.e., mixtures of aged anthropogenic particles, smoke, and desert and agricultural soil dust, in winter (see, e.g., Wang et al., 2011; Law et al., 2014; Willis et al., 2018; Abbatt et al., 2019; Engelmann et al., 2021). Because of biogenic substances in the summertime sea spray aerosol, ice nucleation can be initiated at relatively high temperatures of −5 to −10 ∘C (Wex et al., 2019; Creamean et al., 2022; Alpert et al., 2022). Mineral dust particles, on the other hand, become ice active mainly at temperatures below −15 to −20 ∘C (Ansmann et al., 2008; Kanji et al., 2017) and, thus, control ice nucleation in the wintertime ABL. Agricultural soil dust containing biological and biogenic material may already significantly trigger ice nucleation at temperatures of −10 to −15 ∘C (Tobo et al., 2014; O'Sullivan et al., 2014).
- 2.
The second height regime is the lower to middle free troposphere (Griesche et al., 2021), decoupled from the ABL. This layer mostly contains long-range-transported continental aerosol, regardless of the season of the year (Stohl, 2006; Zhao et al., 2022). Desert dust and agricultural soil dust are the main ice-nucleating particle (INP) aerosol types (DeMott et al., 2015; Kanji et al., 2017). Recently, Tobo et al. (2019) pointed to the potential importance of dust from glacial sources containing biogenic material that may trigger ice nucleation at high temperatures above −15 ∘C. This dust component may be present in the lower free troposphere up to 2–3 km height during the summer months (Kawai et al., 2023). In the ABL and lower free troposphere, the majority of Arctic liquid-water and mixed-phased clouds develop (Carlsen and David, 2022). As was first found in tropical and subtropical mixed-phase clouds (Ansmann et al., 2008, 2009) and later confirmed for Arctic and midlatitude clouds (de Boer et al., 2011; Westbrook and Illingworth, 2011), immersion freezing, i.e., freezing of liquid-water droplets by nucleation of ice on an INP immersed in the droplets, is the dominant ice nucleation mode in the heterogeneous ice nucleation temperature regime ( ∘C), and thus in the lower Arctic troposphere.
- 2.
The third layer (cirrus regime) extends from about 5 km to the tropopause. UTLS sulfate background aerosol with traces of aged (partly coated) desert and agricultural soil dust as well as soot particles may dominate here (Martinsson et al., 2019; Brock et al., 2021). Wildfire smoke has increasingly contributed to the aerosol burden in the Arctic troposphere during the last years (Xian et al., 2022a, b). Smoke particles dominated at heights above 6–7 km from October 2019 to May 2020 over the Polarstern and had a strong impact on cirrus formation, as will be discussed in Sect. 5.3 and more extensively in another paper (in preparation).
This article is organized as follows. In Sects. 2 and 3, the applied instrumentation and lidar data analysis methods are described, respectively. Several case studies of tropospheric aerosol profiling (covering the full range of aerosol conditions from rather clean to polluted) in summer are discussed in Sect. 4.1. Case studies for the winter half year during the Arctic haze period have already been presented in Engelmann et al. (2021). The annual cycle of tropospheric aerosol profiles and aerosol optical thickness (AOT) observed during the MOSAiC year of 2019–2020 are then discussed in Sect. 4.2 and 4.3. Time series of the in situ and lidar-derived particle number concentration, used as a proxy for the cloud condensation nuclei (CCN) number concentration, and of the ice-nucleating particle (INP) number concentration for the height levels of 250 m (near ABL top), 2000 m (free troposphere), and in the upper troposphere are presented in Sect. 5. A short summary and concluding remarks complete the study in Sect. 6.
2.1 MOSAiC Polarstern route
The full track of the Polarstern is given in Creamean et al. (2022), Shupe et al. (2022), and Boyer et al. (2023). The ice breaker drifted with the ice through the central Arctic at latitudes ≥85∘ N until the beginning of April and cruised between 83 and 84∘ N until 22 May 2020 (Engelmann et al., 2021). Because of the COVID-19 pandemic, Polarstern had to leave the ice zone and transit to Ny-Ålesund (78.9∘ N, 11.9∘ E) on the island of Spitsbergen in Svalbard, Norway, at the beginning of June 2020 to exchange science team members. The same procedure was necessary at the beginning of August 2020. As a consequence of these complications, the observations were restricted to latitudes of 80–82∘ N from June to mid-August 2020. From mid-August to the end of September 2020, observations were again taken at latitudes ≥85∘ N.
2.2 MOSAiC Polarstern Polly
The remote-sensing infrastructure aboard Polarstern has been discussed in Engelmann et al. (2021). The multiwavelength polarization Raman lidar Polly (POrtabLe Lidar sYstem) (Engelmann et al., 2016) performed continuous measurements from 26 September 2019 to 2 October 2020 (Polly, 2022). A detailed description of the Polly instrument with all of the upgrades realized during the last years can be found in Hofer et al. (2017) and Jimenez et al. (2020). The lidar is mounted inside the OCEANET-Atmosphere container of the Leibniz Institute for Tropospheric Research (TROPOS). This container is designed for routine operation aboard Polarstern between Bremerhaven, Germany, and Cape Town, South Africa, and for cruises from Bremerhaven to Punta Arenas, Chile (Kanitz et al., 2011, 2013; Bohlmann et al., 2018; Yin et al., 2019), and participated in an Arctic field campaign in June and July 2017 for the first time (Griesche et al., 2020, 2021).
An overview of all measured and derived lidar products is given in Table 1 in Engelmann et al. (2021). The retrieval of the microphysical and cloud-relevant aerosol properties in Table 1 (in this article) is presented in Sect. 3.1–3.4. The basic aerosol observations comprise height profiles of the particle backscatter coefficient at 355, 532, and 1064 nm; the particle extinction coefficient at 355 and 532 nm; the respective extinction-to-backscatter ratio (lidar ratio) at 355 and 532 nm; and the particle linear polarization ratio at 355 and 532 nm (Baars et al., 2016; Hofer et al., 2017; Ohneiser et al., 2021a). Lidar signals are measured with a near-range and a far-range telescope, covering different height ranges; thus, backscatter coefficients and depolarization ratios are measurable from about 100 m to 30 km and extinction coefficients and lidar ratios are measurable from about 400 m upward. The main features of the basic MOSAiC aerosol data analysis (including signal correction, Rayleigh backscattering and extinction correction, and temporal averaging and vertical smoothing of signal profiles) are described in Ohneiser et al. (2020, 2021a, 2022). The retrieval scheme applied to obtain the aerosol properties from the lidar observations that are relevant in the studies of aerosol–cloud interaction are outlined in Sect. 3.
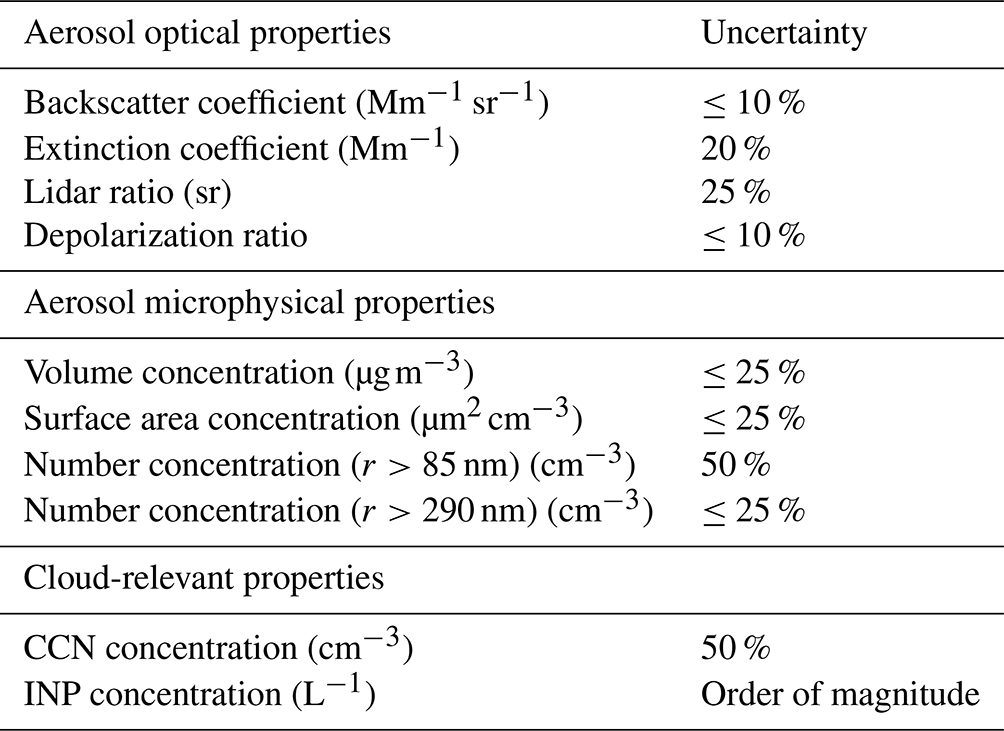
Table 1Overview of Polly observational products used in this study as well as the typical relative uncertainties in the determined and retrieved properties. Particle backscatter coefficients are measured at 355, 532, and 1064 nm, whereas the other aerosol optical properties are measured at 355 and 532 nm. r denotes the aerosol particle radius.
2.3 Microtops II sun photometer
A handheld Microtops II sun photometer (Ichoku et al., 2002) was used by the TROPOS lidar team aboard Polarstern to measure the AOT at wavelengths of 440, 500, 870, and 1020 nm whenever possible to support lidar observations of particle extinction profiles. Unfortunately, this photometer was only available aboard Polarstern from June to September 2020. The MOSAiC sun and lunar photometer installed by the TROPOS team in September 2019 aboard Polarstern failed to work properly. Microtops II is the standard device of MAN (Maritime Aerosol Network) (Smirnov et al., 2009), which is a component of the Aerosol Robotic Network (AERONET) (Holben et al., 1998). An operator is required to point the photometer to the Sun for a while to take stable measurements. Continuous, unattended measurements are not possible. The data are stored in the MAN (Maritime Aerosol Network) database (AERONET-MAN, 2022).
2.4 CALIOP
To check the representativeness of the 1-year MOSAiC aerosol observations, we compared our findings with Cloud-Aerosol Lidar with Orthogonal Polarization (CALIOP) observations (Winker et al., 2009, 2010). The spaceborne CALIOP lidar monitored Arctic aerosol profiles throughout the year (even during the winter months) from June 2006 to August 2023. These observations are favorable for comparison, despite the fact that the maximum latitude covered by the CALIOP observations is 81.8∘ N and MOSAiC measurements were performed from 80 to 90∘ N. Yang et al. (2021) analyzed all Arctic CALIOP aerosol profiles for latitudes from 65 to 82∘ N from June 2006 to December 2019 and presented time series of monthly resolved 13- to 14-year mean AOT and seasonally resolved 14-year mean summer and 13-year mean winter height profiles of the particle extinction coefficient at 532 nm.
2.5 Instrumentation for in situ measurements of aerosol microphysical properties and INP number concentrations aboard Polarstern
Continuous in situ observations of dry-particle number concentrations, particle number size distributions and black carbon mass concentrations (Boyer et al., 2023), and INP number concentrations (Creamean et al., 2022) were performed aboard Polarstern during the entire MOSAiC period from October 2019 to September 2020.
A commercial scanning mobility particle sizer (SMPS) was used to measure the particle number size distribution (PNSD). The instrumental setup includes a condensation particle counter. The particle number concentration was calculated by integrating over the PNSD, which was evaluated in three size (diameter) categories in this study: 10–25 nm (nucleation mode), 25–100 nm (Aitken mode), and 100–500 nm (accumulation mode). The SMPS was installed in the Aerosol Observing System (AOS) container that was operated as part of the United States Department of Energy (DOE) Atmospheric Radiation Measurement (ARM) user facility aboard Polarstern. The AOS was equipped with a total aerosol inlet that was 5 m in length, which corresponds to an inlet height of approximately 18m above the sea surface (Boyer et al., 2023).
The number concentrations n50,dry, discussed in Sect. 5.1, consider dried particles with diameters from 100 to 500 nm. n50,dry is used as a proxy for the CCN number concentration nCCN for a water supersaturation value of 0.2 %. CCN concentrations were also measured aboard Polarstern (Dada et al., 2022) and will be included in the discussions of the MOSAiC observations in Sect. 5.1. The in situ observations of n50,dry were carefully checked and corrected for contamination by local pollution (exhaust plume of Polarstern and further aerosol sources from the nearby measurement field station on the pack ice) (Beck et al., 2022). About 40 % of the measured data had to be removed (Boyer et al., 2023).
Regarding the INP observations, aerosol particles were collected in four size ranges using the Colorado State University (CSU) four-stage Davis Rotating-drum Unit for Monitoring (DRUM) cascading impactor through the AOS inlet (Creamean et al., 2022). The DRUM collected daily integrated samples from 0.15 to >12 µm (particle diameter). The AOS inlet has a high transmission efficiency for particles from 10 nm to 4 µm but has large uncertainties in transmission efficiency above 4 µm due to the low ambient aerosol signal in that size range. Daily mean INP samples, considering aerosol particles from 10 nm to 4 µm, are thus discussed in Sect. 5.2. The INP number concentration (immersion freezing mode, i.e., ice nucleation initiated by INPs immersed in water droplets) was determined by applying the CSU cold-plate method to the 24 h aerosol samples.
2.6 Air mass source analysis
Ensemble backward trajectories were computed (as part of the case studies) in Sect. 4.1 using the NOAA (National Oceanic and Atmospheric Administration) HYSPLIT (HYbrid Single-Particle Lagrangian Integrated Trajectory) model (HYSPLIT, 2022; Stein et al., 2015; Rolph et al., 2017). The arrival heights were set to observed aerosol layers to identify the origin of the pollution. Furthermore, the aerosol-source attribution method of Radenz et al. (2021) was applied. This air mass identification tool was developed to support the interpretation and evaluation of lidar profiles. We computed the normalized (accumulated) residence time, during which the air masses traveled within the well-mixed boundary layer at heights below 2 km, before they crossed Polarstern at well-specified arrival heights (from the surface to 12 km with a resolution of 500 m). This analysis is also based on HYSPLIT backward trajectories. A 10 d backward-trajectory analysis was found to be sufficient to identify the continental pollution sources (Asia, Europe, or North America); it was also sufficient for background aerosol condition cases, in which the respective air masses obviously did not cross any populated continental region (aerosol source region) during a period of longer than a week before arrival over Polarstern.
During the last 10 years, we have developed a complex lidar retrieval scheme to obtain information about microphysical and cloud-relevant parameters from lidar backscatter and extinction profiles for a number of different aerosol types (Mamouri and Ansmann, 2016, 2017; Ansmann et al., 2019a, 2021). In this section, we expand the methodology towards Arctic aerosol conditions.
3.1 Arctic aerosol model: optical vs. microphysical properties
The POLIPHON (Polarization Lidar Photometer Networking) method is a robust and practicable single-wavelength lidar method to derive number, surface area, and volume concentrations of particles from the measured optical properties in the troposphere and stratosphere and to estimate tropospheric CCN and INP number concentrations. The POLIPHON method makes use of the height profiles of the 532 nm particle backscatter coefficient and particle depolarization ratio and converts the measured backscatter into microphysical properties by using aerosol-type-dependent conversion factors. These conversion factors are derived from long-term AERONET observations (Holben et al., 1998) around the globe and connect the optical and underlying microphysical properties for main atmospheric aerosol components, such as desert dust, marine particles, anthropogenic haze, and wildfire smoke.
In the framework of the MOSAiC data analysis, Arctic AERONET observations were used to derive a respective set of conversion factors for Arctic aerosol particles, i.e., a mixture of aged anthropogenic haze, biomass-burning smoke, and soil dust after long-distance transport and a minor contribution of marine particles. Sun and sky photometer observations of 11 Arctic AERONET stations covering up to almost 25 years of observations (1997–2021) were considered in this approach (AERONET, 2022). According to these Arctic AERONET observations, the Arctic aerosol shows remarkably constant properties from the spring season to late summer. Typical Ångström exponents (for the 440–870 nm spectral range) are 1.4–1.6, clearly indicating nonmarine, fine-mode aerosol components. The fine-mode fraction is around 0.9 and indicates the dominance of anthropogenic pollution and biomass-burning smoke. Most of the time, the AOT is found in the range of 0.015–0.15 at 500 nm, which is in good agreement with the studies of Tomasi et al. (2012, 2015) and Xian et al. (2022a).
To obtain height profiles of Arctic aerosols in terms of standard products, such as volume concentration v(z), surface area concentration s(z), and particle number concentrations nrmin(z) considering all particles with radius > rmin (e.g., >50 nm in the case of n50) under ambient conditions, the following basic relationships are available:
with the particle backscatter coefficient β(z) at height z and the extinction-to-backscatter or lidar ratio L. Arctic tropospheric lidar ratios were observed in the range from 20 to 90 sr at 532 nm (Ritter et al., 2016; Engelmann et al., 2021) and accumulated between 40 and 70 sr. All conversion factors, i.e., the extinction-to-volume conversion factor (cv), the extinction-to-surface-area conversion factor (cs), and the extinction-to-number conversion factor (crmin) for 532 nm in Eqs. (1)–(3) are obtained from the analysis of the Arctic AERONET observations regarding the relationship between measured aerosol optical properties (500 or 532 nm AOT) and AERONET retrieval products (column values of nrmin, s, and v). Details of the determination of the conversion factors can be found in Mamouri and Ansmann (2016, 2017). Table 2 shows the obtained conversion factors for Arctic aerosols. These quantities are partly used as input in the estimation of CCN and INP number concentrations, as explained in Sect. 3.3 and 3.4. In the MOSAiC data analysis, we applied the Arctic conversion factors to all MOSAiC lidar observations at the selected height levels of 250 and 2000 m, as discussed in Sect. 5.1 and 5.2. As the conversion factors were derived for summertime aerosol conditions, they may not be fully applicable to Arctic haze observations during the winter half year. This aspect is further discussed in Sects. 3.3, 3.4.1, and 5.1.
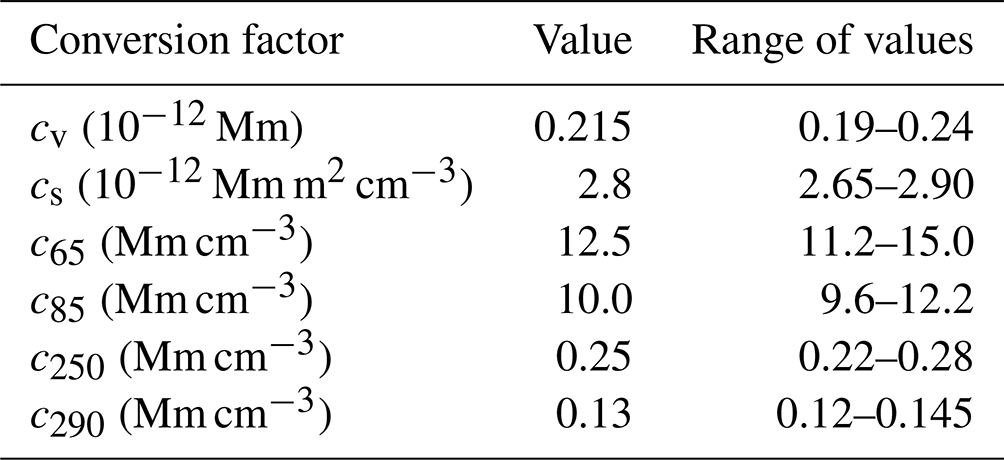
Table 2Conversion parameters for Arctic aerosol, required in the conversion of the particle extinction coefficient σ at 532 nm into particle number concentrations (n65, n85, n250, and n290), surface area concentration (s), and volume concentration (v). The mean values and the range of mean values (from the four stations) for the conversion factors cv, cs, c65, c85, c250, and c290 are obtained from the extended AERONET data analysis (AERONET, 2022). The conversion factors are derived from the AERONET observations at Barrow (1997–2021), Thule (2007–2021), Pearl (2007–2019), and Kangerlussuaq (2008–2021). All conversion factors hold for a 532 nm wavelength. The AERONET data analysis procedures applied to obtain the conversion factors are described in Mamouri and Ansmann (2016, 2017).
Input in these CCN and INP retrieval procedures are aerosol parameters for dry conditions. However, AERONET sun photometer observations in the Arctic are typically performed at a relative humidity (RH) of around 80 % in the lower, aerosol-laden atmosphere according to the MOSAiC 2019–2020 radiosonde observations (Maturilli et al., 2021) and the study of Shupe et al. (2011) at Arctic land-based observatories. Therefore, all of the conversion factors are derived for aerosol scenarios observed at high humidity.
The aerosol particles contain a considerable amount of water at high humidity; thus, the aerosol backscatter and extinction coefficients are significantly enhanced compared with the respective optical properties for dry conditions. To obtain the dry aerosol parameters (e.g., n50,dry, needed in the CCN estimation, and sdry, needed in the INP retrieval), the following procedure was necessary to correct for water uptake effects: we make use of the well-known, so-called enhancement factor , with RH as a percentage and an exponent γ of, e.g., −0.46 for continental fine-mode particles (see, e.g., Skupin et al., 2016). The enhancement factor relates the optical properties of the particles measured under ambient RH conditions (e.g., at 80 %) to respective values for dry conditions (e.g., RH of 0 %–20 %). In the first step, we converted the lidar profiles of the particle extinction coefficient for ambient RH (known from the MOSAiC radiosonde RH profiles) to values for RH =80 % by multiplying the measured extinction values with the factor . Then, we multiplied these extinction coefficients for RH =80 % with the conversion factor of c85 to obtain an estimate for the height profile of the particle number concentration n85(z) at RH =80 %. This number concentration n85 (considering all particles with an ambient radius >85 nm) was then interpreted as an appropriate proxy for n50,dry. It is assumed here that water uptake causes an increase in the radius of dry particles by roughly a factor of 1.5 when the RH is increased from low RH to high RH values of around 80 %; thus, particles with a radius > 80–85 nm will shrink to particles with a radius >50 nm when the RH is reduced from 80 % to less than 30 %–40 %.
In order to obtain the height profile of the particle surface area concentration sdry(z) for Arctic aerosols, we used the computed lidar extinction profiles for RH =80 % and multiplied these profiles by the conversion factor cs to obtain the surface area profile s(z) for RH =80 %. We then converted this s profile to a profile for RH =20 % by multiplying all s values by the factor . This profile, after water uptake correction, was interpreted as sdry.
According to Table 1, the microphysical aerosol properties (dry volume and surface area concentrations) can be estimated with an uncertainty of 25 %. The uncertainty is of the order of 50 % in the case of the n50,dry retrieval when the aerosol type is well known, as comparisons with airborne in situ measurements of CCN number concentrations have shown (Düsing et al., 2018; Choudhury et al., 2022). The uncertainty is larger (within a factor of 2) when the aerosol type, and thus the aerosol size distribution for this aerosol type, is not well known or when a rather complex mixture of different hygroscopic and hydrophobic, fine- and coarse-aerosol particles prevail (Haarig et al., 2019; Georgoulias et al., 2020).
3.2 Upper-tropospheric aerosol conversion factors
In Sect. 5.3, we present INP time series for wildfire smoke particles at the cirrus level (October 2019 to May 2020 and September 2020) and for mineral dust (June–August 2020). In the respective lidar data analysis following Eq. (2), we use the extinction-to-surface-area conversion factor cs of Mm m2 cm−3 for aged UTLS wildfire smoke and a characteristic lidar ratio of 85 sr at 532 nm in the particle surface area retrieval (Ansmann et al., 2021; Ohneiser et al., 2021a). We converted the optical properties measured at upper-tropospheric humidity conditions to values for RH =20 % in a first step and multiplied the RH-corrected extinction values by the smoke-related conversion factor to obtain sdry for smoke conditions. The wildfire conversion factors were applied to all near-tropopause MOSAiC observations in the autumn, winter, and spring seasons of 2019–2020.
In a similar way, the extinction-to-surface-area conversion factor for aged continental aerosol of Mm m2 cm−3 (Mamouri and Ansmann, 2016) was applied for the summer months (June–August), and we assumed a lidar ratio of 55 sr for these continental particles. Furthermore, we assumed that aged desert (clay) dust particles were exclusively responsible for ice nucleation in the upper troposphere during the summer months. The estimated dust fraction multiplied by the total particle surface area sdry was then used as aerosol input in the INP retrieval. More details are given in Sects. 3.4.1, 3.4.2, and 5.3.
From a methodological point of view, the most correct way to determined the dust-related surface area sdry would be to use the measured particle linear depolarization ratio and to separate dust and non-dust components to the backscatter and extinction coefficients in the first step and then apply the dust conversion factor to the dust-related extinction coefficients to obtain the dust sdry values in the second step (Mamouri and Ansmann, 2016). However, such an approach is only possible if the dust fraction is >10 % (and, thus, clearly detectable in the depolarization measurements) and not <5 %, as was the case during the MOSAiC expedition.
3.3 Estimation of CCN number concentration
In Sect. 5.1, lidar-derived time series of the CCN number concentration nCCN at 250 and 2000 m height are discussed. CCN values at 250 m height may represent the aerosol conditions well during low-level cloud formation at the top of the Arctic ABL. According to Peng et al. (2023), the ABL top height was mostly between 100 and 400 m over Polarstern during the MOSAiC year. Time series at 2000 m height provide insight into the CCN conditions in the lower free troposphere, where stratiform mixed-phase cloud layers frequently develop.
As discussed in Mamouri and Ansmann (2016), the particle number concentration n50,dry can be used as a proxy for nCCN in an air parcel in which the relative humidity over water is 100.2 % (supersaturation level of 0.2 %, SWAT=1.002):
The factor fss is set to 1.0 for a water supersaturation value of 0.2 % and is introduced to estimate CCN number concentrations for lower and higher supersaturation levels. Values for fss were found to be about 0.4, 1.5, and 2.0 for SWAT=1.001, 1.004, and 1.007, respectively, in the Canadian Arctic (Tuktoyaktuk; 69.4∘ N, 133.0∘ W) in the spring of 2014 (Herenz et al., 2018). According to their observations the critical diameter (dcrit) was 107 nm at SWAT=1.002. For dcrit, the integral over the independently measured particle size distribution from dcrit to the maximum size bin (dmax) is equal to the measured CCN number concentration (nCCN). dcrit decreases with increasing supersaturation. Moreover, Dada et al. (2022) derived a critical diameter of around 100 nm for a supersaturation of 0.2 % from MOSAiC observations aboard Polarstern during a warm-air-mass intrusion event in April 2020. All of these findings corroborate that n50,dry is an appropriate proxy for nCCN for the supersaturation level of 0.2 %.
As mentioned in Sect. 3.1, we used the Arctic conversion factors obtained from summertime AERONET observations in the analysis of the entire MOSAiC lidar data (measured at 250 and 2000 m height). However, especially the conversion factor c85 (and also c65) in Table 2, used in the n50 and CCN retrieval, is very sensitive to the size distribution details of the given aerosol conditions, and thus may not hold at all for wintertime (Arctic haze) conditions. This potential uncertainty source is discussed in Sect. 5.1, where we compare the lidar estimates of n50,dry with in situ n50,dry values.
3.4 Estimation of INP number concentration
In Sect. 5.2 and 5.3, we present MOSAiC time series of lidar-derived INP estimates for the height levels of 250 and 2000 m above Polarstern and for the height 1 km below the tropopause. INP time series for 250 and 2000 m height indicate the immersion freezing conditions in mixed-phase clouds in the ABL and lower free troposphere, and the INP number concentration values for the uppermost troposphere indicate the potential of aerosol particles to influence ice nucleation at the cirrus level. As outlined Sect. 1, the dominant ice-nucleating aerosol type in the ABL is probably desert and agricultural soil dust in winter. Sea spray aerosol (SSA), carrying ice-active substances of biogenic origin, is assumed to control ice nucleation in the summer ABL. In the lower free troposphere (at 2000 m height in this study), we assume that clay mineral dust is the only INP type throughout the year. In the upper troposphere, we assume that smoke and dust particles serve as INPs in the deposition ice nucleation (DIN) mode. In Sect. 3.4.1, we describe the immersion freezing INP parameterization for clay mineral dust and SSA particles, and the DIN parameterization for smoke and clay mineral dust particles for upper-tropospheric ice nucleation conditions is outlined in Sect. 3.4.2. Thus, in our study, we ignore a contribution by dust from agricultural and glacial sources.
3.4.1 INP parameterization (immersion freezing)
Zhao et al. (2022) recently discussed the long-range transport of desert dust from Asia to the Arctic and showed that a small percentage of dust must be expected everywhere over the Arctic in the tropospheric column from the surface up to the tropopause. The studies of Yang et al. (2021) and Xian et al. (2022a) support this finding. The only exception may be the ABL during the summer months. During long-distance travel from the main dust sources, the dust particles probably become significantly contaminated with substances that reduce their ice nucleation efficiency. As pointed out in the review article of Willis et al. (2018), aerosol particles can undergo significant chemical aging and cloud processing along the transport path to Arctic regions. Aged dust particles may be partly or even completely coated with sulfate, nitrate, and organic substances. Their potential to serve as INP may then be considerably reduced by an order of magnitude (Möhler et al., 2008; Cziczo et al., 2009; Wex et al., 2014; Augustin-Bauditz et al., 2014; Kulkarni et al., 2014; Kanji et al., 2017, 2019; Knopf et al., 2018).
The water-activity-based immersion freezing model ABIFM (Knopf and Alpert, 2013, 2023), drawn from the water-activity-based homogeneous ice nucleation theory (Koop et al., 2000), is used to estimate the INP number concentration nINP in the lower troposphere (immersion freezing regime):
with the contribution afrac of the INP type of interest (dust or SSA) to the total particle surface area concentration sdry; the ice nucleation rate coefficient for immersion freezing Jhet,IF, which is computed as a function of aerosol-type-specific parameters k and b (see Knopf and Alpert, 2013; Alpert and Knopf, 2016; Alpert et al., 2022, for more details); ice nucleation temperature T; and ice supersaturation SICE. In the case of dust particles, we used k=53.32 and in the computation of Jhet,IF (Alpert and Knopf, 2016). These parameters follow from laboratory studies with kaolinite particles (Wex et al., 2014). Kaolinite is a clay mineral. The values are k=26.6132 and b=−3.9346 in the SSA-related calculation of Jhet,IF (Alpert et al., 2022). The decrease in the ice nucleation efficiency of aged and contaminated dust particles is considered by the factor fage, which is set to 0.2 (Augustin-Bauditz et al., 2014; Wex et al., 2014). Ice nucleation (i.e., activation of INPs) takes place during the time interval Δt. The activation time for ice formation according to Eq. (5) is set to Δt=60 s (as in Alpert et al., 2022) to be close to the timescales applied in the filter-based offline INP measurements (DeMott et al., 2016; Creamean et al., 2022).
As outlined in Sect. 3.1, the surface area concentration sdry is obtained from the conversion of the lidar extinction coefficients. We used the Arctic conversion factor cs in Table 2 to estimated sdry for heights below 3–4 km. In contrast to c65 and c85, the factors cs and cv are robust conversion factors and do not vary much from aerosol type to aerosol type, as long as the aerosol conditions are dominated by fine-mode aerosol, as was the case for the selected height levels of 250 and 2000 m. According to our MOSAiC lidar observations, the dust fraction was always afrac≤0.05. For SSA and smoke particles, afrac was set to 1.0 in the respective INP retrievals in the ABL (SSA) and in the upper troposphere (smoke, as described in the next section).
3.4.2 INP parameterization (deposition ice nucleation)
Very limited information about the INP conditions in the Arctic upper troposphere is available in the literature. A short review of field studies regarding aerosol–cirrus interaction is given in Sect. 5.3. During MOSAiC, wildfire smoke particles dominated in the upper troposphere over the central Arctic from October 2019 to May 2020 (Ohneiser et al., 2021a) and also in September 2020. The ice nucleation efficiency of aged smoke particles is determined by organic material (organic carbon, OC). The black carbon (BC) or soot content is typically 2 %–3 % (Dahlkötter et al., 2014; Yu et al., 2019; Torres et al., 2020; Ohneiser et al., 2023) and has no relevant impact on the ice-nucleating efficiency of aged wildfire smoke particles. Biomass-burning particles also contain humic-like substances which represent large macromolecules that could serve as INP at low temperatures of −50 to −70 ∘C (Wang and Knopf, 2011; Wang et al., 2012; Knopf et al., 2018).
Because of the complex chemical, microphysical, and morphological properties of aged fire smoke particles, which can occur as glassy, semiliquid, and liquid aerosol particles, the development of smoke INP parameterization schemes is a crucial task (Knopf et al., 2018). The particles and released vapors in biomass-burning plumes undergo chemical and physical aging processes on their way up to the tropopause and during long-range transport over weeks and months. Aging includes photochemical processes, heterogeneous chemical reactions on and in the particles, condensation of gases on the particle surfaces, collision and coagulation, and cloud processing (when acting as CCN or INPs in several consecutive cloud evolution and dissipation events). All of these impacts change the chemical composition of the smoke particles, their morphological characteristics (size, shape, and internal structure), and the internal mixing state of the smoke particles.
In this exercise, we assume that smoke particles, after finalizing the aging process, show a core–shell structure with a BC-containing core and an OC-rich shell (where OC denotes organic carbon) and that their ability to serve as INPs mainly depends on the material in the shell and, thus, the organic material of the particles. If the particles are in a glassy state, they can act as INPs in DIN processes (Murray et al., 2010; Wang and Knopf, 2011; Wang et al., 2012). DIN is defined as ice formation occurring on the INP surface by water vapor deposition from the supersaturated gas phase. When the smoke particles can take up water, and a liquid surface around the particles develops, immersion freezing can proceed (Wang et al., 2012; Knopf and Alpert, 2013; Knopf et al., 2018).
The goal of the MOSAiC aerosol study here is to demonstrate that the dust and smoke aerosol levels were high enough in the upper troposphere to trigger heterogeneous ice nucleation and to significantly influence cirrus formation. As we will discuss below, ice crystal number concentrations, retrieved from MOSAiC lidar and radar observations, are mostly in the range from 0.1 to 10 L−1 and, thus, point to the dominance of heterogeneous ice formation at the cirrus level. Ice nucleation is initiated by the lofting of air parcels during the updraft period of a gravity wave (Haag and Kärcher, 2004; Spichtinger et al., 2005; Kärcher et al., 2006; Kärcher and Podglajen, 2019). Gravity waves show time periods of typically 15–20 min (Kalesse and Kollias, 2013) with an initial, most important updraft phase of about 5 min (first quarter of the full temporal length) and updraft velocities ranging mostly from 10 to 50 cm s−1 (Barahona et al., 2019; Kärcher and Podglajen, 2019).
As mentioned, we assume that the aerosol in the upper troposphere consisted of wildfire smoke during the MOSAiC autumn, winter, and spring months. From June to August 2020, in the absence of pronounced wildfire smoke layers, the upper-tropospheric aerosol was assumed to be an aerosol mixture mainly composed of anthropogenic haze, soil dust, and a small fraction of biomass-burning smoke. In our INP estimation, we assume that kaolinite particles dominate heterogeneous ice nucleation in the upper troposphere at −50 to −70 ∘C under these aerosol mixture conditions.
We considered DIN as the main heterogeneous ice nucleation mode. The INP number concentration can be estimated using the parameterization of Wang and Knopf (2011):
The ice nucleation rate coefficient Jhet,DIN is a function of the contact angle (cangle), ice nucleation temperature (T), and ice supersaturation (SICE). The selected contact angles are 12 and 26.5∘ for clay mineral dust and wildfire smoke INP computation, respectively (Wang and Knopf, 2011). Although, for each species, cangle can range by about 7–10∘. For these contact angles (12 and 26.5∘), the ice nucleation onset RHICE,on is 107 % (kaolinite) and 140.5 % (smoke) (Wang and Knopf, 2011). In the case of dust, we set afrac to 0.05 and fage to 0.2 in Eq. (6); for wildfire smoke, these values are afrac=1.0 and fage=1.0. The determination of sdry for dust and smoke particles is outlined in the Sect. 3.2. Regarding the organic material, leonardite is selected (a standard humic acid surrogate material) to represent the amorphous organic coating of smoke particles. Leonardite, an oxidation product of lignite, is a humic-acid-containing, soft, waxy particle (mineraloid) that is black or brown in color and soluble in alkaline solutions. The INP characteristics of leonardite have been studied in detail in laboratory experiments (Knopf and Alpert, 2013; Rigg et al., 2013).
We simulated the gravity-wave-induced ascent of an air parcel to provide realistic numbers on ice nucleation events and related INP number concentrations. During the updraft phase, the temperature (T) decreases and SICE increases in the lofted air parcels, and ice nucleation starts when RHICE exceeds RHICE,on. We set the mean updraft speed to 30 cm s−1 (mean value for the first quarter of the gravity wave period) and accumulated the INP number concentration for an ascent period of Δt=35 s (ice nucleation period) in the case of the very ice-active dust particles and 88 s in the case of the much less ice-active smoke particles. After 35 s (dust) and 88 s (smoke) of lofting, RHICE was 2 % (dust) and about 6 % (smoke) larger than RHICE,on. We arbitrarily terminated the INP computation when the INP concentration reached 30 L−1 for a given smoke particle surface area concentration of 25 µm2 cm−3, following Eq. (6). In a similar way, we terminated the dust INP computation when the INP concentration reached 30 L−1 for a given total particle surface area concentration of 25 µm2 cm−3 and by taking a dust fraction (afrac) of 5 % and an aging factor (fage) of 0.2 in Eq. (6) into account. We terminated the computation after 35 and 88 s, as we assumed that water vapor deposition on the rapidly growing, freshly formed ice crystals reduces SICE considerably so that further nucleation is widely suppressed. This simplified approach is sufficient to provide an estimation of how many INPs were typically available for ice nucleation in the upper troposphere over the High Arctic during the MOSAiC year. More information on the gravity wave simulations can be found in Mamouri et al. (2023) and in Sect. 5.3.
As indicated in Table 1, the uncertainty in the lidar-based estimation of the INP number concentration is large (an order magnitude). To validate the reliability of the INP retrieval procedures, we make use of so-called closure studies in which the lidar-derived INP number concentrations (nINP) are compared with estimated ice crystal number concentrations (nICE) from radar–lidar observations in ice crystal virga (Ansmann et al., 2019b; Marinou et al., 2019; Engelmann et al., 2021). In this comparison, we assume that the number of ice crystals indicates the number of INPs (nICE=nINP). Good agreement in these closure studies, i.e., similar estimates of nINP and nICE, in the absence of secondary ice production (Ramelli et al., 2021), would indicate a high reliability of the selected INP parameterization. This closure concept will be applied in an extended MOSAiC study of mixed-phase and ice cloud systems (to be presented in follow-up articles).
Part 1 of the results, which are outlined in Sects. 4 and 5, deals with the optical properties of Arctic aerosols observed during the MOSAiC Polarstern cruise. We start with four case studies in Sect. 4.1 and then present overviews and time series in Sect. 4.2 and 4.3.
4.1 Clean and polluted conditions during the MOSAiC summer: case studies
The three observations in Fig. 1 are selected because they cover the full range of MOSAiC summer scenarios from clean to polluted conditions. As mentioned, wintertime (Arctic haze) scenarios have been discussed by Engelmann et al. (2021). On all 3 d, the lowest part of the troposphere was rather clean. Particle backscatter coefficients from 0.02 to 0.1 Mm−1 sr−1 at 532 nm in Fig. 1a indicate particle extinction coefficients of about 1–6 Mm−1 (for a typical extinction-to-backscatter ratio of 50–60 sr). On 30 June 2020, Arctic background conditions were observed over the Polarstern with extinction coefficients <5 Mm−1 throughout the entire troposphere. The backscatter peak at the surface was probably caused by weak fog that drifted over the lidar during the signal-averaging period (18:00–24:00 UTC). The lidar-derived 532 nm AOT was 0.023 on 30 June 2020 (when ignoring the fog-related near-surface backscatter peak). The Microtops photometer measured a 500 nm AOT of 0.035 on the evening of 30 June 2020. According to the HYSPLIT backward-trajectory analysis in Fig. 2a, the air mass had not had contact with any populated region during the last 10 d. Such clean conditions were frequently observed from the end of May to mid-July 2020.
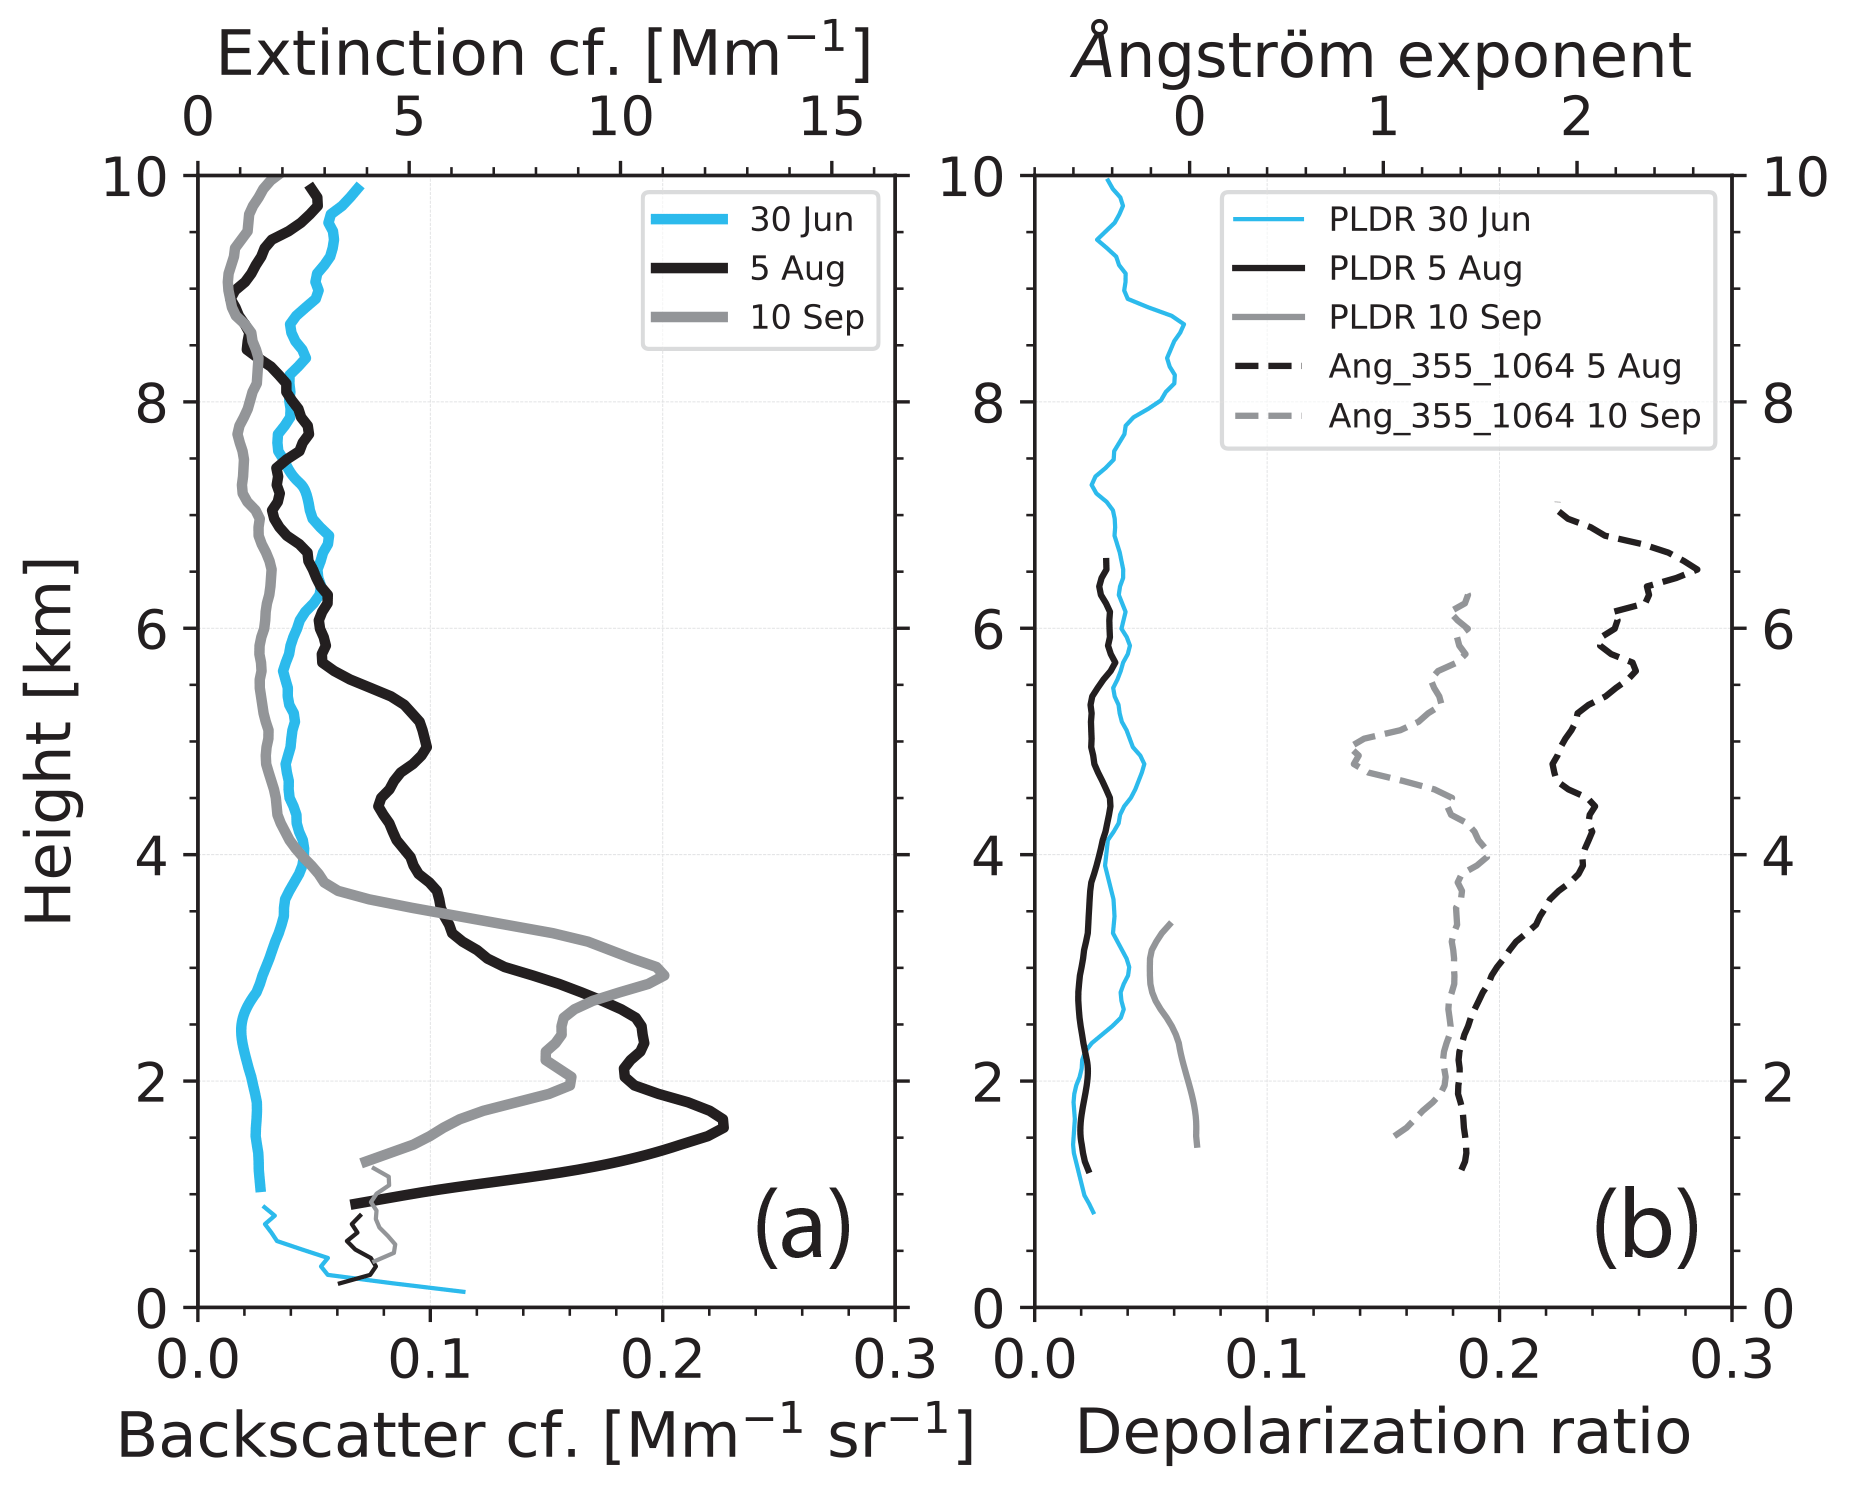
Figure 1Pollution long-range transport towards the central Arctic at heights above 1 km observed with the Polarstern lidar on 5 August 2020 (lidar observations are averaged from 21:00 to 24:00 UTC; Polarstern position: 78.4∘ N, 6.0∘ W) and on 10 September 2020 (signal averaging from 18:15 to 21:10 UTC; Polarstern position: 88.7∘ N, 105.6∘ E). The measurement on 30 June 2020 shows clean background conditions (18:00–24:00 UTC; Polarstern position: 81.8∘ N, 9.5∘ E). Backscatter and extinction profile segments from lidar observations with the near-range telescope are shown as thin solid lines up to about 1 km height in panel (a). The 532 nm extinction coefficients are obtained by multiplying the backscatter coefficients with a lidar ratio of 55 sr. In panel (b), the particle linear depolarization ratio (PLDR) at 532 nm for all 3 d and the backscatter-related Ångström exponent (Ang; considering the backscatter coefficients at 355 and 1064 nm) for the two pollution events on 5 August and 10 September 2020 are given. The Ångström exponent was 1.5–2.0 throughout the troposphere under the clean background conditions on 30 June (not shown).
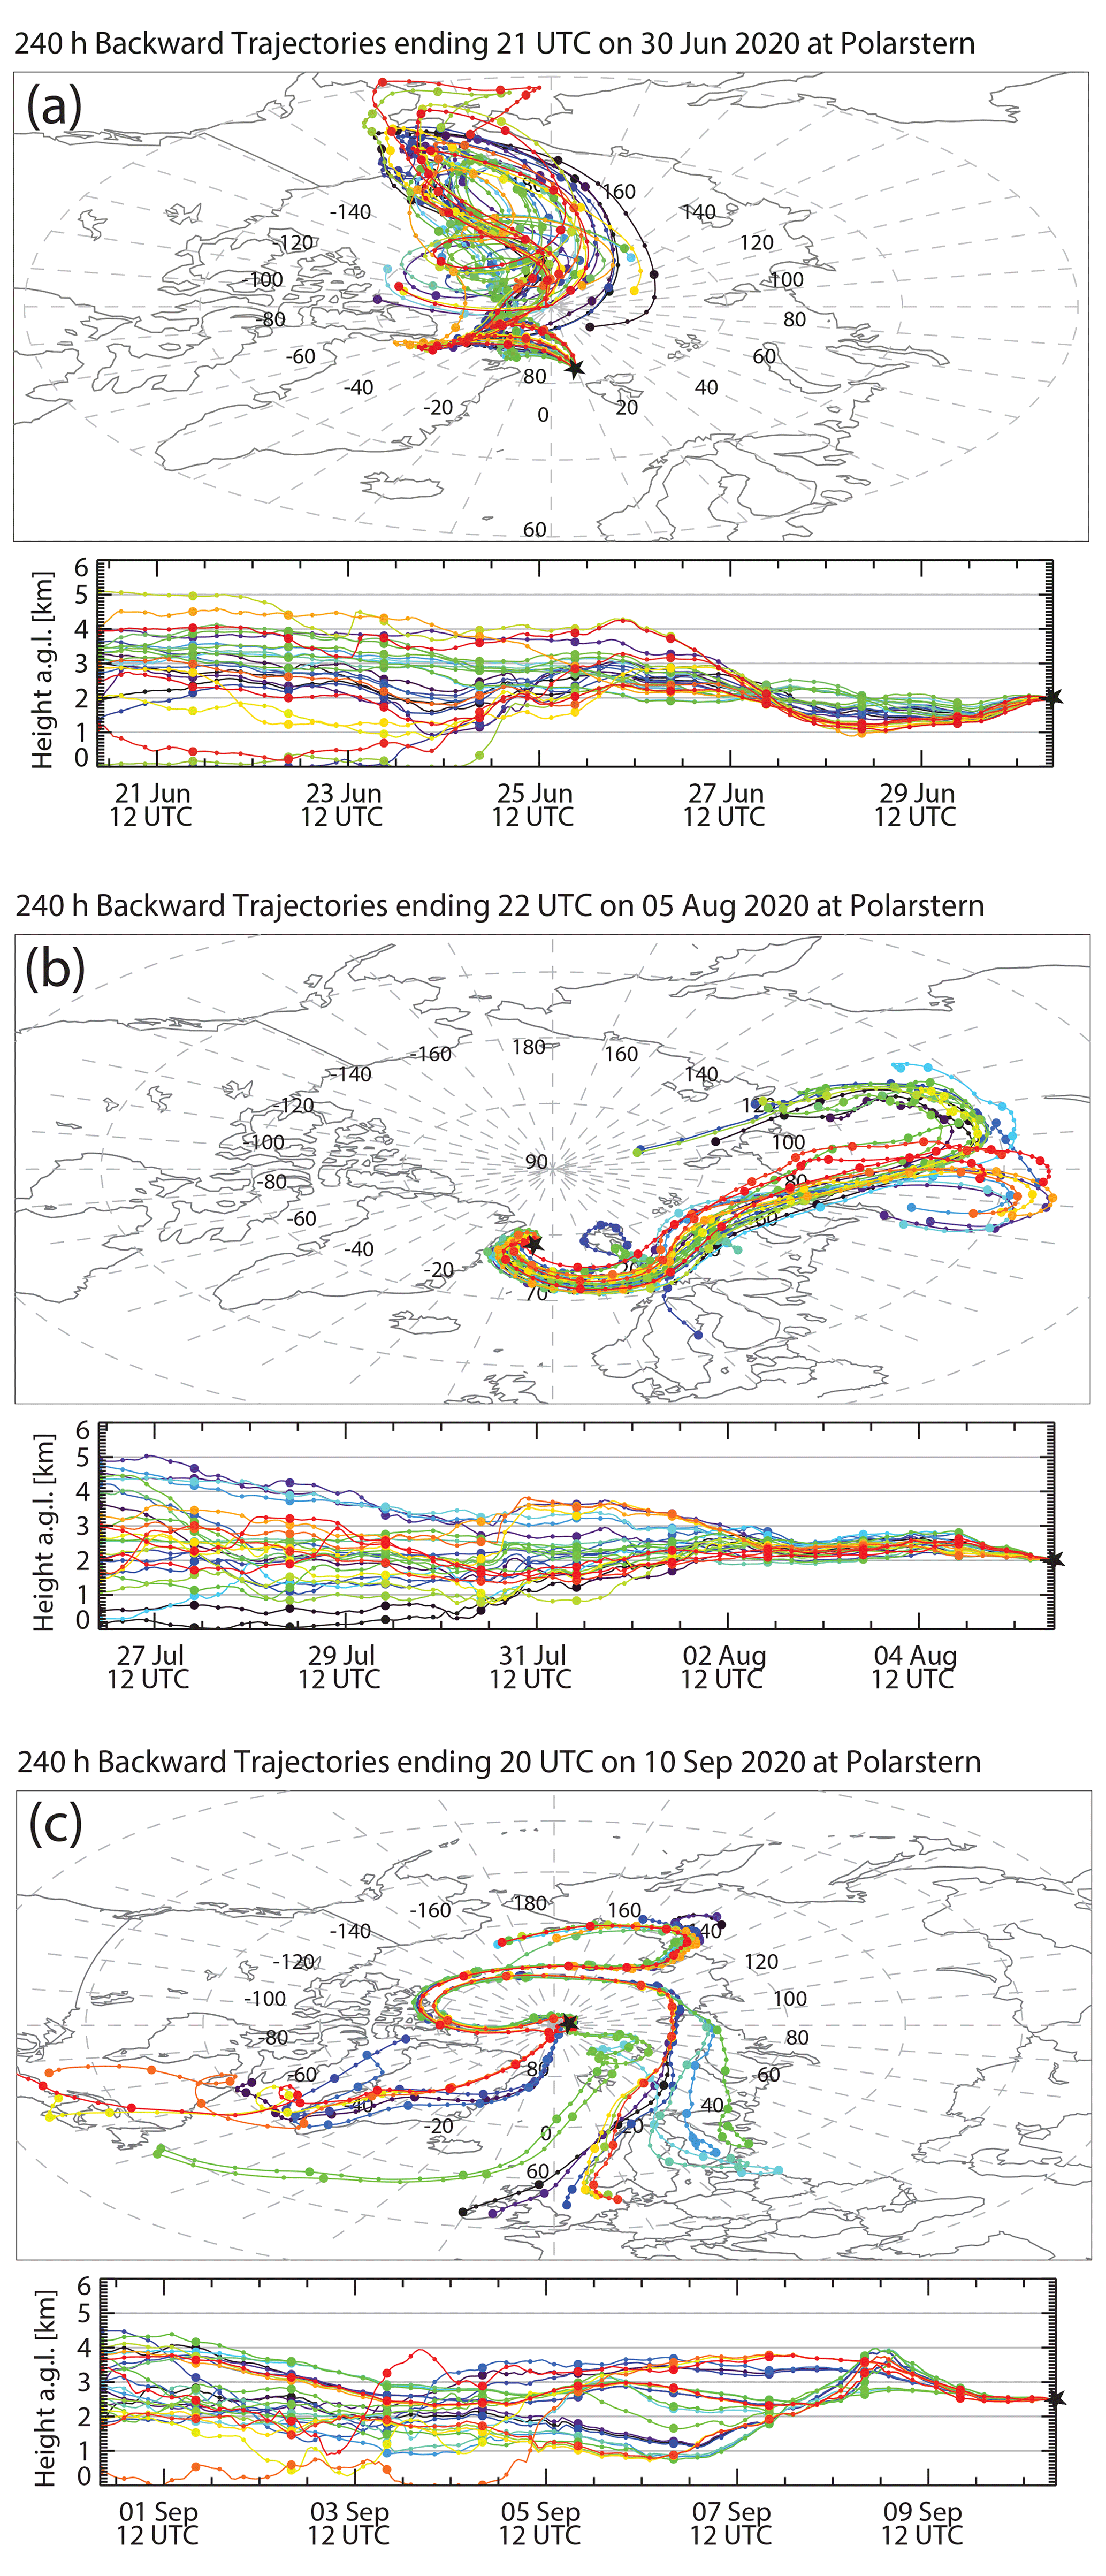
Figure 2(a) HYSPLIT 10 d ensemble backward trajectories arriving over the Polarstern (indicated by a star) on (a) 30 June 2020 at 21:00 UTC, (b) 5 August 2020 at 22:00 UTC, and (c) 10 September 2020 at 21:00 UTC.
On 5 August 2020, the atmosphere was significantly polluted above 1.5 km height (Fig. 1). HYSPLIT backward trajectories in Fig. 2b indicate air mass transport from central and eastern Siberia at 2 km height. The same holds for 4 km height (not shown). The source identification method developed by Radenz et al. (2021) has been applied in Fig. 3 to identify the aerosol sources for all heights in the troposphere. The length of each bar for the different heights indicates the time that the air mass spent at heights below 2 km during the long-distance travel and, thus, the time during which they were able to accumulate aerosol pollution over the Arctic Ocean, adjacent continental sites (savanna and shrubland at high latitudes), and regions further south (grass/cropland). As can be seen, the impact of continental air masses increased with height and time. The air masses above 1.0 km (arriving at 18:00 and 21:00 UTC) were able to take up a significant number of anthropogenic pollution, smoke, and dust particles over Siberia. The Microtops 500 nm AOT was close to 0.05 on 5 August. The integration of the lidar extinction profile yields a 532 nm AOT of 0.047. By combining AOT (from Microtops) and column backscatter (CB; from lidar), we obtain a column lidar ratio (AOT CB) of 56.6 sr, a typical value for continental fine-mode-dominated aerosol (Mattis et al., 2004). The Ångström exponent (Microtops AOT, 440–870 nm) was around 1.7–1.9 on the evening of 5 August and, thus, in good agreement with the backscatter-related Ångström exponent (355–1064 nm) of 1.4–2 in the height range from 2 to 6 km, as shown in Fig. 1b. The particle depolarization ratio was low (0.02–0.03) which is indicative of an almost dust-free air mass.
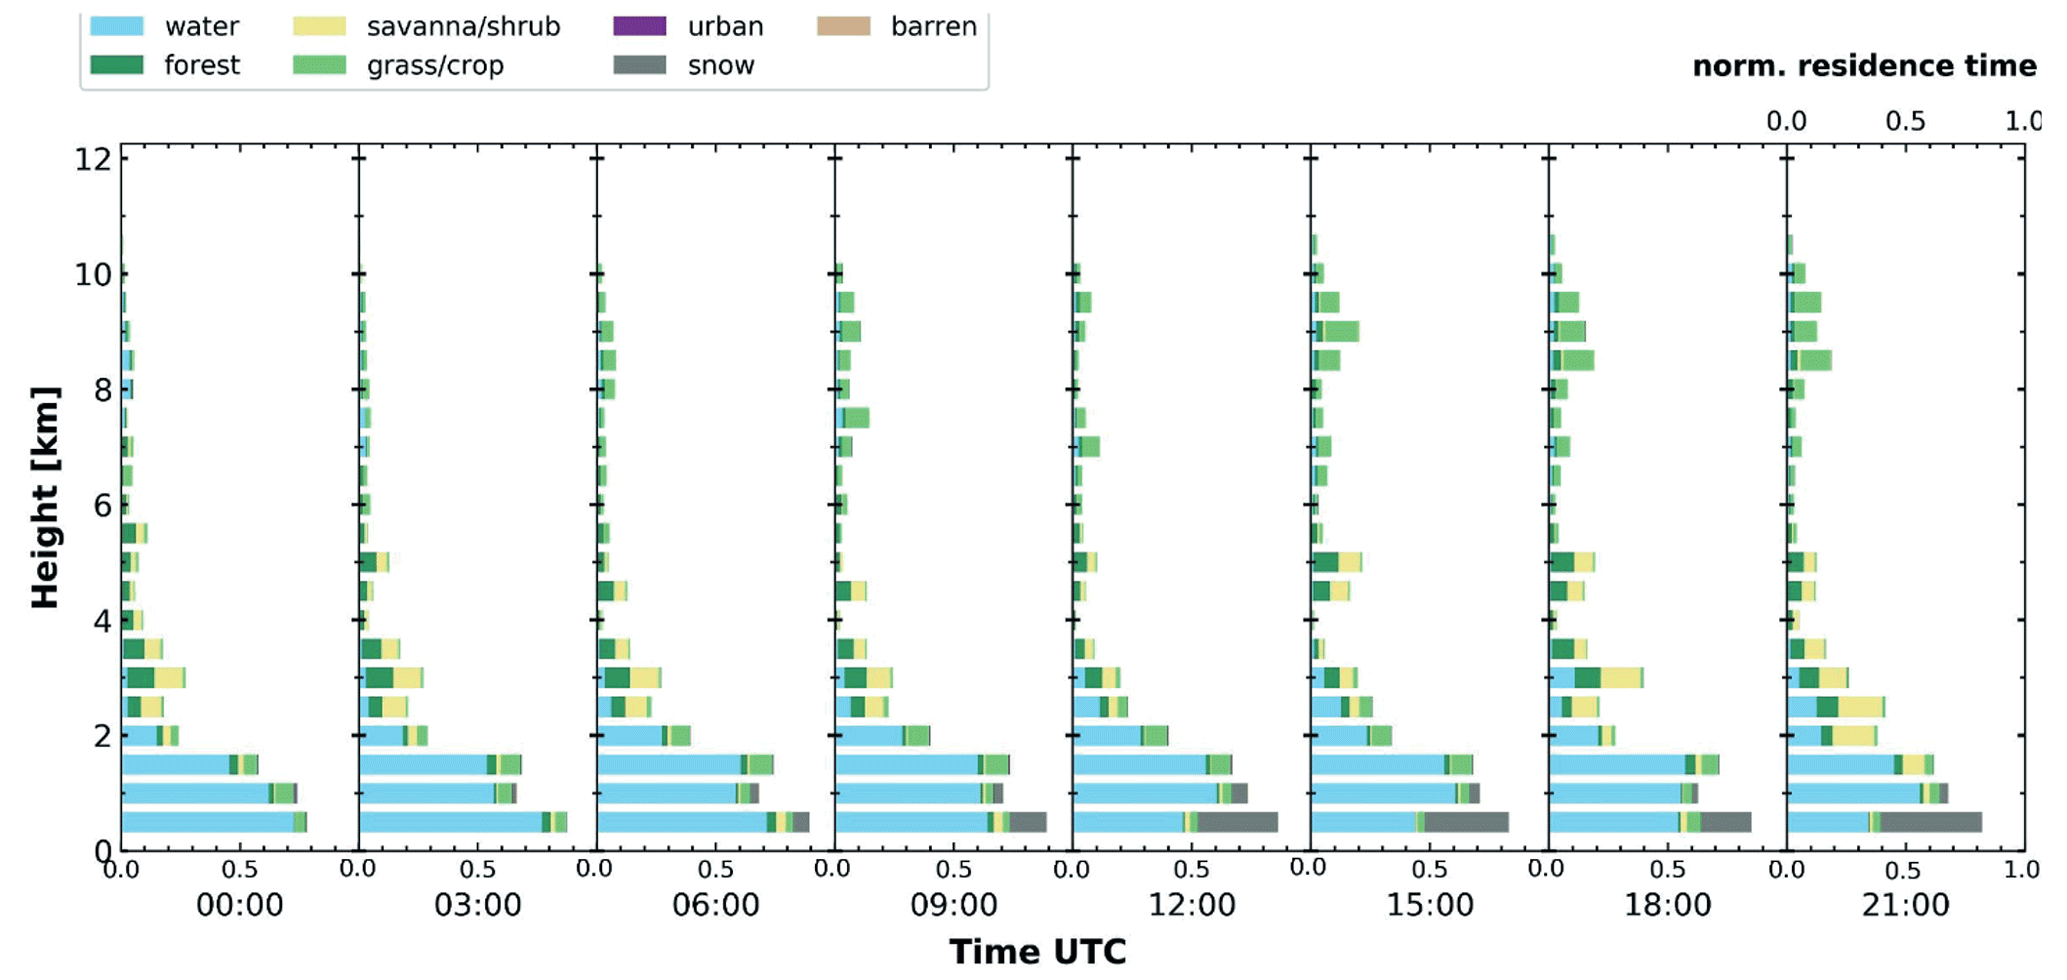
Figure 3Vertically resolved air mass source attribution at 3 h intervals on 5 August 2020. The method of Radenz et al. (2021) is applied. The normalized (accumulated) residence time of air masses, when they traveled within the well-mixed boundary layer at heights below 2 km during the long-range transport, is given. The analysis is based on 10 d HYSPLIT backward trajectories arriving over Polarstern. The colors indicate different land cover classes. Continental particles contributed significantly to the backscatter and extinction coefficients, measured at heights >1 km on 5 August 2020 at 18:00 and 21:00 UTC, as shown in Fig. 1a.
On 10 September 2020, a pronounced haze layer between 1.2 and 3.5 km was observed (Fig. 1). HYSPLIT backward trajectories for this case are shown in Fig. 2c and indicate pollution transport mainly from northern and western Europe and North America. Polarstern was close to 89∘ N on this day. The AOT of the pronounced haze layer was 0.03, and the overall AOT was close to 0.035. By combing Microtops AOT and lidar-derived column backscatter, we obtained a column lidar ratio of 57.8 sr, again a characteristic value for anthropogenic pollution. The moderately low Ångström exponent of 1.3 (Microtops) and around 1.4 (lidar) as well as the enhanced particle depolarization ratio of 0.05–0.07 indicate a noticeable contribution of coarse-mode dust (of about 5 %) to the backscatter and extinction coefficients.
It is noteworthy to mention that the Arctic haze layers in winter showed the highest aerosol burden in the lowest 500–1000 m of the troposphere with the highest extinction coefficients of the order of 30–70 Mm−1 close to the surface, as will be discussed in the next section. The contribution of the lowest 1 km to the total tropospheric 532 nm AOT was typically 0.03–0.05 in winter. In summer, these near-surface aerosol layers are absent, probably as a result of very efficient wet removal by low-level clouds, drizzle, fog, and liquid-water precipitation (Browse et al., 2012). The AOT for the lowest 1000 m of the atmosphere is of the order of 0.002–0.004 in Fig. 1a and, thus, an order of magnitude lower than a typical marine AOT over the open ocean.
Figure 4, finally, shows a wildfire smoke layer in the upper troposphere measured on 19 September 2020. High extinction coefficients up to 300 Mm−1 were observed at heights of around 9 km. The resulting 532 nm AOT was 0.4. The HYSPLIT backward trajectories in Fig. 5 point to North America as a smoke source region. According to Hu et al. (2022), intensive wildfires in California and Oregon injected large amounts of wildfire smoke into the atmosphere on 10 and 11 September 2020. Thick smoke layers at 5–10 km height were detected with CALIOP over the Pacific Ocean just west of the west coast of North America (Hu et al., 2022). CALIOP particle linear depolarization ratios (PLDRs) decreased from initial values of 12 %–14 % at 532 nm on 10 September to <10 % over the eastern USA on 14 September 2020. The volume depolarization ratios of 5 % in Fig. 4a and the respective particle depolarization ratios of 6 %–7 % (not shown) are in good agreement with the decreasing trend found in the CALIOP PLDR observations over the USA. Hu et al. (2022) mentioned that pyrocumulonimbus (pyroCb) development occurred on 9 September and that the smoke was trapped over the eastern Pacific Ocean on 7–11 September due to cyclone activity. The extent to which strong convective motions were responsible for smoke lofting up to the upper troposphere remains an open question. Enhanced PLDR values (>5 %) indicate nonspherical smoke particles, which are usually observed in the upper troposphere when fast smoke lofting into the dry upper troposphere occurs. The decreasing PLDR values (with increasing travel time) reflect the aging of smoke particles. They become increasingly compact and spherical with time.
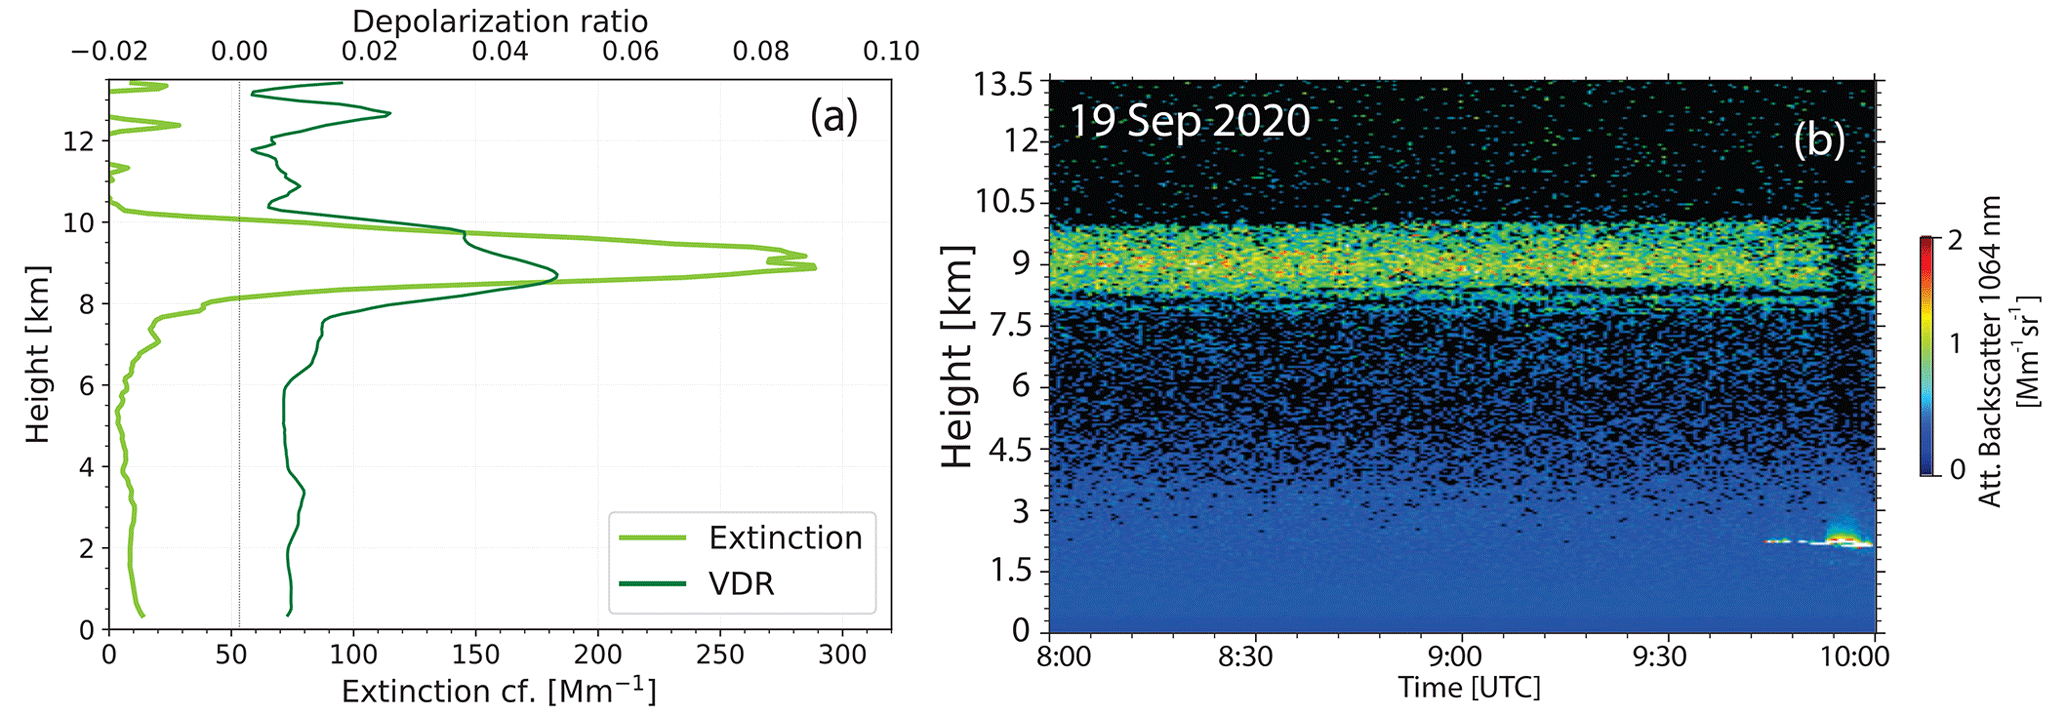
Figure 4Wildfire smoke observed over Polarstern between 8 and 10 km height on 19 September 2020 (08:00–10:00 UTC; 89.1∘ N, 110∘ E). The smoke was probably lofted by strong convection over the western Pacific, west of California. Profiles of the 532 nm particle extinction coefficient (backscatter coefficient multiplied by a smoke lidar ratio of 70 sr) and the volume depolarization ratio (VDR) are shown in panel (a). Mean profiles for the time period from 08:00 to 09:40 UTC are presented. In panel (b), the height–time display of the 1064 nm range-corrected signal (or attenuated backscatter coefficient), showing the 2 km thick smoke layer, is given. The enhanced volume depolarization ratio of 5 % is indicative of nonspherical smoke particles. The 532 nm AOT of the smoke layer was about 0.4.
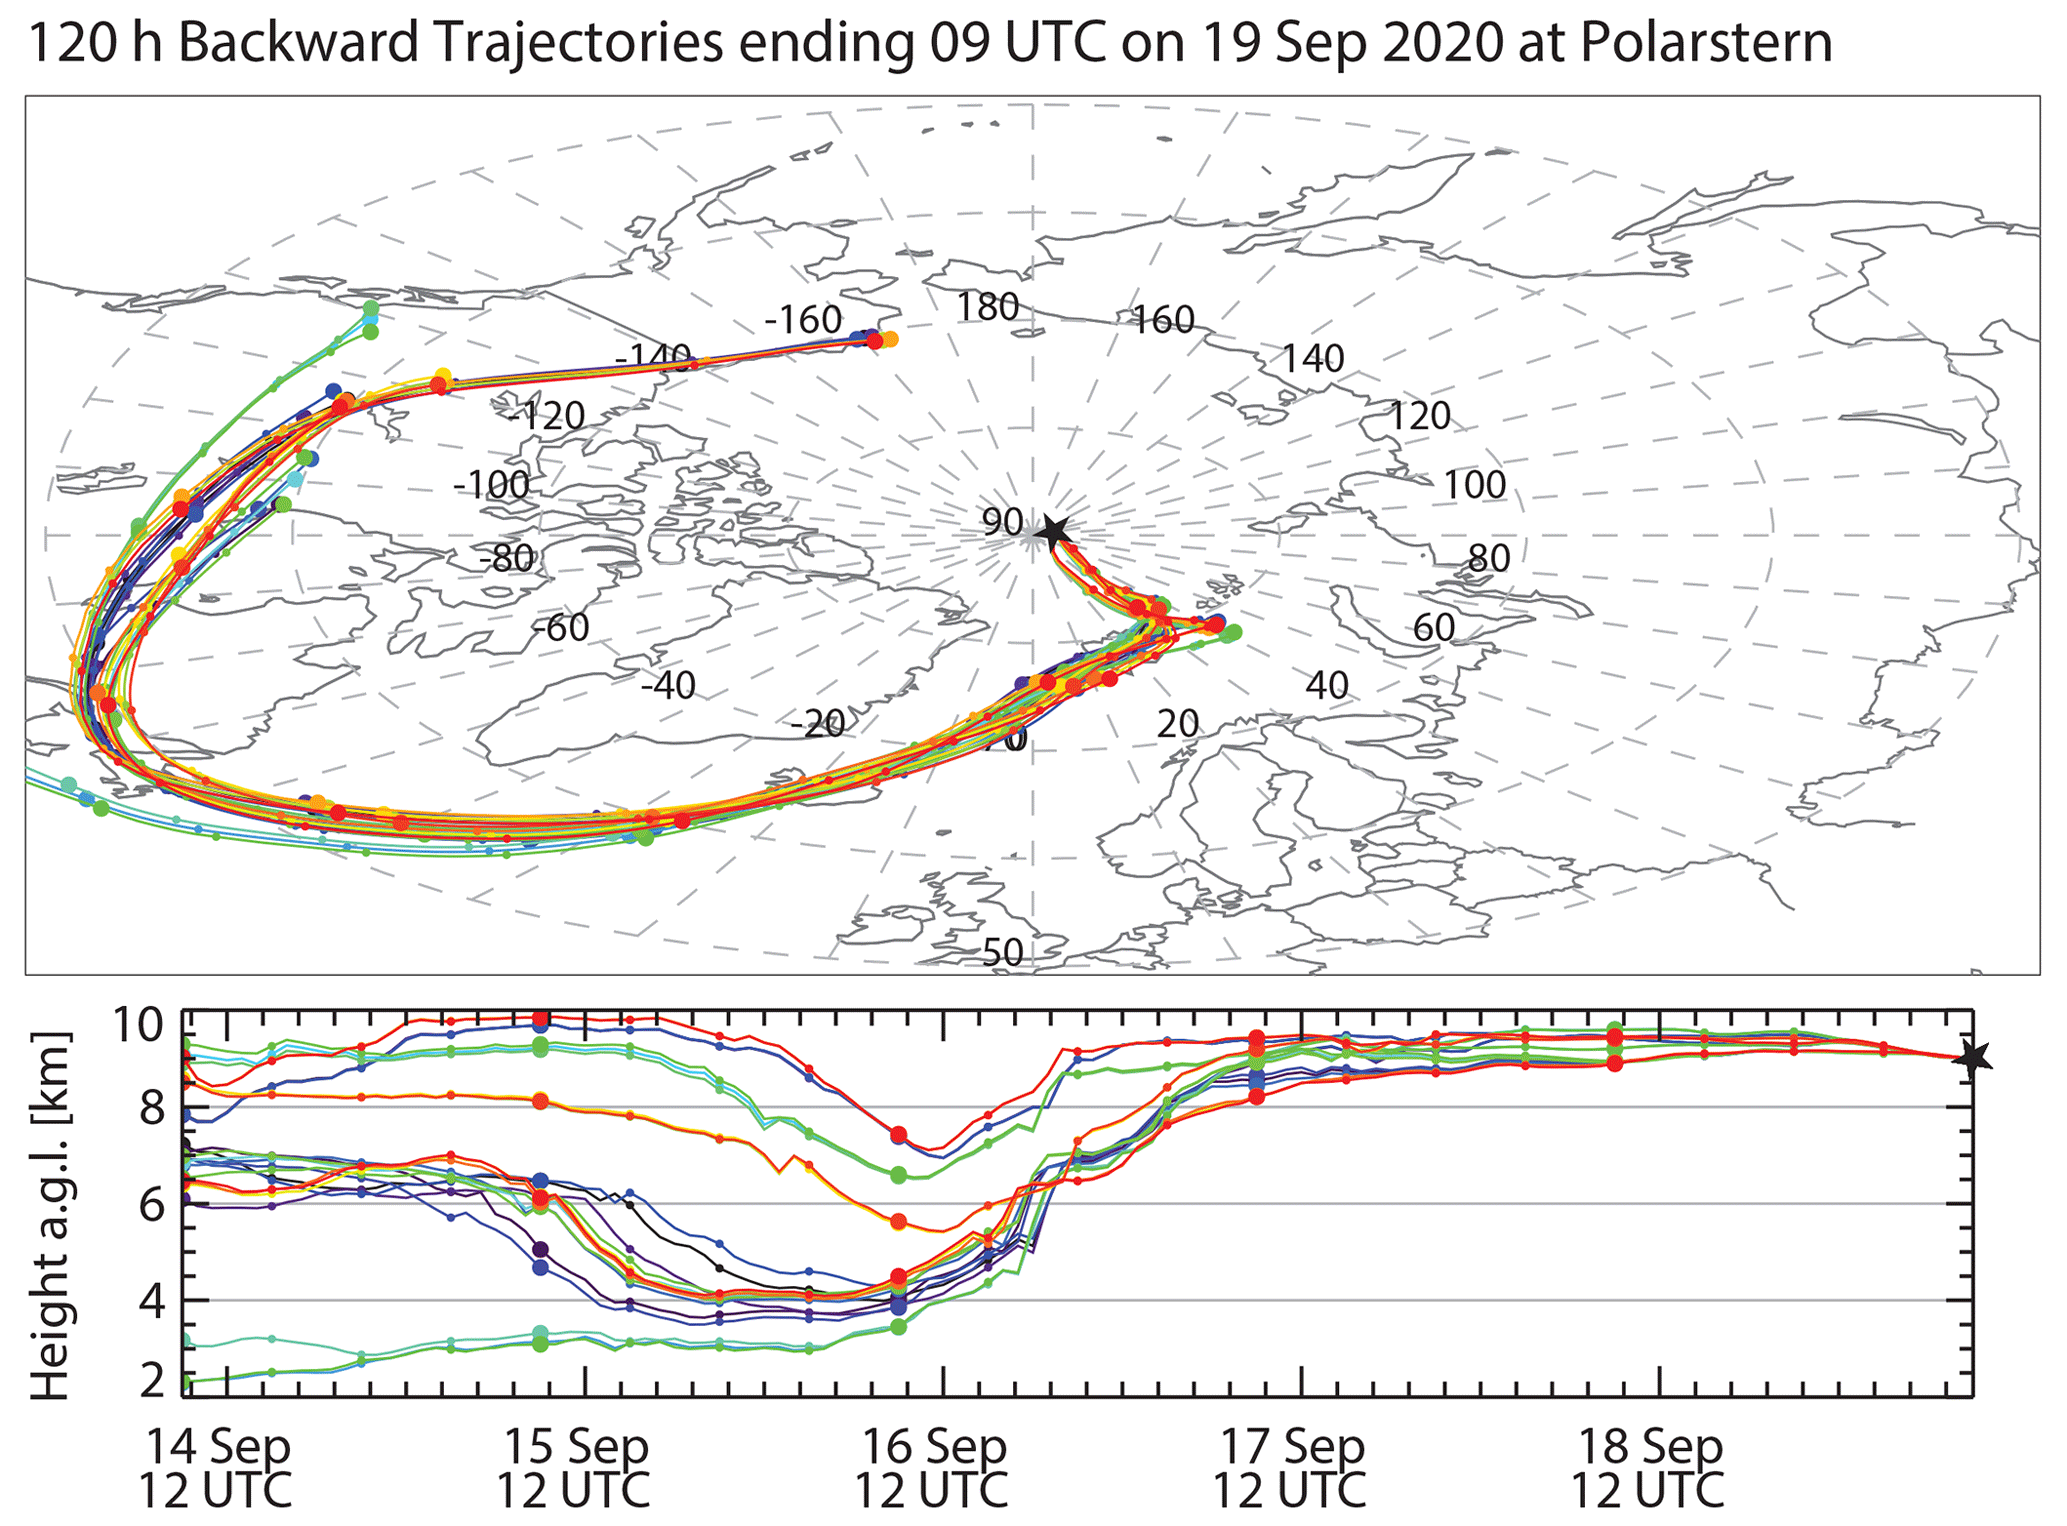
Figure 5HYSPLIT 5 d ensemble backward trajectories arriving over the Polarstern (indicated by a star) on 19 September 2020 at 09:00 UTC.
Similar smoke conditions to those observed over the central Arctic in September 2020 were also reported by Chazette et al. (2018). These authors detected wildfire smoke layers over northern Norway in May 2016. The smoke originated from North America and was found between 6 and 8.5 km height. The smoke showed slightly enhanced PLDR values and particle extinction coefficients up to 100 Mm−1.
4.2 MOSAiC annual cycle: profiles of backscatter and extinction coefficients
The annual cycle of aerosol optical properties during the MOSAiC year is shown in Figs. 6 and 7. Monthly and bimonthly mean backscatter and extinction profiles are presented. We considered all lidar observational periods with at least 60 min of cloud-free conditions. In situations with extended cloud-free weather conditions (over several days), more than one backscatter profile per day was considered (separated by at least 6 h). The following numbers of lidar observations could be realized: 12 in October 2019, 15 in November 2019, 48 in December 2019, 8 in January 2020, 15 in February 2020, 10 in March 2020, and 9 in April 2020. During the cloudy and foggy summer half year in 2020, the following number of observations was available for each month and could be included in the computation of the monthly and bimonthly mean backscatter profiles: 7 in May, 10 in June, 7 in July, 2 in August, and 5 in September.
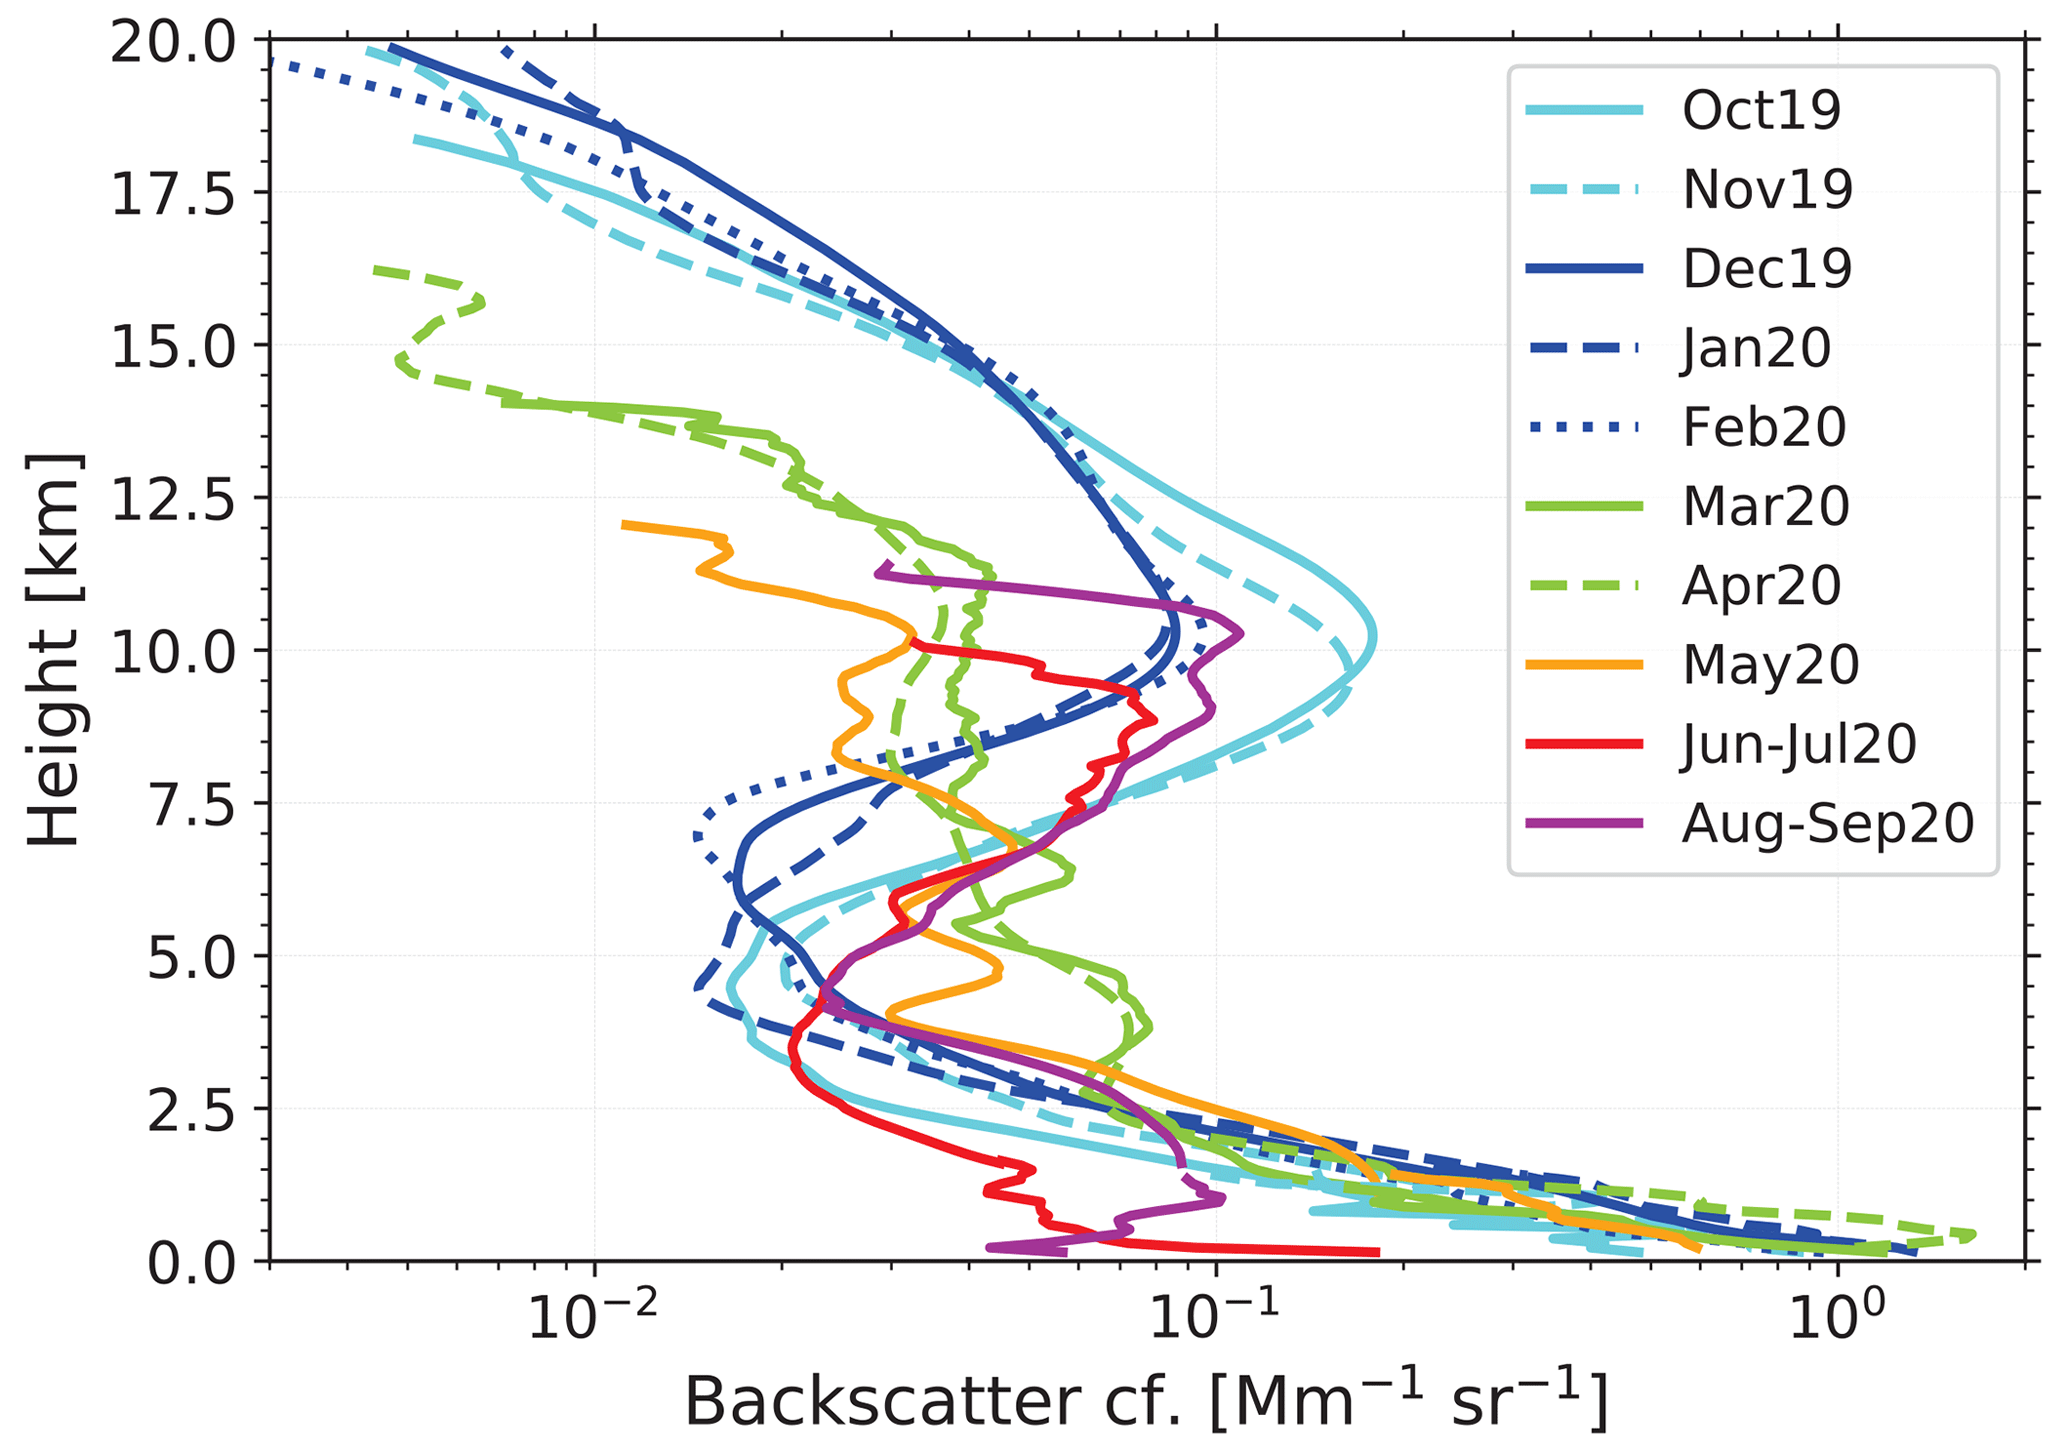
Figure 6Aerosol layering over the central Arctic in 2019–2020. The 1- and 2-month mean particle backscatter profiles, measured at 532 nm, are shown. The UTLS height range (above 7.5 km) was strongly polluted by wildfire smoke (85 % contribution to the particle backscatter coefficient) and Raikoke volcanic aerosol (15 % backscatter fraction) during the autumn and winter months from October 2019 to February 2020 (cyan and blue colors).
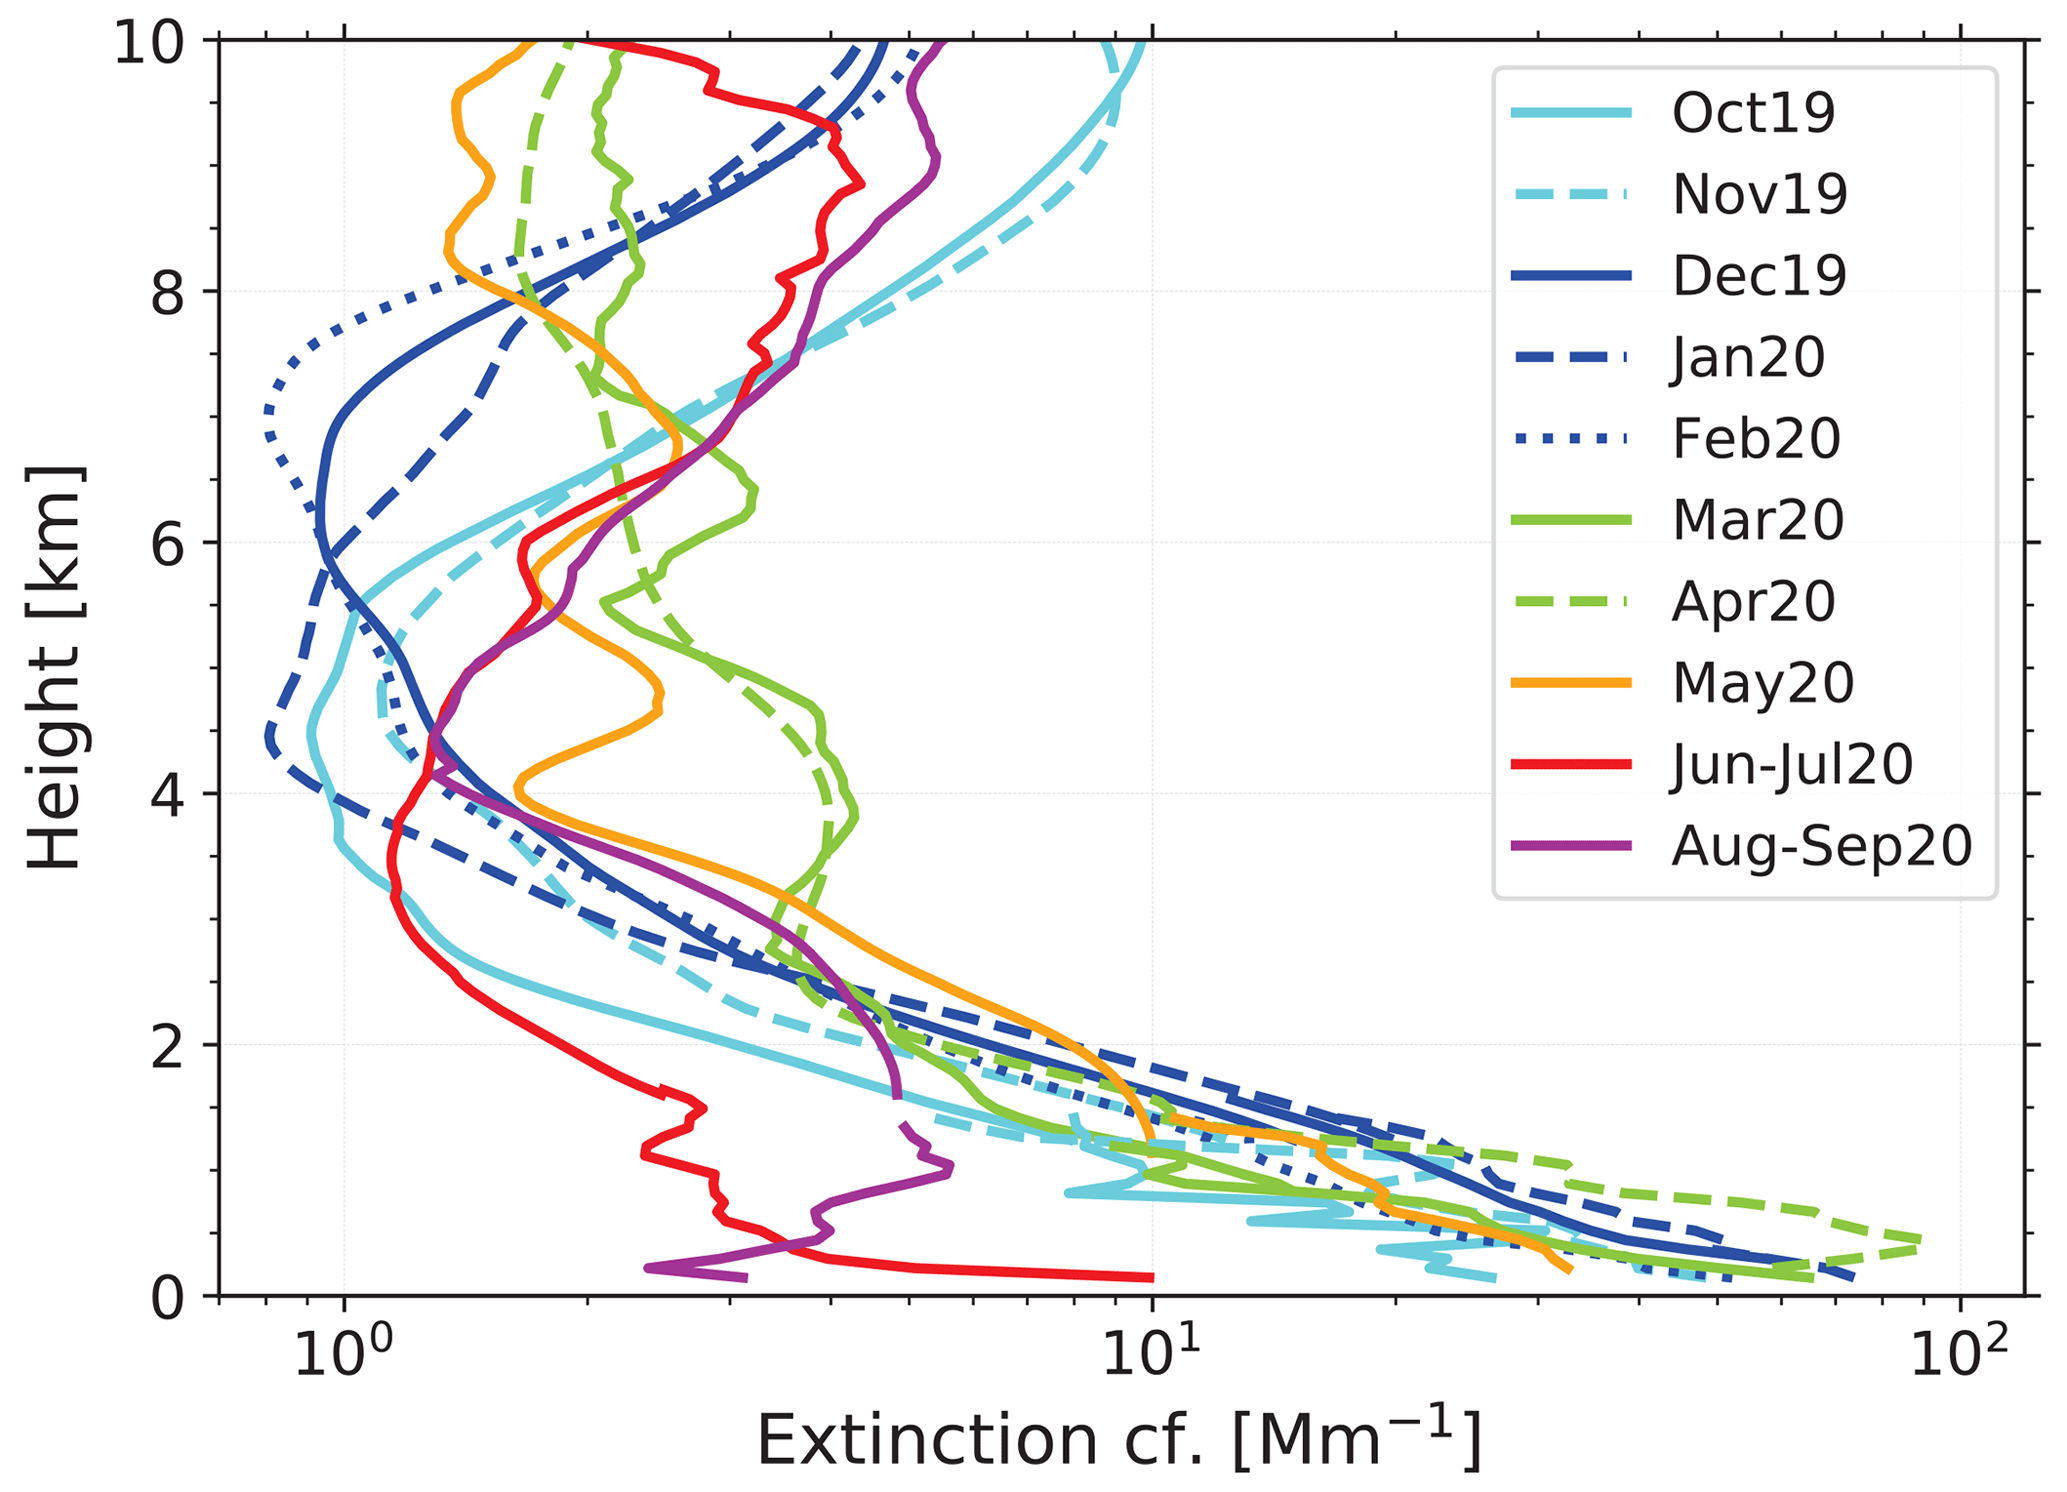
Figure 7Tropospheric aerosol layering in terms of 1- and 2-month mean particle light-extinction profiles (532 nm backscatter profiles shown in Fig. 6 multiplied by a lidar ratio of 55 sr). By combining lidar observations with the near-range telescope (covering the height range from 50 to 100 m up to 1.0–1.5 km) and the far-range telescope (covering the height range >1 km), particle extinction coefficients for the entire vertical tropospheric column could be determined. Continental aerosol pollution, soil dust, and biomass-burning smoke dominated the aerosol conditions in the lowest 5 km, while wildfire smoke caused a re-increase in the extinction values at heights >5 km, especially from October 2019 to February 2020 and in September 2020.
Figure 6 provides an overview of the year-round backscatter conditions up to 20 km height. One of the MOSAiC highlights was the detection of a pronounced and persistent Siberian wildfire smoke layer in the upper troposphere and lower stratosphere (UTLS) over the North Pole region from October 2019 to May 2020. Volcanic sulfate aerosol caused by the eruption of the Raikoke volcano in June 2019 contributed as well, mainly at heights >11 km. This unique event has been discussed in detail by Ohneiser et al. (2021a) and in a recent comment letter by Ansmann et al. (2023). However, the highest tropospheric aerosol backscatter values were observed in the lowest 2.5 km during the winter half year in Fig. 6. Long-range transport of aerosol pollution from the surrounding continents was responsible for these high backscatter levels.
Figure 7 focuses on tropospheric aerosols. The same MOSAiC profiles as in Fig. 6 are shown but now up to 10 km height in terms of the particle extinction coefficient. The backscatter coefficients in Fig. 6 were multiplied by an extinction-to-backscatter ratio (lidar ratio) of 55 sr. The lidar ratio may vary between 40 and 70 sr; thus, the uncertainty in the extinction values is of the order of 25 %.
The most striking feature in Fig. 7 is the strong decrease in the particle extinction coefficient with height during the winter months (Arctic haze season) when aged anthropogenic aerosol, soil dust, and biomass-burning smoke is transported into the Arctic from the surrounding continents (North America, Asia, and Europe) (Stohl, 2006; Willis et al., 2018; Engelmann et al., 2021). Most of the pollution reaching Polarstern at lower heights in the MOSAiC winter of 2019–2020 originated from northern Asia (Creamean et al., 2022; Boyer et al., 2023). Arctic haze events observed on 4 February and 4 March 2020 have been discussed in Engelmann et al. (2021). The largest extinction coefficients occurred close to the surface, where the extinction values were as high as 100 Mm−1 (a typical value for Leipzig, Germany, in central Europe) in extreme situations. The extinction minimum was given at 4–5 km with values close to 1 Mm−1. Higher up, the UTLS wildfire smoke caused a re-increase in the particle extinction values.
Stable atmospheric conditions with a low amount of precipitation and correspondingly weak removal of particles by ice-phase cloud scavenging and cloud-related deposition processes favor long-range transport of aerosol pollution from the industrial centers in the Northern Hemisphere towards the central Arctic during winter (Browse et al., 2012). Removal of aerosol pollution by dry deposition (caused by downward mixing of particles and removal at the surface) is also low in winter over the snow- and ice-covered regions (Willis et al., 2019). The less well-defined extinction profile structures observed from March to May 2020 in Fig. 7 occurred during a phase in which the rather strong polar vortex weakened in March and collapsed around 20 April 2020. The extremely strong polar vortex developed at the end of December 2019 and vanished completely at the beginning of May 2020 (Ohneiser et al., 2021a; Rinke et al., 2021). Downward mixing of the UTLS pollution towards lower troposphere heights obviously occurred in March–May 2020.
During the summer months (June–August), aerosol layering is very different and the aerosol particle number concentration, especially in the lowest 1 km, is roughly an order of magnitude lower than during the winter period. This finding is in full agreement with the modeling study of Browse et al. (2012). They summarized that the seasonal cycle in Arctic aerosol is typified by high number concentrations of aged anthropogenic particles transported from lower latitudes in the late Arctic winter and early spring followed by a sharp transition to low concentrations of locally sourced particles in the summer. Wet-scavenging processes have a strong impact on the seasonal variation in the aerosol conditions. Browse et al. (2012) showed that the transition from high wintertime number concentrations to low concentrations in the summer is controlled by the transition from ice-phase in-cloud scavenging to the much more efficient in-cloud scavenging in the case of warm clouds in the late-spring troposphere. This seasonal cycle is amplified further by the appearance of warm drizzling cloud in the summer boundary layer. Low-level liquid clouds and fog are ubiquitous in Arctic regions in summer and autumn.
The increased extinction coefficients above 4 km height in June–July and August–September are partly caused by wildfires, especially in August and September 2020. Record-breaking smoke conditions as in the summer of 2019, however, did not occur in 2020.
In Fig. 8, we compare the MOSAiC winter (December–February) and summer (June–August) height profiles of the particle extinction coefficient with respective long-term (2006–2019) winter and summer profiles derived from polar observations with the spaceborne lidar CALIOP (Yang et al., 2021). In this way, we can check the extent to which unusual or typical aerosol conditions were observed during the MOSAiC year. In the CALIOP–MOSAiC comparison, one has to keep in mind that the CALIOP profiles in Fig. 8 are mean profiles for the Arctic region from 65 to 82∘ N (Yang et al., 2021). The impact of long-range transport of aerosol pollution from middle to high northern latitudes is probably larger on the CALIOP observations than on the MOSAiC lidar observations from 80 to 90∘ N. Furthermore, the tropospheric observations with the downward-pointing spaceborne lidar CALIOP are less affected by low clouds and fog conditions than the MOSAiC observations with a ground-based lidar.
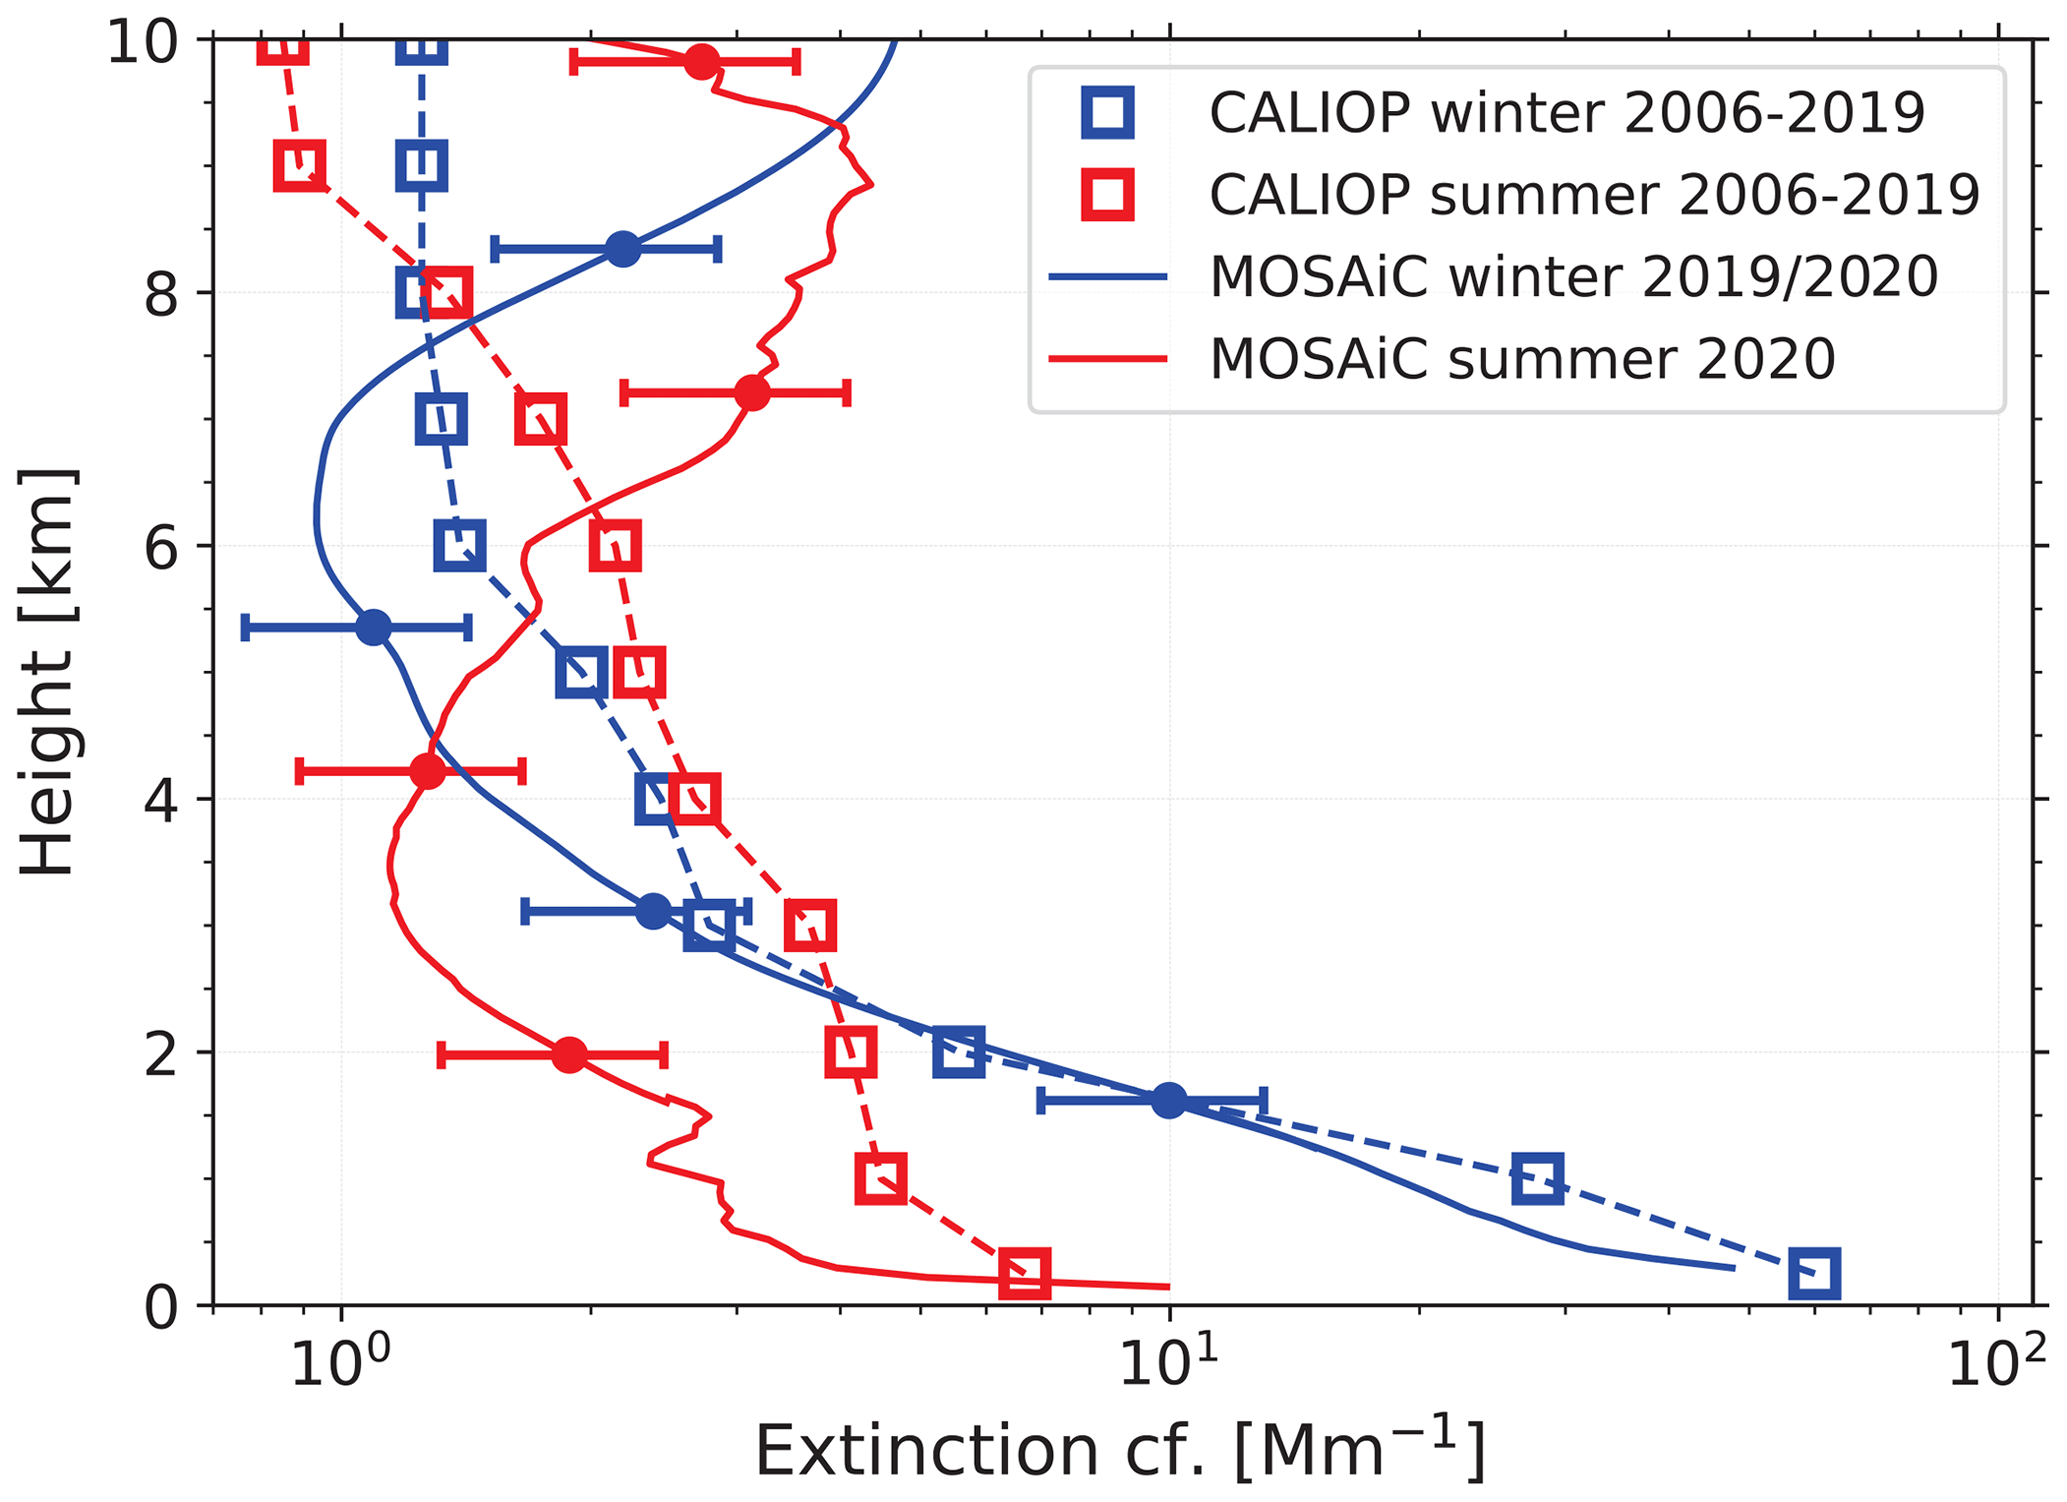
Figure 8CALIOP (2006–2019) vs. MOSAiC (2019–2020) seasonal mean particle extinction profiles (532 nm) for the winter season (December–February) and summer season (June–August). CALIOP profiles are taken from Fig. 6 in Yang et al. (2021) and normalized with AOT shown in Fig. 3 in Yang et al. (2021). All CALIOP observations performed at latitudes between 65 and 82∘ N are considered. The MOSAiC extinction profiles are computed from the 532 nm backscatter profiles (multiplied by a lidar ratio of 55 sr). A few 1 standard deviation (SD) bars are given in the case of the MOSAiC observations.
As can be seen, the MOSAiC observations in the lowermost 3 km during the winter months 2019–2020 agree very well with the 13-year mean profile observations from space. Arctic haze conditions seem not to vary much from year to year. The comparably low MOSAiC extinction in the 3–8 km height range in the winter of 2019–2020 may be partly related to the occurrence of the rather strong polar vortex in 2020, which may have prohibited the transport of aerosol pollution from the south towards the North Pole at heights >3 km. The re-increase in the aerosol extinction coefficient with height (above 7–8 km) in the MOSAiC winter of 2019–2020 is caused by the presence of the persistent 2019–2020 UTLS wildfire smoke layer (Ohneiser et al., 2021a). In the summer of 2020, the lower troposphere up to 6 km height between 80 and 90∘ N was obviously much cleaner than described by the 14-year (2006–2019) summer mean CALIOP extinction values for the latitudinal belt from 65 to 82∘ N.
4.3 MOSAiC annual cycle: aerosol optical thickness
A number of reports on Arctic aerosol optical properties are available from sun photometer observations (e.g., Tomasi et al., 2012, 2015). Recently, Xian et al. (2022a, b) combined AERONET observations (Holben et al., 1998) with aerosol modeling to study trends and changes in the Arctic aerosol conditions during the last 20 years. However, all of these photometer observations were restricted to sunlit conditions. No observation are possible from October to February in the central Arctic. Lidar observations from ground and space can fill this gap.
Figure 9 shows the AOT annual cycle for the MOSAiC year of 2019–2020 derived from the Polarstern lidar observations. Several AOT time series for different vertical columns are presented. The AOTs were calculated from the monthly mean height profiles of the extinction coefficient. In contrast to Fig. 7, we used a lidar ratio of 55 sr in the conversion of the backscatter-to-extinction coefficients for heights <5 km only. For the heights above >5 km, we used a smoke lidar ratio of 85 sr (Ohneiser et al., 2021a). We further assumed that the backscatter coefficient at the minimum measurement height of about 100 m represents the backscatter conditions at the surface as well.
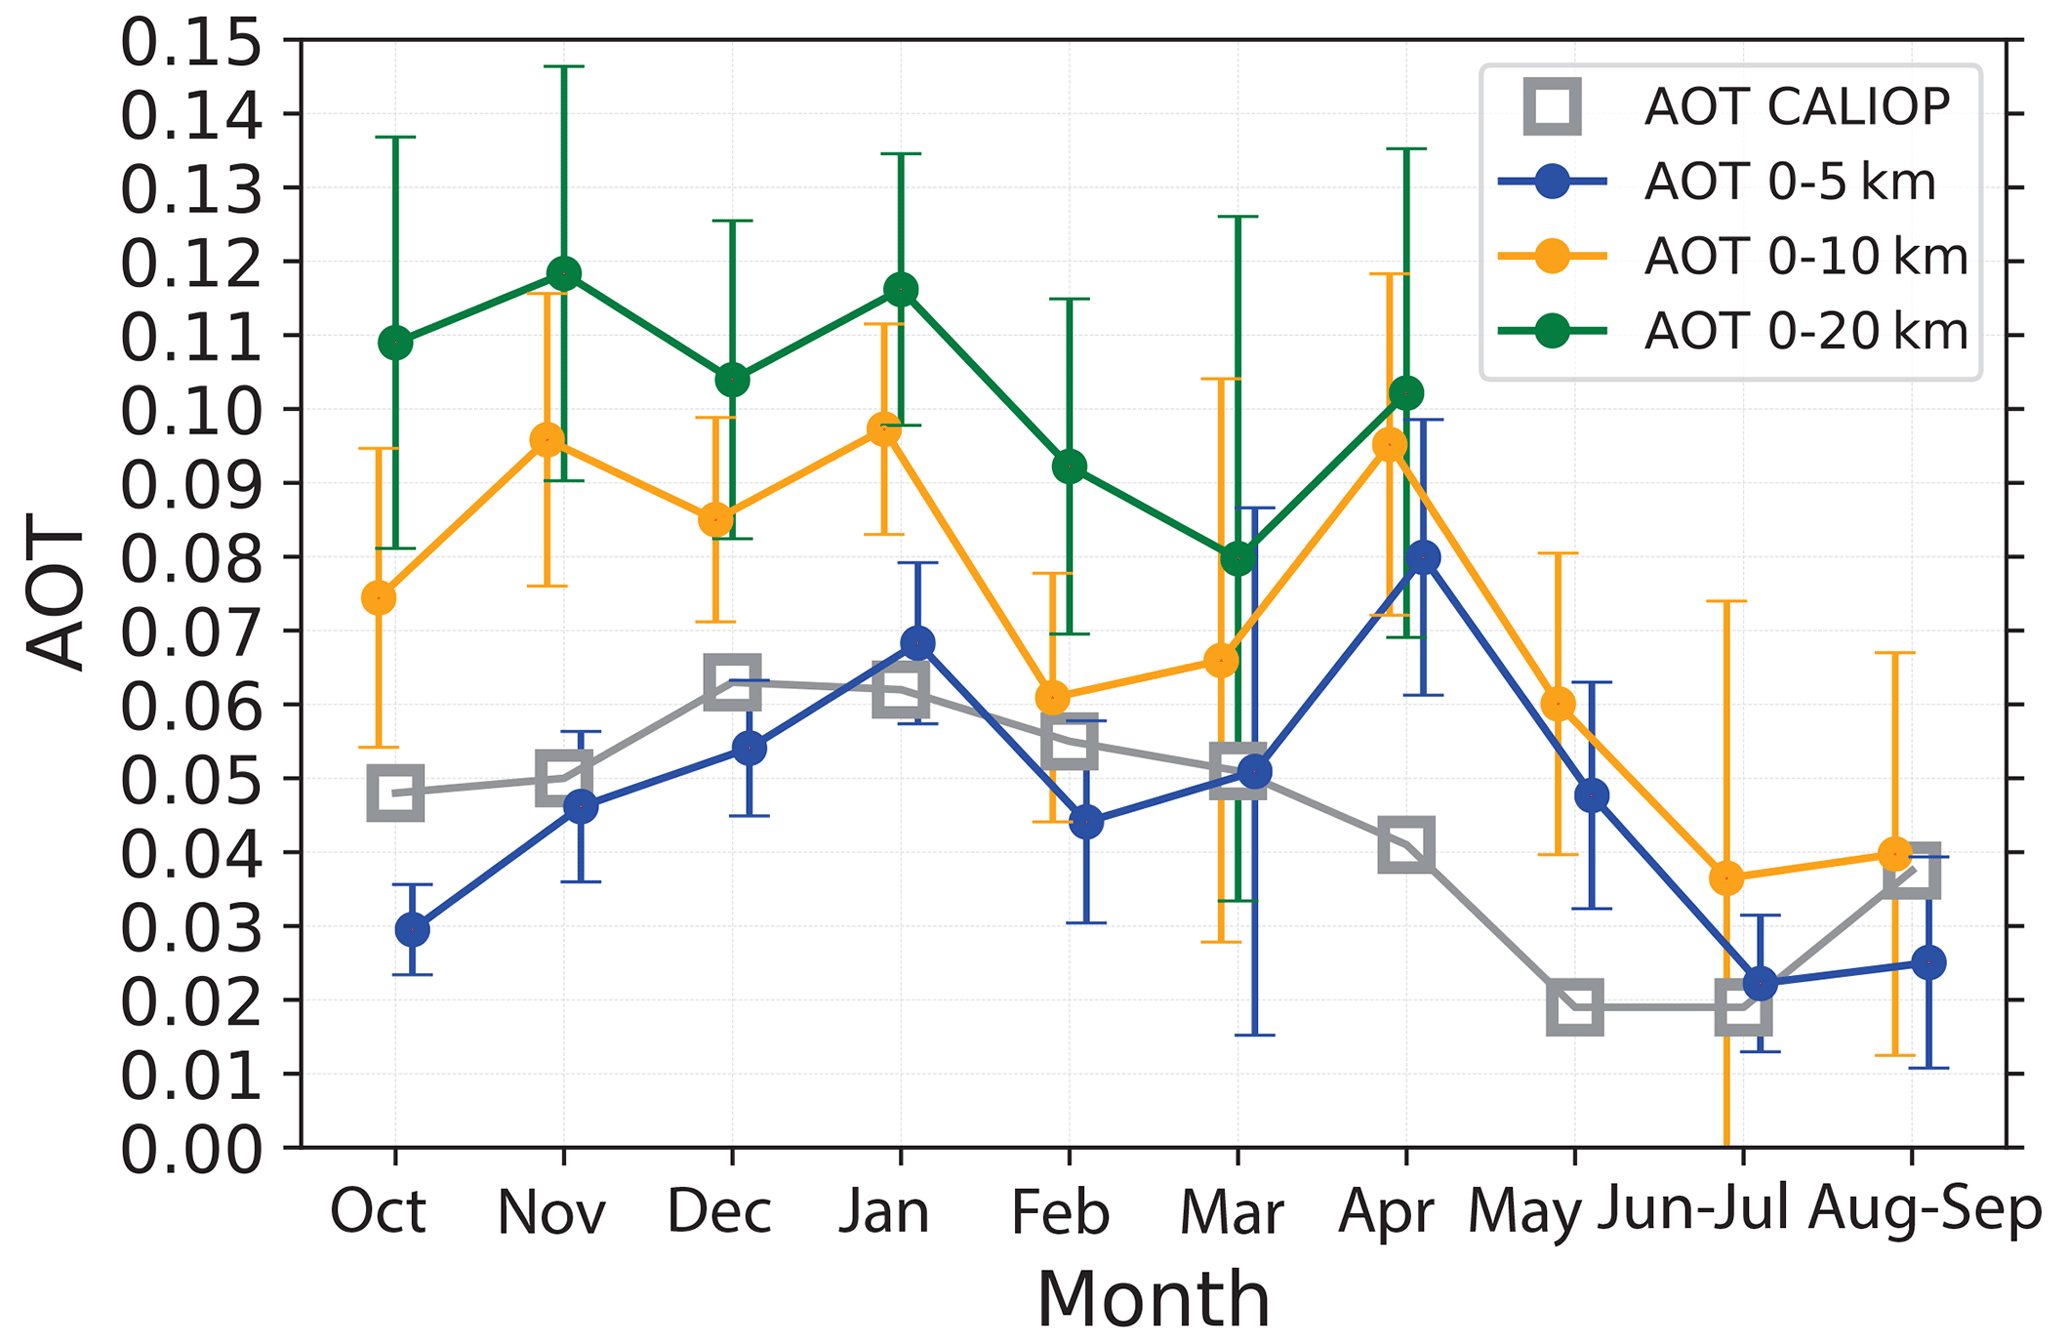
Figure 9The 1- and 2-month mean AOTs for different height ranges measured during the MOSAiC expedition (October 2019 to September 2020). Backscatter profiles (532 nm) were multiplied by a typical tropospheric lidar ratio of 55 sr (0–5 km height) and a smoke lidar ratio of 85 sr (5–20 km) before the AOTs were computed. CALIOP AOT values (2006–2019 monthly means, 65–82∘ N mean, 0–12 km height range) are from Fig. 3. in Yang et al. (2021). SD bars are given in the case of the MOSAiC observations. For comparison, the MOSAiC Microtops II sun photometer observations revealed mean 500 nm AOTs of 0.055±0.014 (June–July) and 0.051±0.014 (August–September).
As was shown in Fig. 7, the main Arctic aerosol layer extended from the surface to the middle of the free troposphere. The annual AOT cycle of this layer (up to 5 km height) is very pronounced in Fig. 9. Arctic haze caused a 532 nm AOT of 0.05–0.06 during the MOSAiC winter and spring months. In summer (June–September), the AOT (for the height range up to 5 km) decreases to values close to 0.02 because of the effective removal of aerosol pollution from the atmosphere. The enhanced AOTs in April and May 2020 for the height range of 0–5 km were obviously dominated by downward mixing of the UTLS smoke towards lower heights.
The tropospheric AOT for the height range up to 10 km was strongly influenced by the UTLS wildfire smoke from October 2019 until May 2020. The AOT for the 0–20 km height range stops in April 2020 in Fig. 9 because a clear difference between the overall 0–20 km AOT and the 0–10 km AOT was no longer visible in the lidar data. The UTLS smoke layer dissolved after the collapse of the polar vortex at the end of April 2020.
The annual cycle of the AOT for the height range from the surface to 5 km is in good agreement with the 2006–2019 mean AOT obtained from the CALIOP observations. It needs to be mentioned here that CALIOP detects the backscatter from the lower troposphere up to 5 km height well, but it is not very sensitive to weak backscatter contributions from the upper troposphere and lower stratosphere. Undetected aerosol contributions to the total AOT are typically of the order of 0.03 at 532 nm according to the studies of Kim et al. (2017) and Toth et al. (2018). This bias explains the difference between the MOSAiC AOTs (for the 0–10 km height range) and the CALIOP AOTs to a large extent.
The MOSAiC AOT summer values (0–10 km, June–September 2020, 80–90∘ N) of about 0.04 are lower than the respective long-term Arctic AERONET sun photometer observations. The long-term mean 500 nm AOTs are 0.06 to 0.07 at Thule (76.5∘ N, 68.7∘ W) and Ittoqqortoormiit (70.5∘ N, 22∘ W) for the summer half year (Xian et al., 2022a). According to the Microtops II observations aboard Polarstern, the mean 500 nm AOT for June–July 2020 (based on 475 observations on 5 different days in June and 5 different days in July, between 80 and 82∘ N) was 0.055±0.014. For the August–September 2020 period (185 observations on 3 different days in August and 4 different days in September, mostly between 85 and 90∘ N), we obtained a 500 nm AOT of 0.051±0.015.
In part 2 of the results, we present our lidar retrieval products regarding CCN and INP number concentrations. We include the MOSAiC in situ observations of the particle number concentrations n50,dry (Boyer et al., 2023) and of ice-nucleating particles nINP (Creamean et al., 2022) aboard Polarstern in this discussion. We should emphasize that the lidar observations, performed during 1–3 h long cloud-free situations, were inhomogeneously distributed over the MOSAiC months and seasons, whereas the in situ observations were conducted on a daily basis regardless of the weather conditions.
5.1 CCN number concentration at the surface, 250 m height, and 2000 m height
In Fig. 10, lidar-derived time series of n50,dry, i.e., of nCCN for a supersaturation of 0.2 % at 250 m and 2000 m height (Sect. 3.3), and monthly means of n50,dry measured in situ aboard Polarstern (Sect. 2.5) are shown. As mentioned, we selected the 250 and 2000 m height levels to show aerosol conditions relevant for the formation of low-level clouds and stratiform mixed-phase clouds in the lower free troposphere, respectively. To minimize the impact of even weak fog events, we only considered lidar observations with a 532 nm backscatter coefficient of <1 Mm−1 sr−1 or extinction coefficients <55 Mm−1. Thus, after conversion of the extinction coefficients, only n50,dry values <700 cm−3 remained.
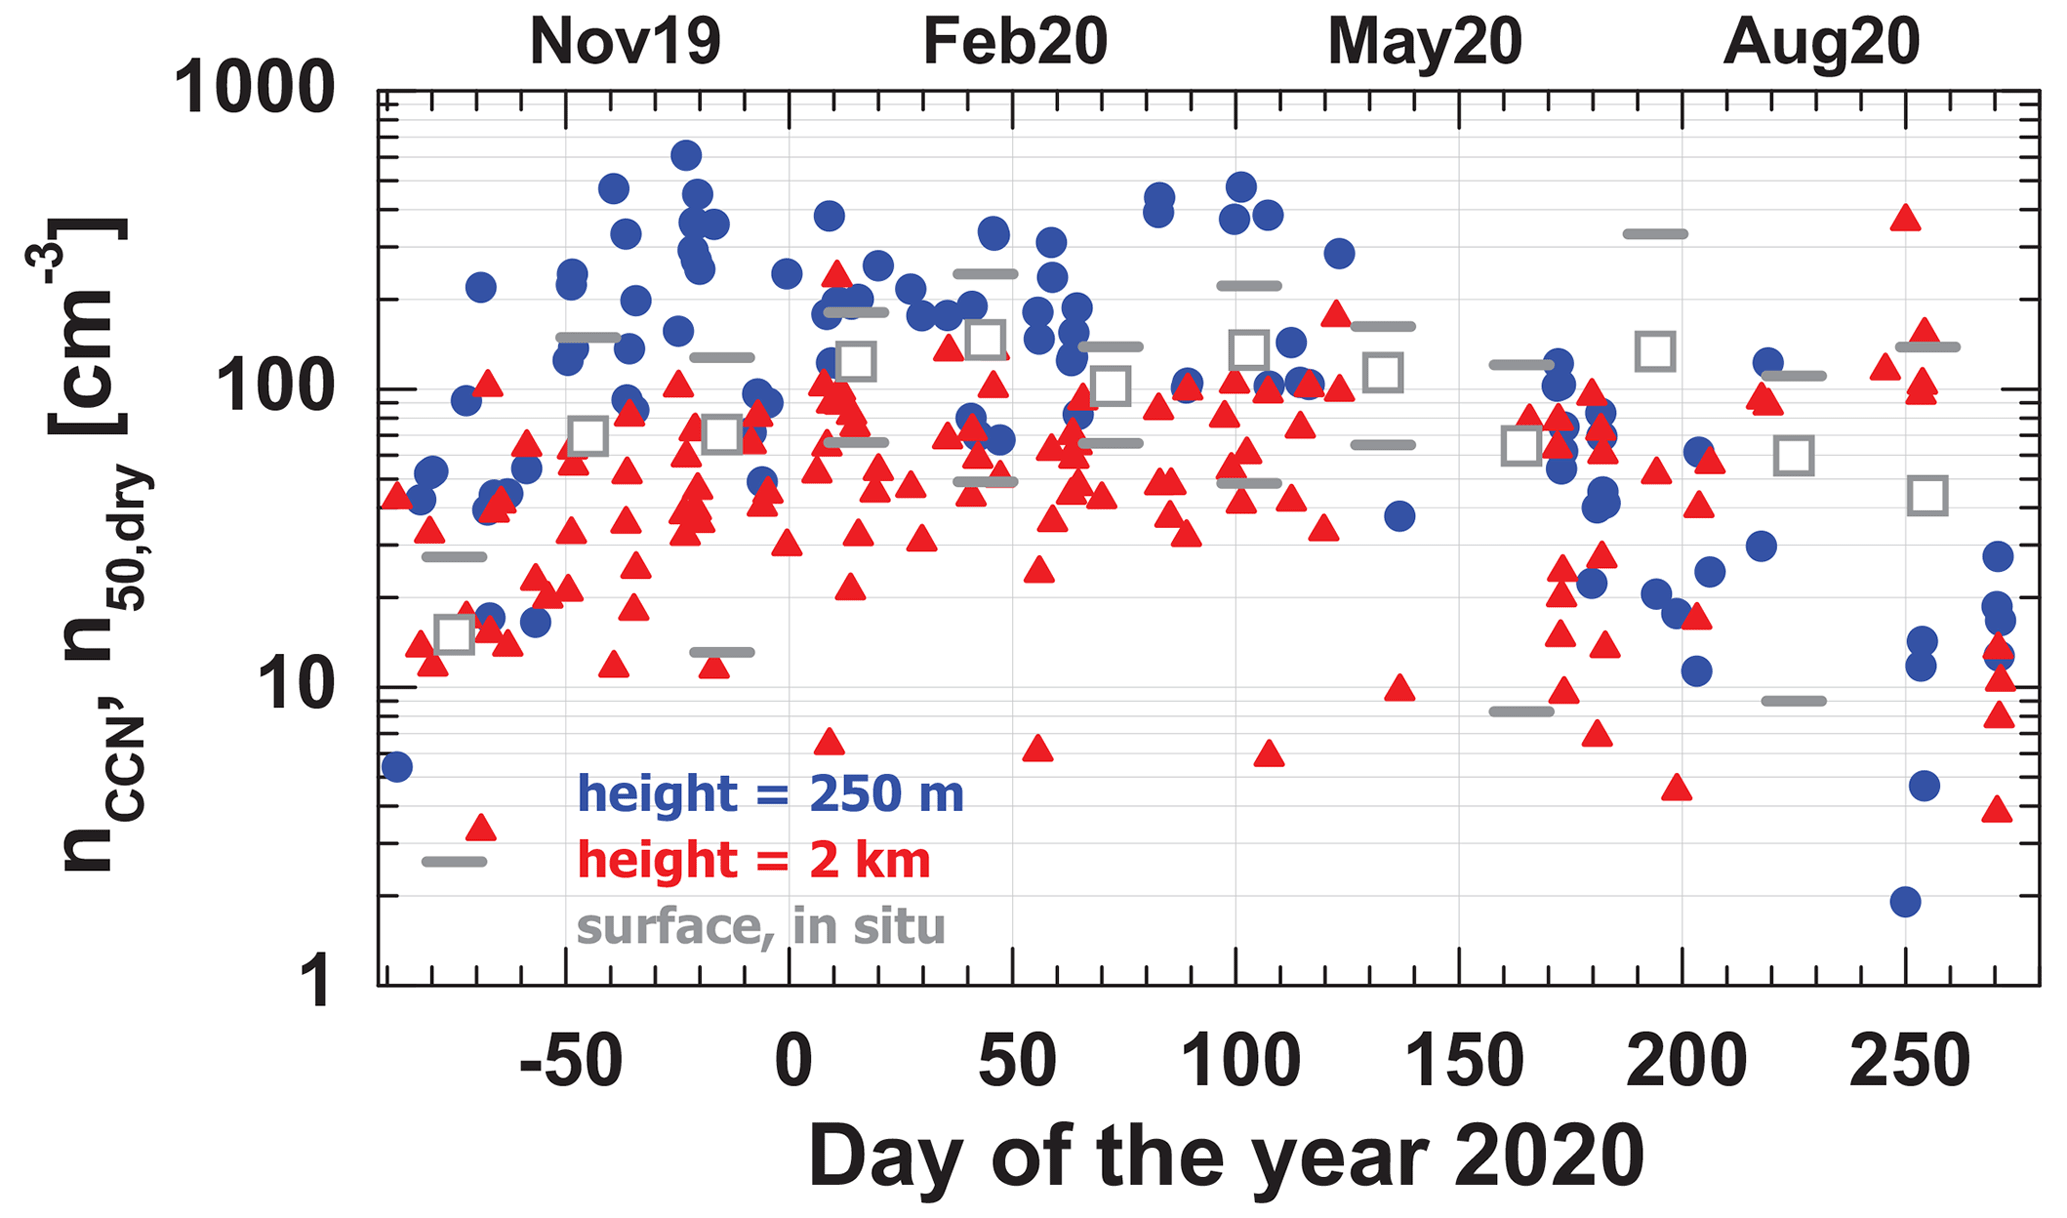
Figure 10Annual cycle of the CCN number concentration (0.2 % supersaturation) during the MOSAiC year, estimated from Polarstern lidar observations at 250 m (blue circles) and 2000 m height (red triangles) and observed in situ aboard Polarstern (gray squares) (Boyer et al., 2023). The in situ values are monthly means; SD is indicated by the short gray horizontal bars, and a few of the lower SD bars are <1 and are, thus, not shown. Only nCCN values <700 cm−3 (for the 250 m height level) are considered, corresponding to lidar-derived particle extinction coefficients <55 Mm−1 (indicating fog-free and cloud-free conditions).
In accordance with the observations of optical properties in Fig. 8, strong differences in the CCN number concentration between winter and summer are found at 250 m height. The n50,dry or nCCN values were mostly in the range of 50–500 cm−3 in the period from November 2019 to April 2020 and between 10 and 100 cm−3 during the summer months when marine CCNs dominate in the ABL. Such a strong contrast between winter and summer is not found at the 2000 m height level. Here, the n50,dry values were mostly between 30 and 100 cm−3. The winter (December–February) mean n50,dry values (and corresponding standard deviation, SD, values) are 113±71 cm−3 (in situ, surface), 222±121 cm−3 (lidar, 250 m height), and 62±41 cm−3 (lidar, 2000 m height). The respect summer (June–August) values are 86±102 cm−3 (in situ, surface), 58±35 cm−3 (lidar, 250 m height), and 46±31 cm−3 (lidar, 2000 m height). The atmospheric variability, reflected in the SD values, is of the order of 50 %–100 % around the mean values.
Direct in situ CCN observations aboard Polarstern (Dada et al., 2022) indicate that the background aerosol CCN values (for a supersaturation level of 0.2 %–0.3 %) increased from <50 cm−3 in October–December 2019 to about 100 cm−3 in January–March 2020 and then further to 100–200 cm−3 in April and the first half of May 2020. Many short-term CCN number concentration peaks around 200–300 cm−3 (November–December), 400–550 cm−3 (January–February), and even 650 cm−3 (April 2020) were measured aboard Polarstern. Similar features (increasing values with time) are visible in the lidar observations at 250 m height in Fig. 10.
The lidar-derived winter values for n50,dry at 250 m height are about a factor of 2 higher than the respective in situ winter n50,dry values. The most likely reason for this bias is that the extinction-to-n50 conversion factor (in the lidar data analysis) was derived from summertime AERONET observations and the respective conversion factor for the dominant aerosol type in winter (Arctic haze) was obviously about a factor of 2 lower than the summer aerosol conversion factor. As mentioned in Sect. 3.3, the extinction-to-number-concentration conversion factor is very sensitive to the dominant particle size distributions (and changes from winter to summer size distributions). The summer deviations between the surface observations and lidar measurements at 250 m height are mainly caused by the low number of lidar observations (very low number of cloud-free periods during the summer months) compared with the high number of daily in situ measurements.
The MOSAiC observations were found to be in good agreement with other measurements in remote areas at high latitudes far away from centers of anthropogenic haze. Tatzelt et al. (2022) presented shipborne in situ measurements of CCN number concentrations conducted in the Southern Ocean during the Antarctic Circumnavigation Expedition (ACE) from December 2016 to March 2017 (summer season). They found mostly CCN values of 50–200 cm−3 for 0.2 % supersaturation, although sometimes also more than 500 cm−3 or less than 5 cm−3. Herenz et al. (2018) and Chang et al. (2022) performed observations of CCN number concentrations in the Canadian Arctic in May 2014 and July–August 2016, respectively, and found CCN number concentrations mostly from 20 to 150 cm−3 (Herenz et al., 2018) and from 20 to 80 cm−3 (Chang et al., 2022). Hartmann et al. (2021) reported CCN concentrations from almost 0 to 250 cm−3 (SWAT=1.002) in the European Arctic at latitudes up to 83.7∘ N in May–July 2017.
5.2 INP number concentration at the surface, 250 m height, and 2000 m height
Guided by our discussion in Sect. 1 about the different INP types in the Arctic ABL, the lower free troposphere, and the upper Arctic troposphere, we performed the INP-related lidar data analysis separately for a near-surface height level (250 m), a height level in the lower free troposphere (2000 m), and a height level close to the Arctic tropopause.
In Sect. 3.4.1, the immersion freezing INP parameterization applied to convert the lidar backscatter coefficients in the lower troposphere into INP number concentrations is described. The same lidar data as used in Sect. 5.1 were considered here. The lidar profiles (averaged over 1–3 h) were now converted into particle surface area concentrations sdry (using the Arctic aerosol conversion factor cs in Table 2). As mentioned in Sect. 3.4.1, the conversion factor cs (input in INP retrieval) is almost insensitive to details in the Arctic particle size distribution; thus, sdry can be obtained with a comparably low uncertainty of ≤25 %, disregarding changes in the Arctic aerosol microphysical properties from winter to summer.
Figure 11 provides a representative view of the annual cycle of INP conditions in the central Arctic in the lowermost 3 km, i.e., at the height range in which mixed-phase clouds usually form. We considered typical ice nucleation temperatures, i.e., winter cloud-top temperatures of −25 ∘C and summer cloud-top temperatures of −10 ∘C at 250 m and of −15 ∘C at 2000 m. We assume that immersion freezing starts at the coldest point of the cloud, i.e., at cloud top.
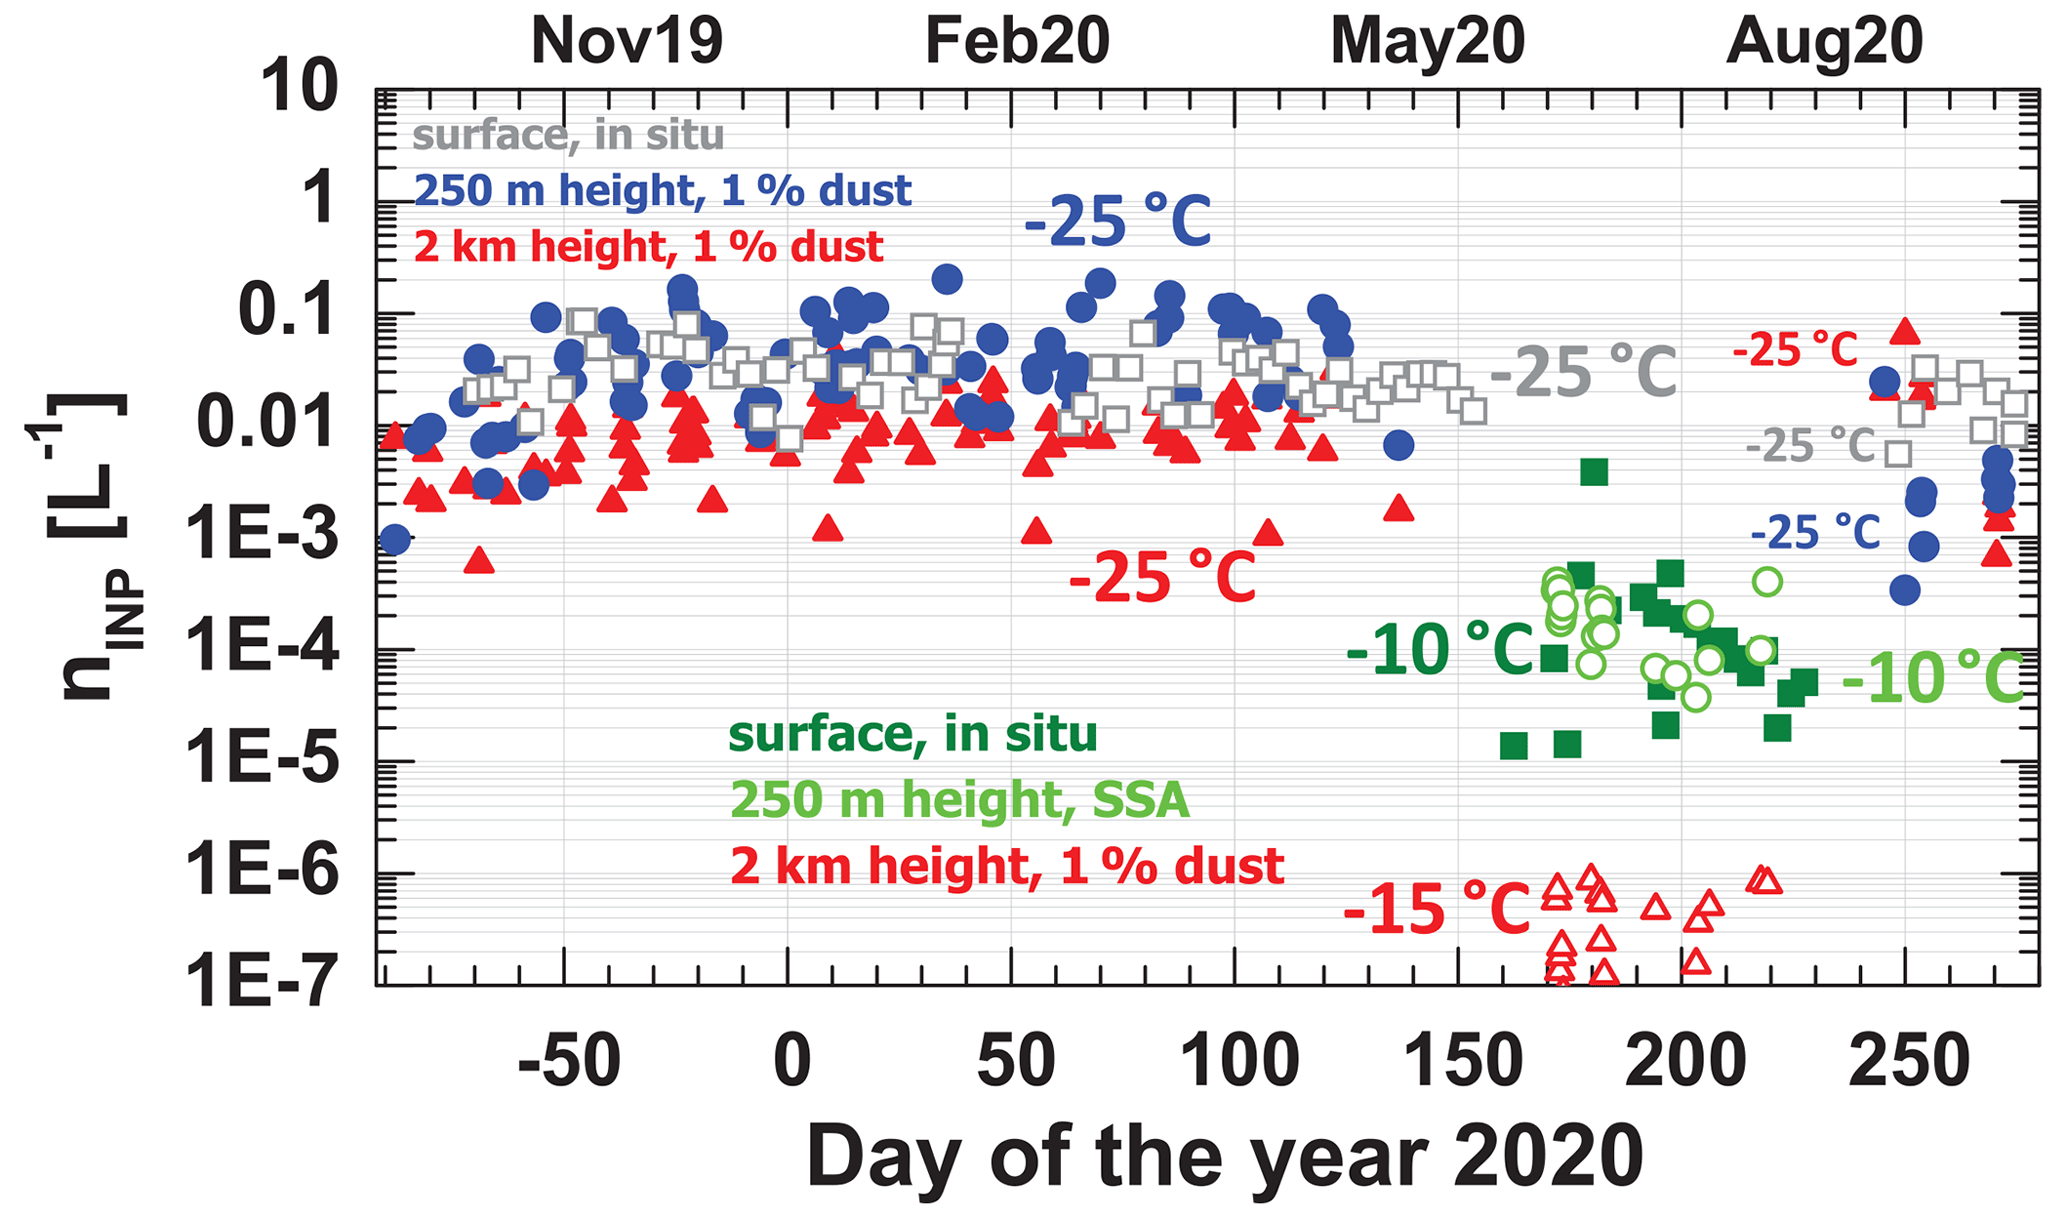
Figure 11Annual cycle of the INP number concentration during the MOSAiC year as observed in situ aboard Polarstern (open gray and closed dark green squares; daily mean INP values) (Creamean et al., 2022) and estimated from Polarstern lidar observations at 250 m (closed blue circles, October 2019 to May 2020 and in September 2020; open light green circles, June–August) and at 2000 m height (closed red triangles, October–May and in September; open red triangles, June–August) for ice-nucleating temperatures of −25 ∘C in autumn, winter, and spring and −10 ∘C (surface, 250 m) and −15 ∘C (2000 m) in summer. Clay mineral dust (1 % contribution to the aerosol surface area concentration) is assumed to be the only ice-active aerosol type at 250 m (in autumn, winter, and spring) and 2000 m height (all seasons), while sea spray aerosol is assumed to be the only INP type at 250 m height in summer.
Equation (5) in Sect. 3.4.1 was used to computed dust-related INP number concentrations at 250 m (autumn, winter, and spring months) and at 2000 m (all seasons). We assume that only clay mineral dust particles can serve as INPs in autumn, spring, and winter months and ignore the contribution of agricultural soil dust. We adjusted the estimated INP time series for the 250 m height level in Fig. 11 to the INP concentrations measured in situ (for the time period from October 2019 to April 2020) by varying the dust fraction afrac in Eq. (5). In this way, we found a dust fraction of 1 %. This is in agreement with the lidar observations indicating low dust fractions, clearly below 5 %. The dust-aging impact was considered by assuming fage=0.2 (Augustin-Bauditz et al., 2014; Wex et al., 2014).
The INP parameterization for sea spray aerosol was applied to estimate the INP number concentration in the ABL during the summer months (June–August 2020). No adjustment to the INP concentration measured in situ was performed here. In summer, we assume that continental aerosol particles (and thus dust particles) are absent in the Arctic ABL so that the aerosol in the lowermost tropospheric layer is of local marine origin (afrac=1.0 in Eq. 5).
As can be seen in Fig. 11, weakly varying INP number concentrations were observed at all three height levels (surface, 250 m height, 2000 m height) from November 2019 to April 2020. This may be related to the stable weather patterns that were widely controlled by the strong, long-lasting winter polar vortex. The difference between the 250 and 2000 m INP number concentrations (October–May) is related to the strong decrease in the particle number concentration with height, as discussed in Sect. 4.2 and shown in Figs. 6 and 7.
The winter (December–February) mean INP number concentrations and corresponding SD values are 0.039±0.02 cm−3 (in situ, surface, −25 ∘C), 0.054±0.042 cm−3 (lidar, 250 m height, −25 ∘C, 1 % dust), and 0.011±0.0073 cm−3 (lidar, 2000 m height, −25 ∘C, 1 % dust). In contrast, the summer (June–August) values are 0.00031±0.00081 cm−3 (in situ, surface, −10 ∘C), 0.000019±0.000012 cm−3 (lidar, 250 m height, −10 ∘C, SSA), and cm−3 (lidar, 2000 m height, −15 ∘C, 1 % dust). The natural (atmospheric) variability, indicated by the SD, is of the order of 50 %–100 % around the mean INP values.
The drop in the INP number concentration by 2–3 orders of magnitude in the ABL (surface, 250 m observations) from winter to summer is largely related to the change in the assumed increase in the cloud-top temperatures from −25 to −10 ∘C. The INP number concentration roughly decreases by an order of magnitude when the cloud-top temperature increases by 5 K. The effective wet removal of continental aerosol during long-range transport to the central Arctic in summer (Browse et al., 2012) also contributes to this strong difference between the winter and summer ABL INP levels.
In Fig. 12, we show ABL INP time series for fixed temperatures of −15 and −25 ∘C to better see the impact of the different INP aerosol types (dust vs. SSA) on ice nucleation in the boundary layer. At the low temperature of −25 ∘C, the ice activity of SSA (summer) and clay mineral dust particles (winter, 1 % fraction) is not very different, especially not in the case of the in situ observations. A pronounced annual cycle is visible in the INP time series for −15 ∘C in Fig. 12. The estimated SSA INP values and the measured INP number concentrations show a maximum during the summer season. The rather low dust INP number concentrations for a temperature of −15 ∘C results from the assumption in the INP parameterization (Eq. 5) that dust particles are exclusively kaolinite particles, which are less efficient immersion freezing INPs at temperatures above −20 ∘C. The in situ observations aboard Polarstern point to the presence of agricultural soil dust particles as well. The uncertainty in lidar-derived INP estimates is generally large because of the unknown mixture of dust components far away from the main dust source regions and the missing information regarding the impact of aging and cloud-processing effects on the ice nucleation efficiency.
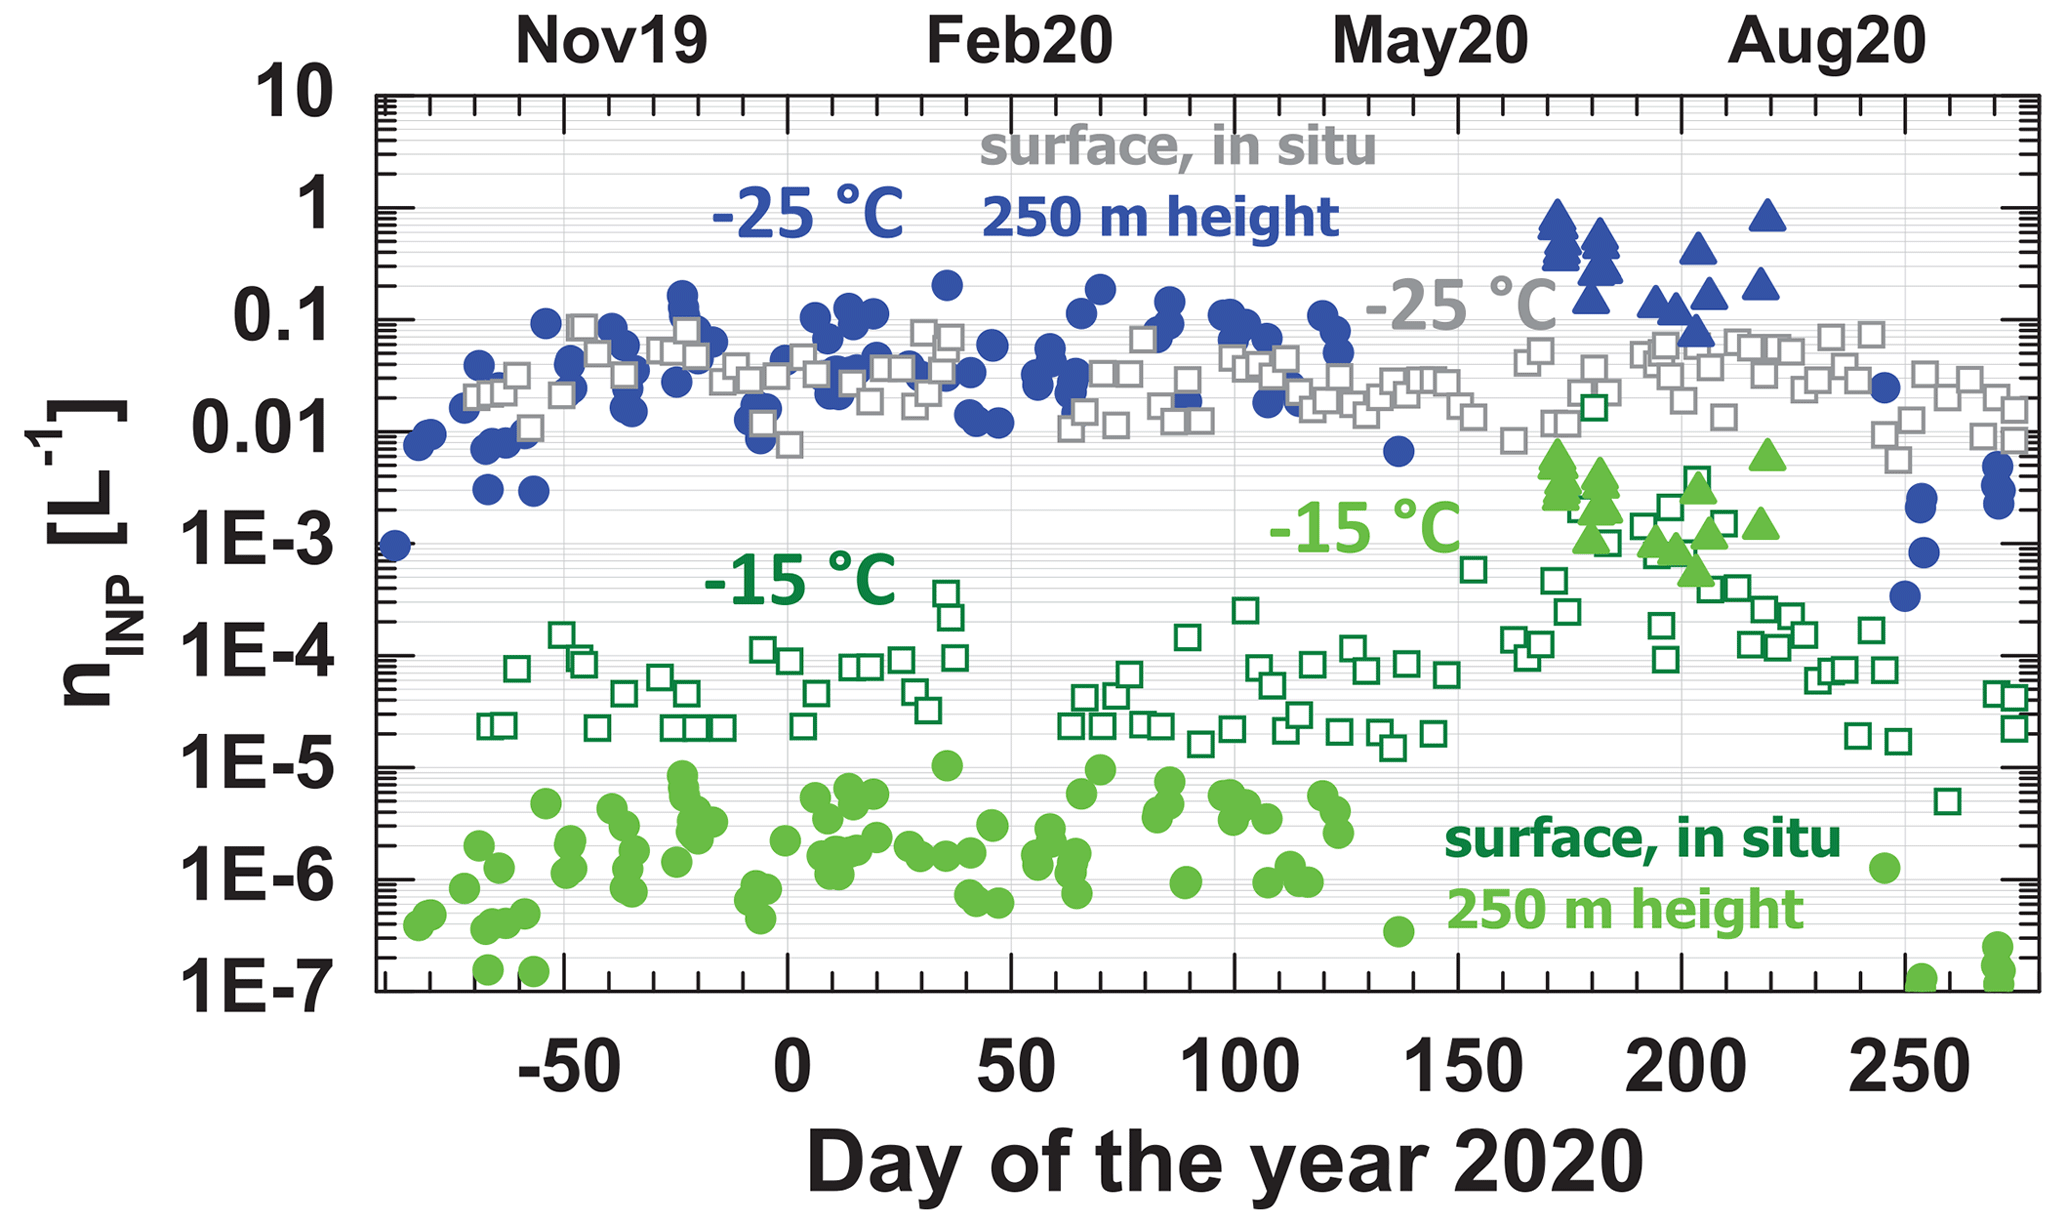
Figure 12Same as Fig. 11 but for fixed temperatures of −25 ∘C (closed blue circles and open gray squares) and −15 ∘C (closed green circles and open green squares) throughout the MOSAiC year. Surface in situ observations (squares) (Creamean et al., 2022) and lidar INP estimates (circles for kaolinite dust and triangles for SSA) for the 250 m height level are shown.
The hypothesis that biogenic INPs dominated the INP number concentrations in summer has already been discussed by Creamean et al. (2022). The authors showed time series of nINP for temperatures of −10, −12.5, −15, −20, −22.5, and −25 ∘C from October 2019 to September 2020. INPs were only observed for high temperatures of −10 and −12.5 ∘C during the summer months (June–August). In winter, the INP number concentrations were close to zero for these high temperatures because of the absence of biogenic aerosol components and because dust particles are not very ice-active at temperatures ∘C.
The obviously different ice nucleation conditions in the ABL and in the layer above the ABL (with dust as the main INP type) in summer were also noticed by Griesche et al. (2021): they observed strong differences in the ice nucleation characteristics of summer mixed-phase clouds developing in an air mass coupled to the surface aerosol conditions and clouds which were decoupled from local aerosol conditions. The decoupled cloud systems showed similar properties to continental mixed-phase clouds, e.g., over Leipzig in Germany.
The MOSAiC observations, as presented in Figs. 11 and 12 for −25 ∘C, are in good agreement with other INP measurements at high latitudes, far away from strong sources of pollution. Tatzelt et al. (2022) presented shipborne observation of INP number concentrations conducted in the Southern Ocean during ACE and found a strong accumulation of values between 0.05 and 0.1 L−1 (interquartile range) for the temperature of −25 ∘C. Observations at Ny-Ålesund (78.9∘ N, 11.9∘ E) in Svalbard, Norway, in October–November 2019 and March–April 2020 yielded INP number concentrations mostly in the range from 0.13 to 0.3 L−1 (interquartile range) between 6 October and 15 November 2019 and from 0.2 to 0.55 L−1 between 16 March and 22 April 2020 for the temperature of −25 ∘C (Li et al., 2022). The Polarstern was more than 500 km north of Ny-Ålesund until April 2020. Si et al. (2019) reported INP number concentrations accumulating from 0.04 to 0.4 L−1 for −25 ∘C, measured in the Canadian central Arctic (82.5∘ N, 62.5∘ W) during March 2016. Hartmann et al. (2021) found INP values of 0.03–2 L−1 for −25 ∘C during a Polarstern cruise in the European Arctic up to 83.7∘ N in May–July 2017. Finally, Sze et al. (2023) analyzed 2-year-long INP measurements (from July 2018 to September 2020) at Villum 5 Research Station, North Greenland (81.6∘ N, 16.7∘ W). These observations suggest INP number concentrations mainly from 0.03 to 0.7 L−1 at −25 ∘C. A clear indication of the dominance of biogenic INPs during the summer months was highlighted.
5.3 INP number concentration close to the tropopause
Cirrus formation processes in polar regions are poorly characterized by observations. The nucleation of first ice crystals, the subsequent formation of extended cirrus layers, and the evolution of ice virga have a rather sensitive impact on the water cycle in the entire tropospheric column, influence the formation of cloud layers in the middle and lower troposphere by seeder–feeder effects, and, thus, affect the radiation and precipitation fields over Arctic regions in a very complex way. The limited knowledge of all of these processes hinders a proper simulation of polar clouds in the climate system. The lack of knowledge is particularly acute for the winter half year. The situation has improved since spaceborne CALIOP (aerosol and cloud lidar) and CloudSat (cloud radar) (Stephens et al., 2002) observations became available in 2006. Grenier et al. (2009) and Jouan et al. (2012, 2014) performed the first systematic polar studies regarding the influence of aerosol particles on ice nucleation and cirrus microphysical properties based on CALIOP and CloudSat observations.
Besides aged dust and soot particles, which are the most likely INP types at the cirrus level at temperatures around and below −50 ∘C, wildfire smoke should also be considered when dealing with aerosol–cirrus interaction and, thus, should be implemented in climate models in future. Aged wildfire smoke in the upper troposphere and stratosphere consists mainly of organic material. Jahn et al. (2020) and Jahl et al. (2021) hypothesized that aged smoke particles contain minerals and that these components determine the smoke INP efficacy. How relevant this aspect is remains to be shown.
Figure 13 shows the MOSAiC time series of smoke INP estimates close to the tropopause from October 2019 to the beginning of May 2020 and then again in September 2020. In addition, mineral dust INP estimates for the summer months from June to August 2020 are included in the figure.
Figure 13Lidar-estimated number concentrations of INPs that would be available for the nucleation of ice crystals during a gravity-wave-induced updraft event of 35 s (dust INPs, open orange circles, June to August 2020, 5 % dust fraction, aging factor fage=0.2) and 88 s (smoke INPs, green triangles, autumn to spring). The DIN time period of 35 or 88 s starts after exceeding a RHICE,on of 107 % (dust) or 140.5 % (smoke) and was (arbitrarily) terminated when RHICE reached 109 % (dust) or 146.8 % (smoke) for temperatures close to 208 K. The variability in the INP values is directly linked to the lidar-estimated particle surface area concentration sdry. The figure suggests that the aerosol concentration in the upper troposphere during the MOSAiC year was high enough to trigger cirrus formation via heterogeneous ice nucleation on smoke and dust INPs. The INP results are in line with retrievals of the ice crystal number concentration (0.1–10 L−1) obtained from our MOSAiC radar–lidar-based data analysis.
Each lidar data point in Fig. 13 represents a several-hour observation (Ohneiser et al., 2021a). The dust and smoke INP retrieval scheme (DIN parameterization) is explained in Sect. 3.4.2. The lidar-derived INP estimation is based on the simulation of gravity-wave-induced air parcel lofting and ice nucleation over Δt=35 s (mineral dust) or 88 s (smoke) for a given mean updraft speed of 30 cm s−1 (mean value for the first quarter of the gravity wave period of 1200 s). Within 35 or 88 s, the air parcel ascends by 16 or 35 m, respectively, and RH increases from RHICE,on (indicating the begin of the ice nucleation phase) to the maximum RHICE before the simulation is terminated. The values for T and the RH range from the RHICE,on to the maximum RHICE in our ice nucleation simulation are given in Fig. 13. We assumed a dust fraction (afrac) of 5 % for the total particle surface area during the summer months and also considered dust particle aging (fage=0.2) in Eq. (6). In the case of smoke, afrac=1.0 and fage=1.0. We arbitrarily terminated the INP computation when the INP concentration reached 30 L−1 in the case of an assumed total particle surface area concentration sdry=25 µm2 cm−3 for the reasons given in Sect. 3.4.2. Using the fixed INP integration times of 35 and 88 s in Fig. 13, the INP values are directly linked to the observed aerosol particle surface area concentration. In this way, the natural variability in the atmospheric aerosol conditions and respective ice nucleation conditions become visible.
We compared our gravity-wave-related INP estimation with the INP number concentrations obtained with the DIN parameterization of Ullrich et al. (2017) for mineral dust. The Ullrich INP parameterization was applied in the cirrus closure studies presented by Ansmann et al. (2019b). For T=208 K and RHICE values of 107 %, 109 %, 111 %, and 112 %, we obtain INP number concentrations of 1.3, 5.5, 19, and 32 L−1, respectively, for the same dust surface area conditions (sdry=25 µm2 cm−3, 5 % dust fraction, aging factor of 0.2) used in the gravity wave simulation, in which we yielded 30 INPs per liter. The agreement between the two independent estimations of the INP number concentrations is good when keeping in mind that the overall uncertainty in any INP estimation is at least 1 order of magnitude.
As can be seen in Fig. 13, INP number concentrations may have been as high as 1–30 L−1 over months in the upper troposphere. These INP number concentrations are high enough to influence cirrus evolution (Spichtinger and Cziczo, 2010). In our opinion, the presence of 1–30 INPs per liter is even sufficient to suppress homogeneous freezing. For homogeneous ice nucleation, a supersaturation of SICE>1.5 is required at −65 ∘C (Koop et al., 2000). The INP values of 1–30 L−1 are consistent with MOSAiC radar–lidar-based retrievals of ice crystal number concentrations (nICE) following Bühl et al. (2019). An example of the retrieval of nICE in Arctic cirrus layers and ice virga zones is shown in Engelmann et al. (2021). Based on the analysis of 10 MOSAiC cirrus systems occurring in December 2019 and January–February 2020, we obtained typical nICE values of 0.1–10 L−1. These low crystal number concentrations are a clear sign of heterogeneous ice nucleation. We applied the recently published CAPTIVATE (Cloud, Aerosol and Precipitation from mulTiple Instruments using a VAriational TEchnique) algorithm (Mason et al., 2023) to the combined MOSAiC radar–lidar cirrus data sets as well to estimate nICE profiles and found good overall agreement with the results obtained with the approach of Bühl et al. (2019).
The MOSAiC radiosonde observations (Maturilli et al., 2021) support that wildfire smoke was the dominant INP type from October 2019 to May 2020. The RH profiles frequently pointed to SICE values of around 1.2 in the cirrus layers, a clear sign that ice-active dust particles were probably absent in these rather aged smoke plumes and, thus, not available for efficient ice nucleation. In the presence of dust particles, the SICE values are expected to be quickly reduced to values close to 1.0 because of strong ice nucleation (already) at SICE≤1.1 and subsequent water vapor deposition on the freshly nucleated ice crystals (Murray et al., 2010; Engelmann et al., 2021). Thus, the observed high radiosonde SICE values are more consistent with the presence of pure smoke particles as INPs.
Finally, Fig. 14 shows an example of the impact of wildfire smoke on cirrus formation. Polarstern was at 88∘ N. A total of 4 d to 5 d of continuous cirrus formation from 25 to 29 February 2020 is presented. The smoke layer is clearly visible in the lidar observations as a yellow layer around 10 km height. Heterogeneous ice nucleation occurred in the yellow smoke layer at temperatures from −69 to −73 ∘C and RH values (over water) of between 65 % and 72 % in the height range from 9 to 10 km on 25–28 February 2020 according to the MOSAiC radiosonde observations. The respective ice supersaturation values were frequently between 1.15 and 1.35. Weak gravity-wave-induced lofting is then sufficient to trigger nucleation of ice crystals. Immediately after nucleation, the crystals grew quickly due to water vapor deposition on the crystals and started to fall out of the smoke layer. They formed long virga, partly visible down to heights of 6 km in Fig. 14. Below 6 km height, the air was dry and the crystals evaporated.
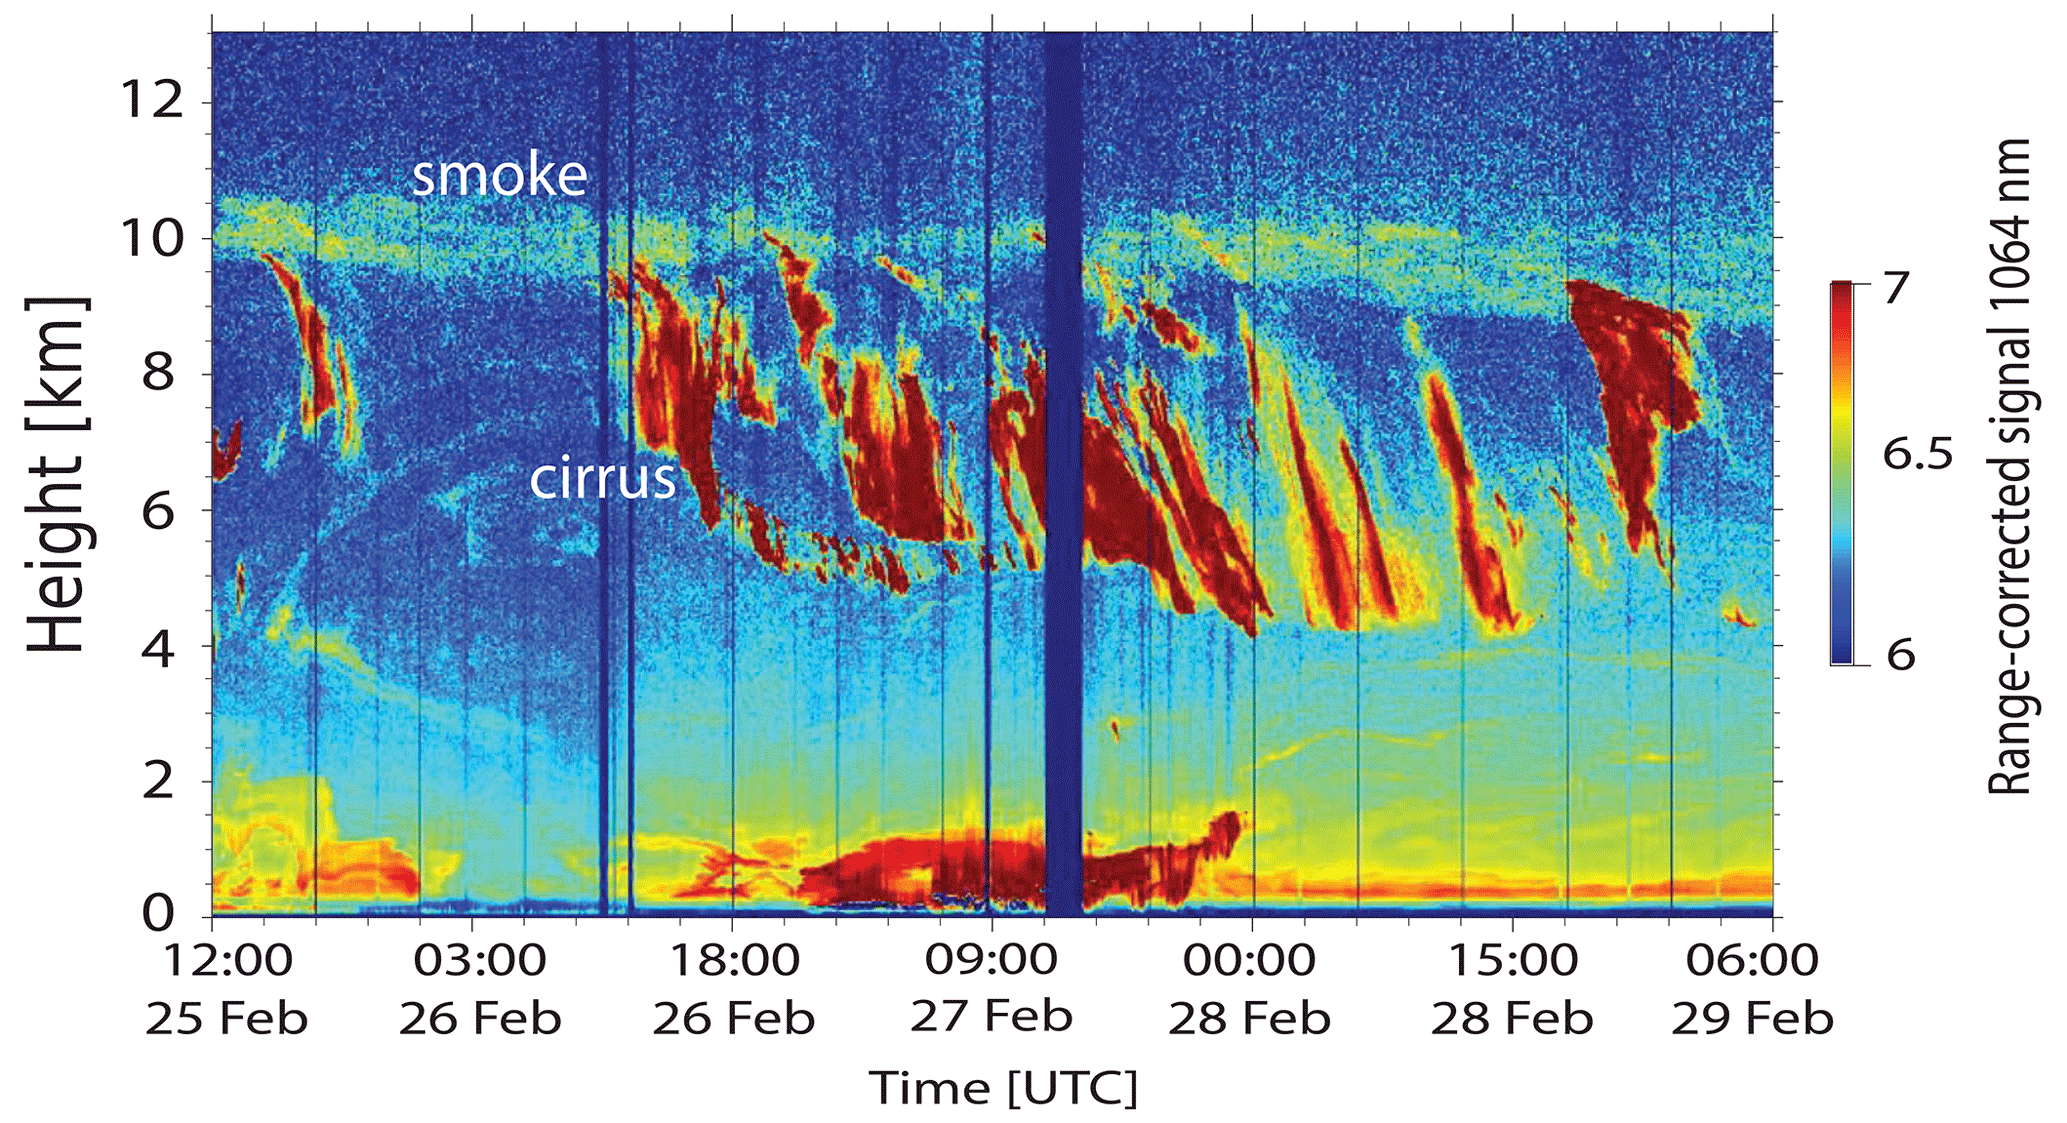
Figure 14Lidar observations of cirrus formation in a wildfire smoke layer (in yellow around 10 km) on 25–29 February 2020. Coherent fall strikes (virga in orange and red) consisting of fast-growing, falling ice crystals developed quickly after nucleation of ice crystals in the smoke layer. The virga reached down to almost 4 km where the crystals evaporated in dry air. Temperatures were close to −70 ∘C at the cirrus formation level. The range-corrected 1064 nm lidar return signal is shown on a logarithmic scale (arbitrary units).
MOSAiC provided a unique opportunity to study vertical aerosol layering up to 30 km height in the central Arctic from 80 to 90∘ N over a full year. Continuous observations (around the clock) of aerosol and cloud profiles with an advanced radar–lidar facility have been successfully performed aboard the German ice breaker Polarstern from October 2019 to September 2020. Such a comprehensive field campaign with winter observations mostly at latitudes >87∘ N has never been conducted in the central Arctic before. Active remote sensing was required to obtain annual cycles of aerosol conditions with high vertical resolution. Sun photometers only cover the sunlit seasons. Widespread surface in situ aerosol observations only cover the aerosol conditions in the shallow ABL and, thus, do not allow us to draw general conclusions about Arctic aerosols nor their impact on cloud processes in different tropospheric height regimes.
The lidar observations and the in situ observations aboard Polarstern allowed a detailed characterization of the vertical distributions of optical, microphysical, and cloud-relevant aerosol properties. A strong decrease in aerosol pollution (anthropogenic haze, fire smoke, and a small fraction of soil dust) with height was found during the winter months (October 2019 to April 2020) up to about 4–5 km height. The aerosol number concentration decreased by an order of magnitude within 2 km. The minimum in the aerosol particle concentration at 4–5 km height separated the Arctic haze layers in the lower atmosphere from wildfire smoke in the upper troposphere and lower stratosphere. In summer, rather clean conditions prevailed in the ABL, obviously a result of efficient wet removal of aerosols from the lowest kilometer of the Arctic atmosphere. Lofted continental aerosol plumes occurred from time to time, mostly above 1 km height.
CCN and INP number concentrations were estimated from the lidar observations. The CCN number concentration was found to strongly drop with height in winter, in line with the observed decrease in the aerosol backscatter and extinction coefficients. During summer, the CCN number concentration in the ABL was, on average, an order of magnitude lower than in winter. As an important fact regarding mixed-phase cloud formation in the ABL, our MOSAiC observations corroborate that the main ice-active aerosol type changes from dust particles (during the autumn, winter, and spring months) to sea spray aerosol containing biogenic substances during the summer season. At 2000 m height, continental aerosol seems to dominate CCN and INP number concentrations throughout the year. Our INP studies suggest that a few percent of aged dust particles (1 %–5 % contribution to the total particle surface area concentration) is sufficient to control ice nucleation in the lower Arctic troposphere (≤3 km height) most of the time, except in summer (within the ABL).
As a highlight of MOSAiC, we observed a persistent wildfire smoke layer in the UTLS height range from the beginning of MOSAiC in October 2019 to May 2020 (Engelmann et al., 2021; Ohneiser et al., 2021a; Ansmann et al., 2023). This aerosol had the potential to significantly influence cirrus formation at the tropopause level. Besides soil dust and soot, wildfire smoke, originating annually from strong fires in North America and Siberia, should, thus, be considered in upper-tropospheric ice formation in atmospheric models.
As an outlook, we are presently analyzing MOSAiC lidar and radar observations with a focus on aerosol–cloud interaction processes, for mixed-phase clouds in the lower troposphere and for upper-tropospheric cirrus separately. The first examples of this part of our MOSAiC data analysis have been presented in Engelmann et al. (2021). The main findings regarding aerosol–cloud interaction will be published in several follow-up MOSAiC articles.
Polly lidar observations (level-0 data, measured signals) are stored in the PollyNet database http://polly.tropos.de/ (Polly, 2022). All of the analysis products are available from TROPOS upon request (polly@tropos.de) and from https://doi.org/10.1594/PANGAEA.935539 (Ohneiser et al., 2021b). MOSAiC radiosonde data are available from https://doi.org/10.1594/PANGAEA.928656 (Maturilli et al., 2021). Backward-trajectory analysis has been performed by air mass transport computation with the NOAA (National Oceanic and Atmospheric Administration) HYSPLIT (HYbrid Single-Particle Lagrangian Integrated Trajectory) model (http://ready.arl.noaa.gov/HYSPLIT_traj.php, HYSPLIT, 2022). AERONET and Microtops observational data are available from the respective databases at http://aeronet.gsfc.nasa.gov/ (AERONET, 2022) and https://aeronet.gsfc.nasa.gov/new_web/maritime_aerosol_network.html (AERONET-MAN, 2022).
The paper was written and designed by AA, KO, and RE. The aerosol data analysis was performed by KO, RE, MR, JMC, MCB, JB, CJ, and HeG. KO, RE, JMC, MCB, DAK, MR, PS, and UW were involved in the interpretation of the findings. RE, HaG, MR, JH, and DA performed the lidar observations aboard Polarstern during MOSAiC. SD and MM were responsible for high-quality MOSAiC Polarstern radiosonde launches. All coauthors were actively involved in the extended discussions and the elaboration of the final design of the manuscript.
At least one of the (co-)authors is a member of the editorial board of Atmospheric Chemistry and Physics. The peer-review process was guided by an independent editor, and the authors also have no other competing interests to declare.
Publisher's note: Copernicus Publications remains neutral with regard to jurisdictional claims made in the text, published maps, institutional affiliations, or any other geographical representation in this paper. While Copernicus Publications makes every effort to include appropriate place names, the final responsibility lies with the authors.
Data used in this article were produced as part of MOSAiC. The authors would like to acknowledge everyone who contributed to the measurements used here (Nixdorf et al., 2021). Radiosonde data were obtained through a partnership between the leading Alfred Wegener Institute; the ARM user facility, a US DOE facility managed by the Biological and Environmental Research Program; and the German Weather Service (DWD). We would like to thank the Polarstern crew for their perfect logistical support during the 1-year MOSAiC expedition.
The Multidisciplinary drifting Observatory for the Study of the Arctic Climate (MOSAiC) program was funded by the German Federal Ministry for Education and Research (BMBF) through financing to the Alfred Wegener Institute, Helmholtz Centre for Polar and Marine Research (AWI), and the Polarstern expedition PS122 under grant no. N-2014-H-060_Dethloff. The lidar analysis on smoke–cirrus interaction was further supported by BMBF funding of the SCiAMO project (MOSAIC-FKZ 03F0915A). The radiosonde program was funded by AWI awards AFMOSAiC-1_00 and AWI_PS122_00, the US DOE ARM program, and the German Weather Service. This project has also received funding from the European Union's Horizon 2020 Research and Innovation program ACTRIS-2 Integrating Activities (H2020-INFRAIA-2014–2015; grant agreement no. 654109) and the Deutsche Forschungsgemeinschaft (DFG, German Research Foundation) – project no. 268020496 – TRR 172, within the Transregional Collaborative Research Center “ArctiC Amplification: Climate Relevant Atmospheric and SurfaCe Processes, and Feedback Mechanisms (AC)3”. Jessie M. Creamean has been supported by the US DOE ARM (grant nos. DE-AC05-76RL01830 and DE-SC0021034) and Atmospheric System Research (ASR) programs (grant nos. DE-SC0019745 and DE-SC002204). Daniel A. Knopf has been supported by the DOE ASR program, Office of Biological and Environmental Research (OBER) (grant no. DE-SC0021034).
This paper was edited by Radovan Krejci and reviewed by two anonymous referees.
Abbatt, J. P. D., Leaitch, W. R., Aliabadi, A. A., Bertram, A. K., Blanchet, J.-P., Boivin-Rioux, A., Bozem, H., Burkart, J., Chang, R. Y. W., Charette, J., Chaubey, J. P., Christensen, R. J., Cirisan, A., Collins, D. B., Croft, B., Dionne, J., Evans, G. J., Fletcher, C. G., Galí, M., Ghahreman, R., Girard, E., Gong, W., Gosselin, M., Gourdal, M., Hanna, S. J., Hayashida, H., Herber, A. B., Hesaraki, S., Hoor, P., Huang, L., Hussherr, R., Irish, V. E., Keita, S. A., Kodros, J. K., Köllner, F., Kolonjari, F., Kunkel, D., Ladino, L. A., Law, K., Levasseur, M., Libois, Q., Liggio, J., Lizotte, M., Macdonald, K. M., Mahmood, R., Martin, R. V., Mason, R. H., Miller, L. A., Moravek, A., Mortenson, E., Mungall, E. L., Murphy, J. G., Namazi, M., Norman, A.-L., O'Neill, N. T., Pierce, J. R., Russell, L. M., Schneider, J., Schulz, H., Sharma, S., Si, M., Staebler, R. M., Steiner, N. S., Thomas, J. L., von Salzen, K., Wentzell, J. J. B., Willis, M. D., Wentworth, G. R., Xu, J.-W., and Yakobi-Hancock, J. D.: Overview paper: New insights into aerosol and climate in the Arctic, Atmos. Chem. Phys., 19, 2527–2560, https://doi.org/10.5194/acp-19-2527-2019, 2019. a, b, c
AERONET: Aerosol Robotic Network aerosol database, http://aeronet.gsfc.nasa.gov/ (last access: 10 December 2022), 2022. a, b, c
AERONET-MAN: AERONET Maritime Aerosol Network database, https://aeronet.gsfc.nasa.gov/new_web/maritime_aerosol_ network.html (last access: 4 February 2022), 2022. a, b
Alpert, P. A. and Knopf, D. A.: Analysis of isothermal and cooling-rate-dependent immersion freezing by a unifying stochastic ice nucleation model, Atmos. Chem. Phys., 16, 2083–2107, https://doi.org/10.5194/acp-16-2083-2016, 2016. a, b
Alpert, P. A., Kilthau, W. P., O. R. E., Moffet, R. C., Gilles, M. K., Wang, B., Laskin, A., Aller, J. Y., and Knopf, D. A.: Ice-nucleating agents in sea spray aerosol identified and quantified with a holistic multimodal freezing model, Sci. Adv., 8, eabq6842, https://doi.org/10.1126/sciadv.abq6842, 2022. a, b, c, d, e
Ansmann, A., Tesche, M., Althausen, D., Müller, D., Seifert, P., Freudenthaler, V., Heese, B., Wiegner, M., Pisani, G., Knippertz, P., and Dubovik, O.: Influence of Saharan dust on cloud glaciation in southern Morocco during the Saharan Mineral Dust Experiment, J. Geophys. Res.-Atmos., 113, D04210, https://doi.org/10.1029/2007JD008785, 2008. a, b
Ansmann, A., Tesche, M., Seifert, P., Althausen, D., Engelmann, R., Fruntke, J., Wandinger, U., Mattis, I., and Müller, D.: Evolution of the ice phase in tropical altocumulus: SAMUM lidar observations over Cape Verde, J. Geophys. Res.-Atmos., 114, D17208, https://doi.org/10.1029/2008JD011659, 2009. a
Ansmann, A., Mamouri, R.-E., Hofer, J., Baars, H., Althausen, D., and Abdullaev, S. F.: Dust mass, cloud condensation nuclei, and ice-nucleating particle profiling with polarization lidar: updated POLIPHON conversion factors from global AERONET analysis, Atmos. Meas. Tech., 12, 4849–4865, https://doi.org/10.5194/amt-12-4849-2019, 2019a. a
Ansmann, A., Mamouri, R.-E., Bühl, J., Seifert, P., Engelmann, R., Hofer, J., Nisantzi, A., Atkinson, J. D., Kanji, Z. A., Sierau, B., Vrekoussis, M., and Sciare, J.: Ice-nucleating particle versus ice crystal number concentrationin altocumulus and cirrus layers embedded in Saharan dust:a closure study, Atmos. Chem. Phys., 19, 15087–15115, https://doi.org/10.5194/acp-19-15087-2019, 2019b. a, b
Ansmann, A., Ohneiser, K., Mamouri, R.-E., Knopf, D. A., Veselovskii, I., Baars, H., Engelmann, R., Foth, A., Jimenez, C., Seifert, P., and Barja, B.: Tropospheric and stratospheric wildfire smoke profiling with lidar: mass, surface area, CCN, and INP retrieval, Atmos. Chem. Phys., 21, 9779–9807, https://doi.org/10.5194/acp-21-9779-2021, 2021. a, b
Ansmann, A., Veselovskii, I., Ohneiser, K., and Chudnovsky, A.: Comment on “Stratospheric Aerosol Composition Observed by the Atmospheric Chemistry Experiment Following the 2019 Raikoke Eruption” by Boone et al., J. Geophys. Res.-Atmos., accepted, 2023. a, b, c, d
Augustin-Bauditz, S., Wex, H., Kanter, S., Ebert, M., Niedermeier, D., Stolz, F., Prager, A., and Stratmann, F.: The immersion mode ice nucleation behavior of mineral dusts: A comparison of different pure and surface modified dusts, Geophys. Res. Lett., 41, 7375–7382, https://doi.org/10.1002/2014GL061317, 2014. a, b, c
Baars, H., Kanitz, T., Engelmann, R., Althausen, D., Heese, B., Komppula, M., Preißler, J., Tesche, M., Ansmann, A., Wandinger, U., Lim, J.-H., Ahn, J. Y., Stachlewska, I. S., Amiridis, V., Marinou, E., Seifert, P., Hofer, J., Skupin, A., Schneider, F., Bohlmann, S., Foth, A., Bley, S., Pfüller, A., Giannakaki, E., Lihavainen, H., Viisanen, Y., Hooda, R. K., Pereira, S. N., Bortoli, D., Wagner, F., Mattis, I., Janicka, L., Markowicz, K. M., Achtert, P., Artaxo, P., Pauliquevis, T., Souza, R. A. F., Sharma, V. P., van Zyl, P. G., Beukes, J. P., Sun, J., Rohwer, E. G., Deng, R., Mamouri, R.-E., and Zamorano, F.: An overview of the first decade of PollyNET: an emerging network of automated Raman-polarization lidars for continuous aerosol profiling, Atmos. Chem. Phys., 16, 5111–5137, https://doi.org/10.5194/acp-16-5111-2016, 2016. a
Barahona, D., Molod, A., and Kalesse, H.: Direct estimation of the global distribution of vertical velocity within cirrus clouds, Sci. Rep., 7, 6840, https://doi.org/10.1038/s41598-017-07038-6, 2019. a
Beck, I., Angot, H., Baccarini, A., Dada, L., Quéléver, L., Jokinen, T., Laurila, T., Lampimäki, M., Bukowiecki, N., Boyer, M., Gong, X., Gysel-Beer, M., Petäjä, T., Wang, J., and Schmale, J.: Automated identification of local contamination in remote atmospheric composition time series, Atmos. Meas. Tech., 15, 4195–4224, https://doi.org/10.5194/amt-15-4195-2022, 2022. a
Bohlmann, S., Baars, H., Radenz, M., Engelmann, R., and Macke, A.: Ship-borne aerosol profiling with lidar over the Atlantic Ocean: from pure marine conditions to complex dust–smoke mixtures, Atmos. Chem. Phys., 18, 9661–9679, https://doi.org/10.5194/acp-18-9661-2018, 2018. a
Boyer, M., Aliaga, D., Pernov, J. B., Angot, H., Quéléver, L. L. J., Dada, L., Heutte, B., Dall'Osto, M., Beddows, D. C. S., Brasseur, Z., Beck, I., Bucci, S., Duetsch, M., Stohl, A., Laurila, T., Asmi, E., Massling, A., Thomas, D. C., Nøjgaard, J. K., Chan, T., Sharma, S., Tunved, P., Krejci, R., Hansson, H. C., Bianchi, F., Lehtipalo, K., Wiedensohler, A., Weinhold, K., Kulmala, M., Petäjä, T., Sipilä, M., Schmale, J., and Jokinen, T.: A full year of aerosol size distribution data from the central Arctic under an extreme positive Arctic Oscillation: insights from the Multidisciplinary drifting Observatory for the Study of Arctic Climate (MOSAiC) expedition, Atmos. Chem. Phys., 23, 389–415, https://doi.org/10.5194/acp-23-389-2023, 2023. a, b, c, d, e, f, g
Brock, C. A., Froyd, K. D., Dollner, M., Williamson, C. J., Schill, G., Murphy, D. M., Wagner, N. J., Kupc, A., Jimenez, J. L., Campuzano-Jost, P., Nault, B. A., Schroder, J. C., Day, D. A., Price, D. J., Weinzierl, B., Schwarz, J. P., Katich, J. M., Wang, S., Zeng, L., Weber, R., Dibb, J., Scheuer, E., Diskin, G. S., DiGangi, J. P., Bui, T., Dean-Day, J. M., Thompson, C. R., Peischl, J., Ryerson, T. B., Bourgeois, I., Daube, B. C., Commane, R., and Wofsy, S. C.: Ambient aerosol properties in the remote atmosphere from global-scale in situ measurements, Atmos. Chem. Phys., 21, 15023–15063, https://doi.org/10.5194/acp-21-15023-2021, 2021. a
Browse, J., Carslaw, K. S., Arnold, S. R., Pringle, K., and Boucher, O.: The scavenging processes controlling the seasonal cycle in Arctic sulphate and black carbon aerosol, Atmos. Chem. Phys., 12, 6775–6798, https://doi.org/10.5194/acp-12-6775-2012, 2012. a, b, c, d, e
Bühl, J., Seifert, P., Radenz, M., Baars, H., and Ansmann, A.: Ice crystal number concentration from lidar, cloud radar and radar wind profiler measurements, Atmos. Meas. Tech., 12, 6601–6617, https://doi.org/10.5194/amt-12-6601-2019, 2019. a, b
Carlsen, T. and David, R. O.: Spaceborne Evidence That Ice-Nucleating Particles Influence High-Latitude Cloud Phase, Geophys. Res. Lett., 49, e2022GL098041, https://doi.org/10.1029/2022GL098041, 2022. a, b
Chang, R. Y.-W., Abbatt, J. P. D., Boyer, M. C., Chaubey, J. P., and Collins, D. B.: Characterizing the hygroscopicity of growing particles in the Canadian Arctic summer, Atmos. Chem. Phys., 22, 8059–8071, https://doi.org/10.5194/acp-22-8059-2022, 2022. a, b
Chazette, P., Raut, J.-C., and Totems, J.: Springtime aerosol load as observed from ground-based and airborne lidars over northern Norway, Atmos. Chem. Phys., 18, 13075–13095, https://doi.org/10.5194/acp-18-13075-2018, 2018. a
Choudhury, G., Ansmann, A., and Tesche, M.: Evaluation of aerosol number concentrations from CALIPSO with ATom airborne in situ measurements, Atmos. Chem. Phys., 22, 7143–7161, https://doi.org/10.5194/acp-22-7143-2022, 2022. a
Creamean, J., Barry, K., Hill, T., Hume, C., DeMott, P. J., Shupe, M. D., Dahlke, S., Willmes, S., Schmale, J., Beck, I., Hoppe, C. J. . M., Fong, A., Chamberlain, E., Bowman, J., Scharien, R., and Persson, O.: Annual cycle observations of aerosols capable of ice formation in central Arctic clouds, Nat. Commun., 13, 3537, https://doi.org/10.1038/s41467-022-31182-x, 2022. a, b, c, d, e, f, g, h, i, j, k
Creamean, J. M., Kirpes, R. M., Pratt, K. A., Spada, N. J., Maahn, M., de Boer, G., Schnell, R. C., and China, S.: Marine and terrestrial influences on ice nucleating particles during continuous springtime measurements in an Arctic oilfield location, Atmos. Chem. Phys., 18, 18023–18042, https://doi.org/10.5194/acp-18-18023-2018, 2018. a
Creamean, J. M., Cross, J. N., Pickart, R., McRaven, L., Lin, P., Pacini, A., Hanlon, R., Schmale, D. G., Ceniceros, J., Aydell, T., Colombi, N., Bolger, E., and DeMott, P. J.: Ice Nucleating Particles Carried From Below a Phytoplankton Bloom to the Arctic Atmosphere, Geophys. Res. Lett., 46, 8572–8581, https://doi.org/10.1029/2019GL083039, 2019. a
Cziczo, D. J., Froyd, K. D., Gallavardin, S. J., Möhler, O., Benz, S., Saathoff, H., and Murphy, D. M.: Deactivation of ice nuclei due to atmospherically relevant surface coatings, Environ. Res. Lett., 4, 1–8, https://doi.org/10.1088/1748-9326/4/4/044013, 2009. a
Dada, L., Angot, H., Beck, I., Baccarini, A., Quéléver, L. L. J., Boyer, M., Laurila, T., Brasseur, Z., Jozef, G., de Boer, G., Shupe, M. D., Henning, S., Bucci, S., Dütsch, M., Stohl, A., Petäjä, T., Daellenbach, K. R., Jokinen, T., and Schmale, J.: A central Arctic extreme aerosol event triggered by a warm air-mass intrusion, Nat. Commun., 13, 5290, https://doi.org/10.1038/s41467-022-32872-2, 2022. a, b, c
Dahlkötter, F., Gysel, M., Sauer, D., Minikin, A., Baumann, R., Seifert, P., Ansmann, A., Fromm, M., Voigt, C., and Weinzierl, B.: The Pagami Creek smoke plume after long-range transport to the upper troposphere over Europe – aerosol properties and black carbon mixing state, Atmos. Chem. Phys., 14, 6111–6137, https://doi.org/10.5194/acp-14-6111-2014, 2014. a
de Boer, G., Morrison, H., Shupe, M. D., and Hildner, R.: Evidence of liquid dependent ice nucleation in high-latitude stratiform clouds from surface remote sensors, Geophys. Res. Lett., 38, L01803, https://doi.org/10.1029/2010GL046016, 2011. a
DeMott, P. J., Prenni, A. J., McMeeking, G. R., Sullivan, R. C., Petters, M. D., Tobo, Y., Niemand, M., Möhler, O., Snider, J. R., Wang, Z., and Kreidenweis, S. M.: Integrating laboratory and field data to quantify the immersion freezing ice nucleation activity of mineral dust particles, Atmos. Chem. Phys., 15, 393–409, https://doi.org/10.5194/acp-15-393-2015, 2015. a
DeMott, P. J., Hill, T. C. J., McCluskey, C. S., Prather, K. A., Collins, D. B., Sullivan, R. C., Ruppel, M. J., Mason, R. H., Irish, V. E., Lee, T., Hwang, C. Y., Rhee, T. S., Snider, J. R., McMeeking, G. R., Dhaniyala, S., Lewis, E. R., Wentzell, J. J. B., Abbatt, J., Lee, C., Sultana, C. M., Ault, A. P., Axson, J. L., Martinez, M. D., Venero, I., Santos-Figueroa, G., Stokes, M. D., Deane, G. B., Mayol-Bracero, O. L., Grassian, V. H., Bertram, T. H., Bertram, A. K., Moffett, B. F., and Franc, G. D.: Sea spray aerosol as a unique source of ice nucleating particles, P. Natl. Acad. Sci. USA., 113, 5797–5803, https://doi.org/10.1073/pnas.1514034112, 2016. a
Düsing, S., Wehner, B., Seifert, P., Ansmann, A., Baars, H., Ditas, F., Henning, S., Ma, N., Poulain, L., Siebert, H., Wiedensohler, A., and Macke, A.: Helicopter-borne observations of the continental background aerosol in combination with remote sensing and ground-based measurements, Atmos. Chem. Phys., 18, 1263–1290, https://doi.org/10.5194/acp-18-1263-2018, 2018. a
Engelmann, R., Kanitz, T., Baars, H., Heese, B., Althausen, D., Skupin, A., Wandinger, U., Komppula, M., Stachlewska, I. S., Amiridis, V., Marinou, E., Mattis, I., Linné, H., and Ansmann, A.: The automated multiwavelength Raman polarization and water-vapor lidar PollyXT: the neXT generation, Atmos. Meas. Tech., 9, 1767–1784, https://doi.org/10.5194/amt-9-1767-2016, 2016. a, b
Engelmann, R., Ansmann, A., Ohneiser, K., Griesche, H., Radenz, M., Hofer, J., Althausen, D., Dahlke, S., Maturilli, M., Veselovskii, I., Jimenez, C., Wiesen, R., Baars, H., Bühl, J., Gebauer, H., Haarig, M., Seifert, P., Wandinger, U., and Macke, A.: Wildfire smoke, Arctic haze, and aerosol effects on mixed-phase and cirrus clouds over the North Pole region during MOSAiC: an introduction, Atmos. Chem. Phys., 21, 13397–13423, https://doi.org/10.5194/acp-21-13397-2021, 2021. a, b, c, d, e, f, g, h, i, j, k, l, m, n, o, p
Georgoulias, A. K., Marinou, E., Tsekeri, A., Proestakis, E., Akritidis, D., Alexandri, G., Zanis, P., Balis, D., Marenco, F., Tesche, M., and Amiridis, V.: A first case study of CCN concentrations from spaceborne lidar observations, Remote Sens.-Basel, 12, 1557, https://doi.org/10.3390/rs12101557, 2020. a
Grenier, P., Blanchet, J.-P., and Muñoz-Alpizar, R.: Study of polar thin ice clouds and aerosols seen by CloudSat and CALIPSO during midwinter 2007, J. Geophys. Res.-Atmos., 114, D09201, https://doi.org/10.1029/2008JD010927, 2009. a
Griesche, H. J., Seifert, P., Ansmann, A., Baars, H., Barrientos Velasco, C., Bühl, J., Engelmann, R., Radenz, M., Zhenping, Y., and Macke, A.: Application of the shipborne remote sensing supersite OCEANET for profiling of Arctic aerosols and clouds during Polarstern cruise PS106, Atmos. Meas. Tech., 13, 5335–5358, https://doi.org/10.5194/amt-13-5335-2020, 2020. a
Griesche, H. J., Ohneiser, K., Seifert, P., Radenz, M., Engelmann, R., and Ansmann, A.: Contrasting ice formation in Arctic clouds: surface-coupled vs. surface-decoupled clouds, Atmos. Chem. Phys., 21, 10357–10374, https://doi.org/10.5194/acp-21-10357-2021, 2021. a, b, c
Haag, W. and Kärcher, B.: The impact of aerosols and gravity waves on cirrus clouds at midlatitudes, J. Geophys. Res.-Atmos., 109, D12202, https://doi.org/10.1029/2004JD004579, 2004. a
Haarig, M., Walser, A., Ansmann, A., Dollner, M., Althausen, D., Sauer, D., Farrell, D., and Weinzierl, B.: Profiles of cloud condensation nuclei, dust mass concentration, and ice-nucleating-particle-relevant aerosol properties in the Saharan Air Layer over Barbados from polarization lidar and airborne in situ measurements, Atmos. Chem. Phys., 19, 13773–13788, https://doi.org/10.5194/acp-19-13773-2019, 2019. a
Hartmann, M., Gong, X., Kecorius, S., van Pinxteren, M., Vogl, T., Welti, A., Wex, H., Zeppenfeld, S., Herrmann, H., Wiedensohler, A., and Stratmann, F.: Terrestrial or marine – indications towards the origin of ice-nucleating particles during melt season in the European Arctic up to 83.7∘ N, Atmos. Chem. Phys., 21, 11613–11636, https://doi.org/10.5194/acp-21-11613-2021, 2021. a, b, c
Herenz, P., Wex, H., Henning, S., Kristensen, T. B., Rubach, F., Roth, A., Borrmann, S., Bozem, H., Schulz, H., and Stratmann, F.: Measurements of aerosol and CCN properties in the Mackenzie River delta (Canadian Arctic) during spring–summer transition in May 2014, Atmos. Chem. Phys., 18, 4477–4496, https://doi.org/10.5194/acp-18-4477-2018, 2018. a, b, c
Hofer, J., Althausen, D., Abdullaev, S. F., Makhmudov, A. N., Nazarov, B. I., Schettler, G., Engelmann, R., Baars, H., Fomba, K. W., Müller, K., Heinold, B., Kandler, K., and Ansmann, A.: Long-term profiling of mineral dust and pollution aerosol with multiwavelength polarization Raman lidar at the Central Asian site of Dushanbe, Tajikistan: case studies, Atmos. Chem. Phys., 17, 14559–14577, https://doi.org/10.5194/acp-17-14559-2017, 2017. a, b
Holben, B. N., Eck, T. F., Slutsker, I., Tanré, D., Buis, J. P., Setzer, A., Vermote, E., Reagan, J. A., Kaufman, Y. J., Nakajima, T., Lavenu, F., Jankowiak, I., and Smirnov, A.: AERONET - A federated instrument network and data archive for aerosol characterization, Remote Sens. Environ., 66, 1–16, https://doi.org/10.1016/S0034-4257(98)00031-5, 1998. a, b, c
Hu, Q., Goloub, P., Veselovskii, I., and Podvin, T.: The characterization of long-range transported North American biomass burning plumes: what can a multi-wavelength Mie–Raman-polarization-fluorescence lidar provide?, Atmos. Chem. Phys., 22, 5399–5414, https://doi.org/10.5194/acp-22-5399-2022, 2022. a, b, c
HYSPLIT: HYbrid Single-Particle Lagrangian Integrated Trajectory model, backward trajectory calculation tool, http://ready.arl.noaa.gov/HYSPLIT_traj.php (last access: 20 November 2022), 2022. a, b
Ichoku, C., Levy, R., Kaufman, Y. J., Remer, L. A., Li, R.-R., Martins, V. J., Holben, B. N., Abuhassan, N., Slutsker, I., Eck, T. F., and Pietras, C.: Analysis of the performance characteristics of the five-channel Microtops II Sun photometer for measuring aerosol optical thickness and precipitable water vapor, J. Geophys. Res.-Atmos., 107, AAC 5–1–AAC 5–17, https://doi.org/10.1029/2001JD001302, 2002. a
Jahl, L. G., Brubaker, T. A., Polen, M. J., Jahn, L. G., Cain, K. P., Bowers, B. B., Fahy, W. D., Graves, S., and Sullivan, R. C.: Atmospheric aging enhances the ice nucleation ability of biomass-burning aerosol, Sci. Adv., 7, eabd3440, https://doi.org/10.1126/sciadv.abd3440, 2021. a
Jahn, L. G., Polen, M. J., Jahl, L. G., Brubaker, T. A., Somers, J., and Sullivan, R. C.: Biomass combustion produces ice-active minerals in biomass-burning aerosol and bottom ash, P. Natl. Acad. Sci. USA, 117, 21928–21937, https://doi.org/10.1073/pnas.1922128117, 2020. a
Jimenez, C., Ansmann, A., Engelmann, R., Donovan, D., Malinka, A., Seifert, P., Wiesen, R., Radenz, M., Yin, Z., Bühl, J., Schmidt, J., Barja, B., and Wandinger, U.: The dual-field-of-view polarization lidar technique: a new concept in monitoring aerosol effects in liquid-water clouds – case studies, Atmos. Chem. Phys., 20, 15265–15284, https://doi.org/10.5194/acp-20-15265-2020, 2020. a, b
Jouan, C., Girard, E., Pelon, J., Gultepe, I., Delanoë, J., and Blanchet, J.-P.: Characterization of Arctic ice cloud properties observed during ISDAC, J. Geophys. Res.-Atmos., 117, D23207, https://doi.org/10.1029/2012JD017889, 2012. a
Jouan, C., Pelon, J., Girard, E., Ancellet, G., Blanchet, J. P., and Delanoë, J.: On the relationship between Arctic ice clouds and polluted air masses over the North Slope of Alaska in April 2008, Atmos. Chem. Phys., 14, 1205–1224, https://doi.org/10.5194/acp-14-1205-2014, 2014. a
Kalesse, H. and Kollias, P.: Climatology of high cloud dynamics using profiling ARM Doppler radar observations, J. Climate, 26, 6340–6359, https://doi.org/10.1175/JCLI-D-12-00695.1, 2013. a
Kanitz, T., Seifert, P., Ansmann, A., Engelmann, R., Althausen, D., Casiccia, C., and Rohwer, E. G.: Contrasting the impact of aerosols at northern and southern midlatitudes on heterogeneous ice formation, Geophys. Res. Lett., 38, L17802, https://doi.org/10.1029/2011GL048532, 2011. a
Kanitz, T., Ansmann, A., Engelmann, R., and Althausen, D.: North-south cross sections of the vertical aerosol distribution over the Atlantic Ocean from multiwavelength Raman/polarization lidar during Polarstern cruises, J. Geophys. Res.-Atmos., 118, 2643–2655, https://doi.org/10.1002/jgrd.50273, 2013. a
Kanji, Z. A., Ladino, L. A., Wex, H., Boose, Y., Burkert-Kohn, M., Cziczo, D. J., and Krämer, M.: Overview of ice nucleating particles, Meteor. Mon., 58, 1–33, https://doi.org/10.1175/AMSMONOGRAPHS-D-16-0006.1, 2017. a, b, c
Kanji, Z. A., Sullivan, R. C., Niemand, M., DeMott, P. J., Prenni, A. J., Chou, C., Saathoff, H., and Möhler, O.: Heterogeneous ice nucleation properties of natural desert dust particles coated with a surrogate of secondary organic aerosol, Atmos. Chem. Phys., 19, 5091–5110, https://doi.org/10.5194/acp-19-5091-2019, 2019. a
Kärcher, B. and Podglajen, A.: A Stochastic Representation of Temperature Fluctuations Induced by Mesoscale Gravity Waves, J. Geophys. Res.-Atmos., 124, 11506–11529, https://doi.org/10.1029/2019JD030680, 2019. a, b
Kärcher, B., Hendricks, J., and Lohmann, U.: Physically based parameterization of cirrus cloud formation for use in global atmospheric models, J. Geophys. Res.-Atmos., 111, D01205, https://doi.org/10.1029/2005JD006219, 2006. a
Kawai, K., Matsui, H., and Tobo, Y.: Dominant Role of Arctic Dust With High Ice Nucleating Ability in the Arctic Lower Troposphere, Geophys. Res. Lett., 50, e2022GL102470, https://doi.org/10.1029/2022GL102470, 2023. a
Kim, M.-H., Omar, A. H., Vaughan, M. A., Winker, D. M., Trepte, C. R., Hu, Y., Liu, Z., and Kim, S.-W.: Quantifying the low bias of CALIPSO's column aerosol optical depth due to undetected aerosol layers, J. Geophys. Res.-Atmos., 122, 1098–1113, https://doi.org/10.1002/2016JD025797, 2017. a
Knopf, D. A. and Alpert, P. A.: A water activity based model of heterogeneous ice nucleation kinetics for freezing of water and aqueous solution droplets, Faraday Discuss., 165, 513–534, https://doi.org/10.1039/c3fd00035d, 2013. a, b, c, d
Knopf, D. A. and Alpert, P. A.: Atmospheric ice nucleation, Nat. Rev. Phys., 5, 203–217, https://doi.org/10.1038/s42254-023-00570-7, 2023. a
Knopf, D. A., Alpert, P. A., and Wang, B.: The role of organic aerosol in atmospheric ice nucleation: a review, ACS Earth Space Chem., 2, 168–202, https://doi.org/10.1021/acsearthspacechem.7b00120, 2018. a, b, c, d
Knust, R.: Polar Research and Supply Vessel POLARSTERN operated by the Alfred‐Wegener‐Institute, Journal of large‐scale research facilities JLSRF, 3, A119, https://doi.org/10.17815/jlsrf-3-163, 2017. a
Koop, T., Luo, B. P., Tsias, A., and Peter, T.: Water activity as the determinant for homogeneous ice nucleation in aqueous solutions, Nature, 406, 611–614, https://doi.org/10.1038/35020537, 2000. a, b
Kulkarni, G., Sanders, C., Zhang, K., Liu, X., and Zhao, C.: Ice nucleation of bare and sulfuric acid-coated mineral dust particles and implication for cloud properties, J. Geophys. Res.-Atmos., 119, 9993–10011, https://doi.org/10.1002/2014JD021567, 2014. a
Law, K. S., Stohl, A., Quinn, P. K., Brock, C. A., Burkhart, J. F., Paris, J.-D., Ancellet, G., Singh, H. B., Roiger, A., Schlager, H., Dibb, J., Jacob, D. J., Arnold, S. R., Pelon, J., and Thomas, J. L.: Arctic Air Pollution: New Insights from POLARCAT-IPY, B. Am. Meteorol. Soc., 95, 1873–1895, https://doi.org/10.1175/BAMS-D-13-00017.1, 2014. a
Li, G., Wieder, J., Pasquier, J. T., Henneberger, J., and Kanji, Z. A.: Predicting atmospheric background number concentration of ice-nucleating particles in the Arctic, Atmos. Chem. Phys., 22, 14441–14454, https://doi.org/10.5194/acp-22-14441-2022, 2022. a, b
Mamouri, R.-E. and Ansmann, A.: Potential of polarization lidar to provide profiles of CCN- and INP-relevant aerosol parameters, Atmos. Chem. Phys., 16, 5905–5931, https://doi.org/10.5194/acp-16-5905-2016, 2016. a, b, c, d, e, f
Mamouri, R.-E. and Ansmann, A.: Potential of polarization/Raman lidar to separate fine dust, coarse dust, maritime, and anthropogenic aerosol profiles, Atmos. Meas. Tech., 10, 3403–3427, https://doi.org/10.5194/amt-10-3403-2017, 2017. a, b, c
Mamouri, R.-E., Ansmann, A., Ohneiser, K., Knopf, D. A., Nisantzi, A., Bühl, J., Engelmann, R., Skupin, A., Seifert, P., Baars, H., Ene, D., Wandinger, U., and Hadjimitsis, D.: Wildfire smoke triggers cirrus formation: Lidar observations over the Eastern Mediterranean (Cyprus), EGUsphere [preprint], https://doi.org/10.5194/egusphere-2023-988, 2023. a
Marinou, E., Tesche, M., Nenes, A., Ansmann, A., Schrod, J., Mamali, D., Tsekeri, A., Pikridas, M., Baars, H., Engelmann, R., Voudouri, K.-A., Solomos, S., Sciare, J., Groß, S., Ewald, F., and Amiridis, V.: Retrieval of ice-nucleating particle concentrations from lidar observations and comparison with UAV in situ measurements, Atmos. Chem. Phys., 19, 11315–11342, https://doi.org/10.5194/acp-19-11315-2019, 2019. a
Martinsson, B. G., Friberg, J., Sandvik, O. S., Hermann, M., van Velthoven, P. F. J., and Zahn, A.: Formation and composition of the UTLS aerosol, npj Clim. Atmos. Sci., 2, 40, https://doi.org/10.1038/s41612-019-0097-1, 2019. a
Mason, S. L., Hogan, R. J., Bozzo, A., and Pounder, N. L.: A unified synergistic retrieval of clouds, aerosols, and precipitation from EarthCARE: the ACM-CAP product, Atmos. Meas. Tech., 16, 3459–3486, https://doi.org/10.5194/amt-16-3459-2023, 2023. a
Mattis, I., Ansmann, A., Müller, D., Wandinger, U., and Althausen, D.: Multiyear aerosol observations with dual-wavelength Raman lidar in the framework of EARLINET, J. Geophys. Res.-Atmos., 109, D13203, https://doi.org/10.1029/2004JD004600, 2004. a
Maturilli, M., Holdridge, D. J., Dahlke, S., Graeser, J., Sommerfeld, A., Jaiser, R., Deckelmann, H., and Schulz, A.: Initial radiosonde data from 2019-10 to 2020-09 during project MOSAiC, PANGAEA [data set], https://doi.org/10.1594/PANGAEA.928656, 2021. a, b, c
Möhler, O., Benz, S., Saathoff, H., Schnaiter, M., Wagner, R., Schneider, J., Walter, S., Ebert, V., and Wagner, S.: The effect of organic coating on the heterogeneous ice nucleation efficiency of mineral dust aerosols, Environ. Res. Lett., 3, 1–8, https://doi.org/10.1088/1748-9326/3/2/025007, 2008. a
Murray, B. J., Wilson, T. W., Dobbie, S., and Cui, Z.: Heterogeneous nucleation of ice particles on glassy aerosols under cirrus conditions, Nat. Geosci., 3, 233–237, https://doi.org/10.1038/ngeo817, 2010. a, b
Nixdorf, U., Dethloff, K., Rex, M., Shupe, M., Sommerfeld, A., Perovich, D., Nicolaus, M., Heuzé, C., Rabe, B., Loose, B., Damm, E., Gradinger, R., Fong., A, Maslowski, W., Rinke, A., Kwok, R., Spreen, G., Wendisch, M., Herber, A., Hirsekorn, M., Mohaupt, V., Frickenhaus, S., Immerz, A., Weiss-Tuider, K., König, B., Mengedoht, D., Regnery, J., Gerchow, P., Ransby, D., Krumpen, T., Morgenstern, A., Haas, C., Kanzow, T., Rack, F. R., Saitzev, V., Sokolov, V., Makarov, A., Schwarze, S., Wunderlich, T., Wurr, K., and Boetius, A.: MOSAiC extended acknowledgement, Zenodo, https://doi.org/10.5281/zenodo.5179738, 2021. a
Ohneiser, K., Ansmann, A., Baars, H., Seifert, P., Barja, B., Jimenez, C., Radenz, M., Teisseire, A., Floutsi, A., Haarig, M., Foth, A., Chudnovsky, A., Engelmann, R., Zamorano, F., Bühl, J., and Wandinger, U.: Smoke of extreme Australian bushfires observed in the stratosphere over Punta Arenas, Chile, in January 2020: optical thickness, lidar ratios, and depolarization ratios at 355 and 532 nm, Atmos. Chem. Phys., 20, 8003–8015, https://doi.org/10.5194/acp-20-8003-2020, 2020. a
Ohneiser, K., Ansmann, A., Chudnovsky, A., Engelmann, R., Ritter, C., Veselovskii, I., Baars, H., Gebauer, H., Griesche, H., Radenz, M., Hofer, J., Althausen, D., Dahlke, S., and Maturilli, M.: The unexpected smoke layer in the High Arctic winter stratosphere during MOSAiC 2019–2020, Atmos. Chem. Phys., 21, 15783–15808, https://doi.org/10.5194/acp-21-15783-2021, 2021a. a, b, c, d, e, f, g, h, i, j, k, l, m, n
Ohneiser, K., Ansmann, A., Engelmann, R., Griesche, H., Radenz, M., Hofer, J., and Althausen, D.: Optical aerosol profiles from the Raman Lidar Polly-XT during MOSAiC, PANGAEA [data set], https://doi.org/10.1594/PANGAEA.935539, 2021b. a
Ohneiser, K., Ansmann, A., Kaifler, B., Chudnovsky, A., Barja, B., Knopf, D. A., Kaifler, N., Baars, H., Seifert, P., Villanueva, D., Jimenez, C., Radenz, M., Engelmann, R., Veselovskii, I., and Zamorano, F.: Australian wildfire smoke in the stratosphere: the decay phase in 2020/2021 and impact on ozone depletion, Atmos. Chem. Phys., 22, 7417–7442, https://doi.org/10.5194/acp-22-7417-2022, 2022. a
Ohneiser, K., Ansmann, A., Witthuhn, J., Deneke, H., Chudnovsky, A., Walter, G., and Senf, F.: Self-lofting of wildfire smoke in the troposphere and stratosphere: simulations and space lidar observations, Atmos. Chem. Phys., 23, 2901–2925, https://doi.org/10.5194/acp-23-2901-2023, 2023. a
O'Sullivan, D., Murray, B. J., Malkin, T. L., Whale, T. F., Umo, N. S., Atkinson, J. D., Price, H. C., Baustian, K. J., Browse, J., and Webb, M. E.: Ice nucleation by fertile soil dusts: relative importance of mineral and biogenic components, Atmos. Chem. Phys., 14, 1853–1867, https://doi.org/10.5194/acp-14-1853-2014, 2014. a
Peng, S., Yang, Q., Shupe, M. D., Xi, X., Han, B., Chen, D., Dahlke, S., and Liu, C.: The characteristics of atmospheric boundary layer height over the Arctic Ocean during MOSAiC, Atmos. Chem. Phys., 23, 8683–8703, https://doi.org/10.5194/acp-23-8683-2023, 2023. a
Polly: PollyNET lidar database, https://polly.tropos.de/ (last access: 10 December 2022), 2022. a, b
Radenz, M., Seifert, P., Baars, H., Floutsi, A. A., Yin, Z., and Bühl, J.: Automated time–height-resolved air mass source attribution for profiling remote sensing applications, Atmos. Chem. Phys., 21, 3015–3033, https://doi.org/10.5194/acp-21-3015-2021, 2021. a, b, c
Ramelli, F., Henneberger, J., David, R. O., Bühl, J., Radenz, M., Seifert, P., Wieder, J., Lauber, A., Pasquier, J. T., Engelmann, R., Mignani, C., Hervo, M., and Lohmann, U.: Microphysical investigation of the seeder and feeder region of an Alpine mixed-phase cloud, Atmos. Chem. Phys., 21, 6681–6706, https://doi.org/10.5194/acp-21-6681-2021, 2021. a
Rex, M., Shupe, M., Heuzé, C., Nicolaus, M., Gradinger, R., Damm, E., Spreen, G., Rinke, A., Maslowski, W., Shepson, P., Courville, Z., Savarino, J., MingXi Yang, M., Ackley, S., Tremblay, J.-E., Timmermans, M.-L., and Miller, L. (Eds.): The Multidisciplinary Drifting Observatory for the Study of Arctic Climate (MOSAiC), Elementa: Science of the Anthropocene, https://online.ucpress.edu/elementa/pages/mosaic (last access: 3 June 2022), 2022. a
Rigg, Y. J., Alpert, P. A., and Knopf, D. A.: Immersion freezing of water and aqueous ammonium sulfate droplets initiated by humic-like substances as a function of water activity, Atmos. Chem. Phys., 13, 6603–6622, https://doi.org/10.5194/acp-13-6603-2013, 2013. a
Rinke, A., Cassano, J. J., Cassano, E. N., Jaiser, R., and Handorf, D.: Meteorological conditions during the MOSAiC expedition: Normal or anomalous?, Elementa: Science of the Anthropocene, 9, 00023, https://doi.org/10.1525/elementa.2021.00023, 2021. a
Ritter, C., Neuber, R., Schulz, A., Markowicz, K., Stachlewska, I., Lisok, J., Makuch, P., Pakszys, P., Markuszewski, P., Rozwadowska, A., Petelski, T., Zielinski, T., Becagli, S., Traversi, R., Udisti, R., and Gausa, M.: 2014 iAREA campaign on aerosol in Spitsbergen – Part 2: Optical properties from Raman-lidar and in-situ observations at Ny-Ålesund, Atmos. Environ., 141, 1–19, https://doi.org/10.1016/j.atmosenv.2016.05.053, 2016. a
Rolph, G., Stein, A., and Stunder, B.: Real-time Environmental Applications and Display sYstem: READY, Environ. Modell. Softw., 95, 210–228, https://doi.org/10.1016/j.envsoft.2017.06.025, 2017. a
Schmale, J., Zieger, P., and Ekman, A.: Aerosols in current and future Arctic climate, Nat. Clim. Change, 11, 95–105, https://doi.org/10.1038/s41558-020-00969-5, 2021. a
Schmale, J., Sharma, S., Decesari, S., Pernov, J., Massling, A., Hansson, H.-C., von Salzen, K., Skov, H., Andrews, E., Quinn, P. K., Upchurch, L. M., Eleftheriadis, K., Traversi, R., Gilardoni, S., Mazzola, M., Laing, J., and Hopke, P.: Pan-Arctic seasonal cycles and long-term trends of aerosol properties from 10 observatories, Atmos. Chem. Phys., 22, 3067–3096, https://doi.org/10.5194/acp-22-3067-2022, 2022. a
Shupe, M. D., Walden, V. P., Eloranta, E., Uttal, T., Campbell, J. R., Starkweather, S. M., and Shiobara, M.: Clouds at Arctic Atmospheric Observatories. Part I: Occurrence and Macrophysical Properties, J. Appl. Meteorol. Clim., 50, 626–644, https://doi.org/10.1175/2010jamc2467.1, 2011. a
Shupe, M. D., Rex, M., Blomquist, B., Ola, P., Persson, G., Schmale, J., Uttal, T., Althausen, D., Angot, H., Archer, S., Bariteau, L., Beck, I., Bilberry, J., Bucci, S., Buck, C., Boyer, M., Brasseur, Z., Brooks, I. M., Calmer, R., Cassano, J., Castro, V., Chu, D., Costa, D., Cox, C. J., Creamean, J., Crewell, S., Dahlke, S., Damm, E., de Boer, G., Deckelmann, H., Dethloff, K., Dütsch, M., Ebell, K., Ehrlich, A., Ellis, J., Engelmann, R., Fong, A. A., Frey, M. M., Gallagher, M. R., Ganzeveld, L., Gradinger, R., Graeser, J., Greenamyer, V., Griesche, H., Griffiths, S., Hamilton, J., Heinemann, G., Helmig, D., Herber, A., Heuzé, C., Hofer, J., Houchens, T., Howard, D., Inoue, J., Jacobi, H.-W., Jaiser, R., Jokinen, T., Jourdan, O., Jozef, G., King, W., Kirchgaessner, A., Klingebiel, M., Krassovski, M., Krumpen, T., Lampert, A., Landing, W., Laurila, T., Lawrence, D., Lonardi, M., Loose, B., Lüpkes, C., Maahn, M., Macke, A., Maslowski, W., Marsay, C., Maturilli, M., Mech, M., Morris, S., Moser, M., Nicolaus, M., Ortega, P., Osborn, J., Pätzold, F., Perovich, D. K., Petäjä, T., Pilz, C., Pirazzini, R., Posman, K., Powers, H., Pratt, K. A., Preußer, A., Quéléver, L., Radenz, M., Rabe, B., Rinke, A., Sachs, T., Schulz, A., Siebert, H., Silva, T., Solomon, A., Sommerfeld, A., Spreen, G., Stephens, M., Stohl, A., Svensson, G., Uin, J., Viegas, J., Voigt, C., von der Gathen, P., Wehner, B., Welker, J. M., Wendisch, M., Werner, M., Xie, Z., and Yue, F.: Overview of the MOSAiC expedition: Atmosphere, Elementa: Science of the Anthropocene, 10, 00060, https://doi.org/10.1525/elementa.2021.00060, 2022. a, b, c
Si, M., Evoy, E., Yun, J., Xi, Y., Hanna, S. J., Chivulescu, A., Rawlings, K., Veber, D., Platt, A., Kunkel, D., Hoor, P., Sharma, S., Leaitch, W. R., and Bertram, A. K.: Concentrations, composition, and sources of ice-nucleating particles in the Canadian High Arctic during spring 2016, Atmos. Chem. Phys., 19, 3007–3024, https://doi.org/10.5194/acp-19-3007-2019, 2019. a
Skupin, A., Ansmann, A., Engelmann, R., Seifert, P., and Müller, T.: Four-year long-path monitoring of ambient aerosol extinction at a central European urban site: dependence on relative humidity, Atmos. Chem. Phys., 16, 1863–1876, https://doi.org/10.5194/acp-16-1863-2016, 2016. a
Smirnov, A., Holben, B. N., Slutsker, I., Giles, D. M., McClain, C. R., Eck, T. F., Sakerin, S. M., Macke, A., Croot, P., Zibordi, G., Quinn, P. K., Sciare, J., Kinne, S., Harvey, M., Smyth, T. J., Piketh, S., Zielinski, T., Proshutinsky, A., Goes, J. I., Nelson, N. B., Larouche, P., Radionov, V. F., Goloub, P., Krishna Moorthy, K., Matarrese, R., Robertson, E. J., and Jourdin, F.: Maritime Aerosol Network as a component of Aerosol Robotic Network, J. Geophys. Res.-Atmos., 114, D06204, https://doi.org/10.1029/2008JD011257, 2009. a
Spichtinger, P. and Cziczo, D. J.: Impact of heterogeneous ice nuclei on homogeneous freezing events in cirrus clouds, J. Geophys. Res.-Atmos., 115, D14208, https://doi.org/10.1029/2009JD012168, 2010. a
Spichtinger, P., Gierens, K., and Dörnbrack, A.: Formation of ice supersaturation by mesoscale gravity waves, Atmos. Chem. Phys., 5, 1243–1255, https://doi.org/10.5194/acp-5-1243-2005, 2005. a
Stein, A. F., Draxler, R. R., Rolph, G. D., Stunder, B. J. B., Cohen, M. D., and Ngan, F.: NOAA's HYSPLIT Atmospheric Transport and Dispersion Modeling System, B. Am. Meteorol. Soc., 96, 2059–2077, https://doi.org/10.1175/BAMS-D-14-00110.1, 2015. a
Stephens, G., Vane, D., Boain, R., Mace, G., Sassen, K., Wang, Z., Illingworth, A., O'Connor, E., Rossow, W., Durden, S., Miller, S., Austin, R., Benedetti, A., and Mitrescu, C.: The CloudSat mission and the A-Train, B. Am. Meteorol. Soc., 83, 1771–1790, https://doi.org/10.1175/BAMS-83-12-1771, 2002. a
Stohl, A.: Characteristics of atmospheric transport into the Arctic troposphere, J. Geophys. Res.-Atmos., 111, D11306, https://doi.org/10.1029/2005JD006888, 2006. a, b
Sze, K. C. H., Wex, H., Hartmann, M., Skov, H., Massling, A., Villanueva, D., and Stratmann, F.: Ice-nucleating particles in northern Greenland: annual cycles, biological contribution and parameterizations, Atmos. Chem. Phys., 23, 4741–4761, https://doi.org/10.5194/acp-23-4741-2023, 2023. a, b
Tatzelt, C., Henning, S., Welti, A., Baccarini, A., Hartmann, M., Gysel-Beer, M., van Pinxteren, M., Modini, R. L., Schmale, J., and Stratmann, F.: Circum-Antarctic abundance and properties of CCN and INPs, Atmos. Chem. Phys., 22, 9721–9745, https://doi.org/10.5194/acp-22-9721-2022, 2022. a, b
Tobo, Y., DeMott, P. J., Hill, T. C. J., Prenni, A. J., Swoboda-Colberg, N. G., Franc, G. D., and Kreidenweis, S. M.: Organic matter matters for ice nuclei of agricultural soil origin, Atmos. Chem. Phys., 14, 8521–8531, https://doi.org/10.5194/acp-14-8521-2014, 2014. a
Tobo, Y., Adachi, K., DeMott, P. J., Hill, T. C. J., Hamilton, D. S., Mahowald, N. M., Nagatsuka, N., Ohata, S., Uetake, J., Kondo, Y., and Koike, M.: Glacially sourced dust as a potentially significant source of ice nucleating particles, Nat. Geosci., 12, 253–258, https://doi.org/10.1038/s41561-019-0314-x, 2019. a
Tomasi, C., Lupi, A., Mazzola, M., Stone, R. S., Dutton, E. G., Herber, A., Radionov, V. F., Holben, B. N., Sorokin, M. G., Sakerin, S. M., Terpugova, S. A., Sobolewski, P. S., Lanconelli, C., Petkov, B. H., Busetto, M., and Vitale, V.: An update on polar aerosol optical properties using POLAR-AOD and other measurements performed during the International Polar Year, Atmos. Environ., 52, 29–47, https://doi.org/10.1016/j.atmosenv.2012.02.055, 2012. a, b
Tomasi, C., Kokhanovsky, A. A., Lupi, A., Ritter, C., Smirnov, A., O'Neill, N. T., Stone, R. S., Holben, B. N., Nyeki, S., Wehrli, C., Stohl, A., Mazzola, M., Lanconelli, C., Vitale, V., Stebel, K., Aaltonen, V., de Leeuw, G., Rodriguez, E., Herber, A. B., Radionov, V. F., Zielinski, T., Petelski, T., Sakerin, S. M., Kabanov, D. M., Xue, Y., Mei, L., Istomina, L., Wagener, R., McArthur, B., Sobolewski, P. S., Kivi, R., Courcoux, Y., Larouche, P., Broccardo, S., and Piketh, S. J.: Aerosol remote sensing in polar regions, Earth-Sci. Rev., 140, 108–157, https://doi.org/10.1016/j.earscirev.2014.11.001, 2015. a, b
Torres, O., Jethva, H., Ahn, C., Jaross, G., and Loyola, D. G.: TROPOMI aerosol products: evaluation and observations of synoptic-scale carbonaceous aerosol plumes during 2018–2020, Atmos. Meas. Tech., 13, 6789–6806, https://doi.org/10.5194/amt-13-6789-2020, 2020. a
Toth, T. D., Campbell, J. R., Reid, J. S., Tackett, J. L., Vaughan, M. A., Zhang, J., and Marquis, J. W.: Minimum aerosol layer detection sensitivities and their subsequent impacts on aerosol optical thickness retrievals in CALIPSO level 2 data products, Atmos. Meas. Tech., 11, 499–514, https://doi.org/10.5194/amt-11-499-2018, 2018. a
Ullrich, R., Hoose, C., Möhler, O., Niemand, M., Wagner, R., Höhler, K., Hiranuma, N., Saathoff, H., and Leisner, T.: A New Ice Nucleation Active Site Parameterization for Desert Dust and Soot, J. Atmos. Sci., 74, 699–717, https://doi.org/10.1175/JAS-D-16-0074.1, 2017. a
Wang, B. and Knopf, D. A.: Heterogeneous ice nucleation on particles composed of humic‐like substances impacted by O3, J. Geophys. Res.-Atmos., 116, D03205, https://doi.org/10.1029/2010JD014964, 2011. a, b, c, d, e
Wang, B., Lambe, A. T., Massoli, P., Onasch, T. B., Davidovits, P., Worsnop, D. R., and Knopf, D. A.: The deposition ice nucleation and immersion freezing potential of amorphous secondary organic aerosol: Pathways for ice and mixed-phase cloud formation, J. Geophys. Res.-Atmos., 117, D16209, https://doi.org/10.1029/2012JD018063, 2012. a, b, c
Wang, Q., Jacob, D. J., Fisher, J. A., Mao, J., Leibensperger, E. M., Carouge, C. C., Le Sager, P., Kondo, Y., Jimenez, J. L., Cubison, M. J., and Doherty, S. J.: Sources of carbonaceous aerosols and deposited black carbon in the Arctic in winter-spring: implications for radiative forcing, Atmos. Chem. Phys., 11, 12453–12473, https://doi.org/10.5194/acp-11-12453-2011, 2011. a
Westbrook, C. D. and Illingworth, A. J.: Evidence that ice forms primarily in supercooled liquid clouds at temperatures >−27 ∘C, Geophys. Res. Lett., 38, L14808, https://doi.org/10.1029/2011GL048021, 2011. a
Wex, H., DeMott, P. J., Tobo, Y., Hartmann, S., Rösch, M., Clauss, T., Tomsche, L., Niedermeier, D., and Stratmann, F.: Kaolinite particles as ice nuclei: learning from the use of different kaolinite samples and different coatings, Atmos. Chem. Phys., 14, 5529–5546, https://doi.org/10.5194/acp-14-5529-2014, 2014. a, b, c, d
Wex, H., Huang, L., Zhang, W., Hung, H., Traversi, R., Becagli, S., Sheesley, R. J., Moffett, C. E., Barrett, T. E., Bossi, R., Skov, H., Hünerbein, A., Lubitz, J., Löffler, M., Linke, O., Hartmann, M., Herenz, P., and Stratmann, F.: Annual variability of ice-nucleating particle concentrations at different Arctic locations, Atmos. Chem. Phys., 19, 5293–5311, https://doi.org/10.5194/acp-19-5293-2019, 2019. a, b, c
Willis, M. D., Leaitch, W. R., and Abbatt, J. P.: Processes controlling the composition and abundance of Arctic aerosol, Rev. Geophys., 56, 621–671, https://doi.org/10.1029/2018RG000602, 2018. a, b, c, d, e
Willis, M. D., Bozem, H., Kunkel, D., Lee, A. K. Y., Schulz, H., Burkart, J., Aliabadi, A. A., Herber, A. B., Leaitch, W. R., and Abbatt, J. P. D.: Aircraft-based measurements of High Arctic springtime aerosol show evidence for vertically varying sources, transport and composition, Atmos. Chem. Phys., 19, 57–76, https://doi.org/10.5194/acp-19-57-2019, 2019. a, b
Winker, D. M., Vaughan, M. A., Omar, A., Hu, Y., Powell, K. A., Liu, Z., Hunt, W. H., and Young, S. A.: Overview of the CALIPSO mission and CALIOP data processing algorithms, J. Atmos. Ocean. Tech., 26, 2310–2323, https://doi.org/10.1175/2009JTECHA1281.1, 2009. a
Winker, D. M., Pelon, J., Coakley, J. A., Ackerman, S. A., Charlson, R. J., Colarco, P. R., Flamant, P. H., Fu, Q., Hoff, R. M., Kittaka, C., Kubar, T. L., Treut, H. L., McCormick, M. P., Mégie, G., Poole, L. R., Powell, K., Trepte, C. R., Vaughan, M. A., and Wielicki, B. A.: The CALIPSO mission: A global 3D view of aerosols and clouds, B. Am. Meteorol. Soc., 91, 1211–1229, 2010. a
Xian, P., Zhang, J., O'Neill, N. T., Toth, T. D., Sorenson, B., Colarco, P. R., Kipling, Z., Hyer, E. J., Campbell, J. R., Reid, J. S., and Ranjbar, K.: Arctic spring and summertime aerosol optical depth baseline from long-term observations and model reanalyses – Part 1: Climatology and trend, Atmos. Chem. Phys., 22, 9915–9947, https://doi.org/10.5194/acp-22-9915-2022, 2022a. a, b, c, d, e, f
Xian, P., Zhang, J., O'Neill, N. T., Reid, J. S., Toth, T. D., Sorenson, B., Hyer, E. J., Campbell, J. R., and Ranjbar, K.: Arctic spring and summertime aerosol optical depth baseline from long-term observations and model reanalyses – Part 2: Statistics of extreme AOD events, and implications for the impact of regional biomass burning processes, Atmos. Chem. Phys., 22, 9949–9967, https://doi.org/10.5194/acp-22-9949-2022, 2022b. a, b, c
Yang, Y., Zhao, C., Wang, Q., Cong, Z., Yang, X., and Fan, H.: Aerosol characteristics at the three poles of the Earth as characterized by Cloud–Aerosol Lidar and Infrared Pathfinder Satellite Observations, Atmos. Chem. Phys., 21, 4849–4868, https://doi.org/10.5194/acp-21-4849-2021, 2021. a, b, c, d, e, f, g
Yin, Z., Ansmann, A., Baars, H., Seifert, P., Engelmann, R., Radenz, M., Jimenez, C., Herzog, A., Ohneiser, K., Hanbuch, K., Blarel, L., Goloub, P., Dubois, G., Victori, S., and Maupin, F.: Aerosol measurements with a shipborne Sun–sky–lunar photometer and collocated multiwavelength Raman polarization lidar over the Atlantic Ocean, Atmos. Meas. Tech., 12, 5685–5698, https://doi.org/10.5194/amt-12-5685-2019, 2019. a
Yu, P., Toon, O. B., Bardeen, C. G., Zhu, Y., Rosenlof, K. H., Portmann, R. W., Thornberry, T. D., Gao, R.-S., Davis, S. M., Wolf, E. T., de Gouw, J., Peterson, D. A., Fromm, M. D., and Robock, A.: Black carbon lofts wildfire smoke high into the stratosphere to form a persistent plume, Science, 365, 587–590, https://doi.org/10.1126/science.aax1748, 2019. a
Zeppenfeld, S., van Pinxteren, M., Hartmann, M., Bracher, A., Stratmann, F., and Herrmann, H.: Glucose as a Potential Chemical Marker for Ice Nucleating Activity in Arctic Seawater and Melt Pond Samples, Environ. Sci. Technol., 53, 8747–8756, https://doi.org/10.1021/acs.est.9b01469, 2019. a
Zhao, X., Huang, K., Fu, J. S., and Abdullaev, S. F.: Long-range transport of Asian dust to the Arctic: identification of transport pathways, evolution of aerosol optical properties, and impact assessment on surface albedo changes, Atmos. Chem. Phys., 22, 10389–10407, https://doi.org/10.5194/acp-22-10389-2022, 2022. a, b
- Abstract
- Introduction
- MOSAiC instrumentation
- Lidar retrieval of microphysical aerosol properties, CCN, and INP number concentrations: the POLIPHON method
- Observations – part 1: aerosol layering and aerosol optical properties
- Observations – part 2: MOSAiC time series of cloud-relevant aerosol properties
- Summary
- Data availability
- Author contributions
- Competing interests
- Disclaimer
- Acknowledgements
- Financial support
- Review statement
- References