the Creative Commons Attribution 4.0 License.
the Creative Commons Attribution 4.0 License.
 | 10 Oct 2023
Occurrence frequency of subcritical Richardson numbers assessed by global high-resolution radiosonde and ERA5 reanalysis
Jia Shao
Jian Zhang
Wuke Wang
Shaodong Zhang
Tao Yu
Wenjun Dong
Kelvin–Helmholtz instability (KHI) is most likely to be the primary source for clear-air turbulence, which is of importance in pollution transfer and diffusion and aircraft safety. It is indicated by the critical value of the dimensionless Richardson (Ri) number, which is predicted to be from linear stability analysis. However, Ri is fairly sensitive to the vertical resolution of the dataset; a higher resolution systematically leads to a finer structure. The study aims to evaluate the performance of ERA5 reanalysis in determining the spatial–temporal variabilities in subcritical Ri by comparing it against a near-global high-resolution radiosonde dataset during the years 2017 to 2022 and further highlights the global climatology and dynamical environment of subcritical Ri. Overall, the occurrence frequency of is inevitably underestimated by the ERA5 reanalysis over all climate zones at all heights from the near-ground atmosphere up to 30 km, compared to radiosonde, due directly to the severe underestimation in wind shears. Otherwise, the occurrence frequency of Ri<1 in ERA5 is climatologically consistent with that from in radiosondes in the free troposphere, especially over the midlatitude and subtropics in the Northern Hemisphere and Southern Hemisphere. Therefore, we argue that the threshold value of Ri could be approximated as 1 rather than when using ERA5-based Ri as a proxy for KHI. The occurrence frequency of subcritical Ri revealed by both datasets exhibits significant seasonal cycles over all climate zones. In addition, it is positively correlated with the standard derivation of orography at low levels and is exceptionally strong over the Niño-3 region at heights of 6–13 km. Furthermore, a high occurrence of subcritical Ri would likely be accompanied by strong wind speeds and intensive orographic or non-orographic gravity waves.
- Article
(14303 KB) - Full-text XML
-
Supplement
(2230 KB) - BibTeX
- EndNote


Kelvin–Helmholtz instability (KHI) is a common phenomenon in the atmospheric boundary layer and the free atmosphere (Muschinski and Wode, 1998), and its wavelengths and depths span a wide range of scales throughout the atmosphere, varying from a few meters or less to tens of kilometers (Fritts et al., 2011). It contributes to vertical mixing of heat, momentum, and constituents, and it acts to limit the maximum shears, just to name a few (Fritts et al., 2011). KHI and gravity wave (GW) breaking are the most recognized instabilities in stably stratified flows (Fritts and Rastogi, 1985). KHI arises preferentially from micro- and mesoscale wind shear intensification, with the maximal occurrence frequency near synoptic-scale upper-level frontal zones near jet streams, with mountain waves, and above the tops of severe thunderstorms (North et al., 2014). Large wind shears are commonly associated with regions where stability changes rapidly (e.g., near the top of the boundary layer) and with the large wind gradient in jet streams (Grasmick and Geerts, 2020). In a changing climate, wind shears in the North Atlantic upper-level jet stream could be increased (Lee et al., 2019), which may increase clear-air turbulence at cruise altitudes. In turn, KHI can reduce wind shears and alter tracer gradients where turbulence and mixing are most intense (Fritts et al., 2022).
KHI influences depend on the spatial scales at which they lead to turbulence (Fritts et al., 2022). Turbulence is by far the most common cause of serious damage to aircraft (Williams and Joshi, 2013). Convective instability, shear instability, KHI, and GW breaking are known to be the major sources for turbulence (Sharman et al., 2012; Ko et al., 2019; Ko and Chun, 2022; Lazarus et al., 2021). KHI requires a sufficiently large Reynolds number and a Richardson (Ri) number sufficiently below to enable KHI formation and subsequent secondary instability leading to turbulence (Fritts et al., 2022). Ri is not a good guide to instability character in general, and does not assure flow stability for superpositions of mean and GW motions. Despite these caveats, does provide a reasonable guide to expected local KHI structure in cases where clear Kelvin–Helmholtz billows arise, according to the simulation in the mesosphere and lower-thermosphere region (Fritts et al., 2014). Values of Ri close to zero favor strong instability, deep billows, and relatively intense turbulence, whereas values of Ri closer to favor weak instability and shallow billows (Fritts et al., 2011). The Richardson number criterion can be applied as a turbulence diagnostic in numerical model outputs (e.g., Sharman and Pearson, 2017), and it has been used as such in climatological studies on the occurrence of clear-air turbulence (Jaeger and Sprenger, 2007). Kunkel et al. (2019) include a brief discussion on the capability of European Centre for Medium-Range Weather Forecasts (ECMWF) models based on case studies to resolve subcritical Richardson numbers and argue that the threshold value of Ri (Rit) taken as 1 might be a good proxy for observed KHI. A very recent study by Lee et al. (2023) also sets Rit from 0–1 in their climatology on the upper-troposphere and lower-stratosphere turbulence diagnostics. Moreover, Zhang et al. (2022b) show that over half of turbulence exists below Ri<1 when the environment is beneficial for the development of turbulence.
Turbulent mixing is of crucial importance to mass, energy, momentum transfer, the dispersion of pollutants, and stratosphere–troposphere exchange. In numerical models, turbulent dissipation rate, turbulent diffusivity, and other parameters representing turbulent mixing efficiency are the most basic parameters which need to be accurately parameterized to evaluate the impact of turbulence effect on matter and energy distribution (Gavrilov et al., 2005). However, due to the intermittent nature of turbulence, it is generally not resolved in (global) numerical weather prediction models, even at nowadays common or state-of-the-art horizontal resolutions of the order of tens of kilometers (Sandu et al., 2019), and it presents a challenge for both observation and numerical modeling (Sharman et al., 2012; Homeyer et al., 2014; Plougonven and Zhang, 2014). For this reason, the indices of turbulence, such as large wind shears, small Ri, and the negative squared Brunt–Väisälä frequency, could comprise a great tool to characterize turbulence (Jaeger and Sprenger, 2007).
The Richardson number is estimated by the finite differences across thin layers and is quite sensitive to the vertical resolution of measurements (Haack et al., 2014). Thus, a proper estimation of Ri requires a high-resolution measurement of temperature and wind speed. The near-globally distributed radiosonde site offers a unique opportunity to investigate the climatology of subcritical Ri occurrence frequency. An overview of subcritical Ri occurrence by using near-global high-resolution (10 m) radiosonde data was presented in Zhang et al. (2022b), and a close association between subcritical Ri occurrence frequency and turbulence fraction has been found. However, the global climatology characteristic of subcritical Ri remains most unclear, especially over oceans where the radiosonde network has a poor coverage.
By comparison, ERA5 global reanalysis can provide a seamless coverage of temperature and wind. It is the latest generation of the ECMWF atmospheric reanalysis and is based on the state-of-the-art Integrated Forecasting System (IFS) Cy41r2 (Hersbach et al., 2020; Gu et al., 2023). Its predecessor, ERA-Interim, was found in particular to have wind shear a factor of 2–3 lower than the measurement based on high-resolution radiosondes (Houchi et al., 2010). Moreover, results show that whatever the location and the geophysical conditions considered, biases between ERA-Interim and balloon wind measurements increase as a function of altitude (Duruisseau et al., 2017). Recent studies have suggested that the structure of and variability in the trade winds in the lower troposphere are reasonably reproduced in the ERA5 reanalysis based on the EUREC4A field campaign (Savazzi et al., 2022). However, a similar comparison between ERA5 and high-resolution radiosonde data across a near-global area has largely been undetermined. The proper estimation of wind shear and Brunt–Väisälä frequency is essential for the determination of Ri.
Thus, our objectives are as follows: (1) evaluate the performance of ERA5 at different heights and climate zones in estimating wind shear and small Richardson number occurrence frequencies, in comparison with a large high-resolution radiosonde dataset spanning the years from 2017 to 2022. (2) Based on the validation and comparison results, we pose the question of how to use ERA5 for subcritical Ri estimation. (3) Evaluate the global climatology of subcritical Ri occurrence based on versatile measurements and model products. (4) Evaluate the dynamic environment (GWs and mean flow) of subcritical Ri. To this end, this analysis is organized as follows. Section 2 shows the data and methods used. Section 3 represents the climatological variation in subcritical Ri and its comparison with radiosonde. Section 4 ends with a summary.
2.1 High-resolution radiosonde dataset
As described in Guo et al. (2021) and Zhang et al. (2022b), a high-vertical-resolution radiosonde (HVRRS) dataset gained from several organizations was adopted, spanning January 2017 to October 2022 over a total of 5.8 years. The organizations include the China Meteorological Administration (CMA), the US National Oceanic and Atmospheric Administration (NOAA), the Global Climate Observing System (GCOS) Reference Upper-Air Network (GRUAN), the Centre for Environmental Data Analysis of the United Kingdom (CEDA), the University of Wyoming, the Deutscher Wetterdienst, and ECMWF. In total, around 0.95 million radiosonde profiles from 434 radiosonde stations released at regular synoptic times of 00:00 and 12:00 UTC were collected to determine the value of Ri. These profiles were sampled at 0.5 or 1 Hz, corresponding to a vertical resolution of approximately 10 or 5 m. Thus, all the profiles were evenly interpreted to 10 m resolution in the vertical by applying a cubic spline interpolation. In addition, the sounding with the burst height lower than 10 km above ground level (a.g.l.) was directly discarded for further study. Meteorological variables, including temperature and wind speed, were prepared for the Ri estimation.
One of the shortages of radiosonde measurements is its inadequate concentration over the polar and ocean regions (Xia et al., 2021). The geographical distribution of the total profile number of each radiosonde station is demonstrated in Fig. S1 in the Supplement. The radiosoundings released over Europe, the United States, and Australia have good geographical coverages and time durations. Over some islands in oceans (e.g., the Pacific Ocean), there are dozens of stations that can provide high-resolution measurements. In the polar regions, there are around 30 stations.
2.2 ERA5 reanalysis and the collocation procedure
ERA5 is the latest version of ECMWF meteorological reanalysis, benefiting from a decade of developments in model physics, core dynamics, and data assimilation (Hersbach et al., 2020). The wind and temperature fields are modeled by the ERA5 reanalysis on a spatial resolution of 0.25∘ latitude–longitude and a temporal resolution of 1 h. The reanalysis has 137 model levels, giving a vertical resolution of approximately 300 m in the middle and upper troposphere. The vertical resolution of ERA5 is illustrated in Fig. S2 in the Supplement. Compared to ERA5, the HVRRS does not provide global seamless observations. Thus, the collocation procedure between reanalysis and the HVRRS goes as follows: (1) the matched grid of ERA5 reanalysis is the nearest neighbor of the radiosonde station; (2) the regular synoptic start time of the radiosonde and reanalysis needs to be kept exactly the same; (3) the model level of reanalysis that follows a hybrid sigma–pressure coordinate is converted into geopotential height to match the HVRRS.
In addition, the standard deviations of orography (SDORs) and the gravity wave dissipation due to the effects of stress associated with unresolved valleys, hills, and mountains in ERA5 reanalysis are extracted.
The relative error between HVRRS-based and ERA5-based quantities is estimated by the ratio of deviations between HVRRS- and ERA5-derived quantities to the HVRRS one.
2.3 The occurrence frequency of subcritical Ri and its uncertainty
Based on a linear theory, the threshold Ri (Rit) defines the boundary where the airflow changes from stability to turbulence, and it is usually suggested to be (Haack et al., 2014). Ri is formulated as
where N is the Brunt–Väisälä frequency (), S is the vertical shear of horizontal wind (), and the overbar denotes a moving average in a 200 m bin to eliminate the influence of measurement noises and small-scale fluctuations such as turbulence and small-scale waves. Therefore, the wind shear and Brunt–Väisälä frequency are computed at 10 m resolution, and then those estimates are averaged over 200 m (20 points) and squared. More exactly, the averaged parameter at altitude i can be represented as , where A denotes wind shear or Brunt–Väisälä frequency and n is the number of vertical bins. In addition, horizontal winds measured under radiosonde at the scale of a few tens of meters are affected by the chaotic movements of the gondola due to the pendulum and to the balloon's own movements (Ingleby et al., 2022). However, it is hard to quantify those movements in the present study.
The Richardson number calculated from Eq. (1) depends on the vertical resolution of the underlying data, as well as on the averaging interval. Ultimately, this influences the estimated occurrence frequency for subcritical Richardson numbers as a proxy for KHI. We resample the HVRRS data to 50 and 100 m and range the length scale of the overbar from 100 to 500 m to diagnose the uncertainties raised by the length scale of segments and the vertical resolution of the dataset. As indicated in Fig. 1, at the same length scale of the overbar, a sparser vertical grid inevitably leads to a lower occurrence frequency of subcritical Ri. For instance, at the length scale set to 100 m, the occurrence frequency of at 0–2 km above sea level (a.s.l.) decreases from 22 % when vertical resolution is equal to 10 m to 16 % for a vertical resolution of 50 m. Moreover, a longer length scale of the segment generally yields a smaller occurrence frequency. For example, when the vertical resolution of the radiosonde is equal to 10 m, the occurrence frequency at 10–15 km a.s.l. decreases from 9 % when the length scale of segment equals 100 m to 1 % when it equals 500 m. It is interesting to note that the occurrence frequency with a vertical resolution of 50 m and a segment interval of 100 m is a bit larger than that with a vertical resolution of 10 m and a segment of 200 m, possibly implying that a shorter segment interval could be expected for a sparser vertical resolution.
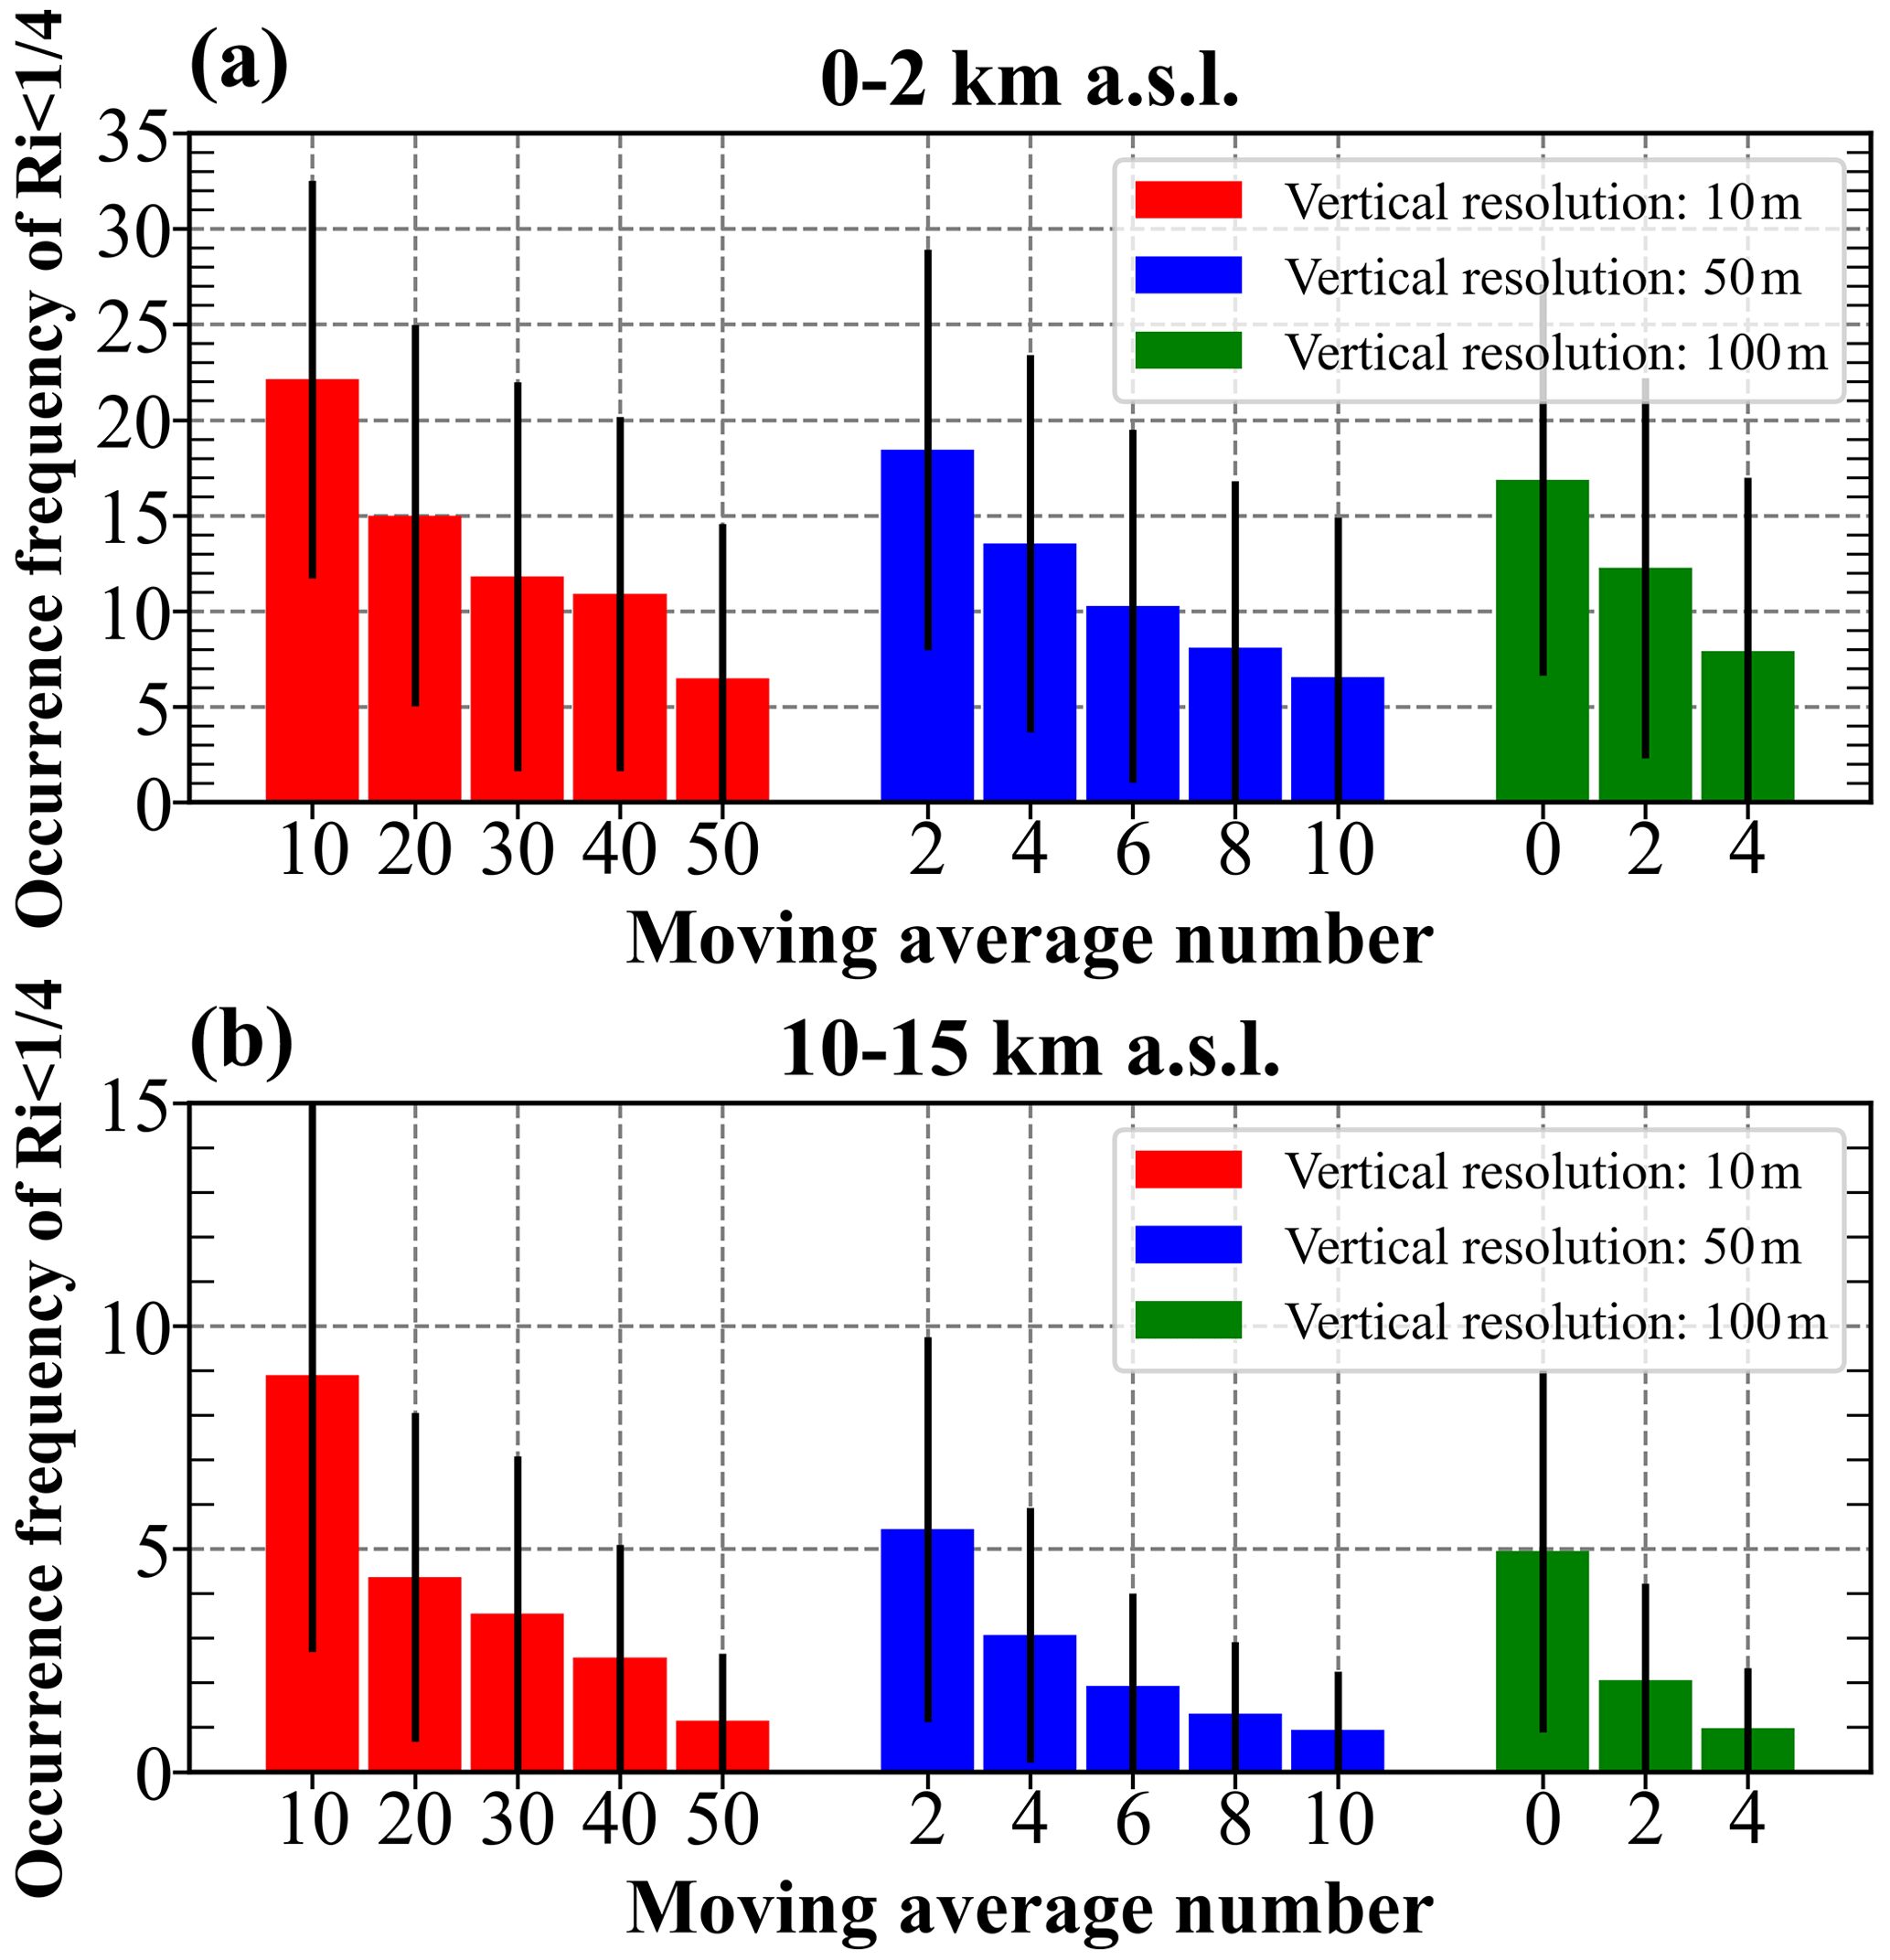
Figure 1The averaged occurrence frequencies of at heights of 0–2 (a) and 10–15 km a.s.l. (b), with vertical resolutions ranging from 10 to 100 m and moving-point numbers increasing from 0 to 50. The error bars correspond to the standard deviation. The metrics are counted based on all radiosonde profiles during the years 2017–2022.
2.4 Gravity wave energy
The GW energy is extracted based on the broad spectral method, according to Wang and Geller (2003). In this method, zonal wind (u), meridional wind (v), and temperature (T) consist of background states (u0, v0, and T0) that are determined by applying a second-order polynomial fit (Zhang et al., 2022a) and perturbations. Therefore, total perturbations are derived as
The perturbations include measurement noises, Kelvin–Helmholtz waves, GWs, and planetary waves. Only the perturbations with vertical wavelengths of 0.3–6.9 km are considered GWs (Wang and Geller, 2003). The mean vertical wavelength of GWs is about 2 km (Wang et al., 2005), and therefore, the lowermost threshold of 0.3 km could have limited influence on the GW energy. However, the retrieval of the largest wavelength is not well determined, which is acknowledged as the radiosonde's “observational filter” (Alexander, 1998). By applying this band-pass filter, the average gravity wave kinetic energy per unit mass (energy density) and the average potential energy density can be expressed as
where g is the gravitational constant; is the normalized temperature perturbation; and the overbar indicates an averaging over the tropospheric segment, which is chosen as 2–8.9 km for all regions expect the polar region and is selected as 2–7.4 km in the polar region (Wang and Geller, 2003). Eventually, the total GW energy Et is the sum of Ek and Ep.
3.1 Comparisons of wind shear between HVRRS and ERA5 reanalysis
The variations in vertical shear of horizontal wind speed and the squared Brunt–Väisälä frequency entirely determine the Ri magnitude. Figure 2 provides an overview of the spatial distribution of wind shear at heights of 0–2 and 10–15 km a.g.l. obtained from the HVRRS and ERA5 reanalysis. HVRRS-based wind shears are taken from Eq. (1), with a vertical resolution of 10 m. The ERA5-derived shear at heights of 0–2 km a.g.l. demonstrates a strong spatial variation, and it is clearly dependent on underlying terrains and latitudes (Fig. 2a). For example, large values can most likely be observed along the coastline, which could be attributed to the prevailing sea-breeze circulation. As compared to the HVRRS, these shears are slightly underestimated by 3.30 , based on all sounding measurements (Fig. 2b). Nevertheless, a close association between averaged ERA5-retrieved shears and HVRRS-determined shears can be noticed in terms of geospatial distribution, with a correlation coefficient of 0.48 (Fig. 2b).
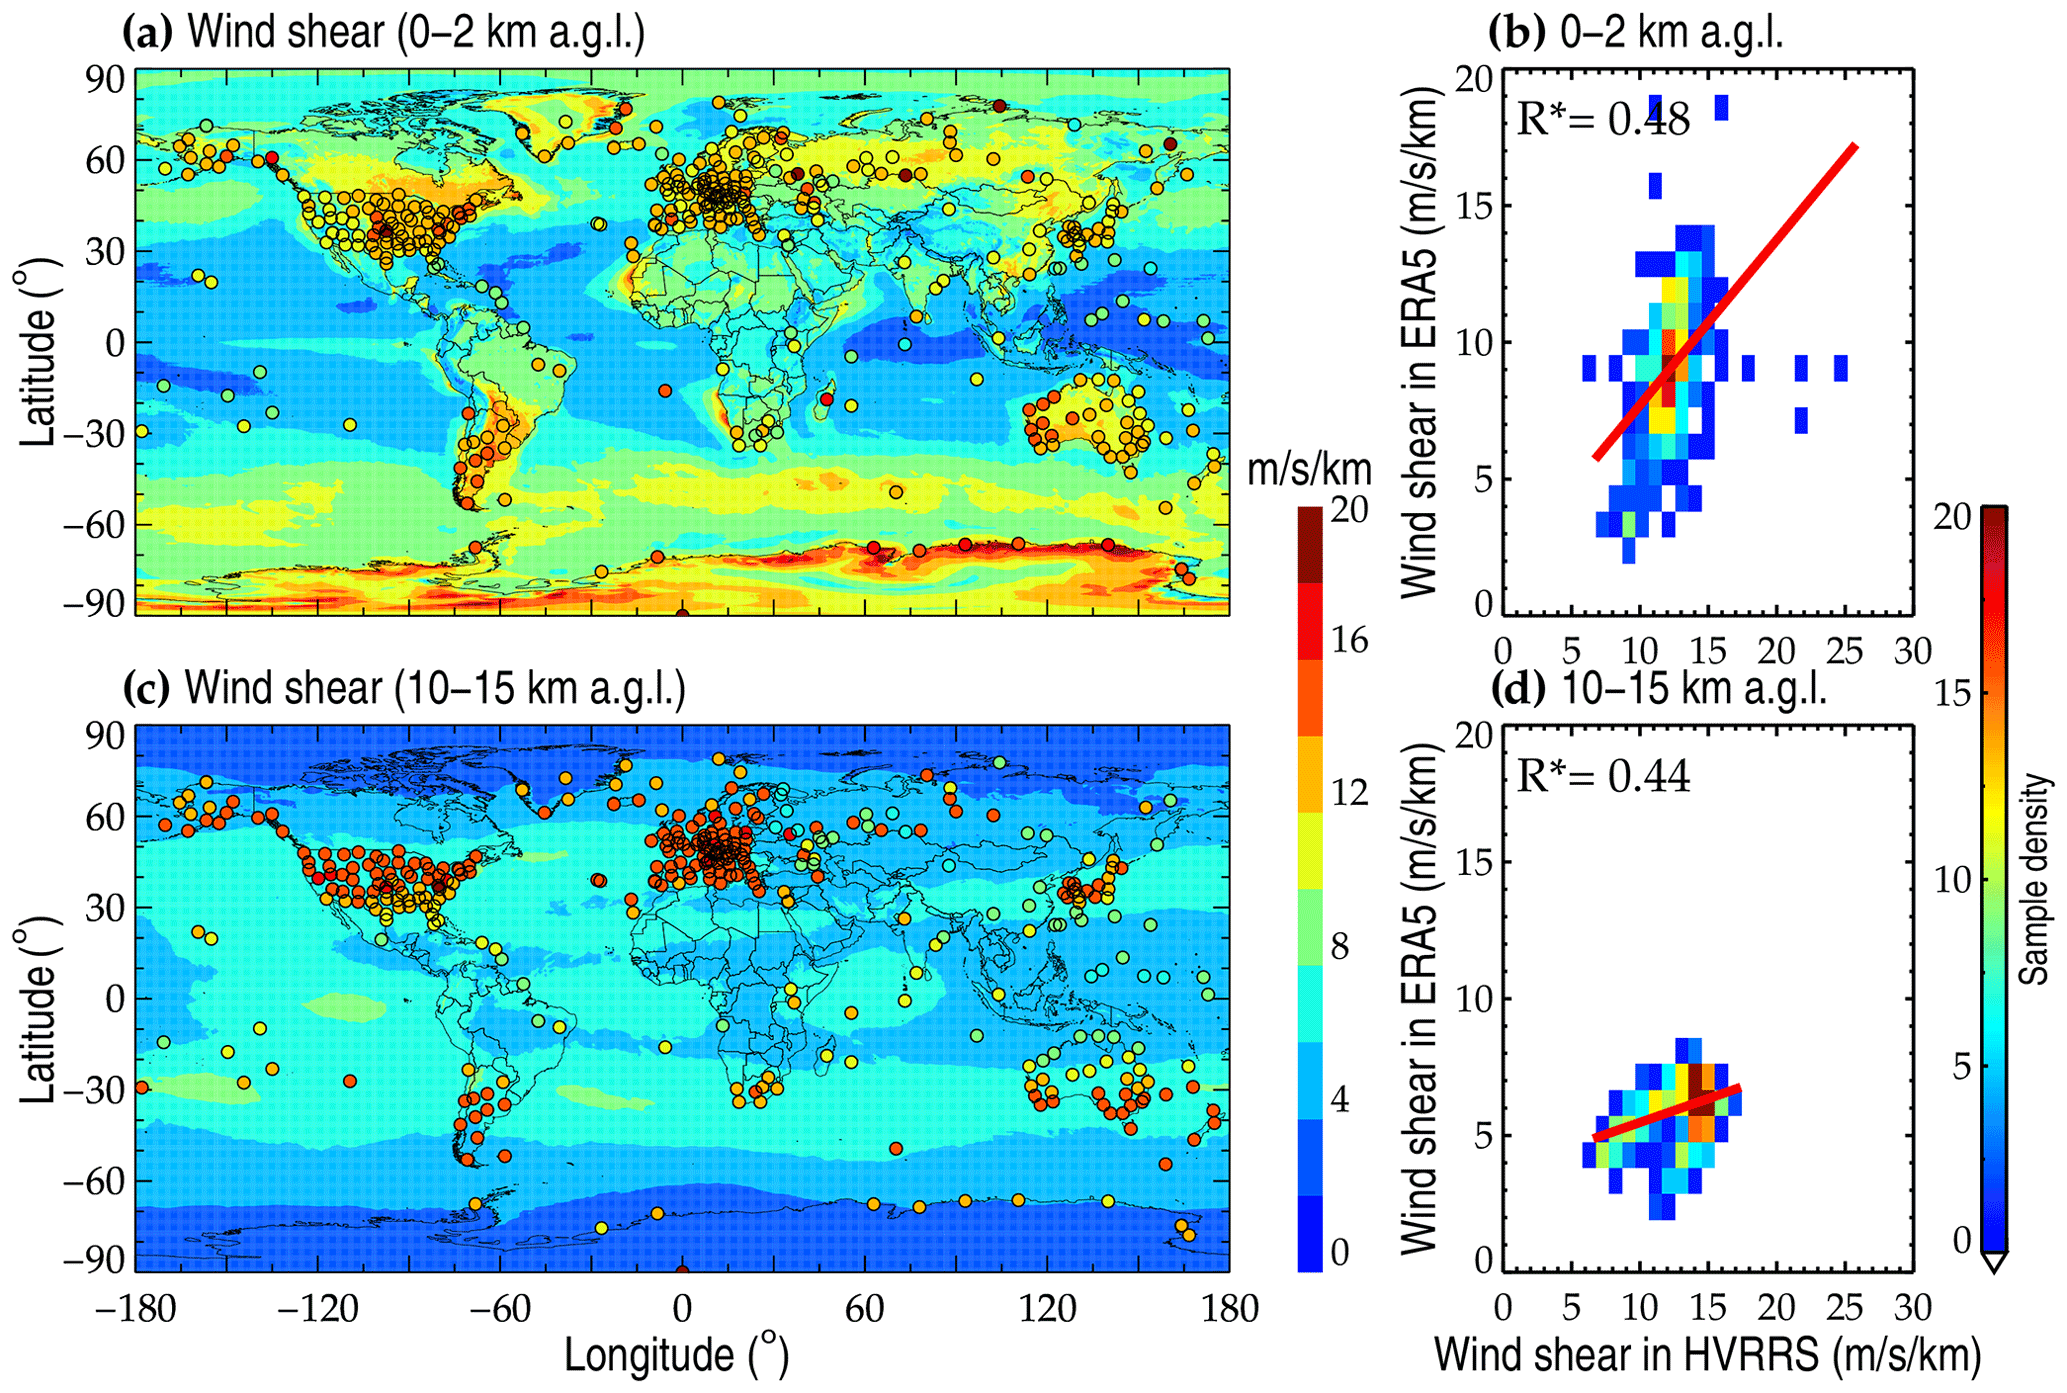
Figure 2The spatial distribution of mean wind shear in ERA5 reanalysis at heights of 0–2 (a) and 10–15 km a.g.l. (c). The overlaid colored circles represent the result in the HVRRS at the same height levels. Each data point represents a vertically averaged value of the wind shear at one radiosonde station during the whole study period. Density plots (b, d) show the correlation between wind shears in HVRRS and ERA5 reanalysis. The ERA5-derived wind shears are spatially and temporally collocated with those of the HVRRS. In addition, the red lines represent a least-squares linear regression, and the star superscripts indicate that values are statistically significant (p<0.05).
It is noteworthy that shears in the ERA5 reanalysis at heights of 10–15 km a.g.l. are substantially underestimated compared to the HVRRS, especially at middle latitudes, with a mean absolute error for all stations of about 8 (Table 1). The underestimation could partly be due to the coarse vertical resolution (around 300 m) in the ERA5 reanalysis in this height interval. Nevertheless, the geographical distribution of the ERA5 shear still exhibits a significant positive correlation with the HVRRS shear, with a correlation coefficient of 0.44 (Fig. 2d).
Table 1Comparisons of mean wind shears between HVRRS and ERA5 reanalysis at heights of 0–2 (a), 10–15 (b), and 20–25 km a.g.l. (c).
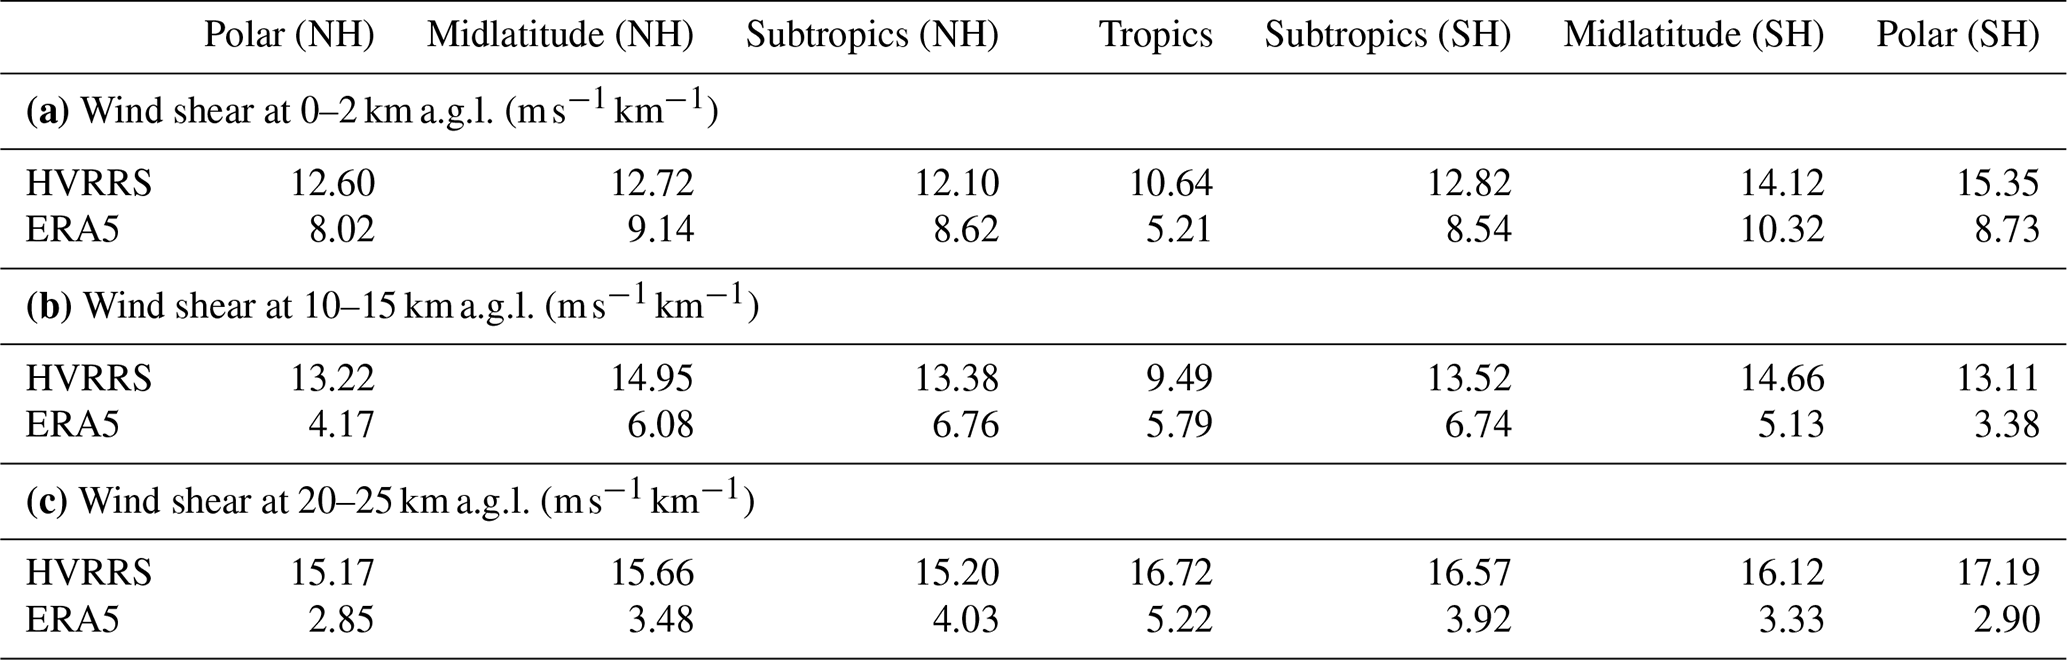
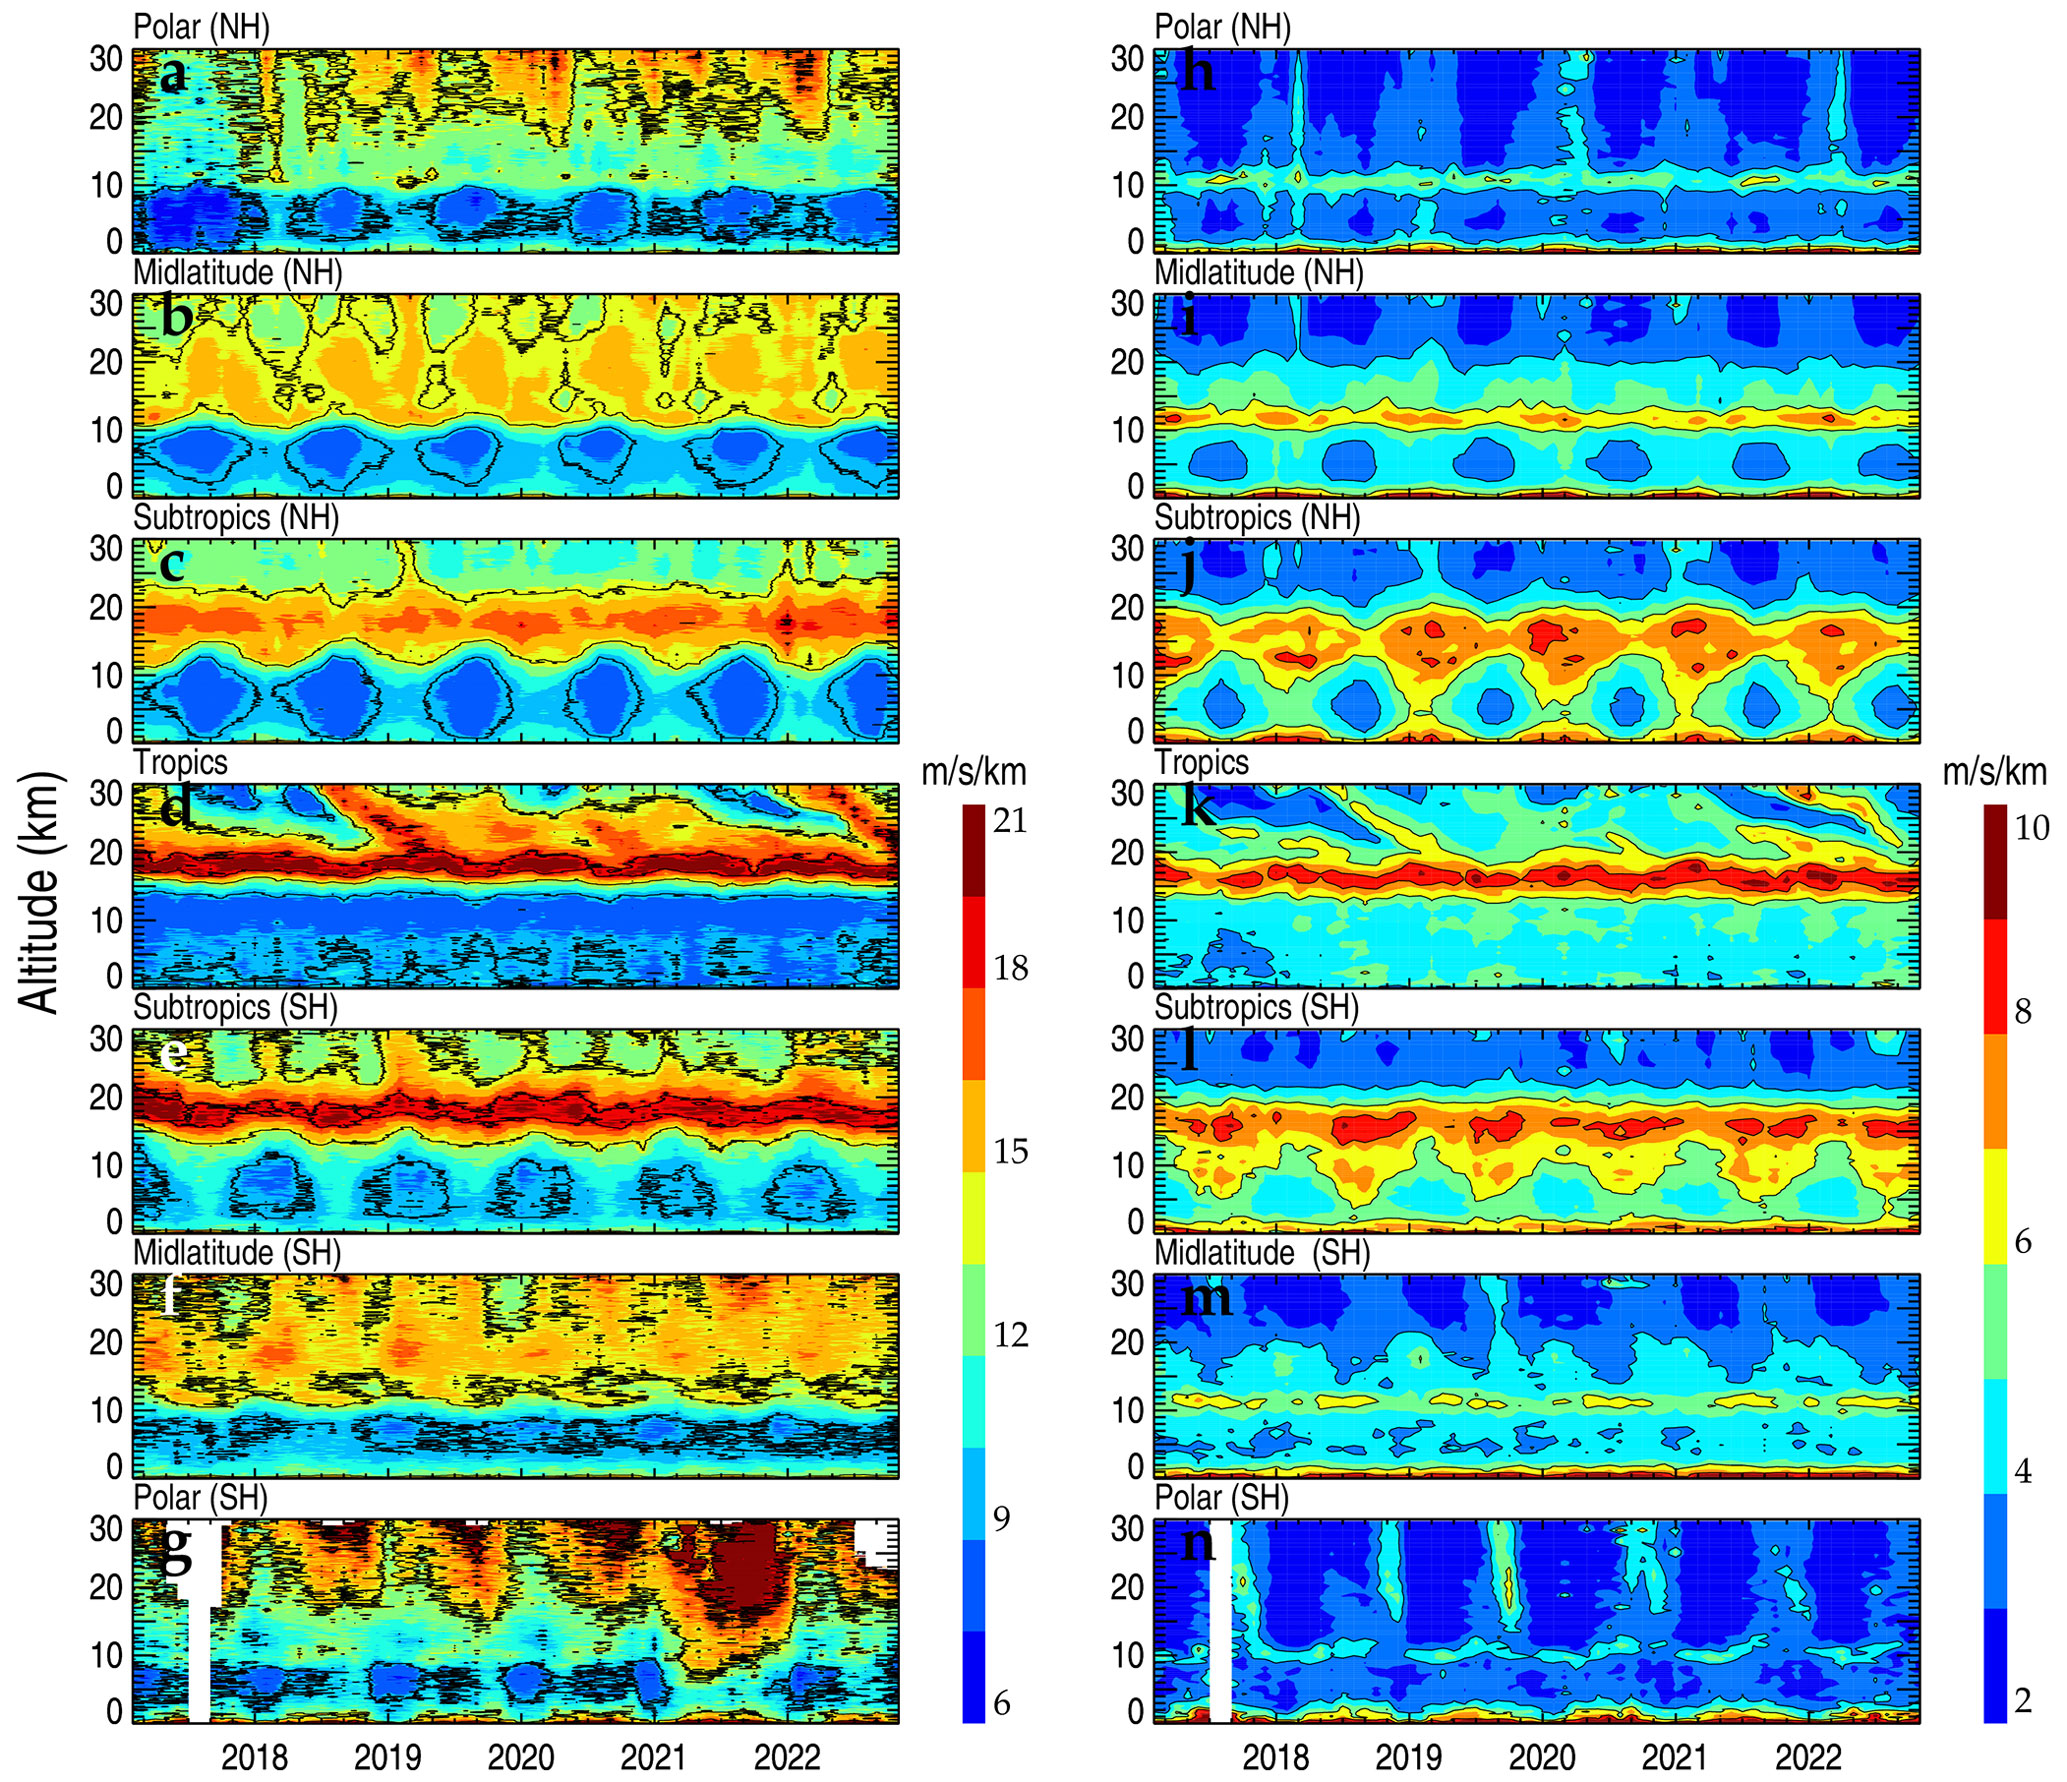
Figure 3Monthly mean wind shears during the years 2017–2022 in HVRRS (a–g) and ERA5 reanalysis (h–n) in different climate zones. The ERA5-derived wind shears are spatially and temporally collocated with those of the HVRRS. NH: Northern Hemisphere; SH: Southern Hemisphere.
Following Houchi et al. (2010), the monthly averaged shears over seven typical climate zones are separately investigated (Fig. 3) and are defined as follows: polar (70–90∘ N or S), midlatitudes (40–70∘ N or S), subtropics (20–40∘ N or S), and tropics (20∘ S–20∘ N). Over the polar regions in the Northern Hemisphere and Southern Hemisphere, HVRRS-based shears are exceptionally strong in the lower stratosphere compared to those in the troposphere (Fig. 3a and g), which could be attributed to the stratospheric polar jet. However, the similar altitude variation can hardly be found in ERA5-based shears, which are dramatically underestimated by around 12 in the lower stratosphere (Fig. 3h and n, also seen in Table 1). The results in midlatitudes reach a similar conclusion (Fig. 3b, f, i, and m). In the subtropical region, HVRRS-based shears are consistently strong at heights of 16–21 km a.g.l., just above the subtropical jet stream (Fig. 3c and e). However, in the ERA5 reanalysis, the region with consistently strong shears can be noticed at approximately 16 km a.g.l. (Fig. 3j and l), which is about 3 km lower than that in the HVRRS. One possible reason might be that the model fails to resolve the further increasing shear in the lower stratosphere. In the tropics, the signature of quasi-biennial oscillation (QBO) can be identified in the lower stratosphere (Fig. 3d and k).
The comparison between HVRRS-based and ERA5-based shears in three typical regimes is tabulated in Table 1. These metrics highlight that ERA5-based shears are underestimated by approximately 3.92, 7.65, and 11.99 at heights of 0–2, 10–15, and 20–25 km a.g.l., respectively, which are roughly consistent with Houchi et al. (2010).
By comparison, the ERA5-acquired N2 averaged over four height intervals (e.g., 0–5, 5–10, 10–15, 15–20 km a.g.l.) is reliably estimated, with a relative error of around 11 %, as illustrated in Fig. S3 in the Supplement. This finding indicates that the ERA5 reanalysis can properly present the static stability of the background atmosphere, but it is not properly coincident with radiosonde in terms of the small-scale variability in dynamical structures. Due to a lack of global measurement of the fine structure of the upper-air wind, however, the accuracy of ERA5-resolved shears is hard to globally validate.
3.2 Occurrence frequency of in HVRRS and ERA5 reanalysis
As a prominent example, the monthly occurrence frequency of over the Corpus Christi station (27.77∘ N, 97.5∘ W) from January 2017 to October 2022 is illustrated in Fig. 4. As a result, the monthly occurrence rate of in the low troposphere determined from the HVRRS is lower than the ERA5-based one, with mean values of around 10.6 % and 16.9 %, respectively. In the lowermost 2 km, the vertical resolution of ERA5 reanalysis is less than 200 m, and it is less than the moving segment interval in Eq. (1). The high occurrence frequency in the low troposphere could be likely related to the negative or small N2. Especially during the daytime, the planetary boundary layer (PBL) is well mixed due to strong turbulence induced by uprising thermals (Song et al., 2018). In addition, an obvious seasonal cycle of occurrence frequencies is revealed by the HVRRS in the middle and upper troposphere and has a maximum in the winter (December–January–February) and spring (March–April–May) seasons, which is consistent with the finding in Zhang et al. (2019). In the vicinity of jet streams, the occurrence frequency of is generally enhanced by large wind shears. However, the ERA5 reanalysis does not provide such a seasonal cycle pattern, and the occurrence frequency of is significantly underestimated by around 8 % (Fig. 4b), which could be attributed to the underestimation in wind shears. In the lower stratosphere, both the HVRRS and the ERA5 reanalysis provide a low estimation of occurrence frequencies, with a value of around 1 %.
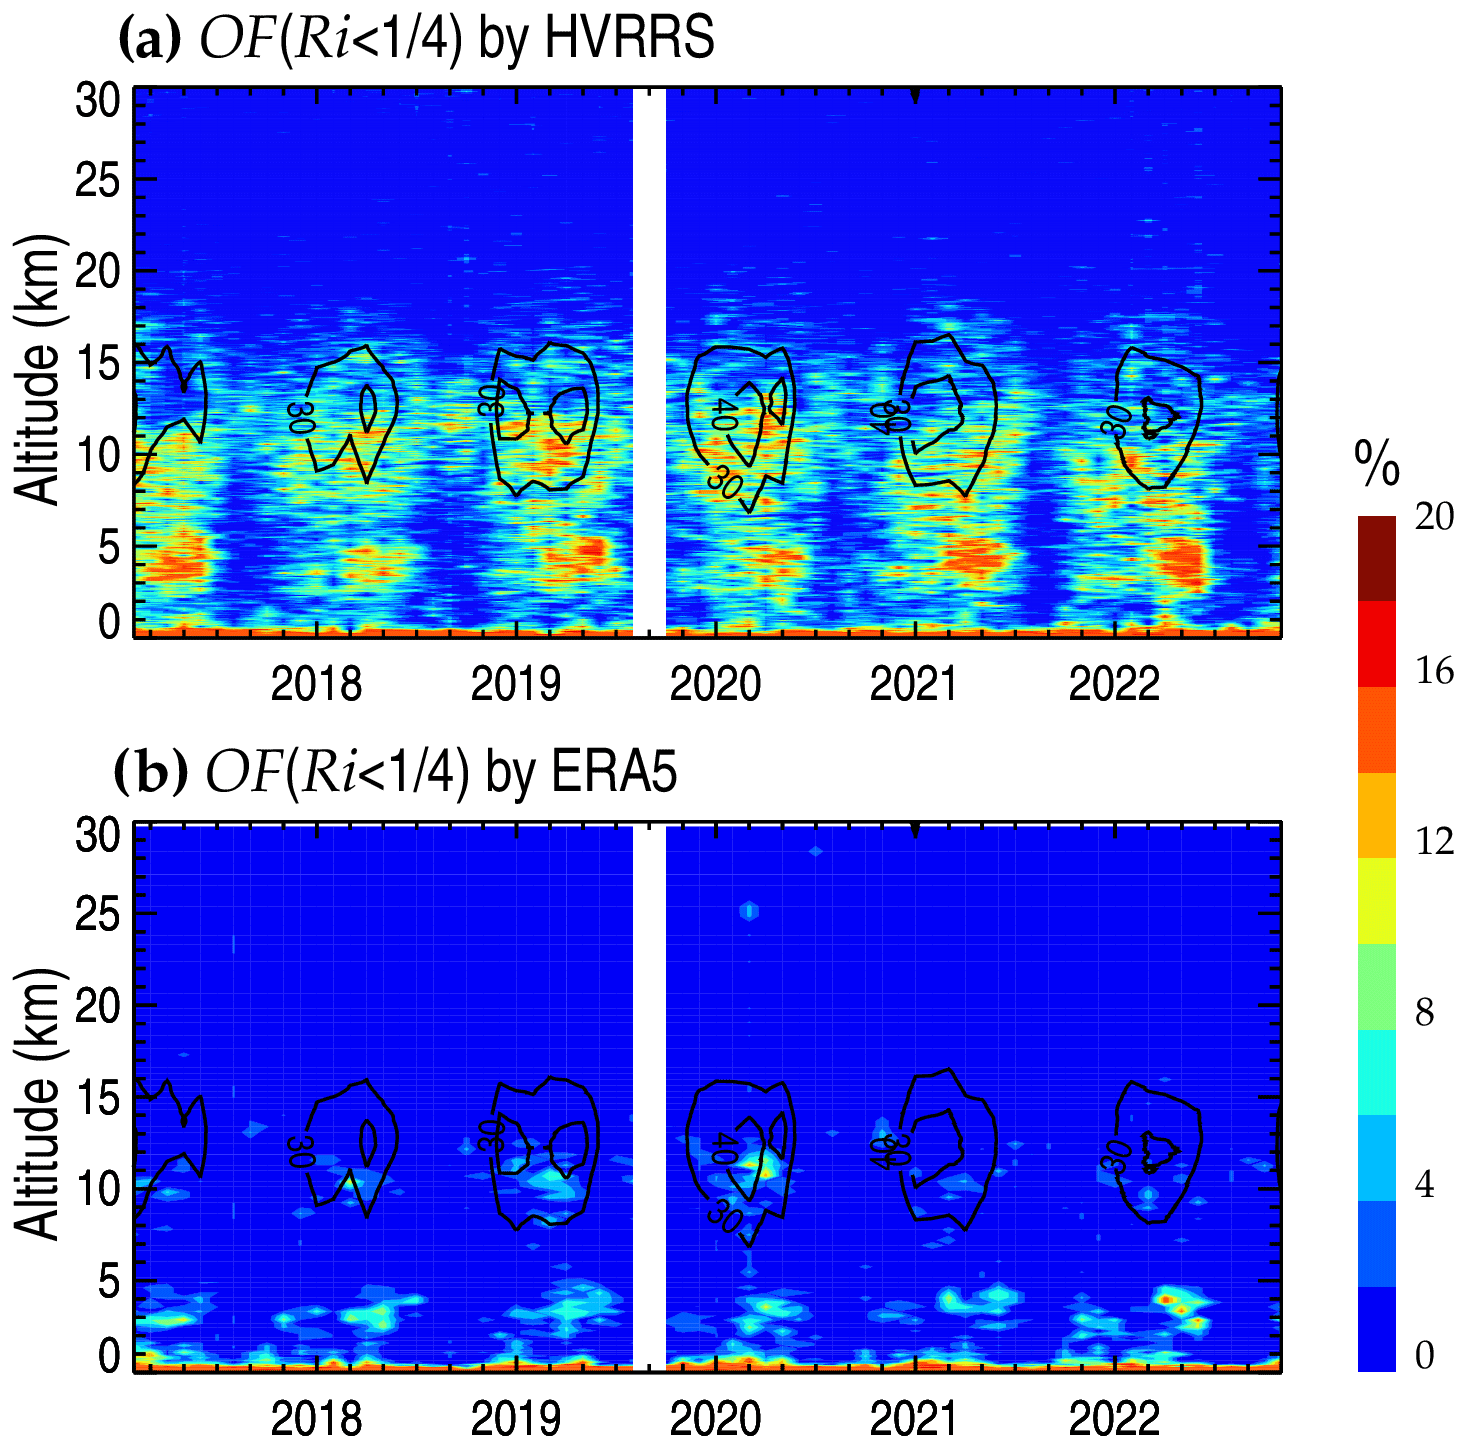
Figure 4The monthly occurrence frequency of at the Corpus Christi station (27.77∘ N, 97.5∘ W) in HVRRS (a) and ERA5 reanalysis (b). Note that the contour curves in (a) and (b) concern the mean horizontal wind speed and that the ERA5-derived quantities are spatially and temporally collocated with those of the HVRRS.
Furthermore, on a large geographical scale the occurrence frequency of retrieved by ERA5 reanalysis is remarkably underestimated in the free atmosphere, as compared to the HVRRS. The annual variation in the occurrence frequency of over seven climate zones at 10–15 km a.g.l. indicated by HVRRS and ERA5 reanalysis is further demonstrated in Fig. 5. It is clearly seen that the occurrence frequency of provided by ERA5 reanalysis is underestimated in all months, over all climate zones, possibly implying that, in the free atmosphere, the threshold value of in Eq. (1) is too small for the ERA5 reanalysis to capture the occurrence of KHI.
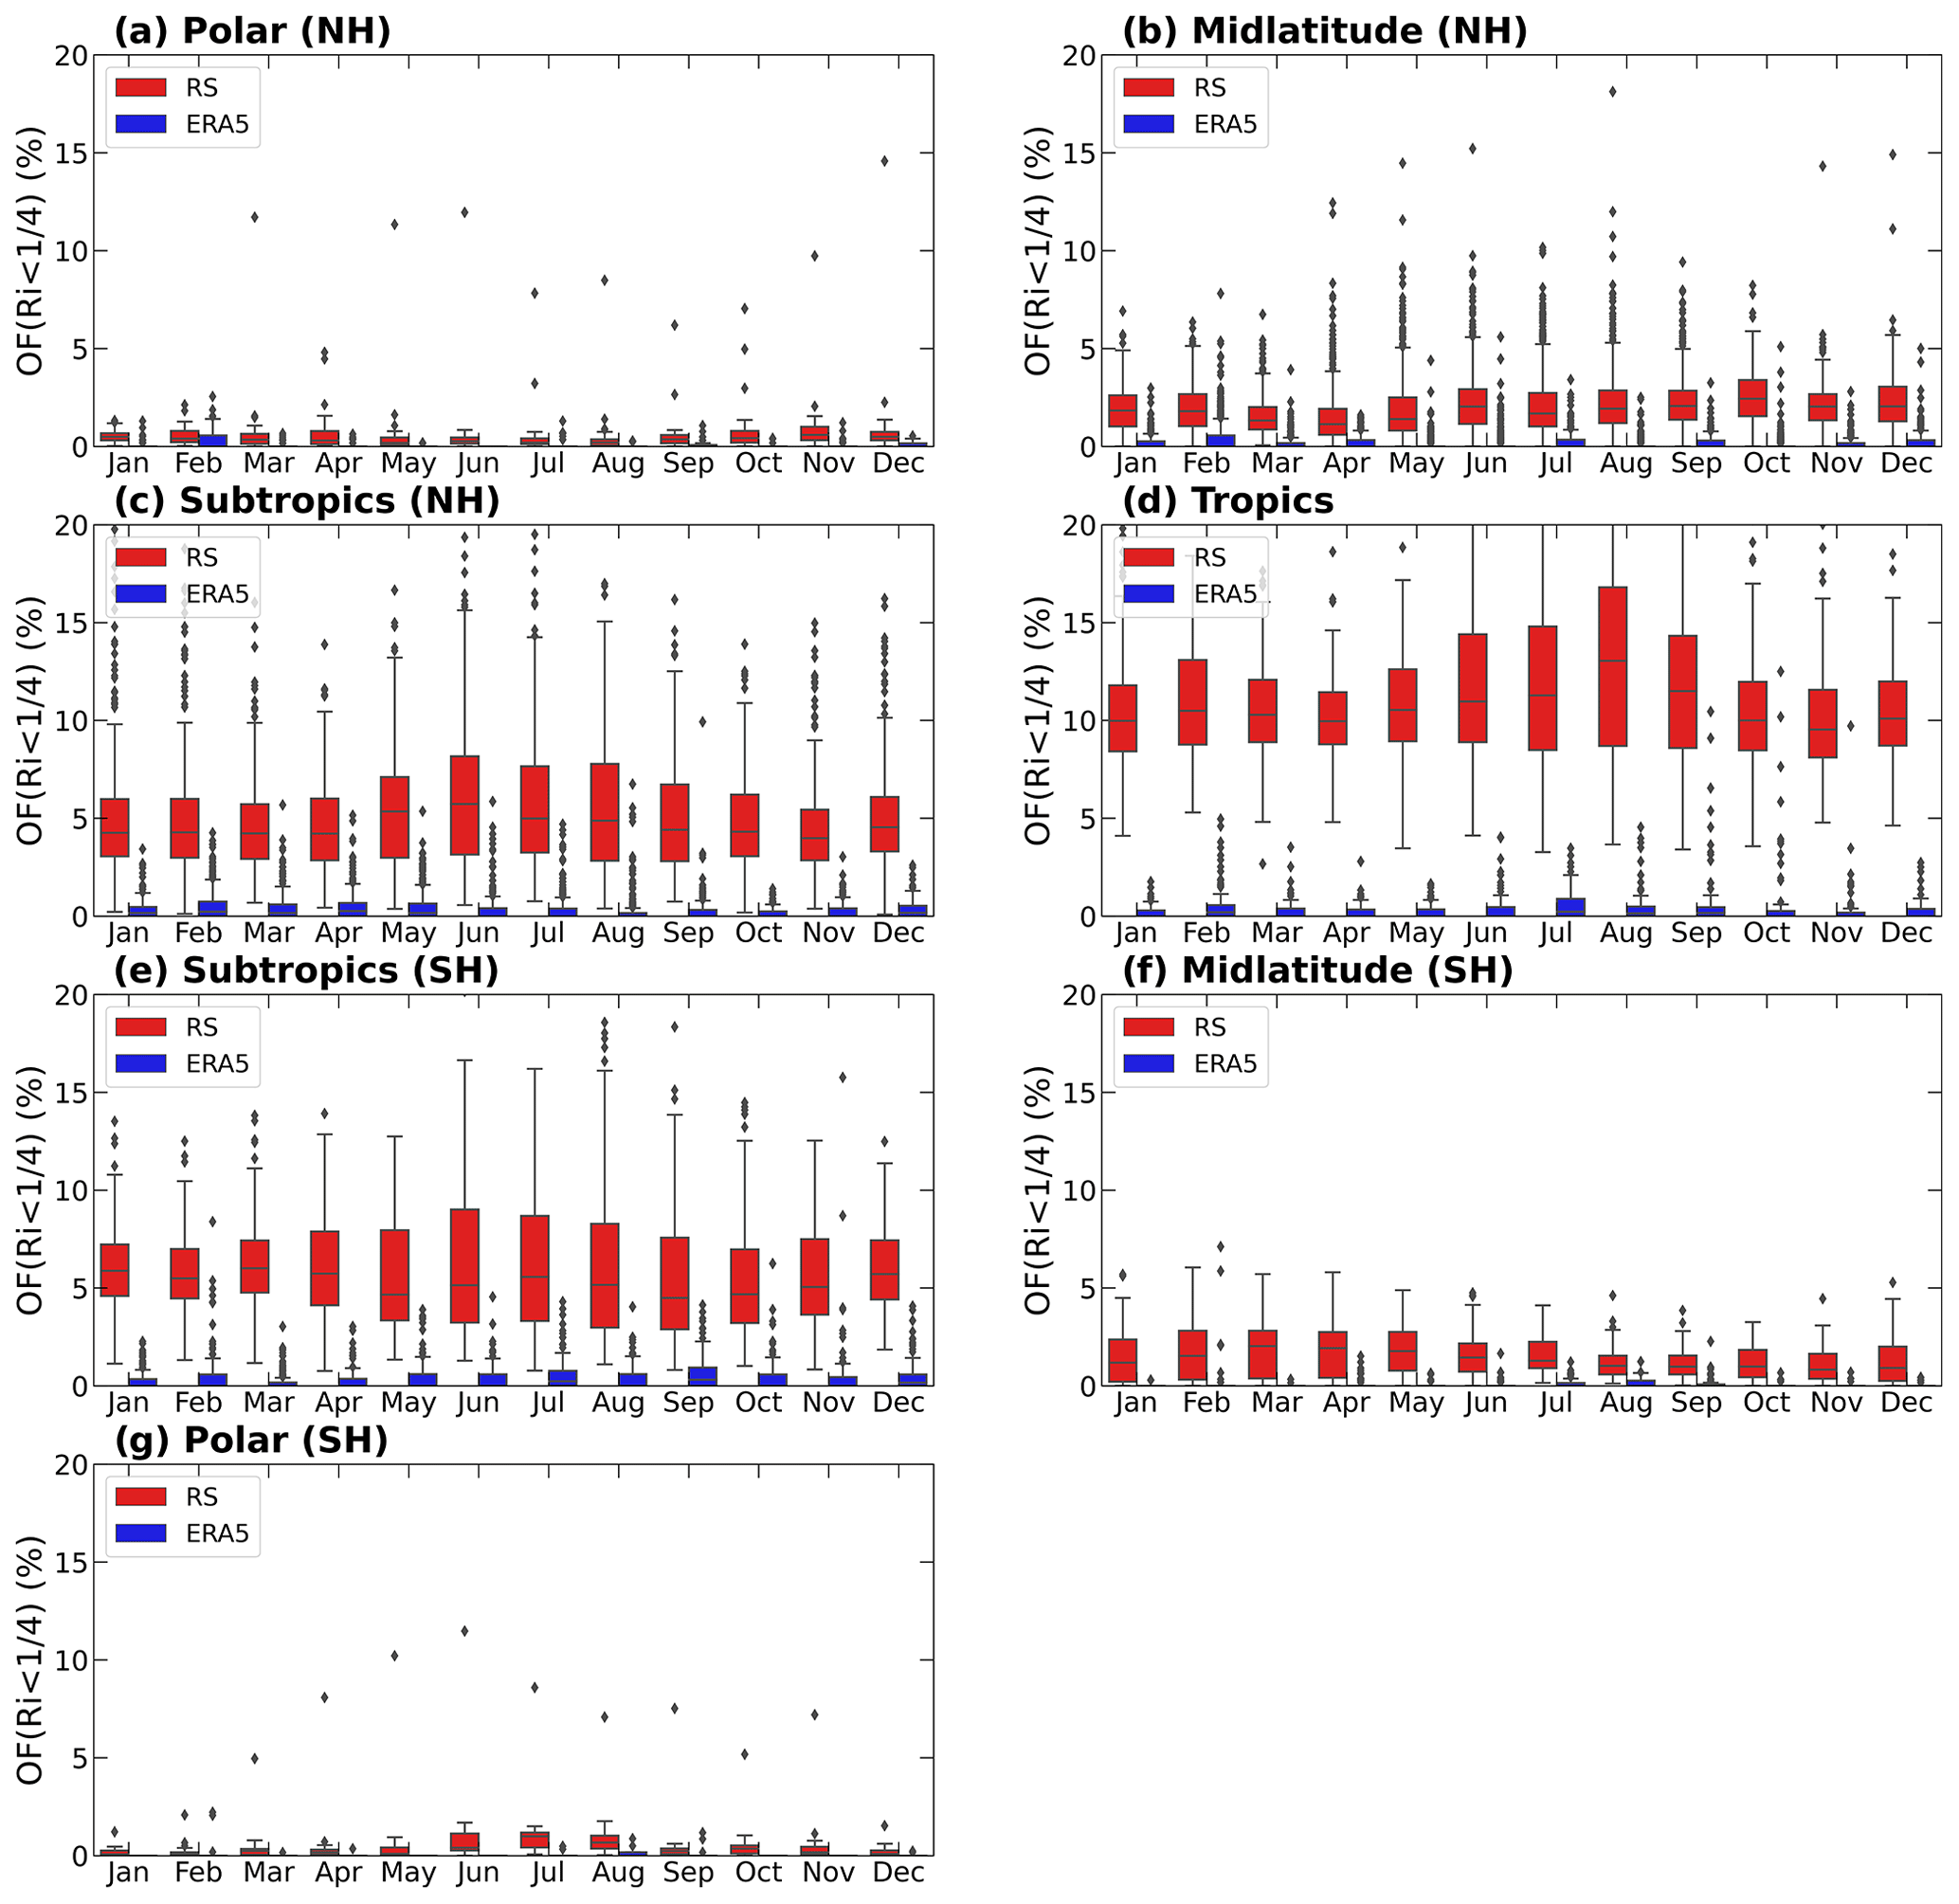
Figure 5The annual cycles of the occurrence frequency of in different climate zones at 10–15 km a.g.l. The red and blue boxes represent the frequencies in HVRRS and ERA5 reanalysis, respectively. The ERA5-derived Ri is spatially and temporally collocated with that of the HVRRS. NH, Northern Hemisphere; SH, Southern Hemisphere.
However, the ERA5 reanalysis data are non-uniformly sampled in altitude. Their vertical resolution drops from about 100 m in the boundary layer to about 500 m in the lower stratosphere. In contrast, radiosondes have a vertical resolution of 10 m at all heights. Therefore, we selected four typical heights and vertically interpolated the radiosonde to the same height resolution as ERA5 for comparison. The four height intervals are 0.8–1.3, 2.2–3.2, 6–15, and 20–21 km a.g.l., as shown in Table 2. In these height intervals, the vertical resolution of ERA5 is about 100, 200, 300, and 400 m, respectively. Even at the same vertical resolution, ERA5 still seriously underestimates the value of OF() (OF denotes occurrence frequency) at all heights and in all climate zones. These results indicate that the greatest difficulty in evaluating subcritical Ri with ERA5 is that its simulation of wind shears might be seriously underestimated compared with radiosonde. As illustrated in Table 3, even accounting for the fact that ERA5 has a comparable vertical resolution to the radiosonde, wind shears in ERA5 reanalysis are still underestimated by around 50.3 %, 48.7 %, 43.6 %, and 62.2 % at 0.8–1.3, 2.2–3.2, 6–15, and 20–21 km a.g.l., respectively. In order to obtain an occurrence frequency of subcritical Ri from ERA5 reanalysis that is comparable with radiosonde-based OF(), the Rit for ERA5 should be set to larger than . For instance, at 0.8–1.3 and 2.2–3.2 km a.g.l., Rit equals 1 could be an appropriate choice for ERA5 reanalysis, rather than (Table 2). More generally, could be more suitable for ERA5 reanalysis, compared to .
Table 2The occurrence rate of low Ri at 0.8–1.3 (a), 2.2–3.2 (b), 6–15 (c), and 20–21 km a.g.l. (d). The critical Ri (Rit) is for radiosonde, and it increases from to 2 for ERA5 reanalysis. Note that HVRRS data were vertically resampled to 100, 200, 300, and 400 m at these four height intervals to match the ERA5 reanalysis. In addition, the moving-average number in Eq. (1) is 0. RS stands for radiosonde.
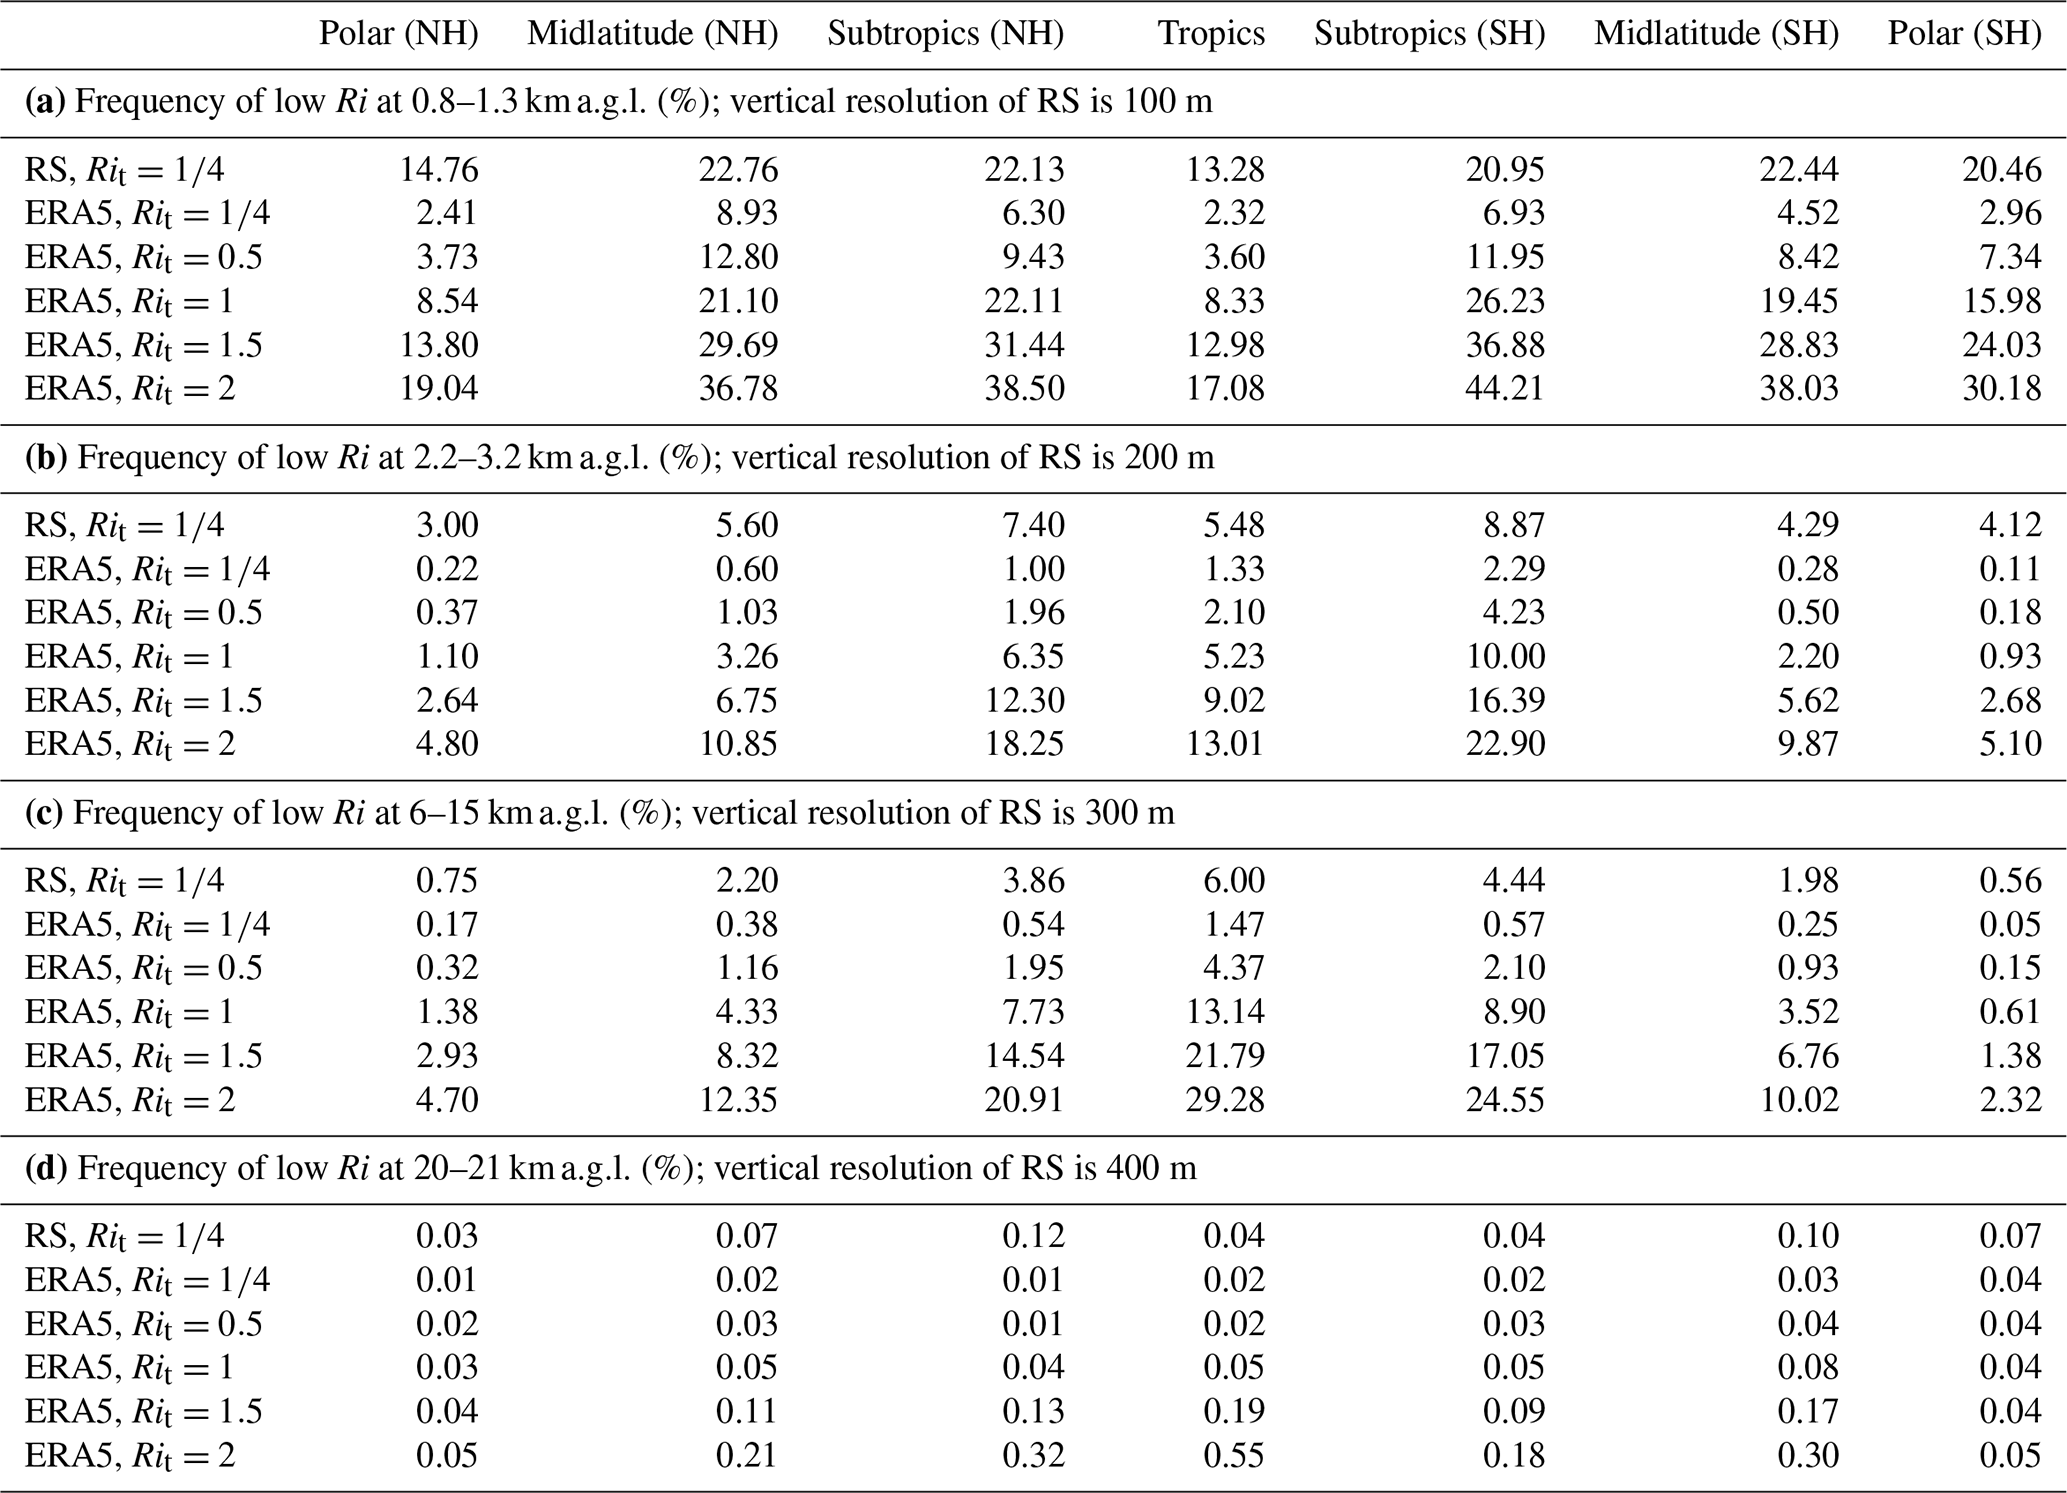
Table 3Vertical wind shears at 0.8–1.3 (a), 2.2–3.2 (b), 6–15 (c), and 20–21 km a.g.l. (d). Note that HVRRS data were vertically resampled to 100, 200, 300, and 400 m at these four height intervals to match the ERA5 reanalysis. RS stands for radiosonde.
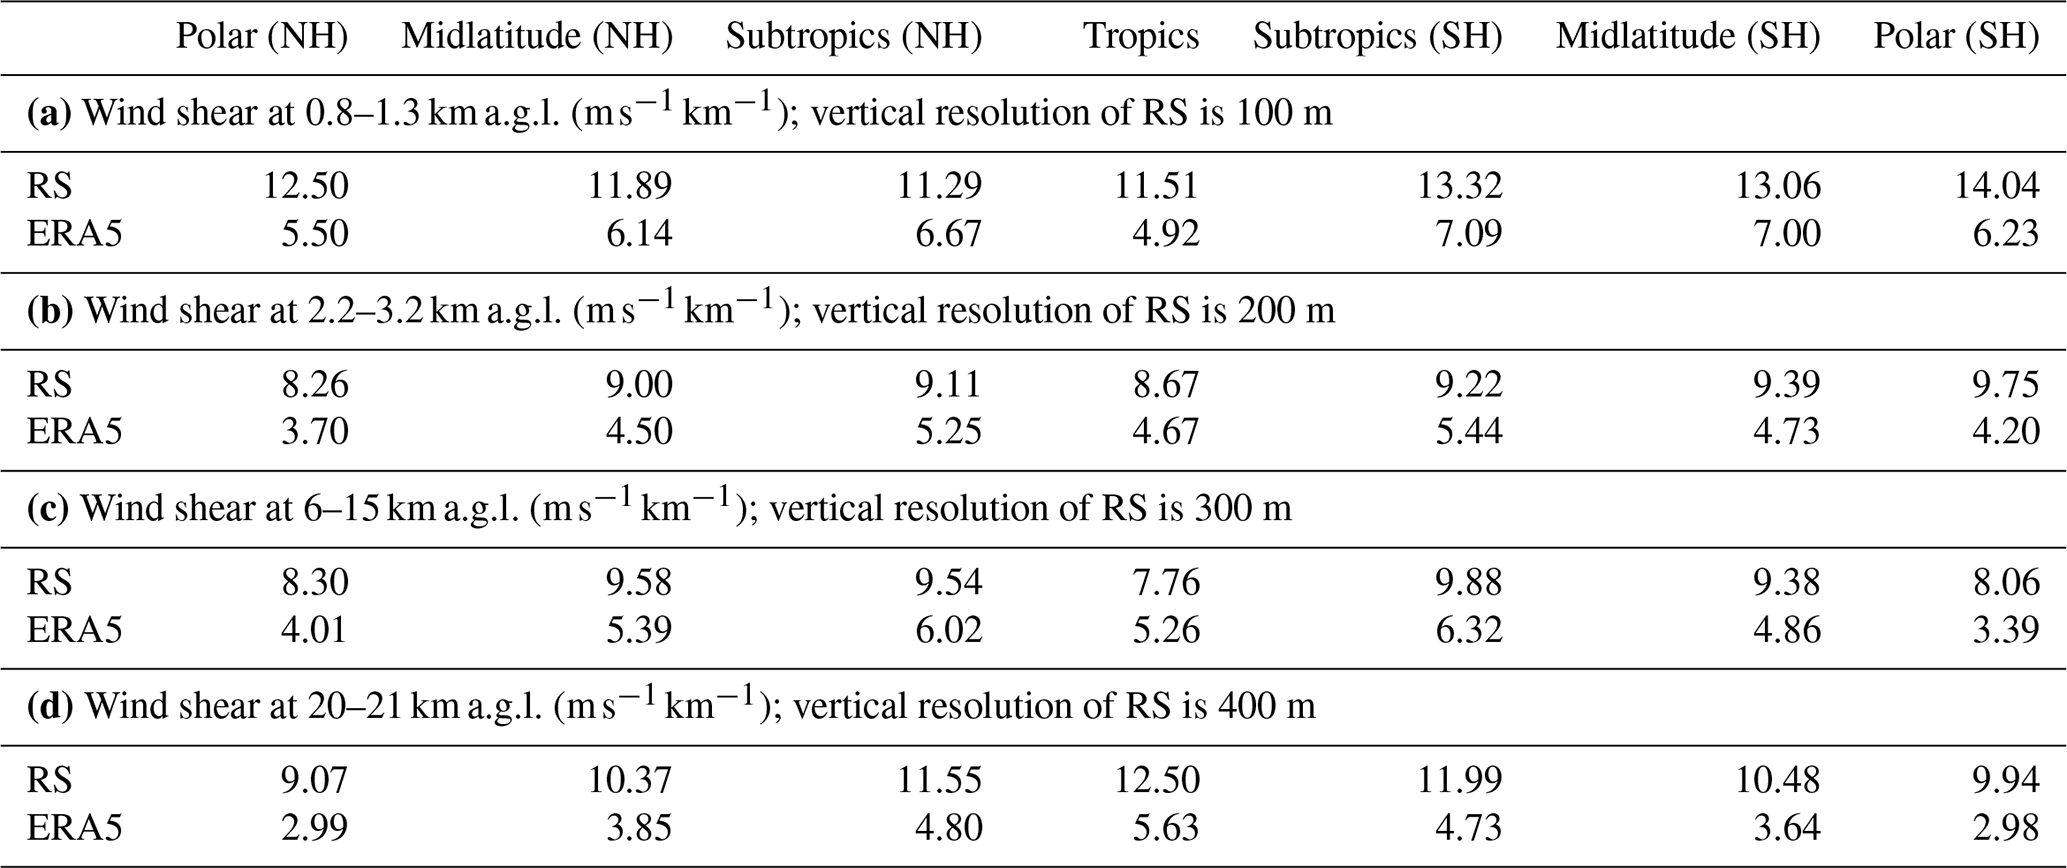
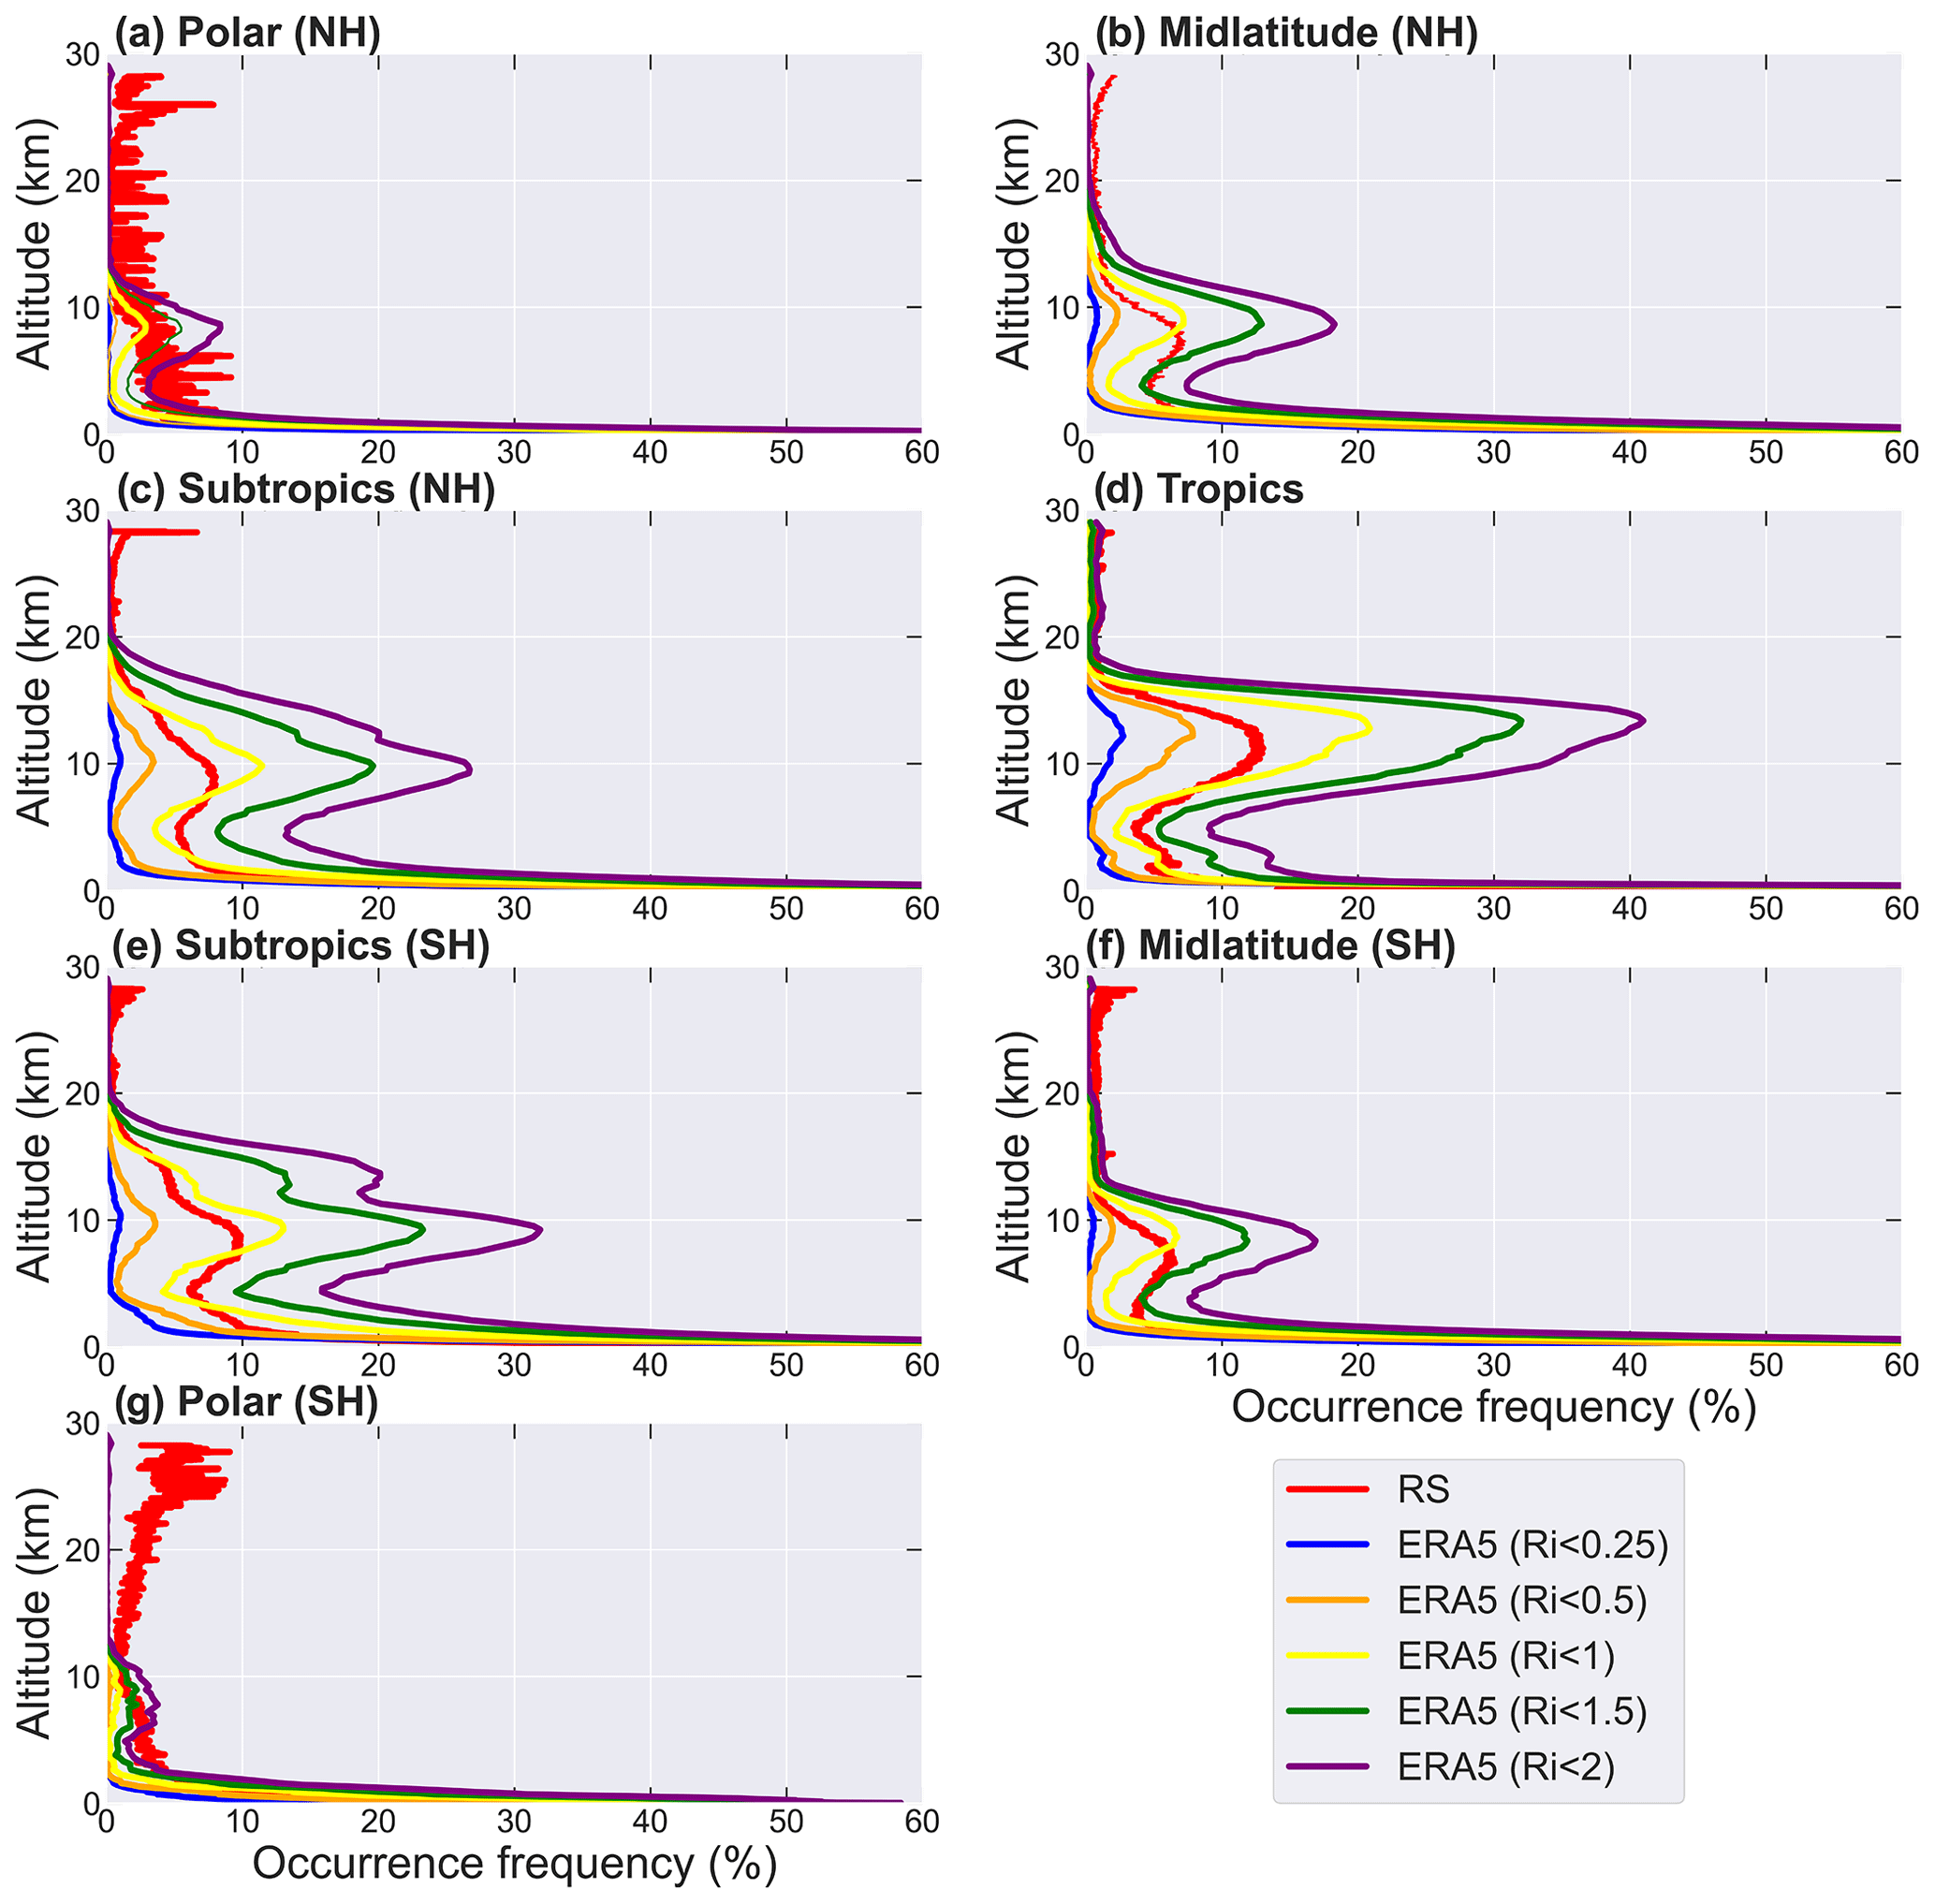
Figure 6The altitude variation in the occurrence frequency of Ri below certain thresholds (0.25, 0.5, 1, 1.5, and 2) in ERA5 reanalysis in various climate zones. The ERA5-derived Ri is spatially and temporally collocated with that of the HVRRS. The occurrences of in the HVRRS are overlapped with red lines.
Due to the huge change in the vertical resolution of ERA5, it could be difficult to interpolate ERA5 into uniform data vertically with a relatively high resolution. Therefore, the question posed here is, what is the proper threshold value of Ri in predicting the occurrence of KHI when using the ERA5 reanalysis, compared to the HVRRS? The occurrence frequency of indicated by the HVRRS and the ERA5-determined occurrence frequencies produced by Ri<0.25, Ri<0.5, Ri<1, Ri<1.5, and Ri<2 at all heights up to 30 km a.g.l. are demonstrated in Fig. 6. It is notable that over all climate zones and in the free atmosphere, occurrence frequencies of Ri<0.25 and Ri<0.5 obtained from the ERA5 reanalysis are underestimated, but the frequencies of Ri<1.5 and Ri<2 are generally overestimated. The occurrence frequency of Ri<1 gives a close estimation for both magnitude and altitude variations compared to the HVRRS over all climate zones.
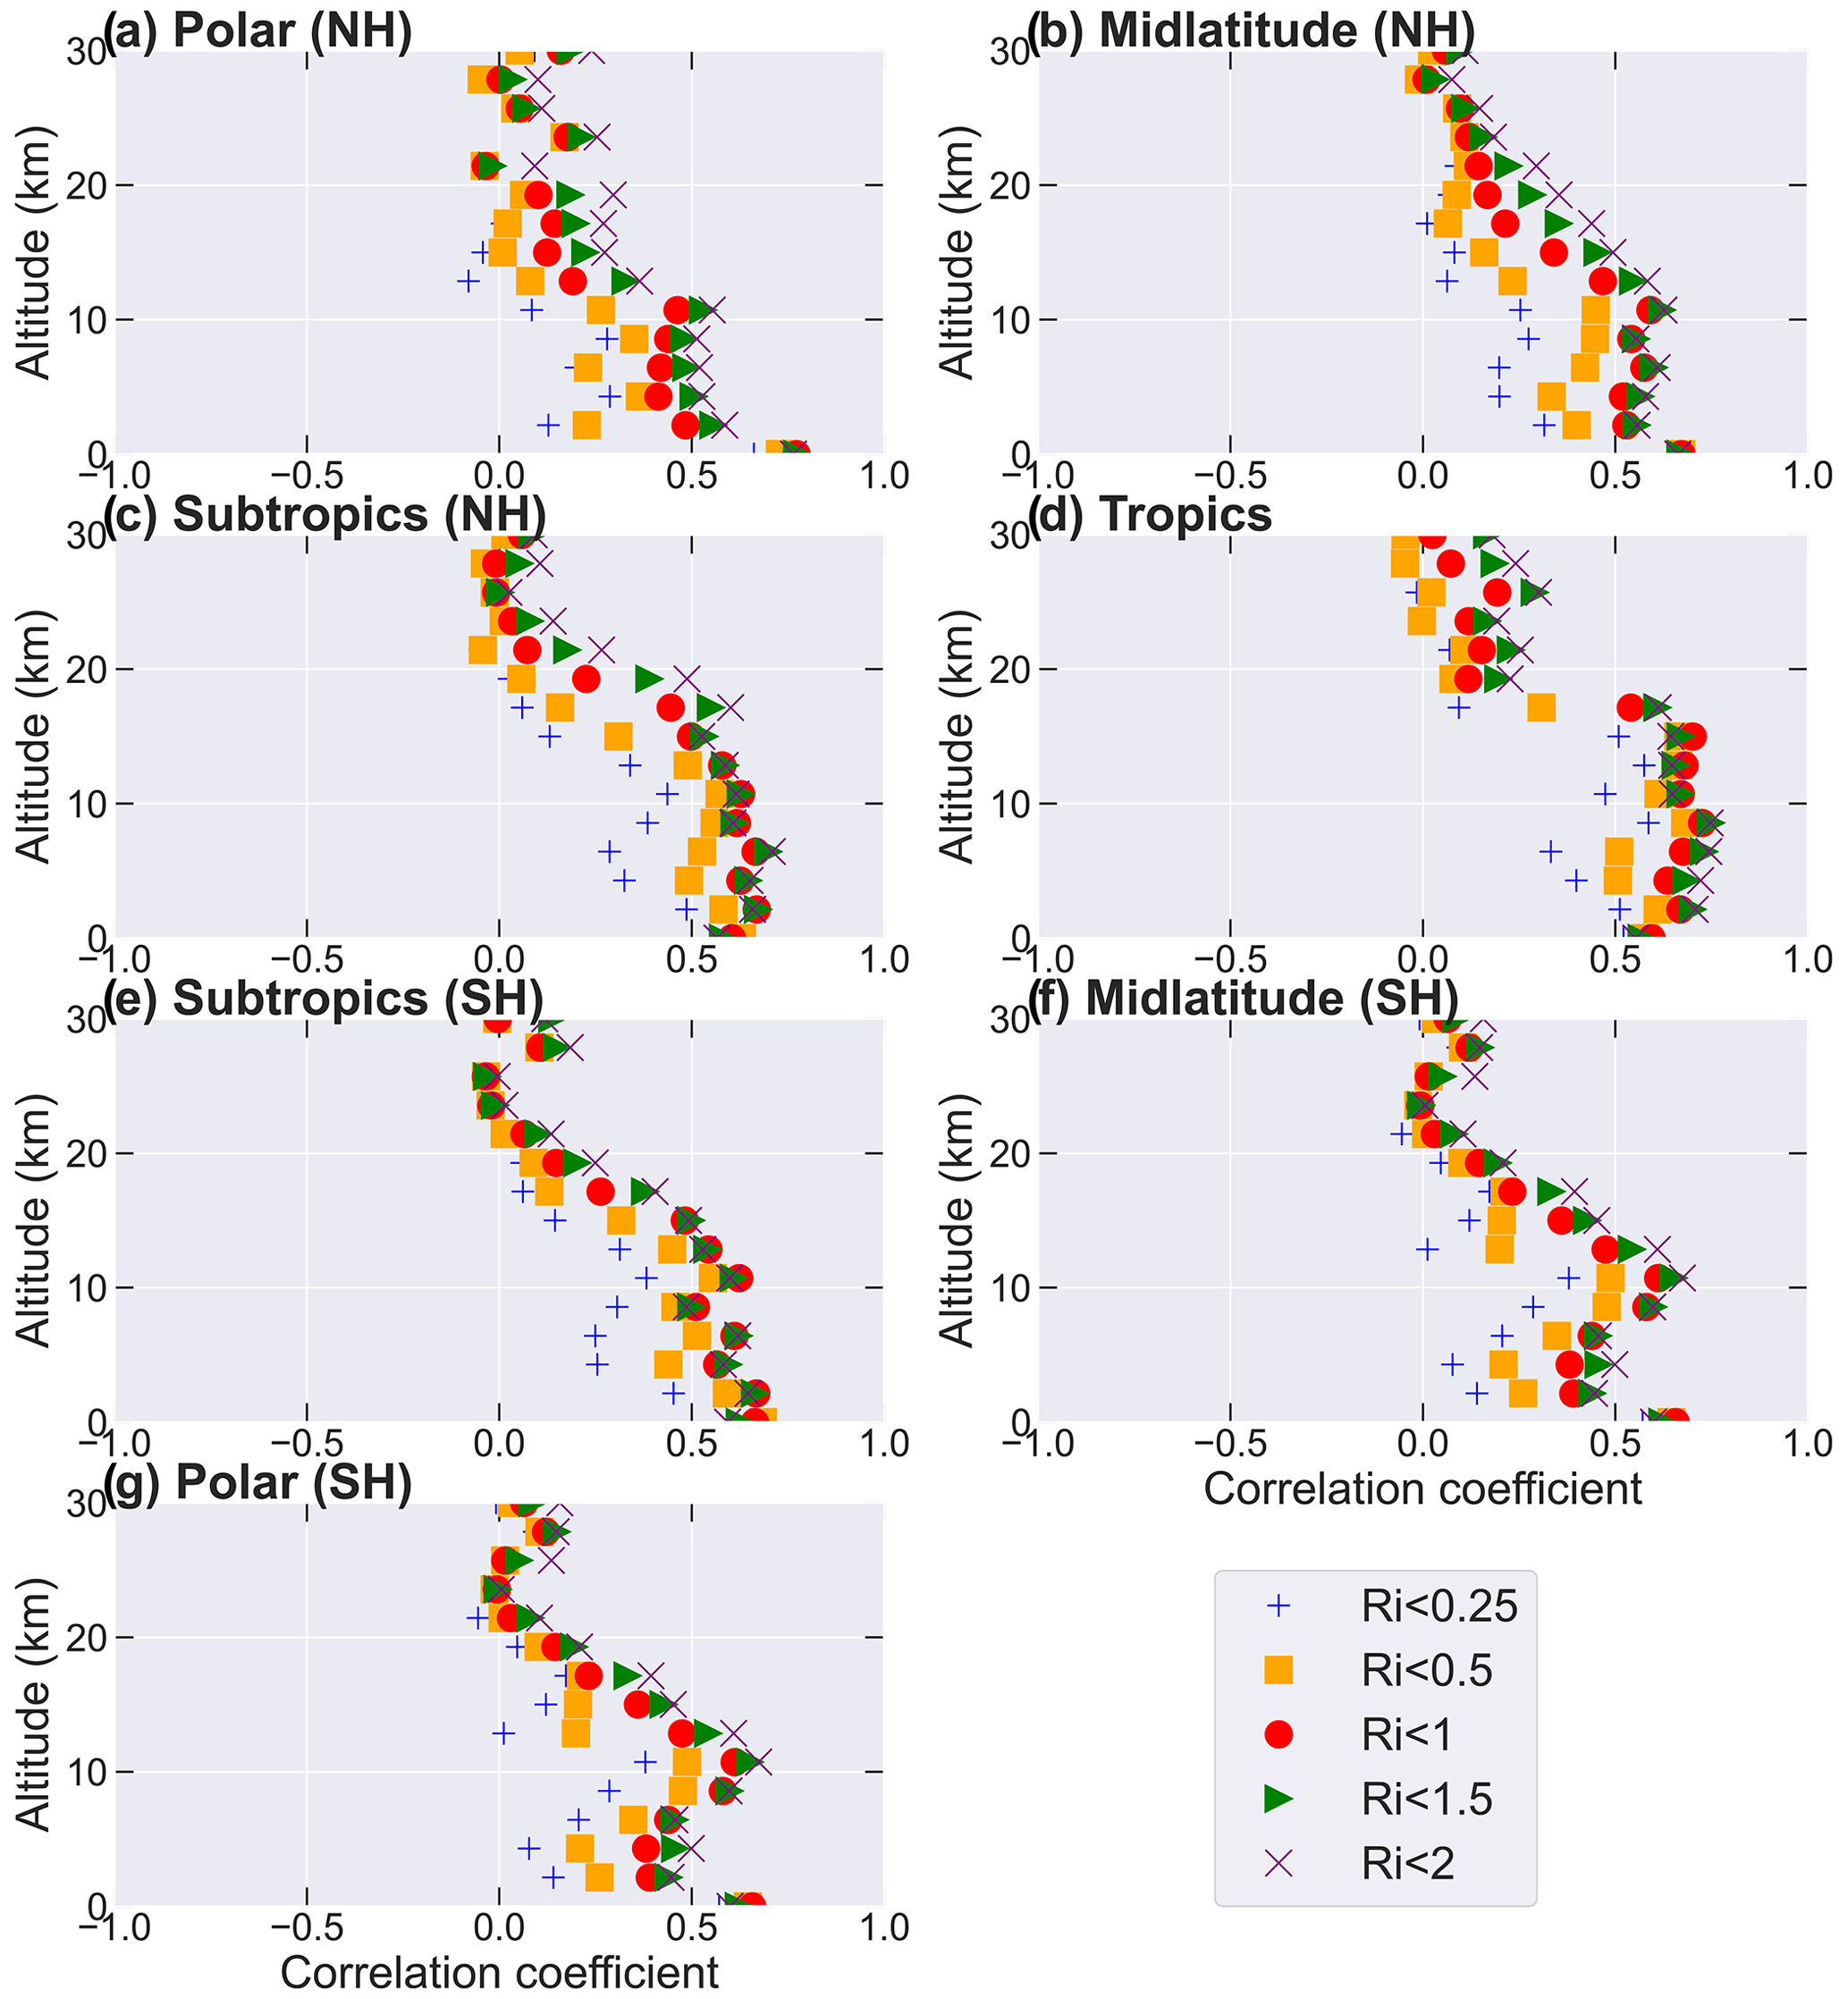
Figure 7The correlation coefficients between the monthly averaged occurrence frequency of in the HVRRS and the monthly occurrence frequency of Ri below certain thresholds (0.25, 0.5, 1, 1.5, and 2) in ERA5 reanalysis. The ERA5-derived Ri is spatially and temporally collocated with that of the HVRRS. The coefficients in various climate zones are estimated in increments of 2 km.
Furthermore, the correlation coefficients between HVRRS-determined occurrence frequencies and the ERA5-determined frequencies indicated by different threshold values of Ri at height levels of 0 to 30 km are illustrated in Fig. 7. It is worth noting that, in the troposphere, the ERA5-based frequencies indicated by Ri<1, Ri<1.5, and Ri<2 are highly positively correlated with those from the HVRRS, with a correlation coefficient of around 0.6 over all climate zones. In the lower stratosphere, however, these coefficients rapidly decline to 0.1, which can be explained by the low occurrence frequency in this height regime.
Combining the findings in Figs. 6 and 7, in the free troposphere, we can conclude that the ERA5-determined occurrence frequency of Ri<1 is closest to the frequency of based on the HVRRS. In the free atmosphere, KHI is the dominant source for clear-air turbulence (CAT), which is a well-known hazard to aviation. Therefore, the global characterization of KHI occurrence frequency in the free atmosphere obtained from ERA5 reanalysis could be of importance for understanding the spatial–temporal variation in CAT. In the following sections, the occurrence frequency of subcritical Ri (hereinafter OF(Ri<Rit)) is based on Ri<1 in ERA5 reanalysis and in the HVRRS, unless otherwise noted.
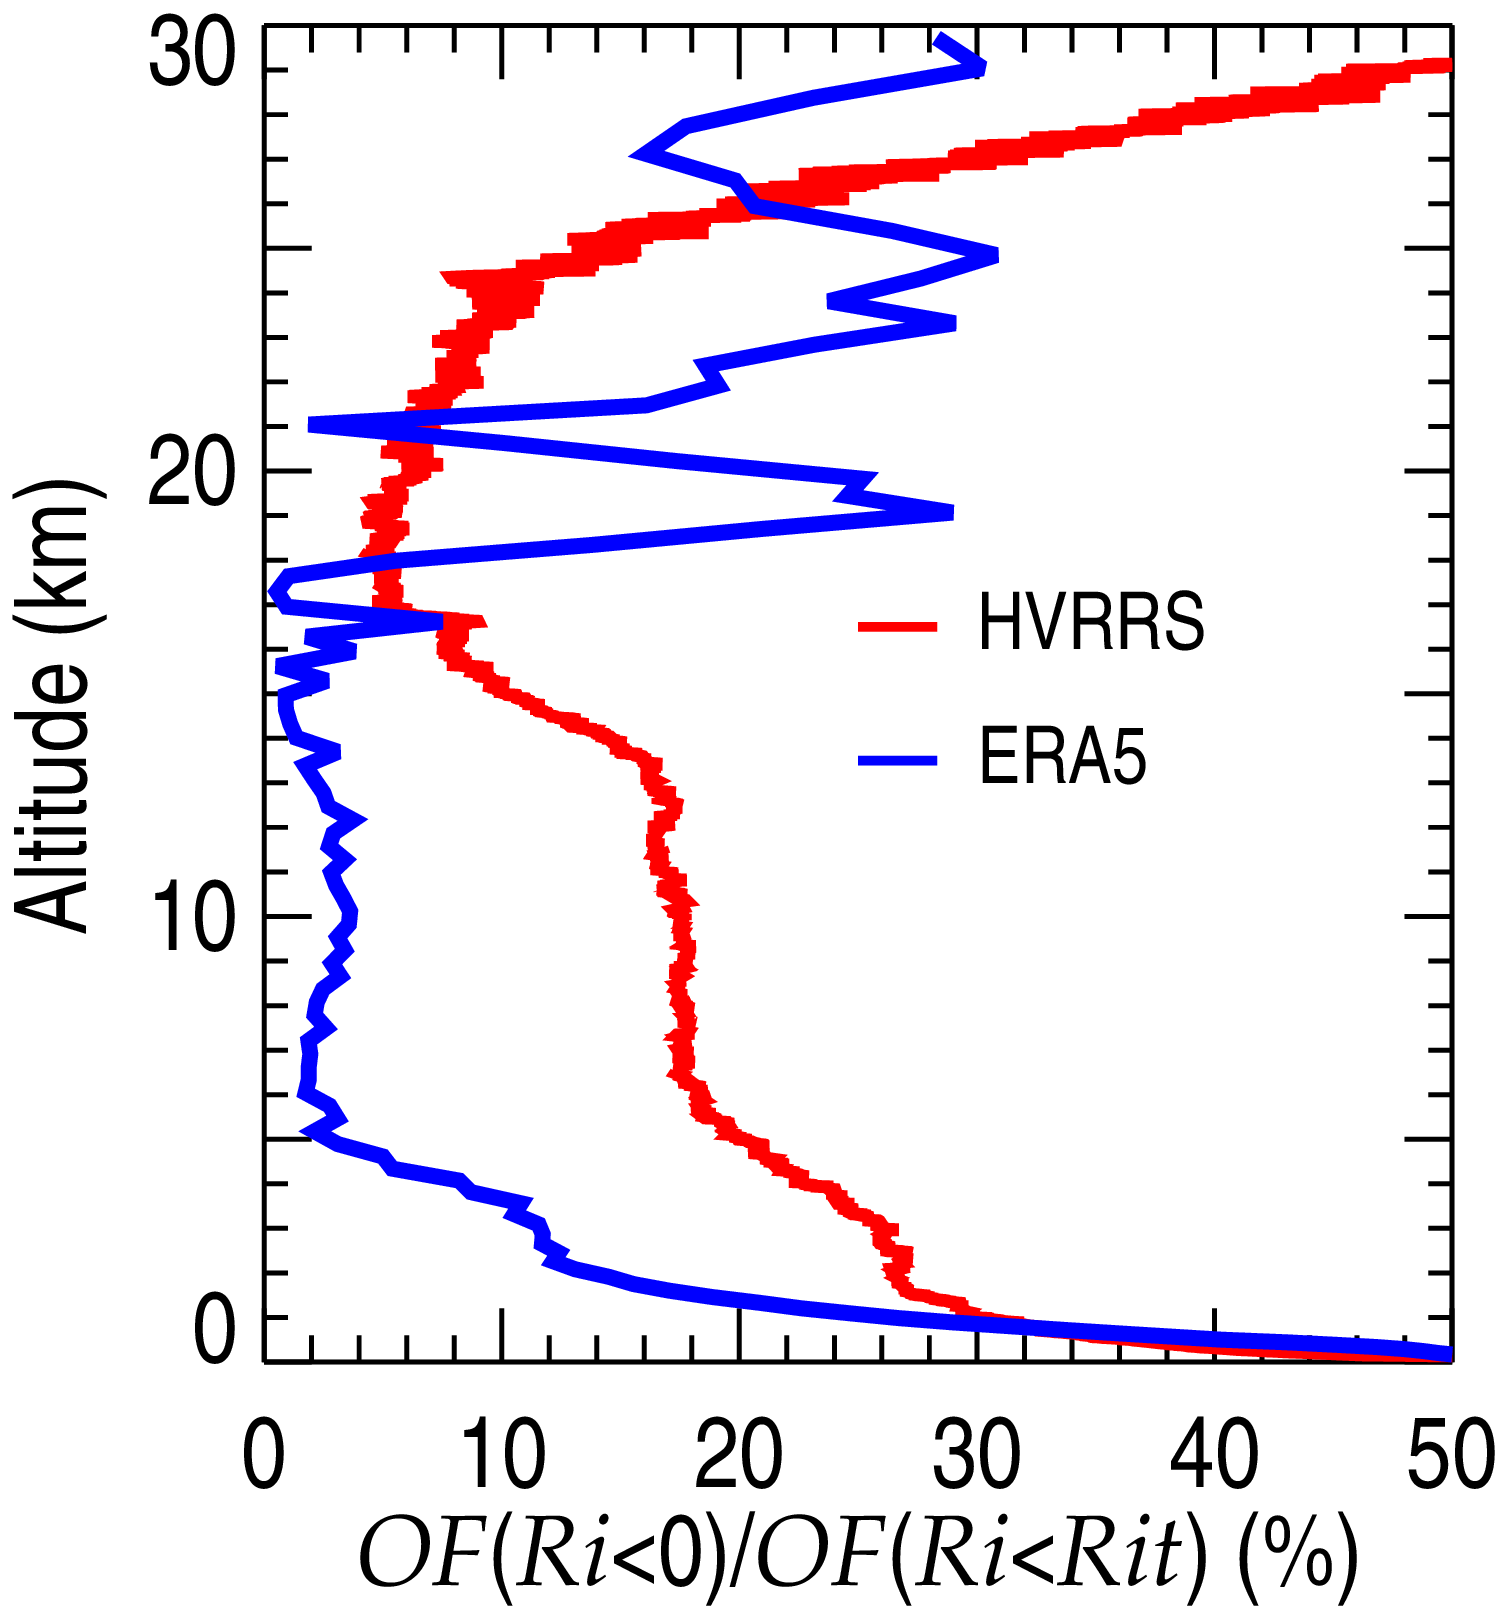
Figure 8The percentage of OF(Ri<0) relative to OF(Ri<Rit) in the HVRRS (red) and ERA5 reanalysis (blue).
Finally, it is noteworthy that OF(Ri<Rit) includes the component of Ri<0 that indicates potential for convective instability. However, both ERA5 and the HVRRS are difficult to totally avoid Ri<0 when calculating Ri. Therefore, we evaluated the proportion of Ri<0 of all Ri<Rit values across two datasets to evaluate the possible contribution from convections, as shown in Fig. 8. For the HVRRS, the proportion of OF(Ri<0) drops sharply from about 40 % in the low troposphere to about 18 % at 5–15 km a.g.l. Similarly, for ERA5, its proportion drops from about 40 % in the lowermost part of the atmosphere to about 2 % at 5–16 km a.g.l. These findings indicate that, in the free atmosphere, OF(Ri<Rit) is mainly composed of OF().
3.3 The OF(Ri<Rit) climatology
For a first indication, the global distributions of OF(Ri<Rit) provided by the ERA5 reanalysis at 0–2, 5–10, 10–15, and 15–20 km a.g.l. are displayed in Fig. 9. OF(Ri<Rit) in the low troposphere is considerably spatially heterogeneous. In subtropical oceans, the intense OF(Ri<Rit) can be noticed and has a magnitude of around 50 % (Fig. 9a). In addition, in the Sahara OF(Ri<Rit) reaches as high as 65 %. Interestingly, the spatial variation in mean OF(Ri<Rit) during the years 2017–2022 is highly consistent with that of the planetary boundary layer height (PBLH) over oceans, such as the Pacific Ocean near Japan and the Atlantic Ocean near the USA, as shown in Fig. S4 in the Supplement. However, at 0–2 km a.g.l., the spatial variation in OF() exhibits a large difference from that of OF(Ri<Rit) in terms of magnitude, as shown in Fig. S5 in the Supplement. It is around 40 % (20 %) lower than that of OF(Ri<Rit) in subtropical oceans (Australia and North Africa). At heights of 5–10 km a.g.l., intensive OF(Ri<Rit) can be viewed in the subtropical regions and has a value of around 10 % (Fig. 9b), which is likely attributed to upper-tropospheric jets. In the upper troposphere above the tropical oceans, OF(Ri<Rit) is as high as 30 % (Fig. 9c), possibly as a result of the maximal heating effect by mesoscale convective systems (e.g., Houze, 1982). In the lower stratosphere, OF(Ri<Rit) sharply decreases to around 0.1 % (Fig. 9d).
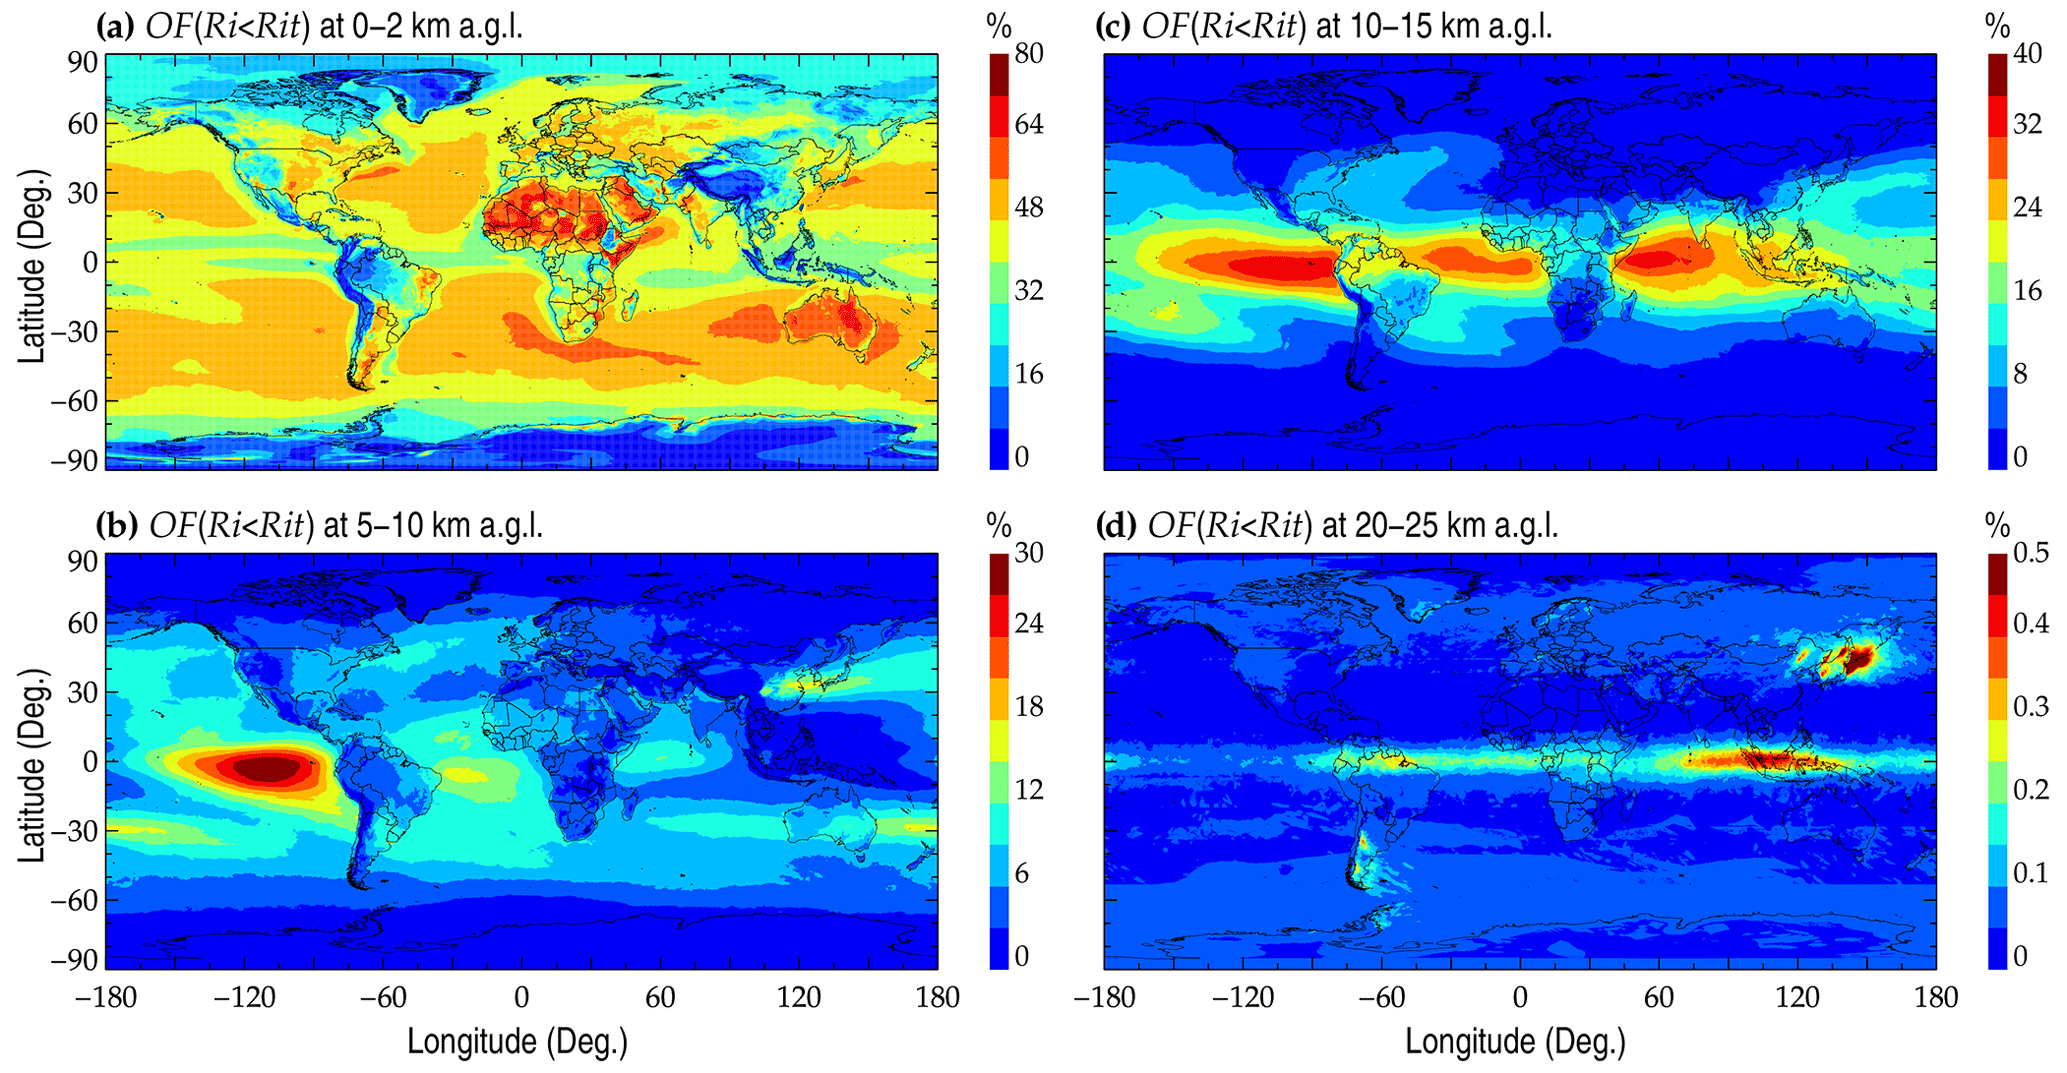
Figure 9The spatial distribution of the mean OF(Ri<Rit) in ERA5 reanalysis at 0–2 (a), 5–10 (b), 10–15 (c), and 20–25 km a.g.l. (d). Note that Rit is set to 1.
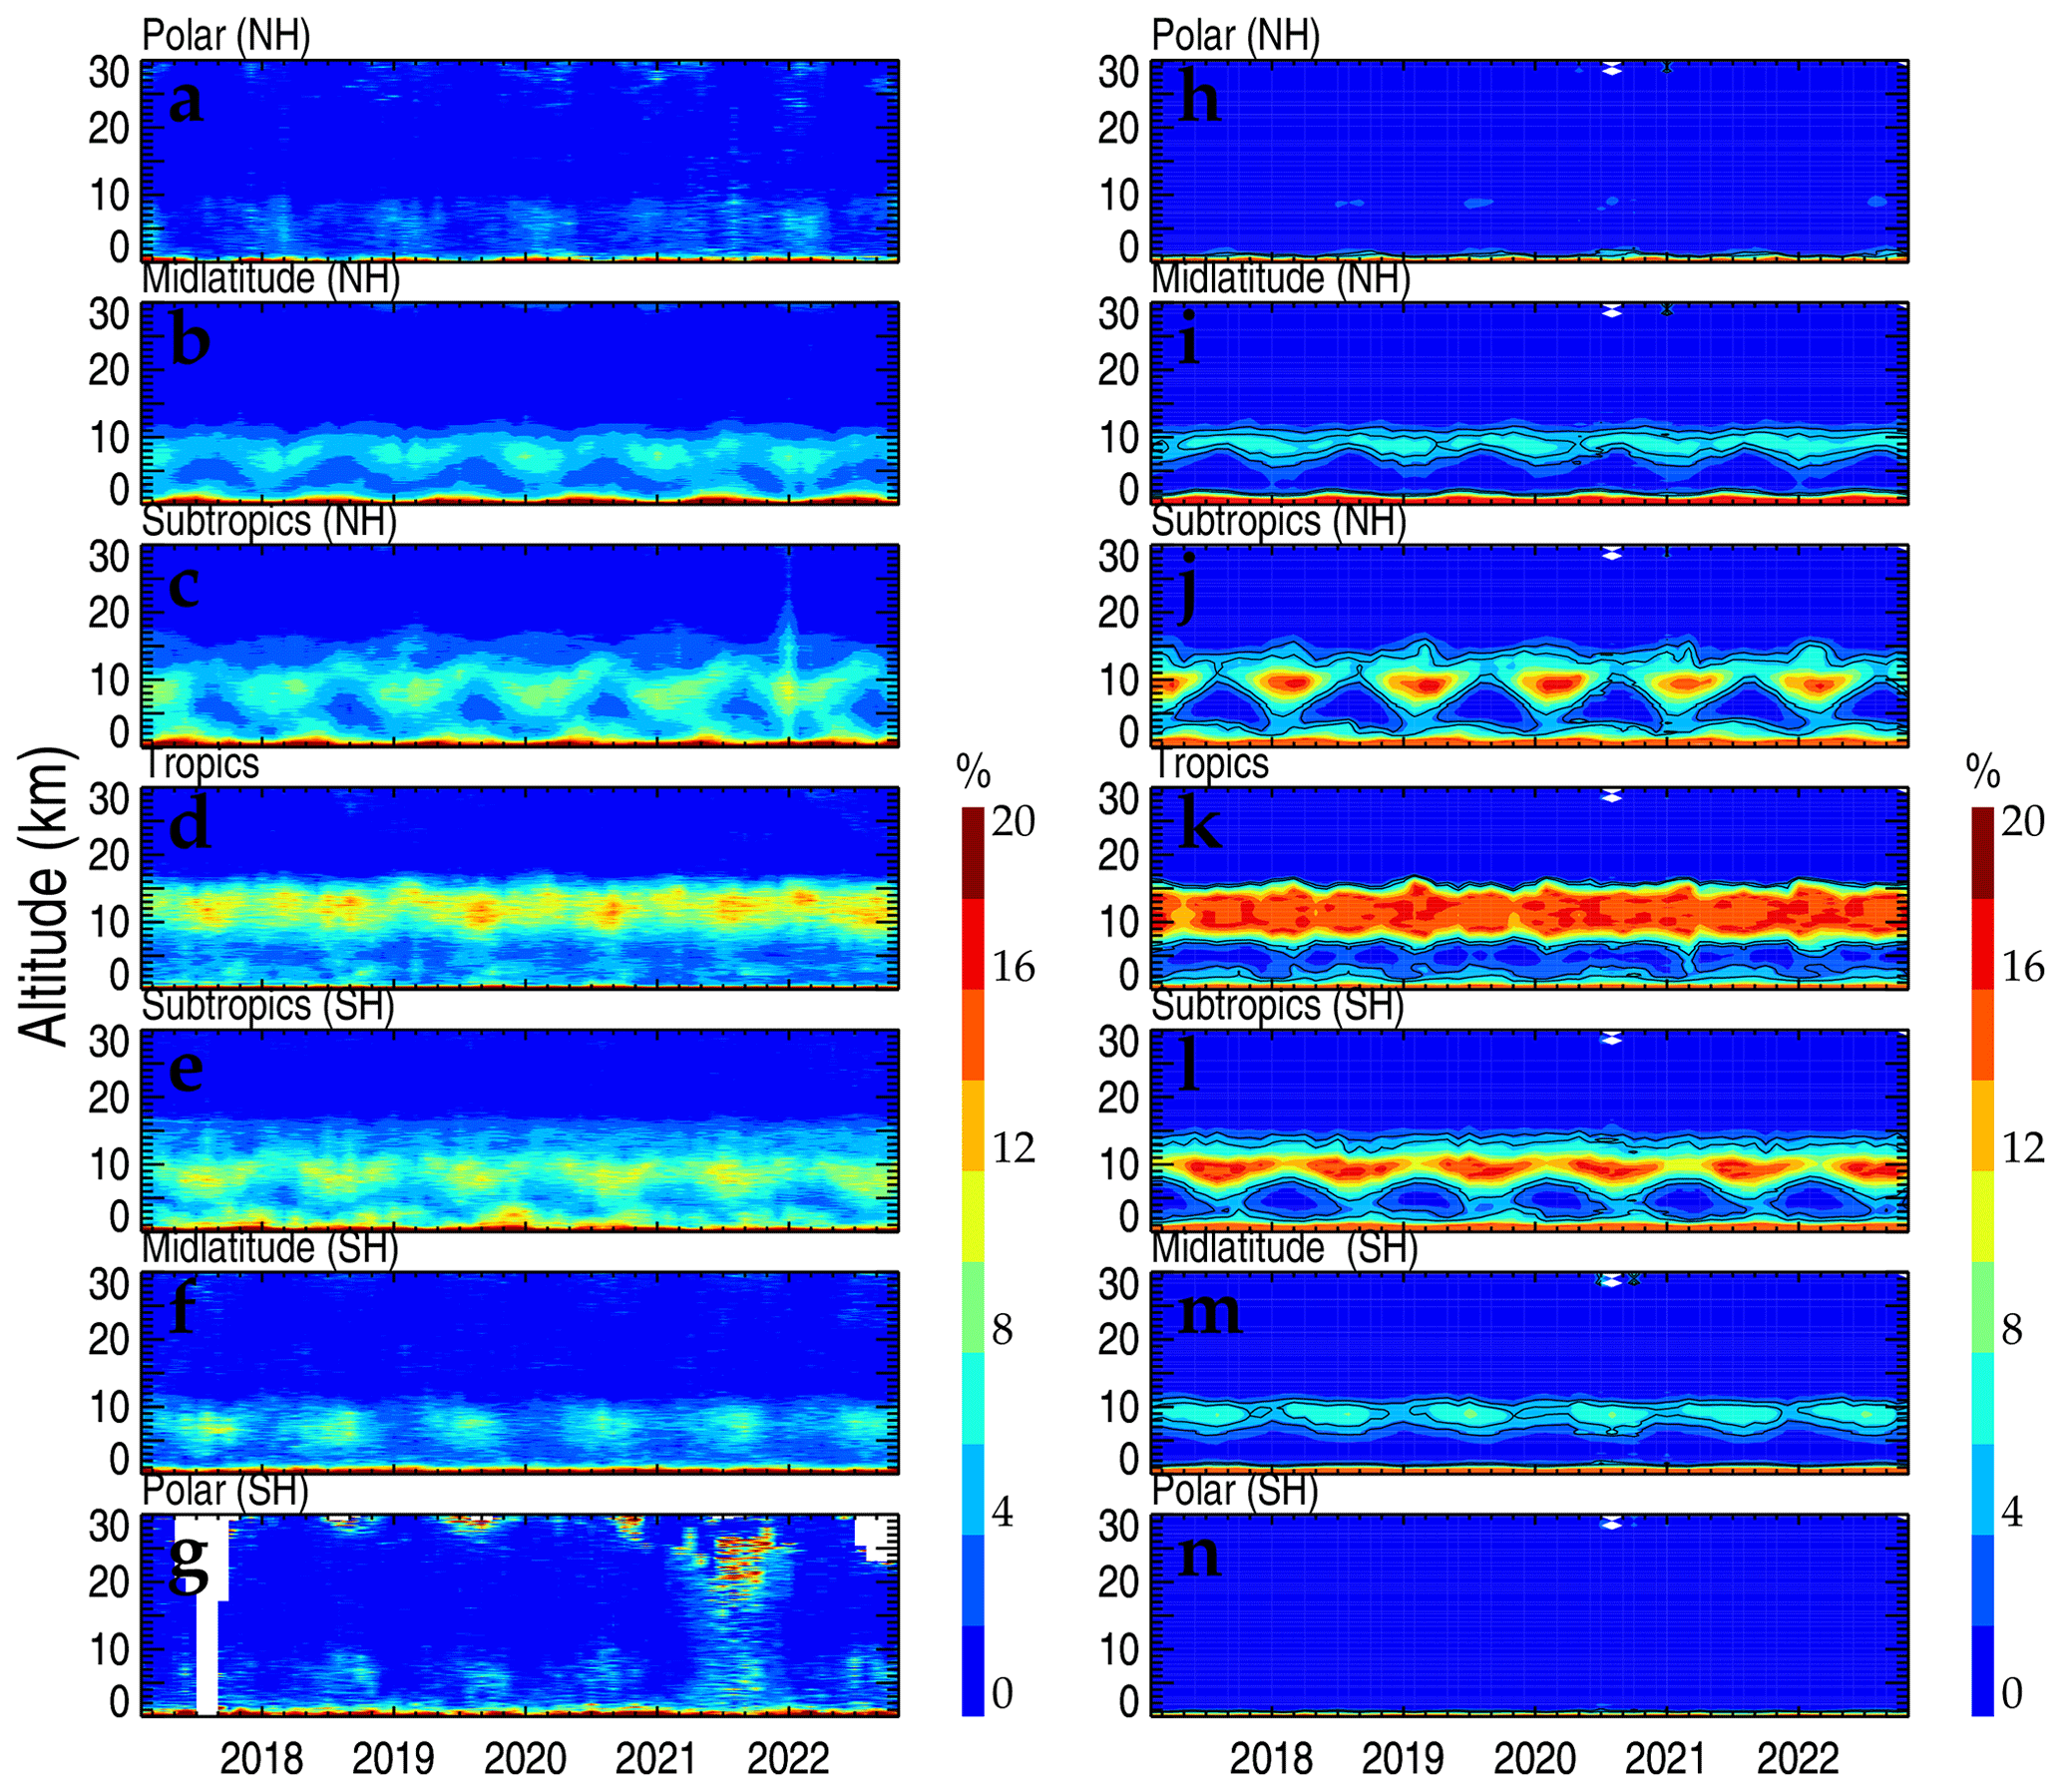
Figure 10The monthly averaged OF(Ri<Rit) in the HVRRS (a–g) and ERA5 reanalysis (h–n) in seven climate zones. NH: Northern Hemisphere; SH: Southern Hemisphere.
In comparison, the spatial–temporal variability in free-tropospheric OF(Ri<Rit) indicated by the HVRRS is fairly consistent with that of ERA5 reanalysis over all climate zones (Fig. 10). Seasonal cycles can be detected by both the HVRRS and the ERA5 reanalysis over all climate zones, especially in the subtropics and midlatitudes. However, the ERA5-based OF(Ri<Rit) can only reflect the large-scale structure of the cycles, and it is hard to quantify the detailed variation with ERA5 like the HVRRS does.
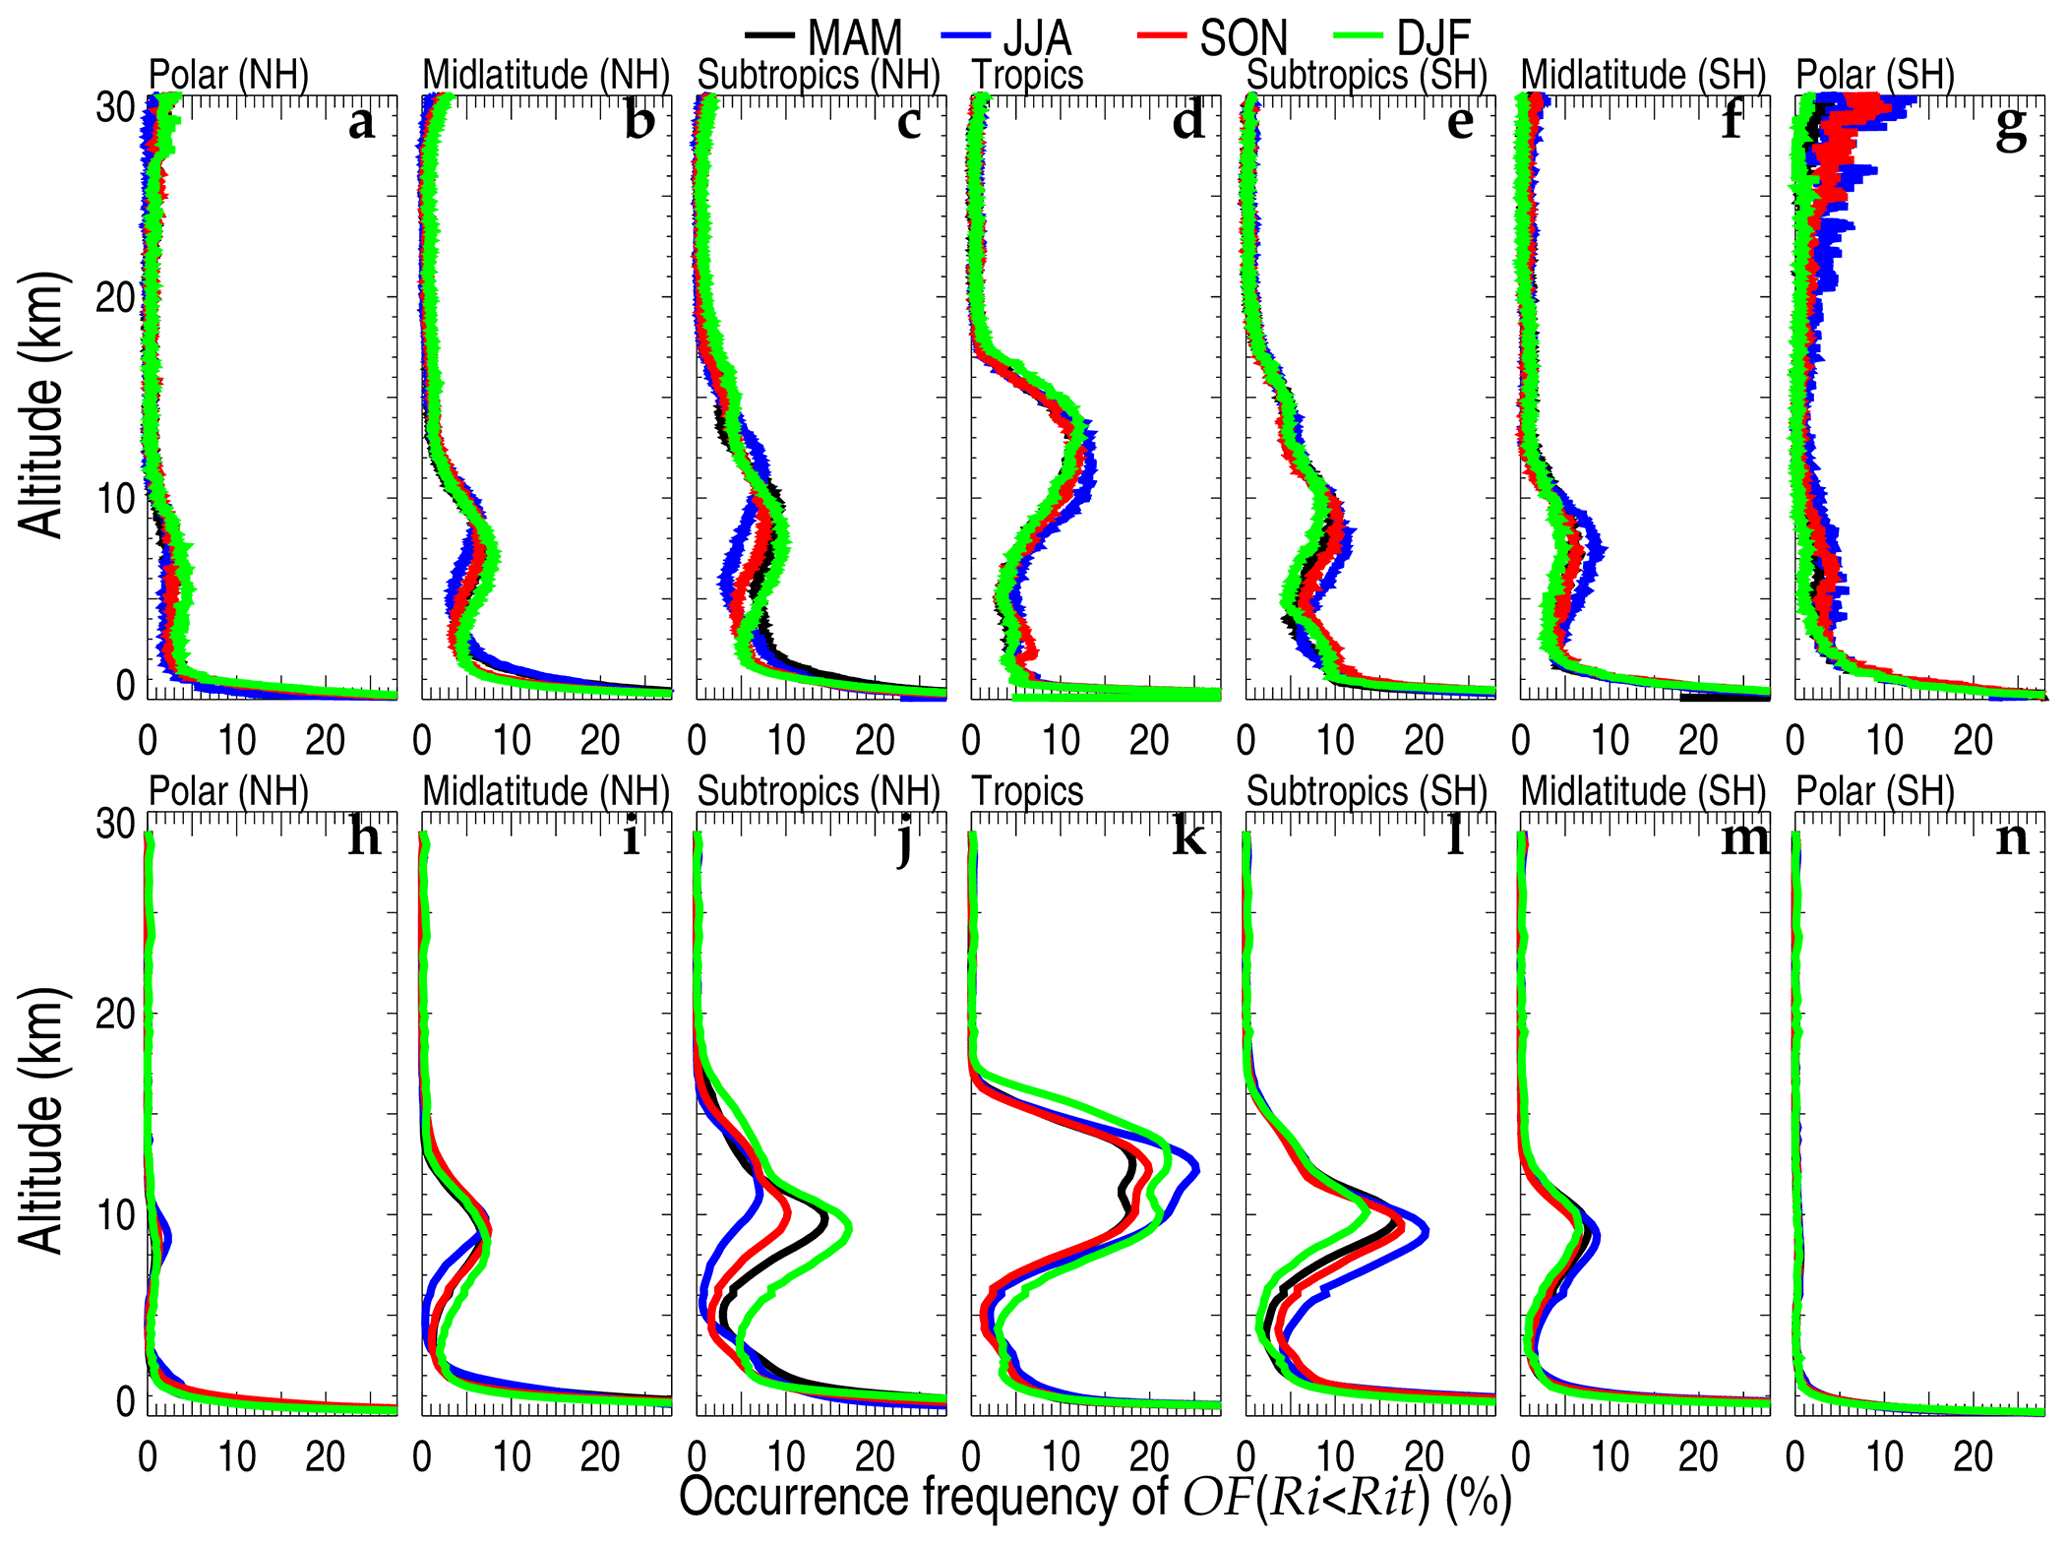
Figure 11The seasonally averaged OF(Ri<Rit) in the HVRRS (a–g) and ERA5 reanalysis (h–m) in seven climate zones. MAM, March–April–May; JJA, June–July–August; SON, September–October–November; DJF, December–January–February. NH: Northern Hemisphere; SH: Southern Hemisphere.
Furthermore, the seasonal variation in OF(Ri<Rit) with for the HVRRS and Rit=1 for ERA5 in all climate zones is provided in Fig. 11. In the midlatitudes and subtropics, OF(Ri<Rit) exhibits maximum values in the low troposphere, as well as a local minimum in the middle troposphere and a local maximum at altitudes around 9 km. In the lower stratosphere, the occurrence frequencies decrease to values of the order of 1 % (Fig. 11b, c, e, and f). In the tropics, a primary peak can be clearly noticed at around 13 km, with a maximum of 12 % for the HVRRS and 20 % for the ERA5 reanalysis (Fig. 11d and k). The seasonality in the tropical region could be related to some large-scale flow features like the summer Asian monsoon and the tropical easterly jet (Roja Raman et al., 2009; Sunilkumar et al., 2015; Kaluza et al., 2021). In polar regions, the tropospheric OF(Ri<Rit) is significantly lower than that of other climate zones, with values ranging from around 4 % at heights of 2–8 km to 1 % in the lower stratosphere (Fig. 11a and g).
In Table 4, the mean OF(Ri<Rit) magnitudes over seven climate zones and in three typical altitude regimes are listed. At 0–2 km a.g.l., the ERA5-based OF(Ri<Rit) is about 24 % larger than that of the HVRRS-based one. At 10–15 km a.g.l., the ERA5-based OF(Ri<Rit) is reasonably well estimated, except that it is overestimated by around 5.92 % in the tropics. In addition, ERA5 underestimates OF(Ri<Rit) by around 0.5 % in the lower stratosphere.
Table 4Similar to Table 1 but for the occurrence frequency of Ri<Rit. Note that Rit is indicated by in radiosonde, but it is identified with 1 in ERA5 reanalysis.
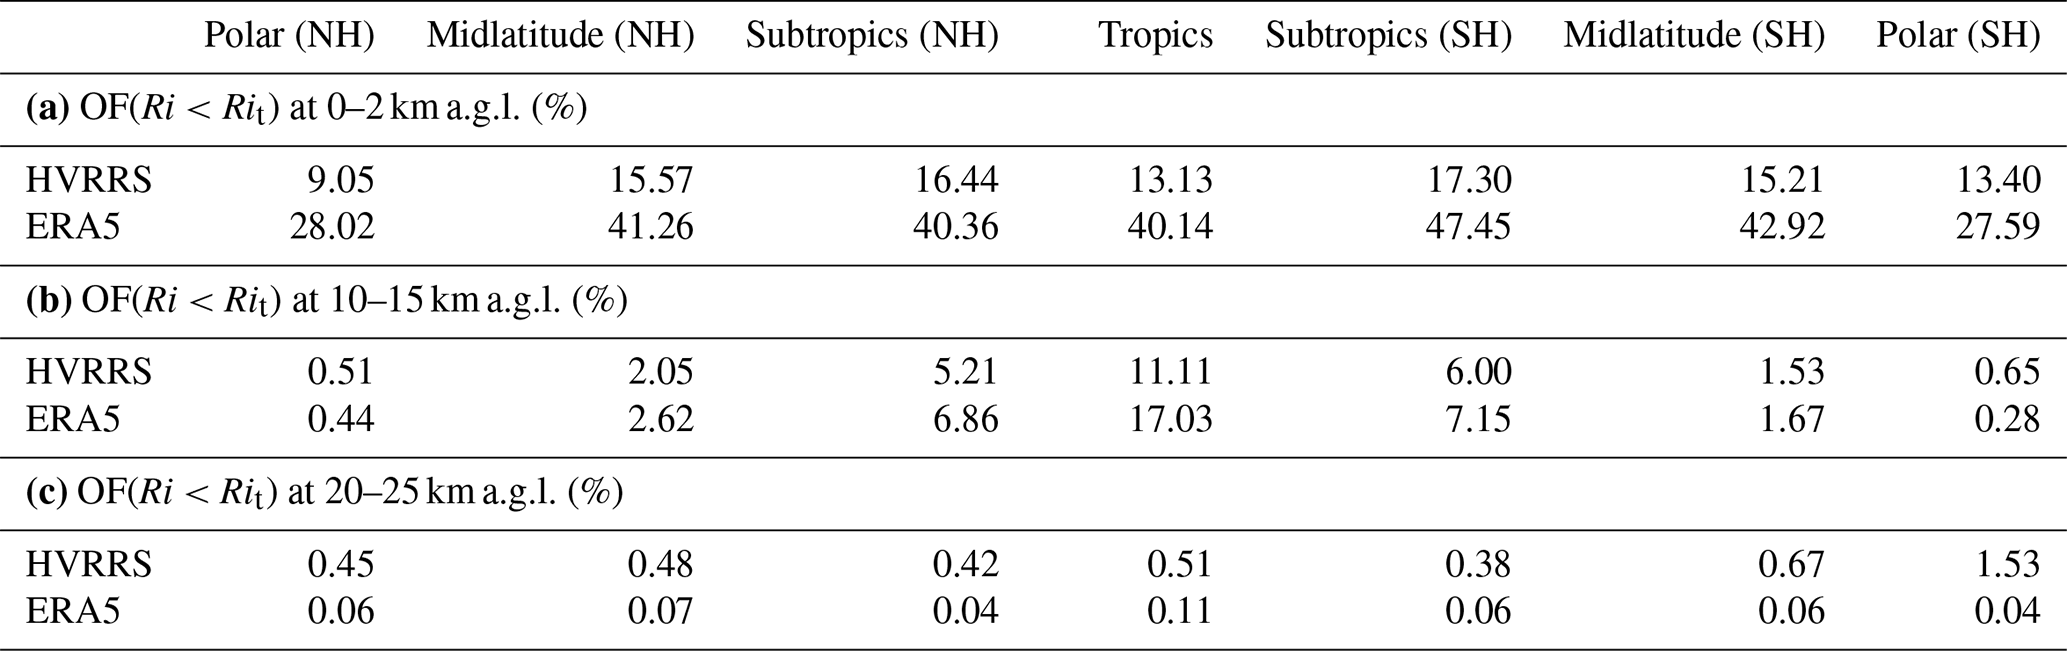
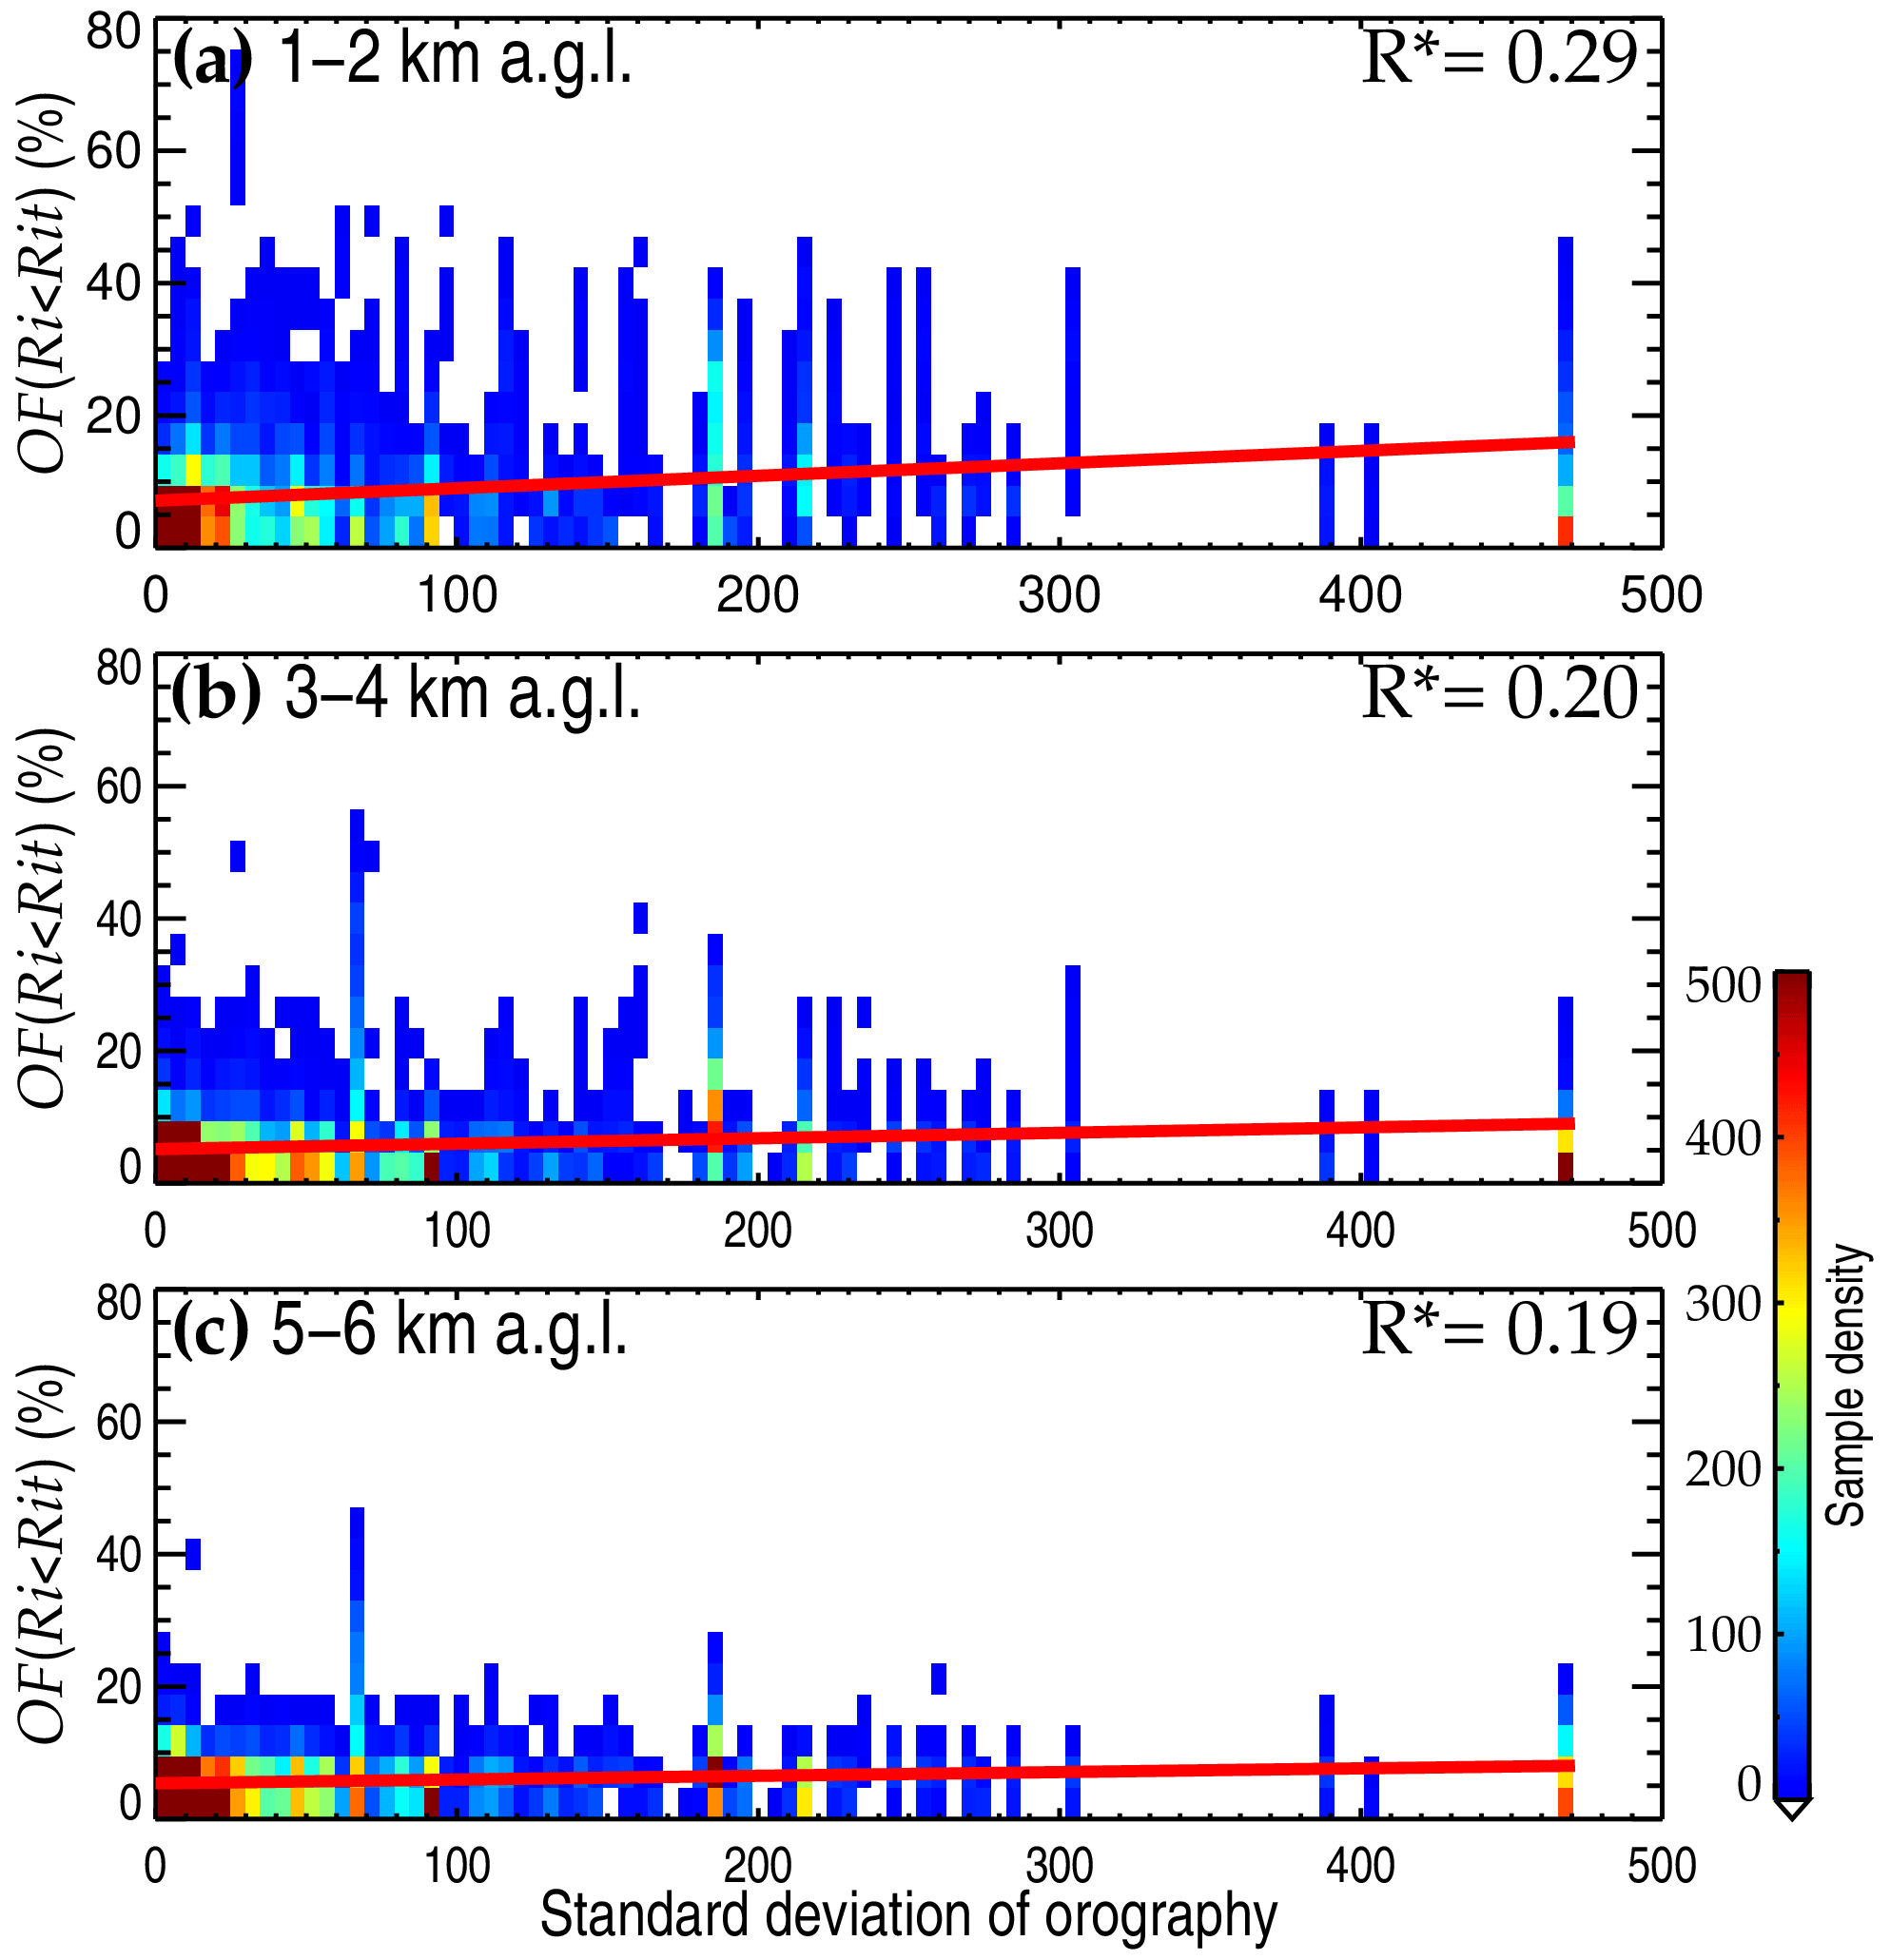
Figure 12The association of HVRRS-determined OF(Ri<Rit) with different standard deviations of orography (dimensionless). Panels (a), (b), and (c) are for height ranges of 1–2, 3–4, and 5–6 km a.g.l., respectively. The correlation coefficients between OF(Ri<Rit) and standard derivation of orography are marked in the top-right corner, where the star superscripts indicate that values are statistically significant (p<0.05).
According to Fig. 9a, it seems that low-level continental OF(Ri<Rit) is dependent on underlying terrains. We investigate the association of low-level HVRRS-determined OF(Ri<Rit) with the standard deviation of orography (SDOR). At heights of 1–2 km a.g.l., the underlying terrain with a large SDOR generally corresponds to a high OF(Ri<Rit), with a correlation coefficient between OF(Ri<Rit) and SDOR of 0.24. Then, the coefficient decreases to 0.15 at 3–4 km a.g.l. (Fig. 12b), and eventually, it equals 0.14 at 5–6 km a.g.l. (Fig. 12c). These findings indicate that complex terrain may locally enhance OF(Ri<Rit).
Moreover, it is quite evident from Figs. 9b and S5 that both OF(Ri<Rit) and OF() are largely enhanced above the tropical ocean associated with the El Niño–Southern Oscillation (ENSO). Most of the enhanced OF(Ri<Rit) can be identified over the Niño-3 region (5∘ N–5∘ S, 150–90∘ W), and the time–height cross section of OF(Ri<Rit) during the years 2000–2022 is illustrated in Fig. 13. OF(Ri<Rit) values in the height region of 6–13 km are evidently large, at around 35 %, which is about 15 % larger than the climatological mean value (Fig. 10k). More specifically, OF(Ri<Rit) during time periods of La Niña events is obviously stronger than that during the El Niño periods. The identification of ENSO events is based on Ren et al. (2018), Li et al. (2022), and Lv et al. (2022). It is also worth recalling here that the wind shear does not exhibit such an anomaly over the Niño-3 region (Fig. 2c), implying that the OF(Ri<Rit) anomaly could likely be attributed to the ENSO-related tropical convective heating in the upper troposphere, leading to a low Brunt–Väisälä frequency.
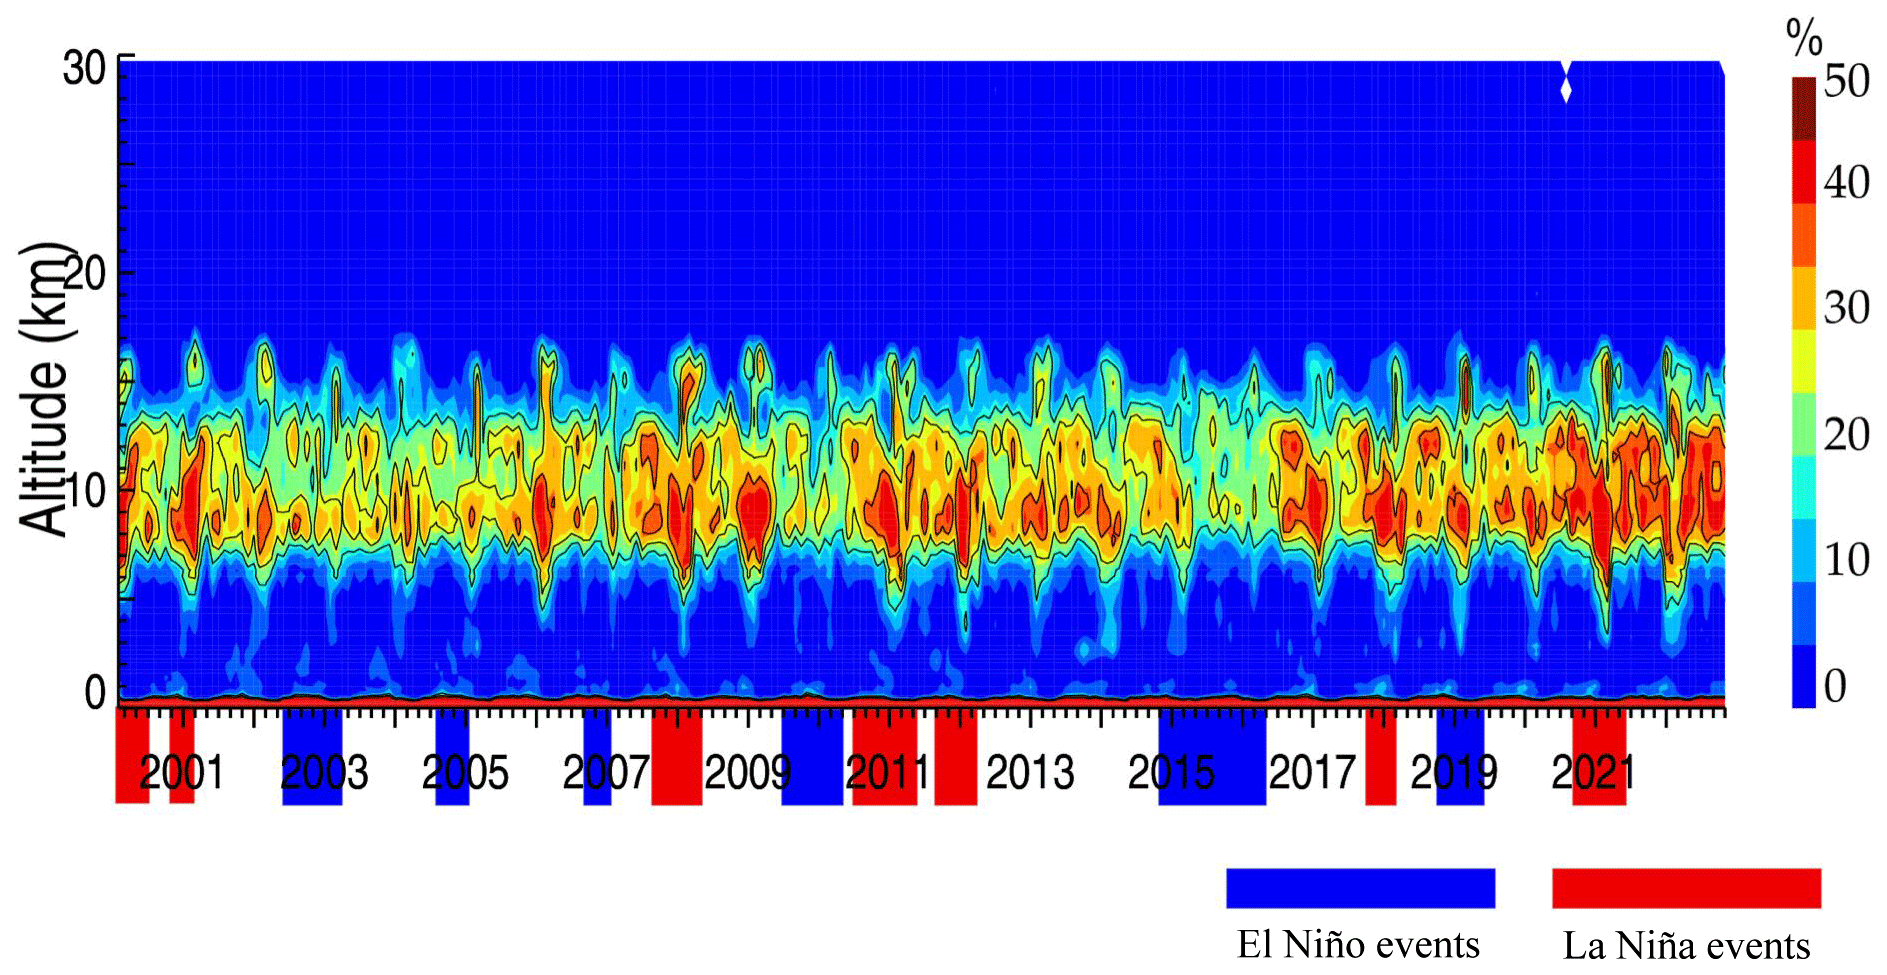
Figure 13The monthly averaged OF(Ri<Rit) in ERA5 reanalysis over the Niño-3 region (5∘ N–5∘ S, 150–90∘ W). The blue and red shading on the time axis indicates the time periods with El Niño and La Niña events, respectively.
3.4 The dynamical environment of OF(Ri<Rit) in the free troposphere
In the free troposphere the percentage of OF(Ri<0) relative to OF(Ri<Rit) is generally less than 20 % (Fig. 8); KHI is preferentially generated from strong wind shears, which may be closely associated with mean flows and wave activities.
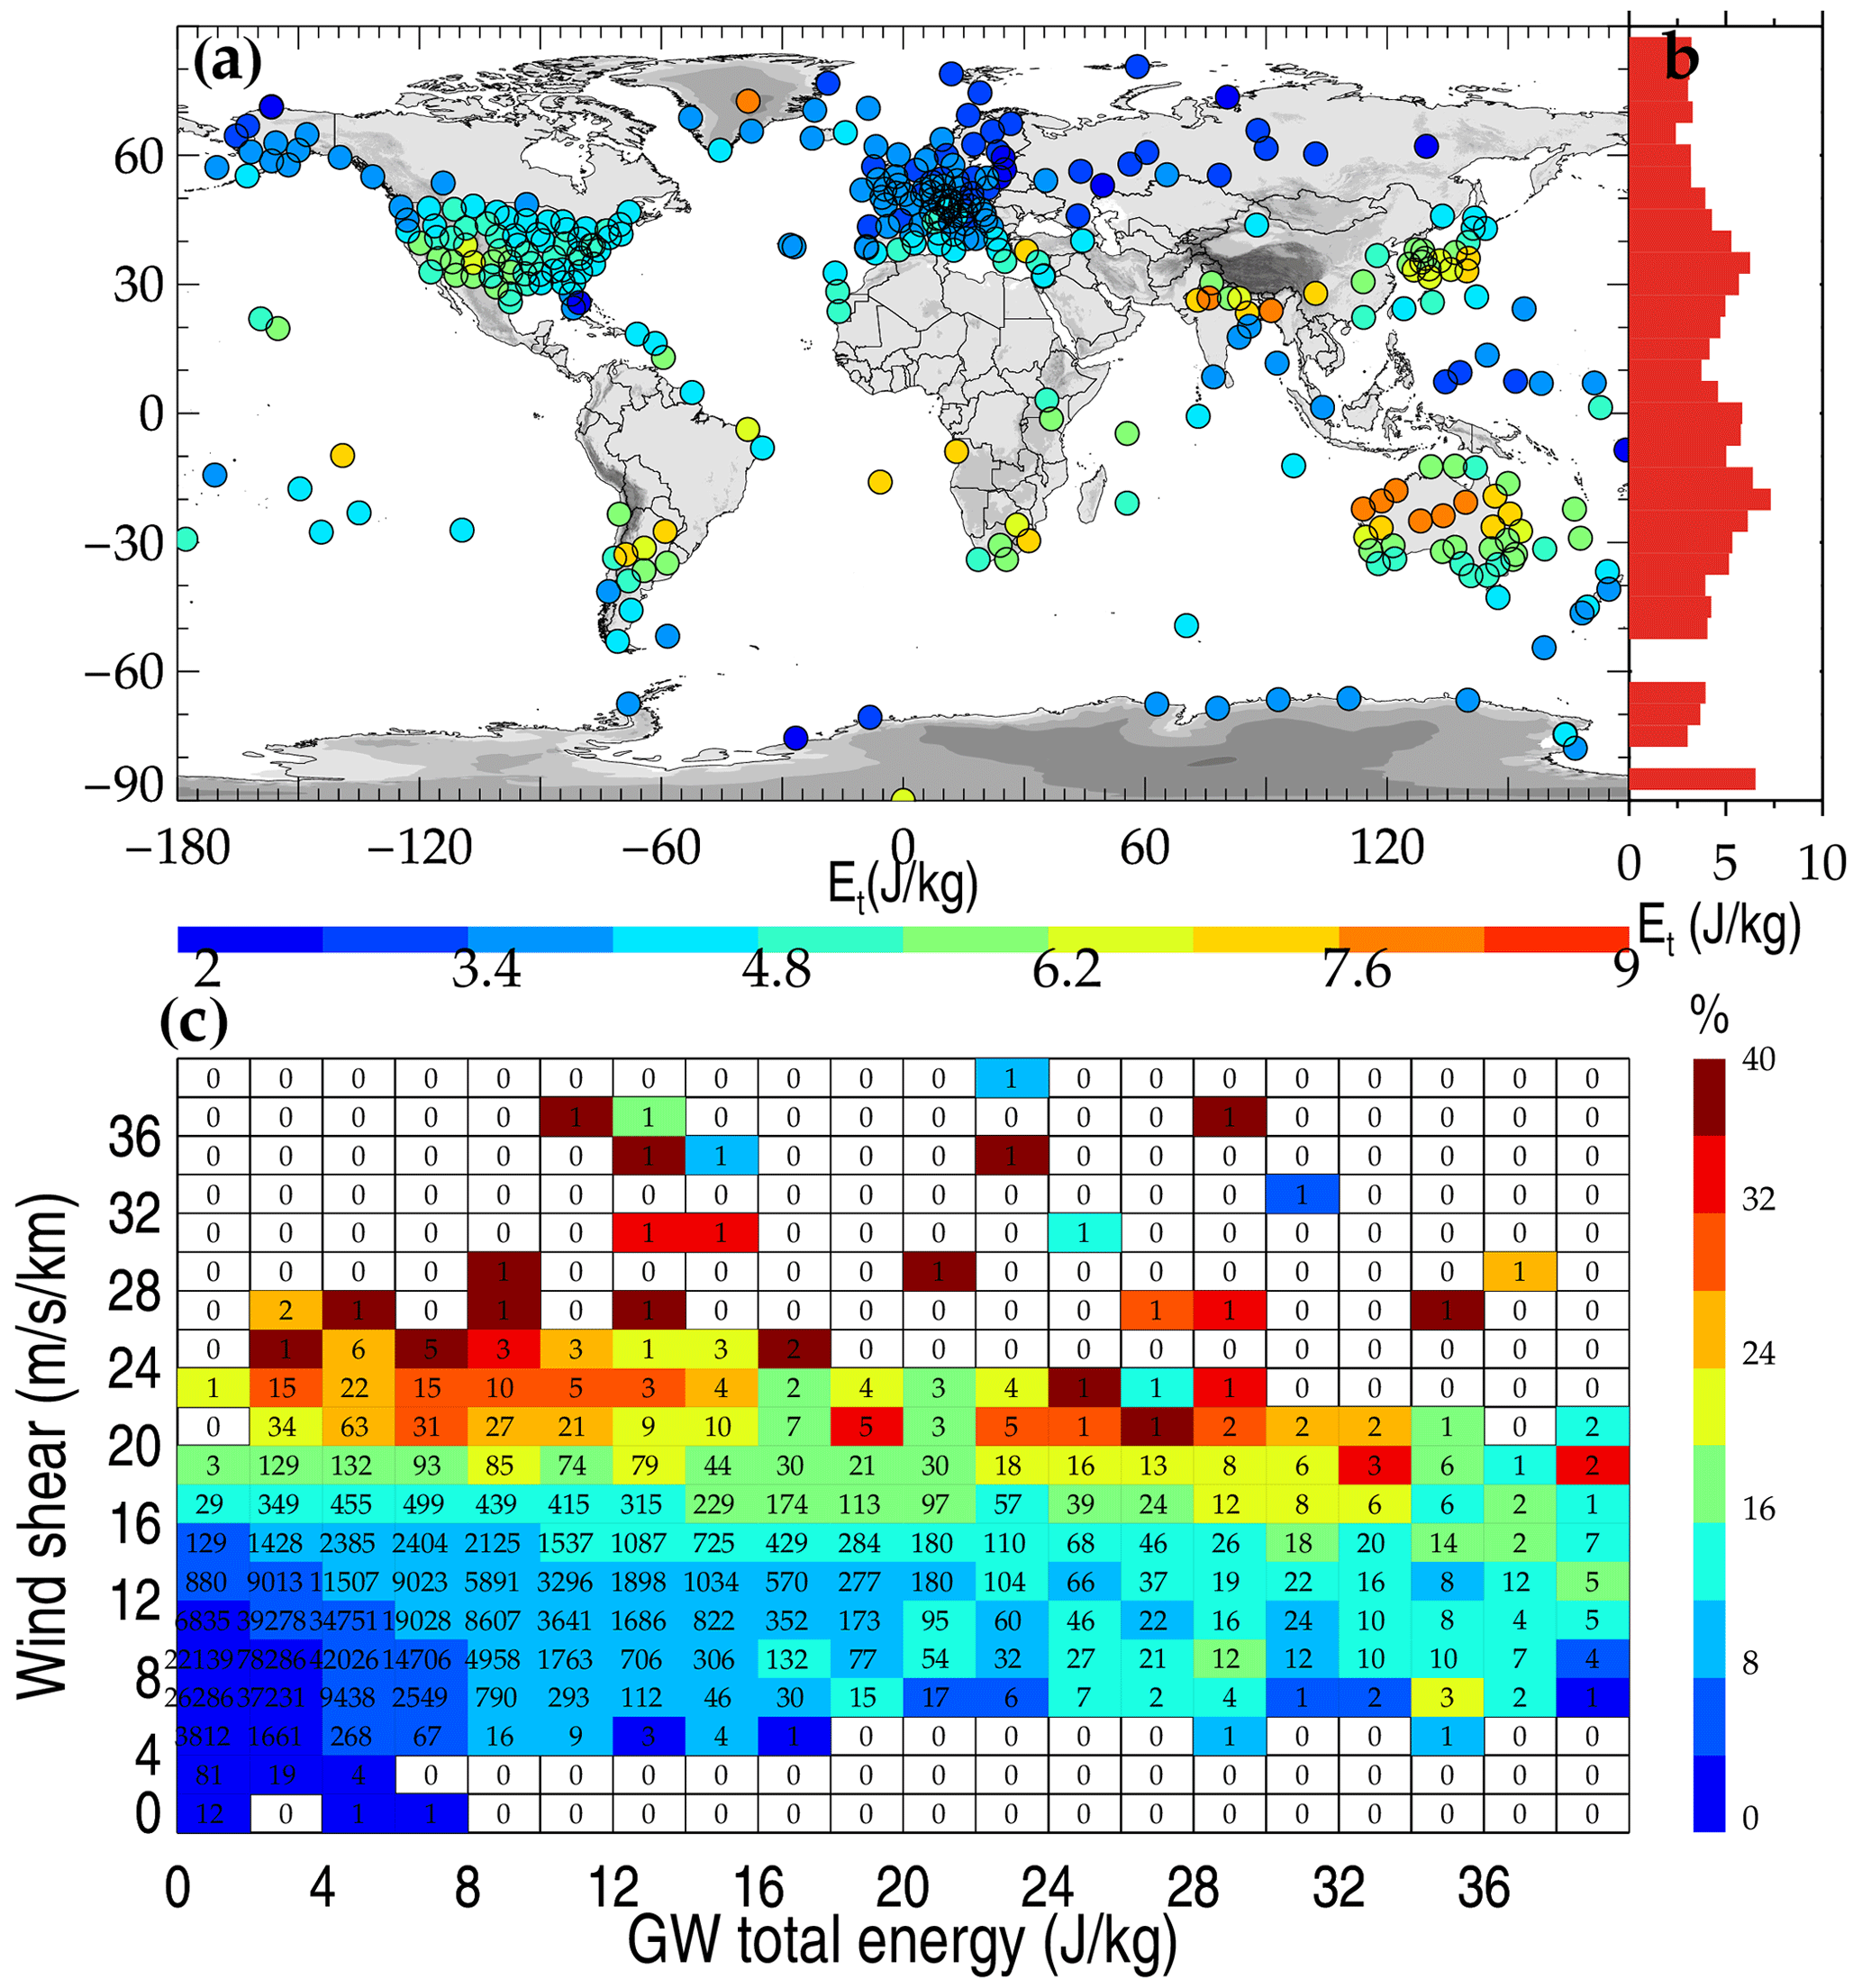
Figure 14Geographical distribution of mean tropospheric GW total energy obtained from the HVRRS (a). The latitudinal variation in mean energy in a grid cell of 5∘ latitude (b). The joint distribution of OF(Ri<Rit) with GW energy and wind shear (c). OF(Ri<Rit) and wind shear are derived from individual HVRRS profiles and vertically averaged over the tropospheric segment that is used for GW study. The numerical number in (c) indicates the matched profile number in each grid, using a bin size of 2 J kg−1 along the x axis and 2 along the y axis.
The propagation of GW could raise strong wind shear and therefore generate KHI. Therefore, we investigate the joint distribution of OF(Ri<Rit) with tropospheric GW total energy and wind shear (Fig. 14). The latitudinal variation in GW total energy exhibits a double-peak structure, with two peaks at around 30∘ in the Northern Hemisphere and Southern Hemisphere (Fig. 14a). The joint distribution of OF(Ri<Rit) with GW energy and wind shear indicates that large OF(Ri<Rit) (for instance, >10 %) generally corresponds to GW energy larger than 10 J kg−1 or to wind shear exceeding 14 (Fig. 14b). Also, OF() exhibits a similar distribution (Fig. S6 in the Supplement). Overall, OF(Ri<Rit) obviously increases with GW total energy (Fig. S9a in the Supplement), possibly implying that the propagation of GWs could enhance wind shears and, therefore, the burst of KHI.
In addition, the interaction between low-level winds and mountain barriers could be a source of orographic GWs (Zhang et al., 2022a). We take orographic GW dissipation in ERA5 reanalysis, which is the accumulated conversion of kinetic energy in the mean flow into heat over the whole atmospheric column, as an indicator of the strength of orographic GWs. It is interesting to note that monthly averaged orographic GW dissipation and monthly ERA5-determined OF(Ri<Rit) at heights from near the ground up to 30 km demonstrate a close association (Fig. S7 in the Supplement). For instance, in the middle troposphere, they are positively associated over mountainous areas such as the Rocky Mountains and the European Alps, with correlation coefficients of around 0.5. These findings also suggest that during months with strong unresolved orographic gravity wave activity, the flow and stability parameters of the resolved flow are then modified, leading to a low Richardson number. Nevertheless, it is hard to quantify the effect of resolved orographic GWs on Ri here.
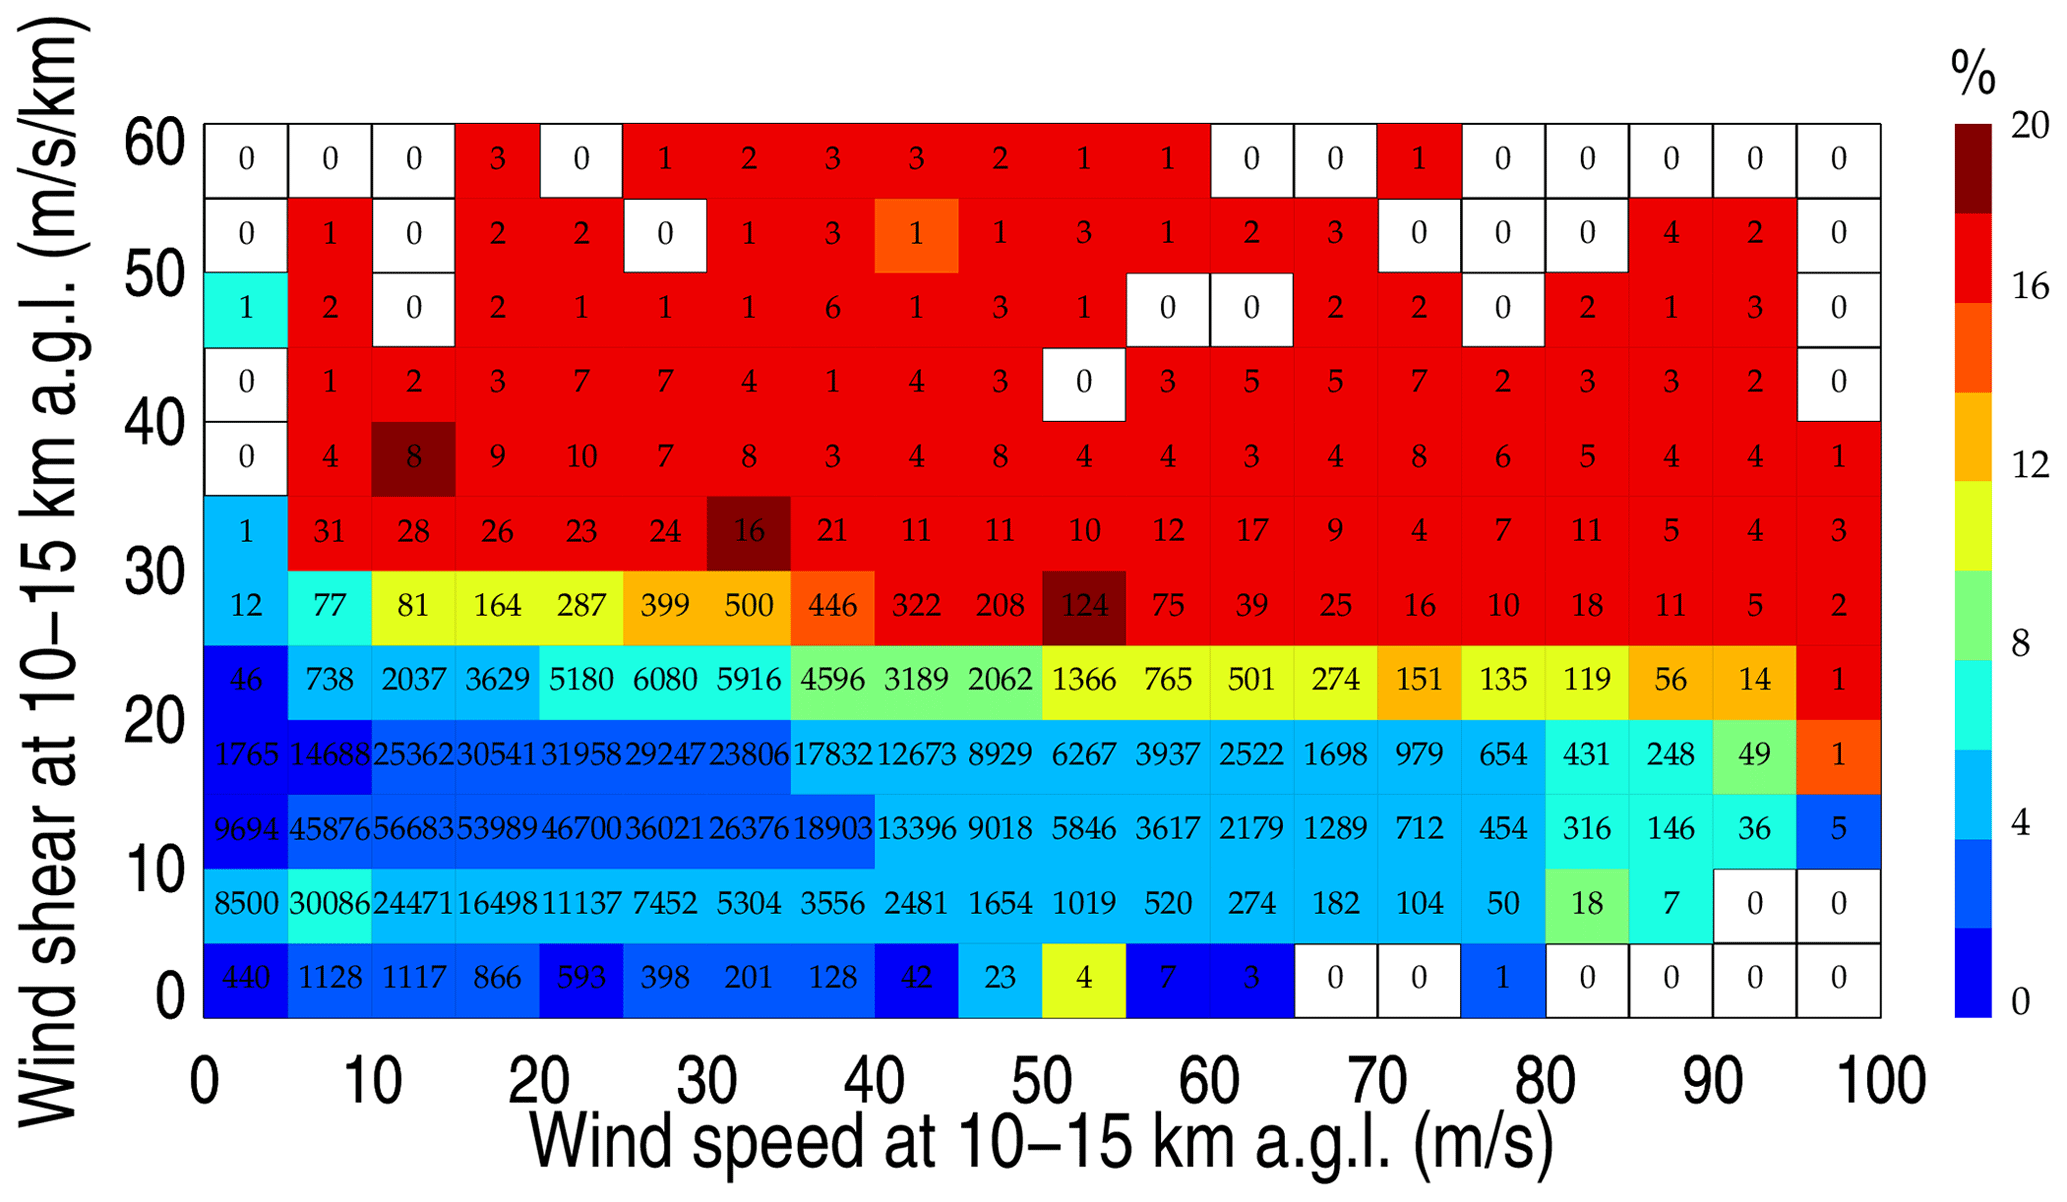
Figure 15Joint distribution of HVRRS-derived wind speed, wind shear, and OF(Ri<Rit), with a bin size of 5 m s−1 along the x axis and 5 along the y axis. Note that all the relationships are based on the mean result of individual profiles at heights of 10–15 km a.g.l. Numbers indicate the matched profile number in each grid.
At jet heights (10–15 km a.g.l.), large shears can be easily induced by strong wind speeds. Figure 15 demonstrates the joint distribution of OF(Ri<Rit) with wind speed and wind shear. Generally, OF(Ri<Rit) larger than 10 % can be easily found when the wind shear exceeds 20 . In addition, OF() gives a similar conclusion (Fig. S8 in the Supplement). In the middle and upper troposphere, OF(Ri<Rit) almost linearly increases with wind speed (Fig. S9b).
In a short conclusion, in the free troposphere, the occurrence of KHI would favor the dynamical environment with intensive orographic or non-orographic GW activities and large mean flows.
The occurrence of KHI is potentially crucial in many ways, such as for aircraft safety and mass transfer, but it is very hard to be globally understood due to its fine structure. The subcritical Richardson number is commonly used as an indictor for KHI. This study uses ERA5 as the latest reanalysis product from ECMWF as well as a comprehensive dataset of high-resolution radiosonde to globally characterize the distribution of low Richardson numbers as a proxy for the occurrence of KHI, for the years 2017 to 2022.
Vertical wind shears are considerably underestimated at almost all heights and over all climate zones by the ERA5 reanalysis compared to the HVRRS. It is noteworthy that vertical wind shear in the ERA5 reanalysis at heights of 10–15 km a.g.l. is dramatically underestimated by around 7.65 , especially at middle latitudes. However, the spatial distribution of the ERA5 shear exhibits a statistically significant positive correlation with the HVRRS shear. As a result, the ERA5-determined occurrence frequency of is significantly underestimated. In addition, it is weakly correlated with HVRRS-determined ones at most heights and over most climate zones.
However, the vertical resolution of ERA5 reanalysis sharply decreases with altitude, which is not comparable with the HVRRS. Thus, to match ERA5 reanalysis at specified height intervals, the HVRRS was vertically interpolated with resolutions spanning 100 to 400 m. Even at a comparable resolution, ERA5-derived shear is underestimated by around 50 %, leading to a considerable underestimation of OF() compared to that derived from radiosondes.
Interestingly, the ERA5-determined occurrence frequency of Ri<1 is generally consistent with the frequency of obtained from the HVRRS, in terms of magnitude and temporal variation. Rather than , we argue that the threshold value of Ri<1 could be more appropriate when using ERA5 reanalysis for KHI study, especially in the middle and upper troposphere over midlatitude and subtropical regions in the Northern Hemisphere and Southern Hemisphere, where a high consistency between the HVRRS and ERA5 has been found in terms of OF(Ri<Rit) magnitude. In other words, for a similar occurrence frequency, the identification of vertical segments with Ri<1 in ERA5 is equitable with the identification of vertical segments with using the HVRRS. It is worth highlighting that the HVRRS experiences a 200 m vertical moving-average procedure to inhabit measurement noises and turbulence fluctuations. Without this procedure, the threshold Ri for the ERA5 reanalysis would be even higher than 1.
The climatology of OF(Ri<Rit) exhibits significant seasonal cycles over all latitudes. A poleward decrease can be clearly identified in the middle and upper troposphere. In addition, over mountainous areas, complex terrains may locally enhance low-level OF(Ri<Rit). Moreover, it is immediately obvious that both OF(Ri<Rit) and OF() in the middle and upper troposphere of the Niño-3 region are considerably enhanced, probably by the tropical convective heating.
Moreover, both OF(Ri<Rit) and OF() exhibit a close relationship with GW activities and background mean flows. Large OF(Ri<Rit) favors intensive GW activities and strong mean flow. Over complex terrains, the orographic GW breaking could locally enhance OF(Ri<Rit).
Those findings are valuable for pointing out the performance of the ERA5 reanalysis in terms of resolving low Richardson numbers as a proxy for KHI in comparison with a near-global high-resolution radiosonde measurement. In addition, the spatial–temporal variability in OF(Ri<Rit) over different climate zones from near the ground up to 30 km is quantitatively characterized by ERA5 and the HVRRS, which could provide new insights that increase our understanding of the fine structure of upper air.
The dataset can be accessed at https://www.ecmwf.int/en/forecasts/dataset/ecmwf-reanalysis-v5 (ECMWF, 2022).
The supplement related to this article is available online at: https://doi.org/10.5194/acp-23-12589-2023-supplement.
JZ conceptualized this study. JS and JZ carried out the analysis with comments from the other co-authors. JZ wrote the original manuscript. WW, SZ, TY, and WD provided useful suggestions for the study. All authors contributed to the improvement of the paper.
The contact author has declared that none of the authors has any competing interests.
Publisher's note: Copernicus Publications remains neutral with regard to jurisdictional claims in published maps and institutional affiliations.
The authors would like to acknowledge the National Meteorological Information Centre (NMIC) of CMA, NOAA, the Deutscher Wetterdienst (Climate Data Center), the UK Centre for Environmental Data Analysis (CEDA), GRUAN, ECMWF, and the University of Wyoming for continuously collecting and generously providing high-resolution radiosonde data. Last but not least, we would like to thank the two anonymous reviewers for their excellent comments that greatly helped to improve our work.
This study is jointly supported by the National Natural Science Foundation of China (grant nos. 42205074, 62101203, and 42127805), the Hubei Provincial Natural Science Foundation of China (grant no. 2021CFB459), and Huazhong Agricultural University Research Grants (grant nos. 2662021XXQD002 and 2662021JC008).
This paper was edited by Aurélien Podglajen and reviewed by two anonymous referees.
Alexander, M. J.: Interpretations of observed climatological patterns in stratospheric gravity wave variance, J. Geophys. Res.-Atmos., 103, 8627–8640, https://doi.org/10.1029/97JD03325, 1998.
Duruisseau, F., Huret, N., Andral, A., and Camy-Peyret, C.: Assessment of the ERA-Interim winds using high-altitude stratospheric balloons, J. Atmos. Sci., 74, 2065–2080, https://doi.org/10.1175/JAS-D-16-0137.1, 2017.
ECMWF: ECMWF Reanalysis v5 (ERA5), European Centre for Medium-Range Weather Forecasts [data set], https://www.ecmwf.int/en/forecasts/dataset/ecmwf-reanalysis-v5, last access: 7 December 2022.
Fritts, D. C. and Rastogi, P. K.: Convective and dynamical instabilities due to gravity wave motions in the lower and middle atmosphere: Theory and observations, Radio Sci., 20, 1247–1277, https://doi.org/10.1029/RS020i006p01247, 1985.
Fritts, D. C., Franke, P. M., Wan, K., Lund, T., and Werne, J.: Computation of clear-air radar backscatter from numerical simulations of turbulence: 2. Backscatter moments throughout the lifecycle of a Kelvin Helmholtz instability, J. Geophys. Res., 116, D11105, https://doi.org/10.1029/2010JD014618, 2011.
Fritts, D. C., Wan, K., Werne, J., Lund, T., and Hecht, J. H.: Modeling the implications of Kelvin-Helmholtz instability dynamics for airglow observations, J. Geophys. Res.-Atmos., 119, 8858–8871, https://doi.org/10.1002/2014JD021737, 2014.
Fritts, D. C., Wang, L., Lund, T. S., Thorpe, S. A., Kjellstrand, C. B., Kaifler, B., and Kaifler, N.: Multi-Scale Kelvin-Helmholtz instability dynamics observed by PMC Turbo on 12 July 2018: 2. DNS modeling of KHI dynamics and PMC responses, J. Geophys. Res.-Atmos., 127, e2021JD035834, https://doi.org/10.1029/2021JD035834, 2022.
Gavrilov, N. M., Luce, H., Crochet, M., Dalaudier, F., and Fukao, S.: Turbulence parameter estimations from high-resolution balloon temperature measurements of the MUTSI-2000 campaign, Ann. Geophys., 23, 2401–2413, https://doi.org/10.5194/angeo-23-2401-2005, 2005.
Grasmick, C. and Geerts, B.: Detailed dual-Doppler structure of Kelvin–Helmholtz waves from an airborne profiling radar over complex terrain. Part I: Dynamic structure, J. Atmos. Sci., 77, 1761–1782, https://doi.org/10.1175/JAS-D-19-0108.1, 2020.
Gu, L., Yin, J., Gentine, P., Wang, H., Slater, L. J., Sullivan, S. C., Chen, J., Zscheischler, J., and Guo, S.: Large anomalies in future extreme precipitation sensitivity driven by atmospheric dynamics, Nat. Commun., 14, 3197, https://doi.org/10.1038/s41467-023-39039-7, 2023.
Guo, J., Zhang, J., Yang, K., Liao, H., Zhang, S., Huang, K., Lv, Y., Shao, J., Yu, T., Tong, B., Li, J., Su, T., Yim, S. H. L., Stoffelen, A., Zhai, P., and Xu, X.: Investigation of near-global daytime boundary layer height using high-resolution radiosondes: first results and comparison with ERA5, MERRA-2, JRA-55, and NCEP-2 reanalyses, Atmos. Chem. Phys., 21, 17079–17097, https://doi.org/10.5194/acp-21-17079-2021, 2021.
Haack, A., Gerding, M., and Lübken, F.-J.: Characteristics of stratospheric turbulent layers measured by LITOS and their relation to the Richardson number, J. Geophys. Res.-Atmos., 119, 10605–10618, https://doi.org/10.1002/2013JD021008, 2014.
Hersbach, H., Bell, B., Berrisford, P., Hirahara, S., Horányi, A., Muñoz-Sabater, J., Nicolas, J., Peubey, C., Radu, R., Schepers, D., Simmons, A., Soci, C., Abdalla, S., Abellan, X., Balsamo, G., Bechtold, P., Biavati, G., Bidlot, J., Bonavita, M., De Chiara, G., Dahlgren, P., Dee, D., Diamantakis, M., Dragani, R., Flemming, J., Forbes, R., Fuentes, M., Geer, A., Haimberger, L., Healy, S., Hogan, R. J., Hólm, E., Janisková, M., Keeley, S., Laloyaux, P., Lopez, P., Lupu, C., Radnoti, G., de Rosnay, P., Rozum, I., Vamborg, F., Villaume, S., and Thépaut, J.-N.: The ERA5 global reanalysis, Q. J. Roy. Meteor. Soc., 146, 1999–2049, https://doi.org/10.1002/qj.3803, 2020.
Homeyer, C. R., Pan, L. L., and Barth, M. C.: Transport from convective overshooting of the extratropical tropopause and the role of large-scale lower stratospheric stability, J. Geophys. Res.-Atmos., 119, 2220–2240, https://doi.org/10.1002/2013JD020931, 2014.
Houchi, K., Stoffelen, A., Marseille, G. J., and De Kloe, J.: Comparison of wind and wind shear climatologies derived from high-resolution radiosondes and the ECMWF model, J. Geophys. Res.-Atmos., 115, D22123, https://doi.org/10.1029/2009JD013196, 2010.
Houze Jr., R. A.: Cloud clusters and large-scale vertical motions in the tropics, J. Meteorol. Soc. Jpn., 60, 396–410, https://doi.org/10.2151/jmsj1965.60.1_396, 1982.
Ingleby, B., Motl, M., Marlton, G., Edwards, D., Sommer, M., von Rohden, C., Vömel, H., and Jauhiainen, H.: On the quality of RS41 radiosonde descent data, Atmos. Meas. Tech., 15, 165–183, https://doi.org/10.5194/amt-15-165-2022, 2022.
Jaeger, E. B. and Sprenger, M.: A Northern Hemispheric climatology of indices for clear air turbulence in the tropopause region derived from ERA40 reanalysis data, J. Geophys. Res., 112, D20106, https://doi.org/10.1029/2006JD008189, 2007.
Kaluza, T., Kunkel, D., and Hoor, P.: On the occurrence of strong vertical wind shear in the tropopause region: a 10 year ERA5 northern hemispheric study, Weather Clim. Dynam., 2, 631–651, https://doi.org/10.5194/wcd-2-631-2021, 2021.
Ko, H. C. and Chun, H. Y.: Potential sources of atmospheric turbulence estimated using the Thorpe method and operational radiosonde data in the United States, Atmos. Res., 265, 105891, https://doi.org/10.1016/j.atmosres.2021.105891, 2022.
Ko, H. C., Chun, H. Y., Wilson, R., and Geller, M. A.: Characteristics of atmospheric turbulence retrieved from high vertical-resolution radiosonde data in the United States, J. Geophys. Res.-Atmos., 124, 7553–7579, https://doi.org/10.1029/2019JD030287, 2019.
Kunkel, D., Hoor, P., Kaluza, T., Ungermann, J., Kluschat, B., Giez, A., Lachnitt, H.-C., Kaufmann, M., and Riese, M.: Evidence of small-scale quasi-isentropic mixing in ridges of extratropical baroclinic waves, Atmos. Chem. Phys., 19, 12607–12630, https://doi.org/10.5194/acp-19-12607-2019, 2019.
Lazarus, S. M., Chiappa, J., Besing, H., Splitt, M. E., and Riousset, J. A.: Distinguishing characteristics of the tropical cyclone gigantic jet environment, J. Atmos. Sci., 78, 2741–2761, https://doi.org/10.1175/JAS-D-20-0265.1, 2021.
Lee, J. H., Kim, J.-H., Sharman, R. D., Kim, J., and Son, S.-W.: Climatology of Clear-Air Turbulence in upper troposphere and lower stratosphere in the Northern Hemisphere using ERA5 reanalysis data, J. Geophys. Res.-Atmos., 128, e2022JD037679, https://doi.org/10.1029/2022JD037679, 2023.
Lee, S. H., Williams, P. D., and Frame, T. H.: Increased shear in the North Atlantic upper-level jet stream over the past four decades, Nature, 572, 639–642, https://doi.org/10.1038/s41586-019-1465-z, 2019.
Li, X., Hu, Z. Z., Tseng, Y. H., Liu, Y., and Liang, P.: A historical perspective of the La Niña event in 2020/2021, J. Geophys. Res.-Atmos., 127, e2021JD035546, https://doi.org/10.1029/2021JD035546, 2022.
Lv, A., Fan, L., and Zhang, W.: Impact of ENSO Events on Droughts in China, Atmosphere, 13, 1764, https://doi.org/10.3390/atmos13111764, 2022.
Muschinski, A. and Wode, C.: First in situ evidence for coexisting submeter temperature and humidity sheets in the lower free troposphere, J. Atmos. Sci., 55, 2893–2906, https://doi.org/10.1175/1520-0469(1998)055<2893:FISEFC>2.0.CO;2, 1998.
North, G. R., Pyle, J. A., and Zhang, F.: Encyclopedia of atmospheric sciences, Academic Press, Cambridge, Massachusetts, United States, 224 pp., ISBN 9780123822260, 2014.
Plougonven, R. and Zhang, F.: Internal gravity waves from atmospheric jets and fronts, Rev. Geophys., 52, 33–76, https://doi.org/10.1002/2012RG000419, 2014.
Ren, H. L., Lu, B., Wan, J., Tian, B., and Zhang, P.: Identification standard for ENSO events and its application to climate monitoring and prediction in China, J. Meteorol. Res.-PRC, 32, 923–936, https://doi.org/10.1007/s13351-018-8078-6, 2018.
Roja Raman, M., Jagannadha Rao, V. V., Venkat Ratnam, M., Rajeevan, M., Rao, S. V., Narayana Rao, D., and Prabhakara Rao, N.: Characteristics of the Tropical Easterly Jet: Long-term trends and their features during active and break monsoon phases, J. Geophys. Res.-Atmos., 114, 1–14, https://doi.org/10.1029/2009JD012065, 2009.
Sandu, I., van Niekerk, A., Shepherd, T. G., Vosper, S. B., Zadra, A., Bacmeister, J., Beljaars, A., Brown, A. R., Dörnbrack, A., McFarlane, N., Pithan, F., and Svensson, G.: Impacts of orography on large-scale atmospheric circulation, npj Clim. Atmos. Sci., 2, 1–8, https://doi.org/10.1038/s41612-019-0065-9, 2019.
Savazzi, A. C. M., Nuijens, L., Sandu, I., George, G., and Bechtold, P.: The representation of the trade winds in ECMWF forecasts and reanalyses during EUREC4A, Atmos. Chem. Phys., 22, 13049–13066, https://doi.org/10.5194/acp-22-13049-2022, 2022.
Sharman, R. D. and Pearson, J. M: Prediction of energy dissipation rates for aviation turbulence. Part I: Forecasting nonconvective turbulence, J. Appl. Meteorol. Clim., 56, 317–337, https://doi.org/10.1175/JAMC-D-16-0205.1, 2017.
Sharman, R. D., Trier, S. B., Lane, T. P., and Doyle, J. D.: Sources and dynamics of turbulence in the upper troposphere and lower stratosphere: A review, Geophys. Res. Lett., 39, L12803, https://doi.org/10.1029/2012GL051996, 2012.
Song, J., Wang, Z.-H., and Wang, C.: The regional impact of urban heat mitigation strategies on planetary boundary layer dynamics over a semiarid city, J. Geophys. Res.-Atmos., 123, 6410–6422, https://doi.org/10.1029/2018JD028302, 2018.
Sunilkumar, S. V., Muhsin, M., Parameswaran, K., Venkat Ratnam, M., Ramkumar, G., Rajeev, K., Krishna Murthy, B. V., Sambhu Namboodiri, K. V., Subrahmanyam, K. V., Kishore Kumar, K., and Shankar Das, S.: Characteristics of turbulence in the troposphere and lower stratosphere over the Indian Peninsula, J. Atmos. Sol.-Terr. Phy., 133, 36–53, https://doi.org/10.1016/j.jastp.2015.07.015, 2015.
Wang, L. and Geller, M. A.: Morphology of gravity-wave energy as observed from 4 years (1998–2001) of high vertical resolution U. S. radiosonde data, J. Geophys. Res.-Atmos., 108, 4489, https://doi.org/10.1029/2002JD002786, 2003.
Wang, L., Geller, M. A., and Alexander, M. J.: Spatial and Temporal Variations of Gravity Wave Parameters, Part I: Intrinsic Frequency, Wavelength, and Vertical Propagation Direction, J. Atmos. Sci., 62, 125–142, https://doi.org/10.1175/JAS-3364.1, 2005.
Williams, P. D. and Joshi, M. M.: Intensification of winter transatlantic aviation turbulence in response to climate change, Nat. Clim. Change, 3, 644–648, https://doi.org/10.1038/nclimate1866, 2013.
Xia, P., Shan, Y., Ye, S., and Jiang, W.: Identification of Tropopause Height with Atmospheric Refractivity, J. Atmos. Sci., 78, 3–16, https://doi.org/10.1175/JAS-D-20-0009.1, 2021.
Zhang, J., Zhang, S. D., Huang, C. M., Huang, K. M., Gong, Y., Gan, Q., and Zhang, Y. H.: Latitudinal and topographical variabilities of free atmospheric turbulence from high-resolution radiosonde data sets, J. Geophys. Res.-Atmos., 124, 4283–4298, https://doi.org/10.1029/2018JD029982, 2019.
Zhang, J., Guo, J., Xue, H., Zhang, S., Huang, K., Dong, W., Shao, J., Yi, M., and Zhang, Y.: Tropospheric gravity waves as observed by the high-resolution China radiosonde network and their potential sources, J. Geophys. Res.-Atmos., 127, e2022JD037174, https://doi.org/10.1029/2022JD037174, 2022a.
Zhang, J., Guo, J., Zhang, S., and Shao, J.: Inertia-gravity wave energy and instability drive turbulence: Evidence from a near-global high-resolution radiosonde dataset, Clim. Dynam., 58, 2927–2939, https://doi.org/10.1007/s00382-021-06075-2, 2022b.