the Creative Commons Attribution 4.0 License.
the Creative Commons Attribution 4.0 License.
 | 06 Oct 2023
Aerosol optical depth climatology from the high-resolution MAIAC product over Europe: differences between major European cities and their surrounding environments
Ludovico Di Antonio
Claudia Di Biagio
Gilles Foret
Paola Formenti
Guillaume Siour
Jean-François Doussin
Matthias Beekmann
The aerosol optical depth (AOD) is a derived measurement useful to investigate the aerosol load and its distribution at different spatio-temporal scales. In this work we use long-term (2000–2021) MAIAC (Multi-Angle Implementation of Atmospheric Correction) retrievals with 1 km resolution to investigate the climatological AOD variability and trends at different scales in Europe: a continental (30–60∘ N, 20∘ W–40∘ E), a regional (100 × 100 km2) and an urban–local scale (3 × 3 km2). The AOD climatology at the continental scale shows the highest values during summer (JJA) and the lowest during winter (DJF) seasons. Regional and urban–local scales are investigated for 21 cities in Europe, including capitals and large urban agglomerations. Analyses show AOD average (550 nm) values between 0.06 and 0.16 at the urban–local scale while also displaying a strong north–south gradient. This gradient corresponds to a similar one in the European background, with higher AOD being located over the Po Valley, the Mediterranean Basin and eastern Europe. Average enhancements of the local with respect to regional AOD of 57 %, 55 %, 39 % and 32 % are found for large metropolitan centers such as Barcelona, Lisbon, Paris and Athens, respectively, suggesting a non-negligible enhancement of the aerosol burden through local emissions. Negative average deviations are observed for other cities, such as Amsterdam (−17 %) and Brussels (−6 %), indicating higher regional background signal and suggesting a heterogeneous aerosol spatial distribution that conceals the urban–local signal. Finally, negative statistically significant AOD trends for the entire European continent are observed. A stronger decrease rate at the regional scale with respect to the local scale occurs for most of the cities under investigation.
- Article
(11294 KB) - Full-text XML
-
Supplement
(1654 KB) - BibTeX
- EndNote


Climate change and air quality preservation represent two of the greatest challenges of our times, especially in densely populated areas. Aerosol particles have been shown to play a key role in climate change and to affect air quality over many regions of the world (Robotto et al., 2022; Viana et al., 2014; Fiore et al., 2012). Aerosols affect the radiative budget both directly, by scattering and absorption of solar and thermal radiation (the aerosol–radiation interaction, ARI), and indirectly, by influencing the cloud formation and properties (aerosol–cloud interaction, ACI) (Bellouin et al., 2020). Constraining the aerosol contribution to climate and its change is still a challenge (Bender, 2020), as further demonstrated by the Climate Change 2021 IPCC report, indicating large remaining spread in ARI and ACI estimations (Masson-Delmotte et al., 2021). Atmospheric aerosols are also a concern for air quality and human health (Yang et al., 2018; Li et al., 2017, 2016; Dockery, 2009). Millions of people in Europe and around the world, especially over dense urban agglomerations, industrial areas and rural environment, experience significant particulate matter exposure (Sicard et al., 2021). Under favorable weather conditions such as high radiation levels, high temperature, low precipitation and low winds during summer or temperature inversions and low planetary boundary layer height during winter, local primary and secondary aerosol formation have been shown to build up to create the so-called “aerosol pollution episodes” (Foret et al., 2022; Groot Zwaaftink et al., 2022; Diémoz et al., 2019). These episodes correspond to daily average particulate matter (PM) levels above the European threshold of 50 µg m−3 and last for several consecutively days. They lead to significant air quality and visibility degradation (Majewski et al., 2021; Singh et al., 2020) and increase the potential health risk (Luo et al., 2021; Grigorieva and Lukyanets, 2021). However, the aerosol anthropogenic precursors, abundant in urban agglomerations, can also spread around emission hotspots and affect larger areas, including rural and forested environments, leading to situations of mixed anthropogenic–biogenic scenarios (Xu et al., 2021). This would lead to aerosols having different chemical, physical and radiative properties and therefore to a potentially different impact on both human health (Tuet et al., 2017; Liu et al., 2009) and the environment (Nascimento et al., 2021; Shrivastava et al., 2019; Martin et al., 2016). In this regard, how the local- and regional-scale anthropogenic and biogenic precursors, their mixing, and their processing affect aerosol loading and properties, in particular around major city agglomerations, is still unknown and is a matter of scientific investigation (Cantrell and Michoud, 2022; Liu et al., 2021; Ma et al., 2021).
The aerosol optical depth (AOD) is a key parameter to investigate aerosol load and distribution over local- to large-scale areas (Bai et al., 2022; Faisal et al., 2022; Raptis et al., 2020; Sun et al., 2019; Just et al., 2015; Smirnov et al., 2002). The AOD is defined as the integral of the aerosol extinction coefficient (inverse units of length) over the whole atmospheric column, and it depends on the aerosol mass concentration, size distribution, shape and complex refractive index. Measurements of AOD are used to improve the air quality forecasts since they can be assimilated in regional or global models (Lee et al., 2022; Ha et al., 2020; Kondragunta et al., 2008), and they can also be linked to visibility measurements (Aman et al., 2022; Zhang et al., 2016; Boers et al., 2015; Kessner et al., 2013; Bäumer et al., 2008). Moreover, the AOD spectral variability can also be used to discern among different aerosol types and help source apportionment (Tuccella et al., 2020; Bahadur et al., 2012). However, since AOD observations are vertically integrated, the correlation with surface aerosol measurements may not be straightforward (He et al., 2021; Grgurić et al., 2014; Segura et al., 2017; Guo et al., 2009; Schaap et al., 2009; Schäfer et al., 2008). In fact, AOD is sensitive to dust and biomass burning plumes transported at high altitude, which may not affect surface measurements (Eck et al., 2023; Gkikas et al., 2022; Song et al., 2009). Different studies reported AOD trends at a global scale (Gupta et al., 2023, 2022; Zhao et al., 2017; He et al., 2016; Mehta et al., 2016; Mao et al., 2014), supporting a decreasing AOD trend over Europe (Gupta et al., 2023, 2022; Filonchyk et al., 2020b; Alpert et al., 2012). The overall decreasing trend at the European regional scale has been attributed to mitigation policies applied in recent years for the aerosol and the aerosol precursor emissions (Gupta et al., 2022; Hammer et al., 2020; Provençal et al., 2017; Zhao et al., 2017).
The AOD is routinely retrieved across the globe by both ground-based sun photometer measurements, such as those of the widespread AERONET (Aerosol Robotic Network) (Giles et al., 2019), and by satellite sensors, among them the Moderate Resolution Imaging Spectroradiometer (MODIS). Three complementary algorithms, developed at NASA, exist for the MODIS AOD retrieval: the Deep Blue (DB) (Hsu et al., 2004), the Dark Target (DT) (Remer et al., 2020, 2005) and the more recent Multi-Angle Implementation of Atmospheric Correction (MAIAC) algorithm (Lyapustin et al., 2018). The DB and DT algorithms, extensively used in the literature (e.g., Shi et al., 2021; Spencer et al., 2019; Sayer et al., 2018; Lee et al., 2017; Hsu et al., 2017), provide aerosol retrievals at a spatial resolution of 3 and 10 km. The MAIAC algorithm provides atmospheric retrievals of AOD at 470 and 550 nm at the more advanced spatial resolution of 1 km. As a matter of fact, an accurate estimation of surface reflectance, discerning among atmospheric and surface contributions, is necessary to provide the best-quality AOD retrievals (Bilal et al., 2019). In this regard, the MAIAC algorithm benefits the multi-angle satellite observations, retaining in memory up to 16 d of consecutive satellite overpasses to better constrain the surface reflectance, improving the AOD retrievals in particular over complex scenes such as urban areas (Chen et al., 2021; Gupta et al., 2016; Wang et al., 2010). The MAIAC aerosol algorithm uses eight different background aerosol models over land (look-up tables, LUTs), and it has developed a more stable algorithm that reduces the AOD bias over bright surfaces (in the absence of smoke and dust), typical for the DT and DB algorithms (Lyapustin et al., 2018). Furthermore, MAIAC can retrieve AOD over partially cloudy conditions and distinguish between smoke and dust scenes (Lyapustin et al., 2012). The AOD from the MAIAC algorithm has been validated over different areas of the world and shown to perform better with respect to the DT and DB algorithms when compared to AERONET observations (Su et al., 2023; Falah et al., 2021; Qin et al., 2021; Martins et al., 2019; Zhang et al., 2019; Tao et al., 2019; Mhawish et al., 2019; Martins et al., 2017; Just et al., 2015). The estimated expected error (EE) for MAIAC AOD is evaluated at ±(0.05 + 0.1) AOD, but it is shown to vary as a function of surface reflectivity, aerosol loading and size, as well as aerosol type (Falah et al., 2021). Because of its 1 km resolution and good performance, the MAIAC AOD product is increasingly used in air quality studies (Pedde et al., 2022; Gladson et al., 2022; Yang et al., 2022; van Donkelaar et al., 2021; Jung et al., 2021; Hough et al., 2021).
In this paper, we benefit from the high-spatial-resolution long-term MAIAC data (from 2000 to 2021) to investigate AOD over Europe. This work is part of the ACROSS (Atmospheric ChemistRy Of the Suburban foreSt; https://across.aeris-data.fr/, last access: June 2023) project, whose objective is to deepen the current physical–chemical knowledge of the interaction between anthropogenic emissions in the Paris area and its surrounding environment through an intensive field campaign, which took place in the summer 2022 (Cantrell and Michoud, 2022). Within the ACROSS context, this study aims to achieve three different objectives:
-
Investigate the urban–local- vs. regional-scale aerosol optical depth variability starting from a broader context over the European domain (30–60∘ N, 20∘ W–40∘ E) up to the urban–local scale (3 × 3 km2) around major urban agglomerations in Europe.
-
Explore the long-term trends at the urban–local (3 × 3 km2), regional (100 × 100 km2) and continental scales (30–60∘ N, 20∘ W–40∘ E).
-
Contextualize the results for the Paris agglomeration with respect to other European cities.
The paper is organized as follows. The MAIAC product and its use are described in Sect. 2. Previous validation studies of the MAIAC product in Europe have been performed in Italy (Stafoggia et al., 2017), the Moscow metropolitan area (Zhdanova et al., 2020) and Germany (Falah et al., 2021), but no analysis has considered the entire European continent. Therefore, a validation analysis for Europe is also provided in Sect. 2. The discussion of the AOD climatology and trends over Europe and local/regional analysis are presented in Sect. 3, before giving conclusions in Sect. 4.
2.1 MAIAC dataset extraction and analysis
The daily MCD19A2 product (Lyapustin and Wang, 2018) providing the AOD at 470 and 550 nm has been used over the period February 2000–August 2021. All the observations are delivered in the HDF4 format and stored at 1 km resolution in sinusoidal grid mapping. The product, distributed on a daily basis, contains the collection of each MODIS Aqua and Terra satellite overpasses, whose number varies according to the latitude. The uncertainty attributed to the MAIAC AOD retrievals has been defined through the expected error EE = , indicating the percentage of AODMAIAC retrievals falling in the envelope (expressed in percent). The EE has been established following Falah et al. (2021) and Lyapustin et al. (2018), considering both absolute and relative errors and by attributing an absolute error of 0.05 and a relative error of 0.1. As discussed in the next section, the validation against AERONET is considered to re-evaluate the EE over Europe and subsequently update the MAIAC uncertainty. In this product, in order to merge the satellite data to perform the climatological averages at the European scale (30–60∘ N, 20∘ W–40∘ E), the daily average of each tile has been taken, followed by horizontal and vertical concatenation over the different MODIS tiles of interest. Only data classified as best-quality AOD (quality check flag “0000”) have been used in the following analysis. Although this choice reduces the number of available data, it guarantees the quality of the retrieval, which is an important aspect to perform high-resolution studies over urban areas.
Starting from the merged MAIAC data, the following treatment is applied.
-
The sinusoidal grid coordinate system is converted to WGS 84.
-
AOD daily averages are calculated for each grid point using available cloud-free observations from Terra and Aqua (i.e., two to five observations per day are available for the different grid points with Terra and Aqua overpass times between 09:00 and 14:00 local time).
-
Local- and regional-scale AOD extractions have been performed to investigate the effect of the aerosol formation and city emissions over the surrounding areas. To this aim a list of 21 cities has been established, including European capital cities and big agglomerates with more than 1 million inhabitants. Those cities are listed in Table 1, and their location is plotted in Fig. 1. The MAIAC AOD data have been extracted around the city locations using two different concentric kernels (centered on the nearest pixel to the longitude and latitude values of each city in Table 1): 3 × 3 km2 (9 km2 area) for the local scale and 100 × 100 km2 (10 000 km2) for the regional scale. The regional domain was chosen to be large enough to minimize effects of the city's pollution; i.e., the local-scale product occupies only ∼ 0.09 % of its regional background. Days for which a minimum of 40 % spatial data coverage is available are considered for both the local and the regional scale, and the others are discarded for the analysis. The local-to-regional AOD ratio (LTRR) has been calculated for each available kernel extraction (after averaging over all the available AOD data satisfying the spatial threshold in the kernels) to quantify the local-scale enhancement of the regional AOD by using the following formula:
Positive deviations of the LTRR highlight the positive contribution of the urban–local scale to the regional background signal, considering that AODlocal intrinsically represents the sum of the local production and the possible regionally advected AOD fractions. Conversely, negative deviations can be linked to the presence of a non-homogenous spatial aerosol distribution at the regional scale, as well as to a possible local sink of pollution. The former may result in a stronger regional background signal related to different aerosol sources surrounding the city which may conceal the urban–local signal and reduce the pollution gradients.
Trend assessment on AOD has been conducted over annual averages of daily AOD data using the original Mann–Kendall test (Hussain and Mahmud, 2019). Annual AOD averages are performed if at least 50 daily AOD observations are available in the year, and trend evaluations are performed if at least 5 years of data are available in the dataset. The output of the Mann–Kendall test provides the significance of the test (p value) and the Theil–Sen slope (Theil, 1992; Sen, 1968). All the tests have been calculated assuming a significance level (α) of 0.05, and the trend is considered significant if the p value < α. The relative change has been calculated following (Colette et al., 2016)where s is the Theil–Sen slope, and y0 is the first available year for the trend evaluation.
Table 1List of European cities used for the city-scale analysis. City names in bold are the cities (not metropolitan regions) with more than 1 million of inhabitants according to the Eurostat database (Eurostat, 2023).
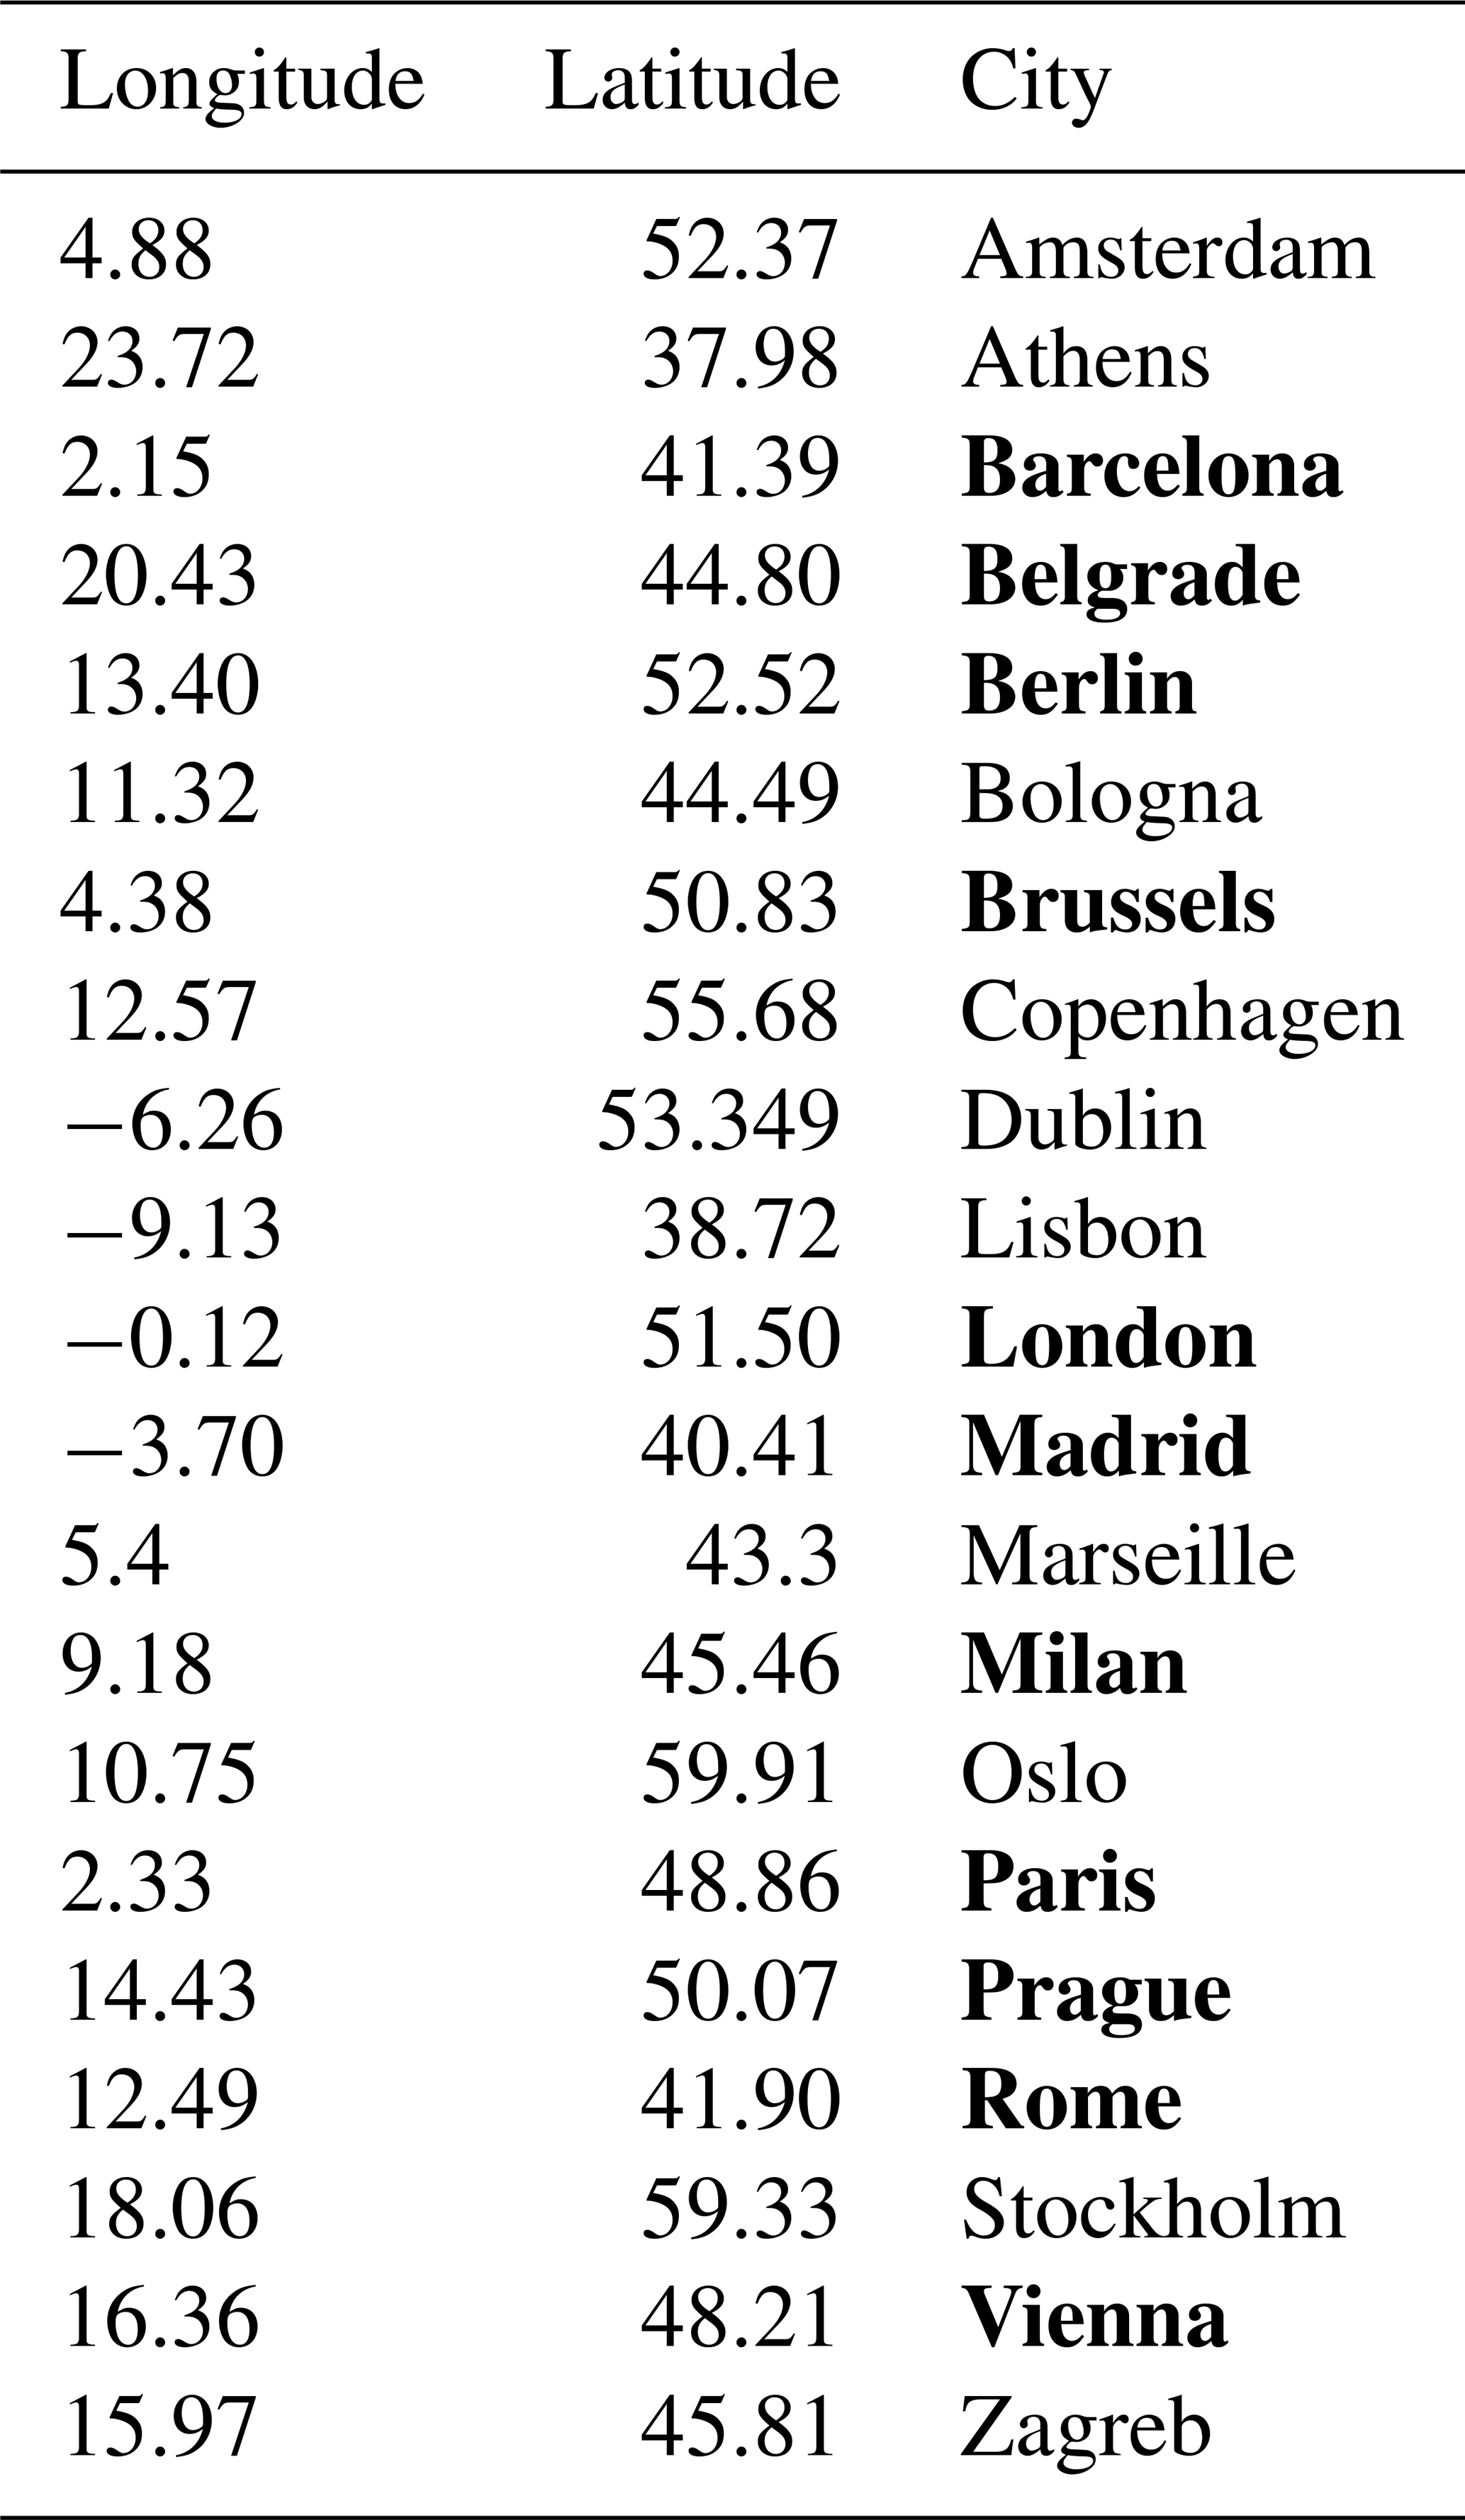
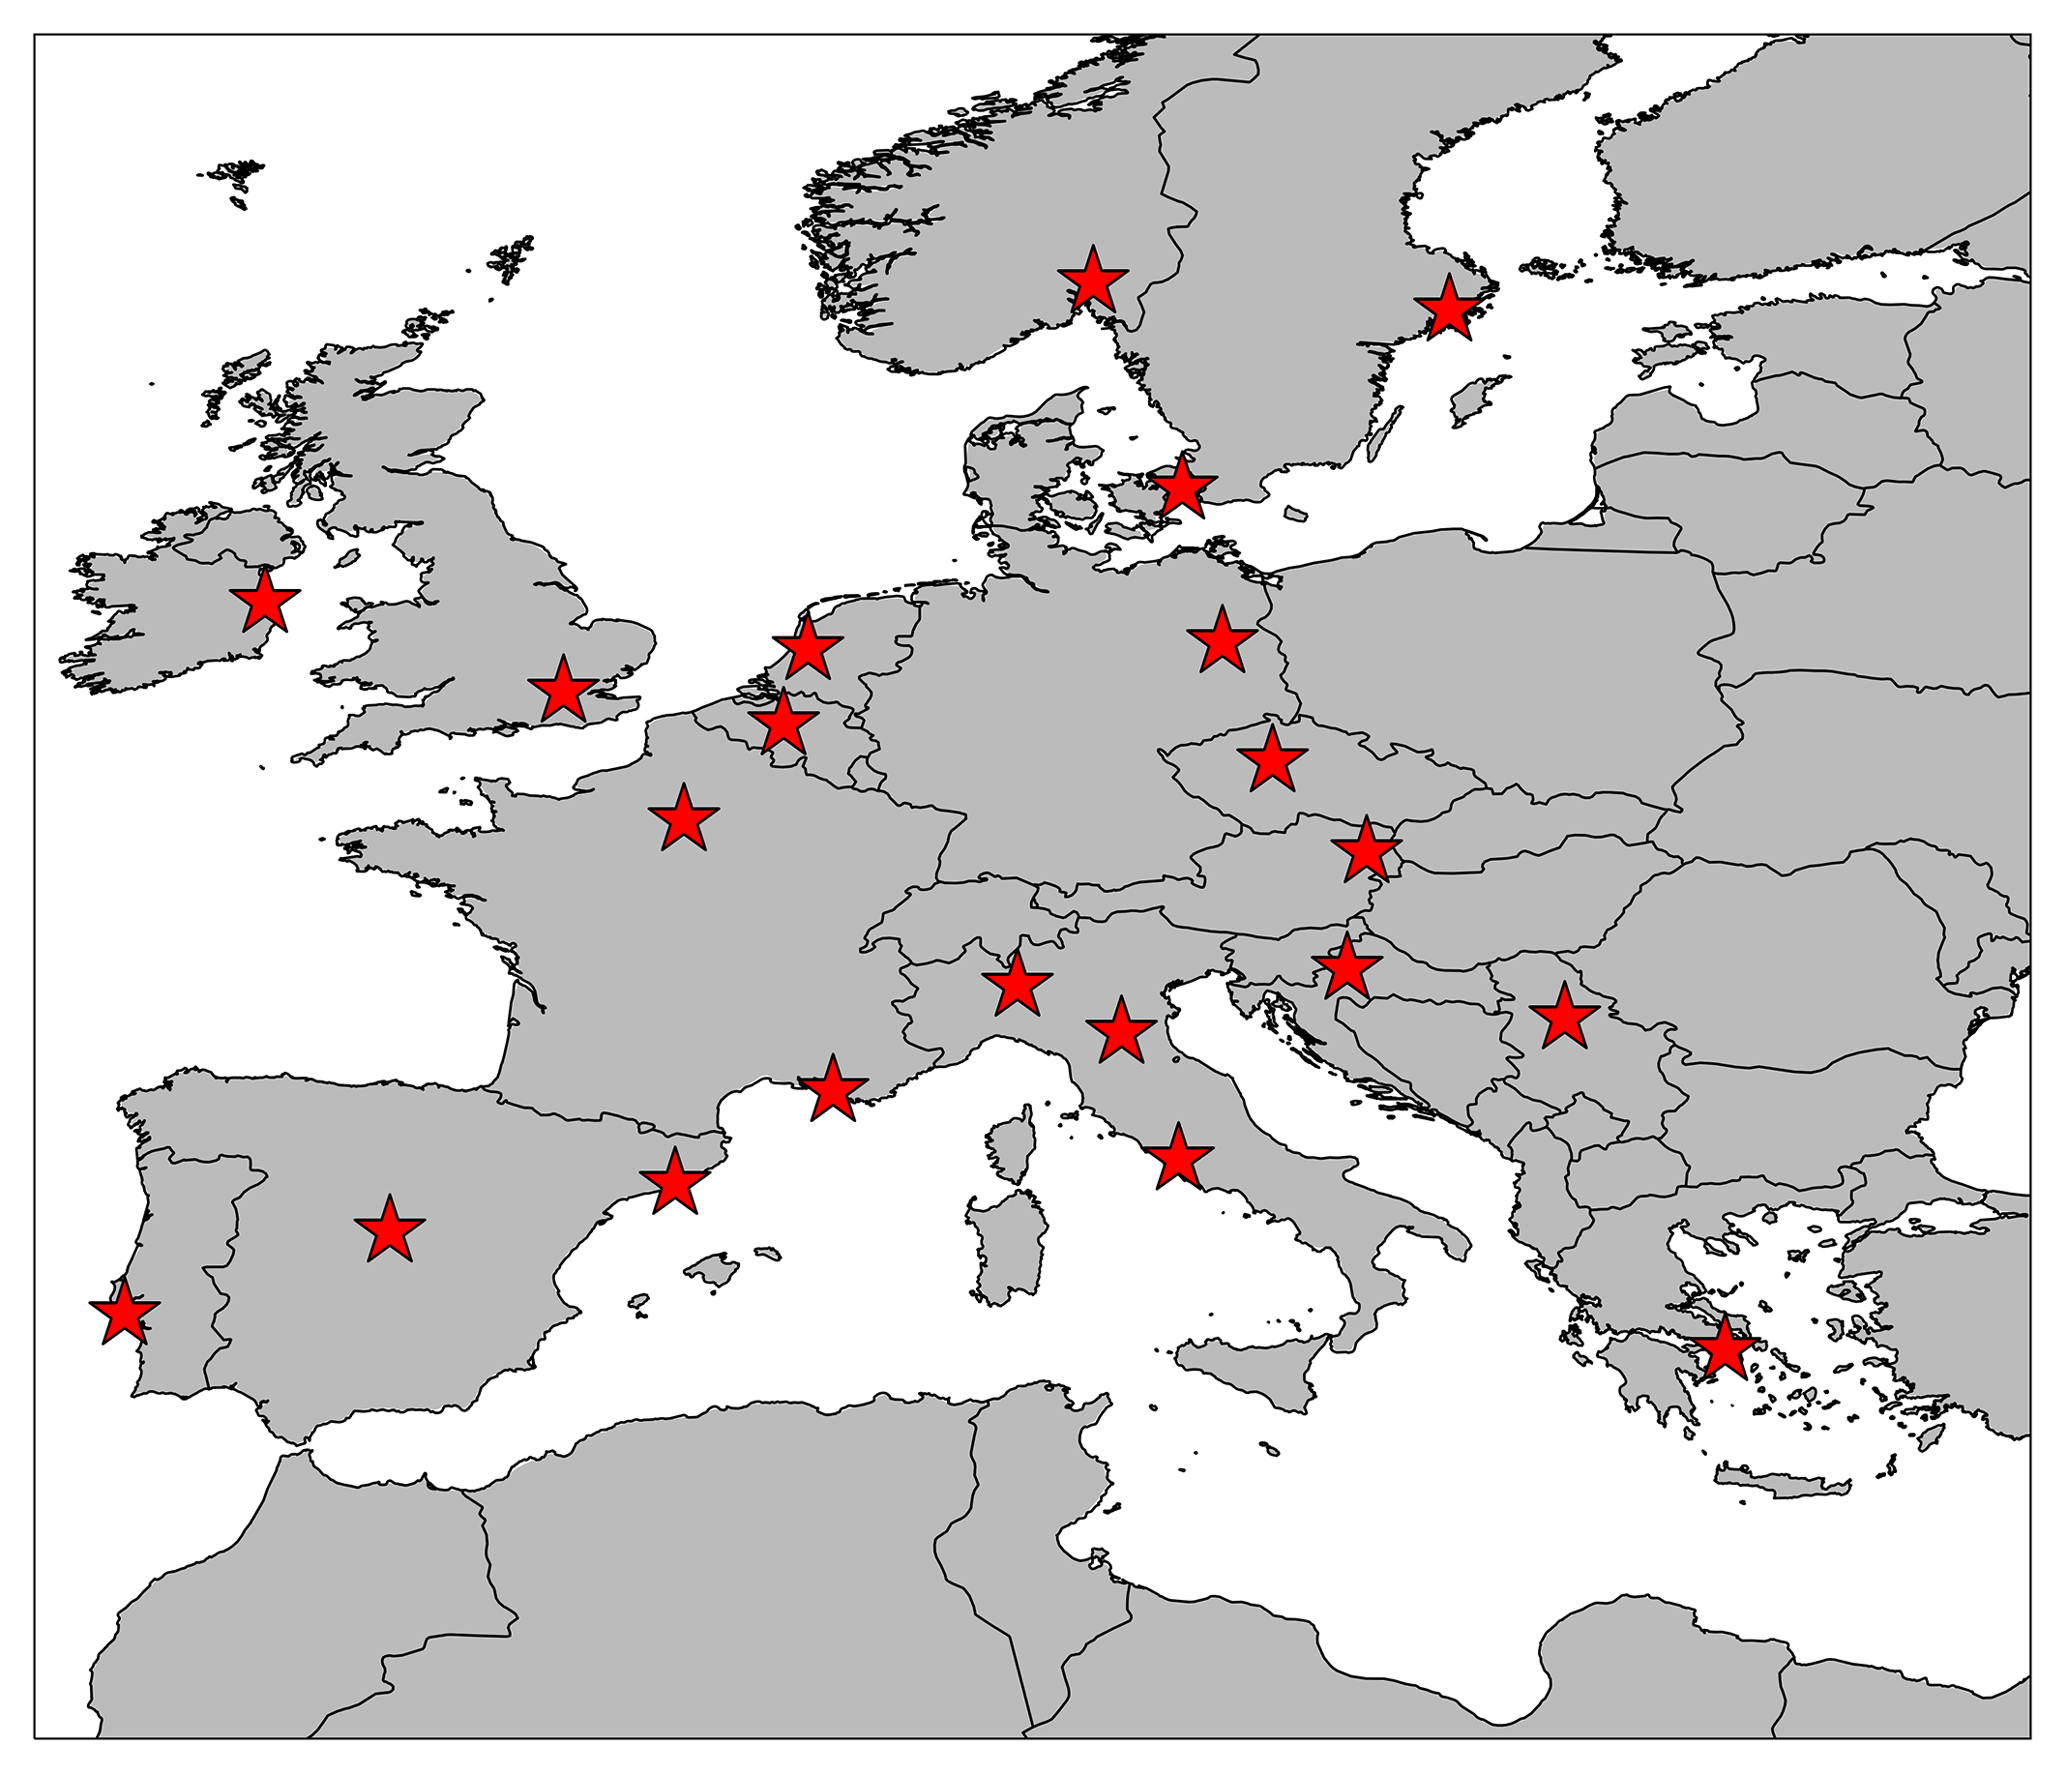
Figure 1Localization of European cities used for the analysis of the local-to-regional ratio. Map created with Cartopy (Elson et al., 2023).
2.2 Validation against AERONET observations and revised MAIAC estimated error (EE) for Europe
The MAIAC AOD validation has been performed by comparing the 550 nm AOD with all the available acquisitions (207 sites) in the AERONET Version 3 ground-based sun photometer network over continental Europe (Giles et al., 2019). Version 3, Level 2 AERONET data have been used (https://aeronet.gsfc.nasa.gov/, last access: June 2023). AERONET provides AOD measurements at four different wavelengths: 440, 675, 860, 1020 nm. The AOD at 550 nm has been extrapolated by assuming a power law relationship with the Ångström exponent α (Ångström, 1929; Schuster et al., 2006) calculated between 440 and 675 nm:
Since the AERONET measurements are taken at different elevation angles depending on the sun elevation over the horizon, the measurements may be considered representative of a larger area around the point of acquisition (Chen et al., 2020; Schutgens, 2020; Kinne et al., 2013). In order to improve the meaningfulness against the AERONET observations, the MAIAC AODs have been additionally extracted by taking an arbitrary average area of 0.06∘ × 0.06∘ over the AERONET site, corresponding to ∼ 7 × 7 km2, chosen between the 1 × 1 and 9 × 9 km2 boxes, for which Falah et al. (2021) show that MAIAC–AERONET comparisons give similar results. Furthermore, AERONET AOD data between ±1 h of the satellite passage have been considered to compare with MAIAC. The uncertainty in the AERONET AOD is ΔAODAERONET=0.02 and is linked to calibration uncertainty (Sinyuk et al., 2020). As the differences between MAIAC and AERONET observations are attributed entirely to MAIAC uncertainty, the derived MAIAC expected error is conservative. Different statistical indicators have been calculated to evaluate the comparison between MAIAC and AERONET AOD data. The mean bias error (MBE), the normalized mean bias (NMB), the root mean square error (RMSE) and the fraction of data within a factor of 2 (FAC2) are defined below (N is the number of data points):
The correlation between AODMAIAC and AODAERONET has been evaluated through the Pearson correlation coefficient R. The slope and the intercept of the regression line have been calculated taking into account the uncertainty in both coordinates using the York regression (York et al., 2004). The comparison between MAIAC and AERONET AOD at 550 nm for all available European AERONET measurements from 2000 to 2021 is shown in Fig. 2. The overall validation performed considering the entire dataset (Fig. 2a) shows a slight underestimation of the AOD from MAIAC with respect to AERONET, with an MBE (−0.02) and an RMSE (0.06) values similar to those retrieved in previous validation studies (Chen et al., 2020; Lyapustin et al., 2018; Martins et al., 2017). The probability density function (PDF) of the MAIAC–AERONET absolute differences (Fig. 2b) shows a mean value and a σ of −0.02 and 0.06, respectively. A total of 77 % of the AOD retrievals fall in an EE = , with a relative error lower than the validation EE = from Falah et al. (2021), accounting for observations in northern Africa, California and Germany, but comparable to the EE envelope (∼ 74 % of points falling within the EE) obtained in Qin et al. (2021) over the Köppen climate classification of normally humid and warm climate (Cf) regions, including part of the European domain.
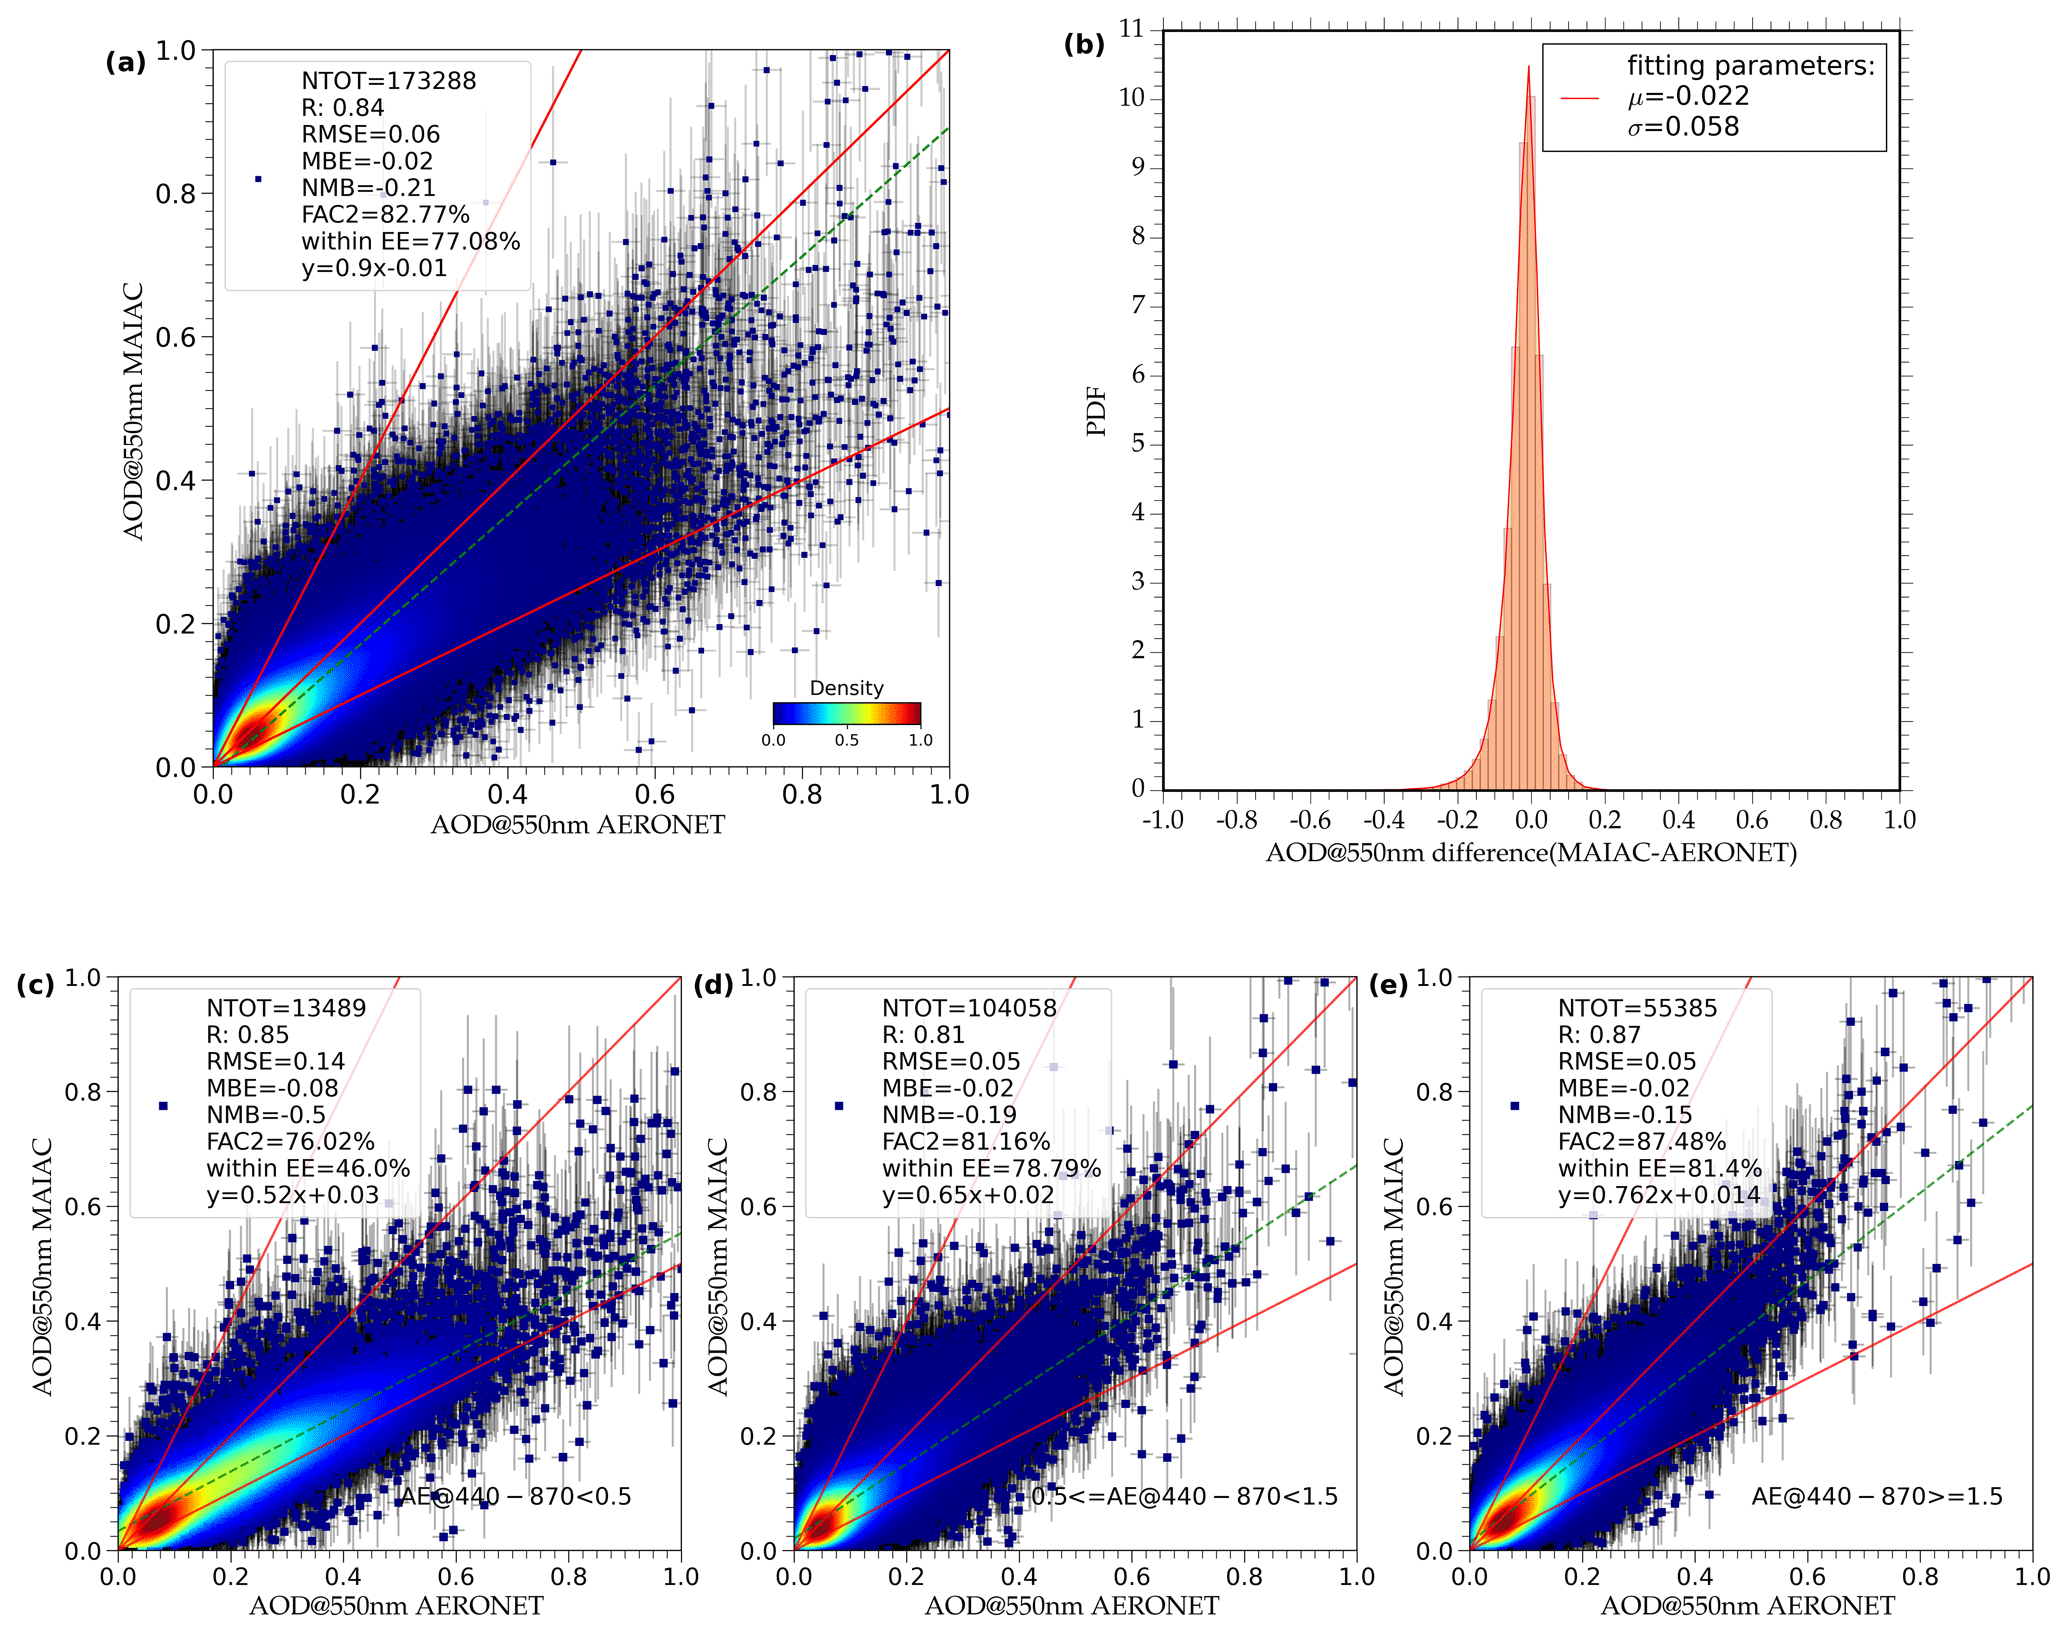
Figure 2Scatterplot of the MAIAC against AERONET observations considering (a) all the available data points in Europe and points selected based on the Ångström exponent (AE) assuming (c) AE < 0.5, (d) 0.5 ≤ AE < 1.5 and (e) AE ≥ 1.5. Panel (b) shows the PDF of the difference between MAIAC and AERONET values in reference to data points in (a). The abbreviations indicate total number of points (NTOT), correlation coefficient (R), root mean square error (RMSE), mean bias error (MBE), normalized mean bias (NMB), fraction of y data between 0.5 and 2 times x (FAC2) expressed in percentage, fraction of retrievals within the expected error (EE = 0.05 + 0.05 AOD), and the equation of the regression line. Vertical and horizontal bars represent the x and y errors. Solid red lines represent the straight lines passing through the origin with slope coefficients of 2, 1 and 0.5, respectively. The dotted green line represents the regression line.
Since dependency of EE on aerosol type and size has been evidenced by Falah et al. (2021) a further detailed validation depending on the Ångström exponent (AE) between 440 and 870 nm has been performed and is presented in Fig. 2c, d and e. The AE, combined with AOD, is an indicator of the particle type and size. AE values lower than 1 can be associated with coarse-mode aerosols (sea salt and dust), whereas AE values higher than 2 can be associated with fine-mode aerosols (urban pollution and smoke) (Schuster et al., 2006). In this regard, three different classes depending on AE have been identified, respectively referred to as coarse, mixed and fine aerosol particles: AE < 0.5, 0.5 ≤ AE < 1.5, AE ≥ 1.5. The MAIAC validation shows an R value of 0.84 for the overall validation (Fig. 2a) comparable with the 0.85, 0.81 and 0.87 for the coarse, mixed and fine classes, respectively. The validation for the mixed- and fine-dominated classes show a satisfactory accuracy of the product, with an MBE of −0.02 for both and 79 % and 81 % of the points, respectively, within the envelope of EE = from Falah et al. (2021). However, for the coarse mode, the MAIAC validation shows an MBE of −0.08 and 46 % of points, within the envelope of EE = from Falah et al. (2021), significantly lower with respect to the other two classes. In the case of AOD < 0.25 (84 % of points in the coarse-mode validation), attributable to a marine-dominated aerosol scene (Toledano et al., 2007), 51 % of points are within the EE, whereas for AOD ≥ 0.25 (16 % of points in the coarse-mode validation), attributable to dust-dominated aerosols (Rogozovsky et al., 2023; Bodenheimer et al., 2021; Toledano et al., 2007), the percentage of points within EE is significantly lower than 1σ (i.e., 68 % of points falling in the EE envelope). As a matter of fact, a higher EE is needed to contain the 68 % of the MAIAC–AERONET differences for the coarse-mode validation. Rogozovsky et al. (2023) and Qin et al. (2021) show that the MAIAC algorithm is sensitive to the aerosol size. Rogozovsky et al. (2023) observed that the underestimation of MAIAC compared to AERONET is related to the presence of dust (characterized by high depolarization ratio and small AE). This result suggests that further improvements are needed in the case of coarse-mode-dominated classification.
In summary, results of the validation against AERONET suggest that the EE for MAIAC for observations over Europe between 2000 and 2021 can be estimated at EE = , lower than the EE estimated by Falah et al. (2021). The total MAIAC AOD uncertainty has therefore been revised to take into account this new estimation.
3.1 European-scale analysis
Before looking at the fine-scale variability in the major European cities (Sect. 3.2), we address here the question of their European AOD background levels and their seasonal variation, as seen by multi-year MAIAC observations. We place our findings in the context of previous analysis mainly based on spatially less refined MODIS observations (Gupta et al., 2023; Filonchyk et al., 2020a; Wei et al., 2019), introducing an analysis based on 2 decades of data, extending and validating studies performed in shorter time periods.
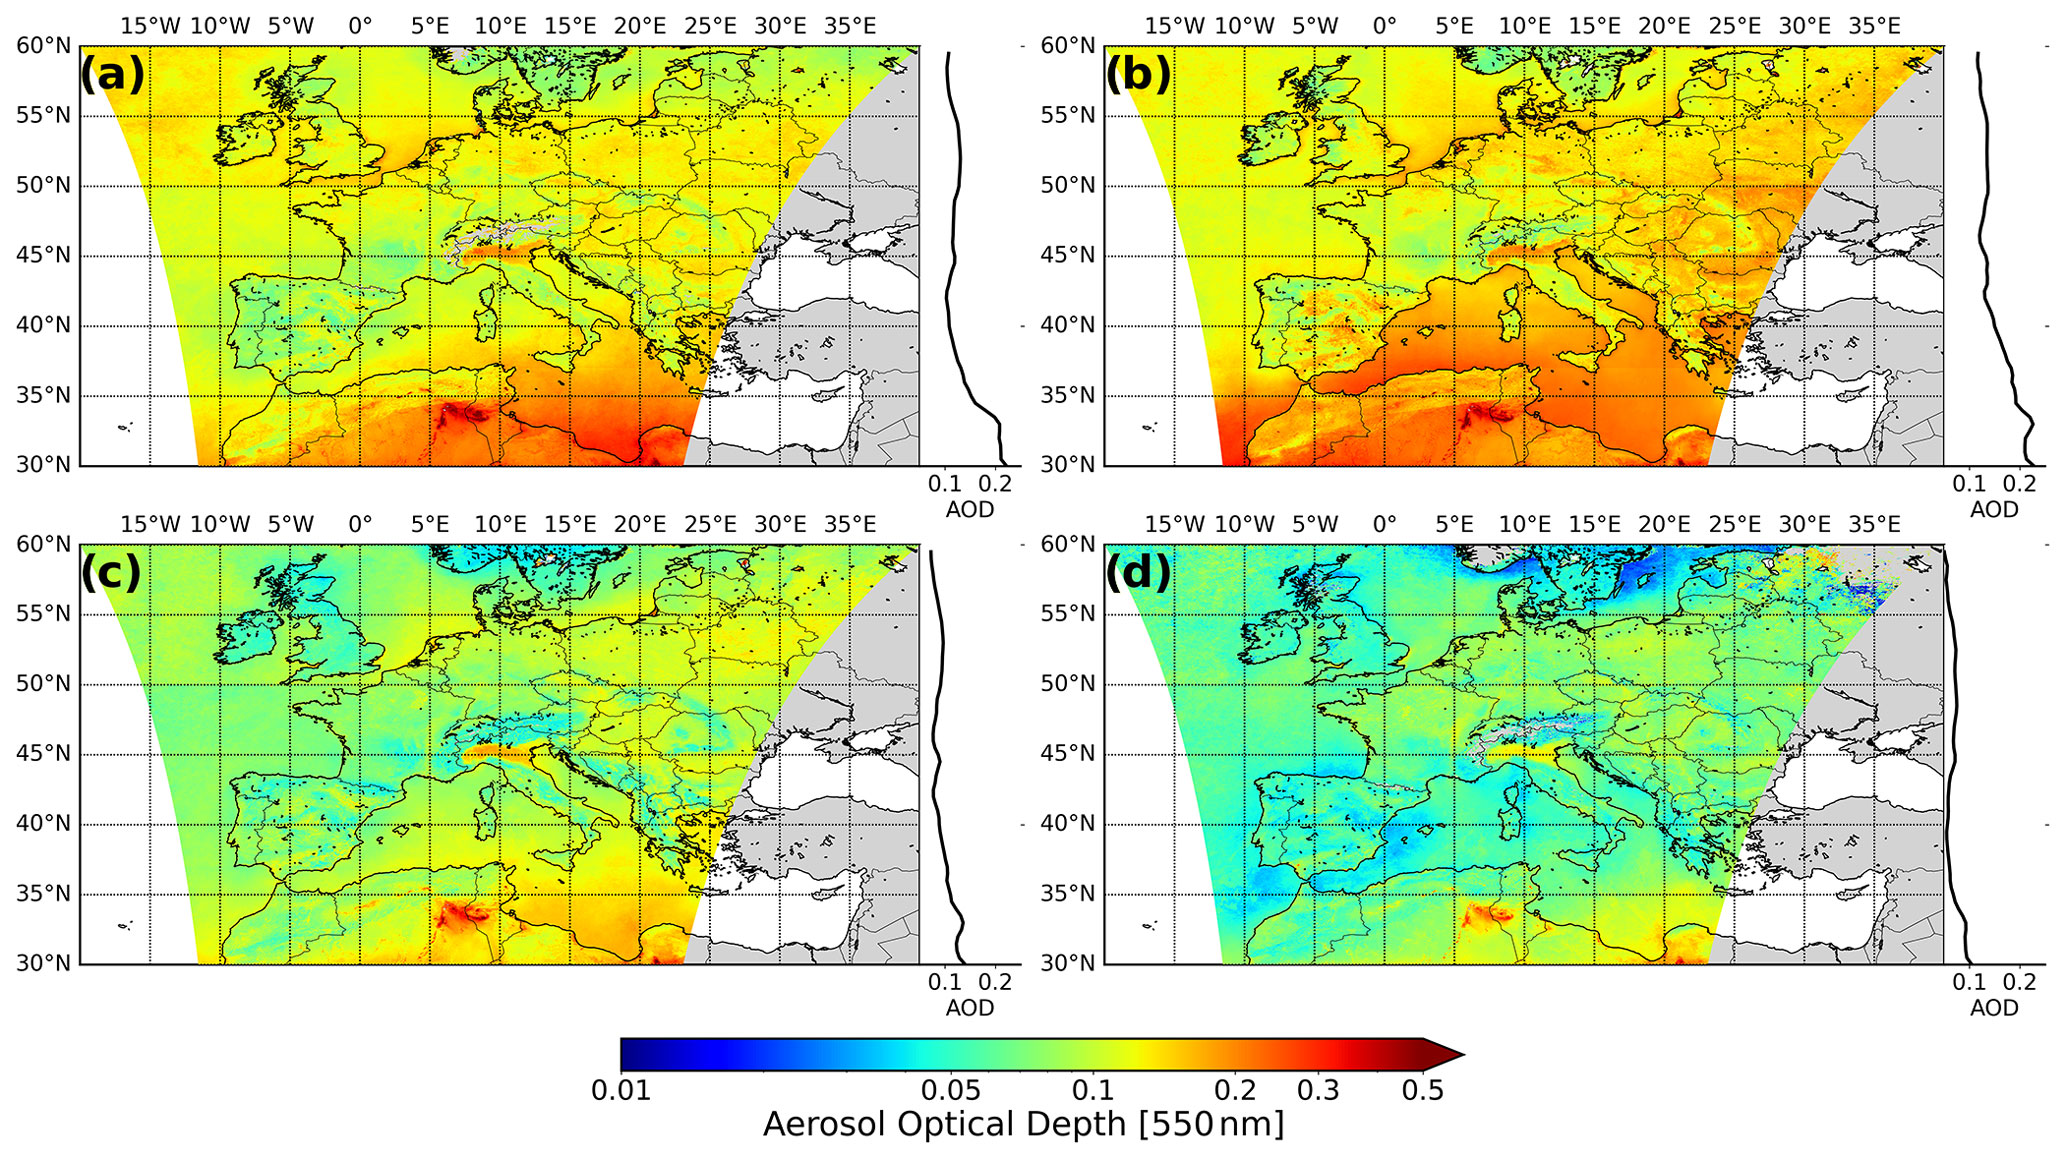
Figure 3Climatological seasonal mean of the aerosol optical depth at 550 nm from the MAIAC algorithm over the period 2000–2021. Seasons are in the following order: (a) March–April–May, (b) June–July–August, (c) September–October–November and (d) December–January–February. The right side of each figure shows the latitudinal average of AOD.
The aerosol optical depth variability at the European scale is shown in Fig. 3, reporting seasonal averages, and in Fig. S1 in the Supplement, reporting the monthly averages of the AOD at 550 nm. The summer (JJA) season shows the highest AOD values, ranging between 0.12–0.22 in the 30–60∘ N band, whereas DJF shows the lowest AOD values, ranging between 0.06–0.09. Figure S1 depicts maps of monthly AOD averages and shows maximum values between April and July and minimum between November and January. A north–south latitudinal gradient is present for all the seasons, as shown in Figs. 3 and S2, with a maximum gradient during the summer (JJA) and minimum during the winter (DJF) season. According to Fig. S2, seasonal AOD averages range between 0.06–0.11 and 0.09–0.22 and in the 55–60 and 30–35∘ N bands, respectively.
These findings with the MAIAC dataset are broadly in line with a previous analysis of MODIS and MISR data (Gupta et al., 2023, 2022; Filonchyk et al., 2020a; Mehta et al., 2016). A north–south AOD gradient over Europe has also been found in other MODIS studies (Merdji et al., 2023; Floutsi et al., 2016; Israelevich et al., 2012; Barnaba and Gobbi, 2004). Concerning averages over western Europe for the 2007–2016 period, Zhao et al. (2018) find a broad spring–summer AOD maximum of around 0.2 extending from April to July for MODIS Aqua and Terra and around 0.15 for MISR and a winter (December and January) minimum between 0.08 and 0.10. Ma and Yu (2015) attribute the simulated spring maximum over southern France and Corsica over the western Mediterranean Basin especially to sulfate and dust, while other primary aerosol species (sea salt, primary carbonaceous aerosol) show lower contributions and a flat seasonal variation. For secondary aerosol as sulfates, these larger AOD values during the late spring–summer season are attributed to stronger photochemical activity due to increased oxidant capacity (enhanced OH and ozone levels), whereas the contrary is expected for the late autumn–early winter minima. However, these authors did not take into account secondary organic aerosol; it can be expected to be at a maximum during summer due to the higher biogenic volatile organic compounds (BVOCs), and increased photochemical activity during this season (Gao et al., 2022). Possible fire events can also affect summer AOD peaks over Europe since they are more frequent during this period (European Commission et al., 2022; Zhao et al., 2018).
Different aerosol hotspots, as previously identified in the literature (Coelho et al., 2022; Backes et al., 2016; Gkikas et al., 2016; Bovchaliuk et al., 2013; Vecchi et al., 2009), are also visible in Fig. 3, especially the Mediterranean Sea, the Po Valley and eastern Europe. The Mediterranean Basin (30–46∘ N, 6∘ W–36∘ E) is affected by both anthropogenic, biogenic and dust emissions (Dayan et al., 2020; Chazette et al., 2019; Michoud et al., 2017; Pace et al., 2006). Its AOD seasonal cycle shown in Fig. 3, ranging between 0.07–0.19 (average values obtained from the ocean part of the basin), follows the Saharan dust transport cycle for the southern part, whereas the northern part is mostly dominated by human activities. In fact, the high MAM AOD values (between 0.2 and 0.3) shown over the south-southeastern part of the Mediterranean Basin are caused by the onset of the Saharan dust transport due to a low-pressure system (the Sharav cyclone), which pushes the dust plumes to the eastern basin (Floutsi et al., 2016; Moulin et al., 1998). During summer, the Balearic cyclogenesis causes the spreading of the dust plumes northwards from the Saharan source region, explaining the high JJA values (AOD > 0.2) over large areas of the southern part of the basin (Formenti et al., 2018; Floutsi et al., 2016; Moulin et al., 1998). The AOD average over the February 2000–August 2021 period over the Mediterranean Basin (30–46∘ N, 6∘ W–36∘ E) resulted in an AOD of 0.13 at 550 nm, comparable to the result obtained in Chiapello et al. (2021) at 865 nm based on POLDER-3 observations.
In the Po Valley (43∘36′–46∘12′ N, 7–12∘30′ E), the seasonal cycle ranges between 0.09 (for DJF) and 0.15 (for JJA), with maxima in June and July (AOD > 0.16). PM composition measurements at the ground are shown to be dominated by traffic, biomass burning emissions, and ammonium nitrate and sulfate formation (Scotto et al., 2021), and the largest ground PM values can occur in the DJF and SON seasons due to recurrent low temperatures and possible intense residential biomass burning (Pietrogrande et al., 2015) and ammonium nitrate precursor emissions (Scotto et al., 2021; Vecchi et al., 2018). The MAM and JJA levels at the ground can be caused by local agricultural sources (e.g., burning of pruning and fertilizers) (Scotto et al., 2021; Bucci et al., 2018; Clarisse et al., 2009). In summertime high levels of secondary organic aerosols in the presence of stagnation conditions have also been observed in Sandrini et al. (2016). Since AOD values are columnar values, the difference observed in the seasonal cycle between the ground (mainly DJF–MAM peaks) and AOD (JJA) can be attributed to different reasons: (1) the planetary boundary layer height (PBL), lower in the winter and higher in the summer, which conversely to ground PM does not affect the AOD measurements, and (2) possible dust events and biomass burning fires that can contribute to the stronger AOD levels during the spring and summer seasons. In addition, high AOD levels are also favored by insufficient pollution dispersion and removal, the valley being surrounded by mountains (the Alps and the Apennines), especially under stable weather conditions, promoting pollutant accumulation and air mass stagnation (Putaud et al., 2014). As a matter of fact, this reasoning is general and not restricted to the Po Valley.
Concerning eastern Europe (42–55∘ N, 13–30∘ E), Fig. 3 shows a strong seasonal variability in AOD for regions like Poland and Serbia, with a maximum AOD of up to 0.2 during the JJA season and minimum over the DJF season, with AOD generally below 0.15. The seasonal cycle for 2001–2014, with a maximum over summer and spring, was also observed by Chubarova et al. (2016), studying the Moscow AERONET site. Furthermore, Bovchaliuk et al. (2013) found AOD values ranging between 0.05 and 0.2 at 870 nm for the 2003–2011 period, with peaks over the spring, which the authors explain by agricultural fires correlated with an observed increase in the fine-fraction-mode particles.
Finally, western Europe (35–60∘ N, 11∘ W–18∘ E) also shows an AOD seasonal variability over land in the 0.06–0.12 range, with the maximum in the JJA season. A summer AOD maximum attributable to dust, smoke and sea spray aerosols has also been found in Zhao et al. (2018) for this area. These values are lower compared to other regions within Europe. This result can be justified by its proximity to the Atlantic Ocean, which contributes to the exposure these areas to more humid and less polluted air masses as well as to a greater pollutant dispersion capability.
3.2 City-scale analysis
The 1 km resolution MAIAC AOD data are used to explore AOD levels over cities and evaluate and quantify the different AOD levels of cities with respect to their surrounding areas. Figure 4 shows the distribution and the heterogeneity of the aerosol optical depth over the different sites. European cities are ordered by increasing 50th-percentile values of the local-scale AOD from left to right. Table 1 gives the coordinates of city centers. An example of AOD time series for some of the cities is shown in Fig. S3. In line with Sect. 3.1, a north–south gradient can be found among the cities as well, highlighting that European cities located at more northern latitudes have AOD levels at 550 nm that are in general lower compared to cities at more southern latitudes: Oslo, Dublin and London show median AOD values (the 25th and 75th percentiles are also reported in brackets) of 0.06 (0.03–0.10), 0.06 (0.04–0.10) and 0.07 (0.04–0.12), respectively, whereas the more southern cities of Bologna, Milan and Athens show 0.13 (0.08–0.19), 0.14 (0.07–0.23) and 0.16 (0.11–0.23), respectively. Sites located in the middle range of Fig. 4, like Lisbon, Berlin and Amsterdam, show median AOD values of 0.09 (0.07–0.12), 0.10 (0.05–0.16) and 0.09 (0.06–0.16). The AOD values in the northern cities only rarely exceed a threshold of 0.3, which we arbitrarily relate to pollution (anthropogenic, dust, fires etc.) events (0.6 %, 2.5 % and 4.0 % of the total observations for Oslo, Dublin and London, respectively; see Table 2). For more southern cities like Milan and Athens, this fraction is 14.7 % and 10.6 %, respectively. Looking more closely to the timing of these occurrences, 18 % and 10 % of these “high-pollution” cases occurred before and after 2010, respectively, for Milan and 14 % and 8 % for Athens.
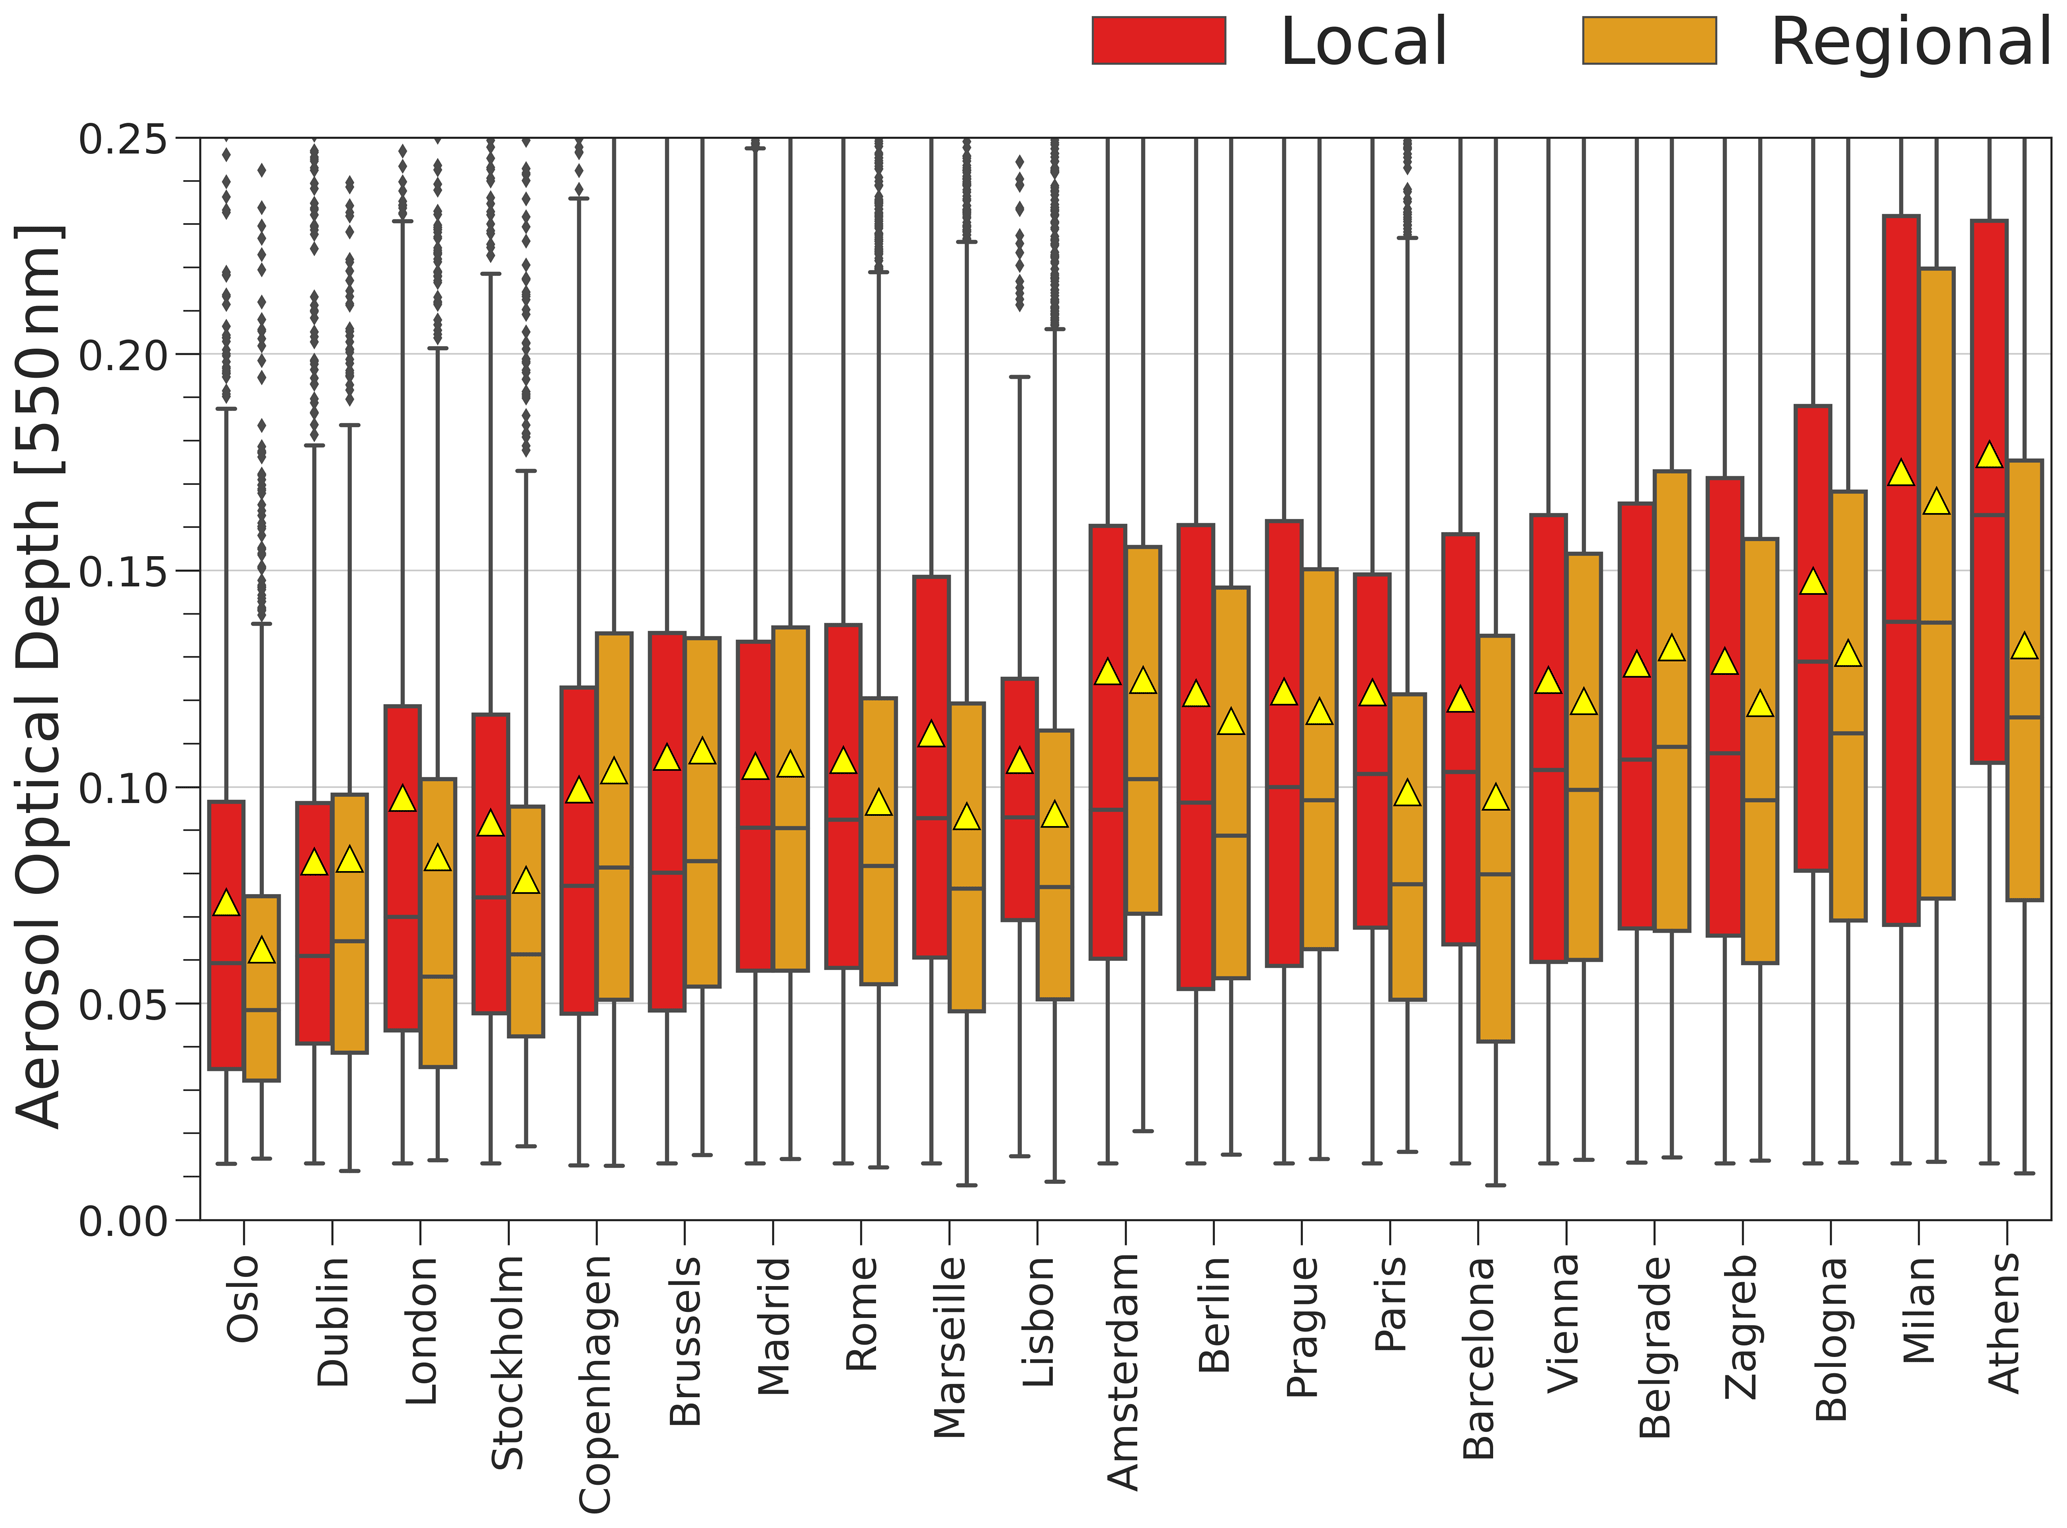
Figure 4Climatology of the aerosol optical depth at 550 nm from the MAIAC algorithm at different cities in Europe for (red) the local scale and (orange) the regional scale, as defined in Sect. 2.1. The location of the cities is shown in Fig. 1. The figure aims to enhance the contribution to AOD enhancement due to the local source of pollution. The yellow triangles represent the AOD mean, whereas the median has been reported as the line crossing the boxplot. Black dots represent the outliers.
Table 2Aerosol optical depth statistics at 550 nm from the MAIAC algorithm at different sites for both the local and regional scale: number of days when AOD > 0.3, 25th and 75th distribution percentiles, LTRR mean ± its standard deviation, and LTRR 25th and 75th distribution percentiles are reported.
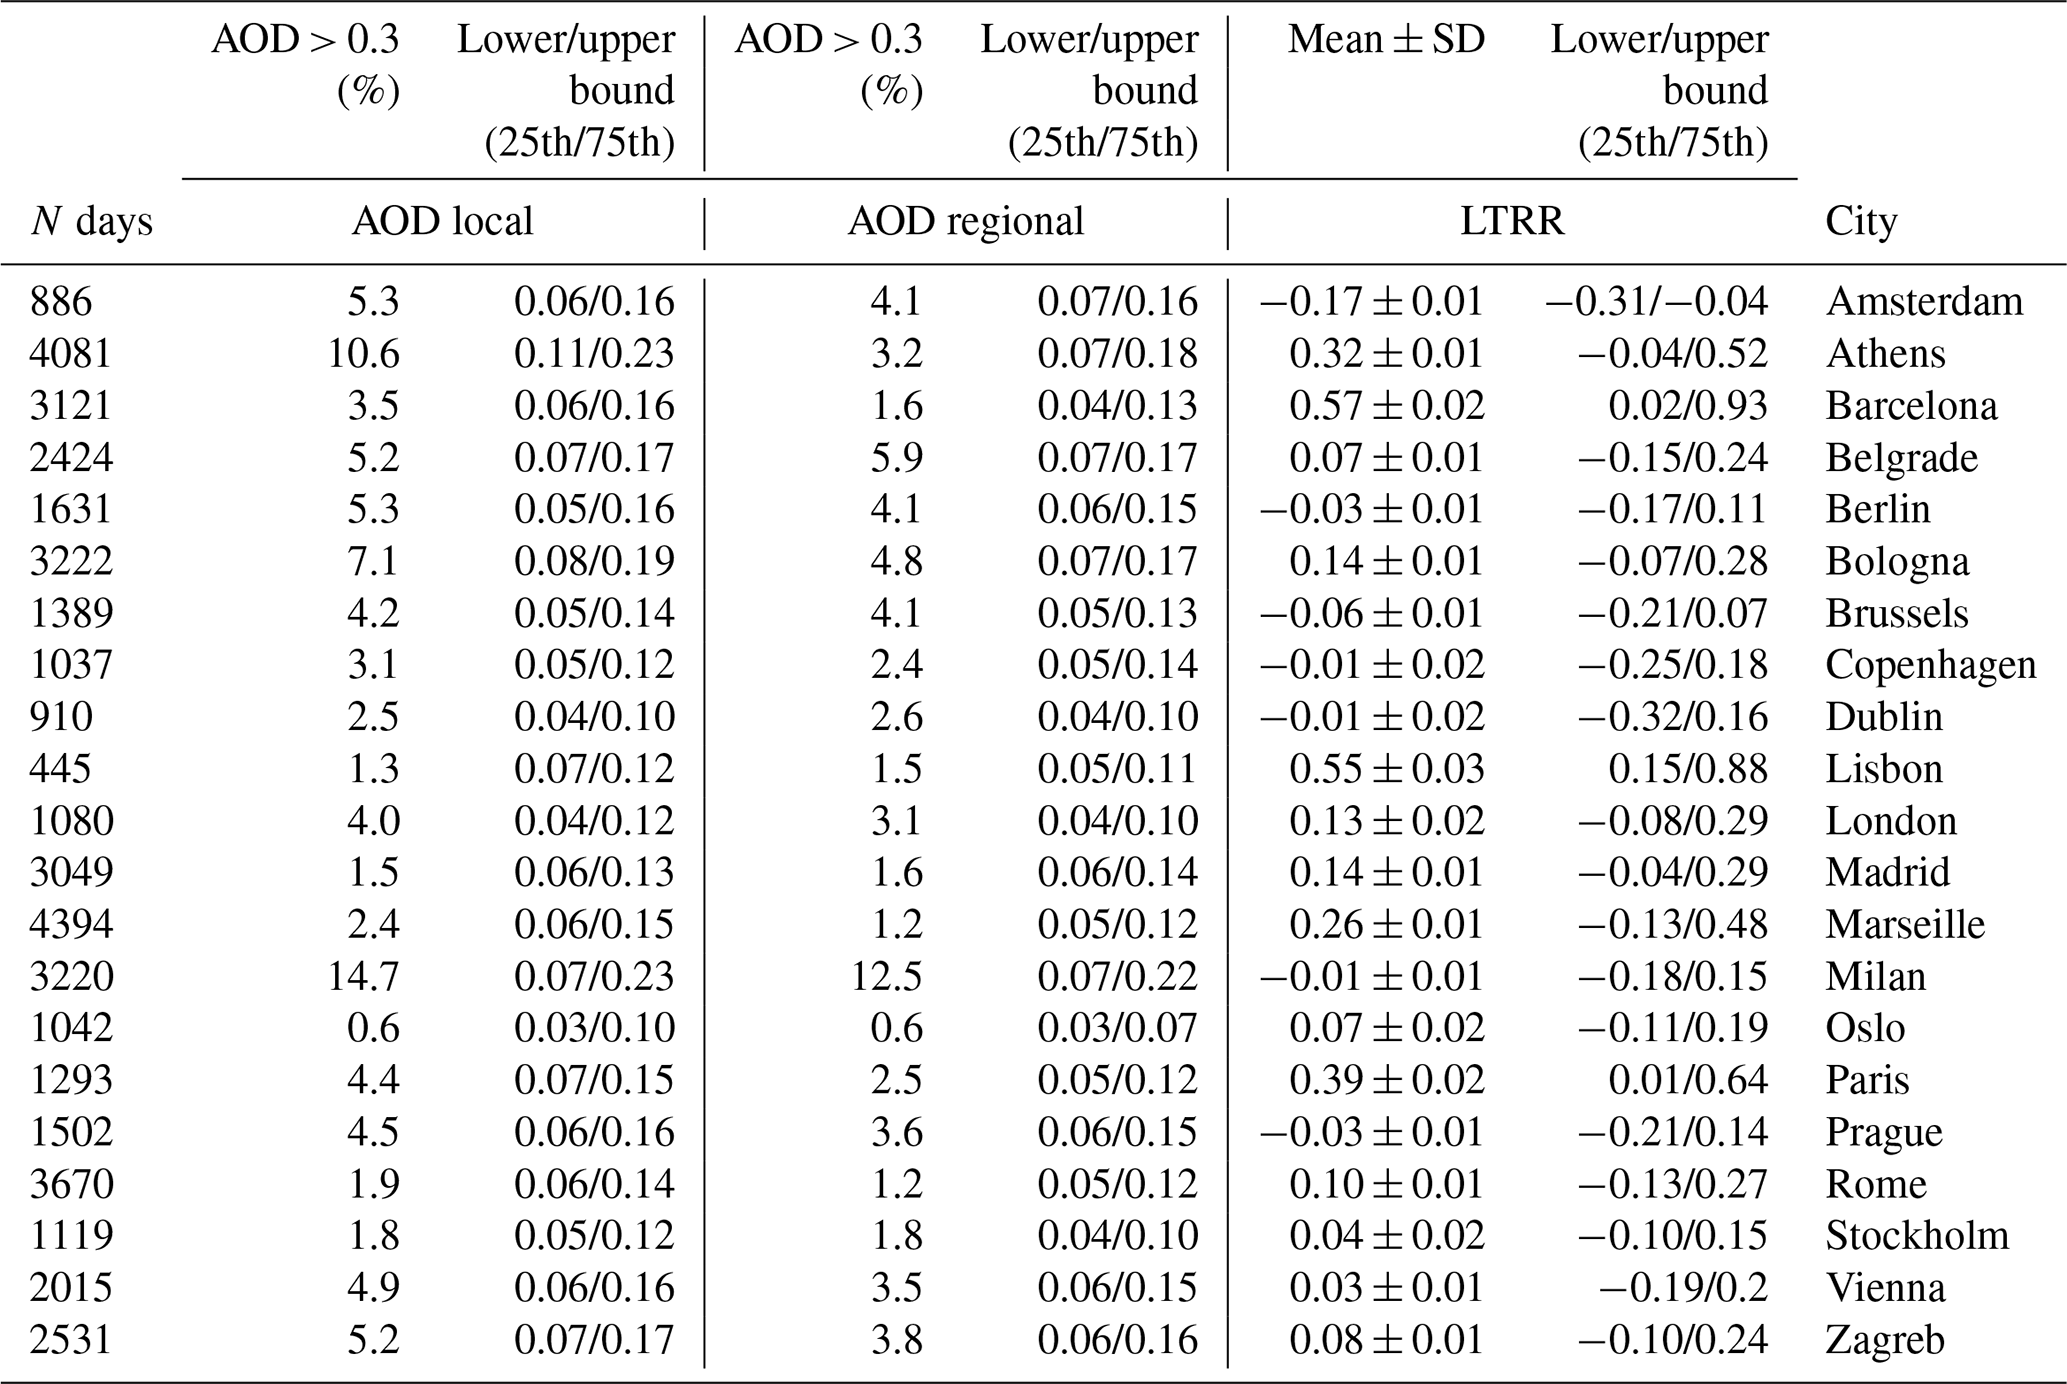
Figure 4 shows that the city centers' local-scale AOD levels in most of the cities considered in our study (58.8 %) are larger than the regional AOD. In addition, an increase in the frequency of AOD > 0.3 can also be observed for the city AOD (See Table 2). The local-to-regional ratio (LTRR) calculated using Eq. (1) for the 2000–2021 period and for the different cities is summarized in Table 2. Again, positive LTRR values are characteristic of an urban-scale contribution to the aerosol burden on top of the regional one, highlighting the importance of local anthropogenic emissions and atmospheric conditions favorable to pollutant accumulation. For instance, an LTRR value of 1 would correspond to a 50 % contribution of urban–local aerosol to total AOD, while a value of 0.5 would correspond to a contribution of a third. It should be noted that the local contribution to surface PM is necessarily stronger than that to AOD, as the importance of the regional background is greater for the vertical column.
In contrast, negative LTRR values indicate a lower local city AOD than the regional one, suggesting a possible inhomogeneity in AOD within the rather large (100 × 100 km2) regional domain since the observed negative LTRR values were in general very small (a low percentage). This could be true especially for coastal sites or partly mountainous sites, where topography plays an important role. Furthermore, this inhomogeneity may be related to (i) the spatial extent of the city, which may impact the AOD levels of the regional scale, or (ii) the different location of emission sources, such as the location of industrial areas, which, combined with favorable meteorological conditions, can lead to inhomogeneous spatial patterns in the regional domain.
An alternative explanation to negative LTRR values would be local aerosol loss at the urban scale. However, systematic urban loss processes are not easy to identify. Sedimentation and dry deposition processes are not expected to be particularly enhanced over urban areas, nor is precipitation, compared to its regional surrounding. On the other hand, the urban heat island with increased temperatures could lead to evaporation of particles. For instance, Pirhadi et al. (2020) finds that due to its semi-volatile character, about 50 % of ambient PM2.5 aerosol mass evaporated when heated up in a thermo-denuder from ambient temperature (∼ 13 ∘C in winter, 23 ∘C in summer and up to 50 ∘C). The urban heat island effect depends on the size and additional heat production within an urban area. It is restricted to light-wind meteorological conditions, and it is more pronounced during night, while MAIAC observations are made during daytime. For these reasons, we consider that evaporation of semi-volatile aerosol under higher urban temperatures could only have a limited effect on our dataset. In the framework of the present analysis it is in general difficult to distinguish between these two loss and inhomogeneity effects.
Maximum mean values of LTRR are shown for Barcelona (0.57 ± 0.02), Lisbon (0.55 ± 0.03), Paris (0.39 ± 0.02) and Athens (0.32 ± 0.01). In contrast, significantly negative LTRR values are shown for Brussels (−0.06 ± 0.01), Amsterdam (−0.17 ± 0.01) and Berlin (−0.03 ± 0.01). The uncertainty has been calculated here as the standard error of the mean: , where σ is the standard deviation of the LTRR distribution, and N is the number of points available over the 2000–2021 period. The most negative LTRR is found for Amsterdam. For this coastal city, larger AODs are observed over the sea than over the continent (see Fig. 3, especially for the spring and autumn seasons), which could be caused by enhanced sea salt, but possibly also by slight differences in the retrieval algorithm for sea and land surfaces. Thus, the regional background cannot be considered to be homogeneous for this case.
In this study we focus on the Paris area, which shows an LTRR of 0.39 ± 0.02. The aim of this interest is to support the preceding climatological studies performed for the ACROSS field campaign (Cantrell and Michoud, 2022). Paris represents a strongly centralized agglomeration with about 11 million inhabitants. It is located in western Europe, in a rural area without strong orography, some 200 km from the Atlantic Ocean. This leads to generally favorable pollutant dispersion conditions (Vautard et al., 2003). The median local AOD value at 550 nm is 0.10 (0.07–0.15) for Paris, which falls slightly over the median of the cities' distribution in Fig. 4. Results from the MEGAPOLI (Beekmann et al., 2010) campaign have shown that a large fraction of fine PM at the ground is transported from the European continent and southern France towards Paris, while local emissions represent a smaller fraction (Beekmann et al., 2015; Bressi et al., 2014). Later studies with multi-year datasets (mid-2011–mid-2013; Petit et al., 2015) or pointing to specific pollution episodes (December 2016; Foret et al., 2022) make the local emission contribution to fine aerosol pollution peaks evident. Skyllakou et al. (2014) show by source apportionment that primary organic aerosol (POA) and elemental carbon (BC) control the PM2.5 fraction of the local Paris emissions, whereas regional advection controls the secondary PM2.5 fraction. Organic aerosols have been shown to play a key role in the Paris air quality assessment (Zhang et al., 2019; Petit et al., 2015; Bressi et al., 2014). Sulfate and secondary organic aerosols are mainly attributed to long-range transport (Foret et al., 2022; Skyllakou et al., 2014). For the period 2000–2021, the percentage of days with AOD > 0.3 is found to be 4 % at the local Paris scale.
Barcelona shows a local/regional distribution that is rather similar to Paris (Fig. 4), although its LTRR is larger (0.57 ± 0.02, actually the largest in our study), and the geomorphology of the two sites is significantly different. It is located in the northeastern part of the Iberian Peninsula, bordering the Mediterranean Sea and the foothills of the Pyrenees mountains. Recirculation caused by mountain winds and sea breeze (Jaén et al., 2021; Pérez et al., 2004) could enhance the urban–local AOD. In addition, the regional background over the mountainous area next to Barcelona is relatively low with respect to that over the Mediterranean Sea (Fig. 3), which could contribute to the large LTRR.
Bologna and Milan are surrounded by the well-known Po Valley, as previously discussed, where recirculation and stagnation events of aerosol and precursors may occur and cause enhanced pollution levels (Putaud et al., 2014). Vecchi et al. (2018) showed by source apportionment analysis that, during the winter season, the major PM contribution to light extinction for the Milan urban area is nitrate (42 %), followed by sulfate and primary aerosol due to traffic- and biomass-burning-related organic aerosol. In another study, secondary inorganic aerosols have also been shown to contribute 35 % of the PM over the Milan urban area on average annually (Amato et al., 2016). As a consequence, the large regional PM background leads to comparatively small additional local contributions and small LTRR values for both of these cities.
Concerning Athens, with an LTRR of 0.32 ± 0.01, aerosols of anthropogenic origin have been shown to dominate. Indeed Taghvaee et al. (2019) showed by source apportionment analysis that traffic emissions, secondary organic aerosol (SOA) and biomass burning correspond to major sources of PM2.5 samples, contributing 44 %, 16 % and 9 %, respectively, with higher PM values during summer than winter. During the latter season high-PM2.5 episodes are linked to dust and biomass burning episodes (Raptis et al., 2020). Furthermore, the organic aerosol concentrations in Athens have been shown to be dominated by regional SOA during summertime (Tsiflikiotou et al., 2019), also highlighting the importance of long-range transport in this area (Manousakas et al., 2020). As a conclusion of this discussion, PM2.5 sources over the Athens region are a mixture of regional and local origin, which is reflected in its LTRR value.
For the seasonal variation in LTRR values, Fig. 5 shows the scatterplot between the local and regional AOD as a function of the season for all cities. The fitting line considering all seasons shows a slope of 1.08 and a linear correlation of 0.89, highlighting the overall average positive contribution to air quality degradation at the local and the regional scale over the different seasons. Figure 5 shows that the fraction of points where AODlocal > AODregional is 84 %, 65 %, 75 % and 97 % for DJF, MAM, JJA and SON, respectively. This result suggests that the local contribution is higher during winter and lower during summer. In order to explain this difference, it should be considered that during summertime, favorable weather conditions, stronger photochemistry activity and enhanced BVOC emissions can lead to increased secondary aerosol formation and increase the secondary to primary aerosol ratio. As secondary aerosol formation is a regional phenomenon (Beekmann et al., 2015; Skyllakou et al., 2014; Karl et al., 2009), the regional contribution to AOD is increased. Furthermore, possible dust and fire events can also contribute to the increase in the regional signal during summer and spring over Europe. However, during wintertime secondary aerosol formation is less pronounced; in addition primary aerosol emissions are increased due to increased heating demand.
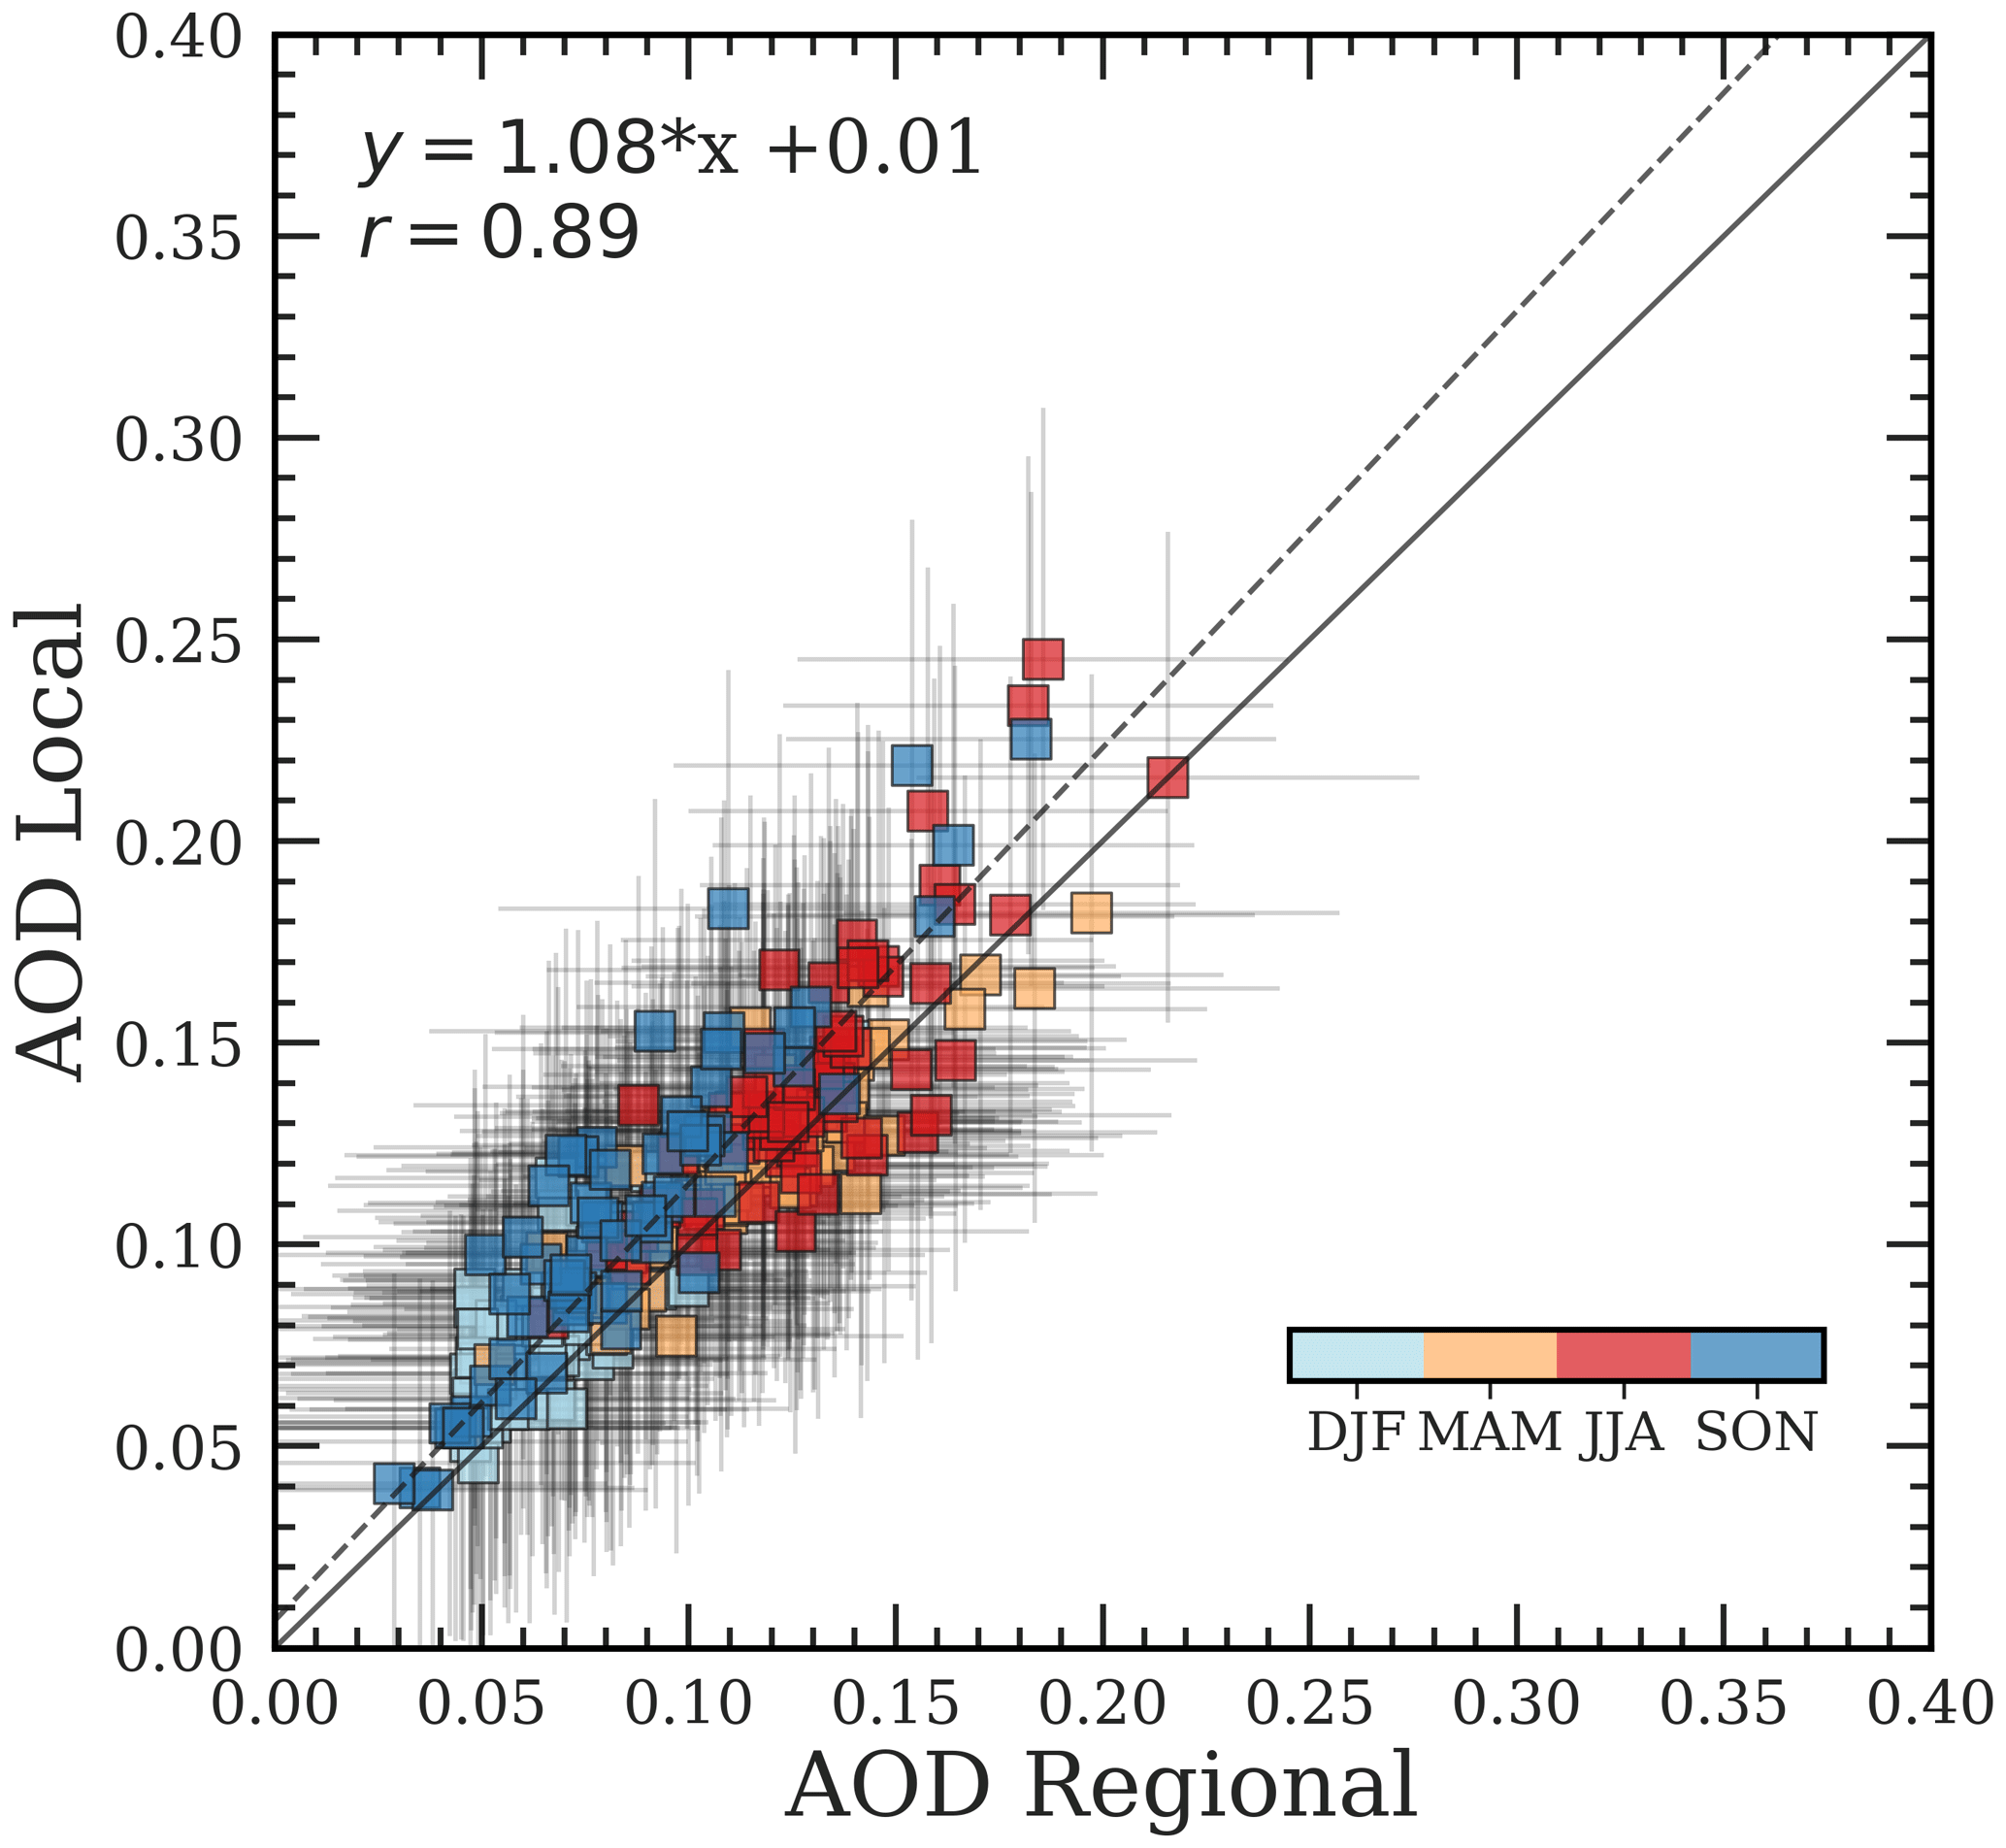
Figure 5Local vs. regional scatterplot in different seasons (December–January–February, DJF; March–April–May, MAM; June–July–August, JJA; September–October–November, SON). The largest differences between local and regional are found during the DJF and MAM seasons. Vertical and horizontal bars represent the x and y errors. Solid and dashed lines represent the 1 : 1 and regression lines, respectively.
3.3 Trend analysis
The analysis of the high-resolution MAIAC product can contribute to the further investigation of the aerosol optical depth tendency over the European region. Statistically significant (p value < 0.05) absolute and relative AOD trends over the European continent are reported in Fig. 6. Negative AOD trends have been found over the domain of interest, in the [−3, −0.6] % yr−1 range, representing the 5th and 95th percentile, respectively, of Fig. 6b. Furthermore, more negative trends are mostly found over the regional hotspots outlined in Sect. 3.1 (Po Valley, Mediterranean Basin, parts of eastern Europe). Decreasing relative and absolute trends of −1.34 ± 0.29 % yr−1 and −0.0021 ± 0.0005 units yr−1 for the Mediterranean Basin have been found for the 2001–2021 period. A decreasing absolute trend of −0.003 units yr−1 for the 2002–2014 period has also been found with the MAIAC data in agreement with the −0.003 units yr−1 observed in Floutsi et al. (2016). A trend of −1.66 ± 0.58 % yr−1 at 550 nm has been estimated for the Po Valley, lower than what has been observed at the Ispra AERONET site in the period 2004–2010 (Putaud et al., 2014), where they estimated a decreasing trend of −4.0 ± 1.8 % yr−1 and −2.5 ± 1.3 % yr−1 for the 440 and 675 nm, respectively. Negative AOD tendency has also been registered for the Benelux and the Peloponnese area of −2.46 ± 0.96 % yr−1 and −1.49 ± 0.45 % yr−1, respectively. A statistically absolute significant trend of −0.003 ± 0.002 units yr−1 has been observed for the eastern Europe area, in line with what is observed in Filonchyk et al. (2020a) for the 2002–2018 period, where values in the range of [−0.0025, −0.0028] units yr−1 are observed for the Czech Republic, Bulgaria, Slovakia and Hungary with MODIS TERRA data. However stronger trends for the 2002–2019 period, in the range of [−0.0031, −0.0076] units yr−1, are observed in Filonchyk et al. (2020b) for several cities in eastern Europe by using MODIS AQUA data. Chubarova et al. (2016) attribute the significant negative trends observed in Moscow for the 2001–2014 period to the strong decrease in SOx, non-methane volatile organic compounds (NMVOCs) and NOx emissions. As a matter of fact, Tsyro et al. (2022) predicted, through a six-model ensemble approach, decreasing surface PM2.5 and PM10 over Europe for the 1990–2010 period, attributed to a large impact on sulfate, ammonium and nitrate precursor emission reductions. Nevertheless, this decrease appeared to have a greater impact over central and eastern Europe. For instance, trends stronger than −2.5 % yr−1 are observed over Germany, the Czech Republic, Hungary, Slovakia and Ukraine for both PM2.5 and PM10.
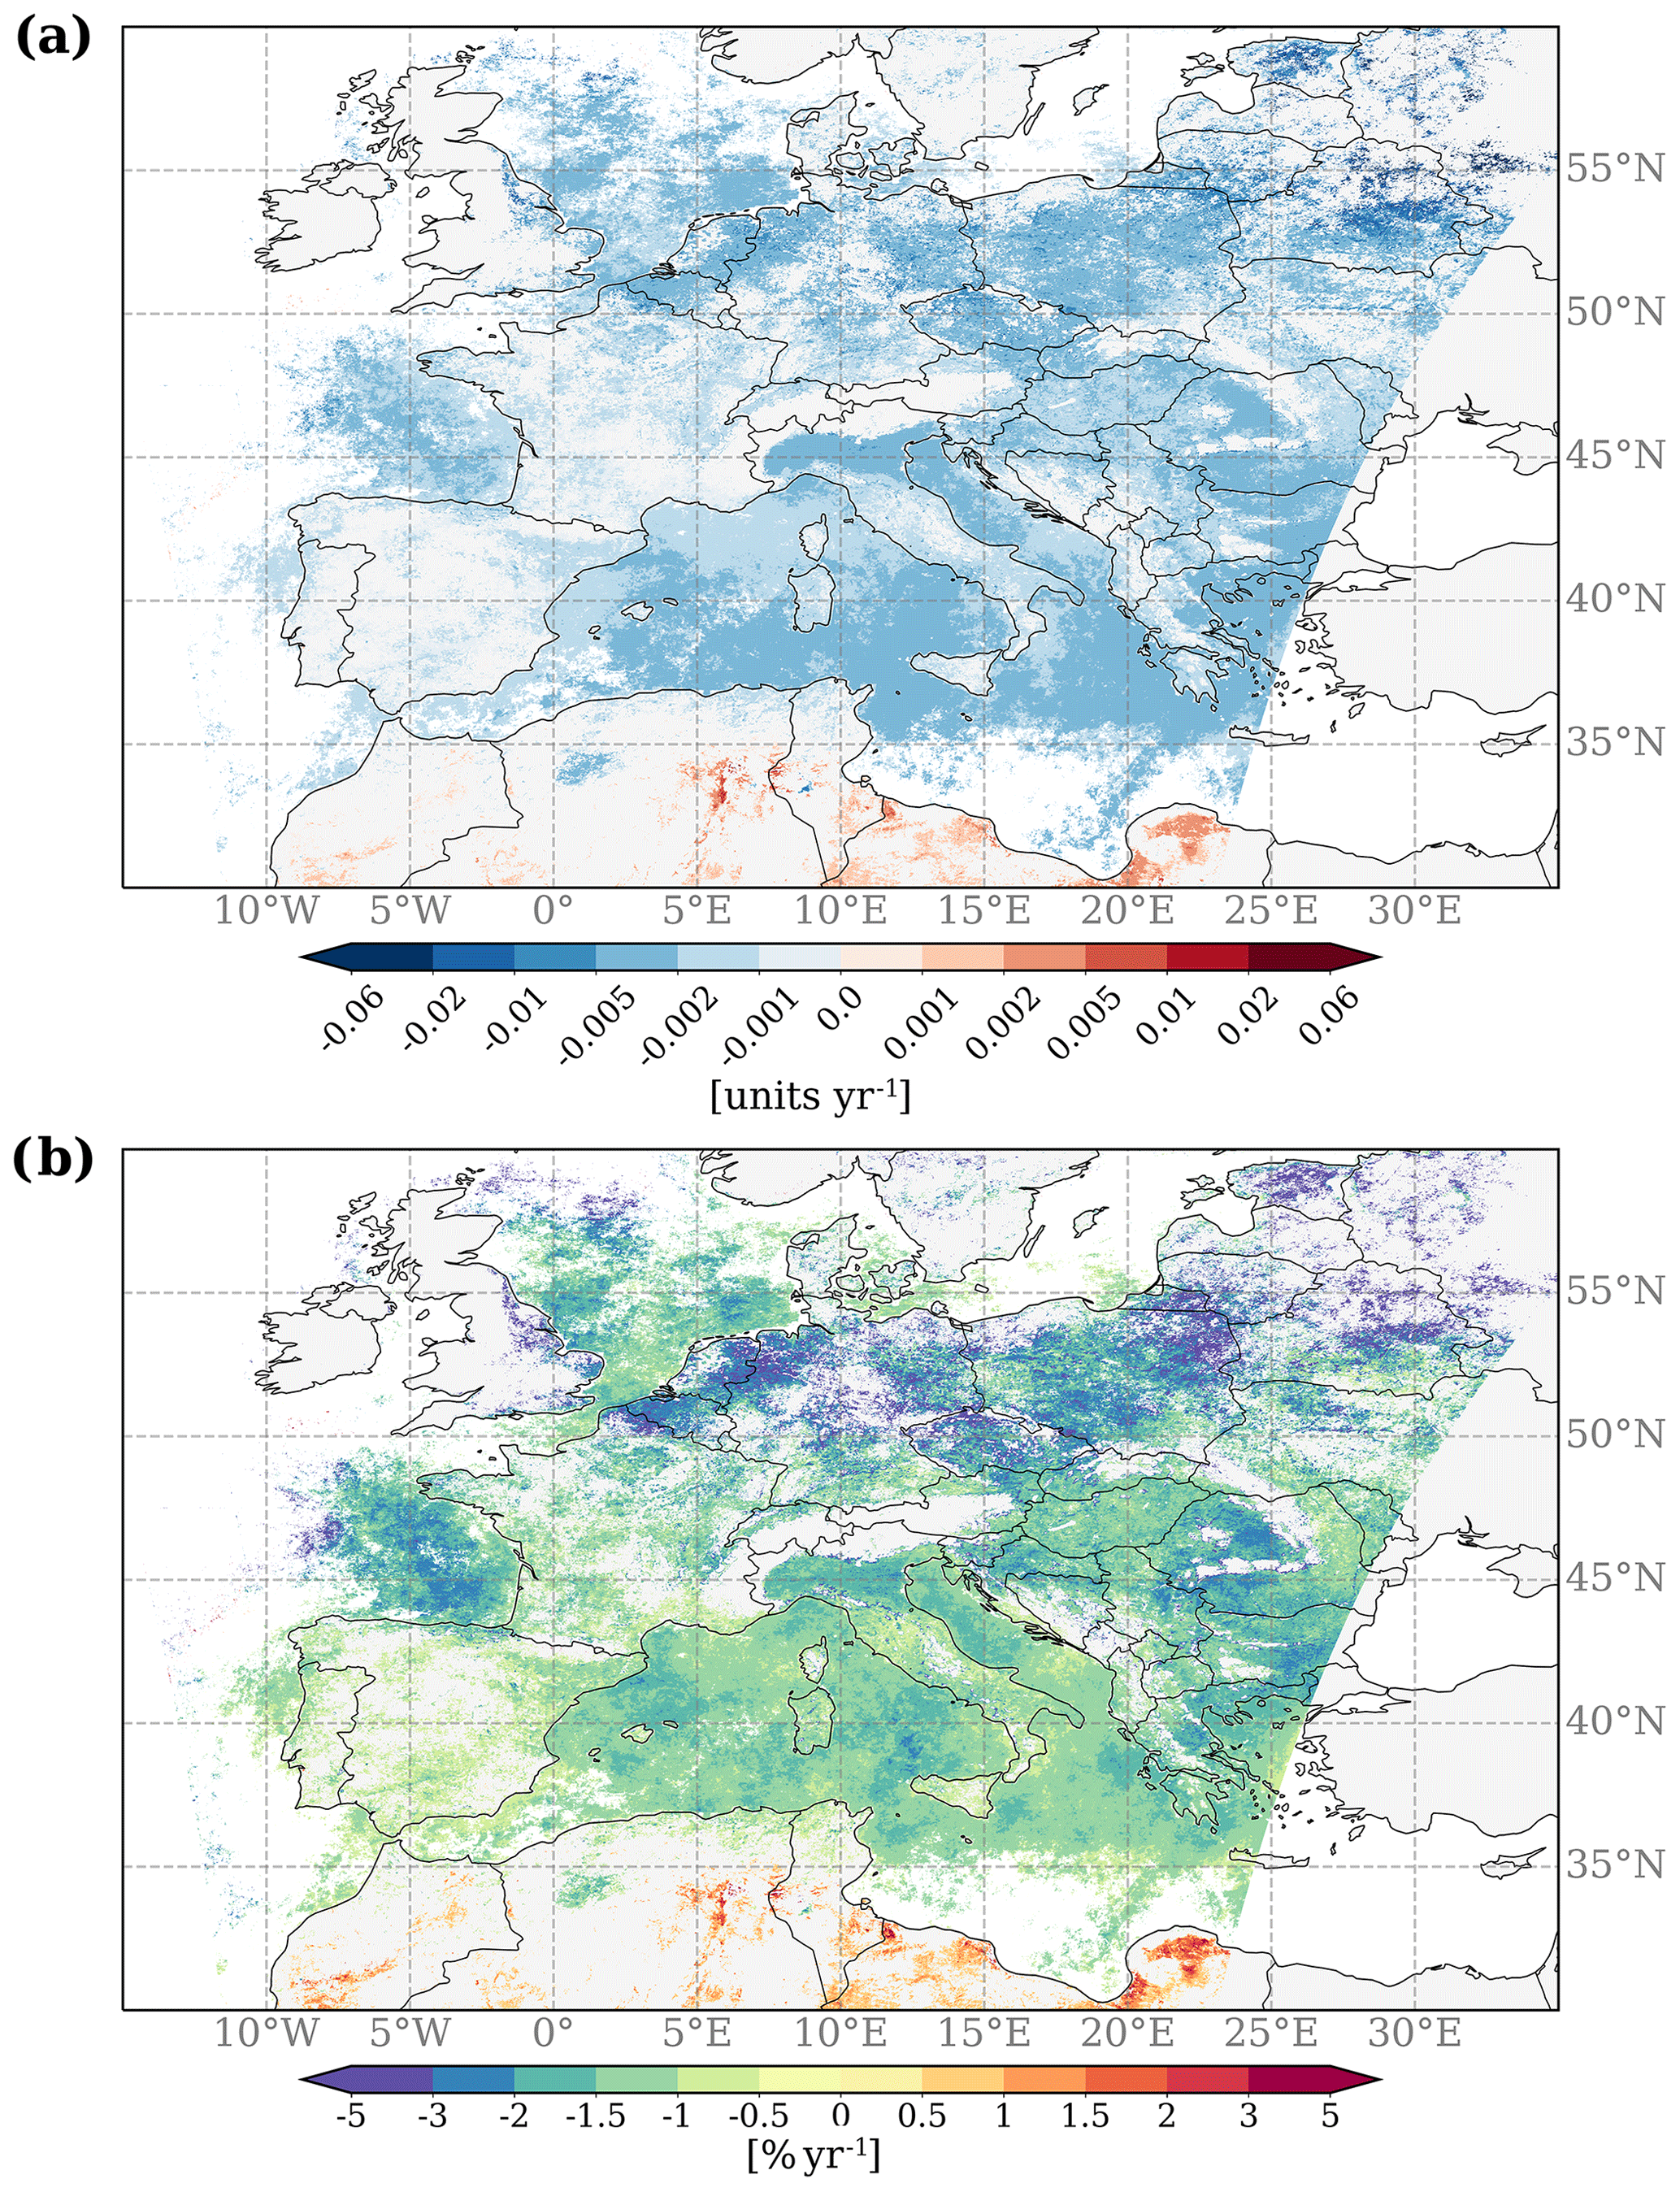
Figure 6Theil–Sen (a) absolute and (b) relative change in aerosol optical depth at 550 nm over the European domain for the 2000–2021 period. Only the significant (p value < 0.05) pixels are reported.
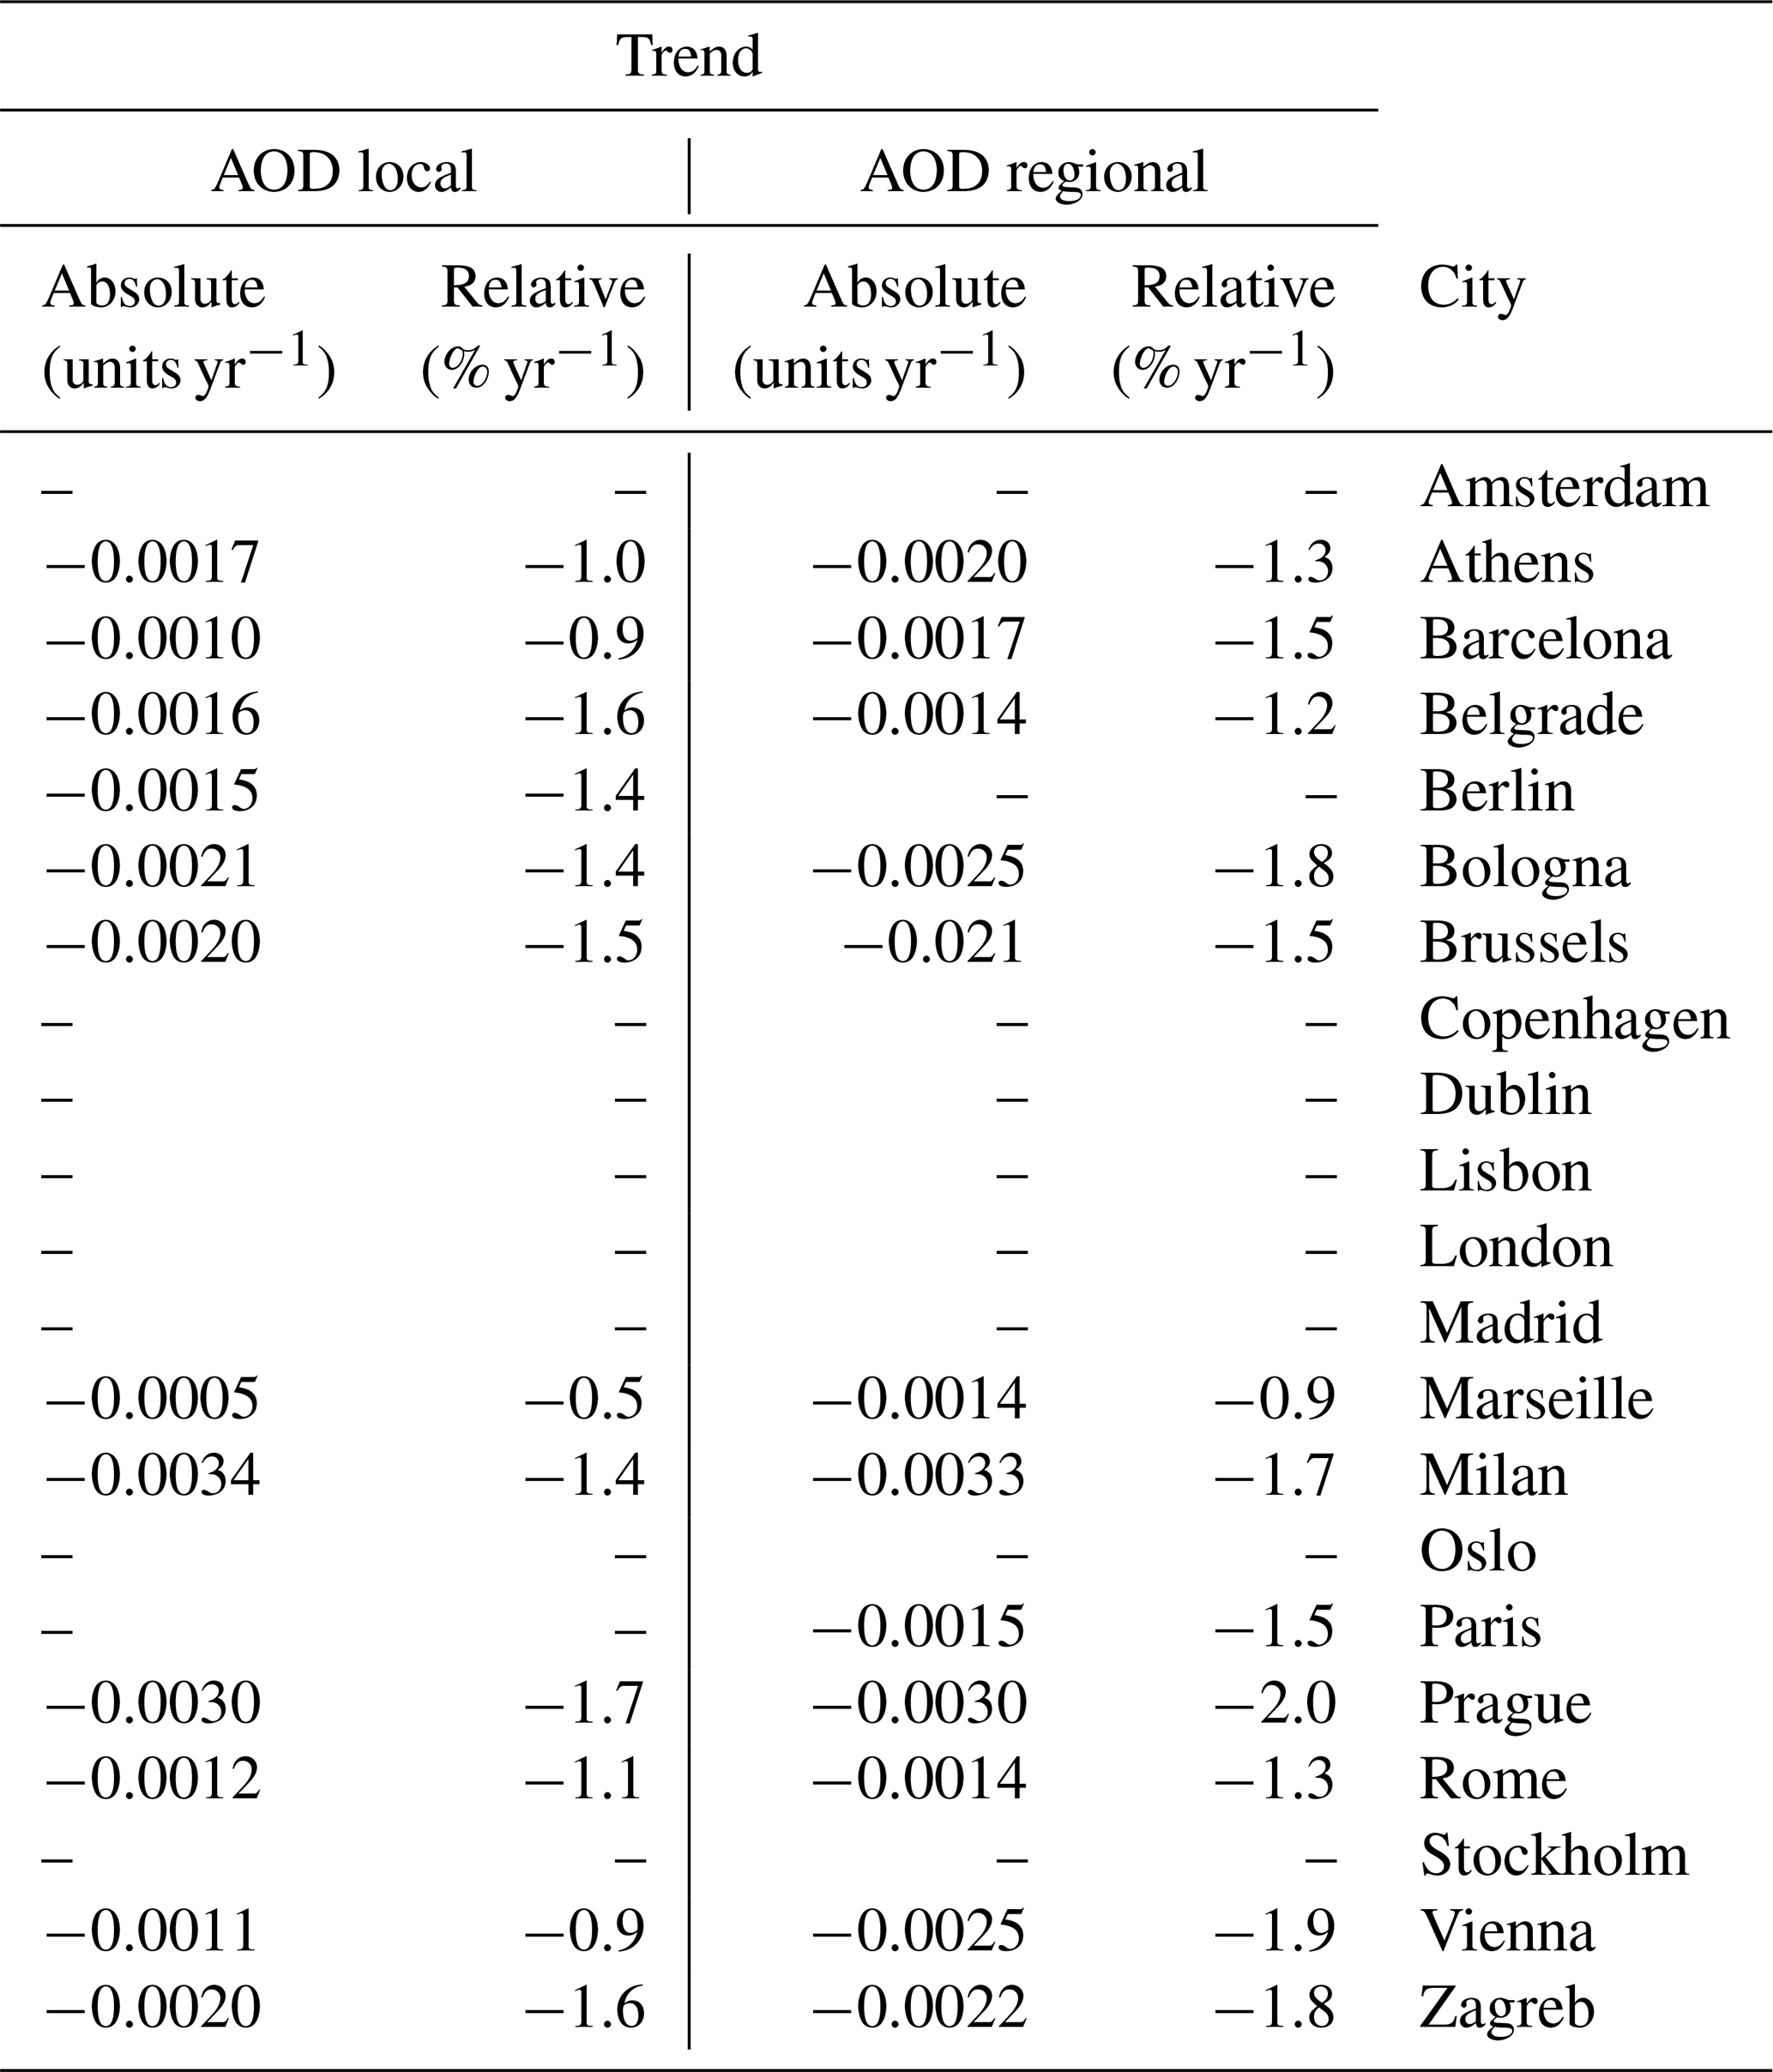
Taking advantage of the high spatial resolution of the MAIAC product, the analysis has been extended to a local scale to estimate the AOD trends over the cities listed in Table 2 and to compare them to the trends for the surrounding regional background. Results are shown and summarized in Table 3. For most of the sites, a significant negative trend can be identified consistently both within the city center (3 × 3 km2) and in the surrounding area (100 × 100 km2). For instance, Athens, Prague, Vienna, Milan, Zagreb and Bologna show AOD trends in the range of [−0.9, −1.7] % yr−1 and [−1.3, −2.0] % yr−1 for the regional and local scale, respectively. This result is in line with the aforementioned observations at the European scale and with other studies focusing on European megacities (Papachristopoulou et al., 2022; Gupta et al., 2022; Zhao et al., 2017). Papachristopoulou et al. (2022) observed a decrease in AOD of up to −0.03 units per decade over the 2003–2020 period for European megacities like Paris, Barcelona, Madrid and London. This result is comparable to the range of [−0.01, −0.03] units per decade observed for the European cities analyzed in this study. Conversely, cities where AOD levels are relatively low (positioned in the leftmost part of Fig. 4) do not generally show statistically significant results. Among all the cities, Prague shows the strongest relative trend at both the regional and local scale of −2.0 % yr−1 and −1.7 % yr−1, respectively. The absolute value obtained in this study for the local scale is comparable to that of −0.0022 obtained in Filonchyk et al. (2020a) for the 2000–2018 period. Moreover, the estimated trend of −1.0 % yr−1 over Athens is in line with the −1.1 % yr−1 obtained at 440 nm at the AERONET urban site in Raptis et al. (2020) for the 2000–2018 period. In the case of Paris, a trend of −1.5 % yr−1 is obtained for the regional scale, while the city center trend is not significant. Interestingly, the regional relative trend for most cities (9 of 11 in Table 3) is stronger (i.e., more negative) than the local one. One possible reason of this outcome could be a stronger decrease in secondary aerosols due to stringent pollution control of precursors (SO2; NOx; volatile organic compounds, VOCs) than that of primary aerosol, as found for several French EMEP/MERA network sites (Font et al., 2023). Indeed, the primary to secondary aerosol ratio is expected to be larger for urban than for regional background sites.
Table 3Optical depth trends at the local and regional scale for the different analyzed cities. Only significant trends are shown (p value < 0.05).
This study presents a quantitative estimation of the aerosol optical depth variability in Europe using long-term measurements (2000–2021) from the MAIAC algorithm applied to MODIS satellite observations. The MAIAC validation, performed at the European scale against ground-based sun photometer data, demonstrates a slight underestimation of MAIAC AOD, showing an MBE of −0.02 and an RMSE of 0.06, respectively. An expected error EE = has been found for the European continent, which is lower with respect to what was suggested by Lyapustin et al. (2018). Moreover, according to the AERONET AE splitting analysis, the validation, which provides satisfactory results for mixed and fine aerosol mode, does not perform as strongly in the presence of coarse-dominated aerosols. This suggests that further improvements of the MAIAC algorithm are needed for scenes dominated by dust or other coarse-sized particles.
Regarding the AOD seasonal climatology over the European continent, the AOD exhibits maximum and minimum values during the summer (JJA) and winter (DJF) seasons, respectively, showing a strong north–south latitudinal gradient. Values of AOD in the range of 0.12–0.22 (JJA) and 0.06–0.09 (DJF) are observed in the 30–60∘ N band.
Concerning the link between regional- and local-scale air quality across the main European cities, which was the main objective of this work, both the regional background and city level AOD show a general north–south gradient with increasing AOD and several hotspots over the Po Valley and the Mediterranean Sea. The analysis of the local-to-regional ratio shows that most of the cities contribute to the enhancement of the AOD loading with respect to their regional background. In contrast, for some cities a slightly negative LTRR could be explained by either specific losses or an inhomogeneity of the regional background. On a relative scale the city contribution to regional AOD is maximum during the winter season because the primary vs. secondary aerosol ratio is expected to be the largest. Concerning the Paris area, most of the pollution has been considered to be transported from the European continent in previous studies (Beekmann et al., 2015). In fact, Paris represents an important isolated agglomeration with respect to the surrounding area. Indeed, the long-term analysis conducted in this work indicates an average local-to-regional excess ratio of 39 %, suggesting a non-negligible impact of the city emissions in addition to the regional aerosol burden in Paris. Further investigation is needed to understand the nature of this AOD difference. As a matter of fact, the interaction between the regional background and the local emissions cannot be exploited through AOD measurements directly, although we know that changes in the chemical and optical properties lead to changes in the aerosol extinction profile. Further investigation of the interaction between biogenic and anthropogenic local and regional air masses and the impact on aerosol properties will be provided in the ACROSS project (Cantrell and Michoud, 2022).
Different studies have already shown negative decreasing AOD trends over the European continent using MODIS satellite data in particular, however, most of the time with a broader spatial resolution with respect to the product used in this study. The MAIAC high-spatial-resolution product has been exploited to investigate the AOD trends at both the European and local city scale. The result shows a general AOD decrease over the entire European continent, consistent with the recent literature and in connection with the mitigation policies over the European countries. In particular, spatially homogeneous trends have been found over known European hotspots (e.g., −1.34 % yr−1 and −1.66 % yr−1 for the Mediterranean Sea and the Po Valley, respectively). In addition, taking advantage of the high spatial resolution, the analysis has also been extended at the city level, showing a statistically significant yearly decrease in AOD at 550 nm during the last 2 decades in the range of [−0.5, −1.7] % yr−1 at the city level and [−0.9, −2.0] % yr−1 in the surroundings. This result highlights the faster decrease in regional AOD levels with respect to those at the urban–local scale. Nevertheless, over the Paris area, we observed a statistically significant negative trend only at the regional scale. A potential explanation could be linked to the more stringent control of aerosol precursor emissions (SO2, NOx, VOCs) with respect to direct aerosol emissions (Font et al., 2023).
The MAIAC MCD19A2 data used in this study are accessible at https://doi.org/10.5067/MODIS/MCD19A2.006 (Lyapustin et al., 2018). The AERONET data are available at https://aeronet.gsfc.nasa.gov/ (AERONET, 2023). Population data reported in Table 1 can be accessed at the following link: http://data.europa.eu/88u/dataset/yfspvoibibfesstjomhcg (Eurostat, 2023). The data and the codes that support the findings of this study are available upon request from the corresponding authors.
The supplement related to this article is available online at: https://doi.org/10.5194/acp-23-12455-2023-supplement.
LDA, CDB and MB designed the study and discussed the results. LDA performed the data analysis with contributions from CDB and MB. GF, PF, GS and JFD contributed to the discussion of the results. LDA, CDB and MB wrote the paper with contributions from all co-authors.
The contact author has declared that none of the authors has any competing interests.
Publisher's note: Copernicus Publications remains neutral with regard to jurisdictional claims in published maps and institutional affiliations.
This article is part of the special issue “Atmospheric Chemistry of the Suburban Forest – multiplatform observational campaign of the chemistry and physics of mixed urban and biogenic emissions”. It is not associated with a conference.
This work has been supported by the ACROSS and the RI-URBANS projects. The ACROSS project has received funding from the French National Research Agency (ANR) under the investment program integrated into France 2030, with the reference ANR-17-MPGA-0002, and it was supported by the French National program LEFE (Les Enveloppes Fluides et l'Environnement) of the CNRS/INSU (Centre National de la Recherche Scientifique/Institut National des Sciences de L'Univers). The RI-URBANS project has received funding from the European Union's Horizon 2020 research and innovation program under grant agreement no. 101036245. We thank all the AERONET PIs and their staff for establishing and maintaining all the sites used in this investigation. Useful discussions with Marc Mallet, Yevgeny Derimian and Jean-Christophe Raut are gratefully acknowledged. We thank Christopher Cantrell and Vincent Michoud, PIs of the ACROSS project. Helpful comments by the reviewers are gratefully acknowledged.
This research has been supported by the European Commission, Horizon 2020 (grant no. 101036245); the Agence Nationale de la Recherche (grant no. ANR-17-MPGA-0002); and the Centre National de la Recherche Scientifique, Institut National des Sciences de L'Univers (ACROSS-GO).
This paper was edited by Stelios Kazadzis and reviewed by Alexei Lyapustin and one anonymous referee.
AERONET: Version 3 Aerosol Optical Depth, https://aeronet.gsfc.nasa.gov/, last access: June 2023.
Alpert, P., Shvainshtein, O., and Kishcha, P.: AOD Trends over Megacities Based on Space Monitoring Using MODIS and MISR, American Journal of Climate Change, 1, 117–131, https://doi.org/10.4236/ajcc.2012.13010, 2012.
Aman, N., Manomaiphiboon, K., Suwattiga, P., Assareh, N., Limpaseni, W., Suwanathada, P., Soonsin, V., and Wang, Y.: Visibility, aerosol optical depth, and low-visibility events in Bangkok during the dry season and associated local weather and synoptic patterns, Environ. Monit. Assess., 194, 322, https://doi.org/10.1007/s10661-022-09880-2, 2022.
Amato, F., Alastuey, A., Karanasiou, A., Lucarelli, F., Nava, S., Calzolai, G., Severi, M., Becagli, S., Gianelle, V. L., Colombi, C., Alves, C., Custódio, D., Nunes, T., Cerqueira, M., Pio, C., Eleftheriadis, K., Diapouli, E., Reche, C., Minguillón, M. C., Manousakas, M.-I., Maggos, T., Vratolis, S., Harrison, R. M., and Querol, X.: AIRUSE-LIFE+: a harmonized PM speciation and source apportionment in five southern European cities, Atmos. Chem. Phys., 16, 3289–3309, https://doi.org/10.5194/acp-16-3289-2016, 2016.
Ångström, A.: On the Atmospheric Transmission of Sun Radiation and on Dust in the Air, Geogr. Ann., 11, 156–166, https://doi.org/10.1080/20014422.1929.11880498, 1929.
Backes, A. M., Aulinger, A., Bieser, J., Matthias, V., and Quante, M.: Ammonia emissions in Europe, part II: How ammonia emission abatement strategies affect secondary aerosols, Atmos. Environ., 126, 153–161, https://doi.org/10.1016/j.atmosenv.2015.11.039, 2016.
Bahadur, R., Praveen, P. S., Xu, Y., and Ramanathan, V.: Solar absorption by elemental and brown carbon determined from spectral observations, P. Natl. Acad. Sci. USA, 109, 17366–17371, https://doi.org/10.1073/pnas.1205910109, 2012.
Bai, R., Xue, Y., Jiang, X., Jin, C., and Sun, Y.: Retrieval of High-Resolution Aerosol Optical Depth for Urban Air Pollution Monitoring, Atmosphere, 13, 756, https://doi.org/10.3390/atmos13050756, 2022.
Barnaba, F. and Gobbi, G. P.: Aerosol seasonal variability over the Mediterranean region and relative impact of maritime, continental and Saharan dust particles over the basin from MODIS data in the year 2001, Atmos. Chem. Phys., 4, 2367–2391, https://doi.org/10.5194/acp-4-2367-2004, 2004.
Bäumer, D., Vogel, B., Versick, S., Rinke, R., Möhler, O., and Schnaiter, M.: Relationship of visibility, aerosol optical thickness and aerosol size distribution in an ageing air mass over South-West Germany, Atmos. Environ., 42, 989–998, https://doi.org/10.1016/j.atmosenv.2007.10.017, 2008.
Beekmann, M., Chiappini, L., Favez, O., Aymoz, G., Bessagnet, B., Rouil, L., and Rossignol, S.: The megapoli paris campaign for urban aerosol characterisation – a comprehensive data set for air quality model evaluation, in: 13. International Conference on Harmonisation within Atmospheric Dispersion Modelling for Regulatory Purposes (HARMO 13), 1–4 June 2010, Paris, France, 519–523, ISBN 978-286815062-2, 2010.
Beekmann, M., Prévôt, A. S. H., Drewnick, F., Sciare, J., Pandis, S. N., Denier van der Gon, H. A. C., Crippa, M., Freutel, F., Poulain, L., Ghersi, V., Rodriguez, E., Beirle, S., Zotter, P., von der Weiden-Reinmüller, S.-L., Bressi, M., Fountoukis, C., Petetin, H., Szidat, S., Schneider, J., Rosso, A., El Haddad, I., Megaritis, A., Zhang, Q. J., Michoud, V., Slowik, J. G., Moukhtar, S., Kolmonen, P., Stohl, A., Eckhardt, S., Borbon, A., Gros, V., Marchand, N., Jaffrezo, J. L., Schwarzenboeck, A., Colomb, A., Wiedensohler, A., Borrmann, S., Lawrence, M., Baklanov, A., and Baltensperger, U.: In situ, satellite measurement and model evidence on the dominant regional contribution to fine particulate matter levels in the Paris megacity, Atmos. Chem. Phys., 15, 9577–9591, https://doi.org/10.5194/acp-15-9577-2015, 2015.
Bellouin, N., Quaas, J., Gryspeerdt, E., Kinne, S., Stier, P., Watson-Parris, D., Boucher, O., Carslaw, K. S., Christensen, M., Daniau, A.-L., Dufresne, J.-L., Feingold, G., Fiedler, S., Forster, P., Gettelman, A., Haywood, J. M., Lohmann, U., Malavelle, F., Mauritsen, T., McCoy, D. T., Myhre, G., Mülmenstädt, J., Neubauer, D., Possner, A., Rugenstein, M., Sato, Y., Schulz, M., Schwartz, S. E., Sourdeval, O., Storelvmo, T., Toll, V., Winker, D., and Stevens, B.: Bounding Global Aerosol Radiative Forcing of Climate Change, Rev. Geophys., 58, e2019RG000660, https://doi.org/10.1029/2019RG000660, 2020.
Bender, F. A.-M.: Aerosol Forcing: Still Uncertain, Still Relevant, AGU Adv., 1, e2019AV000128, https://doi.org/10.1029/2019AV000128, 2020.
Bilal, M., Nazeer, M., Nichol, J. E., Bleiweiss, M. P., Qiu, Z., Jäkel, E., Campbell, J. R., Atique, L., Huang, X., and Lolli, S.: A Simplified and Robust Surface Reflectance Estimation Method (SREM) for Use over Diverse Land Surfaces Using Multi-Sensor Data, Remote Sens., 11, 1344, https://doi.org/10.3390/rs11111344, 2019.
Bodenheimer, S., Nirel, R., Lensky, I. M., and Dayan, U.: The synoptic skill of aerosol optical depth and angstrom exponent levels over the Mediterranean Basin, Int. J. Climatol., 41, 1801–1820, https://doi.org/10.1002/joc.6931, 2021.
Boers, R., Weele, M. van, Meijgaard, E. van, Savenije, M., Siebesma, A. P., Bosveld, F., and Stammes, P.: Observations and projections of visibility and aerosol optical thickness (1956–2100) in the Netherlands: impacts of time-varying aerosol composition and hygroscopicity, Environ. Res. Lett., 10, 015003, https://doi.org/10.1088/1748-9326/10/1/015003, 2015.
Bovchaliuk, A., Milinevsky, G., Danylevsky, V., Goloub, P., Dubovik, O., Holdak, A., Ducos, F., and Sosonkin, M.: Variability of aerosol properties over Eastern Europe observed from ground and satellites in the period from 2003 to 2011, Atmos. Chem. Phys., 13, 6587–6602, https://doi.org/10.5194/acp-13-6587-2013, 2013.
Bressi, M., Sciare, J., Ghersi, V., Mihalopoulos, N., Petit, J.-E., Nicolas, J. B., Moukhtar, S., Rosso, A., Féron, A., Bonnaire, N., Poulakis, E., and Theodosi, C.: Sources and geographical origins of fine aerosols in Paris (France), Atmos. Chem. Phys., 14, 8813–8839, https://doi.org/10.5194/acp-14-8813-2014, 2014.
Bucci, S., Cristofanelli, P., Decesari, S., Marinoni, A., Sandrini, S., Größ, J., Wiedensohler, A., Di Marco, C. F., Nemitz, E., Cairo, F., Di Liberto, L., and Fierli, F.: Vertical distribution of aerosol optical properties in the Po Valley during the 2012 summer campaigns, Atmos. Chem. Phys., 18, 5371–5389, https://doi.org/10.5194/acp-18-5371-2018, 2018.
Cantrell, C. and Michoud, V.: ACROSS: A Field Experiment to Study Atmospheric Oxidation Chemistry and Physics of Mixed Anthropogenic-Biogenic Air Masses in the Greater Paris Area, B. Am. Meteorol. Soc., 1, 599–603, https://doi.org/10.1175/BAMS-D-21-0115.1, 2022.
Chazette, P., Totems, J., and Shang, X.: Transport of aerosols over the French Riviera – link between ground-based lidar and spaceborne observations, Atmos. Chem. Phys., 19, 3885–3904, https://doi.org/10.5194/acp-19-3885-2019, 2019.
Chen, C., Dubovik, O., Fuertes, D., Litvinov, P., Lapyonok, T., Lopatin, A., Ducos, F., Derimian, Y., Herman, M., Tanré, D., Remer, L. A., Lyapustin, A., Sayer, A. M., Levy, R. C., Hsu, N. C., Descloitres, J., Li, L., Torres, B., Karol, Y., Herrera, M., Herreras, M., Aspetsberger, M., Wanzenboeck, M., Bindreiter, L., Marth, D., Hangler, A., and Federspiel, C.: Validation of GRASP algorithm product from POLDER/PARASOL data and assessment of multi-angular polarimetry potential for aerosol monitoring, Earth Syst. Sci. Data, 12, 3573–3620, https://doi.org/10.5194/essd-12-3573-2020, 2020.
Chen, L., Wang, R., Wei, G., Han, J., and Zha, Y.: A surface reflectance correction model to improve the retrieval of MISR aerosol optical depth supported by MODIS data, Adv. Space Res., 67, 858–867, https://doi.org/10.1016/j.asr.2020.10.033, 2021.
Chiapello, I., Formenti, P., Mbemba Kabuiku, L., Ducos, F., Tanré, D., and Dulac, F.: Aerosol optical properties derived from POLDER-3/PARASOL (2005–2013) over the Western Mediterranean Sea – Part 2: Spatial distribution and temporal variability, Atmos. Chem. Phys., 21, 12715–12737, https://doi.org/10.5194/acp-21-12715-2021, 2021.
Chubarova, N. Y., Poliukhov, A. A., and Gorlova, I. D.: Long-term variability of aerosol optical thickness in Eastern Europe over 2001–2014 according to the measurements at the Moscow MSU MO AERONET site with additional cloud and NO2 correction, Atmos. Meas. Tech., 9, 313–334, https://doi.org/10.5194/amt-9-313-2016, 2016.
Clarisse, L., Clerbaux, C., Dentener, F., Hurtmans, D., and Coheur, P.-F.: Global ammonia distribution derived from infrared satellite observations, Nat. Geosci., 2, 479–483, https://doi.org/10.1038/ngeo551, 2009.
Coelho, S., Ferreira, J., Rodrigues, V., and Lopes, M.: Source apportionment of air pollution in European urban areas: Lessons from the ClairCity project, J. Environ. Manage., 320, 115899, https://doi.org/10.1016/j.jenvman.2022.115899, 2022.
Colette, A., Aas, W., Banin, L., Braban, C. F., Ferm, M., Gonzalez Ortiz, A., Ilyin, I., Mar, K., Pandolfi, M., Putaud, J.-P., Shatalov, V., Solberg, S., Spindler, G., Tarasova, O., Vana, M., Adani, M., Almodovar, P., Berton, E., Bessagnet, B., Bohlin-Nizzetto, P., Boruvkova, J., Breivik, K., Briganti, G., Cappelletti, A., Cuvelier, K., Derwent, R., D'Isidoro, M., Fagerli, H., Funk, C., Garcia Vivanco, M., Haeuber, R., Hueglin, C., Jenkins, S., Kerr, J., de Leeuw, F., Lynch, J., Manders, A., Mircea, M., Pay, M. T., Pritula, D., Querol, X., Raffort, V., Reiss, I., Roustan, Y., Sauvage, S., Scavo, K., Simpson, D., Smith, R. I., Tang, Y. S., Theobald, M., Torseth, K., Tsyro, S., van Pul, A., Vidic, S., Wallasch, M., and Wind, P.: Air pollution trends in the EMEP region between 1990 and 2012, 2016, Norwegian Institute for Air Research, Kjeller, Norway, EMEP: CCC-Report 1/2016, 105 pp., 2016.
Dayan, C., Fredj, E., Misztal, P. K., Gabay, M., Guenther, A. B., and Tas, E.: Emission of biogenic volatile organic compounds from warm and oligotrophic seawater in the Eastern Mediterranean, Atmos. Chem. Phys., 20, 12741–12759, https://doi.org/10.5194/acp-20-12741-2020, 2020.
Diémoz, H., Barnaba, F., Magri, T., Pession, G., Dionisi, D., Pittavino, S., Tombolato, I. K. F., Campanelli, M., Della Ceca, L. S., Hervo, M., Di Liberto, L., Ferrero, L., and Gobbi, G. P.: Transport of Po Valley aerosol pollution to the northwestern Alps – Part 1: Phenomenology, Atmos. Chem. Phys., 19, 3065–3095, https://doi.org/10.5194/acp-19-3065-2019, 2019.
Dockery, D. W.: Health Effects of Particulate Air Pollution, Ann. Epidemiol., 19, 257–263, https://doi.org/10.1016/j.annepidem.2009.01.018, 2009.
Eck, T. F., Holben, B. N., Reid, J. S., Sinyuk, A., Giles, D. M., Arola, A., Slutsker, I., Schafer, J. S., Sorokin, M. G., Smirnov, A., LaRosa, A. D., Kraft, J., Reid, E. A., O'Neill, N. T., Welton, E. J., and Menendez, A. R.: The extreme forest fires in California/Oregon in 2020: Aerosol optical and physical properties and comparisons of aged versus fresh smoke, Atmos. Environ., 305, 119798, https://doi.org/10.1016/j.atmosenv.2023.119798, 2023.
Elson, P., Sales de Andrade, E., Lucas, G., May, R., Hattersley, R., Campbell, E., Dawson, A., Little, B., Raynaud, S., scmc72, Snow, A. D., Comer, R., Donkers, K., Blay, B., Killick, P., Wilson, N., Peglar, P., lgolston, lbdreyer, Andrew, Szymaniak, J., Berchet, A., Bosley, C., Davis, L., Filipe, Krasting, J., Bradbury, M., Kirkham, D., stephenworsley, and Havlin, C.: SciTools/cartopy: v0.22.0, Zenodo [code], https://doi.org/10.5281/zenodo.1182735, 2023.
European Commission, Joint Research Centre, San-Miguel-Ayanz, J., Durrant, T., Boca, R., Maianti, P., Libertá, G., Artés-Vivancos, T., Oom, D., Branco, A., Rigo, D., Ferrari, D., Pfeiffer, H., Grecchi, R., and Nuijten, D.: Advance report on wildfires in Europe, Middle East and North Africa 2021, Publications Office of the European Union, https://doi.org/10.2760/039729, 2022.
Eurostat: Population on 1 January by age groups and sex – cities and greater cities, European Commission [data set], http://data.europa.eu/88u/dataset/yfspvoibibfesstjomhcg (last access: September 2023), 2023.
Faisal, A.-A., Rahman, M. M., and Haque, S.: Retrieving spatial variation of aerosol level over urban mixed land surfaces using Landsat imageries: Degree of air pollution in Dhaka Metropolitan Area, Phys. Chem. Earth Parts ABC, 126, 103074, https://doi.org/10.1016/j.pce.2021.103074, 2022.
Falah, S., Mhawish, A., Sorek-Hamer, M., Lyapustin, A. I., Kloog, I., Banerjee, T., Kizel, F., and Broday, D. M.: Impact of environmental attributes on the uncertainty in MAIAC/MODIS AOD retrievals: A comparative analysis, Atmos. Environ., 262, 118659, https://doi.org/10.1016/j.atmosenv.2021.118659, 2021.
Filonchyk, M., Hurynovich, V., Yan, H., Zhou, L., and Gusev, A.: Climatology of aerosol optical depth over Eastern Europe based on 19 years (2000–2018) MODIS TERRA data, Int. J. Climatol., 40, 3531–3549, https://doi.org/10.1002/joc.6412, 2020a.
Filonchyk, M., Hurynovich, V., and Yan, H.: Trends in aerosol optical properties over Eastern Europe based on MODIS-Aqua, Geosci. Front., 11, 2169–2181, https://doi.org/10.1016/j.gsf.2020.03.014, 2020b.
Fiore, A. M., Naik, V., Spracklen, D. V., Steiner, A., Unger, N., Prather, M., Bergmann, D., Cameron-Smith, P. J., Cionni, I., Collins, W. J., Dalsøren, S., Eyring, V., Folberth, G. A., Ginoux, P., Horowitz, L. W., Josse, B., Lamarque, J.-F., MacKenzie, I. A., Nagashima, T., O'Connor, F. M., Righi, M., Rumbold, S. T., Shindell, D. T., Skeie, R. B., Sudo, K., Szopa, S., Takemura, T., and Zeng, G.: Global air quality and climate, Chem. Soc. Rev., 41, 6663–6683, https://doi.org/10.1039/C2CS35095E, 2012.
Floutsi, A. A., Korras-Carraca, M. B., Matsoukas, C., Hatzianastassiou, N., and Biskos, G.: Climatology and trends of aerosol optical depth over the Mediterranean basin during the last 12 years (2002–2014) based on Collection 006 MODIS-Aqua data, Sci. Total Environ., 551–552, 292–303, https://doi.org/10.1016/j.scitotenv.2016.01.192, 2016.
Font, A., Bourin, A., Gouillou, C., Debevec, C., Bonnaire, N., Sauvage, S., F. de Brito, J., and Riffault, V.: Aerosol composition at EMEP remote sites in France : mass balance and de-weathered trends of PM2.5 and its main components, EGU General Assembly 2023, Vienna, Austria, 24–28 April 2023, EGU23-940, https://doi.org/10.5194/egusphere-egu23-940, 2023.
Foret, G., Michoud, V., Kotthaus, S., Petit, J.-E., Baudic, A., Siour, G., Kim, Y., Doussin, J.-F., Dupont, J.-C., Formenti, P., Gaimoz, C., Ghersi, V., Gratien, A., Gros, V., Jaffrezo, J.-L., Haeffelin, M., Kreitz, M., Ravetta, F., Sartelet, K., Simon, L., Té, Y., Uzu, G., Zhang, S., Favez, O., and Beekmann, M.: The December 2016 extreme weather and particulate matter pollution episode in the Paris region (France), Atmos. Environ., 291, 119386, https://doi.org/10.1016/j.atmosenv.2022.119386, 2022.
Formenti, P., Mbemba Kabuiku, L., Chiapello, I., Ducos, F., Dulac, F., and Tanré, D.: Aerosol optical properties derived from POLDER-3/PARASOL (2005–2013) over the western Mediterranean Sea – Part 1: Quality assessment with AERONET and in situ airborne observations, Atmos. Meas. Tech., 11, 6761–6784, https://doi.org/10.5194/amt-11-6761-2018, 2018.
Gao, Y., Ma, M., Yan, F., Su, H., Wang, S., Liao, H., Zhao, B., Wang, X., Sun, Y., Hopkins, J. R., Chen, Q., Fu, P., Lewis, A. C., Qiu, Q., Yao, X., and Gao, H.: Impacts of biogenic emissions from urban landscapes on summer ozone and secondary organic aerosol formation in megacities, Sci. Total Environ., 814, 152654, https://doi.org/10.1016/j.scitotenv.2021.152654, 2022.
Giles, D. M., Sinyuk, A., Sorokin, M. G., Schafer, J. S., Smirnov, A., Slutsker, I., Eck, T. F., Holben, B. N., Lewis, J. R., Campbell, J. R., Welton, E. J., Korkin, S. V., and Lyapustin, A. I.: Advancements in the Aerosol Robotic Network (AERONET) Version 3 database – automated near-real-time quality control algorithm with improved cloud screening for Sun photometer aerosol optical depth (AOD) measurements, Atmos. Meas. Tech., 12, 169–209, https://doi.org/10.5194/amt-12-169-2019, 2019.
Gkikas, A., Hatzianastassiou, N., Mihalopoulos, N., and Torres, O.: Characterization of aerosol episodes in the greater Mediterranean Sea area from satellite observations (2000–2007), Atmos. Environ., 128, 286–304, https://doi.org/10.1016/j.atmosenv.2015.11.056, 2016.
Gkikas, A., Proestakis, E., Amiridis, V., Kazadzis, S., Di Tomaso, E., Marinou, E., Hatzianastassiou, N., Kok, J. F., and García-Pando, C. P.: Quantification of the dust optical depth across spatiotemporal scales with the MIDAS global dataset (2003–2017), Atmos. Chem. Phys., 22, 3553–3578, https://doi.org/10.5194/acp-22-3553-2022, 2022.
Gladson, L., Garcia, N., Bi, J., Liu, Y., Lee, H. J., and Cromar, K.: Evaluating the Utility of High-Resolution Spatiotemporal Air Pollution Data in Estimating Local PM2.5 Exposures in California from 2015–2018, Atmosphere, 13, 85, https://doi.org/10.3390/atmos13010085, 2022.
Grgurić, S., Križan, J., Gašparac, G., Antonić, O., Špirić, Z., Mamouri, R. E., Christodoulou, A., Nisantzi, A., Agapiou, A., Themistocleous, K., Fedra, K., Panayiotou, C., and Hadjimitsis, D.: Relationship between MODIS based Aerosol Optical Depth and PM10 over Croatia, Cent. Eur. J. Geosci., 6, 2–16, https://doi.org/10.2478/s13533-012-0135-6, 2014.
Grigorieva, E. and Lukyanets, A.: Combined Effect of Hot Weather and Outdoor Air Pollution on Respiratory Health: Literature Review, Atmosphere, 12, 790, https://doi.org/10.3390/atmos12060790, 2021.
Groot Zwaaftink, C. D., Aas, W., Eckhardt, S., Evangeliou, N., Hamer, P., Johnsrud, M., Kylling, A., Platt, S. M., Stebel, K., Uggerud, H., and Yttri, K. E.: What caused a record high PM10 episode in northern Europe in October 2020?, Atmos. Chem. Phys., 22, 3789–3810, https://doi.org/10.5194/acp-22-3789-2022, 2022.
Guo, J.-P., Zhang, X.-Y., Che, H.-Z., Gong, S.-L., An, X., Cao, C.-X., Guang, J., Zhang, H., Wang, Y.-Q., Zhang, X.-C., Xue, M., and Li, X.-W.: Correlation between PM concentrations and aerosol optical depth in eastern China, Atmos. Environ., 43, 5876–5886, https://doi.org/10.1016/j.atmosenv.2009.08.026, 2009.
Gupta, G., Venkat Ratnam, M., Madhavan, B. L., and Narayanamurthy, C. S.: Long-term trends in Aerosol Optical Depth obtained across the globe using multi-satellite measurements, Atmos. Environ., 273, 118953, https://doi.org/10.1016/j.atmosenv.2022.118953, 2022.
Gupta, G., Venkat Ratnam, M., Madhavan, B. L., and Jayaraman, A.: Global trends in the aerosol optical, physical, and morphological properties obtained using multi-sensor measurements, Atmos. Environ., 295, 119569, https://doi.org/10.1016/j.atmosenv.2022.119569, 2023.
Gupta, P., Levy, R. C., Mattoo, S., Remer, L. A., and Munchak, L. A.: A surface reflectance scheme for retrieving aerosol optical depth over urban surfaces in MODIS Dark Target retrieval algorithm, Atmos. Meas. Tech., 9, 3293–3308, https://doi.org/10.5194/amt-9-3293-2016, 2016.
Ha, S., Liu, Z., Sun, W., Lee, Y., and Chang, L.: Improving air quality forecasting with the assimilation of GOCI aerosol optical depth (AOD) retrievals during the KORUS-AQ period, Atmos. Chem. Phys., 20, 6015–6036, https://doi.org/10.5194/acp-20-6015-2020, 2020.
Hammer, M. S., van Donkelaar, A., Li, C., Lyapustin, A., Sayer, A. M., Hsu, N. C., Levy, R. C., Garay, M. J., Kalashnikova, O. V., Kahn, R. A., Brauer, M., Apte, J. S., Henze, D. K., Zhang, L., Zhang, Q., Ford, B., Pierce, J. R., and Martin, R. V.: Global Estimates and Long-Term Trends of Fine Particulate Matter Concentrations (1998–2018), Environ. Sci. Technol., 54, 7879–7890, https://doi.org/10.1021/acs.est.0c01764, 2020.
He, Q., Zhang, M., and Huang, B.: Spatio-temporal variation and impact factors analysis of satellite-based aerosol optical depth over China from 2002 to 2015, Atmos. Environ., 129, 79–90, https://doi.org/10.1016/j.atmosenv.2016.01.002, 2016.
He, Q., Wang, M., and Yim, S. H. L.: The spatiotemporal relationship between PM2.5 and aerosol optical depth in China: influencing factors and implications for satellite PM2.5 estimations using MAIAC aerosol optical depth, Atmos. Chem. Phys., 21, 18375–18391, https://doi.org/10.5194/acp-21-18375-2021, 2021.
Hough, I., Sarafian, R., Shtein, A., Zhou, B., Lepeule, J., and Kloog, I.: Gaussian Markov random fields improve ensemble predictions of daily 1 km PM2.5 and PM10 across France, Atmos. Environ., 264, 118693, https://doi.org/10.1016/j.atmosenv.2021.118693, 2021.
Hsu, N. C., Tsay, S.-C., King, M. D., and Herman, J. R.: Aerosol properties over bright-reflecting source regions, IEEE T. Geosci. Remote, 42, 557–569, https://doi.org/10.1109/TGRS.2004.824067, 2004.
Hsu, N. C., Lee, J., Sayer, A. M., Carletta, N., Chen, S.-H., Tucker, C. J., Holben, B. N., and Tsay, S.-C.: Retrieving near-global aerosol loading over land and ocean from AVHRR, J. Geophys. Res.-Atmos., 122, 9968–9989, https://doi.org/10.1002/2017JD026932, 2017.
Hussain, M. M. and Mahmud, I.: pyMannKendall: a python package for non parametric Mann Kendall family of trend tests., J. Open Source Softw., 4, 1556, https://doi.org/10.21105/joss.01556, 2019.
Israelevich, P., Ganor, E., Alpert, P., Kishcha, P., and Stupp, A.: Predominant transport paths of Saharan dust over the Mediterranean Sea to Europe, J. Geophys. Res.-Atmos., 117, D02205, https://doi.org/10.1029/2011JD016482, 2012.
Jaén, C., Udina, M., and Bech, J.: Analysis of two heat wave driven ozone episodes in Barcelona and surrounding region: Meteorological and photochemical modeling, Atmos. Environ., 246, 118037, https://doi.org/10.1016/j.atmosenv.2020.118037, 2021.
Jung, C.-R., Chen, W.-T., and Nakayama, S. F.: A National-Scale 1-km Resolution PM2.5 Estimation Model over Japan Using MAIAC AOD and a Two-Stage Random Forest Model, Remote Sens., 13, 3657, https://doi.org/10.3390/rs13183657, 2021.
Just, A. C., Wright, R. O., Schwartz, J., Coull, B. A., Baccarelli, A. A., Tellez-Rojo, M. M., Moody, E., Wang, Y., Lyapustin, A., and Kloog, I.: Using high-resolution satellite aerosol optical depth to estimate daily PM2.5 geographical distribution in Mexico City, Environ. Sci. Technol., 49, 8576–8584, https://doi.org/10.1021/acs.est.5b00859, 2015.
Karl, M., Tsigaridis, K., Vignati, E., and Dentener, F.: Formation of secondary organic aerosol from isoprene oxidation over Europe, Atmos. Chem. Phys., 9, 7003–7030, https://doi.org/10.5194/acp-9-7003-2009, 2009.
Kessner, A. L., Wang, J., Levy, R. C., and Colarco, P. R.: Remote sensing of surface visibility from space: A look at the United States East Coast, Atmos. Environ., 81, 136–147, https://doi.org/10.1016/j.atmosenv.2013.08.050, 2013.
Kinne, S., O'Donnel, D., Stier, P., Kloster, S., Zhang, K., Schmidt, H., Rast, S., Giorgetta, M., Eck, T. F., and Stevens, B.: MAC-v1: A new global aerosol climatology for climate studies, J. Adv. Model. Earth Syst., 5, 704–740, https://doi.org/10.1002/jame.20035, 2013.
Kondragunta, S., Lee, P., McQueen, J., Kittaka, C., Prados, A. I., Ciren, P., Laszlo, I., Pierce, R. B., Hoff, R., and Szykman, J. J.: Air Quality Forecast Verification Using Satellite Data, J. Appl. Meteorol. Climatol., 47, 425–442, 2008.
Lee, J., Hsu, N. C., Sayer, A. M., Bettenhausen, C., and Yang, P.: AERONET-Based Nonspherical Dust Optical Models and Effects on the VIIRS Deep Blue/SOAR Over Water Aerosol Product, J. Geophys. Res.-Atmos., 122, 10384–10401, https://doi.org/10.1002/2017JD027258, 2017.
Lee, S., Park, S., Lee, M.-I., Kim, G., Im, J., and Song, C.-K.: Air Quality Forecasts Improved by Combining Data Assimilation and Machine Learning With Satellite AOD, Geophys. Res. Lett., 49, e2021GL096066, https://doi.org/10.1029/2021GL096066, 2022.
Li, M.-H., Fan, L.-C., Mao, B., Yang, J.-W., Choi, A. M. K., Cao, W.-J., and Xu, J.-F.: Short-term Exposure to Ambient Fine Particulate Matter Increases Hospitalizations and Mortality in COPD: A Systematic Review and Meta-analysis, Chest, 149, 447–458, https://doi.org/10.1378/chest.15-0513, 2016.
Li, Z., Wen, Q., and Zhang, R.: Sources, health effects and control strategies of indoor fine particulate matter (PM2.5): A review, Sci. Total Environ., 586, 610–622, https://doi.org/10.1016/j.scitotenv.2017.02.029, 2017.
Liu, J., Mauzerall, D. L., and Horowitz, L. W.: Evaluating inter-continental transport of fine aerosols: (2) Global health impact, Atmos. Environ., 43, 4339–4347, https://doi.org/10.1016/j.atmosenv.2009.05.032, 2009.
Liu, Y., Liu, Y., Wang, M., Dong, X., Zheng, Y., Shrivastava, M., Qian, Y., Bai, H., Li, X., and Yang, X.-Q.: Anthropogenic–biogenic interaction amplifies warming from emission reduction over the southeastern US, Environ. Res. Lett., 16, 124046, https://doi.org/10.1088/1748-9326/ac3285, 2021.
Luo, M., Ji, Y., Ren, Y., Gao, F., Zhang, H., Zhang, L., Yu, Y., and Li, H.: Characteristics and Health Risk Assessment of PM2.5-Bound PAHs during Heavy Air Pollution Episodes in Winter in Urban Area of Beijing, China, Atmosphere, 12, 323, https://doi.org/10.3390/atmos12030323, 2021.
Lyapustin, A. and Wang, Y.: MCD19A2 MODIS/Terra+Aqua Land Aerosol Optical Depth Daily L2G Global 1km SIN Grid V006, NASA EOSDIS Land Processes DAAC [data set], https://doi.org/10.5067/MODIS/MCD19A2.006, 2018.
Lyapustin, A., Wang, Y., Laszlo, I., and Korkin, S.: Improved cloud and snow screening in MAIAC aerosol retrievals using spectral and spatial analysis, Atmos. Meas. Tech., 5, 843–850, https://doi.org/10.5194/amt-5-843-2012, 2012.
Lyapustin, A., Wang, Y., Korkin, S., and Huang, D.: MODIS Collection 6 MAIAC algorithm, Atmos. Meas. Tech., 11, 5741–5765, https://doi.org/10.5194/amt-11-5741-2018, 2018.
Ma, X. and Yu, F.: Seasonal and spatial variations of global aerosol optical depth: multi-year modelling with GEOS-Chem-APM and comparisons with multiple-platform observations, Tellus B, 67, 25115, https://doi.org/10.3402/tellusb.v67.25115, 2015.
Ma, Y., Xin, J., Zhang, W., Gong, C., Wen, T., Wu, X., Wang, Y., Wang, L., Wu, F., and Ding, X.: Uncertainties of Simulated Aerosol Direct Radiative Effect Induced by Aerosol Chemical Components: A Measurement-Based Perspective From Urban-Forest Transition Region in East China, J. Geophys. Res.-Atmos., 126, e2020JD033688, https://doi.org/10.1029/2020JD033688, 2021.
Majewski, G., Szeląg, B., Mach, T., Rogula-Kozłowska, W., Anioł, E., Bihałowicz, J., Dmochowska, A., and Bihałowicz, J. S.: Predicting the Number of Days With Visibility in a Specific Range in Warsaw (Poland) Based on Meteorological and Air Quality Data, Front. Environ. Sci., 9, 623094, https://doi.org/10.3389/fenvs.2021.623094, 2021.
Manousakas, M. I., Florou, K., and Pandis, S. N.: Source Apportionment of Fine Organic and Inorganic Atmospheric Aerosol in an Urban Background Area in Greece, Atmosphere, 11, 330, https://doi.org/10.3390/atmos11040330, 2020.
Mao, K. B., Ma, Y., Xia, L., Chen, W. Y., Shen, X. Y., He, T. J., and Xu, T. R.: Global aerosol change in the last decade: An analysis based on MODIS data, Atmos. Environ., 94, 680–686, https://doi.org/10.1016/j.atmosenv.2014.04.053, 2014.
Martin, S. T., Artaxo, P., Machado, L. A. T., Manzi, A. O., Souza, R. A. F., Schumacher, C., Wang, J., Andreae, M. O., Barbosa, H. M. J., Fan, J., Fisch, G., Goldstein, A. H., Guenther, A., Jimenez, J. L., Pöschl, U., Silva Dias, M. A., Smith, J. N., and Wendisch, M.: Introduction: Observations and Modeling of the Green Ocean Amazon (GoAmazon2014/5), Atmos. Chem. Phys., 16, 4785–4797, https://doi.org/10.5194/acp-16-4785-2016, 2016.
Martins, V. S., Lyapustin, A., de Carvalho, L. a. S., Barbosa, C. C. F., and Novo, E. M. L. M.: Validation of high-resolution MAIAC aerosol product over South America, J. Geophys. Res.-Atmos., 122, 7537–7559, https://doi.org/10.1002/2016JD026301, 2017.
Martins, V. S., Lyapustin, A., Wang, Y., Giles, D. M., Smirnov, A., Slutsker, I., and Korkin, S.: Global validation of columnar water vapor derived from EOS MODIS-MAIAC algorithm against the ground-based AERONET observations, Atmos. Res., 225, 181–192, https://doi.org/10.1016/j.atmosres.2019.04.005, 2019.
Masson-Delmotte, Zhai, P., Pirani, A., Connors, S. L., Péan, C., Berger, S., Caud, N., Chen, Y., Goldfarb, L., Gomis, M. I., Huang, M., Leitzell, K., Lonnoy, E., Matthews, J. B. R., Maycock, T. K., Waterfield, T., Yelekçi, Ö., Yu, R., and Zhou, B. (Eds.): Climate Change 2021: The Physical Science Basis. Contribution of Working Group I to the Sixth Assessment Report of the Intergovernmental Panel on Climate Change, Cambridge University Press, Cambridge, United Kingdom and New York, NY, USA, https://doi.org/10.1017/9781009157896, 2021.
Mehta, M., Singh, R., Singh, A., Singh, N., and Anshumali: Recent global aerosol optical depth variations and trends – A comparative study using MODIS and MISR level 3 datasets, Remote Sens. Environ., 181, 137–150, https://doi.org/10.1016/j.rse.2016.04.004, 2016.
Merdji, A. B., Lu, C., Xu, X., and Mhawish, A.: Long-term three-dimensional distribution and transport of Saharan dust: Observation from CALIPSO, MODIS, and reanalysis data, Atmos. Res., 286, 106658, https://doi.org/10.1016/j.atmosres.2023.106658, 2023.
Mhawish, A., Banerjee, T., Sorek-Hamer, M., Lyapustin, A., Broday, D. M., and Chatfield, R.: Comparison and evaluation of MODIS Multi-angle Implementation of Atmospheric Correction (MAIAC) aerosol product over South Asia, Remote Sens. Environ., 224, 12–28, https://doi.org/10.1016/j.rse.2019.01.033, 2019.
Michoud, V., Sciare, J., Sauvage, S., Dusanter, S., Léonardis, T., Gros, V., Kalogridis, C., Zannoni, N., Féron, A., Petit, J.-E., Crenn, V., Baisnée, D., Sarda-Estève, R., Bonnaire, N., Marchand, N., DeWitt, H. L., Pey, J., Colomb, A., Gheusi, F., Szidat, S., Stavroulas, I., Borbon, A., and Locoge, N.: Organic carbon at a remote site of the western Mediterranean Basin: sources and chemistry during the ChArMEx SOP2 field experiment, Atmos. Chem. Phys., 17, 8837–8865, https://doi.org/10.5194/acp-17-8837-2017, 2017.
Moulin, C., Lambert, C. E., Dayan, U., Masson, V., Ramonet, M., Bousquet, P., Legrand, M., Balkanski, Y. J., Guelle, W., Marticorena, B., Bergametti, G., and Dulac, F.: Satellite climatology of African dust transport in the Mediterranean atmosphere, J. Geophys. Res.-Atmos., 103, 13137–13144, https://doi.org/10.1029/98JD00171, 1998.
Nascimento, J. P., Bela, M. M., Meller, B. B., Banducci, A. L., Rizzo, L. V., Vara-Vela, A. L., Barbosa, H. M. J., Gomes, H., Rafee, S. A. A., Franco, M. A., Carbone, S., Cirino, G. G., Souza, R. A. F., McKeen, S. A., and Artaxo, P.: Aerosols from anthropogenic and biogenic sources and their interactions – modeling aerosol formation, optical properties, and impacts over the central Amazon basin, Atmos. Chem. Phys., 21, 6755–6779, https://doi.org/10.5194/acp-21-6755-2021, 2021.
Pace, G., di Sarra, A., Meloni, D., Piacentino, S., and Chamard, P.: Aerosol optical properties at Lampedusa (Central Mediterranean). 1. Influence of transport and identification of different aerosol types, Atmos. Chem. Phys., 6, 697–713, https://doi.org/10.5194/acp-6-697-2006, 2006.
Papachristopoulou, K., Raptis, I.-P., Gkikas, A., Fountoulakis, I., Masoom, A., and Kazadzis, S.: Aerosol optical depth regime over megacities of the world, Atmos. Chem. Phys., 22, 15703–15727, https://doi.org/10.5194/acp-22-15703-2022, 2022.
Pedde, M., Kloog, I., Szpiro, A., Dorman, M., Larson, T. V., and Adar, S. D.: Estimating long-term PM10–2.5 concentrations in six US cities using satellite-based aerosol optical depth data, Atmos. Environ., 272, 118945, https://doi.org/10.1016/j.atmosenv.2022.118945, 2022.
Pérez, C., Sicard, M., Jorba, O., Comerón, A., and Baldasano, J. M.: Summertime re-circulations of air pollutants over the north-eastern Iberian coast observed from systematic EARLINET lidar measurements in Barcelona, Atmos. Environ., 38, 3983–4000, https://doi.org/10.1016/j.atmosenv.2004.04.010, 2004.
Petit, J.-E., Favez, O., Sciare, J., Crenn, V., Sarda-Estève, R., Bonnaire, N., Močnik, G., Dupont, J.-C., Haeffelin, M., and Leoz-Garziandia, E.: Two years of near real-time chemical composition of submicron aerosols in the region of Paris using an Aerosol Chemical Speciation Monitor (ACSM) and a multi-wavelength Aethalometer, Atmos. Chem. Phys., 15, 2985–3005, https://doi.org/10.5194/acp-15-2985-2015, 2015.
Pietrogrande, M. C., Bacco, D., Ferrari, S., Kaipainen, J., Ricciardelli, I., Riekkola, M.-L., Trentini, A., and Visentin, M.: Characterization of atmospheric aerosols in the Po valley during the supersito campaigns – Part 3: Contribution of wood combustion to wintertime atmospheric aerosols in Emilia Romagna region (Northern Italy), Atmos. Environ., 122, 291–305, https://doi.org/10.1016/j.atmosenv.2015.09.059, 2015.
Pirhadi, M., Mousavi, A., Taghvaee, S., Shafer, M. M., and Sioutas, C.: Semi-volatile components of PM2.5 in an urban environment: volatility profiles and associated oxidative potential, Atmos. Environ. Oxf. Engl. 1994, 223, 117197, https://doi.org/10.1016/j.atmosenv.2019.117197, 2020.
Provençal, S., Kishcha, P., da Silva, A. M., Elhacham, E., and Alpert, P.: AOD distributions and trends of major aerosol species over a selection of the world's most populated cities based on the 1st version of NASA's MERRA Aerosol Reanalysis, Urban Clim., 20, 168–191, https://doi.org/10.1016/j.uclim.2017.04.001, 2017.
Putaud, J. P., Cavalli, F., Martins dos Santos, S., and Dell'Acqua, A.: Long-term trends in aerosol optical characteristics in the Po Valley, Italy, Atmos. Chem. Phys., 14, 9129–9136, https://doi.org/10.5194/acp-14-9129-2014, 2014.
Qin, W., Fang, H., Wang, L., Wei, J., Zhang, M., Su, X., Bilal, M., and Liang, X.: MODIS high-resolution MAIAC aerosol product: Global validation and analysis, Atmos. Environ., 264, 118684, https://doi.org/10.1016/j.atmosenv.2021.118684, 2021.
Raptis, I.-P., Kazadzis, S., Amiridis, V., Gkikas, A., Gerasopoulos, E., and Mihalopoulos, N.: A Decade of Aerosol Optical Properties Measurements over Athens, Greece, Atmosphere, 11, 154, https://doi.org/10.3390/atmos11020154, 2020.
Remer, L. A., Kaufman, Y. J., Tanré, D., Mattoo, S., Chu, D. A., Martins, J. V., Li, R.-R., Ichoku, C., Levy, R. C., Kleidman, R. G., Eck, T. F., Vermote, E., and Holben, B. N.: The MODIS Aerosol Algorithm, Products, and Validation, J. Atmos. Sci., 62, 947–973, https://doi.org/10.1175/JAS3385.1, 2005.
Remer, L. A., Levy, R. C., Mattoo, S., Tanré, D., Gupta, P., Shi, Y., Sawyer, V., Munchak, L. A., Zhou, Y., Kim, M., Ichoku, C., Patadia, F., Li, R.-R., Gassó, S., Kleidman, R. G., and Holben, B. N.: The Dark Target Algorithm for Observing the Global Aerosol System: Past, Present, and Future, Remote Sens., 12, 2900, https://doi.org/10.3390/rs12182900, 2020.
Robotto, A., Barbero, S., Bracco, P., Cremonini, R., Ravina, M., and Brizio, E.: Improving Air Quality Standards in Europe: Comparative Analysis of Regional Differences, with a Focus on Northern Italy, Atmosphere, 13, 642, https://doi.org/10.3390/atmos13050642, 2022.
Rogozovsky, I., Ohneiser, K., Lyapustin, A., Ansmann, A., and Chudnovsky, A.: The impact of different aerosol layering conditions on the high-resolution MODIS/MAIAC AOD retrieval bias: The uncertainty analysis, Atmos. Environ., 309, 119930, https://doi.org/10.1016/j.atmosenv.2023.119930, 2023.
Sandrini, S., van Pinxteren, D., Giulianelli, L., Herrmann, H., Poulain, L., Facchini, M. C., Gilardoni, S., Rinaldi, M., Paglione, M., Turpin, B. J., Pollini, F., Bucci, S., Zanca, N., and Decesari, S.: Size-resolved aerosol composition at an urban and a rural site in the Po Valley in summertime: implications for secondary aerosol formation, Atmos. Chem. Phys., 16, 10879–10897, https://doi.org/10.5194/acp-16-10879-2016, 2016.
Sayer, A. M., Hsu, N. C., Lee, J., Bettenhausen, C., Kim, W. V., and Smirnov, A.: Satellite Ocean Aerosol Retrieval (SOAR) Algorithm Extension to S-NPP VIIRS as Part of the “Deep Blue” Aerosol Project, J. Geophys. Res.-Atmos., 123, 380–400, https://doi.org/10.1002/2017JD027412, 2018.
Schaap, M., Apituley, A., Timmermans, R. M. A., Koelemeijer, R. B. A., and de Leeuw, G.: Exploring the relation between aerosol optical depth and PM2.5 at Cabauw, the Netherlands, Atmos. Chem. Phys., 9, 909–925, https://doi.org/10.5194/acp-9-909-2009, 2009.
Schäfer, K., Harbusch, A., Emeis, S., Koepke, P., and Wiegner, M.: Correlation of aerosol mass near the ground with aerosol optical depth during two seasons in Munich, Atmos. Environ., 42, 4036–4046, https://doi.org/10.1016/j.atmosenv.2008.01.060, 2008.
Schuster, G. L., Dubovik, O., and Holben, B. N.: Angstrom exponent and bimodal aerosol size distributions, J. Geophys. Res.-Atmos., 111, D07207, https://doi.org/10.1029/2005JD006328, 2006.
Schutgens, N. A. J.: Site representativity of AERONET and GAW remotely sensed aerosol optical thickness and absorbing aerosol optical thickness observations, Atmos. Chem. Phys., 20, 7473–7488, https://doi.org/10.5194/acp-20-7473-2020, 2020.
Scotto, F., Bacco, D., Lasagni, S., Trentini, A., Poluzzi, V., and Vecchi, R.: A multi-year source apportionment of PM2.5 at multiple sites in the southern Po Valley (Italy), Atmos. Pollut. Res., 12, 101192, https://doi.org/10.1016/j.apr.2021.101192, 2021.
Segura, S., Estellés, V., Utrillas, M. P., and Martínez-Lozano, J. A.: Long term analysis of the columnar and surface aerosol relationship at an urban European coastal site, Atmos. Environ., 167, 309–322, https://doi.org/10.1016/j.atmosenv.2017.08.012, 2017.
Sen, P. K.: Estimates of the Regression Coefficient Based on Kendall's Tau, J. Am. Stat. Assoc., 63, 1379–1389, https://doi.org/10.2307/2285891, 1968.
Shi, Y. R., Levy, R. C., Yang, L., Remer, L. A., Mattoo, S., and Dubovik, O.: A Dark Target research aerosol algorithm for MODIS observations over eastern China: increasing coverage while maintaining accuracy at high aerosol loading, Atmos. Meas. Tech., 14, 3449–3468, https://doi.org/10.5194/amt-14-3449-2021, 2021.
Shrivastava, M., Andreae, M. O., Artaxo, P., Barbosa, H. M. J., Berg, L. K., Brito, J., Ching, J., Easter, R. C., Fan, J., Fast, J. D., Feng, Z., Fuentes, J. D., Glasius, M., Goldstein, A. H., Alves, E. G., Gomes, H., Gu, D., Guenther, A., Jathar, S. H., Kim, S., Liu, Y., Lou, S., Martin, S. T., McNeill, V. F., Medeiros, A., de Sá, S. S., Shilling, J. E., Springston, S. R., Souza, R. a. F., Thornton, J. A., Isaacman-VanWertz, G., Yee, L. D., Ynoue, R., Zaveri, R. A., Zelenyuk, A., and Zhao, C.: Urban pollution greatly enhances formation of natural aerosols over the Amazon rainforest, Nat. Commun., 10, 1046, https://doi.org/10.1038/s41467-019-08909-4, 2019.
Sicard, P., Agathokleous, E., De Marco, A., Paoletti, E., and Calatayud, V.: Urban population exposure to air pollution in Europe over the last decades, Environ. Sci. Eur., 33, 28, https://doi.org/10.1186/s12302-020-00450-2, 2021.
Singh, A., Avis, W. R., and Pope, F. D.: Visibility as a proxy for air quality in East Africa, Environ. Res. Lett., 15, 084002, https://doi.org/10.1088/1748-9326/ab8b12, 2020.
Sinyuk, A., Holben, B. N., Eck, T. F., Giles, D. M., Slutsker, I., Korkin, S., Schafer, J. S., Smirnov, A., Sorokin, M., and Lyapustin, A.: The AERONET Version 3 aerosol retrieval algorithm, associated uncertainties and comparisons to Version 2, Atmos. Meas. Tech., 13, 3375–3411, https://doi.org/10.5194/amt-13-3375-2020, 2020.
Skyllakou, K., Murphy, B. N., Megaritis, A. G., Fountoukis, C., and Pandis, S. N.: Contributions of local and regional sources to fine PM in the megacity of Paris, Atmos. Chem. Phys., 14, 2343–2352, https://doi.org/10.5194/acp-14-2343-2014, 2014.
Smirnov, A., Holben, B. N., Eck, T. F., Slutsker, I., Chatenet, B., and Pinker, R. T.: Diurnal variability of aerosol optical depth observed at AERONET (Aerosol Robotic Network) sites, Geophys. Res. Lett., 29, 30-1–30-4, https://doi.org/10.1029/2002GL016305, 2002.
Song, C. K., Ho, C. H., Park, R. J., Choi, Y. S., Kim, J., Gong, D. Y., and Lee, Y. B.: Spatial and seasonal variations of surface PM10 concentration and MODIS aerosol optical depth over China, Asia-Pac. J. Atmos. Sci., 45, 33–43, 2009.
Spencer, R. S., Levy, R. C., Remer, L. A., Mattoo, S., Arnold, G. T., Hlavka, D. L., Meyer, K. G., Marshak, A., Wilcox, E. M., and Platnick, S. E.: Exploring Aerosols Near Clouds With High-Spatial-Resolution Aircraft Remote Sensing During SEAC4RS, J. Geophys. Res.-Atmos., 124, 2148–2173, https://doi.org/10.1029/2018JD028989, 2019.
Stafoggia, M., Schwartz, J., Badaloni, C., Bellander, T., Alessandrini, E., Cattani, G., de' Donato, F., Gaeta, A., Leone, G., Lyapustin, A., Sorek-Hamer, M., de Hoogh, K., Di, Q., Forastiere, F., and Kloog, I.: Estimation of daily PM10 concentrations in Italy (2006–2012) using finely resolved satellite data, land use variables and meteorology, Environ. Int., 99, 234–244, https://doi.org/10.1016/j.envint.2016.11.024, 2017.
Su, X., Cao, M., Wang, L., Gui, X., Zhang, M., Huang, Y., and Zhao, Y.: Validation, inter-comparison, and usage recommendation of six latest VIIRS and MODIS aerosol products over the ocean and land on the global and regional scales, Sci. Total Environ., 884, 163794, https://doi.org/10.1016/j.scitotenv.2023.163794, 2023.
Sun, E., Xu, X., Che, H., Tang, Z., Gui, K., An, L., Lu, C., and Shi, G.: Variation in MERRA-2 aerosol optical depth and absorption aerosol optical depth over China from 1980 to 2017, J. Atmos. Sol.-Terr. Phy., 186, 8–19, https://doi.org/10.1016/j.jastp.2019.01.019, 2019.
Taghvaee, S., Sowlat, M. H., Diapouli, E., Manousakas, M. I., Vasilatou, V., Eleftheriadis, K., and Sioutas, C.: Source apportionment of the oxidative potential of fine ambient particulate matter (PM2.5) in Athens, Greece, Sci. Total Environ., 653, 1407–1416, https://doi.org/10.1016/j.scitotenv.2018.11.016, 2019.
Tao, M., Wang, J., Li, R., Wang, L., Wang, L., Wang, Z., Tao, J., Che, H., and Chen, L.: Performance of MODIS high-resolution MAIAC aerosol algorithm in China: Characterization and limitation, Atmos. Environ., 213, 159–169, https://doi.org/10.1016/j.atmosenv.2019.06.004, 2019.
Theil, H.: A Rank-Invariant Method of Linear and Polynomial Regression Analysis, in: Henri Theil's Contributions to Economics and Econometrics: Econometric Theory and Methodology, edited by: Raj, B. and Koerts, J., Springer Netherlands, Dordrecht, the Netherlands, 345–381, https://doi.org/10.1007/978-94-011-2546-8_20, 1992.
Toledano, C., Cachorro, V. E., Berjon, A., de Frutos, A. M., Sorribas, M., de la Morena, B. A., and Goloub, P.: Aerosol optical depth and Ångström exponent climatology at El Arenosillo AERONET site (Huelva, Spain), Q. J. Roy. Meteor. Soc., 133, 795–807, https://doi.org/10.1002/qj.54, 2007.
Tsiflikiotou, M. A., Kostenidou, E., Papanastasiou, D. K., Patoulias, D., Zarmpas, P., Paraskevopoulou, D., Diapouli, E., Kaltsonoudis, C., Florou, K., Bougiatioti, A., Stavroulas, I., Theodosi, C., Kouvarakis, G., Vasilatou, V., Siakavaras, D., Biskos, G., Pilinis, C., Eleftheriadis, K., Gerasopoulos, E., Mihalopoulos, N., and Pandis, S. N.: Summertime particulate matter and its composition in Greece, Atmos. Environ., 213, 597–607, https://doi.org/10.1016/j.atmosenv.2019.06.013, 2019.
Tsyro, S., Aas, W., Colette, A., Andersson, C., Bessagnet, B., Ciarelli, G., Couvidat, F., Cuvelier, K., Manders, A., Mar, K., Mircea, M., Otero, N., Pay, M.-T., Raffort, V., Roustan, Y., Theobald, M. R., Vivanco, M. G., Fagerli, H., Wind, P., Briganti, G., Cappelletti, A., D'Isidoro, M., and Adani, M.: Eurodelta multi-model simulated and observed particulate matter trends in Europe in the period of 1990–2010, Atmos. Chem. Phys., 22, 7207–7257, https://doi.org/10.5194/acp-22-7207-2022, 2022.
Tuccella, P., Curci, G., Pitari, G., Lee, S., and Jo, D. S.: Direct Radiative Effect of Absorbing Aerosols: Sensitivity to Mixing State, Brown Carbon, and Soil Dust Refractive Index and Shape, J. Geophys. Res.-Atmos., 125, e2019JD030967, https://doi.org/10.1029/2019JD030967, 2020.
Tuet, W. Y., Chen, Y., Fok, S., Champion, J. A., and Ng, N. L.: Inflammatory responses to secondary organic aerosols (SOA) generated from biogenic and anthropogenic precursors, Atmos. Chem. Phys., 17, 11423–11440, https://doi.org/10.5194/acp-17-11423-2017, 2017.
van Donkelaar, A., Hammer, M. S., Bindle, L., Brauer, M., Brook, J. R., Garay, M. J., Hsu, N. C., Kalashnikova, O. V., Kahn, R. A., Lee, C., Levy, R. C., Lyapustin, A., Sayer, A. M., and Martin, R. V.: Monthly Global Estimates of Fine Particulate Matter and Their Uncertainty, Environ. Sci. Technol., 55, 15287–15300, https://doi.org/10.1021/acs.est.1c05309, 2021.
Vautard, R., Menut, L., Beekmann, M., Chazette, P., Flamant, P. H., Gombert, D., Guédalia, D., Kley, D., Lefebvre, M.-P., Martin, D., Mégie, G., Perros, P., and Toupance, G.: A synthesis of the Air Pollution Over the Paris Region (ESQUIF) field campaign, J. Geophys. Res.-Atmos., 108, 8558, https://doi.org/10.1029/2003JD003380, 2003.
Vecchi, R., Bernardoni, V., Fermo, P., Lucarelli, F., Mazzei, F., Nava, S., Prati, P., Piazzalunga, A., and Valli, G.: 4-hours resolution data to study PM10 in a “hot spot” area in Europe, Environ. Monit. Assess., 154, 283–300, https://doi.org/10.1007/s10661-008-0396-1, 2009.
Vecchi, R., Bernardoni, V., Valentini, S., Piazzalunga, A., Fermo, P., and Valli, G.: Assessment of light extinction at a European polluted urban area during wintertime: Impact of PM1 composition and sources, Environ. Pollut., 233, 679–689, https://doi.org/10.1016/j.envpol.2017.10.059, 2018.
Viana, M., Pey, J., Querol, X., Alastuey, A., de Leeuw, F., and Lükewille, A.: Natural sources of atmospheric aerosols influencing air quality across Europe, Sci. Total Environ., 472, 825–833, https://doi.org/10.1016/j.scitotenv.2013.11.140, 2014.
Wang, Y., Lyapustin, A. I., Privette, J. L., Cook, R. B., SanthanaVannan, S. K., Vermote, E. F., and Schaaf, C. L.: Assessment of biases in MODIS surface reflectance due to Lambertian approximation, Remote Sens. Environ., 114, 2791–2801, https://doi.org/10.1016/j.rse.2010.06.013, 2010.
Wei, J., Li, Z., Peng, Y., and Sun, L.: MODIS Collection 6.1 aerosol optical depth products over land and ocean: validation and comparison, Atmos. Environ., 201, 428–440, https://doi.org/10.1016/j.atmosenv.2018.12.004, 2019.
Xu, L., Du, L., Tsona, N. T., and Ge, M.: Anthropogenic Effects on Biogenic Secondary Organic Aerosol Formation, Adv. Atmos. Sci., 38, 1053–1084, https://doi.org/10.1007/s00376-020-0284-3, 2021.
Yang, B.-Y., Qian, Z., Li, S., Chen, G., Bloom, M. S., Elliott, M., Syberg, K. W., Heinrich, J., Markevych, I., Wang, S.-Q., Chen, D., Ma, H., Chen, D.-H., Liu, Y., Komppula, M., Leskinen, A., Liu, K.-K., Zeng, X.-W., Hu, L.-W., Guo, Y., and Dong, G.-H.: Ambient air pollution in relation to diabetes and glucose-homoeostasis markers in China: a cross-sectional study with findings from the 33 Communities Chinese Health Study, Lancet Planet. Health, 2, e64–e73, https://doi.org/10.1016/S2542-5196(18)30001-9, 2018.
Yang, X., Xiao, D., Fan, L., Li, F., Wang, W., Bai, H., and Tang, J.: Spatiotemporal estimates of daily PM2.5 concentrations based on 1-km resolution MAIAC AOD in the Beijing–Tianjin–Hebei, China, Environ. Chall., 8, 100548, https://doi.org/10.1016/j.envc.2022.100548, 2022.
York, D., Evensen, N. M., Martínez, M. L., and De Basabe Delgado, J.: Unified equations for the slope, intercept, and standard errors of the best straight line, Am. J. Phys., 72, 367–375, https://doi.org/10.1119/1.1632486, 2004.
Zhang, Y., Favez, O., Petit, J.-E., Canonaco, F., Truong, F., Bonnaire, N., Crenn, V., Amodeo, T., Prévôt, A. S. H., Sciare, J., Gros, V., and Albinet, A.: Six-year source apportionment of submicron organic aerosols from near-continuous highly time-resolved measurements at SIRTA (Paris area, France), Atmos. Chem. Phys., 19, 14755–14776, https://doi.org/10.5194/acp-19-14755-2019, 2019.
Zhang, Z. Y., Wong, M. S., and Lee, K. H.: Evaluation of the representativeness of ground-based visibility for analysing the spatial and temporal variability of aerosol optical thickness in China, Atmos. Environ., 147, 31–45, https://doi.org/10.1016/j.atmosenv.2016.09.060, 2016.
Zhao, B., Jiang, J. H., Gu, Y., Diner, D., Worden, J., Liou, K.-N., Su, H., Xing, J., Garay, M., and Huang, L.: Decadal-scale trends in regional aerosol particle properties and their linkage to emission changes, Environ. Res. Lett., 12, 054021, https://doi.org/10.1088/1748-9326/aa6cb2, 2017.
Zhao, B., Jiang, J. H., Diner, D. J., Su, H., Gu, Y., Liou, K.-N., Jiang, Z., Huang, L., Takano, Y., Fan, X., and Omar, A. H.: Intra-annual variations of regional aerosol optical depth, vertical distribution, and particle types from multiple satellite and ground-based observational datasets, Atmos. Chem. Phys., 18, 11247–11260, https://doi.org/10.5194/acp-18-11247-2018, 2018.
Zhdanova, E. Y., Chubarova, N. Y., and Lyapustin, A. I.: Assessment of urban aerosol pollution over the Moscow megacity by the MAIAC aerosol product, Atmos. Meas. Tech., 13, 877–891, https://doi.org/10.5194/amt-13-877-2020, 2020.