the Creative Commons Attribution 4.0 License.
the Creative Commons Attribution 4.0 License.
 | 24 Jan 2023
Nitrogen oxides in the free troposphere: implications for tropospheric oxidants and the interpretation of satellite NO2 measurements
Daniel J. Jacob
Ruijun Dang
Lok N. Lamsal
Sarah A. Strode
Stephen D. Steenrod
K. Folkert Boersma
Sebastian D. Eastham
Thibaud M. Fritz
Chelsea Thompson
Jeff Peischl
Ilann Bourgeois
Ilana B. Pollack
Benjamin A. Nault
Ronald C. Cohen
Pedro Campuzano-Jost
Jose L. Jimenez
Simone T. Andersen
Lucy J. Carpenter
Tomás Sherwen
Mat J. Evans
Satellite-based retrievals of tropospheric NO2 columns are widely used to infer NOx (≡ NO + NO2) emissions. These retrievals rely on model information for the vertical distribution of NO2. The free tropospheric background above 2 km is particularly important because the sensitivity of the retrievals increases with altitude. Free tropospheric NOx also has a strong effect on tropospheric OH and ozone concentrations. Here we use observations from three aircraft campaigns (SEAC4RS, DC3, and ATom) and four atmospheric chemistry models (GEOS-Chem, GMI, TM5, and CAMS) to evaluate the model capabilities for simulating NOx in the free troposphere and attribute it to sources. NO2 measurements during the Studies of Emissions and Atmospheric Composition, Clouds, and Climate Coupling by Regional Surveys (SEAC4RS) and Deep Convective Clouds and Chemistry (DC3) campaigns over the southeastern U.S. in summer show increasing concentrations in the upper troposphere above 10 km, which are not replicated by the GEOS-Chem, although the model is consistent with the NO measurements. Using concurrent NO, NO2, and ozone observations from a DC3 flight in a thunderstorm outflow, we show that the NO2 measurements in the upper troposphere are biased high, plausibly due to interference from thermally labile NO2 reservoirs such as peroxynitric acid (HNO4) and methyl peroxy nitrate (MPN). We find that NO2 concentrations calculated from the NO measurements and NO–NO2 photochemical steady state (PSS) are more reliable to evaluate the vertical profiles of NO2 in models. GEOS-Chem reproduces the shape of the PSS-inferred NO2 profiles throughout the troposphere for SEAC4RS and DC3 but overestimates NO2 concentrations by about a factor of 2. The model underestimates MPN and alkyl nitrate concentrations, suggesting missing organic NOx chemistry. On the other hand, the standard GEOS-Chem model underestimates NO observations from the Atmospheric Tomography Mission (ATom) campaigns over the Pacific and Atlantic oceans, indicating a missing NOx source over the oceans. We find that we can account for this missing source by including in the model the photolysis of particulate nitrate on sea salt aerosols at rates inferred from laboratory studies and field observations of nitrous acid (HONO) over the Atlantic. The median PSS-inferred tropospheric NO2 column density for the ATom campaign is 1.7 ± 0.44 × 10¹⁴ molec. cm−2, and the NO2 column density simulated by the four models is in the range of 1.4–2.4 × 10¹⁴ molec. cm−2, implying that the uncertainty from using modeled NO2 tropospheric columns over clean areas in the retrievals for stratosphere–troposphere separation is about 1 × 10¹⁴ molec. cm−2. We find from GEOS-Chem that lightning is the main primary NOx source in the free troposphere over the tropics and southern midlatitudes, but aircraft emissions dominate at northern midlatitudes in winter and in summer over the oceans. Particulate nitrate photolysis increases ozone concentrations by up to 5 ppbv (parts per billion by volume) in the free troposphere in the northern extratropics in the model, which would largely correct the low model bias relative to ozonesonde observations. Global tropospheric OH concentrations increase by 19 %. The contribution of the free tropospheric background to the tropospheric NO2 columns observed by satellites over the contiguous U.S. increases from 25 ± 11 % in winter to 65 ± 9 % in summer, according to the GEOS-Chem vertical profiles. This needs to be accounted for when deriving NOx emissions from satellite NO2 column measurements.
- Article
(4014 KB) - Full-text XML
-
Supplement
(953 KB) - BibTeX
- EndNote


Retrievals of NO2 tropospheric columns from satellite measurements of solar backscatter are used extensively to infer anthropogenic NOx (≡ NO + NO2) emissions near the surface and their trends (e.g., Martin et al., 2003; Richter et al., 2005; Beirle et al., 2011; Krotkov et al., 2016). This is complicated by the presence of background NO2 in the free troposphere, which is the part of the atmosphere between the top of the boundary layer (∼ 2 km altitude) and the tropopause. NOx sources in the free troposphere include lightning, aircraft, transport from the boundary layer and the stratosphere, and chemical recycling from HNO3 and organic nitrates (Singh et al., 1996; Jaeglé et al., 1998a; Levy et al., 1999; Hudman et al., 2007). As fossil fuel NOx emissions have decreased in the U.S. and other post-industrial countries, the relative contribution of the free tropospheric background to the tropospheric NO2 columns has increased (Silvern et al., 2019). Satellite instruments are more sensitive to NO2 in the free troposphere than in the boundary layer because of atmospheric scattering, so the NO2 column retrievals must assume a vertical distribution of NO2 (shape factor) specified by an atmospheric chemistry model for the local conditions (Martin et al., 2002; Eskes and Boersma, 2003). However, these models may be subject to large errors in the free troposphere (Travis et al., 2016; Silvern et al., 2018). Here we use the vertical distribution of tropospheric NOx from aircraft measurements over land and ocean, simulated with the GEOS-Chem and other atmospheric chemistry models, to diagnose the confidence to be had in these models and in the aircraft observations. We discuss the implications for global tropospheric oxidants and the retrieval and interpretation of satellite NO2 measurements in terms of surface NOx emissions.
Accurate in situ measurements of NO2 in the free troposphere are challenging because of low NO2 concentrations and interferences from labile non-radical NOx reservoirs (HNO4, N2O5, and organic nitrates) when sampling at cold temperatures (Bradshaw et al., 1999; Browne et al., 2011; Reed et al., 2016; Nussbaumer et al., 2021). Current techniques to measure NO2 in situ involve either (i) the conversion of NO2 to NO by photolysis followed by measurement of NO through chemiluminescence (photolysis–chemiluminescence or P-CL; Walega et al., 1991; Ryerson et al., 2000; Bourgeois et al., 2022) or (ii) the direct measurement of NO2 through laser-induced fluorescence (LIF; e.g., Thornton et al., 2000; Matsumoto et al., 2001; Javed et al., 2019), cavity ring-down spectroscopy (Osthoff et al., 2006), or cavity-enhanced differential optical absorption spectroscopy (Platt et al., 2009). Intercomparisons of NO2 instruments have generally found agreement among the different techniques at high (> 1 ppbv – parts per billion by volume) NO2 concentrations (Thornton et al., 2003; Fuchs et al., 2010; Sparks et al., 2019; Bourgeois et al., 2022) but poor agreement in free tropospheric conditions, where NO2 concentrations are below 50 pptv (parts per trillion by volume) and close to the instrument detection limits (Gregory et al., 1990a; Sparks et al., 2019). In contrast, NO measurements in the free troposphere are generally found to be reliable down to about 10 pptv (Gregory et al., 1990b; Rollins et al., 2020). The NO2 photolysis technique has been used for NO2 measurements from aircraft since the 1980s (Ridley et al., 1988; Sandholm et al., 1990). However, the free tropospheric NO2 concentrations from these measurements were often found to be higher than expected from the NO–NO2 photochemical steady state (PSS; Davis et al., 1993; Fan et al., 1994; Crawford et al., 1996). This was later attributed to an artifact in the NO2 measurements from the decomposition of peroxyacetyl nitrate (PAN), HNO4, and methyl peroxy nitrate (MPN) in the sample line and the photolysis cell (Bradshaw et al., 1999; Browne et al., 2011; Reed et al., 2016). These species are present at relatively high concentrations at cold temperatures of the upper troposphere (Murphy et al., 2004; Kim et al., 2007; Singh et al., 1986) and can cause significant interference in the NO2 measurements when the instrument temperature is higher than the ambient temperature (Nault et al., 2015; Reed et al., 2016).
The LIF technique was developed to eliminate interferences associated with the photolytic conversion of NO2 (Thornton et al., 2000) and has been widely used in aircraft campaigns to measure the free tropospheric profiles of NO2 over North America and remote regions (Murphy et al., 2004; Bertram et al., 2007; Browne et al., 2011; Nault et al., 2015) and to evaluate satellite NO2 retrievals (Bucsela et al., 2008; Boersma et al., 2008; Laughner et al., 2019). However, Silvern et al. (2018) found that the LIF NO2 measurements in the upper troposphere over the southeastern U.S. during the Studies of Emissions and Atmospheric Composition, Clouds, and Climate Coupling by Regional Surveys (SEAC4RS) aircraft campaign were much higher than the NO2 concentrations expected from the NO–NO2 PSS, indicating either an error in the NO–NO2-O3 kinetics at low temperatures or a remaining bias in the measurement.
Free tropospheric NO2 concentrations have also been derived using remote sensing techniques. The airborne multi-axis differential optical absorption spectroscopy (AMAX-DOAS) instrument has been used to measure vertical profiles of NO2 in the free troposphere (Baidar et al., 2013; Volkamer et al., 2015). Ground-based MAX-DOAS instruments can measure NO2 vertical profiles in the boundary layer but have low sensitivity to the free troposphere (Vlemmix et al., 2011). NO2 concentrations in the upper troposphere (8–12 km) have been retrieved from satellite NO2 column measurements using cloud-slicing techniques based on measuring differences in partial NO2 columns above clouds of different heights (Belmonte Rivas et al., 2015; Choi et al., 2014; Marais et al., 2021). These provide extensive spatial coverage, but there are inconsistencies among different products and large differences compared to aircraft LIF measurements (Marais et al., 2018, 2021).
Atmospheric chemistry models are often used alongside satellite NO2 measurements to determine surface NOx emissions and their trends, as they provide a way to relate changes in NO2 columns to surface NOx emissions (Martin et al., 2003; Lamsal et al., 2011). But the sensitivity of modeled NO2 columns to surface emissions depends on the relative contribution of the free troposphere to NO2 columns. Modeled NO2 vertical profiles over the continents generally agree with aircraft observations below about 6 km (Lamsal et al., 2014; Choi et al., 2020) but underestimate NO2 measurements in the upper troposphere (Martin et al., 2006; Travis et al., 2016; Williams et al., 2017; Miyazaki et al., 2020). This could reflect model errors in the parameterized lightning NOx emissions (Martin et al., 2006; Allen et al., 2010; Hudman et al., 2007; Zhu et al., 2019), convective transport of surface pollutants (Travis et al., 2016), or NOx chemistry (Nault et al., 2016; Silvern et al., 2018) but also measurement errors.
A number of global modeling studies have evaluated NO simulations over remote regions because of their importance for the production of tropospheric ozone and the hydroxyl radical (OH) and have generally found agreement within a factor of 2 (e.g., Emmons et al., 1997; Wang et al., 1998; Levy et al., 1999; Bey et al., 2001; Horowitz et al., 2003). However, a recent comparison of six global models with aircraft observations over the Pacific and Atlantic oceans made during the NASA Atmospheric Tomography Mission (ATom) campaign's first deployment (July–August 2016) found a significant underestimate of NO in all models below 4 km in the tropics and subtropics (Guo et al., 2021a). Other studies also suggest a missing source of NOx in models over the subtropical oceans from fast photolysis of particulate nitrate (Ye et al., 2016; Reed et al., 2017; Kasibhatla et al., 2018; Andersen et al., 2023) or from oceanic emissions (Fisher et al., 2018).
Here we use data from the SEAC4RS and the Deep Convective Clouds and Chemistry (DC3) aircraft campaigns to demonstrate the pervasiveness of interference from non-radical NOx reservoirs in NO2 measurements in the upper troposphere. We go on to use the more reliable NO measurements and the NO2 concentrations derived by applying PSS to the NO measurements to evaluate the NO and NO2 vertical profiles from different models for the SEAC4RS, DC3, and ATom campaigns. We use the model results to examine the sources of NOx in the free troposphere, effects on tropospheric ozone and OH, and contribution of the free tropospheric background to satellite NO2 columns over the U.S.
2.1 Aircraft observations
We use observations from the SEAC4RS (August–September 2013; Toon et al., 2016) and DC3 (April–May 2012; Barth et al., 2015) campaigns over the southeastern U.S. (25–40∘ N; 65–100∘ W) and the ATom campaign (four seasonal deployments in 2016–2018) over the Pacific and Atlantic oceans (Thompson et al., 2022). For all three campaigns, we use measurements from the NASA DC-8 aircraft, which has a ∼ 12 km ceiling. Table 1 lists the measurements used in this work. Here, we briefly describe the NO2 and NO measurements, as they are most relevant. NO2 measurements during the SEAC4RS and DC3 campaigns were made using the UC Berkeley LIF instrument (Thornton et al., 2000; Cleary et al., 2002; Nault et al., 2015). The LIF measurements have little (< 5 %) interference from HNO4, but there is interference from the thermal decomposition of MPN, for which a correction was applied (0 %–21 % for SEAC4RS and 0 %–40 % for DC3). The correction was calculated using concurrent measurements of MPN concentrations (from the same instrument using thermal decomposition in a heated channel) and the fractional thermal decomposition of MPN in the NO2 channel, considering the temperature of the channel (15–25 ∘C) and the instrument residence time (0.23 s for SEAC4RS and 0.5 s in DC3), as described by Nault et al. (2015). The LIF measurements have an accuracy of 5 % and a detection limit of ∼ 30 pptv for 1 Hz measurements (Thornton et al., 2000; Day et al., 2002; Wooldridge et al., 2010). NO2 measurements in ATom were made with the National Oceanic and Atmospheric Administration (NOAA) Nitrogen Oxides and Ozone (NOyO3) instrument, using the P-CL technique (Ryerson et al., 2000; Bourgeois et al., 2022). The NOAA instrument also provided NO2 measurements in SEAC4RS and DC3. The instrument has an accuracy of ∼ 7 % and a detection limit of 20–30 pptv for 1 Hz measurements (Pollack et al., 2010, 2012). Interference in the NO2 measurement from HNO4 and MPN is estimated to be 30 %–40 % for HNO4 and 100 % for MPN, based on an estimated photolysis cell temperature of 20–30 ∘C and the residence time of air in the cell of 0.75 s during ATom (Bourgeois et al., 2022). The P-CL NO2 measurements are not corrected for this interference. The P-CL NO2 measurements also have photolytic interference from HONO (5 % of the HONO mixing ratio), but this is negligible in much of the troposphere where HONO concentration is generally less than 10 pptv (Ye et al., 2016; Andersen et al., 2023). NO measurements in all three campaigns were made by the NOAA NOyO3 instrument, with an accuracy of 4 % and a detection limit of 6–10 pptv for 1 Hz measurements (Ryerson et al., 2000). For comparison with the model, we exclude measurements influenced by fresh convection (condensation nuclei larger than 10 nm > 104 cm−3), fresh NOx emissions (NOy NO < 3 mol mol−1), biomass burning plumes (CO > 200 ppbv and CH3CN > 200 pptv), and stratospheric intrusions (O3 > 100 ppbv or CO < 45 ppbv).
Table 1Measurements from the SEAC4RS, DC3, and ATom aircraft campaignsa.
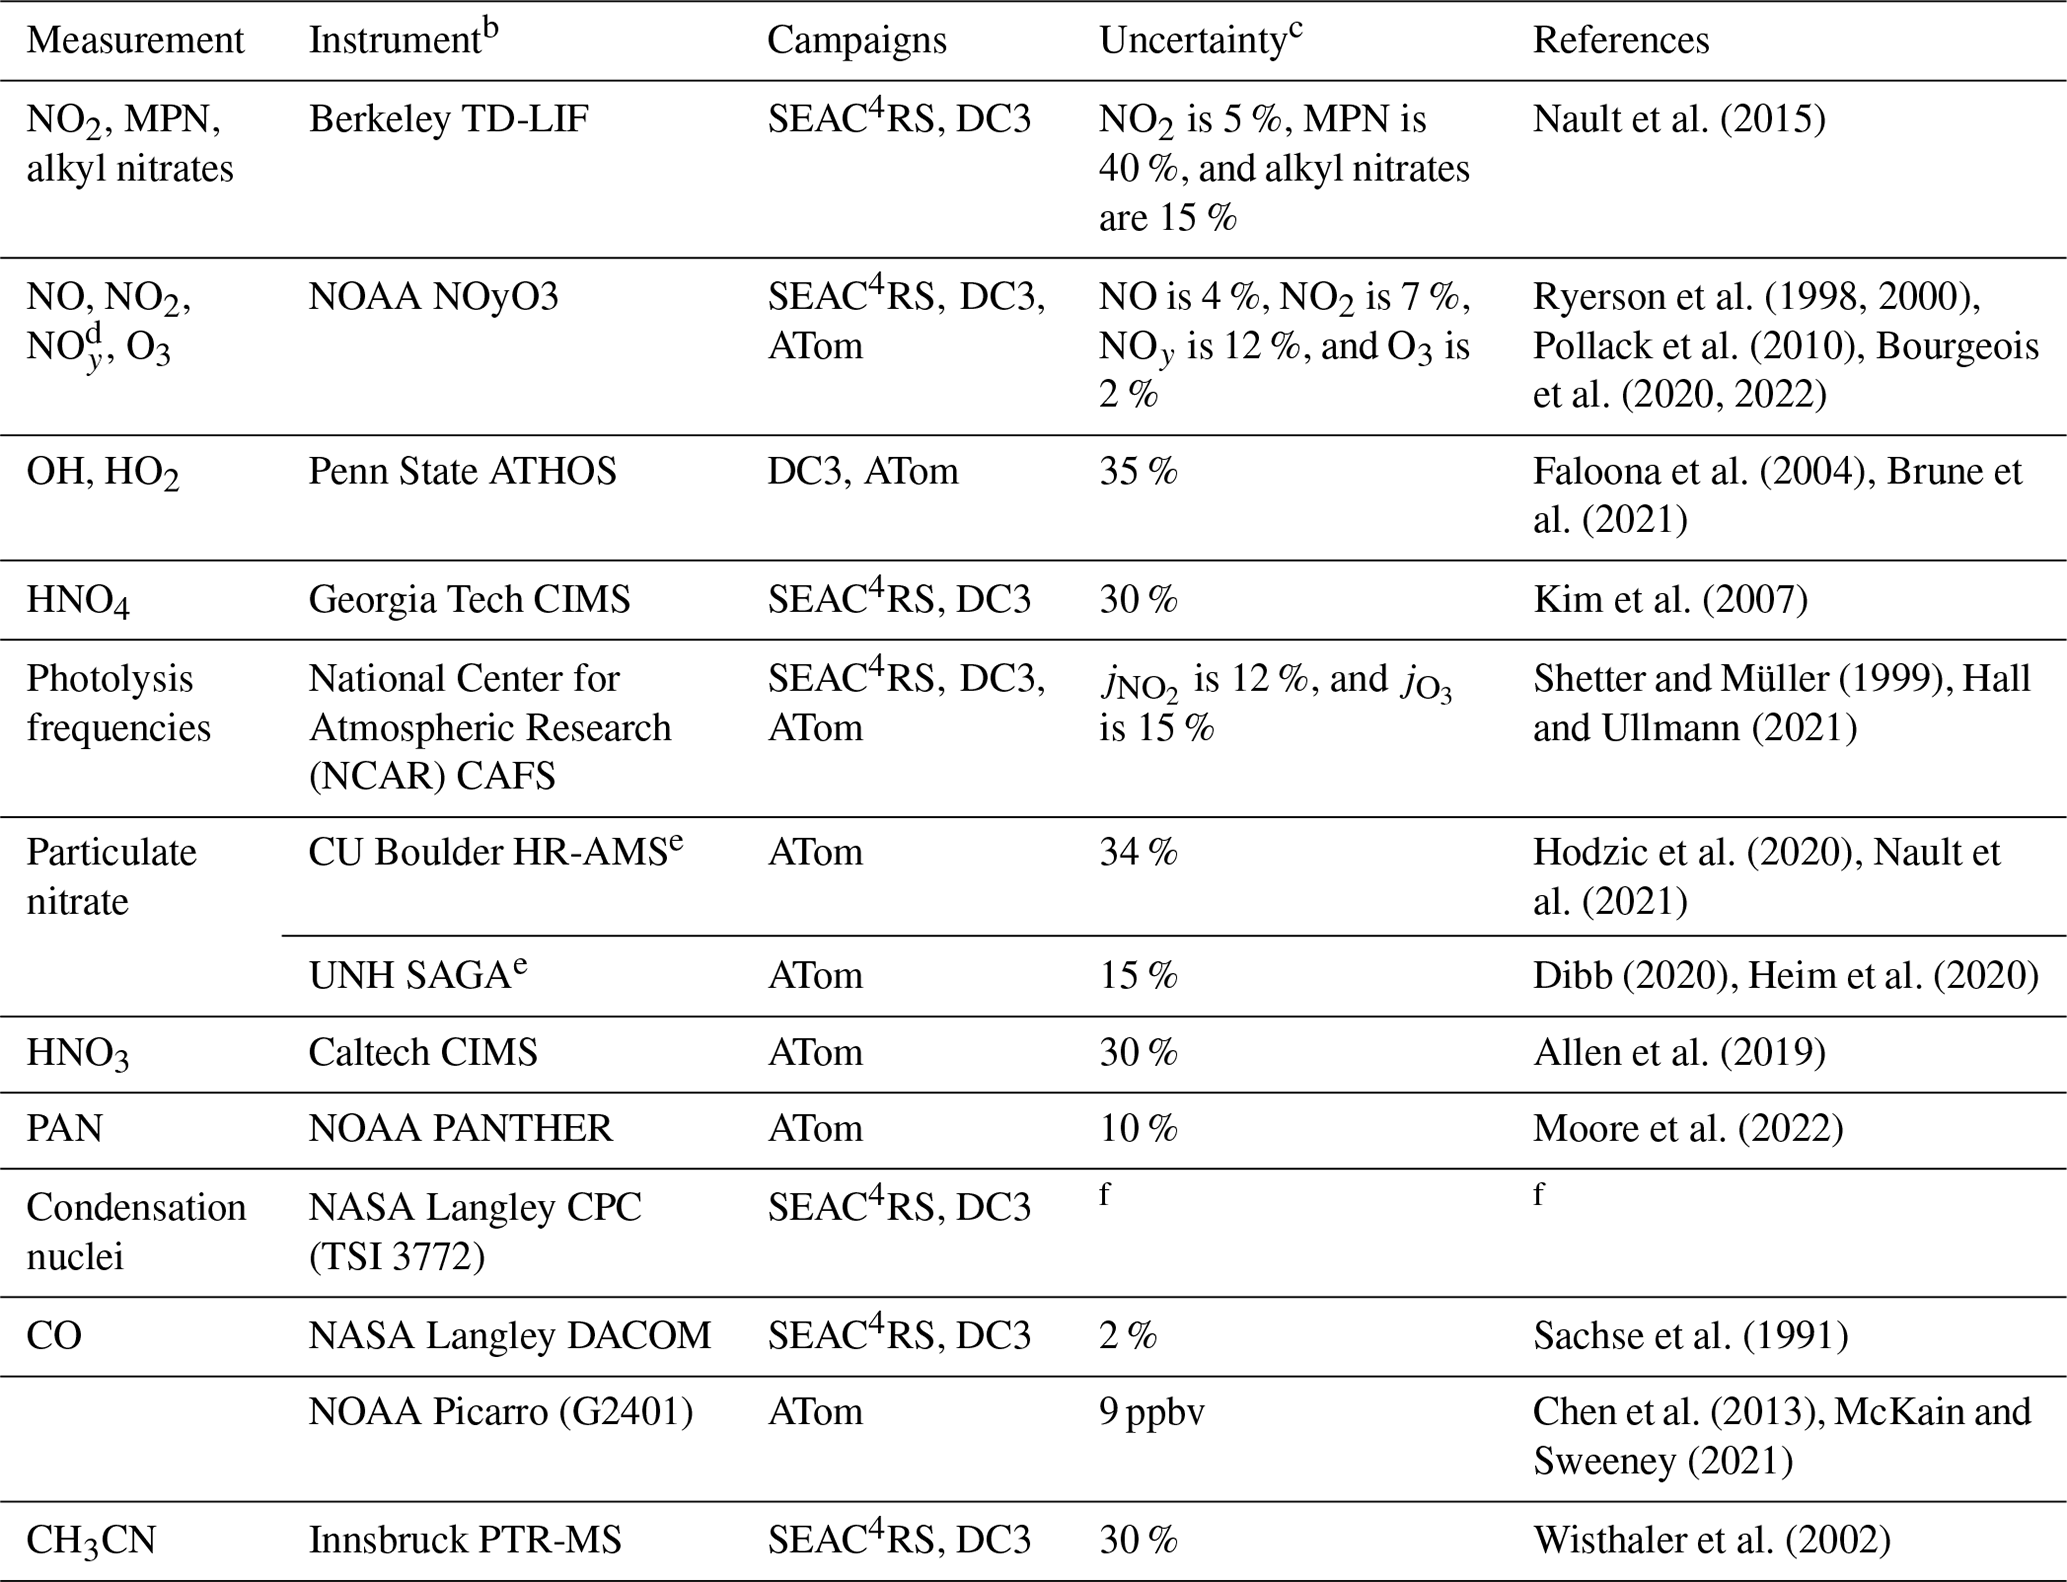
a Measurements used in this work to evaluate the NOx simulations and to select data for analysis. b Instrument acronyms: TD-LIF is thermal dissociation laser-induced fluorescence, ATHOS is the Airborne Tropospheric Hydrogen Oxides Sensor, CIMS is the chemical ionization mass spectrometer, NCAR is the National Center for Atmospheric Research, CAFS is the charged-coupled device (CCD) actinic flux spectroradiometer, HR-AMS is the high-resolution aerosol mass spectrometer, SAGA is soluble acidic gases and aerosols, PANTHER is the PAN and Trace Hydro-halocarbon ExpeRiment, CPC is the condensation particle counter, DACOM is the differential absorption carbon monoxide monitor, and PTR-MS is proton transfer reaction mass spectrometry. c Estimated accuracy at analyte concentrations well above the detection limit. d Total reactive nitrogen oxides, including NOx and its oxidation products. e The AMS measures the composition of non-refractory submicron aerosols. SAGA measures the ionic composition of water-soluble bulk aerosols with a diameter of less than about 4 µm. f Commercial instrument operated by the NASA Langley Aerosol Research Group Experiment.
2.2 GEOS-Chem model
We use the GEOS-Chem atmospheric chemistry model (12.9.3; https://doi.org/10.5281/zenodo.3959279, The International GEOS-Chem User Community, 2020) with a modification to include inorganic particulate nitrate (pNO) photolysis as described below. Our simulations are driven by assimilated meteorology from NASA Global Modeling and Assimilation Office (GMAO)'s Modern-Era Retrospective analysis for Research and Applications, Version 2 (MERRA-2; Gelaro et al., 2017). We conduct global simulations at 4∘ × 5∘ horizontal resolution (47 levels in the vertical) for the time periods corresponding to the following aircraft campaigns: SEAC4RS (July–August 2013), DC3 (May–June 2012), and ATom (July–August 2016, January–February 2017, September–October 2017, and April–May 2018), as well as an annual simulation for 2015. Previous work on the SEAC4RS campaign used finer-resolution simulations (Travis et al., 2016), but these are not needed here, as the free tropospheric NO2 concentrations do not vary much at regional scales, and finer-resolution tests showed similar results (Yu et al., 2016). The horizontal grid resolution can lead to localized differences in the upper troposphere from stratospheric intrusions, convective transport, and lightning NOx emissions (Schwantes et al., 2022), and we minimize these effects by filtering out data influenced by the stratosphere, fresh convection, and fresh NOx emissions, as described above. The spin-up period for our simulations is 6 months. Comparison to aircraft measurements is done by sampling the model along the flight path as an online diagnostic during the model simulation.
Table 2 lists the global NOx emissions in our 2015 simulation. Anthropogenic NOx emissions are from the Community Emissions Data System (CEDS) global inventory (Hoesly et al., 2018), superseded with regional emission inventories for the U.S. (U.S. EPA 2011 NEI, 2021), Canada (Air Pollutant Emissions Inventory, 2021), Africa (Marais and Wiedinmyer, 2016), and China (Zheng et al., 2018). The U.S. EPA 2011 National Emissions Inventory (NEI) is scaled annually using EPA-estimated emissions trends (U.S. EPA Air Pollutant Emissions Trends Data, 2021). Travis et al. (2016) had to scale down the NEI NOx emissions in GEOS-Chem by 40 % to reproduce the SEAC4RS NOx observations, but we do not do this in our simulations as it leads to an underestimate of NOx in other seasons (Jaeglé et al., 2018; Silvern et al., 2019). Open fire NOx emissions are from the GFEDv4 inventory (Giglio et al., 2013). Ship NOx emissions are from CEDS and are processed using the PARAmetrization of emitted NOx (PARANOX) model to account for fast in-plume NOx oxidation (Vinken et al., 2011; Holmes et al., 2014). Aircraft NOx emissions are from the Aviation Emissions Inventory Code (AEIC) inventory (Stettler et al., 2011; Simone et al., 2013) and are updated here with flight traffic data for 2015. Lightning NOx emissions follow Murray et al. (2012), with lightning flash rates calculated as a function of the cloud-top height and scaled to match the observed climatology from satellite data. Emissions are computed at the native MERRA-2 resolution (0.5∘ × 0.625∘). NO yields of 500 mol per flash are used for the northern midlatitudes (> 35∘ N) and 260 mol per flash elsewhere. Emissions are distributed in the vertical following Ott et al. (2010). Soil and fertilizer NOx emissions are from Hudman et al. (2012) and are computed at 0.5∘ × 0.625∘ resolution (Weng et al., 2020).
Table 2Global NOx emissions in 2015a.
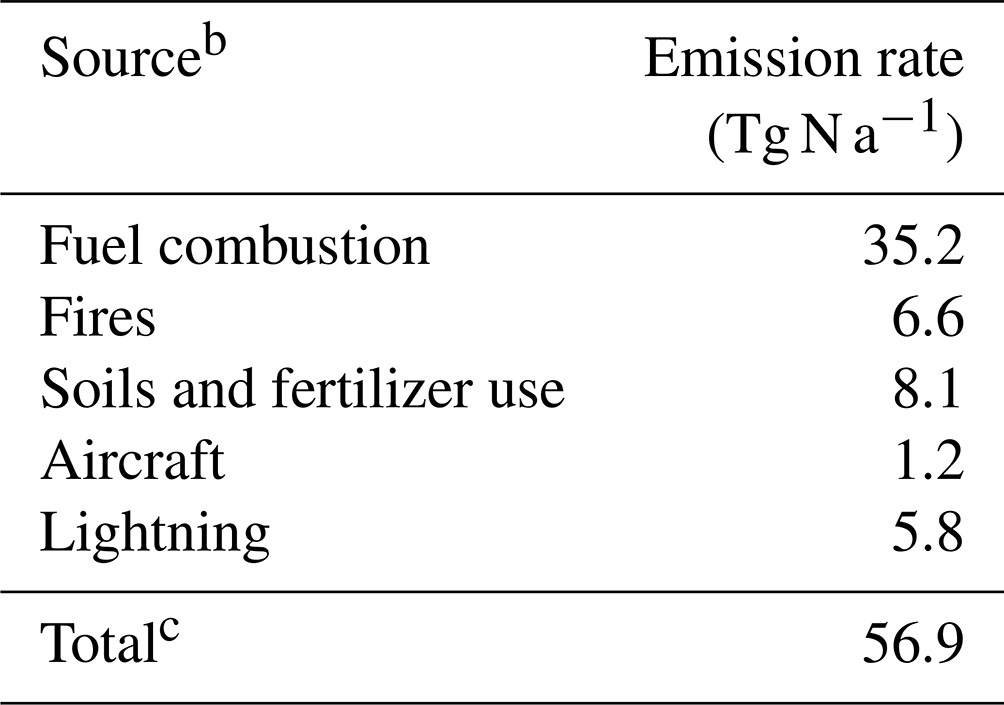
a As used in our GEOS-Chem simulation. b References for the different sources are given in the text. c Not including the NOx source of ∼ 0.5 Tg N a−1 from downwelling of stratospheric NOy produced from N2O.
GEOS-Chem includes a detailed representation of NOx–HOx–VOC–aerosol–halogen chemistry (where VOC is a volatile organic compound; Mao et al., 2013; Travis et al., 2016; Holmes et al., 2019; Wang et al., 2021; McDuffie et al., 2021; Pai et al., 2020). Recent improvements to the model's NOx chemistry include the addition of detailed tropospheric halogen chemistry (Wang et al., 2021), addition of methyl, ethyl, and propyl nitrate emissions and chemistry (Fisher et al., 2018), and updates to the heterogeneous NOx reactions in aerosols and cloud droplets (Holmes et al., 2019; McDuffie et al., 2021). Here we follow Schmidt et al. (2016) and exclude bromine release from sea salt aerosol debromination because it leads to excessive model BrO in the marine boundary layer (MBL). Equilibrium partitioning of HNO3 to pNO on fine-mode aerosols is calculated using ISORROPIA II (Fountoukis and Nenes, 2007; Wang et al., 2019). The fine-mode aerosols are treated as internal mixtures of sulfate, nitrate, ammonium, and sea salt components, representing well-aged particles that have undergone coagulation and cloud processing (Fridlind and Jacobson, 2000). The model also includes the formation and uptake of sulfate and nitrate in alkaline sea salt aerosols (Wang et al., 2019). Uptake of HNO3 as pNO on coarse sea salt aerosols is treated as a kinetic process, following Wang et al. (2019). Sea salt aerosol emissions follow Jaeglé et al. (2011) and are calculated at 0.5∘ × 0.625∘ resolution (Weng et al., 2020). Our simulation does not include HNO3 uptake on alkaline dust particles, which could be important in dust plumes over the ocean (Fairlie et al., 2010; Karydis et al., 2016). Photolysis frequencies in the model are calculated using Fast-JX (Wild and Prather, 2000; Eastham et al., 2014).
Previous studies examining the GEOS-Chem NO simulation for the ATom campaign showed underestimates in the lower troposphere (Fisher et al., 2018; Travis et al., 2020; Guo et al., 2021a). Measurements in the marine atmosphere indicate elevated levels of HONO that likely originate from pNO photolysis (Ye et al., 2016; Andersen et al., 2023) and would provide a fast source of NOx missing from the model. We address this by including pNO photolysis in our simulation, following the implementation of this reaction in GEOS-Chem by Kasibhatla et al. (2018). The photolysis frequency of pNO is calculated by scaling the photolysis frequency of HNO3 by an enhancement factor (EF). There is high uncertainty in the EF, with laboratory studies in the range of 1–1000 (Ye et al., 2017b; Bao et al., 2018; Gen et al., 2019; Shi et al., 2021). Field and modeling studies find that EFs of 10–500 are needed to explain the NOx and HONO observations over the oceans (Ye et al., 2016, 2017a; Reed et al., 2017; Kasibhatla et al., 2018; Zhu et al., 2022; Andersen et al., 2023), with higher values for pNO in sea salt aerosols (Andersen et al., 2023). Consistent with these studies, we find that we can match the ATom NO observations by using an EF of 100 for pNO in sea salt aerosol. In our model, coarse-mode pNO is only present in sea salt aerosols and has an EF of 100, but fine-mode pNO is internally mixed with sulfate, ammonium, and sea salt aerosol. So we decrease the EF of fine-mode pNO, depending on the relative amounts of pNO and sea salt aerosol, as follows:
Here and [SSA] are the molar concentrations in air of fine-mode pNO and sea salt aerosol. The molar concentration of sea salt is taken as , based on the fraction of Na+ in seawater (Millero et al., 2008) and where Na+ is the chemically inert sea salt aerosol species simulated by GEOS-Chem. We choose a lower limit of 10 for the EF, based on the results of Romer et al. (2018), who estimated EF values for non-sea-salt pNO aerosols in the range 1–30 from observations over South Korea. The relative yields of HONO : NO2 from pNO photolysis are taken as 2 : 1 (Ye et al., 2017b; Kasibhatla et al., 2018). We will discuss the effect of pNO photolysis on remote NOx concentrations in more detail in Sect. 3.2.
2.3 Other models
In addition to GEOS-Chem simulations, we analyze results from three other global atmospheric chemistry models: the Global Modeling Initiative (GMI) model, the massively parallel version of the tracer model version 5 (TM5-MP), and the Copernicus Atmosphere Monitoring Service (CAMS) reanalysis product. The GMI model simulates tropospheric and stratospheric chemistry (Duncan et al., 2007; Strahan et al., 2007; Strode et al., 2015) using meteorological fields from NASA GMAO's MERRA-2 reanalysis. GMI NO2 vertical profiles are used to specify shape factors in the Ozone Monitoring Instrument (OMI) NO2 retrievals (Krotkov et al., 2017; Lamsal et al., 2021). The version used here has a horizontal resolution of 1∘ × 1.25∘. Strode et al. (2021) describe the GMI model simulations for the ATom campaign. The TM5-MP model is a high-resolution (1∘ × 1∘) version of the TM5 global atmospheric chemistry model developed specifically for application to satellite retrievals (Williams et al., 2017; Huijnen et al., 2010). It is driven by assimilated meteorology from the European Centre for Medium-Range Weather Forecasts (ECMWF) ERA-Interim reanalysis. The TM5 NO2 profiles are used in the Quality Assurance for Essential Climate Variables (QA4ECV) OMI and TROPOspheric Monitoring Instrument (TROPOMI) NO2 retrievals (Boersma et al., 2018; van Geffen et al., 2022). CAMS provides a global reanalysis of atmospheric composition at a horizontal resolution of 80 km (T255) for the period from 2003 onwards (Inness et al., 2019). It is based on ECMWF's Integrated Forecast System (IFS) and uses 4D-Var data assimilation of satellite retrievals of NO2, O3, CO, and aerosol optical depth. The CAMS NO2 profiles are planned for use in NO2 retrievals from the European Sentinel-4 geostationary satellite (ESA Sentinel-4 Data Products, 2022). The TM5 and CAMS output along the ATom flight tracks was available only for the first ATom deployment (July–August 2016).
3.1 Vertical distribution of NOx over the U.S.
Figure 1 compares the median vertical profiles of the observed and GEOS-Chem NO and NO2 concentrations for the SEAC4RS and DC3 aircraft campaigns. For both campaigns, the observed and GEOS-Chem NO concentrations (Fig. 1a, d) peak in the boundary layer and again in the upper troposphere because of lightning and aircraft emissions, convective lifting of surface emissions, long NOx lifetime (except near fresh convection), and a shift in the daytime NO NO2 ratio toward NO at low temperatures (Jaeglé et al., 1998a; Bertram et al., 2007; Hudman et al., 2007; Nault et al., 2017). The GEOS-Chem NO2 profiles are similar to the LIF NO2 profiles below 10 km but differ in the upper troposphere (Fig. 1b, e), as previously noted by Travis et al. (2016). LIF NO2 concentrations in SEAC4RS increase from 20 pptv at 9 km to 120 pptv at 12 km, but GEOS-Chem NO2 concentrations remain below 30 pptv. The difference between GEOS-Chem and the P-CL NO2 observations in the upper troposphere during DC3 is even larger.
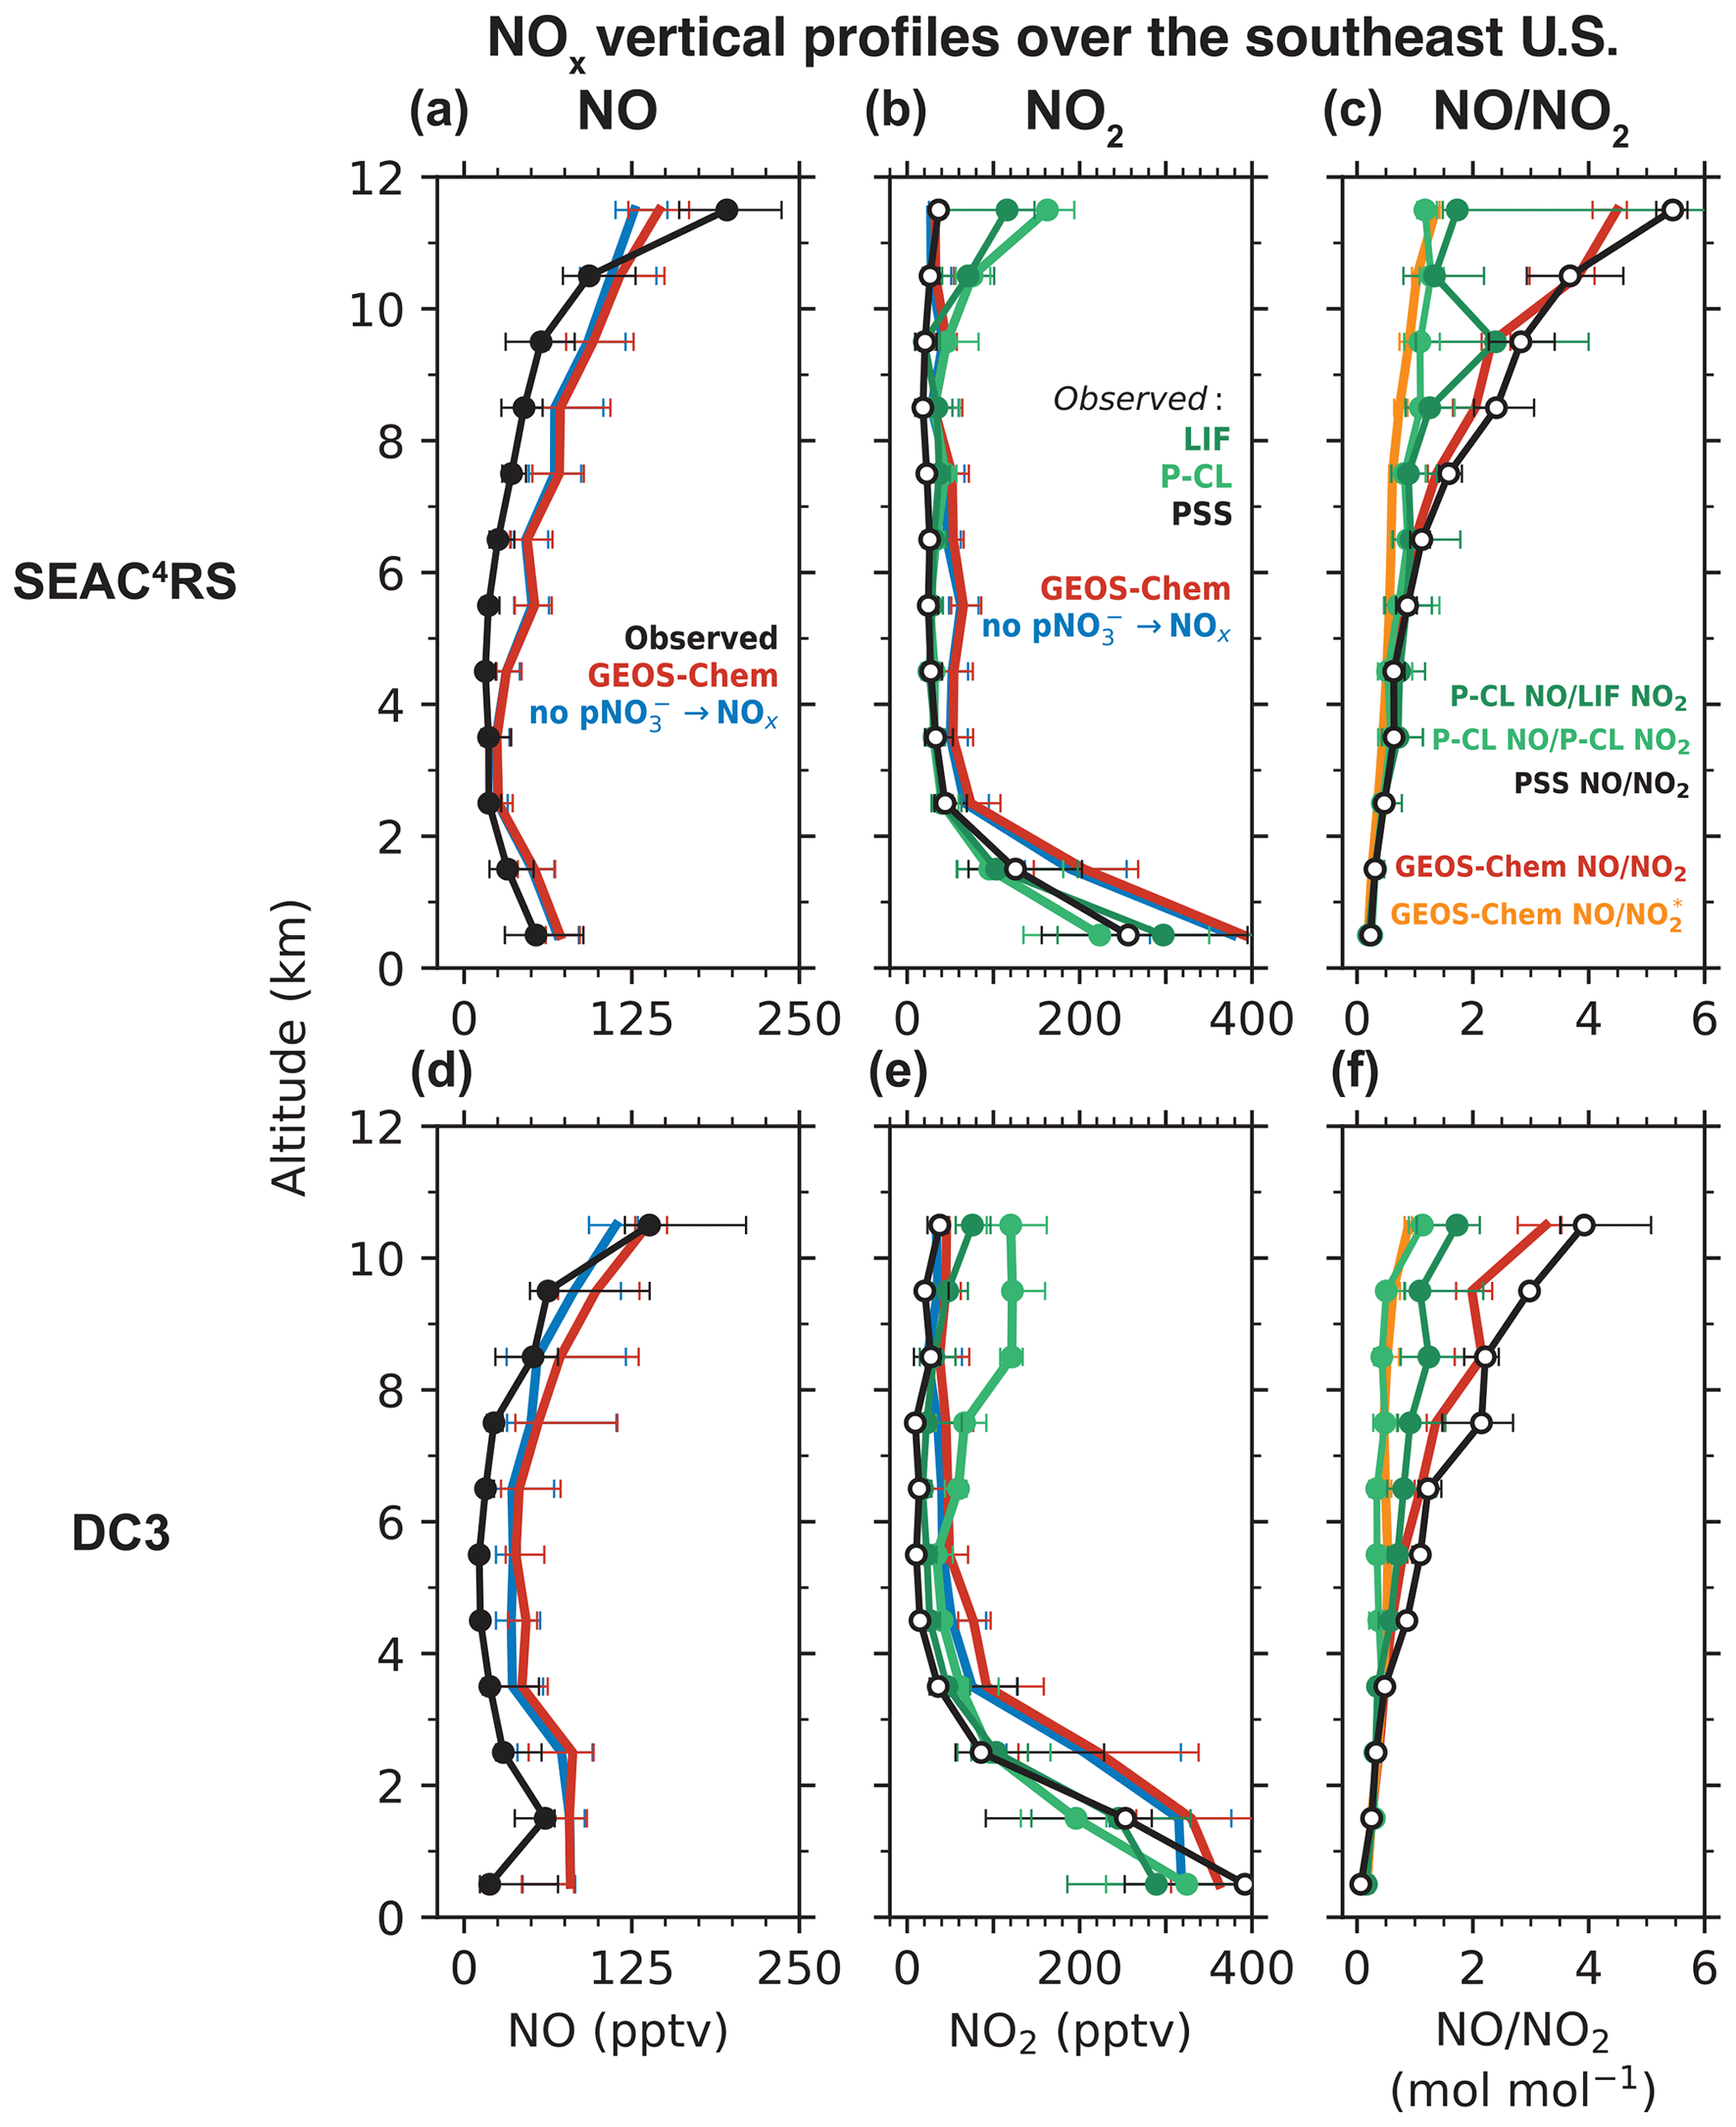
Figure 1Median vertical profiles of observed and GEOS-Chem simulated NO concentrations (a, d), NO2 concentrations (b, e), and NO NO2 molar ratios (c, f) during the SEAC4RS (August–September 2013) and DC3 (April–May 2012) aircraft campaigns over the southeastern U.S. The NO measurements are from the NOAA P-CL instrument. NO2 was measured by the Berkeley LIF and the NOAA P-CL instruments. The NO NO2 ratios at the photochemical steady state (PSS; Eq. 2) and the corresponding NO2 concentrations (Eq. 3) are also shown in panels (c) and (f). The PSS calculation is based mostly on observed quantities but uses modeled values for quantities that were not measured, as described in the text. Also shown in panels (c) and (f) are the NO NO (NO ≡ NO2 + HNO4 + MPN) ratios from GEOS-Chem. MPN is methyl peroxy nitrate. We exclude measurements in early mornings and late evenings (solar zenith angle > 70∘) and those influenced by fresh NOx emissions recent convection, biomass burning, and the stratosphere, as described in Sect. 2.1. The horizontal bars show the interquartile ranges of the measurements in each 1 km altitude bin.
Travis et al. (2016) and Silvern et al. (2018) showed that the difference between the measured and GEOS-Chem NO2 in the upper troposphere in SEAC4RS can be explained by the departure of the measured NO NO2 ratio from that expected from the calculated PSS between NO and NO2. In the daytime, NO and NO2 interconvert rapidly through the following main reactions:
Here RO2 represents the ensemble of organic peroxy radicals. At PSS, the NO NO2 ratio is given by the following:
where is the NO2 photolysis frequency, and ki is the rate constant of reaction i. We calculate the PSS NO NO2 ratio for the SEAC4RS and DC3 data using concurrent aircraft measurements and GEOS-Chem-simulated values along the flight path for quantities that were not measured. [O3] and were measured in both campaigns. [HO2] was measured only in DC3, but H2O2 concentrations measured in SEAC4RS are consistent with GEOS-Chem (Silvern et al., 2018), which provides support for the model [HO2]. Rate constants are as recommended by the Jet Propulsion Laboratory (JPL) evaluation (Burkholder et al., 2020) and adjusted for temperature and pressure. We take the NO+CH3O2 reaction rate constant as k3. [RO2] and [BrO] are taken from GEOS-Chem but make only small contributions. In the free troposphere, NO–NO2 PSS is largely governed by the NO+O3 reaction (Bradshaw et al., 1999; Silvern et al., 2018). Thus, the PSS NO NO2 ratio depends mainly on observed quantities and on relatively well-established kinetics (Silvern et al., 2018). We estimate the uncertainty in the PSS NO NO2 ratio at 1 Hz of about ± 20 %, based on uncertainties in the [O3], [HO2], and measurements (Table 1), rate constants (10 %; Burkholder et al., 2020), and model [RO2] and [BrO] (assumed to be 50 %).
Figure 1c, f show the vertical profiles of the measured and the PSS NO NO2 ratios. The PSS NO NO2 ratio increases with altitude because of the slower rate of the NO + O3 reaction at colder temperatures (Burkholder et al., 2020). There is relatively little change in with altitude (Silvern et al., 2018). The measured and PSS ratios match below 5 km, but at higher altitudes, the measured ratios are smaller than the PSS ratios. Between 10 and 12 km, the NO NO2 ratios using the LIF measurements are in the range of 1 to 2, while the PSS NO NO2 ratios are in the range of 3 to 6. The NO NO2 ratios using the P-CL measurements at this altitude are close to 1. The GEOS-Chem NO NO2 ratios are similar to the PSS ratios throughout the troposphere.
The P-CL NO2 instrument has significant interference from the dissociation of HNO4 and MPN (Reed et al., 2016; Nussbaumer et al., 2021; Bourgeois et al., 2022), and we find that the ratio of NO NO (NO ≡ NO2 + HNO4 + MPN) in GEOS-Chem matches the NO NO2 ratio for the P-CL NO2 measurements (Fig. 1c, f). The LIF NO2 measurements correct for the thermal dissociation of MPN (there is little thermal dissociation of HNO4), but the correction is affected by the high uncertainty in the concentrations and the thermal stability of MPN (Nault et al., 2015). The LIF instrument was modified between DC3 and SEAC4RS to shorten the sample residence time and reduce the fraction of MPN dissociating in the instrument (Nault et al., 2015), but we do not find that this improved agreement between the measured and PSS NO NO2 (Fig. 1c, f). It is also possible that HNO4 and MPN (and potentially other labile NO2 reservoir species) dissociate on the inlet walls, which the correction would not account for. Bradshaw et al. (1999) could achieve agreement of their NO2 measurements with the PSS concentrations at all altitudes by using an unusually large inlet (10 cm diameter) and a very high flow rate in the instrument to minimize wall collisions.
Silvern et al. (2018) pointed out that the difference between the measured and PSS NO NO2 ratios could arise from either an error in the NO-NO2-O3 kinetics or a systematic bias in the NO2 measurements in the upper troposphere. Here we arbitrate between these two hypotheses by using quasi-Lagrangian observations in the outflow from a dissipating thunderstorm in the upper troposphere deliberately sampled during DC3 (flight RF17). Nault et al. (2016) previously analyzed the evolution of NOx and NOy (NOy ≡ NOx + non-radical reservoirs) on this flight to determine NOx oxidation rates and showed a steady decrease with time in the NO and NO2 concentrations and an increase in the NOy oxidation products during the 2 h sampling period. Figure 2a shows the flight path with daytime plume crossings colored by the measured NOy NO molar ratio. The NOy NO ratio increases on each successive plume crossing as NOx undergoes oxidation in the outflow, and we use the ratio as a measure of chemical aging in the plume (Kleinman et al., 2008; Hayes et al., 2013). Figure 2b shows the measured NO, NO2, and the sum of HNO4 and MPN concentrations as a function of the NOy NO ratio. NO concentrations decreased from 900 to 400 pptv between the start and the end of the measurement period. But there was relatively little change in the NO2 concentrations. The mean LIF NO2 concentrations decreased by 25 %, while the mean P-CL NO2 concentrations increased, likely due to increasing interference from HNO4 and MPN produced in the plume. Figure 2b also shows the NO2 concentrations inferred by applying PSS to NO observations as follows:
where PSS is calculated from observations using Eq. (2) and measured [O3], [HO2], and . In this case, we take [RO2] to be equal to the measured [HO2] as an upper limit, instead of using the value from GEOS-Chem, since we do not expect the model to simulate the thunderstorm plume. The PSS NO2 concentrations decreased by a factor of 2 between the start and end of the measurement period, in line with the NO concentrations.
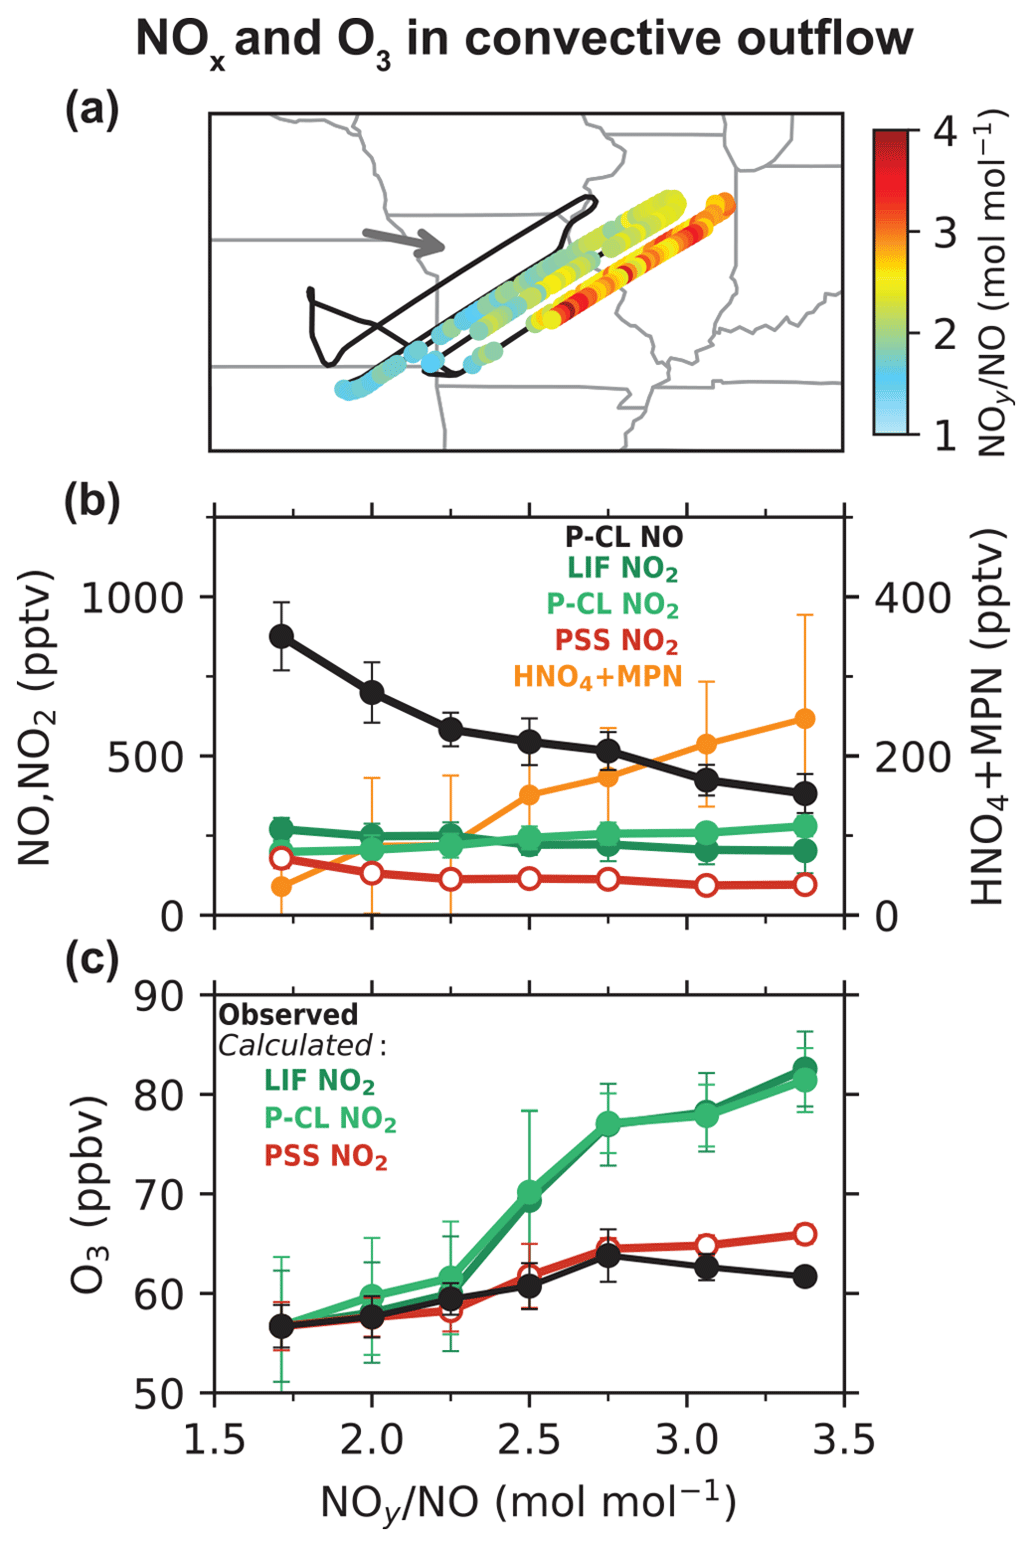
Figure 2Evolution of NOx and O3 concentrations in a thunderstorm outflow targeted for quasi-Lagrangian sampling by DC3 flight 17 over the central U.S. at 12 km altitude. Panel (a) shows the flight track with data points within the outflow colored by the observed NOy NO ratio as a measure of chemical aging. The arrow shows the mean wind direction. Panel (b) shows the measured concentrations of NO, NO2, and the sum of HNO4 and MPN as a function of the NOy NO molar ratio. Also shown are the PSS NO2 concentrations (Eq. 3). Panel (c) shows the measured ozone concentrations as a function of the NOy NO molar ratio along with the ozone concentrations calculated from Eq. (4), with NO2 concentrations from LIF, P-CL, or PSS NO2. The circles and the error bars in panels (b) and (c) show the means and standard deviations for each NOy NO bin.
Figure 2c shows the observed ozone concentrations as a function of the NOy NO ratio. Ozone concentrations increase with the age of the plume, reflecting the NOx-limited conditions for ozone production prevalent in the upper troposphere over the central U.S. in summer (Pickering et al., 1990; Jaeglé et al., 1998b; Apel et al., 2015). We compare the observed ozone increase to that computed from the observed and the observed NO, NO2, HO2, and OH concentrations. Ozone is produced through the photolysis of NO2 (Reaction R5) and is lost mainly by reaction with NO (Reaction R1), photolysis in the presence of water vapor (Reaction R6), and oxidation by HO2 and OH (Reactions R7 and R8).
The instantaneous net ozone production rate is then given as follows:
where
and is the frequency of the O3 photolysis channel producing O(1D) and was measured on the flight. [H2O] and [M] are calculated from meteorological observations on the flight. is the weighted-average reaction rate constant of O(1D) with N2 and O2 (Seinfeld and Pandis, 2016). We use Eq. (4) to calculate three estimates for the instantaneous net ozone production rate in the plume using NO2 from LIF, P-CL, and PSS. The total ozone increase in the plume is calculated by integrating over the measurement period.
The observed ozone concentrations increased by 7 ppbv between the start and the end of the measurement period in the plume. In comparison, the ozone increase calculated using the NO2 measurements from both the LIF and P-CL instruments is 25 ppbv, while that calculated using the PSS NO2 concentrations is close to the observations. We also examine the effect of potential uncertainties in the NO–NO2–O3 kinetic data by decreasing by 20 % and increasing by 40 % in Eq. (4), following Silvern et al. (2018). We find that the ozone increase calculated using the NO2 measurements is lowered to 17 ppbv, which is still much higher than the observed increase, implying that the difference between the NO2 measurements and the PSS NO2 concentrations cannot be attributed to errors in the NO–NO2–O3 kinetic data. The most likely explanation is that the LIF NO2 measurements are biased high, as are the P-CL measurements. The median LIF and P-CL NO2 concentrations in the outflow plume were both 235 pptv, compared to a median PSS NO2 concentration of 116 pptv. The median measured HNO4 and MPN concentrations were 44 and 90 pptv, respectively, and can explain the difference between the P-CL and PSS NO2 concentrations. The LIF NO2 measurements are thought to have little interference from HNO4 and were corrected for the partial dissociation of MPN, but it appears that this correction may have been underestimated. For this flight, the median correction to the NO2 measurements was just 7 %. The correction is affected by high uncertainty in the thermal dissociation rate constant of MPN (±30 %) and in the MPN measurements (±40 % + 20 pptv for 1 Hz; Nault et al., 2015). The MPN measurements themselves would be affected by a bias in the NO2 measurements as they are based on the difference in the NO2 measured between the heated MPN channel and the NO2 channel at cabin temperature. Interference from other known non-acyl peroxy nitrates would not be significant (Khan et al., 2020), but there could be other unknown organic NO2 reservoir species forming in convective outflows (Silvern et al., 2018).
Considering this bias in the LIF and P-CL NO2 measurements in the upper troposphere, we instead use the NO observations and the related PSS NO2 concentrations inferred from the NO and other observations (Eq. 3) to evaluate the modeled NOx in the free troposphere (Fig. 1). GEOS-Chem reproduces the shape of the NO and the PSS NO2 profiles throughout the troposphere for SEAC4RS and DC3 (Fig. 1b, d). There is no increase in the modeled or the PSS NO2 concentrations in the upper troposphere, as higher NO concentrations are compensated by higher NO NO2 ratios. GEOS-Chem NO concentrations are about 2 times higher than the observations in the free troposphere, consistent with previous work for SEAC4RS (Travis et al., 2016; Silvern et al., 2018). We calculate the NO2 column density corresponding to the PSS and GEOS-Chem NO2 profiles by converting the median NO2 concentrations at each altitude to a partial column density (product of the NO2 number density and the height of the altitude bin) and summing them from the surface to 12 km. We find that the PSS NO2 column densities in the free troposphere for the SEAC4RS and DC3 profiles in Fig. 1 are 3.6 × 10¹⁴ and 3.8 × 10¹⁴ molec. cm−2, respectively, compared to 6.5 × 10¹⁴ and 10.4 × 10¹⁴ molec. cm−2 in GEOS-Chem. However, the model does not overestimate NOy concentrations, suggesting that the model may be missing NOx oxidation chemistry, which is likely organic. We find that the median MPN concentration in the free troposphere in GEOS-Chem is about 5 pptv compared to about 40 pptv in the observations, consistent with the findings of Silvern et al. (2018) for SEAC4RS. Similarly, median alkyl nitrate concentration in the model is about 12 pptv but 60 pptv in the observations. NOx emissions are likely overestimated in the U.S. EPA NEI inventory used in our simulations (Travis et al., 2016), which explains the NO2 overestimate in the boundary layer, but this would have little effect in the free troposphere, where lightning emissions supply the majority of NOx. Finally, we find little difference in the SEAC4RS and DC3 NOx profiles in the free troposphere between our baseline simulation and the simulation without pNO photolysis, indicating that chemical recycling through pNO photolysis is a minor source of NOx over the U.S. compared to emissions.
Retrieval of NO2 columns from satellite-based instruments generally involves the following steps: (i) using the observed solar backscatter radiance to calculate a total slant NO2 column density along the light path, (ii) removal of the stratospheric contribution to calculate the tropospheric slant column density Ωs, and (iii) conversion of the tropospheric slant column density to a tropospheric vertical column density Ωv, using an air mass factor (AMF) that depends on the vertical profile of NO2 (Palmer et al., 2001; Martin et al., 2002).
where AMFG is the geometric AMF that describes the satellite viewing geometry, w(z) are the scattering weights that describe the sensitivity of the backscattered radiance to the NO2 abundance as a function of altitude (z), S(z) is the NO2 shape factor describing the vertical profile of the NO2 number density normalized to the NO2 vertical column density, and zt is the tropopause height. w(z) is computed with radiative transfer modeling and, in clear skies, is 3–4 times higher in the upper troposphere than in the boundary layer because of atmospheric scattering (Martin et al., 2002). Here we use scattering weights from the NASA OMI NO2 retrieval (v4.0; Lamsal et al., 2021) and exclude scenes with cloud fraction greater than 0.1 and surface albedo greater than 0.3.
We use Eq. (6) to calculate AMFs corresponding to PSS and GEOS-Chem NO2 profiles for SEAC4RS and DC3. AMFG over the southeastern U.S. in summer for OMI is about 2.6. The shape factors are calculated by converting the NO2 concentration profiles (Fig. 1) to number density profiles and normalizing them to the respective NO2 columns. For SEAC4RS, both the PSS and GEOS-Chem NO2 profiles yield an AMF of 1.0, reflecting the similar shapes of the NO2 profiles despite the GEOS-Chem overestimate of the NO2 concentrations. For DC3, the AMFs corresponding to the PSS and GEOS-Chem profiles are 0.91 and 1.03, respectively. These results suggest that using the GEOS-Chem NO2 profiles as a priori in the NO2 column retrievals over the southeastern U.S. would result in an error of 0 %–10 %, compared to the previous error estimate of 30 % based on the LIF NO2 measurements in SEAC4RS (Silvern et al., 2018). The sensitivity of satellite retrievals to NO2 vertical profiles is discussed further in Sect. 3.5.
3.2 NOx in the remote troposphere: interpreting the ATom data
We now examine the distribution of NOx over the Pacific and Atlantic oceans during the ATom campaign in order to contrast the NO2 profiles in the remote troposphere to the SEAC4RS and DC3 NO2 profiles over land. Modeled NO2 over remote regions is often used in the stratospheric–tropospheric separation of satellite NO2 columns (Bucsela et al., 2013). NOx in the remote troposphere is also important for global tropospheric ozone and OH production. Figures 3 and 4 show the median vertical profiles of NO and the PSS NO2 concentrations over the Pacific and Atlantic oceans separated by seasons and latitude bands. The PSS NO2 concentrations in Fig. 4 are inferred from the ATom observations of NO, ozone, HO2, and using Eqs. (2) and (3). The observed NO concentrations increase from 10 pptv near the surface to 20–100 pptv in the upper troposphere above 8 km because of the longer NOx lifetime and the increase in NO NO2 ratios with altitude. The PSS NO2 profiles show a decrease in NO2 concentrations with altitude because of the increase in NO NO2 ratios. PSS NO2 concentrations in the upper troposphere are generally lower than 10 pptv, except in the northern midlatitudes in August and October, where NO2 concentrations increase in the upper troposphere. The upper tropospheric NOx concentrations over the Atlantic in August are similar to those observed over the southeastern U.S. during SEAC4RS and DC3 and reflect the transport of lightning-generated NOx from the U.S. to the Atlantic Ocean (Crawford et al., 2000; Cooper et al., 2006; Singh et al., 2007). There is little seasonal variation in NOx below 8 km. The column density for PSS NO2 has a campaign median of 1.7 × 10¹⁴ molec. cm−2 and a range of 1.2–3.0 × 10¹⁴ molec. cm−2 for the different seasons and latitude bands, which is similar in magnitude to NO2 columns retrieved from OMI observations over remote regions (Hains et al., 2010; Lamsal et al., 2021). The free tropospheric PSS NO2 column density over the northern Atlantic (30–60∘ N) in August is 2.1 × 10¹⁴ molec. cm−2, which is about 45 % lower than that observed in SEAC4RS and DC3.
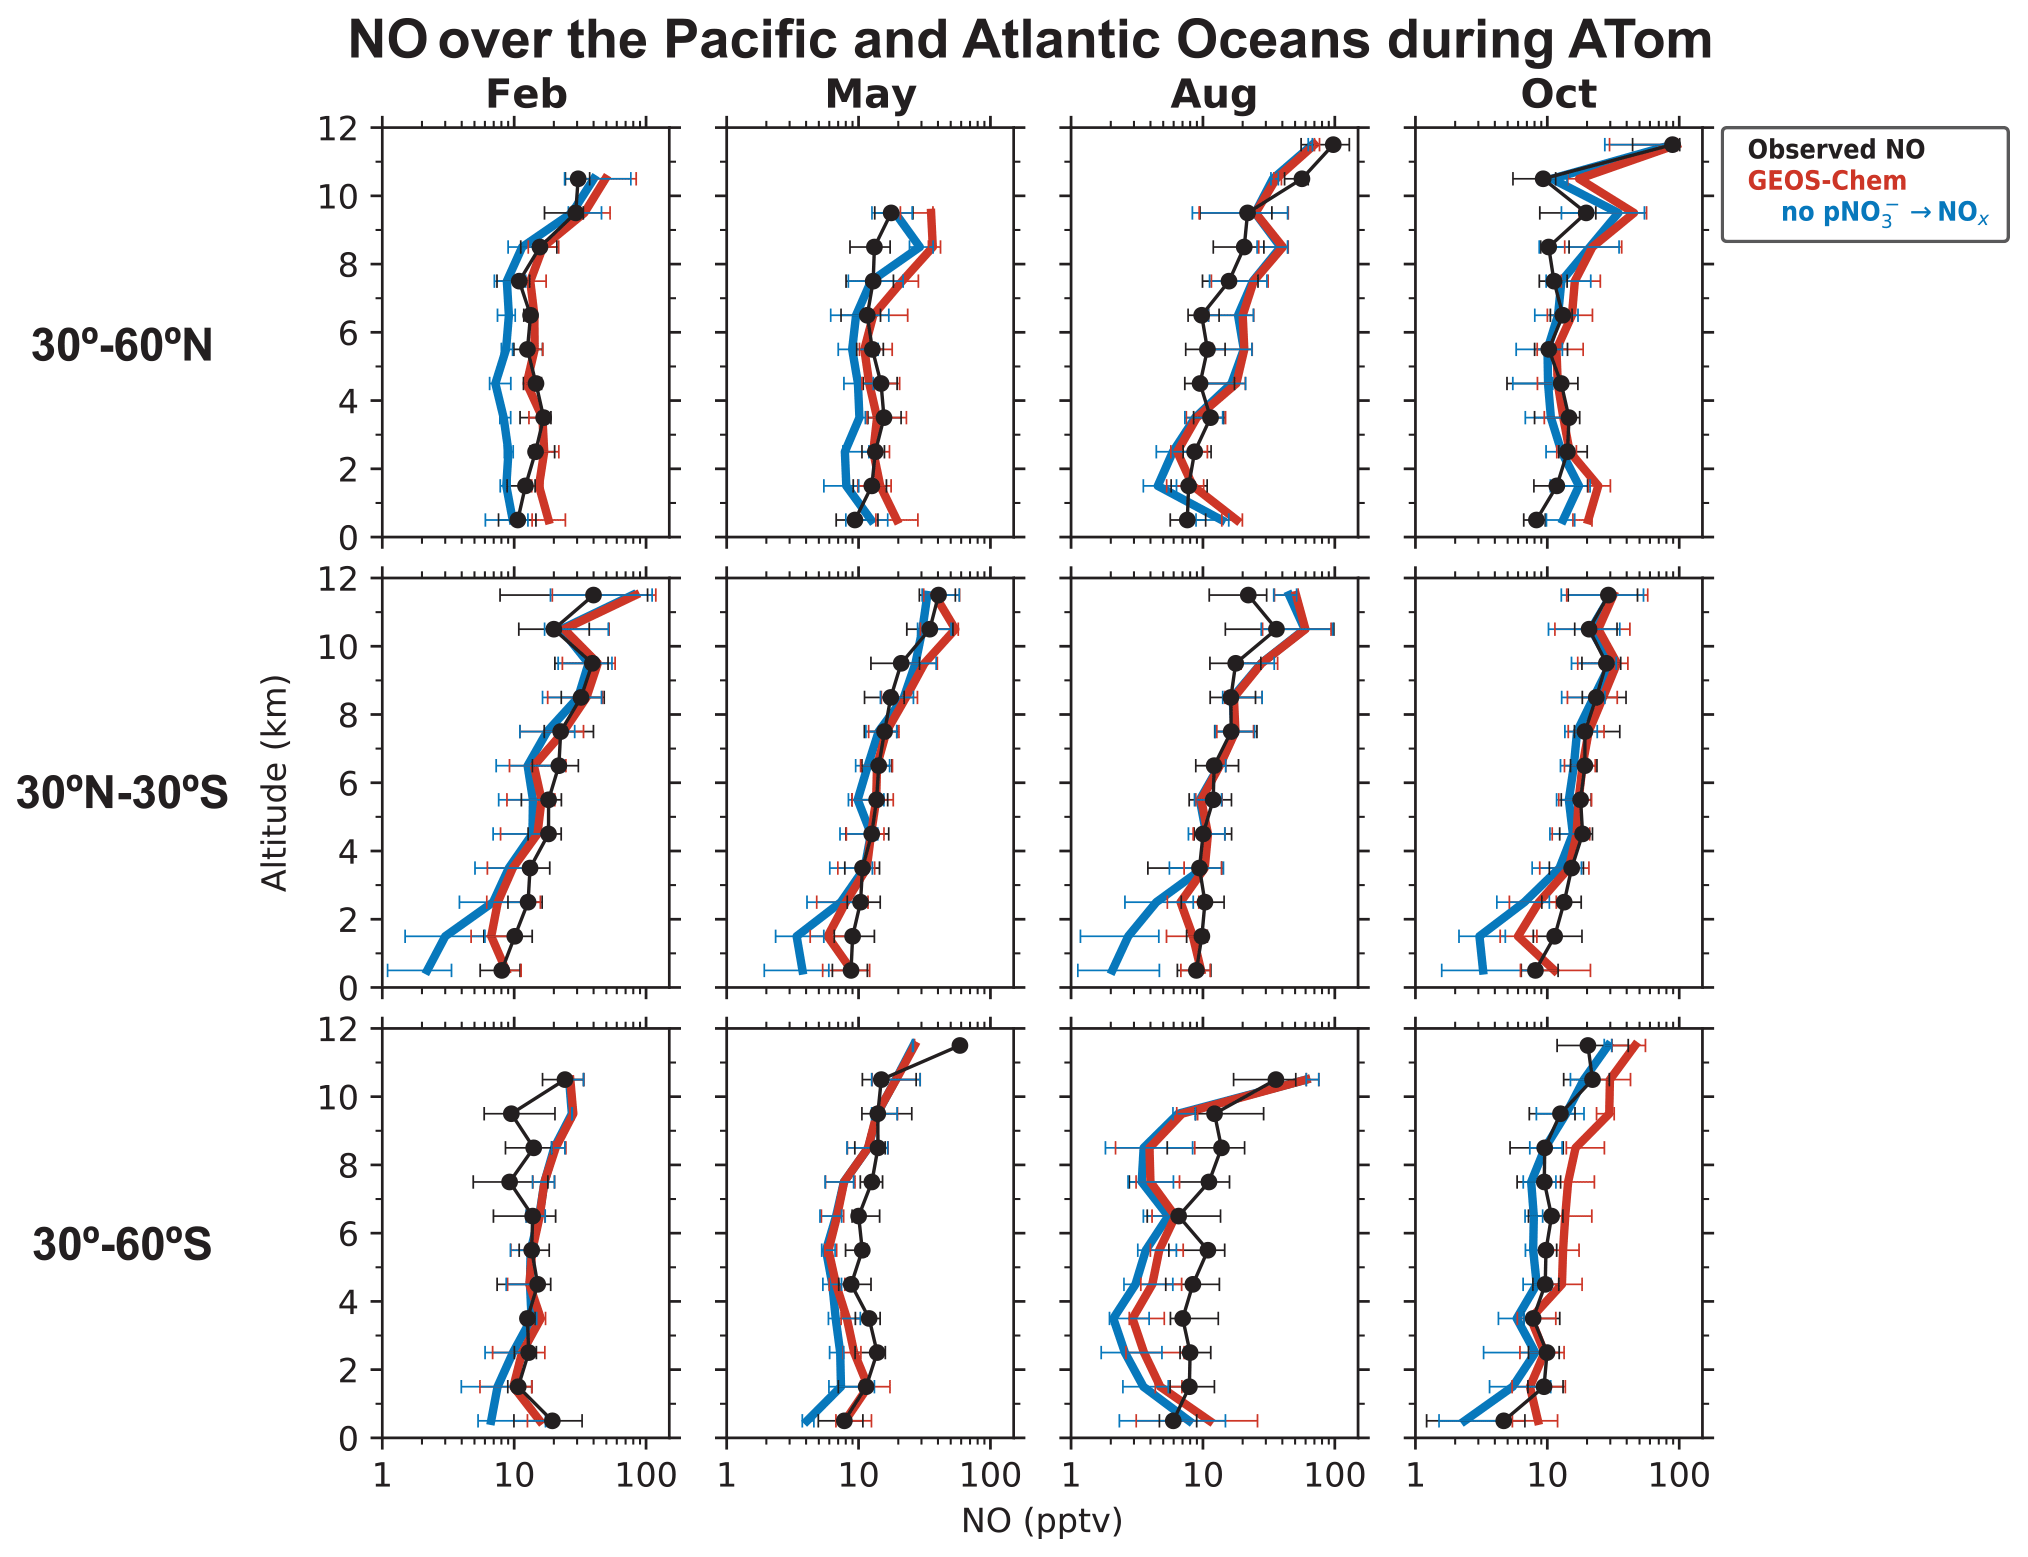
Figure 3Median vertical profiles of NO concentrations over the Pacific and Atlantic oceans during the ATom flight campaigns (2016–2018), separated by seasons and latitude bands. Observations (black) are from the NOAA P-CL instrument. The data selection criteria are as described in the caption of Fig. 1. Horizontal bars show the interquartile ranges in 1 km altitude bins. Model results are from our baseline GEOS-Chem simulation and a sensitivity simulation without pNO photolysis. The model is sampled along the flight tracks. NO concentrations are plotted on a log scale to show the values in the lower troposphere clearly.
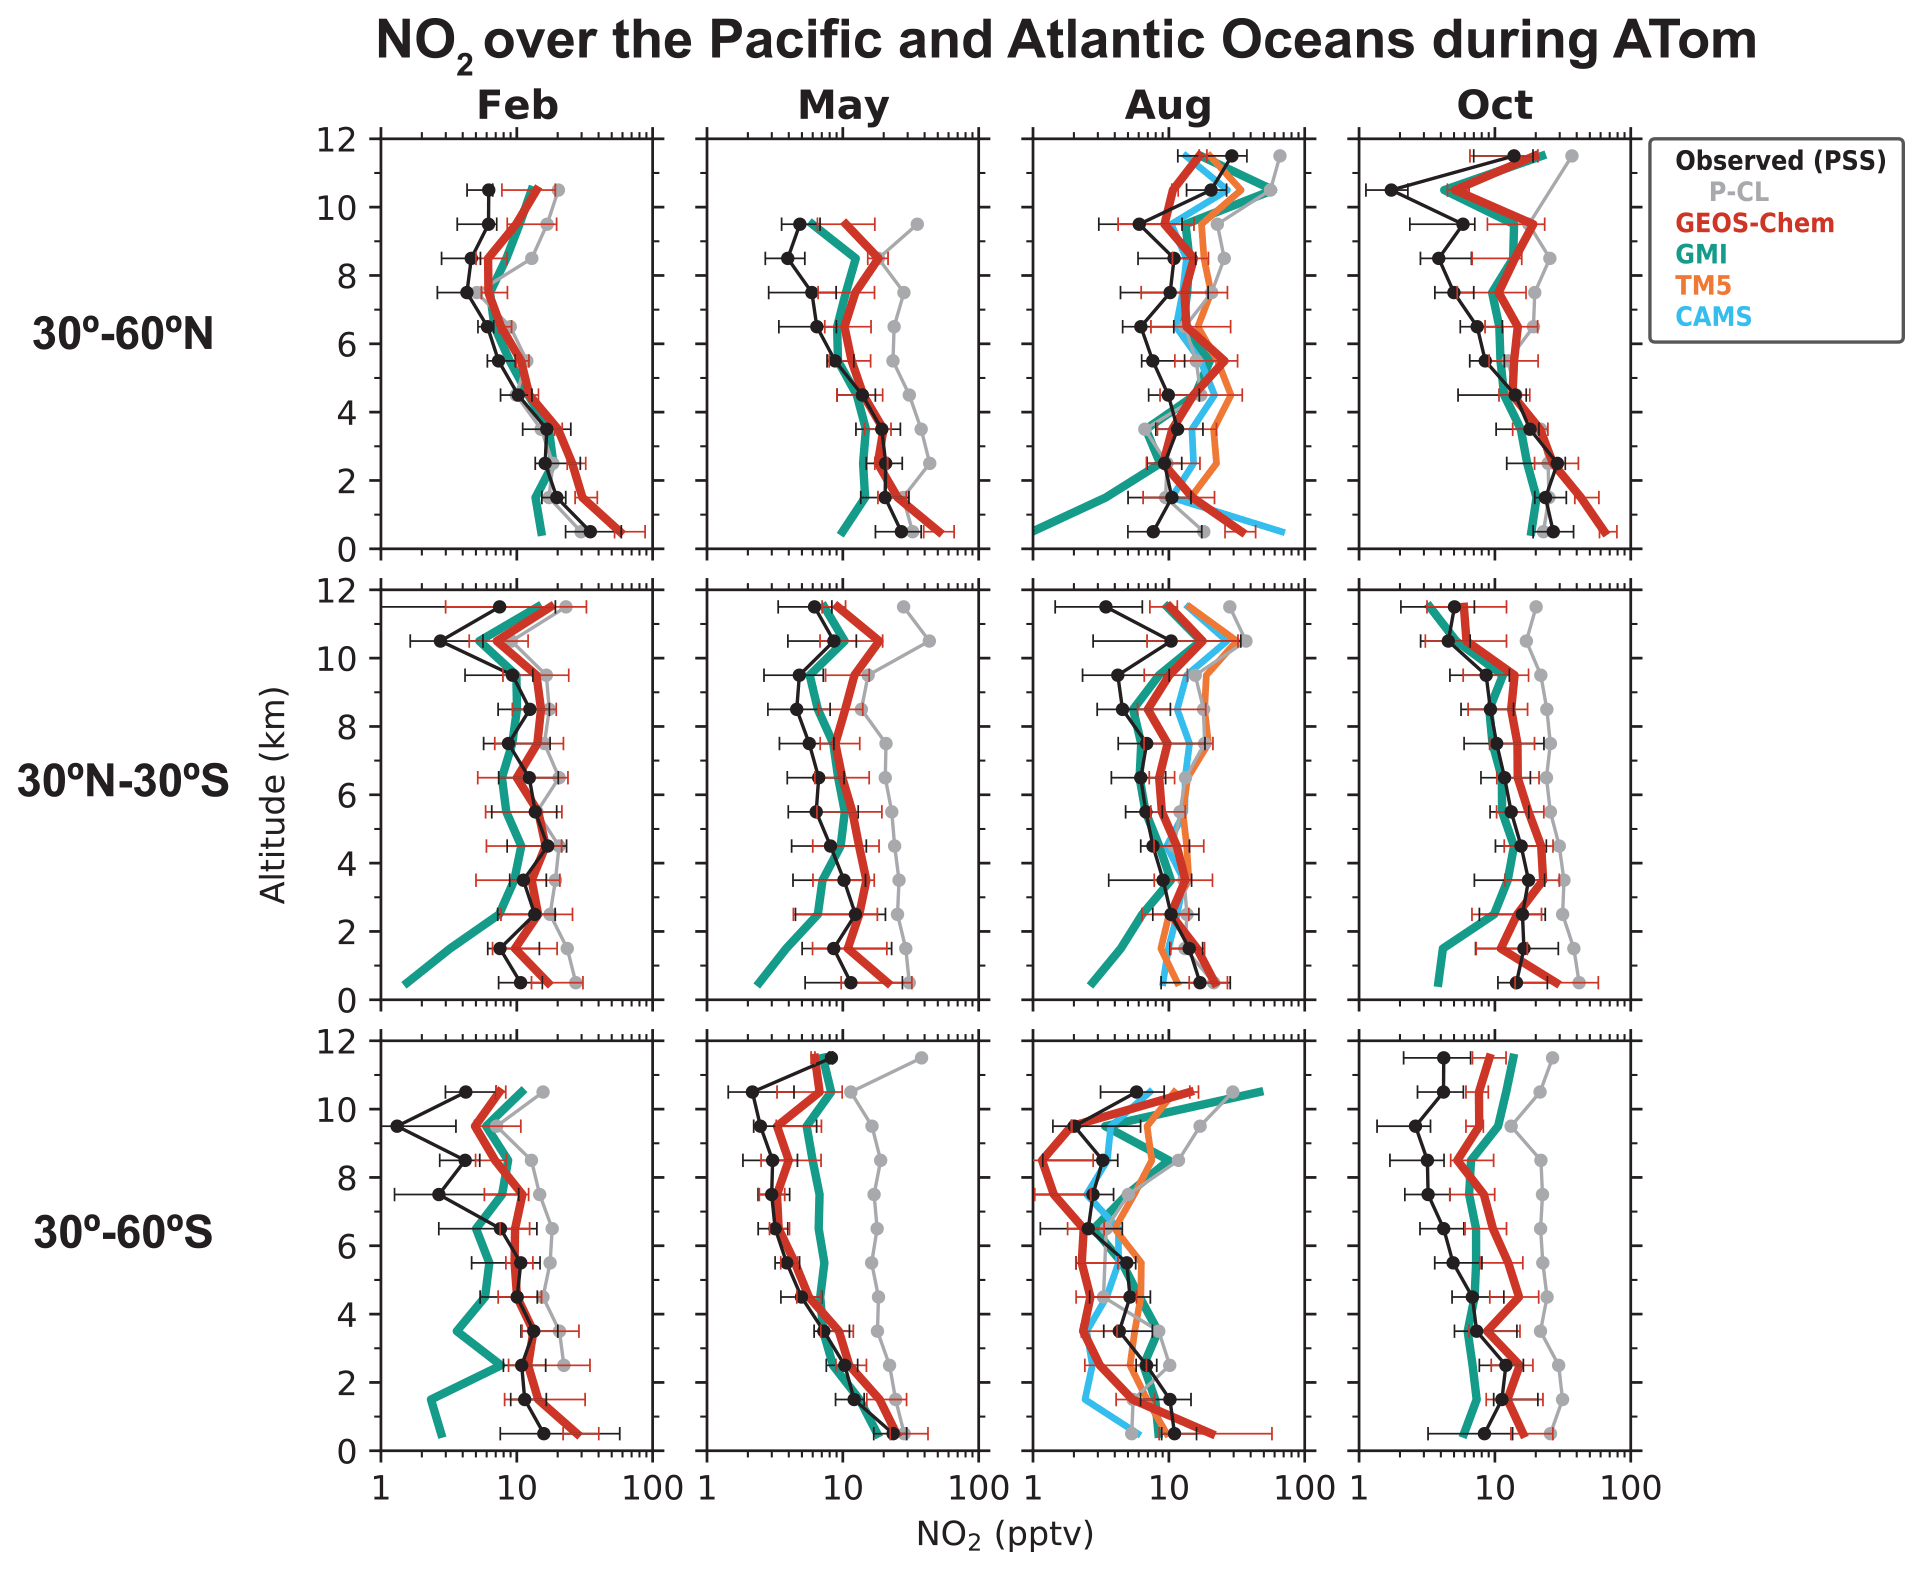
Figure 4Median vertical profiles of NO2 concentrations over the Pacific and Atlantic oceans during the ATom flight campaigns (2016–2018), separated by seasons and latitude regions. Observations are based on the photochemical steady state (PSS) with local measurements of NO concentrations and other quantities, following Eqs. (2) and (3). Horizontal bars show the interquartile ranges in 1 km altitude bins. The data selection criteria are as described in the caption of Fig. 1. NO2 measurements from the P-CL instrument are also shown for reference. Model results are from our baseline GEOS-Chem simulation (including pNO photolysis), GMI, TM5, and CAMS, which are sampled along the flight tracks. The TM5 and CAMS NO2 profiles are available only for August. NO2 concentrations are plotted on a log scale. For clarity, the interquartile ranges for the GMI, TM5, and CAMS profiles are shown separately in Fig. S2.
Figure 3 compares the NO observations to results from our baseline GEOS-Chem simulation and from a sensitivity simulation without the NOx source from pNO photolysis. The GEOS-Chem simulation without pNO photolysis underestimates NO observations below 6 km by a factor of 2–5 in most cases. The underestimate does not extend to the upper troposphere, so it cannot be attributed to errors in lightning or aircraft NOx emissions. The underestimate is not related to NOx recycling from HNO3, PAN, or alkyl nitrates either. GEOS-Chem generally overestimates ATom HNO3 observations (Fig. S1 in the Supplement; Travis et al., 2020; Luo et al., 2020). The model is consistent with the ATom observations of PAN in the tropics and southern midlatitudes and underestimates it a little in the northern midlatitudes (Fig. S1). GEOS-Chem simulation of methyl, ethyl, and propyl nitrates is generally consistent with the ATom observations (Fisher et al., 2018). Fisher et al. (2018) also considered whether missing oceanic NO emissions in the model could explain the underestimate in NO in the MBL. This source is largely limited to the equatorial region and is estimated to be about 108 molec. cm−2 s−1 (Torres and Thompson, 1993; Tian et al., 2020), which is 100 times smaller than that would be required to correct the NO underestimate in the model. The NOx sink from reaction with OH is not overestimated in the model either, considering that GEOS-Chem's OH concentrations are consistent with ATom observations (Travis et al., 2020). There is some uncertainty in the NO2 + OH + M → HNO3 + M rate constant used in models, as reported in laboratory (Mollner et al., 2010; Burkholder et al., 2020) and field studies (Henderson et al., 2011; Seltzer et al., 2015; Nault et al., 2016), but it is not large enough to explain the NO underestimate. The representation of heterogenous NOx chemistry in the model reflects current knowledge and includes an empirical parameterization for the N2O5 reaction probability derived from aircraft observations (Jaeglé et al., 2018; McDuffie et al., 2018; Holmes et al., 2019). These processes are not well constrained, but they are important mainly in the extratropical latitudes in winter and spring (Alexander et al., 2020).
Recent studies suggest that photolysis of pNO could be much faster than photolysis of gas-phase HNO3 and contribute an important source of NOx over the oceans (Ye et al., 2016; Reed et al., 2017; Kasibhatla et al., 2018). pNO photolysis produces NO2 and HONO (Scharko et al., 2014; Ye et al., 2017b), and HONO photolyzes further to produce NO, as follows:
In a bulk solution, the absorption cross section of NO is about 100 times larger than that of HNO3 (Burley and Johnston, 1992), but the effective quantum yields for Reactions (R9a) and (R9b) are low (∼ 1 %; Warneck and Wurzinger, 1988; Benedict et al., 2017) because the products are surrounded by water molecules and recombine before they can escape to the gas phase (Nissenson et al., 2010; Richards-Henderson et al., 2015). However, the photolysis of NO on aerosols is thought to be much more efficient than that in the gas and bulk aqueous phases. Field studies trying to explain the observed HONO and NOx concentrations over the oceans postulate enhancement factors (EFs) for the pNO photolysis rate relative to that of HNO3 of 10–500 (Ye et al., 2016, 2017a; Reed et al., 2017; Kasibhatla et al., 2018; Zhu et al., 2022; Andersen et al., 2023). Similar EFs have also been observed in laboratory studies of photolysis of pNO in ambient aerosols from urban and remote areas (Ye et al., 2017b; Bao et al., 2018; Gen et al., 2019). The high EFs could reflect the higher absorption cross sections and quantum yields for NO molecules at the surface of the particles (Zhu et al., 2008, 2010; Du and Zhu, 2011; Nissenson et al., 2010). The fraction of NO at the surface is larger in the presence of halides, as found in sea salt aerosols (Wingen et al., 2008; Richards-Henderson et al., 2013; Zhang et al., 2020). Other factors that could contribute to higher EFs include high aerosol [H+] (Scharko et al., 2014; Mora Garcia et al., 2021) and the presence of organic species that can act as photosensitizers, H donors, electron donors, or promote secondary reactions (Ye et al., 2019; Mora Garcia et al., 2021). Laboratory studies on NaNO3 and NH4NO3 particles find EFs of less than 10 (Shi et al., 2021), suggesting that aerosol composition is an important factor in the photolysis rate of pNO. The relative yields of HONO : NO2 in Reactions (R9a) and (R9b) also vary substantially in laboratory results. Ye et al. (2017b) found relative yields for HONO : NO2 ranging from 1 : 1 to 30 : 1, with lower values for marine aerosol samples and higher values for urban samples. Bao et al. (2018) found median relative yields for HONO : NO2 of 3.5 : 1 for aerosol samples from Beijing.
Our baseline simulation assumes EFs of 10–100, depending on the relative amount of pNO and sea salt aerosols (Eq. 1), and a HONO : NO2 yield of 2 : 1, following Kasibhatla et al. (2018). Figure 5 shows the spatial distribution of EFs at the surface and as a function of altitude. The simulated EF decreases from 100 in the MBL to less than 30 over the continents, where much of the pNO is present as NH4NO3. The values over the oceans are consistent with EFs required to explain high daytime HONO concentrations (more than 10 pptv) observed over the oceans (Ye et al., 2016; Andersen et al., 2023). Kasibhatla et al. (2018) found that an EF of 100 and a HONO : NO2 yield of 15 : 1 were needed in GEOS-Chem to reproduce the observed diurnal cycle of HONO at Cabo Verde, although EFs of 25–50 and the HONO : NO2 yield of 2 : 1 were sufficient to explain the NOx observations. Romer et al. (2018) suggested an upper limit for the EF of 30, arguing that higher values would lead to inconsistency between the calculated steady state NOx HNO3 ratios and observations from seven aircraft campaigns. Most of these campaigns were over or near continents in the northern midlatitudes, where EFs in our simulation are also generally low. In the northern midlatitudes, EFs decrease with altitude, reflecting the increase in the fraction of pNO present as NH4NO3 relative to that present on sea salt aerosols. There is little change in the EFs with altitude elsewhere.

Figure 5Annual mean (2015) enhancement factors (EFs) for the photolysis frequency of pNO with respect to the photolysis frequency of HNO3 in our baseline simulation. Panel (a) shows EFs at the surface, and panel (b) shows the zonal mean EFs. The EF for fine pNO varies from 10 to 100, according to Eq. (1), and that for coarse pNO is set at 100. The values shown here are the concentration-weighted average EFs for total (fine plus coarse) pNO. The zonal mean EFs are calculated as pNO concentration-weighted averages for the band of grid cells in each altitude and latitude bin. The white shading in the zonal mean plots denotes the stratosphere.
pNO concentrations were measured by the AMS and SAGA instruments during ATom and were found to be very low (Fig. S1). The AMS measures total (inorganic and organic) nitrate in non-refractory particles smaller than 1 µm diameter, while SAGA measures water-soluble NO ions in particles smaller than about 4 µm diameter. Almost all of the nitrate measured by the AMS was organic (Nault et al., 2021; Hodzic et al., 2020; Guo et al., 2021b), and (inorganic) pNO concentrations were less than 1 ng sm−3. The median SAGA-measured pNO concentration was 44 ng sm−3. In comparison, the median pNO concentrations in GEOS-Chem were 2.1 ng sm−3 in the fine mode and 1.8 ng sm−3 in the coarse mode. GEOS-Chem overestimated the observed pNO concentrations in the northern midlatitudes (Fig. S1), likely reflecting the overestimate in HNO3 concentrations and aerosol pH compared to the ATom measurements (Travis et al., 2020; Luo et al., 2020; Nault et al., 2021), but the effect on the NOx source from pNO photolysis is dampened because the EF for fine-mode pNO photolysis decreases at higher pNO concentrations (Eq. 1). GEOS-Chem pNO concentrations are lower compared to the SAGA observations in 30∘ N–30∘ S, but much of the pNO measured there is associated with dust and probably has a lower EF than that of pNO on sea salt aerosols (Andersen et al., 2023).
Including pNO photolysis in the model significantly increases modeled NOx concentrations below 6 km and improves agreement with the NO observations (Fig. 3) and with the PSS NO2 concentrations inferred from NO observations (Fig. 4). The largest increase is in the tropics (30∘ S–30∘ N), where pNO photolysis is faster because of high actinic flux and high EFs and because the NOx source from PAN decomposition is small there (Moxim et al., 1996; Fischer et al., 2014). The effect of pNO photolysis is generally smaller above 6 km because of lower pNO concentrations, except in the midlatitudes in spring when pNO concentrations are high, and there is sufficient actinic flux. GEOS-Chem NO2 concentrations are slightly higher than the PSS NO2 concentrations in the upper troposphere because of higher NO concentrations and higher ozone concentrations driving down the NO NO2 ratios in the model. The ozone concentrations in the upper troposphere in the model are, on average, 20 ppbv higher than the ATom observations. Travis et al. (2020) had also reported a similar overestimate in ozone concentrations in GEOS-Chem in the upper troposphere for ATom.
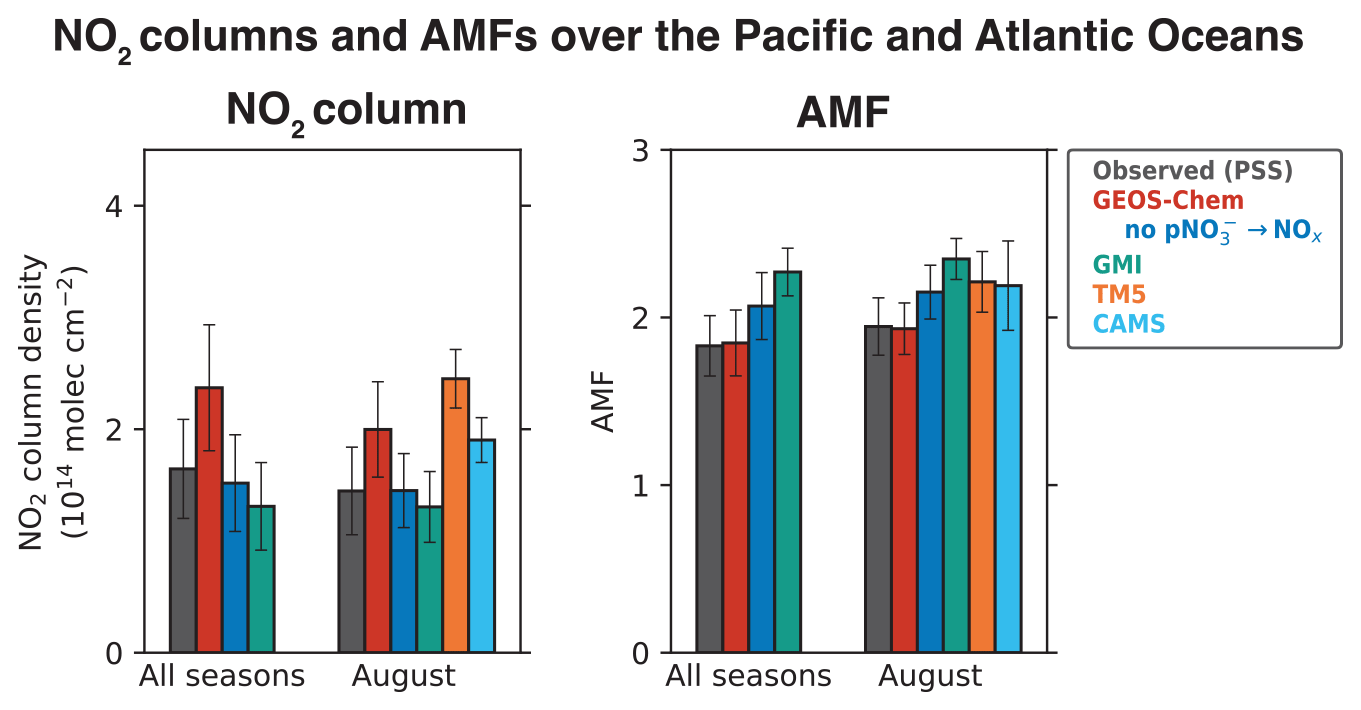
Figure 6Tropospheric NO2 column densities and NO2 air mass factors (AMFs) over the Pacific and Atlantic oceans during ATom. The observed values are based on the median NO2 vertical profiles calculated using the photochemical steady state (PSS) with local measurements of NO concentrations and other quantities following Eqs. (2) and (3). Model results are from our baseline GEOS-Chem simulation, GEOS-Chem simulation without pNO photolysis, and GMI, TM5, and CAMS sampled along the flight tracks. Values shown are medians for all four ATom deployments and for the August deployment, as the TM5 and CAMS NO2 profiles are available only for August. AMFs are calculated using the NASA OMI NO2 v4.0 scattering weights, following Eq. (6), with geometric AMF (AMFG) values of 2.6 for 30∘ S–30∘ N and 3.7 for 30–60∘ S and 30–60∘ N. Error bars show the standard deviations of the medians and are calculated using jackknife resampling.
Figure 4 also shows the NO2 profiles simulated by the GMI, TM5, and CAMS models, and Fig. 6 compares the NO2 column density and AMFs for the PSS and the modeled NO2 profiles. The TM5 and CAMS results are available only for August, so the NO2 column density and AMFs for August are shown separately. The NO2 column densities and AMFs are calculated from the median PSS and modeled NO2 profiles for the campaign, with the AMF calculation further assuming AMFG values of 2.6 for tropics (0–30∘) and 3.7 for midlatitudes (30–60∘), and a scattering weight profile from the NASA OMI NO2 retrieval (v4.0) for scenes with cloud fraction < 0.1 and surface albedo < 0.3. The campaign median (all seasons) NO2 column density is 2.4 × 10¹⁴ molec. cm−2 in our baseline GEOS-Chem simulation compared to 1.7 ± 0.44 × 10¹⁴ molec. cm−2 for PSS NO2, and the corresponding AMFs are about equal (1.8). The NO2 column density in the simulation without pNO photolysis is 1.5 × 10¹⁴ molec. cm−2. GMI NO2 concentrations are much lower than the PSS NO2 concentrations below 4 km, similar to the GEOS-Chem simulation without the pNO photolysis source, and generally higher than the PSS NO2 concentrations in the upper troposphere. The campaign average NO2 column density in GMI is 1.4 × 10¹⁴ molec. cm−2, and the AMF is 2.2. GMI NO2 concentrations are consistent with PSS NO2 in the northern midlatitudes in February and in the southern midlatitudes in August, even though GMI does not include NOx formation from pNO photolysis. This is likely because GMI does not include NOx loss through the hydrolysis of NO3 and N2O5 in clouds (Holmes et al., 2019) or the formation of halogen nitrates (Wang et al., 2021). The TM5 and CAMS models slightly overestimate the PSS NO2 columns. Overall, the difference in NO2 column densities among the four models is ∼ 1 × 10¹⁴ molec. cm−2. In comparison, the uncertainty in the NO2 retrievals from using modeled NO2 tropospheric columns over clean areas for stratosphere–troposphere separation is estimated to be 2 × 10¹⁴ molec. cm−2 (Bucsela et al., 2013; Boersma et al., 2018). The difference among the models in the AMFs is ∼ 20 %, which is higher than the assumed uncertainty of 10 % in the QA4ECV NO2 column retrievals associated with the a priori profiles (Boersma et al., 2018). The uncertainty associated with NO2 spectral fitting and stratosphere–troposphere separation in remote regions is large for single-pixel retrievals (∼ 100 %), but this reduces when averaging spatially and temporally (Boersma et al., 2018).
3.3 Effect of pNO photolysis on global NOx, OH, and ozone concentrations
Figure 7 shows the change in the annual mean NOx, OH, and ozone concentrations at the surface and zonally between our baseline simulation and the sensitivity simulation without pNO photolysis. pNO photolysis increases NOx, OH, and ozone tropospheric masses in the model by 9 %, 19 %, and 10 %, respectively, but there are much larger changes in certain areas (Fig. 7). In comparison, Kasibhatla et al. (2018) found increases in the NOx, OH, and ozone tropospheric masses of 1 %–3 % in simulations that included photolysis of only coarse-mode pNO at an EF of 100 and increases of 3 %–6 % when fine-mode pNO photolysis was also included at an EF of 25. We find that NOx concentrations increase by a factor of 2 on average in the MBL, though there is little increase in the northern extratropical MBL as the PAN concentrations are high (Fig. S1) and provide the main source of NOx in the region. There is little change in surface NOx concentrations over continents, as local emissions dominate the NOx source. NOx concentrations decrease slightly over some regions because the increase in OH concentrations resulting from HONO photolysis shortens the NOx lifetime. The increase in NOx concentrations in the tropics and subtropics is limited mostly to the MBL, since pNO concentrations are low at higher altitudes. In the free troposphere of the northern midlatitudes, pNO photolysis increases NOx concentrations by just 20 % because pNO concentrations and EFs for pNO photolysis are generally low (Fig. 5). The effect of pNO photolysis is larger in spring when there is a seasonal peak in pNO concentrations in the model. There is a large increase in NOx concentrations over Antarctica, as there are few other NOx sources in the region in the model. Our simulations do not include snow NO photolysis, which is an important source of NOx in the region (Zatko et al., 2016).
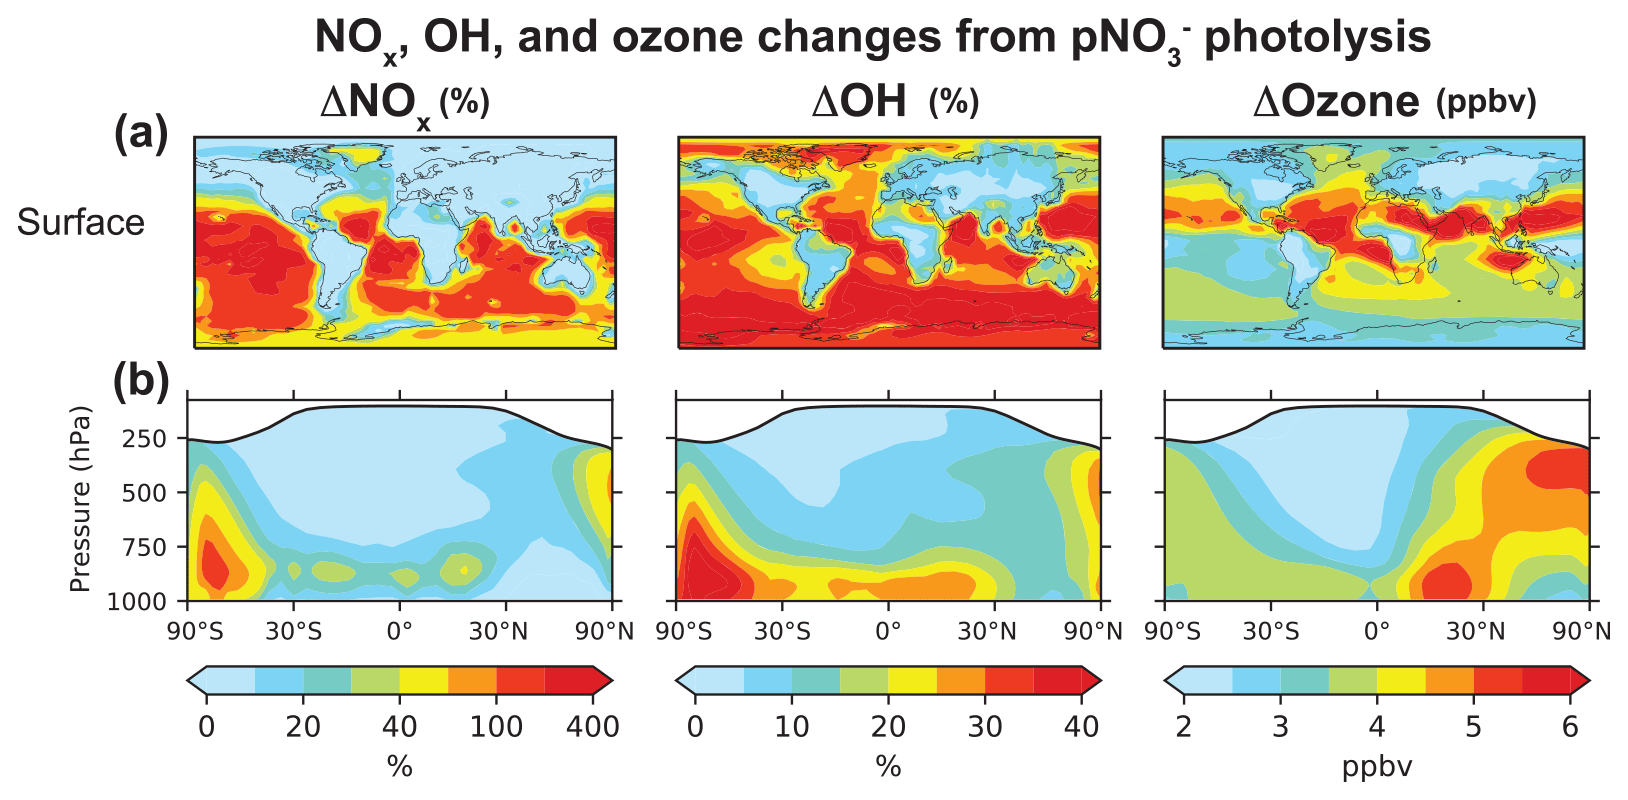
Figure 7Annual mean (2015) changes in NOx, OH, and ozone concentrations from including pNO photolysis in GEOS-Chem. Panel (a) shows changes at the surface, and panel (b) shows the zonal means. Changes in NOx and OH are shown as percent change in concentrations in our baseline simulation relative to that in the sensitivity simulation without pNO photolysis, and changes in ozone are shown as differences in concentrations (in ppbv) between the two simulations. The white shading in the zonal mean plots denotes the stratosphere.
pNO photolysis increases the production of OH and ozone because of the increase in NOx concentrations in low NOx regions, where OH and ozone production are most sensitive to NOx concentrations. OH is also produced by the photolysis of HONO released to the gas phase during pNO photolysis (Reaction R10), which would be an important source of OH in winter when OH production from Reaction (R6) is slow (Elshorbany et al., 2012). The increase in OH concentrations is particularly large (∼ 30 %) in the MBL. Travis et al. (2020) showed that the GEOS-Chem OH concentrations from a simulation without pNO photolysis are consistent with the ATom observations, but they also found an underestimate in the modeled OH reactivity in the lower troposphere due to missing VOCs in the model. The source of these VOCs is likely oceanic and would depress model OH (Thames et al., 2020). The OH source from pNO photolysis could then compensate for the increase in OH reactivity. The OH increase implied by pNO recycling decreases the global atmospheric methane lifetime from 8.0 to 7.0 years, reducing the agreement with the value of 9.1 ± 0.9 years inferred from the methyl chloroform proxy (Prather et al., 2012), but, again, this could be compensated by an increase in the model OH reactivity (Travis et al., 2020; Kim et al., 2022).
pNO photolysis increases surface ozone concentrations by 3.6 ± 0.94 ppbv on average at the surface and up to 8 ppbv in the tropics and subtropics. In the northern extratropics, the ozone increase is small at the surface but about 5 ppbv in the free troposphere, reflecting the spatial pattern of increase in NOx concentrations. Wang et al. (2021) recently evaluated the GEOS-Chem ozone simulation with ozonesonde observations and found an underestimate in simulated free tropospheric ozone of 5–15 ppbv in the Northern Hemisphere and up to 5 ppbv in the Southern Hemisphere, depending on whether halogen chemistry was included or not. Including the NOx source from pNO photolysis improves GEOS-Chem's ozone simulation. We will examine this further in a future publication.
3.4 Primary sources of NOx in the free troposphere
NOx in the free troposphere originates from diverse primary sources with differing spatial and seasonal characteristics. The sources include in situ emissions from lightning and aircraft, uplifting of NOx emitted from surface sources, and downwelling of stratospheric NOy produced from the photolysis of N2O. Lightning is the main in situ source of NOx in the free troposphere globally (Table 2), but it is concentrated over continents and has a strong seasonality in the midlatitudes. Aircraft emissions are largest in the northern midlatitudes, and while most of the aircraft emissions are over land, there are significant emissions over the northern Atlantic and Pacific oceans (Simone et al., 2013). Surface emissions are widely distributed over the tropics and the northern midlatitudes, but their transport to the free troposphere would vary seasonally. Here we use GEOS-Chem to determine the relative importance of these primary sources for NOx in the free troposphere.
Figure 8 shows the vertical profiles of NOx over the Pacific and Atlantic oceans and the contiguous U.S. for February and August separately for surface emissions (fuel combustion, fires, and soils and fertilizer use), aircraft emissions, and lightning emissions. We focus on the tropospheric sources and exclude the stratospheric NOy source from N2O because it is small in the global troposphere, although it could be important in the upper troposphere in the high latitudes in summer (Levy et al., 1999). The source contributions are derived from three sensitivity simulations with small (20 %) perturbation to each source in turn and are calculated as , where [NOx]0 is the NOx concentrations in the baseline simulation and [NOx]i is the NOx concentration in the sensitivity simulation i. The source contributions for the northern midlatitudes are shown separately for February and August, but for the tropics and southern midlatitudes, the February and August average is shown.
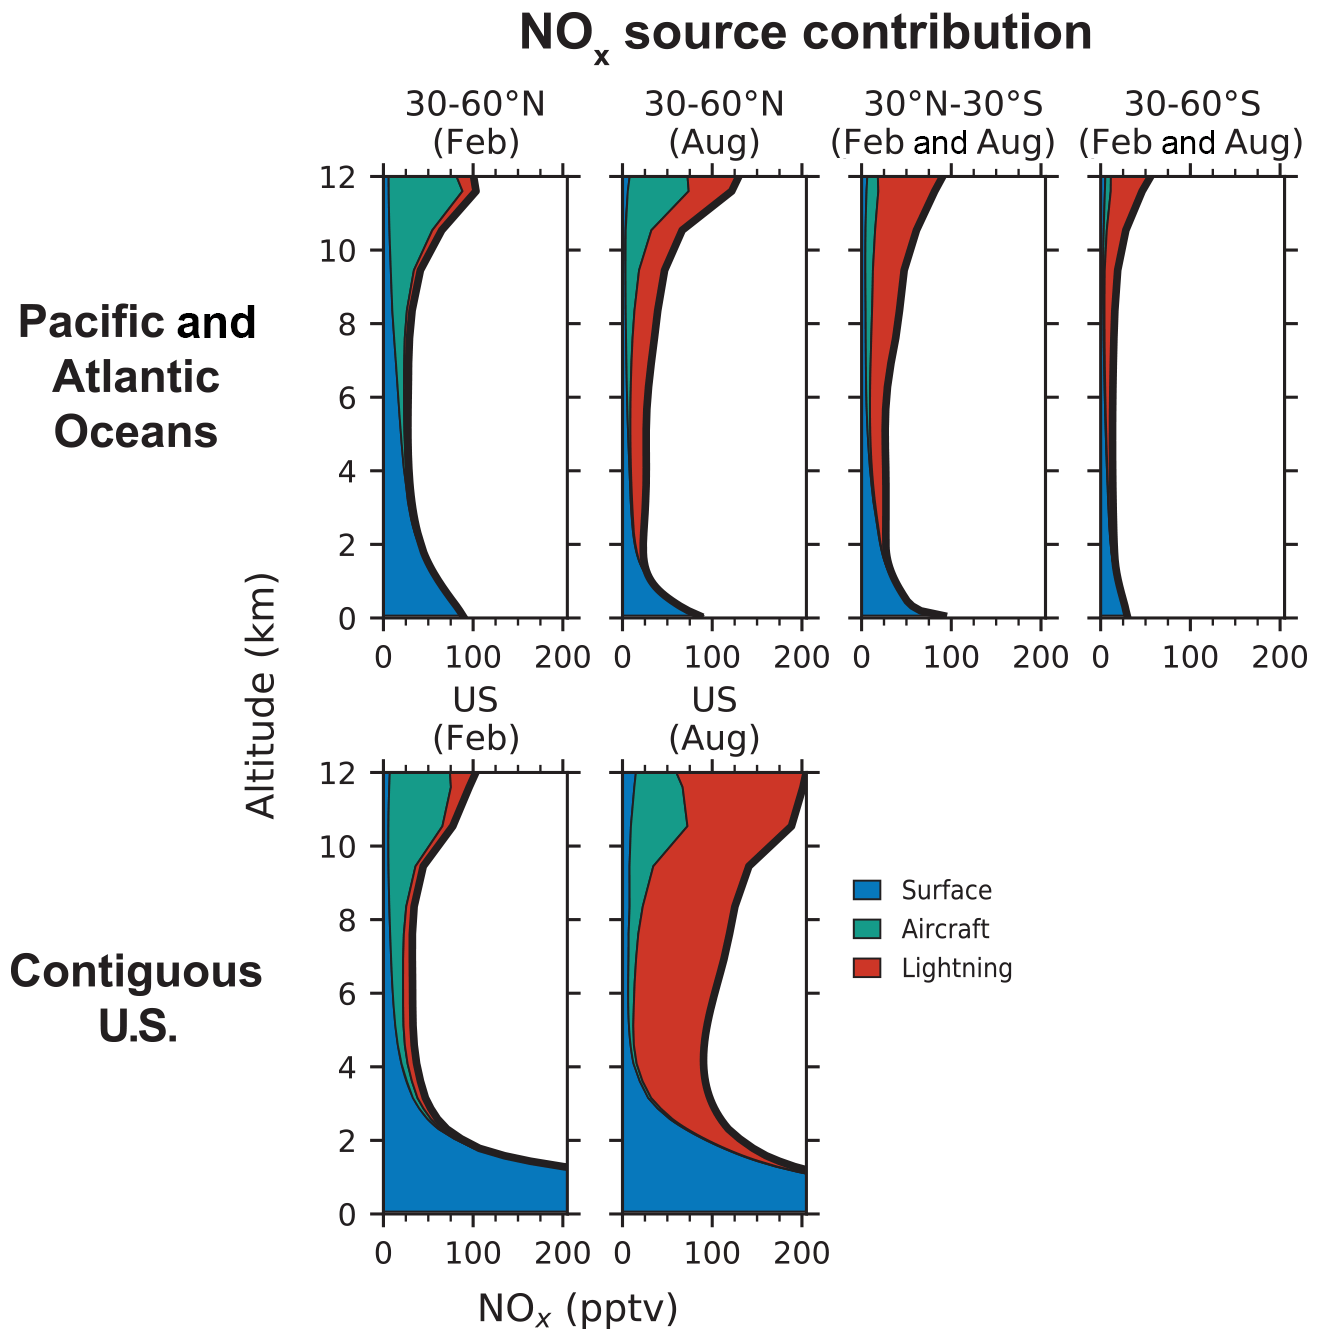
Figure 8Vertical profiles of NOx concentrations from three primary source categories over the Pacific and Atlantic oceans and over the contiguous U.S. in GEOS-Chem. The source categories include surface emissions (fuel combustion, soil, fertilizer use, and fires), aircraft emissions, and lightning emissions. The profiles for the Pacific and Atlantic oceans are means for the regions sampled in ATom (160∘ E–160∘ W and 25–50∘ W in the Northern Hemisphere and 160∘ E–160∘ W and 0–30∘ W in the Southern Hemisphere) and are separated into three latitude bands. The northern midlatitude (30–60∘ N) profiles are further separated by month (February and August), while the other profiles are averages for the 2 months. The profiles for the contiguous U.S. (defined as 25–50∘ N and 65–130∘ W) are shown separately for February and August.
Over the northern midlatitude oceans, in February, most of the NOx in the free troposphere is supplied by surface and aircraft sources. Both sources contribute equally (42 %) to the free tropospheric NOx column, but surface emissions are dominant below 6 km and aircraft emissions above 6 km. In August, lightning is the dominant source of NOx, supplying 55 % of the NOx column in the free troposphere. Aircraft emissions contribute 33 % but are the major source of NOx between 10 and 12 km. Aircraft emissions account for the higher NOx concentrations in the upper troposphere over the northern midlatitudes than over the tropics and southern midlatitudes. Lightning is the dominant source of NOx in the tropics and the southern midlatitudes, supplying 62 %–68 % of the free tropospheric NOx column, with surface sources supplying 18 %–30 % of NOx. However, Bourgeois et al. (2021) found that models tend to underestimate the contribution of biomass burning emissions to NOx over the remote oceans.
Comparing the NOx source contributions over the northern midlatitude oceans to those over the contiguous U.S., we find that the NOx sources over the two regions are similar in winter. Surface and aircraft sources each supply about 40 % of NOx in the free troposphere in February over the U.S., with surface sources dominating below 4 km and aircraft sources in the upper troposphere. In August, lightning emissions supply 73 % of the NOx in the free troposphere over the U.S., much more than in winter and over the oceans. Previous modeling studies have also found lightning to be the main source of NOx in the tropics and southern midlatitudes, and a seasonal change in the main source in the northern midlatitudes – from lightning in summer to surface and aircraft emissions in winter (Lamarque et al., 1996; Levy et al., 1999). But the contribution of aircraft emissions to free tropospheric NOx in our simulation is higher than in these previous studies, reflecting a nearly 2-fold increase in global aircraft NOx emissions in the past 3 decades (Hoesly et al., 2018).
3.5 Implications for the retrieval and interpretation of satellite NO2 data
We showed that the previously reported model underestimate of NO2 concentrations in the upper troposphere over the U.S. can be attributed to interference in the NO2 measurements and that, when compared with the measured NO and PSS NO2 profiles, the modeled NO2 profiles in the free troposphere are consistent with the SEAC4RS, DC3, and ATom observations. This increases our confidence in the modeled NO2 profiles, and here we use them to examine the importance of the free troposphere in the retrieval and interpretation of satellite NO2 data over the U.S. Figure 9 shows the GEOS-Chem vertical profiles of the NO2 number density in the early afternoon (OMI and TROPOMI overpass time) over the contiguous U.S. for the summer and winter of 2015. The results are from our baseline simulation, but there is little difference in the NO2 profiles between our baseline simulation and the simulation without pNO photolysis over the U.S. (Fig. 1), except in spring when the NO2 concentrations in the free troposphere are about 10 % higher due to the pNO photolysis source.

Figure 9Seasonal mean vertical profiles of sensitivity (scattering weights) of the OMI satellite instrument, NO2 number density, and cumulative percent contributions to tropospheric NO2 columns as would be observed by OMI over the contiguous U.S. Panel (a) shows the mean profile of the scattering weights from the NASA OMI NO2 (v4.0) retrievals averaged over summer and winter for scenes with cloud fraction < 0.1 and surface albedo < 0.3. There is little difference in the scattering weight profile between winter and summer. Panel (b) shows the afternoon NO2 profiles simulated by GEOS-Chem and GMI for summer (June, July, and August) and winter (December, January, and February) for the year 2015. The x axis is shown on a log scale. Panel (c) shows the cumulative percent contribution from NO2 at different altitudes to the tropospheric NO2 columns, as measured by OMI for summer and winter. It is calculated using Eq. (7). The shaded areas in panels (b) and (c) depict the standard deviations.
In summer, simulated NO2 partial columns in the boundary layer and the free troposphere are 6.9 × 10¹⁴ and 5.8 × 10¹⁴ molec. cm−2, respectively. In comparison, the simulated wintertime NO2 partial columns are 15.4 × 10¹⁴ and 1.9 × 10¹⁴ molec. cm−2 in the boundary layer and the free troposphere. The boundary layer NO2 column is higher in winter because of longer NOx chemical lifetimes (Kenagy et al., 2018; Shah et al., 2020) and slower ventilation to the free troposphere, while the free troposphere NO2 column is higher in summer because of lightning emissions (Fig. 7). The GEOS-Chem summertime NO2 column density in the free troposphere over the U.S. is about 3 times higher than the PSS-inferred NO2 column over the oceans during ATom. Whereas, in winter, the free tropospheric NO2 column over the U.S. is similar to that over the oceans, indicating little contrast in free tropospheric NO2 between the U.S. and surrounding oceans, as was previously discussed in the context of Fig. 8. The similarity in free tropospheric NO2 between the U.S. and the oceans in winter reflects the longer lifetime of NOx and higher pNO concentrations over the ocean. It also implies that ATom observations over the northern midlatitudes in February could be used to estimate the free tropospheric NO2 concentrations over the U.S. in winter in the absence of aircraft observations over land that probe the full height of the winter troposphere. Marais et al. (2018) had compared the GEOS-Chem NO2 concentrations at 6–10 km with those derived from the OMI cloud-sliced product (Choi et al., 2014) for 2005–2007 and found that GEOS-Chem underestimates NO2 concentrations over North America in winter by about a factor of 3. The successful simulation of the measured NO and the PSS NO2 concentrations over the northern midlatitudes in winter during ATom suggests that there is little bias in the free tropospheric NO2 concentrations in the model and that the underestimate with respect to the OMI observations likely reflects uncertainties in the cloud-slicing technique.
Figure 9b also shows the afternoon NO2 number density from the GMI model. The GEOS-Chem and GMI profiles have consistent shapes, but there are differences in the free tropospheric NO2 concentrations because of differences in NOx oxidation chemistry and lightning and aircraft NOx emissions. The NOx lifetime is longer in GMI compared to GEOS-Chem because of lower summertime OH concentrations in GMI and because GMI does not include NOx loss through the hydrolysis of NO3 and N2O5 in clouds and the formation of halogen nitrates. Both models use similar parameterizations for lightning emissions (Allen et al., 2010; Murray et al., 2012), but GMI assumes a higher NO yield over the U.S. (500 mol per flash north of 26∘ N and 250 mol per flash south of it) than GEOS-Chem (500 mol per flash north of 35∘ N and 260 mol per flash south of it). Aircraft emissions in GMI are from an older inventory (Duncan et al., 2007) with global NOx emissions of 0.56 Tg N a−1 compared to 1.2 Tg N a−1 in our simulation.
We calculate the seasonal AMFs corresponding to the GEOS-Chem and GMI NO2 profiles (Eq. 6) to determine the effect of different a priori profiles on the retrieved NO2 columns. As before, we use scattering weights from the NASA OMI NO2 retrieval (v4.0) and exclude scenes with cloud fraction greater than 0.1 and surface albedo greater than 0.3. The scattering weight profile over the U.S. is shown in Fig. 9a and shows values decreasing by a factor of 5 between the upper troposphere and the surface. The gradient is steeper than that for strictly clear-sky conditions (Martin et al., 2002). There is little seasonal difference in the scattering weight profile because scenes with high cloud fraction and bright surfaces were excluded, but AMFG is higher in winter (3.7) than in summer (2.6) because of higher solar zenith angles. In summer, the AMF calculated using the GEOS-Chem profile is 1.14 ± 0.11, compared to 1.33 ± 0.20 calculated with the GMI profile. In winter, the AMFs from the two models are nearly identical (about 1.0). The AMFs are lower in winter than in summer because of higher NO2 concentrations in winter in the boundary layer where satellite measurements are less sensitive. GEOS-Chem NO concentrations in the free troposphere were about 2 times higher than the measurements during SEAC4RS and DC3 (Fig. 1). If we decrease the GEOS-Chem NO2 number density in the free troposphere by half in summer, then the AMF decreases to 0.98. Decreasing the NO2 number density by half in the free troposphere and the boundary layer would have no effect on the AMF, since the shape factor (Eq. 6) would remain the same. Boersma et al. (2018) estimated a single-pixel uncertainty in the QA4ECV retrieval AMFs over the U.S. of 20 % in summer and 25 % in winter, attributing about half (10 %) of it to NO2 profile uncertainty and the remaining to uncertainties in surface albedo and cloud properties. However, we find that the uncertainty in AMFs from errors in the a priori NO2 profiles in summer is larger than 10 %.
Figure 9c shows the cumulative contribution from different altitudes to the tropospheric NO2 columns, as would be measured by OMI. It is calculated as follows:
where Γ(z) is the percent contribution to the tropospheric NO2 column from NO2 at and above altitude z, zt is the tropopause altitude, and w(z) and n(z) are the vertical profiles of scattering weight and NO2 number density. The contribution of the free troposphere to NO2 columns is significantly higher in summer than in winter. In summer, the free troposphere contributes 65 ± 9 % of the tropospheric NO2 column over the U.S. in GEOS-Chem (75 ± 10 % in GMI), whereas in winter, 75 ± 11 % of the NO2 column resides below 2 km. The free tropospheric contribution decreases to 55 % if we halve the GEOS-Chem NO2 column in the free troposphere in summer. Travis et al. (2016) had also calculated a free troposphere contribution of 70 %–75 % from the GEOS-Chem NO2 profiles in SEAC4RS.
The large contribution of the free troposphere to NO2 columns affects the interpretation of satellite data in terms of NOx emissions. It greatly diminishes the sensitivity of the summertime NO2 columns to changes in surface NOx emissions over the U.S. The free tropospheric contribution would be relatively smaller over major cities, where summertime NO2 columns exceed 3 × 10¹⁵ molec. cm−2 (Lamsal et al., 2021), but it still needs to be accounted for. Urban NOx emissions and their trends are commonly derived by fitting an exponential decay function to satellite NO2 columns downwind of the source (e.g., Beirle et al., 2011; Lorente et al., 2019; Goldberg et al., 2021). The fitting function includes a background offset term and thus implicitly accounts for the free tropospheric contribution. The free tropospheric contribution is also accounted for when models that include lightning and aircraft NOx emissions are used to relate NO2 columns to NOx emissions, but there is substantial uncertainty in the magnitude and distribution of lightning NOx emissions (Schumann and Huntrieser, 2007; Murray, 2016), which is the main source of NO2 in the free troposphere in summer. Missing organic NOx chemistry in summer would also contribute to model errors in the free tropospheric NO2, as suggested by our SEAC4RS and DC3 analysis. Wintertime NO2 columns will respond more strongly to changes in NOx emissions, but the uncertainty in the NO2 retrievals associated with surface albedo and clouds is larger in winter (Boersma et al., 2018). Better observational constraints on free tropospheric NO2 concentrations are needed.
We used aircraft measurements from the SEAC4RS, DC3, and ATom campaigns to evaluate the vertical distribution of NOx in the free troposphere in the GEOS-Chem, GMI, TM5, and CAMS atmospheric chemistry models in the context of their use for retrieval and interpretation of satellite NO2 column measurements. We first examined the accuracy of the in situ NO2 measurements in the upper troposphere using observations made in a thunderstorm outflow during the DC3 campaign. We found that the laser-induced fluorescence (LIF) and the photolysis–chemiluminescence (P-CL) NO2 measurements were significantly higher than the NO2 concentrations calculated using the NO measurements and the NO–NO2 photochemical steady state (PSS) and that the ozone production expected based on these NO2 measurements was much higher than the observed ozone production. This indicates a positive interference in the NO2 measurements, presumably from dissociation of non-radical NOy species such as HNO4 and methyl peroxy nitrate (MPN), even though the LIF measurements include a correction for the thermal dissociation of MPN. The underestimate in modeled NO2 concentrations relative to the LIF measurements in the upper troposphere reported previously (Travis et al., 2016; Silvern et al., 2018) is likely due to the interference in the NO2 measurements. There is a need to improve NO2 measurements in the free troposphere. At present, NO2 concentrations inferred by applying PSS to NO and other measurements provide a better estimate of free tropospheric NO2 than the direct measurements, and we use them as basis for evaluating the models.
GEOS-Chem reproduces the shapes of the vertical profiles of the NO observations and the PSS-inferred NO2 concentrations during SEAC4RS and DC3 over the southeastern U.S. in summer. The NO2 air mass factors (AMFs) calculated using the measured (PSS) and the GEOS-Chem NO2 vertical profiles combined with scattering weights from the NASA OMI NO2 v4.0 retrievals differ by less than 10 %. However, GEOS-Chem overestimates NO2 concentrations in the free troposphere for SEAC4RS and DC3 by about a factor of 2 and underestimates concentrations of MPN and alkyl nitrates, suggesting missing organic NOx chemistry in the model that needs further examination.
The NO concentrations measured over the Pacific and Atlantic oceans were reproduced by GEOS-Chem when pNO photolysis was included in the model with photolysis frequencies 10–100 times higher than that of gas-phase HNO3, as suggested by laboratory studies of pNO photolysis and field studies of HONO sources in the marine atmosphere (Ye et al., 2016, 2017b; Andersen et al., 2023). The median NO2 column density for the ATom campaign was 1.7 ± 0.44 × 10¹⁴ molec. cm−2 for the observed PSS NO2 concentrations and 2.4 × 10¹⁴ molec. cm−2 for GEOS-Chem with pNO photolysis and 1.5 × 10¹⁴ molec. cm−2 without. The NO2 column density for the GMI, TM5, and CAMS models was between 1.4 and 2.5 × 10¹⁴ molec. cm−2, and the NO2 AMFs calculated using the PSS NO2 profiles and the simulated NO2 profiles differed by less than 20 %. We conclude that model errors in the tropospheric NO2 profiles over the remote oceans are not a major source of uncertainty in the satellite NO2 retrievals. We calculated the contribution of surface, aircraft, and lightning emissions to NOx columns over the Pacific and Atlantic oceans and over the U.S. in GEOS-Chem and found that lightning is the main NOx source over the tropics and southern midlatitudes and over the U.S. in the summer, contributing 62 %–73 % of the NOx columns in the free troposphere. However, aircraft emissions are the main source of free tropospheric NOx in the northern midlatitudes in winter and in summer over the oceans.
pNO photolysis increases the global tropospheric mass of NOx, OH, and ozone in GEOS-Chem by 9 %, 19 %, and 10 %, respectively. NOx concentrations increase most in the tropical MBL where NOx sources from PAN are small. There is a small increase in NOx concentrations in the free troposphere over the continents, particularly in spring when the pNO concentration is highest. The increase in OH concentrations would degrade the model performance relative to OH measurements in ATom, but the ATom observations also indicate an underestimate in the modeled OH reactivity in the lower troposphere (Travis et al., 2020), implying missing OH sinks in the model. pNO photolysis increases ozone concentrations by up to 8 ppbv at the surface in the tropics and subtropics and by 5 ppbv in the free troposphere over the northern extratropics, which would largely correct the model bias relative to ozonesonde observations (Wang et al., 2021).
The seasonal GEOS-Chem and GMI afternoon NO2 profiles over the contiguous U.S. are largely consistent with each other and show higher boundary layer NO2 columns in winter than in summer because of longer NOx chemical lifetimes and slower ventilation to the free troposphere but higher free tropospheric NO2 columns in summer because of lightning emissions. In winter, the free troposphere contributes 25 ± 11 % of the NO2 columns that would be observed by satellite instruments over the contiguous U.S., but in summer this increases to 65 %–75 % and weakens the sensitivity of the summertime NO2 columns to changes in surface NOx emissions. This is less of a problem for urban areas where boundary layer NO2 columns are generally much larger than the free tropospheric columns.
The SEAC4RS aircraft measurements are available at https://doi.org/10.5067/Aircraft/SEAC4RS/Aerosol-TraceGas-Cloud (SEAC4RS Science Team, 2014), DC3 at https://doi.org/10.5067/Aircraft/DC3/DC8/Aerosol-TraceGas (DC3 Science Team, 2013), and ATom at https://doi.org/10.3334/ORNLDAAC/1925 (Wofsy et al., 2021). The GMI model results for ATom are available at https://doi.org/10.3334/ORNLDAAC/1897 (Strode et al., 2021). All other model results are available on request from the corresponding author. The GEOS-Chem 12.9.2 code is available at https://doi.org/10.5281/zenodo.3959279 (The International GEOS-Chem User Community, 2020).
The supplement related to this article is available online at: https://doi.org/10.5194/acp-23-1227-2023-supplement.
VS and DJJ designed the study and led the analysis. RD helped with interpreting the GEOS-Chem results. LNL, SAS, and SDS provided the GMI simulation results, and KFB provided the TM5 and CAMS results. SDE and TMF provided the updated AEIC inventory. CT, JP, IB, IBP, BAN, RCC, PCJ, and JLJ made the NO, NO2, NOy, ozone, and pNO measurements during the SEAC4RS, DC3, and ATom campaigns. STA, LJC, TS, and MJE helped with the pNO photolysis simulation. VS and DJJ wrote the paper, with input from all authors.
The contact author has declared that none of the authors has any competing interests.
This product/document has been created with or contains elements of the Base of Aircraft Data (BADA) Family Release which has been made available by EUROCONTROL to MIT. EUROCONTROL has all relevant rights to BADA (© 2019. The European Organisation for the Safety of Air Navigation (EUROCONTROL). All rights reserved. EUROCONTROL shall not be liable for any direct, indirect, incidental, or consequential damages arising out of or in connection with this product or document, including with respect to the use of BADA.
Publisher's note: Copernicus Publications remains neutral with regard to jurisdictional claims in published maps and institutional affiliations.
We are grateful to the instrument teams of the SEAC4RS, DC3, and ATom campaigns for making their data freely available. We thank Tom Ryerson (NOAA), for contributing to the NO, NO2, NOy, and O3 measurements in the three campaigns, and Eloïse Marais (University College London) and Sunny Choi (NASA GSFC), for helpful discussions. GMI is supported by the NASA Modeling, Analysis, and Prediction (MAP) program. GMI simulations used computational resources from the NASA High-End Computing (HEC) program through the NASA Center for Climate Simulation (NCCS). Jose L. Jimenez and Pedro Campuzano-Jost have been supported by NASA (grant no. 80NSSC21K1451).
This research has been supported by the National Aeronautics and Space Administration (grant no. 80NSSC20K0930) and the U.S. Environmental Protection Agency (grant no. 84001401).
This paper was edited by Hang Su and reviewed by three anonymous referees.
Air Pollutant Emissions Inventory: https://www.canada.ca/en/environment-climate-change/services/pollutants/air-emissions-inventory-overview.html, last access: 1 July 2021.
Alexander, B., Sherwen, T., Holmes, C. D., Fisher, J. A., Chen, Q., Evans, M. J., and Kasibhatla, P.: Global inorganic nitrate production mechanisms: comparison of a global model with nitrate isotope observations, Atmos. Chem. Phys., 20, 3859–3877, https://doi.org/10.5194/acp-20-3859-2020, 2020.
Allen, D., Pickering, K., Duncan, B., and Damon, M.: Impact of lightning NO emissions on North American photochemistry as determined using the Global Modeling Initiative (GMI) model, J. Geophys. Res., 115, D22301, https://doi.org/10.1029/2010JD014062, 2010.
Allen, H. M., Crounse, J. D., Kim, M. J., Teng, A. P., and Wennberg, P. O.: Atmospheric Tomography Mission (ATom): L2 In Situ Data from Caltech Chemical Ionization Mass Spectrometer (CIT-CIMS), ORNL DAAC, Oak Ridge, Tennessee, USA [data set], https://doi.org/10.3334/ORNLDAAC/1713, 2019.
Andersen, S. T., Carpenter, L. J., Reed, C., Lee, J. D., Chance, R., Sherwen, T., Vaughan, A. R., Stewart, J., Edwards, P. M., Bloss, W. J., Sommariva, R., Crilley, L. R., Nott, G. J., Neves, L., Read, K., Heard, D. E., Seakins, P. W., Whalley, L. K., Boustead, G. A., Fleming, L. T., Stone, D., and Fomba, K. W.: Extensive field evidence for the release of HONO from the photolysis of nitrate aerosols, Sci. Adv., 9, eadd6266, https://doi.org/10.1126/sciadv.add6266, 2023.
Apel, E. C., Hornbrook, R. S., Hills, A. J., Blake, N. J., Barth, M. C., Weinheimer, A., Cantrell, C., Rutledge, S. A., Basarab, B., Crawford, J., Diskin, G., Homeyer, C. R., Campos, T., Flocke, F., Fried, A., Blake, D. R., Brune, W., Pollack, I. B., Peischl, J., Ryerson, T., Wennberg, P. O., Crounse, J. D., Wisthaler, A., Mikoviny, T., Huey, G., Heikes, B., O'Sullivan, D., and Riemer, D. D.: Upper tropospheric ozone production from lightning NOx-impacted convection: Smoke ingestion case study from the DC3 campaign, J. Geophys. Res.-Atmos., 120, 2505–2523, https://doi.org/10.1002/2014JD022121, 2015.
Baidar, S., Oetjen, H., Coburn, S., Dix, B., Ortega, I., Sinreich, R., and Volkamer, R.: The CU Airborne MAX-DOAS instrument: vertical profiling of aerosol extinction and trace gases, Atmos. Meas. Tech., 6, 719–739, https://doi.org/10.5194/amt-6-719-2013, 2013.
Bao, F., Li, M., Zhang, Y., Chen, C., and Zhao, J.: Photochemical Aging of Beijing Urban PM2.5: HONO Production, Environ. Sci. Technol., 52, 6309–6316, https://doi.org/10.1021/acs.est.8b00538, 2018.
Barth, M. C., Cantrell, C. A., Brune, W. H., Rutledge, S. A., Crawford, J. H., Huntrieser, H., Carey, L. D., MacGorman, D., Weisman, M., Pickering, K. E., Bruning, E., Anderson, B., Apel, E., Biggerstaff, M., Campos, T., Campuzano-Jost, P., Cohen, R., Crounse, J., Day, D. A., Diskin, G., Flocke, F., Fried, A., Garland, C., Heikes, B., Honomichl, S., Hornbrook, R., Huey, L. G., Jimenez, J. L., Lang, T., Lichtenstern, M., Mikoviny, T., Nault, B., O'Sullivan, D., Pan, L. L., Peischl, J., Pollack, I., Richter, D., Riemer, D., Ryerson, T., Schlager, H., St. Clair, J., Walega, J., Weibring, P., Weinheimer, A., Wennberg, P., Wisthaler, A., Wooldridge, P. J., and Ziegler, C.: The Deep Convective Clouds and Chemistry (DC3) Field Campaign, B. Am. Meteorol. Soc., 96, 1281–1309, https://doi.org/10.1175/BAMS-D-13-00290.1, 2015.
Beirle, S., Boersma, K. F., Platt, U., Lawrence, M. G., and Wagner, T.: Megacity Emissions and Lifetimes of Nitrogen Oxides Probed from Space, Science, 333, 1737–1739, https://doi.org/10.1126/science.1207824, 2011.
Belmonte Rivas, M., Veefkind, P., Eskes, H., and Levelt, P.: OMI tropospheric NO2 profiles from cloud slicing: constraints on surface emissions, convective transport and lightning NOx, Atmos. Chem. Phys., 15, 13519–13553, https://doi.org/10.5194/acp-15-13519-2015, 2015.
Benedict, K. B., McFall, A. S., and Anastasio, C.: Quantum Yield of Nitrite from the Photolysis of Aqueous Nitrate above 300 nm, Environ. Sci. Technol., 51, 4387–4395, https://doi.org/10.1021/acs.est.6b06370, 2017.
Bertram, T. H., Perring, A. E., Wooldridge, P. J., Crounse, J. D., Kwan, A. J., Wennberg, P. O., Scheuer, E., Dibb, J., Avery, M., Sachse, G., Vay, S. A., Crawford, J. H., McNaughton, C. S., Clarke, A., Pickering, K. E., Fuelberg, H., Huey, G., Blake, D. R., Singh, H. B., Hall, S. R., Shetter, R. E., Fried, A., Heikes, B. G., and Cohen, R. C.: Direct Measurements of the Convective Recycling of the Upper Troposphere, Science, 315, 816–820, https://doi.org/10.1126/science.1134548, 2007.
Bey, I., Jacob, D. J., Yantosca, R. M., Logan, J. A., Field, B. D., Fiore, A. M., Li, Q., Liu, H. Y., Mickley, L. J., and Schultz, M. G.: Global modeling of tropospheric chemistry with assimilated meteorology: Model description and evaluation, J. Geophys. Res.-Atmos., 106, 23073–23095, https://doi.org/10.1029/2001JD000807, 2001.
Boersma, K. F., Jacob, D. J., Bucsela, E. J., Perring, A. E., Dirksen, R., van der A, R. J., Yantosca, R. M., Park, R. J., Wenig, M. O., and Bertram, T. H.: Validation of OMI tropospheric NO2 observations during INTEX-B and application to constrain NOx emissions over the eastern United States and Mexico, Atmos. Environ., 42, 4480–4497, https://doi.org/10.1016/j.atmosenv.2008.02.004, 2008.
Boersma, K. F., Eskes, H. J., Richter, A., De Smedt, I., Lorente, A., Beirle, S., van Geffen, J. H. G. M., Zara, M., Peters, E., Van Roozendael, M., Wagner, T., Maasakkers, J. D., van der A, R. J., Nightingale, J., De Rudder, A., Irie, H., Pinardi, G., Lambert, J.-C., and Compernolle, S. C.: Improving algorithms and uncertainty estimates for satellite NO2 retrievals: results from the quality assurance for the essential climate variables (QA4ECV) project, Atmos. Meas. Tech., 11, 6651–6678, https://doi.org/10.5194/amt-11-6651-2018, 2018.
Bourgeois, I., Peischl, J., Thompson, C. R., Aikin, K. C., Campos, T., Clark, H., Commane, R., Daube, B., Diskin, G. W., Elkins, J. W., Gao, R.-S., Gaudel, A., Hintsa, E. J., Johnson, B. J., Kivi, R., McKain, K., Moore, F. L., Parrish, D. D., Querel, R., Ray, E., Sánchez, R., Sweeney, C., Tarasick, D. W., Thompson, A. M., Thouret, V., Witte, J. C., Wofsy, S. C., and Ryerson, T. B.: Global-scale distribution of ozone in the remote troposphere from the ATom and HIPPO airborne field missions, Atmos. Chem. Phys., 20, 10611–10635, https://doi.org/10.5194/acp-20-10611-2020, 2020.
Bourgeois, I., Peischl, J., Neuman, J. A., Brown, S. S., Thompson, C. R., Aikin, K. C., Allen, H. M., Angot, H., Apel, E. C., Baublitz, C. B., Brewer, J. F., Campuzano-Jost, P., Commane, R., Crounse, J. D., Daube, B. C., DiGangi, J. P., Diskin, G. S., Emmons, L. K., Fiore, A. M., Gkatzelis, G. I., Hills, A., Hornbrook, R. S., Huey, L. G., Jimenez, J. L., Kim, M., Lacey, F., McKain, K., Murray, L. T., Nault, B. A., Parrish, D. D., Ray, E., Sweeney, C., Tanner, D., Wofsy, S. C., and Ryerson, T. B.: Large contribution of biomass burning emissions to ozone throughout the global remote troposphere, P. Natl. Acad. Sci. USA, 118, e2109628118, https://doi.org/10.1073/pnas.2109628118, 2021.
Bourgeois, I., Peischl, J., Neuman, J. A., Brown, S. S., Allen, H. M., Campuzano-Jost, P., Coggon, M. M., DiGangi, J. P., Diskin, G. S., Gilman, J. B., Gkatzelis, G. I., Guo, H., Halliday, H. A., Hanisco, T. F., Holmes, C. D., Huey, L. G., Jimenez, J. L., Lamplugh, A. D., Lee, Y. R., Lindaas, J., Moore, R. H., Nault, B. A., Nowak, J. B., Pagonis, D., Rickly, P. S., Robinson, M. A., Rollins, A. W., Selimovic, V., St. Clair, J. M., Tanner, D., Vasquez, K. T., Veres, P. R., Warneke, C., Wennberg, P. O., Washenfelder, R. A., Wiggins, E. B., Womack, C. C., Xu, L., Zarzana, K. J., and Ryerson, T. B.: Comparison of airborne measurements of NO, NO2, HONO, NOy, and CO during FIREX-AQ, Atmos. Meas. Tech., 15, 4901–4930, https://doi.org/10.5194/amt-15-4901-2022, 2022.
Bradshaw, J., Davis, D., Crawford, J., Chen, G., Shetter, R., Müller, M., Gregory, G., Sachse, G., Blake, D., Heikes, B., Singh, H., Mastromarino, J., and Sandholm, S.: Photofragmentation two-photon laser-induced fluorescence detection of NO2 and NO: Comparison of measurements with model results based on airborne observations during PEM-Tropics A, Geophys. Res. Lett., 26, 471–474, https://doi.org/10.1029/1999GL900015, 1999.
Browne, E. C., Perring, A. E., Wooldridge, P. J., Apel, E., Hall, S. R., Huey, L. G., Mao, J., Spencer, K. M., Clair, J. M. St., Weinheimer, A. J., Wisthaler, A., and Cohen, R. C.: Global and regional effects of the photochemistry of CH3O2NO2: evidence from ARCTAS, Atmos. Chem. Phys., 11, 4209–4219, https://doi.org/10.5194/acp-11-4209-2011, 2011.
Brune, W. H., Miller, D. O., and Thames, A. B.: Atmospheric Tomography Mission (ATom): Measurements from Airborne Tropospheric Hydrogen Oxides Sensor (ATHOS), V2, ORNL DAAC, Oak Ridge, Tennessee, USA [data set], https://doi.org/10.3334/ORNLDAAC/1930, 2021.
Bucsela, E. J., Perring, A. E., Cohen, R. C., Boersma, K. F., Celarier, E. A., Gleason, J. F., Wenig, M. O., Bertram, T. H., Wooldridge, P. J., Dirksen, R., and Veefkind, J. P.: Comparison of tropospheric NO2 from in situ aircraft measurements with near-real-time and standard product data from OMI, J. Geophys. Res., 113, D16S31, https://doi.org/10.1029/2007JD008838, 2008.
Bucsela, E. J., Krotkov, N. A., Celarier, E. A., Lamsal, L. N., Swartz, W. H., Bhartia, P. K., Boersma, K. F., Veefkind, J. P., Gleason, J. F., and Pickering, K. E.: A new stratospheric and tropospheric NO2 retrieval algorithm for nadir-viewing satellite instruments: applications to OMI, Atmos. Meas. Tech., 6, 2607–2626, https://doi.org/10.5194/amt-6-2607-2013, 2013.
Burkholder, J. B., Sander, S. P., Abbatt, J., Barker, J. R., Cappa, C., Crounse, J. D., Dibble, T. S., Huie, R. E., Kolb, C. E., Kurylo, M. J., Orkin, V. L., Percival, C. J., Wilmouth, D. M., and Wine, P. H.: Chemical Kinetics and Photochemical Data for Use in Atmospheric Studies, Evaluation No. 19, JPL Publication 19-5, https://jpldataeval.jpl.nasa.gov/pdf/NASA-JPL%20Evaluation%2019-5.pdf (last access: 1 February 2022), 2020.
Burley, J. D. and Johnston, H. S.: Ionic mechanisms for heterogeneous stratospheric reactions and ultraviolet photoabsorption cross sections for NO, HNO3, and NO in sulfuric acid, Geophys. Res. Lett., 19, 1359–1362, https://doi.org/10.1029/92GL01115, 1992.
Chen, H., Karion, A., Rella, C. W., Winderlich, J., Gerbig, C., Filges, A., Newberger, T., Sweeney, C., and Tans, P. P.: Accurate measurements of carbon monoxide in humid air using the cavity ring-down spectroscopy (CRDS) technique, Atmos. Meas. Tech., 6, 1031–1040, https://doi.org/10.5194/amt-6-1031-2013, 2013.
Choi, S., Joiner, J., Choi, Y., Duncan, B. N., Vasilkov, A., Krotkov, N., and Bucsela, E.: First estimates of global free-tropospheric NO2 abundances derived using a cloud-slicing technique applied to satellite observations from the Aura Ozone Monitoring Instrument (OMI), Atmos. Chem. Phys., 14, 10565–10588, https://doi.org/10.5194/acp-14-10565-2014, 2014.
Choi, S., Lamsal, L. N., Follette-Cook, M., Joiner, J., Krotkov, N. A., Swartz, W. H., Pickering, K. E., Loughner, C. P., Appel, W., Pfister, G., Saide, P. E., Cohen, R. C., Weinheimer, A. J., and Herman, J. R.: Assessment of NO2 observations during DISCOVER-AQ and KORUS-AQ field campaigns, Atmos. Meas. Tech., 13, 2523–2546, https://doi.org/10.5194/amt-13-2523-2020, 2020.
Cleary, P. A., Wooldridge, P. J., and Cohen, R. C.: Laser-induced fluorescence detection of atmospheric NO2 with a commercial diode laser and a supersonic expansion, Appl. Optics, 41, 6950, https://doi.org/10.1364/AO.41.006950, 2002.
Cooper, O. R., Stohl, A., Trainer, M., Thompson, A. M., Witte, J. C., Oltmans, S. J., Morris, G., Pickering, K. E., Crawford, J. H., Chen, G., Cohen, R. C., Bertram, T. H., Wooldridge, P., Perring, A., Brune, W. H., Merrill, J., Moody, J. L., Tarasick, D., Nédélec, P., Forbes, G., Newchurch, M. J., Schmidlin, F. J., Johnson, B. J., Turquety, S., Baughcum, S. L., Ren, X., Fehsenfeld, F. C., Meagher, J. F., Spichtinger, N., Brown, C. C., McKeen, S. A., McDermid, I. S., and Leblanc, T.: Large upper tropospheric ozone enhancements above midlatitude North America during summer: In situ evidence from the IONS and MOZAIC ozone measurement network, J. Geophys. Res., 111, D24S05, https://doi.org/10.1029/2006JD007306, 2006.
Crawford, J., Davis, D., Chen, G., Bradshaw, J., Sandholm, S., Gregory, G., Sachse, G., Anderson, B., Collins, J., Blake, D., Singh, H., Heikes, B., Talbot, R., and Rodriguez, J.: Photostationary state analysis of the NO2-NO system based on airborne observations from the western and central North Pacific, J. Geophys. Res., 101, 2053–2072, https://doi.org/10.1029/95JD02201, 1996.
Crawford, J., Davis, D., Olson, J., Chen, G., Liu, S., Fuelberg, H., Hannan, J., Kondo, Y., Anderson, B., Gregory, G., Sachse, G., Talbot, R., Viggiano, A., Heikes, B., Snow, J., Singh, H., and Blake, D.: Evolution and chemical consequences of lightning-produced NOx observed in the North Atlantic upper troposphere, J. Geophys. Res., 105, 19795–19809, https://doi.org/10.1029/2000JD900183, 2000.
Davis, D. D., Chen, G., Chameides, W., Bradshaw, J., Sandholm, S., Rodgers, M., Schendal, J., Madronich, S., Sachse, G., Gregory, G., Anderson, B., Barrick, J., Shipham, M., Collins, J., Wade, L., and Blake, D.: A photostationary state analysis of thev NO2-NO system based on airborne observations from the subtropical/tropical North and South Atlantic, J. Geophys. Res., 98, 23501, https://doi.org/10.1029/93JD02412, 1993.
Day, D. A., Wooldridge, P. J., Dillon, M. B., Thornton, J. A., and Cohen, R. C.: A thermal dissociation laser-induced fluorescence instrument for in situ detection of NO2, peroxy nitrates, alkyl nitrates, and HNO3, J. Geophys. Res.-Atmos., 107, ACH 4-1–ACH 4-14, https://doi.org/10.1029/2001JD000779, 2002.
DC3 Science Team: DC3 Field Campaign Data from DC-8 aircraft, NASA [data set], https://doi.org/10.5067/Aircraft/DC3/DC8/Aerosol-TraceGas, 2013.
Dibb, J. E.: Atmospheric Tomography Mission (ATom): Measurements of Soluble Acidic Gases and Aerosols (SAGA), ORNL DAAC, Oak Ridge, Tennessee, USA [data set], https://doi.org/10.3334/ORNLDAAC/1748, 2020.
Du, J. and Zhu, L.: Quantification of the absorption cross sections of surface-adsorbed nitric acid in the 335–365 nm region by Brewster angle cavity ring-down spectroscopy, Chem. Phys. Lett., 511, 213–218, https://doi.org/10.1016/j.cplett.2011.06.062, 2011.
Duncan, B. N., Strahan, S. E., Yoshida, Y., Steenrod, S. D., and Livesey, N.: Model study of the cross-tropopause transport of biomass burning pollution, Atmos. Chem. Phys., 7, 3713–3736, https://doi.org/10.5194/acp-7-3713-2007, 2007.
Eastham, S. D., Weisenstein, D. K., and Barrett, S. R. H.: Development and Evaluation of the Unified Tropospheric–Stratospheric Chemistry Extension (UCX) for the Global Chemistry-Transport Model GEOS-Chem, Atmos. Environ., 89, 52–63, https://doi.org/10.1016/j.atmosenv.2014.02.001, 2014.
Elshorbany, Y. F., Steil, B., Brühl, C., and Lelieveld, J.: Impact of HONO on global atmospheric chemistry calculated with an empirical parameterization in the EMAC model, Atmos. Chem. Phys., 12, 9977–10000, https://doi.org/10.5194/acp-12-9977-2012, 2012.
Emmons, L. K., Carroll, M. A., Hauglustaine, D. A., Brasseur, G. P., Atherton, C., Penner, J., Sillman, S., Levy, H., Rohrer, F., Wauben, W. M. F., Van Velthoven, P. F. J., Wang, Y., Jacob, D., Bakwin, P., Dickerson, R., Doddridge, B., Gerbig, C., Honrath, R., Hübler, G., Jaffe, D., Kondo, Y., Munger, J. W., Torres, A., and Volz-Thomas, A.: Climatologies of NOx and NOy: A comparison of data and models, Atmos. Environ., 31, 1851–1904, https://doi.org/10.1016/S1352-2310(96)00334-2, 1997.
ESA Sentinel-4 Data Products: https://sentinel.esa.int/web/sentinel/missions/sentinel-4/data-products, last access: 15 May 2022.
Eskes, H. J. and Boersma, K. F.: Averaging kernels for DOAS total-column satellite retrievals, Atmos. Chem. Phys., 3, 1285–1291, https://doi.org/10.5194/acp-3-1285-2003, 2003.
Fairlie, T. D., Jacob, D. J., Dibb, J. E., Alexander, B., Avery, M. A., van Donkelaar, A., and Zhang, L.: Impact of mineral dust on nitrate, sulfate, and ozone in transpacific Asian pollution plumes, Atmos. Chem. Phys., 10, 3999–4012, https://doi.org/10.5194/acp-10-3999-2010, 2010.
Faloona, I. C., Tan, D., Lesher, R. L., Hazen, N. L., Frame, C. L., Simpas, J. B., Harder, H., Martinez, M., Di Carlo, P., Ren, X., and Brune, W. H.: A Laser-induced Fluorescence Instrument for Detecting Tropospheric OH and HO2: Characteristics and Calibration, J. Atmos. Chem., 47, 139–167, https://doi.org/10.1023/B:JOCH.0000021036.53185.0e, 2004.
Fan, S.-M., Jacob, D. J., Mauzerall, D. L., Bradshaw, J. D., Sandholm, S. T., Blake, D. R., Singh, H. B., Talbot, R. W., Gregory, G. L., and Sachse, G. W.: Origin of tropospheric NOx over subarctic eastern Canada in summer, J. Geophys. Res., 99, 16867, https://doi.org/10.1029/94JD01122, 1994.
Fischer, E. V., Jacob, D. J., Yantosca, R. M., Sulprizio, M. P., Millet, D. B., Mao, J., Paulot, F., Singh, H. B., Roiger, A., Ries, L., Talbot, R. W., Dzepina, K., and Pandey Deolal, S.: Atmospheric peroxyacetyl nitrate (PAN): a global budget and source attribution, Atmos. Chem. Phys., 14, 2679–2698, https://doi.org/10.5194/acp-14-2679-2014, 2014.
Fisher, J. A., Atlas, E. L., Barletta, B., Meinardi, S., Blake, D. R., Thompson, C. R., Ryerson, T. B., Peischl, J., Tzompa-Sosa, Z. A., and Murray, L. T.: Methyl, Ethyl, and Propyl Nitrates: Global Distribution and Impacts on Reactive Nitrogen in Remote Marine Environments, J. Geophys. Res.-Atmos., 123, 12429–12451, https://doi.org/10.1029/2018JD029046, 2018.
Fountoukis, C. and Nenes, A.: ISORROPIA II: a computationally efficient thermodynamic equilibrium model for K+–Ca2+–Mg2+––Na+–––Cl−–H2O aerosols, Atmos. Chem. Phys., 7, 4639–4659, https://doi.org/10.5194/acp-7-4639-2007, 2007.
Fridlind, A. M. and Jacobson, M. Z.: A study of gas-aerosol equilibrium and aerosol pH in the remote marine boundary layer during the First Aerosol Characterization Experiment (ACE 1), J. Geophys. Res., 105, 17325–17340, https://doi.org/10.1029/2000JD900209, 2000.
Fuchs, H., Ball, S. M., Bohn, B., Brauers, T., Cohen, R. C., Dorn, H.-P., Dubé, W. P., Fry, J. L., Häseler, R., Heitmann, U., Jones, R. L., Kleffmann, J., Mentel, T. F., Müsgen, P., Rohrer, F., Rollins, A. W., Ruth, A. A., Kiendler-Scharr, A., Schlosser, E., Shillings, A. J. L., Tillmann, R., Varma, R. M., Venables, D. S., Villena Tapia, G., Wahner, A., Wegener, R., Wooldridge, P. J., and Brown, S. S.: Intercomparison of measurements of NO2 concentrations in the atmosphere simulation chamber SAPHIR during the NO3Comp campaign, Atmos. Meas. Tech., 3, 21–37, https://doi.org/10.5194/amt-3-21-2010, 2010.
Gelaro, R., McCarty, W., Suárez, M. J., Todling, R., Molod, A., Takacs, L., Randles, C. A., Darmenov, A., Bosilovich, M. G., Reichle, R., Wargan, K., Coy, L., Cullather, R., Draper, C., Akella, S., Buchard, V., Conaty, A., da Silva, A. M., Gu, W., Kim, G.-K., Koster, R., Lucchesi, R., Merkova, D., Nielsen, J. E., Partyka, G., Pawson, S., Putman, W., Rienecker, M., Schubert, S. D., Sienkiewicz, M., and Zhao, B.: The Modern-Era Retrospective Analysis for Research and Applications, Version 2 (MERRA-2), J. Climate, 30, 5419–5454, https://doi.org/10.1175/JCLI-D-16-0758.1, 2017.
Gen, M., Zhang, R., Huang, D. D., Li, Y., and Chan, C. K.: Heterogeneous Oxidation of SO2 in Sulfate Production during Nitrate Photolysis at 300 nm: Effect of pH, Relative Humidity, Irradiation Intensity, and the Presence of Organic Compounds, Environ. Sci. Technol., 53, 8757–8766, https://doi.org/10.1021/acs.est.9b01623, 2019.
Giglio, L., Randerson, J. T., and van der Werf, G. R.: Analysis of daily, monthly, and annual burned area using the fourth-generation global fire emissions database (GFED4), J. Geophys. Res.-Biogeo., 118, 317–328, https://doi.org/10.1002/jgrg.20042, 2013.
Goldberg, D. L., Anenberg, S. C., Lu, Z., Streets, D. G., Lamsal, L. N., E McDuffie, E., and Smith, S. J.: Urban NOx emissions around the world declined faster than anticipated between 2005 and 2019, Environ. Res. Lett., 16, 115004, https://doi.org/10.1088/1748-9326/ac2c34, 2021.
Gregory, G. L., Hoell, J. M., Carroll, M. A., Ridley, B. A., Davis, D. D., Bradshaw, J., Rodgers, M. O., Sandholm, S. T., Schiff, H. I., Hastie, D. R., Karecki, D. R., Mackay, G. I., Harris, G. W., Torres, A. L., and Fried, A.: An intercomparison of airborne nitrogen dioxide instruments, J. Geophys. Res., 95, 10103–10127, https://doi.org/10.1029/JD095iD07p10103, 1990a.
Gregory, G. L., Hoell, J. M., Torres, A. L., Carroll, M. A., Ridley, B. A., Rodgers, M. O., Bradshaw, J., Sandholm, S., and Davis, D. D.: An intercomparison of airborne nitric oxide measurements: A second opportunity, J. Geophys. Res., 95, 10129–10138, https://doi.org/10.1029/JD095iD07p10129, 1990b.
Guo, H., Flynn, C. M., Prather, M. J., Strode, S. A., Steenrod, S. D., Emmons, L., Lacey, F., Lamarque, J.-F., Fiore, A. M., Correa, G., Murray, L. T., Wolfe, G. M., St. Clair, J. M., Kim, M., Crounse, J., Diskin, G., DiGangi, J., Daube, B. C., Commane, R., McKain, K., Peischl, J., Ryerson, T. B., Thompson, C., Hanisco, T. F., Blake, D., Blake, N. J., Apel, E. C., Hornbrook, R. S., Elkins, J. W., Hintsa, E. J., Moore, F. L., and Wofsy, S.: Heterogeneity and chemical reactivity of the remote troposphere defined by aircraft measurements , Atmos. Chem. Phys., 21, 13729–13746, https://doi.org/10.5194/acp-21-13729-2021, 2021a.
Guo, H., Campuzano-Jost, P., Nault, B. A., Day, D. A., Schroder, J. C., Kim, D., Dibb, J. E., Dollner, M., Weinzierl, B., and Jimenez, J. L.: The importance of size ranges in aerosol instrument intercomparisons: a case study for the Atmospheric Tomography Mission, Atmos. Meas. Tech., 14, 3631–3655, https://doi.org/10.5194/amt-14-3631-2021, 2021b.
Hains, J. C., Boersma, K. F., Kroon, M., Dirksen, R. J., Cohen, R. C., Perring, A. E., Bucsela, E., Volten, H., Swart, D. P. J., Richter, A., Wittrock, F., Schoenhardt, A., Wagner, T., Ibrahim, O. W., van Roozendael, M., Pinardi, G., Gleason, J. F., Veefkind, J. P., and Levelt, P.: Testing and improving OMI DOMINO tropospheric NO 2 using observations from the DANDELIONS and INTEX-B validation campaigns, J. Geophys. Res., 115, D05301, https://doi.org/10.1029/2009JD012399, 2010.
Hall, S. R. and Ullmann, K.: Atmospheric Tomography Mission (ATom): Actinic Flux and Photolysis Frequencies from CAFS Instrument, 2016–2018, V2, ORNL DAAC, Oak Ridge, Tennessee, USA [data set], https://doi.org/10.3334/ORNLDAAC/1933, 2021.
Hayes, P. L., Ortega, A. M., Cubison, M. J., Froyd, K. D., Zhao, Y., Cliff, S. S., Hu, W. W., Toohey, D. W., Flynn, J. H., Lefer, B. L., Grossberg, N., Alvarez, S., Rappenglück, B., Taylor, J. W., Allan, J. D., Holloway, J. S., Gilman, J. B., Kuster, W. C., de Gouw, J. A., Massoli, P., Zhang, X., Liu, J., Weber, R. J., Corrigan, A. L., Russell, L. M., Isaacman, G., Worton, D. R., Kreisberg, N. M., Goldstein, A. H., Thalman, R., Waxman, E. M., Volkamer, R., Lin, Y. H., Surratt, J. D., Kleindienst, T. E., Offenberg, J. H., Dusanter, S., Griffith, S., Stevens, P. S., Brioude, J., Angevine, W. M., and Jimenez, J. L.: Organic aerosol composition and sources in Pasadena, California, during the 2010 CalNex campaign, J. Geophys. Res.-Atmos., 118, 9233–9257, https://doi.org/10.1002/jgrd.50530, 2013.
Heim, E. W., Dibb, J., Scheuer, E., Jost, P. C., Nault, B. A., Jimenez, J. L., Peterson, D., Knote, C., Fenn, M., Hair, J., Beyersdorf, A. J., Corr, C., and Anderson, B. E.: Asian dust observed during KORUS-AQ facilitates the uptake and incorporation of soluble pollutants during transport to South Korea, Atmos. Environ., 224, 117305, https://doi.org/10.1016/j.atmosenv.2020.117305, 2020.
Henderson, B. H., Pinder, R. W., Crooks, J., Cohen, R. C., Hutzell, W. T., Sarwar, G., Goliff, W. S., Stockwell, W. R., Fahr, A., Mathur, R., Carlton, A. G., and Vizuete, W.: Evaluation of simulated photochemical partitioning of oxidized nitrogen in the upper troposphere, Atmos. Chem. Phys., 11, 275–291, https://doi.org/10.5194/acp-11-275-2011, 2011.
Hodzic, A., Campuzano-Jost, P., Bian, H., Chin, M., Colarco, P. R., Day, D. A., Froyd, K. D., Heinold, B., Jo, D. S., Katich, J. M., Kodros, J. K., Nault, B. A., Pierce, J. R., Ray, E., Schacht, J., Schill, G. P., Schroder, J. C., Schwarz, J. P., Sueper, D. T., Tegen, I., Tilmes, S., Tsigaridis, K., Yu, P., and Jimenez, J. L.: Characterization of organic aerosol across the global remote troposphere: a comparison of ATom measurements and global chemistry models, Atmos. Chem. Phys., 20, 4607–4635, https://doi.org/10.5194/acp-20-4607-2020, 2020.
Hoesly, R. M., Smith, S. J., Feng, L., Klimont, Z., Janssens-Maenhout, G., Pitkanen, T., Seibert, J. J., Vu, L., Andres, R. J., Bolt, R. M., Bond, T. C., Dawidowski, L., Kholod, N., Kurokawa, J.-I., Li, M., Liu, L., Lu, Z., Moura, M. C. P., O'Rourke, P. R., and Zhang, Q.: Historical (1750–2014) anthropogenic emissions of reactive gases and aerosols from the Community Emissions Data System (CEDS), Geosci. Model Dev., 11, 369–408, https://doi.org/10.5194/gmd-11-369-2018, 2018.
Holmes, C. D., Prather, M. J., and Vinken, G. C. M.: The climate impact of ship NOx emissions: an improved estimate accounting for plume chemistry, Atmos. Chem. Phys., 14, 6801–6812, https://doi.org/10.5194/acp-14-6801-2014, 2014.
Holmes, C. D., Bertram, T. H., Confer, K. L., Graham, K. A., Ronan, A. C., Wirks, C. K., and Shah, V.: The Role of Clouds in the Tropospheric NOx Cycle: A New Modeling Approach for Cloud Chemistry and Its Global Implications, Geophys. Res. Lett., 46, 4980–4990, https://doi.org/10.1029/2019GL081990, 2019.
Horowitz, L. W., Walters, S., Mauzerall, D. L., Emmons, L. K., Rasch, P. J., Granier, C., Tie, X., Lamarque, J.-F., Schultz, M. G., Tyndall, G. S., Orlando, J. J., and Brasseur, G. P.: A global simulation of tropospheric ozone and related tracers: Description and evaluation of MOZART, version 2, J. Geophys. Res., 108, 4784, https://doi.org/10.1029/2002JD002853, 2003.
Hudman, R. C., Jacob, D. J., Turquety, S., Leibensperger, E. M., Murray, L. T., Wu, S., Gilliland, A. B., Avery, M., Bertram, T. H., Brune, W., Cohen, R. C., Dibb, J. E., Flocke, F. M., Fried, A., Holloway, J., Neuman, J. A., Orville, R., Perring, A., Ren, X., Sachse, G. W., Singh, H. B., Swanson, A., and Wooldridge, P. J.: Surface and lightning sources of nitrogen oxides over the United States: Magnitudes, chemical evolution, and outflow, J. Geophys. Res., 112, D12S05, https://doi.org/10.1029/2006JD007912, 2007.
Hudman, R. C., Moore, N. E., Mebust, A. K., Martin, R. V., Russell, A. R., Valin, L. C., and Cohen, R. C.: Steps towards a mechanistic model of global soil nitric oxide emissions: implementation and space based-constraints, Atmos. Chem. Phys., 12, 7779–7795, https://doi.org/10.5194/acp-12-7779-2012, 2012.
Huijnen, V., Williams, J., van Weele, M., van Noije, T., Krol, M., Dentener, F., Segers, A., Houweling, S., Peters, W., de Laat, J., Boersma, F., Bergamaschi, P., van Velthoven, P., Le Sager, P., Eskes, H., Alkemade, F., Scheele, R., Nédélec, P., and Pätz, H.-W.: The global chemistry transport model TM5: description and evaluation of the tropospheric chemistry version 3.0, Geosci. Model Dev., 3, 445–473, https://doi.org/10.5194/gmd-3-445-2010, 2010.
Inness, A., Ades, M., Agustí-Panareda, A., Barré, J., Benedictow, A., Blechschmidt, A.-M., Dominguez, J. J., Engelen, R., Eskes, H., Flemming, J., Huijnen, V., Jones, L., Kipling, Z., Massart, S., Parrington, M., Peuch, V.-H., Razinger, M., Remy, S., Schulz, M., and Suttie, M.: The CAMS reanalysis of atmospheric composition, Atmos. Chem. Phys., 19, 3515–3556, https://doi.org/10.5194/acp-19-3515-2019, 2019.
Jaeglé, L., Jacob, D. J., Wang, Y., Weinheimer, A. J., Ridley, B. A., Campos, T. L., Sachse, G. W., and Hagen, D. E.: Sources and chemistry of NOx in the upper troposphere over the United States, Geophys. Res. Lett., 25, 1705–1708, https://doi.org/10.1029/97GL03591, 1998a.
Jaeglé, L., Jacob, D. J., Brune, W. H., Tan, D., Faloona, I. C., Weinheimer, A. J., Ridley, B. A., Campos, T. L., and Sachse, G. W.: Sources of HOx and production of ozone in the upper troposphere over the United States, Geophys. Res. Lett., 25, 1709–1712, https://doi.org/10.1029/98GL00041, 1998b.
Jaeglé, L., Quinn, P. K., Bates, T. S., Alexander, B., and Lin, J.-T.: Global distribution of sea salt aerosols: new constraints from in situ and remote sensing observations, Atmos. Chem. Phys., 11, 3137–3157, https://doi.org/10.5194/acp-11-3137-2011, 2011.
Jaeglé, L., Shah, V., Thornton, J. A., Lopez-Hilfiker, F. D., Lee, B. H., McDuffie, E. E., Fibiger, D., Brown, S. S., Veres, P., Sparks, T. L., Ebben, C. J., Wooldridge, P. J., Kenagy, H. S., Cohen, R. C., Weinheimer, A. J., Campos, T. L., Montzka, D. D., Digangi, J. P., Wolfe, G. M., Hanisco, T., Schroder, J. C., Campuzano-Jost, P., Day, D. A., Jimenez, J. L., Sullivan, A. P., Guo, H., and Weber, R. J.: Nitrogen Oxides Emissions, Chemistry, Deposition, and Export Over the Northeast United States During the WINTER Aircraft Campaign, J. Geophys. Res.-Atmos., 123, 12368–12393, https://doi.org/10.1029/2018JD029133, 2018.
Javed, U., Kubistin, D., Martinez, M., Pollmann, J., Rudolf, M., Parchatka, U., Reiffs, A., Thieser, J., Schuster, G., Horbanski, M., Pöhler, D., Crowley, J. N., Fischer, H., Lelieveld, J., and Harder, H.: Laser-induced fluorescence-based detection of atmospheric nitrogen dioxide and comparison of different techniques during the PARADE 2011 field campaign, Atmos. Meas. Tech., 12, 1461–1481, https://doi.org/10.5194/amt-12-1461-2019, 2019.
Karydis, V. A., Tsimpidi, A. P., Pozzer, A., Astitha, M., and Lelieveld, J.: Effects of mineral dust on global atmospheric nitrate concentrations, Atmos. Chem. Phys., 16, 1491–1509, https://doi.org/10.5194/acp-16-1491-2016, 2016.
Kasibhatla, P., Sherwen, T., Evans, M. J., Carpenter, L. J., Reed, C., Alexander, B., Chen, Q., Sulprizio, M. P., Lee, J. D., Read, K. A., Bloss, W., Crilley, L. R., Keene, W. C., Pszenny, A. A. P., and Hodzic, A.: Global impact of nitrate photolysis in sea-salt aerosol on NOx, OH, and O3 in the marine boundary layer, Atmos. Chem. Phys., 18, 11185–11203, https://doi.org/10.5194/acp-18-11185-2018, 2018.
Kenagy, H. S., Sparks, T. L., Ebben, C. J., Wooldrige, P. J., Lopez-Hilfiker, F. D., Lee, B. H., Thornton, J. A., McDuffie, E. E., Fibiger, D. L., Brown, S. S., Montzka, D. D., Weinheimer, A. J., Schroder, J. C., Campuzano-Jost, P., Day, D. A., Jimenez, J. L., Dibb, J. E., Campos, T., Shah, V., Jaeglé, L., and Cohen, R. C.: NOx Lifetime and NOy Partitioning During WINTER, J. Geophys. Res.-Atmos., 123, 9813–9827, https://doi.org/10.1029/2018JD028736, 2018.
Khan, M. A. H., Miles, B., Jenkin, M. E., Derwent, R. G., Percival, C. J., and Shallcross, D. E.: Investigating the Impacts of Nonacyl Peroxy Nitrates on the Global Composition of the Troposphere Using a 3-D Chemical Transport Model, STOCHEM-CRI, ACS Earth Space Chem., 4, 1201–1212, https://doi.org/10.1021/acsearthspacechem.0c00133, 2020.
Kim, H., Park, R. J., Kim, S., Brune, W. H., Diskin, G. S., Fried, A., Hall, S. R., Weinheimer, A. J., Wennberg, P., Wisthaler, A., Blake, D. R., and Ullmann, K.: Observed versus simulated OH reactivity during KORUS-AQ campaign: Implications for emission inventory and chemical environment in East Asia, Elem. Sci. Anth., 10, 00030, https://doi.org/10.1525/elementa.2022.00030, 2022.
Kim, S., Huey, L. G., Stickel, R. E., Tanner, D. J., Crawford, J. H., Olson, J. R., Chen, G., Brune, W. H., Ren, X., Lesher, R., Wooldridge, P. J., Bertram, T. H., Perring, A., Cohen, R. C., Lefer, B. L., Shetter, R. E., Avery, M., Diskin, G., and Sokolik, I.: Measurement of HO2NO2 in the free troposphere during the Intercontinental Chemical Transport Experiment–North America 2004, J. Geophys. Res.-Atmos., 112, D12S01, https://doi.org/10.1029/2006JD007676, 2007.
Kleinman, L. I., Springston, S. R., Daum, P. H., Lee, Y.-N., Nunnermacker, L. J., Senum, G. I., Wang, J., Weinstein-Lloyd, J., Alexander, M. L., Hubbe, J., Ortega, J., Canagaratna, M. R., and Jayne, J.: The time evolution of aerosol composition over the Mexico City plateau, Atmos. Chem. Phys., 8, 1559–1575, https://doi.org/10.5194/acp-8-1559-2008, 2008.
Krotkov, N. A., McLinden, C. A., Li, C., Lamsal, L. N., Celarier, E. A., Marchenko, S. V., Swartz, W. H., Bucsela, E. J., Joiner, J., Duncan, B. N., Boersma, K. F., Veefkind, J. P., Levelt, P. F., Fioletov, V. E., Dickerson, R. R., He, H., Lu, Z., and Streets, D. G.: Aura OMI observations of regional SO2 and NO2 pollution changes from 2005 to 2015, Atmos. Chem. Phys., 16, 4605–4629, https://doi.org/10.5194/acp-16-4605-2016, 2016.
Krotkov, N. A., Lamsal, L. N., Celarier, E. A., Swartz, W. H., Marchenko, S. V., Bucsela, E. J., Chan, K. L., Wenig, M., and Zara, M.: The version 3 OMI NO2 standard product, Atmos. Meas. Tech., 10, 3133–3149, https://doi.org/10.5194/amt-10-3133-2017, 2017.
Lamarque, J.-F., Brasseur, G. P., Hess, P. G., and Müller, J.-F.: Three-dimensional study of the relative contributions of the different nitrogen sources in the troposphere, J. Geophys. Res., 101, 22955–22968, https://doi.org/10.1029/96JD02160, 1996.
Lamsal, L. N., Martin, R. V., Padmanabhan, A., van Donkelaar, A., Zhang, Q., Sioris, C. E., Chance, K., Kurosu, T. P., and Newchurch, M. J.: Application of satellite observations for timely updates to global anthropogenic NOx emission inventories, Geophys. Res. Lett., 38, L05810, https://doi.org/10.1029/2010GL046476, 2011.
Lamsal, L. N., Krotkov, N. A., Celarier, E. A., Swartz, W. H., Pickering, K. E., Bucsela, E. J., Gleason, J. F., Martin, R. V., Philip, S., Irie, H., Cede, A., Herman, J., Weinheimer, A., Szykman, J. J., and Knepp, T. N.: Evaluation of OMI operational standard NO2 column retrievals using in situ and surface-based NO2 observations, Atmos. Chem. Phys., 14, 11587–11609, https://doi.org/10.5194/acp-14-11587-2014, 2014.
Lamsal, L. N., Krotkov, N. A., Vasilkov, A., Marchenko, S., Qin, W., Yang, E.-S., Fasnacht, Z., Joiner, J., Choi, S., Haffner, D., Swartz, W. H., Fisher, B., and Bucsela, E.: Ozone Monitoring Instrument (OMI) Aura nitrogen dioxide standard product version 4.0 with improved surface and cloud treatments, Atmos. Meas. Tech., 14, 455–479, https://doi.org/10.5194/amt-14-455-2021, 2021.
Laughner, J. L., Zhu, Q., and Cohen, R. C.: Evaluation of version 3.0B of the BEHR OMI NO2 product, Atmos. Meas. Tech., 12, 129–146, https://doi.org/10.5194/amt-12-129-2019, 2019.
Levy, H., Moxim, W. J., Klonecki, A. A., and Kasibhatla, P. S.: Simulated tropospheric NOx: Its evaluation, global distribution and individual source contributions, J. Geophys. Res., 104, 26279–26306, https://doi.org/10.1029/1999JD900442, 1999.
Lorente, A., Boersma, K. F., Eskes, H. J., Veefkind, J. P., van Geffen, J. H. G. M., de Zeeuw, M. B., Denier van der Gon, H. A. C., Beirle, S., and Krol, M. C.: Quantification of nitrogen oxides emissions from build-up of pollution over Paris with TROPOMI, Sci. Rep., 9, 20033, https://doi.org/10.1038/s41598-019-56428-5, 2019.
Luo, G., Yu, F., and Moch, J. M.: Further improvement of wet process treatments in GEOS-Chem v12.6.0: impact on global distributions of aerosols and aerosol precursors, Geosci. Model Dev., 13, 2879–2903, https://doi.org/10.5194/gmd-13-2879-2020, 2020.
Mao, J., Paulot, F., Jacob, D. J., Cohen, R. C., Crounse, J. D., Wennberg, P. O., Keller, C. A., Hudman, R. C., Barkley, M. P., and Horowitz, L. W.: Ozone and organic nitrates over the eastern United States: Sensitivity to isoprene chemistry, J. Geophys. Res.-Atmos., 118, 11256–11268, https://doi.org/10.1002/jgrd.50817, 2013.
Marais, E. A. and Wiedinmyer, C.: Air Quality Impact of Diffuse and Inefficient Combustion Emissions in Africa (DICE-Africa), Environ. Sci. Technol., 50, 10739–10745, https://doi.org/10.1021/acs.est.6b02602, 2016.
Marais, E. A., Jacob, D. J., Choi, S., Joiner, J., Belmonte-Rivas, M., Cohen, R. C., Beirle, S., Murray, L. T., Schiferl, L. D., Shah, V., and Jaeglé, L.: Nitrogen oxides in the global upper troposphere: interpreting cloud-sliced NO2 observations from the OMI satellite instrument, Atmos. Chem. Phys., 18, 17017–17027, https://doi.org/10.5194/acp-18-17017-2018, 2018.
Marais, E. A., Roberts, J. F., Ryan, R. G., Eskes, H., Boersma, K. F., Choi, S., Joiner, J., Abuhassan, N., Redondas, A., Grutter, M., Cede, A., Gomez, L., and Navarro-Comas, M.: New observations of NO2 in the upper troposphere from TROPOMI, Atmos. Meas. Tech., 14, 2389–2408, https://doi.org/10.5194/amt-14-2389-2021, 2021.
Martin, R. V., Chance, K., Jacob, D. J., Kurosu, T. P., Spurr, R. J. D., Bucsela, E., Gleason, J. F., Palmer, P. I., Bey, I., Fiore, A. M., Li, Q., Yantosca, R. M., and Koelemeijer, R. B. A.: An improved retrieval of tropospheric nitrogen dioxide from GOME, J. Geophys. Res.-Atmos., 107, 4437, https://doi.org/10.1029/2001JD001027, 2002.
Martin, R. V., Jacob, D. J., Chance, K., Kurosu, T. P., Palmer, P. I., and Evans, M. J.: Global inventory of nitrogen oxide emissions constrained by space-based observations of NO2 columns, J. Geophys. Res.-Atmos., 108, 4537, https://doi.org/10.1029/2003JD003453, 2003.
Martin, R. V., Sioris, C. E., Chance, K., Ryerson, T. B., Bertram, T. H., Wooldridge, P. J., Cohen, R. C., Neuman, J. A., Swanson, A., and Flocke, F. M.: Evaluation of space-based constraints on global nitrogen oxide emissions with regional aircraft measurements over and downwind of eastern North America, J. Geophys. Res., 111, D15308, https://doi.org/10.1029/2005JD006680, 2006.
Matsumoto, J., Hirokawa, J., Akimoto, H., and Kajii, Y.: Direct measurement of NO2 in the marine atmosphere by laser-induced fluorescence technique, Atmos. Environ., 35, 2803–2814, https://doi.org/10.1016/S1352-2310(01)00078-4, 2001.
McDuffie, E. E., Fibiger, D. L., Dubé, W. P., Lopez-Hilfiker, F., Lee, B. H., Thornton, J. A., Shah, V., Jaeglé, L., Guo, H., Weber, R. J., Michael Reeves, J., Weinheimer, A. J., Schroder, J. C., Campuzano-Jost, P., Jimenez, J. L., Dibb, J. E., Veres, P., Ebben, C., Sparks, T. L., Wooldridge, P. J., Cohen, R. C., Hornbrook, R. S., Apel, E. C., Campos, T., Hall, S. R., Ullmann, K., and Brown, S. S.: Heterogeneous N2O5 Uptake During Winter: Aircraft Measurements During the 2015 WINTER Campaign and Critical Evaluation of Current Parameterizations, J. Geophys. Res.-Atmos., 123, 4345–4372, https://doi.org/10.1002/2018JD028336, 2018.
McDuffie, E. E., Martin, R. V., Spadaro, J. V., Burnett, R., Smith, S. J., O'Rourke, P., Hammer, M. S., van Donkelaar, A., Bindle, L., Shah, V., Jaeglé, L., Luo, G., Yu, F., Adeniran, J. A., Lin, J., and Brauer, M.: Source sector and fuel contributions to ambient PM2.5 and attributable mortality across multiple spatial scales, Nat. Commun., 12, 3594, https://doi.org/10.1038/s41467-021-23853-y, 2021.
McKain, K. and Sweeney, C.: Atmospheric Tomography Mission (ATom)ATom: CO2, CH4, and CO Measurements from Picarro, 2016–2018, ORNL DAAC, Oak Ridge, Tennessee, USA [data set], https://doi.org/10.3334/ORNLDAAC/1732, 2021.
Millero, F. J., Feistel, R., Wright, D. G., and McDougall, T. J.: The composition of Standard Seawater and the definition of the Reference-Composition Salinity Scale, Deep-Sea Res. Pt. I, 55, 50–72, https://doi.org/10.1016/j.dsr.2007.10.001, 2008.
Miyazaki, K., Bowman, K., Sekiya, T., Eskes, H., Boersma, F., Worden, H., Livesey, N., Payne, V. H., Sudo, K., Kanaya, Y., Takigawa, M., and Ogochi, K.: Updated tropospheric chemistry reanalysis and emission estimates, TCR-2, for 2005–2018, Earth Syst. Sci. Data, 12, 2223–2259, https://doi.org/10.5194/essd-12-2223-2020, 2020.
Mollner, A. K., Valluvadasan, S., Feng, L., Sprague, M. K., Okumura, M., Milligan, D. B., Bloss, W. J., Sander, S. P., Martien, P. T., Harley, R. A., McCoy, A. B., and Carter, W. P. L.: Rate of Gas Phase Association of Hydroxyl Radical and Nitrogen Dioxide, Science, 330, 646–649, https://doi.org/10.1126/science.1193030, 2010.
Moore, F. L., Hintsa, E. J., Nance, D., Dutton, G., Hall, B., and Elkins, J. W.: Atmospheric Tomography Mission (ATom): Trace Gas Measurements from PANTHER Gas Chromatograph, ORNL DAAC, Oak Ridge, Tennessee, USA [data set], https://doi.org/10.3334/ORNLDAAC/1914, 2022.
Mora Garcia, S. L., Pandit, S., Navea, J. G., and Grassian, V. H.: Nitrous Acid (HONO) Formation from the Irradiation of Aqueous Nitrate Solutions in the Presence of Marine Chromophoric Dissolved Organic Matter: Comparison to Other Organic Photosensitizers, ACS Earth Space Chem., 5, 3056–3064, https://doi.org/10.1021/acsearthspacechem.1c00292, 2021.
Moxim, W. J., Levy, H., and Kasibhatla, P. S.: Simulated global tropospheric PAN: Its transport and impact on NOx, J. Geophys. Res., 101, 12621–12638, https://doi.org/10.1029/96JD00338, 1996.
Murphy, J. G., Thornton, J. A., Wooldridge, P. J., Day, D. A., Rosen, R. S., Cantrell, C., Shetter, R. E., Lefer, B., and Cohen, R. C.: Measurements of the sum of HO2NO2 and CH3O2NO2 in the remote troposphere, Atmos. Chem. Phys., 4, 377–384, https://doi.org/10.5194/acp-4-377-2004, 2004.
Murray, L. T.: Lightning NOx and Impacts on Air Quality, Curr. Pollution Rep., 2, 115–133, https://doi.org/10.1007/s40726-016-0031-7, 2016.
Murray, L. T., Jacob, D. J., Logan, J. A., Hudman, R. C., and Koshak, W. J.: Optimized regional and interannual variability of lightning in a global chemical transport model constrained by LIS/OTD satellite data, J. Geophys. Res.-Atmos., 117, D20307, https://doi.org/10.1029/2012JD017934, 2012.
Nault, B. A., Garland, C., Pusede, S. E., Wooldridge, P. J., Ullmann, K., Hall, S. R., and Cohen, R. C.: Measurements of CH3O2NO2 in the upper troposphere, Atmos. Meas. Tech., 8, 987–997, https://doi.org/10.5194/amt-8-987-2015, 2015.
Nault, B. A., Garland, C., Wooldridge, P. J., Brune, W. H., Campuzano-Jost, P., Crounse, J. D., Day, D. A., Dibb, J., Hall, S. R., Huey, L. G., Jimenez, J. L., Liu, X., Mao, J., Mikoviny, T., Peischl, J., Pollack, I. B., Ren, X., Ryerson, T. B., Scheuer, E., Ullmann, K., Wennberg, P. O., Wisthaler, A., Zhang, L., and Cohen, R. C.: Observational Constraints on the Oxidation of NOx in the Upper Troposphere, J. Phys. Chem. A, 120, 1468–1478, https://doi.org/10.1021/acs.jpca.5b07824, 2016.
Nault, B. A., Laughner, J. L., Wooldridge, P. J., Crounse, J. D., Dibb, J., Diskin, G., Peischl, J., Podolske, J. R., Pollack, I. B., Ryerson, T. B., Scheuer, E., Wennberg, P. O., and Cohen, R. C.: Lightning NOx Emissions: Reconciling Measured and Modeled Estimates With Updated NOx Chemistry, Geophys. Res. Lett., 44, 9479–9488, https://doi.org/10.1002/2017GL074436, 2017.
Nault, B. A., Campuzano-Jost, P., Day, D. A., Jo, D. S., Schroder, J. C., Allen, H. M., Bahreini, R., Bian, H., Blake, D. R., Chin, M., Clegg, S. L., Colarco, P. R., Crounse, J. D., Cubison, M. J., DeCarlo, P. F., Dibb, J. E., Diskin, G. S., Hodzic, A., Hu, W., Katich, J. M., Kim, M. J., Kodros, J. K., Kupc, A., Lopez-Hilfiker, F. D., Marais, E. A., Middlebrook, A. M., Andrew Neuman, J., Nowak, J. B., Palm, B. B., Paulot, F., Pierce, J. R., Schill, G. P., Scheuer, E., Thornton, J. A., Tsigaridis, K., Wennberg, P. O., Williamson, C. J., and Jimenez, J. L.: Chemical transport models often underestimate inorganic aerosol acidity in remote regions of the atmosphere, Commun. Earth Environ., 2, 93, https://doi.org/10.1038/s43247-021-00164-0, 2021.
Nissenson, P., Dabdub, D., Das, R., Maurino, V., Minero, C., and Vione, D.: Evidence of the water-cage effect on the photolysis of NO and FeOH. Implications of this effect and of H2O2 surface accumulation on photochemistry at the air–water interface of atmospheric droplets, Atmos. Environ., 44, 4859–4866, https://doi.org/10.1016/j.atmosenv.2010.08.035, 2010.
Nussbaumer, C. M., Parchatka, U., Tadic, I., Bohn, B., Marno, D., Martinez, M., Rohloff, R., Harder, H., Kluge, F., Pfeilsticker, K., Obersteiner, F., Zöger, M., Doerich, R., Crowley, J. N., Lelieveld, J., and Fischer, H.: Modification of a conventional photolytic converter for improving aircraft measurements of NO2 via chemiluminescence, Atmos. Meas. Tech., 14, 6759–6776, https://doi.org/10.5194/amt-14-6759-2021, 2021.
Osthoff, H. D., Brown, S. S., Ryerson, T. B., Fortin, T. J., Lerner, B. M., Williams, E. J., Pettersson, A., Baynard, T., Dubé, W. P., Ciciora, S. J., and Ravishankara, A. R.: Measurement of atmospheric NO2 by pulsed cavity ring-down spectroscopy, J. Geophys. Res., 111, D12305, https://doi.org/10.1029/2005JD006942, 2006.
Ott, L. E., Pickering, K. E., Stenchikov, G. L., Allen, D. J., DeCaria, A. J., Ridley, B., Lin, R.-F., Lang, S., and Tao, W.-K.: Production of lightning NOx and its vertical distribution calculated from three-dimensional cloud-scale chemical transport model simulations, J. Geophys. Res.-Atmos., 115, D04301, https://doi.org/10.1029/2009JD011880, 2010.
Pai, S. J., Heald, C. L., Pierce, J. R., Farina, S. C., Marais, E. A., Jimenez, J. L., Campuzano-Jost, P., Nault, B. A., Middlebrook, A. M., Coe, H., Shilling, J. E., Bahreini, R., Dingle, J. H., and Vu, K.: An evaluation of global organic aerosol schemes using airborne observations, Atmos. Chem. Phys., 20, 2637–2665, https://doi.org/10.5194/acp-20-2637-2020, 2020.
Palmer, P. I., Jacob, D. J., Chance, K., Martin, R. V., Spurr, R. J. D., Kurosu, T. P., Bey, I., Yantosca, R., Fiore, A., and Li, Q.: Air mass factor formulation for spectroscopic measurements from satellites: Application to formaldehyde retrievals from the Global Ozone Monitoring Experiment, J. Geophys. Res.-Atmos., 106, 14539–14550, https://doi.org/10.1029/2000JD900772, 2001.
Pickering, K. E., Thompson, A. M., Dickerson, R. R., Luke, W. T., McNamara, D. P., Greenberg, J. P., and Zimmerman, P. R.: Model calculations of tropospheric ozone production potential following observed convective events, J. Geophys. Res., 95, 14049, https://doi.org/10.1029/JD095iD09p14049, 1990.
Platt, U., Meinen, J., Pöhler, D., and Leisner, T.: Broadband Cavity Enhanced Differential Optical Absorption Spectroscopy (CE-DOAS) – applicability and corrections, Atmos. Meas. Tech., 2, 713–723, https://doi.org/10.5194/amt-2-713-2009, 2009.
Pollack, I. B., Lerner, B. M., and Ryerson, T. B.: Evaluation of ultraviolet light-emitting diodes for detection of atmospheric NO2 by photolysis – chemiluminescence, J. Atmos. Chem., 65, 111–125, https://doi.org/10.1007/s10874-011-9184-3, 2010.
Pollack, I. B., Ryerson, T. B., Trainer, M., Parrish, D. D., Andrews, A. E., Atlas, E. L., Blake, D. R., Brown, S. S., Commane, R., Daube, B. C., de Gouw, J. A., Dubé, W. P., Flynn, J., Frost, G. J., Gilman, J. B., Grossberg, N., Holloway, J. S., Kofler, J., Kort, E. A., Kuster, W. C., Lang, P. M., Lefer, B., Lueb, R. A., Neuman, J. A., Nowak, J. B., Novelli, P. C., Peischl, J., Perring, A. E., Roberts, J. M., Santoni, G., Schwarz, J. P., Spackman, J. R., Wagner, N. L., Warneke, C., Washenfelder, R. A., Wofsy, S. C., and Xiang, B.: Airborne and ground-based observations of a weekend effect in ozone, precursors, and oxidation products in the California South Coast Air Basin, J. Geophys. Res., 117, D00V05, https://doi.org/10.1029/2011JD016772, 2012.
Prather, M. J., Holmes, C. D., and Hsu, J.: Reactive greenhouse gas scenarios: Systematic exploration of uncertainties and the role of atmospheric chemistry, Geophys. Res. Lett., 39, L09803, https://doi.org/10.1029/2012GL051440, 2012.
Reed, C., Evans, M. J., Di Carlo, P., Lee, J. D., and Carpenter, L. J.: Interferences in photolytic NO2 measurements: explanation for an apparent missing oxidant?, Atmos. Chem. Phys., 16, 4707–4724, https://doi.org/10.5194/acp-16-4707-2016, 2016.
Reed, C., Evans, M. J., Crilley, L. R., Bloss, W. J., Sherwen, T., Read, K. A., Lee, J. D., and Carpenter, L. J.: Evidence for renoxification in the tropical marine boundary layer, Atmos. Chem. Phys., 17, 4081–4092, https://doi.org/10.5194/acp-17-4081-2017, 2017.
Richards-Henderson, N. K., Callahan, K. M., Nissenson, P., Nishino, N., Tobias, D. J., and Finlayson-Pitts, B. J.: Production of gas phase NO2 and halogens from the photolysis of thin water films containing nitrate, chloride and bromide ions at room temperature, Phys. Chem. Chem. Phys., 15, 17636, https://doi.org/10.1039/c3cp52956h, 2013.
Richards-Henderson, N. K., Anderson, C., Anastasio, C., and Finlayson-Pitts, B. J.: The effect of cations on NO2 production from the photolysis of aqueous thin water films of nitrate salts, Phys. Chem. Chem. Phys., 17, 32211–32218, https://doi.org/10.1039/C5CP05325K, 2015.
Richter, A., Burrows, J. P., Nüß, H., Granier, C., and Niemeier, U.: Increase in tropospheric nitrogen dioxide over China observed from space, Nature, 437, 129–132, https://doi.org/10.1038/nature04092, 2005.
Ridley, B. A., Carroll, M. A., Gregory, G. L., and Sachse, G. W.: NO and NO2 in the troposphere: Technique and measurements in regions of a folded tropopause, J. Geophys. Res., 93, 15813, https://doi.org/10.1029/JD093iD12p15813, 1988.
Rollins, A. W., Rickly, P. S., Gao, R.-S., Ryerson, T. B., Brown, S. S., Peischl, J., and Bourgeois, I.: Single-photon laser-induced fluorescence detection of nitric oxide at sub-parts-per-trillion mixing ratios, Atmos. Meas. Tech., 13, 2425–2439, https://doi.org/10.5194/amt-13-2425-2020, 2020.
Romer, P. S., Wooldridge, P. J., Crounse, J. D., Kim, M. J., Wennberg, P. O., Dibb, J. E., Scheuer, E., Blake, D. R., Meinardi, S., Brosius, A. L., Thames, A. B., Miller, D. O., Brune, W. H., Hall, S. R., Ryerson, T. B., and Cohen, R. C.: Constraints on Aerosol Nitrate Photolysis as a Potential Source of HONO and NOx, Environ. Sci. Technol., 52, 13738–13746, https://doi.org/10.1021/acs.est.8b03861, 2018.
Ryerson, T. B., Buhr, M. P., Frost, G. J., Goldan, P. D., Holloway, J. S., Hübler, G., Jobson, B. T., Kuster, W. C., McKeen, S. A., Parrish, D. D., Roberts, J. M., Sueper, D. T., Trainer, M., Williams, J., and Fehsenfeld, F. C.: Emissions lifetimes and ozone formation in power plant plumes, J. Geophys. Res., 103, 22569–22583, https://doi.org/10.1029/98JD01620, 1998.
Ryerson, T. B., Williams, E. J., and Fehsenfeld, F. C.: An efficient photolysis system for fast-response NO2 measurements, J. Geophys. Res.-Atmos., 105, 26447–26461, https://doi.org/10.1029/2000JD900389, 2000.
Sachse, G. W., Collins Jr., J. E., Hill, G. F., Wade, L. O., Burney, L. G., and Ritter, J. A.: Airborne tunable diode laser sensor for high-precision concentration and flux measurements of carbon monoxide and methane, Optics, Electro-Optics, and Laser Applications in Science and Engineering, 1 May 1991, Los Angeles, CA, USA, 157, https://doi.org/10.1117/12.46162, 1991.
Sandholm, S. T., Bradshaw, J. D., Dorris, K. S., Rodgers, M. O., and Davis, D. D.: An airborne compatible photofragmentation two-photon laser-induced fluorescence instrument for measuring background tropospheric levels of NO, NOx, and NO2, J. Geophys. Res., 95, 10155–10161, https://doi.org/10.1029/JD095iD07p10155, 1990.
Scharko, N. K., Berke, A. E., and Raff, J. D.: Release of Nitrous Acid and Nitrogen Dioxide from Nitrate Photolysis in Acidic Aqueous Solutions, Environ. Sci. Technol., 48, 11991–12001, https://doi.org/10.1021/es503088x, 2014.
Schmidt, J. A., Jacob, D. J., Horowitz, H. M., Hu, L., Sherwen, T., Evans, M. J., Liang, Q., Suleiman, R. M., Oram, D. E., Le Breton, M., Percival, C. J., Wang, S., Dix, B., and Volkamer, R.: Modeling the Observed Tropospheric BrO Background: Importance of Multiphase Chemistry and Implications for Ozone, OH, and Mercury, J. Geophys. Res.-Atmos., 121, 11819–11835, https://doi.org/10.1002/2015JD024229, 2016.
Schumann, U. and Huntrieser, H.: The global lightning-induced nitrogen oxides source, Atmos. Chem. Phys., 7, 3823–3907, https://doi.org/10.5194/acp-7-3823-2007, 2007.
Schwantes, R. H., Lacey, F. G., Tilmes, S., Emmons, L. K., Lauritzen, P. H., Walters, S., Callaghan, P., Zarzycki, C. M., Barth, M. C., Jo, D. S., Bacmeister, J. T., Neale, R. B., Vitt, F., Kluzek, E., Roozitalab, B., Hall, S. R., Ullmann, K., Warneke, C., Peischl, J., Pollack, I. B., Flocke, F., Wolfe, G. M., Hanisco, T. F., Keutsch, F. N., Kaiser, J., Bui, T. P. V., Jimenez, J. L., Campuzano-Jost, P., Apel, E. C., Hornbrook, R. S., Hills, A. J., Yuan, B., and Wisthaler, A.: Evaluating the Impact of Chemical Complexity and Horizontal Resolution on Tropospheric Ozone Over the Conterminous US With a Global Variable Resolution Chemistry Model, J. Adv. Model. Earth Syst., 14, e2021MS002889, https://doi.org/10.1029/2021MS002889, 2022.
SEAC4RS Science Team: SEAC4RS Field Campaign Data, NASA [data set], https://doi.org/10.5067/Aircraft/SEAC4RS/Aerosol-TraceGas-Cloud, 2014.
Seinfeld, J. H. and Pandis, S. N.: Atmospheric chemistry and physics: from air pollution to climate change, Third edition., John Wiley & Sons, Hoboken, New Jersey, ISBN 978-1-119-22117-3, 2016.
Seltzer, K. M., Vizuete, W., and Henderson, B. H.: Evaluation of updated nitric acid chemistry on ozone precursors and radiative effects, Atmos. Chem. Phys., 15, 5973–5986, https://doi.org/10.5194/acp-15-5973-2015, 2015.
Shah, V., Jacob, D. J., Li, K., Silvern, R. F., Zhai, S., Liu, M., Lin, J., and Zhang, Q.: Effect of changing NOx lifetime on the seasonality and long-term trends of satellite-observed tropospheric NO2 columns over China, Atmos. Chem. Phys., 20, 1483–1495, https://doi.org/10.5194/acp-20-1483-2020, 2020.
Shetter, R. E. and Müller, M.: Photolysis frequency measurements using actinic flux spectroradiometry during the PEM-Tropics mission: Instrumentation description and some results, J. Geophys. Res., 104, 5647–5661, https://doi.org/10.1029/98JD01381, 1999.
Shi, Q., Tao, Y., Krechmer, J. E., Heald, C. L., Murphy, J. G., Kroll, J. H., and Ye, Q.: Laboratory Investigation of Renoxification from the Photolysis of Inorganic Particulate Nitrate, Environ. Sci. Technol., 55, 854–861, https://doi.org/10.1021/acs.est.0c06049, 2021.
Silvern, R. F., Jacob, D. J., Travis, K. R., Sherwen, T., Evans, M. J., Cohen, R. C., Laughner, J. L., Hall, S. R., Ullmann, K., Crounse, J. D., Wennberg, P. O., Peischl, J., and Pollack, I. B.: Observed NO NO2 Ratios in the Upper Troposphere Imply Errors in NO-NO2-O3 Cycling Kinetics or an Unaccounted NO x Reservoir, Geophys. Res. Lett., 45, 4466–4474, https://doi.org/10.1029/2018GL077728, 2018.
Silvern, R. F., Jacob, D. J., Mickley, L. J., Sulprizio, M. P., Travis, K. R., Marais, E. A., Cohen, R. C., Laughner, J. L., Choi, S., Joiner, J., and Lamsal, L. N.: Using satellite observations of tropospheric NO2 columns to infer long-term trends in US NOx emissions: the importance of accounting for the free tropospheric NO2 background, Atmos. Chem. Phys., 19, 8863–8878, https://doi.org/10.5194/acp-19-8863-2019, 2019.
Simone, N. W., Stettler, M. E. J., and Barrett, S. R. H.: Rapid estimation of global civil aviation emissions with uncertainty quantification, Transp. Res. D Transp., 25, 33–41, https://doi.org/10.1016/j.trd.2013.07.001, 2013.
Singh, H. B., Salas, L. J., and Viezee, W.: Global distribution of peroxyacetyl nitrate, Nature, 321, 588–591, https://doi.org/10.1038/321588a0, 1986.
Singh, H. B., Herlth, D., Kolyer, R., Salas, L., Bradshaw, J. D., Sandholm, S. T., Davis, D. D., Crawford, J., Kondo, Y., Koike, M., Talbot, R., Gregory, G. L., Sachse, G. W., Browell, E., Blake, D. R., Rowland, F. S., Newell, R., Merrill, J., Heikes, B., Liu, S. C., Crutzen, P. J., and Kanakidou, M.: Reactive nitrogen and ozone over the western Pacific: Distribution, partitioning, and sources, J. Geophys. Res., 101, 1793–1808, https://doi.org/10.1029/95JD01029, 1996.
Singh, H. B., Salas, L., Herlth, D., Kolyer, R., Czech, E., Avery, M., Crawford, J. H., Pierce, R. B., Sachse, G. W., Blake, D. R., Cohen, R. C., Bertram, T. H., Perring, A., Wooldridge, P. J., Dibb, J., Huey, G., Hudman, R. C., Turquety, S., Emmons, L. K., Flocke, F., Tang, Y., Carmichael, G. R., and Horowitz, L. W.: Reactive nitrogen distribution and partitioning in the North American troposphere and lowermost stratosphere, J. Geophys. Res., 112, D12S04, https://doi.org/10.1029/2006JD007664, 2007.
Sparks, T. L., Ebben, C. J., Wooldridge, P. J., Lopez-Hilfiker, F. D., Lee, B. H., Thornton, J. A., McDuffie, E. E., Fibiger, D. L., Brown, S. S., Montzka, D. D., Weinheimer, A. J., Schroder, J. C., Campuzano-Jost, P., Jimenez, J. L., and Cohen, R. C.: Comparison of Airborne Reactive Nitrogen Measurements During WINTER, J. Geophys. Res.-Atmos., 124, 10483–10502, https://doi.org/10.1029/2019JD030700, 2019.
Stettler, M. E. J., Eastham, S., and Barrett, S. R. H.: Air quality and public health impacts of UK airports. Part I: Emissions, Atmos. Environ., 45, 5415–5424, https://doi.org/10.1016/j.atmosenv.2011.07.012, 2011.
Strahan, S. E., Duncan, B. N., and Hoor, P.: Observationally derived transport diagnostics for the lowermost stratosphere and their application to the GMI chemistry and transport model, Atmos. Chem. Phys., 7, 2435–2445, https://doi.org/10.5194/acp-7-2435-2007, 2007.
Strode, S. A., Rodriguez, J. M., Logan, J. A., Cooper, O. R., Witte, J. C., Lamsal, L. N., Damon, M., Van Aartsen, B., Steenrod, S. D., and Strahan, S. E.: Trends and variability in surface ozone over the United States, J. Geophys. Res.-Atmos., 120, 9020–9042, https://doi.org/10.1002/2014JD022784, 2015.
Strode, S. A., Steenrod, S. D., Nicely, J. M., Liu, J., Damon, M. R., and Strahan, S. E.: ATom: Global Modeling Initiative (GMI) Chemical Transport Model (CTM) Output. ORNL DAAC, Oak Ridge, Tennessee, USA [data set], https://doi.org/10.3334/ORNLDAAC/1897, 2021.
Thames, A. B., Brune, W. H., Miller, D. O., Allen, H. M., Apel, E. C., Blake, D. R., Bui, T. P., Commane, R., Crounse, J. D., Daube, B. C., Diskin, G. S., DiGangi, J. P., Elkins, J. W., Hall, S. R., Hanisco, T. F., Hannun, R. A., Hintsa, E., Hornbrook, R. S., Kim, M. J., McKain, K., Moore, F. L., Nicely, J. M., Peischl, J., Ryerson, T. B., St. Clair, J. M., Sweeney, C., Teng, A., Thompson, C. R., Ullmann, K., Wennberg, P. O., and Wolfe, G. M.: Missing OH reactivity in the global marine boundary layer, Atmos. Chem. Phys., 20, 4013–4029, https://doi.org/10.5194/acp-20-4013-2020, 2020.
The International GEOS-Chem User Community: GEOS-Chem 12.9.2, Zenodo [code], https://doi.org/10.5281/zenodo.3959279, 2020.
Thompson, C. R., Wofsy, S. C., Prather, M. J., Newman, P. A., Hanisco, T. F., Ryerson, T. B., Fahey, D. W., Apel, E. C., Brock, C. A., Brune, W. H., Froyd, K., Katich, J. M., Nicely, J. M., Peischl, J., Ray, E., Veres, P. R., Wang, S., Allen, H. M., Asher, E., Bian, H., Blake, D., Bourgeois, I., Budney, J., Bui, T. P., Butler, A., Campuzano-Jost, P., Chang, C., Chin, M., Commane, R., Correa, G., Crounse, J. D., Daube, B., Dibb, J. E., DiGangi, J. P., Diskin, G. S., Dollner, M., Elkins, J. W., Fiore, A. M., Flynn, C. M., Guo, H., Hall, S. R., Hannun, R. A., Hills, A., Hintsa, E. J., Hodzic, A., Hornbrook, R. S., Huey, L. G., Jimenez, J. L., Keeling, R. F., Kim, M. J., Kupc, A., Lacey, F., Lait, L. R., Lamarque, J.-F., Liu, J., McKain, K., Meinardi, S., Miller, D. O., Montzka, S. A., Moore, F. L., Morgan, E. J., Murphy, D. M., Murray, L. T., Nault, B. A., Neuman, J. A., Nguyen, L., Gonzalez, Y., Rollins, A., Rosenlof, K., Sargent, M., Schill, G., Schwarz, J. P., Clair, J. M. St., Steenrod, S. D., Stephens, B. B., Strahan, S. E., Strode, S. A., Sweeney, C., Thames, A. B., Ullmann, K., Wagner, N., Weber, R., Weinzierl, B., Wennberg, P. O., Williamson, C. J., Wolfe, G. M., and Zeng, L.: The NASA Atmospheric Tomography (ATom) Mission: Imaging the Chemistry of the Global Atmosphere, B. Am. Meteorol. Soc., 103, E761–E790, https://doi.org/10.1175/BAMS-D-20-0315.1, 2022.
Thornton, J. A., Wooldridge, P. J., and Cohen, R. C.: Atmospheric NO2: In Situ Laser-Induced Fluorescence Detection at Parts per Trillion Mixing Ratios, Anal. Chem., 72, 528–539, https://doi.org/10.1021/ac9908905, 2000.
Thornton, J. A., Wooldridge, P. J., Cohen, R. C., Williams, E. J., Hereid, D., Fehsenfeld, F. C., Stutz, J., and Alicke, B.: Comparisons of in situ and long path measurements of NO2 in urban plumes, J. Geophys. Res., 108, 4496, https://doi.org/10.1029/2003JD003559, 2003.
Tian, Y., Yang, G.-P., Liu, C.-Y., Li, P.-F., Chen, H.-T., and Bange, H. W.: Photoproduction of nitric oxide in seawater, Ocean Sci., 16, 135–148, https://doi.org/10.5194/os-16-135-2020, 2020.
Toon, O. B., Maring, H., Dibb, J., Ferrare, R., Jacob, D. J., Jensen, E. J., Luo, Z. J., Mace, G. G., Pan, L. L., Pfister, L., Rosenlof, K. H., Redemann, J., Reid, J. S., Singh, H. B., Thompson, A. M., Yokelson, R., Minnis, P., Chen, G., Jucks, K. W., and Pszenny, A.: Planning, implementation, and scientific goals of the Studies of Emissions and Atmospheric Composition, Clouds and Climate Coupling by Regional Surveys (SEAC4RS) field mission, J. Geophys. Res.-Atmos., 121, 4967–5009, https://doi.org/10.1002/2015JD024297, 2016.
Torres, A. L. and Thompson, A. M.: Nitric oxide in the equatorial Pacific boundary layer: SAGA 3 measurements, J. Geophys. Res., 98, 16949, https://doi.org/10.1029/92JD01906, 1993.
Travis, K. R., Jacob, D. J., Fisher, J. A., Kim, P. S., Marais, E. A., Zhu, L., Yu, K., Miller, C. C., Yantosca, R. M., Sulprizio, M. P., Thompson, A. M., Wennberg, P. O., Crounse, J. D., St. Clair, J. M., Cohen, R. C., Laughner, J. L., Dibb, J. E., Hall, S. R., Ullmann, K., Wolfe, G. M., Pollack, I. B., Peischl, J., Neuman, J. A., and Zhou, X.: Why do models overestimate surface ozone in the Southeast United States?, Atmos. Chem. Phys., 16, 13561–13577, https://doi.org/10.5194/acp-16-13561-2016, 2016.
Travis, K. R., Heald, C. L., Allen, H. M., Apel, E. C., Arnold, S. R., Blake, D. R., Brune, W. H., Chen, X., Commane, R., Crounse, J. D., Daube, B. C., Diskin, G. S., Elkins, J. W., Evans, M. J., Hall, S. R., Hintsa, E. J., Hornbrook, R. S., Kasibhatla, P. S., Kim, M. J., Luo, G., McKain, K., Millet, D. B., Moore, F. L., Peischl, J., Ryerson, T. B., Sherwen, T., Thames, A. B., Ullmann, K., Wang, X., Wennberg, P. O., Wolfe, G. M., and Yu, F.: Constraining remote oxidation capacity with ATom observations, Atmos. Chem. Phys., 20, 7753–7781, https://doi.org/10.5194/acp-20-7753-2020, 2020.
U.S. EPA Air Pollutant Emissions Trends Data: https://www.epa.gov/air-emissions-inventories/air-pollutant-emissions-trends-data, last access: 15 July 2021.
U.S. EPA 2011 NEI: https://www.epa.gov/air-emissions-inventories/2011-national-emissions-inventory-nei-data, last access: 15 July 2021.
van Geffen, J., Eskes, H., Compernolle, S., Pinardi, G., Verhoelst, T., Lambert, J.-C., Sneep, M., ter Linden, M., Ludewig, A., Boersma, K. F., and Veefkind, J. P.: Sentinel-5P TROPOMI NO2 retrieval: impact of version v2.2 improvements and comparisons with OMI and ground-based data, Atmos. Meas. Tech., 15, 2037–2060, https://doi.org/10.5194/amt-15-2037-2022, 2022.
Vinken, G. C. M., Boersma, K. F., Jacob, D. J., and Meijer, E. W.: Accounting for non-linear chemistry of ship plumes in the GEOS-Chem global chemistry transport model, Atmos. Chem. Phys., 11, 11707–11722, https://doi.org/10.5194/acp-11-11707-2011, 2011.
Vlemmix, T., Piters, A. J. M., Berkhout, A. J. C., Gast, L. F. L., Wang, P., and Levelt, P. F.: Ability of the MAX-DOAS method to derive profile information for NO2: can the boundary layer and free troposphere be separated?, Atmos. Meas. Tech., 4, 2659–2684, https://doi.org/10.5194/amt-4-2659-2011, 2011.
Volkamer, R., Baidar, S., Campos, T. L., Coburn, S., DiGangi, J. P., Dix, B., Eloranta, E. W., Koenig, T. K., Morley, B., Ortega, I., Pierce, B. R., Reeves, M., Sinreich, R., Wang, S., Zondlo, M. A., and Romashkin, P. A.: Aircraft measurements of BrO, IO, glyoxal, NO2, H2O, O2–O2 and aerosol extinction profiles in the tropics: comparison with aircraft-/ship-based in situ and lidar measurements, Atmos. Meas. Tech., 8, 2121–2148, https://doi.org/10.5194/amt-8-2121-2015, 2015.
Walega, J. G., Dye, J. E., Grahek, F. E., and Ridley, B. K.: Compact measurement system for the simultaneous determination of NO, NO2, NOy, and O3 using a small aircraft, Optics, Electro-Optics, and Laser Applications in Science and Engineering, 1 May 1991, Los Angeles, CA, 232, https://doi.org/10.1117/12.46167, 1991.
Wang, X., Jacob, D. J., Eastham, S. D., Sulprizio, M. P., Zhu, L., Chen, Q., Alexander, B., Sherwen, T., Evans, M. J., Lee, B. H., Haskins, J. D., Lopez-Hilfiker, F. D., Thornton, J. A., Huey, G. L., and Liao, H.: The role of chlorine in global tropospheric chemistry, Atmos. Chem. Phys., 19, 3981–4003, https://doi.org/10.5194/acp-19-3981-2019, 2019.
Wang, X., Jacob, D. J., Downs, W., Zhai, S., Zhu, L., Shah, V., Holmes, C. D., Sherwen, T., Alexander, B., Evans, M. J., Eastham, S. D., Neuman, J. A., Veres, P. R., Koenig, T. K., Volkamer, R., Huey, L. G., Bannan, T. J., Percival, C. J., Lee, B. H., and Thornton, J. A.: Global tropospheric halogen (Cl, Br, I) chemistry and its impact on oxidants, Atmos. Chem. Phys., 21, 13973–13996, https://doi.org/10.5194/acp-21-13973-2021, 2021.
Wang, Y., Logan, J. A., and Jacob, D. J.: Global simulation of tropospheric O3-NOx -hydrocarbon chemistry: 2. Model evaluation and global ozone budget, J. Geophys. Res., 103, 10727–10755, https://doi.org/10.1029/98JD00157, 1998.
Warneck, P. and Wurzinger, C.: Product quantum yields for the 305-nm photodecomposition of nitrate in aqueous solution, J. Phys. Chem., 92, 6278–6283, https://doi.org/10.1021/j100333a022, 1988.
Weng, H., Lin, J., Martin, R., Millet, D. B., Jaeglé, L., Ridley, D., Keller, C., Li, C., Du, M., and Meng, J.: Global high-resolution emissions of soil NOx, sea salt aerosols, and biogenic volatile organic compounds, Sci. Data, 7, 148, https://doi.org/10.1038/s41597-020-0488-5, 2020.
Wild, O. and Prather, M. J.: Excitation of the Primary Tropospheric Chemical Mode in a Global Three-Dimensional Model, J. Geophys. Res., 105, 24647–24660, https://doi.org/10.1029/2000JD900399, 2000.
Williams, J. E., Boersma, K. F., Le Sager, P., and Verstraeten, W. W.: The high-resolution version of TM5-MP for optimized satellite retrievals: description and validation, Geosci. Model Dev., 10, 721–750, https://doi.org/10.5194/gmd-10-721-2017, 2017.
Wingen, L. M., Moskun, A. C., Johnson, S. N., Thomas, J. L., Roeselová, M., Tobias, D. J., Kleinman, M. T., and Finlayson-Pitts, B. J.: Enhanced surface photochemistry in chloride–nitrate ion mixtures, Phys. Chem. Chem. Phys., 10, 5668, https://doi.org/10.1039/b806613b, 2008.
Wisthaler, A., Hansel, A., Dickerson, R. R., and Crutzen, P. J.: Organic trace gas measurements by PTR-MS during INDOEX 1999, J. Geophys. Res., 107, 8024, https://doi.org/10.1029/2001JD000576, 2002.
Wofsy, S. C., Afshar, S., Allen, H. M., Apel, E. C., Asher, E. C., Barletta, B., Bent, J., Bian, H., Biggs, B. C., Blake, D. R., Blake, N., Bourgeois, I., Brock, C. A., Brune, W. H., Budney, J. W., Bui, T. P., Butler, A., Campuzano-Jost, P., Chang, C. S., Chin, M., Commane, R., Correa, G., Crounse, J. D., Cullis, P. D., Daube, B. C., Day, D. A., Dean-Day, J. M., Dibb, J. E., DiGangi, J. P., Diskin, G. S., Dollner, M., Elkins, J. W., Erdesz, F., Fiore, A. M., Flynn, C. M., Froyd, K. D., Gesler, D. W., Hall, S. R., Hanisco, T. F., Hannun, R. A., Hills, A. J., Hintsa, E. J., Hoffman, A., Hornbrook, R. S., Huey, L. G., Hughes, S., Jimenez, J. L., Johnson, B. J., Katich, J. M., Keeling, R. F., Kim, M. J., Kupc, A., Lait, L. R., McKain, K., Mclaughlin, R. J., Meinardi, S., Miller, D. O., Montzka, S. A., Moore, F. L., Morgan, E. J., Murphy, D. M., Murray, L. T., Nault, B. A., Neuman, J. A., Newman, P. A., Nicely, J. M., Pan, X., Paplawsky, W., Peischl, J., Prather, M. J., Price, D. J., Ray, E. A., Reeves, J. M., Richardson, M., Rollins, A. W., Rosenlof, K. H., Ryerson, T. B., Scheuer, E., Schill, G. P., Schroder, J. C., Schwarz, J. P., St.Clair, J. M., Steenrod, S. D., Stephens, B. B., Strode, S. A., Sweeney, C., Tanner, D., Teng, A. P., Thames, A. B., Thompson, C. R., Ullmann, K., Veres, P. R., Wagner, N. L., Watt, A., Weber, R., Weinzierl, B. B., Wennberg, P. O., Williamson, C. J., Wilson, J. C., Wolfe, G. M., Woods, C. T., Zeng, L. H., and Vieznor, N.: ATom: Merged Atmospheric Chemistry, Trace Gases, and Aerosols, Version 2. ORNL DAAC, Oak Ridge, Tennessee, USA [data set], https://doi.org/10.3334/ORNLDAAC/1925, 2021.
Wooldridge, P. J., Perring, A. E., Bertram, T. H., Flocke, F. M., Roberts, J. M., Singh, H. B., Huey, L. G., Thornton, J. A., Wolfe, G. M., Murphy, J. G., Fry, J. L., Rollins, A. W., LaFranchi, B. W., and Cohen, R. C.: Total Peroxy Nitrates (ΣPNs) in the atmosphere: the Thermal Dissociation-Laser Induced Fluorescence (TD-LIF) technique and comparisons to speciated PAN measurements, Atmos. Meas. Tech., 3, 593–607, https://doi.org/10.5194/amt-3-593-2010, 2010.
Ye, C., Zhou, X., Pu, D., Stutz, J., Festa, J., Spolaor, M., Tsai, C., Cantrell, C., Mauldin, R. L., Campos, T., Weinheimer, A., Hornbrook, R. S., Apel, E. C., Guenther, A., Kaser, L., Yuan, B., Karl, T., Haggerty, J., Hall, S., Ullmann, K., Smith, J. N., Ortega, J., and Knote, C.: Rapid cycling of reactive nitrogen in the marine boundary layer, Nature, 532, 489–491, https://doi.org/10.1038/nature17195, 2016.
Ye, C., Heard, D. E., and Whalley, L. K.: Evaluation of Novel Routes for NOx Formation in Remote Regions, Environ. Sci. Technol., 51, 7442–7449, https://doi.org/10.1021/acs.est.6b06441, 2017a.
Ye, C., Zhang, N., Gao, H., and Zhou, X.: Photolysis of Particulate Nitrate as a Source of HONO and NOx, Environ. Sci. Technol., 51, 6849–6856, https://doi.org/10.1021/acs.est.7b00387, 2017b.
Ye, C., Zhang, N., Gao, H., and Zhou, X.: Matrix effect on surface-catalyzed photolysis of nitric acid, Sci. Rep., 9, 4351, https://doi.org/10.1038/s41598-018-37973-x, 2019.
Yu, K., Jacob, D. J., Fisher, J. A., Kim, P. S., Marais, E. A., Miller, C. C., Travis, K. R., Zhu, L., Yantosca, R. M., Sulprizio, M. P., Cohen, R. C., Dibb, J. E., Fried, A., Mikoviny, T., Ryerson, T. B., Wennberg, P. O., and Wisthaler, A.: Sensitivity to grid resolution in the ability of a chemical transport model to simulate observed oxidant chemistry under high-isoprene conditions, Atmos. Chem. Phys., 16, 4369–4378, https://doi.org/10.5194/acp-16-4369-2016, 2016.
Zatko, M., Geng, L., Alexander, B., Sofen, E., and Klein, K.: The impact of snow nitrate photolysis on boundary layer chemistry and the recycling and redistribution of reactive nitrogen across Antarctica and Greenland in a global chemical transport model, Atmos. Chem. Phys., 16, 2819–2842, https://doi.org/10.5194/acp-16-2819-2016, 2016.
Zhang, R., Gen, M., Huang, D., Li, Y., and Chan, C. K.: Enhanced Sulfate Production by Nitrate Photolysis in the Presence of Halide Ions in Atmospheric Particles, Environ. Sci. Technol., 54, 3831–3839, https://doi.org/10.1021/acs.est.9b06445, 2020.
Zheng, B., Tong, D., Li, M., Liu, F., Hong, C., Geng, G., Li, H., Li, X., Peng, L., Qi, J., Yan, L., Zhang, Y., Zhao, H., Zheng, Y., He, K., and Zhang, Q.: Trends in China's anthropogenic emissions since 2010 as the consequence of clean air actions, Atmos. Chem. Phys., 18, 14095–14111, https://doi.org/10.5194/acp-18-14095-2018, 2018.
Zhu, C., Xiang, B., Zhu, L., and Cole, R.: Determination of absorption cross sections of surface-adsorbed HNO3 in the 290–330 nm region by Brewster angle cavity ring-down spectroscopy, Chem. Phys. Lett., 458, 373–377, https://doi.org/10.1016/j.cplett.2008.04.125, 2008.
Zhu, C., Xiang, B., Chu, L. T., and Zhu, L.: 308 nm Photolysis of Nitric Acid in the Gas Phase, on Aluminum Surfaces, and on Ice Films, J. Phys. Chem. A, 114, 2561–2568, https://doi.org/10.1021/jp909867a, 2010.
Zhu, Q., Laughner, J. L., and Cohen, R. C.: Lightning NO2 simulation over the contiguous US and its effects on satellite NO2 retrievals, Atmos. Chem. Phys., 19, 13067–13078, https://doi.org/10.5194/acp-19-13067-2019, 2019.
Zhu, Y., Wang, Y., Zhou, X., Elshorbany, Y. F., Ye, C., Hayden, M., and Peters, A. J.: An investigation into the chemistry of HONO in the marine boundary layer at Tudor Hill Marine Atmospheric Observatory in Bermuda, Atmos. Chem. Phys., 22, 6327–6346, https://doi.org/10.5194/acp-22-6327-2022, 2022.