the Creative Commons Attribution 4.0 License.
the Creative Commons Attribution 4.0 License.
 | 04 Jan 2023
Formaldehyde and hydroperoxide distribution around the Arabian Peninsula – evaluation of EMAC model results with ship-based measurements
Bettina Brendel
John N. Crowley
Philipp G. Eger
Hartwig Harder
Monica Martinez
Andrea Pozzer
Roland Rohloff
Jan Schuladen
Sebastian Tauer
David Walter
Jos Lelieveld
Horst Fischer
Formaldehyde (HCHO), hydrogen peroxide (H2O2) and organic hydroperoxides (ROOH) play a key role in atmospheric oxidation processes. They act as sources and sinks for HOx radicals (OH + HO2), with OH as the primary oxidant that governs the atmospheric self-cleaning capacity. Measurements of these species allow for evaluation of chemistry-transport models which need to account for multifarious source distributions, transport, complex photochemical reaction pathways and deposition processes of these species. HCHO is an intermediate during the oxidation of volatile organic compounds (VOCs) and is an indicator of photochemical activity and combustion-related emissions. In this study, we use in situ observations of HCHO, H2O2 and ROOH in the marine boundary layer (MBL) to evaluate results of the general circulation model EMAC (ECHAM5/MESSy2 Atmospheric Chemistry; European Center HAMburg, Modular Earth Submodel System). The dataset was obtained during the Air Quality and Climate Change in the Arabian Basin (AQABA) ship campaign around the Arabian Peninsula in summer 2017. This region is characterized by high levels of photochemical air pollution, humidity and solar irradiation, especially in the areas around the Suez Canal and the Arabian Gulf. High levels of air pollution with up to 12 ppbv HCHO, 2.3 ppbv ROOH and relatively low levels of H2O2 (≤0.5 ppbv) were detected over the Arabian Gulf. We find that EMAC failed to predict absolute mixing ratios of HCHO and ROOH during high-pollution events over the Arabian Gulf, while it reproduced HCHO on average within a factor of 2. Dry deposition velocities were determined for HCHO and H2O2 at night with 0.77±0.29 cm s−1 for HCHO and 1.03±0.52 cm s−1 for H2O2 over the Arabian Sea, which were matched by EMAC. The photochemical budget of H2O2 revealed elevated HOx radical concentrations in EMAC, which resulted in an overestimation of H2O2 by more than a factor of 5 for the AQABA dataset. The underestimated air pollution over the Arabian Gulf was related to EMAC's coarse spatial resolution and missing anthropogenic emissions in the model.
- Article
(5390 KB) - Full-text XML
-
Supplement
(4321 KB) - BibTeX
- EndNote


The effects of anthropogenic emission of greenhouse gases and aerosols and their increasing impact on climate and air quality represent a global threat. Industrialization enabled the economic development to the modern society, which is characterized by urbanization and immense population growth. Large shares of agriculture and industry are coupled to the utilization of fossil fuels, and thus, emission controls and the characterization of air quality and its health impacts are of increasing importance. Globally, fossil-fuel-related emissions account for about 65 % of the excess mortality and 70 % of the climate cooling by anthropogenic aerosols (Lelieveld et al., 2019). Worldwide some of the largest hydrocarbon reservoirs are being exploited by the oil and gas industry in the Middle East, increasing also the local ship traffic drastically. The emission of volatile organic compounds (VOCs) and nitrogen oxides (NOx= NO + NO2) by combustion processes make this region a hotspot of air pollution and favor the production of tropospheric ozone (O3). The Arabian Peninsula is overall characterized by unique atmospheric conditions (e.g., high temperatures and intense solar irradiation, accompanied by aridity, low cloudiness and occasional dust storms), which classifies the region as a unique environment to study the abundance of atmospheric pollutants and their processing through photochemical oxidation.
The oxidation capacity of the atmosphere determines its self-cleaning ability and is mainly controlled by hydroxyl (OH) radicals in the gas phase. OH oxidizes methane (CH4) and other VOCs so that these gases are efficiently removed from the atmosphere, e.g., by transition into the particle phase and subsequent rainout. Lelieveld et al. (2016) showed that global OH concentrations are buffered with a mean recycling probability of 67 %, indicating that OH is not very sensitive to perturbations by natural or anthropogenic emission changes. This buffering mechanism is based on complementary primary and secondary production of OH, e.g., through photo dissociation of ozone (O3), reservoir species and radical recycling mechanisms (Lelieveld et al., 2016). OH recycling is generally dominated by the reaction of peroxy radicals with NO, which is referred to as the NOx recycling mechanism of OH.
Besides hydroxyl radicals, peroxides are a main contributor to the oxidation capacity of the atmosphere, especially in the liquid phase. Further, H2O2 plays a key role in atmospheric sulfate formation and acts as a temporary reservoir for OH. With its lifetime of several hours, H2O2 enables horizontal and vertical transport of HOx by, e.g., advection/convection of air masses (Nussbaumer et al., 2021a). However, H2O2 also transitions readily into the liquid phase and thus also acts as a net sink for HOx radicals via its dry and wet deposition. To understand the H2O2 budget and its diurnal variability, it is necessary to consider all physical and chemical processes within the atmosphere. Besides the net photochemical production (production minus loss) and deposition, horizontal and vertical transport have to be considered. The variation in the H2O2 mixing ratio in the absence of clouds during the day can be described by Eq. (1) (Fischer et al., 2019):
with Pchem as the sum of all photochemical production terms and Lchem as the sum of photochemical losses. The third term describes vertical transport in the well-mixed boundary layer, which is determined by entrainment and deposition. ωe represents the entrainment velocity with Δ[H2O2] as the concentration difference between the boundary layer and the free troposphere. The deposition is determined by the deposition velocity (Vdep) and the boundary layer height (hBL). The last term describes the effect of horizontal transport on the H2O2 budget due to a gradient in H2O2 mixing ratios (−∇(v[H2O2])).
The dominant photochemical source of H2O2 is the recombination of HO2 radicals which involves a collision partner (M) usually nitrogen (N2), oxygen (O2) or water vapor (H2O):
The production of H2O2 via Reaction (R1) competes with the reaction of nitrogen monoxide (NO) and HO2 in Reaction (R2), which is one of the most important reactions in the troposphere to recycle OH radicals (Lelieveld et al., 2016).
The photochemical formation of peroxides therefore depends to a large extent on the abundance of NOx, as elevated mixing ratios of NO (∼100 pptv and higher) substantially suppress peroxide formation (Lee et al., 2000). Photochemical loss reactions of H2O2 are the conversion by OH radicals to HO2 radicals (Reaction R3) and photolysis as a source of OH (Reaction R4).
Note that Reactions (R3) and (R4) regenerate HOx, and thus only physical removal of H2O2 from the atmosphere establishes a net loss of HOx. According to its relatively high Henry's law coefficient (∼105 mol L−1 atm−1), H2O2 is highly soluble and thus efficiently removed by rain or fog (Klippel et al., 2011; Fischer et al., 2019). Dry deposition also contributes significantly to the removal of H2O2 in the boundary layer with typical deposition velocities of 0.1–5 cm s−1 (Stickler et al., 2007; Nguyen et al., 2015), which leads to a local maximum of H2O2 mixing ratios above the boundary layer (Stickler et al., 2007; Klippel et al., 2011).
In the marine boundary layer (MBL), H2O2 concentration gradients are small so that horizontal transport becomes unimportant. Additionally, the MBL height is relatively constant with no significant diel variation, and thus vertical transport is weak, except close to convective clouds (Nussbaumer et al., 2021a; Fischer et al., 2015). Therefore, the H2O2 distribution in the MBL depends largely on net photochemical tendencies and deposition processes (Fischer et al., 2015). The H2O2 budget in the continental boundary layer is more complex, since all terms in Eq. (1) contribute significantly to the H2O2 budget and the boundary layer height follows a relatively strong diel variation. In situ observations in various locations enable (together with meteorological and boundary layer height information) assessment of the role of H2O2 for the oxidizing capacity of the atmosphere (Fischer et al., 2019). Various measurement techniques have been developed to determine its vertical and geographical distribution and understand its budget and its response to natural and anthropogenic perturbations (Hottmann et al., 2020; Fischer et al., 2015, 2019; Bozem et al., 2017; Klippel et al., 2011; Snow et al., 2007; Lee et al., 2000; Sauer et al., 1997).
Similar to H2O2, organic peroxides (ROOH) impact the oxidative potential of the atmosphere significantly, and they also act as HOx reservoirs (Lee et al., 2000). Methyl hydroperoxide (MHP, CH3OOH) is generally the most abundant gaseous, organic hydroperoxide, which is produced by the reaction of HO2 with methylperoxy radicals (CH3O2) formed, e.g., during the photochemical oxidation of methane (CH4) (Reactions R5, R6) or by reactions of acetyl peroxy radicals (CH3C(O)O2) with HO2 and NO, which can dominate the production of CH3O2 (Crowley et al., 2018). Note that the production of MHP competes with the production of formaldehyde (HCHO, Reaction R7) from the methylperoxy radical (Nussbaumer et al., 2021b). Besides the photochemical pathways, H2O2 and MHP have also been observed to be directly released from biomass burning (Lee et al., 1997).
The main loss reactions of MHP are its photolysis ( s−1 at sun peak) (Reaction R8), the reaction with OH (Reaction R9) (with a lifetime of ∼15 h for most regions during AQABA; Air Quality and Climate Change in the Arabian Basin) and physical deposition processes, although it is ∼2 orders of magnitude less soluble than H2O2 (O'Sullivan et al., 1996; Klippel et al., 2011).
H2O2 and MHP can be found in comparable concentrations in many parts of the atmosphere, with the highest variations in the boundary layer (Reeves and Penkett, 2003; Klippel et al., 2011). Besides MHP, peracetic acid (PAA) is another abundant organic hydroperoxide in the troposphere. PAA production rates depend on HO2 and the acetyl peroxy radical (CH3C(O)O2), which is considered one of the four most abundant organic peroxy radicals (Tyndall et al., 2001; Crowley et al., 2018). Acetyl peroxy radicals also react rapidly with NOx; thus the highest concentrations of PAA are expected in regions which are impacted by biogenic emissions in which HO2 levels are high enough to compete with NOx (Berasategui et al., 2020; Phillips et al., 2013). Further organic peroxides are formed in the oxidation of isoprene and other volatile organic compounds (VOCs) (Wennberg et al., 2018; St. Clair et al., 2016; Reeves and Penkett, 2003; Sauer et al., 1999; O'Sullivan et al., 1996). Recent studies also indicate the oxidative potential of isoprene hydroxyl hydroperoxides (ISOPOOH) for sulfate formation in cloud droplets, which could even surpass that of H2O2 in forested regions (Dovrou et al., 2019, 2021).
Another major HOx reservoir is formaldehyde, which is a ubiquitous trace gas and the most abundant aldehyde in the troposphere. HCHO is highly reactive and acts as a major source of HO2 via its photolysis to H and HCO radicals. It can be emitted directly from a variety of both biogenic and anthropogenic sources and is an intermediate during the oxidation of a large number of VOCs, making budget assessments highly complex. Previous studies designed to distinguish between secondary production and direct emissions of HCHO vary widely in their estimates and highlight the importance of local phenomena (Dienhart et al., 2021; Nussbaumer et al., 2021b; Luecken et al., 2018; Anderson et al., 2017; Wolfe et al., 2016; Stickler et al., 2006; Lee et al., 1997).
Remote sensing techniques on satellites platforms enable global observations of HCHO and thus identification of VOC oxidation hotspots (e.g., due to oxidation of isoprene and anthropogenic emissions) and seasonal variability (Zhu et al., 2020; De Smedt et al., 2012, 2015, 2018; Marbach et al., 2009). HCHO measurements are currently used to derive ratios for O3 sensitivity studies (i.e., NOx or VOC limitation) and global mapping of OH variability in remote air (Nussbaumer et al., 2021a, 2022; Tadic et al., 2020; Wolfe et al., 2016, 2019; Schroeder et al., 2017). In very clean conditions like the remote MBL or the free troposphere, HCHO production is dominated by the photo-oxidation of methane (Reaction R5), with the bimolecular self-reaction of methylperoxy radicals as the rate-limiting factor (Reaction R10) (Nussbaumer et al., 2021b; Wagner et al., 2001). The methoxy radical product (CH3O) reacts quasi-instantaneously with oxygen to form HCHO and HO2 (Reaction R11). In continentally influenced air masses (NO ≥100 pptv), Reaction (R10) is suppressed, as methylperoxy radicals rapidly oxidize NO (Reaction R12), which accelerates HCHO and simultaneously limits MHP formation (Nussbaumer et al., 2021b; Klippel et al., 2011; Lee et al., 2000).
Photolysis of the NO2 product (Reactions R2, R12) leads to tropospheric O3 formation. Further sources of HCHO are the photochemical degradation of several VOCs, e.g., the ozonolysis of isoprene and other alkenes as well as the degradation of MHP, acetaldehyde, acetone and methanol (Nussbaumer et al., 2021b; Wennberg et al., 2018; Wolfe et al., 2016; Snow et al., 2007; Stickler et al., 2006).
Since the sources of HCHO are diverse, an alternative approach to the calculation of the HCHO budget is to derive the production rate of HCHO from measurements of OH reactivity towards VOCs, as demonstrated for the Air Quality and Climate Change in the Arabian Basin (AQABA) campaign data by Dienhart et al. (2021).
Photochemical losses of HCHO are the reaction with OH and its photolysis (Reactions R14–R16) (e.g., Heikes et al., 2001).
Anthropogenic release of HCHO by the oil and gas industry, biomass burning, and secondary production can significantly enhance local HO2 production (Parrish et al., 2012; Klippel et al., 2011; Lee et al., 1997). Since the atmospheric lifetime of HCHO is at least several hours and it is released during the photochemical oxidation of numerous VOCs, it is a suitable tracer for localized emissions from anthropogenic activity and combustion processes including biomass burning. The budget of HCHO can be described similarly to H2O2 via Eq. (1): its photochemical production pathways depend strongly on the abundance and the composition of VOCs. In the free troposphere, the main sources of HCHO are the photochemical degradation of methane, methanol and MHP (Stickler et al., 2006), whereas in the boundary layer the oxidation of alkenes (e.g., isoprene, ethene) and alkanes and the photochemical degradation of, e.g., acetaldehyde, acetone, peroxyacetyl nitrate (PAN) and dimethyl sulfide (DMS) become more significant (Crowley et al., 2018; Nussbaumer et al., 2021b). Wolfe et al. (2016) showed that the link between HCHO and isoprene oxidation is a strong, nonlinear function of NOx. Primary emissions of HCHO are dominated by combustion processes, with the combustion of fossil fuels in industrialized areas (Williams et al., 2009; Wert et al., 2003) and biomass burning as a strong local source (Kluge et al., 2020; Coggon et al., 2019). Wet and dry deposition are major loss processes of HCHO, even though it is less soluble than H2O2. The highest mixing ratios of HCHO are typically found in the boundary layer and decrease with altitude in the free troposphere (Zhu et al., 2020; Anderson et al., 2017; Stickler et al., 2007). In clean MBL conditions, HCHO mixing ratios mainly depend on the abundance of HOx and are therefore rather homogenously distributed, whereby horizontal transport is not significant. In more polluted conditions, horizontal transport can significantly influence HCHO mixing ratios on a regional scale. Vertical transport of HCHO is often limited to within the MBL, as the boundary layer height is almost constant, except close to convective clouds where elevated mixing ratios of HCHO can be used as an indicator for recent convection (Anderson et al., 2017).
In this study we present the first ship-based measurements in the marine boundary layer of the Arabian Gulf and around the Arabian Peninsula. H2O2, organic peroxides and HCHO mixing ratios were evaluated during AQABA in summer 2017 and compared to results of the 3-D general circulation model EMAC (ECHAM5/MESSy2 Atmospheric Chemistry; European Center HAMburg, Modular Earth Submodel System). Dry deposition rates of H2O2 and HCHO were determined at night using the method of Shepson et al. (1992). Photochemical equilibrium concentrations of H2O2 were evaluated with measured OH, HO2 and actinic flux measurements.
2.1 AQABA campaign
The Air Quality and Climate Change in the Arabian Basin (AQABA) measurement expedition took place from 25 June until 3 September 2017. Instrumentation of the ship (Kommandor Iona) was performed in La Seyne-sur-Mer (near Toulon, France), from where the first leg of the cruise started through the Mediterranean, the Suez Canal and the Red Sea to the first stop in Jeddah. The expedition continued 2 d later via the Gulf of Aden, the Indian Ocean, the Gulf of Oman and the Arabian Gulf (also Persian Gulf) to Kuwait. On the second leg, the ship returned with the same route (Fig. 1), without stopping in Jeddah, to end the expedition at Stromboli volcano. The Kommandor Iona was equipped with a weather station and five laboratory containers on the front deck with instrumentation for in situ and offline monitoring of a large variety of gaseous species, particles and radicals. Details about the measurements performed during AQABA can be found in a number of previous publications (Dienhart et al., 2021; Friedrich et al., 2021; Paris et al., 2021; Celik et al., 2020; Tadic et al., 2020; Wang et al., 2020; Bourtsoukidis et al., 2019; Pfannerstil et al., 2019; Eger et al., 2019).
2.2 Instrumentation and sampling
HCHO and hydroperoxides were measured using modified commercial Aero-Laser instruments (AL2021, AL4021, Aero-Laser, Germany), which were placed in a temperature-controlled container. With the exception of the aerosol and radical measurements (OH and HO2), air was sampled from a high-flow (10 m3 min−1) cylindrical stainless steel inlet (sampling height: 5.5 m above deck, diameter: 0.2 m), placed between the containers on the front deck of the ship. Air was drawn from the center of the high flow inlet into the air-conditioned laboratory containers using PFA (perfluoroalkoxy alkane) tubing. The 4.2 m long in. PFA bypass was insulated to prevent condensation and was used with a flow rate of 12 L min−1, which resulted in a residence time of ∼9 s for both instruments. This setup ensured no vessel contamination while sampling against the wind direction and minimized sampling artifacts, e.g., by preventing condensation. The sampling bypass was exchanged in Kuwait before the second leg.
2.3 HCHO measurements
HCHO measurements were performed based on the fluorometric Hantzsch reagent method (AL4021 is therefore called the “Hantzsch monitor”) following the principle of Dasgupta et al. (1988) and the design of Kelly and Fortune (1994). In a first step, HCHO is stripped from an airflow of 1 L min−1 into 0.025 M H2SO4 (sulfuric acid for analysis, 96 %, Acros Organics) with a flow of 0.55 mL min−1 at 10 ∘C in a stripping coil. The acidity of the stripping solution promotes quantitative solubility of HCHO and minimizes the dissolution of gaseous SO2 which otherwise could interfere by formation of a sulfur adduct in the liquid phase. Subsequently, HCHO(aq) (aqueous) quantitatively reacts with pentane-2,4-dione (acetylacetone, EMSURE for analysis, 99 %, Merck) and ammonia (ammonium acetate, 99 %, VWR) at low pH (acetic acid, analytical grade, 100 %, SERVA) in the reactor coil, thermostatted at 65 ∘C, to form the Hantzsch product 3,5-diacetyl-1,4-dihydrolutidine (DDL). DDL is subsequently detected by excitation at 410 nm with a mercury Pen-Ray® lamp, followed by collection of the fluorescence radiation 90∘ off axis around 510 nm with a photomultiplier tube (model H957-01, Hamamatsu Photonics). Aqueous HCHO standards were used to calibrate the response. Line losses and sampling efficiency during the campaign were corrected by measuring gaseous standards generated using a HCHO permeation source (Sect. 2.5).
2.4 H2O2 and organic hydroperoxide measurements
H2O2 and organic hydroperoxides (ROOH) were measured with the AL2021 based on the dual-enzyme technique described in Lazrus et al. (1985). Ambient air is collected through a bypass with 2.3 L min−1 and consequently passed through a glass coil together with a buffered (potassium hydrogen phthalate for analysis, PanReac; NaOH, 1 mol L−1, Fluka) stripping solution (0.55 mL min−1, pH 5.8). Hydroperoxides dissolve in the stripping solution with a stripping efficiency depending on their Henry's law constant (O'Sullivan et al., 1996). Typically, H2O2 is dissolved quantitatively; CH3OOH (methyl hydroperoxide, MHP) is the smallest organic hydroperoxide, with a stripping efficiency of ∼60 % (Hottmann et al., 2020; Klippel et al., 2011). As the instrument does not differentiate between different organic hydroperoxides and as solvation is a critical step for quantification, the AL2021 delivers a lower estimate of the total organic hydroperoxide mixing ratios. The dissolved hydroperoxides are separated into two channels and subsequently detected via reaction to a fluorescent dye with horseradish peroxidase (HRP, Sigma-Aldrich) and 4-hydroxyphenylacetic acid (POPHA, Sigma-Aldrich). The dimer of POPHA, 6,6'-dihydroxy-3,3'-biphenyldiacetic acid, is formed stoichiometrically and detected by fluorescence spectroscopy via excitation with a cadmium Pen-Ray® lamp at 326 nm. Detection of the fluorescence radiation 90∘ off axis is performed between 400–420 nm with a photomultiplier tube (model H957-01, Hamamatsu Photonics) for both channels. The enzyme catalase (Sigma-Aldrich) is injected into the reaction coil of channel B, prior to the reaction with HRP and POPHA, to selectively destroy H2O2. This technique allows for quantification of H2O2 by calculation of the difference between channel A, which delivers the total mixing ratio of ROOH and H2O2, and channel B, which delivers the total mixing ratio of ROOH. Since this principle is dependent on the catalase efficiency, it is determined for every liquid calibration and was in the range of 95 %–100 % during AQABA. In addition to the AL2021, we also operated an instrument for the detection of different organic peroxides separated by HPLC (high-performance liquid chromatography). Similar to the AL2021, it utilizes the selective dual-enzyme technique by post-column derivatization, and thus the HPLC enables quantification of separated organic hydroperoxides and H2O2 in low levels of parts per trillion by volume. When the sea was rough, the movement of the ship interfered with the instrument, causing drifts of the baseline, which may have been caused by pressure variations within the constant-flow eluent pumps. Therefore, quantification of the organic hydroperoxides was not possible, and we only used the chromatograms for qualitative identification of the more abundant species.
2.5 Calibration and instrument characteristics during AQABA
External calibration of both instruments was performed with aqueous standards (HCHO, H2O2) by dilution of stock solutions. The H2O2 stock solution was prepared with 1 mL H2O2 (30 %, Roth) in 999 mL H2O (EMSURE®, Merck) and checked for stability by regular titration with potassium permanganate (KMnO4, 0.002 mol L−1, Merck). The HCHO stock solution consisted of 3 mL HCHO (37 %, Sigma-Aldrich) in 997 mL H2O and was titrated against iodine (I2, 0.05 mol L−1, Merck).
In addition, gaseous standards were measured to calculate the inlet efficiency of the PFA bypass. Calibration gas flows were generated using permeation devices in temperature-controlled glass flasks, which were flushed at a constant flow rate of 80 sccm (standard cubic centimeters per minute) with zero air (zero-air generator CAP 60, Infiltec, Germany). HCHO calibration gas was created from a paraformaldehyde container (VICI AG, Switzerland) which was heated to 60 ∘C. The gaseous H2O2 standard was generated from a permeation source built with a 15 cm long in. polyethylene (PE) tube, which was filled with the 30 % H2O2 solution, closed with PFA fittings (Swagelok, USA) and heated to 35 ∘C. The highly concentrated flow was then diluted with additional zero air. The permeation rates of both sources were measured based on the chromotropic acid reaction (Altshuller et al., 1961) and the reaction of H2O2 with TiCl4 described in Pilz and Johann (1974). Note that the AL2021 has known O3 and NO interferences, which were accounted for in the final dataset. We found an interference of 36 pptv H2O2 equivalents per 100 ppbv O3 and 12 pptv H2O2 per 100 ppbv NO. We did not find a significant O3 interference in lab experiments for the AL4021.
Zero-gas measurements were performed every 3.5 h for 30 min to account for baseline drifts and to determine the instrument's stability. For this purpose, we used a bypass via a three-way valve with a silica gel cartridge (SiO2 with orange indicator, Roth) to dry the sampled air followed by a scrubber cartridge containing hopcalite (MnO2/CuO, IAC-330, Infiltec, Germany) and platinum (Pt/Al2O3, IAC-114, Infiltec, Germany) as catalysts to destroy the remaining hydroperoxides, HCHO, other OVOCs (oxygenated VOCs) and O3.
Both instruments log data on a custom-built computing unit (V25) with a 3 s time resolution, but the data shown in this paper were at least averaged to the so-called effective time resolution, which was determined as the response time of the instrument (10 % to 90 % of the signal intensity during the injection of liquid standards). The limit of detection (LOD) was calculated as the 2σ deviation of all zero-air measurements during AQABA at the effective time resolution of 180 s. The precision (P) was calculated by the 1σ deviation of the liquid standard calibrations throughout the whole measurement campaign; therefore it contains also the pipetting error during the preparation of the standards. The total measurement uncertainty (TMU) was calculated according to Gaussian error propagation. In this equation, S is the uncertainty of the standard, IE is the inlet efficiency and OI is the O3 interference.
Table 1Instrument characteristics of the HCHO and hydroperoxide measurements during the AQABA campaign.
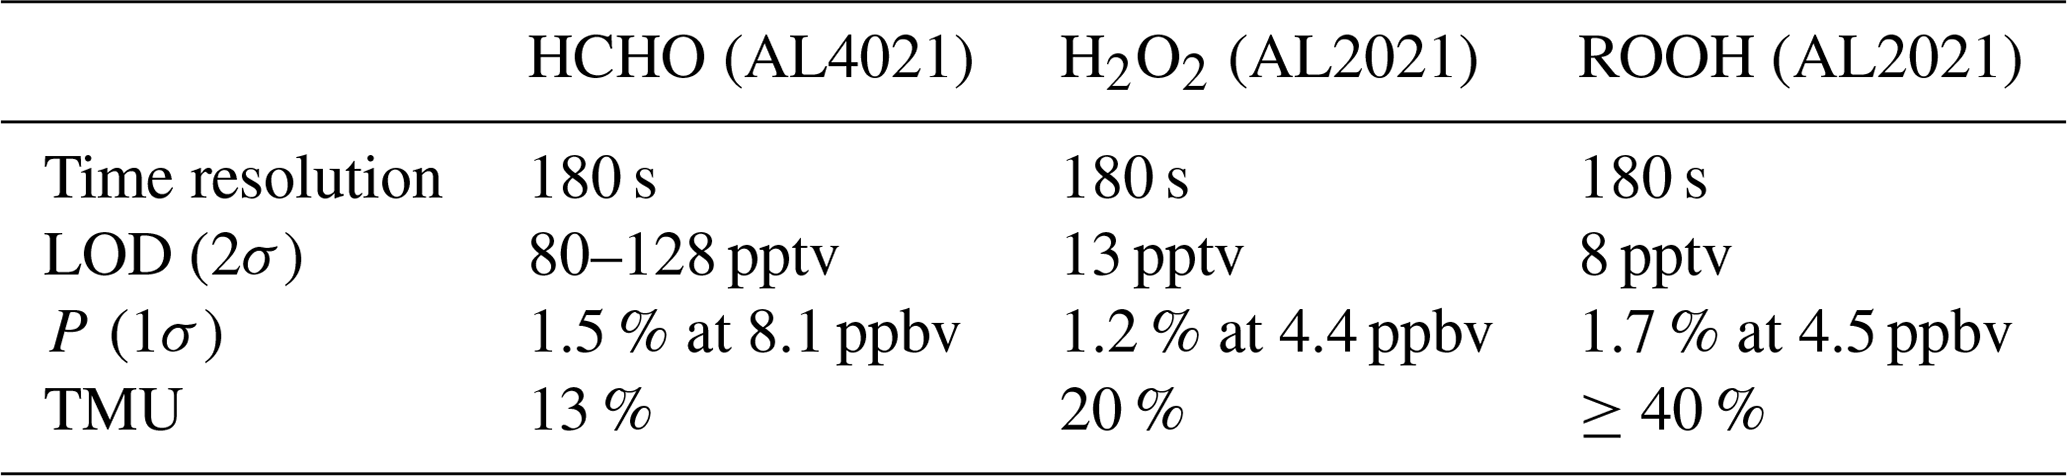
Note that for the LOD of the AL4021, we found a significant change in the background noise, while operating the instrument when the sea was rough with strong waves. Excluding times of rough sea yields a LOD (2σ) of 80 pptv.
2.6 Further measurements
OH and HO2 were performed with the Hydroxyl Radical Measurement Unit based on Fluorescence Spectroscopy (HORUS) instrument and sampled from a separated inlet closer to the LIF (laser-induced fluorescence) instrument to achieve residence times as low as possible in the sampling. The instrument utilizes LIF of the OH radical at 308 nm, which is created by a pulsed tunable laser system (Nd:YAG, neodymium-doped yttrium aluminum garnet) operated at a pulse frequency of 3 kHz. OH radicals are excited in a low-pressure detection cell (White cell setup) with a flow rate of 10 L min−1. The detection of HO2 is achieved by chemical conversion via the addition of NO downstream of the OH detection. The resulting sum of ambient plus chemically converted OH is measured in a second detection axis (Hens et al., 2014; Marno et al., 2020). HORUS achieved an instrumental LOD of 0.03–0.15 pptv for OH and 0.22–2.01 pptv for HO2 with a TMU of 17 % (OH) and 20 % (HO2), respectively.
Wavelength-resolved actinic flux was measured with a spectral photometer (CCD spectroradiometer 85237; charge-coupled device) to calculate photolysis frequencies (j values). The radiometer was installed about 5 m above the front deck level, and it was cleaned every morning to remove sea salt and dust particles. Decreases in sensitivity due to sensor contamination were corrected with a linear interpolation between the cleaning events. The j values are not corrected for upwelling actinic flux from the sea surface, and therefore the TMU was estimated with >10 %, depending on the reaction. More details about the setup and calibration of CCD spectroradiometers can be found in Bohn and Lohse (2017). Temperature, pressure, and wind direction and speed were measured with the European Common Automatic Weather Station (EUCAWS), a weather station specifically designed for ships.
2.7 Global atmospheric chemistry model EMAC
The ECHAM5/MESSy2 Atmospheric Chemistry (EMAC) model is a numerical chemistry general circulation model (CGCM), which describes tropospheric and middle-atmosphere processes. EMAC is based on the fifth generation of the European Center HAMburg (ECHAM5) general circulation model (Roeckner et al., 2006) and uses the second version of the Modular Earth Submodel System (MESSy2) to link multi-institutional submodels (Joeckel et al., 2010). Here we use EMAC with the chemistry mechanism MOM (Mainz Organics Mechanism) implemented with the submodel MECCA (Module Efficiently Calculating the Chemistry of the Atmosphere), which contains not only the basic HOx, NOx and CH4 chemistry but also halogens, sulfur and mercury (Sander et al., 2019; Lelieveld et al., 2016). Development of MOM also included a variety of nonmethane hydrocarbons (NMHCs), aromatics and OVOCs including isoprene and terpene oxidation (Sander et al., 2019), and, recently, the model has been thoroughly evaluated with this chemical mechanism (Pozzer et al., 2022). Therefore, it is ideal to test the model with complex photo-oxidation during AQABA, especially in the Arabian Gulf, where a lot of the oil and gas industry is operating and which model results already identified as a hotspot of tropospheric O3 (Lelieveld et al., 2009). The model simulations were carried out in the T106L31 resolution, which correspond to a grid of (∼110 km) with 31 vertical pressure layers and a time resolution of 10 min. The EMAC data were interpolated bi-linearly along the GPS track of the ship with the S4D submodel (sampling in 4 dimensions; Jöckel et al., 2010). The model was initialized from a previous evaluated simulation (Pozzer et al., 2022) and started on 1 June 2017, covering the entire campaign. The dynamics have been weakly nudged (Jeuken et al., 1996; Jöckel et al., 2006) towards the ERA-Interim data (Berrisford et al., 2011) of the European Centre for Medium-Range Weather Forecasts (ECMWF) to reproduce the actual day-to-day meteorology in the troposphere. The anthropogenic emissions are based on the Emissions Database for Global Atmospheric Research (EDGAR v4.3.2). Further details are presented in Pozzer et al. (2022). Previous results of airborne and shipborne expeditions have been compared to EMAC (Fischer et al., 2015; Klippel et al., 2011); also the AQABA datasets of NOx, O3 and VOCs during AQABA have been published (Tadic et al., 2020; Wang et al., 2020).
2.8 Hybrid Single-Particle Lagrangian Integrated Trajectory (HYSPLIT) model
Back trajectories of air parcels encountered during the AQABA campaign have been calculated with the Hybrid Single-Particle Lagrangian Integrated Trajectory model, HYSPLIT (version 4, 2014), developed by the Air Resources Laboratory of the National Oceanic and Atmospheric Administration (NOAA). HYSPLIT is a hybrid between a Lagrangian and Eulerian model for the simulation of the movement and dispersion of small imaginary air parcels within the atmosphere (Draxler et al., 1998). The model can be accessed at https://www.arl.noaa.gov/hysplit/ (last access: 15 November 2022). Back trajectories for the AQABA campaign were calculated with a start height of 200 m above sea level at the location of the Kommandor Iona with a resolution of 1 h (Figs. S17, S18). For the purpose of this study, the movement of air parcels was tracked for 48 h backwards.
2.9 Methods
In the MBL, the production of peroxides is dominated by the recombination of peroxyl radicals; thus the in situ measurements of HO2 enable calculation of the production rates P(H2O2) with Eq. (4).
Photochemical loss reactions are the photolysis and the reaction with OH, besides the deposition, which is the dominant loss at night.
Since the measurements were performed in the MBL, the water dependency of the HO2 recombination becomes significant and was calculated with the relative humidity (RH) measurements via Eqs. (10)–(12) (https://iupac-aeris.ipsl.fr/test/front-office/datasheets/pdf/HOx14.pdf, 21 July 2022).
At night, the photochemical production and loss reactions due to OH can be neglected; therefore, the decay of H2O2 and HCHO in clean air masses at night is dominated by deposition. With the assumption of a constant, horizontally homogenous boundary layer and a linear concentration profile within the BL, the exponential decay can be used to estimate the deposition velocity (Vdep) with the method of Shepson et al. (1992). In this calculation, we assume that the initial mixing ratio [X]0 () represents the mixing ratio on top of the nocturnal boundary layer (hBL). If species X is homogeneously distributed within the BL and it follows exponential decay at night, the first-order decay is given by Eq. (11). Thus, the first-order decay plot ( versus the time) yields the deposition velocity of species X with a known boundary layer height.
Additionally, the deposition rate can be calculated with Eq. (12), assuming that the boundary layer is well mixed.
3.1 Regional distribution of HCHO, H2O2 and organic peroxides around the Arabian Peninsula
The cruise track of the Kommandor Iona is shown in Fig. 1, subdivided into eight regions identified by different colors: the Mediterranean Sea (MS), Suez Canal and the Gulf of Suez (SU), Red Sea north (RN), Red Sea south (RS), Gulf of Aden (GA), Arabian Sea (AS), Gulf of Oman (GO), and Arabian Gulf (AG). The AG (also known as the Persian Gulf) and the SU are well known for their oil and gas industry and intensive ship traffic, respectively; hence primary emissions of NOx, CO and to a lesser extent HCHO were expected to affect mixing ratios of these trace gases. Nearby ship plumes (including the Kommandor Iona exhaust) and other point sources were identified with the use of NOx, CO, SO2 and wind direction data and excluded from the dataset used in this study (Celik et al., 2020). The measurements were affected by aft winds in particular during the first leg, resulting in a contamination from the ships exhaust, thus limiting the amount of data available (Fig. S1 in the Supplement). In general, we did not find elevated mixing ratios of peroxides in ship plumes (presumably a result of the high NOx levels) and thus decided to keep the data, but corrections for known NO interferences were applied (Sect. 2.4). Contrary to H2O2, HCHO is affected by ship exhaust plumes (Celik et al., 2020), and thus contaminated data have been filtered out.
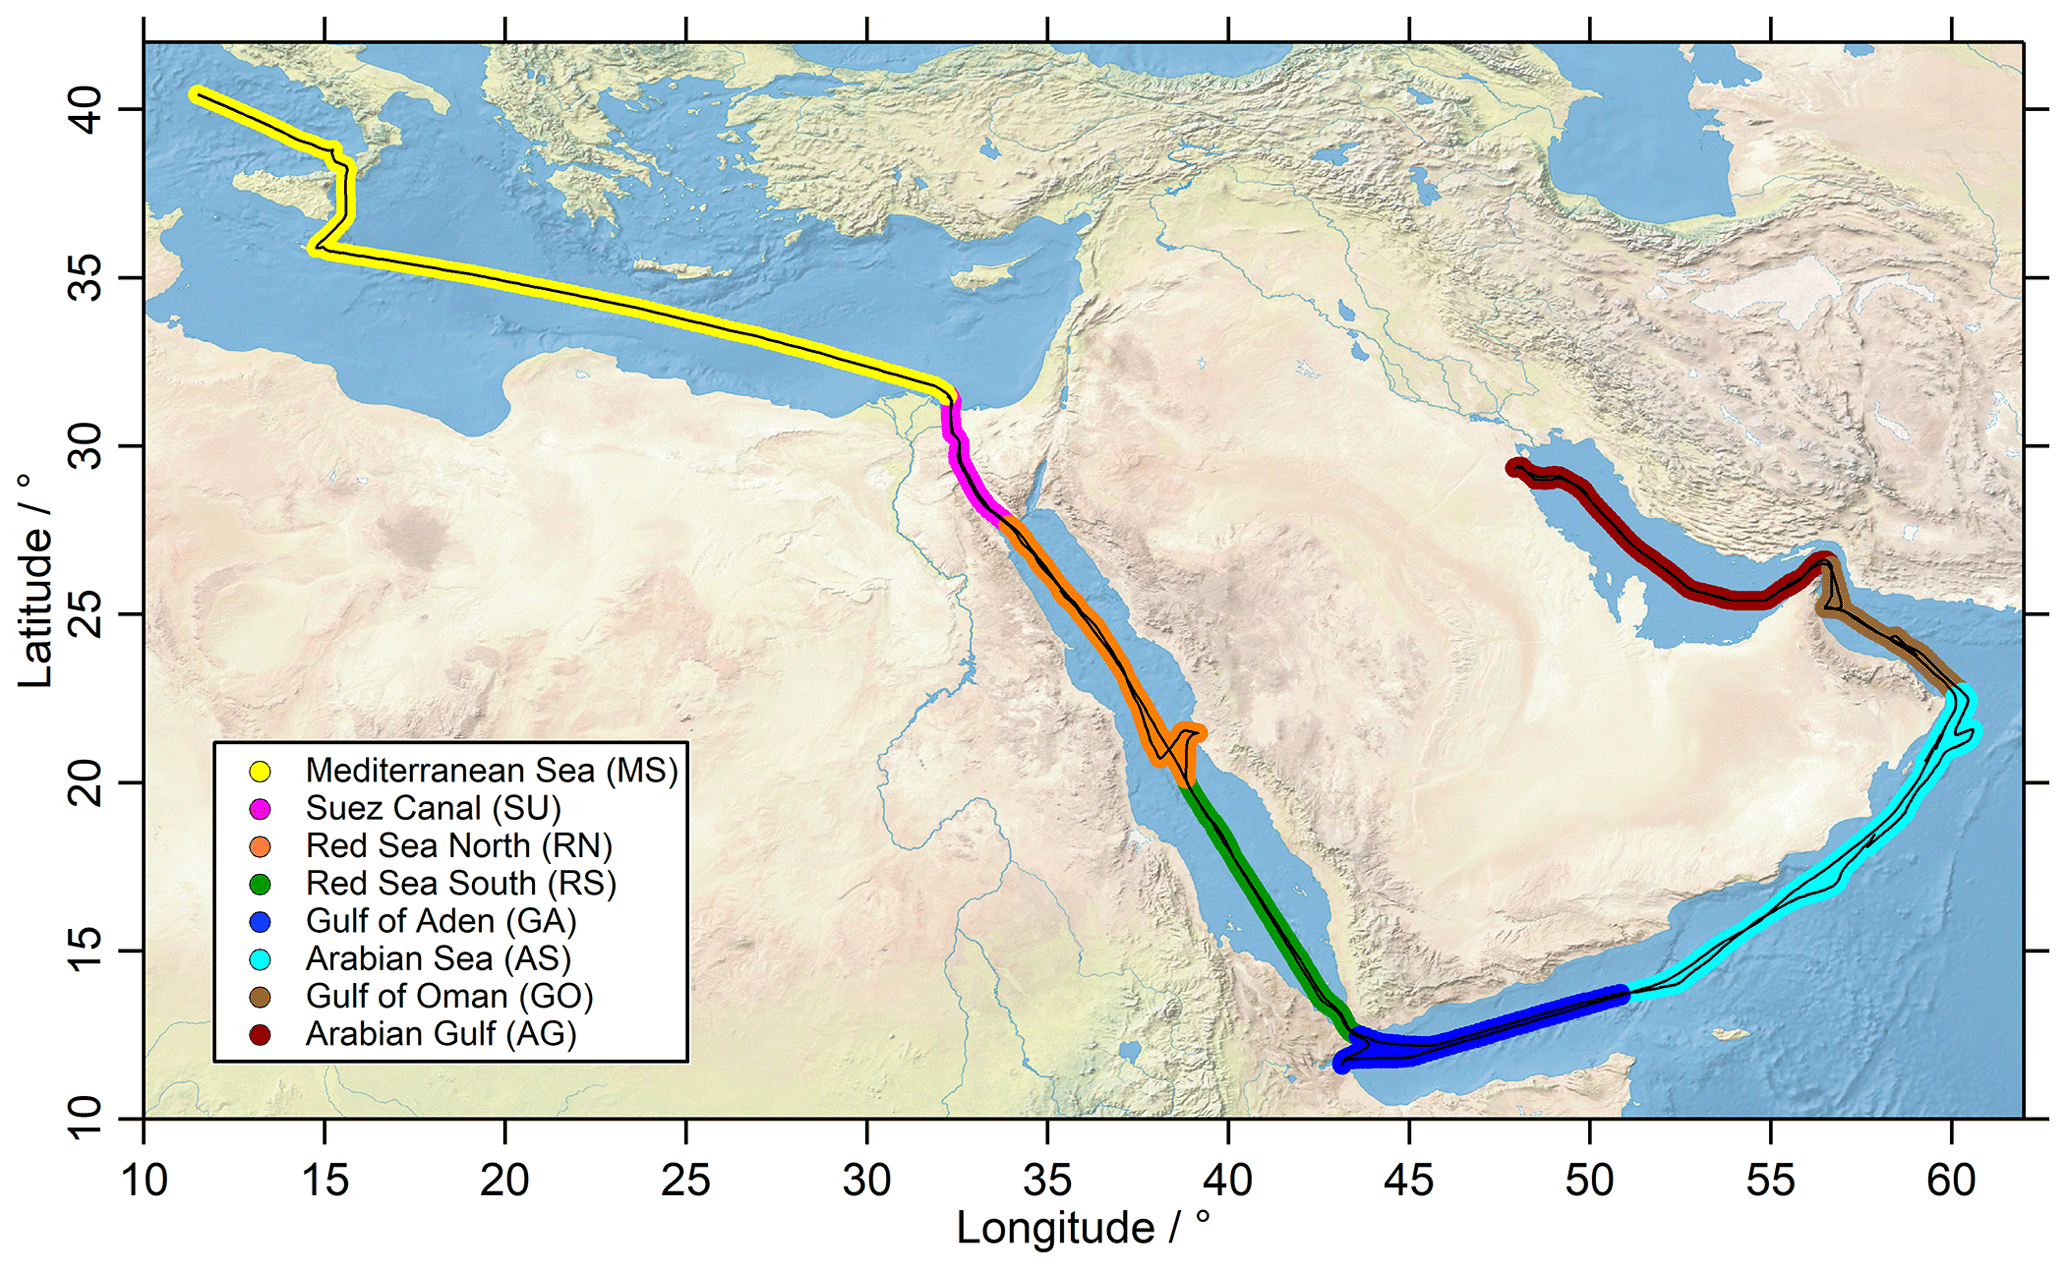
Figure 1The ship track (black) of the Kommandor Iona during the AQABA cruise subdivided according to different chemical regimes into eight regions: Mediterranean Sea (MS: yellow), Suez Canal (SU: pink), Red Sea north (RN: orange), Red Sea south (RS: green), Gulf of Aden (GA: blue), Arabian Sea (AS: turquoise), Gulf of Oman (GO: brown) and Arabian Gulf (AG: red). HYSPLIT trajectories for the respective regions are presented in the Supplement (Figs. S17, S18). The map was created with data provided by the Natural Earth website (http://www.naturalearthdata.com, last access: 3 June 2021).
In Fig. 2 we present mixing ratios of HCHO (upper panels), H2O2 (middle panels) and ROOH (lower panels) color-coded along the ship cruise track for the first (left panels) and second leg (right panels). Time series of these species can also be found in the Supplement (Figs. S1, S3 and S5). Box-and-whisker plots of the mixing ratios for HCHO, H2O2 and ROOH for the eight regions are shown in Figs. 3 and 4. Numerical values are listed in Table S1 in the Supplement.
Mixing ratios of HCHO (upper panels of Figs. 2, S1) exhibit a large variability. The highest mixing ratios (12.6 ppbv) were measured in the center of the Arabian Gulf with northwesterly winds originating from Iraq/Kuwait during the first leg (Figs. 2, S18). Lower mixing ratios were detected in this area during the second leg, when the wind originated from the northeast, coming from Iran (Fig. 2, upper-right panel). The lowest HCHO median mixing ratios were measured in the RS (0.37 ppbv) during the second leg, in unpolluted air mass originating from Eritrea (Fig. S17). Low HCHO was also found over the GA (0.50 ppbv), the MS (0.77 ppbv) and the AS (0.86 ppbv). In general, low mixing ratios of HCHO are associated with low NOx, low O3 (Tadic et al., 2021), low VOCs (Bourtsoukidis et al., 2019), low OH reactivity (Pfannerstill et al., 2019) and in particular low OH reactivity towards VOCs (Dienhart et al., 2021), while high mixing ratios of HCHO are associated with elevated values for these species.
To the best of our knowledge there are no shipborne measurements of HCHO available in the Red Sea and the Arabian Gulf to be compared to our data. In general, the measured mean mixing ratios during AQABA are generally larger compared to previous studies in the MBL. Wagner et al. (2001) performed shipborne measurements during the Indian Ocean Experiment (INDOEX) campaign in the central Indian Ocean with HCHO mixing ratios between 0.2–0.5 ppbv, with the lowest mixing ratios in the clean maritime background of the Southern Hemisphere and about 0.5 ppbv HCHO in continentally influenced air masses. Weller et al. (2000) reported ship-based HCHO measurements in the Atlantic, which reached a broad maximum with values of 1.0–1.2 ppbv in the tropical Atlantic, decreasing towards the poles with values below 0.8 ppbv. These air masses represented pristine MBL conditions with average daytime NO of 3.1 pptv. During AQABA we did not encounter such very clean conditions with the lowest median NOx of 0.19 ppbv for the AS and 0.25 ppbv for the MS. This was likely due to sailing on major ship traffic routes which may have also led to enhanced background HCHO compared to remote MBL conditions.
The lowest median mixing ratios of H2O2 were found in the GO and the GA (0.12 ppbv), followed by the AS (0.15 ppbv), while higher mixing ratios of H2O2 were found in the RS, SU (0.25 ppbv) and MS (0.26 ppbv). Altogether, the H2O2 measurements exhibit lower variation around the Arabian Peninsula compared to HCHO. Higher variability in H2O2 was found in the SU and AG, although less than 25 % of the data exceed 0.50 ppbv, with the highest H2O2 mixing ratios observed in the AG (0.92 ppbv) in the harbor of Kuwait. The AG, SU, MS and RN also show the strongest diurnal variations of up to ∼300 pptv (Fig. S3).
Absolute mixing ratios of H2O2 are in the same range as previous measurements of H2O2 in the MBL (Fischer et al., 2015; Stickler et al., 2007; O'Sullivan et al., 2004; Chang et al., 2004; Kieber et al., 2001; Lee et al., 2000; Weller et al., 2000; Junkermann and Stockwell, 1999). These observations indicate the highest mixing ratios (>500 pptv) of H2O2 in the tropics (O'Sullivan et al., 2004, 1999; Weller et al., 2000; Junkermann and Stockwell, 1999; Heikes et al., 1996; Slemr and Tremmel, 1994) and decreasing concentrations towards higher latitudes in both hemispheres, reaching 200–300 pptv in the extratropics (Fischer et al., 2015; O'Sullivan et al., 1999, 2004; Weller et al., 2000; Junkermann and Stockwell, 1999; Slemr and Tremmel, 1994). In general, higher H2O2 mixing ratios have been observed in continental outflow (e.g., Heikes et al., 1996).
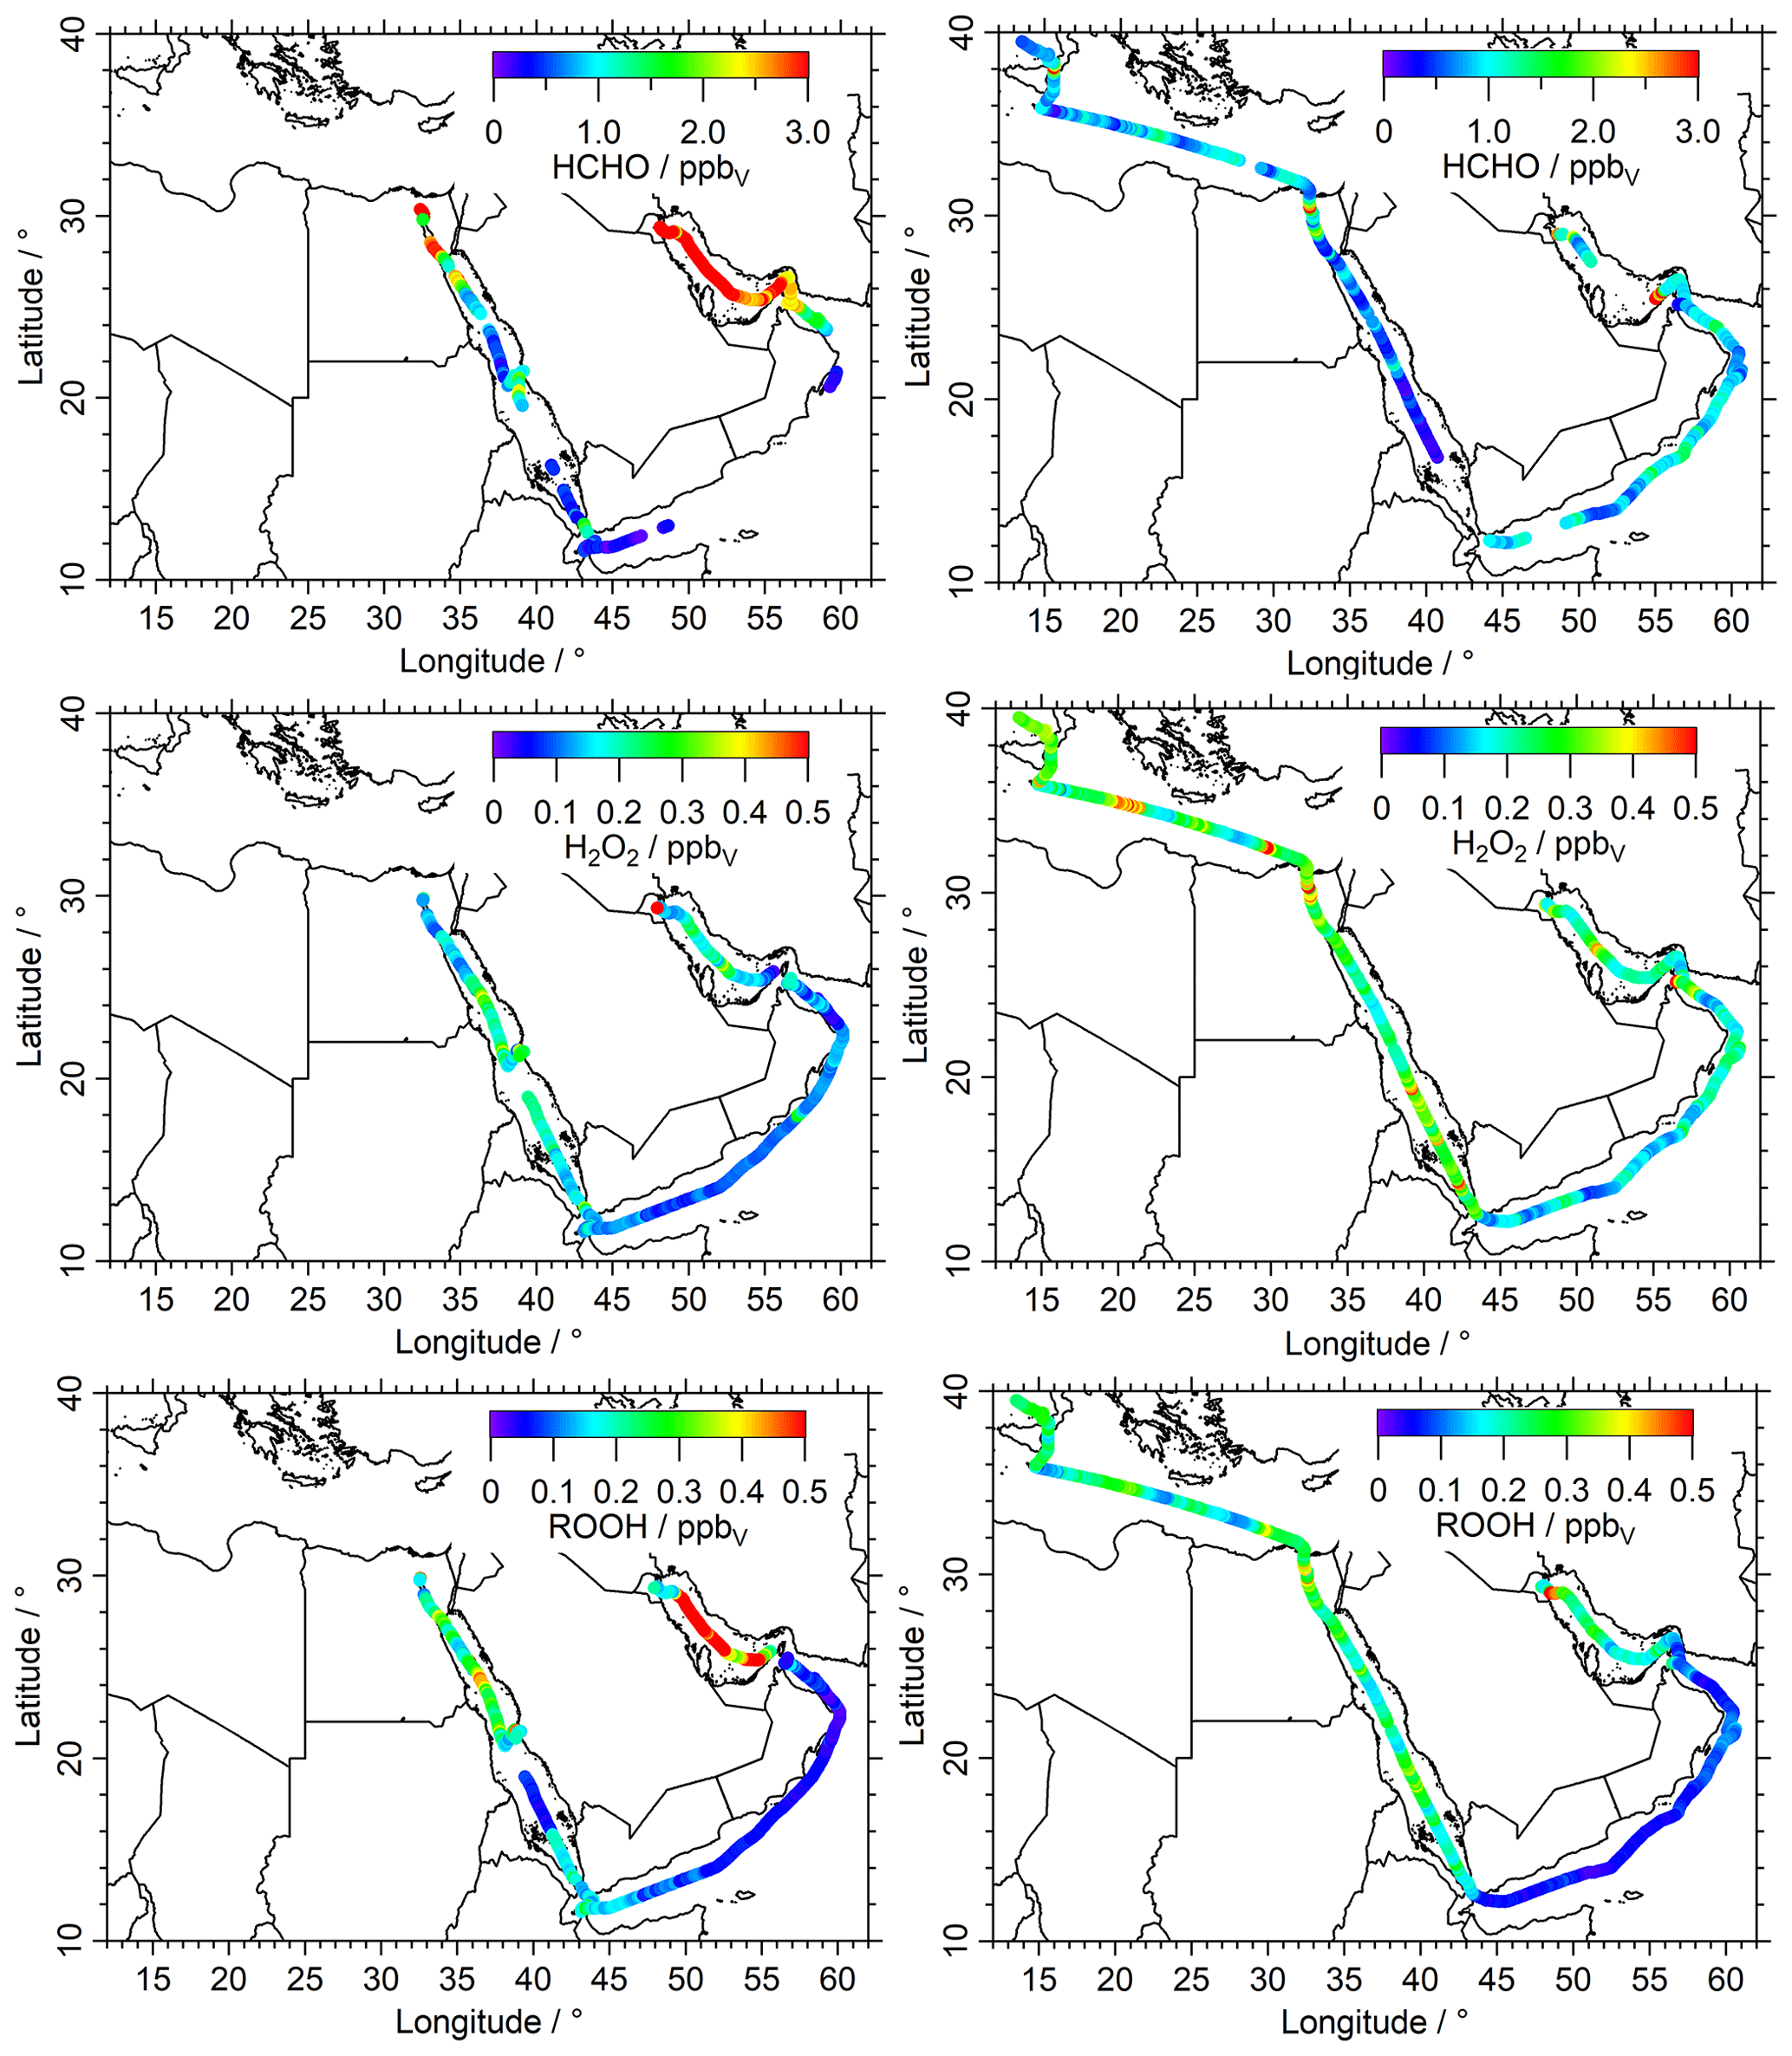
Figure 2Overview and data coverage of HCHO, H2O2 and organic hydroperoxide measurements during both legs of the AQABA ship campaign (graphs on the left represent the first leg). Contaminated HCHO data (e.g., by ship exhausts) were removed from the dataset with a stack filter (based on the NO, CO and SO2 observations); therefore there is less HCHO data coverage during the first leg in the Arabian Sea.
The organic peroxides showed higher variability compared to H2O2 (Fig. 4), with the lowest median value in the AS (0.06 ppbv), followed by the GO (0.07 ppbv) and GA (0.10 ppbv). We found the lowest variability (whisker intervals) in the AS, which represents the cleanest conditions and the lowest variability in O3 and NOx (Tadic et al., 2020). Higher levels of organic peroxides were detected in the SU (0.26 ppbv), AG (0.23 ppbv), MS (0.22 ppbv) and RN (0.20 ppbv) with the highest mixing ratios in the center of the Arabian Gulf during the first leg (2.26 ppbv).
The chromatograms of the HPLC-based instrument indicate significant abundances of four distinct inorganic and organic hydroperoxides in the AG (Fig. S10), which were identified as H2O2, MHP, PAA (peracetic acid) and EHP (ethyl hydroperoxide) based on their retention times and gaseous injections of PAA with a diffusion source. In addition to the continuous HPLC measurements, we also injected enriched samples with sampling times varying between 12–36 h during various times along the ship track. Although these samples have a very limited time resolution, they were used for a qualitative assessment of the abundance of further organic hydroperoxides. Significantly enhanced amounts of EHP were only detected over the Arabian Gulf, although small amounts of EHP were also detected in the enriched samples of the MS (Fig. S10), where we detected aged air masses originating in Europe (Fig. S17).
The highest amounts of photochemical air pollution were detected over the AG, which is confirmed by the highest mixing ratios of HCHO and ROOH in this region when observing winds from the western coastline and Kuwait (Fig. S19). Less air pollution was observed during the second leg, when we were sampling air masses originating from Iran. In this region we also observed the strongest radiation and the highest temperatures during AQABA. The SU and RN also show enhanced contributions of VOCs (Wang et al., 2020) and elevated OH reactivity (Pfannerstill et al., 2019), mainly while passing oil rigs and on the way through the Suez Canal. Tadic et al. (2020) found the cleanest conditions, from both a NOx and O3 perspective, for the AS and RS. This can be confirmed by the rather decreased mixing ratios of HCHO, ROOH and H2O2 mixing ratios, which reflect low levels of HOx. Air masses transported from Eritrea also contained suppressed mixing ratios of ROOH during the first leg.
3.2 EMAC model comparison
The observations of HCHO, H2O2 and ROOH were compared to numerical results of the model EMAC. The highly complex photochemistry around the Arabian Peninsula is well suited to evaluate the MOM photochemistry mechanism. The high pollution levels, e.g., in the AG contrast with the rather clean regions like the AS and RS, which represent mostly aged air masses with less anthropogenic influence, although clean MBL conditions (NOx<50 pptv) were rarely encountered during AQABA. Here we use simulations from the lowest vertical level of EMAC (∼30 m) at a temporal resolution of 10 min. Time series (Figs. S1, S3 and S5) and scatterplots (Figs. S2, S4 and S6) are shown in the Supplement. Regional variations are highlighted in Figs. 3 and 4 by box-and-whisker plots and by the measurement–model ratio (Figs. 3 and 4); the EMAC data were adapted to the measurements with a time resolution of 10 min for these plots. Numerical values are listed in Table S1. Additionally, frequency distribution of mixing ratios for observations and model simulations for the individual regions are presented in the Supplement (Figs. S14, S15, S16).
In general, EMAC reproduces the regional trends of HCHO quite well (Fig. 3, left panel), although the whisker intervals (10 %–90 %) demonstrate that the model computes less variability, most likely due to missing localized pollution events, which is to be expected for a global model at relatively low spatial resolution. The median values of the measurement–model ratio vary between 0.3 and 1.6 (Fig. 3, right panel). EMAC overestimates HCHO in the cleaner regions of the MS, RS and GA, while it underestimates HCHO in the AS and the heavily polluted AG (Fig. S1).
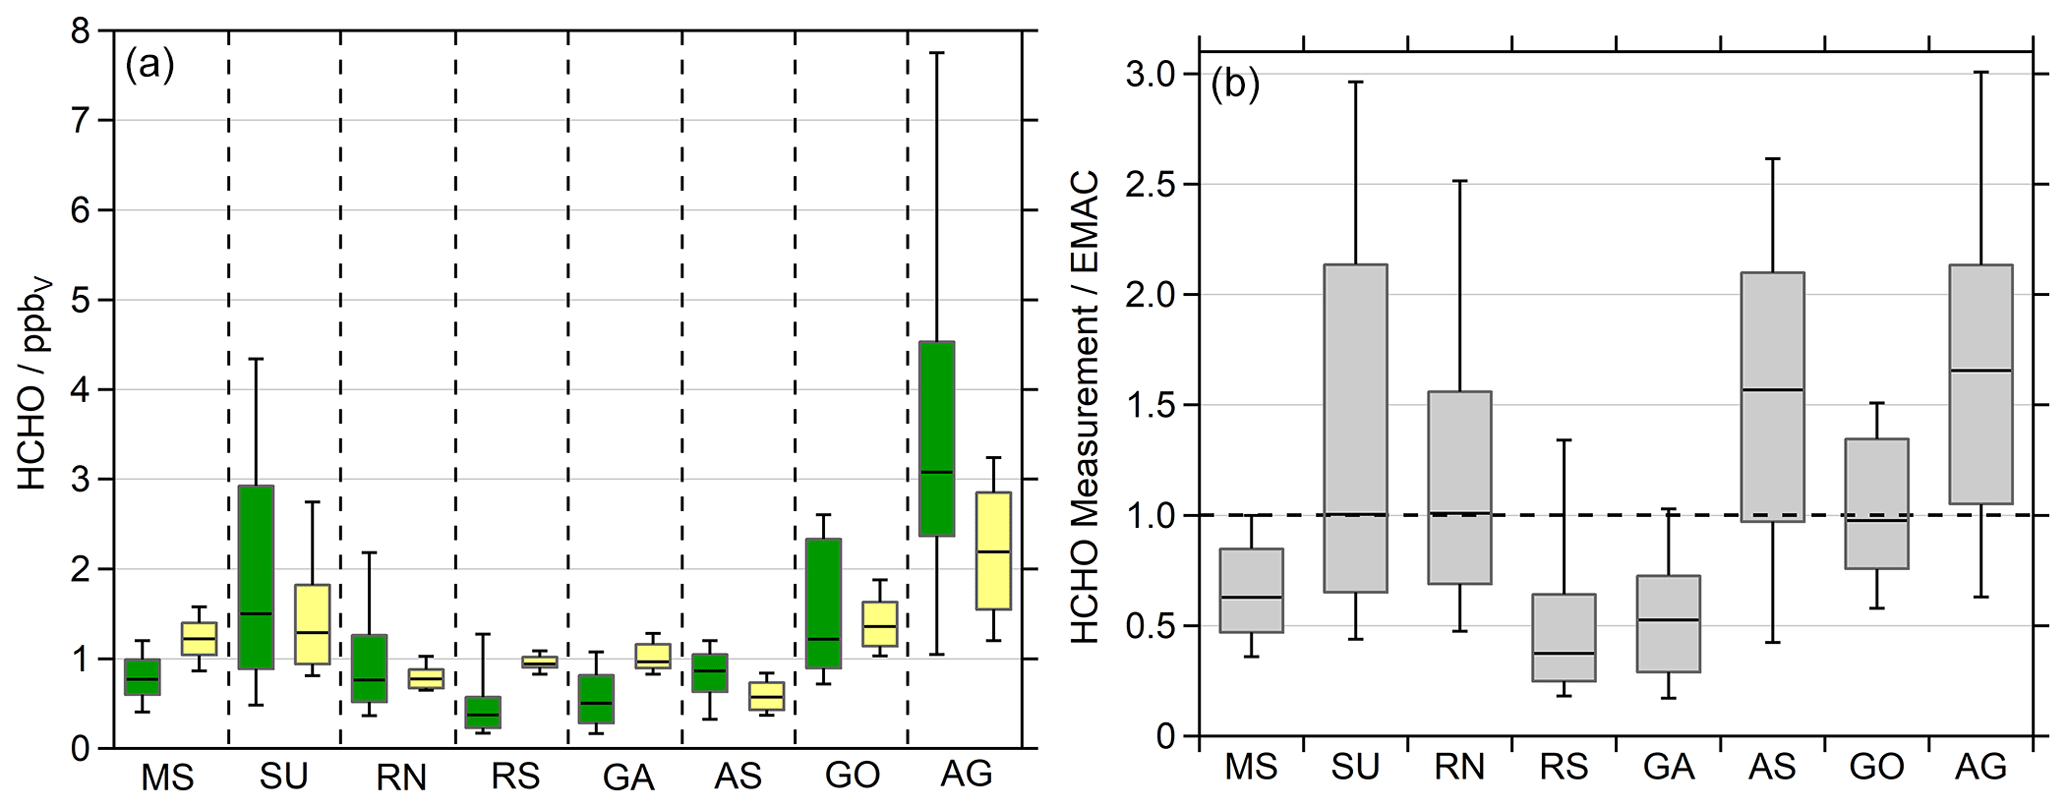
Figure 3Formaldehyde observations (green) and EMAC simulations (yellow) divided into the eight regions during AQABA: Mediterranean Sea (MS), Suez Canal (SU), Red Sea north (RN), Red Sea south (RS), Gulf of Aden (GA), Arabian Sea (AS), Gulf of Oman (GO) and Arabian Gulf (AG). We used the lowermost model results (∼30 m) for the comparison in 10 min averages (a). The box represents 25 % to 75 % of the data, and the whiskers are from 10 % to 90 % with the median as the black line. Panel (b) shows the ratio between the observations and the model simulations.
Elevated NOx and O3 measurements classified the AG and SU as the most polluted regions, followed by the RN and GO, which both were influenced to a higher extent by anthropogenic pollution (Tadic et al., 2020). The elevated HCHO during the high-ozone and VOC conditions on the first leg in the AG was not reproduced by EMAC. Here the model clearly underestimates HCHO (Fig. S1) and ROOH (Fig. S5). Since the elevated OVOCs correlated well with CO and O3 (Wang et al., 2020), we can assume that we probed a highly polluted and photochemically active air mass, with both effective photochemical production and primary emissions of HCHO. Paris et al. (2021) identified natural-gas flaring as a major source of the elevated VOCs over the Arabian Gulf. During this event, maximum HCHO and ROOH mixing ratios were measured during AQABA, with values up to 12.6 ppbv HCHO and 2.26 ppbv ROOH in the center of the gulf (Figs. 2, S9, S19). The event was less pronounced in EMAC with up to 3.31 ppbv HCHO leading to an underestimation over the AG by about a factor of 4. EMAC does not simulate significantly elevated values of ROOH peaking at 0.49 ppbv with elevated contributions of PAA and EHP. Even though the model underestimates ROOH also by about a factor of 4 (Fig. S9). Wang et al. (2020) showed that EMAC simulates enhanced acetone and methyl ethyl ketone (MEK) during this event, although the model shows no significant increase in acetaldehyde.
In the Suez Canal and the Gulf of Suez (SU), the second most polluted region, the model also underestimates HCHO mixing ratios, even though EMAC simulates a significant increase in HCHO compared to the MS and RN. Wang et al. (2020) showed that these air masses have been influenced by biomass burning and increased anthropogenic emissions, e.g., by gas flaring similar to the Arabian Gulf.
EMAC overestimates HCHO in the less polluted regions of the MS, RS and GA. Tadic et al. (2020) also found that the simulations overestimate NOx and O3 in these areas. EMAC significantly underestimates HCHO for the AS, especially at night (Fig. S1). Here, a well-pronounced diurnal cycle is simulated, while the observations indicate only a distinct diurnal variation in the eastern part of the AS, which got stronger in the GA (Fig. S1). Slightly elevated mixing ratios were observed in the AS, compared to clean MBL conditions, e.g., during INDOEX (Wagner et al., 2001), and are most likely caused by other primary sources and oxidation of further VOCs, not by methane oxidation only. Previous observations in the remote MBL showed significantly lower HCHO in the range of 0.2–0.4 ppbv (Wagner et al., 2001). Thus, we assume that the air masses encountered in the AS during AQABA were still influenced by anthropogenic pollution, which is supported by the elevated NOx (Tadic et al., 2020) and acrolein as the main contributor to OH reactivity in the AS and GA (Pfannerstill et al., 2019). An additional source for HCHO was the ozonolysis of ethene, which reached maximum values of 0.24 ppbv with a median of 0.08 ppbv in the AS (Bourtsoukidis et al., 2019). Wang et al. (2020) also show strongly enhanced acetaldehyde in the AS relative to model simulations, indicating a missing oceanic source in the model. Tripathi et al. (2020) also performed VOC and seawater measurements of phytoplankton species, which demonstrate the high biological activity in the region. They determined elevated ethene (8.92±3.50 ppbv) and propene (3.38±1.30 ppbv) in marine air originating from the Arabian Sea. Just recently, Tegtmeier et al. (2022) highlighted the complexity of the air phase composition over the Indian Ocean, with the major differences between the Indian summer and winter monsoon.
Altogether, EMAC reproduces observed HCHO mixing ratios on average within a factor of 2. However, the model clearly underestimates air pollution over the Arabian Gulf, which leads to the assumption of missing sources in EMAC and may also be related to the limited resolution of EMAC. The model simulates the AS cleaner than it was observed, but the relatively low levels of HCHO over the RS with winds from Eritrea (Figs. S2, S17) were overestimated. Analysis of the air mass origin showed that air masses over the Arabian Sea represented clean and aged conditions transported from the center of the Indian Ocean (Fig. S18). Given the multitude of potential HCHO sources both from direct emissions and a large variety of photochemical precursors and the limited resolution of EMAC, the agreement within a factor of 2 is satisfactory. The comparison of simulated HCHO based on a more highly resolved model (WRF-Chem; Weather Research and Forecasting) did not improve the accuracy of HCHO and was thus not included in the paper.
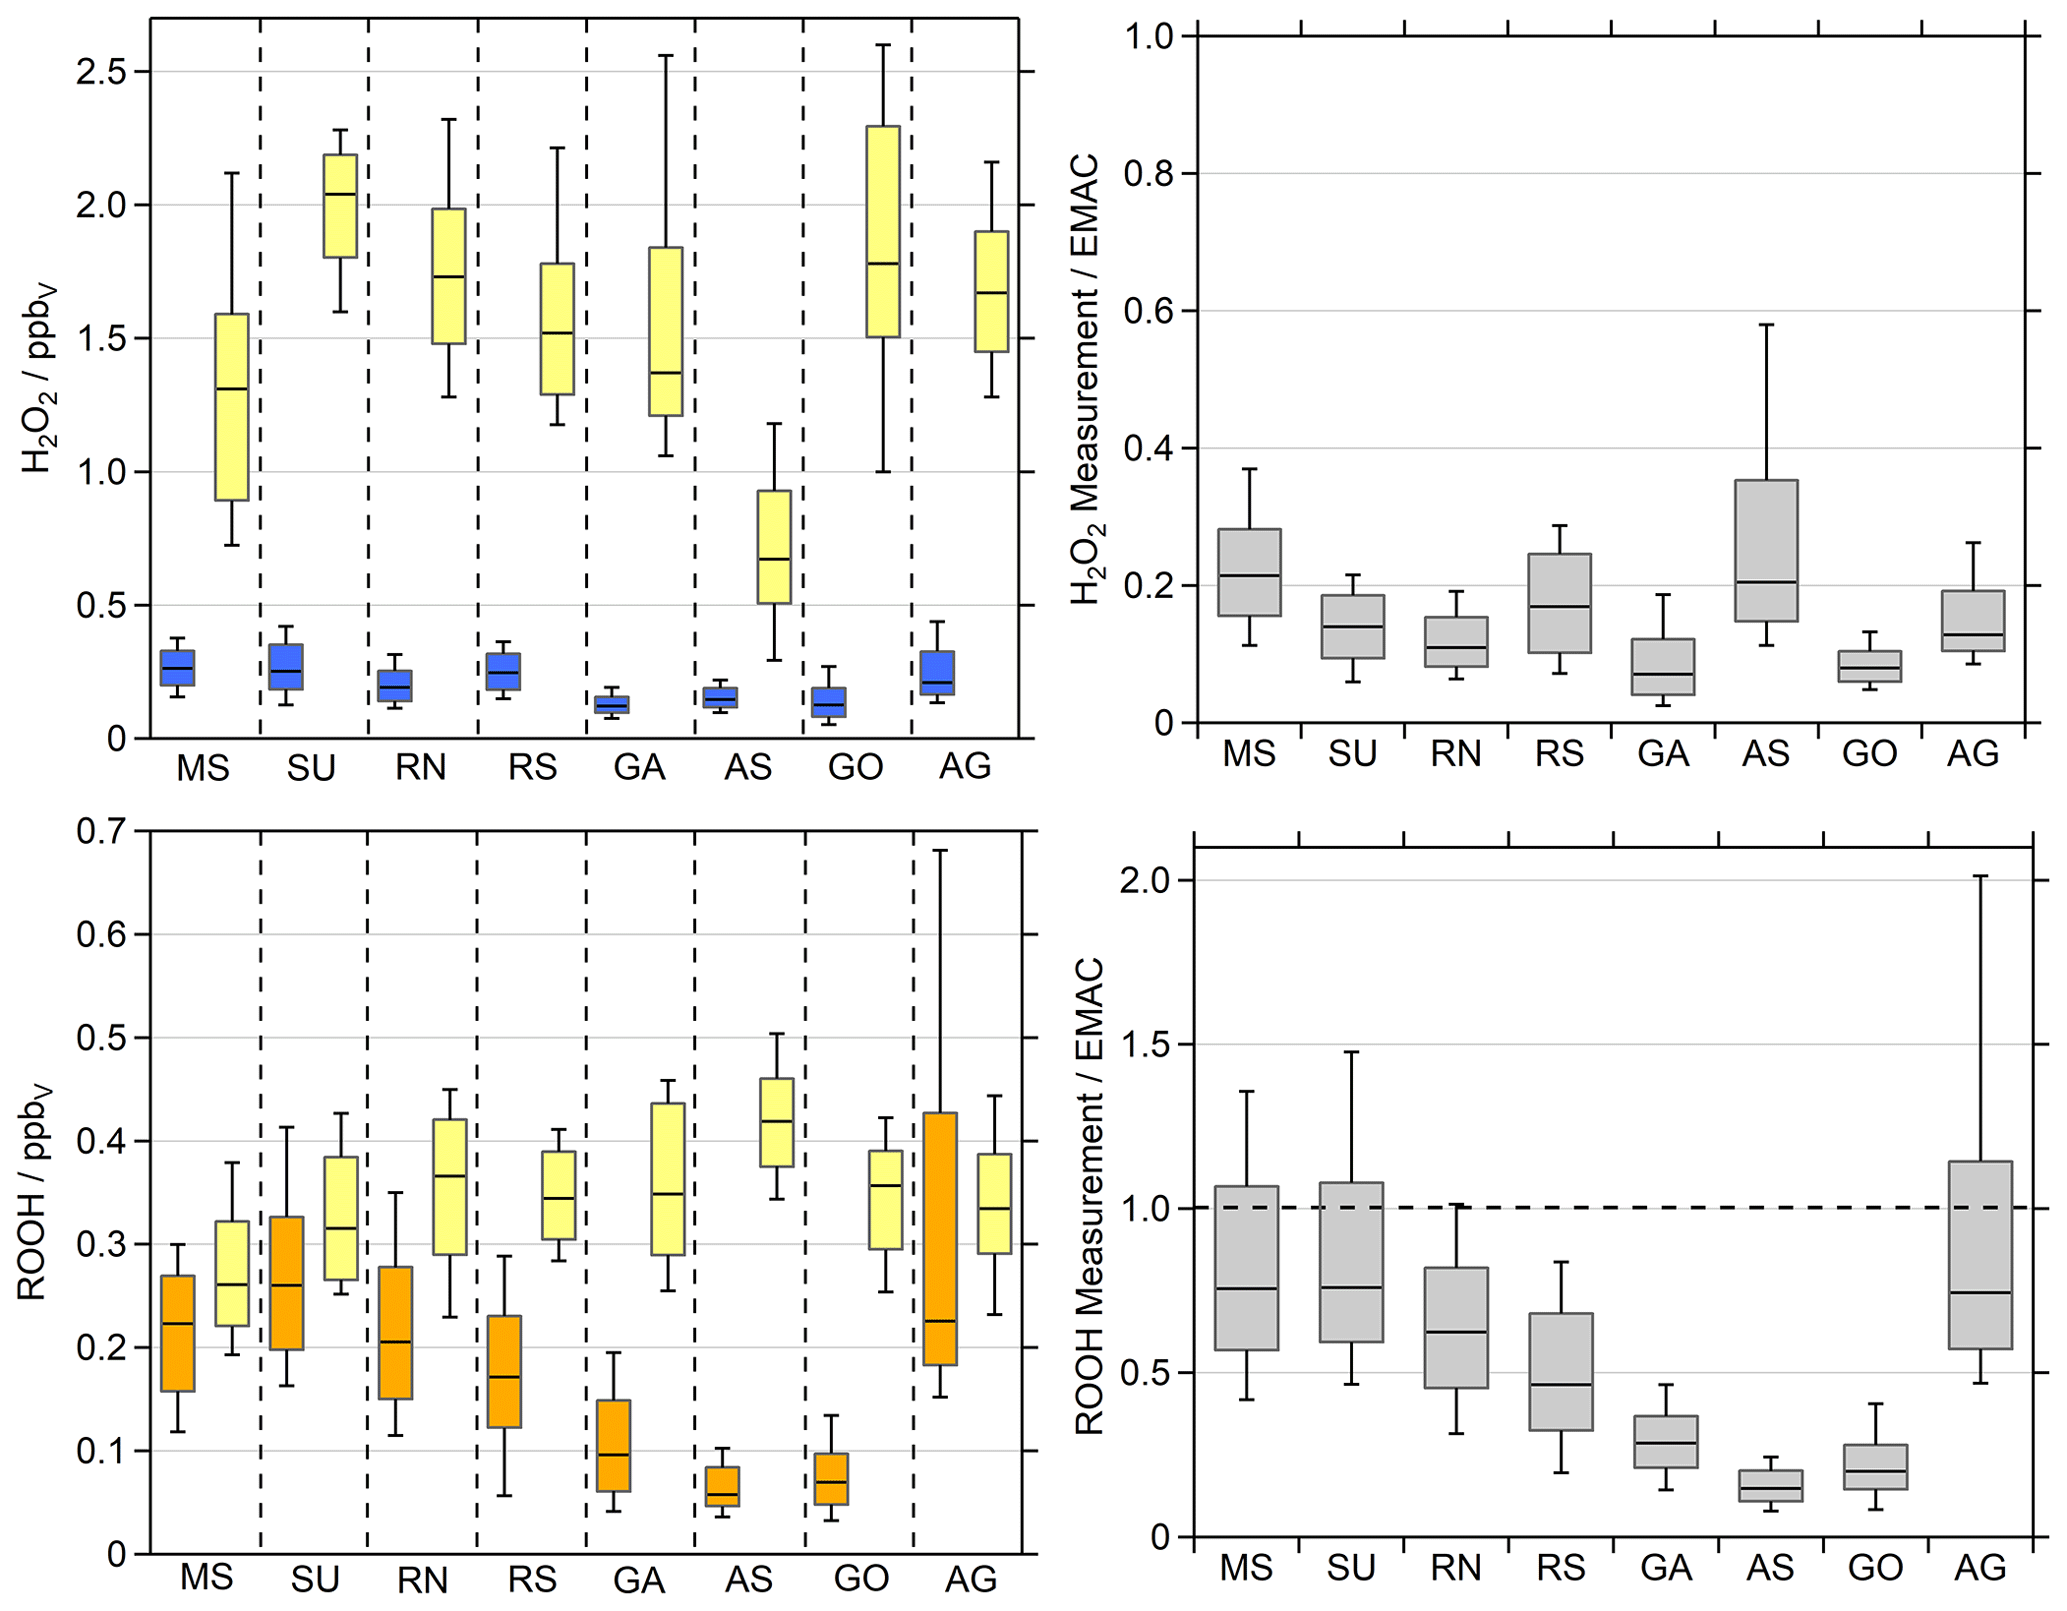
Figure 4H2O2 (blue) and organic hydroperoxide (ROOH, orange) observations compared to the EMAC simulations (yellow). We used the lowermost model results (∼30 m) for the comparison. The box represents 25 % to 75 % of the data, and the whiskers are from 10 % to 90 % with the median as the black line. The right panel shows the ratio between the observations and the simulations.
The measurement–model comparison for H2O2 reveals that EMAC systematically overestimates H2O2 mixing ratios by up to an order of magnitude. With the exception of the Arabian Sea (0.7 ppbv), the model predicts H2O2 with median mixing ratios in excess of 1.3 ppbv, with the highest median values of 2.0 and 1.8 ppbv for the SU and GO, respectively. While the measurements cover a whisker range (10 % to 90 % of the data) of only 0.1 to 0.4 ppbv, this consistent overestimation by the model indicates either a significant overestimation of H2O2 sources or missing sinks in the model or a combination of both.
In order to compare the observations of ROOH with model results, we summed up individual simulated organic hydroperoxide species, which were identified in the qualitative HPLC measurements (Fig. S4): methyl hydroperoxide (MHP), peracetic acid (PAA) and ethyl hydroperoxide (EHP). Please note that measured ROOH is a lower limit of the sum of organic hydroperoxides, since different sampling efficiencies for the individual species, which depend on the Henry's law constants, are not accounted for. It can be assumed that MHP is the dominant contributor to the total organic hydroperoxides in the clean MBL, which has a sampling efficiency of only 60 % (Fischer et al., 2015). In remote areas, this would lead to an underestimation of measured ROOH by a factor of 0.6. With significant contributions of higher organic hydroperoxides, which are generally more soluble, this underestimation tends to be smaller.
EMAC also tends to overestimate the organic hydroperoxides, with the lowest median value of 0.26 ppbv in the MS (observations of 0.22 ppbv) and the highest of 0.42 ppbv in the AS (observations of 0.06 ppbv) (Fig. 4 and Table S1). For the whole dataset, the simulated ROOH cover a whisker range (10 % to 90 % of the data) between 0.19 and 0.50 ppbv, while the observations span 0.04 to 0.68 ppbv. Although the measurements can be reproduced within the 25 %–75 % box range in some regions, median values differ between about a factor of 1 to 7 between the simulations and observations. Please note that the AG was the only region where we measured four separated hydroperoxides in the in situ results of the HPLC, with the largest contribution of MHP and EHP. This enhancement was also found in the EMAC results, as EHP and PAA mixing ratios increased in the AG, especially during the high-pollution events of the first leg (Fig. S10). Although the simulations of ROOH match the observations better than H2O2, EMAC overestimates the organic peroxides, especially in the clean regions while cruising close to the coast. The AG shows the highest variability in ROOH, which is to be expected due to the complex photochemistry of VOCs (Bourtsoukidis et al., 2019; Pfannerstill et al., 2019). The model simulates strong diel cycles (∼300 pptv) throughout the whole dataset, while the observations only indicate comparable variations for the RN, SU, MS and AG. A distinct decline in ROOH mixing ratios was observed for the AS and GO, which is not reproduced by EMAC.
Possible explanations for the systematic overestimation of both H2O2 and organic hydroperoxides by EMAC can be an overestimation of photochemical sources or an underestimation of loss processes in the model or due to the unknown sampling efficiencies of the organic peroxides. To investigate photochemical misrepresentations, we compared the observed and simulated OH and HO2 daytime values ( s−1; Figs. 5, S7, S8). Since the source term of H2O2 depends quadratically on HO2 concentrations (Eq. 3), simulations of H2O2 are highly sensitive to HO2, while its photochemical loss scales linearly with OH (Eq. 4). The model overestimates both OH and HO2 throughout the whole campaign. The highest observed HO2 median values were found in the SU (19.3 pptv) and RN (16.3 pptv), followed by the RS (14.8 pptv) and MS (14.4 pptv). The remaining regions show significantly less HO2 with the smallest median value for the GO (4.5 pptv). The smallest whisker ranges of the dataset in the AS and GO demonstrate suppressed HO2 in these regions. Surprisingly small mixing ratios were also detected over the polluted Arabian Gulf (6.8 pptv).
According to the observations, EMAC simulates the highest HO2 median values for the SU (27.9 pptv) and RN (26.1 pptv), while mixing ratios in the MS (19.4 pptv) and RS (11.2 pptv) are smaller. Significant overestimation of HO2 was found for the GO (23.1 pptv) and AG (19.0 pptv), showing similar enhancements of HO2. In the rather clean regions during AQABA, e.g., GA (16.7 pptv) and AS (19.6 pptv), the model generates significantly enhanced daytime HO2 compared to the observations, while diurnal variation in HO2 matches the observations in the RS and MS (Fig. S8). Altogether, we examined an overestimation of HO2 by about a factor of 2 (EMAC dataset was aligned to the observations), with average daytime mixing ratios of 11.3 pptv for the observations and 19.7 pptv for the EMAC simulation, respectively.
The highest median OH values were observed for the SU (0.13 pptv), RN (0.13 pptv), MS (0.12 pptv) and GO (0.11 pptv). Slightly less OH was detected in the RS (0.07 pptv), AS (0.05 pptv) and AG (0.05 pptv). The box-and-whisker plot ranges indicate the highest variations in OH in the GA, where we detected the highest OH mixing ratios of 0.6 pptv close to Bab-el-Mandeb on 16 August 2017 (Fig. S7). EMAC simulates the highest OH mixing ratios in the SU (0.49 pptv), GO (0.47 pptv) and RN (0.44 pptv), while the lowest median values of OH were simulated in the RS (0.13 pptv), followed by the MS (0.26 pptv) and AS (0.26 pptv).
The EMAC results for OH follow similar regional trends compared to HO2, although they reflect a stronger pronounced overestimation, since the measurements do not reflect a substantial increase in OH in the MS, SU, RN and RS. This results in overestimated daily median values within a factor of 2 to 5.
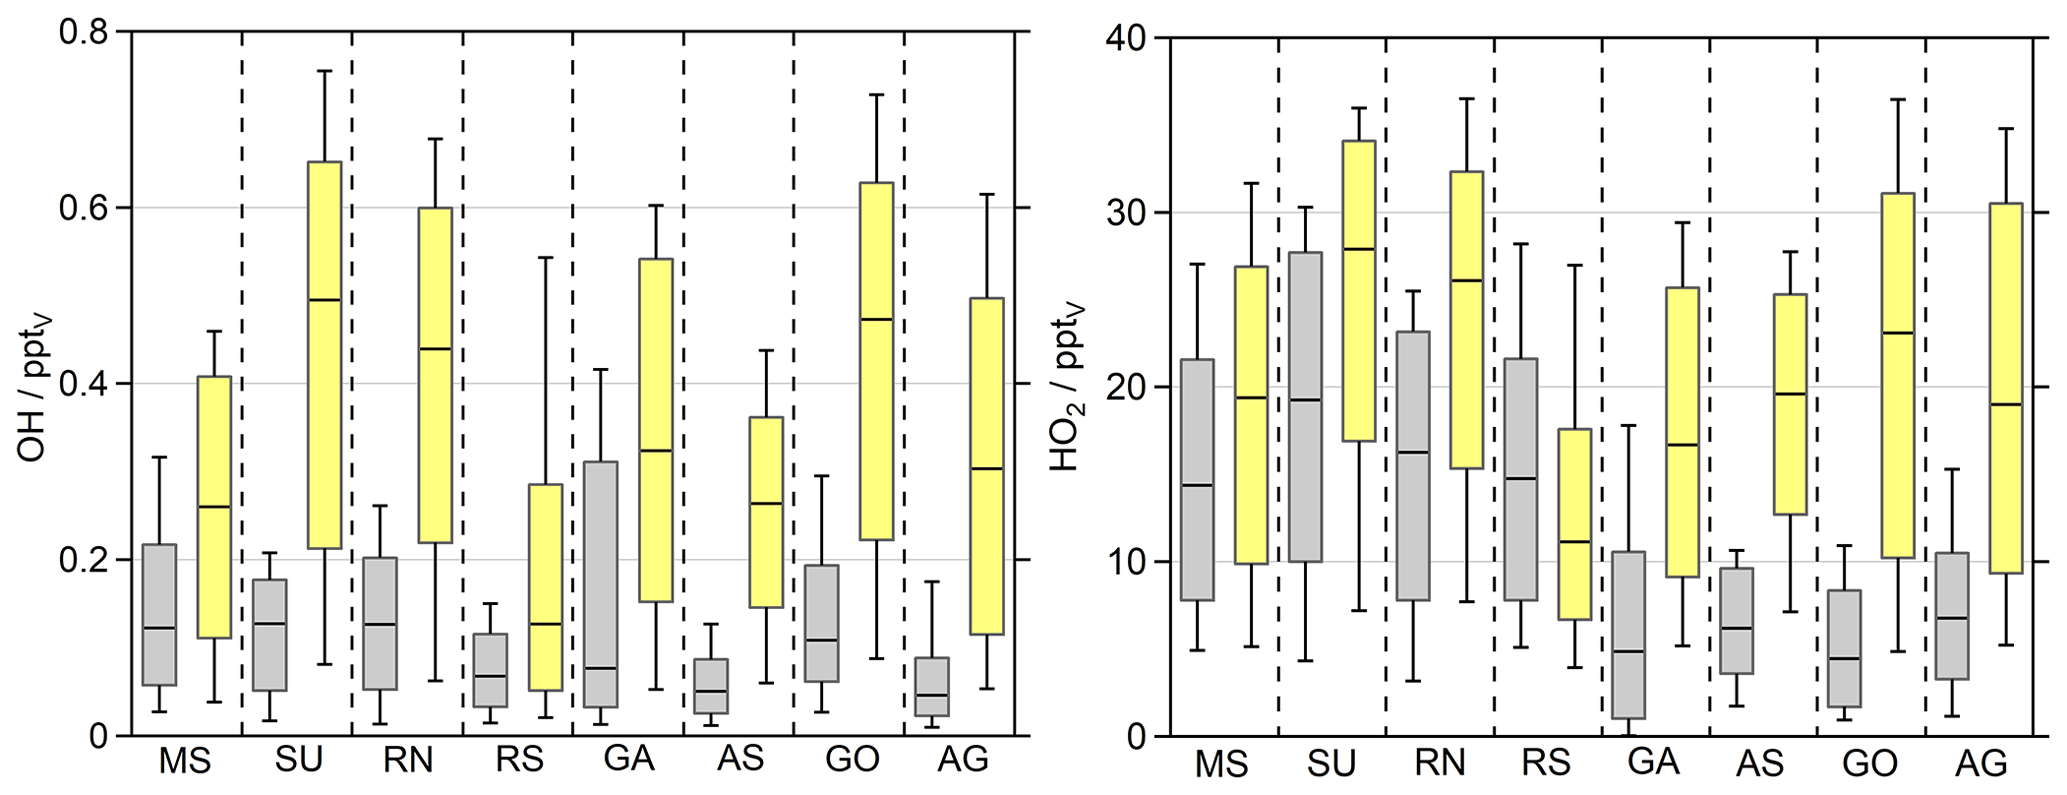
Figure 5OH and HO2 daytime values ( s−1) of the observations (grey) and the EMAC simulations (yellow). The box represents 25 % to 75 % of the data, and the whiskers are from 10 % to 90 % with the median as the black line. The EMAC data were adapted to the measurements with a time resolution of 10 min so that the diurnal variations are reflected accurately.
3.3 Photochemical production and loss of H2O2
The comparison to EMAC in the previous section showed that overestimations of HOx by EMAC affect simulations of HCHO, H2O2 and ROOH. How misrepresentation of HOx will affect HCHO is complex due to the many HCHO sources and the fact that both sources and sinks are strongly related to OH concentrations. Therefore, we will concentrate on H2O2 in the following calculation of its photochemical production and loss terms in order to evaluate the discrepancy between modeled and measured H2O2. H2O2 is highly sensitive towards deviations of HOx between the observations and the model, as its production depends quadratically on HO2 (Eq. 3) but its loss only linearly on OH (Eq. 4). Thus, H2O2 can be used to evaluate the discrepancy between measured and modeled HOx.
The daytime production rates of H2O2 ( s−1) are displayed in Fig. 6 in order to compare the results of the observations and EMAC, with the corresponding timelines presented in Fig. S11 and a scatterplot of in Fig. S12. Based on the observations, the highest production rates were found in the SU with a median production of 202 pptv h−1 and the largest whisker range of up to ∼480 pptv h−1. A similar range was simulated by EMAC with an increased median value of 298 pptv h−1. The MS and RN demonstrate comparable results, where the box ranges of the observations and the model agree to some extent, although the overestimated HO2 by EMAC outweighs the slightly smaller reaction constant of (Fig. S12). Overall, EMAC tends to overestimate P(H2O2), except in the RS, where the model correctly simulates the lowest H2O2 production rates of the dataset with a median value of 63 pptv h−1 – about a factor of 5 lower than in the SU. However, the observations display reduced P(H2O2) in the remaining regions, which resulted in a stronger pronounced discrepancy with at least a factor of 5 for the GA, AS, GO and AG.

Figure 6Box plots of H2O2 production rates (pptv h−1) for the observations (grey) and the EMAC model (yellow) during daytime ( s−1) and the corresponding loss rate constants (s−1) for photolysis (observations in grey and EMAC in yellow) and reaction with OH (green, orange). The box represents 25 % to 75 % of the data, and the whiskers are from 10 % to 90 % with the median as the black line. The corresponding timelines are presented in Fig. S11. Note that the deposition term from Eq. (4) is not included in the calculation of the losses.
Besides dry deposition, photochemical losses of H2O2 are the reaction with OH and photolysis, which were calculated according to Eq. (4) and displayed without multiplication of the H2O2 mixing ratio for the sake of comparability (Fig. 6). The simulated photolysis rate constants (j values) demonstrate good agreement with the observations with a factor of 1.2, during the rarely cloudy conditions of AQABA. EMAC only overestimates for air masses very close to the coastline, e.g., in the SU (up to s−1) and to a lesser extent in the GO, while the photolysis rate was underestimated in the RS (Fig. S11). Loss of H2O2 due to photolysis was less important than the reaction with OH for most regions, while photolysis prevailed for the AS, RS and AG. In contrast to the observations, photochemical losses of H2O2 were dominated by the reaction with OH and were overestimated within a factor of ∼2–5 by the model with the best agreement in the RS. Loss due to dry deposition could not be determined during the day, but nighttime deposition velocities are calculated in Sect. 3.4.
To further put these results into perspective, Fig. 7 presents the net photochemical production of H2O2 (P(H2O2)–L(H2O2)), whereby the loss rate constants were multiplied with the H2O2 mixing ratio. Please note that in this term neither physical loss processes (e.g., deposition) nor transport are represented, and thus it only reflects the effect of local photochemistry on the H2O2 mixing ratio. The slightly overestimated photochemical production in the MS, SU and RN by EMAC is compensated by elevated losses via reaction with OH in these regions so that both datasets agree well in the MS and RN and demonstrate a strongly pronounced diurnal variation peaking at ∼580 and ∼500 pptv h−1, respectively (Fig. 8). Net photochemical production of H2O2 outweighs the model results in the SU and RS, especially at noon (Fig. 8). The GA, AS, GO and AG remain overestimated by EMAC so that the elevated losses in the model do not compensate for the enhanced production rates due to the quadratic dependence on the HO2 concentration. The observations demonstrate less net photochemical production in the GA, AS, GO and AG with noontime values below 200 pptv h−1 due to the decreased HO2. Pfannerstill et al. (2019) reported the highest OH reactivity in the AG (11.6 s−1) and SU (10.4–10.8 s−1), comparable results for the GO (8.4 s−1) and GA (8.0 s−1), and the lowest OH reactivity for the AS (4.9 s−1). Air masses in the AG demonstrated by far the highest contribution of reactivity towards OVOCs (∼40 %), alkanes and alkenes (together ∼14 %). Air masses in the GO showed slightly higher contributions of reactions with NOx compared to the AG, while the AS represents the cleanest conditions during AQABA with respect to NOx (Tadic et al., 2020). A potential explanation for the surprisingly low HO2 mixing ratios in the AG could be suppressed OH recycling by means of enhanced organic peroxy radicals (RO2) and in general a large contribution of reactions with OVOCs, alkanes, alkenes and aromatics, as OH recycling through these reactions is slower compared to NOx recycling (via HO2 + NO). Enhanced ROOH indicates a larger contribution of ROx reactions (= OH + HO2 + RO2), which would also slow down OH recycling. There are no measurements of organic peroxy radicals available, but Tadic et al. (2020) calculated noontime estimates of HO2 + RO2, with the highest noontime median values of ∼75 pptv in the AG (see Fig. 7 of Tadic et al., 2020). The remaining regions of AQABA show noontime median values in the range of ∼10–35 pptv. Elevated RO2 in the AG is also supported by the enhanced mixing ratios of ROOH, the only region where we detected MHP, PAA and EHP in the in situ measurements of the HPLC (Fig. S10).
The decreased observations of net photochemical production of H2O2 in the AS, GO and GA are generally caused by lower HOx mixing ratios, which are not reproduced by EMAC. The box range indicates similar values of net photochemical production in the MS, which agree mostly within a factor of 2. However, the H2O2 observations display an average diurnal variation of ∼0.2 ppbv with the highest mean mixing ratios of ∼0.4 ppbv at 12:00 UTC, while the EMAC results indicate a variation of ∼1.2 ppbv with the highest mixing ratios of ∼2.1 ppbv also at 12:00 UTC (Fig. S13). In general, the observations only display weak diurnal variations compared to the large diurnal variation in net photochemical production, which implies that other loss processes (e.g., deposition, wash out due to sea spray) contributed significantly to the diurnal variability in H2O2 in the marine boundary layer.
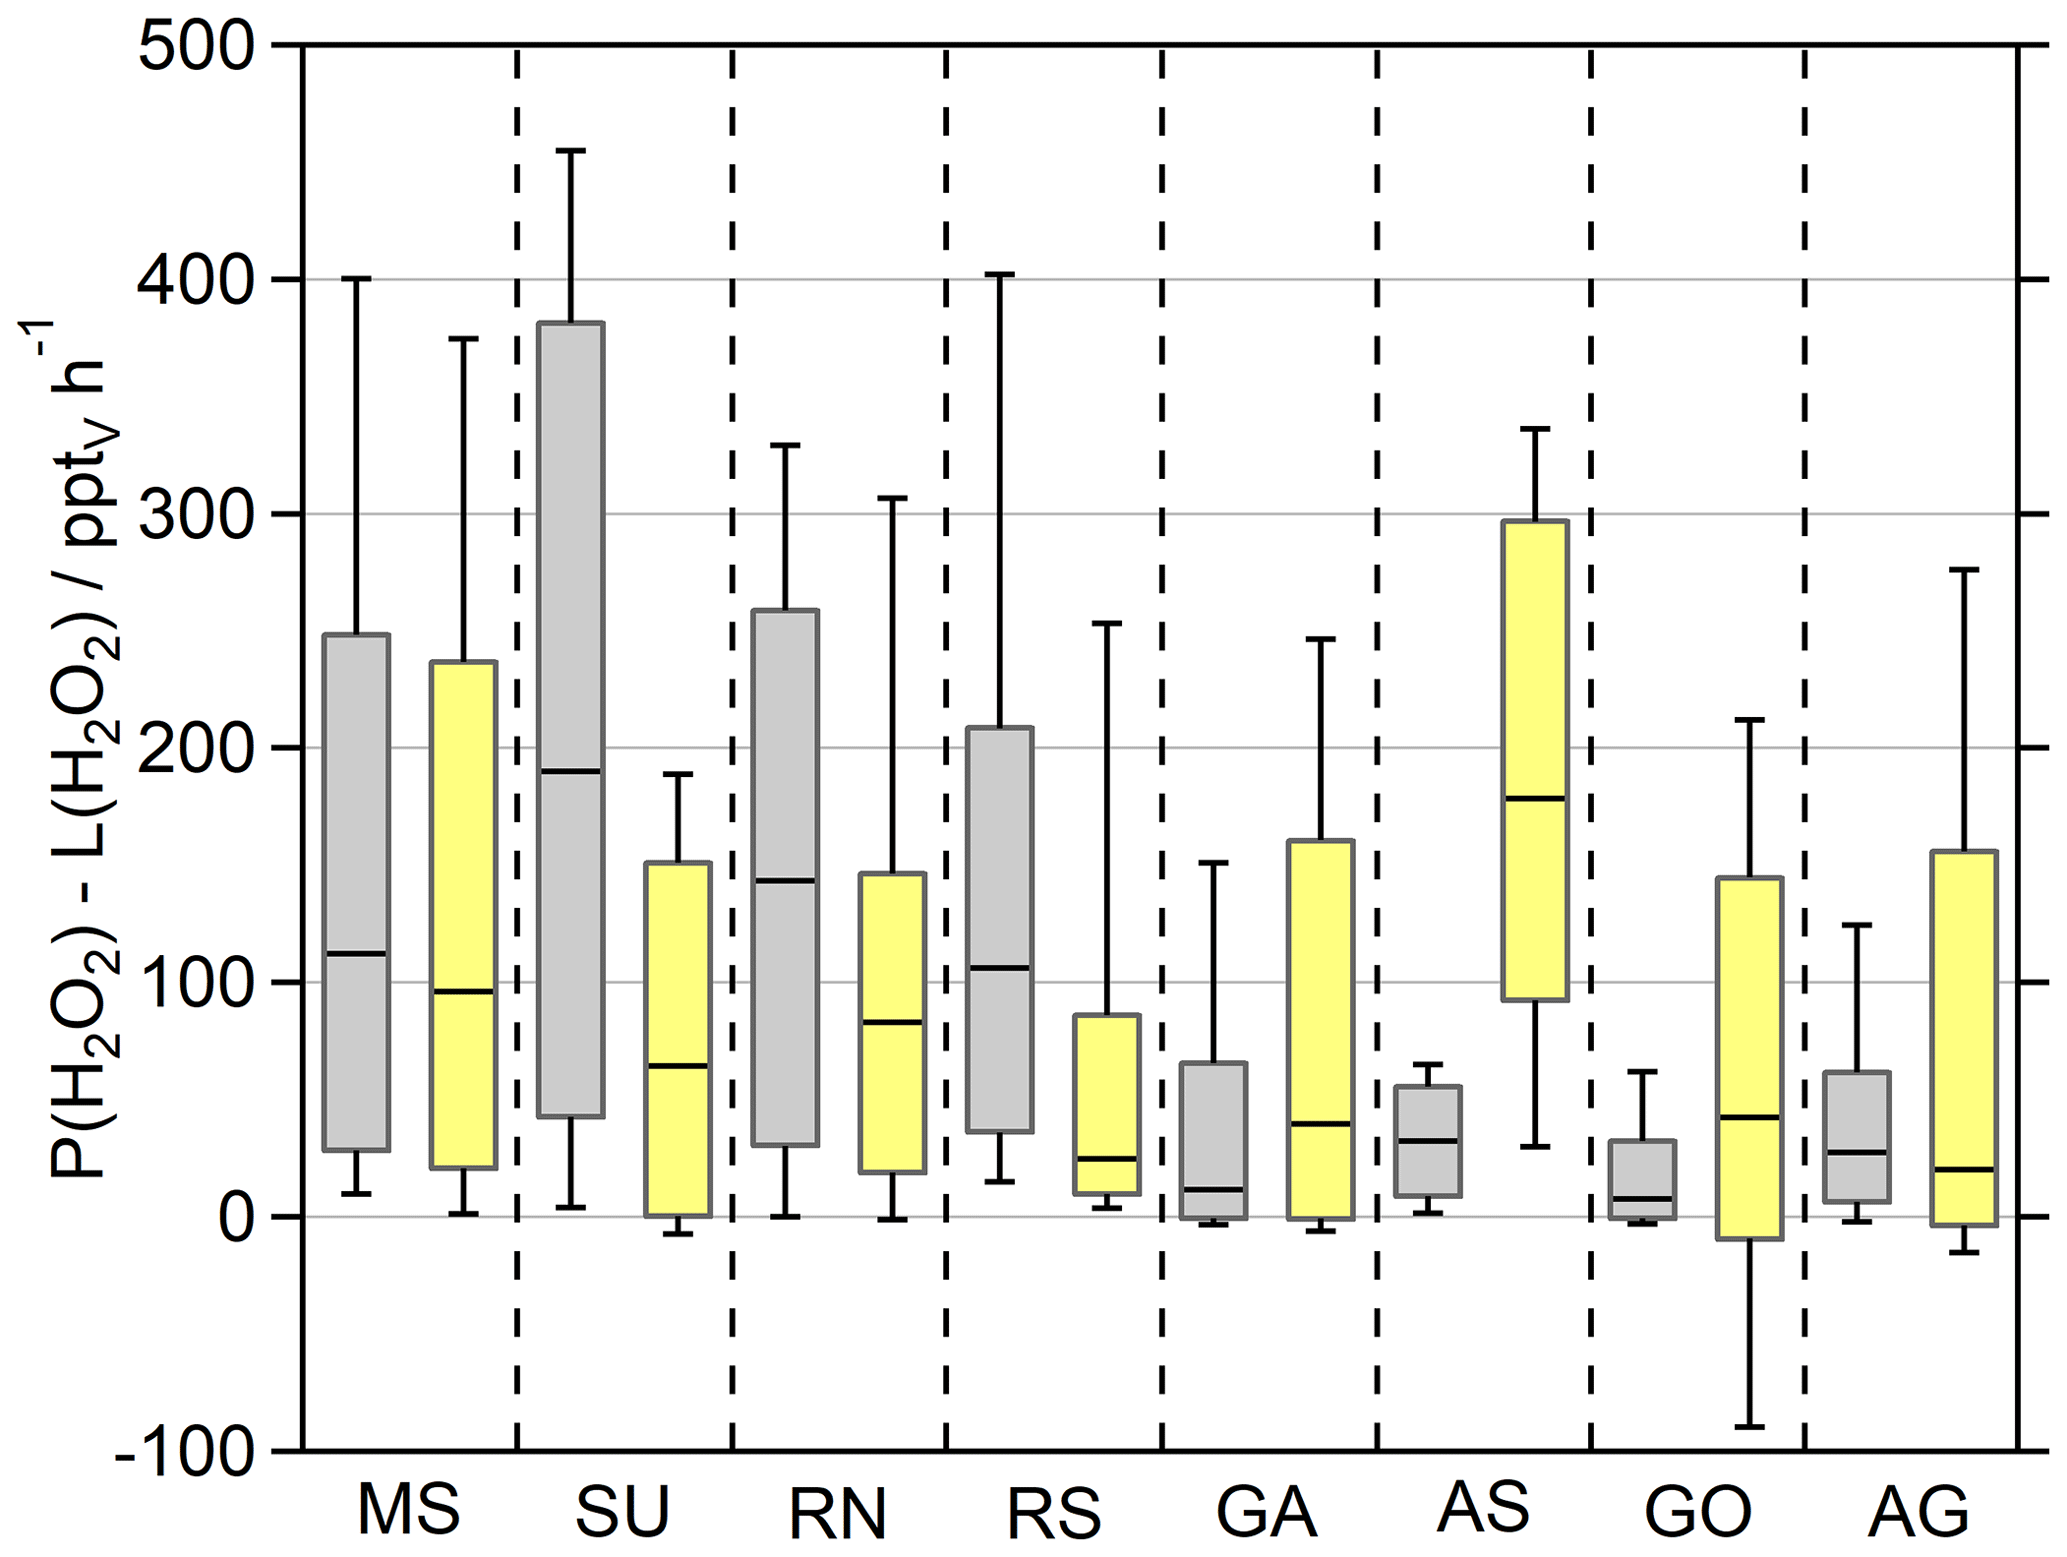
Figure 7Box plot of the net photochemical production of H2O2 (P(H2O2)–L(H2O2)) of the observations and the EMAC model results (yellow) during the day ( s−1). The box represents 25 % to 75 % of the data, and the whiskers are from 10 % to 90 % with the median as the black line. The corresponding timelines are presented in Fig. S11. Note that the deposition term from Eq. (4) is not included in this calculation.
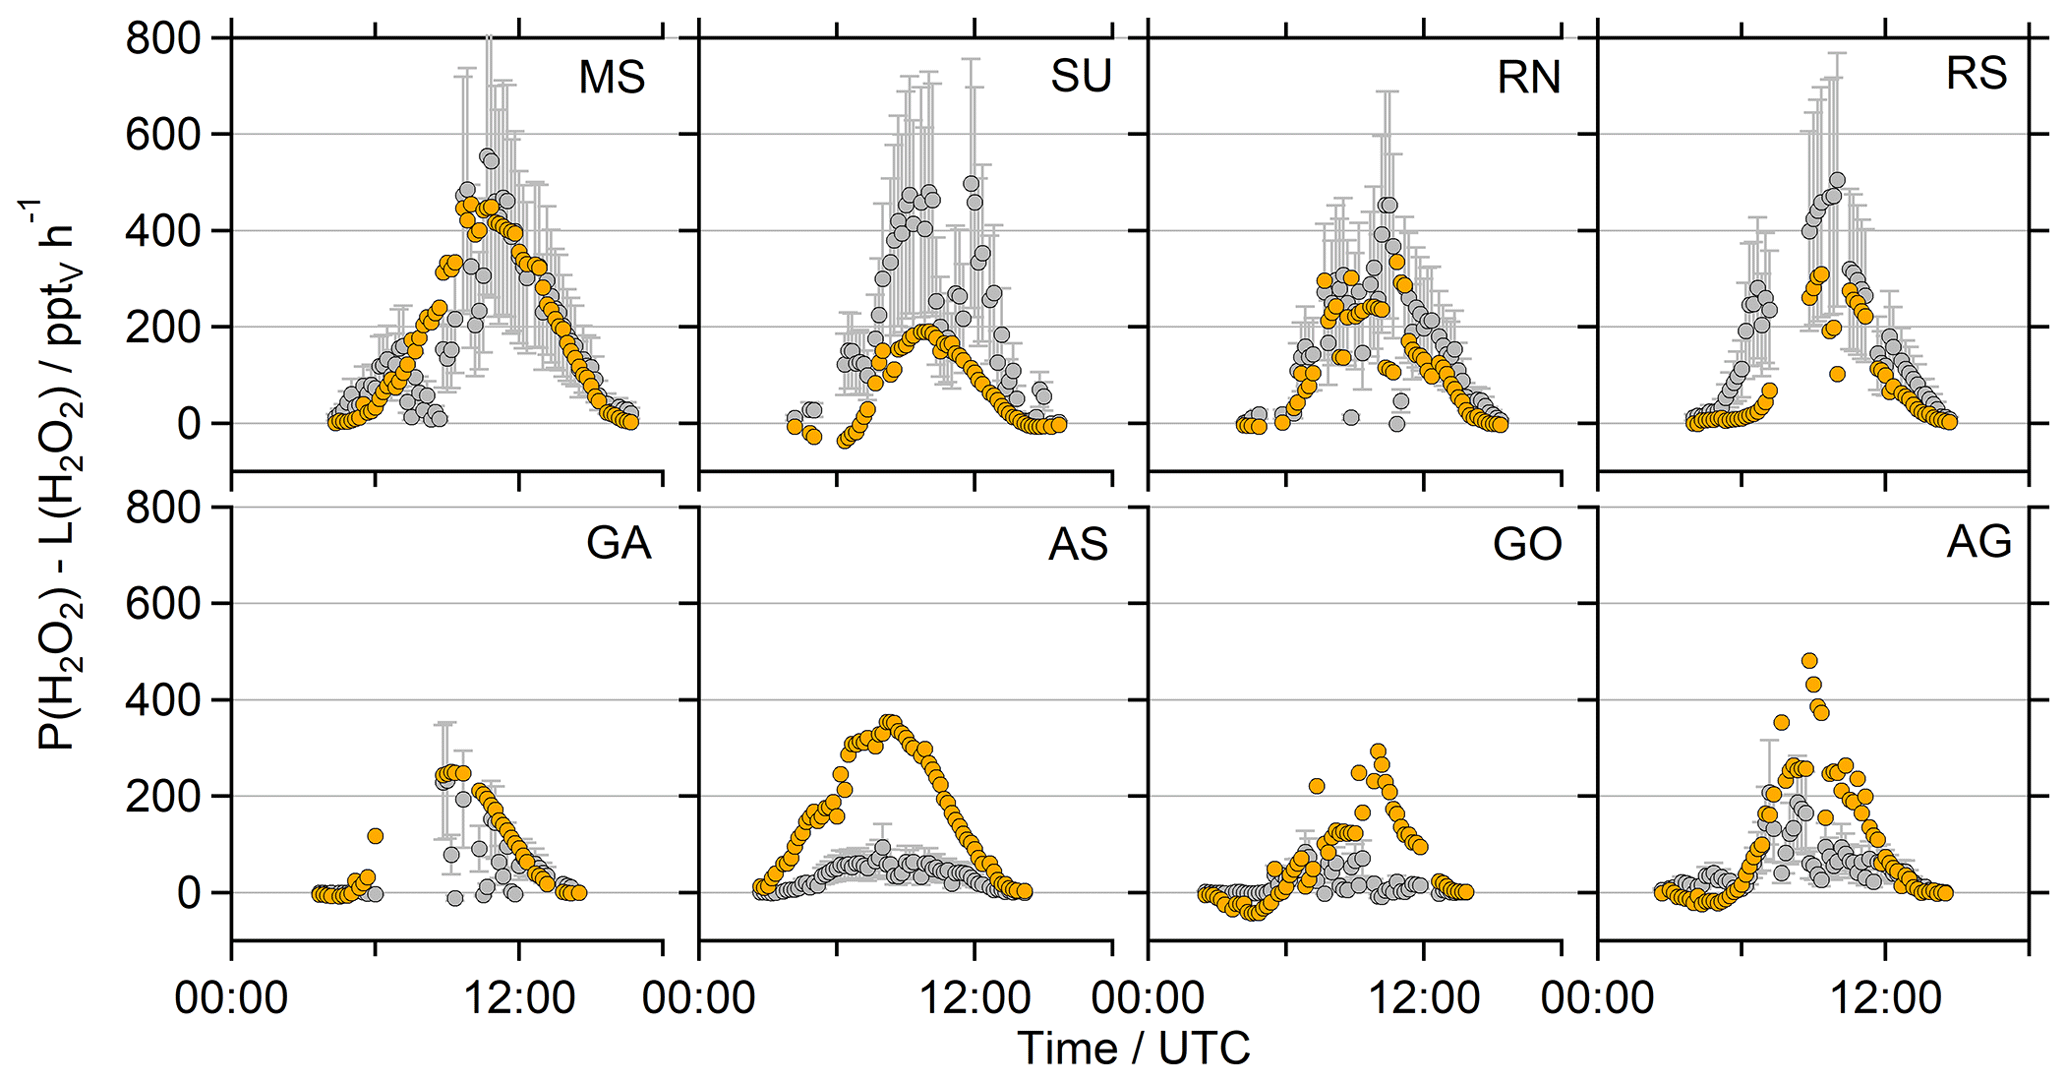
Figure 8Diurnal variation in the net photochemical production of H2O2 (P(H2O2)–L(H2O2)) of the observations (grey) and the EMAC model results (orange) during the day ( s−1). The corresponding timelines are presented in Fig. S11. Note that the deposition term from Eq. (4) is not included in this calculation.
3.4 Dry deposition
An alternative reason for deviations between H2O2 observations and EMAC predictions could lie in the physical processes of deposition to the ocean surface and entrainment through the top of the MBL. Both processes are related to the absolute value and the diurnal variability in the boundary layer height. Due to the coarse resolution of EMAC grid cells (approx. 120 km), the boundary layer height (hBL) in the model is often affected by diurnal variation due to neighboring continental cells, especially close to the coast. Figure 9 shows EMAC simulations of hBL compared to ERA5 data (fifth-generation ECMWF reanalysis). ERA5 resolves the global atmosphere in hourly intervals for 30 km grids at 137 vertical levels up to 0.01 hPa, and thus its horizontal resolution is a factor of 4 higher than that of EMAC. The ERA5 dataset is available within the Copernicus Climate Change Service (https://www.ecmwf.int/en/forecasts/datasets/reanalysis-datasets/era5; last access: 27 February 2021). The BL simulated by EMAC is very shallow at night and increases rapidly in height after sunrise, which may reflect continental influence in the EMAC grid boxes. The only regions where EMAC shows no clear continental influence are the AS and the MS, even though the model clearly underestimated the hBL over the Arabian Sea and even more over the Mediterranean Sea. Local maxima on 27 and 30 August are prominent while passing Crete and the Strait of Messina.
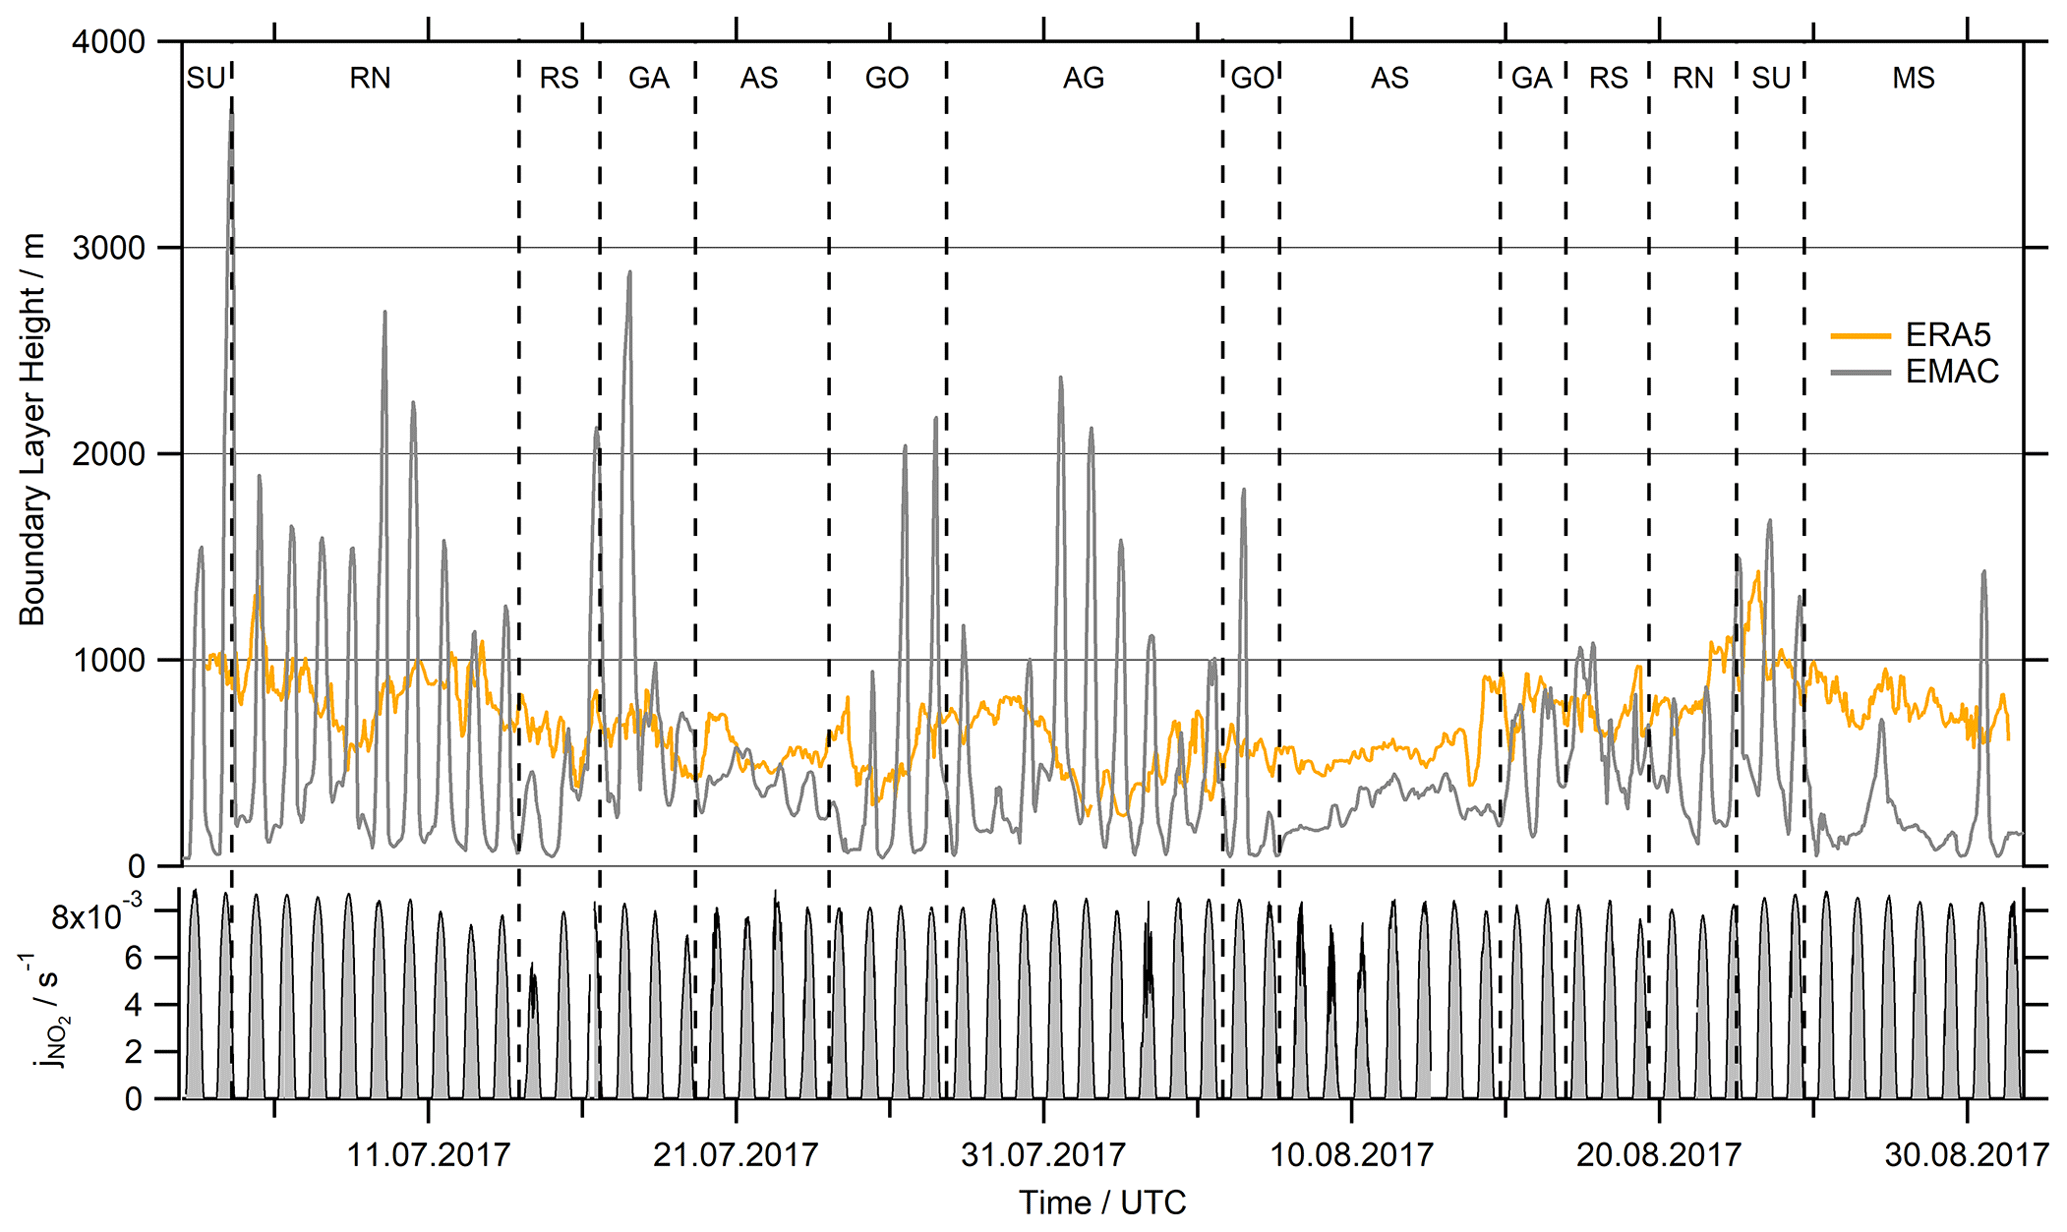
Figure 9Comparison of the simulated hBL in EMAC with ERA5 (fifth-generation ECMWF reanalysis) data at a resolution 4 times higher (31 km grid) than EMAC (∼110 km grid) and hourly averaged data. EMAC's hBL indicates continental influence by the strong diurnal variation while cruising close to the coast (SU, RN, GA, GO and AG), with the highest values determined for the ports of Jeddah (10–13 July), Djibouti (16 July) and Kuwait (1–3 August). The measured photolysis frequency serves as a reference of sunlight intensity during AQABA.
This misrepresentation of the MBL height and its diurnal variation by EMAC has two consequences. First, according to Eq. (12), the deposition loss kdep for a given deposition velocity Vdep is inversely proportional to the boundary layer height hBL. Overestimations of hBL by EMAC in particular during the day would thus lead to an underestimation of the deposition sink, while it would lead to an overestimation at night. Additionally, diurnal variations in hBL lead to entrainment of free-tropospheric air into the MBL, in particular during the early morning (Fischer et al., 2015, 2019). While vertical profiles of HCHO mixing ratios decrease with height (Anderson et al., 2017; Klippel et al., 2011; Heikes et al., 2001), H2O2 and MHP mixing ratios increase up to a local maximum above the boundary layer (Allen et al., 2022a; Nussbaumer et al., 2021a; Klippel et al., 2011). Therefore, intrusion of air masses from the lower troposphere will most likely result in a decrease in HCHO in the MBL, while peroxide mixing ratios would likely increase as shown in Fischer et al. (2015).
To further evaluate the influence of deposition on H2O2 and HCHO levels, deposition velocities were derived from nighttime observations ( s−1) of their loss rates following the method of Shepson et al. (1992) (Eq. 13). Here we use the exponential decays of the HCHO and H2O2 mixing ratios versus time to deduce nighttime loss rates over the Arabian Sea and the Mediterranean Sea, where the EMAC simulation of hBL was most accurate (Figs. 9, 10). The slope of the linear regression yields the respective deposition rate constant (kdep) at night, assuming negligible nighttime chemistry, i.e., nonsignificant production of H2O2 and HCHO due to ozonolysis and nighttime oxidants (NO3, Cl) and their respective losses. We only used the data of the second leg in the AS (less data coverage on the first leg due to contamination), which represent high-humidity conditions (87.6±3.1 %) and strong headwinds (10.3±2.3 m s−1), while winds over the Mediterranean Sea were slower (6.1±2.2 m s−1, 73.6±7.0 %). In general, deduced loss rates for H2O2 and HCHO show higher variability in the AS than in the MS, with the highest values for both species on 12 August and the lowest values on 9 August in the eastern part of the AS after a partly cloudy day.
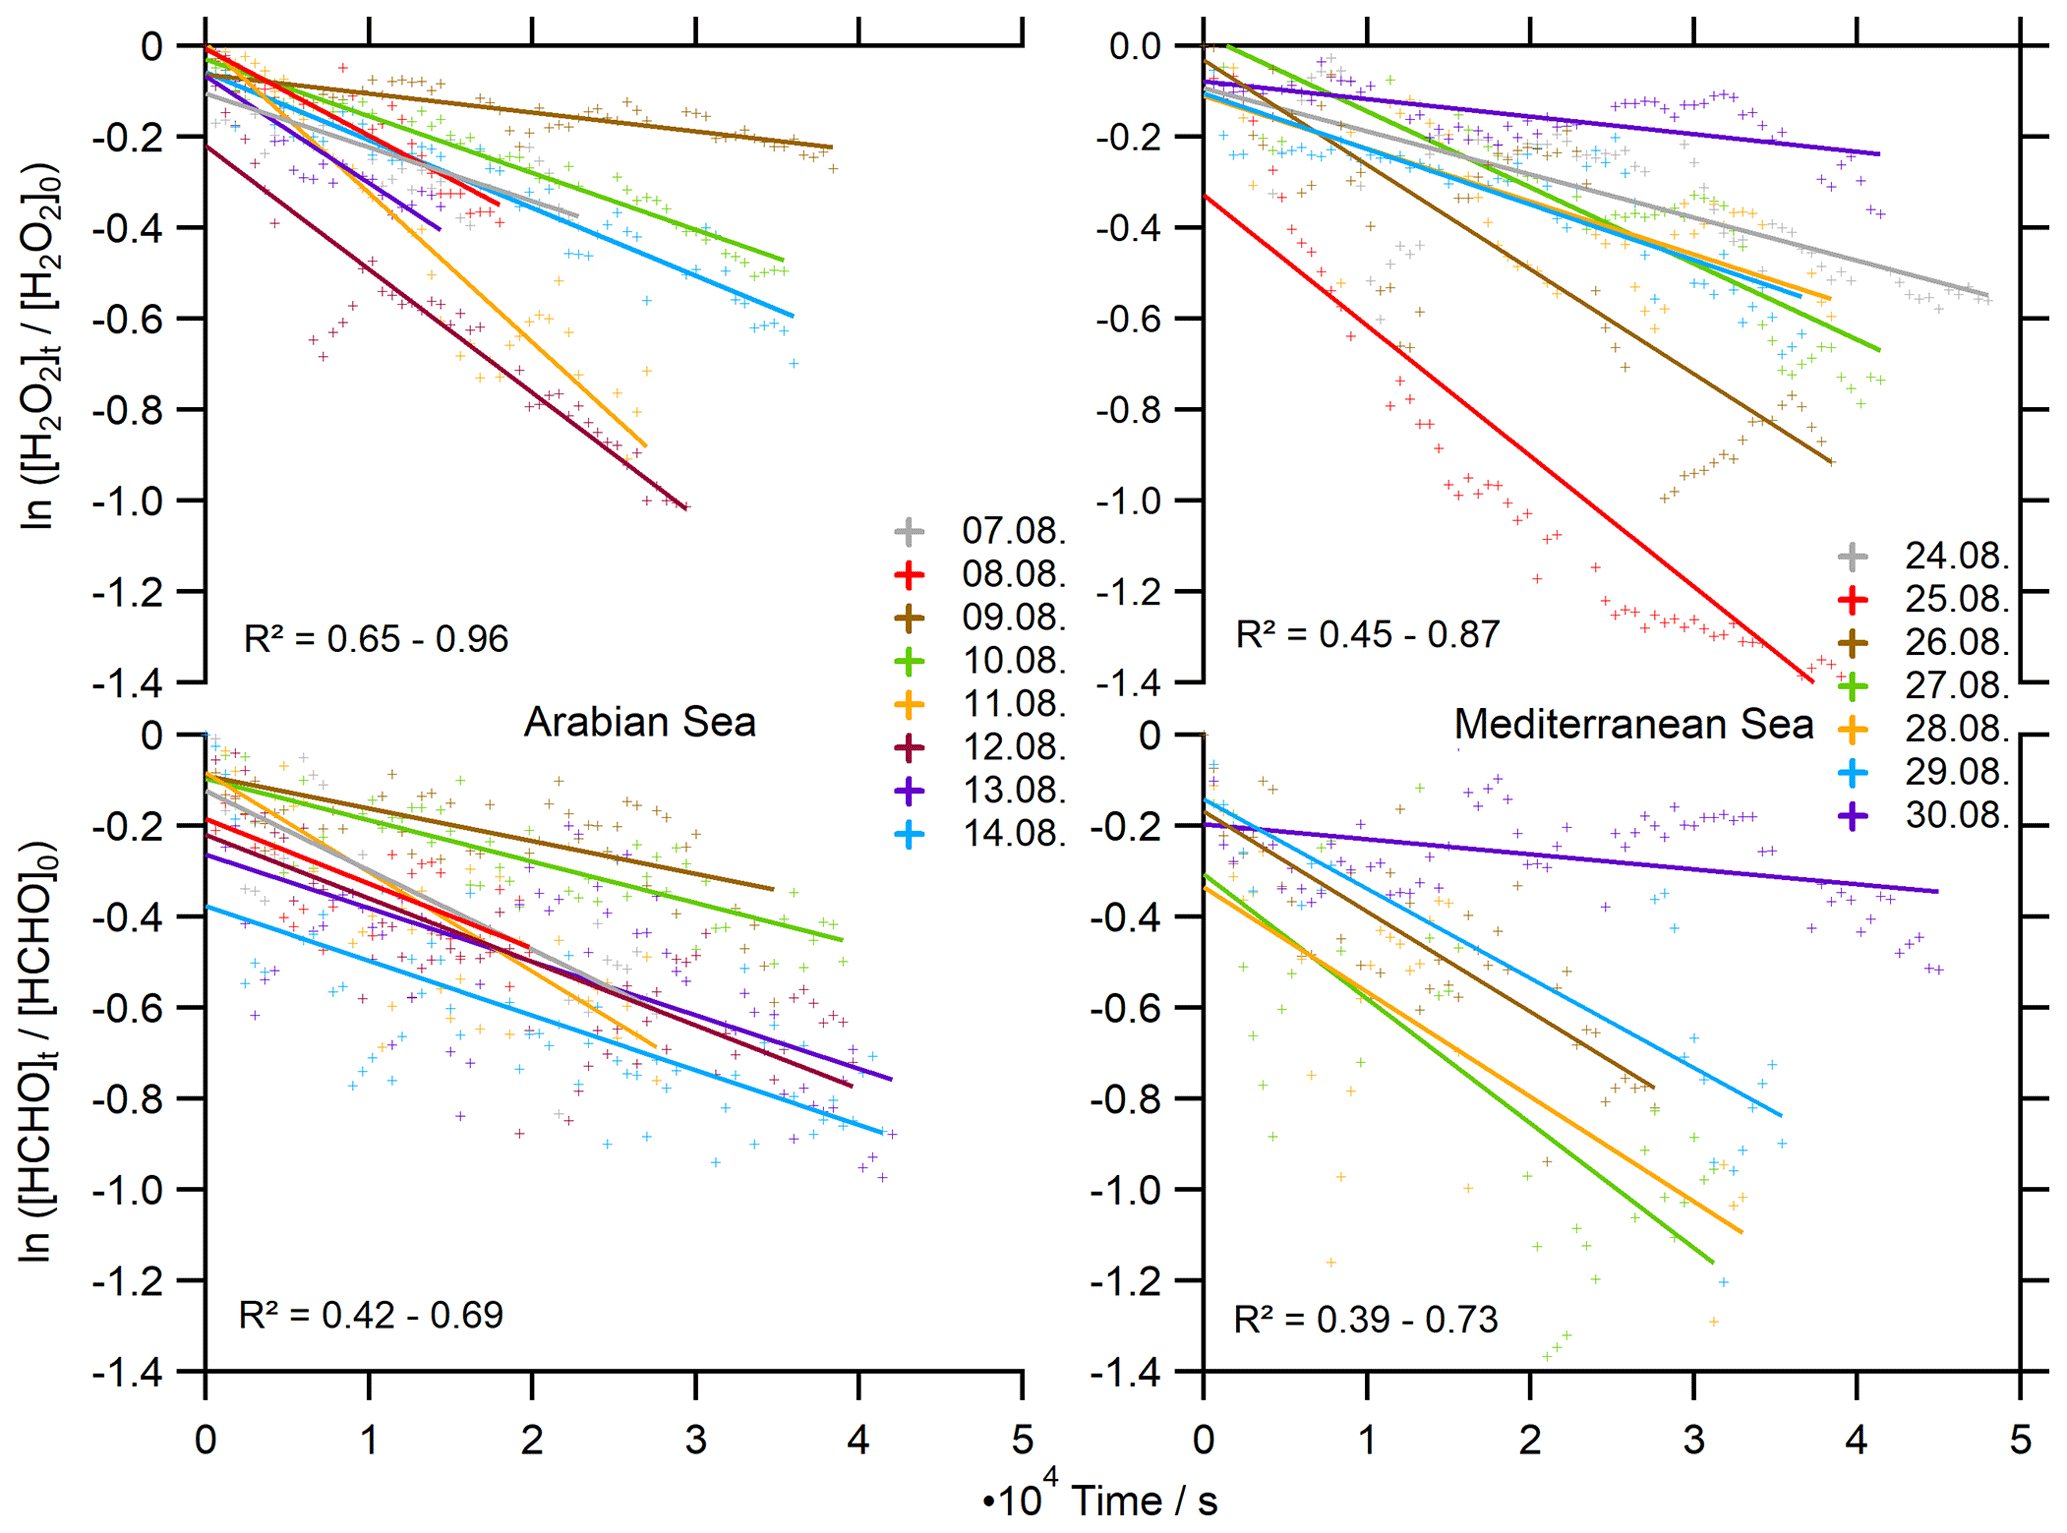
Figure 10Determination of the deposition rates kdep for H2O2 and HCHO in 10 min averages at night ( s−1).
A mean deposition loss kdep(H2O2) of s−1 was determined for the Arabian Sea, similar to the results over the Mediterranean Sea ( s−1). We thereby determined a minimum of s−1 and a maximum deposition loss rate of s−1 for H2O2 with a variability within an order of magnitude. Dry deposition rates of HCHO are comparable to H2O2 with kdep(HCHO) s−1 over the AS and s−1 over the MS. The deposition losses of HCHO cover a similar range of s−1 to s−1. The results for the MS cover a smaller number of nights, as we experienced local increases in HCHO from 24 to 26 August 2017. These enhancements were associated with slightly elevated NO2, indicating local pollution events, and thus we excluded these nights.
Based on the deposition losses we calculated deposition velocities according to Eq. (12) using mean values of hBL from ERA5 data for the corresponding time frame. For the resulting Vdep we assume an uncertainty of at least 40 % (Fig. 11, Table S2). Vdep(HCHO) values cover a range of 0.23–2.22 cm s−1, with the highest values during the night of 27–28 August 2017 in the Mediterranean Sea. Mean values (±1σ) of 0.77±0.29 and 1.49±0.76 were determined for the AS and MS, respectively. The deposition velocities of H2O2 cover a similar range of 0.26–2.34 cm s−1, also with the highest values during the night of 27–28 August 2017. This resulted in mean values of 1.03±0.52 cm s−1 for the AS and 1.21±0.69 cm s−1 for the MS.
Averaged values were compared to the Vdep used by EMAC in Fig. 11. In general, observation-based Vdep and model values for both species are of similar magnitude for the AS (with the exception of the very low values derived during the night of 9–10 August 17), while values of Vdep are underestimated by at least a factor of 2 for the Mediterranean Sea. Additionally, EMAC simulates reduced variability compared to the observations with mean values (±1σ) of 0.78±0.16 cm s−1 for the AS and 0.32±0.16 cm s−1 for the MS, respectively. Deposition velocities of H2O2 show enhanced values compared to HCHO due to the larger Henry's law coefficient of H2O2, which resulted in mean values of 1.05±0.27 cm s−1 for the AS and 0.37±0.21 cm s−1 for the MS.
Striking similarities were found for both species, as the calculated kdep and also the derived Vdep seem to follow the same trend in the Arabian Sea. A linear correlation coefficient of R2=0.77 was found for a linear fit of Vdep(HCHO) against Vdep(H2O2) for the Arabian Sea. The simulated deposition velocity in EMAC depends linearly on the wind speed (Fischer et al., 2015), which explains the higher values derived during the period with strong headwinds over the Arabian Sea. The observations confirm larger deposition velocities of H2O2 for the AS, while we determined enhanced values of Vdep(HCHO) for the MS. Both species show lower deposition velocities close to the coast on 30 July 2017 and in general a higher variability than the simulations by EMAC.
The observed nighttime values of Vdep(H2O2) match previously derived values within the literature: Allen et al. (2022b) found similar values of Vdep(H2O2) in the MBL with a range of 1.00–1.32 cm s−1, which corresponds to a loss of 5 %–10 % HOx in the marine boundary layer. Stickler et al. (2007) determined a mean Vdep(H2O2) of 1.3 cm s−1 in the MBL with a range of 0.1 to 1.8 cm s−1 depending on the entrainment rate. Fischer et al. (2019) calculated nighttime deposition velocities in the continental boundary layer for five different campaigns in Europe and determined values in the range of 0.16 to 0.60 cm s−1 at night and 0.56 to 6.04 cm s−1 during the day. Nguyen et al. (2015) performed flux measurements and derived a diel cycle of Vdep(H2O2) with values ≤1 cm s−1 at night and a maximum of ∼6 cm s−1 at noon. In sum, our observations agree with previous measurements in the continental and marine boundary layer at night.

Figure 11Comparison of the calculated deposition velocity Vdep for HCHO and H2O2 in the Arabian Sea (AS) and the Mediterranean Sea (MS).
Deposition velocities of HCHO are generally expected to be lower than that of H2O2 due to its higher uptake resistance, which is related to, e.g., solubility and hydrolysis of the trace gas (Stickler et al., 2007; Ganzeveld and Lelieveld, 1995). This can be confirmed with our results in the AS, where Vdep(HCHO) is on average a factor of 0.8 smaller than Vdep(H2O2). The results for the MS do not confirm this expectation, as we determined a factor of 1.2 higher deposition velocities of HCHO. To the best of our knowledge, reports of the deposition velocity of HCHO in the MBL are sparse. Nussbaumer et al. (2021b) derived a nighttime Vdep(HCHO) of 0.47 cm s−1 in the continental boundary layer. Sumner et al. (2001) calculated a Vdep(HCHO) of 0.65±0.36 cm s−1 at night at a mixed deciduous–coniferous forest site, while Stickler et al. (2007) suggest a constant value of 0.36 cm s−1 over the ocean based on single-column model results. In comparison to the evaluated Vdep in the continental boundary layer, our measurements indicate more efficient deposition over the open ocean. This may be due to a more efficient near-surface transport, e.g., due to high wind speeds and turbulence, as it is expected that high wind speeds lead to a more efficient deposition. Altogether, EMAC simulates relatively accurate dry deposition velocities of HCHO and H2O2 for the AS with a deviation of less than 5 % for the derived mean values, while Vdep was underestimated by at least a factor of 2 for the MS. Additionally, the observations demonstrate a higher variability than the model. Please note that deposition velocities for the observations were only calculated at night, and thus deposition losses of H2O2 and HCHO during daytime remain uncertain, although previous observations indicate a stronger deposition loss during the day (e.g., Fischer et al., 2019). Please note that our observations might be affected by additional loss processes, e.g., due to interactions with sea spray or in general heterogeneous chemistry.
In situ measurements of HCHO, H2O2, ROOH, OH, HO2 and actinic flux were carried out in the MBL around the Arabian Peninsula during the AQABA campaign in summer 2017 (1 July–1 September 2017). Mixing ratios of HCHO varied greatly within a range of 0.05 to 12.63 ppbv, with the highest mixing ratios over the polluted Arabian Gulf. Elevated ROOH mixing ratios (up to 2.26 ppbv) also reflected the high level of photochemical air pollution in the AG, while mixing ratios in other regions were below 0.30 ppbv. H2O2 was the least abundant HOx reservoir with mixing ratios mostly within the range of 0.10–0.40 ppbv, and no significant enhancements were detected during the pollution event in the center of the AG. The highest daytime median values of HO2 were detected for the area around the Suez Canal (15.90 pptv), while significantly lower values were found for the AG (4.65 pptv). In the AG, we also encountered the lowest daytime median values of OH (0.04 pptv), while we determined a daytime median of 0.09 pptv for the whole dataset. In general, the elevated values of HCHO and ROOH in the Arabian Gulf are consistent with the increased mixing ratios of O3 (Tadic et al., 2020), VOCs (Bourtsoukidis et al., 2019) and OVOCs (Wang et al., 2020) and the high levels of OH reactivity during AQABA, where Pfannerstill et al. (2019) derived the highest median loss rate of OH with 18.8 s−1. The lowest mixing ratios of HCHO, H2O2 and ROOH were found for air masses in the Arabian Sea and the southern Red Sea during the second leg of the campaign, where the lowest concentrations of NOx and O3 were present (Tadic et al., 2020), although we rarely encountered really clean MBL conditions during AQABA (Celik et al., 2020).
The comparison of measurements with results from the general circulation model EMAC indicates that the model simulates HCHO mixing ratios on average within a factor of 2, while it clearly overestimates H2O2 and to a lesser extent ROOH. This effect can to a large degree be explained by the overestimated mixing ratios of HOx. Production and loss of HCHO scale linearly with OH, while the photochemical production of H2O2 depends quadratically on HO2 and only linearly on OH. The calculation of net photochemical production of H2O2 (P(H2O2)–L(H2O2)) revealed an overestimation by the model, with the largest deviations over the Arabian Sea, the Gulf of Oman and the Arabian Gulf. These regions were characterized by reduced mixing ratios of HO2, which are not reproduced by EMAC. Even though net photochemical production matched over the MS, simulated H2O2 was overestimated, which may be related to transport or underestimated deposition during the day.
Loss of HCHO and H2O2 due to dry deposition, their predominant loss process at night, was studied for the regions far away from the coastline so that the diurnal variation in the boundary layer height in EMAC interfered less with the derived results. The analysis revealed mean values (±1σ) of Vdep(HCHO) with 0.77±0.29 cm s−1 for the Arabian Sea and 1.49±0.76 cm s−1 for the Mediterranean Sea. Enhanced values of Vdep(H2O2) compared to Vdep(HCHO) were determined for the AS (1.03±0.52 cm s−1), while the deposition of H2O2 to the MS was on average slower than that of HCHO with 1.21±0.69 cm s−1. EMAC generally simulates accurate deposition velocities of HCHO and H2O2 over the Arabian Sea, while the deposition of both species was underestimated by at least a factor of 2 over the Mediterranean Sea. Further, the simulated Vdep shows less variability compared to the observations. Losses due to deposition could not be compared during the day and remain uncertain.
The analysis of the deposition velocity revealed underestimated losses due to dry deposition in the MBL, which leads to overestimated HOx precursors in EMAC. An updated scheme for the simulation of dry deposition of land–atmosphere exchange in EMAC was developed by Emmerichs et al. (2021). They include, e.g., improved stomatal uptake and dry deposition dependent on soil moisture, which decreased HCHO mixing ratios during boreal summer by up to 25 % at the ground level. We emphasize that the ocean surface might be an additional surface where dry deposition of trace gases might need to be adjusted. This effect may be most important during the day and on a local scale but certainly could have an effect on the HOx budget in EMAC. Additionally, EMAC is limited by its coarse spatial resolution (∼110 km), which leads to spurious diurnal variation in the boundary layer height when cruising close to the coast.
The overestimated HOx in EMAC most likely results from the overall enhanced VOC oxidation and regionally overestimated O3. Moreover, the model was shown to be unable to reproduce the local phenomena encountered, e.g., the air pollution event in the AG. This leads to the assumption that the model may reproduce HCHO within a factor of 2 but possibly due to the wrong reasons, i.e., overestimated HOx which compensates for missing sources in the model. This assumption is supported by the observations of several other OVOCs which were not matched by EMAC (Wang et al., 2020).
The systematic overestimation of H2O2 is at least partly explained by the overrated HO2, although net photochemical production of H2O2 revealed that the model matches the observations in some regions well, as the overall overestimated OH compensates partially for too high values of HO2. The decreased concentrations of HO2 observed over the GA, AS, GO and AG are not matched by EMAC. The reduced HOx encountered in air masses over the Arabian Gulf can most likely be attributed to elevated mixing ratios of RO2, which are reflected in the enhanced ROOH and the estimates of RO2 + HO2 by Tadic et al. (2020). Despite matching results for the net photochemical production in some regions, the observations of H2O2 reflect less diurnal variation and overall lower mixing ratios than simulated by EMAC. This implies that further loss processes, e.g., the deposition during daytime, and in general heterogeneous chemistry remain a major uncertainty in the photochemical budget of H2O2 in the MBL. We therefore emphasize the importance of H2O2 and organic peroxide in situ measurements, which were valuable to evaluate simulated deposition velocities and the accuracy of HOx simulations.
All AQABA datasets used in this study are permanently stored in an archive on the Keeper service of the Max Planck Digital Library (https://keeper.mpdl.mpg.de/library/708bfb36-1cf8-4d6a-b5f8-acec03ed5e5e/2017_AQABA/; Lelieveld et al., 2022) and are available to all scientists, who agree to the AQABA data protocol.
The supplement related to this article is available online at: https://doi.org/10.5194/acp-23-119-2023-supplement.
DD, BB, HF and JL designed and supervised the study and the AQABA campaign. DD performed the HCHO and hydroperoxide measurements during the second leg of the campaign and evaluated the HCHO dataset. BB performed the HCHO and hydroperoxide measurements during the first leg and provided the hydroperoxide dataset. HH, MM, ST and RR performed the LIF OH and HO2 measurements during AQABA. JS and JNC performed the actinic flux measurements and calculated photolysis rates. PGE and JNC carried out the O3 measurements during the cruise. AP performed the EMAC model runs. DW calculated the HYSPLIT trajectories.
The contact author has declared that none of the authors has any competing interests.
Publisher's note: Copernicus Publications remains neutral with regard to jurisdictional claims in published maps and institutional affiliations.
We graciously acknowledge cooperation with the Cyprus Institute (CyI), the King Abdullah University of Science and Technology (KAUST) and the Kuwait Institute for Scientific Research (KISR). We thank Hays Ships Ltd, Captain Pavel Kirzner and the crew of Kommandor Iona for the great support during all weather or wavy conditions and for an unforgettable time on board. We would like to especially thank Marcel Dorf and Claus Koeppel for the organization of the campaign and Hartwig Harder for the management on board. Last but not least we are grateful to the whole AQABA community and for a successful campaign.
The article processing charges for this open-access publication were covered by the Max Planck Society.
This paper was edited by Tanja Schuck and reviewed by two anonymous referees.
Allen, H. M., Crounse, J. D., Kim, M. J., Teng, A. P., Ray, E. A., McKain, K., Sweeney, C., and Wennberg P. O.: H2O2 and CH3OOH (MHP) in the remote atmosphere: 1. Global distribution and regional influences, J. Geophys. Res.-Atmos., 127, e2021JD035701, https://doi.org/10.1029/2021JD035701, 2022a.
Allen, H. M., Bates, K. H., Crounse, J. D., Kim, M. J., Teng, A. P., Ray, E. A., and Wennberg, P. O.: H2O2 and CH3OOH (MHP) in the remote atmosphere: 2. Physical and chemical controls, J. Geophys. Res.-Atmos., 127, e2021JD035702, https://doi.org/10.1029/2021JD035702, 2022b.
Altshuller, A. P., Miller, D. L., and Sleva, S. F.: Determination of Formaldehyde in Gas Mixtures by the Chromotropic Acid Method, Anal. Chem., 33, 621–625, https://doi.org/10.1021/ac60172a043, 1961.
Anderson, D. C., Nicely, J. M., Wolfe, G. M., Hanisco, T. F., Salawitch, R. J., Canty, T. P., Dickerson, R. R., Apel, E. C., Baidar, S., Bannan, T. J., Blake, N. J., Chen, D., Dix, B., Fernandez, R. P., Hall, S. R., Hornbrook R. S., Huey, L. G., Josse, B., Jöckel, P., Kinnision, D. E., Koenig, T. K., Le Breton, M., Marécal, V., Morgenstern, O., Oman, L. D., Pan, L. L., Percival, C., Plummer, D., Revell, L. E., Rozanow, E., Saiz-Lopez, A., Stenke, A., Sudo, K., Tilmes S., Ullmann, K., Volkamer, R., Weinheimer, A. J., and Zeng, G.: Formaldehyde in the tropical western Pacific: Chemical sources and sinks, convective transport, and representation in CAM-Chem and the CCMI models, J. Geophys. Res.-Atmos., 122, 11201–11226, https://doi.org/10.1002/2016JD026121, 2017.
Berasategui, M., Amedro, D., Vereecken, L., Lelieveld, J., and Crowley, J. N.: Reaction between CH3C(O)OOH (peracetic acid) and OH in the gas phase: a combined experimental and theoretical study of the kinetics and mechanism, Atmos. Chem. Phys., 20, 13541–13555, https://doi.org/10.5194/acp-20-13541-2020, 2020.
Berrisford, P., Dee, D., Poli, P., Brugge, R., Fielding, M., Fuentes, M., Kållberg, P., Kobayashi, S., Uppala, S., and Simmons, A.: The ERA-Interim archive version 2.0, p. 23, https://www.ecmwf.int/node/8174 (last access: 2 March 2022), 2011.
Bohn, B. and Lohse, I.: Calibration and evaluation of CCD spectroradiometers for ground-based and airborne measurements of spectral actinic flux densities, Atmos. Meas. Tech., 10, 3151–3174, https://doi.org/10.5194/amt-10-3151-2017, 2017.
Bourtsoukidis, E., Ernle, L., Crowley, J. N., Lelieveld, J., Paris, J.-D., Pozzer, A., Walter, D., and Williams, J.: Non-methane hydrocarbon (C2–C8) sources and sinks around the Arabian Peninsula, Atmos. Chem. Phys., 19, 7209–7232, https://doi.org/10.5194/acp-19-7209-2019, 2019.
Bozem, H., Pozzer, A., Harder, H., Martinez, M., Williams, J., Lelieveld, J., and Fischer, H.: The influence of deep convection on HCHO and H2O2 in the upper troposphere over Europe, Atmos. Chem. Phys., 17, 11835–11848, https://doi.org/10.5194/acp-17-11835-2017, 2017.
Celik, S., Drewnick, F., Fachinger, F., Brooks, J., Darbyshire, E., Coe, H., Paris, J.-D., Eger, P. G., Schuladen, J., Tadic, I., Friedrich, N., Dienhart, D., Hottmann, B., Fischer, H., Crowley, J. N., Harder, H., and Borrmann, S.: Influence of vessel characteristics and atmospheric processes on the gas and particle phase of ship emission plumes: in situ measurements in the Mediterranean Sea and around the Arabian Peninsula, Atmos. Chem. Phys., 20, 4713–4734, https://doi.org/10.5194/acp-20-4713-2020, 2020.
Chang, W., Lee, M., and Heikes, B. G.: One-dimensional photochemical study of H2O2, CH3OOH, and HCHO in the marine boundary layer during Pacific Exploratory Mission in the Tropics (PEM-Tropics) B, J. Geophys. Res., 109, D06307, https://doi.org/10.1029/2003JD004256, 2004.
Coggon, M. M., Lim, C. Y., Koss, A. R., Sekimoto, K., Yuan, B., Gilman, J. B., Hagan, D. H., Selimovic, V., Zarzana, K. J., Brown, S. S., Roberts, J. M., Müller, M., Yokelson, R., Wisthaler, A., Krechmer, J. E., Jimenez, J. L., Cappa, C., Kroll, J. H., de Gouw, J., and Warneke, C.: OH chemistry of non-methane organic gases (NMOGs) emitted from laboratory and ambient biomass burning smoke: evaluating the influence of furans and oxygenated aromatics on ozone and secondary NMOG formation, Atmos. Chem. Phys., 19, 14875–14899, https://doi.org/10.5194/acp-19-14875-2019, 2019.
Crowley, J. N., Pouvesle, N., Phillips, G. J., Axinte, R., Fischer, H., Petäjä, T., Nölscher, A., Williams, J., Hens, K., Harder, H., Martinez-Harder, M., Novelli, A., Kubistin, D., Bohn, B., and Lelieveld, J.: Insights into HOx and ROx chemistry in the boreal forest via measurement of peroxyacetic acid, peroxyacetic nitric anhydride (PAN) and hydrogen peroxide, Atmos. Chem. Phys., 18, 13457–13479, https://doi.org/10.5194/acp-18-13457-2018, 2018.
Dasgupta, P. K., Dong, S., Hwang, H., Yang, H.-C., and Genfa, Z.: Continuous liquid-phase fluorometry coupled to a diffusion scrubber for the real-time determination of atmospheric formaldehyde, hydrogen peroxide and sulfur dioxide, Atmos. Environ., 22, 949–963, https://doi.org/10.1016/0004-6981(88)90273-9, 1988.
De Smedt, I., Van Roozendael, M., Stavrakou, T., Müller, J.-F., Lerot, C., Theys, N., Valks, P., Hao, N., and van der A, R.: Improved retrieval of global tropospheric formaldehyde columns from GOME-2/MetOp-A addressing noise reduction and instrumental degradation issues, Atmos. Meas. Tech., 5, 2933–2949, https://doi.org/10.5194/amt-5-2933-2012, 2012.
De Smedt, I., Stavrakou, T., Hendrick, F., Danckaert, T., Vlemmix, T., Pinardi, G., Theys, N., Lerot, C., Gielen, C., Vigouroux, C., Hermans, C., Fayt, C., Veefkind, P., Müller, J.-F., and Van Roozendael, M.: Diurnal, seasonal and long-term variations of global formaldehyde columns inferred from combined OMI and GOME-2 observations, Atmos. Chem. Phys., 15, 12519–12545, https://doi.org/10.5194/acp-15-12519-2015, 2015.
De Smedt, I., Theys, N., Yu, H., Danckaert, T., Lerot, C., Compernolle, S., Van Roozendael, M., Richter, A., Hilboll, A., Peters, E., Pedergnana, M., Loyola, D., Beirle, S., Wagner, T., Eskes, H., van Geffen, J., Boersma, K. F., and Veefkind, P.: Algorithm theoretical baseline for formaldehyde retrievals from S5P TROPOMI and from the QA4ECV project, Atmos. Meas. Tech., 11, 2395–2426, https://doi.org/10.5194/amt-11-2395-2018, 2018.
Dienhart, D., Crowley, J. N., Bourtsoukidis, E., Edtbauer, A., Eger, P. G., Ernle, L., Harder, H., Hottmann, B., Martinez, M., Parchatka, U., Paris, J.-D., Pfannerstill, E. Y., Rohloff, R., Schuladen, J., Stönner, C., Tadic, I., Tauer, S., Wang, N., Williams, J., Lelieveld, J., and Fischer, H.: Measurement report: Observation-based formaldehyde production rates and their relation to OH reactivity around the Arabian Peninsula, Atmos. Chem. Phys., 21, 17373–17388, https://doi.org/10.5194/acp-21-17373-2021, 2021.
Dovrou, E., Rivera-Rios, J. C., Bates, K. H., and Keutsch, F. N.: Sulfate Formation via Cloud Processing from Isoprene Hydroxyl Hydroperoxides (ISOPOOH), Environ. Sci. Technol., 53, 12476–12484, https://doi.org/10.1021/acs.est.9b04645, 2019.
Dovrou, E., Bates, K. H., Rivera-Rios, J. C., Cox, J. L., Shutter, J. D., and Keutsch, F. N.: Towards a chemical mechanism of the oxidation of aqueous sulfur dioxide via isoprene hydroxyl hydroperoxides (ISOPOOH), Atmos. Chem. Phys., 21, 8999–9008, https://doi.org/10.5194/acp-21-8999-2021, 2021.
Draxler, R. R. and Hess G. D.: An overview of the HYSPLIT4 modelling system for trajectories, dispersion and deposition, Aust. Meteorol. Mag., 47, 295–308, 1998.
Eger, P. G., Friedrich, N., Schuladen, J., Shenolikar, J., Fischer, H., Tadic, I., Harder, H., Martinez, M., Rohloff, R., Tauer, S., Drewnick, F., Fachinger, F., Brooks, J., Darbyshire, E., Sciare, J., Pikridas, M., Lelieveld, J., and Crowley, J. N.: Shipborne measurements of ClNO2 in the Mediterranean Sea and around the Arabian Peninsula during summer, Atmos. Chem. Phys., 19, 12121–12140, https://doi.org/10.5194/acp-19-12121-2019, 2019.
Emmerichs, T., Kerkweg, A., Ouwersloot, H., Fares, S., Mammarella, I., and Taraborrelli, D.: A revised dry deposition scheme for land–atmosphere exchange of trace gases in ECHAM/MESSy v2.54, Geosci. Model Dev., 14, 495–519, https://doi.org/10.5194/gmd-14-495-2021, 2021.
Fischer, H., Pozzer, A., Schmitt, T., Jöckel, P., Klippel, T., Taraborrelli, D., and Lelieveld, J.: Hydrogen peroxide in the marine boundary layer over the South Atlantic during the OOMPH cruise in March 2007, Atmos. Chem. Phys., 15, 6971–6980, https://doi.org/10.5194/acp-15-6971-2015, 2015.
Fischer, H., Axinte, R., Bozem, H., Crowley, J. N., Ernest, C., Gilge, S., Hafermann, S., Harder, H., Hens, K., Janssen, R. H. H., Königstedt, R., Kubistin, D., Mallik, C., Martinez, M., Novelli, A., Parchatka, U., Plass-Dülmer, C., Pozzer, A., Regelin, E., Reiffs, A., Schmidt, T., Schuladen, J., and Lelieveld, J.: Diurnal variability, photochemical production and loss processes of hydrogen peroxide in the boundary layer over Europe, Atmos. Chem. Phys., 19, 11953–11968, https://doi.org/10.5194/acp-19-11953-2019, 2019.
Friedrich, N., Eger, P., Shenolikar, J., Sobanski, N., Schuladen, J., Dienhart, D., Hottmann, B., Tadic, I., Fischer, H., Martinez, M., Rohloff, R., Tauer, S., Harder, H., Pfannerstill, E. Y., Wang, N., Williams, J., Brooks, J., Drewnick, F., Su, H., Li, G., Cheng, Y., Lelieveld, J., and Crowley, J. N.: Reactive nitrogen around the Arabian Peninsula and in the Mediterranean Sea during the 2017 AQABA ship campaign, Atmos. Chem. Phys., 21, 7473–7498, https://doi.org/10.5194/acp-21-7473-2021, 2021.
Ganzeveld, L. and Lelieveld, J.: Dry deposition parameterization in a chemistry general circulation model and its influence on the distribution of reactive trace gases, J. Geophys. Res., 100, 20999–21012, https://doi.org/10.1029/95JD02266, 1995.
Heikes, B., Snow, J., Egli, P., O'Sullivan, D., Crawford, J., and Olson, J.: Formaldehyde over the central Pacific during PEM-Tropics B, J. Geophys. Res., 106, 32717–32731, https://doi.org/10.1029/2001JD900012, 2001.
Heikes, B. G., Lee, M., Bradshaw, J., Sandholm, S., Davis, D. D., Crawford, J., Rodriguez, J., Liu, S., McKeen, S., Thornton, D., Bandy, A., Gregory, G., Talbot, R., and Blake, D.: Hydrogen peroxide and methylhydrogenperoxide distributions related to ozone and odd hydrogen over the North Pacific in the fall of 1991, J. Geophys. Res., 101, 1891–1905, https://doi.org/10.1029/95JD01364, 1996.
Hens, K., Novelli, A., Martinez, M., Auld, J., Axinte, R., Bohn, B., Fischer, H., Keronen, P., Kubistin, D., Nölscher, A. C., Oswald, R., Paasonen, P., Petäjä, T., Regelin, E., Sander, R., Sinha, V., Sipilä, M., Taraborrelli, D., Tatum Ernest, C., Williams, J., Lelieveld, J., and Harder, H.: Observation and modelling of HOx radicals in a boreal forest, Atmos. Chem. Phys., 14, 8723–8747, https://doi.org/10.5194/acp-14-8723-2014, 2014.
Hottmann, B., Hafermann, S., Tomsche, L., Marno, D., Martinez, M., Harder, H., Pozzer, A., Neumaier, M., Zahn, A., Bohn, B., Stratmann, G., Ziereis, H., Lelieveld, J., and Fischer, H.: Impact of the South Asian monsoon outflow on atmospheric hydroperoxides in the upper troposphere, Atmos. Chem. Phys., 20, 12655–12673, https://doi.org/10.5194/acp-20-12655-2020, 2020.
Jeuken, A., Siegmund, P., Heijboer, L., Feichter, J., and Bengtsson, L.: On the potential assimilating meteorological analyses in a global model for the purpose of model validation, J. Geophys. Res.-Atmos., 101, 16939–16950, 1996.
Jöckel, P., Tost, H., Pozzer, A., Brühl, C., Buchholz, J., Ganzeveld, L., Hoor, P., Kerkweg, A., Lawrence, M. G., Sander, R., Steil, B., Stiller, G., Tanarhte, M., Taraborrelli, D., van Aardenne, J., and Lelieveld, J.: The atmospheric chemistry general circulation model ECHAM5/MESSy1: consistent simulation of ozone from the surface to the mesosphere, Atmos. Chem. Phys., 6, 5067–5104, https://doi.org/10.5194/acp-6-5067-2006, 2006.
Jöckel, P., Kerkweg, A., Pozzer, A., Sander, R., Tost, H., Riede, H., Baumgaertner, A., Gromov, S., and Kern, B.: Development cycle 2 of the Modular Earth Submodel System (MESSy2), Geosci. Model Dev., 3, 717–752, https://doi.org/10.5194/gmd-3-717-2010, 2010.
Junkerman, W. and Stockwell, W.: On the budget of photooxidants in the marine boundary layer of the tropical South Atlantic, J. Geophys. Res., 104, 8039–8046, https://doi.org/10.1029/1998JD100060, 1999.
Kelly, T. J. and Fortune, C. R.: Continuous Monitoring of Gaseous Formaldehyde Using an Improved Fluorescence Approach, Int. J. Environ. An. Ch., 54, 249–263, https://doi.org/10.1080/03067319408034093, 1994.
Kieber, R. J., Cooper, W. J., Willey, J. D., and Avery Jr., G. B.: Hydrogen peroxide at the Bermuda Atlantic Time Series Station. Part 1: Temporal variability of atmospheric hydrogen peroxide and its influence on seawater concentrations, J. Atmos. Chem., 39, 1–13, 2001.
Klippel, T., Fischer, H., Bozem, H., Lawrence, M. G., Butler, T., Jöckel, P., Tost, H., Martinez, M., Harder, H., Regelin, E., Sander, R., Schiller, C. L., Stickler, A., and Lelieveld, J.: Distribution of hydrogen peroxide and formaldehyde over Central Europe during the HOOVER project, Atmos. Chem. Phys., 11, 4391–4410, https://doi.org/10.5194/acp-11-4391-2011, 2011.
Kluge, F., Hüneke, T., Knecht, M., Lichtenstern, M., Rotermund, M., Schlager, H., Schreiner, B., and Pfeilsticker, K.: Profiling of formaldehyde, glyoxal, methylglyoxal, and CO over the Amazon: normalized excess mixing ratios and related emission factors in biomass burning plumes, Atmos. Chem. Phys., 20, 12363–12389, https://doi.org/10.5194/acp-20-12363-2020, 2020.
Lazrus, A. L., Kok, G, L., Gitlin, S. N., Lind, J. A., and McLaren, S. E.: Automated fluorimetric method for hydrogen peroxide in atmospheric precipitation, Anal. Chem., 57, 917–922, https://doi.org/10.1021/ac00281a031, 1985.
Lee, M., Heikes, B. G., Jacob, D. J., Sachse, G., and Anderson, B.: Hydrogen peroxide, organic hydroperoxide, and formaldehyde as primary pollutants from biomass burning, J. Geophys. Res., 102, 1301–1309, https://doi.org/10.1029/96JD01709, 1997.
Lee, M., Heikes, B. G., and O'Sullivan, D. W.: Hydrogen peroxide and organic hydroperoxide in the troposphere: A review, Atmos. Environ., 34, 3475–3494, https://doi.org/10.1016/S1352-2310(99)00432-X, 2000.
Lelieveld, J., Hoor, P., Jöckel, P., Pozzer, A., Hadjinicolaou, P., Cammas, J.-P., and Beirle, S.: Severe ozone air pollution in the Persian Gulf region, Atmos. Chem. Phys., 9, 1393–1406, https://doi.org/10.5194/acp-9-1393-2009, 2009.
Lelieveld, J., Gromov, S., Pozzer, A., and Taraborrelli, D.: Global tropospheric hydroxyl distribution, budget and reactivity, Atmos. Chem. Phys., 16, 12477–12493, https://doi.org/10.5194/acp-16-12477-2016, 2016.
Lelieveld, J., Klingmüller, K., Pozzer, A., Burnett, R. T., Haines, A., and Ramanathan, V.: Effects of fossil fuel and total anthropogenic emission removal on public health and climate, P. Natl. Acad. Sci. USA, 116, 7192–7197, https://doi.org/10.1073/pnas.1819989116, 2019.
Lelieveld, J., Fischer, H., Harder, H., Dienhart, D., Brendel, B., Martinez, M., Tauer, S., and Rohloff, R.: HCHO dataset, https://keeper.mpdl.mpg.de/library/708bfb36-1cf8-4d6a-b5f8-acec03ed5e5e/2017_AQABA/; last access: 28 April 2022.
Luecken, D. J., Napelenok, S. L., Strum, M., Scheffe, R., and Phillips, S.: Sensitivity of ambient atmospheric formaldehyde and ozone to precursor species and source types across the United States, Environ. Sci. Technol., 52, 4668–4675, https://doi.org/10.1021/acs.est.7b05509, 2018.
Marbach, T., Beirle, S., Platt, U., Hoor, P., Wittrock, F., Richter, A., Vrekoussis, M., Grzegorski, M., Burrows, J. P., and Wagner, T.: Satellite measurements of formaldehyde linked to shipping emissions, Atmos. Chem. Phys., 9, 8223–8234, https://doi.org/10.5194/acp-9-8223-2009, 2009.
Marno, D., Ernest, C., Hens, K., Javed, U., Klimach, T., Martinez, M., Rudolf, M., Lelieveld, J., and Harder, H.: Calibration of an airborne HOx instrument using the All Pressure Altitude-based Calibrator for HOx Experimentation (APACHE), Atmos. Meas. Tech., 13, 2711–2731, https://doi.org/10.5194/amt-13-2711-2020, 2020.
Nguyen, T. B., Crounse, J. D., Teng, A. P., St Clair, J. M., Paulot, F., Wolfe, G. M., and Wennberg, P. O.: Rapid deposition of oxidized biogenic compounds to a temperate forest, P. Natl. Acad. Sci. USA, 112, E392–401, https://doi.org/10.1073/pnas.1418702112, 2015.
Nussbaumer, C. M., Tadic, I., Dienhart, D., Wang, N., Edtbauer, A., Ernle, L., Williams, J., Obersteiner, F., Gutiérrez-Álvarez, I., Harder, H., Lelieveld, J., and Fischer, H.: Measurement report: In situ observations of deep convection without lightning during the tropical cyclone Florence 2018, Atmos. Chem. Phys., 21, 7933–7945, https://doi.org/10.5194/acp-21-7933-2021, 2021a.
Nussbaumer, C. M., Crowley, J. N., Schuladen, J., Williams, J., Hafermann, S., Reiffs, A., Axinte, R., Harder, H., Ernest, C., Novelli, A., Sala, K., Martinez, M., Mallik, C., Tomsche, L., Plass-Dülmer, C., Bohn, B., Lelieveld, J., and Fischer, H.: Measurement report: Photochemical production and loss rates of formaldehyde and ozone across Europe, Atmos. Chem. Phys., 21, 18413–18432, https://doi.org/10.5194/acp-21-18413-2021, 2021b.
Nussbaumer, C. M., Pozzer, A., Tadic, I., Röder, L., Obersteiner, F., Harder, H., Lelieveld, J., and Fischer, H.: Tropospheric ozone production and chemical regime analysis during the COVID-19 lockdown over Europe, Atmos. Chem. Phys., 22, 6151–6165, https://doi.org/10.5194/acp-22-6151-2022, 2022.
O'Sullivan, D. W., Lee, M., Noone, B. C., and Heikes, B. G.: Henry's Law Constant Determinations for Hydrogen Peroxide, Methyl Hydroperoxide, Hydroxymethyl Hydroperoxide, Ethyl Hydroperoxide, and Peroxyacetic Acid, J. Phys. Chem., 100, 3241–3247, https://doi.org/10.1021/jp951168n, 1996.
O'Sullivan, D. W., Heikes, B. G., Lee, M., Chang, W., Gregory, G. L., Blake, D. R., and Sachse, G. W.: Distribution of hydrogen peroxide and methylhydroperoxide over the Pacific and South Atlantic Oceans, J. Geophys. Res., 104, 5635–5646, https://doi.org/10.1029/98JD01250, 1999.
O'Sullivan, D. W., Heikes, B. G., Snow, J., Burrow, P., Avery, M., Blake, D. R., Sachse, G. W., Talbot, R. W., Thornton, D. C., and Bandy, A. R.: Long-term and seasonal variations in the levels of hydrogen peroxide, methylhydroperoxide, and selected compounds over the Pacific Ocean, J. Geophys. Res., 109, D15S13, https://doi.org/10.1029/2003JD003689, 2004.
Paris, J.-D., Riandet, A., Bourtsoukidis, E., Delmotte, M., Berchet, A., Williams, J., Ernle, L., Tadic, I., Harder, H., and Lelieveld, J.: Shipborne measurements of methane and carbon dioxide in the Middle East and Mediterranean areas and the contribution from oil and gas emissions, Atmos. Chem. Phys., 21, 12443–12462, https://doi.org/10.5194/acp-21-12443-2021, 2021.
Parrish, D. D., Ryerson, T. B., Mellqvist, J., Johansson, J., Fried, A., Richter, D., Walega, J. G., Washenfelder, R. A., de Gouw, J. A., Peischl, J., Aikin, K. C., McKeen, S. A., Frost, G. J., Fehsenfeld, F. C., and Herndon, S. C.: Primary and secondary sources of formaldehyde in urban atmospheres: Houston Texas region, Atmos. Chem. Phys., 12, 3273–3288, https://doi.org/10.5194/acp-12-3273-2012, 2012.
Pfannerstill, E. Y., Wang, N., Edtbauer, A., Bourtsoukidis, E., Crowley, J. N., Dienhart, D., Eger, P. G., Ernle, L., Fischer, H., Hottmann, B., Paris, J.-D., Stönner, C., Tadic, I., Walter, D., Lelieveld, J., and Williams, J.: Shipborne measurements of total OH reactivity around the Arabian Peninsula and its role in ozone chemistry, Atmos. Chem. Phys., 19, 11501–11523, https://doi.org/10.5194/acp-19-11501-2019, 2019.
Phillips, G. J., Pouvesle, N., Thieser, J., Schuster, G., Axinte, R., Fischer, H., Williams, J., Lelieveld, J., and Crowley, J. N.: Peroxyacetyl nitrate (PAN) and peroxyacetic acid (PAA) measurements by iodide chemical ionisation mass spectrometry: first analysis of results in the boreal forest and implications for the measurement of PAN fluxes, Atmos. Chem. Phys., 13, 1129–1139, https://doi.org/10.5194/acp-13-1129-2013, 2013.
Pilz, W. and Johann, I.: Die Bestimmung Kleinster Mengen von Wasserstoffperoxyd in Luft, Int. J. Environ. An. Ch., 3, 257–270, https://doi.org/10.1080/03067317408071087, 1974.
Pozzer, A., Reifenberg, S. F., Kumar, V., Franco, B., Kohl, M., Taraborrelli, D., Gromov, S., Ehrhart, S., Jöckel, P., Sander, R., Fall, V., Rosanka, S., Karydis, V., Akritidis, D., Emmerichs, T., Crippa, M., Guizzardi, D., Kaiser, J. W., Clarisse, L., Kiendler-Scharr, A., Tost, H., and Tsimpidi, A.: Simulation of organics in the atmosphere: evaluation of EMACv2.54 with the Mainz Organic Mechanism (MOM) coupled to the ORACLE (v1.0) submodel, Geosci. Model Dev., 15, 2673–2710, https://doi.org/10.5194/gmd-15-2673-2022, 2022.
Reeves, C. E. and Penkett, S. A.: Measurements of peroxides and what they tell us, Chem. Rev., 103, 5199–5218, https://doi.org/10.1021/cr0205053, 2003.
Roeckner, E., Brokopf, R., Esch, M., Giorgetta, M., Hagemann, S., and Kornblueh, L.: Sensitivity of Simulated Climate to Horizontal and Vertical Resolution in the ECHAM5 Atmosphere Model, J. Climate, 19, 3771–3791, https://doi.org/10.1175/JCLI3824.1, 2006.
Sander, R., Baumgaertner, A., Cabrera-Perez, D., Frank, F., Gromov, S., Grooß, J.-U., Harder, H., Huijnen, V., Jöckel, P., Karydis, V. A., Niemeyer, K. E., Pozzer, A., Riede, H., Schultz, M. G., Taraborrelli, D., and Tauer, S.: The community atmospheric chemistry box model CAABA/MECCA-4.0, Geosci. Model Dev., 12, 1365–1385, https://doi.org/10.5194/gmd-12-1365-2019, 2019.
Sauer, F., Limbach, S., and Moortgat, G. K.: Measurements of hydrogen peroxide and individual organic peroxides in the marine troposphere, Atmos. Environ., 31, 1173–1184, https://doi.org/10.1016/S1352-2310(96)00289-0, 1997.
Sauer, F., Schaefer, C., Neeb, P., Horie, O., and Moortgat, G. K.: Formation of hydrogen peroxide in the ozonolysis of isoprene and simple alkenes under humid conditions, Atmos. Environ., 33, 229–241, https://doi.org/10.1016/S1352-2310(98)00152-6, 1999.
Schroeder, J. R., Crawford, J. H., Fried, A., Walega, J., Weinheimer, A., Wisthaler, A., Müller, M., Mikoviny, T., Chen, G., Shook, M., Blake, D. R., and Tonnesen, G. S.: New insights into the column CH2O/NO2 ratio as an indicator of near-surface ozone sensitivity, J. Geophys. Res.-Atmos., 122, 8885–8907, https://doi.org/10.1002/2017JD026781, 2017.
Shepson, P. B., Bottenheim, J. W., Hastie, D. R., and Venkatram, A.: Determination of the relative ozone and PAN deposition velocities at night, Geophys. Res. Lett., 19, 1121–1124, https://doi.org/10.1029/92GL01118, 1992.
Snow, J. A., Heikes, B. G., Shen, H., O'Sullivan, D. W., Fried, A., and Walega, J.: Hydrogen peroxide, methyl hydroperoxide, and formaldehyde over North America and the North Atlantic, J. Geophys. Res., 112, 8353, https://doi.org/10.1029/2006JD007746, 2007.
Slemr, F. and Tremmel, H. G.: Hydroperoxides in the marine troposphere over the Atlantic Ocean, J. Atmos. Chem., 19, 71–404, https://doi.org/10.1007/BF00694493,1994.
St. Clair, J. M., Rivera-Rios, J. C., Crounse, J. D., Knap, H. C., Bates, K. H., and Teng, A. P.: Kinetics and Products of the Reaction of the First-Generation Isoprene Hydroxy Hydroperoxide (ISOPOOH) with OH, J. Phys. Chem., 120, 1441–1451, https://doi.org/10.1021/acs.jpca.5b06532, 2016.
Stickler, A., Fischer, H., Williams, J., Reus, M. de, Sander, R., and Lawrence, M. G.: Influence of summertime deep convection on formaldehyde in the middle and upper troposphere over Europe, J. Geophys. Res., 111, D14308, https://doi.org/10.1029/2005JD007001, 2006.
Stickler, A., Fischer, H., Bozem, H., Gurk, C., Schiller, C., Martinez-Harder, M., Kubistin, D., Harder, H., Williams, J., Eerdekens, G., Yassaa, N., Ganzeveld, L., Sander, R., and Lelieveld, J.: Chemistry, transport and dry deposition of trace gases in the boundary layer over the tropical Atlantic Ocean and the Guyanas during the GABRIEL field campaign, Atmos. Chem. Phys., 7, 3933–3956, https://doi.org/10.5194/acp-7-3933-2007, 2007.
Sumner, A. L., Shepson, P. B., Couch, T. L., Thornberry, T., Carroll, M. A., Sillman, S., Pippin, M., Bertman, S., Tan, D., Faloona, I., Brune, W., Young, V., Cooper, O., Moody, J., and Stockwell, W.: A study of formaldehyde chemistry above a forest canopy, J. Geophys. Res., 106, 24387–24405, https://doi.org/10.1029/2000JD900761, 2001.
Tadic, I., Crowley, J. N., Dienhart, D., Eger, P., Harder, H., Hottmann, B., Martinez, M., Parchatka, U., Paris, J.-D., Pozzer, A., Rohloff, R., Schuladen, J., Shenolikar, J., Tauer, S., Lelieveld, J., and Fischer, H.: Net ozone production and its relationship to nitrogen oxides and volatile organic compounds in the marine boundary layer around the Arabian Peninsula, Atmos. Chem. Phys., 20, 6769–6787, https://doi.org/10.5194/acp-20-6769-2020, 2020.
Tadic, I., Nussbaumer, C. M., Bohn, B., Harder, H., Marno, D., Martinez, M., Obersteiner, F., Parchatka, U., Pozzer, A., Rohloff, R., Zöger, M., Lelieveld, J., and Fischer, H.: Central role of nitric oxide in ozone production in the upper tropical troposphere over the Atlantic Ocean and western Africa, Atmos. Chem. Phys., 21, 8195–8211, https://doi.org/10.5194/acp-21-8195-2021, 2021.
Tegtmeier, S., Marandino, C., Jia, Y., Quack, B., and Mahajan, A. S.: Atmospheric gas-phase composition over the Indian Ocean, Atmos. Chem. Phys., 22, 6625–6676, https://doi.org/10.5194/acp-22-6625-2022, 2022.
Tripathi, N., Sahu, L. K., Singh, A., Yadav, R., Patel, A., Patel, K., and Meenu, P.: Elevated levels of biogenic nonmethane hydrocarbons in the marine boundary layer of the Arabian Sea during the intermonsoon, J. Geophys. Res. Atmos., 125, e2020JD032869, https://doi.org/10.1029/2020JD032869, 2020.
Tyndall, G. S., Cox, R. A., Granier, C., Lesclaux, R., Moortgat, G. K., and Pilling, M. J.: Atmospheric chemistry of small organic peroxy radicals, J. Geophys. Res., 106, 12157–12182, https://doi.org/10.1029/2000jd900746, 2001.
Wagner, V., Schiller, C., and Fischer, H.: Formaldehyde measurements in the marine boundary layer of the Indian Ocean during the 1999 INDOEX cruise of the R/V Ronald H. Brown, J. Geophys. Res., 106, 28529–28538, https://doi.org/10.1029/2000JD900825, 2001.
Wang, N., Edtbauer, A., Stönner, C., Pozzer, A., Bourtsoukidis, E., Ernle, L., Dienhart, D., Hottmann, B., Fischer, H., Schuladen, J., Crowley, J. N., Paris, J.-D., Lelieveld, J., and Williams, J.: Measurements of carbonyl compounds around the Arabian Peninsula: overview and model comparison, Atmos. Chem. Phys., 20, 10807–10829, https://doi.org/10.5194/acp-20-10807-2020, 2020.
Weller, R., Schrems, O., Boddenberg, A., Gäb, S., and Gautrois, M.: Meridional distribution of hydroperoxides and formaldehyde in the marine boundary layer of the Atlantic (48∘ N–35∘ S) measured during the Albatross campaign, J. Geophys. Res., 105, 14401–14412, https://doi.org/10.1029/1999JD901145, 2000.
Wennberg, P. O., Bates, K. H., Crounse, J. D., Dodson, L. G., McVay, R. C., Mertens, L. A., Nguyen, T. B., Praske, E., Schwantes, R. H., Smarte, M. D., St Clair, J. M., Teng, A. P., Zhang, X., and Seinfeld, J. H.: Gas-Phase Reactions of Isoprene and Its Major Oxidation Products, Chem. Rev., 118, 3337–3390, https://doi.org/10.1021/acs.chemrev.7b00439, 2018.
Wert, B. P., Trainer, M., Fried, A., Ryerson, T. B., Henry, B., Potter, W., Angevine, W. M., Atlas, E., Donnelly, S. G., Fehsenfeld, F. C., Frost, G. J., Goldan, P. D., Hansel, A., Holloway, J. S., Hubler, G., Kuster, W. C., Nicks Jr., D. K., Neuman, J. A., Parrish, D. D., Schauffler, S., Stutz, J., Sueper, D. T., Wiedinmyer, C., and Wisthaler, A.: Signatures of terminal alkene oxidation in airborne formaldehyde measurements during TexAQS 2000, J. Geophys. Res., 108, 4104, https://doi.org/10.1029/2002JD002502, 2003.
Williams, E. J., Lerner, B. M., Murphy, P. C., Herndon, S. C., and Zahniser, M. S.: Emissions of NOx, SO2, CO, and HCHO from commercial marine shipping during Texas Air Quality Study (TexAQS) 2006, J. Geophys. Res., 114, 3944, https://doi.org/10.1029/2009JD012094, 2009.
Wolfe, G. M., Kaiser, J., Hanisco, T. F., Keutsch, F. N., de Gouw, J. A., Gilman, J. B., Graus, M., Hatch, C. D., Holloway, J., Horowitz, L. W., Lee, B. H., Lerner, B. M., Lopez-Hilifiker, F., Mao, J., Marvin, M. R., Peischl, J., Pollack, I. B., Roberts, J. M., Ryerson, T. B., Thornton, J. A., Veres, P. R., and Warneke, C.: Formaldehyde production from isoprene oxidation across NOx regimes, Atmos. Chem. Phys., 16, 2597–2610, https://doi.org/10.5194/acp-16-2597-2016, 2016.
Wolfe, G. M., Nicely, J. M., St. Clair, J. M., Hanisco, T. F., Liao, J., Oman, L. D., Brune, W. B., Miller, D., Thames, A., Gonzalez Abad, G., Ryerson, T. B., Thompson, C. R., Peischl, J., McCain, K., Sweeney, C., Wennberg, P. O., Kim, M., Crounse, J. D., Hall, S. R., Ullmann, K., Diskin, G., Bui, P., Chang, C., and Dean-Day, J.: Mapping hydroxyl variability throughout the global remote troposphere via synthesis of airborne and satellite formaldehyde observations, P. Natl. Acad. Sci. USA, 116, 11171–11180, https://doi.org/10.1073/pnas.1821661116, 2019.
Zhu, L., González Abad, G., Nowlan, C. R., Chan Miller, C., Chance, K., Apel, E. C., DiGangi, J. P., Fried, A., Hanisco, T. F., Hornbrook, R. S., Hu, L., Kaiser, J., Keutsch, F. N., Permar, W., St. Clair, J. M., and Wolfe, G. M.: Validation of satellite formaldehyde (HCHO) retrievals using observations from 12 aircraft campaigns, Atmos. Chem. Phys., 20, 12329–12345, https://doi.org/10.5194/acp-20-12329-2020, 2020.