the Creative Commons Attribution 4.0 License.
the Creative Commons Attribution 4.0 License.
 | 04 Oct 2023
Evaluation of aerosol- and gas-phase tracers for identification of transported biomass burning emissions in an industrially influenced location in Texas, USA
Sujan Shrestha
Shan Zhou
Manisha Mehra
Meghan Guagenti
Subin Yoon
Sergio L. Alvarez
Fangzhou Guo
Chun-Ying Chao
James H. Flynn III
Yuxuan Wang
Robert J. Griffin
Sascha Usenko
Rebecca J. Sheesley
As criteria pollutants from anthropogenic emissions have declined in the US in the last 2 decades, biomass burning (BB) emissions are becoming more important for urban air quality. Tracking the transported BB emissions and their impacts is challenging, especially in areas that are also burdened by anthropogenic sources like the Texas Gulf Coast. During the Corpus Christi and San Antonio (CCSA) field campaign in spring 2021, two long-range-transport BB events (BB1 and BB2) were identified. The observed patterns of an absorption Ångström exponent (AAE), a high-resolution time-of-flight aerosol mass spectrometer (HR-ToF-AMS) BB tracer (f60), equivalent black carbon (eBC), acetonitrile and carbon monoxide (CO) during BB1 and BB2 indicated differences in the mixing of transported BB plumes with local anthropogenic sources. The combined information from HYSPLIT backward-trajectory (BT) and satellite observations revealed that BB1 had mixed influence of transported smoke plumes from fires in central Mexico, the Yucatán Peninsula and the central US, whereas BB2 was influenced by fires in the central US. The estimated transport times of smoke from the Mexican fires and the central US fires to our study site were not too different (48–54 and 24–36 h, respectively), and both events appeared to have undergone similar levels of atmospheric processing, as evident in the elemental ratios of bulk organic aerosol (OA). We observed an aging trend for f44 vs. f60 and f44 vs. f43 as a function of time during BB2 but not during BB1. Positive matrix factorization (PMF) analysis of OA showed that BB1 had a mixture of organics from aged BB emissions with an anthropogenic marine signal, while the oxidized organic compounds from aged BB emissions dominated the aerosols during BB2. The size distribution of aerosol composition revealed distinct characteristics between BB1 and BB2, where BB1 was found to be externally mixed, exhibiting a combination of BB and anthropogenic marine aerosols. On the other hand, BB2 exhibited internal mixing dominated by aged BB aerosol. Our analysis from mobile and stationary measurements highlights that both CO and acetonitrile are likely impacted by local sources even during the BB events and specifically that acetonitrile cannot be used as a unique BB tracer for dilute BB plumes in an industrially influenced location. A suitable volatile organic compound (VOC) tracer would need to be emitted in high concentrations during BB, resistant to degradation during transport, unique to BB and able to be measured in the field. This study effectively demonstrates that AAE and aerosol BB tracers served as precise and effective tracers in these complex emission scenarios. Network deployment of multiwavelength photometers holds promise for enhancing our understanding of BB impacts on air quality and supporting informed decision-making for effective mitigation strategies in locations with mixed sources and influence of dilute BB plumes. To demonstrate the relevance of such an aerosol optical network, we provide evidence of the potential regional impacts of these transported BB events on urban O3 levels using measurements from the surface air quality monitoring network in Texas.
- Article
(7217 KB) - Full-text XML
-
Supplement
(1390 KB) - BibTeX
- EndNote


Biomass burning (BB) activities emit fine particulate matter (PM2.5, aerodynamic diameter smaller than 2.5 µm), volatile organic compounds (VOCs) and trace gases into the atmosphere. BB plumes can be transported across long distances and impact air quality in downwind locations (Rogers et al., 2020; Sciare et al., 2008; Sakamoto et al., 2015; Streets et al., 2003; Zhang et al., 2012; Morris et al., 2006; Markowicz et al., 2016; Forster et al., 2001). During long-range transport, the physical properties and chemical composition of the plume can be altered significantly by both plume aging and dilution due to boundary layer mixing (Reid et al., 2005; Hung et al., 2020; Hodshire et al., 2019).
In urban locations that are burdened by local anthropogenic sources, it is challenging to characterize and quantify the impacts of aged and/or dilute BB smoke plumes (Bein et al., 2008; Singh et al., 2012). Several approaches have been established to determine the impact of transported BB smoke on the ambient air quality of downwind locations. This includes laboratory, field-based and satellite observations of aerosol composition and optical properties (de Gouw and Jimenez, 2009; Laing et al., 2016; Li et al., 2020; Zauscher et al., 2013; Zhou et al., 2017) as well as analysis of chemical and organic molecular markers of BB emissions (including non-sea-salt potassium, acetonitrile and levoglucosan) (Yokelson et al., 2009; Bhattarai et al., 2019; Huangfu et al., 2021; Bond and Bergstrom, 2006; Mehra et al., 2019). Studies based on aerosol optical properties utilize the wavelength dependence of aerosol absorption and scattering to identify aerosol types, i.e., differentiate black carbon (BC) from fossil fuel combustion, brown carbon (BrC) from BB and minerals from dust (Schmeisser et al., 2017). An absorption Ångström exponent (AAE) and a scattering Ångström exponent (SAE) are commonly used intensive parameters to characterize the aerosol wavelength dependence (Bergstrom et al., 2007; Russell et al., 2010; Gyawali et al., 2009; Kirchstetter et al., 2004). In order for molecular or chemical markers to be used in identifying BB contributions, these markers must be conserved during atmospheric chemical reactions during the transport (Fraser and Lakshmanan, 2000). Further, for these markers to be detectable in urban locations, the specific tracer must be unique to BB emission and emitted in a large quantity, so that the compound is quantifiable above the urban background concentration.
The frequency, duration and burned area during wildfires in the northwestern US have increased over the last 2 decades under the changing climatic conditions (Westerling and Bryant, 2008; Westerling et al., 2006; Kasischke and Turetsky, 2006), implying an increase in the concentration of air pollutants during the wildfire seasons (i.e., spring and summer) as a result of these fires. These impacts can be observed on a regional scale (Jaffe et al., 2008). For example, several studies have shown that the transported pollutants from BB emissions in Alaska, Canada and the northwestern US can exacerbate ozone (O3), CO, BC and PM2.5 levels in Houston, Texas, for several days (Lei et al., 2018; McMillan et al., 2010; Morris et al., 2006; Schade et al., 2011). Wildfires and agricultural burning in central Mexico and the Yucatán Peninsula peak during the spring–summer season and also transport pollutants to the southern US (Wang et al., 2018; Rogers and Bowman, 2001; Yokelson et al., 2013). Previous studies have documented emissions of trace gases, VOCs and particulates as well as the evolution of O3 from forest fires and agricultural burnings in the southeastern US (Müller et al., 2016; Liu et al., 2016). It has not been reported whether fires in these regions are also increasing. Jaffe and Wigder (2012) conducted a comprehensive review of various factors that contribute to O3 production from wildfire emissions. These factors included emissions of O3 precursors (NOx and VOCs), combustion efficiency, photochemical reactions, the influence of aerosols on chemistry and radiation, as well as local and downwind meteorological patterns. By contrast, the literature has also reported that carbonaceous aerosols and organics in the BB plumes can absorb and scatter incoming solar radiation and reduce the photolysis of atmospheric trace gases, thereby reducing the surface O3 production (Jiang et al., 2012; He and Carmichael, 1999; Tang et al., 2003). Thus, the interaction between the meteorology and chemistry of the BB plume plays a crucial role in governing the effects on surface O3 in the downwind regions.
Wang et al. (2018) have shown that the transport of central Mexican and Yucatán BB emissions adversely impacted surface air quality at several major urban centers along the Gulf Coast, including Houston and Corpus Christi in Texas. The episodic transport events of BB emissions can result in O3 and PM2.5 exceedances of the air quality standards across several metropolitan areas in Texas. The Texas Commission on Environment Quality (TCEQ) operates a network of surface air quality monitoring stations in Texas, but the measurements are largely limited to criteria pollutants. Real-time observational data integrated with satellite observations and transport models may improve efforts to track the transported BB emissions, locate the source regions, understand the plume aging and analyze its impacts on surface air quality.
Although Texas is the second-most populous state in the US, with multiple industrial and economic urban centers, many of the previous air quality studies focused on the Houston–Galveston–Brazoria and Dallas–Fort Worth areas (Parrish et al., 2009; McMillan et al., 2010; Yoon et al., 2021; Anderson et al., 2019; Shrestha et al., 2022; Guo et al., 2021). To better understand air quality drivers in emerging Texas cities, the San Antonio Field Study (SAFS) 2017 investigated ambient concentrations and sources of VOCs and trace gases as well as physical and chemical processes that control O3 (Guo et al., 2021; Shrestha et al., 2022; Anderson et al., 2019). Results from the SAFS 2017 study highlighted the need to characterize the influence of upwind sources and long-range transport on air quality in San Antonio. To address these outstanding questions from SAFS 2017, the Corpus Christi and San Antonio (CCSA) field study was conducted in spring 2021 (Zhou et al., 2023). Corpus Christi is upwind of San Antonio when the wind is coming from the south-southeast. Historical wind data analysis reveals that, during the spring months in San Antonio, the prevailing wind direction is predominantly southeasterly (Guo et al., 2021). This mobile and stationary field experiment was designed to measure the impact of local emissions and transported pollution on air quality in Corpus Christi and San Antonio. This paper primarily focuses on BB transport events identified during stationary measurement at Port Aransas (PA), a Gulf Coast city near Corpus Christi, during the field campaign (see Fig. 1). The goals were to (i) study the physical and chemical properties of transported BB smoke and their impact on background air quality in PA; (ii) identify fire source regions and understand transport times, aging and dilution of smoke plumes; and (iii) evaluate the challenges of using BB tracers in an industrialized area like PA. Finally, we included general comments on extending permanent in situ monitoring networks with low-cost aerosol optical measurements for identifying BB events.
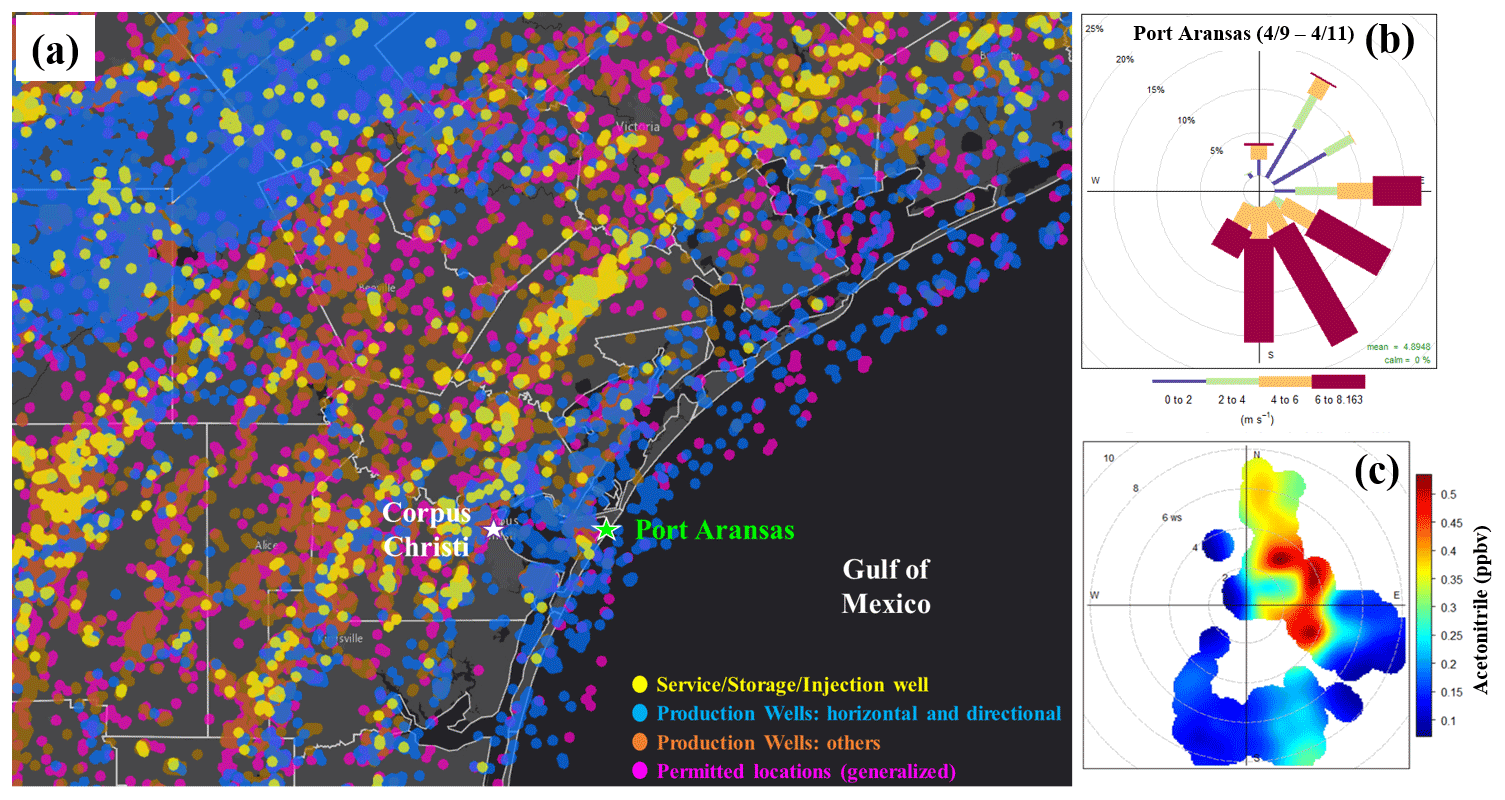
Figure 1(a) Geographic Information System (GIS) map of oil and gas activities in Texas (study site; PA is shown with the green star), (b) wind rose for PA and (c) pollution rose plot for acetonitrile during the period of interest (9–11 April 2021). The GIS map in panel (a) was obtained from https://maps.fractracker.org (last access: 8 May 2021).
2.1 Site description
The stationary measurements were performed at a beachfront site in PA, TX (27.803∘ N, 97.077∘ W) from 3 to 15 April 2021. The sampling site is approximately 4 km southwest of the mouth of the Corpus Christi Ship Channel into the Gulf of Mexico and 35 km directly east of Corpus Christi's urban core. Oil and gas wells lie in every direction from the study site (green star) (Fig. 1a). The instrumentation was housed in a mobile air quality lab (MAQL2) operated by Baylor University, the University of Houston and Rice University. MAQL2 is a 35 m3 insulated air-conditioned trailer with a ∼9 m telescoping tower and inlet box that extends above the trailer during stationary measurements (Fig. S1 in the Supplement). The aerosol inlet has a PM2.5 cyclone and stainless-steel bellows. The inlet lines inside the trailer were made as short as possible (0.5 m); these lengths of tubing were insulated to minimize wall loss and vaporization effects associated with temperature changes between the ambient air and inside the trailer. A heated sampling line set at 70 ∘C, manufactured by Atmos-Seal Engineering Inc., was used for VOC measurements. During mobile measurements, the MAQL2 was towed by a Ford F-250 truck with an air-ride system installed to minimize the vibration during motion, and a generator was carried in the bed of the truck to provide electrical power. The inlet box was positioned above the front bumper of the vehicle, forward of the generator and truck exhaust, to avoid self-sampling during mobile measurements (Fig. S1).
2.2 Instrumentation
2.2.1 Aerosol optical parameters
The aerosol light absorption coefficient (σabs) was measured with a 3λ tricolor absorption photometer (TAP, Brechtel Inc., Hayward, CA) at wavelengths of 365, 520 and 640 nm. The TAP is the commercially available version of the National Oceanic and Atmospheric Administration (NOAA's) continuous light absorption photometer (CLAP) (Ogren et al., 2017). The TAP consecutively samples through eight sample filter spots and two reference filter spots. During deployment at PA, the TAP was set to rotate to the next filter spot when a filter spot's transmission reached 50 %.
The light-scattering coefficient (σscat) was measured using an integrating nephelometer (model 3563, TSI Inc., Shoreview, MN) at wavelengths of 450, 550 and 700 nm. During the campaign, the TSI nephelometer was calibrated against zero air and carbon dioxide (CO2) (Anderson and Ogren, 1998). The measured values were corrected for angular scattering and truncation error (Anderson and Ogren, 1998; Bond et al., 2009) using the relationship , where C is the correction factor, σneph is the scattering coefficient reported by the instrument, and σcorrected is the corrected scattering coefficient (Shrestha et al., 2018). The correction factor (C) was calculated using Eq. (1), where the values for constants a and b were obtained from Anderson and Ogren (1998) and the SAE was calculated from the scattering coefficients measured during this study.
Using 5 min averages, AAE and SAE were calculated as the negative slope of the linear fit of the optical parameter vs. wavelength on a log–log plot (Bergstrom et al., 2007; Bond and Bergstrom, 2006; Kirchstetter et al., 2004). AAE and SAE provide information about the wavelength dependence of absorption and scattering, respectively (Schmeisser et al., 2017). Generally, AAE values of approximately 1 characterize fresh BC, whereas BrC and mineral oxides show strong preferential light absorption in the UV range, resulting in an enhancement in AAE values with respect to BC (Bond and Bergstrom, 2006; Bergstrom et al., 2007). SAE values are inversely related to the particle size distribution within the measured sample, so that generally SAE values less than 1 indicate size distributions dominated by coarser particles, while those greater than 1 indicate that finer particles dominated the scattering aerosol (Schuster et al., 2006). The narrow spectral range of the TAP (365–640 nm) compared to other aerosol absorption measurements like by an Aethalometer (AE33) may result in a lower range of AAEs. Therefore, in this study, an AAE above 1.2 (i.e., the average AAE during the non-BB-influenced period + 2 standard deviations) is used to identify events that lie above the baseline AAE for a given site (discussed in Sect. 3.3.1), rather than the absolute AAE value from the literature. While the variability in aerosol optical measurements between different instruments has been extensively studied in the previous literature (Laing et al., 2020; Ogren et al., 2017; Ogren, 2010; Bond et al., 1999), it is not the primary focus of this paper. A previous intercomparison study demonstrated excellent agreement between long-term measurements by the CLAP (NOAA's version of the TAP) and by the particle soot absorption photometer (PSAP) at multiple sites (Ogren et al., 2017) and indicated that the TAP and AE33 intercompare when a different correction factor is applied to the AE33 absorption coefficient (Laing et al., 2020). The absorption coefficient data from this study are available (link below in the Data availability section). This will enable future studies to access and utilize data from this study for the investigation and comparison with other instruments that use different protocols for BC calculation.
Single-scattering albedo (SSA) is the ratio of σscat to the extinction coefficient (σscat+σabs), which provides information about the top-of-atmosphere forcing due to the aerosol, i.e., the absorbing or scattering nature of the sampled aerosol. An SSA value greater than 0.95 represents aerosol with a net cooling effect, while a value less than 0.85 will result in net warming. The SSA values between 0.85 and 0.95 may represent a warming or cooling effect depending upon the surface albedo and cloud cover (Ramanathan et al., 2001). The wavelengths for σscat and σabs were not the same, so to calculate SSA at 550 nm, the σabs measured at 540 nm was converted to that applicable to 550 nm using the equation below:
2.2.2 PM2.5 filter sampling
PM2.5 samples were collected on 90 mm diameter quartz-fiber filters (Pall Corporation, Port Washington, NY, USA) using a medium-volume (90 L min−1; URG Corporation, Chapel Hill, NC, USA) sampler at the Texas A&M Corpus Christi campus. A detailed discussion regarding filter collection protocols is reported in Yoon et al. (2021). We calculated equivalent black carbon (eBC) mass concentrations from the absorption coefficient measured by the TAP at a wavelength of 520 nm using mass absorption cross-section (MAC) values determined from the PM2.5 filter samples. Details about the eBC calculation are presented in Sect. S1 in the Supplement. Using the method discussed in Sect. S1, the derived MAC at 520 nm was 11.45 m2 g−1.
2.2.3 Real-time, size-resolved aerosol composition
An Aerodyne (Billerica, MA, USA) time-of-flight aerosol mass spectrometer (HR-ToF-AMS) was used for size-resolved chemical characterization of non-refractory submicron aerosols (NR-PM1) (DeCarlo et al., 2006). Detailed discussion regarding the HR-ToF-AMS operation and data handling followed during this study can be found in our previous publication (Zhou et al., 2023). In brief, the size-resolved NR-PM1 mass concentration and chemical composition were analyzed using the standard HR-ToF-AMS data analysis toolkits (SQUIRREL v1.64 and PIKA v1.24). Table S2 in the Supplement lists the minimum detection limits (MDLs) of the five HR-ToF-AMS species (organic, sulfate, nitrate, ammonium and chloride). Positive matrix factorization (PMF) analysis of the combined spectral matrices of organic and inorganic species of the HR-ToF-AMS (Zhou et al., 2017; Paatero and Tapper, 1994) identified seven organic aerosol (OA) factors associated with distinct sources and chemical and physical properties, which include (i) hydrocarbon-like OA (HOA) associated with traffic emissions, (ii) biomass burning OA (BBOA), (iii) less-oxidized oxygenated OA (LO-OOA) likely representing fresher secondary OA (SOA), (iv) more-oxidized OOA (MO-OOA) likely representing more aged and processed SOA, (v) less oxidized OOA that was associated with ammonium nitrate (AN-OOA), (vi) highly oxidized OOA associated with ammonium sulfate (AS-OOA) and (vii) highly oxidized OOA associated with acidic sulfate (acidic-OOA). Details of the PMF analysis method and the results evaluation can be found in Sect. S2. Further, f60 values (i.e., the fraction of the signal at 60, mostly in the OA spectrum) above 0.3 % were used as markers for BB emissions (Docherty et al., 2008; Cubison et al., 2011).
2.2.4 Trace gases and meteorological data
Nitric oxide (NO), nitrogen dioxide (NO2), nitrogen oxides (), total reactive nitrogen (NOy), CO and O3 were measured during the campaign. O3 measurements were conducted using a modified Thermo Environmental, Inc., Model 42C instrument, which utilizes chemiluminescence (CL) with NO gas to measure O3. NO and NO2 were measured using CL instruments (Air Quality Design; Golden, CO). The NOy was measured with a molybdenum oxide catalytic converter inlet and a subsequent CL NOx analyzer. The CO was measured using off-axis integrated cavity output spectroscopy (Los Gatos Research, Inc., Li-7000). Greater detail about trace gas measurements is presented in our previous publications (Shrestha et al., 2022; Guo et al., 2021). The MDL and the uncertainty for trace gas measurements during the campaign are presented in Table S3.
Basic meteorological parameters, including wind speed and direction, temperature, and relative humidity, were measured continuously using an RM Young 86000 ultrasonic anemometer. Figure 1b shows that southeasterly wind was dominant at PA, with intermittent wind from other directions during the campaign.
2.2.5 VOCs
A quadrupole proton-transfer reaction mass spectrometer (PTR-MS Q300; Ionicon Analytik, Austria) was used to measure VOCs during this study. In the PTR-MS, target gas molecules are ionized by proton transfer from protonated water (H3O+). The ionized material is then detected and quantified using a quadrupole mass spectrometer. A more detailed description of the PTR-MS is given in other studies (Lindinger and Jordan, 1998; de Gouw et al., 2003a; de Gouw and Warneke, 2007). A sample drying system similar to that used by Jobson and McCoskey (2010) was implemented to reduce any effects of water vapor that can occur when operating the PTR-MS at a lower (100 Td). More details regarding the PTR-MS operation, calibration and VOC data analysis followed in this study are presented in our previous publication (Shrestha et al., 2022). The MDLs and the uncertainty of the measured VOCs during the campaign are presented in Table S4.
2.3 Satellite observations
2.3.1 Active fire count and aerosol optical depth (AOD)
The ground-based measurements have been supported by the analysis of satellite AOD data obtained from the Moderate Resolution Imaging Spectroradiometer (MODIS) mounted on board the Aqua and Terra satellites. The MODIS AOD gridded at a 10 km×10 km resolution was averaged for each day. This study uses level-3 AOD at 550 nm over the land and ocean product for understanding trends in smoke aerosol loading (Remer et al., 2005; Levy et al., 2007).
Information about the daily active fires was obtained from the Visible Infrared Imaging Radiometer Suite (VIIRS) satellite observations. The VIIRS imagery-resolution bands sense 32 375 m pixel lines per scan with a field view of 112.56∘ (Li et al., 2020; Cao et al., 2014; Wolfe et al., 2013). The active fire confidence values below 70 % were eliminated during the data processing.
2.3.2 Satellite imagery of smoke plumes
The smoke map generated by the NOAA Hazard Mapping System (HMS) was used to understand the spatial distributions of visible smoke plumes across North America. The NOAA HMS graphics system is an interactive satellite image developed by the National Environmental Satellite, Data, and Information Service (NESDIS). The satellite imagery can be downloaded from the NOAA smoke product website (https://satepsanone.nesdis.noaa.gov/FIRE/fire.html, last access: 1 August 2023). These maps provide daily information on the horizontal distribution and density of the smoke plumes in the region (Rogers et al., 2020; Rolph et al., 2009; Fischer et al., 2018).
2.4 Backward-trajectory analysis
The NOAA HYSPLIT model (Draxler and Hess, 1998; Stein et al., 2015) was used to simulate 72 h backward trajectories (BTs) at different starting heights (50, 100 and 500 m) every hour from 9 April through 12 April 2021 (Central Standard Time – CST) at the PA site. The BTs at all three starting heights reported similar results; therefore, we chose the 50 m starting height for further analysis (Fig. S4). The HYSPLIT model has been used extensively for atmospheric transport and dispersion research in the last 3 decades. In this study, the HYSPLIT model was used to study possible source regions and estimate the age of the air masses arriving at the study site during the BB events. Meteorological data from the Global Data Assimilation System (GDAS) with spatial resolution were used in this study.
During the stationary period when the MAQL2 was deployed in PA for the CCSA study, potential BB events were identified, first through the daily NOAA HMS updates of smoke across the Gulf Coast and in the greater Corpus Christi area and then through evaluation of in situ measurements of aerosols, VOCs and trace gases from the MAQL2. Two BB events were identified on 10 April (11:00–23:00 CST) and 11 April (06:45–14:00 CST) at PA and are referred to as BB1 (orange shade) and BB2 (pink shade) hereafter (Fig. 2). The two BB events were first distinguished based on the observed pattern of enhancement in the AAE and the HR-ToF-AMS tracer, f60 (Sect. 3.1); the accuracy of the AAE identification of BB influence was assessed in comparison with f60. To better understand transport times and potential plume age, we analyzed possible source regions using BTs and satellite observations (Sect. 3.2). Based on these results, we considered aerosol chemical speciation of NR-PM1 (Sect. 3.3) and evaluated the efficacy of gas-phase BB tracers (including CO and acetonitrile) in an industrialized urban environment (Sect. 3.4 and 3.5). Finally, we discuss the potential implications of this BB event for Texas urban air quality.
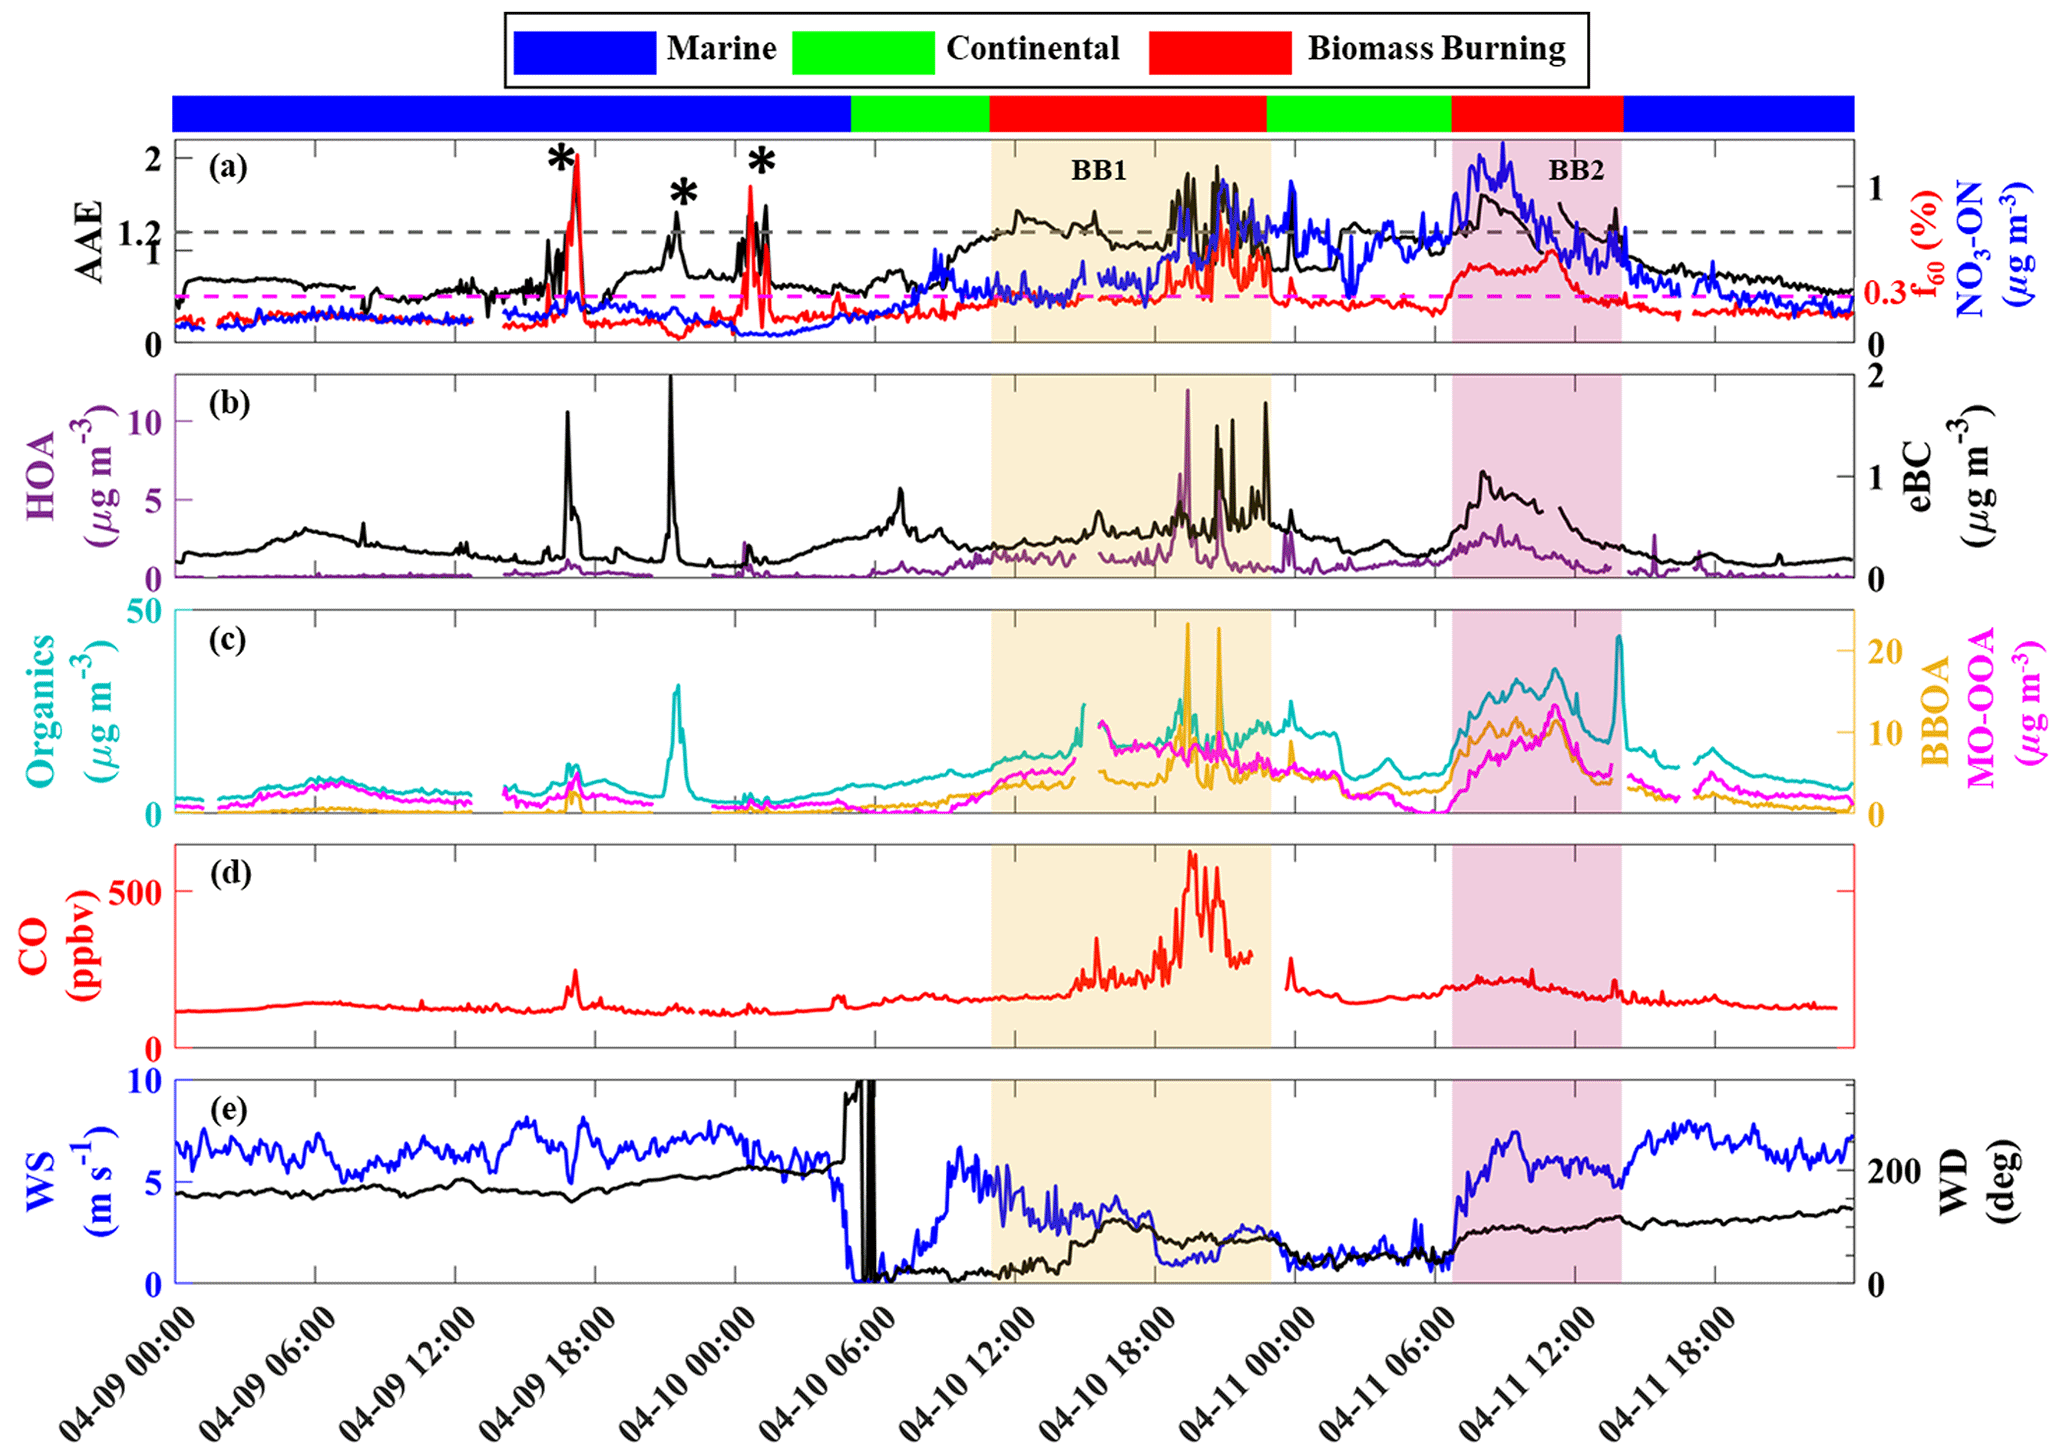
Figure 2Time series plots for (a) AAE, f60 (dashed lines in grey and magenta represent AAE=1.2 and f60=0.3 %, respectively), and the AMS-measured nitrate signal attributed to organonitrates (NO3-ON). (b) HR-ToF-AMS HOA factor concentration and eBC concentration. (c) OA concentration together with BBOA factor and MO-OOA factor concentrations. (d) CO. (e) Wind speed and direction. The short-duration events associated with local combustion, indicated by the * symbol in panel (a), were removed from the marine average. The marine and continental air mass classifications are differentiated based on the surface wind direction measured during the campaign.
3.1 Identifying biomass burning using aerosol optical properties
The aerosol optical properties, aerosol chemical speciation, trace gas and meteorological measurements from PA highlight changes in composition during the 9–11 April period of interest; this includes the day prior to the identified BB event. Based on the direction of the surface wind, the in situ measurements were separated into marine and continental periods, while the BB designation was defined by the aerosol indicators (AAE and f60). The measurement statistics during the BB1, BB2, marine background and continental air mass periods are presented in Table 1. The short-duration events associated with local combustion that impact AAE and f60 values were removed from the marine average (see Fig. 2). Note that the statistics presented in this study are for a short period of interest (9–11 April) within a total campaign (3–15 April), so the averages presented here differ from campaign averages reported in Zhou et al. (2023). Unless otherwise specified, all the data presented in this study pertain to the period of interest, i.e., 9–11 April.
Table 1Basic statistics (average ± standard deviation) of aerosol optical properties, aerosol speciation and select gases during the period of interest (9–11 April). The short-duration events associated with local combustion, indicated by the * symbol in Fig. 2a, were removed from the marine average.
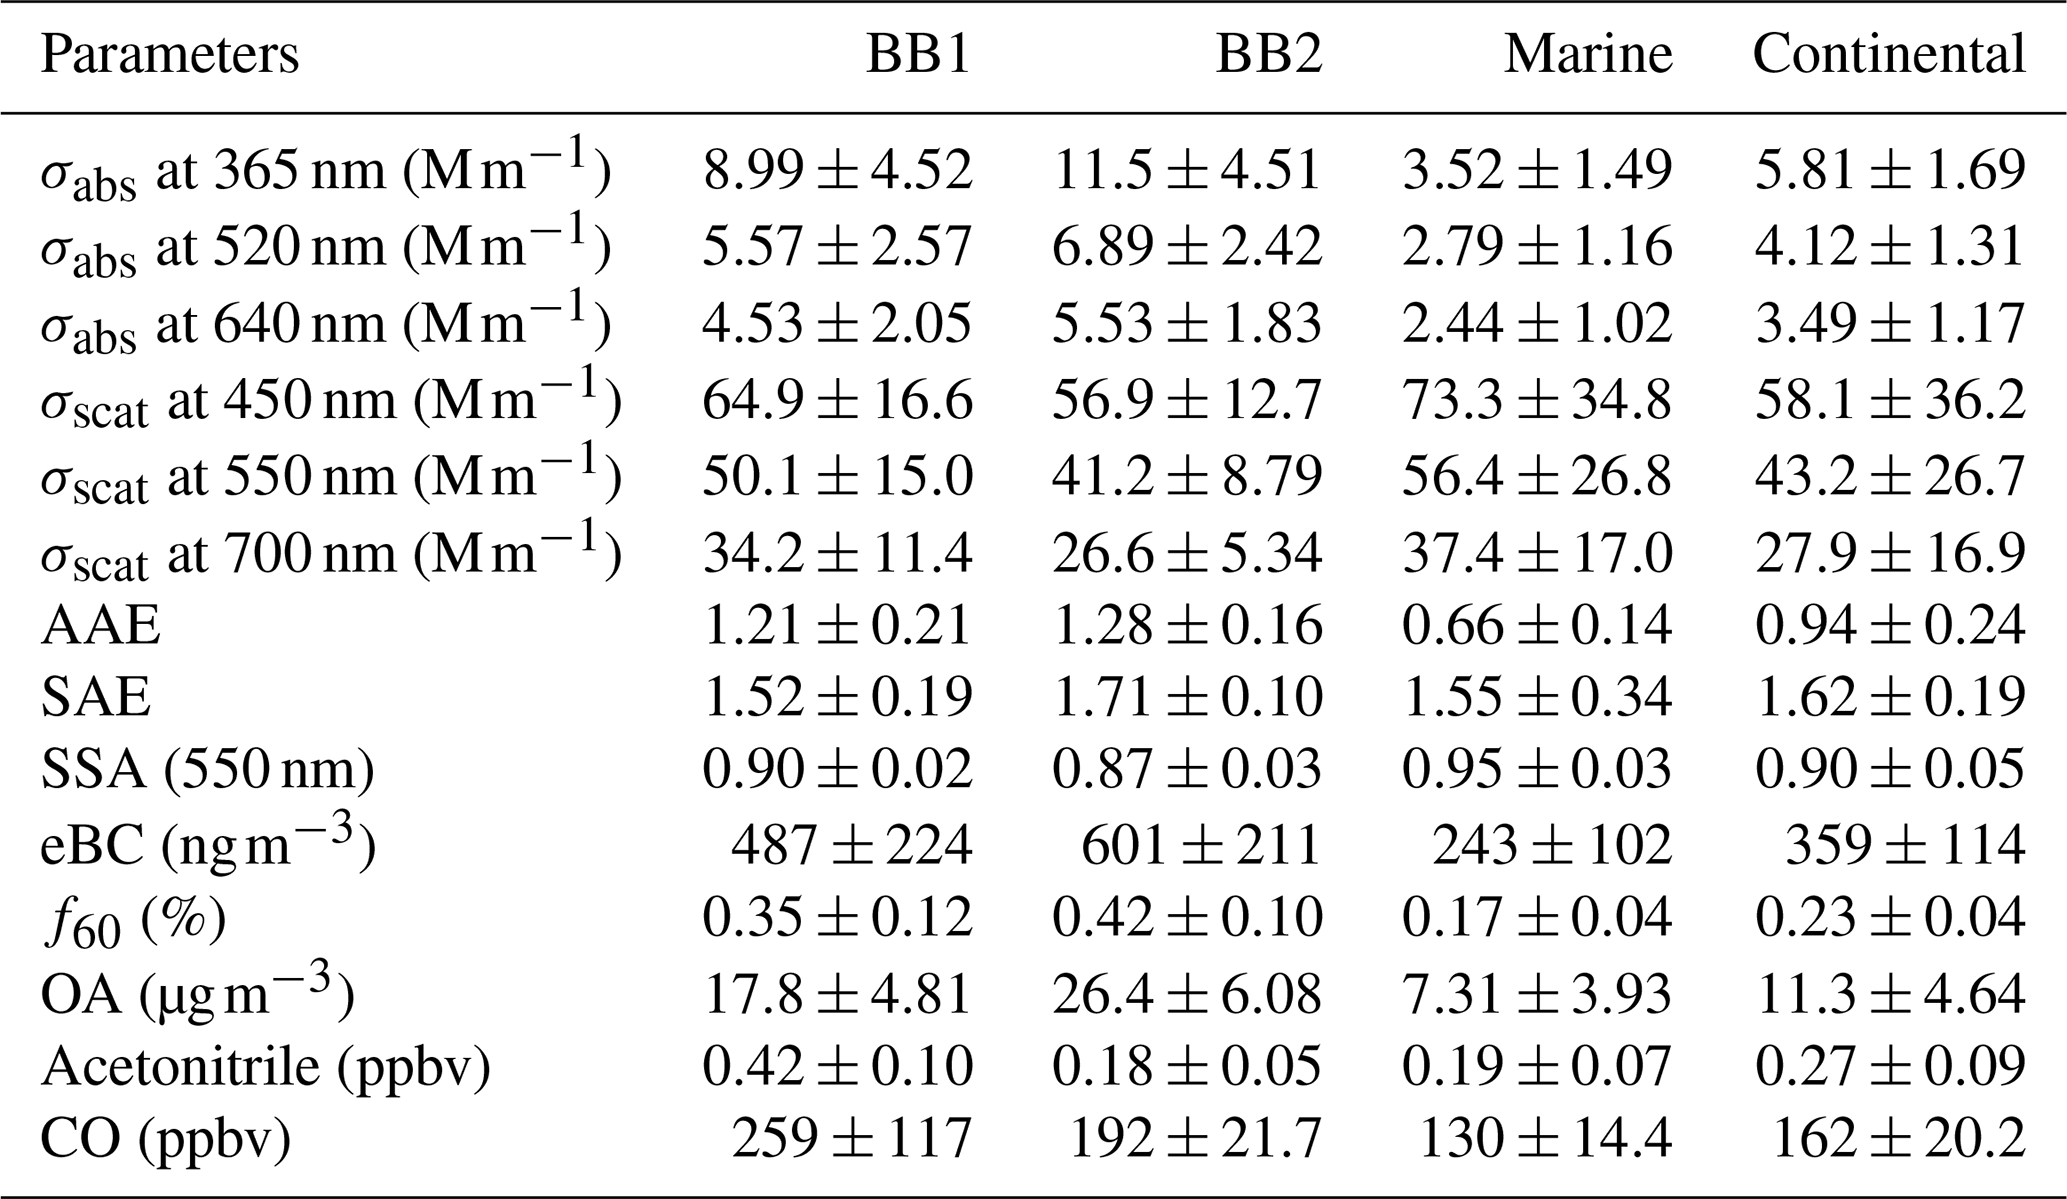
The σabs values for the ultraviolet–visible range (365–640 nm) were significantly higher during BB1 and BB2 (e.g., 5.57 ± 2.56 and 6.89 ± 2.42 M m−1, respectively, at 520 nm) compared to marine and continental air masses (2.79 ± 1.16 and 4.12 ± 1.31 M m−1, respectively, at 520 nm) in the same week. However, the average σscat values at all three wavelengths (450, 550 and 700 nm) at PA were similar between BB and background marine air mass (Table 1). This does not agree with the studies conducted at remote locations and during airborne measurements of relatively fresh plumes that reported enhancement in aerosol scattering, mass concentration and number concentration during atmospheric transport of BB aerosols (Laing et al., 2020; Yokelson et al., 2009; Hobbs et al., 2003). It is interesting that the mean background σscat and σabs (56.52 and 2.79 M m−1) at PA were higher than some of the other coastal locations in the US, such as Trinidad Head ( and ) and Point Reyes in California ( and ) and Cape Cod in Massachusetts ( and ) (Oltmans et al., 2008; Berkowitz et al., 2005; Titos et al., 2014). The higher background σscat and σabs at PA demonstrate the influence of anthropogenic emissions including shipping activities and oil and gas extraction on background aerosol in the Gulf of Mexico (Zhou et al., 2023).
The enhancement in σabs during the BB events was higher in the UV wavelength compared to longer wavelengths (Table 1). This wavelength dependency on aerosol absorption resulted in high AAEs during BB1 and BB2 (1.2 ± 0.2 and 1.3 ± 0.2, respectively) compared to the marine (0.66 ± 0.14) and continental air masses (0.94 ± 0.24) (Fig. 2a). The marine air masses had AAEs significantly less than 1, similar to other coastal locations, such as the island of Graciosa in the Azores, Portugal (average AAE of 0.65) (Jefferson, 2010), and Point Reyes in California, USA (average of ∼0.5) (Berkowitz et al., 2005; Schmeisser et al., 2017). The continental air masses at PA during this study had AAE∼1, which is routinely reported in urban aerosols that contain BC from fossil fuel combustion. Ambient aerosols impacted by BB can include BrC, which preferentially absorbs at lower wavelengths, resulting in an increased AAE (in excess of 2) (Bergstrom et al., 2007; Bond and Bergstrom, 2006; Kirchstetter et al., 2004). However, laboratory and field-based studies have reported a wide range of AAE values for different biomass fuel and burning conditions (0.55 to more than 3) (Gyawali et al., 2009; Bahadur et al., 2012; Pokhrel et al., 2016; Kirchstetter et al., 2004). Additionally, as the BrC emitted during wildfires decays during atmospheric transport (Forrister et al., 2015; Liu et al., 2016), there may be a subsequent decrease in the AAEs of the plume aerosols due to photobleaching (Reid et al., 2005; Eck et al., 2001; O'Neill et al., 2002). Liu et al. (2021) reported that the organic aerosol absorptivity decreases significantly during evolution when light is present. When considering the decrease during transport and dilution associated with mixing with local aerosol, it is not unexpected that the AAEs during BB1 and BB2 at PA showed only a minor enhancement above the marine and continental backgrounds. In fact, similar AAE values have been reported for transported BB plumes impacting urban locations during South African (Bergstrom et al., 2007) and Yucatán (Marley et al., 2009) fires. Although the AAE was impacted by the BB event, the SAE was consistent (1.5–1.7) during the period of interest. Locations that are influenced by coarse marine-mode aerosols exhibit a lower SAE (less than 1) (Costabile et al., 2013; Pandolfi et al., 2018; Titos et al., 2014). However, the slightly higher range of SAEs observed at PA indicated an additional influence of local anthropogenic emissions besides marine influence at the sampling site (Zhou et al., 2023).
BB1 and BB2 events had clear synoptic peaks of eBC, OA and f60 (Fig. 2b and c). Both the eBC and OA concentrations were significantly enhanced during BB1 and BB2, while the f60 was 0.35 ± 0.12 % and 0.42 ± 0.10 % during BB1 and BB2 (Table 1). An f60 value above 0.3 % indicates BB influence (Zhou et al., 2017). Thus, the aerosol BB tracers have good agreement with respect to the BB designation during the period of interest. However, the trace gas and eBC reveal a more complicated scenario. There was a good correlation for eBC with CO (r2=0.62) and f60 (r2=0.75) during BB2, and there was a poor correlation with CO (r2=0.23) and f60 (r2=0.27) during BB1 (Figs. S2 and S3). Figure 3a–c show that the patterns of AAE, f60, eBC and CO were different during BB1 and BB2. The more specific BB tracers (AAE and f60) had a different temporal trend than the more general combustion tracers (eBC and CO), indicating that PA was influenced by more than one type of combustion plume during BB1 and BB2. The high variability of the eBC and CO concentrations during BB1 is possibly driven by mixed plumes from different sources. Further, CO had high peaks for a couple of hours (18:00–20:00 CST) during BB1, when the wind speed was very low (). We assume that the high CO during that period was contributed by local non-BB combustion sources, as indicated by elevated HOA concentrations (e.g., traffic or other primary combustion emissions), a lack of enhancement in acetonitrile concentration (discussed in Sect. 3.4) and poor correlations of CO with eBC and f60.
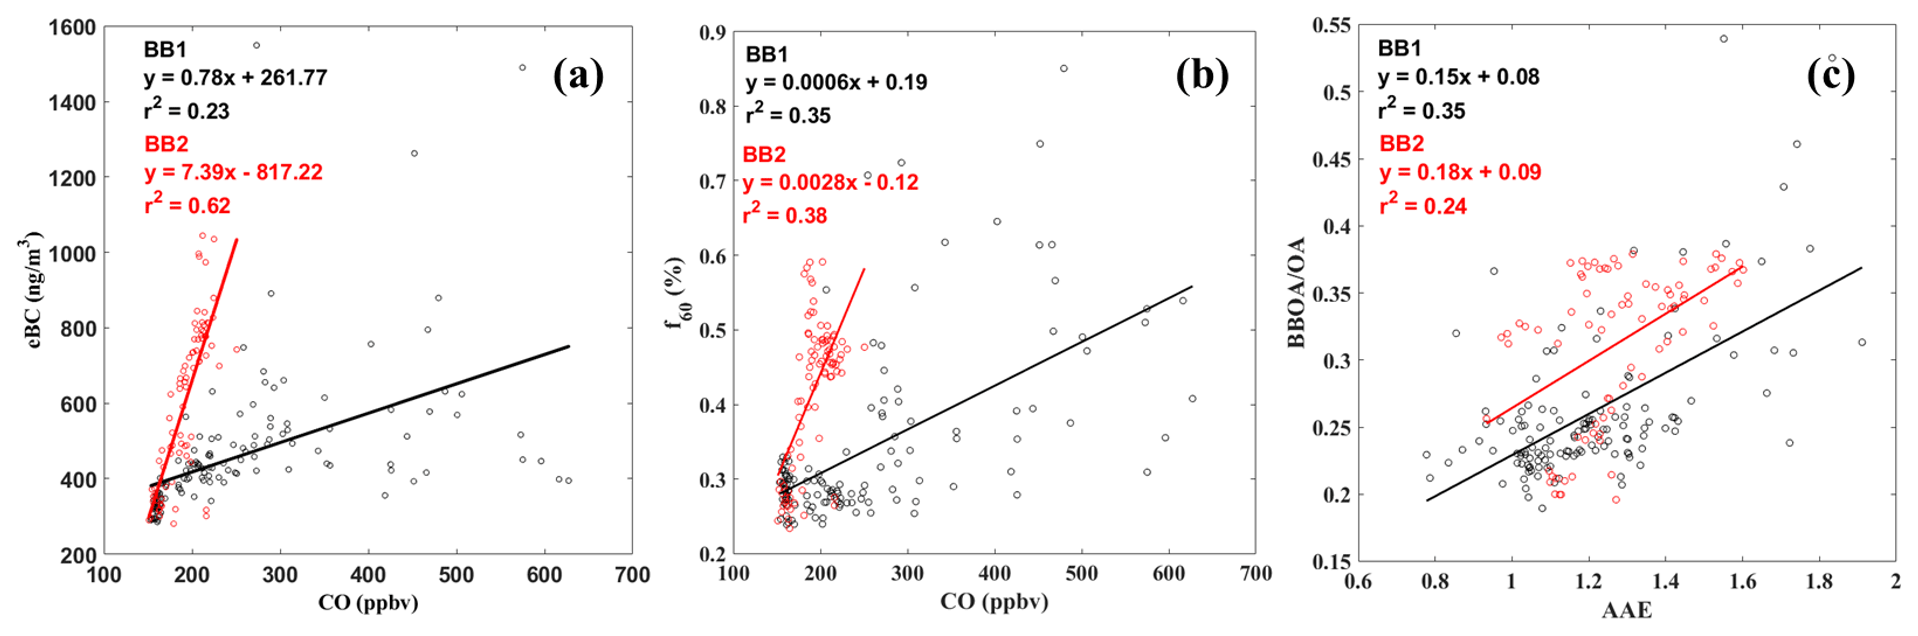
Figure 3Correlation of (a) eBC vs. CO, (b) f60 vs. CO and (c) the BBOAOA ratio vs. AAE during BB1 and BB2. The slope of the regression lines in panel (b) is close to zero due to the difference in magnitude of the f60 value and the CO concentration.
3.2 Analysis of potential biomass burning source regions using satellite data and backward-trajectory analysis
For this study, we evaluated the MODIS AOD, VIIRS fire count, NOAA HMS smoke product and HYSPLIT BTs to identify the fire source regions and estimate the plume age and transport times of BB1 and BB2, following a methodology similar to previous studies (Laing et al., 2016; Zhou et al., 2017; Deng et al., 2008; Mathur, 2008). The NOAA HMS smoke product indicated that PA had smoke in the column from 10 to 16 April (Fig. 4); however, it does not provide information about vertical distribution and boundary layer mixing of the smoke (Jaffe et al., 2020; Buysse et al., 2019). The influence of BB on surface air quality was evident in the ground-based observations only on 10 and 11 April (see Sect. 3.1). Because we are most interested in the days with surface air quality impacts, we focused on source regions and transport during 10–11 April. Extensive fire detects were evident in central Mexico, the Yucatán Peninsula and the central US during this period (Fig. 4). BTs ending at PA shifted gradually from Mexico to the northern US over the course of the day on 10 April and remained from the northern US through 11 April (Fig. S4), intersecting with dense fire hotspots in the central US (Oklahoma and Kansas). The air parcel heights during BB1 and BB2 were generally below 1500 m above ground level (m a.g.l.) when they passed over the active fire locations in the central US (Fig. 4). As discussed above, the HMS smoke product indicated a smoke plume extending from Mexico, over the Gulf of Mexico and to PA on both days during BB1 and BB2, indicating the possibility of influence of the fires in the Mexican region, which complicates the assignment of a specific source region. The smoke cover in the Gulf of Mexico resulted in higher AOD values (0.5 ± 0.1; white square region in Fig. 4) on 10 and 11 April compared to the days prior to the event (0.3 ± 0.1), indicating heavy loading of aerosols on those days. Specifically, the MODIS grid that includes PA reported higher AOD during BB events (0.24) compared to the days prior to the event (0.18). Therefore, based on the BTs and satellite analysis, we assume that BB1 had a mixed influence of transported smoke plumes from fires in central Mexico, the Yucatán Peninsula and the central US, whereas BB2 was influenced predominantly by fires in the central US. Based on the combined information of fire hotspots and the BTs, we estimate that the transport time of smoke from the Mexican fires and the central US fires ranged from 48 to 54 h and from 24 to 36 h, respectively, before arriving at PA. The difference between the two BB events that was evident in the BB tracer analysis is then supported by differences in the BTs and source region analysis. The apparent local influence on CO and HOA is not specifically addressed by the satellite and BT analysis, except to confirm that there were no local BB sources immediately upwind of PA at this time. In a broad sense, these results highlight the importance of integrating ground-based monitors, including permanent in situ air quality monitoring networks, intensive deployments and satellite observations to understand the impact of smoke on surface air quality.
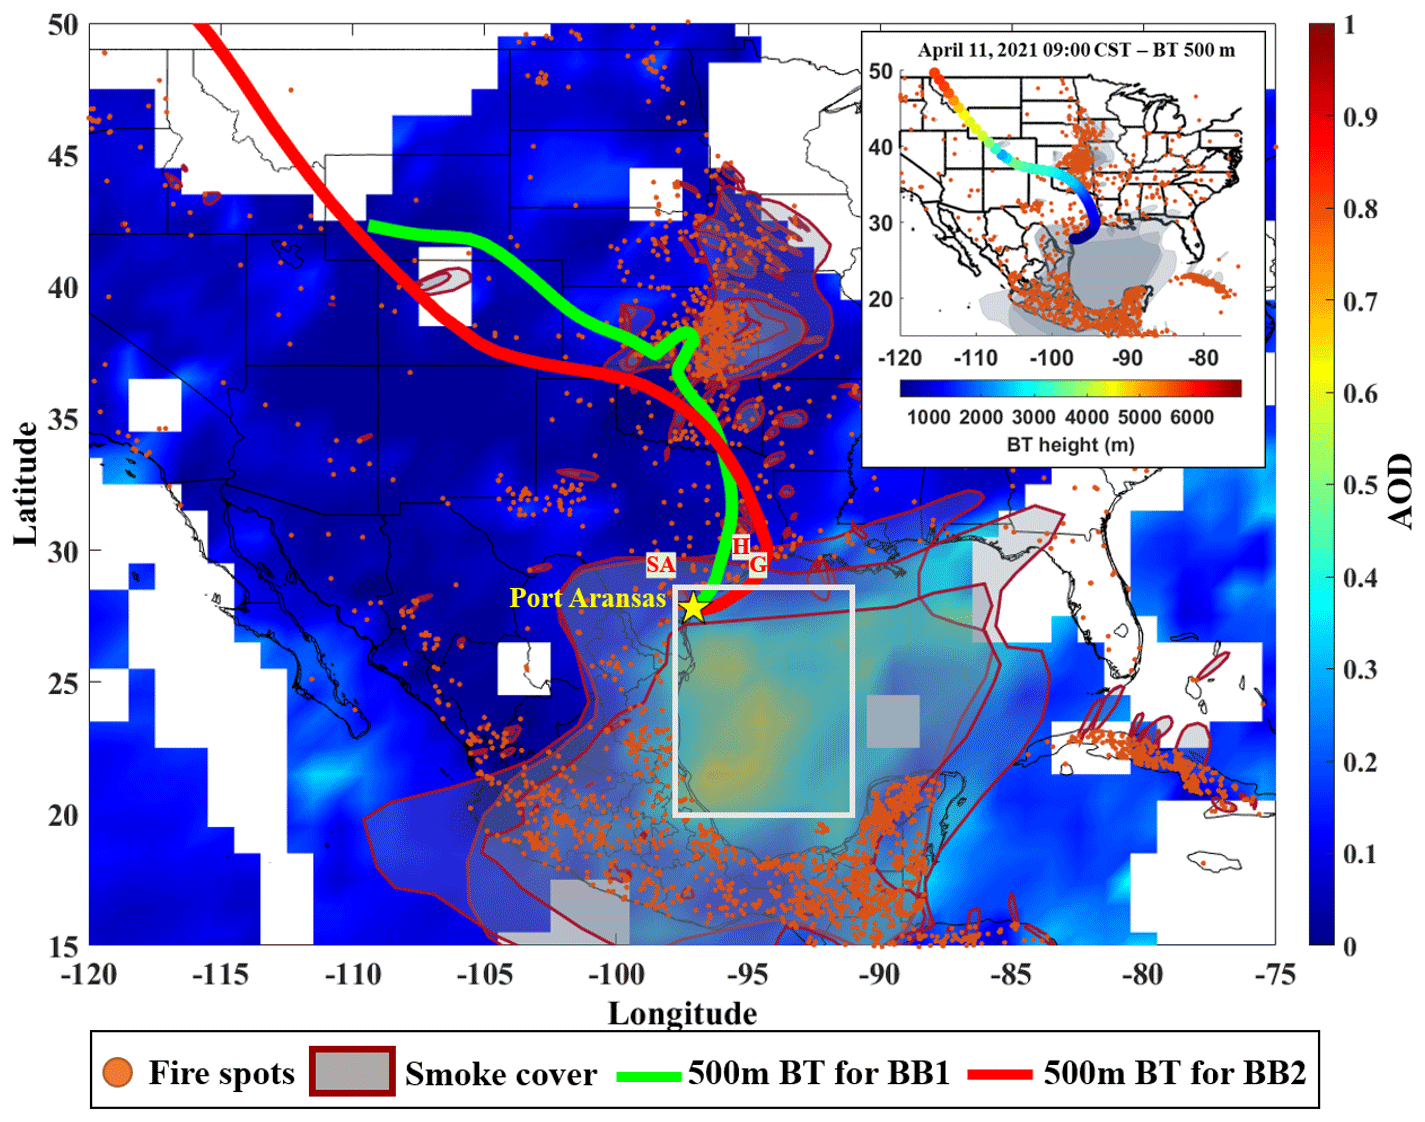
Figure 4Spatial distribution of average AOD from the Aqua and Terra satellites (10–11 April 2021). The white outlined box shows the grid size considered for calculating the average AOD. VIIRS active fire, NOAA HMS smoke and BTs are included in the main map and the inset. The inset plot also includes trajectory heights. The end times of the BTs are chosen to represent the middle of the BB1 (10 April 2021, 20:00 CST) and BB2 (11 April 2021, 09:00 CST) observed in the ground-based measurement. The study site PA is denoted by a yellow star symbol. H, G and SA represent the geolocations of other major cities in Texas (Houston, Galveston and San Antonio, respectively). This map was created in MATLAB.
3.3 Aerosol chemical composition during biomass burning events
To further characterize the two BB events at PA, we assessed the chemical speciation and the particle-size-based OA composition from the HR-ToF-AMS. Figures 5 and S5 provide an overview of the aerosol composition from 9 to 11 April. Differences in composition among marine background, continental air mass and the two BB events are used here both to validate the BB designation and to further characterize the BB plume.
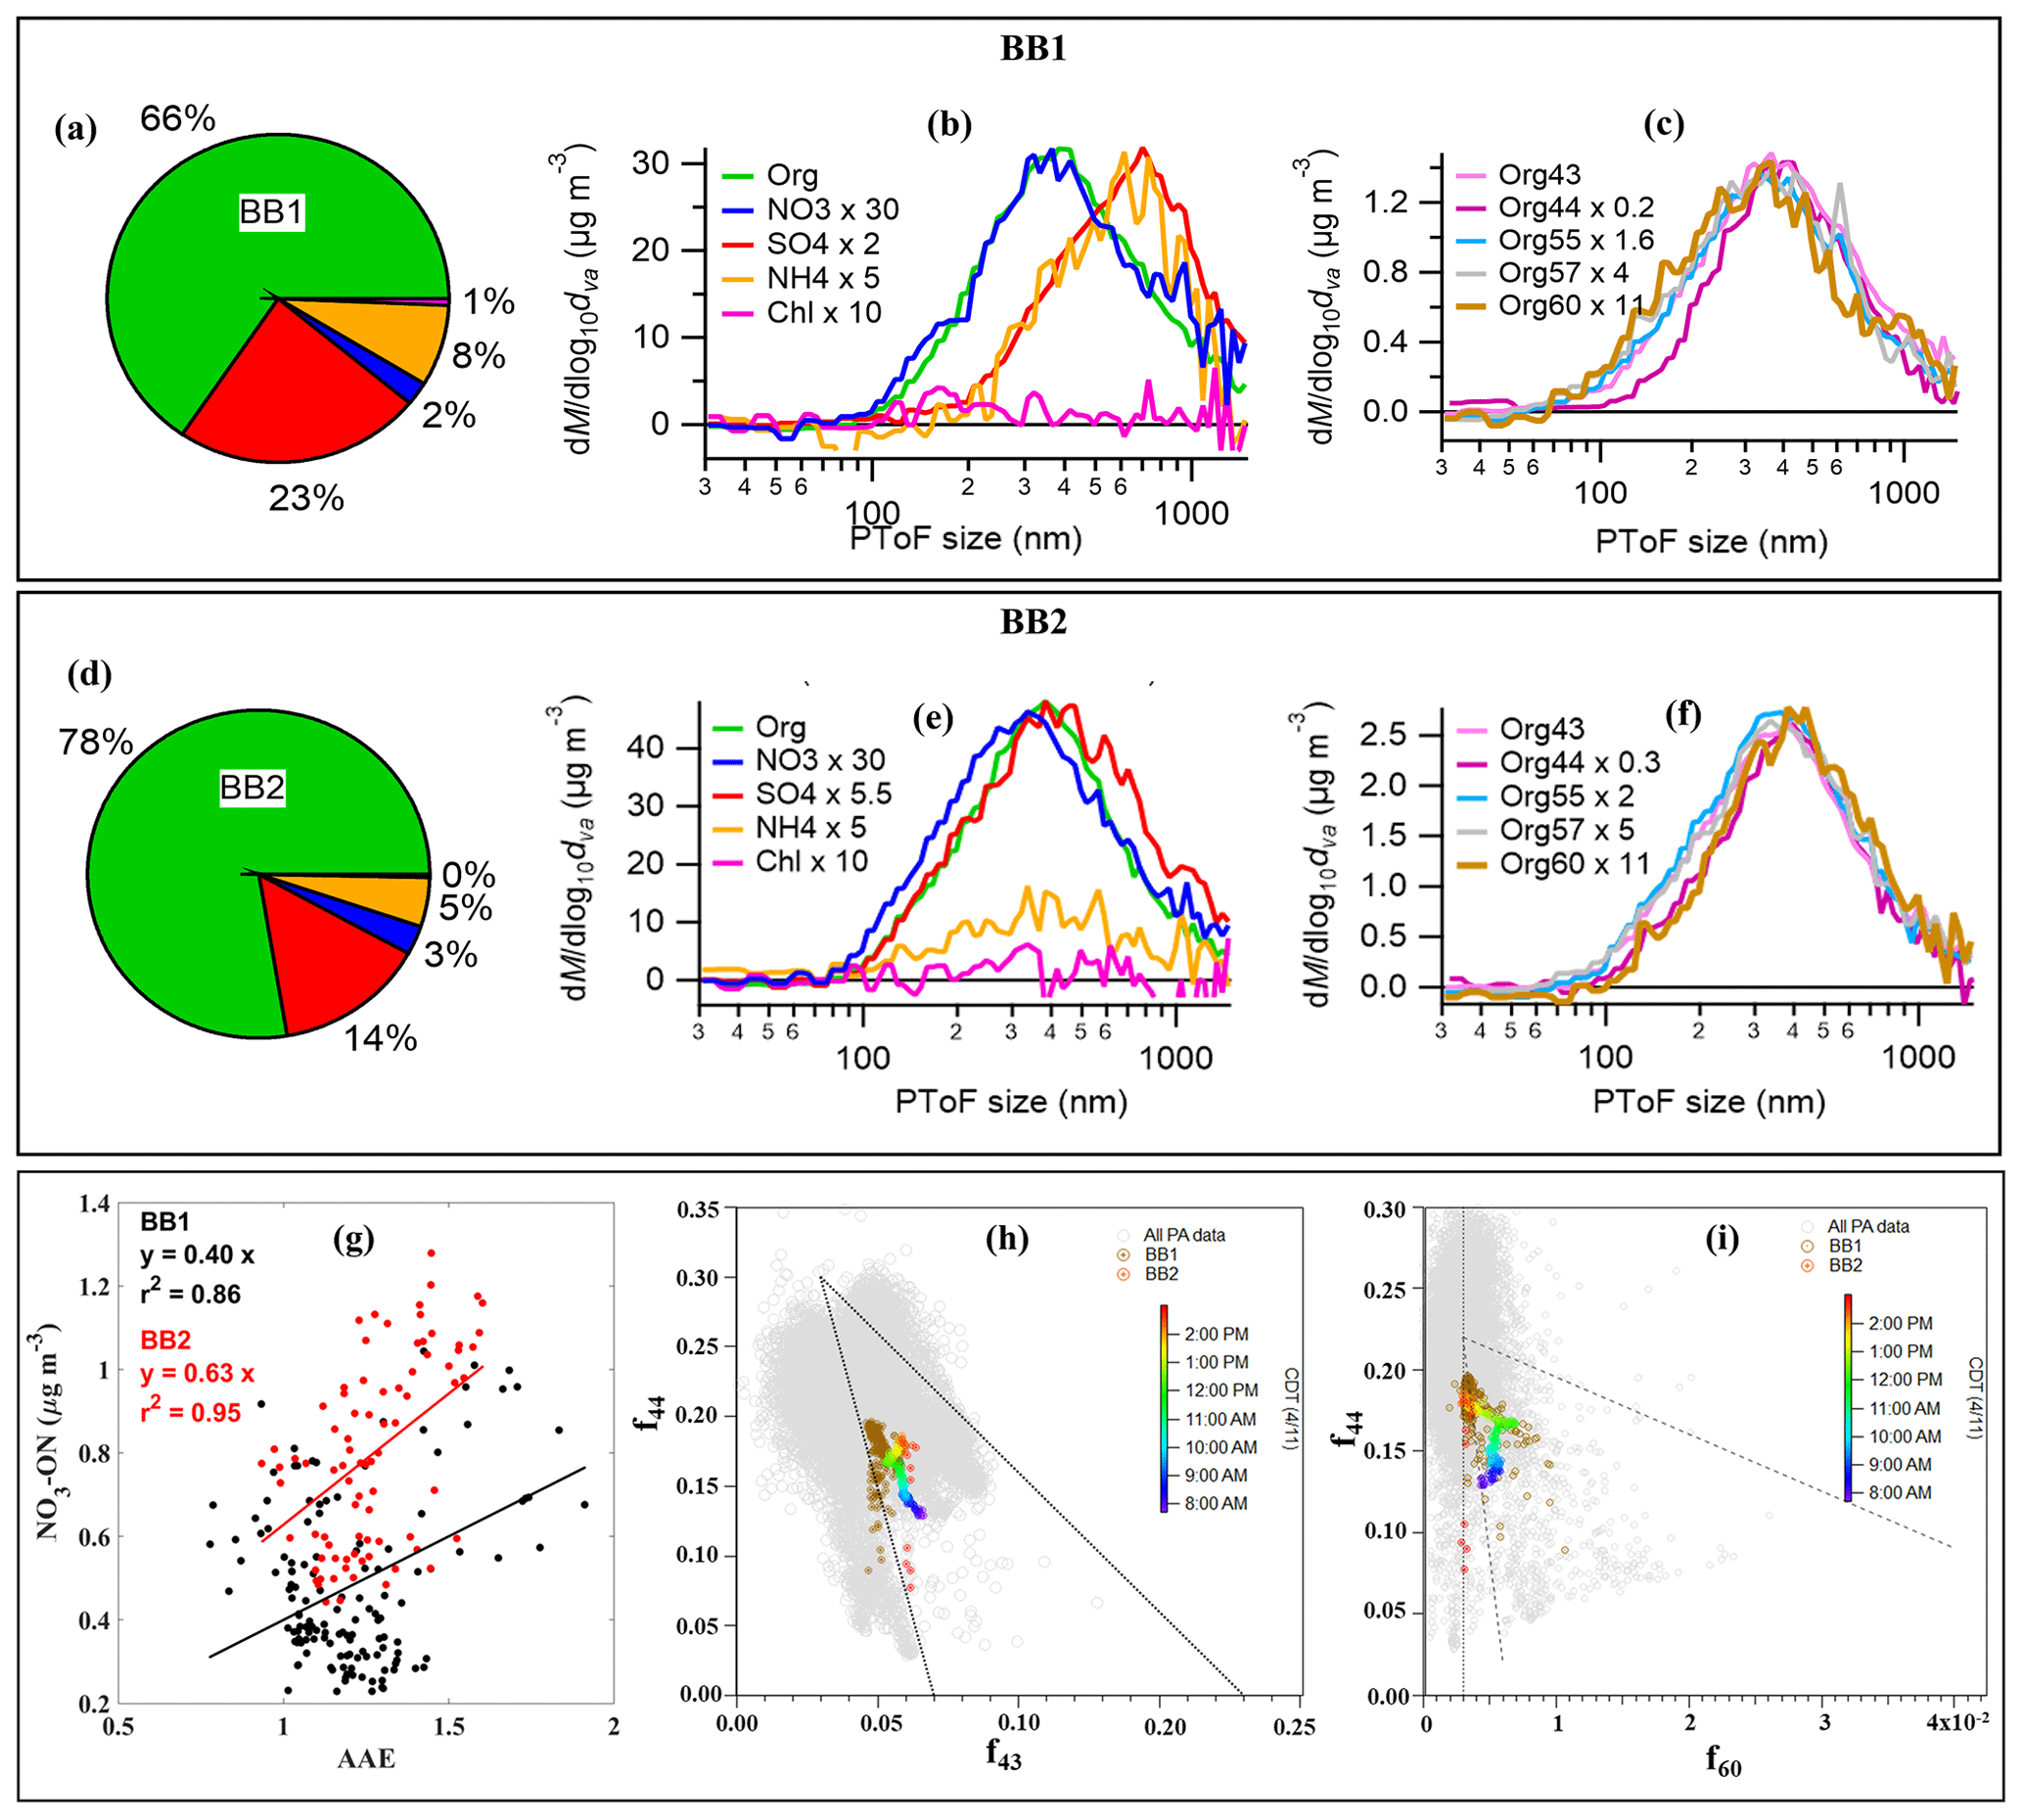
Figure 5(a) Pie chart showing NR-PM1 composition during BB1. (b, c) Average particle time-of-flight (PToF) size distribution of NR-PM1 species and select organic s during BB1. (d) Pie chart showing NR-PM1 composition during BB2. (e, f) Average size distribution of NR-PM1 species and select organic s during BB2. (g) Scatter plot of NO3-ON vs. AAE during BB1 and BB2. Scatter plots of (h) f44 vs. f43 and (i) f44 vs. f60, where BB2 data are colored as a function of time of day and the grey markers correspond to the measured OA during this study. The triangular boundaries in panels (h) and (i) represent the ranges set by Cubison et al. (2011) and Ng et al. (2010). The vertical dashed line in panel (i) denotes f60=0.003. In the pie charts (a, d) are organics (in green), nitrates (in blue), sulfates (in red), ammonium (in yellow) and chloride (in magenta).
Previous studies have shown a significant increase in NR-PM1 concentrations during BB events when the plumes are relatively fresh and the sampling locations do not have immediate anthropogenic sources (Zhou et al., 2017; Hu et al., 2016). In contrast, the average NR-PM1 concentrations for this study were similar amongst BB1 (27.84 ± 6.53 µg m−3), BB2 (33.96 ± 6.53 µg m−3), marine background (27.59 ± 8.82 µg m−3) and continental air mass (24.17 ± 9.42 µg m−3). This result is consistent with the scattering coefficient measurements discussed in Sect. 3.1. These observations indicated that marine air masses at PA were highly polluted with a submicron aerosol loading that included contributions from anthropogenic activities in the Gulf of Mexico (Zhou et al., 2023) and that the dilute BB plumes did not enhance the absolute aerosol concentration at the surface. Although the total NR-PM1 concentrations were similar, the aerosol compositions changed drastically among the BB events, marine background and continental air mass. During the BB events, organics dominated the aerosol composition (66 % and 78 % of NR-PM1 during BB1 and BB2, respectively). The OA fraction was enhanced during BB1 and BB2 compared to the marine background (29 % of NR-PM1) and continental air mass (49 % of NR-PM1). The OA fraction in the BB depends on the fuel burned and the stage of the fire (i.e., smoldering and flaming), together with evolution during the transport. Generally, high values of OA fractions (greater than 90 %) have been reported for forest fires in the Amazon (Artaxo et al., 2013), North America (Kondo et al., 2011; Zhou et al., 2017) and Africa (Capes et al., 2008). Slightly lower OA fractions (∼60 %–70 %) have been reported in Asia (Chakraborty et al., 2015; Kondo et al., 2011). Notably, the OA fractions observed during the BB events during this study are comparable to those reported for the Yucatán fires (60 ± 11 %) (Yokelson et al., 2009). We assume that the moderate range of OA fractions in this study compared to the freshly emitted BB emissions is due to boundary layer mixing of the BB plume with local emissions and aging during transport, as evidenced by the NR-PM1 composition.
The background marine NR-PM1 was dominated by sulfate (; 58 % of the total NR-PM1 mass), whereas the fraction was the second-most prevalent constituent of continental air mass (38 % of the total NR-PM1 mass), just slightly lower than the organic fraction (46 % of the total NR-PM1 mass). The fraction of NR-PM1 was significantly lower during BB1 (23.07 ± 3.96 %) and BB2 (14.27 ± 7.32 %) but was still higher than in previous studies from Yucatán (0.89 ± 0.56 %) and Amazon fires (1.95 ± 0.83 %) (Yokelson et al., 2009; Ferek et al., 1998). The forest fires in this region are not a significant source of sulfate aerosol (Collier et al., 2016; Zhou et al., 2017; Yokelson et al., 2009). Zhou et al. (2023) reported that anthropogenic sulfate remained the dominant sulfate source in the Gulf Coast, coastal and continental air masses during the same study, whereas mass concentrations of sea salt sulfate and biogenic sulfate were largest in the Gulf Coast air masses and decreased with increasing continental influences. These results from Zhou et al. (2023) highlighted anthropogenic shipping emissions over the Gulf of Mexico as a major contributor to sulfate at PA during the campaign.
Figure S5 shows that the NR-PM1 composition during the marine background period was dominated by sulfate, and the OA composition was dominated by AS-OOA, while acidic-OOA was also elevated, suggesting influences from processed shipping emissions. During the BB periods, however, organics became the dominant NR-PM1 component and the mass fractional contribution of sulfate aerosol decreased dramatically, while BBOA and MO-OOA increased. This suggests that the OA compositions during the BB periods were predominantly driven by BB plumes; marine anthropogenic activities likely had minimal influence on the non-BB OAs.
The PMF analysis of NR-PM1 can facilitate our characterization of the two different BB events (Figs. 2 and S5). Using both the specific tracers, AAE and f60, in addition to the PMF results, we see interesting differences between BB1 and BB2. Although AAE, f60, CO and BBOA generally increased during BB1 and BB2, the period from 18:00 to 22:00 CST on 10 April did not show good agreement among the tracers. The HOA and BBOA factors correlated (r2=0.79) during BB1 (Fig. S2), but the BBOA factor did not follow the same trend as the AAE and f60 during this short time period. The HOA factor was mostly associated with fresh or local combustion sources and more closely mimicked the CO trends (discussed in Sect. 3.1) during the time period of BB1, which may again hint that the extreme CO peak on the evening of 10 April was a local combustion source not of BB origin. Interestingly, the MO-OOA factor mirrored some of the more gradual increases seen in the AAE and f60 but not any of the sharp increases. Laboratory experiments and field observations have shown that the mass spectrum of OA from BB becomes increasingly like MO-OOA as it photochemically ages (Hennigan et al., 2011; Grieshop et al., 2009; Zhou et al., 2017). Therefore, aged BB aerosols can contribute to the MO-OOA factor (Bougiatioti et al., 2014). For BB2, all the BB tracers (AAE, f60, BBOA, MO-OOA, CO and eBC) are in good agreement. It seems that, for these BB events, both BBOA and MO-OOA factors are needed to clearly describe the two plumes, while the HOA, CO and AAE facilitate the disentangling of the mixed combustion signal for BB1.
The eight AMS ion families at (in different colors) and the elemental ratios of bulk OA (, , and ) during BB1 and BB2 are included in Fig. S5. During BB1 and BB2, , and were similar ( and 0.58, and 1.34, and and 1.90, respectively). Generally, the ratio ≥ 0.6 and H:C ratio ≥ 1.2 represent highly oxidized and highly saturated air masses (Brito et al., 2014; Brege et al., 2018; Tu et al., 2016; Zhou et al., 2017). Therefore, the observed elemental ratios during BB1 and BB2 in this study tend to agree well with the processed or oxidized air mass as reported in aged smoke plumes. Also, as evident in the MO-OOA factor, the consistency in elemental ratios between BB1 and BB2 shows that, regardless of the material burned, aerosols become chemically identical as they age and the smoke plume becomes more diluted (Jimenez et al., 2009; Ng et al., 2010; Brito et al., 2014). Specific fragments can improve understanding of differences in OA composition and processing during BB1 and BB2, especially f44 vs. f43 (Fig. 5h) and f44 vs. f60 (Fig. 5i) (Ng et al., 2010; Cubison et al., 2011). The average f44 values for BB1 (0.17) and BB2 (0.16) were similar, but BB2 had a slightly higher f43 than BB1 (0.059 vs. 0.051), which is consistent with BB2 being primarily composed of an aged BB plume. The two BB events generally overlapped on the f44 vs. f60 space. The progression of f44 vs. f43 and f44 vs. f60 as a function of time elapsed during BB2 is also shown in Fig. 5h and i. The observed direction of the trend during BB2 was similar to previous field studies, showing an increase in f44 and a decrease in f60 due to photochemical aging (Cubison et al., 2011). Previous studies have shown that the increase in f44 with photochemical aging may lead to the production of carboxylic acids (Zhang et al., 2005; Takegawa et al., 2007). There was no discernible temporal progression in these relationships for BB1 (Fig. S5i and j), which is likely due to the presence of mixed sources, including processed BB aerosols from different fire regions (as discussed in Sect. 3.2) and non-BB anthropogenic emissions (as discussed in Sect. 3.1).
Figure 5b, c, e and f show the average size distributions of NR-PM1 species and key organic signals at 43, 44, 55, 57 and 60 during BB1 and BB2. Organic signals 43 and 44 were dominated by C2H3O+, an ion fragment from oxidized organic compounds including aldehydes and ketones, and , an ion fragment from carboxylic acids, whereas 55 and 57 were dominated by and , respectively, which are ion fragments from hydrocarbons. 60 was primarily the AMS BB indicator, , an ion fragment of anhydrous sugar (e.g., levoglucosan). During BB2, the aerosol composition and the organic fragments showed a unimodal distribution, with a mode diameter in the accumulation-mode size range of about 400 nm; the aerosol appears to be internally mixed. This confirms our previous discussion that the oxidized organic compounds ubiquitously dominated the aerosols during BB2, signifying the presence of aged BB emissions (Alfarra et al., 2004; Zhang et al., 2005; Chakraborty et al., 2015). During BB1, the size distribution of total nitrates, OA and organic mass fragments showed a similar distribution peaking at about 400 nm. However, the size distribution of sulfate and ammonium aerosols showed peaks at a significantly larger diameter of about 700 nm, and 60, 55 and 57 showed enhanced signals at condensation mode (∼100–200 nm) compared to those during BB2. Given the difference in the size distribution of aerosol composition during BB1, it appears to be externally mixed. The contribution of sulfate and ammonium to the NR-PM1 composition for BB1 is also much greater than for BB2 (sum of 31 % and 19 %, respectively). The external mixing and the higher contribution of ammonium sulfate likely represent a mixture of organics from aged BB emission with an anthropogenic marine signal (e.g., inclusion of shipping activities and oil and gas extraction as discussed in earlier sections and in Zhou et al., 2023). This marine signal in BB1 may indicate that the Mexican fires transported over the Gulf of Mexico contributed to BB1, while the internal mixing and lack of a marine signal in BB2 may indicate that the central US fires dominated that period. However, the presence of mixed sources of processed BB aerosols and non-BB anthropogenic emissions at PA complicates the size distributions of NR-PM1 composition for both the BB1 and BB2 events, which needs further investigation.
The nitrate fraction of NR-PM1 was similar during BB1 (2 %) and BB2 (3 %). Studies have confirmed that particulate organonitrates (ON) in the atmosphere are closely associated with BB emissions (Joo et al., 2019; Brege et al., 2018; Zhu et al., 2021; Tiitta et al., 2016). In this study, ON was observed and appeared to account for most of the NO+ and (major ions of inorganic and organic nitrates in AMS) signals detected in NR-PM1 during the BB periods. The signal ratios of NO+ and were 7.5 and 7.7 for BB1 and BB2, respectively, substantially higher than the ratio for pure ammonium nitrate particles (RAN=2.38). Based on this information and following the method proposed by Farmer et al. (2010), we estimate that nearly all the NO+ and signals measured during the BB periods (∼92 % and ∼99 % for BB1 and BB2, respectively) were contributed by ON. The nitrate signal measured by the AMS that are attributed to ON, referred to as NO3-ON, had similar trends to AAE and f60 during the BB events (Fig. 2a). There was a clear enhancement in NO3-ON concentrations during the BB1 and BB2 events (0.49 ± 0.20 and 0.79 ± 0.22 µg m−3, respectively) compared to the marine background period (0.21 ± 0.13 µg m−3). ON is a known chromophore and thus likely contributes to the increase in AAEs during BB1 and BB2. Gas-phase compounds like phenols produced during BB can undergo nitrate-mediated oxidation to form aqueous-phase SOA (Xiao et al., 2022). Laboratory studies have demonstrated that aqueous-phase SOAs from BB are chromophores and can influence the aerosol light absorption properties (Pang et al., 2019; Jiang et al., 2021; Smith et al., 2014). Additionally, BB emission can also undergo rapid oxidation by nitric radicals during nighttime to form SOA (Lalchandani et al., 2022). If we assume that the UV absorption from ON was solely responsible for enhancement in AAEs during BB events, we can evaluate the relationship between AAEs and ON during BB1 and BB2 (Fig. 5g). We do see a high correlation between these two during BB1 (r2=0.85) and BB2 (r2=0.95), when the correlation line is forced through zero. Thus, we observe potential indications of BrC as represented by ON during the BB events. This assumption may be an oversimplification, as other BrC compounds may also contribute to the UV absorption in these plumes.
3.4 Application of acetonitrile as a VOC tracer for biomass burning
BB emissions consist of a mixture of organic and inorganic compounds in the gas and aerosol phases (Holzinger et al., 1999). As with the aerosol fraction, there are common VOC markers for BB; acetonitrile has been utilized as a BB tracer in PTR-MS measurements (de Gouw et al., 2003b; Karl et al., 2003; Sinha et al., 2014). BB emissions are a significant component of the global budget of acetonitrile (de Gouw et al., 2003b; Holzinger et al., 1999, 2001). However, studies have highlighted that acetonitrile signals from BB can be convoluted by local vehicular emissions (Guan et al., 2020; Swarthout et al., 2013), coal burning (Jobson et al., 2010; Valach et al., 2014; Inomata et al., 2013) and industrial emissions including oil and gas activities (Cai et al., 2019). In fact, background acetonitrile levels have been reported to vary from ∼100 pptv to above 600 pptv across different regions (Huangfu et al., 2021, and references therein). Therefore, using acetonitrile in an anthropogenically influenced environment like PA requires careful consideration (Huangfu et al., 2021). In this section we evaluate the efficacy of acetonitrile as a BB tracer for dilute plumes on the Gulf Coast of Texas.
During the two BB events identified in this study, the acetonitrile did not follow the same trend as AAE or f60 (Figs. 6a and 2). Acetonitrile had peaks prior to the onset of BB1 and in the early afternoon of 10 April, with relatively low concentrations during BB2. Thus, we hypothesize that the acetonitrile levels at the study site are impacted by emissions from the dense network of on-shore and off-shore oil and gas activities in the PA and Corpus Christi region and/or urban backgrounds in continental air mass regimes (Fig. 1c). To determine whether the acetonitrile mixing ratios associated with the observed BB plumes at PA would exceed the local background, we (i) investigated the geospatial variability of acetonitrile emissions (including industrial and traffic sources) in Corpus Christi by evaluating mobile measurements and (ii) estimated the acetonitrile in the BB events using an enhancement ratio of CO with respect to acetonitrile from the literature (Warneke et al., 2006).

Figure 6(a) Time series for ambient acetonitrile observed during the campaign (in blue) and estimated acetonitrile (in red) using the reorganized equation from Warneke et al. (2006). (b) Box plot showing the acetonitrile concentration measured in the industrial corridor during mobile measurements on drive day 1 (16 April) and drive day 2 (18 April). (c, d) Acetonitrile concentration measured during mobile measurements on 16 and 18 April in Corpus Christi. The location of the major industrial corridor is marked by the green box (c) and the orange box (d). The dashed lines in green and orange (a) represent average acetonitrile concentrations measured in the major industrial corridor during drive days 1 and 2, respectively. The spatial distribution of acetonitrile (c, d) was created in MATLAB.
The mobile measurement shows that, while the ambient acetonitrile concentration varied on a daily basis, acetonitrile concentration was clearly enhanced in the major industrial sector of Corpus Christi (Fig. 6). The acetonitrile concentration in PA did not surpass the average measured acetonitrile from the major industrial sector of Corpus Christi in either BB event (Fig. 6a). These results indicate that local anthropogenic emissions likely enhance the background acetonitrile level in PA. Additional investigation is needed to characterize and define these local sources.
To further test acetonitrile as a BB tracer for this study, we estimated the BB-associated acetonitrile using an orthogonal regression-based equation formulation by Warneke et al. (2006). Because we observed CO enhancement during BB1 and BB2, we reorganized the equation to estimate acetonitrile concentration during the BB events (Eq. 3 below) using the literature-based ERCO-acetonitrile and the ambient CO measurements from our investigation. We acknowledge the limitation of this calculation, which assumes that (i) the entire CO enhancement above the background is from the BB influence and that (ii) 0.36 ± 0.06 ppbv of CO per parts per trillion by volume of acetonitrile is observed in the BB plume in an urban environment. Based on the standard deviation of the reported ERCO-acetonitrile, we estimate that this calculation for BB-related acetonitrile is ∼17 %.
where CO background = 75 ppbv, enhancement ratio (ERCO-acetonitrile) = 0.36 ppbv and acetonitrile background = 0.115 ppbv were used as reported in Warneke et al. (2006).
Figure 6a shows a time series of ambient acetonitrile measured during the campaign and the estimated acetonitrile concentration using the abovementioned Eq. (3). The observed acetonitrile and estimated acetonitrile were similar during BB2, indicating that the observed acetonitrile was potentially influenced by the BB2 plume. However, the estimated acetonitrile did not match the observed acetonitrile during BB1 or during the preceding period of continental influence. The observed acetonitrile was higher than the estimated acetonitrile during the preceding period of continental influence, likely indicating the local industrial sources of acetonitrile as mentioned above. However, on the evening of 10 April, the calculated acetonitrile was well above the ambient acetonitrile levels. This switch to a condition of estimated acetonitrile greater than observed acetonitrile likely indicates a local combustion source that emits CO but does not emit acetonitrile, and it is therefore likely not BB. This analysis highlights that both CO and acetonitrile can be impacted by local sources and specifically that acetonitrile cannot be used as a unique BB tracer for dilute BB plumes when the background acetonitrile level is high due to the presence of local anthropogenic sources. Overall, this study demonstrates that AAE and aerosol composition served as reliable indicators of transported BB plumes in the urban environment.
3.5 Evaluation of additional VOCs and trace gases during biomass burning events
Figure 7 shows the time series of acetonitrile, acetaldehyde, benzene, toluene, formaldehyde (HCHO), O3, NO, NO2 and NOx. Notably, during BB events, benzene and toluene concentrations exhibited significant enhancement above the marine background levels, with increases of 0.23 and 0.19 ppbv (benzene) and 0.25 and 0.33 ppbv (toluene) observed for BB1 and BB2, respectively. Furthermore, elevated levels of NOx were observed during BB events compared to the marine background conditions, with enhancements of 2.81 and 2.49 ppbv noted for BB1 and BB2, respectively. Although the concentrations of these compounds were also slightly elevated above continental air mass periods, the magnitudes were comparatively lower.
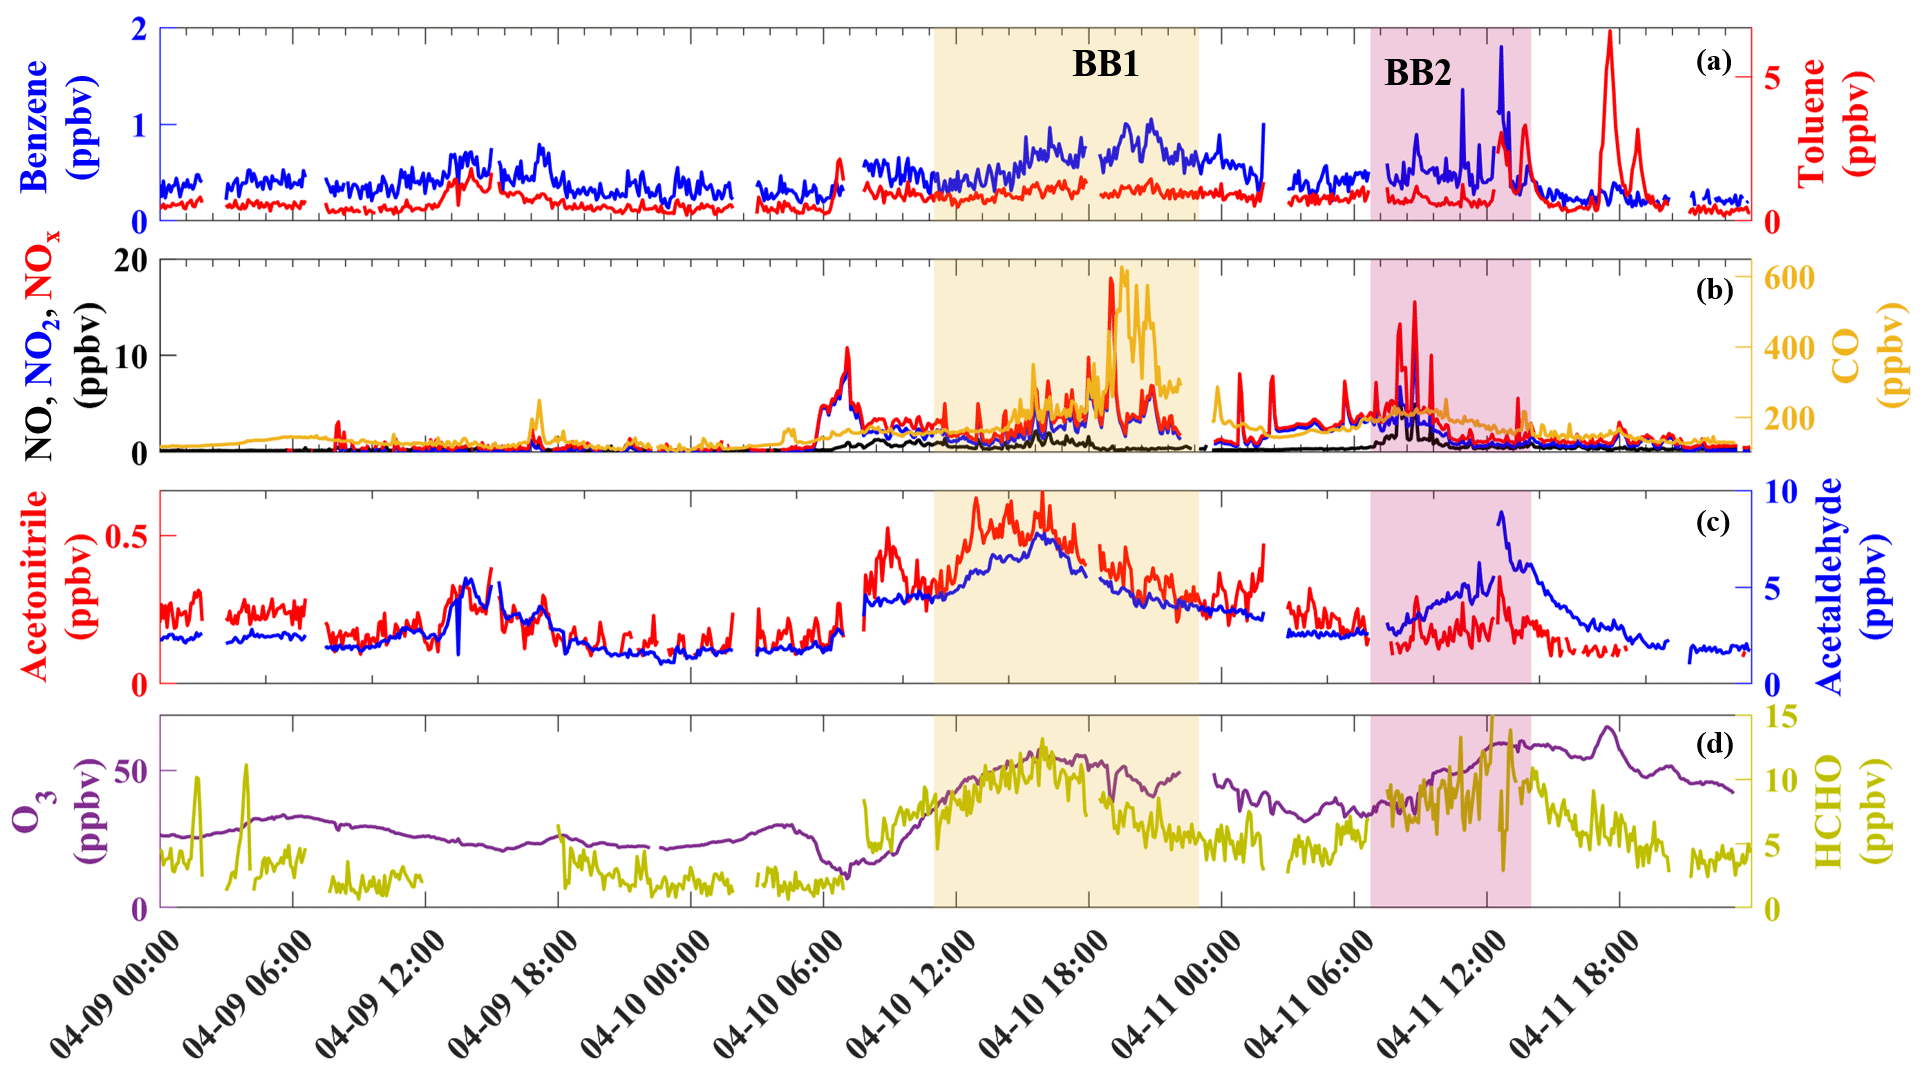
Figure 7Time series of (a) benzene and toluene; (b) NO, NO2, NOx and CO; (c) acetonitrile and acetaldehyde; and (d) O3 and HCHO.
Regarding acetaldehyde and HCHO, their concentrations surpassed the marine background levels; however, their profiles exhibited a photochemical production trend that correlated with the typical behavior observed for O3. It should be noted that the measurement period was characterized by high ambient temperatures, which adds complexity to attributing the elevations of HCHO and acetaldehyde solely to BB plumes but does indicate enhanced photochemical activity within the BB plume. Characterizing VOCs and NOx during dilute BB plumes in an industrialized location is complicated due to the presence of multiple local emission sources and atmospheric processing during the transport. However, the identification of the BB plumes with AAE, AMS-driven PMF factors, f60 and satellite imagery enables attribution of these additional pollutants to the same BB plume.
In addition to acetonitrile, other VOCs like phenols, furans, furfurals and hydrogen cyanide have also been used as BB tracers (Tripathi et al., 2022; Coggon et al., 2016; Bruns et al., 2017). However, these VOCs were not included in the select list of measured compounds. It is known that furans, furfurals and phenols are emitted in higher quantities by biomass burning compared to vehicular emissions, making them potentially important tracers for BB plumes (Mohr et al., 2013; Coggon et al., 2019; Yuan et al., 2017; Wang et al., 2020). However, these compounds exhibit high atmospheric reactivity and undergo secondary transformations. Previous studies have demonstrated the presence of secondary oxidation products of these compounds such as maleic anhydride and nitrophenols in BB plumes (Yuan et al., 2017; Wang et al., 2020). Further, Lalchandani et al. (2022) reported a regional impact of furans from BB, leading to increased levels of SOA precursors such as ammonium nitrate and BBOA. SOA evolutions are remarkably higher during the smoldering than in the flaming phase, due to the higher emission of VOCs (Li et al., 2021). Considering the high atmospheric reactivity and potential for SOA formation of these primary VOCs, further investigations into their secondary oxidized products and the associated SOA are warranted in aged BB plumes. In the current study, the enhancement of MO-OOA, HCHO and acetaldehyde indicates that the plume had undergone photochemical oxidation during transport, which likely would have made the measurement of reactive VOC tracers difficult.
Previous studies have demonstrated that transported BB plumes advected to the surface can contribute to O3 production and lead to exceedances of the National Ambient Air Quality Standard (NAAQS) (Wilkins et al., 2020; Schade et al., 2011; McMillan et al., 2010; Lei et al., 2018; Langford et al., 2015). For instance, transported BB emission was estimated to contribute ∼10 ppbv to 2 O3 exceedance days in Las Vegas during the summer of 2013 (Langford et al., 2015). Similarly, Wilkins et al. (2020) asserted that aged BB plumes were more O3-enriched and reported that aged plumes (4–7 d) contributed, on average, 15 ppbv to surface O3 in the Midwestern US. Lei et al. (2018), McMillan et al. (2010) and Schade et al. (2011) showed the transport of CO and O3 from fires in the US Pacific Northwest to Houston, which then contributed to an O3 exceedance period in the Houston area. These results highlight that BB contribution can be an important factor in urban O3 chemistry.
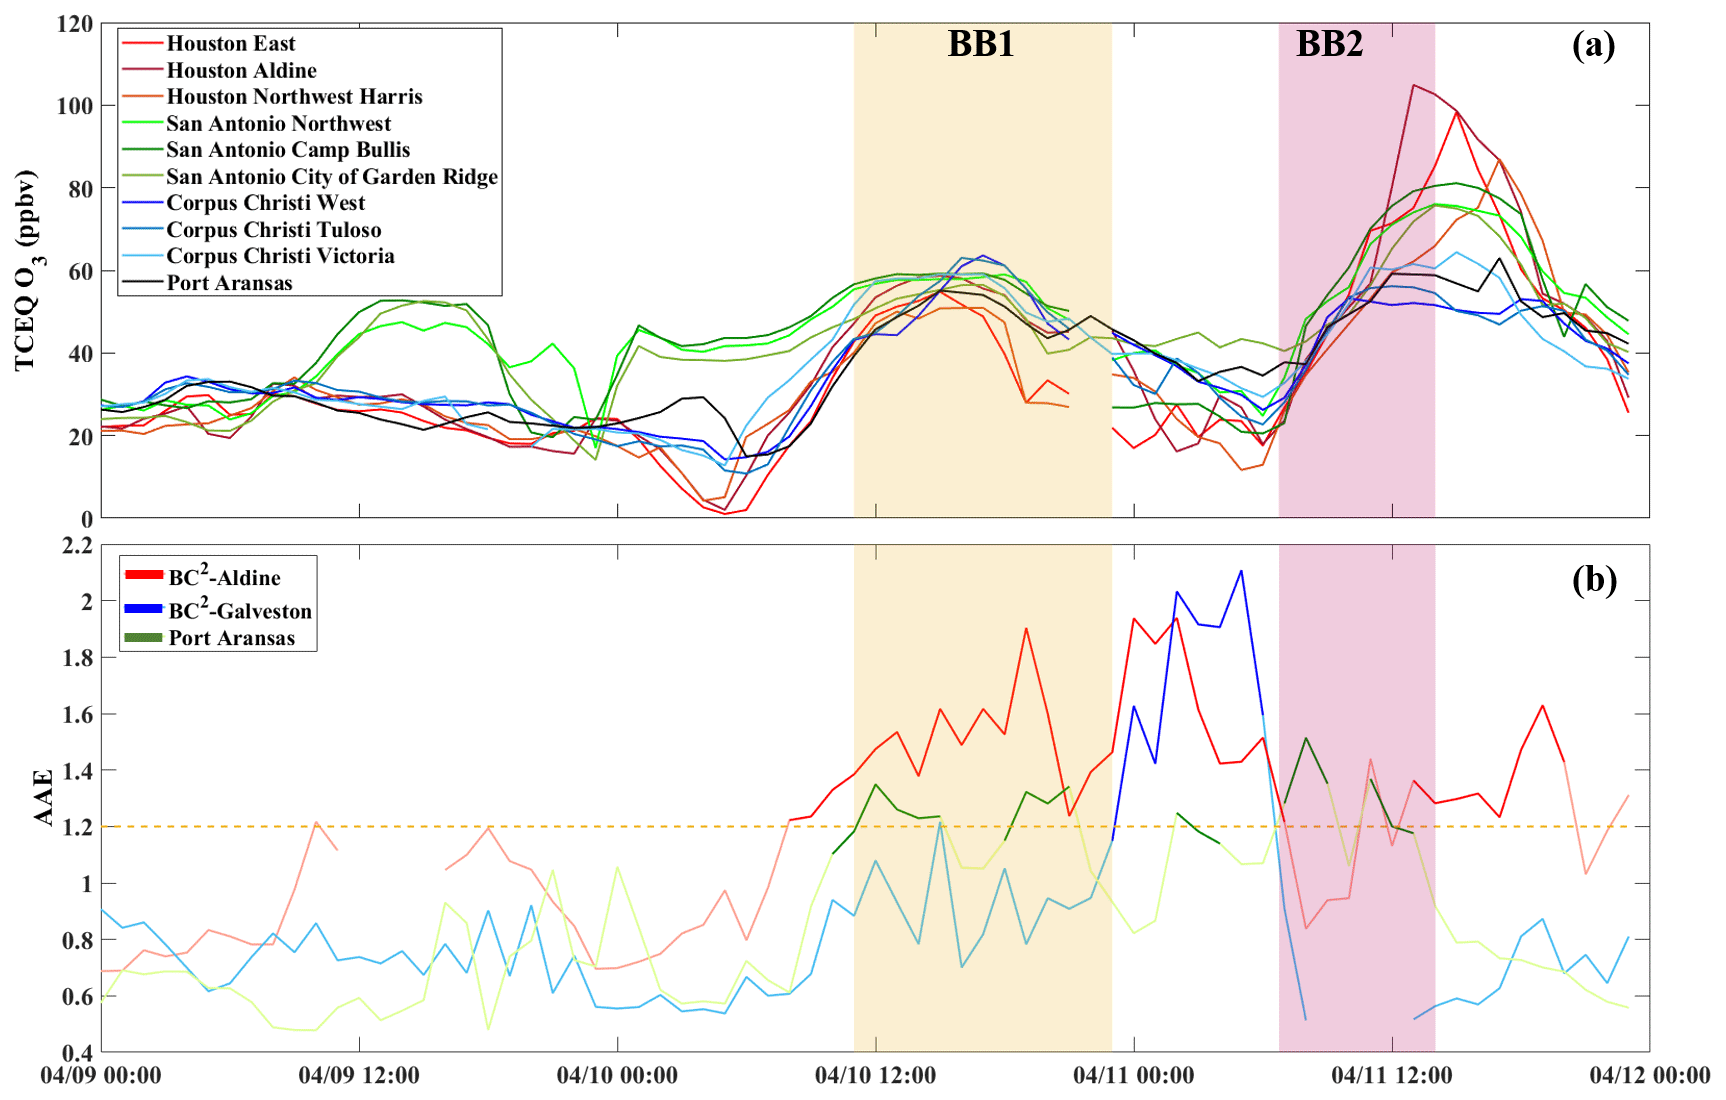
Figure 8Time series of (a) O3 concentrations reported by TCEQ sites and PA (this study). (b) AAE observed at (BC)2 sites in Houston and PA. AAE above the threshold for BB indication (campaign average + 2 standard deviations) is plotted in darker color. Hourly data from the different air quality monitors, including O3 from the TCEQ monitors, are available from the TCEQ website (https://www.tceq.texas.gov/gis/geotam-viewer, last access: 1 August 2023).
During the BB events discussed in this study, the Texas Commission on Environmental Quality (TCEQ) O3 monitors recorded elevated O3 concentrations across southern Texas. Figure 8a shows the time series of O3 concentrations for 9–11 April in southern Texas, including Houston–Galveston, San Antonio and Corpus Christi. Three representative sites from each of these metropolitan areas are plotted to highlight the concurrent enhancement in O3 on those days. There were more than 30 other TCEQ sites that showed elevated O3 concentrations above 65 ppbv during this time period (https://www.tceq.texas.gov/gis/geotam-viewer, last access: 1 August 2023). The presence of smoke in Houston can be evaluated using the Black and Brown Carbon (BC)2 network. (BC)2 is a TCEQ-funded aerosol optical network in Texas operated by our research group that utilizes the same aerosol optical measurement instrumentation as in this study. An elevated AAE was also observed on 10–12 April at (BC)2 in Houston (Fig. 8b). These results indicated that the smoke distribution from the NOAA HMS product (Fig. 4) may have had regional impacts on O3 concentrations across southern Texas. However, accurately estimating the contribution from BB emission to the local O3 enhancement with single-point measurements is difficult (Thompson et al., 2019). Additional investigation of this regional event is needed to confirm the potential BB contribution to urban air quality.
Permanent ground-based air quality monitoring networks play a crucial role in identifying such events but often lack specificity towards identification of BB influence. In this regard, the low-cost aerosol optical measurements in this study exhibited an exceptional ability to identify BB events, even in a dilute plume in an industrialized urban environment. The results of this study support the implementation of an extended network of low-cost aerosol optical measurements to identify the influence of BB plumes, especially in cities that are designated as non-attainment or marginal non-attainment of criteria air pollutants.
The data used in this study can be accessed through the publicly available link https://doi.org/10.18738/T8/DEPG3R (Shrestha et al., 2023).
The supplement related to this article is available online at: https://doi.org/10.5194/acp-23-10845-2023-supplement.
SS, MM, MG, SY, SLA, SZ, FG, CYC, JHF, RJG, SU and RJS participated in the field campaign, including measurements and data quality assurance. SS performed data analysis. RJS supervised the project and data analysis. SS prepared a draft of the manuscript. SS and RJS edited the final version of the manuscript. All the authors reviewed the manuscript and provided inputs for data analysis.
The contact author has declared that none of the authors has any competing interests.
Publisher's note: Copernicus Publications remains neutral with regard to jurisdictional claims in published maps and institutional affiliations.
We would like to thank J. David Felix of Texas A&M Corpus Christi for assistance with the filter sampling at TAMU-CC and Johnathan White of Baylor University for assistance with the organic carbon and elemental carbon (OCEC) analysis. The preparation of this paper was financed through a grant from the Texas Commission on Environmental Quality (TCEQ; grant no. 582-18-81339) administered by the University of Texas at Austin, Center for Energy and Environmental Resources (CEER), through the Air Quality Research Program (AQRP; project no. 20-003). The (BC)2 monitoring in Houston and El Paso in the 2021 ozone season was financed through the TCEQ (grant no. 582-18-81339). The content, findings, opinions and conclusions are the work of the authors and do not necessarily represent findings, opinions or conclusions of the TCEQ or the AQRP. The authors gratefully acknowledge the NOAA Air Resources Laboratory (ARL) for the provision of the HYSPLIT transport and dispersion model and/or the READY website (http://www.ready.noaa.gov, last access: 8 May 2021) used in this publication. The authors acknowledge FracTracer Alliance for the permission to use the GIS map of oil and gas activities in Texas.
This research has been supported by the Texas Commission on Environmental Quality (grant no. 582-18-81339 and project no. 20-003).
This paper was edited by Dantong Liu and reviewed by two anonymous referees.
Alfarra, M. R., Coe, H., Allan, J. D., Bower, K. N., Boudries, H., Canagaratna, M. R., Jimenez, J. L., Jayne, J. T., Garforth, A. A., Li, S.-M., and Worsnop, D. R.: Characterization of urban and rural organic particulate in the Lower Fraser Valley using two Aerodyne Aerosol Mass Spectrometers, Atmos. Environ., 38, 5745–5758, https://doi.org/10.1016/j.atmosenv.2004.01.054, 2004.
Anderson, D. C., Pavelec, J., Daube, C., Herndon, S. C., Knighton, W. B., Lerner, B. M., Roscioli, J. R., Yacovitch, T. I., and Wood, E. C.: Characterization of ozone production in San Antonio, Texas, using measurements of total peroxy radicals, Atmos. Chem. Phys., 19, 2845–2860, https://doi.org/10.5194/acp-19-2845-2019, 2019.
Anderson, T. L. and Ogren, J. A.: Determining Aerosol Radiative Properties Using the TSI 3563 Integrating Nephelometer, Aerosol Sci. Tech., 29, 57–69, https://doi.org/10.1080/02786829808965551, 1998.
Artaxo, P., Rizzo, L. V., Brito, J. F., Barbosa, H. M. J., Arana, A., Sena, E. T., Cirino, G. G., Bastos, W., Martin, S. T., and Andreae, M. O.: Atmospheric aerosols in Amazonia and land use change: from natural biogenic to biomass burning conditions, Faraday Discuss., 165, 203, https://doi.org/10.1039/c3fd00052d, 2013.
Bahadur, R., Praveen, P. S., Xu, Y., and Ramanathan, V.: Solar absorption by elemental and brown carbon determined from spectral observations., P. Natl. Acad. Sci. USA, 109, 17366–17371, https://doi.org/10.1073/pnas.1205910109, 2012.
Bein, K. J., Zhao, Y., Johnston, M. V., and Wexler, A. S.: Interactions between boreal wildfire and urban emissions, J. Geophys. Res., 113, D07304, https://doi.org/10.1029/2007JD008910, 2008.
Bergstrom, R. W., Pilewskie, P., Russell, P. B., Redemann, J., Bond, T. C., Quinn, P. K., and Sierau, B.: Spectral absorption properties of atmospheric aerosols, Atmos. Chem. Phys., 7, 5937–5943, https://doi.org/10.5194/acp-7-5937-2007, 2007.
Berkowitz, C. M., Jobson, B. T., Alexander, M. L., Laskin, A., and Laulainen, N. S.: Aerosol Composition and Morphology during the 2005 Marine Stratus Radiation Aerosol and Drizzle Study, Abstract ID: A13E-05, AGU Fall Meeting Abstracts, https://ui.adsabs.harvard.edu/abs/2005AGUFM.A13E..05B (last access: 1 August 2023), 2005.
Bhattarai, H., Saikawa, E., Wan, X., Zhu, H., Ram, K., Gao, S., Kang, S., Zhang, Q., Zhang, Y., Wu, G., Wang, X., Kawamura, K., Fu, P., and Cong, Z.: Levoglucosan as a tracer of biomass burning: Recent progress and perspectives, Atmos. Res., 220, 20–33, https://doi.org/10.1016/j.atmosres.2019.01.004, 2019.
Bond, T. C. and Bergstrom, R. W.: Light absorption by carbonaceous particles: An investigative review, Aerosol Sci. Tech., 40, 27–67, https://doi.org/10.1080/02786820500421521, 2006.
Bond, T. C., Anderson, T. L., and Campbell, D.: Calibration and Intercomparison of Filter-Based Measurements of Visible Light Absorption by Aerosols, Aerosol Sci. Tech., 30, 582–600, https://doi.org/10.1080/027868299304435, 1999.
Bond, T. C., Covert, D. S., and Müller, T.: Truncation and Angular-Scattering Corrections for Absorbing Aerosol in the TSI 3563 Nephelometer, Aerosol Sci. Tech., 43, 866–871, https://doi.org/10.1080/02786820902998373, 2009.
Bougiatioti, A., Stavroulas, I., Kostenidou, E., Zarmpas, P., Theodosi, C., Kouvarakis, G., Canonaco, F., Prévôt, A. S. H., Nenes, A., Pandis, S. N., and Mihalopoulos, N.: Processing of biomass-burning aerosol in the eastern Mediterranean during summertime, Atmos. Chem. Phys., 14, 4793–4807, https://doi.org/10.5194/acp-14-4793-2014, 2014.
Brege, M., Paglione, M., Gilardoni, S., Decesari, S., Facchini, M. C., and Mazzoleni, L. R.: Molecular insights on aging and aqueous-phase processing from ambient biomass burning emissions-influenced Po Valley fog and aerosol, Atmos. Chem. Phys., 18, 13197–13214, https://doi.org/10.5194/acp-18-13197-2018, 2018.
Brito, J., Rizzo, L. V., Morgan, W. T., Coe, H., Johnson, B., Haywood, J., Longo, K., Freitas, S., Andreae, M. O., and Artaxo, P.: Ground-based aerosol characterization during the South American Biomass Burning Analysis (SAMBBA) field experiment, Atmos. Chem. Phys., 14, 12069–12083, https://doi.org/10.5194/acp-14-12069-2014, 2014.
Bruns, E. A., Slowik, J. G., El Haddad, I., Kilic, D., Klein, F., Dommen, J., Temime-Roussel, B., Marchand, N., Baltensperger, U., and Prévôt, A. S. H.: Characterization of gas-phase organics using proton transfer reaction time-of-flight mass spectrometry: fresh and aged residential wood combustion emissions, Atmos. Chem. Phys., 17, 705–720, https://doi.org/10.5194/acp-17-705-2017, 2017.
Buysse, C. E., Kaulfus, A., Nair, U., and Jaffe, D. A.: Relationships between Particulate Matter, Ozone, and Nitrogen Oxides during Urban Smoke Events in the Western US, Environ. Sci. Technol., 53, 12519–12528, https://doi.org/10.1021/acs.est.9b05241, 2019.
Cai, S., Zhu, L., Wang, S., Wisthaler, A., Li, Q., Jiang, J., and Hao, J.: Time-Resolved Intermediate-Volatility and Semivolatile Organic Compound Emissions from Household Coal Combustion in Northern China, Environ. Sci. Technol., 53, 9269–9278, https://doi.org/10.1021/acs.est.9b00734, 2019.
Cao, C., De Luccia, F. J., Xiong, X., Wolfe, R., and Weng, F.: Early On-Orbit Performance of the Visible Infrared Imaging Radiometer Suite Onboard the Suomi National Polar-Orbiting Partnership (S-NPP) Satellite, IEEE T. Geosci. Remote, 52, 1142–1156, https://doi.org/10.1109/TGRS.2013.2247768, 2014.
Capes, G., Johnson, B., McFiggans, G., Williams, P. I., Haywood, J., and Coe, H.: Aging of biomass burning aerosols over West Africa: Aircraft measurements of chemical composition, microphysical properties, and emission ratios, J. Geophys. Res., 113, D00C15, https://doi.org/10.1029/2008JD009845, 2008.
Chakraborty, A., Bhattu, D., Gupta, T., Tripathi, S. N., and Canagaratna, M. R.: Real-time measurements of ambient aerosols in a polluted Indian city: Sources, characteristics, and processing of organic aerosols during foggy and nonfoggy periods, J. Geophys. Res.-Atmos., 120, 9006–9019, https://doi.org/10.1002/2015JD023419, 2015.
Coggon, M. M., Veres, P. R., Yuan, B., Koss, A., Warneke, C., Gilman, J. B., Lerner, B. M., Peischl, J., Aikin, K. C., Stockwell, C. E., Hatch, L. E., Ryerson, T. B., Roberts, J. M., Yokelson, R. J., and de Gouw, J. A.: Emissions of nitrogen-containing organic compounds from the burning of herbaceous and arboraceous biomass: Fuel composition dependence and the variability of commonly used nitrile tracers, Geophys. Res. Lett., 43, 9903–9912, https://doi.org/10.1002/2016GL070562, 2016.
Coggon, M. M., Lim, C. Y., Koss, A. R., Sekimoto, K., Yuan, B., Gilman, J. B., Hagan, D. H., Selimovic, V., Zarzana, K. J., Brown, S. S., Roberts, J. M., Müller, M., Yokelson, R., Wisthaler, A., Krechmer, J. E., Jimenez, J. L., Cappa, C., Kroll, J. H., de Gouw, J., and Warneke, C.: OH chemistry of non-methane organic gases (NMOGs) emitted from laboratory and ambient biomass burning smoke: evaluating the influence of furans and oxygenated aromatics on ozone and secondary NMOG formation, Atmos. Chem. Phys., 19, 14875–14899, https://doi.org/10.5194/acp-19-14875-2019, 2019.
Collier, S., Zhou, S., Onasch, T. B., Jaffe, D. A., Kleinman, L., Sedlacek, A. J., Briggs, N. L., Hee, J., Fortner, E., Shilling, J. E., Worsnop, D., Yokelson, R. J., Parworth, C., Ge, X., Xu, J., Butterfield, Z., Chand, D., Dubey, M. K., Pekour, M. S., Springston, S., and Zhang, Q.: Regional Influence of Aerosol Emissions from Wildfires Driven by Combustion Efficiency: Insights from the BBOP Campaign, Environ. Sci. Technol., 50, 8613–8622, https://doi.org/10.1021/acs.est.6b01617, 2016.
Costabile, F., Barnaba, F., Angelini, F., and Gobbi, G. P.: Identification of key aerosol populations through their size and composition resolved spectral scattering and absorption, Atmos. Chem. Phys., 13, 2455–2470, https://doi.org/10.5194/acp-13-2455-2013, 2013.
Cubison, M. J., Ortega, A. M., Hayes, P. L., Farmer, D. K., Day, D., Lechner, M. J., Brune, W. H., Apel, E., Diskin, G. S., Fisher, J. A., Fuelberg, H. E., Hecobian, A., Knapp, D. J., Mikoviny, T., Riemer, D., Sachse, G. W., Sessions, W., Weber, R. J., Weinheimer, A. J., Wisthaler, A., and Jimenez, J. L.: Effects of aging on organic aerosol from open biomass burning smoke in aircraft and laboratory studies, Atmos. Chem. Phys., 11, 12049–12064, https://doi.org/10.5194/acp-11-12049-2011, 2011.
de Gouw, J. and Jimenez, J. L.: Organic Aerosols in the Earth's Atmosphere, Environ. Sci. Technol., 43, 7614–7618, https://doi.org/10.1021/es9006004, 2009.
de Gouw, J. A. and Warneke, C.: Measurements of volatile organic compounds in the earth's atmosphere using proton-transfer-reaction mass spectrometry, Mass Spectrom. Rev., 26, 223–257, https://doi.org/10.1002/mas.20119, 2007.
de Gouw, J. A., Warneke, C., Karl, T., Eerdekens, G., van der Veen, C., and Fall, R.: Sensitivity and specificity of atmospheric trace gas detection by proton-transfer-reaction mass spectrometry, Int. J. Mass Spectrom., 223–224, 365–382, https://doi.org/10.1016/S1387-3806(02)00926-0, 2003a.
de Gouw, J. A., Warneke, C., Parrish, D. D., Holloway, J. S., Trainer, M., and Fehsenfeld, F. C.: Emission sources and ocean uptake of acetonitrile (CH3CN) in the atmosphere, J. Geophys. Res.-Atmos., 108, 1–8, https://doi.org/10.1029/2002jd002897, 2003b.
DeCarlo, P. F., Kimmel, J. R., Trimborn, A., Northway, M. J., Jayne, J. T., Aiken, A. C., Gonin, M., Fuhrer, K., Horvath, T., Docherty, K. S., Worsnop, D. R., and Jimenez, J. L.: Field-Deployable, High-Resolution, Time-of-Flight Aerosol Mass Spectrometer, Anal. Chem., 78, 8281–8289, https://doi.org/10.1021/ac061249n, 2006.
Deng, X., Tie, X., Zhou, X., Wu, D., Zhong, L., Tan, H., Li, F., Huang, X., Bi, X., and Deng, T.: Effects of Southeast Asia biomass burning on aerosols and ozone concentrations over the Pearl River Delta (PRD) region, Atmos. Environ., 42, 8493–8501, https://doi.org/10.1016/j.atmosenv.2008.08.013, 2008.
Docherty, K. S., Stone, E. A., Ulbrich, I. M., DeCarlo, P. F., Snyder, D. C., Schauer, J. J., Peltier, R. E., Weber, R. J., Murphy, S. M., Seinfeld, J. H., Grover, B. D., Eatough, D. J., and Jimenez, J. L.: Apportionment of Primary and Secondary Organic Aerosols in Southern California during the 2005 Study of Organic Aerosols in Riverside (SOAR-1), Environ. Sci. Technol., 42, 7655–7662, https://doi.org/10.1021/es8008166, 2008.
Draxler, R. R. and Hess, G. D.: An overview of the HYSPLIT_4 modeling system for trajectories, dispersion, and deposition, Aust. Meteorol. Mag., 47, 295–308, 1998.
Eck, T. F., Holben, B. N., Ward, D. E., Dubovik, O., Reid, J. S., Smirnov, A., Mukelabai, M. M., Hsu, N. C., O'Neill, N. T., and Slutsker, I.: Characterization of the optical properties of biomass burning aerosols in Zambia during the 1997 ZIBBEE field campaign, J. Geophys. Res.-Atmos., 106, 3425–3448, https://doi.org/10.1029/2000JD900555, 2001.
Farmer, D. K., Matsunaga, A., Docherty, K. S., Surratt, J. D., Seinfeld, J. H., Ziemann, P. J., and Jimenez, J. L.: Response of an aerosol mass spectrometer to organonitrates and organosulfates and implications for atmospheric chemistry, P. Natl. Acad. Sci. USA, 107, 6670–6675, https://doi.org/10.1073/pnas.0912340107, 2010.
Ferek, R. J., Reid, J. S., Hobbs, P. V., Blake, D. R., and Liousse, C.: Emission factors of hydrocarbons, halocarbons, trace gases and particles from biomass burning in Brazil, J. Geophys. Res.-Atmos., 103, 32107–32118, https://doi.org/10.1029/98JD00692, 1998.
Fischer, E. V., Zhu, L., Payne, V. H., Worden, J. R., Jiang, Z., Kulawik, S. S., Brey, S., Hecobian, A., Gombos, D., Cady-Pereira, K., and Flocke, F.: Using TES retrievals to investigate PAN in North American biomass burning plumes, Atmos. Chem. Phys., 18, 5639–5653, https://doi.org/10.5194/acp-18-5639-2018, 2018.
Forrister, H., Liu, J., Scheuer, E., Dibb, J., Ziemba, L., Thornhill, K. L., Anderson, B., Diskin, G., Perring, A. E., Schwarz, J. P., Campuzano-Jost, P., Day, D. A., Palm, B. B., Jimenez, J. L., Nenes, A., and Weber, R. J.: Evolution of brown carbon in wildfire plumes, Geophys. Res. Lett., 42, 4623–4630, https://doi.org/10.1002/2015GL063897, 2015.
Forster, C., Wandinger, U., Wotawa, G., James, P., Mattis, I., Althausen, D., Simmonds, P., O'Doherty, S., Jennings, S. G., Kleefeld, C., Schneider, J., Trickl, T., Kreipl, S., Jäger, H., and Stohl, A.: Transport of boreal forest fire emissions from Canada to Europe, J. Geophys. Res.-Atmos., 106, 22887–22906, https://doi.org/10.1029/2001JD900115, 2001.
Fraser, M. P. and Lakshmanan, K.: Using Levoglucosan as a Molecular Marker for the Long-Range Transport of Biomass Combustion Aerosols, Environ. Sci. Technol., 34, 4560–4564, https://doi.org/10.1021/es991229l, 2000.
Grieshop, A. P., Donahue, N. M., and Robinson, A. L.: Laboratory investigation of photochemical oxidation of organic aerosol from wood fires 2: analysis of aerosol mass spectrometer data, Atmos. Chem. Phys., 9, 2227–2240, https://doi.org/10.5194/acp-9-2227-2009, 2009.
Guan, H., Wang, X., Han, R., Yuan, L., Meng, S., Wang, S., and Du, Z.: High-resolution and -precision spectra of acetonitrile at the ν 5-band for laser remote sensing, J. Quant. Spectrosc. Ra., 255, 107254, https://doi.org/10.1016/j.jqsrt.2020.107254, 2020.
Guo, F., Bui, A. A. T., Schulze, B. C., Yoon, S., Shrestha, S., Wallace, H. W., Sakai, Y., Actkinson, B. W., Erickson, M. H., Alvarez, S., Sheesley, R., Usenko, S., Flynn, J., and Griffin, R. J.: Urban core-downwind differences and relationships related to ozone production in a major urban area in Texas, Atmos. Environ., 262, 118624, https://doi.org/10.1016/j.atmosenv.2021.118624, 2021.
Gyawali, M., Arnott, W. P., Lewis, K., and Moosmüller, H.: In situ aerosol optics in Reno, NV, USA during and after the summer 2008 California wildfires and the influence of absorbing and non-absorbing organic coatings on spectral light absorption, Atmos. Chem. Phys., 9, 8007–8015, https://doi.org/10.5194/acp-9-8007-2009, 2009.
He, S. and Carmichael, G. R.: Sensitivity of photolysis rates and ozone production in the troposphere to aerosol properties, J. Geophys. Res.-Atmos., 104, 26307–26324, https://doi.org/10.1029/1999JD900789, 1999.
Hennigan, C. J., Miracolo, M. A., Engelhart, G. J., May, A. A., Presto, A. A., Lee, T., Sullivan, A. P., McMeeking, G. R., Coe, H., Wold, C. E., Hao, W.-M., Gilman, J. B., Kuster, W. C., de Gouw, J., Schichtel, B. A., Collett Jr., J. L., Kreidenweis, S. M., and Robinson, A. L.: Chemical and physical transformations of organic aerosol from the photo-oxidation of open biomass burning emissions in an environmental chamber, Atmos. Chem. Phys., 11, 7669–7686, https://doi.org/10.5194/acp-11-7669-2011, 2011.
Hobbs, P. V., Sinha, P., Yokelson, R. J., Christian, T. J., Blake, D. R., Gao, S., Kirchstetter, T. W., Novakov, T., and Pilewskie, P.: Evolution of gases and particles from a savanna fire in South Africa, J. Geophys. Res.-Atmos., 108, 8485, https://doi.org/10.1029/2002JD002352, 2003.
Hodshire, A. L., Akherati, A., Alvarado, M. J., Brown-Steiner, B., Jathar, S. H., Jimenez, J. L., Kreidenweis, S. M., Lonsdale, C. R., Onasch, T. B., Ortega, A. M., and Pierce, J. R.: Aging Effects on Biomass Burning Aerosol Mass and Composition: A Critical Review of Field and Laboratory Studies, Environ. Sci. Technol., 53, 10007–10022, https://doi.org/10.1021/acs.est.9b02588, 2019.
Holzinger, R., Warneke, C., Hansel, A., Jordan, A., Lindinger, W., Scharffe, D. H., Schade, G., and Crutzen, P. J.: Biomass burning as a source of formaldehyde, acetaldehyde, methanol, acetone, acetonitrile, and hydrogen cyanide, Geophys. Res. Lett., 26, 1161–1164, https://doi.org/10.1029/1999GL900156, 1999.
Holzinger, R., Jordan, A., Hansel, A., and Lindinger, W.: Automobile Emissions of Acetonitrile: Assessment of its Contribution to the Global Source, J. Atmos. Chem., 38, 187–193, https://doi.org/10.1023/A:1006435723375, 2001.
Hu, W., Hu, M., Hu, W.-W., Niu, H., Zheng, J., Wu, Y., Chen, W., Chen, C., Li, L., Shao, M., Xie, S., and Zhang, Y.: Characterization of submicron aerosols influenced by biomass burning at a site in the Sichuan Basin, southwestern China, Atmos. Chem. Phys., 16, 13213–13230, https://doi.org/10.5194/acp-16-13213-2016, 2016.
Huangfu, Y., Yuan, B., Wang, S., Wu, C., He, X., Qi, J., de Gouw, J., Warneke, C., Gilman, J. B., Wisthaler, A., Karl, T., Graus, M., Jobson, B. T., and Shao, M.: Revisiting Acetonitrile as Tracer of Biomass Burning in Anthropogenic-Influenced Environments, Geophys. Res. Lett., 48, e2020GL092322, https://doi.org/10.1029/2020GL092322, 2021.
Hung, W.-T., Lu, C.-H., Shrestha, B., Lin, H.-C., Lin, C.-A., Grogan, D., Hong, J., Ahmadov, R., James, E., and Joseph, E.: The impacts of transported wildfire smoke aerosols on surface air quality in New York State: A case study in summer 2018, Atmos. Environ., 227, 117415, https://doi.org/10.1016/j.atmosenv.2020.117415, 2020.
Inomata, S., Tanimoto, H., Fujitani, Y., Sekimoto, K., Sato, K., Fushimi, A., Yamada, H., Hori, S., Kumazawa, Y., Shimono, A., and Hikida, T.: On-line measurements of gaseous nitro-organic compounds in diesel vehicle exhaust by proton-transfer-reaction mass spectrometry, Atmos. Environ., 73, 195–203, https://doi.org/10.1016/j.atmosenv.2013.03.035, 2013.
Jaffe, D., Chand, D., Hafner, W., Westerling, A., and Spracklen, D.: Influence of Fires on O 3 Concentrations in the Western U. S., Environ. Sci. Technol., 42, 5885–5891, https://doi.org/10.1021/es800084k, 2008.
Jaffe, D. A. and Wigder, N. L.: Ozone production from wildfires: A critical review, Atmos. Environ., 51, 1–10, https://doi.org/10.1016/j.atmosenv.2011.11.063, 2012.
Jaffe, D. A., O'Neill, S. M., Larkin, N. K., Holder, A. L., Peterson, D. L., Halofsky, J. E., and Rappold, A. G.: Wildfire and prescribed burning impacts on air quality in the United States, J. Air Waste Manage., 70, 583–615, https://doi.org/10.1080/10962247.2020.1749731, 2020.
Jefferson, A.: Empirical estimates of CCN from aerosol optical properties at four remote sites, Atmos. Chem. Phys., 10, 6855–6861, https://doi.org/10.5194/acp-10-6855-2010, 2010.
Jiang, W., Misovich, M. V., Hettiyadura, A. P. S., Laskin, A., McFall, A. S., Anastasio, C., and Zhang, Q.: Photosensitized Reactions of a Phenolic Carbonyl from Wood Combustion in the Aqueous Phase – Chemical Evolution and Light Absorption Properties of AqSOA, Environ. Sci. Technol., 55, 5199–5211, https://doi.org/10.1021/acs.est.0c07581, 2021.
Jiang, X., Wiedinmyer, C., and Carlton, A. G.: Aerosols from Fires: An Examination of the Effects on Ozone Photochemistry in the Western United States, Environ. Sci. Technol., 46, 11878–11886, https://doi.org/10.1021/es301541k, 2012.
Jimenez, J. L., Canagaratna, M. R., Donahue, N. M., Prevot, A. S. H., Zhang, Q., Kroll, J. H., DeCarlo, P. F., Allan, J. D., Coe, H., Ng, N. L., Aiken, A. C., Docherty, K. S., Ulbrich, I. M., Grieshop, A. P., Robinson, A. L., Duplissy, J., Smith, J. D., Wilson, K. R., Lanz, V. A., Hueglin, C., Sun, Y. L., Tian, J., Laaksonen, A., Raatikainen, T., Rautiainen, J., Vaattovaara, P., Ehn, M., Kulmala, M., Tomlinson, J. M., Collins, D. R., Cubison, M. J., Dunlea, J., Huffman, J. A., Onasch, T. B., Alfarra, M. R., Williams, P. I., Bower, K., Kondo, Y., Schneider, J., Drewnick, F., Borrmann, S., Weimer, S., Demerjian, K., Salcedo, D., Cottrell, L., Griffin, R., Takami, A., Miyoshi, T., Hatakeyama, S., Shimono, A., Sun, J. Y., Zhang, Y. M., Dzepina, K., Kimmel, J. R., Sueper, D., Jayne, J. T., Herndon, S. C., Trimborn, A. M., Williams, L. R., Wood, E. C., Middlebrook, A. M., Kolb, C. E., Baltensperger, U., and Worsnop, D. R.: Evolution of Organic Aerosols in the Atmosphere, Science, 326, 1525–1529, https://doi.org/10.1126/science.1180353, 2009.
Jobson, B. T. and McCoskey, J. K.: Sample drying to improve HCHO measurements by PTR-MS instruments: laboratory and field measurements, Atmos. Chem. Phys., 10, 1821–1835, https://doi.org/10.5194/acp-10-1821-2010, 2010.
Jobson, B. T., Volkamer, R. A., Velasco, E., Allwine, G., Westberg, H., Lamb, B. K., Alexander, M. L., Berkowitz, C. M., and Molina, L. T.: Comparison of aromatic hydrocarbon measurements made by PTR-MS, DOAS and GC-FID during the MCMA 2003 Field Experiment, Atmos. Chem. Phys., 10, 1989–2005, https://doi.org/10.5194/acp-10-1989-2010, 2010.
Joo, T., Rivera-Rios, J. C., Takeuchi, M., Alvarado, M. J., and Ng, N. L.: Secondary Organic Aerosol Formation from Reaction of 3-Methylfuran with Nitrate Radicals, ACS Earth Sp. Chem., 3, 922–934, https://doi.org/10.1021/acsearthspacechem.9b00068, 2019.
Karl, T., Jobson, T., Kuster, W. C., Williams, E., Stutz, J., Shetter, R., Hall, S. R., Goldan, P., Fehsenfeld, F., and Lindinger, W.: Use of proton-transfer-reaction mass spectrometry to characterize volatile organic compound sources at the La Porte super site during the Texas Air Quality Study 2000, J. Geophys. Res.-Atmos., 108, 1–15, https://doi.org/10.1029/2002jd003333, 2003.
Kasischke, E. S. and Turetsky, M. R.: Recent changes in the fire regime across the North American boreal region – Spatial and temporal patterns of burning across Canada and Alaska, Geophys. Res. Lett., 33, L09703, https://doi.org/10.1029/2006GL025677, 2006.
Kirchstetter, T. W., Novakov, T., and Hobbs, P. V.: Evidence that the spectral dependence of light absorption by aerosols is affected by organic carbon, J. Geophys. Res.-Atmos., 109, 1–12, https://doi.org/10.1029/2004JD004999, 2004.
Kondo, Y., Matsui, H., Moteki, N., Sahu, L., Takegawa, N., Kajino, M., Zhao, Y., Cubison, M. J., Jimenez, J. L., Vay, S., Diskin, G. S., Anderson, B., Wisthaler, A., Mikoviny, T., Fuelberg, H. E., Blake, D. R., Huey, G., Weinheimer, A. J., Knapp, D. J., and Brune, W. H.: Emissions of black carbon, organic, and inorganic aerosols from biomass burning in North America and Asia in 2008, J. Geophys. Res., 116, D08204, https://doi.org/10.1029/2010JD015152, 2011.
Laing, J. R., Jaffe, D. A., and Hee, J. R.: Physical and optical properties of aged biomass burning aerosol from wildfires in Siberia and the Western USA at the Mt. Bachelor Observatory, Atmos. Chem. Phys., 16, 15185–15197, https://doi.org/10.5194/acp-16-15185-2016, 2016.
Laing, J. R., Jaffe, D. A., and Sedlacek III, A. J.: Comparison of Filter-based Absorption Measurements of Biomass Burning Aerosol and Background Aerosol at the Mt. Bachelor Observatory, Aerosol Air Qual. Res., 20, 663–678, https://doi.org/10.4209/aaqr.2019.06.0298, 2020.
Lalchandani, V., Srivastava, D., Dave, J., Mishra, S., Tripathi, N., Shukla, A. K., Sahu, R., Thamban, N. M., Gaddamidi, S., Dixit, K., Ganguly, D., Tiwari, S., Srivastava, A. K., Sahu, L., Rastogi, N., Gargava, P., and Tripathi, S. N.: Effect of Biomass Burning on PM2.5 Composition and Secondary Aerosol Formation During Post-Monsoon and Winter Haze Episodes in Delhi, J. Geophys. Res.-Atmos., 127, e2021JD035232, https://doi.org/10.1029/2021JD035232, 2022.
Langford, A. O., Senff, C. J., Alvarez, R. J., Brioude, J., Cooper, O. R., Holloway, J. S., Lin, M. Y., Marchbanks, R. D., Pierce, R. B., Sandberg, S. P., Weickmann, A. M., and Williams, E. J.: An overview of the 2013 Las Vegas Ozone Study (LVOS): Impact of stratospheric intrusions and long-range transport on surface air quality, Atmos. Environ., 109, 305–322, https://doi.org/10.1016/j.atmosenv.2014.08.040, 2015.
Lei, R., Talbot, R., Wang, Y., Wang, S.-C., and Estes, M.: Influence of Cold Fronts on Variability of Daily Surface O3 over the Houston-Galveston-Brazoria Area in Texas USA during 2003–2016, Atmosphere-Basel, 9, 159, https://doi.org/10.3390/atmos9050159, 2018.
Levy, R. C., Remer, L. A., Mattoo, S., Vermote, E. F., and Kaufman, Y. J.: Second-generation operational algorithm: Retrieval of aerosol properties over land from inversion of Moderate Resolution Imaging Spectroradiometer spectral reflectance, J. Geophys. Res.-Atmos., 112, 2006JD007811, https://doi.org/10.1029/2006JD007811, 2007.
Li, F., Zhang, X., and Kondragunta, S.: Biomass Burning in Africa: An Investigation of Fire Radiative Power Missed by MODIS Using the 375 m VIIRS Active Fire Product, Remote Sens.-Basel, 12, 1561, https://doi.org/10.3390/rs12101561, 2020.
Li, S., Liu, D., Hu, D., Kong, S., Wu, Y., Ding, S., Cheng, Y., Qiu, H., Zheng, S., Yan, Q., Zheng, H., Hu, K., Zhang, J., Zhao, D., Liu, Q., Sheng, J., Ye, J., He, H., and Ding, D.: Evolution of Organic Aerosol From Wood Smoke Influenced by Burning Phase and Solar Radiation, J. Geophys. Res.-Atmos., 126, e2021JD034534, https://doi.org/10.1029/2021JD034534, 2021.
Lindinger, W. and Jordan, A.: Proton-transfer-reaction mass spectrometry (PTR–MS): on-line monitoring of volatile organic compounds at pptv levels, Chem. Soc. Rev., 27, 347, https://doi.org/10.1039/a827347z, 1998.
Liu, D., Li, S., Hu, D., Kong, S., Cheng, Y., Wu, Y., Ding, S., Hu, K., Zheng, S., Yan, Q., Zheng, H., Zhao, D., Tian, P., Ye, J., Huang, M., and Ding, D.: Evolution of Aerosol Optical Properties from Wood Smoke in Real Atmosphere Influenced by Burning Phase and Solar Radiation, Environ. Sci. Technol., 55, 5677–5688, https://doi.org/10.1021/acs.est.0c07569, 2021.
Liu, X., Zhang, Y., Huey, L. G., Yokelson, R. J., Wang, Y., Jimenez, J. L., Campuzano-Jost, P., Beyersdorf, A. J., Blake, D. R., Choi, Y., St. Clair, J. M., Crounse, J. D., Day, D. A., Diskin, G. S., Fried, A., Hall, S. R., Hanisco, T. F., King, L. E., Meinardi, S., Mikoviny, T., Palm, B. B., Peischl, J., Perring, A. E., Pollack, I. B., Ryerson, T. B., Sachse, G., Schwarz, J. P., Simpson, I. J., Tanner, D. J., Thornhill, K. L., Ullmann, K., Weber, R. J., Wennberg, P. O., Wisthaler, A., Wolfe, G. M., and Ziemba, L. D.: Agricultural fires in the southeastern U. S. during SEAC 4 RS: Emissions of trace gases and particles and evolution of ozone, reactive nitrogen, and organic aerosol, J. Geophys. Res.-Atmos., 121, 7383–7414, https://doi.org/10.1002/2016JD025040, 2016.
Markowicz, K. M., Chilinski, M. T., Lisok, J., Zawadzka, O., Stachlewska, I. S., Janicka, L., Rozwadowska, A., Makuch, P., Pakszys, P., Zielinski, T., Petelski, T., Posyniak, M., Pietruczuk, A., Szkop, A., and Westphal, D. L.: Study of aerosol optical properties during long-range transport of biomass burning from Canada to Central Europe in July 2013, J. Aerosol Sci., 101, 156–173, https://doi.org/10.1016/j.jaerosci.2016.08.006, 2016.
Marley, N. A., Gaffney, J. S., Tackett, M., Sturchio, N. C., Heraty, L., Martinez, N., Hardy, K. D., Marchany-Rivera, A., Guilderson, T., MacMillan, A., and Steelman, K.: The impact of biogenic carbon sources on aerosol absorption in Mexico City, Atmos. Chem. Phys., 9, 1537–1549, https://doi.org/10.5194/acp-9-1537-2009, 2009.
Mathur, R.: Estimating the impact of the 2004 Alaskan forest fires on episodic particulate matter pollution over the eastern United States through assimilation of satellite-derived aerosol optical depths in a regional air quality model, J. Geophys. Res., 113, D17302, https://doi.org/10.1029/2007JD009767, 2008.
McMillan, W. W., Pierce, R. B., Sparling, L. C., Osterman, G., McCann, K., Fischer, M. L., Rappenglück, B., Newsom, R., Turner, D., Kittaka, C., Evans, K., Biraud, S., Lefer, B., Andrews, A., and Oltmans, S.: An observational and modeling strategy to investigate the impact of remote sources on local air quality: A Houston, Texas, case study from the Second Texas Air Quality Study (TexAQS II), J. Geophys. Res., 115, D01301, https://doi.org/10.1029/2009JD011973, 2010.
Mehra, M., Panday, A. K., Puppala, S. P., Sapkota, V., Adhikary, B., Pokheral, C. P., and Ram, K.: Impact of local and regional emission sources on air quality in foothills of the Himalaya during spring 2016: An observation, satellite and modeling perspective, Atmos. Environ., 216, 116897, https://doi.org/10.1016/j.atmosenv.2019.116897, 2019.
Mohr, C., Lopez-Hilfiker, F. D., Zotter, P., Prévôt, A. S. H., Xu, L., Ng, N. L., Herndon, S. C., Williams, L. R., Franklin, J. P., Zahniser, M. S., Worsnop, D. R., Knighton, W. B., Aiken, A. C., Gorkowski, K. J., Dubey, M. K., Allan, J. D., and Thornton, J. A.: Contribution of Nitrated Phenols to Wood Burning Brown Carbon Light Absorption in Detling, United Kingdom during Winter Time, Environ. Sci. Technol., 47, 6316–6324, https://doi.org/10.1021/es400683v, 2013.
Morris, G. A., Hersey, S., Thompson, A. M., Pawson, S., Nielsen, J. E., Colarco, P. R., McMillan, W. W., Stohl, A., Turquety, S., Warner, J., Johnson, B. J., Kucsera, T. L., Larko, D. E., Oltmans, S. J., and Witte, J. C.: Alaskan and Canadian forest fires exacerbate ozone pollution over Houston, Texas, on 19 and 20 July 2004, J. Geophys. Res., 111, D24S03, https://doi.org/10.1029/2006JD007090, 2006.
Müller, M., Anderson, B. E., Beyersdorf, A. J., Crawford, J. H., Diskin, G. S., Eichler, P., Fried, A., Keutsch, F. N., Mikoviny, T., Thornhill, K. L., Walega, J. G., Weinheimer, A. J., Yang, M., Yokelson, R. J., and Wisthaler, A.: In situ measurements and modeling of reactive trace gases in a small biomass burning plume, Atmos. Chem. Phys., 16, 3813–3824, https://doi.org/10.5194/acp-16-3813-2016, 2016.
Ng, N. L., Canagaratna, M. R., Zhang, Q., Jimenez, J. L., Tian, J., Ulbrich, I. M., Kroll, J. H., Docherty, K. S., Chhabra, P. S., Bahreini, R., Murphy, S. M., Seinfeld, J. H., Hildebrandt, L., Donahue, N. M., DeCarlo, P. F., Lanz, V. A., Prévôt, A. S. H., Dinar, E., Rudich, Y., and Worsnop, D. R.: Organic aerosol components observed in Northern Hemispheric datasets from Aerosol Mass Spectrometry, Atmos. Chem. Phys., 10, 4625–4641, https://doi.org/10.5194/acp-10-4625-2010, 2010.
O'Neill, N. T., Eck, T. F., Holben, B. N., Smirnov, A., Royer, A., and Li, Z.: Optical properties of boreal forest fire smoke derived from Sun photometry, J. Geophys. Res.-Atmos., 107, AAC 6-1–AAC 6-19, https://doi.org/10.1029/2001JD000877, 2002.
Ogren, J. A.: Comment on “Calibration and Intercomparison of Filter-Based Measurements of Visible Light Absorption by Aerosols,” Aerosol Sci. Tech., 44, 589–591, https://doi.org/10.1080/02786826.2010.482111, 2010.
Ogren, J. A., Wendell, J., Andrews, E., and Sheridan, P. J.: Continuous light absorption photometer for long-term studies, Atmos. Meas. Tech., 10, 4805–4818, https://doi.org/10.5194/amt-10-4805-2017, 2017.
Oltmans, S. J., Lefohn, A. S., Harris, J. M., and Shadwick, D. S.: Background ozone levels of air entering the west coast of the US and assessment of longer-term changes, Atmos. Environ., 42, 6020–6038, https://doi.org/10.1016/j.atmosenv.2008.03.034, 2008.
Paatero, P. and Tapper, U.: Positive matrix factorization: A non-negative factor model with optimal utilization of error estimates of data values, Environmetrics, 5, 111–126, https://doi.org/10.1002/env.3170050203, 1994.
Pandolfi, M., Alados-Arboledas, L., Alastuey, A., Andrade, M., Angelov, C., Artiñano, B., Backman, J., Baltensperger, U., Bonasoni, P., Bukowiecki, N., Collaud Coen, M., Conil, S., Coz, E., Crenn, V., Dudoitis, V., Ealo, M., Eleftheriadis, K., Favez, O., Fetfatzis, P., Fiebig, M., Flentje, H., Ginot, P., Gysel, M., Henzing, B., Hoffer, A., Holubova Smejkalova, A., Kalapov, I., Kalivitis, N., Kouvarakis, G., Kristensson, A., Kulmala, M., Lihavainen, H., Lunder, C., Luoma, K., Lyamani, H., Marinoni, A., Mihalopoulos, N., Moerman, M., Nicolas, J., O'Dowd, C., Petäjä, T., Petit, J.-E., Pichon, J. M., Prokopciuk, N., Putaud, J.-P., Rodríguez, S., Sciare, J., Sellegri, K., Swietlicki, E., Titos, G., Tuch, T., Tunved, P., Ulevicius, V., Vaishya, A., Vana, M., Virkkula, A., Vratolis, S., Weingartner, E., Wiedensohler, A., and Laj, P.: A European aerosol phenomenology – 6: scattering properties of atmospheric aerosol particles from 28 ACTRIS sites, Atmos. Chem. Phys., 18, 7877–7911, https://doi.org/10.5194/acp-18-7877-2018, 2018.
Pang, H., Zhang, Q., Lu, X., Li, K., Chen, H., Chen, J., Yang, X., Ma, Y., Ma, J., and Huang, C.: Nitrite-Mediated Photooxidation of Vanillin in the Atmospheric Aqueous Phase, Environ. Sci. Technol., 53, 14253–14263, https://doi.org/10.1021/acs.est.9b03649, 2019.
Parrish, D. D., Allen, D. T., Bates, T. S., Estes, M., Fehsenfeld, F. C., Feingold, G., Ferrare, R., Hardesty, R. M., Meagher, J. F., Nielsen-Gammon, J. W., Pierce, R. B., Ryerson, T. B., Seinfeld, J. H., and Williams, E. J.: Overview of the Second Texas Air Quality Study (TexAQS II) and the Gulf of Mexico Atmospheric Composition and Climate Study (GoMACCS), J. Geophys. Res., 114, D00F13, https://doi.org/10.1029/2009JD011842, 2009.
Pokhrel, R. P., Wagner, N. L., Langridge, J. M., Lack, D. A., Jayarathne, T., Stone, E. A., Stockwell, C. E., Yokelson, R. J., and Murphy, S. M.: Parameterization of single-scattering albedo (SSA) and absorption Ångström exponent (AAE) with EC / OC for aerosol emissions from biomass burning, Atmos. Chem. Phys., 16, 9549–9561, https://doi.org/10.5194/acp-16-9549-2016, 2016.
Ramanathan, V., Crutzen, P. J., Kiehl, J. T., and Rosenfeld, D.: Aerosols, Climate, and the Hydrological Cycle, Science, 294, 2119–2124, https://doi.org/10.1126/science.1064034, 2001.
Reid, J. S., Eck, T. F., Christopher, S. A., Koppmann, R., Dubovik, O., Eleuterio, D. P., Holben, B. N., Reid, E. A., and Zhang, J.: A review of biomass burning emissions part III: intensive optical properties of biomass burning particles, Atmos. Chem. Phys., 5, 827–849, https://doi.org/10.5194/acp-5-827-2005, 2005.
Remer, L. A., Kaufman, Y. J., Tanré, D., Mattoo, S., Chu, D. A., Martins, J. V., Li, R.-R., Ichoku, C., Levy, R. C., Kleidman, R. G., Eck, T. F., Vermote, E., and Holben, B. N.: The MODIS Aerosol Algorithm, Products, and Validation, J. Atmos. Sci., 62, 947–973, https://doi.org/10.1175/JAS3385.1, 2005.
Rogers, C. M. and Bowman, K. P.: Transport of smoke from the Central American fires of 1998, J. Geophys. Res.-Atmos., 106, 28357–28368, https://doi.org/10.1029/2000JD000187, 2001.
Rogers, H. M., Ditto, J. C., and Gentner, D. R.: Evidence for impacts on surface-level air quality in the northeastern US from long-distance transport of smoke from North American fires during the Long Island Sound Tropospheric Ozone Study (LISTOS) 2018, Atmos. Chem. Phys., 20, 671–682, https://doi.org/10.5194/acp-20-671-2020, 2020.
Rolph, G. D., Draxler, R. R., Stein, A. F., Taylor, A., Ruminski, M. G., Kondragunta, S., Zeng, J., Huang, H.-C., Manikin, G., McQueen, J. T., and Davidson, P. M.: Description and Verification of the NOAA Smoke Forecasting System: The 2007 Fire Season, Weather Forecast., 24, 361–378, https://doi.org/10.1175/2008WAF2222165.1, 2009.
Russell, P. B., Bergstrom, R. W., Shinozuka, Y., Clarke, A. D., DeCarlo, P. F., Jimenez, J. L., Livingston, J. M., Redemann, J., Dubovik, O., and Strawa, A.: Absorption Angstrom Exponent in AERONET and related data as an indicator of aerosol composition, Atmos. Chem. Phys., 10, 1155–1169, https://doi.org/10.5194/acp-10-1155-2010, 2010.
Sakamoto, K. M., Allan, J. D., Coe, H., Taylor, J. W., Duck, T. J., and Pierce, J. R.: Aged boreal biomass-burning aerosol size distributions from BORTAS 2011, Atmos. Chem. Phys., 15, 1633–1646, https://doi.org/10.5194/acp-15-1633-2015, 2015.
Schade, G. W., Khan, S., Park, C., and Boedeker, I.: Rural Southeast Texas Air Quality Measurements during the 2006 Texas Air Quality Study, J. Air Waste Manage., 61, 1070–1081, https://doi.org/10.1080/10473289.2011.608621, 2011.
Schmeisser, L., Andrews, E., Ogren, J. A., Sheridan, P., Jefferson, A., Sharma, S., Kim, J. E., Sherman, J. P., Sorribas, M., Kalapov, I., Arsov, T., Angelov, C., Mayol-Bracero, O. L., Labuschagne, C., Kim, S.-W., Hoffer, A., Lin, N.-H., Chia, H.-P., Bergin, M., Sun, J., Liu, P., and Wu, H.: Classifying aerosol type using in situ surface spectral aerosol optical properties, Atmos. Chem. Phys., 17, 12097–12120, https://doi.org/10.5194/acp-17-12097-2017, 2017.
Schuster, G. L., Dubovik, O., and Holben, B. N.: Angstrom exponent and bimodal aerosol size distributions, J. Geophys. Res.-Atmos., 111, 1–14, https://doi.org/10.1029/2005JD006328, 2006.
Sciare, J., Oikonomou, K., Favez, O., Liakakou, E., Markaki, Z., Cachier, H., and Mihalopoulos, N.: Long-term measurements of carbonaceous aerosols in the Eastern Mediterranean: evidence of long-range transport of biomass burning, Atmos. Chem. Phys., 8, 5551–5563, https://doi.org/10.5194/acp-8-5551-2008, 2008.
Shrestha, S., Puppala, S. P., Adhikary, B., Shrestha, K. L., and Panday, A. K.: Field Measurements for Quantifying Semi-Volatile Aerosol Influence on Physical and Optical Properties of Ambient Aerosols in the Kathmandu Valley, Nepal, Aerosol Air Qual. Res., 18, 1617–1630, https://doi.org/10.4209/aaqr.2017.11.0492, 2018.
Shrestha, S., Yoon, S., Erickson, M. H., Guo, F., Mehra, M., Bui, A. A. T., Schulze, B. C., Kotsakis, A., Daube, C., Herndon, S. C., Yacovitch, T. I., Alvarez, S., Flynn, J. H., Griffin, R. J., Cobb, G. P., Usenko, S., and Sheesley, R. J.: Traffic, transport, and vegetation drive VOC concentrations in a major urban area in Texas, Sci. Total Environ., 838, 155861, https://doi.org/10.1016/j.scitotenv.2022.155861, 2022.
Shrestha, S., Zhou, S., Mehra, M., Guagenti, M., Yoon, S., Alvarez, S. L., Guo, F., Chao, C.-Y., Flynn III, J. H., Wang, Y., Griffin, R. J., Usenko, S., and Sheesley, R. J.: Evaluation of aerosol- and gas-phase tracers for identification of transported biomass burning emissions in an industrially influenced location in Texas, USA, Version V1, Texas Data Repository [data set], https://doi.org/10.18738/T8/DEPG3R, 2023.
Singh, H. B., Cai, C., Kaduwela, A., Weinheimer, A., and Wisthaler, A.: Interactions of fire emissions and urban pollution over California: Ozone formation and air quality simulations, Atmos. Environ., 56, 45–51, https://doi.org/10.1016/j.atmosenv.2012.03.046, 2012.
Sinha, V., Kumar, V., and Sarkar, C.: Chemical composition of pre-monsoon air in the Indo-Gangetic Plain measured using a new air quality facility and PTR-MS: high surface ozone and strong influence of biomass burning, Atmos. Chem. Phys., 14, 5921–5941, https://doi.org/10.5194/acp-14-5921-2014, 2014.
Smith, J. D., Sio, V., Yu, L., Zhang, Q., and Anastasio, C.: Secondary Organic Aerosol Production from Aqueous Reactions of Atmospheric Phenols with an Organic Triplet Excited State, Environ. Sci. Technol., 48, 1049–1057, https://doi.org/10.1021/es4045715, 2014.
Stein, A. F., Draxler, R. R., Rolph, G. D., Stunder, B. J. B., Cohen, M. D., and Ngan, F.: NOAA's HYSPLIT Atmospheric Transport and Dispersion Modeling System, B. Am. Meteorol. Soc., 96, 2059–2077, https://doi.org/10.1175/BAMS-D-14-00110.1, 2015.
Streets, D. G., Yarber, K. F., Woo, J.-H., and Carmichael, G. R.: Biomass burning in Asia: Annual and seasonal estimates and atmospheric emissions, Global Biogeochem. Cy., 17, 1099, https://doi.org/10.1029/2003GB002040, 2003.
Swarthout, R. F., Russo, R. S., Zhou, Y., Hart, A. H., and Sive, B. C.: Volatile organic compound distributions during the NACHTT campaign at the Boulder Atmospheric Observatory: Influence of urban and natural gas sources, J. Geophys. Res.-Atmos., 118, 10614–10637, https://doi.org/10.1002/jgrd.50722, 2013.
Takegawa, N., Miyakawa, T., Kawamura, K., and Kondo, Y.: Contribution of Selected Dicarboxylic and ω-Oxocarboxylic Acids in Ambient Aerosol to the 44 Signal of an Aerodyne Aerosol Mass Spectrometer, Aerosol Sci. Tech., 41, 418–437, https://doi.org/10.1080/02786820701203215, 2007.
Tang, Y., Carmichael, G. R., Uno, I., Woo, J.-H., Kurata, G., Lefer, B., Shetter, R. E., Huang, H., Anderson, B. E., Avery, M. A., Clarke, A. D., and Blake, D. R.: Impacts of aerosols and clouds on photolysis frequencies and photochemistry during TRACE-P: 2. Three-dimensional study using a regional chemical transport model, J. Geophys. Res.-Atmos., 108, 8822, https://doi.org/10.1029/2002JD003100, 2003.
Thompson, A. M., Smit, H. G. J., Witte, J. C., Stauffer, R. M., Johnson, B. J., Morris, G., von der Gathen, P., Van Malderen, R., Davies, J., Piters, A., Allaart, M., Posny, F., Kivi, R., Cullis, P., Hoang Anh, N. T., Corrales, E., Machinini, T., da Silva, F. R., Paiman, G., Thiong'o, K., Zainal, Z., Brothers, G. B., Wolff, K. R., Nakano, T., Stübi, R., Romanens, G., Coetzee, G. J. R., Diaz, J. A., Mitro, S., Mohamad, M., and Ogino, S.-Y.: Ozonesonde Quality Assurance: The JOSIE–SHADOZ (2017) Experience, B. Am. Meteorol. Soc., 100, 155–171, https://doi.org/10.1175/BAMS-D-17-0311.1, 2019.
Tiitta, P., Leskinen, A., Hao, L., Yli-Pirilä, P., Kortelainen, M., Grigonyte, J., Tissari, J., Lamberg, H., Hartikainen, A., Kuuspalo, K., Kortelainen, A.-M., Virtanen, A., Lehtinen, K. E. J., Komppula, M., Pieber, S., Prévôt, A. S. H., Onasch, T. B., Worsnop, D. R., Czech, H., Zimmermann, R., Jokiniemi, J., and Sippula, O.: Transformation of logwood combustion emissions in a smog chamber: formation of secondary organic aerosol and changes in the primary organic aerosol upon daytime and nighttime aging, Atmos. Chem. Phys., 16, 13251–13269, https://doi.org/10.5194/acp-16-13251-2016, 2016.
Titos, G., Jefferson, A., Sheridan, P. J., Andrews, E., Lyamani, H., Alados-Arboledas, L., and Ogren, J. A.: Aerosol light-scattering enhancement due to water uptake during the TCAP campaign, Atmos. Chem. Phys., 14, 7031–7043, https://doi.org/10.5194/acp-14-7031-2014, 2014.
Tripathi, N., Sahu, L. K., Wang, L., Vats, P., Soni, M., Kumar, P., Satish, R. V., Bhattu, D., Sahu, R., Patel, K., Rai, P., Kumar, V., Rastogi, N., Ojha, N., Tiwari, S., Ganguly, D., Slowik, J., Prévôt, A. S. H., and Tripathi, S. N.: Characteristics of VOC Composition at Urban and Suburban Sites of New Delhi, India in Winter, J. Geophys. Res.-Atmos., 127, e2021JD035342, https://doi.org/10.1029/2021JD035342, 2022.
Tu, P., Hall, W. A., and Johnston, M. V.: Characterization of Highly Oxidized Molecules in Fresh and Aged Biogenic Secondary Organic Aerosol, Anal. Chem., 88, 4495–4501, https://doi.org/10.1021/acs.analchem.6b00378, 2016.
Valach, A. C., Langford, B., Nemitz, E., MacKenzie, A. R., and Hewitt, C. N.: Concentrations of selected volatile organic compounds at kerbside and background sites in central London, Atmos. Environ., 95, 456–467, https://doi.org/10.1016/j.atmosenv.2014.06.052, 2014.
Wang, L., Slowik, J. G., Tripathi, N., Bhattu, D., Rai, P., Kumar, V., Vats, P., Satish, R., Baltensperger, U., Ganguly, D., Rastogi, N., Sahu, L. K., Tripathi, S. N., and Prévôt, A. S. H.: Source characterization of volatile organic compounds measured by proton-transfer-reaction time-of-flight mass spectrometers in Delhi, India, Atmos. Chem. Phys., 20, 9753–9770, https://doi.org/10.5194/acp-20-9753-2020, 2020.
Wang, S.-C., Wang, Y., Estes, M., Lei, R., Talbot, R., Zhu, L., and Hou, P.: Transport of Central American Fire Emissions to the U. S. Gulf Coast: Climatological pathways and impacts on ozone and PM2.5, J. Geophys. Res.-Atmos., 123, 8344–8361, https://doi.org/10.1029/2018JD028684, 2018.
Warneke, C., de Gouw, J. A., Stohl, A., Cooper, O. R., Goldan, P. D., Kuster, W. C., Holloway, J. S., Williams, E. J., Lerner, B. M., McKeen, S. A., Trainer, M., Fehsenfeld, F. C., Atlas, E. L., Donnelly, S. G., Stroud, V., Lueb, A., and Kato, S.: Biomass burning and anthropogenic sources of CO over New England in the summer 2004, J. Geophys. Res.-Atmos., 111, D23S15, https://doi.org/10.1029/2005JD006878, 2006.
Westerling, A. L. and Bryant, B. P.: Climate change and wildfire in California, Climatic Change, 87, 231–249, https://doi.org/10.1007/s10584-007-9363-z, 2008.
Westerling, A. L., Hidalgo, H. G., Cayan, D. R., and Swetnam, T. W.: Warming and Earlier Spring Increase Western U. S. Forest Wildfire Activity, Science, 313, 940–943, https://doi.org/10.1126/science.1128834, 2006.
Wilkins, J. L., de Foy, B., Thompson, A. M., Peterson, D. A., Hyer, E. J., Graves, C., Fishman, J., and Morris, G. A.: Evaluation of Stratospheric Intrusions and Biomass Burning Plumes on the Vertical Distribution of Tropospheric Ozone Over the Midwestern United States, J. Geophys. Res.-Atmos., 125, e2020JD032454, https://doi.org/10.1029/2020JD032454, 2020.
Wolfe, R. E., Lin, G., Nishihama, M., Tewari, K. P., Tilton, J. C., and Isaacman, A. R.: Suomi NPP VIIRS prelaunch and on-orbit geometric calibration and characterization, J. Geophys. Res.-Atmos., 118, 11508–11521, https://doi.org/10.1002/jgrd.50873, 2013.
Xiao, Y., Hu, M., Li, X., Zong, T., Xu, N., Hu, S., Zeng, L., Chen, S., Song, Y., Guo, S., and Wu, Z.: Aqueous secondary organic aerosol formation attributed to phenols from biomass burning, Sci. Total Environ., 847, 157582, https://doi.org/10.1016/j.scitotenv.2022.157582, 2022.
Yokelson, R. J., Crounse, J. D., DeCarlo, P. F., Karl, T., Urbanski, S., Atlas, E., Campos, T., Shinozuka, Y., Kapustin, V., Clarke, A. D., Weinheimer, A., Knapp, D. J., Montzka, D. D., Holloway, J., Weibring, P., Flocke, F., Zheng, W., Toohey, D., Wennberg, P. O., Wiedinmyer, C., Mauldin, L., Fried, A., Richter, D., Walega, J., Jimenez, J. L., Adachi, K., Buseck, P. R., Hall, S. R., and Shetter, R.: Emissions from biomass burning in the Yucatan, Atmos. Chem. Phys., 9, 5785–5812, https://doi.org/10.5194/acp-9-5785-2009, 2009.
Yokelson, R. J., Andreae, M. O., and Akagi, S. K.: Pitfalls with the use of enhancement ratios or normalized excess mixing ratios measured in plumes to characterize pollution sources and aging, Atmos. Meas. Tech., 6, 2155–2158, https://doi.org/10.5194/amt-6-2155-2013, 2013.
Yoon, S., Ortiz, S. M., Clark, A. E., Barrett, T. E., Usenko, S., Duvall, R. M., Ruiz, L. H., Bean, J. K., Faxon, C. B., Flynn, J. H., Lefer, B. L., Leong, Y. J., Griffin, R. J., and Sheesley, R. J.: Apportioned primary and secondary organic aerosol during pollution events of DISCOVER-AQ Houston, Atmos. Environ., 244, 117954, https://doi.org/10.1016/j.atmosenv.2020.117954, 2021.
Yuan, Y., Zhao, X., Wang, S., and Wang, L.: Atmospheric Oxidation of Furan and Methyl-Substituted Furans Initiated by Hydroxyl Radicals, J. Phys. Chem. A, 121, 9306–9319, https://doi.org/10.1021/acs.jpca.7b09741, 2017.
Zauscher, M. D., Wang, Y., Moore, M. J. K., Gaston, C. J., and Prather, K. A.: Air Quality Impact and Physicochemical Aging of Biomass Burning Aerosols during the 2007 San Diego Wildfires, Environ. Sci. Technol., 47, 7633–7643, https://doi.org/10.1021/es4004137, 2013.
Zhang, Q., Canagaratna, M. R., Jayne, J. T., Worsnop, D. R., and Jimenez, J. L.: Time- and size-resolved chemical composition of submicron particles in Pittsburgh: Implications for aerosol sources and processes, J. Geophys. Res., 110, D07S09, https://doi.org/10.1029/2004JD004649, 2005.
Zhang, Y.-N., Zhang, Z.-S., Chan, C.-Y., Engling, G., Sang, X.-F., Shi, S., and Wang, X.-M.: Levoglucosan and carbonaceous species in the background aerosol of coastal southeast China: case study on transport of biomass burning smoke from the Philippines, Environ. Sci. Pollut. R., 19, 244–255, https://doi.org/10.1007/s11356-011-0548-7, 2012.
Zhou, S., Collier, S., Jaffe, D. A., Briggs, N. L., Hee, J., Sedlacek III, A. J., Kleinman, L., Onasch, T. B., and Zhang, Q.: Regional influence of wildfires on aerosol chemistry in the western US and insights into atmospheric aging of biomass burning organic aerosol, Atmos. Chem. Phys., 17, 2477–2493, https://doi.org/10.5194/acp-17-2477-2017, 2017.
Zhou, S., Guo, F., Chao, C.-Y., Yoon, S., Alvarez, S. L., Shrestha, S., Flynn, J. H., Usenko, S., Sheesley, R. J., and Griffin, R. J.: Marine Submicron Aerosols from the Gulf of Mexico: Polluted and Acidic with Rapid Production of Sulfate and Organosulfates, Environ. Sci. Technol., 57, 5149–5159, https://doi.org/10.1021/acs.est.2c05469, 2023.
Zhu, Q., Cao, L.-M., Tang, M.-X., Huang, X.-F., Saikawa, E., and He, L.-Y.: Characterization of Organic Aerosol at a Rural Site in the North China Plain Region: Sources, Volatility and Organonitrates, Adv. Atmos. Sci., 38, 1115–1127, https://doi.org/10.1007/s00376-020-0127-2, 2021.