the Creative Commons Attribution 4.0 License.
the Creative Commons Attribution 4.0 License.
 | 26 Sep 2023
Measurement report: Carbonyl sulfide production during dimethyl sulfide oxidation in the atmospheric simulation chamber SAPHIR
Domenico Taraborrelli
Sascha Alber
Birger Bohn
Hans-Peter Dorn
Hendrik Fuchs
Chenxi Qiu
Franz Rohrer
Roberto Sommariva
Fred Stroh
Zhaofeng Tan
Sergej Wedel
Anna Novelli
Carbonyl sulfide (OCS), the most abundant sulfur gas in the Earth's atmosphere, is a greenhouse gas, a precursor to stratospheric sulfate aerosol, and a proxy for terrestrial CO2 uptake. Estimates of important OCS sources and sinks still have significant uncertainties and the global budget is not considered closed. One particularly uncertain source term, the OCS production during the atmospheric oxidation of dimethyl sulfide (DMS) emitted by the oceans, is addressed by a series of experiments in the atmospheric simulation chamber SAPHIR in conditions comparable to the remote marine atmosphere. DMS oxidation was initiated with OH and/or Cl radicals and DMS, OCS, and several oxidation products and intermediates were measured, including hydroperoxymethyl thioformate (HPMTF), which was recently found to play a key role in DMS oxidation in the marine atmosphere. One important finding is that the onset of HPMTF and OCS formation occurred faster than expected from the current chemical mechanisms. In agreement with other recent studies, OCS yields between 9 % and 12 % were observed in our experiments. Such yields are substantially higher than the 0.7 % yield measured in laboratory experiments in the 1990s, which is generally used to estimate the indirect OCS source from DMS in global budget estimates. However, we do not expect the higher yields found in our experiments to directly translate into a substantially higher OCS source from DMS oxidation in the real atmosphere, where conditions are highly variable, and, as pointed out in recent work, heterogeneous HPMTF loss is expected to effectively limit OCS production via this pathway. Together with other experimental studies, our results will be helpful to further elucidate the DMS oxidation chemical mechanism and in particular the paths leading to OCS formation.
- Article
(2540 KB) - Full-text XML
-
Supplement
(1033 KB) - BibTeX
- EndNote


In the Earth's atmosphere, sulfur compounds and aerosols are closely linked: under predominantly oxidizing conditions, sulfur gases are ultimately converted to sulfuric acid (H2SO4), which readily undergoes condensation to small aerosol droplets. With the exception of highly variable volcanic sources, the largest natural sulfur source for the atmosphere by far is oceanic emissions of dimethyl sulfide (DMS) with emission rates of about 28 Tg S a−1 (Lana et al., 2011). The importance of DMS emissions in the context of tropospheric aerosols and clouds and their interactions with the Earth's climate system have been extensively discussed (Charlson et al., 1987; Park et al., 2021; Quinn and Bates, 2011; Sanchez et al., 2018). Barnes et al. (1994) first pointed out the role of DMS as a source of carbonyl sulfide (OCS), the most important non-volcanic source of sulfate aerosol in the stratosphere, which plays an important role for climate (Kremser et al., 2016).
1.1 The atmospheric OCS budget and the search for a “missing source”
Besides contributing 34–66 Gg S a−1 to the stratospheric sulfate aerosol layer (Kremser et al., 2016, and references therein) and being itself a greenhouse gas (Brühl et al., 2012), OCS is considered a valuable tracer to quantify carbon cycle processes (Whelan et al., 2018, and references therein). Its average tropospheric mixing ratio has been relatively constant at around 500 ppt for the last 4 decades suggesting that sources and sinks are approximately balanced. This was in good agreement with a bottom–up OCS budget published by Kettle et al. (2002), but a revision of the largest OCS sink, i.e. the uptake by vegetation and soils (Berry et al., 2013; Sandoval-Soto et al., 2005; Suntharalingam et al., 2008), has led to a gap of a few hundred gigagrams of sulfur per year in budget estimates. The OCS budget and its uncertainties have been reviewed in detail by Kremser et al. (2016) and Whelan et al. (2018), who discuss the possible contributions of marine and anthropogenic emissions and an overestimation of the terrestrial sink for the “missing OCS source”.
Evidence that at least part of the missing source appears to be located over the ocean, and specifically over the tropical Pacific, comes from satellite observations (Glatthor et al., 2015) and inverse modelling studies (Kuai et al., 2015; Ma et al., 2021). OCS cycling in seawater is well understood and the direct oceanic OCS flux is sufficiently constrained, and its uncertainty is too small to explain a significant fraction of the missing source (Lennartz et al., 2021, 2017). The indirect OCS source from CS2 emitted from the ocean and partially converted to OCS in the atmosphere is currently also considered unlikely to fill the gap, although uncertainties in marine CS2 cycling and emissions are larger than for OCS (Lennartz et al., 2021). Another indirect marine OCS source is the production during the DMS oxidation in the atmosphere.
1.2 Atmospheric DMS oxidation: a candidate for the missing OCS source?
In OCS budget estimates, the indirect source of OCS from atmospheric DMS oxidation has been calculated by multiplying the integrated DMS emission inventory (Lana et al., 2011) by a yield of 0.7 % for OCS produced from DMS determined in laboratory experiments (Albu et al., 2008; Barnes et al., 1994, 1996). A higher OCS yield in the remote marine atmosphere has been speculated upon by Lennartz et al. (2017), and recent theoretical (Khan et al., 2021; Wu et al., 2015; Jernigan et al., 2022), laboratory (Jernigan et al., 2022; Ye et al., 2021, 2022; Berndt et al., 2019), and field studies (Veres et al., 2020; Vermeuel et al., 2020) provided new insights into the DMS oxidation mechanism, raising doubts about a globally constant yield of OCS production from DMS.
Based on theoretical calculations, the study by Wu et al. (2015) was the first to point out the potential importance of isomerization reactions in the DMS oxidation scheme under remote conditions at low concentrations of nitrogen oxides (NOx) and peroxy radicals (HO2 and RO2). Wu et al. (2015) proposed an isomerization rate constant of 2.1 s−1 (293 K) for the primary RO2 formed following the OH abstraction of the methyl hydrogen (CH3SCH2O2). This reaction would be the dominant loss process of the RO2 leading to the formation of hydroperoxymethyl thioformate (HPMTF). Several laboratory studies have been carried out to measure this isomerization rate constant, finding values of 0.23 ± 0.12 s−1 (295 K, Berndt et al., 2019), ∼ 0.1 s−1 (298 K, Jernigan et al., 2022), and 0.06 s−1 (298 K, Assaf et al., 2023). Even with the slower isomerization rate of 0.06 s−1, this reaction would still be the dominant reaction path in marine environments where nitric oxide (NO) mixing ratios are typically lower than 0.1 ppb. During the NASA ATom aircraft mission, Veres et al. (2020) measured HPMTF mixing ratios of up to 100 ppt and Vermeuel et al. (2020) observed up to 40 ppt in ground-based measurements in the marine boundary layer, indicating the relevance of the suggested RO2 isomerization pathway in the DMS oxidation in the real atmosphere.
The possibility of OCS formation following the reaction of HPMTF with OH was already suggested by Wu et al. (2015). Recent laboratory experiments (Jernigan et al., 2022; Ye et al., 2022) on the DMS oxidation by OH under low- conditions clearly demonstrated the formation of the HPMTF intermediate in significant quantities and of OCS as a product with a yield of several percent, much higher than the yield of 0.7 % found in all previous experiments (Albu et al., 2008; Barnes et al., 1994, 1996), which were performed at much higher HO2 and RO2 concentrations, possibly preventing the isomerization reactions and the formation of HPMTF.
1.3 Aims of this study
Here, we present results from experiments investigating the DMS oxidation by OH and Cl radicals in the atmospheric simulation chamber SAPHIR. Experiments were performed with both artificial UV radiation sources as well as natural solar radiation at low concentrations of reagents to keep conditions as similar as possible to the marine environment (note that in the real atmosphere, marine aerosols are expected to affect the lifetimes of intermediates including HPMTF; see, for example, Jernigan et al., 2022; Ye et al., 2022). Our approach of monitoring the decay of the DMS concentration and product formation after an initial DMS injection under varying conditions is complementary to the experiments of Jernigan et al. (2022), who employed a smaller dark chamber under a continuous-flow regime. The experiments and instrumentation used to measure relevant species are described in Sect. 2. All measurement results are given in Sect. 3, which also discusses instrument intercomparisons for certain species and implications for data quality and the interpretation of the results. Constraints and open questions with respect to the chemical mechanism that are implied by our results are summarized and briefly discussed in Sect. 4.
2.1 The atmospheric simulation chamber SAPHIR
Experiments were carried out in June 2020 in the atmospheric simulation chamber SAPHIR (Forschungszentrum Jülich), which has a cylindrical shape with a volume of 270 m3. The SAPHIR chamber is designed for the investigation of oxidation processes under atmospheric conditions in a controlled environment. Its double walls, made of Teflon (FEP) film, are transmissive for the entire solar UV and visible spectrum (Bohn and Zilken, 2005), and a shutter system allows for sunlight exposure or cutoff. Permanent flushing of the space between the double walls prevents diffusion of impurities from ambient air into the inner chamber, which is operated with synthetic air produced from evaporated liquid nitrogen and oxygen of highest purity (Linde, purity > 99.99990 %). Two fans in the chamber ensure a complete mixing of trace gases within 2 min. The replenishment flow is controlled to maintain an overpressure of 35 Pa to avoid ambient air penetrating the chamber, leading to a typical dilution of trace gases at a first-order rate constant of approximately s−1 (the actual dilution rate was continuously monitored both via the measured flow through the SAPHIR chamber and by the observed decay of CO2 added to the chamber; see Fig. S7 in the Supplement). More detailed descriptions of the SAPHIR chamber are given in earlier publications (Bohn et al., 2005; Rohrer et al., 2005).
2.2 Details of performed experiments
Four experiments were carried out to study the DMS oxidation and related OCS formation (Table 1). In all the experiments, the chamber was cleaned before the injection of trace gases by exchanging the chamber air 8 to 10 times with pure synthetic air. Evaporated Milli-Q® water was then introduced into the dark chamber by a carrier flow of synthetic air reaching the mixing ratios given in Table 1. In Experiments II–IV, this was followed by the injection of carbon dioxide (CO2, Air Liquide N45, 99.995 % purity, mixing ratio after the injection ∼ 100 ppm) to improve spectral line locking of the OCS instrument.
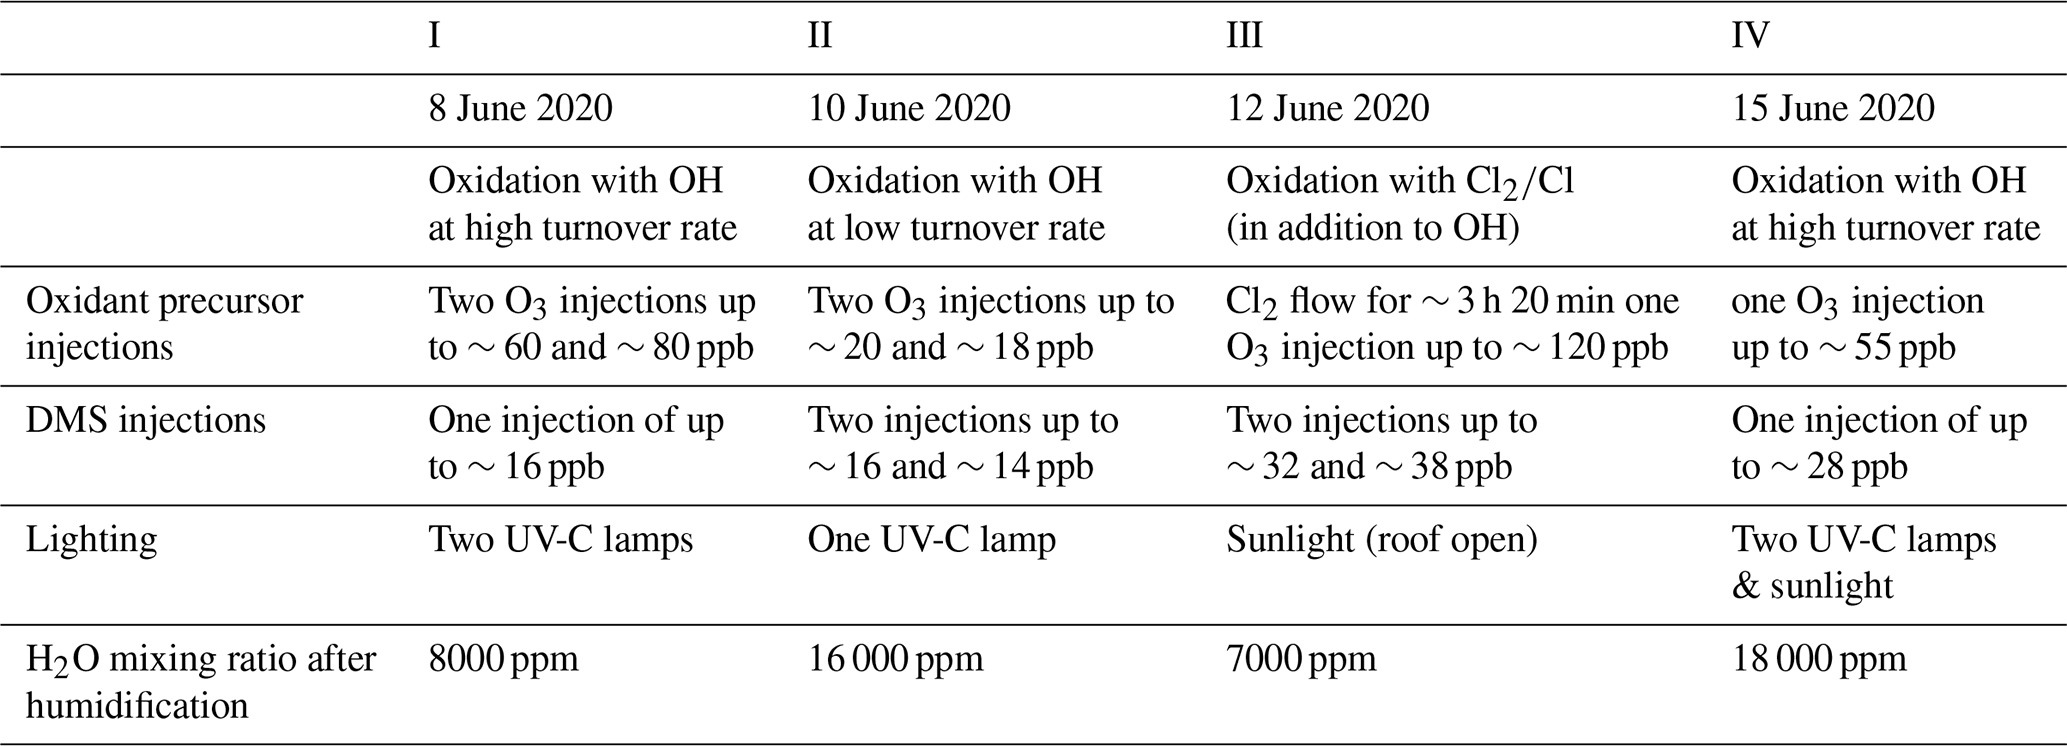
To increase the OH radical concentration in the chamber in Experiments I, II, and IV, OH was generated by the photolysis of added ozone (injected amounts are given in Table 1) and subsequent reaction of O(1D) that reacted with water vapour (H2O). Radiation was provided by UV-C lamps (253.652 nm, Philips TUV 36W SLV/6) and ozone by a silent discharge ozonizer (O3onia). While the high O3 absorption cross section of cm2 at 254 nm allows for substantial photolysis and OH production, other trace gases present in the experiments have absorption cross sections much smaller at 254 nm (DMS cm2; OCS < cm2; SO2 cm2, no photolysis; dimethyl sulfoxide (DMSO) < ; HPMTF has no structure where strong absorption is expected as peroxides and aldehydes absorb little in that spectral range, i.e. on the order of 10−20 cm2), and we do not expect the low-intensity radiation of the lamps to photolyse any of these in a relevant amount. To prevent significant formation of nitrogen oxides (NOx) from HONO, the lamps were the only light source, and the roof was closed for the entire duration of Experiments I and II. The lamps were located in the central part of the chamber, which resulted in an inhomogeneous distribution of the radiation and OH radicals and therefore also of any trace gas produced from the reaction of OH with a lifetime shorter than the mixing time (∼ 2 min). The trace gases relevant for this study (DMS, HPMTF, OCS, and SO2) have a much longer lifetime, so that a homogenous distribution can be assumed. Therefore, the determination of yields and measured concentrations of products were unaffected by the inhomogeneous illumination. Before turning on the lamps, DMS (Sigma-Aldrich, natural, ≥ 99 %) was introduced into the chamber reaching mixing ratios given in Table 1. In Experiment I, the lamps were on for ∼ 8 h, while in Experiment II they were turned off after ∼ 24 h.
Experiment III was designed to study the DMS oxidation by chlorine radicals that may be relevant in the remote marine atmosphere under low-OH conditions. After the injection of water vapour, DMS was injected (up to 40 ppb) and the chamber roof was opened. This allows for OH radicals to be produced from the photolysis of HONO, which is released by the chamber wall upon illumination (Rohrer et al., 2005). After 1 h of an open roof, gaseous chlorine (Cl2, Air Liquide, 10 ppm Cl2 with a purity of 99.8 % and 1 % CO2 with a purity of 99.995 % in N2 with a purity of 99.999 %) was continuously injected for ∼ 3.5 h at a rate of ∼ 1.1 ppb h−1. Its rapid photolysis produced a steady-state concentration of Cl radicals, competing with the OH for the reaction with DMS.
Experiment IV was similar to Experiments I and II: UV-C lamps were used to boost the production of OH radicals. In this experiment, DMS (up to ∼ 30 ppb) was injected when the UV-C lamps were already turned on but before the injection of O3 to investigate whether DMS photolysis is relevant. After 1 h, 50 ppb of O3 were introduced. The lamps were turned on for ∼ 8 h. Three hours and 30 min after the lamp were switched on, the chamber roof was opened for 3 h.
All experiments were designed such that chamber-specific sinks (dilution and wall loss of trace gases) and sources of trace gases that are formed in the sunlit chamber except for nitrous acid did not influence the results.
2.3 Instruments
An overview of the analytical instruments and the parameters measured is given in Table 2. NO and NO2 were measured by chemiluminescence (Eco Physics, TR780); CO, CO2, CH4, and H2O by cavity ring-down spectroscopy (CRDS, Picarro, G2401); and O3 by UV absorption (Ansyco-41M and Thermo scientific-49I). Photolysis frequencies inside the chamber were derived from solar actinic flux densities measured by a spectroradiometer mounted on the roof of the nearby institute building (Bohn et al., 2005; Bohn and Zilken, 2005). Formaldehyde (HCHO) was detected by CRDS (Picarro, G2307, Glowania et al., 2021). DMS was monitored by a proton-transfer-reaction time-of-flight mass spectrometer (PTR-TOF-MS, Ionicon; Jordan et al., 2009), which unfortunately was not calibrated in our experiment for any other sulfur gases that were observed by PTR-TOF-MS in the DMS oxidation experiments by Jernigan et al. (2022) and Ye et al. (2022). Raw signals at ratios where DMSO, DMSO2, CH3SCHO, and CH3SCH2OOH would be expected to show up are shown in Figs. S1–S4, but as these signals are not quantitative and may partly or even entirely be caused by interferences from different organic compounds, they are not considered in the results and discussion below. Cl2 was detected by a chemical ionization mass spectrometer using iodine as a reagent ion (I-CIMS; Sommariva et al., 2018; Tan et al., 2022). The concentrations of OH, HO2, and RO2 radicals were measured by a laser-induced fluorescence (LIF) instrument permanently in use at the SAPHIR chamber and described previously (Holland et al., 2003; Fuchs et al., 2011; Cho et al., 2022), but the LIF OH measurement is only used for Experiment III where the UV lamps were not used. The OH reactivity (kOH), the inverse lifetime of OH, was measured by a pump and probe technique coupled with the time-resolved detection of OH by LP-LIF (laser photolysis–laser- induced fluorescence; Lou et al., 2010; Fuchs et al., 2017). The OH radical together with SO2 and HCHO was also measured by differential optical absorption spectroscopy (DOAS; Dorn et al., 1995; Glowania et al., 2021) in Experiment IV.
Table 2Specification of instruments used in this study. Abbreviations are all spelled out in the text.
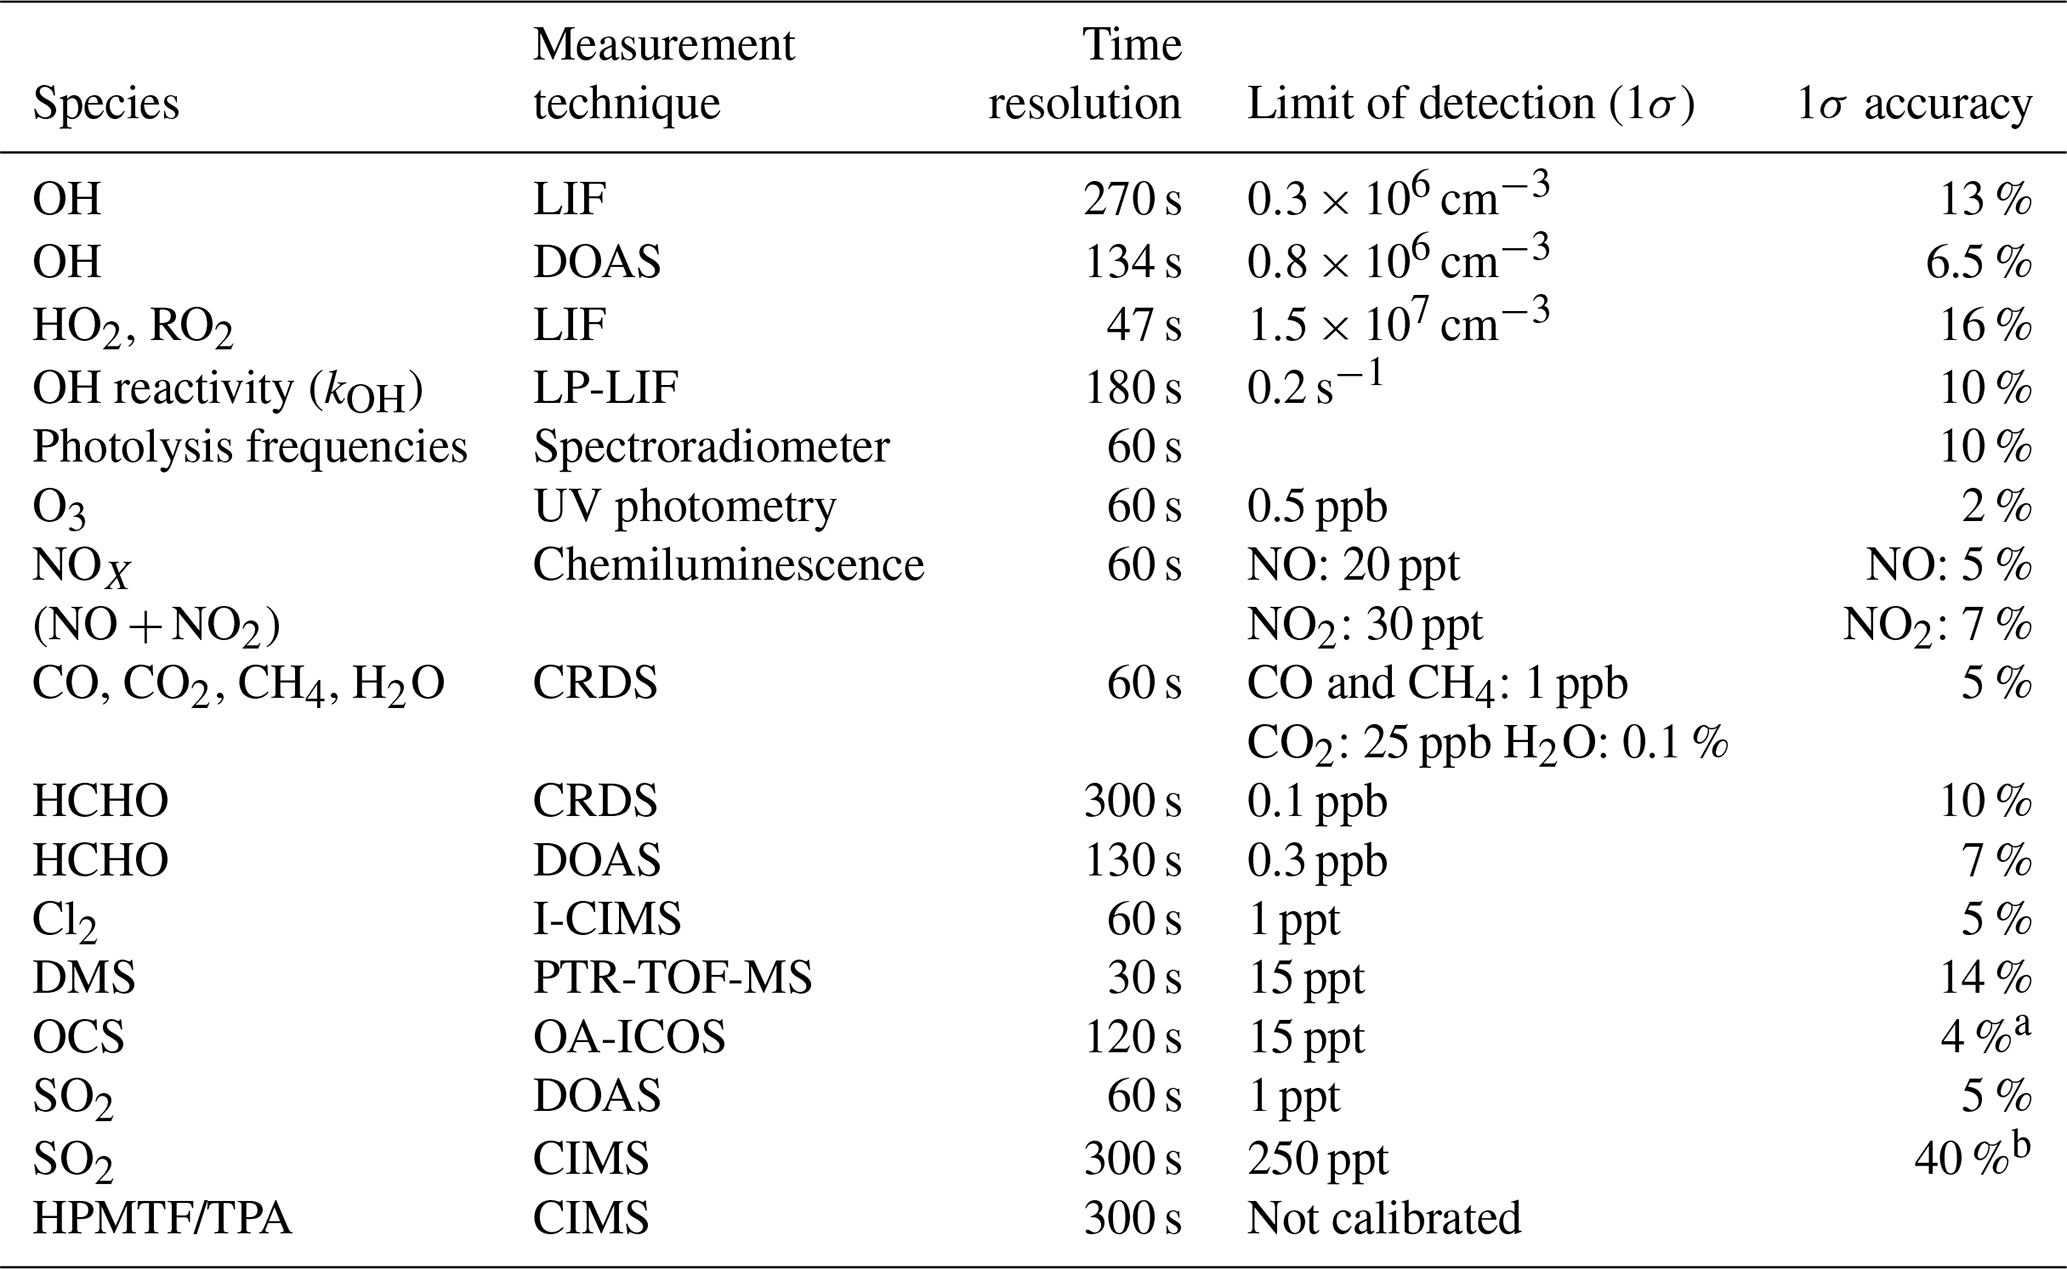
a 30 ppt at OCS < 750 ppt. b 500 ppt at SO2<1250 ppt.
OCS was measured by off-axis integrated cavity output spectroscopy (OA-ICOS; Baer et al., 2002; O'Keefe, 1998; Paul et al., 2001) using a prototype of a commercially available ABB Los Gatos OCS analyser (more details on the instrument are given in Kremser et al., 2021). Air was directly sampled from the SAPHIR chamber through ∼ 8 m and 3/8′′ o.d. Teflon (PTFE) tubing at a mass flow rate of kg s−1. To ensure data quality and determine measurement accuracy and precision particularly for OCS, calibrations were carried out prior to the experiments using calibration standards providing mixing ratios of 0.25–5 ppb prepared with a permeation system as well as a certified standard containing 450 ppt OCS (National Oceanic and Atmospheric Administration NOAA, Boulder, USA).
The Forschungszentrum Jülich GmbH IEK-7 project FunMass stands for a suite of chemical ionization mass spectrometers (CIMSs) employing a custom-made ion funnel in the ion-molecule-reaction (IMR) region (operating at around 35 hPa) and employing time-of-flight (TOF) mass analysers as described in Albrecht (2014) and Khattatov (2019). Here we used the laboratory version FunMass-L using iodide ion chemistry and a high-resolution (TOFWERK H-TOF) mass analyser (e.g. Lee et al., 2014). Employing a 0.4 mm diameter PTFE nozzle, it sampled a 1.1 slpm flow from the SAPHIR chamber through a 6 mm outer diameter Teflon (PFA) tubing with a length of 62 cm from the inlet into the IMR which was operating at 35 hPa. Reagent iodide ions were produced by passing methyl iodide (CH3I) mixed in N2 (Linde, purity > 99.9999 %, ca. 1 ppm CH3I, 0.25 slpm) through a radioactive ion source (Po-210, NR; P-2021, 370 MBq). The iodide ions and their water clusters then react with relevant analyte species like HPMTF and TPA (thioperformic acid) to form iodide-ion–molecule clusters detected in the mass spectrometer at mass-to-charge ratios () of 234.893 and 204.883, respectively (Berndt et al., 2019; Veres et al., 2020; Ye et al., 2022). The typical residence time in the IMR is 60 ms.
Any major interference of the (I*HPMTF)− cluster by the isobaric (I*N2O5)− cluster is ruled out for the following reasons. A zero-dimensional box model constrained to observed NO, NO2 (up to 1.5 ppb), O3, and temperature was run to simulate expected concentrations of NO3, HNO3, and N2O5 in the chamber. This resulted in N2O5 mixing ratios well below 1 ppt, which is rather low, such that a significant interference on the HPMTF signal can be excluded. Further, the similar temporal evolution of the reported HPMTF and TPA signals, which differ substantially from the modelled temporal profile of N2O5, also support that there is no major interference. We also note that modelled HNO3 exhibits a very similar temporal evolution to the uncalibrated I-CIMS signal for the (I*HNO3)− cluster giving further confidence in the modelled N2O5 evolution. We also tried to explore the isotopologue signatures for the HPMTF and the N2O5 clusters. The exercise was done for measurement day II. The 237 and 235 peaks (the HPMTF 34S and 32S clusters, respectively) show a very similar temporal evolution; however, the average ratio found for the areas was very noisy and about 4-fold the expected 4.2 %, indicating that at least the 237 peak is blended by some isobaric unknown ion. Therefore, this method could not be used to ensure the absence or low significance of N2O5. For the 236 peak (the blended 33S-HPMTF (0.8 %) and 15NNO5 (0.4 %) cluster) no significant peak was detected at all, which due to the generally low signal-to-noise ratios () also cannot rule out some contribution by N2O5. This applies to days III and IV as well since is very similar.
For the SO2 quantification we choose the SO ion cluster observed at (e.g. Möhler et al., 1992; Seeley et al., 1997) formed from the reaction of SO2 and CO. The latter ion was used for normalization and was most probably formed from varying amounts of CO2 in the IMR. The formation of SO by reactions of IO (x=2, 3, 4) or O as described by Eger et al. (2019) seems very improbable due to extremely low abundances of these potential reagent ions. The possible origin of the CO ions from O chemistry in a two-step process involving CO2 and O3 as described by Novak et al. (2020; see R4a/b and R5a/b) also seems rather improbable due to the very low O signals involved. This is supported by the absence of any correlation of the CO and SO signals even for significant changes in O3 as, e.g., encountered for the second ozone addition (see Fig. 2 around 8.5 h). Unfortunately, a detailed pathway for the CO formation cannot be given. The iodide cluster I*SO could not be detected with our setup, most probably due to the electric fields generated within the ion funnel leading to collision-induced dissociation.
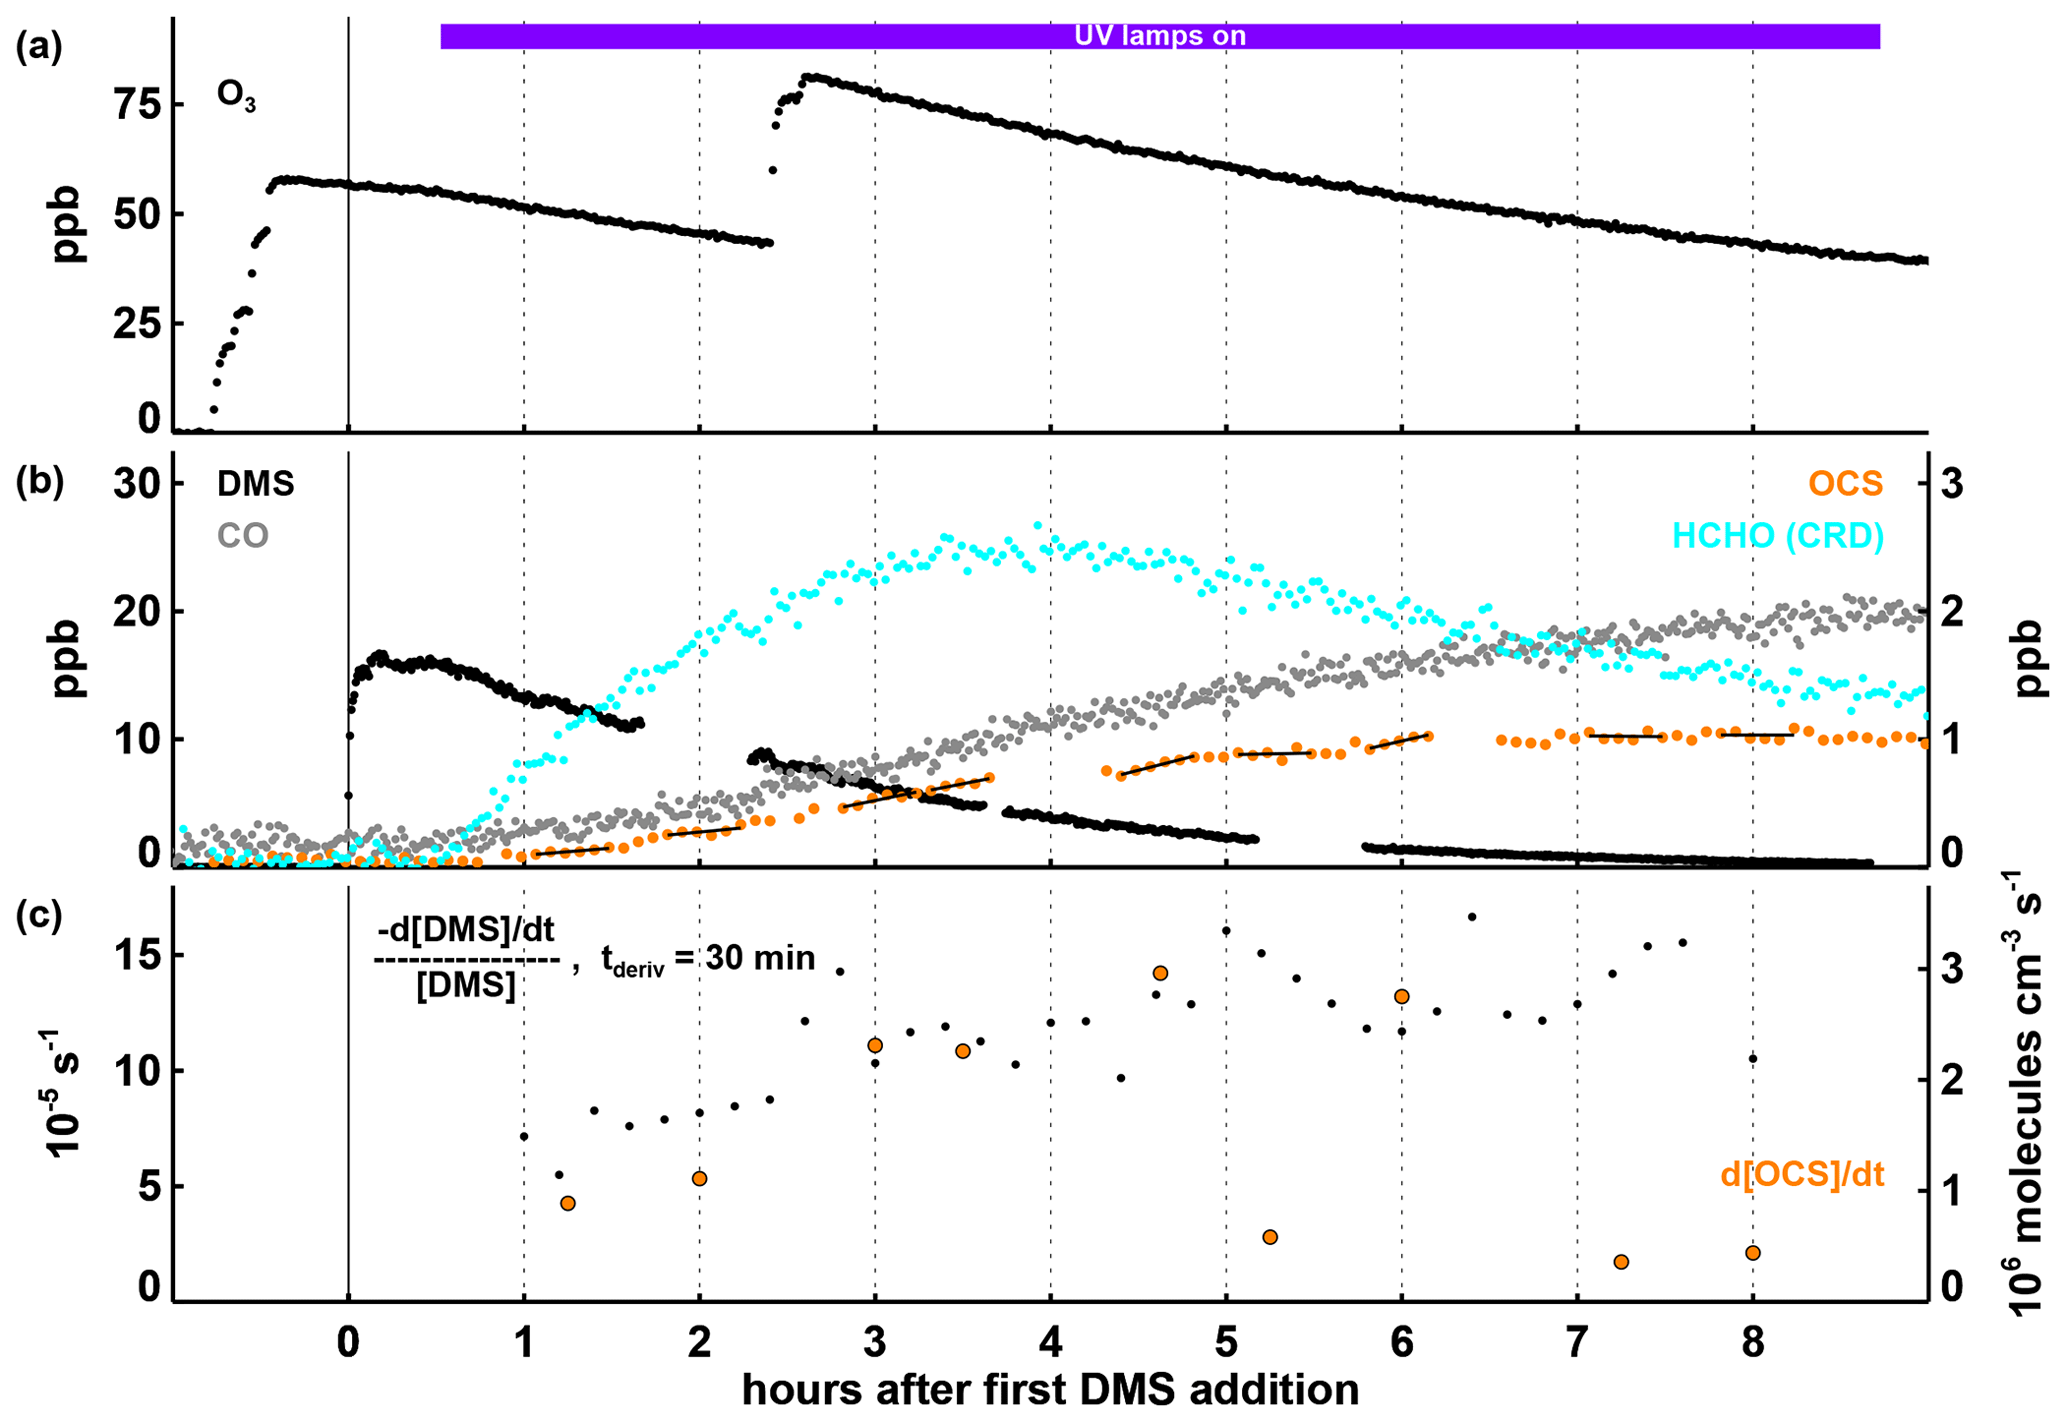
Figure 1Time series of selected parameters in Experiment I, with time in hours after the first DMS injection and the period with the UV lamps turned on indicated by the coloured bar at the top of panel (a). In panels (a) and (b), mixing ratios for trace gases are shown, with the position of the labels indicating which axis refers to which species. In panel (c), the first-order DMS decay rate is determined for each individual point by a linear least squares fit of the DMS concentration data within ± 15 min of this point. OCS production rates given in panel (c) are calculated by a linear least squares fitting of the OCS concentration data marked with the black lines in panel (b), each encompassing 30 min of data (the time periods were chosen to avoid data gaps and periods where the production rate changed significantly within 30 min). Both the DMS loss and the OCS formation rates shown are corrected for the loss induced by the replenishment flow in SAPHIR.
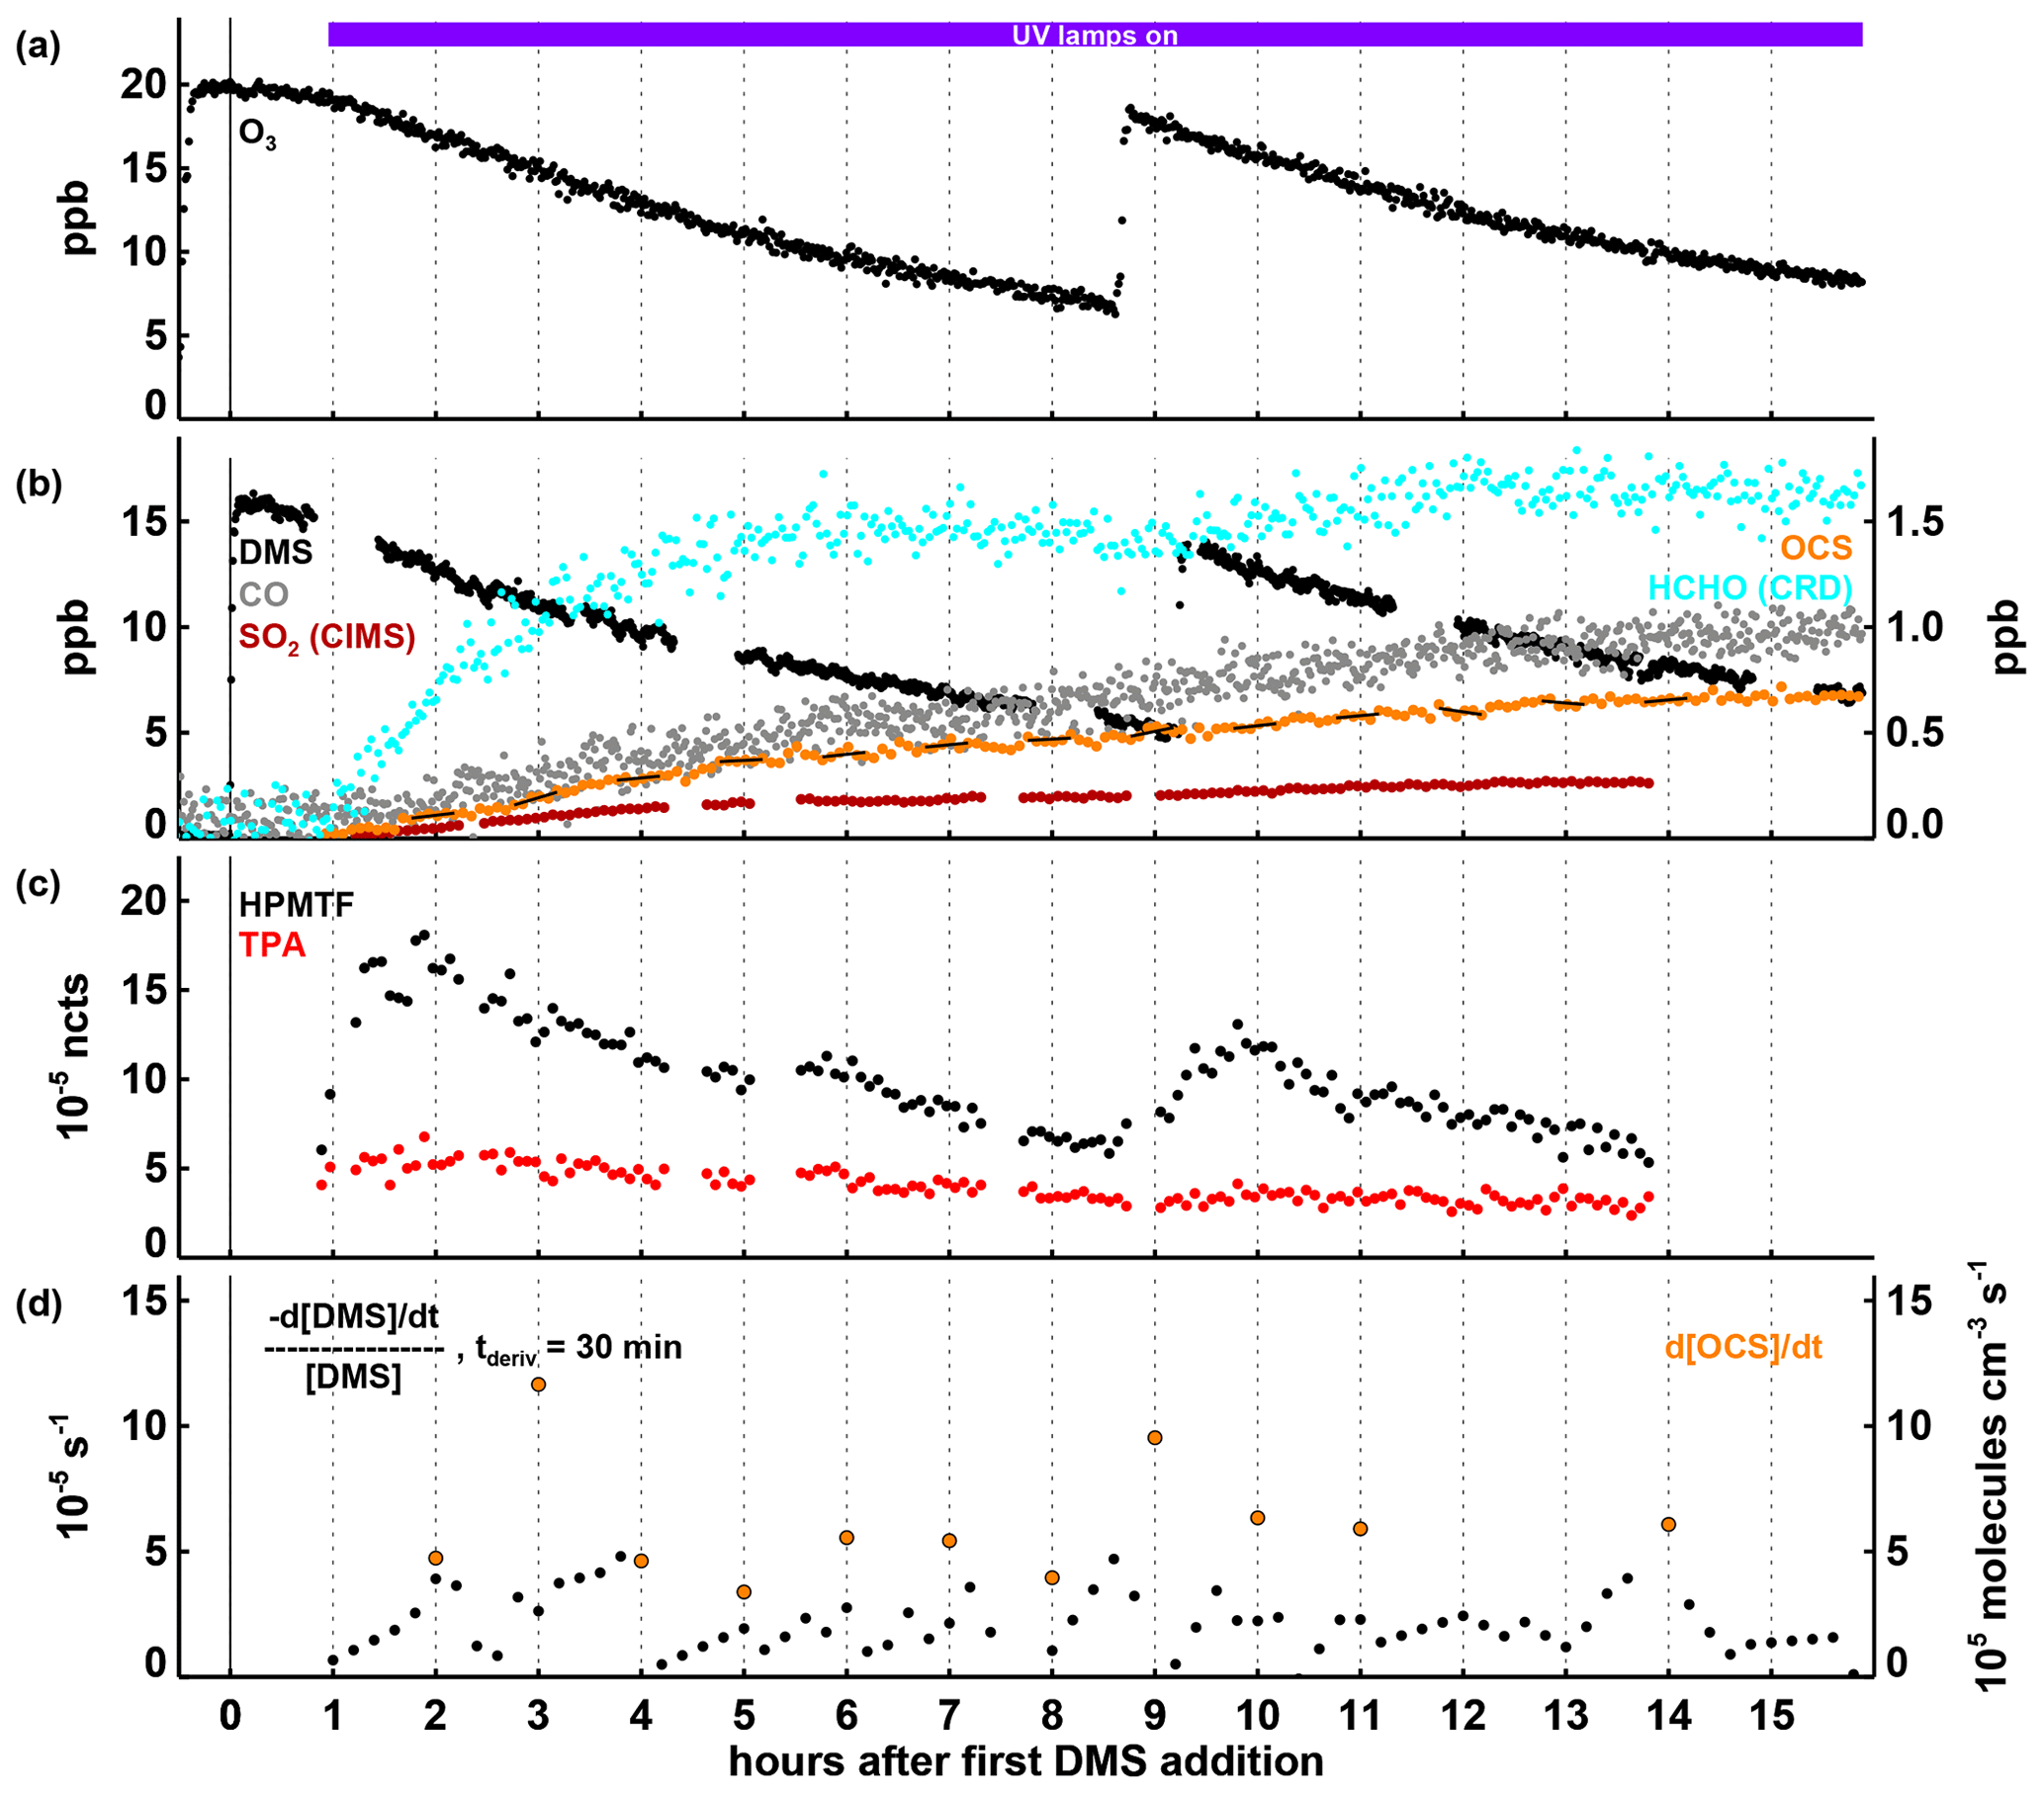
Figure 2Time series of selected parameters in Experiment II, with time in hours after the first DMS injection and the period with the UV lamps turned on indicated by the coloured bar at the top of panel (a). In panels (a) and (b), mixing ratios for trace gases are shown, with the position of the labels indicating which axis refers to which species. In panel (c), HPMTF and TPA are shown as normalized counts (see Sect. 2.3). In panel (d), the first-order DMS decay rate is determined for each individual point by a linear least squares fit of the DMS concentration data within ± 15 min of this point. OCS production rates given in panel (d) are calculated by a linear least squares fitting of the OCS concentration data marked with the black lines in panel (b), each encompassing 30 min of data (the time periods were chosen to avoid data gaps and periods where the production rate changed significantly within 30 min). Both the DMS loss and the OCS formation rates shown are corrected for the loss induced by the replenishment flow in SAPHIR.
Online calibration was performed for SO2 employing a compact permeation oven containing a gravimetrically quantified SO2 permeation tube (Fine Metrology, Italy) as described by Von Hobe et al. (2023). Regular additions from the oven adding 700 ppt SO2 to the IMR analyte gas (either chamber air or synthetic air) were done. However, due to the varying and weak CO reagent ion abundance, measured SO2 mixing ratios mostly cannot be statistically quantified to better than around 40 %. We referenced all SO2 data to the starting signal (ncts, normalized counts) once humidification and CO2 injection were completed and signals stabilized (days III and IV). For day II due to a late measurement start of the CIMS (just before turning on UV lamps and about 1 h after the DMS addition), the reference signal was derived from the very first measurement points somewhat later than for days III and IV. However, the SO2 reference signals which corresponded to about 200 ppt agreed within about ± 100 ppt for all days. This is well below the other main error sources. We cannot assign the origin of this background. Presented SO2 therefore represented the increase from the start of the DMS oxidation which corresponds to the reacted DMS. Uncertainties resulting from this procedure mainly due to changing humidity and ozone are estimated to a maximum of +50 and −350 ppt of SO2, respectively. However, the comparison to the DOAS instrument shows quite a good agreement of better than 10 % for Experiment IV when both measurements were operating (Fig. 4), giving further confidence in the applied procedures.
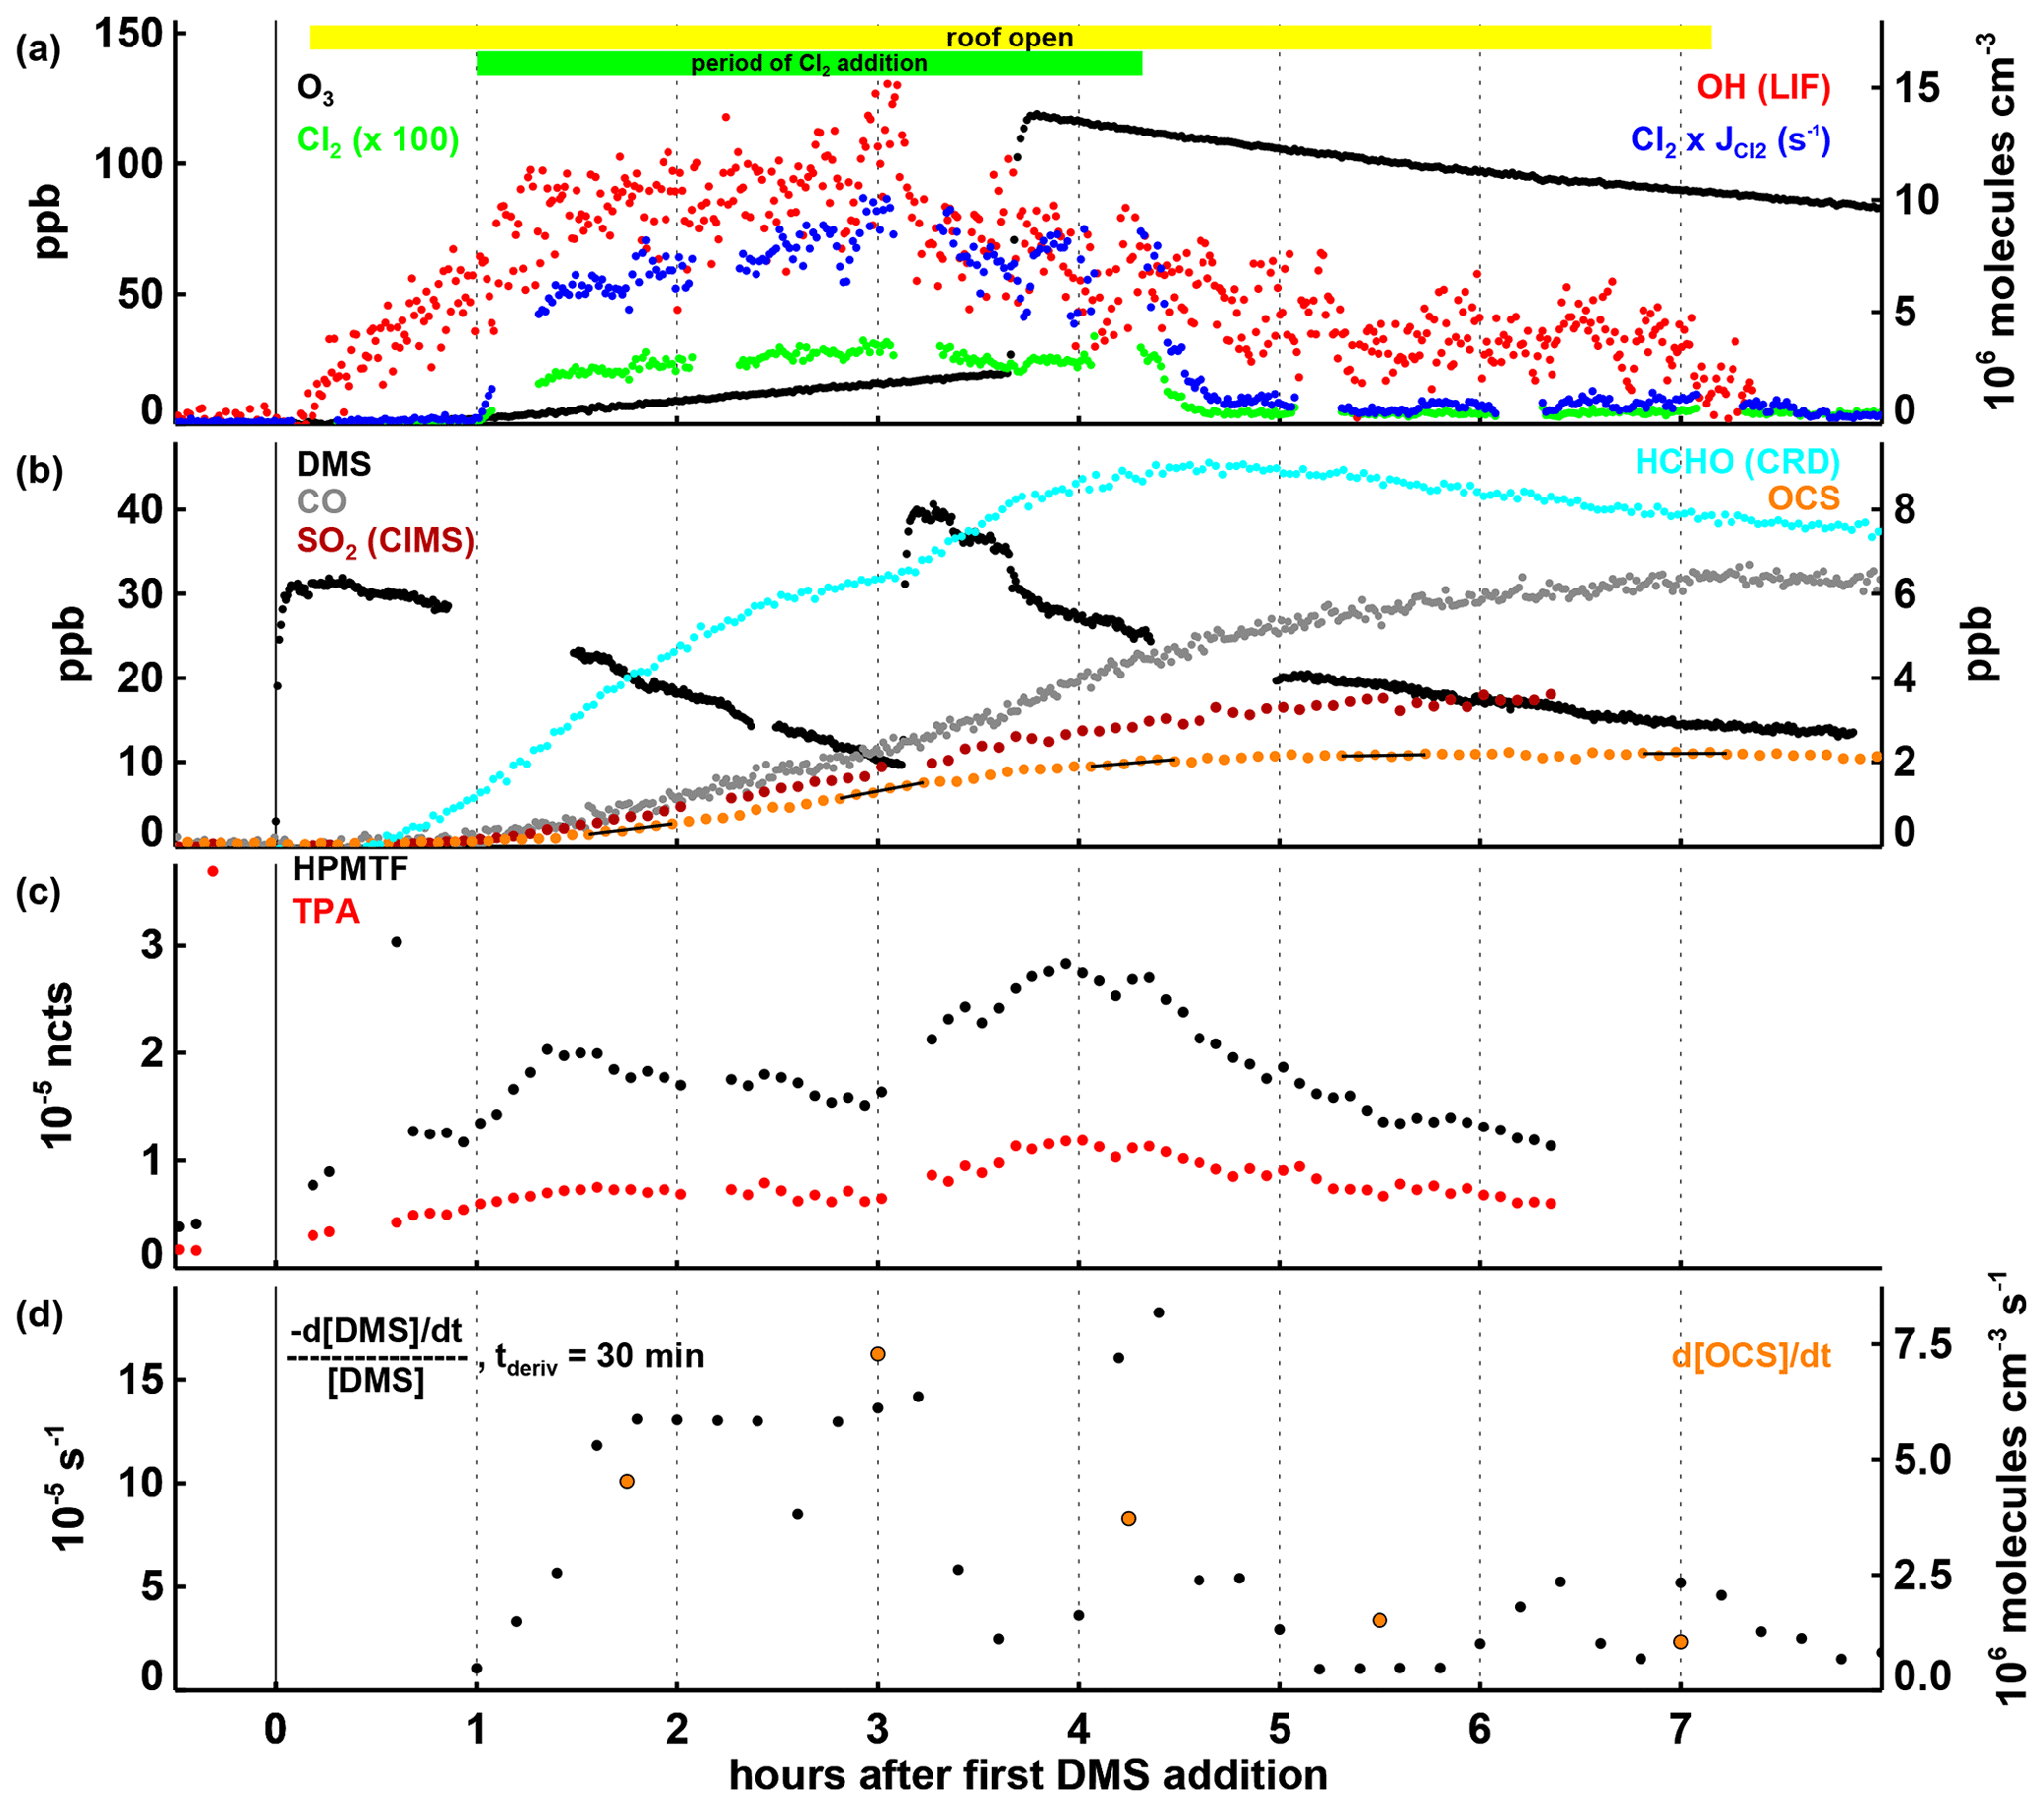
Figure 3Time series of selected parameters in Experiment III, with time in hours after the first DMS injection and the periods of daylight irradiation and continuous Cl2 injection indicated by the coloured bars at the top of panel (a). In panels (a) and (b), mixing ratios for trace gases, the OH concentration, and the product of the Cl2 concentration and its photolysis rate are shown, with the position of the labels indicating which axis refers to which species. In panel (c), HPMTF and TPA are shown as normalized counts (see Sect. 2.3). In panel (d), the first-order DMS decay rate is determined for each individual point by a linear least squares fit of the DMS concentration data within ± 15 min of this point. OCS production rates given in panel (d) are calculated by a linear least squares fitting of the OCS concentration data marked with the black lines in panel (b), each encompassing 30 min of data (the time periods were chosen to avoid data gaps and periods where the production rate changed significantly within 30 min). Both the DMS loss and the OCS formation rates shown are corrected for the loss induced by the replenishment flow in SAPHIR.
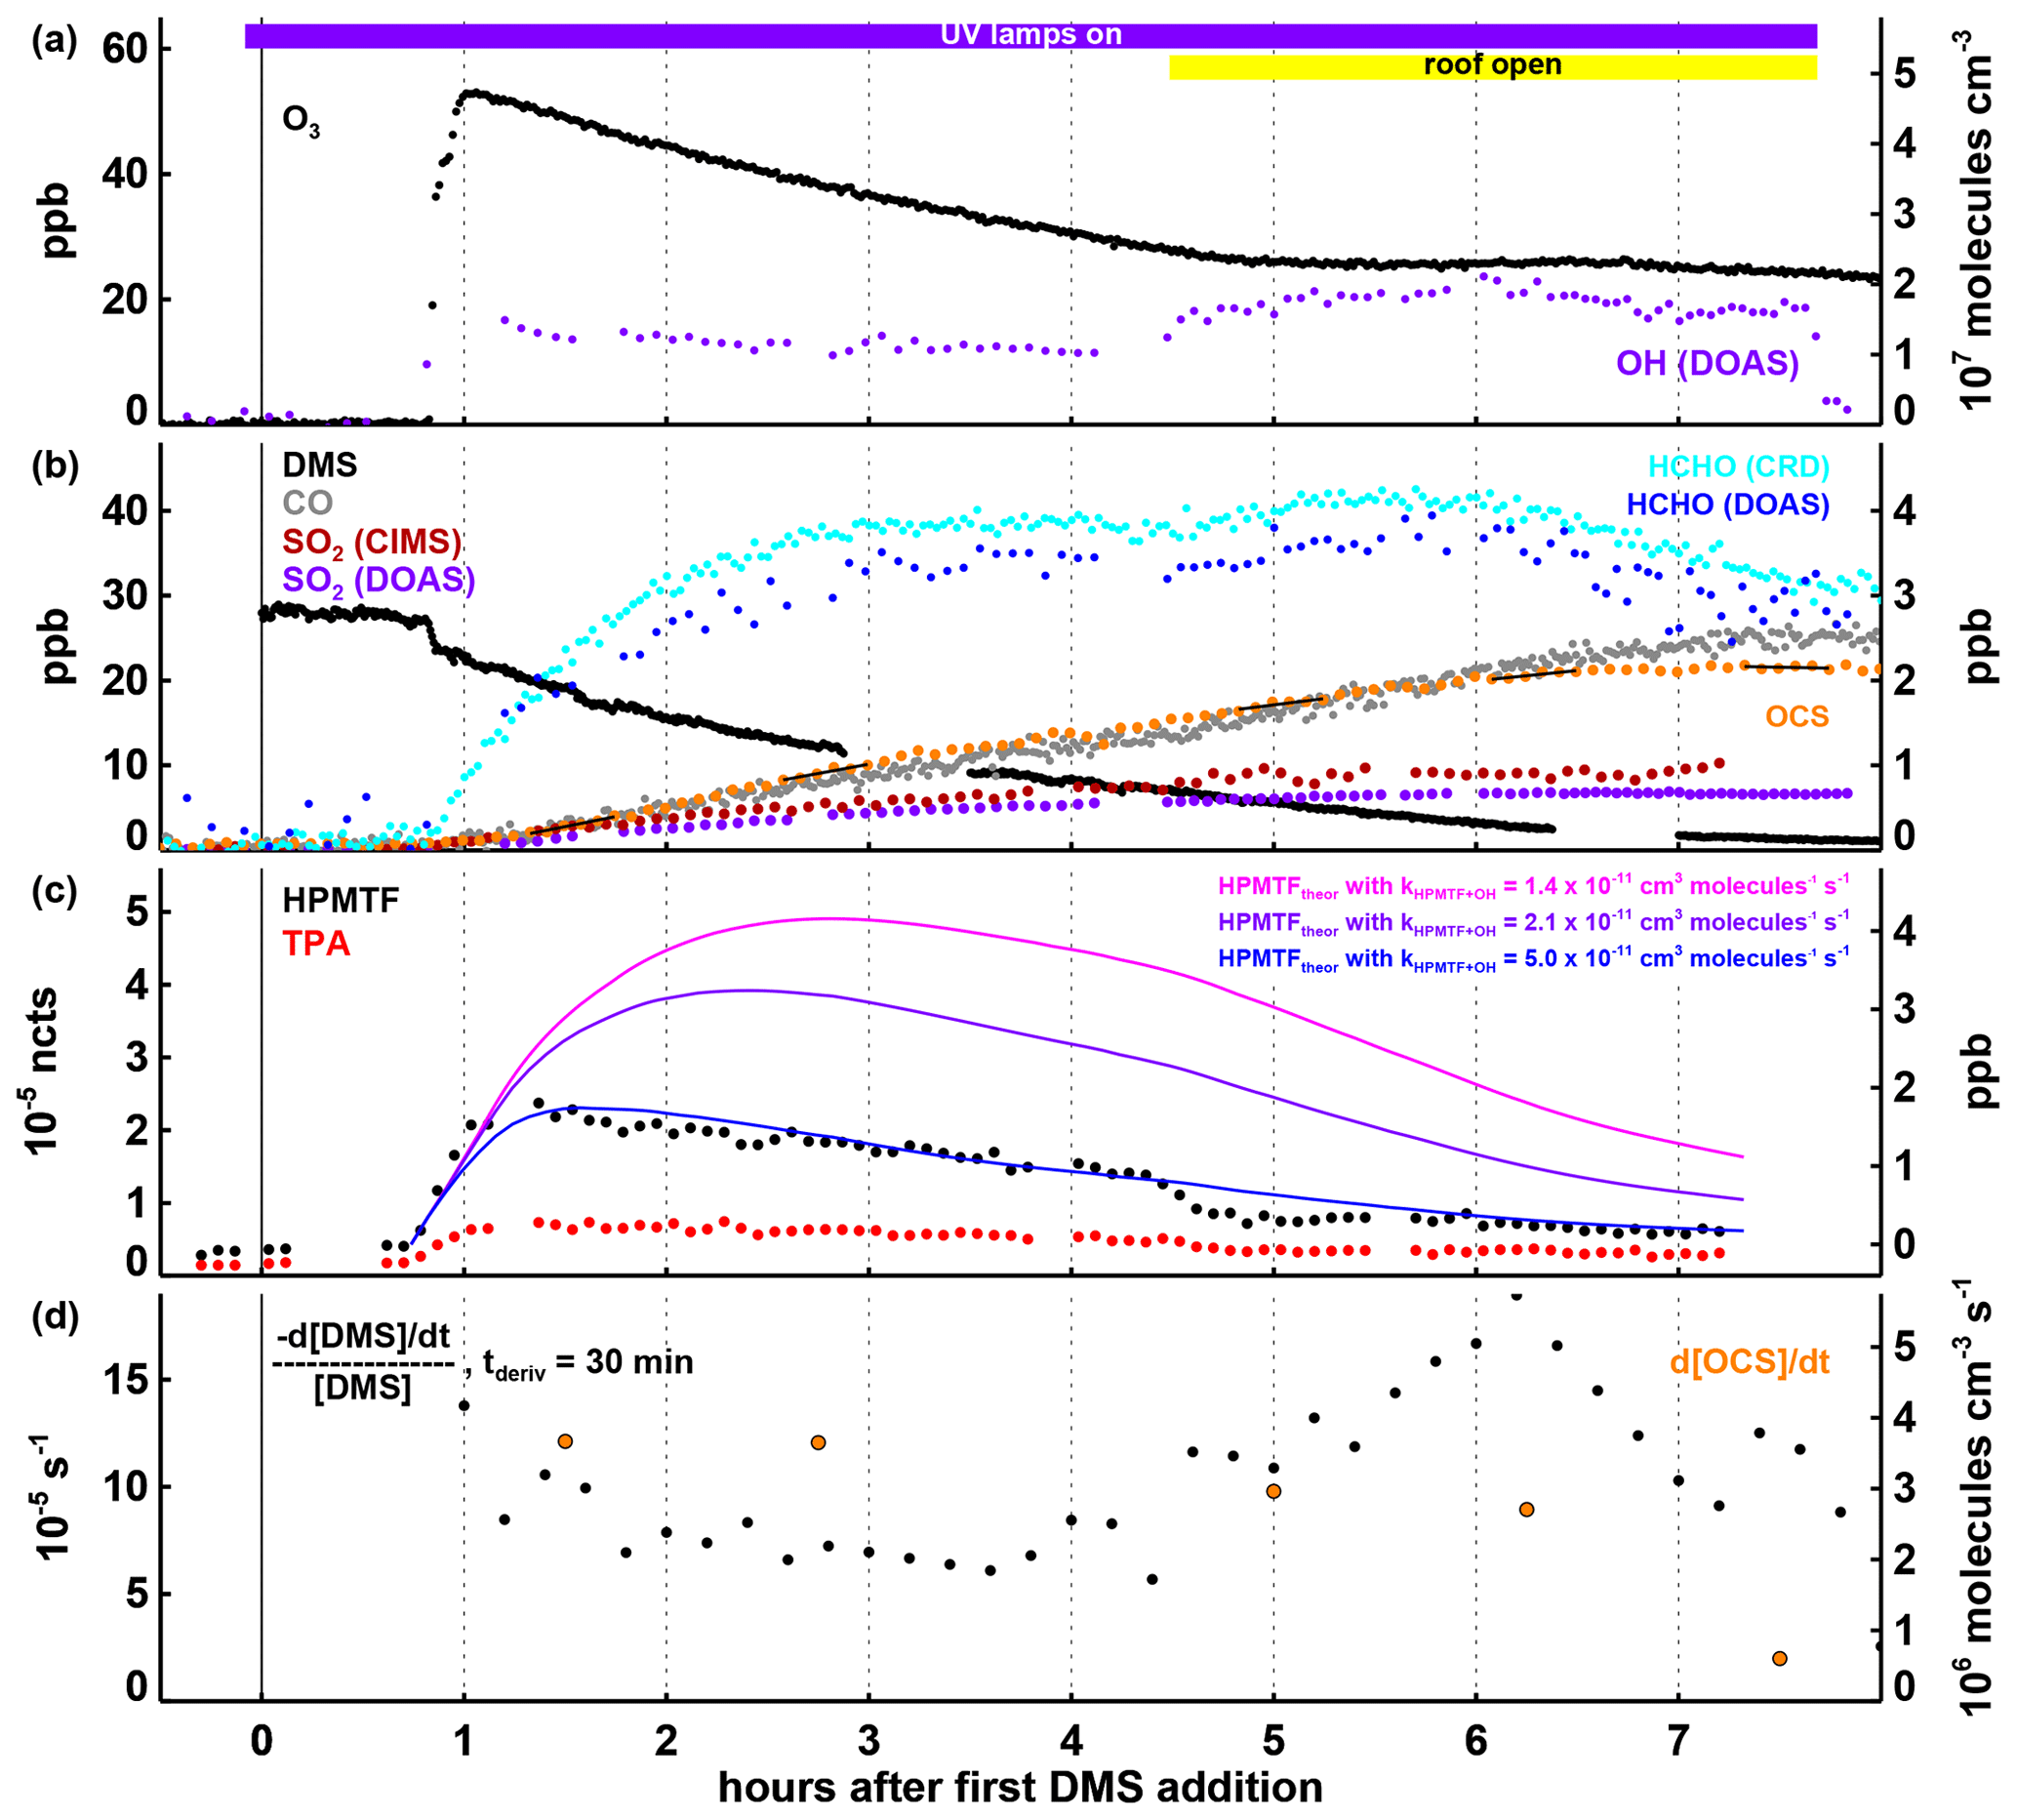
Figure 4Time series of selected parameters in Experiment IV, with time in hours after the first DMS injection and the periods with the UV lamps turned on and the SAPHIR daylight shutters being open indicated by the coloured bars at the top of panel (a). In panels (a) and (b), mixing ratios for trace gases and the OH concentration are shown, with the position of the labels indicating which axis refers to which species. In panel (c), observed HPMTF and TPA are shown as normalized counts (left-side axis) and estimated (see text in Sect. 3.4) HPMTF mixing ratios (right-side axis) are shown for cm3 molecules−1 s−1 (Jernigan et al., 2022; magenta), cm3 molecules−1 s−1 (Ye et al., 2022; purple) and cm3 molecules−1 s−1 (blue). In panel (d), the first-order DMS decay rate is determined for each individual point by a linear least squares fit of the DMS concentration data within ± 15 min of this point. OCS production rates given in panel (d) are calculated by a linear least squares fitting of the OCS concentration data marked with the black lines in panel (b), each encompassing 30 min of data (the time periods were chosen to avoid data gaps and periods where the production rate changed significantly within 30 min). Both the DMS loss and the OCS formation rates shown are corrected for the loss induced by the replenishment flow in SAPHIR.
Calibrations for HPMTF or TPA were not carried out for this campaign; therefore just the ratios of counts for detected product ions over the sum of the I− and I*H2O− signals are reported here. The change in this quantity, here termed normalized counts or ncts, is proportional, to first order, to concentrations of the neutral analytes (e.g. Huey, 2007). However, as we lacked a proper way to scrub the relevant species detected by the CIMS while retaining ozone and humidity, we could not establish a proper zero background here. For the HPMTF and TPA measurements this procedure did not produce consistent starting values, and we report non-background-corrected values. These background values before the expected presence of OH (UV light for days II and III and O3 for day IV) were below 20 % of the maximum observed signals also for day II with the late measurement start of the CIMS. Clearly, we cannot exclude pre-existing HPMTF or TPA at these starting points. Therefore, in our view it is also not possible to establish an HPMTF formation from DMS and ozone alone based on the available data. Also, some background variations expected due to variations in relative humidity, which usually dropped slowly but significantly over the experiments (up to 35 % over an 8 h measurement; see Fig. S2), cannot be ruled out.
Time series of observed radicals, trace gases, stable intermediates, and inferred reaction rates that are discussed in some detail in this section are shown for the respective experiments in Figs. 1–4, with additional parameters and concentrations of further gas-phase compounds and radicals given in Figs. S1–S4 (the time zero used for the relative timescale in all figures is defined for each experiment by the respective first DMS injections). Below, we describe the important observations for each experiment.
3.1 Experiment I: high turnover rate of DMS
In Experiment I, O3 was added to reach mixing ratios between 50 and 80 ppb and both UV-C lamps were turned on to produce OH (Fig. 1a). With HO2 and RO2 concentrations of and 3×109 cm−3, respectively, and no detectable NO present (Fig. S1), the isomerization reaction would be the dominant loss process for CH3SCH2O2, similar to what is expected in pristine marine air. The DMS loss rate constant, determined by taking the derivative of the observed DMS decay, slowly rises from s−1 to ∼ s−1 (Fig. 1c). Using the combined DMS + OH rate constants at 298 K for the H abstraction and OH addition pathways of cm3 molecules−1 s−1 (Barnes et al., 2006, and references therein) and assuming that DMS is consumed only by the OH radical and dilution, this would be consistent with an average OH concentration in the range of 1–2×10⁷ molecules cm−3. Nearly all the DMS injected had reacted after about 9 h (Fig. 1b).
Effects from the observed temperature variations of ∼ 10 ∘C in Experiment I (see Fig. S1c) on the DMS + OH reactions are impossible to discern due to the low precision of the observed DMS decay and lacking observations of the OH concentration and variability. Nevertheless, it should be noted that while the rate constant of the DMS + OH abstraction reaction has a moderate temperature dependence (< 5 % over a temperature range of 16–35 ∘C over all four experiments; see Figs. S1–S4), the rate constant of the DMS + OH addition reaction changes from at 16 ∘C to at 35 ∘C (Burkholder et al., 2019). This means that at the lower end of the temperature range in our experiments, we expect about 60 % to react through abstraction and 40 % through addition, while at the upper end, it is more like 80 % going through abstraction and 20 % through addition. As a consequence, we would expect more OCS production at higher temperatures as we get more HPMTF from getting more of the primary RO2 and a faster isomerization rate due to the temperature.
On the product side, CO starts to increase as soon as DMS and OH are available (Fig. 1b). Towards the end of the experiment, observed CO levels exceed the original amount of DMS. While a CO yield of up to 2 is theoretically possible because of the two carbon atoms in DMS, additional CO production from the oxidation of hydrocarbons outgassing from the chamber film cannot be ruled out. As shown in Fig. 1c, HCHO increases rapidly during the first 3 h after DMS and OH are available and then starts to level off and later decreases, showing that at this point, the removal exceeds the production. OCS concentrations increase almost linearly at an average rate of molecules cm−3 s1 until DMS is nearly consumed (Fig. 1b and c). An interesting observation is the lack of any substantial time delay (i.e. more than ∼ 15 min) between the start of DMS oxidation and OCS production, indicating that this must at least partly proceed via reactions involving only short-lived intermediates.
The total OCS yield per DMS consumed in Experiment I was 10.4 ± 1.6 % (the given uncertainty is propagated from the uncertainties in chamber dilution rate and the OCS and DMS measurements). This was calculated by dividing the amount of OCS present at the end of the experiment by the dilution-corrected total sulfur in the chamber (any sulfur was present as DMS at the beginning of the Experiment; see Fig. S5) minus the DMS still present:
where kSAPHIR is the observed chamber dilution rate and the summation is carried out for each DMS injection. This, as well the OCS yields given in the following sections, represents experimental results that strongly depend on the conditions in the SAPHIR chamber. We expect OCS yields from DMS oxidation in the real atmosphere to be significantly lower, as will be discussed in Sect. 4.
3.2 Experiment II: low turnover rate of DMS
As a result of O3 mixing ratios being held between 8 and 20 ppb (significantly less than in Experiment I) and only one UV-C lamp turned on to photolyse O3, OH concentrations in Experiment II are expected to be significantly lower than in Experiment I, which is supported by the lower DMS removal that never exceeded s−1 in this experiment (Fig. 2d). After about 14 h, more than 50 % of the sulfur present in the chamber is still present as DMS (see Fig. S6b).
Products are also formed at lower rates than in Experiment I, but the qualitative behaviour is similar. In addition to CO, HCHO, and OCS, measurements of SO2, as an expected major sulfur product of the DMS oxidation, are also available in this experiment (Fig. 2b). By the end of the experiment, about 2.5 ppb SO2 is observed making up most of the converted sulfur still in the chamber (for a sulfur budget of all measured sulfur compounds, see Fig. S6). The yield of OCS produced in Experiment II was 11.5 ± 1.8 % (calculated according to Eq. 1).
HPMTF and TPA, proposed as important intermediates for OCS production from DMS by Jernigan et al. (2022), both increase rapidly after the onset of DMS removal (Fig. 2c). The HPMTF concentration peaks after about 1 h and again 1 h after the second DMS injection, suggesting that its removal proceeds fairly rapidly. As explained in Sect. 2.3, the measurements of these intermediates are not calibrated and only relative signals are available.
3.3 Experiment III: oxidation of DMS by chlorine
In Experiment III DMS was additionally oxidized by Cl (expected to be present in the marine environment) instead of only OH like in Experiments I and II. However, as stated in Sect. 2.1, OH is always produced from the photolysis of HONO coming off the chamber film as soon as the chamber roof is opened (Fig. 3a). At an OH concentration of ∼ 1×10⁷ molecules cm−3, the DMS removal rate from the reaction with OH is expected to be s−1. The observed rate (Fig. 2d) is about twice as high during the Cl2 addition phase (3 h and 20 min, starting 1 h after the first DMS addition), indicating that reaction with either Cl2 (Dyke et al., 2005, 2006) or Cl radicals contributes significantly to the removal of DMS.
The observed OCS production rate of up to 7×10⁶ molecules cm−3 s−1 during this period (Fig. 3d) is higher than in any other experiment, so that it seems likely that OCS is being produced not only when DMS oxidation is initiated by OH but also when Cl2 and/or Cl are involved as initial oxidizing agents. Differently from the other experiments in this work, the concentration of NO was not negligible in Experiment III (Fig. S3b) reaching up to ∼ 200 ppt before the ozone injection and decreasing to ∼ 50 ppt afterwards. Even during the part of the experiment with high NO mixing ratios, high OCS levels are observed consistent with a unimolecular isomerization rate constant for CH3SCH2O2 faster than ∼ 0.05 s−1 (298 K).
HPMTF and TPA are both present at measurable levels (Fig. 3c), but because a quantitative comparison between experiments is not possible here, it cannot be resolved if they are exclusively produced via the OH oxidation chain or also via reactions involving chlorine. Mechanistically, HPMTF production following H abstraction from DMS upon reaction with Cl can be expected to proceed like after H abstraction with OH. Nothing is known about the secondary chemistry when HPMTF reacts with Cl and how this may promote or inhibit OCS-producing channels. With the open roof in Experiment III, photolysis reactions may also play a role in HPMTF chemistry (see Khan et al., 2021, for a discussion of HPMTF photolysis reactions).
An interesting observation is the drop in OCS production (Fig. 3d) when O3 is added later in the experiment. With the rise in HPMTF and TPA levels related to the second DMS injection just prior to O3 addition, one might expect OCS production to continue at the same rate or faster. We can only speculate that ClO, which is rapidly formed when both Cl and O3 are present, competes as a reaction partner in one or more steps in the DMS oxidation chain with impacts on the distribution of intermediates and products. It should be noted that the Cl + O3 reaction is about 10 times slower than the Cl + DMS reaction and a maximum ClO concentration of 4×10⁷ molecules cm−3 is estimated from steady-state calculations. Because ClO is less reactive towards DMS than Cl (ClO reacts with DMS at a rate constant of 9.5 ± cm3 molecule−1 s−1 according to Barnes et al., 1991), it is not expected to be competitive with Cl or even Cl2 for the oxidation of DMS. The overall OCS yield at the end of Experiment III was 9.5 ± 1.5 % (calculated according to Eq. 1).
3.4 Experiment IV: high turnover rate of DMS and sunlight
The initial conditions in Experiment IV were similar to those in Experiment I, only with higher DMS mixing ratios. Later in the experiment, the chamber roof was also opened, allowing for HONO photolysis as an additional OH source and, like in Experiment III, for photolysis reactions in the visible and near UV. Another difference compared to the Experiments I–III is the availability of measurements by the DOAS instrument. SO2 mixing ratios measured by DOAS were about 20 %–30 % lower than those observed by FunMass (Fig. 4b). The DMS decay rate constant calculated from the OH radical concentrations measured by the DOAS instrument was in good agreement with the observed DMS concentration time series within the measurement uncertainties (shown in Fig. S5) as can be expected because the DOAS instrument measures along the centreline of the chamber.
Product and intermediate formation behaved similarly to the way it behaved in Experiments I–III. The production of HPMTF, TPA, and OCS commenced quasi-immediately after DMS was added, with both HPMTF and TPA concentrations peaking within about 30 min after the DMS addition (Fig. 4c). Assuming (i) that HPMTF formation dominates over bi-molecular reactions so that HPMTF forms approximately at the rate of DMS removal via the H-abstraction reaction (strictly, this is an upper limit) and that (ii) HPMTF is only lost by its reaction with OH and dilution, expected HPMTF mixing ratios are calculated for different values of the reaction rate constant kHPMTF+OH, shown in Fig. 4c. Adjusting kHPMTF+OH so that the shape of the calculated HPMTF time series fits the shape of the observed ion mass signal of HPMTF gives a value of the reaction rate constant of around cm3 molecules−1 s−1 (Fig. 4c), higher than the values of cm3 molecules−1 s−1 determined by Jernigan et al. (2022) and the value of cm3 molecules−1 s−1 (Ye et al., 2022). Because HPMTF was only measured in relative terms and not as an absolute mixing ratio and because this steady-state approach depends on two critical assumptions that may not hold 100 %, one should be cautious and not interpret this result as a quantitative determination of kHPMTF+OH. A drop in HPMTF below the first-order removal curve is observed when the chamber roof is opened. As much of the DMS has already been removed by this time, this drop would be difficult to explain by a sudden change in the HPMTF production rate (e.g. from competing binary reactions) and is more likely caused by a faster/additional removal process such as daylight photolysis. This is, however, only speculative, and further experiments to corroborate and quantify this are warranted. The dilution-corrected overall OCS yield in Experiment IV was 11.9 ± 1.8 % (calculated according to Eq. 1).
In all four experiments, significant OCS production was observed with total yields between 9 % and 12 %. This is significantly higher than the 0.7 % observed in earlier experiments (Albu et al., 2008; Barnes et al., 1994, 1996) and in the same range as recently observed by Jernigan et al. (2022), who used a rather different experimental design and chamber, which gives confidence to both results. It needs to be stressed that such experimental OCS yields from DMS oxidation will not necessarily pertain to the real atmosphere. First, low-NOx conditions favouring the isomerization reaction of CH3SCH2O2 resulting in HPMTF formation over bi-molecular reactions are only found in pristine marine environments. Second, as pointed out by Jernigan et al. (2022), heterogeneous loss of HPMTF will suppress OCS formation in the real atmosphere. As a result, substantial variability in OCS formation during DMS oxidation is expected, and back-of-the-envelope-type calculations using a single OCS yield to derive a global indirect OCS source from global DMS emission estimates are not warranted. Rather, a robust estimate of this OCS source requires detailed parameterization in atmospheric models, and for that, a full qualitative and quantitative understanding of the OCS production mechanism and of other atmospherically relevant HPMTF loss processes is needed. Based on some of our observations, future experiments to fully establish and quantify this mechanism should probably include HPMTF photolysis and the role of chlorine radicals as a potentially relevant oxidant under certain atmospheric conditions.
Observations by the FunMass instrument corroborate the findings of Jernigan et al. (2022) that HPMTF appears to be a key intermediate in the DMS oxidation chain and most likely for the OCS-forming channels. Lacking a robust quantification method for HPMTF, it is impossible to quantitatively derive its formation and decay rates from our experiments. The appearance of OCS within minutes after the start of the DMS oxidation process and the rapid increase and decay of the HPMTF signal may indicate that this chemistry proceeds faster than expected from the current state-of-the-art mechanistic theory as described, e.g., in Jernigan et al. (2022) as a “multi generation mechanism”. The relative increase in the HPMTF decay rate when the roof is opened in Experiment IV suggests that HPMTF photolysis reactions could play a significant role at least under the given experimental conditions. Clearly, these results are only qualitative and should be viewed with caution given the relative HPMTF scale and the uncertainties in the level and homogeneity of the OH concentration in the SAPHIR chamber in our experiments. TPA, an intermediate thought to play a role further down the reaction chain, was also observed, again in qualitative agreement with the experiment by Jernigan et al. (2022). As for HPMTF, the shape of the TPA trace suggests rapid formation and removal reactions.
Data from the experiments in the SAPHIR chamber used in this work are available at the EUROCHAMP database web page (https://data.eurochamp.org/, EUROCHAMP, 2023). Data for each experiment are available as follows: experiment on 8 June 2020 (Experiment I) – Novelli et al. (2023a, https://doi.org/10.25326/667N-KA95); experiment on 10 June 2020 (Experiment II) – Novelli et al., 2023b, https://doi.org/10.25326/74PS-NM77); experiment on 12 June 2020 (Experiment III) – Novelli et al. (2023c, https://doi.org/10.25326/57DX-WR36); experiment on 15 June 2020 (Experiment IV) – Novelli et al. (2023d, https://doi.org/10.25326/BYAV-YK31).
The supplement related to this article is available online at: https://doi.org/10.5194/acp-23-10609-2023-supplement.
MvH, FS, YL, SA, CQ, FR, HF, HPD, SW, ZT, RS, BB, and AN collected and quality-checked the data. MvH and AN wrote the paper. AN and DT designed and led the experiments. All authors were involved in helpful discussion and contributed to the paper.
At least one of the (co-)authors is a member of the editorial board of Atmospheric Chemistry and Physics. The peer-review process was guided by an independent editor, and the authors also have no other competing interests to declare.
Publisher’s note: Copernicus Publications remains neutral with regard to jurisdictional claims in published maps and institutional affiliations.
The article processing charges for this open-access publication were covered by the Forschungszentrum Jülich. Sascha Alber, Yun Li, and Chenxi Qiu were supported by the graduate school HITEC of the Forschungszentrum Jülich GmbH.
This paper was edited by John Liggio and reviewed by two anonymous referees.
Albrecht, S.: Development of a highly sensitive and versatile mass spectrometer system for laboratory and atmospheric measurements, Schriften des Forschungszentrums Jülich, Reihe Energie & Umwelt, 171 pp., Bergische Universität Wuppertal, Dissertation, http://hdl.handle.net/2128/8414 (last access: 20 September 2023), 2014.
Albu, M., Barnes, I., Becker, K. H., Patroescu-Klotz, I., Benter, T., and Mocanu, R.: FT-IR product study on the OH radical initiated oxidation of dimethyl sulfide: Temperature and O(2) partial pressure dependence, in Simulation and Assessment of Chemical Processes in a Multiphase Environment, edited by: Barnes, I. and Kharytonov, M. M., 501–513, Springer, Dordrecht, https://doi.org/10.1007/978-1-4020-8846-9_41, 2008.
Assaf, E., Finewax, Z., Marshall, P., Veres, P. R., Neuman, J. A., and Burkholder, J. B.: Measurement of the Intramolecular Hydrogen-Shift Rate Coefficient for the CH3SCH2OO Radical between 314 and 433 K, J. Phys. Chem. A, 127, 2336–2350, https://doi.org/10.1021/acs.jpca.2c09095, 2023.
Baer, D. S., Paul, J. B., Gupta, M., and O'Keefe, A.: Sensitive absorption measurements in the near-infrared region using off-axis integrated cavity output spectroscopy, SPIE Proc., 4817, Diode Lasers and Applications in Atmospheric Sensing, https://doi.org/10.1117/12.451461, 2002.
Barnes, I., Bastian, V., Becker, K. H., and Overath, R. D.: Kinetic studies of the reactions of IO, BrO, and ClO with dimethylsulfide. Int. J. Chem. Kinet., 23, 579–591, https://doi.org/10.1002/kin.550230704, 1991.
Barnes, I., Becker, K. H., and Patroescu, I.: The tropospheric oxidation of dimethyl sulfide: A new source of carbonyl sulfide, Geophys. Res. Lett., 21, 2389–2392, https://doi.org/10.1029/94GL02499, 1994.
Barnes, I., Becker, K. H., and Patroescu, I.: FTIR product study of the OH initiated oxidation of dimethyl sulphide: Observation of carbonyl sulphide and dimethyl sulphoxide, Atmos. Environ., 30, 1805–1814, https://doi.org/10.1016/1352-2310(95)00389-4, 1996.
Barnes, I., Hjorth, J., and Mihalopoulos, N.: Dimethyl Sulfide and Dimethyl Sulfoxide and Their Oxidation in the Atmosphere, Chem. Rev., 106, 940–975, https://doi.org/10.1021/cr020529+, 2006.
Berndt, T., Scholz, W., Mentler, B., Fischer, L., Hoffmann, E. H., Tilgner, A., Hyttinen, N., Prisle, N. L., Hansel, A., and Herrmann, H.: Fast Peroxy Radical Isomerization and OH Recycling in the Reaction of OH Radicals with Dimethyl Sulfide, J. Phys. Chem. Lett., 10, 6478–6483, https://doi.org/10.1021/acs.jpclett.9b02567, 2019.
Berry, J., Wolf, A., Campbell, J. E., Baker, I., Blake, N., Blake, D., Denning, A. S., Kawa, S. R., Montzka, S. A., Seibt, U., Stimler, K., Yakir, D., and Zhu, Z.: A coupled model of the global cycles of carbonyl sulfide and CO2: A possible new window on the carbon cycle, J. Geophys. Res.-Biogeosci., 118, 842–852, https://doi.org/10.1002/jgrg.20068, 2013.
Bohn, B. and Zilken, H.: Model-aided radiometric determination of photolysis frequencies in a sunlit atmosphere simulation chamber, Atmos. Chem. Phys., 5, 191–206, https://doi.org/10.5194/acp-5-191-2005, 2005.
Bohn, B., Rohrer, F., Brauers, T., and Wahner, A.: Actinometric measurements of NO2 photolysis frequencies in the atmosphere simulation chamber SAPHIR, Atmos. Chem. Phys., 5, 493–503, https://doi.org/10.5194/acp-5-493-2005, 2005.
Brühl, C., Lelieveld, J., Crutzen, P. J., and Tost, H.: The role of carbonyl sulphide as a source of stratospheric sulphate aerosol and its impact on climate, Atmos. Chem. Phys., 12, 1239–1253, https://doi.org/10.5194/acp-12-1239-2012, 2012.
Burkholder, J. B., Sander, S. B., Abbatt, J., Barker, J. R., Cappa, C., Crounse, J. D., Dibble, T. S., Huie, R. S., Kolb, C. E., Kurylo, M. J., Orkin, V. L., Percival, C. J., Wilmouth, D. M., and Wine, P. H.: Chemical Kinetics and Photochemical Data for Use in Atmospheric Studies, Evaluation No. 19, JPL Publication 19-5, Jet Propulsion Laboratory, Pasadena, 2019, http://jpldataeval.jpl.nasa.gov (last access: 15 September 2023), 2019.
Charlson, R. J., Lovelock, J. E., Andreae, M. O., and Warren, S. G.: Oceanic phytoplankton, atmospheric sulphur, cloud albedo and climate, Nature, 326, 655–661, https://doi.org/10.1038/326655a0, 1987.
Cho, C., Fuchs, H., Hofzumahaus, A., Holland, F., Bloss, W. J., Bohn, B., Dorn, H. P., Glowania, M., Hohaus, T., Liu, L., Monks, P. S., Niether, D., Rohrer, F., Sommariva, R., Tan, Z., Tillmann, R., Kiendler-Scharr, A., Wahner, A., and Novelli, A.: Experimental chemical budgets of OH, HO2 and RO2 radicals in rural air in West-Germany during the JULIAC campaign 2019, EGUsphere, 2022, 1–51, https://doi.org/10.5194/egusphere-2022-820, 2022.
Dorn, H.-P., Brandenburger, U., Brauers, T., and Hausmann, M.: A New In Situ Laser Long-Path Absorption Instrument for the Measurement of Tropospheric OH Radicals, J. Atmos. Sci., 52, 3373–3380, https://doi.org/10.1175/1520-0469(1995)052<3373:anisll>2.0.co;2, 1995.
Dyke, J. M., Ghosh, M. V., Kinnison, D. J., Levita, G., Morris, A., and Shallcross, D. E.: A kinetics and mechanistic study of the atmospherically relevant reaction between molecular chlorine and dimethyl sulfide (DMS), Phys. Chem. Chem. Phys., 7, 866–873, https://doi.org/10.1039/B415566A, 2005.
Dyke, J. M., Ghosh, M. V., Goubet, M., Lee, E. P. F., Levita, G., Miqueu, K., and Shallcross, D. E.: A study of the atmospherically relevant reaction between molecular chlorine and dimethylsulfide (DMS): Establishing the reaction intermediate and measurement of absolute photoionization cross-sections, Chem. Phys., 324, 85–95, https://doi.org/10.1016/j.chemphys.2005.11.045, 2006.
Eger, P. G., Helleis, F., Schuster, G., Phillips, G. J., Lelieveld, J., and Crowley, J. N.: Chemical ionization quadrupole mass spectrometer with an electrical discharge ion source for atmospheric trace gas measurement, Atmos. Meas. Tech., 12, 1935–1954, https://doi.org/10.5194/amt-12-1935-2019, 2019.
EUROCHAMP: EUROCHAMP data center, Simulation chamber data and data products, EUROCHAMP 2020, https://data.eurochamp.org/ (last access: 18 September 2023), 2023.
Fuchs, H., Bohn, B., Hofzumahaus, A., Holland, F., Lu, K. D., Nehr, S., Rohrer, F., and Wahner, A.: Detection of HO2 by laser-induced fluorescence: calibration and interferences from RO2 radicals, Atmos. Meas. Tech., 4, 1209–1225, https://doi.org/10.5194/amt-4-1209-2011, 2011.
Fuchs, H., Novelli, A., Rolletter, M., Hofzumahaus, A., Pfannerstill, E. Y., Kessel, S., Edtbauer, A., Williams, J., Michoud, V., Dusanter, S., Locoge, N., Zannoni, N., Gros, V., Truong, F., Sarda-Esteve, R., Cryer, D. R., Brumby, C. A., Whalley, L. K., Stone, D., Seakins, P. W., Heard, D. E., Schoemaecker, C., Blocquet, M., Coudert, S., Batut, S., Fittschen, C., Thames, A. B., Brune, W. H., Ernest, C., Harder, H., Muller, J. B. A., Elste, T., Kubistin, D., Andres, S., Bohn, B., Hohaus, T., Holland, F., Li, X., Rohrer, F., Kiendler-Scharr, A., Tillmann, R., Wegener, R., Yu, Z., Zou, Q., and Wahner, A.: Comparison of OH reactivity measurements in the atmospheric simulation chamber SAPHIR, Atmos. Meas. Tech., 10, 4023–4053, https://doi.org/10.5194/amt-10-4023-2017, 2017.
Glatthor, N., Höpfner, M., Baker, I. T., Berry, J., Campbell, J. E., Kawa, S. R., Krysztofiak, G., Leyser, A., Sinnhuber, B. M., Stiller, G. P., Stinecipher, J., and von Clarmann, T.: Tropical sources and sinks of carbonyl sulfide observed from space, Geophys. Res. Lett., 42, 10082–10090, https://doi.org/10.1002/2015gl066293, 2015.
Glowania, M., Rohrer, F., Dorn, H.-P., Hofzumahaus, A., Holland, F., Kiendler-Scharr, A., Wahner, A., and Fuchs, H.: Comparison of formaldehyde measurements by Hantzsch, CRDS and DOAS in the SAPHIR chamber, Atmos. Meas. Tech., 14, 4239–4253, https://doi.org/10.5194/amt-14-4239-2021, 2021.
Holland, F., Hofzumahaus, A., Schafer, R., Kraus, A., and Patz, H. W.: Measurements of OH and HO2 radical concentrations and photolysis frequencies during BERLIOZ, J. Geophys. Res.-Atmos., 108, 8246, https://doi.org/10.1029/2001jd001393, 2003.
Huey, L. G.: Measurement of trace atmospheric species by chemical ionization mass spectrometry: Speciation of reactive nitrogen and future directions, Mass Spec. Rev., 26, 166–184, https://doi.org/10.1002/mas.20118, 2007.
Jernigan, C. M., Fite, C. H., Vereecken, L., Berkelhammer, M. B., Rollins, A. W., Rickly, P. S., Novelli, A., Taraborrelli, D., Holmes, C. D., and Bertram, T. H.: Efficient Production of Carbonyl Sulfide in the Low-NOx Oxidation of Dimethyl Sulfide, Geophys. Res. Lett., 49, e2021GL096838, https://doi.org/10.1029/2021GL096838, 2022.
Jordan, A., Haidacher, S., Hanel, G., Hartungen, E., Märk, L., Seehauser, H., Schottkowsky, R., Sulzer, P., and Märk, T. D.: A high resolution and high sensitivity proton-transfer-reaction time-of-flight mass spectrometer (PTR-TOF-MS), Int. J. Mass. Spectrom., 286, 122–128, https://doi.org/10.1016/j.ijms.2009.07.005, 2009.
Kettle, A. J., Kuhn, U., von Hobe, M., Kesselmeier, J., and Andreae, M. O.: Global budget of atmospheric carbonyl sulfide: Temporal and spatial variations of the dominant sources and sinks, J. Geophys. Res.-Atmos., 107, ACH 25-21–ACH 25-16, https://doi.org/10.1029/2002JD002187, 2002.
Khan, M. A. H., Bannan, T. J., Holland, R., Shallcross, D. E., Archibald, A. T., Matthews, E., Back, A., Allan, J., Coe, H., Artaxo, P., and Percival, C. J.: Impacts of Hydroperoxymethyl Thioformate on the Global Marine Sulfur Budget, ACS Earth Space Chem., 5, 2577–2586, https://doi.org/10.1021/acsearthspacechem.1c00218, 2021.
Khattatov, T.: Development, calibration and deployment of an airborne chemical ionization mass spectrometer for trace gas measurements, Schriften des Forschungszentrums Jülich, Reihe Energie & Umwelt/Energy & Environment 464, 14, 125, Jülich, Dissertation, 125 S, Bergische Univ. Wuppertal, http://hdl.handle.net/2128/22604 (last access: 20 September 2023), Dissertation, 2019.
Kremser, S., Harvey, M., Kuma, P., Hartery, S., Saint-Macary, A., McGregor, J., Schuddeboom, A., von Hobe, M., Lennartz, S. T., Geddes, A., Querel, R., McDonald, A., Peltola, M., Sellegri, K., Silber, I., Law, C. S., Flynn, C. J., Marriner, A., Hill, T. C. J., DeMott, P. J., Hume, C. C., Plank, G., Graham, G., and Parsons, S.: Southern Ocean cloud and aerosol data: a compilation of measurements from the 2018 Southern Ocean Ross Sea Marine Ecosystems and Environment voyage, Earth Syst. Sci. Data, 13, 3115–3153, https://doi.org/10.5194/essd-13-3115-2021, 2021.
Kremser, S., Thomason, L. W., von Hobe, M., Hermann, M., Deshler, T., Timmreck, C., Toohey, M., Stenke, A., Schwarz, J. P., Weigel, R., Fueglistaler, S., Prata, F. J., Vernier, J. P., Schlager, H., Barnes, J. E., Antuña-Marrero, J. C., Fairlie, D., Palm, M., Mahieu, E., Notholt, J., Rex, M., Bingen, C., Vanhellemont, F., Bourassa, A., Plane, J. M. C., Klocke, D., Carn, S. A., Clarisse, L., Trickl, T., Neely, R., James, A. D., Rieger, L., Wilson, J. C., and Meland, B.: Stratospheric aerosols: “Observations, processes, and impact on climate”, Rev. Geophys., 54, 278–335, https://doi.org/10.1002/2015RG000511, 2016.
Kuai, L., Worden, J. R., Campbell, J. E., Kulawik, S. S., Li, K.-F., Lee, M., Weidner, R. J., Montzka, S. A., Moore, F. L., Berry, J. A., Baker, I., Denning, A. S., Bian, H., Bowman, K. W., Liu, J., and Yung, Y. L.: Estimate of carbonyl sulfide tropical oceanic surface fluxes using Aura Tropospheric Emission Spectrometer observations, J. Geophys. Res.-Atmos., 120, 11012–11023, https://doi.org/10.1002/2015JD023493, 2015.
Lana, A., Bell, T. G., Simó, R., Vallina, S. M., Ballabrera-Poy, J., Kettle, A. J., Dachs, J., Bopp, L., Saltzman, E. S., Stefels, J., Johnson, J. E., and Liss, P. S.: An updated climatology of surface dimethlysulfide concentrations and emission fluxes in the global ocean, Global Biogeochem. Cyc., 25, GB1004, https://doi.org/10.1029/2010GB003850, 2011.
Lee, B. H., Lopez-Hilfiker, F. D., Mohr, C., Kurtén, T., Worsnop, D. R., and Thornton, J. A.: An Iodide-Adduct High-Resolution Time-of-Flight Chemical-Ionization Mass Spectrometer: Application to Atmospheric Inorganic and Organic Compounds, Environ. Sci. Technnol., 48, 6309–6317, https://doi.org/10.1021/es500362a, 2014.
Lennartz, S. T., Gauss, M., von Hobe, M., and Marandino, C. A.: Monthly resolved modelled oceanic emissions of carbonyl sulphide and carbon disulphide for the period 2000–2019, Earth Syst. Sci. Data, 13, 2095–2110, https://doi.org/10.5194/essd-13-2095-2021, 2021.
Lennartz, S. T., Marandino, C. A., von Hobe, M., Cortes, P., Quack, B., Simo, R., Booge, D., Pozzer, A., Steinhoff, T., Arevalo-Martinez, D. L., Kloss, C., Bracher, A., Röttgers, R., Atlas, E., and Krüger, K.: Direct oceanic emissions unlikely to account for the missing source of atmospheric carbonyl sulfide, Atmos. Chem. Phys., 17, 385–402, https://doi.org/10.5194/acp-17-385-2017, 2017.
Lou, S., Holland, F., Rohrer, F., Lu, K., Bohn, B., Brauers, T., Chang, C. C., Fuchs, H., Häseler, R., Kita, K., Kondo, Y., Li, X., Shao, M., Zeng, L., Wahner, A., Zhang, Y., Wang, W., and Hofzumahaus, A.: Atmospheric OH reactivities in the Pearl River Delta – China in summer 2006: measurement and model results, Atmos. Chem. Phys., 10, 11243–11260, https://doi.org/10.5194/acp-10-11243-2010, 2010.
Ma, J., Kooijmans, L. M. J., Cho, A., Montzka, S. A., Glatthor, N., Worden, J. R., Kuai, L., Atlas, E. L., and Krol, M. C.: Inverse modelling of carbonyl sulfide: implementation, evaluation and implications for the global budget, Atmos. Chem. Phys., 21, 3507–3529, https://doi.org/10.5194/acp-21-3507-2021, 2021.
Möhler, O., Reiner, T., and Arnold, F.: THE FORMATION OF SO BY GAS-PHASE ION-MOLECULE REACTIONS, J. Chem. Phys., 97, 8233–8239, https://doi.org/10.1063/1.463394, 1992.
Novelli, A., von Hobe, M., Fuchs, H., Rohrer, F., and Wedel, S.: Atmospheric simulation chamber study: Dimethyl sulfide + OH – Gas-phase oxidation – product study, AERIS [data set], https://doi.org/10.25326/667N-KA95, 2023a.
Novelli, A., von Hobe, M., Alber, S., Fuchs, H., Li, Y., Qiu, C., Rohrer, F., Wedel, S., and Stroh, F.: Atmospheric simulation chamber study: Dimethyl sulfide + OH – Gas-phase oxidation – product study, AERIS [data set], https://doi.org/10.25326/74PS-NM77, 2023b.
Novelli, A., von Hobe, M., Alber, S., Fuchs, H., Li, Y., Qiu, C., Rohrer, F., Wedel, S., Stroh, F., Bohn, B., Dorn, H.-P., Sommariva, R., and Tan, Z.: Atmospheric simulation chamber study: Dimethyl sulfide + OH – Gas-phase oxidation – product study, AERIS [data set], https://doi.org/10.25326/57DX-WR36, 2023c.
Novelli, A., von Hobe, M., Alber, S., Fuchs, H., Li, Y., Qiu, C., Rohrer, F., Wedel, S., Stroh, F., Bohn, B., and Dorn, H.-P.: Atmospheric simulation chamber study: Dimethyl sulfide + OH – Gas-phase oxidation – product study, AERIS [data set], https://doi.org/10.25326/BYAV-YK31, 2023d.
O'Keefe, A.: Integrated cavity output analysis of ultra-weak absorption, Chem. Phys. Lett., 293, 331–336, 1998.
Park, K.-T., Yoon, Y. J., Lee, K., Tunved, P., Krejci, R., Ström, J., Jang, E., Kang, H. J., Jang, S., Park, J., Lee, B. Y., Traversi, R., Becagli, S., and Hermansen, O.: Dimethyl Sulfide-Induced Increase in Cloud Condensation Nuclei in the Arctic Atmosphere, Global Biogeochem. Cy., 35, e2021GB006969, https://doi.org/10.1029/2021GB006969, 2021.
Paul, J. B., Lapson, L., and Anderson, J. G.: Ultrasensitive absorption spectroscopy with a high-finesse optical cavity and off-axis alignment, Appl. Opt., 40, 4904–4910, https://doi.org/10.1364/AO.40.004904, 2001.
Quinn, P. K. and Bates, T. S.: The case against climate regulation via oceanic phytoplankton sulphur emissions, Nature, 480, 51–56, https://doi.org/10.1038/nature10580, 2011.
Rohrer, F., Bohn, B., Brauers, T., Brüning, D., Johnen, F.-J., Wahner, A., and Kleffmann, J.: Characterisation of the photolytic HONO-source in the atmosphere simulation chamber SAPHIR, Atmos. Chem. Phys., 5, 2189–2201, https://doi.org/10.5194/acp-5-2189-2005, 2005.
Sanchez, K. J., Chen, C.-L., Russell, L. M., Betha, R., Liu, J., Price, D. J., Massoli, P., Ziemba, L. D., Crosbie, E. C., Moore, R. H., Müller, M., Schiller, S. A., Wisthaler, A., Lee, A. K. Y., Quinn, P. K., Bates, T. S., Porter, J., Bell, T. G., Saltzman, E. S., Vaillancourt, R. D., and Behrenfeld, M. J.: Substantial Seasonal Contribution of Observed Biogenic Sulfate Particles to Cloud Condensation Nuclei, Sci. Rep., 8, 3235, https://doi.org/10.1038/s41598-018-21590-9, 2018.
Sandoval-Soto, L., Stanimirov, M., von Hobe, M., Schmitt, V., Valdes, J., Wild, A., and Kesselmeier, J.: Global uptake of carbonyl sulfide (COS) by terrestrial vegetation: Estimates corrected by deposition velocities normalized to the uptake of carbon dioxide (CO2), Biogeosciences, 2, 125–132, https://doi.org/10.5194/bg-2-125-2005, 2005.
Seeley, J. V., Morris, R. A., and Viggiano, A. A.: Rate constants for the reactions of CO(H2O)n=0–5 + SO2: Implications for CIMS detection of SO2, Geophys. Res. Lett., 24, 1379–1382, https://doi.org/10.1029/97GL01323, 1997.
Sommariva, R., Hollis, L. D. J., Sherwen, T., Baker, A. R., Ball, S. M., Bandy, B. J., Bell, T. G., Chowdhury, M. N., Cordell, R. L., Evans, M. J., Lee, J. D., Reed, C., Reeves, C. E., Roberts, J. M., Yang, M., and Monks, P. S.: Seasonal and geographical variability of nitryl chloride and its precursors in Northern Europe, Atmos. Sci. Lett., 19, e844, https://doi.org/10.1002/asl.844, 2018.
Suntharalingam, P., Kettle, A. J., Montzka, S. M., and Jacob, D. J.: Global 3-D model analysis of the seasonal cycle of atmospheric carbonyl sulfide: Implications for terrestrial vegetation uptake, Geophys. Res. Lett., 35, L19801, https://doi.org/10.1029/2008GL034332, 2008.
Tan, Z., Fuchs, H., Hofzumahaus, A., Bloss, W. J., Bohn, B., Cho, C., Hohaus, T., Holland, F., Lakshmisha, C., Liu, L., Monks, P. S., Novelli, A., Niether, D., Rohrer, F., Tillmann, R., Valkenburg, T. S. E., Vardhan, V., Kiendler-Scharr, A., Wahner, A., and Sommariva, R.: Seasonal variation in nitryl chloride and its relation to gas-phase precursors during the JULIAC campaign in Germany, Atmos. Chem. Phys., 22, 13137–13152, https://doi.org/10.5194/acp-22-13137-2022, 2022.
Veres, P. R., Neuman, J. A., Bertram, T. H., Assaf, E., Wolfe, G. M., Williamson, C. J., Weinzierl, B., Tilmes, S., Thompson, C. R., Thames, A. B., Schroder, J. C., Saiz-Lopez, A., Rollins, A. W., Roberts, J. M., Price, D., Peischl, J., Nault, B. A., Møller, K. H., Miller, D. O., Meinardi, S., Li, Q., Lamarque, J.-F., Kupc, A., Kjaergaard, H. G., Kinnison, D., Jimenez, J. L., Jernigan, C. M., Hornbrook, R. S., Hills, A., Dollner, M., Day, D. A., Cuevas, C. A., Campuzano-Jost, P., Burkholder, J., Bui, T. P., Brune, W. H., Brown, S. S., Brock, C. A., Bourgeois, I., Blake, D. R., Apel, E. C., and Ryerson, T. B.: Global airborne sampling reveals a previously unobserved dimethyl sulfide oxidation mechanism in the marine atmosphere, P. Nat. Acad. Sci. USA, 117, 4505–4510, https://doi.org/10.1073/pnas.1919344117, 2020.
Vermeuel, M. P., Novak, G. A., Jernigan, C. M., and Bertram, T. H.: Diel Profile of Hydroperoxymethyl Thioformate: Evidence for Surface Deposition and Multiphase Chemistry, Environ. Sci. Technnol., 54, 12521–12529, https://doi.org/10.1021/acs.est.0c04323, 2020.
von Hobe, M., Spelten, N., Kloss, C., Khattatov, T., Li, Y., and Stroh, F.: A compact low cost permeation oven, Atmos. Meas. Tech., in preparation, 2023.
Whelan, M. E., Lennartz, S. T., Gimeno, T. E., Wehr, R., Wohlfahrt, G., Wang, Y., Kooijmans, L. M. J., Hilton, T. W., Belviso, S., Peylin, P., Commane, R., Sun, W., Chen, H., Kuai, L., Mammarella, I., Maseyk, K., Berkelhammer, M., Li, K.-F., Yakir, D., Zumkehr, A., Katayama, Y., Ogée, J., Spielmann, F. M., Kitz, F., Rastogi, B., Kesselmeier, J., Marshall, J., Erkkilä, K.-M., Wingate, L., Meredith, L. K., He, W., Bunk, R., Launois, T., Vesala, T., Schmidt, J. A., Fichot, C. G., Seibt, U., Saleska, S., Saltzman, E. S., Montzka, S. A., Berry, J. A., and Campbell, J. E.: Reviews and syntheses: Carbonyl sulfide as a multi-scale tracer for carbon and water cycles, Biogeosciences, 15, 3625–3657, https://doi.org/10.5194/bg-15-3625-2018, 2018.
Wu, R., Wang, S., and Wang, L.: New Mechanism for the Atmospheric Oxidation of Dimethyl Sulfide. The Importance of Intramolecular Hydrogen Shift in a CH3SCH2OO Radical, J. Phys. Chem. A, 119, 112–117, https://doi.org/10.1021/jp511616j, 2015.
Ye, Q., Goss, M. B., Isaacman-VanWertz, G., Zaytsev, A., Massoli, P., Lim, C., Croteau, P., Canagaratna, M., Knopf, D. A., Keutsch, F. N., Heald, C. L., and Kroll, J. H.: Organic Sulfur Products and Peroxy Radical Isomerization in the OH Oxidation of Dimethyl Sulfide, ACS Earth Space Chem., 5, 2013–2020, https://doi.org/10.1021/acsearthspacechem.1c00108, 2021.
Ye, Q., Goss, M. B., Krechmer, J. E., Majluf, F., Zaytsev, A., Li, Y., Roscioli, J. R., Canagaratna, M., Keutsch, F. N., Heald, C. L., and Kroll, J. H.: Product distribution, kinetics, and aerosol formation from the OH oxidation of dimethyl sulfide under different RO2 regimes, Atmos. Chem. Phys., 22, 16003–16015, https://doi.org/10.5194/acp-22-16003-2022, 2022.