the Creative Commons Attribution 4.0 License.
the Creative Commons Attribution 4.0 License.
 | 25 Sep 2023
Evolution of atmospheric age of particles and its implications for the formation of a severe haze event in eastern China
Xiaodong Xie
Jianlin Hu
Momei Qin
Dongsheng Ji
Hongli Wang
Shengrong Lou
Cheng Huang
Chong Liu
Hongliang Zhang
Hong Liao
Yuanhang Zhang
Atmospheric age reflects how long particles have been suspended in the atmosphere, which is closely associated with the evolution of air pollutants. Severe regional haze events occur frequently in China, influencing air quality, human health, and regional climate. Previous studies have explored the characteristics of mass concentrations and compositions of fine particulate matter (PM2.5) during haze events, but the evolution of atmospheric age remains unclear. In this study, the age-resolved University of California, Davis/California Institute of Technology (UCD/CIT) model was developed and applied to simulate the concentration and age distribution of PM2.5 during a severe regional haze episode in eastern China. The results indicated that PM2.5 concentrations in the North China Plain (NCP) gradually accumulated due to stagnant weather conditions during the beginning stage of the haze event. Accordingly, the atmospheric age of elemental carbon (EC), primary organic aerosol (POA), sulfate (), and secondary organic aerosol (SOA) gradually increased. The subsequent PM2.5 concentration growth was driven by the local chemical formation of nitrate () under high relative humidity. The newly formed particles led to a decrease in the mean atmospheric age of particles. During the regional transport stage, aged particles from the NCP moved to the downwind Yangtze River Delta (YRD) region, leading to a sharp increase in PM2.5 concentrations and the average age of EC, POA, , and SOA in YRD. In contrast, the average age of and ammonium remained unchanged or even slightly decreased due to continuous local formation in the YRD region. Different evolution of the atmospheric age among these components provides a unique perspective on the formation of PM2.5 components during the regional haze event. The information can also be used for designing effective control strategies for different components of PM2.5.
- Article
(12419 KB) - Full-text XML
-
Supplement
(7283 KB) - BibTeX
- EndNote


Haze pollution is a chronic environmental issue in China, influencing atmospheric visibility (Li et al., 2019; Pui et al., 2014), human health (C. Wang et al., 2021; Lelieveld et al., 2015; Cohen et al., 2017), ecosystems (Xie et al., 2020; Gu et al., 2002; Cirino et al., 2014), and climate (Ramanathan et al., 2001; Seinfeld et al., 2016; IPCC, 2021). Fine particulate matter, also known as PM2.5, the major pollutant during haze days, is either directly emitted into the atmosphere or formed from precursor gases through chemical processes. Although the annual mean PM2.5 concentrations in Chinese megacities have been substantially reduced in recent years because of the strict emission control measures (Wang et al., 2019; Q. Zhang et al., 2019), severe regional haze pollution (PM2.5>150 µg m−3) still frequently occurs in densely populated regions, such as the North China Plain (NCP) and the Yangtze River delta (YRD; An et al., 2019).
Intensive pollutant emissions and unfavorable meteorology are two key factors controlling haze formation. NCP and YRD are two major city clusters in eastern China with intensive anthropogenic emissions. Previous studies have revealed that severe winter haze events in the NCP were initialized by the accumulation of local emissions under stable weather conditions and further deteriorated by rapid secondary formation (An et al., 2019; Zheng et al., 2015). Polluted air masses in the NCP are rapidly eliminated by the strong prevailing northwesterly wind and moved downwind to the YRD regions (X. Wang et al., 2021). During the long-range transport, freshly emitted particles gradually age and mix with secondary inorganic and organic species, further influencing regional climate and air quality through aerosol–planetary boundary layer (PBL) interaction (Huang et al., 2020; Zhang et al., 2021).
The atmospheric age of an air pollutant, defined as the time since it is emitted or formed, provides a unique perspective on the evolution of pollutants in the atmosphere (Wagstrom and Pandis, 2009; Ying et al., 2021; H. Zhang et al., 2019). Unlike the lifetime or residence time of pollutants, atmospheric age refers to the time that a single particle remains in the atmosphere at a given location and time, which can better reflect its instantaneous physical and chemical properties (Chen et al., 2017). However, measuring and calculating the atmospheric age of air pollutants is difficult because of their chemical nonlinearity and process complexity. Previous studies have attempted to track particle age distributions by adding tracers in Lagrangian trajectory models such as FLEXPART (Stohl et al., 2003). However, due to the simplified chemistry, this method cannot accurately determine the age distributions of secondary species. Some other studies estimated the photochemical age of an air mass using the ratio of hydrocarbons, including toluene benzene and ethylbenzene benzene (Chu et al., 2021; Parrish et al., 2007). Since the oxidation rates of these hydrocarbons by hydroxyl (OH) radicals vary widely, the hydrocarbon ratios change with photochemical aging (Chen et al., 2021). By this definition, the photochemical age determines the degree of photochemical processing associated with OH radicals rather than the physical age of pollutants (Irei et al., 2016).
A few attempts were made to track the age distribution of aerosols using chemical transport models (CTMs; Han and Zender, 2010; Wagstrom and Pandis, 2009; Wu et al., 2017). CTMs can reproduce the evolution of pollutants in the atmosphere (including emission, transport, deposition, and chemical transformation). H. Zhang et al. (2019) introduced a dynamic age-bin-updating algorithm in the source-oriented University of California, Davis/California Institute of Technology (UCD/CIT) air quality model to track the age distribution of primary PM2.5. In their study, chemical variables in the UCD/CIT model were expanded by adding an additional dimension to represent pollutants with varying atmospheric ages, and the evolution of particle concentrations between different age bins was dynamically updated at a fixed frequency. The dynamic age-bin-updating algorithm can be represented in Eq. (1).
where t is the age bin index, and n is the total number of age bins. More recently, this dynamic age-bin-updating algorithm was used to determine the age distribution of primary and secondary inorganic compounds in the Community Multiscale Air Quality (CMAQ) model (Ying et al., 2021). In this study, we further developed the age-resolved UCD/CIT model to track the atmospheric age distribution of various primary and secondary components of PM2.5, based on the method used by H. Zhang et al. (2019). Different from that of Ying et al. (2021), the atmospheric age of secondary aerosols is calculated based on the time they are formed in the atmosphere. Then we applied the model to investigate the evolution of the concentrations and ages of the major PM2.5 components during a typical winter haze episode in eastern China.
2.1 Description of UCD/CIT model
The source-oriented UCD/CIT air quality model (Held et al., 2004; Hu et al., 2014, 2015; Kleeman and Cass, 2001; Ying et al., 2007; Ying and Kleeman, 2006) was used in this study to simulate air quality in eastern China. The UCD/CIT model is a 3-dimensional Eulerian regional CTM with detailed chemistry and aerosol mechanisms. Details about the fundamental algorithms used in the UCD/CIT model can be found in the above references. Briefly, gas-phase chemistry is modeled by the SAPRC-11 chemical mechanism (Carter and Heo, 2013). Aerosols are represented using a sectional approach, with 15 log-spaced size bins encompassing 10 nm–10 µm. Thermodynamic equilibrium for inorganic aerosols is calculated by ISORROPIA (Nenes et al., 1998). Secondary organic aerosol (SOA) treatment is based on the two-product model used in the Community Multiscale Air Quality (CMAQ) model, including a total of 19 semivolatile or nonvolatile species from seven precursors (Carlton et al., 2010).
In most existing air quality models, particles from diverse emission sources are mixed. However, the UCD/CIT model applies a source-oriented framework in which primary and secondary particles from each source category are tracked separately through the calculation of all major atmospheric processes, such as advection, diffusion, deposition, and gas particle partitioning. Thus, the source contributions to regional particle concentrations can be evaluated. H. Zhang et al. (2019) expanded the source-oriented UCD/CIT model to track the age distribution of elemental carbon (EC) in the atmosphere. In this study, we implemented the atmospheric age distribution modeling framework to track the age distribution of both primary and secondary aerosols. The age distribution of SOA was added to the framework, making it possible to have complete age-resolved modeling of secondary aerosols.
The age-resolved UCD/CIT model employs a sectional approach to track particles of different atmospheric ages (n age bins). Freshly emitted or formed particles at each model time step are set to the lowest age bin. At a fixed age-bin-updating frequency (Δτ), particles in the lower age bin would be moved to the higher age bin successively. Particles in the last age bin represent those older than the highest explicit age. The average age of particles in the ith age bin () is approximately equal to the middle of that period.
The average age of particles can be calculated by
2.2 Model setup
The age-resolved UCD/CIT model was run from 21 December 2017 to 2 January 2018, with the first 4 d as the spin-up period to minimize the impact of initial conditions. The model domain has a horizontal resolution of 36 km that encompasses eastern China (Fig. 1) and a vertical structure of 16 layers with 10 layers below 1 km. Hourly meteorological inputs were generated by the Weather Research Forecasting (WRF) model version 4.2 with initial and boundary conditions from the 1.0∘ × 1.0∘ National Centers for Environmental Prediction Final (NCEP FNL) operational global analyses dataset. More details on the WRF model configuration can be found in Xie et al. (2023).
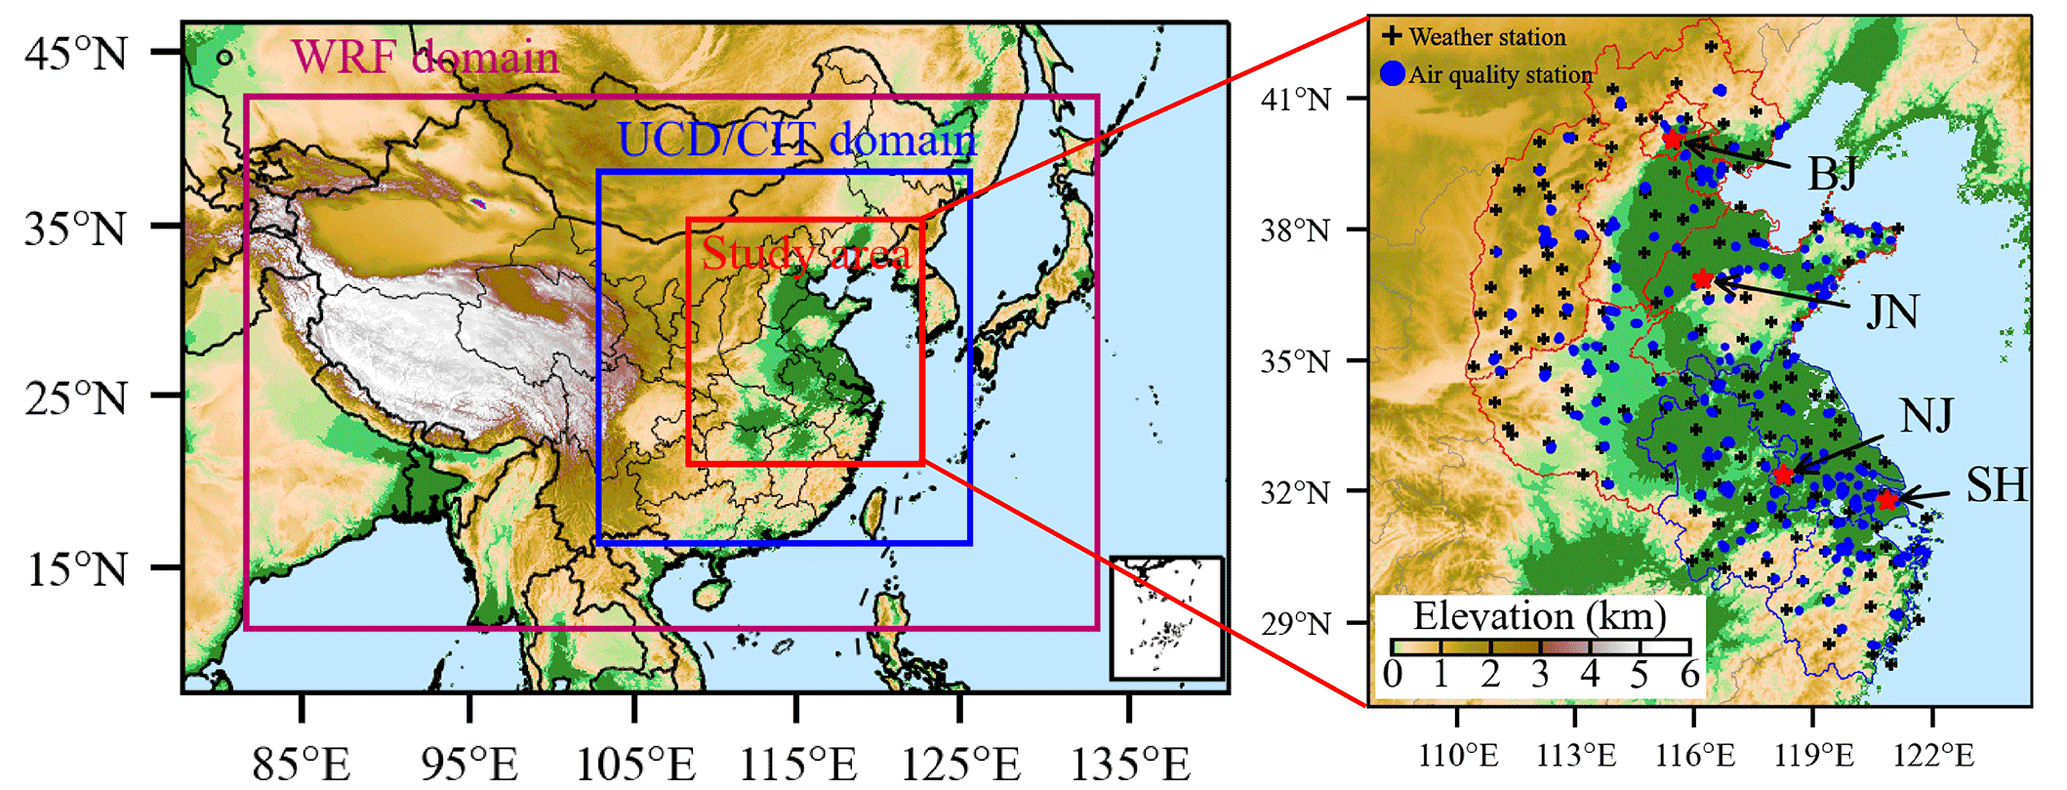
Figure 1Modeling domains and the locations of the observation stations. Black crosses represent the weather stations, and blue dots represent the air quality stations. Four main cities (BJ is for Beijing, JN is for Jinan, NJ is for Nanjing, and SH is for Shanghai) in eastern China are also marked by red stars.
Anthropogenic emissions were taken from the MEIC (Multi-resolution Emission Inventory for China) v1.3, with a spatial resolution of 0.25∘ × 0.25∘ (Zheng et al., 2018). FINN (Fire INventory from NCAR) v1.5, with 1 km resolution (Wiedinmyer et al., 2011), and MEGAN (Model of Emissions of Gases and Aerosols from Nature) v2.10 (Guenther et al., 2006), driven by meteorological inputs from WRF, were used to provide wildfire and biogenic emissions, respectively. Total particle-phase emissions from the abovementioned sources were transformed into size-resolved emissions, based on measured source profiles (Hu et al., 2015; Kleeman et al., 2008; Robert et al., 2007a, b). The fraction of total particulate emissions assigned to each size bin is shown in Table S1 in the Supplement. In addition, sea salt and dust emissions were calculated online within the model, based on wind speed and land use type, as described in Hu et al. (2015).
A total of nine age bins were configured to determine the age distribution of particles in this study. The age-bin-updating frequency was set to 12 h in our base simulation so that we could explicitly track particle ages up to 96 h. However, PM2.5 concentrations can grow explosively during our study period within several hours. Thus, another four simulations with age-bin-updating intervals of 1, 3, 6, and 8 h were also conducted to better reflect the age distribution of particles (Table S2). Results from different simulations were combined by replacing the low-time-resolution simulations with the corresponding high-time-resolution results (Ying et al., 2021). The simulated concentrations of PM2.5 and its major components from the age-resolved model show good agreement with the original UCD/CIT model (Fig. S1), confirming that the dynamic age-bin-updating algorithm will not change the concentration prediction. The computational burden of the age-resolved UCD/CIT model with nine age bins is ∼ 3 times higher than the original model.
2.3 Field observations
Hourly meteorological data, including 2 m air temperature (T2 m), 10 m wind speed (WS) and wind direction (WD), and 2 m relative humidity (RH) were collected from 171 routine weather stations in eastern China (Fig. 1) from the Chinese National Meteorological Center (http://data.cma.cn/en, last access: 16 September 2023). Surface PM2.5 observations were acquired from the national air quality monitoring network developed by the China National Environmental Monitoring Center (http://www.cnemc.cn/en, last access: 16 September 2023). Measurements of the aerosol composition were conducted at four main cities in eastern China, including Beijing, Jinan, Nanjing, and Shanghai. Water-soluble inorganic ions (WSIIs; including nitrate, , sulfate, , and ammonium, ) were measured by an online analyzer (MARGA, Monitor for AeRosols and Gases in Ambient Air, model ADI 2080; Applikon Analytical B. V., the Netherlands) with a PM2.5 cyclone inlet in Jinan, Nanjing, and Shanghai (Shu et al., 2019). In Beijing, the mass concentrations of WSIIs were analyzed by two ion chromatography systems (Dionex ICS-2000 and ICS-2500 for cations and anions, respectively; Tan et al., 2018). Carbonaceous components (organic carbon, OC, and EC) in four cities were analyzed with a carbon analyzer (model RT-4, Sunset Laboratory Inc., USA) based on the thermal-optical transmittance method (H. L. Wang et al., 2016). The measured OC was converted to organic matter (OM) by multiplying by a factor of 1.64 (Tan et al., 2018). More details about the principles and operation of the above instruments can be found in the corresponding references.
The incremental mass ratio (IMR) proposed by Tan et al. (2018) was adopted in this study to determine the aerosol components that drive the particle concentration growth during the haze episode. Briefly, the IMR of a certain component i (IMRi) is calculated as the ratio of the increment of component i (ΔCi) to the increment of PM2.5 (ΔPM2.5) total mass during the PM2.5 growth stage.
Thus, the contribution of each chemical composition to the PM2.5 increment can be calculated.
3.1 Episode description and model evaluation
Figure 2 shows a severe regional haze episode over eastern China spanning from 25 December 2017 to 2 January 2018. The time series of PM2.5 concentrations in eastern China indicates that PM2.5 gradually accumulated in the NCP (see red lines in Fig. 2c–e; in the following sections, NCP refers to this region) from 25–28 December 2017 under the condition of low wind speed (∼ 2 m s−1) and rising RH (Fig. S2), which is identified as the accumulation stage. Severe haze pollution characterized by high PM2.5 concentrations (> 150 µg m−3) persisted from the night of 28 December to the morning of 30 December, while the peak value of PM2.5 reached 191 µg m−3 at 10:00 LT on 29 December (stabilization stage). On 30 December, a cold front formed in the NCP, where the cold air in front of the Siberian High encountered the warm air from the south (Fig. S3). As a result, the wind speed increased sharply from 2.5 to 5.7 m s−1 within 6 h, followed by a steep drop in air temperature from 4.3 to −7.0 ∘C (Fig. S2). Under the influence of strong northwesterly winds, a continuous movement of PM2.5 from north to south (i.e., Taiyuan, Linfen, Shijiazhuang, Zhengzhou, Nanjing, and Shanghai) occurred, and the polluted air masses dissipated quickly in the NCP within several hours (dilution stage; Fig. S4). Consequently, severe haze pollution formed rapidly in the YRD (see blue lines in Fig. 2c–e; in the following sections, YRD refers to this region) during 30–31 December due to regional transport from the NCP, with the peak value of PM2.5 concentrations being greater than 200 µg m−3.
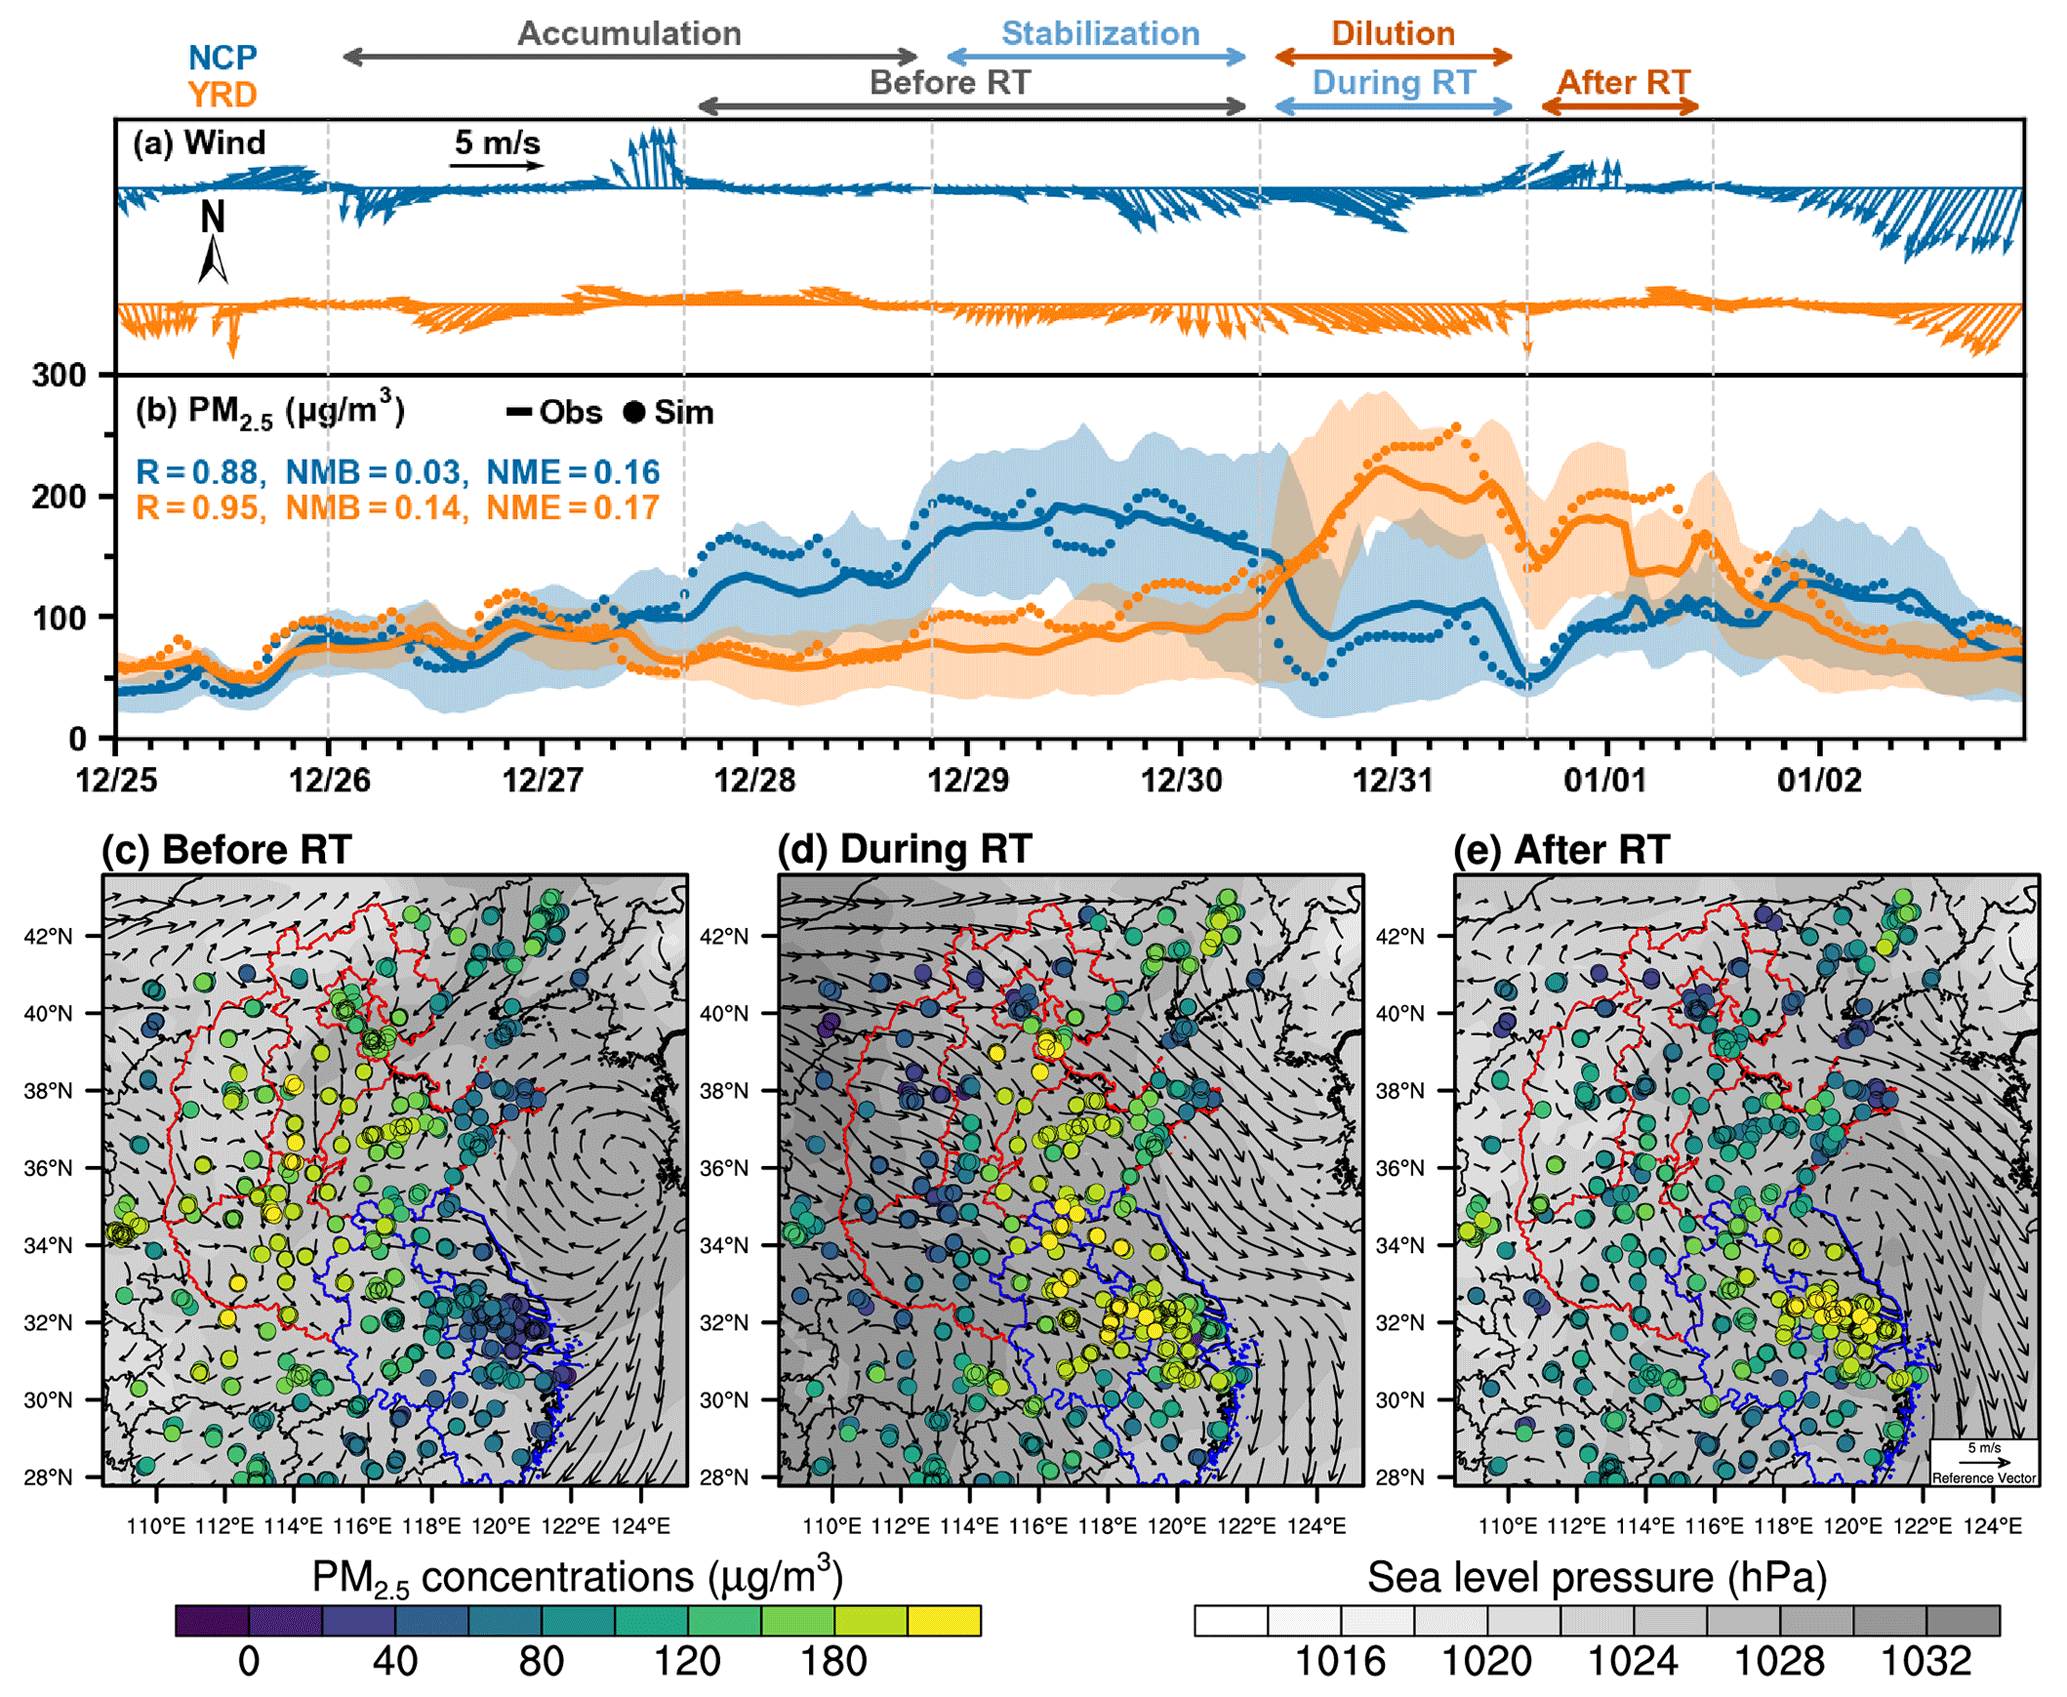
Figure 2Time series and spatial distributions of wind fields and PM2.5 during this haze episode. (a, b) Observed wind and PM2.5 concentrations in the NCP (red lines in panels c–e) and YRD (blue lines in panels c–e). Shaded areas represent the 25th–75th percentile range of observation. Solid dots mark the simulated PM2.5 concentrations. (c–e) Observed PM2.5 concentrations, WRF-simulated wind fields, and sea level pressure before, during, and after regional transport (RT).
To better explore the characteristics of PM2.5 pollution in the YRD, the haze episode was divided into three stages (before, during, and after regional transport) in this study, according to PM2.5 concentrations and winds (Fig. 2a and b). Before regional transport, PM2.5 concentrations in the NCP (> 250 µg m−3) were much higher than those in the YRD (∼ 70 µg m−3). Low wind speed (∼ 2 m s−1) favored the accumulation of air pollutants in the NCP. Meanwhile, southeasterly winds prevailed in the coastal areas of the YRD, bringing fewer polluted air masses. In the following 1–2 d, eastern China was under the control of strong northwesterly winds (4–5 m s−1) due to the cold front, and the heavily polluted air masses gradually moved from north to south (Fig. 2d). After the cold front passes, high pressure controls the YRD, leading to subsidence and trapping of PM2.5 in the PBL. Thus, high concentrations of PM2.5 occurred in the YRD with low wind speed, especially in Jiangsu and Shanghai (Fig. 2e).
The UCD/CIT model reproduces the observed temporal variations in the hourly PM2.5 concentrations averaged over the NCP and the YRD well during this haze episode, with a high correlation coefficient (R>0.85) and a low normalized mean bias (NMB < 15 %; Fig. 2b). High PM2.5 concentrations (> 150 µg m−3) with low wind speed over the southern Hebei, Shandong, Henan, northern Jiangsu, and Anhui provinces are well captured by the model (Fig. S5). The simulated PM2.5 compositions (, , , EC, and OM) also agree well with the daily averaged measurements in Beijing, Jinan, Nanjing, and Shanghai (Fig. S6), with the model performance statistics being comparable to those in other studies (Shi et al., 2017; Hu et al., 2016; Q. Zhang et al., 2019). Detailed model evaluation about meteorological parameters and concentrations of PM2.5 and its major chemical compositions can be found in the Supplement. Note that there are currently no techniques to measure particle age quantitatively. Therefore, no observational age data are available to directly evaluate the predicted age results. Nevertheless, the evolution of particle chemical compositions over time is related to the ages, so we assume that the validated chemical composition results can also provide confidence in the predicted age information.
3.2 Evolution of particle chemical compositions
Figure 3 shows the observed chemical composition evolution in Beijing, Jinan, Nanjing, and Shanghai. , , and (denoted SNA hereafter) increased rapidly and became the major component of PM2.5 during the PM2.5 growth stage in all four cities, while the mass fraction of EC and OM in PM2.5 decreased. In Beijing and Jinan, located in the NCP, the daily averaged SNA concentrations increased from 10 and 22 µg m−3 on 25 December to 110 and 157 µg m−3 on 29 December, and their mass fraction in PM2.5 increased from ∼ 40 % to ∼ 75 %. Particularly, exhibited the highest levels among SNA in all four cities. The peak value of was 49, 57, 80, and 51 µg m−3 for Beijing, Jinan, Nanjing, and Shanghai, respectively, contributing to 25 %–41 % of PM2.5 mass concentrations. The IMR of (29 %–33 %) was much higher than that of other components in Beijing, Nanjing, and Shanghai (Figs. 3e and S7), indicating that was the driving component during the PM2.5 growth stage. In Jinan, the IMR of (26 %) was slightly higher than that of (24 %). Nevertheless, the mass fraction of in PM2.5 during the PM2.5 growth stage (25–29 December) was 26 %, significantly larger than that of (16 %) and (15 %). The higher fraction of in PM2.5 and its dominant contribution to the PM2.5 growth stage have also been pointed out by recent observation and modeling studies conducted in eastern China during winter haze periods (Shao et al., 2018; Xu et al., 2019; Xie et al., 2022).
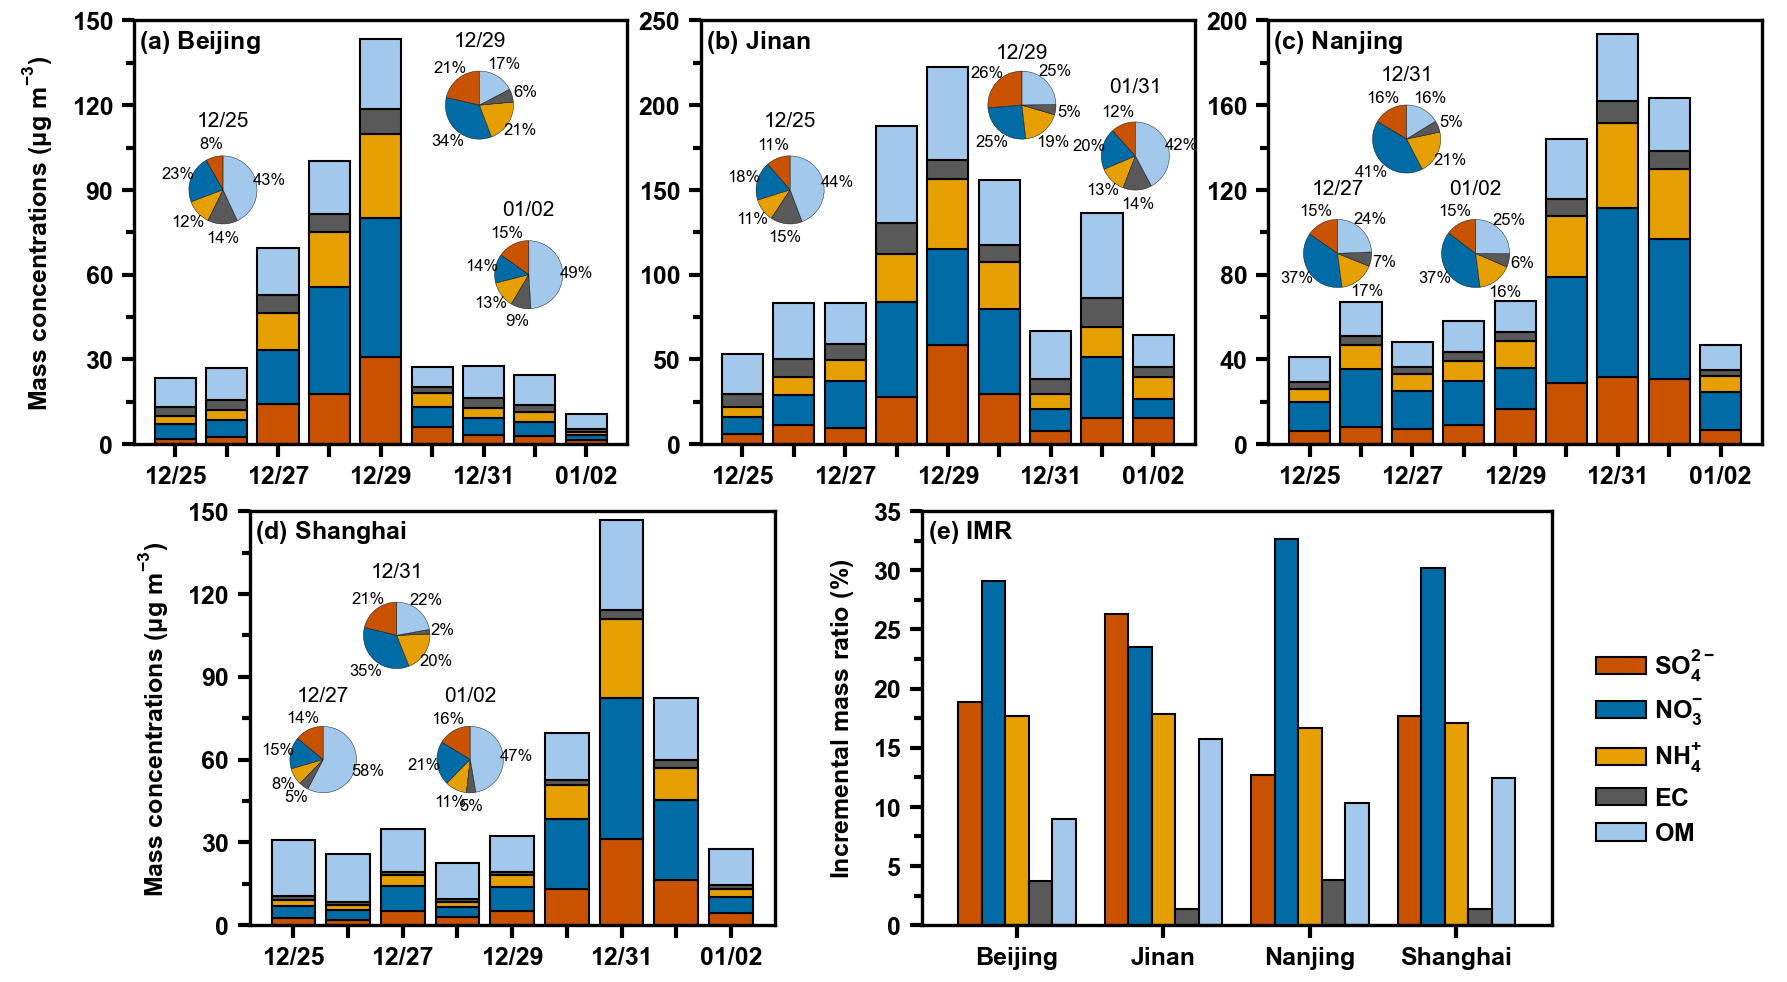
Figure 3Mass concentrations and fractions (a–d) and incremental mass ratio (e) of the major PM2.5 chemical compositions (, , , EC, and OM) in Beijing, Jinan, Nanjing, and Shanghai.
During 25–29 December, the NCP region was under the control of a uniform pressure field with low horizontal winds (Fig. S3), and pollutants gradually accumulated under such stagnant conditions. The observed RH gradually increased, and the maximum exceeded 80 % on 28–29 December, which facilitated the chemical formation of secondary aerosols and accelerated the hygroscopic growth of particles (Cheng et al., 2016; Sun et al., 2014; Yang et al., 2015). Process analysis also indicates that chemical formation is the driving process for the growth of SNA in the NCP, with its net production rate being ∼ 3 times larger than that of vertical mixing and horizontal advection during the accumulation stage (Fig. 4a and b). For YRD cities, Nanjing and Shanghai, daily SNA concentrations increased sharply by 3–6 times within 2 d (30–31 December) and accounted for 78 % of the peak PM2.5. Horizontal advection played a dominant role during the explosive growth of air pollutants, with a maximum production rate of 8.1 and 2.7 for and , respectively (Fig. 4c and d). The chemical process also contributed obviously to and in Nanjing during the regional transport, indicating the continuous local formation in the YRD regions.
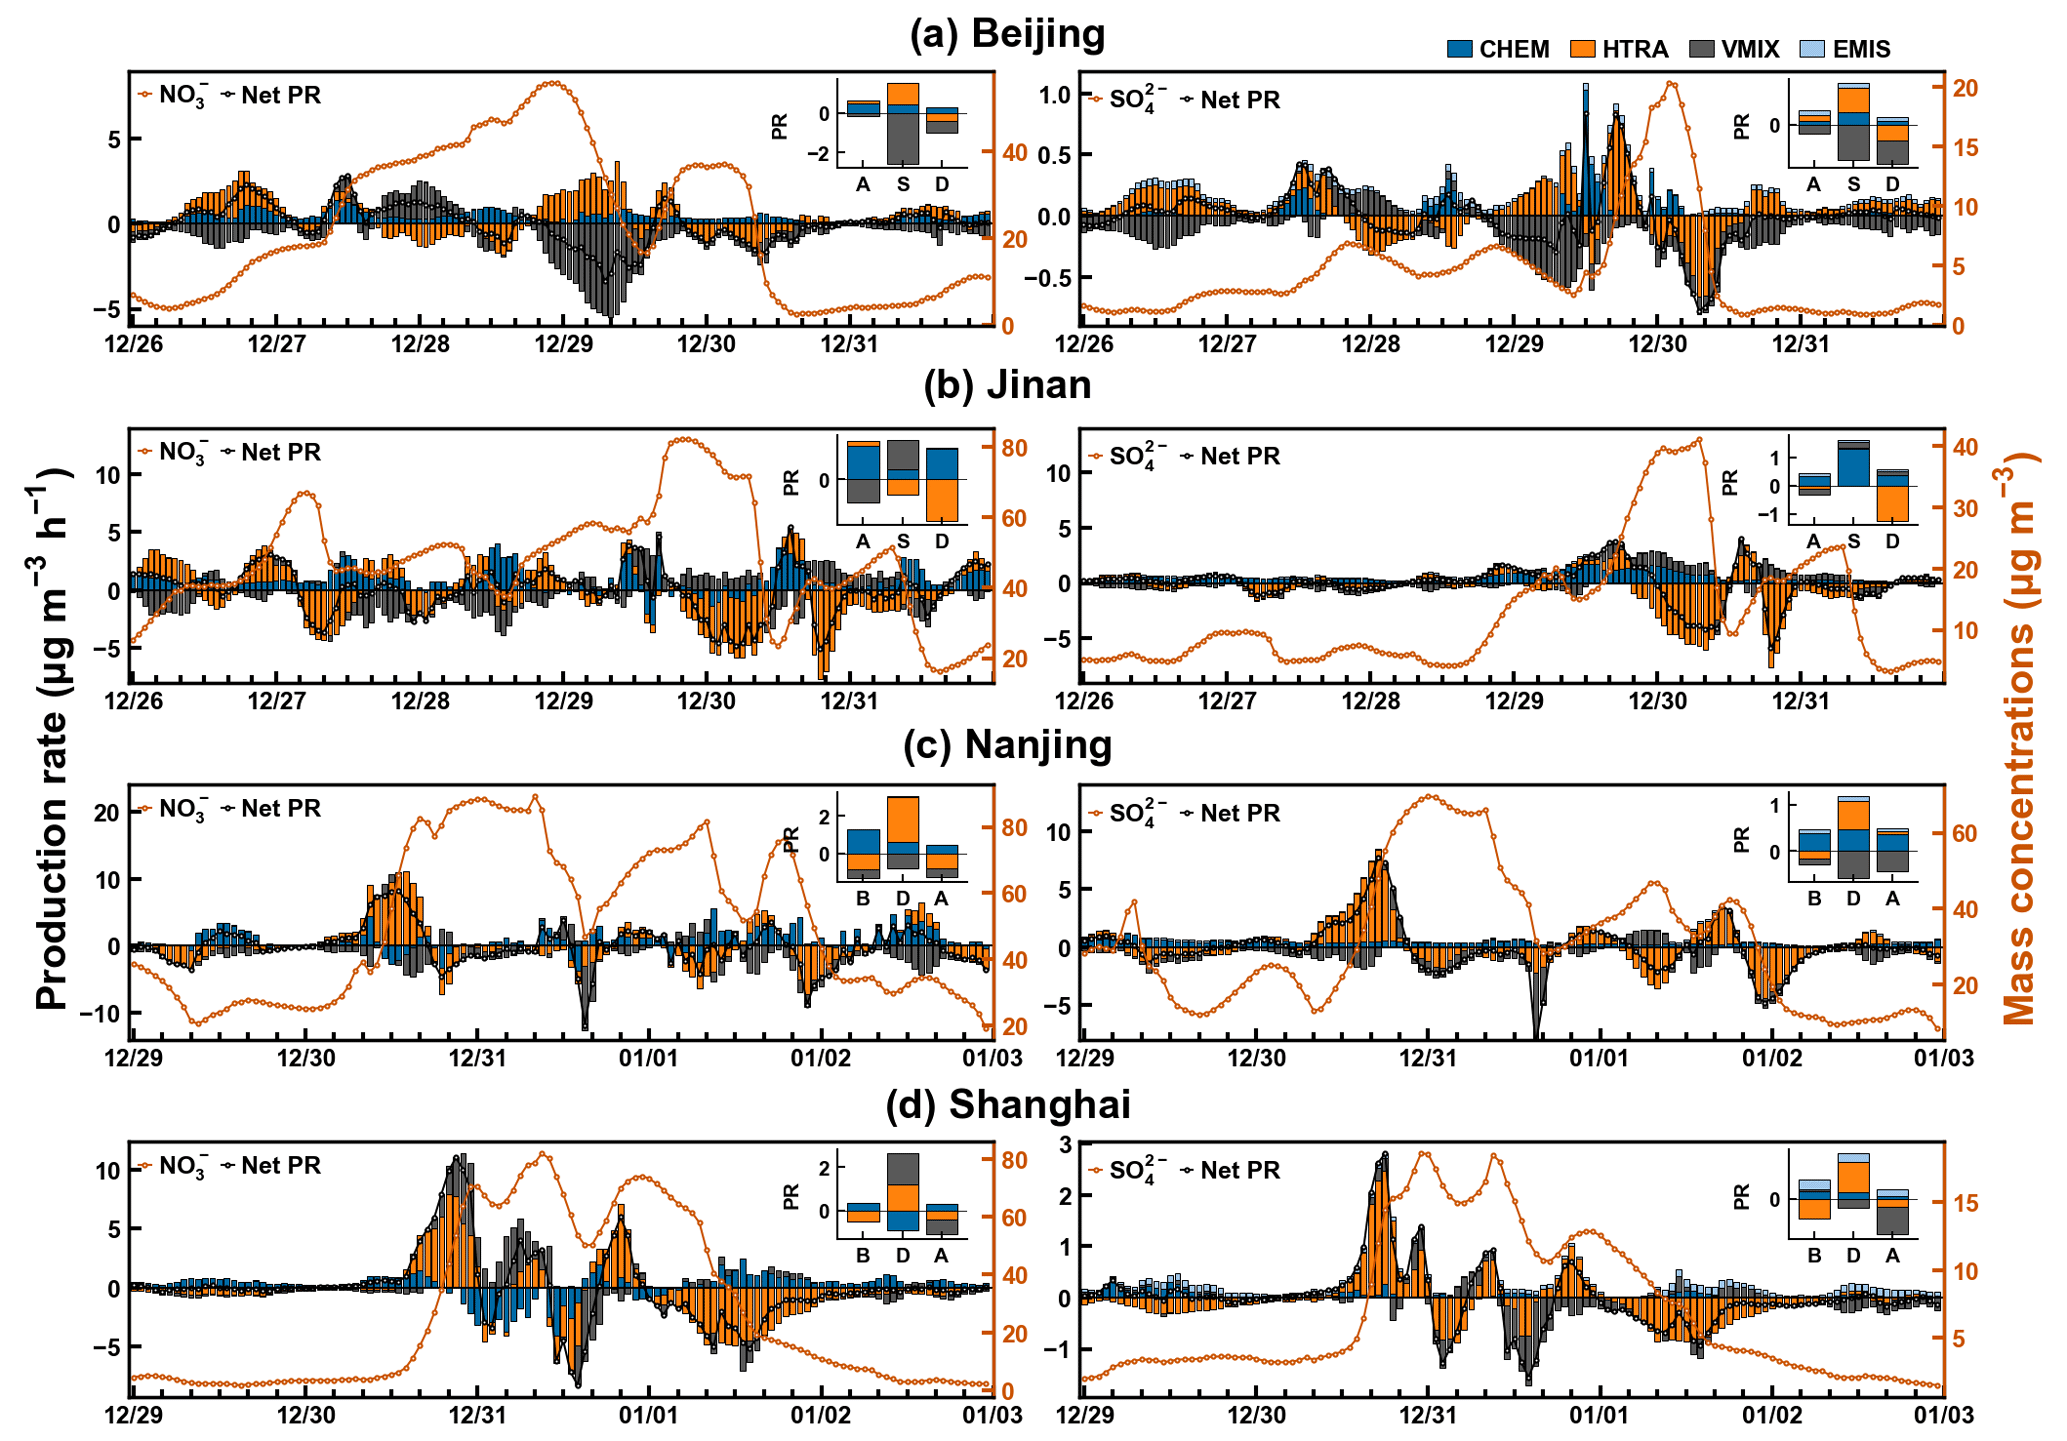
Figure 4The contributions of physicochemical processes (CHEM is the gas-phase, aerosol, and cloud chemistry; VMIX is the vertical mixing and dry deposition; HTRA is the horizontal advection; EMIS is the emission) to and concentrations within the first 10 layers in Beijing, Jinan, Nanjing, and Shanghai. The stacked bar graphs inserted in each panel represent the total contribution during the corresponding period. A, S, and D indicate the accumulation, stabilization, and dilution stage in Beijing and Jinan. B, D, and A represent the period before, during, and after regional transport in Nanjing and Shanghai.
3.3 Evolution of particle age distribution
The age distribution evolutions of the major PM2.5 compositions (EC, , , , POA, and SOA) in Beijing and Shanghai are illustrated in Figs. 5 and 6. High concentrations of EC, POA, and typically occurred at low atmospheric ages, with obvious diurnal variations in both cities. The bimodal distribution of fresh particles (defined as particles with atmospheric age < 24 h) was mainly related to the variations in local emissions and the evolution of PBL. Generally, the atmospheric age decreased in the early morning before sunrise (Fig. S8). This is because of the increased traffic emissions during the morning rush hour and the weakened vertical dispersion due to the low boundary layer height. The mean atmospheric age increased during the daytime because freshly emitted particles were mixed to a more developed boundary layer. In the late afternoon, the mean atmospheric age decreased again. The increased traffic and residential emissions during the evening rush hour and decreased mixing layer height both contribute to the reduction in the mean atmospheric age. From Figs. 5 and 6, some diagonal stripes can be easily observed, which indicate that the concentrations of particles dropped rapidly after being released due to the atmospheric dilution process such as advection and deposition. Nevertheless, under stable weather conditions with low wind speeds, the dilution effect was weak, and EC, POA, and particles could accumulate in the atmosphere for a longer time. This can be seen in Beijing from 25–29 December, with a gradually increasing mean atmospheric age of EC, POA, and . During this time, relatively high concentrations of aged EC, POA, and particles (with atmospheric age > 24 h) together with large contributions from fresh particles can also be observed (e.g., 12:00 to 18:00 LT on 28 December). On 30 December, aged EC, POA, and particles in Beijing were removed sharply by strong northwesterly wind, leading to a steep decrease (from ∼ 40 h to less than 6 h) in their mean atmospheric age. Subsequently, in Shanghai, the concentration of aged particles increased rapidly during the period from 14:00 LT on 30 December to 02:00 LT on 31 December, indicating the influence of regional transport. As a result, the mean atmospheric age of EC, POA, and increased from 3–6 to 47–52 h.
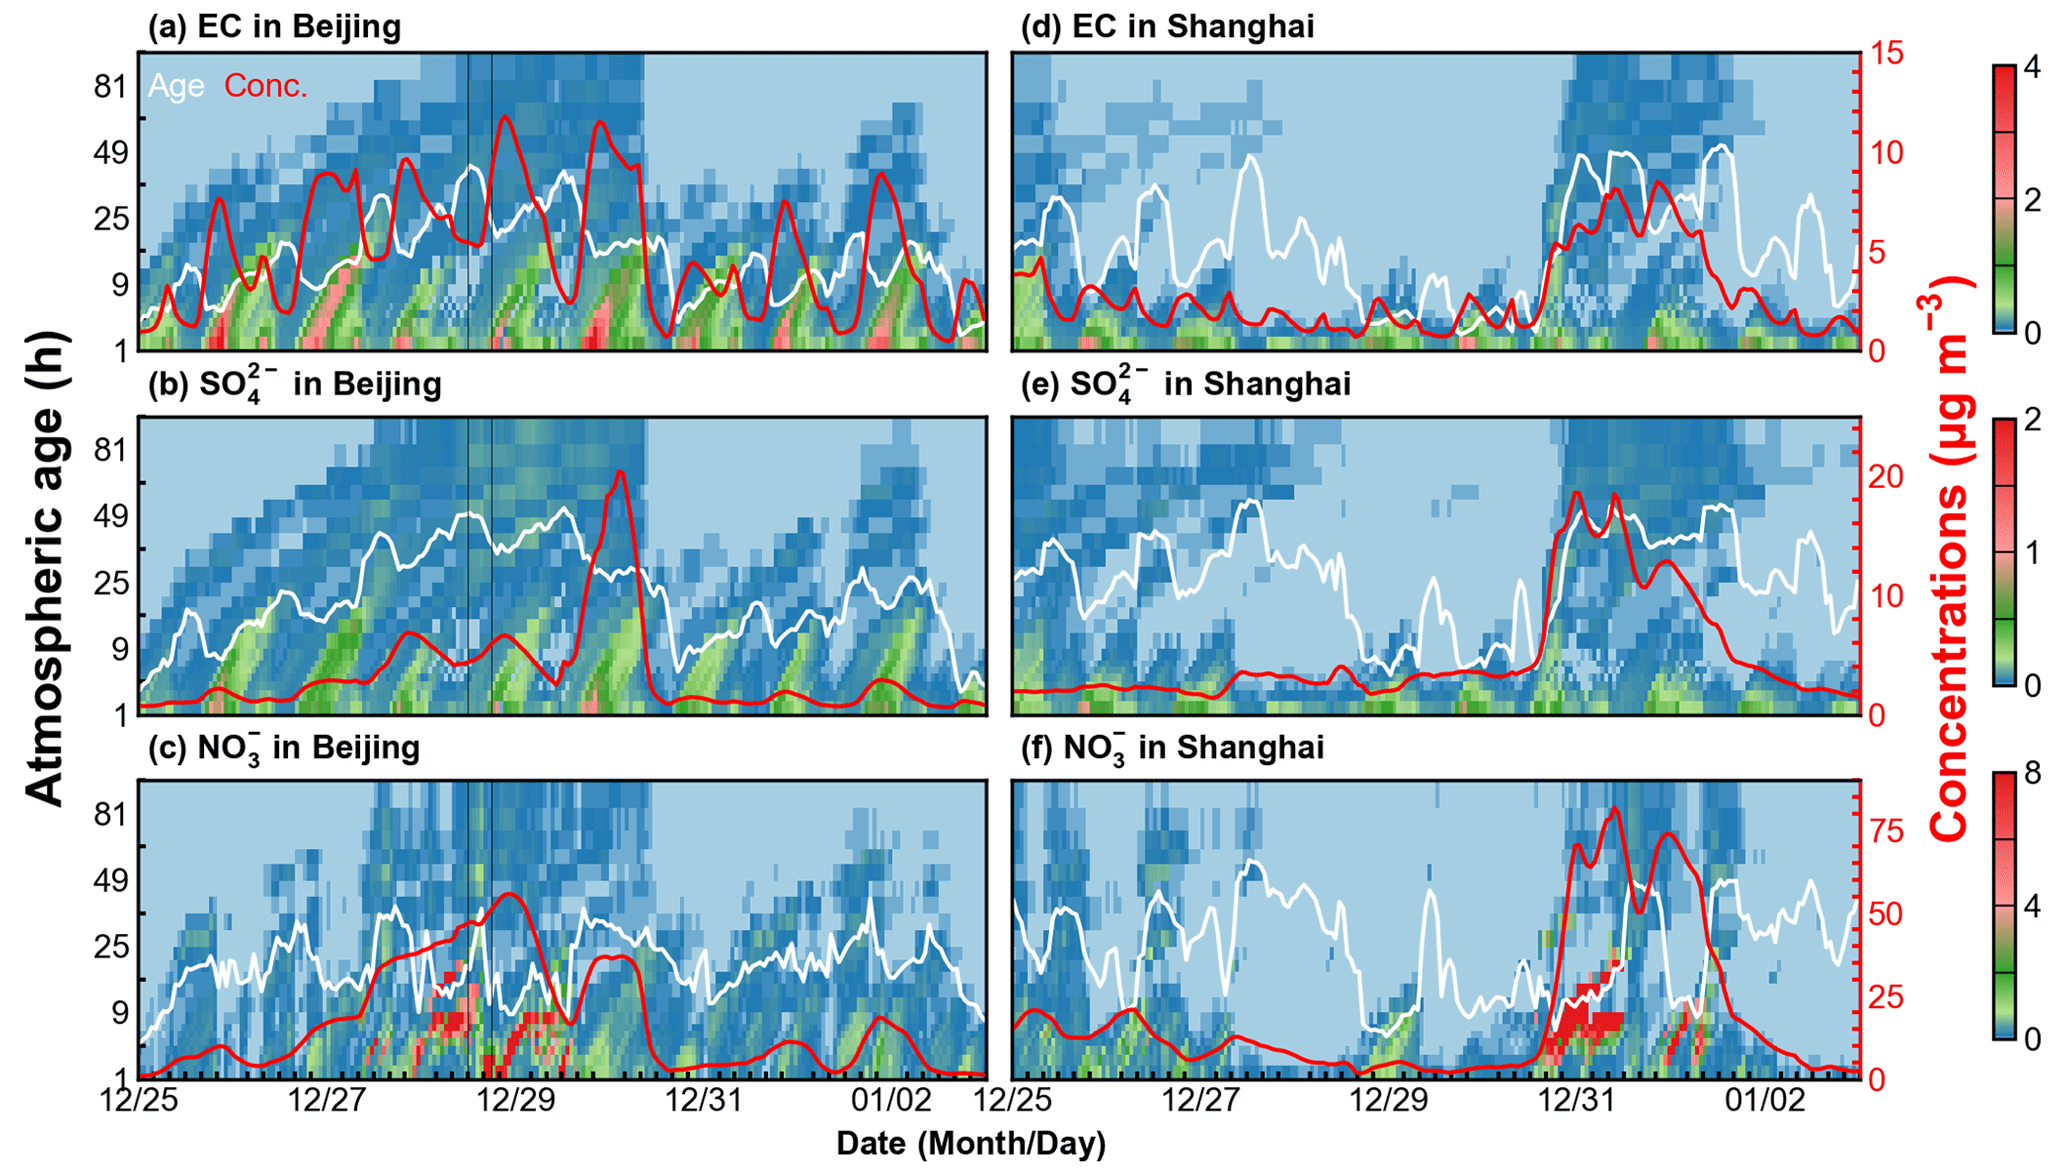
Figure 5Hourly atmospheric age distribution of EC, , and in Beijing and Shanghai during this haze episode. White lines represent the average atmospheric age, and red lines (right y axis) indicate total mass concentrations. The results were combined from simulations with age-bin-updating intervals of 1, 3, 6, 8, and 12 h. The black lines in panels (a)–(c) indicate 12:00 to 18:00 LT on 28 December.
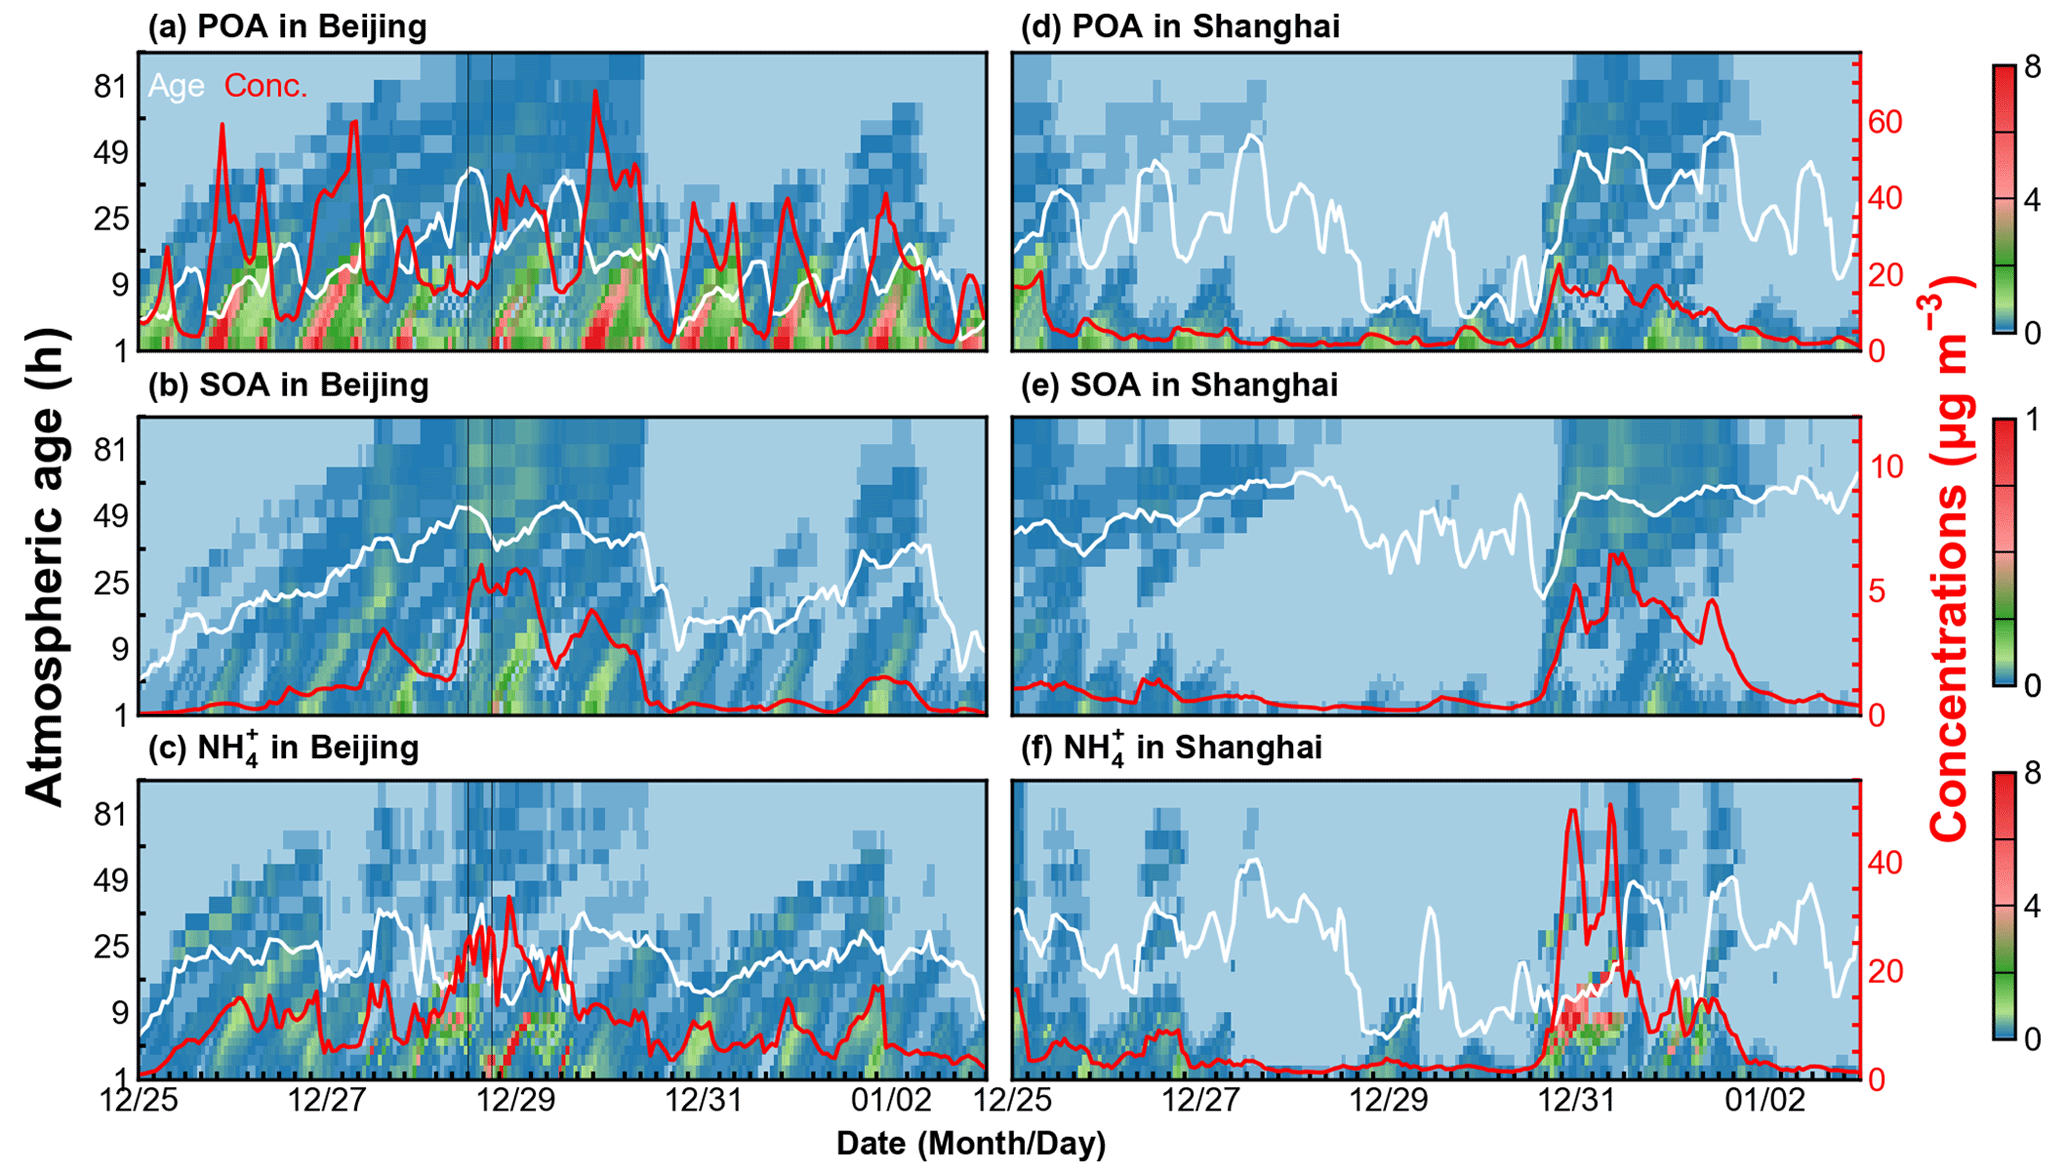
For both Beijing and Shanghai, the average age of SOA is generally larger than that of EC and POA, with a maximum average age of 55 and 69 h, respectively. Similar to that of EC, POA, and , the average age of SOA gradually increased during the accumulation stage in Beijing, and then decreased sharply on 30 December due to the sweeping effect of the strong northwesterly wind. In Shanghai, the average age of SOA increased from ∼ 20 to ∼ 60 h within several hours during the regional transport. Oligomers of anthropogenic SOA (AOLGA), xylene, toluene, long-chain alkanes, and monoterpenes were found to be the most important precursors, contributing over 95 % of the total SOA in Beijing, Jinan, Nanjing, and Shanghai (Figs. S9 and S10). The contribution of AOLGA increased with atmospheric age in all four cities, while the contributions of xylene, toluene, and long-chain alkanes decreased with age. In the NCP cities, the contribution of AOLGA to total SOA concentrations increased from 35 % in the accumulation stage to 48 % in the stabilization stage. This is because semivolatile SOA would not immediately form AOLGA after being released into the atmosphere, and the oligomerization reactions take time.
and exhibited different age distributions compared to EC, POA, , and SOA during the PM2.5 growth stage in all the four cities. The mean atmospheric age of and did not show an increasing trend and even decreased on some occasions during the accumulation stage in Beijing and Jinan (Figs. S11 and S12). Such a low atmospheric age was mainly due to the continuous formation of secondary NH4NO3 particles locally (Fig. S13), which increased the concentrations of fresh particles and decreased the mean age of and . High concentrations of fresh combined with a moderate contribution of aged can also be seen during the explosive growth stage (e.g., 16:00 to 23:00 LT on 30 December 2017) in Nanjing and Shanghai, indicating that the continuous local formation with additional help from regional transport together contribute to the high concentrations of . The average atmospheric age of in Jinan, Nanjing, and Shanghai decrease significantly with RH, and low average ages are often observed with a high concentration of (Fig. S15). This confirms our speculation that the rapid chemical formation of under high RH conditions (Fig. S2) leads to a high concentration of fresh and decreases the mean age of .
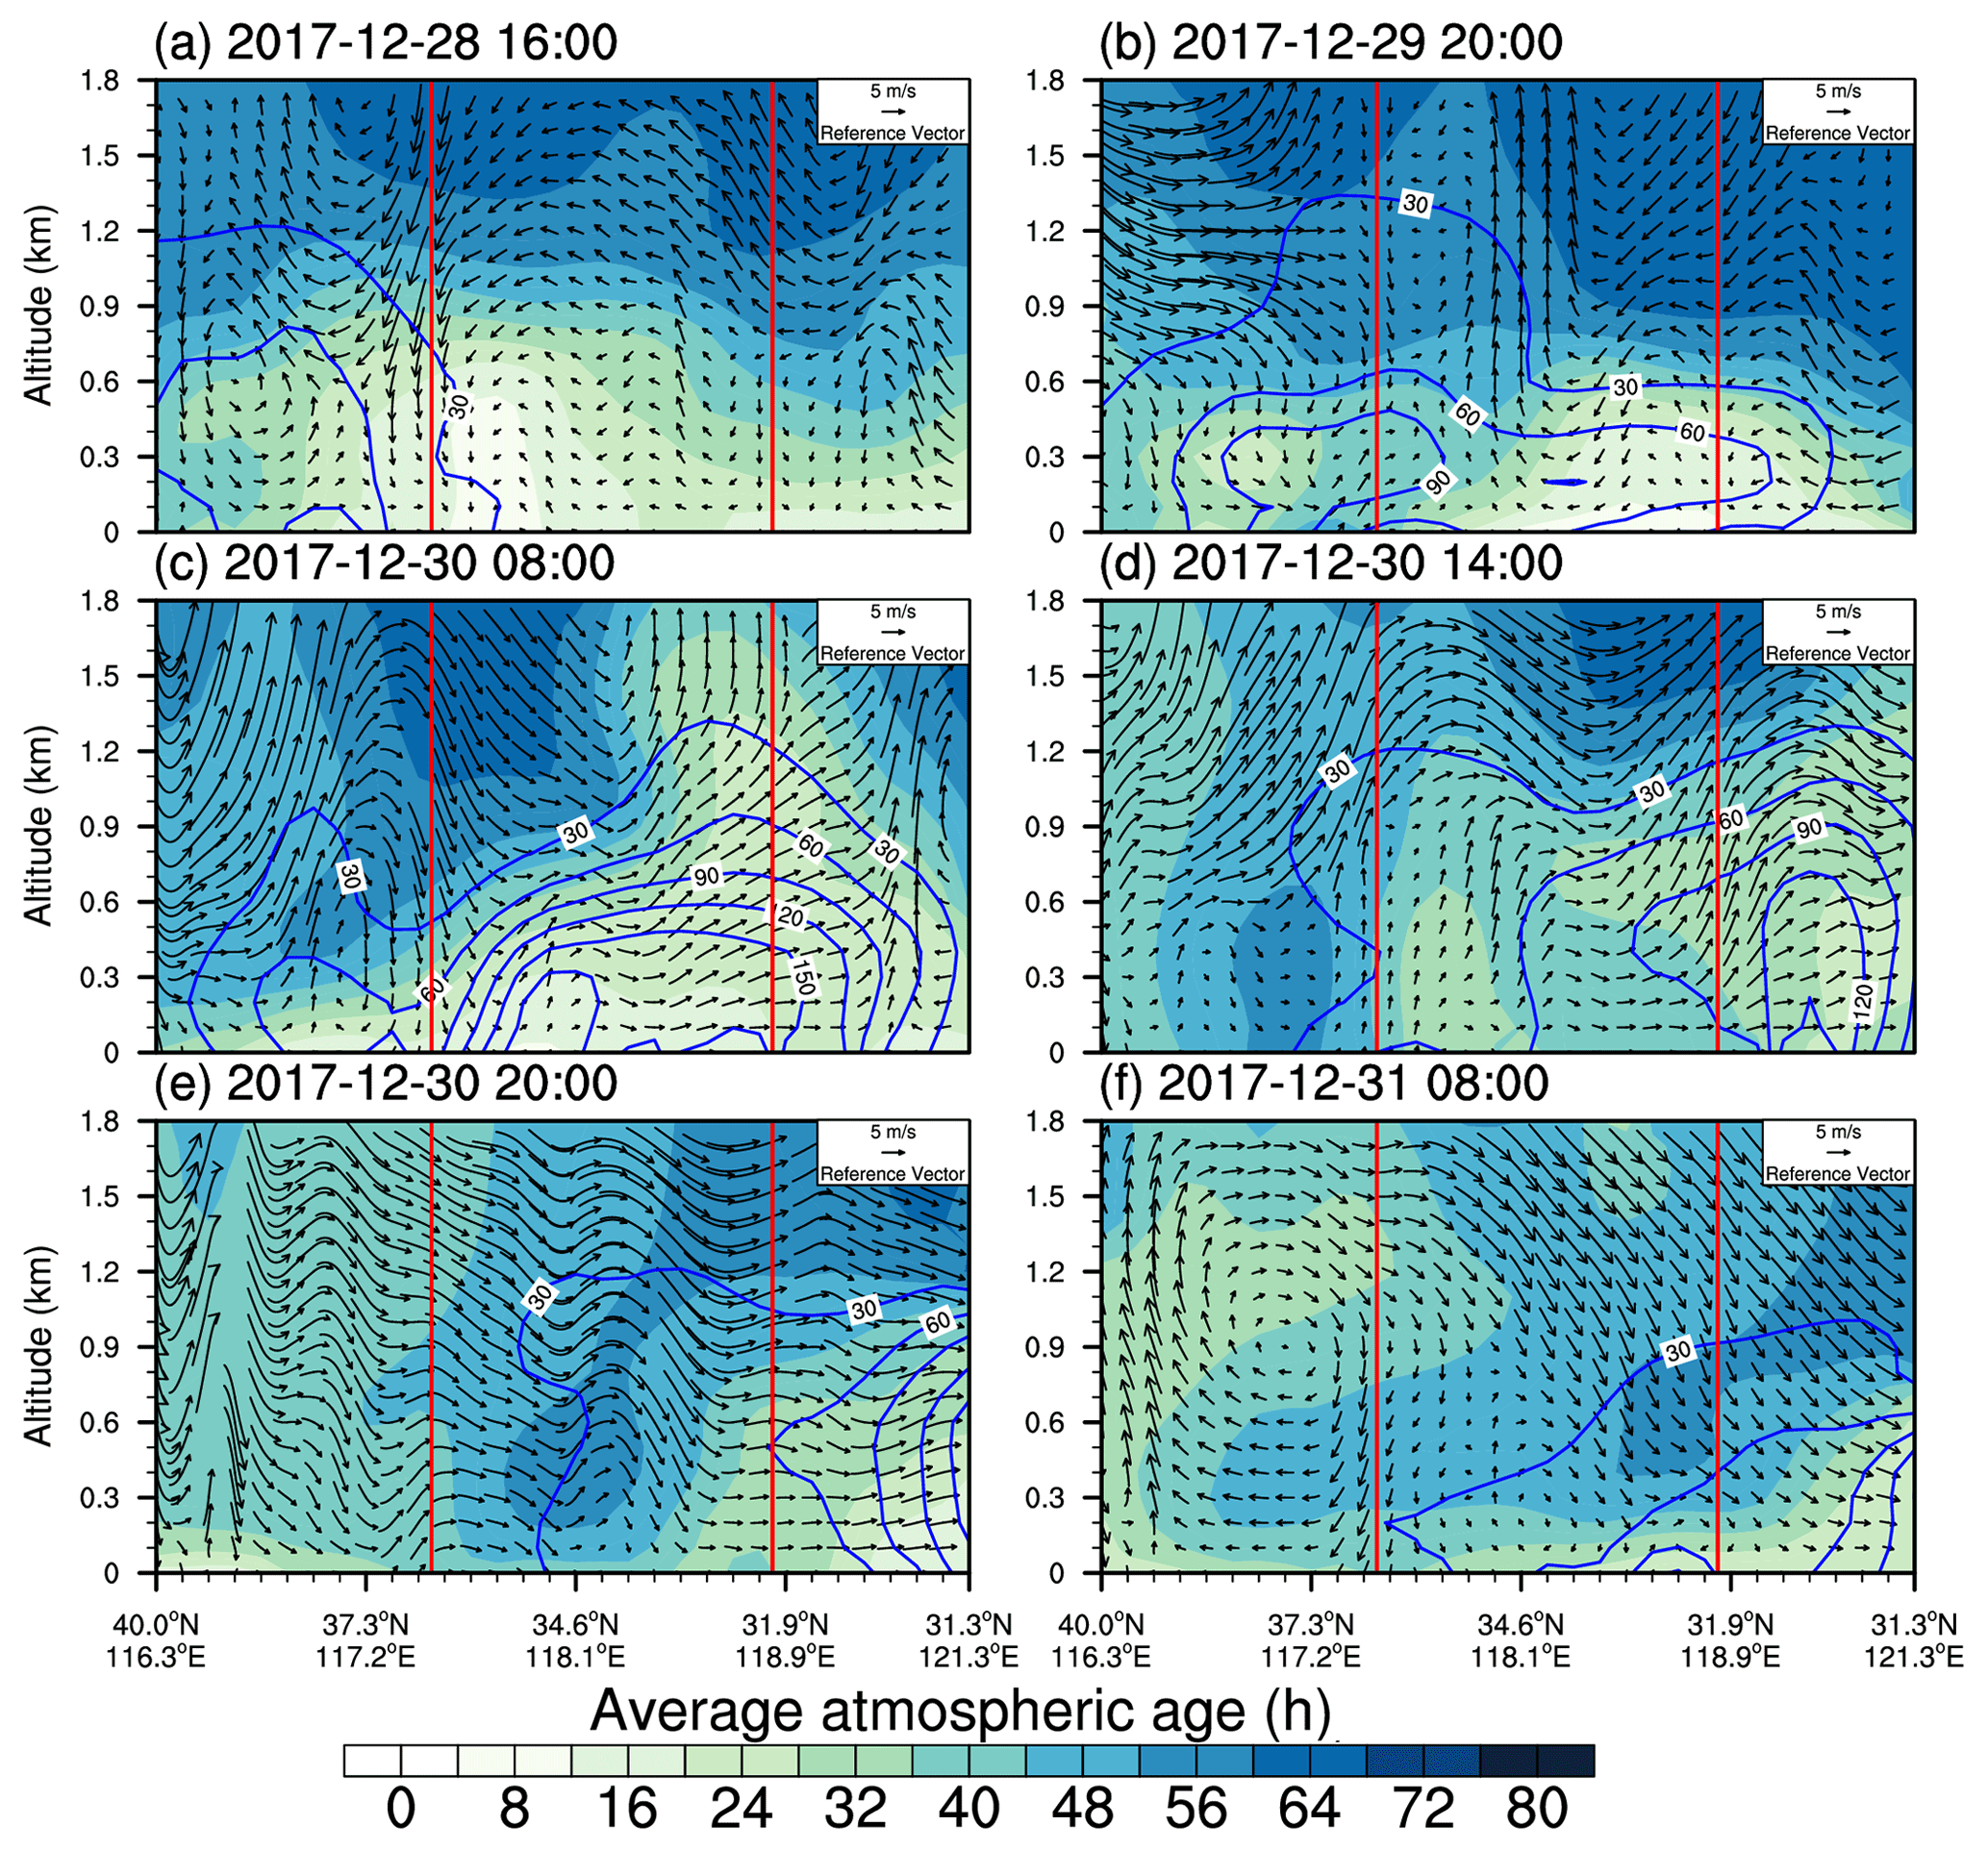
The vertical cross sections of the concentrations and mean ages for EC and along the transport route from Beijing to Shanghai (see solid white lines in Fig. 1) are shown in Figs. 7 and 8, while those for and SOA are illustrated in Figs. S16 and S17. Before the regional transport (e.g., 16:00 LT on 28 December 2017), aged particles mainly accumulated in the NCP under slow wind speed (∼ 2 m s−1). The average age of EC, , , and SOA was approximately 30–50, 50–60, 20–45, and 50–60 h, respectively, which is larger than that in the YRD (15–30 h for EC, 30–50 h for , 8–24 h for , and 35–45 h for SOA). An obvious vertical gradient of particle age occurred in the YRD, with a lower age near the surface and higher age aloft. Compared to YRD, the vertical distribution of particle ages was more uniform in the NCP due to the accumulation of aged pollutants in the atmosphere under stable weather conditions. When the cold front passed through, the vertical distribution in the NCP appears to be more uniform. This is because the upward motion ahead of the cold front enhanced the vertical mixing of air pollutants. Additionally, polluted air masses carrying aged particles gradually moved from the NCP to the YRD under strong northwesterly wind (> 5 m s−1). During this period, high PM2.5 concentrations occurred in eastern China and vertically extended up to 1.2 km, as they were forced by the upward motion along the cold front. For EC, , and SOA, the average age in the YRD increased significantly within the whole PBL due to the regional transport from the NCP. The maximum age reached 48, 60, and 65 h for EC, , and SOA, respectively. For , the highest concentration reached 180 µg m−3 for regions between Jinan and Nanjing at 08:00 LT on 30 December 2017, which was 2 times the peak value in the NCP before the regional transport (∼ 90 µg m−3). Moreover, the average age of was relatively low (6–24 h) for high-concentration particles, indicating the significant contribution from the local chemical formation.
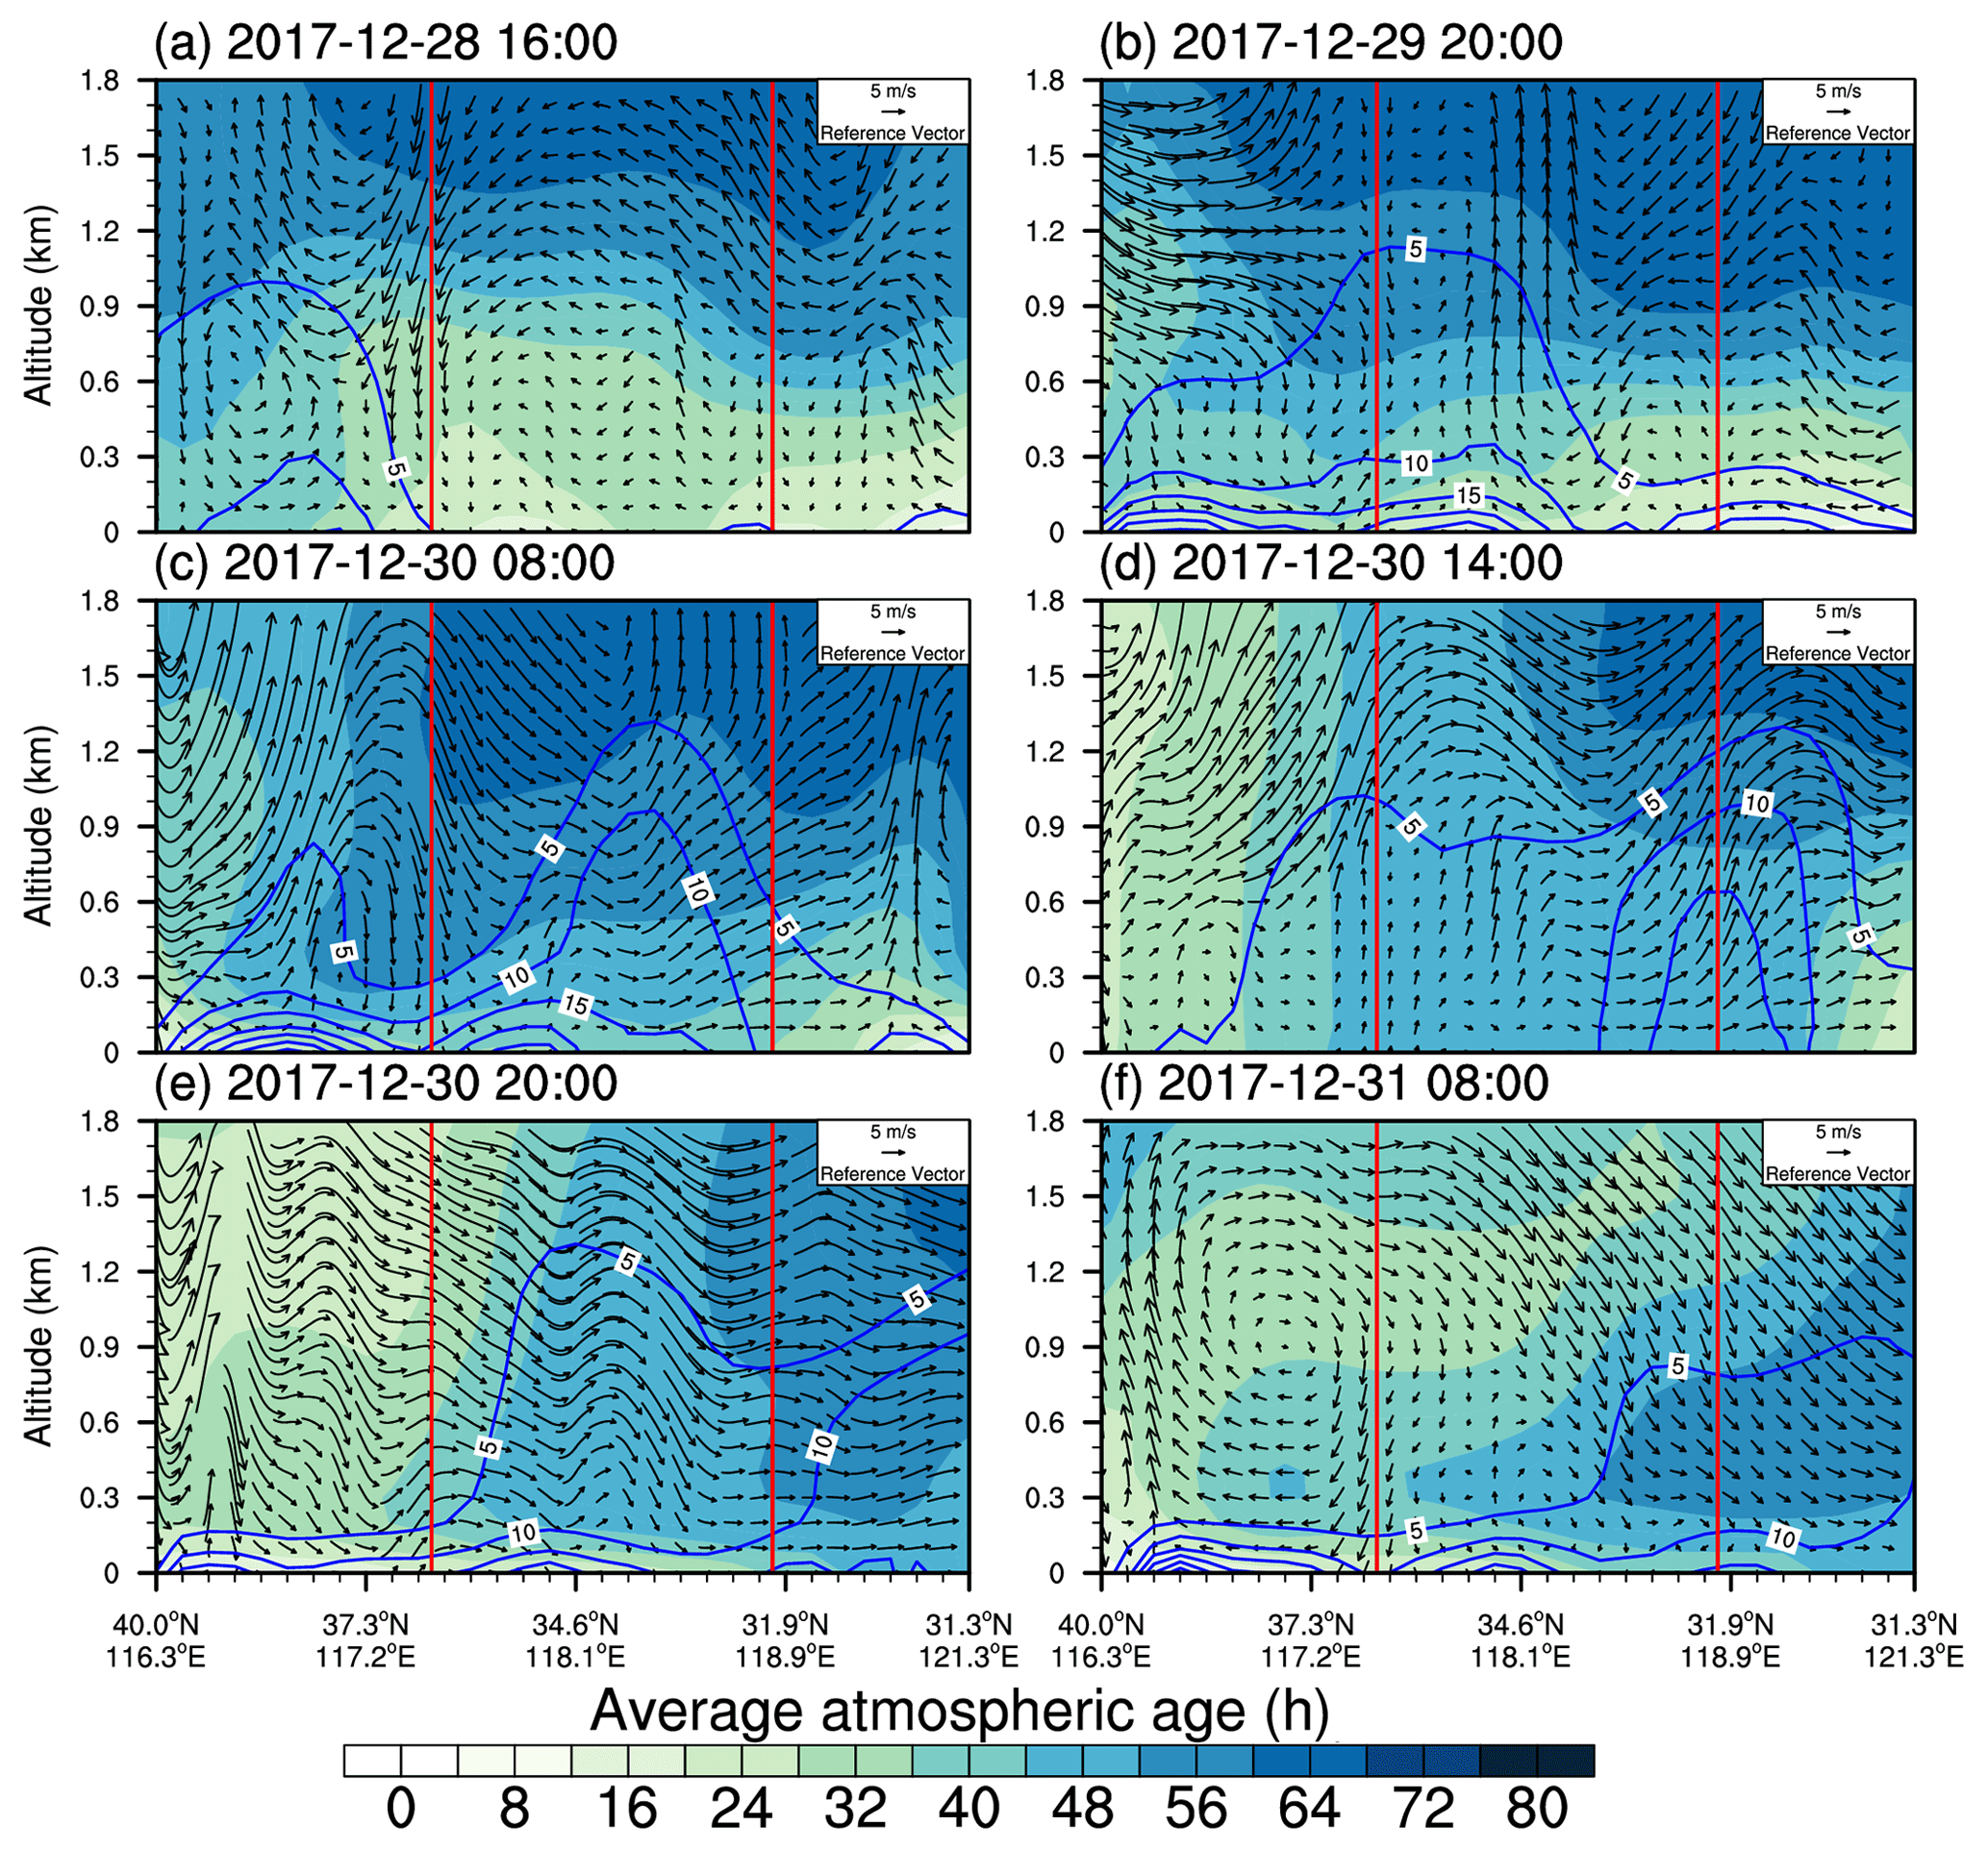
Figure 7Vertical cross section of the average atmospheric age (color contours; h) and concentrations (solid blue lines; µg m−3) of EC along the transport route from Beijing to Shanghai (see solid white lines in Fig. 1) at (a) 16:00 LT on 28 December; (b) 20:00 LT on 29 December; (c–e) 08:00, 14:00, and 20:00 LT on 30 December; and (f) 08:00 LT on 31 December 2017. Note that the vertical wind speed was multiplied by 500 for the illustration of vertical circulations. The location of Jinan and Nanjing are marked as solid red lines.
The age distribution of the major PM2.5 chemical compositions (EC, , , , and SOA) in Beijing, Jinan, Nanjing, and Shanghai is shown in Fig. 9. and SOA exhibited larger atmospheric age than other PM2.5 components, with a maximum average age of 84 and 81 h, respectively. This can also be observed in other regions (Figs. S18 and S19). In the NCP cities, Beijing and Jinan, more aged particles occurred in the stabilization stage. The average age in Beijing was 45, 76, 55, 61, and 71 h for EC, , , , and SOA, respectively, which is higher than that in the accumulation and dilution stages. It is worth noting that a large fraction (50 %–60 %) of and particles with an age younger than 12 h occurred in Jinan during the stabilization stage, indicating a rapid local formation. In the YRD cities, Nanjing and Shanghai, the mass fraction of aged EC, , and SOA particles increased significantly during the regional transport; their average ages were even larger than that in the NCP cities (Fig. S19). This is mainly because of the strong northwesterly wind that brought abundant aged particles from the NCP. and showed a smaller atmospheric age than and SOA, with an average age of 20–30 h during the regional transport. Fresh and particles with an atmospheric age of less than 24 h accounted for more than 70 % of the total mass. As can be seen from Fig. S19, the low atmospheric age of and was found in YRD, while high atmospheric age occurred in NCP.
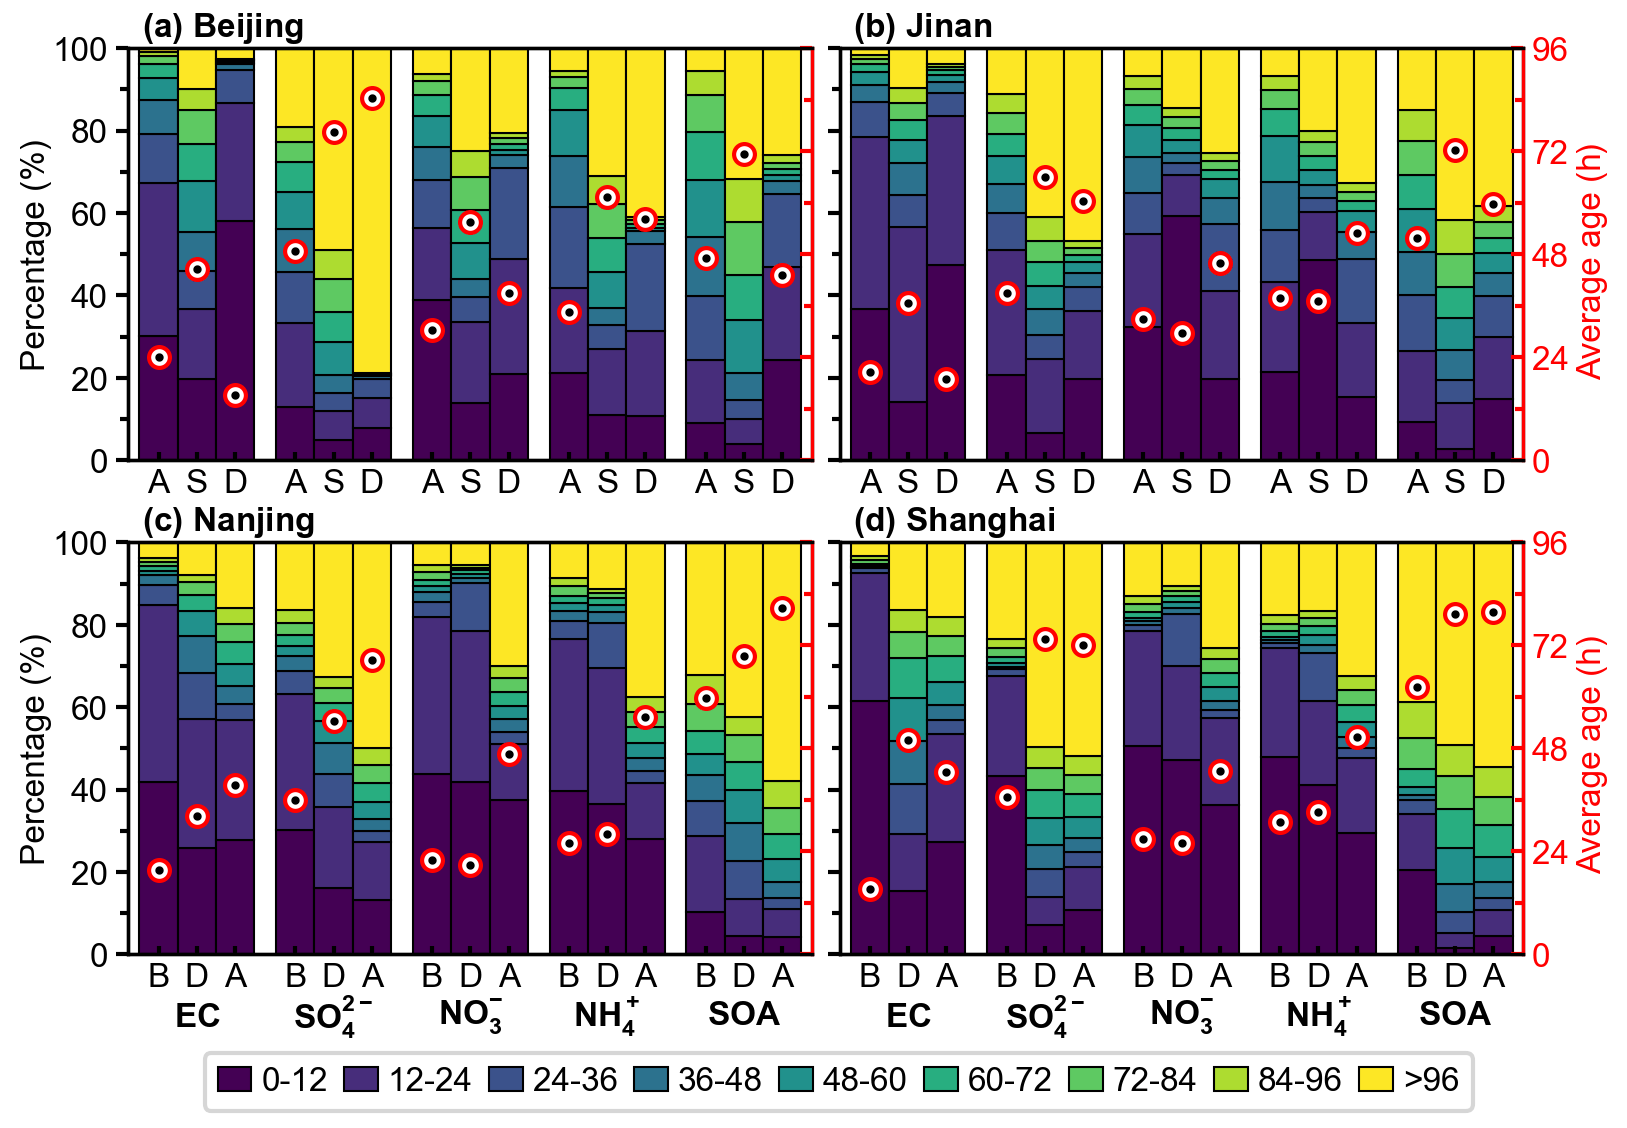
Figure 9The mass fractional contributions of different age bins to EC, , , , and SOA in Beijing, Jinan, Nanjing, and Shanghai. The red circle with a black dot indicates the average atmospheric age (in hours; right y axis). A, S, and D indicate the accumulation, stabilization, and dilution stage in Beijing and Jinan. B, D, and A represent the period before, during, and after regional transport in Nanjing and Shanghai.
Figures 10 and S20 show the size distribution of the major PM2.5 chemical compositions in Beijing and Shanghai. Both EC and POA exhibited bimodal size distributions, with a fine-mode peak at 0.2–0.4 µm and a coarse-mode peak at 1–4 µm, respectively. SOA, , , and were mainly concentrated in the fine mode, with a peak at 3–4 µm. The size distribution of particles with different atmospheric ages was quite different. Aged particles were mainly concentrated in a larger size range, especially for SOA, , and . For example, with a diameter > 0.4 µm in both Beijing and Shanghai showed an atmospheric age of > 96 h. When the accumulation stage evolved into the stabilization stage, the size of SOA, , and increased slightly in Beijing, while that of EC and POA remained almost unchanged. In Shanghai, and were mainly concentrated in the size range of 0.1–0.3 µm before the regional transport. Their dominant size increased to 0.3–0.7 µm during the regional transport.
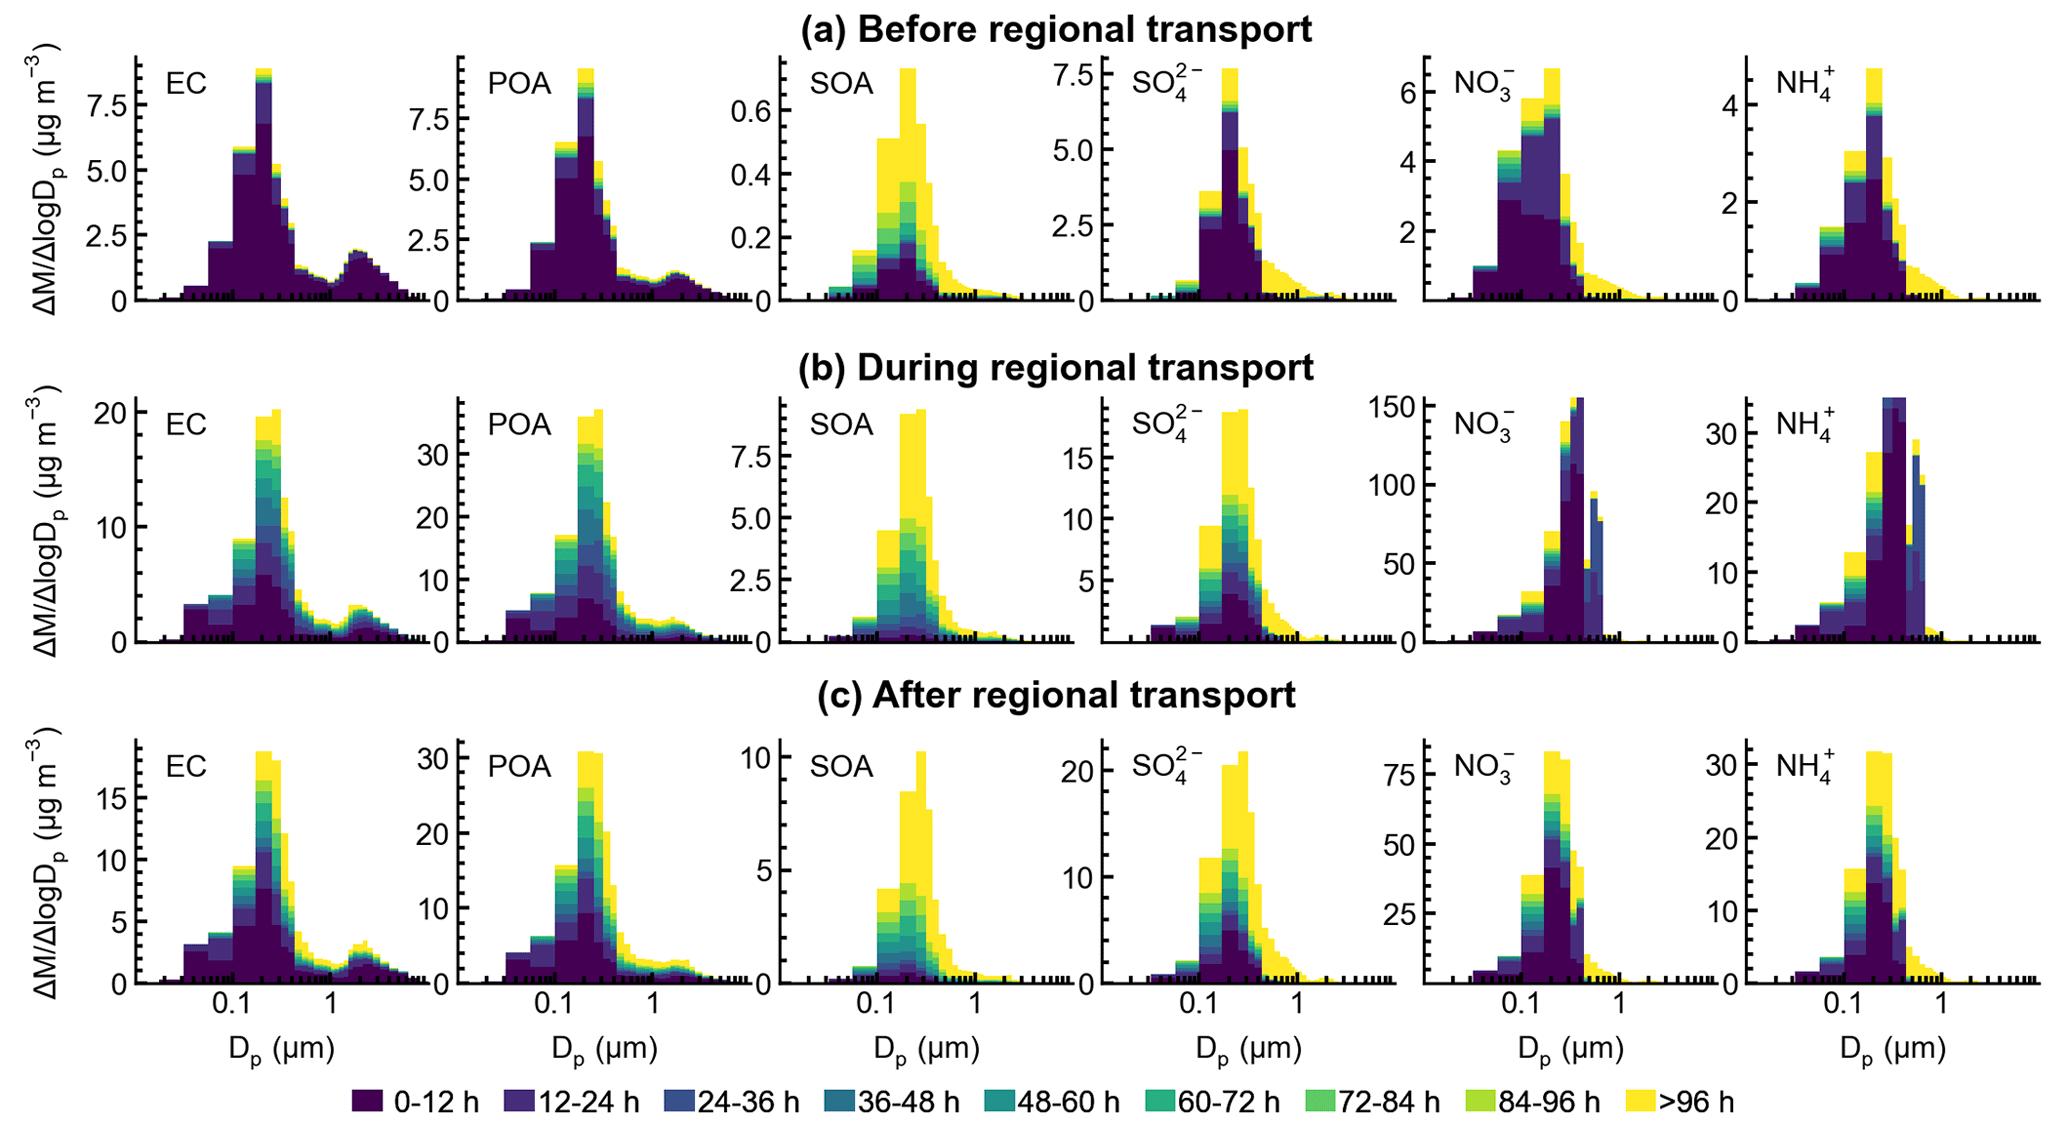
Figure 10The size distribution of EC, POA, SOA, , , and in Shanghai (a) before, (b) during, and (c) after regional transport.
Our results indicate that the atmospheric age of EC, POA, , and SOA increased gradually during the accumulation stage in the NCP due to air stagnation. The regional transport from the NCP to the YRD brought in high concentrations of aged primary particles, such as EC and POA. As a result, the simulated average atmospheric age of EC was ∼ 40 h during the regional transport, which was much higher than the “experimental” aging timescale to achieve complete morphology modification and absorption enhancement of BC in Beijing (4.6 h) and Houston, Texas, USA (18 h; Peng et al., 2016). It could be speculated that the aged EC or POA particles are coated continuously by the newly formed fresh SNA particles along the transport route, which could further enhance the light absorption of particles (Bond et al., 2013). Using transmission electron microscopy (TEM), Zhang et al. (2021) observed abundant spherical primary OM particles coated with secondary aerosols in the YRD during the regional transport, which is consistent with our findings. Previous studies have confirmed the crucial role of aerosol–PBL interaction in altering the vertical structure of the PBL and the formation and accumulation of haze in eastern China (Huang et al., 2020; Li et al., 2017). Thus, the potential absorption enhancement of aged black or brown carbon particles during the regional transport could amplify the aerosol–PBL interactions and further exacerbate air pollution.
Another interesting finding is that the atmospheric age of remained unchanged or even slightly decreased during the regional transport from NCP to YRD, contrary to the age evolution of . This indicates that is mainly formed in the upwind NCP region and then transported to YRD, while there is a large fraction of formed locally in YRD. concentrations have been dramatically reduced during the last decade due to desulfurization devices vigorously promoted in coal-fired facilities, and has become the dominant inorganic component of PM2.5 in most regions of eastern China (Sun et al., 2022). Our previous study for January 2013 suggested that NOx emissions from local sources and adjacent Jiangsu province contributed to nearly 30 % of in Shanghai, respectively (Xie et al., 2021). Therefore, reduction can be achieved by cooperative emission controls within the YRD region. Moreover, emission reduction actions should be taken a few days in advance to mitigate severe haze pollution under unfavorable weather conditions.
This study is subject to a few limitations. The UCD/CIT model includes formation mechanisms through the gas-phase oxidation of SO2 by OH radicals and the in-cloud aqueous oxidation. However, recent field observations indicated a large contribution from other pathways during winter haze events in China, such as manganese-catalyzed oxidation on aerosol surfaces (W. Wang et al., 2021) and aqueous oxidation of SO2 by NO2 (Cheng et al., 2016; G. Wang et al., 2016). The missing mechanism in the current model leads to a substantial underestimation of (42.3 %), which will further affect the age distribution of particles. Since SOA is universally underestimated in current CTMs (Hu et al., 2017), uncertainties may also occur with SOA. Additionally, the discretization of atmospheric age in our model can lead to some uncertainties, especially for the calculation of average atmospheric age (Xie et al., 2023). Thus, in this study, we run five different simulations with Δτ of 1, 3, 6, 8, and 12 h, respectively, and combine the results to minimize the effect of discrete age representation.
In this study, the age-resolved UCD/CIT model was used to investigate the age distribution of PM2.5 during a severe regional haze episode in eastern China in December 2017. A comparison with surface observations shows that the model reasonably captured the spatiotemporal variations in the PM2.5 and its major chemical compositions. Our results indicate that at the beginning stage of the haze event (25–29 December 2017), the stagnant weather conditions characterized by weak surface wind and high RH facilitated the accumulation and secondary formation of air pollutants, leading to increased PM2.5 concentrations in the NCP region. was found to be the dominant chemical composition during this haze episode, contributing to ∼ 30 % of the PM2.5 concentration growth in Beijing, Jinan, Nanjing, and Shanghai. Both the concentration and atmospheric age of EC, POA, , and SOA increased gradually during the accumulation stage in the NCP due to the weakened atmospheric diffusion capacity, while the atmospheric age of and remained unchanged because of continuous local formation. During the regional transport stage (30 December), a cold front moved from north to south, bringing aged particles from the NCP to the YRD region and increasing the PM2.5 concentrations rapidly within hours. Accordingly, the average atmospheric age of EC, POA, , and SOA particles in the YRD increased from 5–20 to 50–60 h. In contrast, continuous local chemical formation resulted in an unexpected decrease in the atmospheric age of and in the YRD, although the concentrations of aged particles with old atmospheric age increased due to regional transport. The age information provided in this study enhances our understanding of the formation mechanism of haze events and helps us design cost-effective control strategies for different PM2.5 components.
Hourly PM2.5 data used in this study are freely available from http://www.cnemc.cn/en (China National Environmental Monitoring Centre, 2023). Meteorological observations used in this study are available from http://data.cma.cn/en/?r=data/detail&dataCode=A.0012.0001 (China Meteorological Data Service Centre, 2023). The UCD/CIT model outputs are currently available from the corresponding author upon request.
The supplement related to this article is available online at: https://doi.org/10.5194/acp-23-10563-2023-supplement.
XX and JH designed the research. XX, JH, MQ, HZ, and QY contributed to model development, simulations, and data processing. SG, MH, DJ, HW, SL, CH, and CL provided the observation data. HL and YZ contributed to the result discussion. XX prepared the paper, and all coauthors helped improve the paper.
The contact author has declared that none of the authors has any competing interests.
Publisher's note: Copernicus Publications remains neutral with regard to jurisdictional claims in published maps and institutional affiliations.
The authors would like to thank the three anonymous reviewers for their helpful and constructive comments that improved the paper substantially.
This research has been supported by the National Key Research and Development Program of China (grant no. 2019YFA0606802), the National Natural Science Foundation of China (grant nos. 41975162, 42277095, and 42021004), and the Jiangsu Environmental Protection Research Project (grant no. 2016015).
This paper was edited by Dantong Liu and reviewed by three anonymous referees.
An, Z., Huang, R., Zhang, R., Tie, X., Li, G., Cao, J., Zhou, W., Shi, Z., Han, Y., Gu, Z., and Ji, Y.: Severe haze in northern China: A synergy of anthropogenic emissions and atmospheric processes, P. Natl. Acad. Sci. USA, 116, 8657–8666, https://doi.org/10.1073/pnas.1900125116, 2019.
Bond, T. C., Doherty, S. J., Fahey, D. W., Forster, P. M., Berntsen, T., DeAngelo, B. J., Flanner, M. G., Ghan, S., Kärcher, B., Koch, D., Kinne, S., Kondo, Y., Quinn, P. K., Sarofim, M. C., Schultz, M. G., Schulz, M., Venkataraman, C., Zhang, H., Zhang, S., Bellouin, N., Guttikunda, S. K., Hopke, P. K., Jacobson, M. Z., Kaiser, J. W., Klimont, Z., Lohmann, U., Schwarz, J. P., Shindell, D., Storelvmo, T., Warren, S. G., and Zender, C. S.: Bounding the role of black carbon in the climate system: A scientific assessment, J. Geophys. Res.-Atmos., 118, 5380–5552, https://doi.org/10.1002/jgrd.50171, 2013.
Carlton, A. G., Bhave, P. V., Napelenok, S. L., Edney, E. O., Sarwar, G., Pinder, R. W., Pouliot, G. A., and Houyoux, M.: Model Representation of Secondary Organic Aerosol in CMAQv4.7, Environ. Sci. Technol., 44, 8553–8560, https://doi.org/10.1021/es100636q, 2010.
Carter, W. P. L. and Heo, G.: Development of revised SAPRC aromatics mechanisms, Atmos. Environ., 77, 404–414, https://doi.org/10.1016/j.atmosenv.2013.05.021, 2013.
Chen, T., Liu, J., Ma, Q., Chu, B., Zhang, P., Ma, J., Liu, Y., Zhong, C., Liu, P., Wang, Y., Mu, Y., and He, H.: Measurement report: Effects of photochemical aging on the formation and evolution of summertime secondary aerosol in Beijing, Atmos. Chem. Phys., 21, 1341–1356, https://doi.org/10.5194/acp-21-1341-2021, 2021.
Chen, X., Wang, Z., Yu, F., Pan, X., Li, J., Ge, B., Wang, Z., Hu, M., Yang, W., and Chen, H.: Estimation of atmospheric aging time of black carbon particles in the polluted atmosphere over central-eastern China using microphysical process analysis in regional chemical transport model, Atmos. Environ., 163, 44–56, https://doi.org/10.1016/j.atmosenv.2017.05.016, 2017.
Cheng, Y., Zheng, G., Wei, C., Mu, Q., Zheng, B., Wang, Z., Gao, M., Zhang, Q., He, K., Carmichael, G., Pöschl, U., and Su, H.: Reactive nitrogen chemistry in aerosol water as a source of sulfate during haze events in China, Sci. Adv., 2, e1601530, https://doi.org/10.1126/sciadv.1601530, 2016.
China Meteorological Data Service Centre: Daily Timed Data From Automated Weather Stations In China, http://data.cma.cn/en/?r=data/detail&dataCode=A.0012.0001, last access: 16 September 2023.
China National Environmental Monitoring Centre: Real-time National Air Quality, http://www.cnemc.cn/en, last access: 16 September 2023.
Chu, B., Dada, L., Liu, Y., Yao, L., Wang, Y., Du, W., Cai, J., Dällenbach, K. R., Chen, X., Simonen, P., Zhou, Y., Deng, C., Fu, Y., Yin, R., Li, H., He, X.-C., Feng, Z., Yan, C., Kangasluoma, J., Bianchi, F., Jiang, J., Kujansuu, J., Kerminen, V.-M., Petäjä, T., He, H., and Kulmala, M.: Particle growth with photochemical age from new particle formation to haze in the winter of Beijing, China, Sci. Total Environ., 753, 142207, https://doi.org/10.1016/j.scitotenv.2020.142207, 2021.
Cirino, G. G., Souza, R. A. F., Adams, D. K., and Artaxo, P.: The effect of atmospheric aerosol particles and clouds on net ecosystem exchange in the Amazon, Atmos. Chem. Phys., 14, 6523–6543, https://doi.org/10.5194/acp-14-6523-2014, 2014.
Cohen, A. J., Brauer, M., Burnett, R., Anderson, H. R., Frostad, J., Estep, K., Balakrishnan, K., Brunekreef, B., Dandona, L., Dandona, R., Feigin, V., Freedman, G., Hubbell, B., Jobling, A., Kan, H., Knibbs, L., Liu, Y., Martin, R., Morawska, L., Pope, C. A., III, Shin, H., Straif, K., Shaddick, G., Thomas, M., van Dingenen, R., van Donkelaar, A., Vos, T., Murray, C. J. L., and Forouzanfar, M. H.: Estimates and 25-year trends of the global burden of disease attributable to ambient air pollution: an analysis of data from the Global Burden of Diseases Study 2015, Lancet, 389, 1907–1918, https://doi.org/10.1016/S0140-6736(17)30505-6, 2017.
Gu, L., Baldocchi, D., Verma, S. B., Black, T. A., Vesala, T., Falge, E. M., and Dowty, P. R.: Advantages of diffuse radiation for terrestrial ecosystem productivity, J. Geophys. Res.-Atmos., 107, 4050, https://doi.org/10.1029/2001JD001242, 2002.
Guenther, A., Karl, T., Harley, P., Wiedinmyer, C., Palmer, P. I., and Geron, C.: Estimates of global terrestrial isoprene emissions using MEGAN (Model of Emissions of Gases and Aerosols from Nature), Atmos. Chem. Phys., 6, 3181–3210, https://doi.org/10.5194/acp-6-3181-2006, 2006.
Han, Q. and Zender, C. S.: Desert dust aerosol age characterized by mass-age tracking of tracers, J. Geophys. Res.-Atmos., 115, D22201, https://doi.org/10.1029/2010JD014155, 2010.
Held, T., Ying, Q., Kaduwela, A., and Kleeman, M.: Modeling particulate matter in the San Joaquin Valley with a source-oriented externally mixed three-dimensional photochemical grid model, Atmos. Environ., 38, 3689–3711, https://doi.org/10.1016/j.atmosenv.2004.02.053, 2004.
Hu, J., Zhang, H., Chen, S.-H., Wiedinmyer, C., Vandenberghe, F., Ying, Q., and Kleeman, M. J.: Predicting Primary PM2.5 and PM0.1 Trace Composition for Epidemiological Studies in California, Environ. Sci. Technol., 48, 4971–4979, https://doi.org/10.1021/es404809j, 2014.
Hu, J., Zhang, H., Ying, Q., Chen, S.-H., Vandenberghe, F., and Kleeman, M. J.: Long-term particulate matter modeling for health effect studies in California – Part 1: Model performance on temporal and spatial variations, Atmos. Chem. Phys., 15, 3445–3461, https://doi.org/10.5194/acp-15-3445-2015, 2015.
Hu, J., Chen, J., Ying, Q., and Zhang, H.: One-year simulation of ozone and particulate matter in China using WRF/CMAQ modeling system, Atmos. Chem. Phys., 16, 10333–10350, https://doi.org/10.5194/acp-16-10333-2016, 2016.
Hu, J., Wang, P., Ying, Q., Zhang, H., Chen, J., Ge, X., Li, X., Jiang, J., Wang, S., Zhang, J., Zhao, Y., and Zhang, Y.: Modeling biogenic and anthropogenic secondary organic aerosol in China, Atmos. Chem. Phys., 17, 77–92, https://doi.org/10.5194/acp-17-77-2017, 2017.
Huang, X., Ding, A., Wang, Z., Ding, K., Gao, J., Chai, F., and Fu, C.: Amplified transboundary transport of haze by aerosol–boundary layer interaction in China, Nat. Geosci., 13, 428–434, https://doi.org/10.1038/s41561-020-0583-4, 2020.
IPCC: Climate Change 2021: The Physical Science Basis. Contribution of Working Group I to the Sixth Assessment Report of the Intergovernmental Panel on Climate Change, Cambridge University Press, Cambridge, United Kingdom and New York, NY, USA, 2021.
Irei, S., Takami, A., Sadanaga, Y., Nozoe, S., Yonemura, S., Bandow, H., and Yokouchi, Y.: Photochemical age of air pollutants, ozone, and secondary organic aerosol in transboundary air observed on Fukue Island, Nagasaki, Japan, Atmos. Chem. Phys., 16, 4555–4568, https://doi.org/10.5194/acp-16-4555-2016, 2016.
Kleeman, M. J. and Cass, G. R.: A 3D Eulerian Source-Oriented Model for an Externally Mixed Aerosol, Environ. Sci. Technol., 35, 4834–4848, https://doi.org/10.1021/es010886m, 2001.
Kleeman, M. J., Robert, M. A., Riddle, S. G., Fine, P. M., Hays, M. D., Schauer, J. J., and Hannigan, M. P.: Size distribution of trace organic species emitted from biomass combustion and meat charbroiling, Atmos. Environ., 42, 3059–3075, https://doi.org/10.1016/j.atmosenv.2007.12.044, 2008.
Lelieveld, J., Evans, J. S., Fnais, M., Giannadaki, D., and Pozzer, A.: The contribution of outdoor air pollution sources to premature mortality on a global scale, Nature, 525, 367–371, https://doi.org/10.1038/nature15371, 2015.
Li, X., Huang, L., Li, J., Shi, Z., Wang, Y., Zhang, H., Ying, Q., Yu, X., Liao, H., and Hu, J.: Source contributions to poor atmospheric visibility in China, Resour. Conserv. Recy., 143, 167–177, https://doi.org/10.1016/j.resconrec.2018.12.029, 2019.
Li, Z., Guo, J., Ding, A., Liao, H., Liu, J., Sun, Y., Wang, T., Xue, H., Zhang, H., and Zhu, B.: Aerosol and boundary-layer interactions and impact on air quality, Natl. Sci. Rev., 4, 810–833, https://doi.org/10.1093/nsr/nwx117, 2017.
Nenes, A., Pandis, S. N., and Pilinis, C.: ISORROPIA: A New Thermodynamic Equilibrium Model for Multiphase Multicomponent Inorganic Aerosols, Aquat. Geochem., 4, 123–152, https://doi.org/10.1023/A:1009604003981, 1998.
Parrish, D. D., Stohl, A., Forster, C., Atlas, E. L., Blake, D. R., Goldan, P. D., Kuster, W. C., and de Gouw, J. A.: Effects of mixing on evolution of hydrocarbon ratios in the troposphere, J. Geophys. Res.-Atmos., 112, D10S34, https://doi.org/10.1029/2006jd007583, 2007.
Peng, J., Hu, M., Guo, S., Du, Z., Zheng, J., Shang, D., Levy Zamora, M., Zeng, L., Shao, M., Wu, Y.-S., Zheng, J., Wang, Y., Glen, C. R., Collins, D. R., Molina, M. J., and Zhang, R.: Markedly enhanced absorption and direct radiative forcing of black carbon under polluted urban environments, P. Natl. Acad. Sci. USA, 113, 4266–4271, https://doi.org/10.1073/pnas.1602310113, 2016.
Pui, D. Y. H., Chen, S.-C., and Zuo, Z.: PM2.5 in China: Measurements, sources, visibility and health effects, and mitigation, Particuology, 13, 1–26, https://doi.org/10.1016/j.partic.2013.11.001, 2014.
Ramanathan, V., Crutzen, P. J., Kiehl, J. T., and Rosenfeld, D.: Aerosols, Climate, and the Hydrological Cycle, Science, 294, 2119–2124, https://doi.org/10.1126/science.1064034, 2001.
Robert, M. A., Kleeman, M. J., and Jakober, C. A.: Size and Composition Distributions of Particulate Matter Emissions: Part 2—Heavy-Duty Diesel Vehicles, J. Air Waste Manage., 57, 1429–1438, https://doi.org/10.3155/1047-3289.57.12.1429, 2007a.
Robert, M. A., VanBergen, S., Kleeman, M. J., and Jakober, C. A.: Size and Composition Distributions of Particulate Matter Emissions: Part 1—Light-Duty Gasoline Vehicles, J. Air Waste Manage., 57, 1414–1428, https://doi.org/10.3155/1047-3289.57.12.1414, 2007b.
Seinfeld, J. H., Bretherton, C., Carslaw, K. S., Coe, H., DeMott, P. J., Dunlea, E. J., Feingold, G., Ghan, S., Guenther, A. B., Kahn, R., Kraucunas, I., Kreidenweis, S. M., Molina, M. J., Nenes, A., Penner, J. E., Prather, K. A., Ramanathan, V., Ramaswamy, V., Rasch, P. J., Ravishankara, A. R., Rosenfeld, D., Stephens, G., and Wood, R.: Improving our fundamental understanding of the role of aerosol-cloud interactions in the climate system, P. Natl. Acad. Sci. USA, 113, 5781–5790, https://doi.org/10.1073/pnas.1514043113, 2016.
Shao, P., Tian, H., Sun, Y., Liu, H., Wu, B., Liu, S., Liu, X., Wu, Y., Liang, W., Wang, Y., Gao, J., Xue, Y., Bai, X., Liu, W., Lin, S., and Hu, G.: Characterizing remarkable changes of severe haze events and chemical compositions in multi-size airborne particles (PM1, PM2.5 and PM10) from January 2013 to 2016–2017 winter in Beijing, China, Atmos. Environ., 189, 133–144, https://doi.org/10.1016/j.atmosenv.2018.06.038, 2018.
Shi, Z., Li, J., Huang, L., Wang, P., Wu, L., Ying, Q., Zhang, H., Lu, L., Liu, X., Liao, H., and Hu, J.: Source apportionment of fine particulate matter in China in 2013 using a source-oriented chemical transport model, Sci. Total Environ., 601–602, 1476–1487, https://doi.org/10.1016/j.scitotenv.2017.06.019, 2017.
Shu, L., Wang, T., Xie, M., Li, M., Zhao, M., Zhang, M., and Zhao, X.: Episode study of fine particle and ozone during the CAPUM-YRD over Yangtze River Delta of China: Characteristics and source attribution, Atmos. Environ., 203, 87–101, https://doi.org/10.1016/j.atmosenv.2019.01.044, 2019.
Stohl, A., Forster, C., Eckhardt, S., Spichtinger, N., Huntrieser, H., Heland, J., Schlager, H., Wilhelm, S., Arnold, F., and Cooper, O.: A backward modeling study of intercontinental pollution transport using aircraft measurements, J. Geophys. Res.-Atmos., 108, 4370, https://doi.org/10.1029/2002jd002862, 2003.
Sun, J., Qin, M., Xie, X., Fu, W., Qin, Y., Sheng, L., Li, L., Li, J., Sulaymon, I. D., Jiang, L., Huang, L., Yu, X., and Hu, J.: Seasonal modeling analysis of nitrate formation pathways in Yangtze River Delta region, China, Atmos. Chem. Phys., 22, 12629–12646, https://doi.org/10.5194/acp-22-12629-2022, 2022.
Sun, Y., Jiang, Q., Wang, Z., Fu, P., Li, J., Yang, T., and Yin, Y.: Investigation of the sources and evolution processes of severe haze pollution in Beijing in January 2013, J. Geophys. Res.-Atmos., 119, 4380–4398, https://doi.org/10.1002/2014JD021641, 2014.
Tan, T., Hu, M., Li, M., Guo, Q., Wu, Y., Fang, X., Gu, F., Wang, Y., and Wu, Z.: New insight into PM2.5 pollution patterns in Beijing based on one-year measurement of chemical compositions, Sci. Total Environ., 621, 734–743, https://doi.org/10.1016/j.scitotenv.2017.11.208, 2018.
Wagstrom, K. M. and Pandis, S. N.: Determination of the age distribution of primary and secondary aerosol species using a chemical transport model, J. Geophys. Res.-Atmos., 114, D14303, https://doi.org/10.1029/2009jd011784, 2009.
Wang, C., Wang, Y., Shi, Z., Sun, J., Gong, K., Li, J., Qin, M., Wei, J., Li, T., Kan, H., and Hu, J.: Effects of using different exposure data to estimate changes in premature mortality attributable to PM2.5 and O3 in China, Environ. Pollut., 285, 117242, https://doi.org/10.1016/j.envpol.2021.117242, 2021.
Wang, G., Zhang, R., Gomez, M. E., Yang, L., Levy Zamora, M., Hu, M., Lin, Y., Peng, J., Guo, S., Meng, J., Li, J., Cheng, C., Hu, T., Ren, Y., Wang, Y., Gao, J., Cao, J., An, Z., Zhou, W., Li, G., Wang, J., Tian, P., Marrero-Ortiz, W., Secrest, J., Du, Z., Zheng, J., Shang, D., Zeng, L., Shao, M., Wang, W., Huang, Y., Wang, Y., Zhu, Y., Li, Y., Hu, J., Pan, B., Cai, L., Cheng, Y., Ji, Y., Zhang, F., Rosenfeld, D., Liss, P. S., Duce, R. A., Kolb, C. E., and Molina, M. J.: Persistent sulfate formation from London Fog to Chinese haze, P. Natl. Acad. Sci. USA, 113, 13630–13635, https://doi.org/10.1073/pnas.1616540113, 2016.
Wang, H. L., Qiao, L. P., Lou, S. R., Zhou, M., Ding, A. J., Huang, H. Y., Chen, J. M., Wang, Q., Tao, S. K., Chen, C. H., Li, L., and Huang, C.: Chemical composition of PM2.5 and meteorological impact among three years in urban Shanghai, China, J. Clean. Prod., 112, 1302–1311, https://doi.org/10.1016/j.jclepro.2015.04.099, 2016.
Wang, W., Liu, M., Wang, T., Song, Y., Zhou, L., Cao, J., Hu, J., Tang, G., Chen, Z., Li, Z., Xu, Z., Peng, C., Lian, C., Chen, Y., Pan, Y., Zhang, Y., Sun, Y., Li, W., Zhu, T., Tian, H., and Ge, M.: Sulfate formation is dominated by manganese-catalyzed oxidation of SO2 on aerosol surfaces during haze events, Nat. Commun., 12, 1993, https://doi.org/10.1038/s41467-021-22091-6, 2021.
Wang, X., Zhang, R., Tan, Y., and Yu, W.: Dominant synoptic patterns associated with the decay process of PM2.5 pollution episodes around Beijing, Atmos. Chem. Phys., 21, 2491–2508, https://doi.org/10.5194/acp-21-2491-2021, 2021.
Wang, Y., Li, W., Gao, W., Liu, Z., Tian, S., Shen, R., Ji, D., Wang, S., Wang, L., Tang, G., Song, T., Cheng, M., Wang, G., Gong, Z., Hao, J., and Zhang, Y.: Trends in particulate matter and its chemical compositions in China from 2013–2017, Sci. China Earth Sci., 62, 1857–1871, https://doi.org/10.1007/s11430-018-9373-1, 2019.
Wiedinmyer, C., Akagi, S. K., Yokelson, R. J., Emmons, L. K., Al-Saadi, J. A., Orlando, J. J., and Soja, A. J.: The Fire INventory from NCAR (FINN): a high resolution global model to estimate the emissions from open burning, Geosci. Model Dev., 4, 625–641, https://doi.org/10.5194/gmd-4-625-2011, 2011.
Wu, J. B., Wang, Z. F., Wang, Q., Li, J., Xu, J. M., Chen, H. S., Ge, B. Z., Zhou, G. Q., and Chang, L. Y.: Development of an on-line source-tagged model for sulfate, nitrate and ammonium: A modeling study for highly polluted periods in Shanghai, China, Environ. Pollut., 221, 168–179, https://doi.org/10.1016/j.envpol.2016.11.061, 2017.
Xie, X., Wang, T., Yue, X., Li, S., Zhuang, B., and Wang, M.: Effects of atmospheric aerosols on terrestrial carbon fluxes and CO2 concentrations in China, Atmos. Res., 237, 104859, https://doi.org/10.1016/j.atmosres.2020.104859, 2020.
Xie, X., Shi, Z., Ying, Q., Zhang, H., and Hu, J.: Age-Resolved Source and Region Contributions to Fine Particulate Matter During an Extreme Haze Episode in China, Geophys. Res. Lett., 48, e2021GL095388, https://doi.org/10.1029/2021GL095388, 2021.
Xie, X., Hu, J., Qin, M., Guo, S., Hu, M., Wang, H., Lou, S., Li, J., Sun, J., Li, X., Sheng, L., Zhu, J., Chen, G., Yin, J., Fu, W., Huang, C., and Zhang, Y.: Modeling particulate nitrate in China: Current findings and future directions, Environ. Int., 166, 107369, https://doi.org/10.1016/j.envint.2022.107369, 2022.
Xie, X., Ying, Q., Zhang, H., and Hu, J.: Spatial and Temporal Variations in the Atmospheric Age Distribution of Primary and Secondary Inorganic Aerosols in China, Engineering, in press, https://doi.org/10.1016/j.eng.2022.03.013, 2023.
Xu, W., Sun, Y., Wang, Q., Zhao, J., Wang, J., Ge, X., Xie, C., Zhou, W., Du, W., Li, J., Fu, P., Wang, Z., Worsnop, D. R., and Coe, H.: Changes in Aerosol Chemistry From 2014 to 2016 in Winter in Beijing: Insights From High-Resolution Aerosol Mass Spectrometry, J. Geophys. Res.-Atmos., 124, 1132–1147, https://doi.org/10.1029/2018JD029245, 2019.
Yang, Y. R., Liu, X. G., Qu, Y., An, J. L., Jiang, R., Zhang, Y. H., Sun, Y. L., Wu, Z. J., Zhang, F., Xu, W. Q., and Ma, Q. X.: Characteristics and formation mechanism of continuous hazes in China: a case study during the autumn of 2014 in the North China Plain, Atmos. Chem. Phys., 15, 8165–8178, https://doi.org/10.5194/acp-15-8165-2015, 2015.
Ying, Q. and Kleeman, M. J.: Source contributions to the regional distribution of secondary particulate matter in California, Atmos. Environ., 40, 736–752, https://doi.org/10.1016/j.atmosenv.2005.10.007, 2006.
Ying, Q., Fraser, M. P., Griffin, R. J., Chen, J., and Kleeman, M. J.: Verification of a source-oriented externally mixed air quality model during a severe photochemical smog episode, Atmos. Environ., 41, 1521–1538, https://doi.org/10.1016/j.atmosenv.2006.10.004, 2007.
Ying, Q., Zhang, J., Zhang, H., Hu, J., and Kleeman, M. J.: Atmospheric Age Distribution of Primary and Secondary Inorganic Aerosols in a Polluted Atmosphere, Environ. Sci. Technol., 55, 5668–5676, https://doi.org/10.1021/acs.est.0c07334, 2021.
Zhang, H., Guo, H., Hu, J., Ying, Q., and Kleeman, M. J.: Modeling Atmospheric Age Distribution of Elemental Carbon Using a Regional Age-Resolved Particle Representation Framework, Environ. Sci. Technol., 53, 270–278, https://doi.org/10.1021/acs.est.8b05895, 2019.
Zhang, J., Yuan, Q., Liu, L., Wang, Y., Zhang, Y., Xu, L., Pang, Y., Zhu, Y., Niu, H., Shao, L., Yang, S., Liu, H., Pan, X., Shi, Z., Hu, M., Fu, P., and Li, W.: Trans-Regional Transport of Haze Particles From the North China Plain to Yangtze River Delta During Winter, J. Geophys. Res.-Atmos., 126, e2020JD033778, https://doi.org/10.1029/2020JD033778, 2021.
Zhang, Q., Zheng, Y., Tong, D., Shao, M., Wang, S., Zhang, Y., Xu, X., Wang, J., He, H., Liu, W., Ding, Y., Lei, Y., Li, J., Wang, Z., Zhang, X., Wang, Y., Cheng, J., Liu, Y., Shi, Q., Yan, L., Geng, G., Hong, C., Li, M., Liu, F., Zheng, B., Cao, J., Ding, A., Gao, J., Fu, Q., Huo, J., Liu, B., Liu, Z., Yang, F., He, K., and Hao, J.: Drivers of improved PM2.5 air quality in China from 2013 to 2017, P. Natl. Acad. Sci. USA, 116, 24463–24469, https://doi.org/10.1073/pnas.1907956116, 2019.
Zheng, B., Tong, D., Li, M., Liu, F., Hong, C., Geng, G., Li, H., Li, X., Peng, L., Qi, J., Yan, L., Zhang, Y., Zhao, H., Zheng, Y., He, K., and Zhang, Q.: Trends in China's anthropogenic emissions since 2010 as the consequence of clean air actions, Atmos. Chem. Phys., 18, 14095–14111, https://doi.org/10.5194/acp-18-14095-2018, 2018.
Zheng, G. J., Duan, F. K., Su, H., Ma, Y. L., Cheng, Y., Zheng, B., Zhang, Q., Huang, T., Kimoto, T., Chang, D., Pöschl, U., Cheng, Y. F., and He, K. B.: Exploring the severe winter haze in Beijing: the impact of synoptic weather, regional transport and heterogeneous reactions, Atmos. Chem. Phys., 15, 2969–2983, https://doi.org/10.5194/acp-15-2969-2015, 2015.