the Creative Commons Attribution 4.0 License.
the Creative Commons Attribution 4.0 License.
 | 22 Sep 2023
Physicochemical characterization and source apportionment of Arctic ice-nucleating particles observed in Ny-Ålesund in autumn 2019
Elise K. Wilbourn
Zezhen Cheng
Jörg Wieder
Allison Fagerson
Jan Henneberger
Ghislain Motos
Rita Traversi
Sarah D. Brooks
Mauro Mazzola
Swarup China
Athanasios Nenes
Ulrike Lohmann
Naruki Hiranuma
Ice-nucleating particles (INPs) initiate primary ice formation in Arctic mixed-phase clouds (MPCs), altering cloud radiative properties and modulating precipitation. For atmospheric INPs, the complexity of their spatiotemporal variations, heterogeneous sources, and evolution via intricate atmospheric interactions challenge the understanding of their impact on microphysical processes in Arctic MPCs and induce an uncertain representation in climate models. In this work, we performed a comprehensive analysis of atmospheric aerosols at the Arctic coastal site in Ny-Ålesund (Svalbard, Norway) from October to November 2019, including their ice nucleation ability, physicochemical properties, and potential sources. Overall, INP concentrations (NINP) during the observation season were approximately up to 3 orders of magnitude lower compared to the global average, with several samples showing degradation of NINP after heat treatment, implying the presence of proteinaceous INPs. Particle fluorescence was substantially associated with INP concentrations at warmer ice nucleation temperatures, indicating that in the far-reaching Arctic, aerosols of biogenic origin throughout the snow- and ice-free season may serve as important INP sources. In addition, case studies revealed the links between elevated NINP and heat lability, fluorescence, high wind speeds originating from the ocean, augmented concentration of coarse-mode particles, and abundant organics. Backward trajectory analysis demonstrated a potential connection between high-latitude dust sources and high INP concentrations, while prolonged air mass history over the ice pack was identified for most scant INP cases. The combination of the above analyses demonstrates that the abundance, physicochemical properties, and potential sources of INPs in the Arctic are highly variable despite its remote location.
- Article
(13557 KB) - Full-text XML
- BibTeX
- EndNote


Arctic regions are extremely sensitive to climate change. Over the past few decades, it has been reported that the anthropogenic warming in the Arctic is 2 to 3 times faster than the global average (Forster et al., 2021; Wendisch et al., 2019; Serreze and Barry, 2011), a phenomenon commonly known as Arctic amplification. Satellite observations have revealed a considerable retreat of Arctic sea ice extent in all seasons (Stroeve et al., 2012; Serreze et al., 2007), which is identified as one of the principal drivers of Arctic amplification given the positive surface albedo feedback (Screen and Simmonds, 2010; Hall, 2004). Modeling studies (Pithan and Mauritsen, 2014; Graversen and Wang, 2009; Hall, 2004) have also verified Arctic amplification in the absence of surface albedo feedback. Additionally, other feedbacks are also suggested as important contributors to Arctic amplification, including atmospheric and oceanic heat transport from the mid-latitudes (Spielhagen et al., 2011), the greenhouse effect of additional water vapor (Graversen and Wang, 2009), lapse-rate associated with the vertical structure of warming (Bintanja et al., 2012), and cloud feedbacks (Korolev et al., 2017; Vavrus, 2004; Intrieri et al., 2002). Cloud feedbacks are nontrivial regarding Arctic amplification given the ubiquity of clouds and their potential to affect the radiative balance at both the surface and the top of the atmosphere. However, accurate quantification and prediction of cloud-induced feedbacks to climate change remain challenging due to the rudimentary understanding of aerosol–cloud interactions and inadequate model representations (Forster et al., 2021; Schmale et al., 2021; Murray et al., 2021), particularly in the remote Arctic.
Low-level mixed-phase clouds (MPCs), composed of a mixture of ice and supercooled liquid water, play a critical role in the energy budget, given their spatiotemporal prevalence in the Arctic (Forster et al., 2021; Korolev et al., 2017; Morrison et al., 2012). The phase partitioning of hydrometeors within the MPCs is an essential microphysical process that intrinsically drives the cloud feedback because more liquid water and fewer ice crystals (i.e., the trend in the warming future) are associated with increased cloud albedo and diminished downwelling short-wave radiation, leading to a negative cloud-phase feedback to climate change (Lohmann and Neubauer, 2018; Storelvmo, 2017). In MPCs, where the temperature is higher than the onset of homogeneous freezing at approximately −38 ∘C for cloud-droplet-relevant sizes, primary ice formation can only be triggered with the aid of a small subset of aerosol particles termed ice-nucleating particles (INPs, e.g., Kanji et al., 2017; Vali et al., 2015). Immersion freezing, a heterogeneous freezing process where INPs become immersed in a dilute aqueous solution through the activation of cloud droplets followed by catalyzing freezing from within (Vali et al., 2015), is considered the most important freezing mode in the MPCs (Kanji et al., 2017; Hande and Hoose, 2017; Westbrook and Illingworth, 2013) and will be the focus of this study. Frequently, secondary ice production increases ice crystal concentrations to several orders of magnitude higher than the INP concentration (Korolev et al., 2020). However, cases with ice crystal number concentrations limited by the available INPs have also been observed in the Arctic (Pasquier et al., 2022b). Despite the extraordinary paucity of INPs in the troposphere and that at −15 ∘C, approximately 1 in 105 to 106 aerosol particles can act as an INP (e.g., Kanji et al., 2017; Petters and Wright, 2015); their type, abundance, and variability can indirectly affect the climate by altering the microphysical and radiative properties of MPCs (e.g., DeMott et al., 2010; Lohmann, 2002). For instance, cloud-resolving modeling studies revealed that the liquid and ice water path (Eirund et al., 2019), atmospheric stability (Jiang et al., 2000; Harrington et al., 1999), and precipitation (Harrington and Olsson, 2001) in the Arctic MPCs respond sensitively to INP perturbations in abundance and efficiency, and the responses were dominant over altering the cloud condensation nuclei (CCN) concentrations (Solomon et al., 2018). In addition, the slope of INP concentration versus ice nucleation temperature (i.e., INP efficiency) can influence the development and radiative forcing of convective clouds (Hawker et al., 2021), and with relatively low abundance in the Arctic, enhanced Arctic amplification was simulated given larger and fewer ice particles in MPCs (Tan and Storelvmo, 2019). Moreover, modeling studies (Hines et al., 2021; Vignon et al., 2021; Vergara-Temprado et al., 2018) produced more realistic cloud-phase separations with an adjusted microphysics scheme that better represented heterogeneous nucleation processes. Therefore, further constraints on the role of INPs and robust representations in the cloud microphysics parameterizations in climate models are of vital importance to accurately capture the cloud feedback related to Arctic amplification.
A variety of aerosols of both terrestrial and marine origin in the Arctic can act as INPs in the MPC temperature regime. Mineral dust particles can typically act as INPs at temperatures below approximately −15 ∘C (Kanji et al., 2017; Hoose and Möhler, 2012; Murray et al., 2012). In the Arctic, mineral dust emitted from high latitudes, e.g., from the glacial outwash plains in Svalbard (Tobo et al., 2019) or from deserts in Iceland (Sanchez-Marroquin et al., 2020), or dust originating from long-range transport (Vergara-Temprado et al., 2017) are significant terrestrial sources of INPs. In contrast, biological INPs favor heterogeneous ice nucleation at relatively warmer temperatures above approximately −15 ∘C (Murray et al., 2012). Their sources in the Arctic can stem from land, e.g., vegetation (Conen et al., 2016); runoff from watersheds (Tobo et al., 2019) and thawing permafrost (Barry et al., 2023; Creamean et al., 2020); or from the ocean, e.g., sea spray aerosols (SSAs) (Irish et al., 2017; DeMott et al., 2016; Wilson et al., 2015), phytoplankton (Ickes et al., 2020; Hartmann et al., 2020; Creamean et al., 2019), and bacterial productivity (Šantl Temkiv et al., 2019). In addition to the INP sources originating from the vicinity of the measurement sites in the local Arctic, the remote effect of INP emissions from mid- to low-latitudes and long-range transport cannot be neglected (Schmale et al., 2021). In deterministic INP parameterizations, the magnitude of the cloud-phase-related feedback relies on the efficiencies of INPs due to their dependency on nucleation temperatures for different INP species (Murray et al., 2021; Hawker et al., 2021).
In this study, we aim to improve our understanding of the abundance, variability, sources, physicochemical properties, and impacting factors of INPs in the Arctic based on field measurement data. We introduce the campaign information, experimental setup, and different INP instrumentation in Sect. 2. An overview of ambient INP measurements and characterization is presented and discussed in Sect. 3.1 and 3.2, respectively, and several special case studies are demonstrated in Sect. 3.3. Section 4 highlights the conclusions from this study and suggests potential implications for the changing climate.
2.1 Measurement location and experimental setup
The measurement campaign of ambient INP and aerosol properties was a part of the Ny-Ålesund AeroSol Cloud ExperimeNT (NASCENT) campaign (Pasquier et al., 2022a) from October to November 2019 at Ny-Ålesund (78.9∘ N, 11.9∘ E). Ny-Ålesund is located on the western coast of the Svalbard archipelago (Fig. 1a). Ambient INP and aerosol measurements were conducted at two locations: in an aerosol container (78.923∘ N, 11.921∘ E) and at Gruvebadet observatory station (GVB, 78.918∘ N, 11.894∘ E; see Fig. 1b). Local sources of pollution have a limited influence on the measurement sites during the measurement period, given the predominant southeasterly wind at the aerosol container and prevailing southwesterly winds close to the GVB observatory station (see the detailed wind pattern in Fig. 1b).
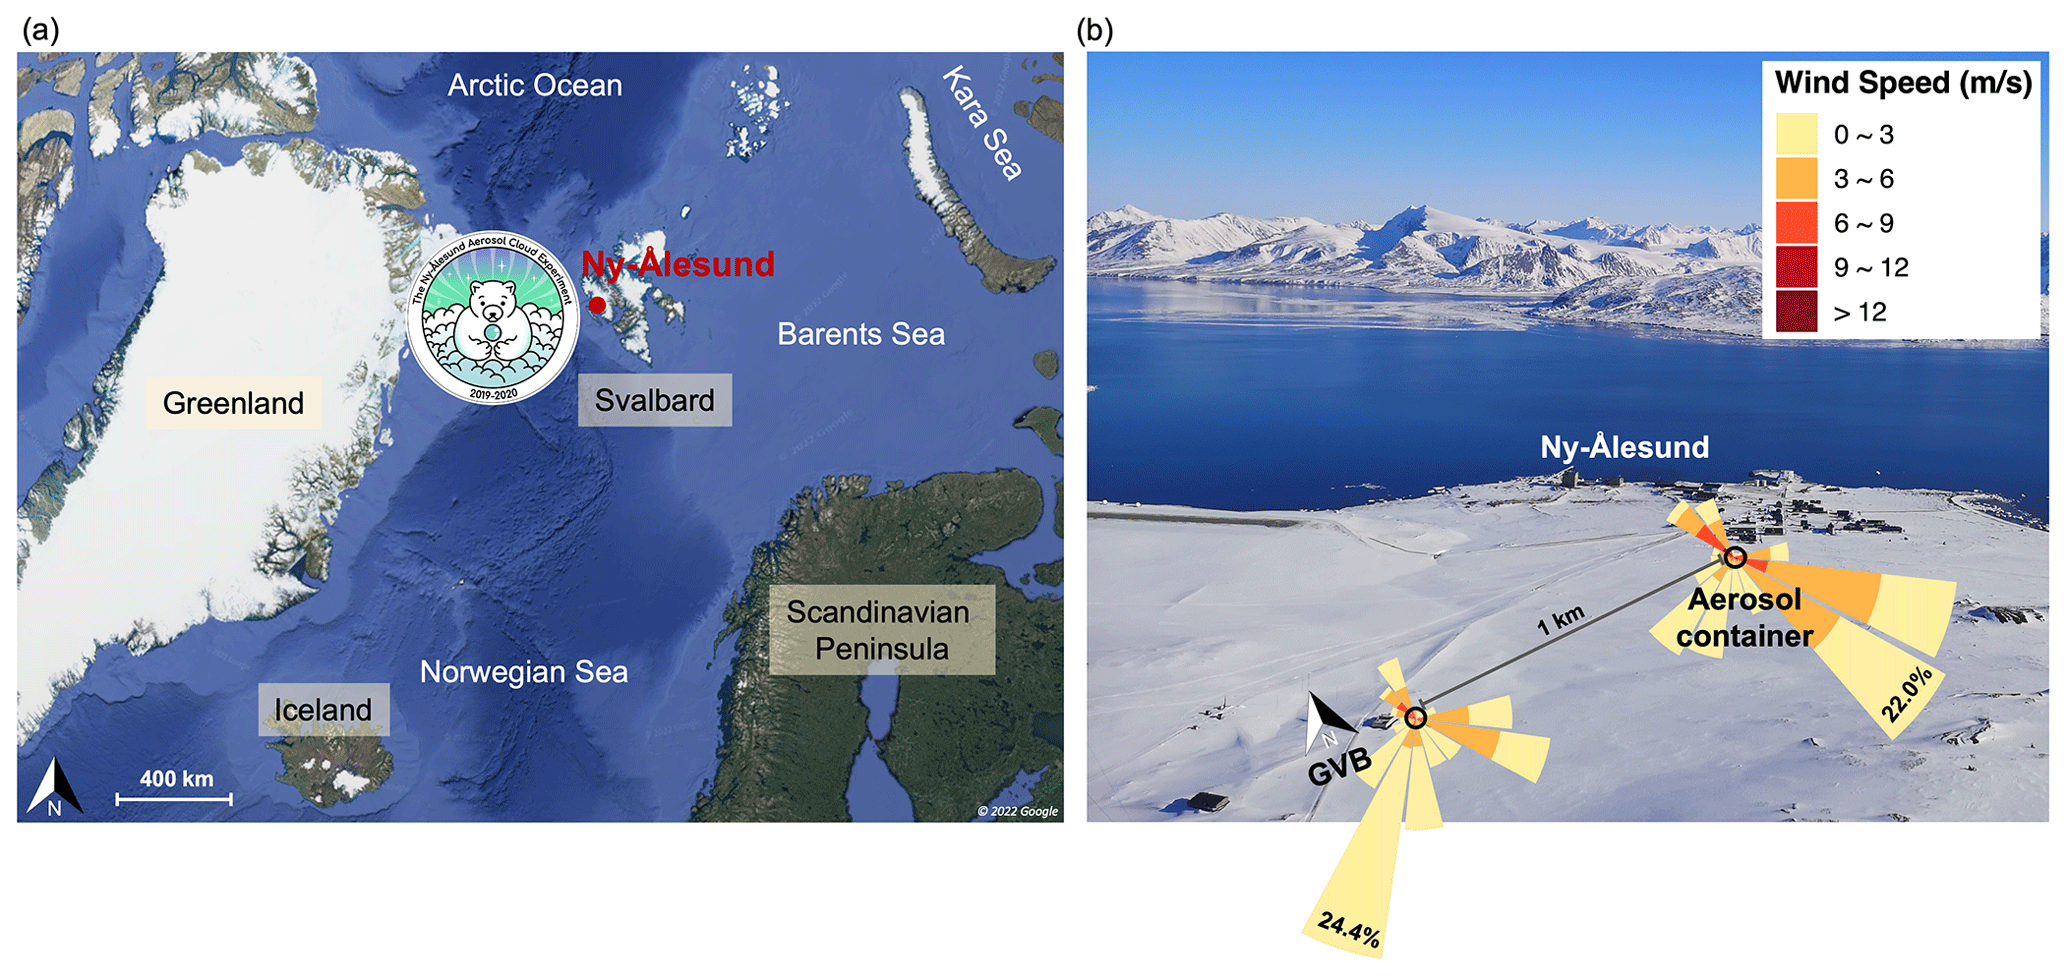
Figure 1(a) Geographic location of the 2019 NASCENT campaign in Ny-Ålesund, Svalbard. (b) Location of measurement stations in Ny-Ålesund (photo taken in mid-October 2019). The atmospheric container was located at the southern edge of Ny-Ålesund town and was approximately 600 m from the shore of Kongsfjorden. The GVB observatory station is located about 1 km west of Ny-Ålesund town and is approximately 49 m a.s.l. The frequency of occurrence in wind direction and speed during the 2019 NASCENT campaign are shown for the GVB station and aerosol container. The colored bars of wind roses provide the frequency of occurrence, with the value of the frequency of occurrence of the most likely wind direction displayed at the longest bars.
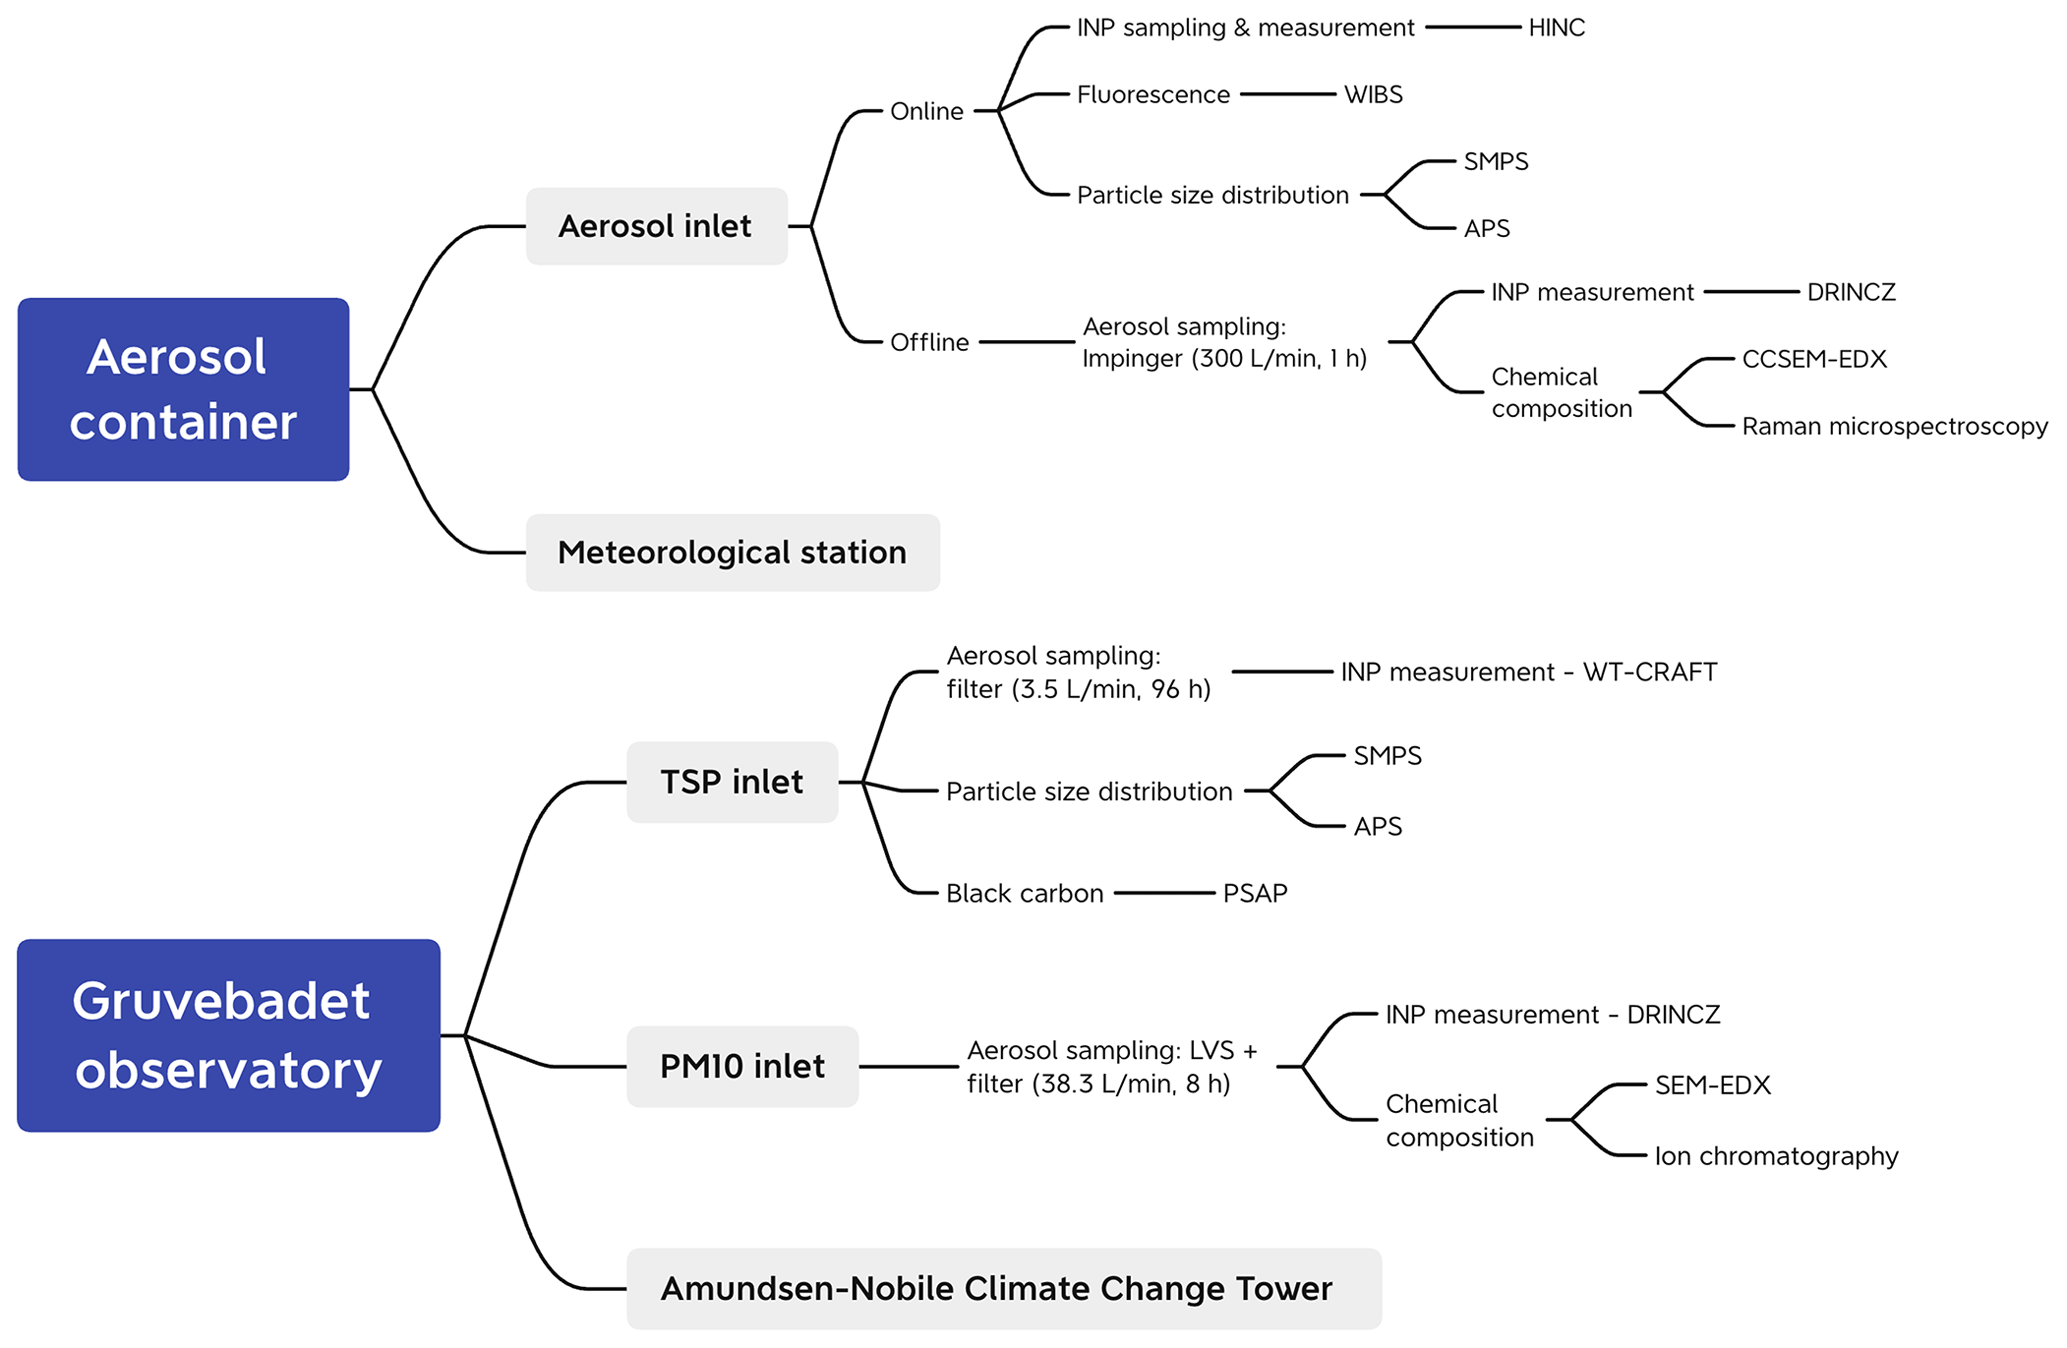
Figure 2Schematic of the experimental setup in Ny-Ålesund at the aerosol container and Gruvebadet (GVB) observatory. Online means the analytical instruments with real-time aerosol sampling and monitoring, and offline denotes the instruments and devices that collect samples and take post-measurements separately. The sampling flow rates and duration are shown in the parentheses for aerosol sampling instruments. Acronym meanings are as follows: Horizontal Ice Nucleation Chamber (HINC), Wideband Integrated Bioaerosol Sensor (WIBS), Scanning Mobility Particle Sizer (SMPS), Aerodynamic Particle Sizer (APS), DRoplet Ice Nuclei Counter Zurich (DRINCZ), Computer-Controlled Scanning Electron Microscopy with Energy-Dispersive X-ray spectroscopy (CCSEM/EDX), West Texas Cryogenic Refrigerator Applied to Freezing Test (WT-CRAFT) system, Particle Soot Absorption Photometer (PSAP) and Low Volume Sampler (LVS).
A flow diagram of the instrument setup is shown in Fig. 2. In the aerosol container, the aerosol flow was sampled through a total aerosol inlet mounted outside of the container, which was about 4.5 m above the ground. The inlet had an upper cutoff threshold of approximately 40 µm (Li et al., 2022) and was heated to a maximum of 40 ∘C to avoid clogging and frost buildup in the sampling line. The evaporation of volatile compounds in the aerosols cannot be excluded. Subsequently, the aerosol flow was directed into different branches of aerosol and INP instruments (for detailed flow configurations, see Li et al., 2022). The aerosol samples collected offline by the impinger were later subject to INP measurement via the DRoplet Ice Nuclei Counter Zurich (DRINCZ; David et al., 2019) and chemical composition analyses using computer-controlled scanning electron microscopy with energy-dispersive X-ray spectroscopy (CCSEM/EDX) and Raman microspectroscopy. At the GVB observatory, ambient INPs were analyzed using different offline techniques. Aerosol particles for analysis with DRINCZ were collected onto the 47 mm polycarbonate membrane filter (Whatman, 0.4 µm pore size) during 8 h intervals using a low-volume aerosol sampler (LVS, DPA14, Digitel) coupled with a PM10 inlet. The height of the inlet was approximately 5 m a.g.l., and the operating flow rate was 38.3 L min−1. Aerosols for the West Texas Cryogenic Refrigerator Applied to Freezing Test (WT-CRAFT) analysis were collected using 47 mm polycarbonate membrane filters (Whatman, 0.2 µm pore size) during 4 d intervals (one exception was a 3 d sample started on 27 October 2019) from a central total suspended particulate (TSP) inlet with a critical-orifice-controlled sampling flow rate of 3.5 std L min−1 (for a detailed setup see Rinaldi et al., 2021). Additionally, the aerosol properties were also monitored at the GVB observatory, including particle size distribution, black carbon, and chemical composition. The descriptions of instruments measuring INPs, aerosol physicochemical properties, and meteorological conditions are given below.
2.2 INP sampling and measurement techniques
To investigate the ambient INP concentrations in immersion-freezing mode, we used different INP sampling and measurement instruments introduced in the following subsections, which provide a large range of sampled particle sizes, time resolutions, freezing temperatures, and hence different INP detection limits (see Table 1). In particular, the droplet-freezing techniques (see Sect. 2.2.1 and 2.2.2) have different limits of detection (LOD) due to the different droplet sizes and numbers in the experimental setup.
Table 1Summary of INP sampling and measurement techniques applied in the present study. For the droplet freezing techniques (i.e., DRINCZ and WT-CRAFT), the lower temperature range represents the homogeneous freezing temperature, where pure water is observed to freeze at the corresponding droplet size. In HINC, homogeneous freezing is observed at −38 ∘C, which is to be expected given that the droplet sizes are much smaller than the other instruments. In this work, HINC was only operated at −30 ∘C in the immersion freezing mode (RHw = 104 %).
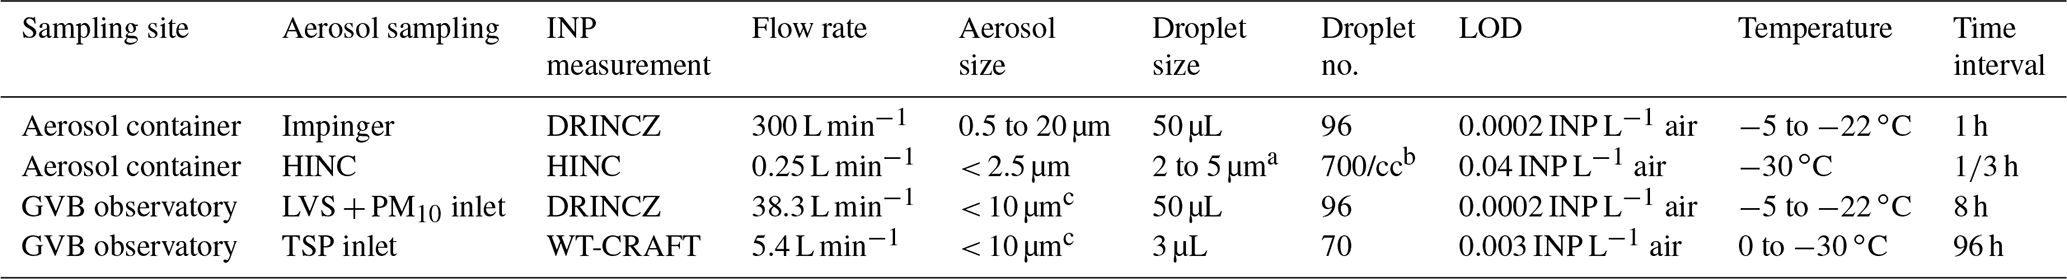
a Depending on aerosol sizes and compositions. b Assuming droplet size of 5 µm before water vapor competition. c The PM10 and WT-CRAFT samples were collected on the 0.4 and 0.2 µm polycarbonate membrane filters, respectively. The small-sized particles can be sampled by interception and diffusion, even for those below the filter pore sizes. Therefore, there is no lower size limit because the entire airflow is directed through the filter.
2.2.1 DRINCZ
INP concentrations (NINP) were measured using different offline and online methods. In the aerosol container, ambient aerosols were collected into the ultrapure water (W4502-1L, Sigma-Aldrich) using the high-flow-rate impinger (Coriolis® μ, Bertin Instruments, lower limit cutoff size of 0.5 µm) at a flow rate of 300 L min−1 for 1 h. Additional ultrapure water (W4502-1L, Sigma-Aldrich) was constantly supplied to the sampling container via a refilling system during the operation of the impinger in order to compensate for the evaporation losses. The INP analysis for impinger samples was conducted on site directly after the sample collection. Aerosol filters collected using the PM10 inlet at the GVB observatory were analyzed for NINP after the campaign in the laboratory back at ETH after frozen storage and transport at −20 ∘C. To determine NINP, membrane filters were immersed in 15 mL of ultrapure water (W4502-1L, Sigma-Aldrich) and agitated using a sonicator to extract the particles into the water. During October and November 2019, a total of 137 and 77 samples were collected by the impinger and PM10 filters, respectively, for immersion-mode NINP analysis in DRINCZ (David et al., 2019). Each sample was pipetted into a sealed polymerase chain reaction (PCR) tray with 96 aliquots of 50 µL and cooled in an ethanol bath at 1 ∘C min−1. During the cooling phase, a camera placed above the bath captures images of the cooling state of the PCR tray and the bath temperature was monitored. From the variation in optical brightness of an aliquot between subsequent images, the freezing temperature of the aliquots was determined. INP concentrations are derived by using the impinger flow rate and volume of an aliquot (see details in David et al., 2019). We calculated NINP at each integer temperature based on (Vali, 1971, 2019):
where Nfrz(T) is the number of frozen aliquots at temperature T, Ntot is the total number of aliquots (Ntot = 96), Va is the volume of an individual aliquot (Va = 50 µL), Vliquid is the volume of sampling liquid (15 mL for impinger), Qsample is the sampling flow rate (300 L min−1 for impinger), and tsample is the sampling time (1 h for impinger). DF is the dilution factor, which was applied to quantify the dilutions for some highly IN-active samples. Diluted and non-diluted scans were combined using the methodology provided in Wieder et al. (2022) for these samples. NINP of each sample derived from above was corrected for the background of blank samples based on the methods in David et al. (2019) and Li et al. (2022). For impinger samples, in order to account for contamination from the refilling system and the sampling substrate, blank samples were collected and analyzed every 3 d during the campaign by adding the same amount of ultrapure water for samples (15 mL) to the sampling container using the refilling system. Concerning PM10 filter samples, empty filters were taken on site and reserved in the filter holders for the same duration as for the sampling stage before being stored, processed, and analyzed for background INP concentrations. According to Vali (2019), all field samples were corrected for the background by subtracting the differential INP spectrum of the corresponding blanks from that of the original samples. Based on the LOD of DRINCZ and purity of the nano-pure water, the highest temperature for NINP detection was approximately −5 ∘C (around which the instrument is not sensitive enough to detect the low concentrations), and the lowest temperature at which ice nucleation could be reliably reported was −22 ∘C (below which NINP are usually closed to the background concentrations), with the overall uncertainty in the reported freezing temperature of a well of ±0.9 ∘C (David et al., 2019).
2.2.2 WT-CRAFT
The WT-CRAFT system, a replica of the Cryogenic Refrigerator Applied to Freezing Test (CRAFT) system (Tobo, 2016), was used to measure NINP in a unit volume of air for aerosol particles collected at the GVB observatory. With a detection capability of > 0.003 INP std L−1 of air, NINP was assessed for a total of seven samples in the temperature range of approximately −30 to 0 ∘C, with a systematic uncertainty in freezing temperature of ±0.5 ∘C (Vepuri et al., 2021). The background contribution may be substantial for the WT-CRAFT NINP data measured below −25 ∘C. Alternatively, the 95 % confidence interval can represent an experimental uncertainty in the estimated NINP for each measured data point (Rinaldi et al., 2021). All analyses were completed within 1 year after collecting the samples, and the samples were stored in a fridge (4 ∘C) before commencing the analysis.
For each experiment, the freezing properties of 70 solution droplets (3 µL each) placed on a hydrophobic Vaseline layer were assessed with a cooling rate of 1 ∘C min−1. A cumulative number of unfrozen droplets were counted for every 0.5 ∘C based on the color contrast shift in the off-the-shelf video-recording camera. If the freezing temperature was not obvious for any droplets, the image analysis was performed using ImageJ software to determine the temperature of phase change. Using the same Eq. (1), NINP of the samples was estimated as a function of T, where Ntot = 70; Va = 3 µL; and Vliquid, Qsample, and tsample depend on the individual samples.
Prior to each WT-CRAFT experiment, particles on an individual filter sample were suspended in a known volume of ultrapure high-performance liquid chromatography (HPLC) grade water. The HPLC water volume was determined for the third frozen droplet to correspond to 0.003 INP L−1 according to Eq. (1). It is noteworthy that we limited our WT-CRAFT data analysis to the third frozen droplet to eliminate any uncontrollable artifacts in our WT-CRAFT data (Hiranuma et al., 2019). Because of the negligible background freezing contribution of the field blank filter at −25 ∘C (i.e., < 3 %), we did not apply any background corrections to our NINP data. Otherwise, we followed the exact same protocols described in Rinaldi et al. (2021) for our suspension generation and dilution.
2.2.3 HINC
To complement the INP measurements at colder temperatures, we sampled and measured NINP with HINC (Lacher et al., 2017), a continuous flow diffusion chamber. HINC was operated at T = −30 ∘C (±0.4 ∘C) and relative humidity with respect to water RHw = 104 % (±1.5 %), representative of ice nucleation in immersion and condensation modes. The detailed experimental configuration of HINC can be found in Li et al. (2022). With a size threshold of 5 µm derived from the water droplet survival test (Lacher et al., 2017) at the designed experimental conditions, we were able to distinguish the ice crystals from water droplets during the sampling phase. To account for ice particles emitted from frost buildup, which can be misidentified as INPs when detaching from the inner surface, we applied a routine of filtered air measurements (5 min) before and after each sampling interval (15 min) to determine the background count of ice particles and the LOD based on Poisson statistics. Subsequently, NINP was calculated by subtracting ice particle concentrations during the background interval from that during the sampling interval (see detailed calculations in Lacher et al., 2017). During the field campaign between October and November 2019, we reported 135 INP concentrations from HINC measurements that were higher than the LOD of the instrument out of a total of 348 observations. In other words, the 135 INP concentration data points have a significance level of 68.3 % and were more reliable for extrapolation due to the limitation of the instrument at the measurement conditions.
We compare the different approaches to infer the impact of particle size on ice nucleation. INP measurements from different approaches allow us to understand aerosol properties. For example, we could have active INPs from pollen particles above 10 µm, which are not captured by the PM10 measurements, but submicrometer biogenic macromolecules down to below 100 nm would be captured. With the impinger, we capture particles larger than 10 µm but no particles smaller than 500 nm. Therefore, different approaches are needed to capture both extreme ends of the size range. Similarly, WT-CRAFT collected particles smaller than 10 µm efficiently and uses smaller droplet sizes than DRINCZ for freezing experiments, and it thus can be assessed for ice nucleation temperatures down to −30 ∘C, extending the temperature range of the DRINCZ approach (−22 ∘C) by 8 ∘C. The broader coverage of particle sizes and temperatures measured by the combined methods allows for a better representation of ambient INPs.
2.3 Heat treatments
Macromolecules originating from biological species (e.g., bacteria and phytoplankton) that are typically comprised of proteins can effectively catalyze ice nucleation (Pummer et al., 2015; Hill et al., 2016). Proteins are susceptible to heat; i.e., heating effectively unfolds the proteinaceous structure, degrading the IN ability of the particles (Creamean et al., 2021; Hill et al., 2016; McCluskey et al., 2018; Pummer et al., 2015). For the heat treatment, liquid samples from the impinger and washout of PM10 filters and TSP filters (for WT-CRAFT analysis) were subjected to 95 ∘C for 20 min. Subsequently, after being stabilized to room temperature, they were redistributed to PCR trays for INP analysis using DRINCZ. By comparing the IN activity after heating, it is possible to assess the contribution of heat-labile species to the INP population, which could be used as a proxy to indicate the presence of biological INPs. We note that such heat treatment could exclude lower molecular weight samples yet still imply that proteinaceous aggregates are present (Seifried et al., 2023). Thus, any effect of heat treatment on the INP concentration would be due to the contribution of heat-labile particles from biogenic sources. Post-campaign heat tests were conducted in the laboratory. To elucidate the relative change in INPs affected by degradation due to freezing storage only, we repeated the INP concentration analysis for original impinger samples that were selected for heat treatment. Heat treatment was applied to all PM10 filter samples and 14 impinger samples overlapping with the WT-CRAFT time window for repeated INP analysis and heat treatment for comparison.
2.4 Particle chemical composition analysis
2.4.1 CCSEM/EDX for impinger droplet residual samples
Computer-controlled scanning electron microscopy with energy-dispersive X-ray spectroscopy (CCSEM/EDX) was utilized to automatically probe the morphology and elemental composition of individual particles in a series of selected impinger samples collected on the aluminum foil (Laskin et al., 2006). The system includes an environmental scanning electron microscope (ESEM, Quanta 3D, Thermo Fisher) equipped with an FEI Quanta digital field emission gun operated at 20 kV and 480 pA with a 30 µm aperture and a spot size of 6.0 nm to retrieve the ESEM images, which was used to retrieve the morphologies of individual particles (Lata et al., 2021). These individual particles are recognized based on the difference in brightness and contrast between particles and substrate in ESEM images. The ESEM was also equipped with an EDX spectrometer (EDAX, Inc.) to determine the relative percentages of 12 elements (C, N, O, Na, Mg, Si, P, S, Ca, Mn, Fe, and Zn) in the individual particles (see Table D1). Applying a k-means clustering algorithm on all analyzed particles using their atomic percentages (Hartigan and Wong, 1979), we categorized components inside each particle as salt (Na + Mg ≥ 15 %), Si dust (Si + Ca + Fe ≥ 15 % and Si ≥ Fe), Fe dust (Si + Ca + Fe ≥ 15 % and Fe > Si), sulfate (S) (S ≥ 2 %), phosphorus (P ≥ 1 %), and metal-containing particles (Mn + Zn ≥ 15 %). The number of clusters was determined using the silhouette method (Kodinariya and Makwana, 2013). Based on their compositions, we then classified individual particles as salt-containing particles, dust-containing particles, metal-containing particles, and P-containing particles. It should be noted that particles can be clustered into multiple classes. For instance, if a particle only fulfills Na + Mg ≥ 15 % and Si + Ca + Fe ≥ 15 % and Si ≥ Fe, its composition is classified as (salt + Si − dust). It should be noted that the chamber was operated at 293 K under vacuum conditions (ca. 2 × 10⁻⁶ Torr). Thus, volatile and semi-volatile components might have been evaporated. For selected impinger samples as case studies indicated in Sect. 3.3.2, the total number of particles analyzed by CCSEM-EDX was 1171, 1286, and 1016 for the Impinger_high, Impinger_moderate, and Impinger_low samples, respectively.
2.4.2 Single particulate matter chemical composition using Raman microspectroscopy on impinger samples
Selected samples were characterized with Raman microspectroscopy using a Thermo Scientific DXR Raman spectrometer coupled to an Olympus BX 20 microscope and a CCD to capture images of the particle as the analysis was performed (Deng et al., 2014). The analysis was performed with a 532 nm frequency doubled neodymium-doped yttrium orthovanadate (Nd: YVO4) diode-pumped solid-state laser with 3 MW power. A 50× objective (Thermo Scientific) was used to find a single particle that was then sampled for bond composition following the procedures used in previous studies (Deng et al., 2014). A series of 10 exposures at 10 s each was averaged to smooth the sample spectrum. Samples that showed signs of fluorescence were not analyzed past identification of the fluorescence, as there was no way to tell whether additional peaks were obscured by the fluorescence signal.
Peaks were classified based on Larkin (2017) and samples were classified into broad categories. As the environmental samples contain both internally and externally mixed aerosol particles, a more detailed classification was not possible. The samples were classified as metal-containing, nitrogen-containing, sulfur-containing, organic-containing, and aromatic-ring-containing (note that particles can be placed into more than one category based on composition).
2.4.3 JEOL SEM-EDX for PM10 filter samples
The JEOL scanning electron microscopy–energy-dispersive X-ray spectroscopy (SEM-EDX) system (Model JSM-6010LA) was used to assess the elemental composition of aerosol particles collected on the PM10 filters. Briefly, this system allowed us to characterize the atomic percentage of 14 elements, N, O, Na, Mg, Al, Si, P, S, Cl, K, Ca, Mn, Fe, and Zn, on a single-particle basis (see Table D2). All analyses were performed under a constant measurement condition, which is a 20 keV electron beam accelerating voltage and a 10 mm distance between the SEM objective lens and the specimen surface. Because the particles were collected on polycarbonate filters, it was not possible to determine the atomic percentage of carbon. Instead, SEM-EDX data were mainly used to determine the presence or absence of mineral-dust- and/or sea-salt-relevant elements using the simple particle-type classification method, which was previously applied for the Alaskan Arctic aerosol characterization study Hiranuma et al. (2013).
A total of 627 aerosol particles (i.e., 6 filter samples and approximately 100 particles per sample) were analyzed in this study. Individual particles were assessed for their x axis and y axis segment diameters, and a cross-sectional average diameter was computed for each particle. The largest particle analyzed was 6.04 µm in diameter. It should be noted that the edge of filter pores can be misidentified as particles under CCSEM-EDX due to having similar brightness and contrast to particles. The lower detection limit for the JOEL SEM method is approximately 0.5 µm particle diameter. Thus, we decided to manually analyze a subset of particles with a regular SEM-EDX system. We note that the manual operation of SEM-EDX is a time-consuming and labor-intensive process, and thus its application during this study was limited. For this reason, a few samples were selected to study in greater detail. A subset of single particles was selected on each filter to analyze particle composition, with at least 100 randomly selected particles (at least 25 particles per 128 µm × 96 µm cross section) across each filter to give an approximation of population chemical composition and major particle groups (i.e., mineral-dust- or sea-salt-rich particles). No specific particle size or shape was pre-selected for analysis. Instead, a range of sizes and shapes was targeted to give the best approximation of overall population chemistry.
2.5 Complementary measurements and analyses
2.5.1 Particle size distribution
The size distribution of submicrometer particles was measured using a scanning mobility particle sizer (SMPS, Model 3938, comprising a 3082 classifier, a 3081 long differential mobility analyzer and a 3787 CPC, TSI Inc.). The sampling flow rate of the SMPS was 0.6 L min−1 with a sheath-to-sample ratio of 10 : 1, leading to a range from approximately 15 to 600 nm in electrical mobility diameter. In addition, multiple charge correction was applied to account for the misclassification of large particles with multiple charges. Parallel to the SMPS, the size distributions of coarse-mode (ranging from approximately 0.5 to 20 µm in aerodynamic diameter) particles were analyzed by an aerodynamic particle sizer (APS, model 3321, TSI Inc.) at a flow rate of 1 L min−1. For the purposes of cross-comparison, the electrical mobility diameters obtained from SMPS and aerodynamic diameters from the APS were converted to volume-equivalent diameters assuming an average particle density of 2 g cm−3 (Li et al., 2022; Tobo et al., 2019) and a dynamic shape factor of 1.2 (Li et al., 2022; Thomas and Charvet, 2017). A set of identical SMPS and APS instruments were available at both the GVB observatory and the aerosol container for this study.
2.5.2 Particle fluorescence
The concentration of biological fluorescent particles with diameters ranging between 0.5 and 20 µm was monitored using the wideband integrated bioaerosol sensor (WIBS-5/NEO, DMT) on a single particle basis, downstream of the inlet of the aerosol container. The WIBS uses ultraviolet light to trigger the excitation of particles and to detect the emissions scattered from the fluorescent particles (Toprak and Schnaiter, 2013). The wavelengths of excitation and emission were specifically designed to probe biological fluorophores, e.g., tryptophan-containing proteins, NAD(P)H, and riboflavin, which are ubiquitous in the airborne microbes (Pöhlker et al., 2012). The resulting total fluorescence was then measured in three fluorescence channels: FL1 (310–400 nm) and FL2 (420–650 nm) following a 280 nm excitation and a 370 nm excitation for channel FL3 (420–650 nm). Each individual particle is identified to be fluorescent in any channel when the intensity of its fluorescence emission is higher than the baseline threshold. However, the fluorescent signals from WIBS may misidentify non-biological particles with fluorescent signatures, such as some dust particles, HULIS, and polycyclic aromatic hydrocarbons (PAHs) (Toprak and Schnaiter, 2013). These misclassifications could be suppressed by characterizing the fluorescence in different channels independently, which allows particles to be classified into different fluorescence categories (Savage et al., 2017; Perring et al., 2015). The new fluorescence categories are named A, B, C, AB, AC, BC, and ABC based on the detection of activation in the original channels (i.e., FL1, FL2, and FL3), signifying particle fluorescence detected in channel FL1 only, FL2 only, FL3 only, FL1 and FL2, FL1 and FL3, FL2 and FL3, and all three channels, respectively. More details are given in Fig. 1 of Savage et al. (2017) and Perring et al. (2015). To minimize the false-positive signal from non-biological particles being classified as fluorescent, the category “AC + ABC” (a particle fluoresces in both the FL1 and the FL3 channels but is not activated in the FL2 channel) was applied as a proxy for detecting biological fluorescent aerosol particles, with reduced remaining interference from non-biological sources (Toprak and Schnaiter, 2013).
2.5.3 Black carbon
Equivalent black carbon (eBC) concentration data were used to assess the potential contribution of BC on INP abundance. The eBC was measured using a particle soot absorption photometer (PSAP, Radiance Research), with which the light absorption coefficient (babs, m−1) can be determined at three absorption wavelengths (Gilardoni et al., 2019). The eBC concentration is derived from the light absorption coefficient at 660 nm. The mass concentration of BC (MBC, g m−3) can be estimated by dividing babs by the constant mass absorption cross section of BC (MAC, m2 g−1) of 10.0 ± 0.2 m2 g−1 (Sinha et al., 2017).
2.5.4 Meteorological conditions
We investigated the relationships between INP concentrations and the meteorological variables, including ambient temperature (Tenv), relative humidity (RHenv), pressure (penv), wind speed (ws), and wind direction (wd). The meteorological measurements for correlating samples from the aerosol container were conducted using an automatic meteorological station (MetSystems model WS-501, OTT). For measurements at the GVB observatory, we used the meteorological data from the Amundsen-Nobile Climate Change Tower configured with a set of meteorological sensors (details described in Mazzola et al., 2016).
2.5.5 Ion chromatography
The ionic compositions of the filters collected at GVB observatory in parallel with LVS PM10 filters were measured in aqueous extracts prepared prior to analysis using the ion chromatography following the procedures described in Becagli et al. (2011). The resulting ionic compositions involve many cations, inorganic anions (see detailed ion species in Becagli et al., 2011), methanesulfonic acid (MSA), and oxalate.
2.5.6 Backward trajectory analysis
Air mass backward trajectories were computed with the Hybrid Single-Particle Lagrangian Integrated Trajectory (HYSPLIT) model available online (https://www.ready.noaa.gov/HYSPLIT_traj.php, last access: 23 May 2023; Rolph et al., 2017; Stein et al., 2015). The 10 d (240 h) backward trajectories were computed 5 m a.g.l. from the sampling location every 6 h during the sampling period. To account for wet deposition, complete particle loss was assumed at 7 mm rainfall along the trajectory (Gong et al., 2020). The rainfall was summed along the trajectory, and the trajectory origin is reported as either the time and location where cumulative rainfall exceeded 7 mm or the location of the air mass 240 h before the sampling time, whichever was earlier. Air mass origin is reported in broad geographic terms, with oceans named according to commonly accepted names as defined by the U.S. Board on Geographic Names and terrestrial regions defined by continent. The Arctic regions were defined as occurring above 60∘ N latitudes. Back trajectory origins were determined accounting for particle deposition due to wet deposition.
3.1 Overview of atmospheric INP concentration
Figure 3a shows the overall NINP range as a function of ice nucleation temperature (T) at Ny-Ålesund during the NASCENT campaign (Pasquier et al., 2022a) from October to November 2019. In general, measurements among different techniques agree with each other, as demonstrated by the substantial overlap. Specifically, the median NINP at T = −20 ∘C measured with the PM10, impinger, and WT-CRAFT instruments were approximately 1.0 × 10⁻², 2.7 × 10⁻², and 0.7 × 10⁻² L−1, respectively. In addition, the variability in NINP as a function of T changes with T. In particular, for the PM10 and impinger samples, NINP varied over 3 orders of magnitude at mid-range temperatures (T = −16 to −14 ∘C), but the variation range shrunk as T increased or decreased. This could be attributed to the reduced number of available observations as the lower and upper instrument detection limits are approached (see Sect. 2.2.1). In addition, the distribution of WT-CRAFT INP data overlaps largely with PM10 and impinger data, which is to be expected since they were both taken at the GVB station. Additionally, the INP data for WT-CRAFT and PM10 can be extrapolated approximately log-linearly, although some variation is observed due to the limited sample number and coarse temporal resolution.
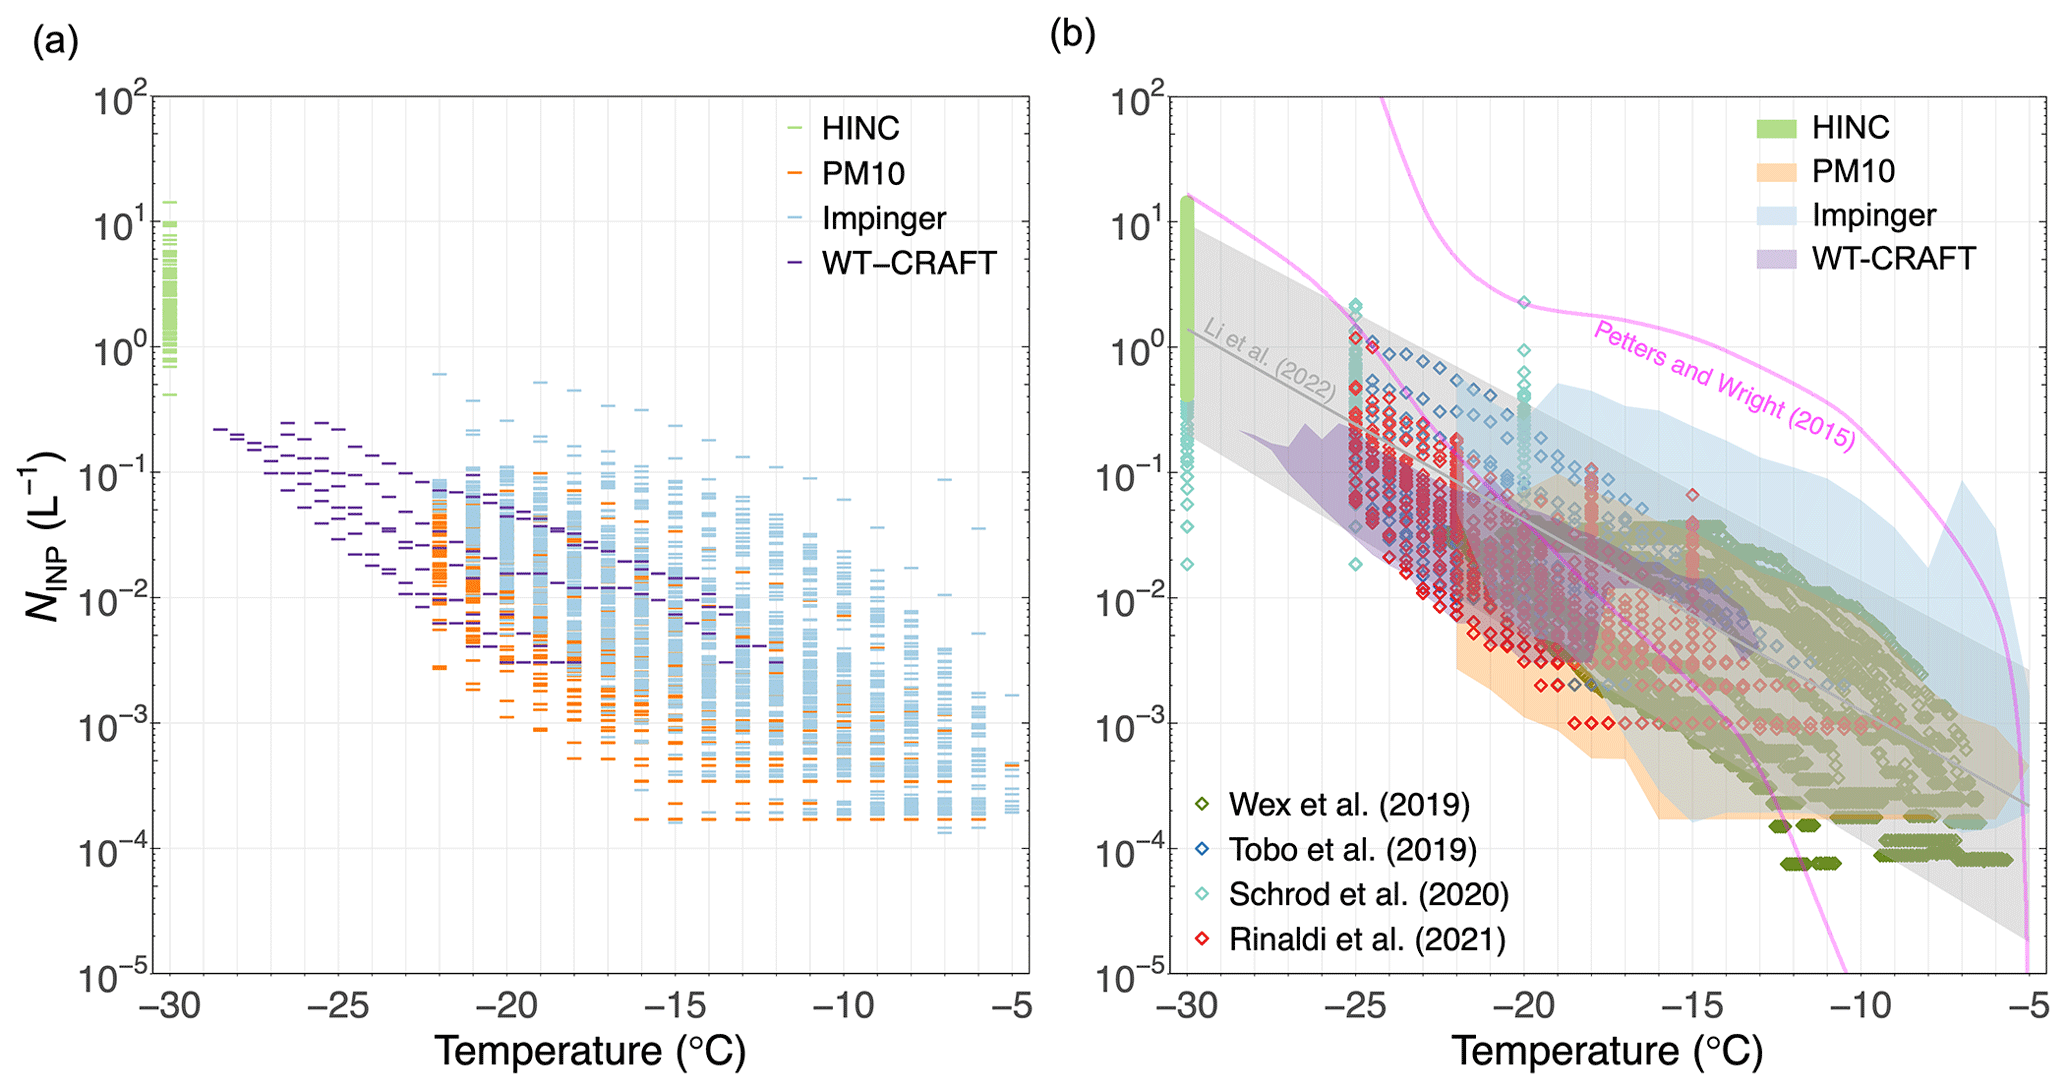
Figure 3Ambient INP concentration as a function of temperature for (a) observations of NINP (symbolized with “–”) including the sampling and measurements with HINC (T = −30 ∘C) and the impinger (−22 to −5 ∘C) at the aerosol container and with the PM10 filter (−22 to −5 ∘C) and WT-CRAFT (−30 to −12 ∘C) at the GVB observatory during autumn 2019 in Ny-Ålesund. (b) Comparison of our observations to literature data. The area between two lines in magenta is a compilation of INP concentrations determined from precipitation samples from the mid-latitudes (Petters and Wright, 2015). The light gray line (median) and the shaded area (95 % confidence interval) denote the INP parameterization developed from the Ny-Ålesund data during the NASCENT campaign in autumn 2019 and spring 2020 (Li et al., 2022). INP concentration data from Rinaldi et al. (2021) (spring and summer), Schrod et al. (2020) (yearlong), Tobo et al. (2019) (spring and summer), and Wex et al. (2019) (spring, summer, and autumn) measured at the same location are also presented in colored diamonds.
Compared to the global range of NINP derived from precipitation samples collected in the continental mid-latitudes (Petters and Wright, 2015) (Fig. 3b), the average NINP observed in the Arctic is approximately 2 orders of magnitude lower. However, at the highest T (−5 to −7 ∘C), NINP observed with the impinger were close to or higher than the global average level (Petters and Wright, 2015); despite this, high uncertainties may arise. This indicates a potentially significant contribution of biological INPs in the Arctic. The Arctic INP parameterization (Li et al., 2022) derived from the same campaign developed from impinger and HINC data from both autumn 2019 and spring 2020 generally agreed with the observations from PM10 and WT-CRAFT. Moreover, Fig. 3b also displays a compilation of NINP measurements from recent ground-based observations in Ny-Ålesund for comparison. Note that besides the natural variability in NINP, a number of factors (e.g., systematic error of each instrument, sampling volume, and seasonality) could contribute to the differences in observed NINP among studies. Nevertheless, the majority of literature NINP overlapped with our observation range, except Schrod et al. (2020), who observed systematically higher NINP at T = −20 ∘C, and data from Wex et al. (2019) at higher T, who measured lower INP concentrations, likely due to different detection threshold of the instruments (i.e., LOD) and the seasons during which they took measurements because a different season could imply different sources and abundance of INPs.
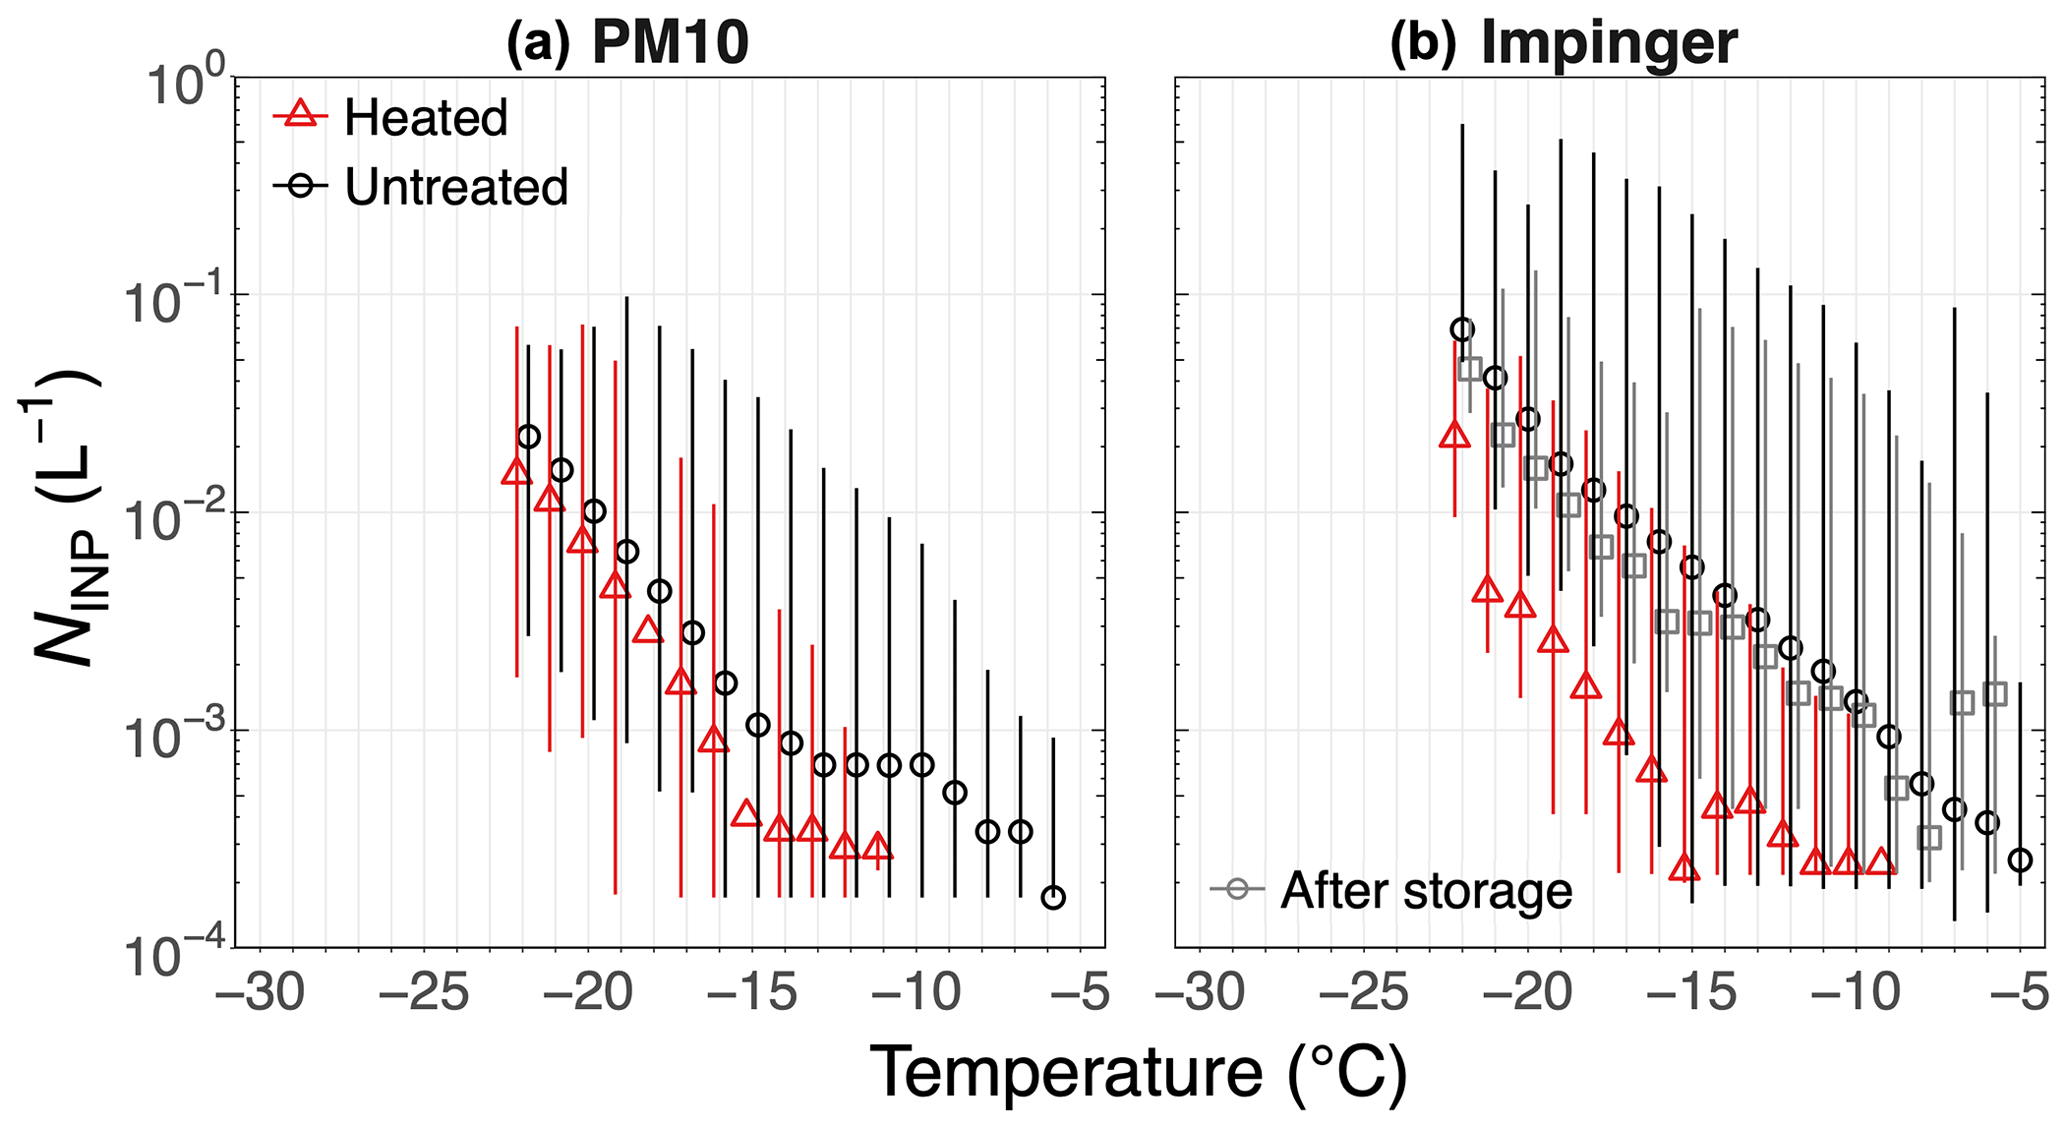
Figure 4Ambient INP concentration with and without heat treatment conditions as a function of temperature for different samples: (a) PM10 and (b) impinger. The symbols represent the median NINP of all samples collected during October–November 2019, and the vertical lines represent the 5 %–95 % percentile of the measurements. The heat treatment was not conducted on site for impinger samples shown in (b). Instead, the frozen samples were reanalyzed (gray squares) after storage in the laboratory and then subjected to heat treatment.
To detect the presence of proteinaceous biological ice-nucleating entities, heat treatment was applied to sample solutions. Figure 4 compares the overall INP spectra of untreated, stored, and heat-treated samples. For untreated samples, the overall INP concentrations at the same temperatures sampled by the impinger from the aerosol container were systematically higher (ca. 2 to 3 times) than those sampled by PM10 filters at the GVB observatory. The differences in NINP between the impinger and PM10 filter samples could be due to the storage and analyzing procedure. The impinger samples were analyzed for NINP directly after collection on site, and the PM10 filters were stored frozen at −20 ∘C and analyzed 1.5 years after the campaign in the laboratory. Beall et al. (2020) revealed that heat-labile INPs tend to be more sensitive to the frozen storage, i.e., the freezing and re-thawing of heat-sensitive PM10 samples (Fig. 4a) during the storage and analysis could conceivably degrade the IN activity. The number of small organic INPs could be reduced due to aggregation when enriched solute becomes incorporated into the ice phase during storage. Additionally, as the solution phase is enriched during freezing, smaller INPs may be absorbed onto the surface of larger particles, thus resulting in the coalescence of the INPs (Beall et al., 2020). However, a clear mechanism for the INP losses after cryo-storage is not reported since they lack the identities of observed INPs. Similarly, a slight reduction in median INP concentrations was also observed for impinger samples at most of the investigated temperatures when they were stored and reanalyzed in the laboratory (see “after storage” in gray symbols in Fig. 4b). The above reasons, however, would not explain degradation in the PM10 samples; as such, we believe that the lower NINP in the PM10 samples is indicative of a size dependency since the impinger samples include particles larger than 10 µm that are excluded in the PM10 samples. This conclusion is also supported by the NINP from the impinger being systematically higher than those from the PM10 samples (see Fig. 3). The NINP of the impinger samples before and after storage largely overlap in freezing temperatures. Upon conducting a t test, this difference was insignificant at most investigated temperatures (not shown). Given the similar volume of air collected in each sample (approximately 18 m3 and 18.4 m3 for impinger and PM10 filter samples, respectively), a possible reason for the differences in INP population was due to different size thresholds (as alluded to above) based on the sampling efficiency (i.e., impinger was 0.5 to 20 µm and PM10 filter was < 10 µm) at which the aerosols were collected using the two sampling techniques. Particles larger than 10 µm collected by the impinger are effective INPs given their large sizes (DeMott et al., 2015; Mason et al., 2016) despite their relative scarcity in the ambient air. In terms of heat sensitivity, the general degradation of NINP for all samples after being heated at 95 ∘C for 20 min, particularly at T ≥ −15 ∘C, suggests that heat-labile IN-active proteins or biological macromolecules likely contribute to INP sources in the Arctic during our measurement season. The remaining IN-active materials could be mineral dust or heat-resistant organics (Conen et al., 2016; Hill et al., 2016), for which NINP was similar for PM10 and impinger samples. More evidence is provided by measurements with finer resolutions to unveil the INP abundance and potential sources (see Sect. 3.3).
3.2 NINP correlations with meteorological and aerosol physicochemical variables
Table 2 summarizes the Pearson correlation coefficients (r) between the entire time series of NINP and several physicochemical and meteorological variables. It can be seen that for most cases −0.5 < ρ < 0.5, suggesting no strong correlation in general. The absence of a strong correlation demonstrates that a mixture of parameters correlated with the observed INP population during the 6-week measurement campaign. However, the actual level of correlations could be underestimated for all cases because in order to synchronize NINP and other measured parameters with different time resolutions, the variability could be concealed when averaging the variable over a period of time, e.g., averaging 3 min particle size distribution data for comparison with NINP over several hours in a high-volume filter sample. In addition, the level of statistical significance was reduced due to the shrunk data sets. The aforementioned rationale supports the need for the high time resolution of NINP measurements.
Table 2Pearson correlation coefficients (r) between INP concentration at different nucleation temperatures (sampled by impinger (−6 to −18 ∘C) and HINC (−30 ∘C) at the aerosol container, with the upper part separated by the double solid lines in the upper part of the table) to aerosol physicochemical and meteorological variables: aerosol concentration of particles within different diameter ranges (n0.01–0.1, n0.1–0.5, n> 0.5, n0.5–1, n1–2.5 and n> 2.5, with diameters in µm), aerosol surface area concentration of particles with diameter at different size ranges (S> 0.5 and S< 2.5, with size unit in µm), equivalent black carbon concentration (eBC), fluorescent particle concentration defined by different categories (nfluor, nFL1, nFL2, nFL3 and nAC+ABC, according to the criteria of classification defined in Sect. 2.5.2), and meteorological variables (ambient temperature (Tenv), RH (RHenv), pressure (penv), wind speed (ws), and direction (wd)). Note that different aerosol size-resolved variables were correlated with NINP at different nucleation temperatures due to different size cut-offs of INP sampling and measurement: the impinger sampled NINP at T of −6, −9, −12, −15, −18 ∘C with a lower size threshold of 0.5 µm, and the HINC measured NINP at T of −30 ∘C with an upper size limit of 2.5 µm, located in the aerosol container. Correlations between NINP (−6 to −18 ∘C) and sodium, ammonium, calcium, nitrate, sulfate, and methanesulfonic acid (MSA) were derived from the filter samples collected at GVB in parallel with PM10 INP filters using the ion chromatography analyses (below the double solid lines).
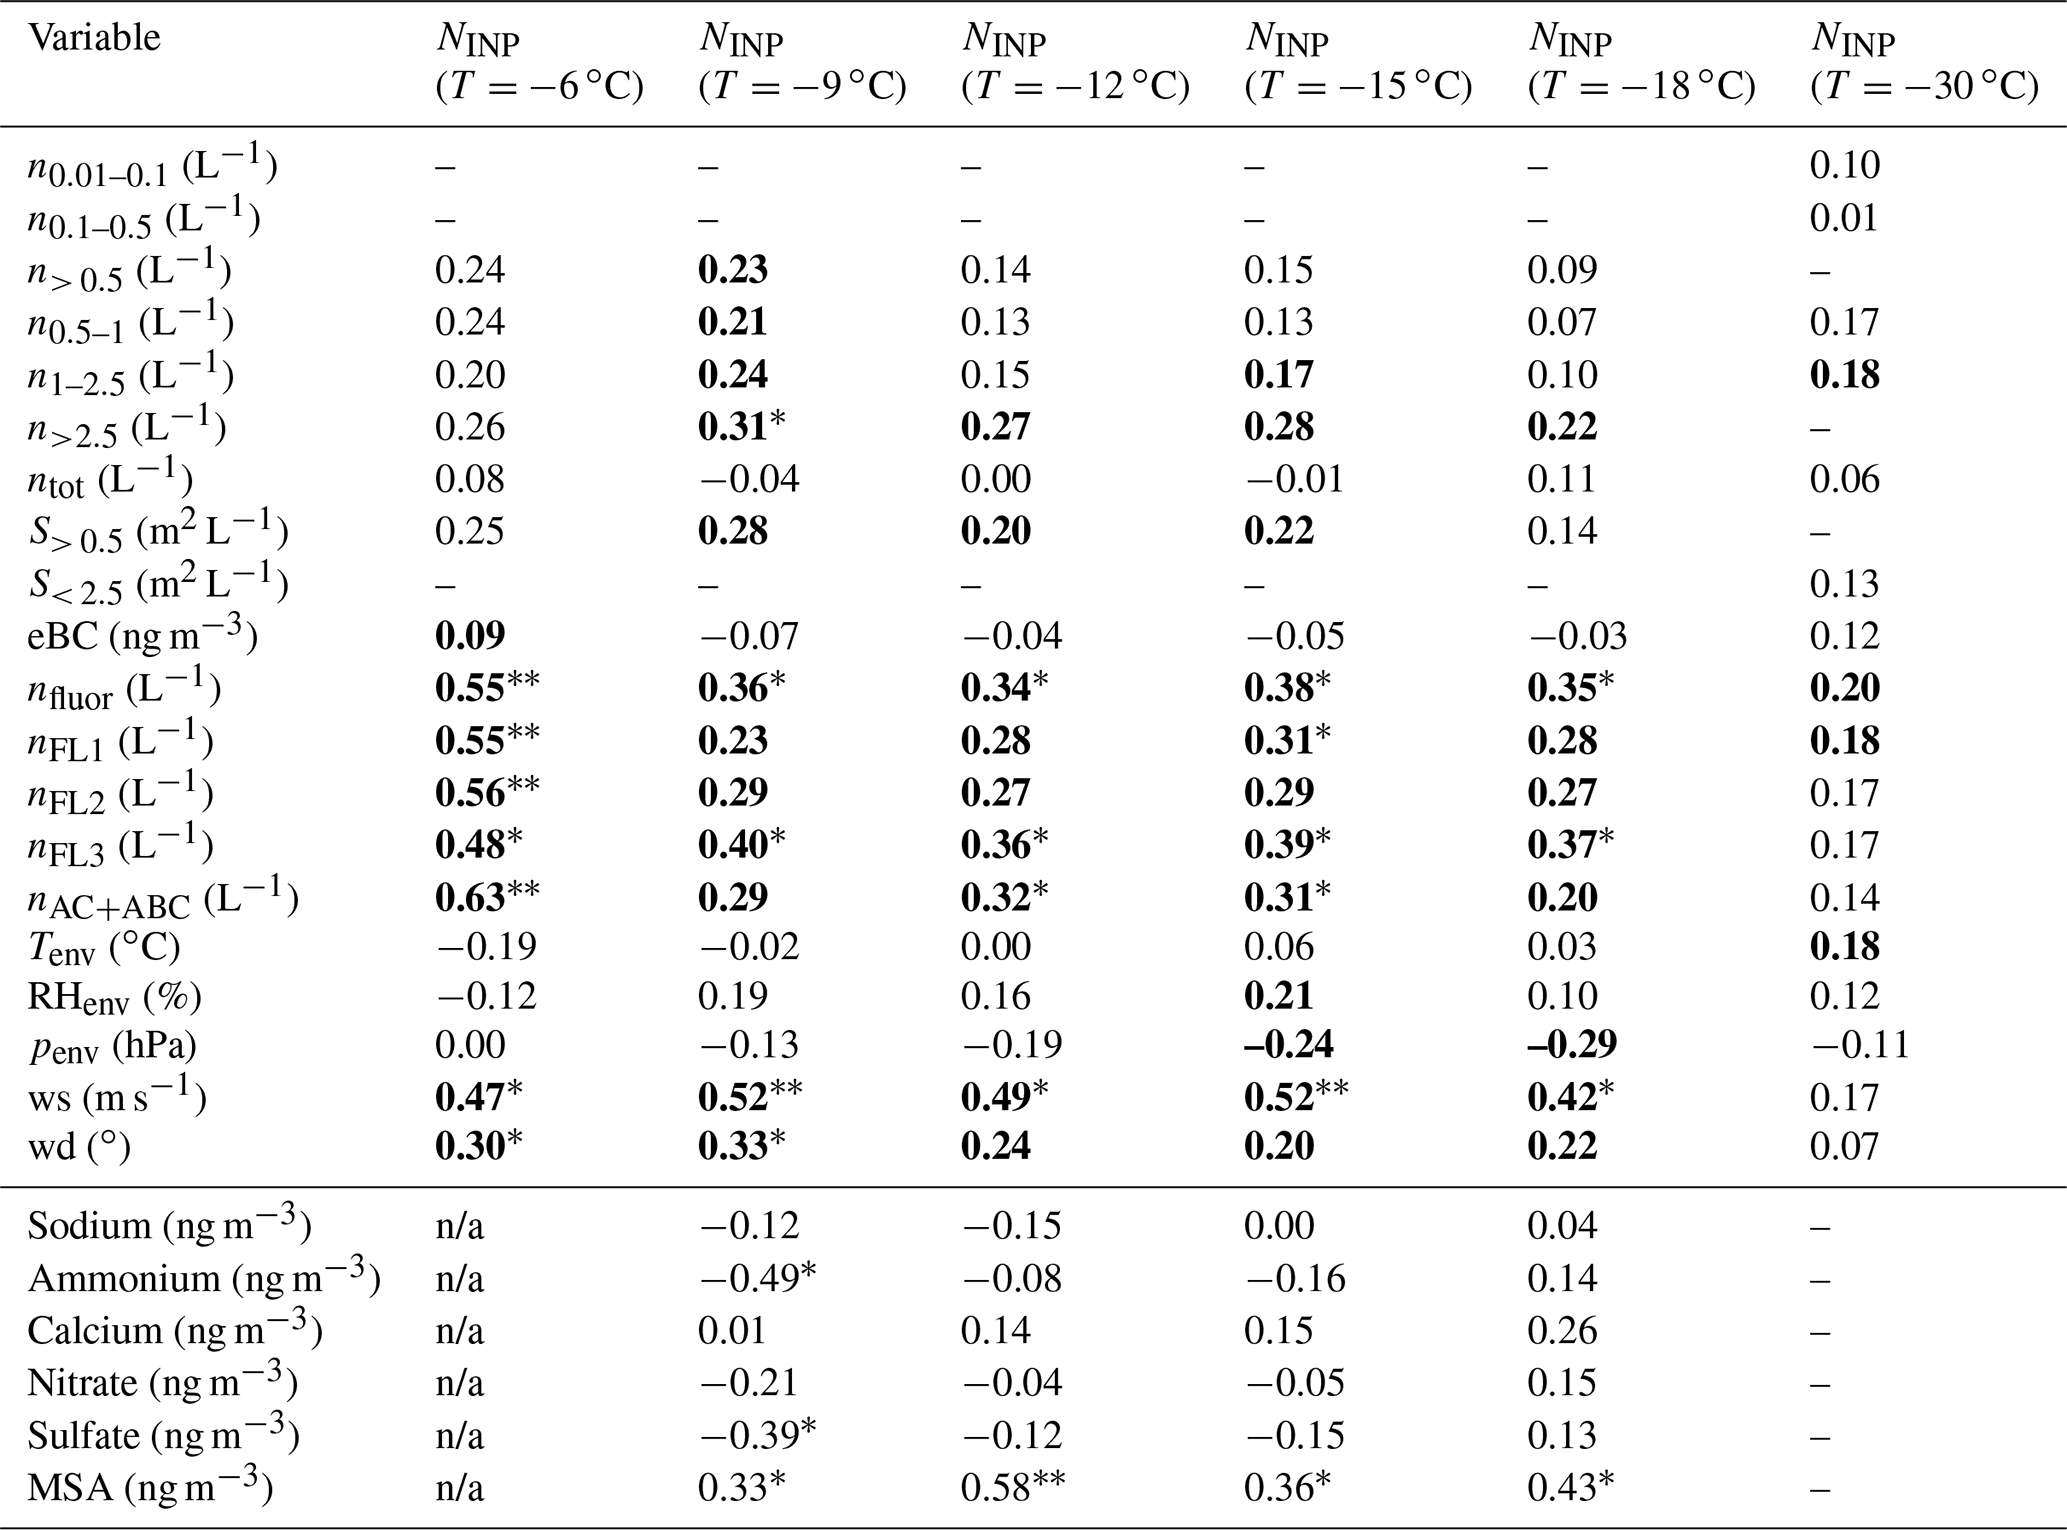
The r values in bold text represent results with statistical significance (p < 0.05), the r values with ∗ denote moderate correlation (0.3 < < 0.5), and the r values with indicate strong correlation ( > 0.5). “n/a” indicates that r cannot be calculated due to the limited data pairs. “–” signifies the coupled variables: NINP at measured temperature and variables shown in the first column in Table 2 should not be correlated with each other due to the violation of, e.g., measurement locations or size cutoff ranges between instruments.
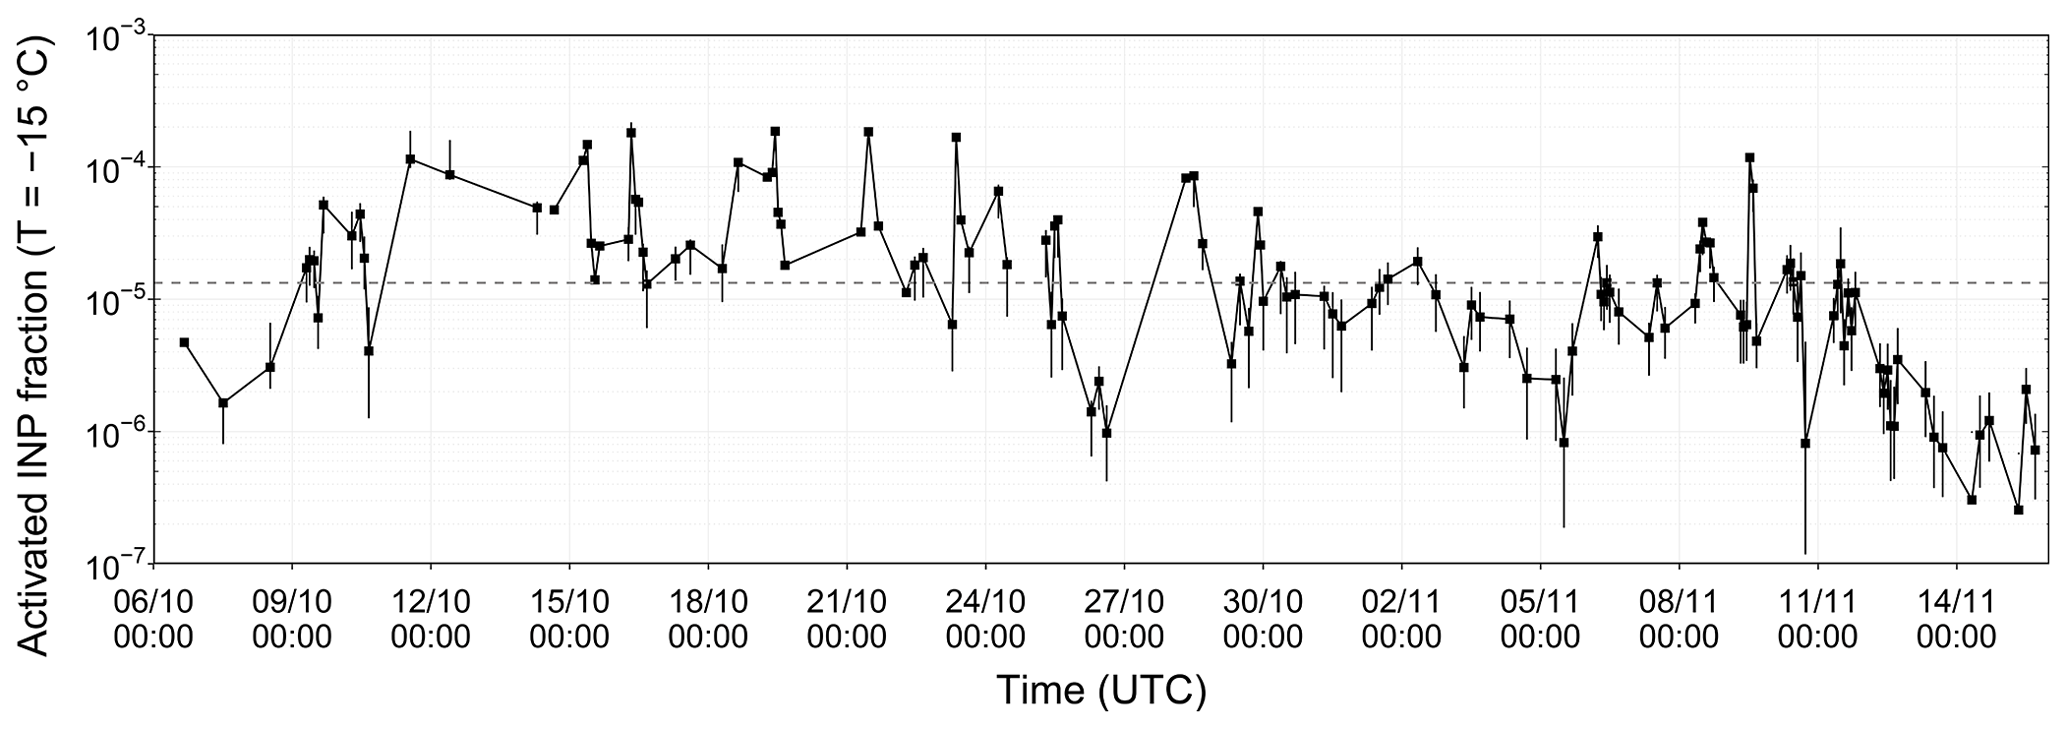
Figure 5Time series for activated INP fraction at T of −15 ∘C during the autumn 2019 campaign in Ny-Ålesund. The activated INP fraction is the ratio between NINP measured from impinger samples and n> 0.5 measured from the APS. Vertical extensions represent the uncertainty range within 95 % confidence intervals. The dashed horizontal line indicates the median activated fraction over the entire campaign.
Regarding the correlations between NINP and size-resolved aerosol concentrations, it should be noted that increasingly higher correlations of NINP were found with aerosol concentrations with increasingly larger size ranges at most nucleation temperatures, revealing the fact of the increasing contribution of larger-sized particles to INP populations. Nevertheless, the overall absence of strong correlations is presented, which is in agreement with some previous studies (e.g., Li et al., 2022; Paramonov et al., 2020; Lacher et al., 2018). The absence of a notable correlation was also observed between NINP and supermicrometer aerosol particles, despite previous findings (e.g., DeMott et al., 2015; Mason et al., 2016) suggesting a positive correlation between the concentration of INPs and supermicrometer aerosols. One important reason is that INPs are only a small subgroup of ambient aerosol particles. The time series of the activated fraction of INPs shown in Fig. 5 implies that approximately 1 out of 105 ambient aerosol particles on average acted as INPs at −15 ∘C. Therefore, a minor fluctuation in IN-inactive components in the total aerosol populations, e.g., via a sudden increase in coarse-mode sea salt, would mask the correlations. Additionally, the long-range transport of INPs from mid- and high-latitudes in the upper troposphere, which is considered to be another important source of INPs in the remote Arctic (e.g., Porter et al., 2022; Schmale et al., 2021; Wex et al., 2019), may alter the population of INPs towards smaller sizes due to the size-dependent deposition processes during atmospheric transport (Lacher et al., 2018). Similarly, strong correlations between NINP and available surface area concentrations (i.e., S> 0.5 and S< 2.5 for correlating NINP sampled by impinger and HINC, respectively) were not found.
Strikingly, the correlations between NINP and fluorescent particle number concentrations, which have been used as a proxy for identifying bioaerosol (e.g., Toprak and Schnaiter, 2013; Savage et al., 2017), had a relatively strong statistical significance compared to other observed variables. This observation was particularly true towards warm nucleation temperatures, consistent with our inference from our heat test results shown in Sect. 3.1. It is therefore reasonable to conclude that when the surface was free from snow and ice (as it was during most of the time during our measured period in the high Arctic), highly IN-active bioaerosols originating from the terrestrial and marine environments could act as dominant local INP sources. Additionally, concerning eBC, the overall weak to no correlation with NINP at all investigated temperatures suggests negligible contributions from eBC, which is in agreement with the findings that BC is not an effective INP in the immersion freezing mode in the MPC temperature regime (−38 ∘C < T < 0 ∘C) both from field (Paramonov et al., 2020; Lacher et al., 2018; Kupiszewski et al., 2016) and laboratory studies (Kanji et al., 2020; Mahrt et al., 2018; Chou et al., 2013; Friedman et al., 2011).
Aside from the characterization of physical aerosol properties, we also investigated the relationships of meteorological variables with NINP. Schneider et al. (2021) improved the predictability of NINP by using ambient temperature as a proxy for seasonal variations in INP abundance. However, a correlation between NINP and ambient temperature (Tenv) was not observed in this work. Similarly, ambient relative humidity (RHenv) and pressure (penv) were not (or weakly) correlated with NINP. In contrast, moderate to strong correlations were found between NINP (T > −30 ∘C) and ground-level wind speed (ws), suggesting transport and advection of INPs within the sampling period. The concentration of SSA depends strongly on wind-induced wave breaking and bubble bursting (Lewis et al., 2004; Moallemi et al., 2021), which could enhance the local INP sources via, e.g., increased re-suspension of blowing dust and/or boosted SSA. Weak to moderate correlations were observed between NINP and ground-level wind direction (wd), suggesting that abrupt increases in local emissions from certain directions did not contribute to specific INP sources over a relatively long time span. To be more specific, the highest NINP was approximately associated with the wind direction from the northern side, where there was an ice-free ocean during the entire measurement season, indicating the local marine SSA contributed to the INP concentrations. Given that sea salt is not an active INP in immersion mode, it is reasonable to conclude that the organic or biogenic components of SSA contribute to NINP, as supported by the heat treatment results and high correlations with fluorescent particle number concentrations.
The lower part in Table 2 shows the correlations between NINP derived from PM10 filter samples and their ionic composition. Due to the limitation that the ion chromatography samples had a time resolution of 2 d, the number of samples was insufficient compared to other online measurement variables, resulting in the inadequate significance of correlations to NINP. Nevertheless, moderate to strong correlations between NINP and the concentration of methanesulfonic acid (MSA) were observed for most measured temperatures. MSA is oxidized from dimethyl sulfide (DMS) originating from emissions by oceanic phytoplankton. Despite MSA itself not acting as an INP, it is a unique indicator for tracing marine biological productivity since MSA has no other natural sources (Becagli et al., 2019). Therefore, the presented correlations demonstrate an association between INP abundance and local marine biological activity during our measured period. No correlations were manifested between NINP and other trace ions, including sodium, ammonium, calcium, nitrate, and sulfate.
3.3 Special case studies
To further explore the INP characteristics and sources, we focused on short-term cases characterized by a broad range of NINP, aerosol physicochemical properties, meteorological conditions, and air mass origins. Figure 6a and b highlight the selected cases from all INP measurements representative of high, moderate, and low INP number concentrations for PM10 and impinger samples, respectively. Figure 6c shows the INP measurements with WT-CRAFT and the effect of heating. The range of temperatures differs between NINP measured by WT-CRAFT and DINRCZ (i.e., PM10 and impinger samples) due to the smaller droplet volume in WT-CRAFT (see Table 1). At the GVB observatory, NINP measured by WT-CRAFT was comparable to that measured from PM10 filters in the overlapping temperature range from −15 to −20 ∘C. The NINP from the impinger measurements is higher than that measured from the WT-CRAFT. This could be due to either the different locations of the samples or the larger drop sizes in DRINCZ. The total volume of air sampled for the two samples is similar. The more likely explanation is that the particle size range measured by the impinger is much larger. As such, the sampled aerosol size ranges should be considered when evaluating such comparisons. Despite the longer sampling duration (> 3 d) of the WT-CRAFT NINP data, we compare it to the immersion freezing data from DRINCZ because it bridges the temperature gap towards HINC measurements. To be specific, one interesting exception highlighted in Fig. 6c (filled symbols labeled as WT-CRAFT_high) displayed both high NINP and heat-resistant INPs for the sample collected from 19 to 23 October 2019. To understand the properties of the heat-resistant and high NINP sample in more detail with regard to aerosol properties (e.g., particle sizes), time windows that overlap with the WT-CRAFT_high case that also show a large range of NINP were selected for further investigation (Fig. 6a and b). With a finer temporal resolution of 1 h and 8 h for the selected impinger and PM10 samples, respectively, the INP abundance in the corresponding WT-CRAFT_high sample could be explained by the highest concentrations. More evidence will be provided in the following subsections to elaborate on INP and aerosol features.
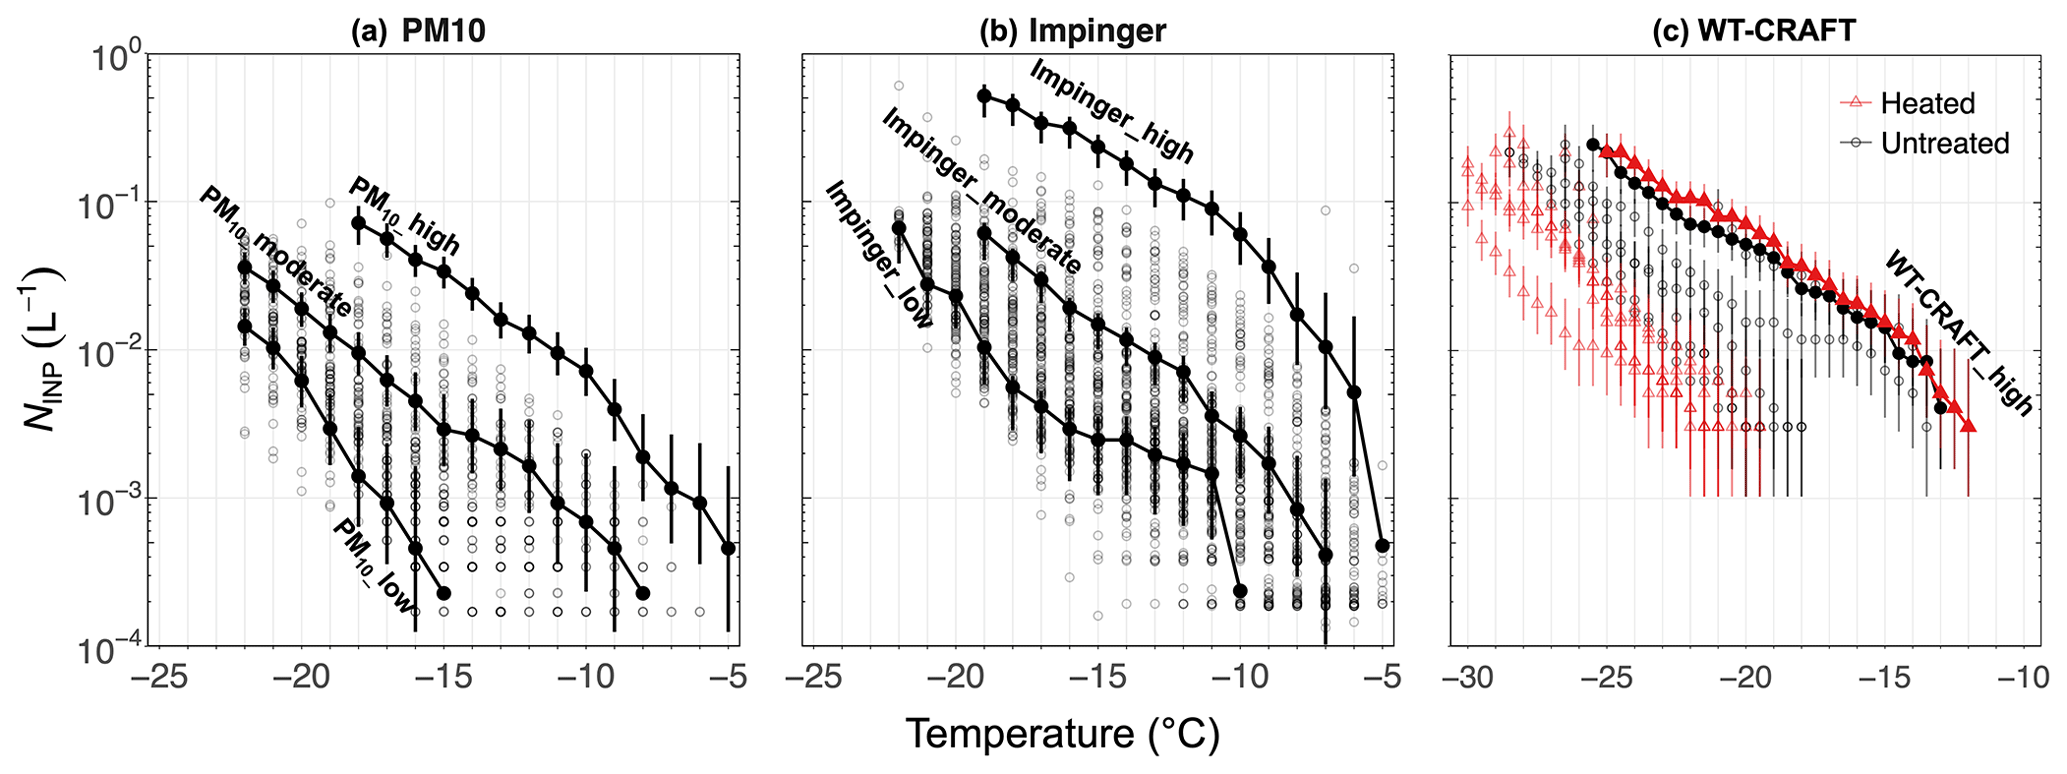
Figure 6A selection of typical INP spectra (highlighted lines and filled circles) labeled with high, moderate, and low NINP for case studies for (a) PM10 filter sampling (8 h interval) from 00:00 UTC 19 October 2019, 16:00 UTC 19 October 2019, and 00:00 UTC 23 October 2019, respectively, and for (b) impinger samples sampling (1 h interval) from 11:05 UTC 21 October 2019, 06:34 UTC 24 October 2019, and 15:40 UTC 25 October 2019, respectively. (c) Individual INP spectra measured by WT-CRAFT (approximately 4 d interval) during the 2019 NASCENT campaign from 12:43 UTC 3 October 2019 to 12:49 UTC 30 October 2019. The filled symbols with highlighted lines indicate the high-INP case measured between 12:37 UTC 19 October 2019 and 14:05 UTC 23 October 2019, overlapping the cases selected in (a) and (b). The hollow symbols in the background represent all measurements from the corresponding offline techniques during the 2019 NASCENT field measurement. The vertical extensions represent the 95 % confidence intervals of the experiments (only shown for selected cases in panels a and b for a clear display).
3.3.1 Time series
Figure 7 shows the time series during the period of selected impinger samples for parallel comparison. All samples exhibited relative heat sensitivity, i.e., a reduction in INP concentrations was observed at T of −15 ∘C (Fig. 7a) for all selected cases (not detectable for some samples with values below the detection limit of DRINCZ). In addition, a high fluorescent particle population in the impinger_high case (Fig. 7b) indicates the probable existence of biological particles, which could serve as INPs at the investigated temperatures. However, for the impinger_low case, we still observed moderate levels of fluorescent particle concentrations, possibly due to the inclusion of the non-IN-active biological or abiotic fluorescent particles. Wind conditions can impact the local aerosolization process, as shown in Fig. 7c. The time window for the impinger_high case was dominated by northerly winds coming from the direction of the ocean (see Figs. 1b and 7c), associated with higher wind speeds compared to the moderate and low-INP cases. INP enrichment in the impinger_high sample could be attributed to promoted local SSA that were IN active, likely originating from biological production and aerosolization of the marine biota (Inoue et al., 2021). The size-resolved time series in Fig. 7d coincided with the INP fluctuations, i.e., a rising NINP tendency with increasing coarse-mode particle number concentrations (n> 0.5) and total surface area concentrations (Stot). This finding was consistent with previous ground-based observations that coarse-mode particles can strongly correlate with ambient INP population (e.g., DeMott et al., 2015; Mason et al., 2016). Concerning the moderate-INP case, an abrupt rise in fine particle concentrations was observed, which had small contributions to the total surface area concentration and thus INP abundance. The low-INP case was an exception regarding n> 0.5 and Stot, which exhibited moderate levels of n> 0.5 and Stot but had the lowest NINP among the investigated cases.
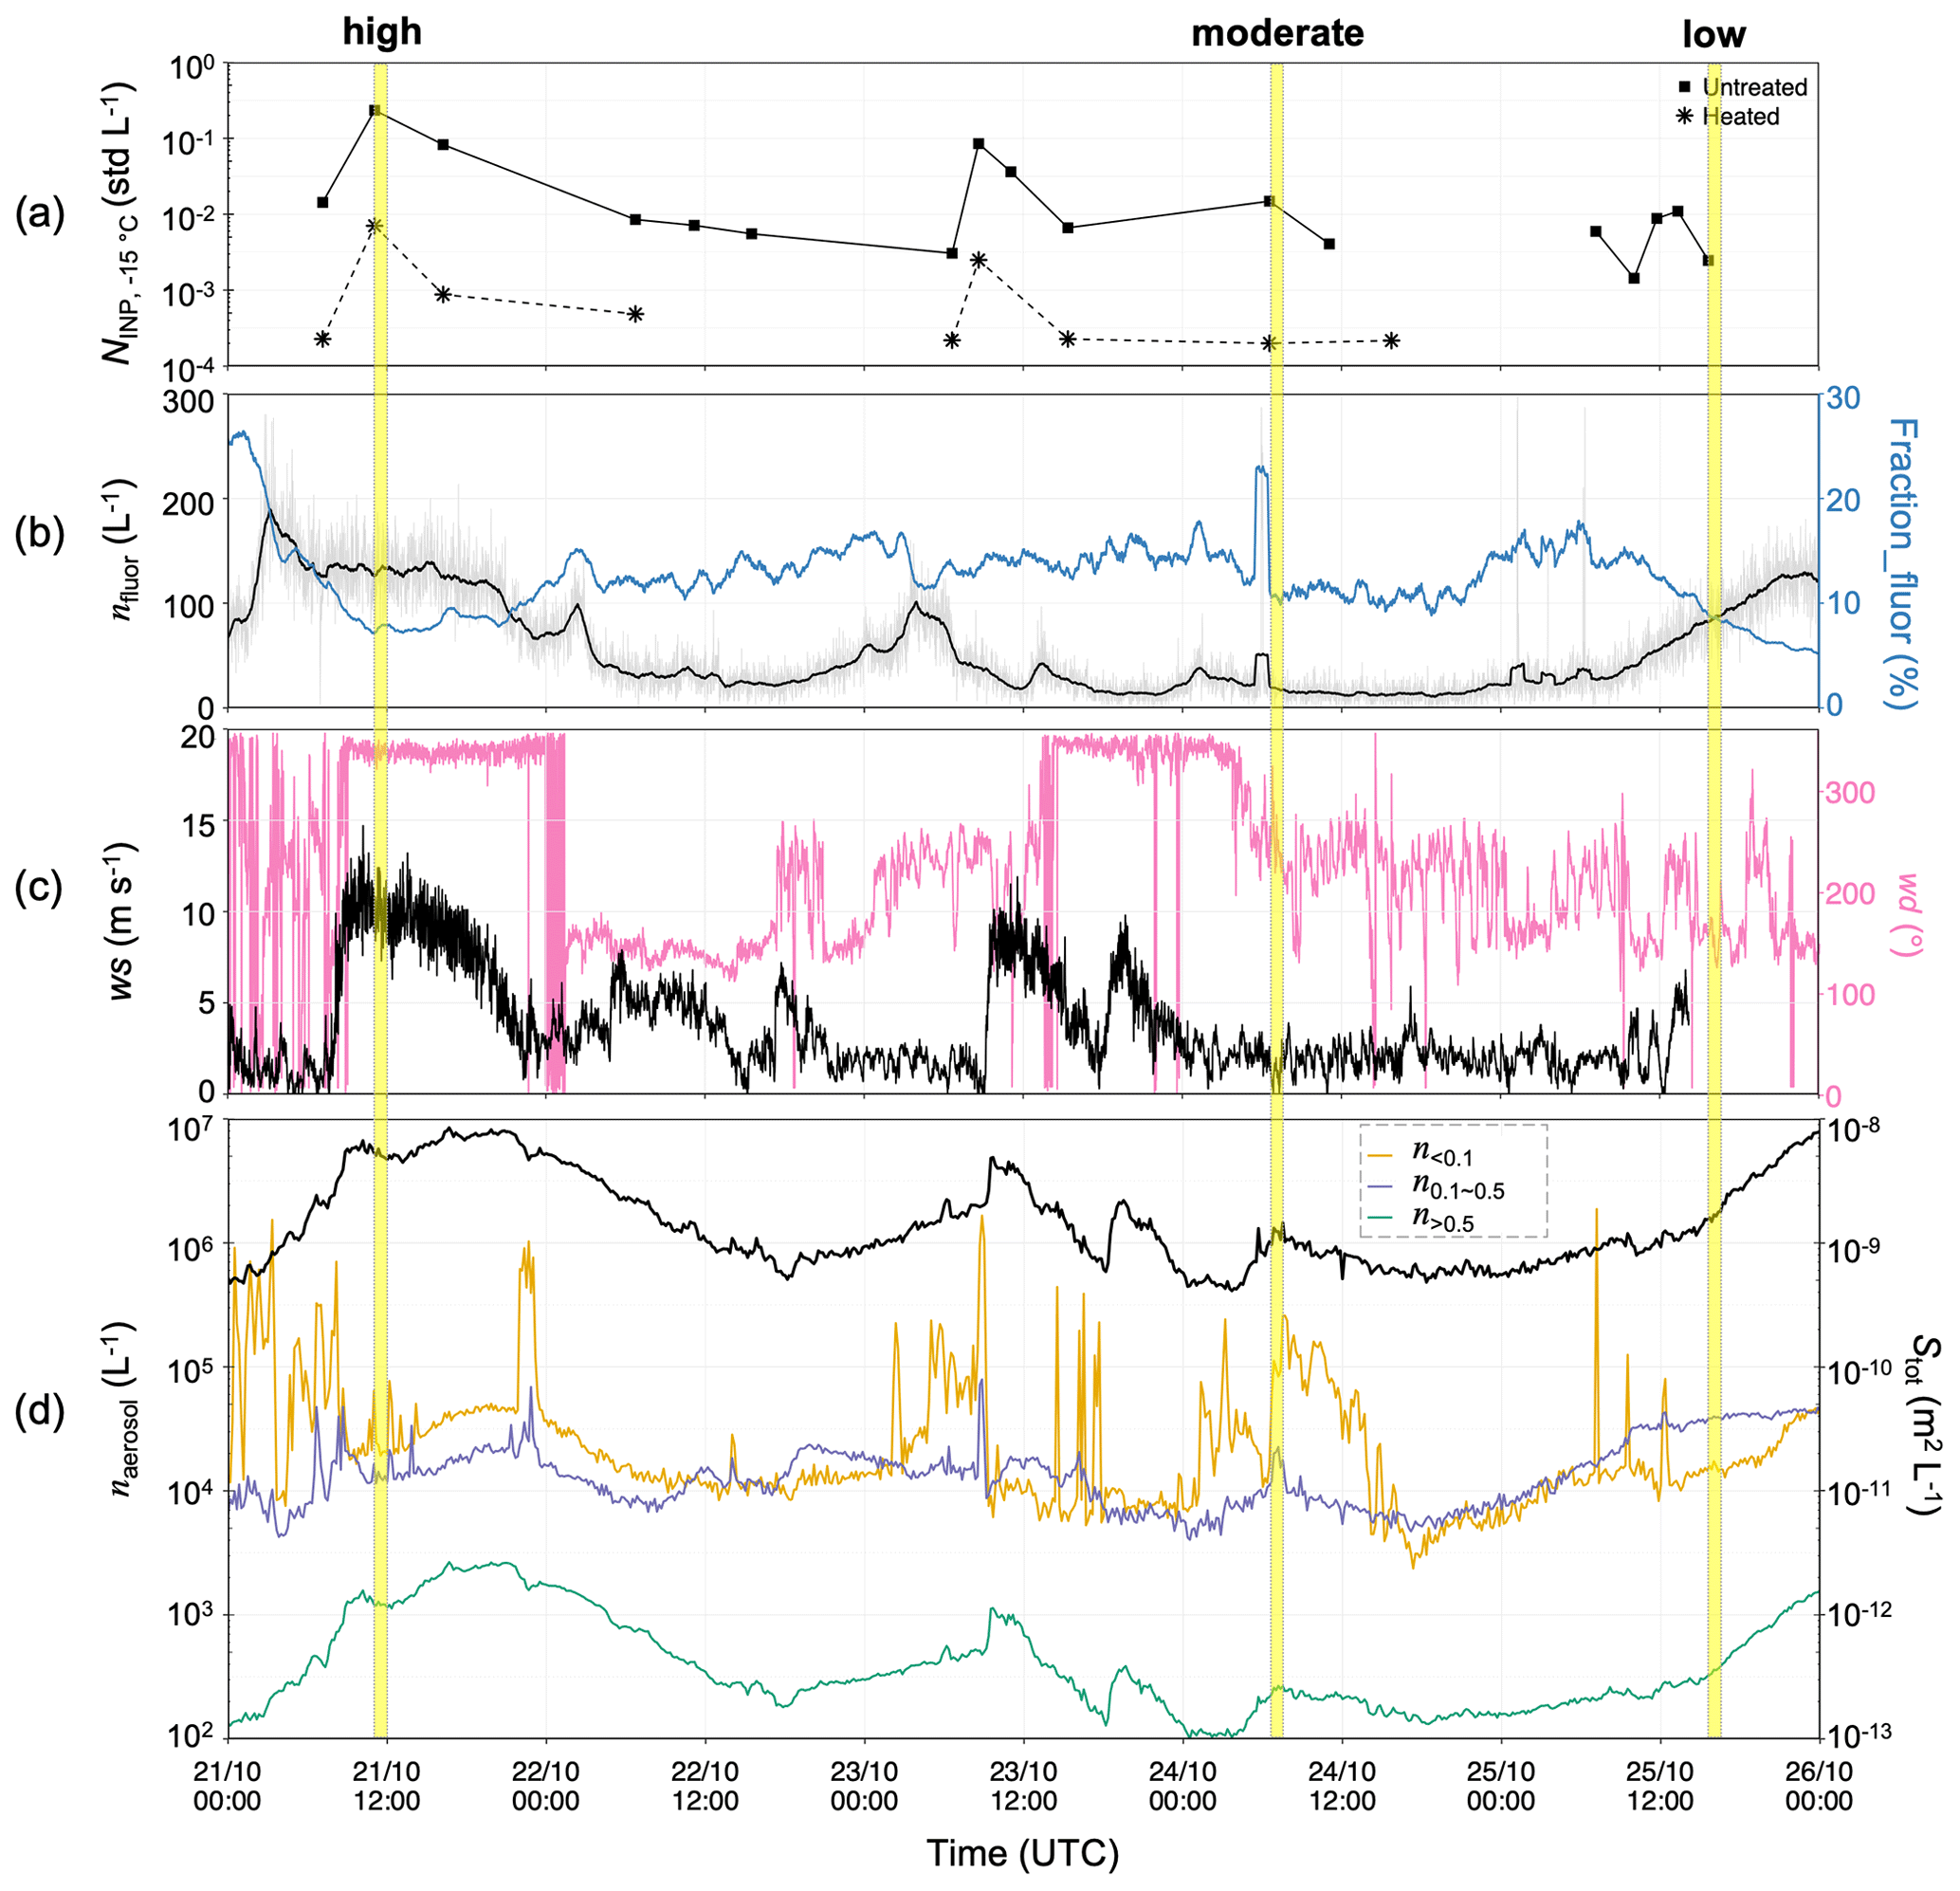
Figure 7Time series in October 2019 during the window of selected impinger sample cases for (a) NINP at T of −15 ∘C (the entire temperature spectra can be found in Fig. 6b), (b) fluorescent particle number concentrations (nfluor, original 1 min data in light gray and 30 min average in black) and fractions (Fraction_fluor), (c) wind speed (ws) and direction (wd), and (d) aerosol number concentration (naerosol) with different size ranges and total surface area concentration (Stot) calculated for relevant sizes for impinger samples.
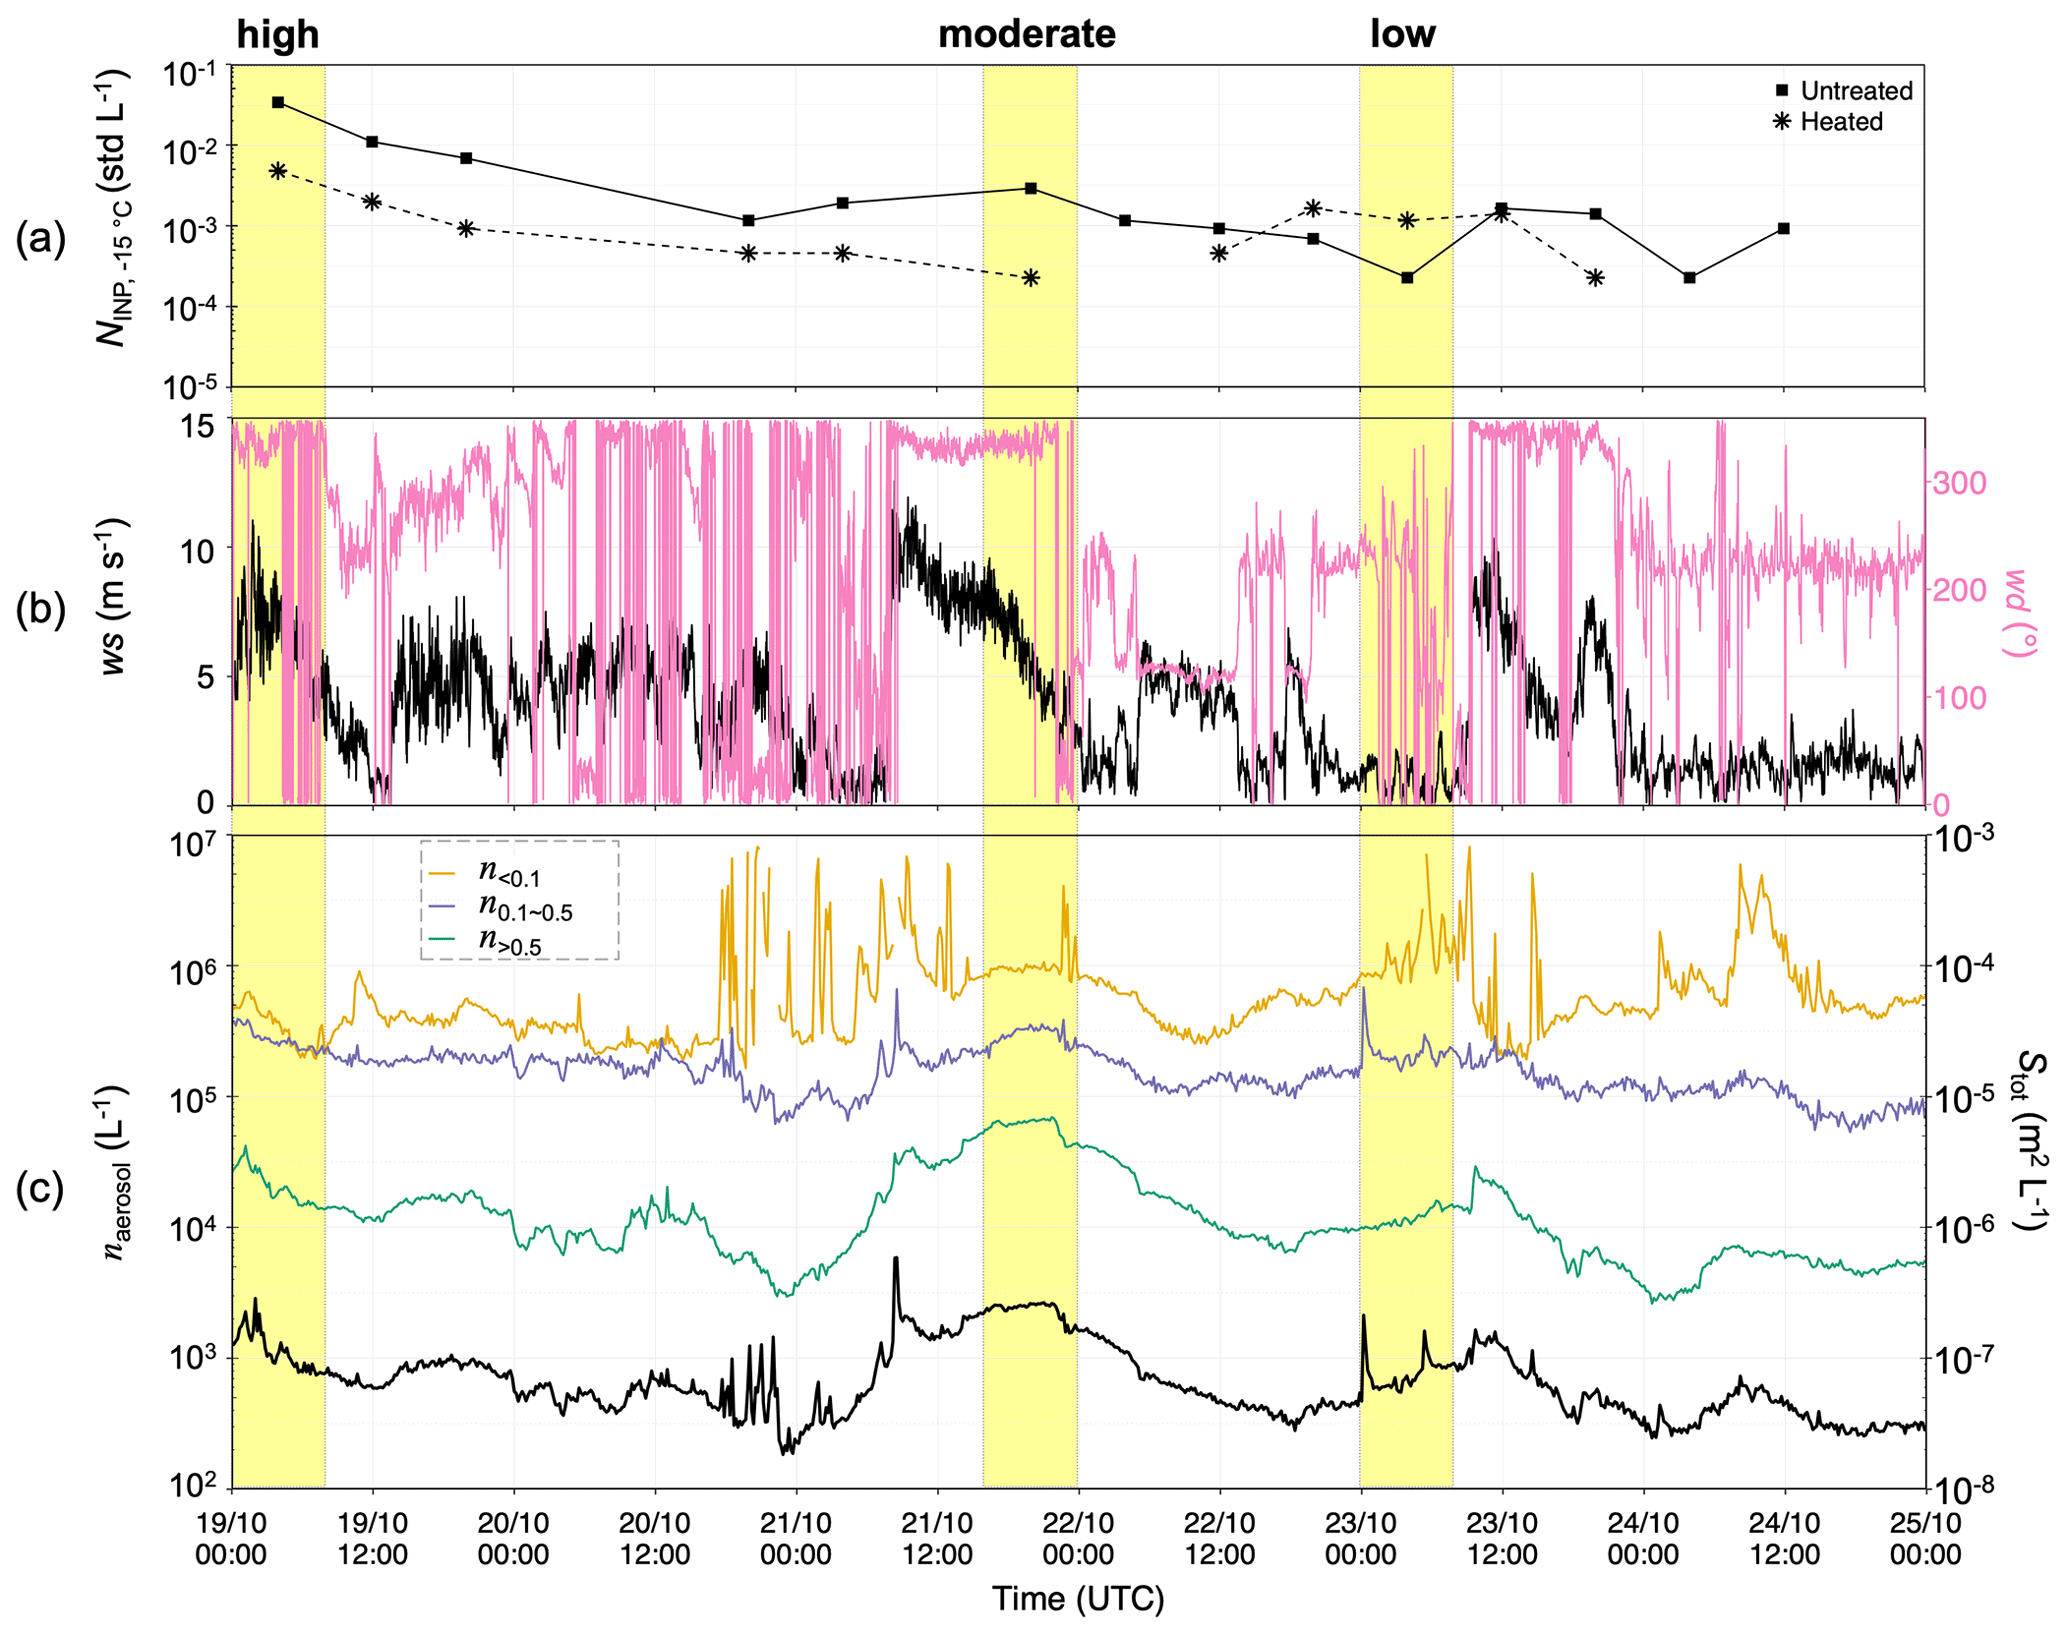
Figure 8Time series in October 2019 during the window of selected PM10 sample cases for (a) NINP at T of −15 ∘C (the entire temperature spectra can be found in Fig. 6a), (b) wind speed (ws) and direction (wd), and (c) aerosol number concentration (naerosol) with different size ranges and total surface area concentration (Stot) calculated for relevant sizes for PM10 samples.
Interestingly, we noticed similar NINP and wind patterns for selected PM10 samples (Fig. 8) from GVB that showed high and moderate NINP tend to be associated with high-speed winds of maritime origin. However, the size-resolved particle number and surface area concentrations were not good predictors for NINP. The selected high, moderate, and low PM10 samples showed comparable n> 0.5 and Stot values (See Appendix B for the full range of particle size distribution). The possible reason is that aerosols sampled at the GVB observatory experienced more dilution and mixing due to the increased distance from the ocean. Additionally, as discussed in Sect. 3.2, the coarse time resolution of PM10 samples could mask the instantaneous enhanced INP loading by averaging it out over the 8 h sampling period. Nevertheless, the high loading of particles with sizes larger than approximately 2.5 µm could contribute to the high-INP case of the PM10 sample (shown in Fig. B1).
3.3.2 Physicochemical characterization of selected samples
Similar to Fig. 4, Fig. 9 displays individual INP spectra exposed to heat treatment or storage conditions for selected impinger and PM10 cases overlapping the period of the highlighted WT-CRAFT sample shown in Fig. 4c. Most selected samples were heat-labile samples in terms of NINP, especially for the impinger_high sample at temperatures higher than −10 ∘C, revealing potential biogenic INP sources. PM10_low was an exception, showing heat-resistant INP composition, consistent with the heating results of the corresponding WT-CRAFT sample from the GVB station (filled circles in Fig. 4c), where the 4 d WT-CRAFT sample possessed relatively high NINP with heat resistance. On the other hand, the parallel PM10 cases with much finer time resolution (i.e., 8 h PM10_high, PM10_moderate and PM10_low samples) covered a wide range (i.e., over 2 orders of magnitude) of NINP with different sensitivities to heat treatment (see the second row in Fig. 9). Since NINP is determined by the most active INPs in the droplet, samples that contain heat-labile INPs and heat-resistant INPs could still freeze effectively even after heating, thus masking the effect of heating (Alsante et al., 2023). Sampling with higher temporal resolution reduces the probability of including INPs of different properties within the same droplet, thus motivating finer temporal resolution of INP measurements in field studies that desire the characterization of INP properties. Additionally, the level of NINP after heat treatment (in red) also approximately followed the INP abundance classification (i.e., high to moderate to low), suggesting that the relative abundance of relatively heat-resistant INPs, i.e., mineral dust particles, despite being generally low in the background, may still explain the difference in NINP in the selected samples.
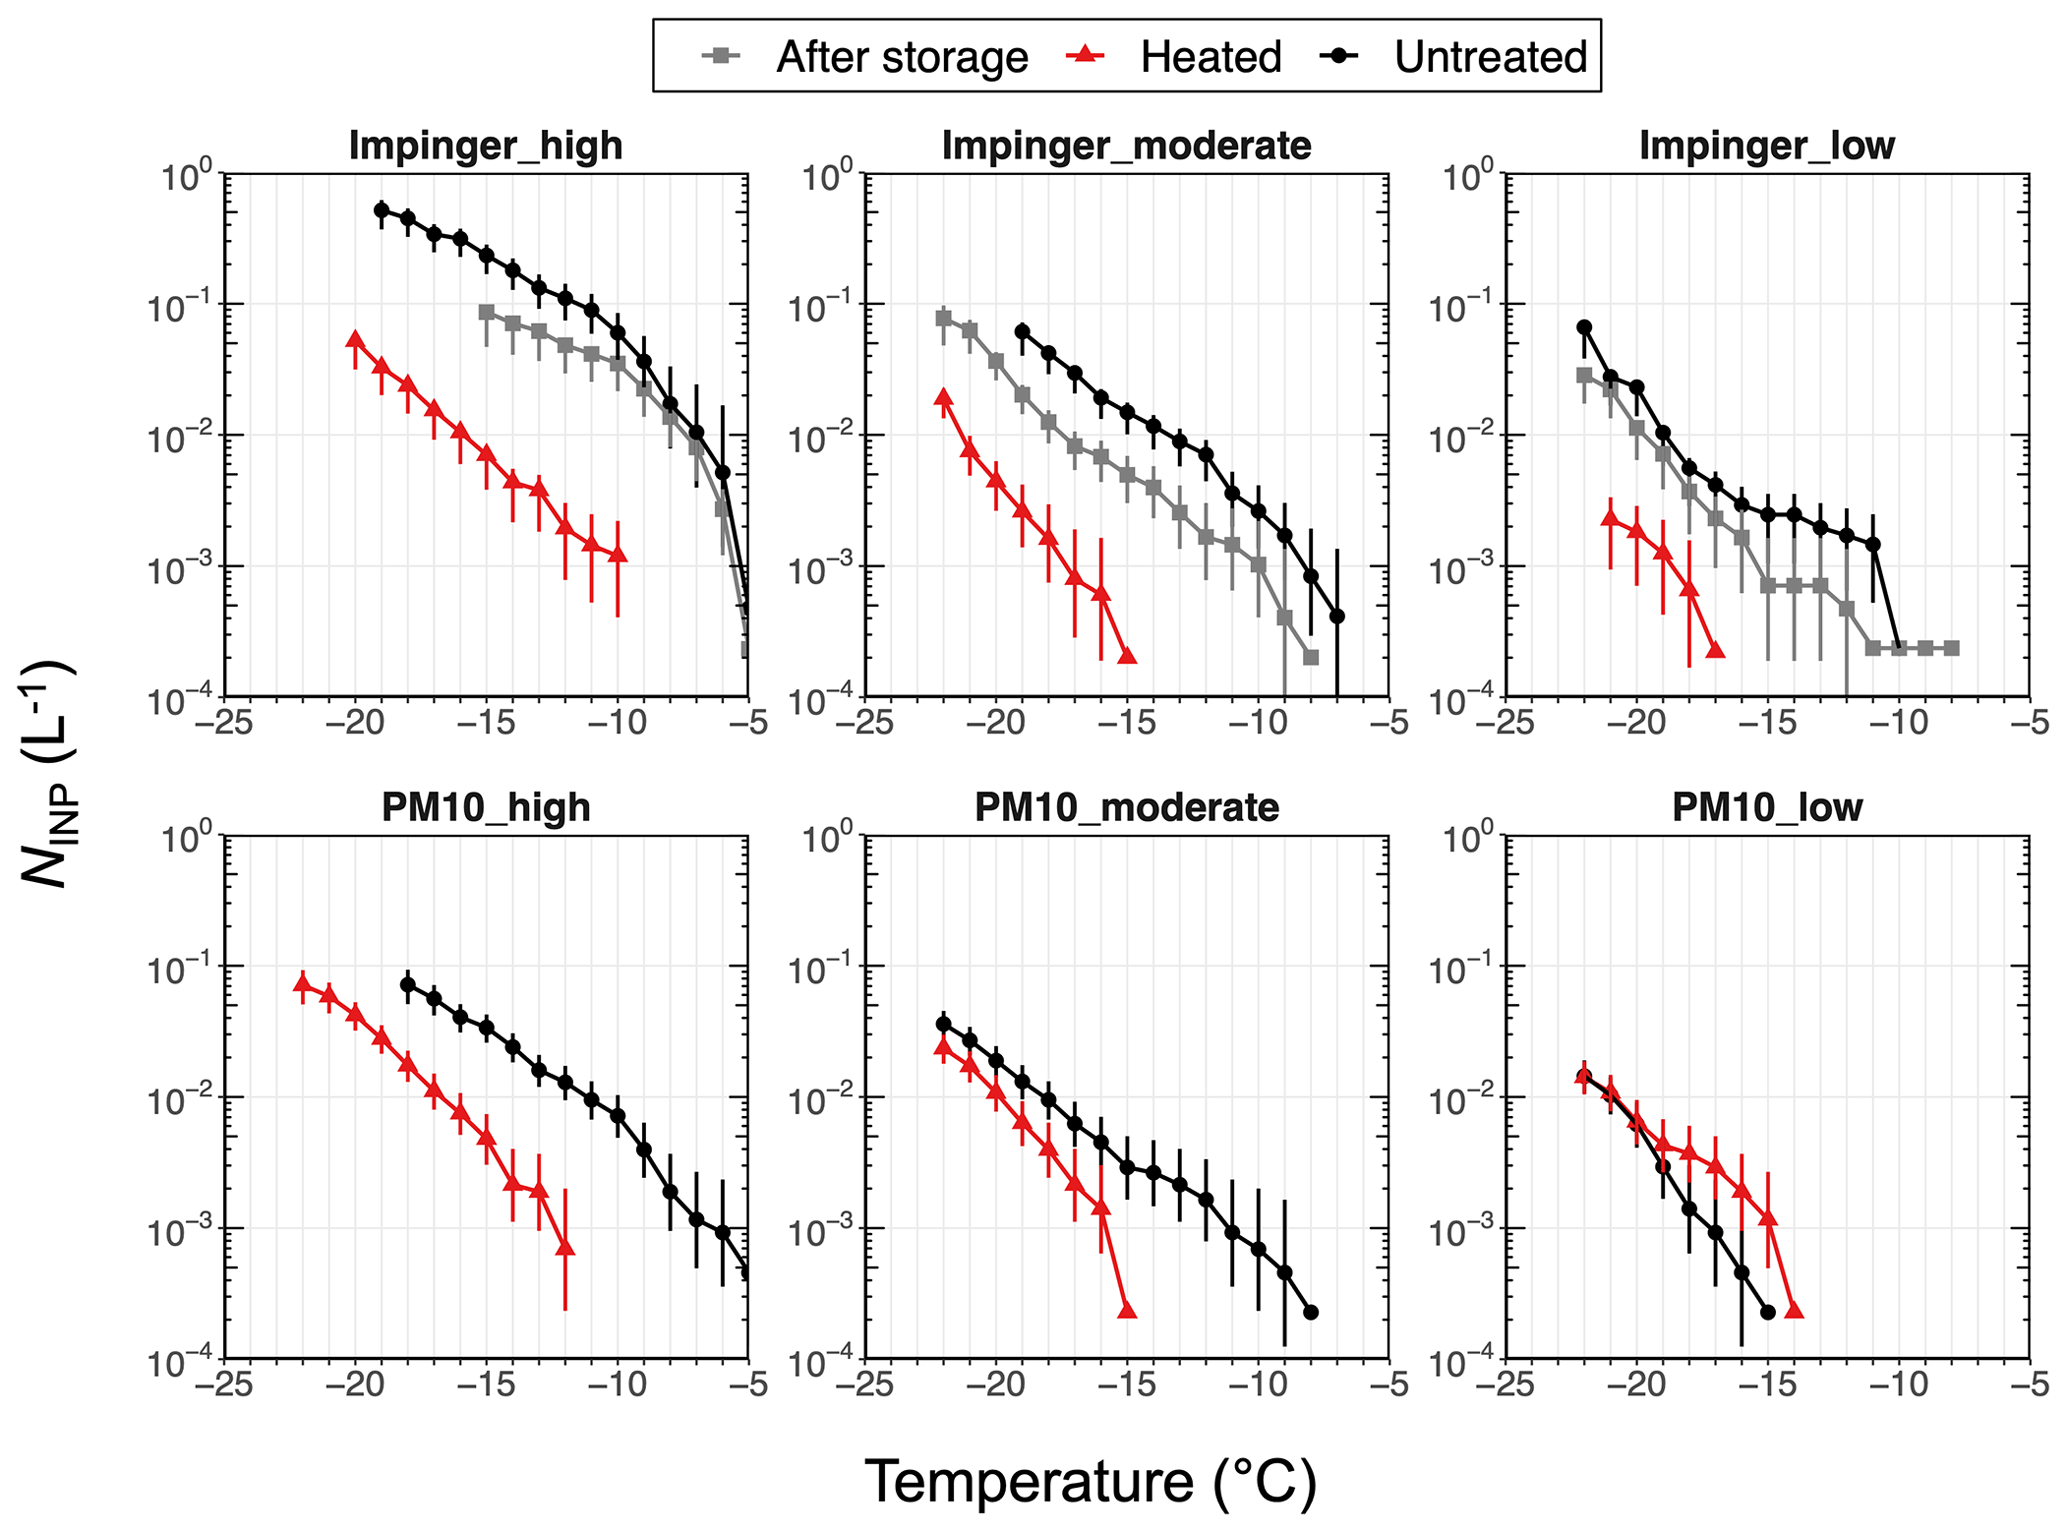
Figure 9Selected INP spectra for untreated, heated, and storage conditions labeled high, moderate, and low NINP for case studies for impinger and PM10 samples. The vertical extensions represent the 95 % confidence intervals of the experiments. Note that the time stamps for the same NINP labels regarding the impinger and PM10 samples are different. High-INP cases are for 11:05–12:05 UTC 21 October 2019 and 00:00–08:00 UTC 19 October 2019, moderate-INP cases are for 06:34–07:34 UTC 24 October 2019 and 16:00–24:00 UTC 21 October 2019, and low-INP cases are for 15:40–16:40 UTC 25 October 2019 and 00:00–08:00 UTC 23 October 2019 for impinger and PM10 samples, respectively.
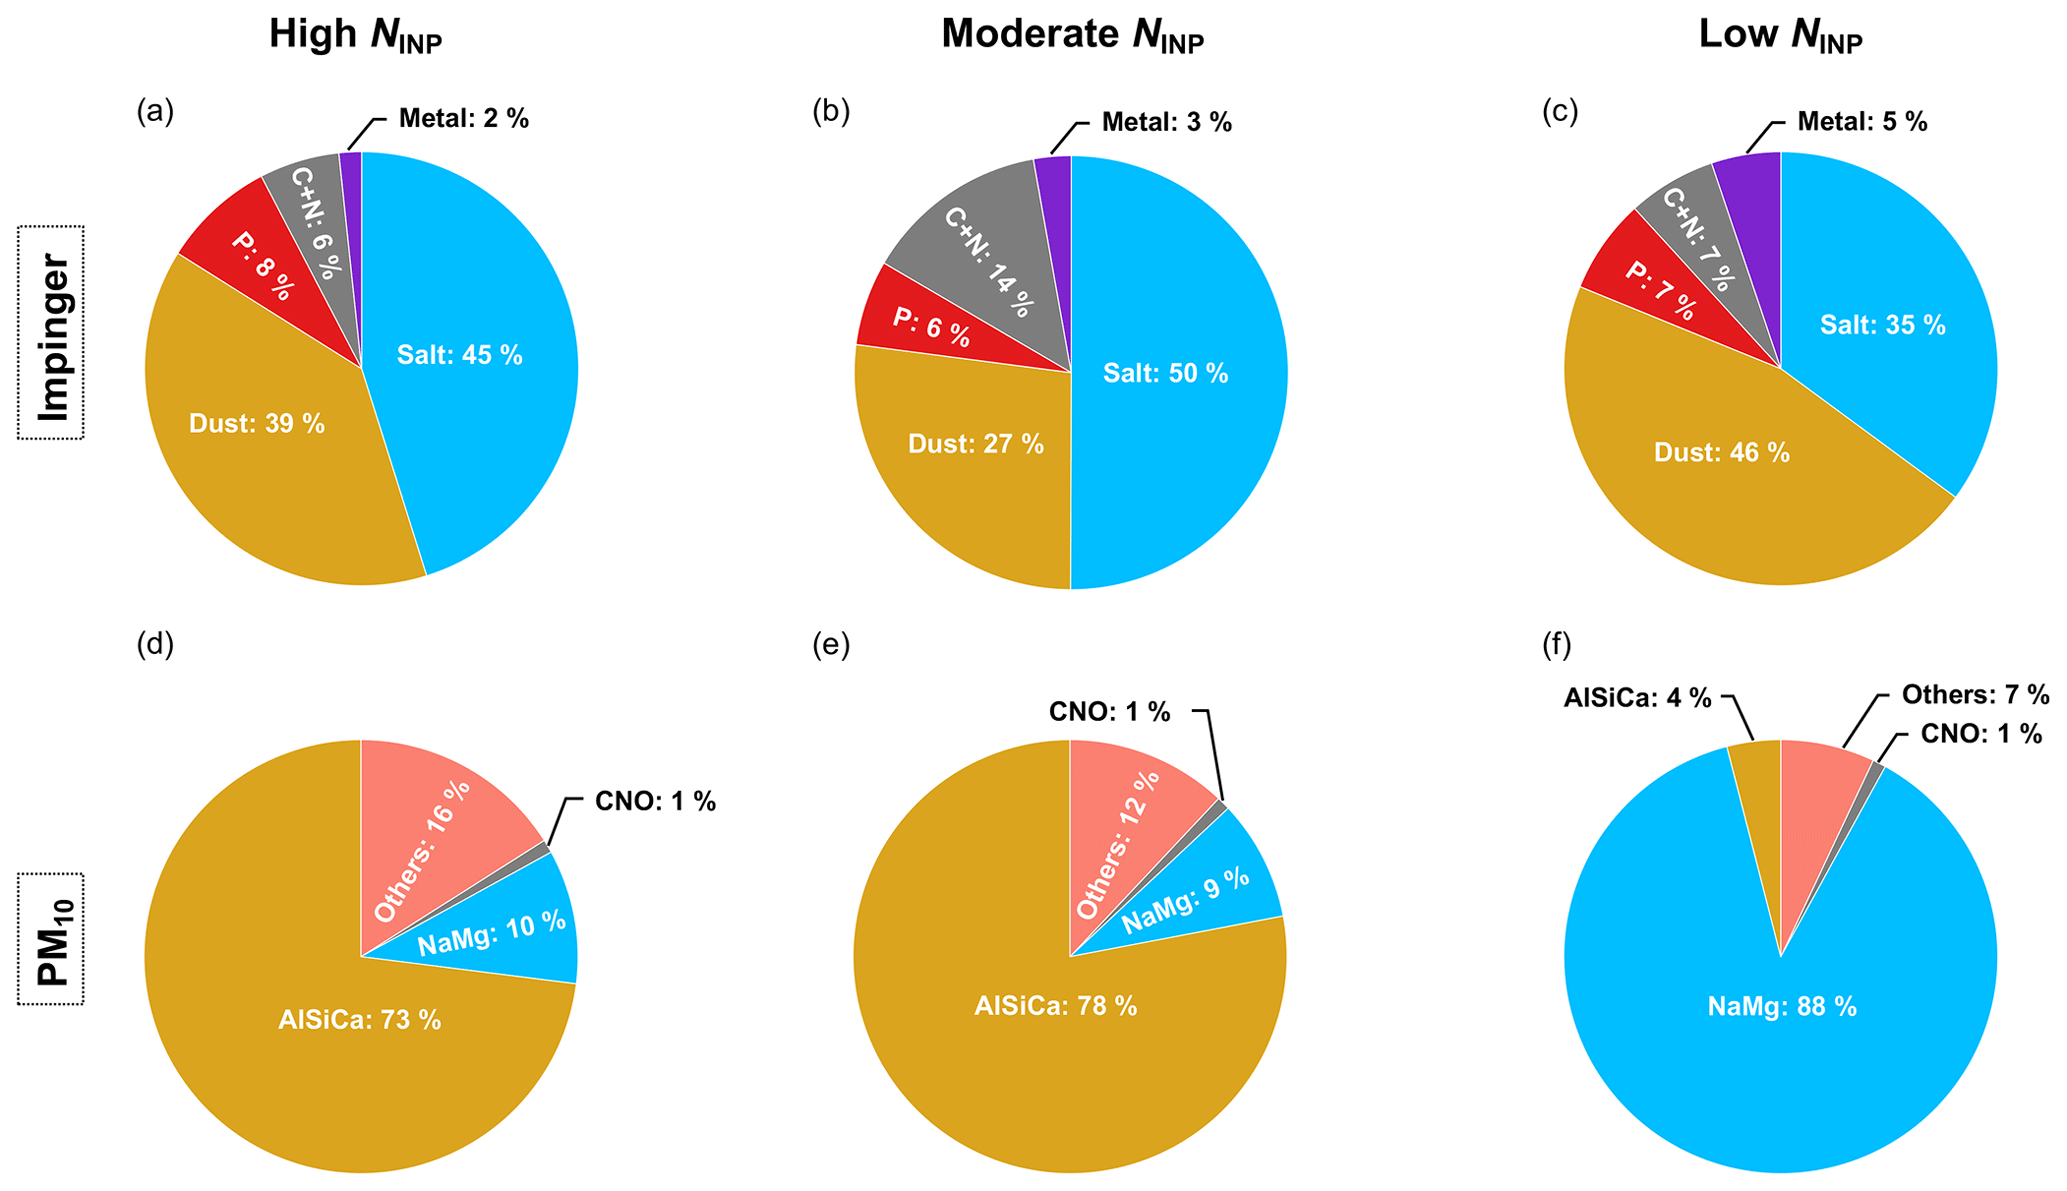
Figure 10Normalized chemical composition fractions from SEM-EDX for selected (a–c) impinger samples (droplet residuals) and (d–f) PM10 samples. Note that the categorization based on elemental compositions was slightly different for selected impinger (Cheng et al., 2022) and PM10 (Hiranuma et al., 2013) samples. The group C + N (CNO) include particles containing only carbon and nitrogen (and oxygen) that are mainly representative of (oxygenated) carbonaceous particles. The salt and NaMg classes are identical and are composed of particles containing sodium and magnesium salts typically indicative of sea salt. The dust class is similar to AlSiCa, except Al was not included in the categorization of dust in impinger droplet residual samples that were collected on aluminum substrates.
We evaluated the chemical compositions of the representative subset of droplet residual (impinger) and particular matter (PM10) filter samples labeled with high, moderate, and low NINP from offline INP measurements in order to understand the diverse chemical compositions and sources (Fig. 10). Note that the air masses cannot be compared directly from the compositions of the high, moderate, and low NINP cases from the impinger and PM10 samples (Fig. 10) because they were not taken at the same time. Note the slight differences for classifications in impinger droplet residual and PM10 samples due to different probed elements (see detailed atomic fractions in Appendix D) and different sampling substrates. C + N, P (phosphorus), metal, dust, and salt are major compositions of impinger droplet residual samples (Fig. 10a, b and c). The compositional diversity suggests that the sea salts and minerals sampled in our study could be aged and mixed. However, we still cannot comment on the mixing state (internal versus external) because all aerosols were sampled into the same liquid sample, allowing for post-sampling mixing. Abundant carbonaceous organics (C + N) were detected in the impinger_moderate sample, possibly released after marine biological production, as suggested by the fluorescent signals shown in Fig. 7b. Additionally, although higher dust and lower salt contents were detected in impinger_low samples, the INP concentration was low. A possible reason could be the suppression of ice nucleation activity of dust particles when aged in an aqueous environment (Kumar et al., 2018) in the impinger samples. Table 3 summarizes the detection of organic functional groups (bonds) for selected impinger droplet residual samples using Raman microspectroscopy. Organic-rich functional groups were identified in the high- and moderate-INP sample, associated with possible co-emission with marine biogenic aerosols as previously discussed. In contrast, no organic functional groups were identified in the impinger_low sample.
Table 3Summary of the number (no.) of functional groups or chemical bonds detected via the Raman spectroscopy for selected impinger droplet residual samples.
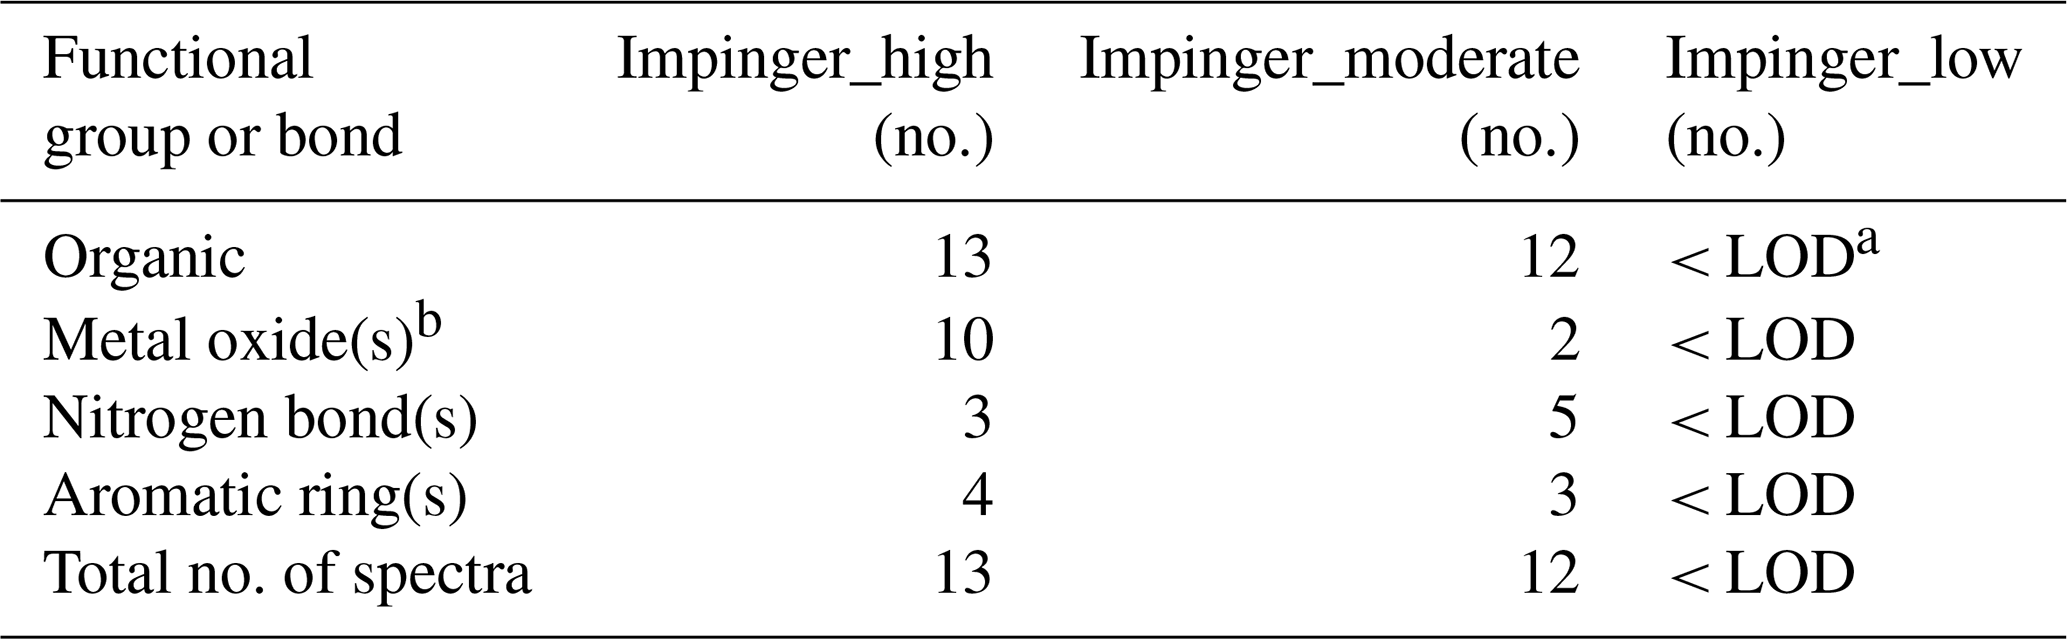
a Limit of detection. b Possible interference from the aluminum foil that was used as sample substrate.
Concerning PM10 samples, greater dust (AlSiCa) content was associated with samples with higher NINP, demonstrating major terrestrial sources. In contrast, more sea salt was pronounced in the low-NINP sample. It remains unknown whether the abundance of INP of maritime origin is due to the presence of other marine constituents occasionally co-emitted with sea salt particles, such as sulfates or organic carbon, in the elevated particles during periods of marine biological activity.
To summarize, our single particle microspectroscopy results justify the conclusions that (1) the aerosol particle composition is not equivalent to the INP composition, (2) the variation in aerosol composition can infer the particle source and air mass history but cannot be a direct indicator of the INP abundance, and (3) quantitatively small organic compounds can substantially influence the INP prosperities at least in our studied samples collected in the Arctic.
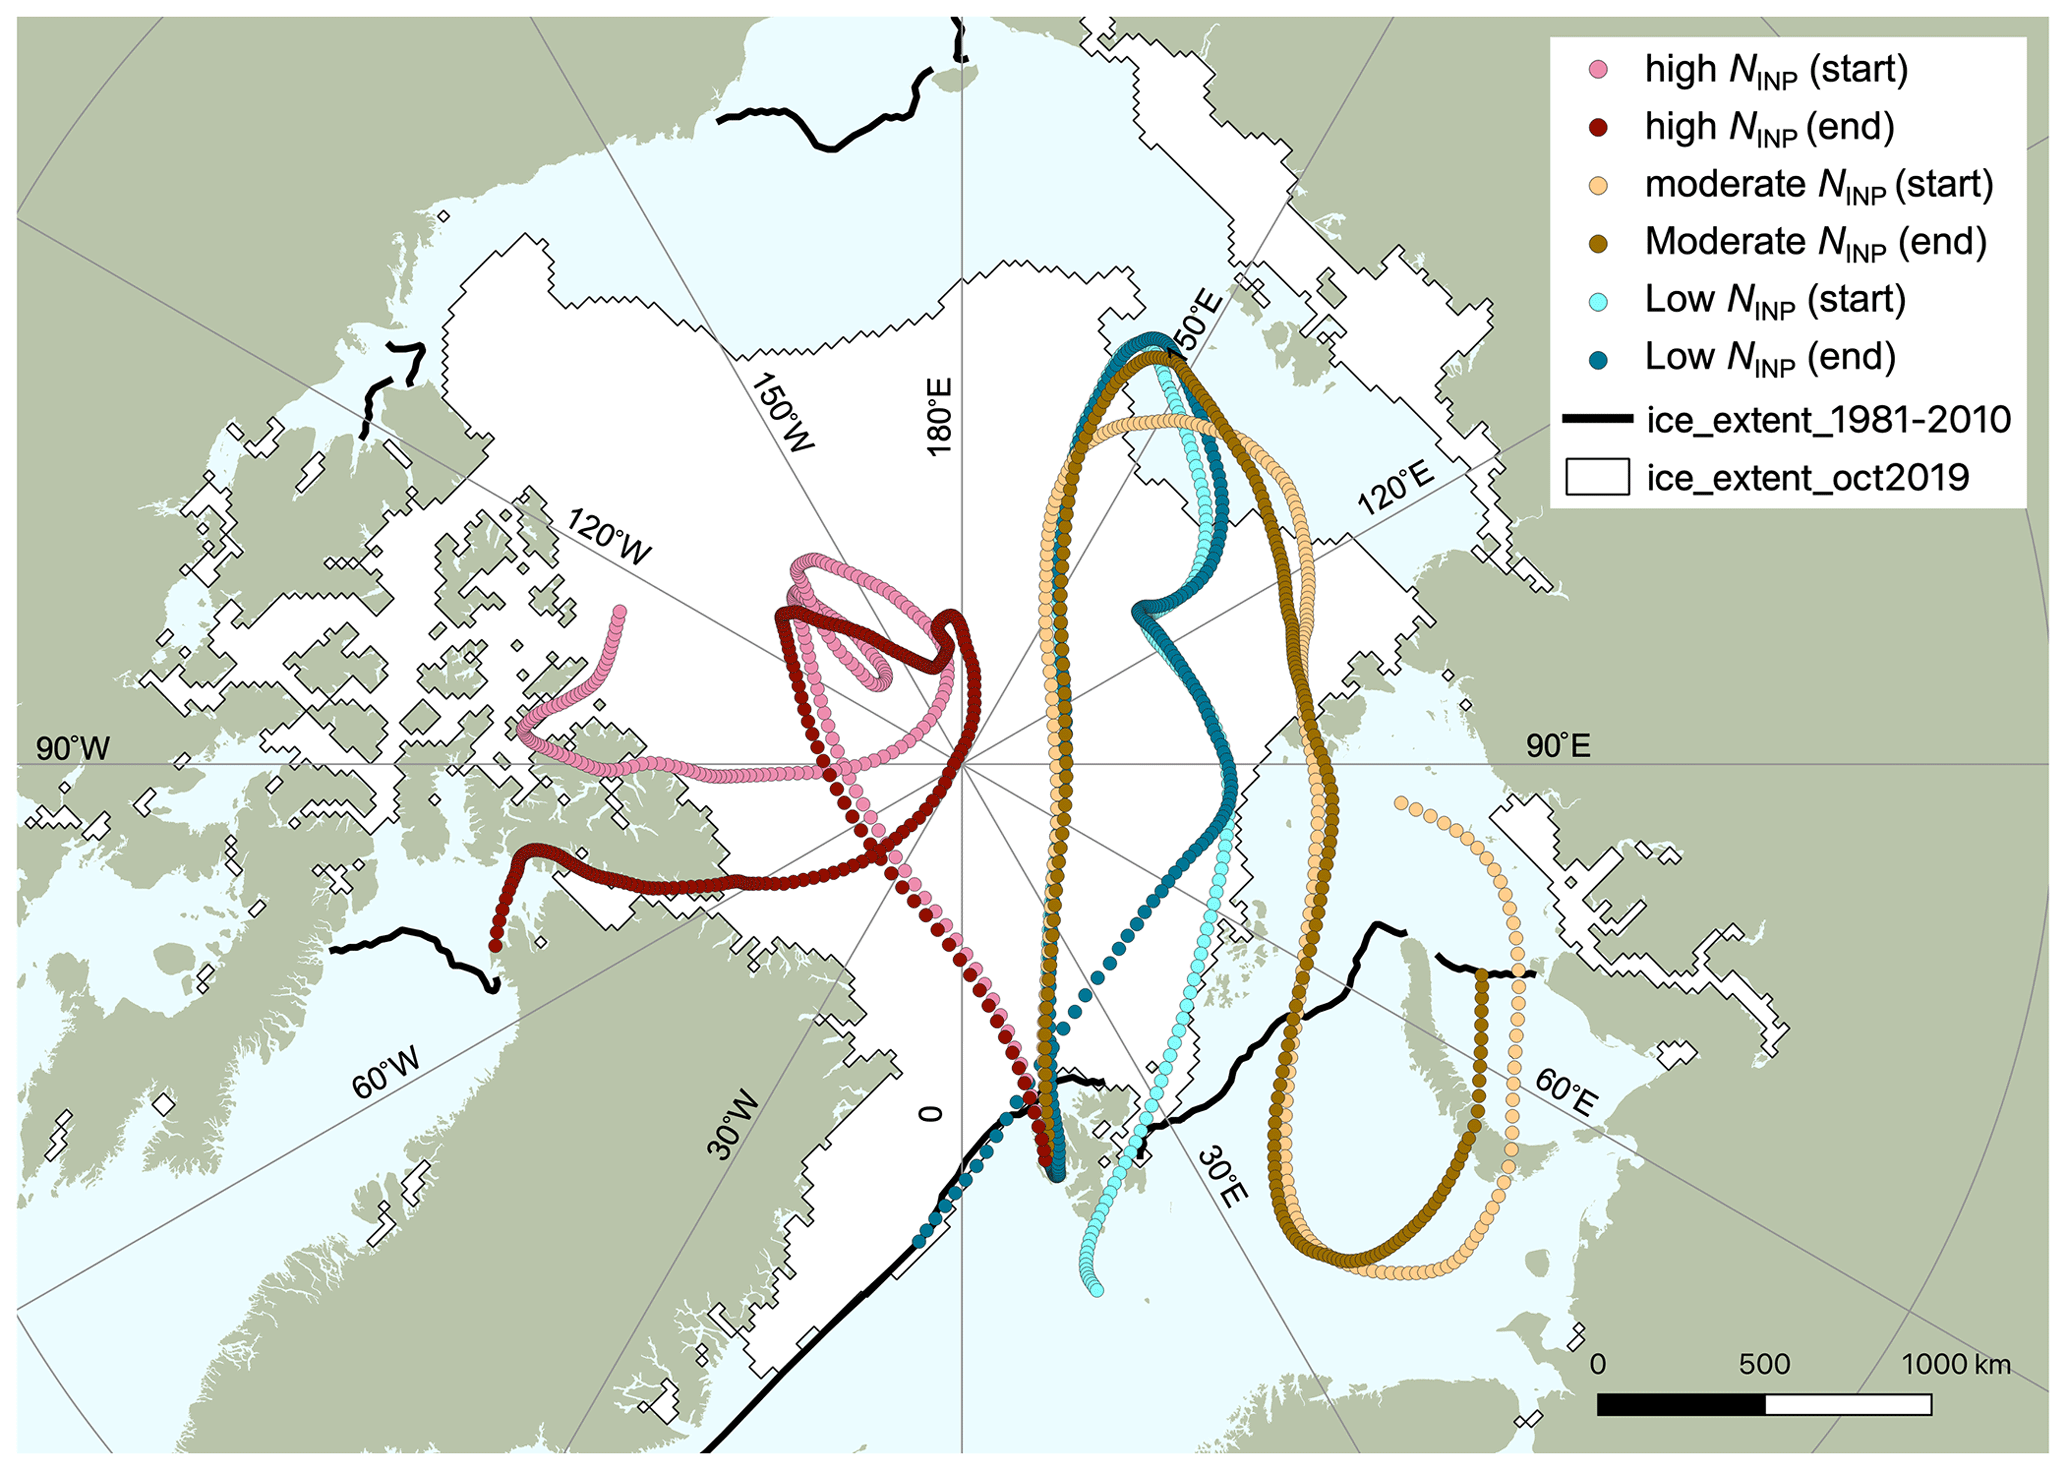
Figure 11HYSPLIT backward trajectories over 10 d, starting at the sampling location at 5 m a.g.l height every hour within the sampling period (two trajectories per sample) for the selected impinger INP case studies throughout the campaign. The high-INP case is from 11:05 to 12:05 UTC 21 October 2019, the moderate-INP case is from 06:34 to 07:34 UTC 24 October 2019, and the low-INP case is from 15:40 to 16:40 UTC 25 October 2019.
3.3.3 HYSPLIT backward trajectories for selected case studies
Backward trajectory analysis was conducted to assess the origin of sampled air masses and to identify potential long-range sources of the measured INPs in the Arctic coastal region in Ny-Ålesund. Figure 11 shows the air masses during the sampling period of the impinger_high case originating from the coastal regions in the vicinity of Greenland, indicating possible influences from long-range transport of terrestrial sources, which qualitatively justifies the inclusion of some dust and organics. Similarly, rich organic and sea salt particles identified in the impinger_moderate sample could be attributed to the potential impacts from lower latitudes, where the residence time of air masses was much longer over the ice-free Barents and Kara seas. A clear exception of air mass history was observed for the impinger_low sample when the air circulation within the Arctic Circle was mostly over the ice pack or locally over Spitsbergen, which explains the low concentrations of INPs, organics, and aerosol particles.
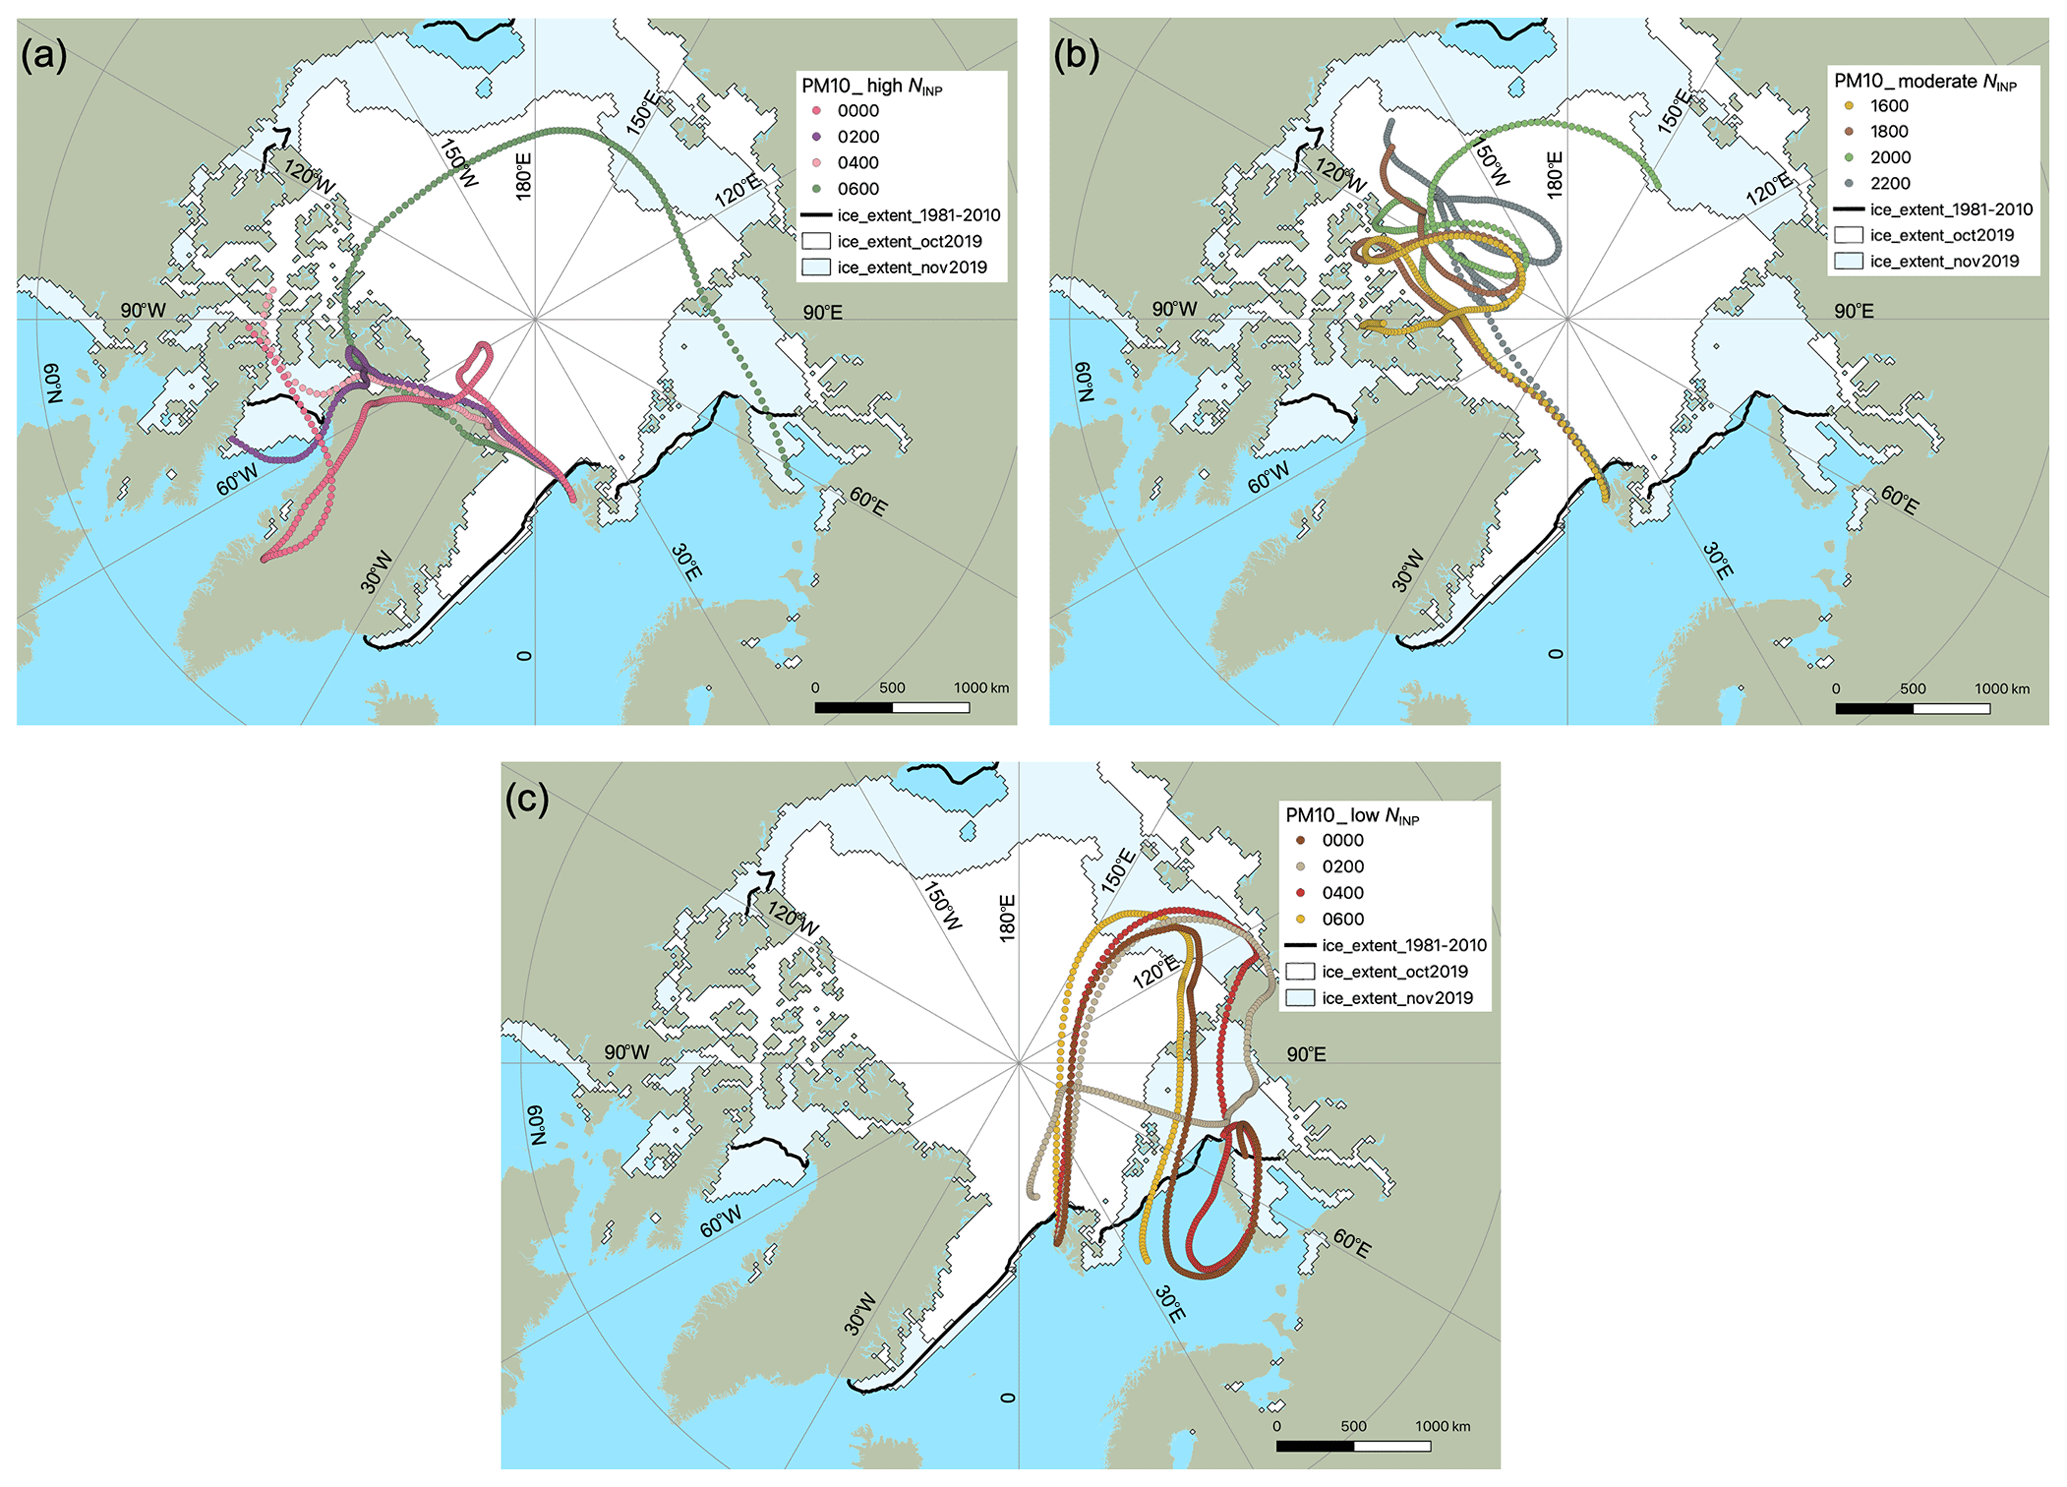
Figure 12HYSPLIT backward trajectories over 10 d, starting at the sampling location at 5 m a.g.l height every 2 h (3 trajectories per sample), for the selected PM10 INP case studies throughout the campaign. The high-INP case is from 00:00 to 08:00 UTC 19 October 2019, the moderate-INP case is from 16:00 to 24:00 UTC 21 October 2019, and the low-INP case is from 00:00 to 08:00 UTC 23 October 2019.
Air mass trajectories during the sampling time of PM10 filters (Fig. 12) show that the trajectories predominantly originated from western and northern Greenland in the high and moderate cases (Fig. 12a and b), which coincided with relatively abundant INPs and high-latitude dust. The consistency regarding high INPs and dust from Greenland for both PM10 and impinger samples suggests that long-range-transported dust from high latitudes (e.g., Greenland) could play an important role in the INP population in the remote Arctic regions.
This study presents the measurement results of ambient INP concentrations and related aerosol properties during the NASCENT campaign in Ny-Ålesund, Svalbard, in October–November 2019. A combination of online and offline INP measurement techniques was applied in order to obtain a wider range of NINP-T spectra and to understand the spatiotemporal variability in INPs from fine to coarse temporal and aerosol size resolution. In this work, despite different INP concentrations being observed by the applied INP techniques (i.e., HINC, PM10, impinger, and WT-CRAFT), all methods are representative in the context of different properties of collected aerosols. A range of aerosol particle sizes can act as INPs so that different measurements are needed to cover the full size range of aerosols smaller than 20 µm. This is true for particle size distribution measurements as well. PM10 filters and WT-CRAFT collect aerosol particles below 10 µm, and the impinger samples particles between 0.5 and 20 µm. A broader range of particle sizes measured by the combined methods allows for a better representation of ambient INPs. In addition, INP measurements from different approaches allow us to determine INP properties from different species. For instance, if one focuses exclusively on mineral dust, a method is needed that captures the coarse-mode aerosol particles.
Overall, we observed that NINP was approximately 2 orders of magnitudes lower compared to the global average (Petters and Wright, 2015) and was generally in good agreement with NINP from previous studies in Ny-Ålesund. We showed that the majority of offline samples experienced a degradation in NINP upon heat treatment, particularly towards warm temperatures (i.e., T > −15 ∘C), indicating the likely presence of proteinaceous or biogenic INPs. Correlation results linking aerosol properties to NINP exhibited weak associations between NINP and coarse-mode particles, despite their importance being highlighted by many previous studies. The averaging effect over relatively coarse-resolution data, scarcity of INPs, and possible long-range modification processes were proposed as potential causes. Relatively strong correlations were found between NINP and particle fluorescence, suggesting that highly IN-active bioaerosols, which may be inherently related to particles large in size during the snow and ice-free season, could serve as dominant local INP sources in the remote Arctic. The relationship between INP abundance and ocean-oriented high-speed wind and MSA concentrations further supports that NINP could be contributed from locally enhanced SSA of biological origin.
Moreover, case studies with scenarios for a typical range of NINP collected closer to the coast were presented (i.e., impinger samples from the aerosol container). The high-NINP case was associated with strong heat lability, fluorescence, high wind speed originating from the ocean, elevated concentration of coarse-mode particles and surface area, and abundant organics. Chemical composition analyses reveal that the diversity in aerosol composition did not substantially impact the INP abundance, which could be a good future motivation to investigate the composition of cloud and ice residual and mixing state of aerosols and their associated impact on INP population and properties. Backward trajectories demonstrated possible high-latitude dust sources from long-range transport (e.g., coastal Greenland) that could be responsible for the INP enrichment. In contrast, for low-NINP cases, most of the air mass history was over the ice pack zone. This research increased the data coverage of INP measurements in the remote Arctic and provided comprehensive analyses of the INP physicochemical properties and potential sources. Further studies with long-term observations are needed to elucidate the annual sources of INPs in the Arctic on a better statistical basis.
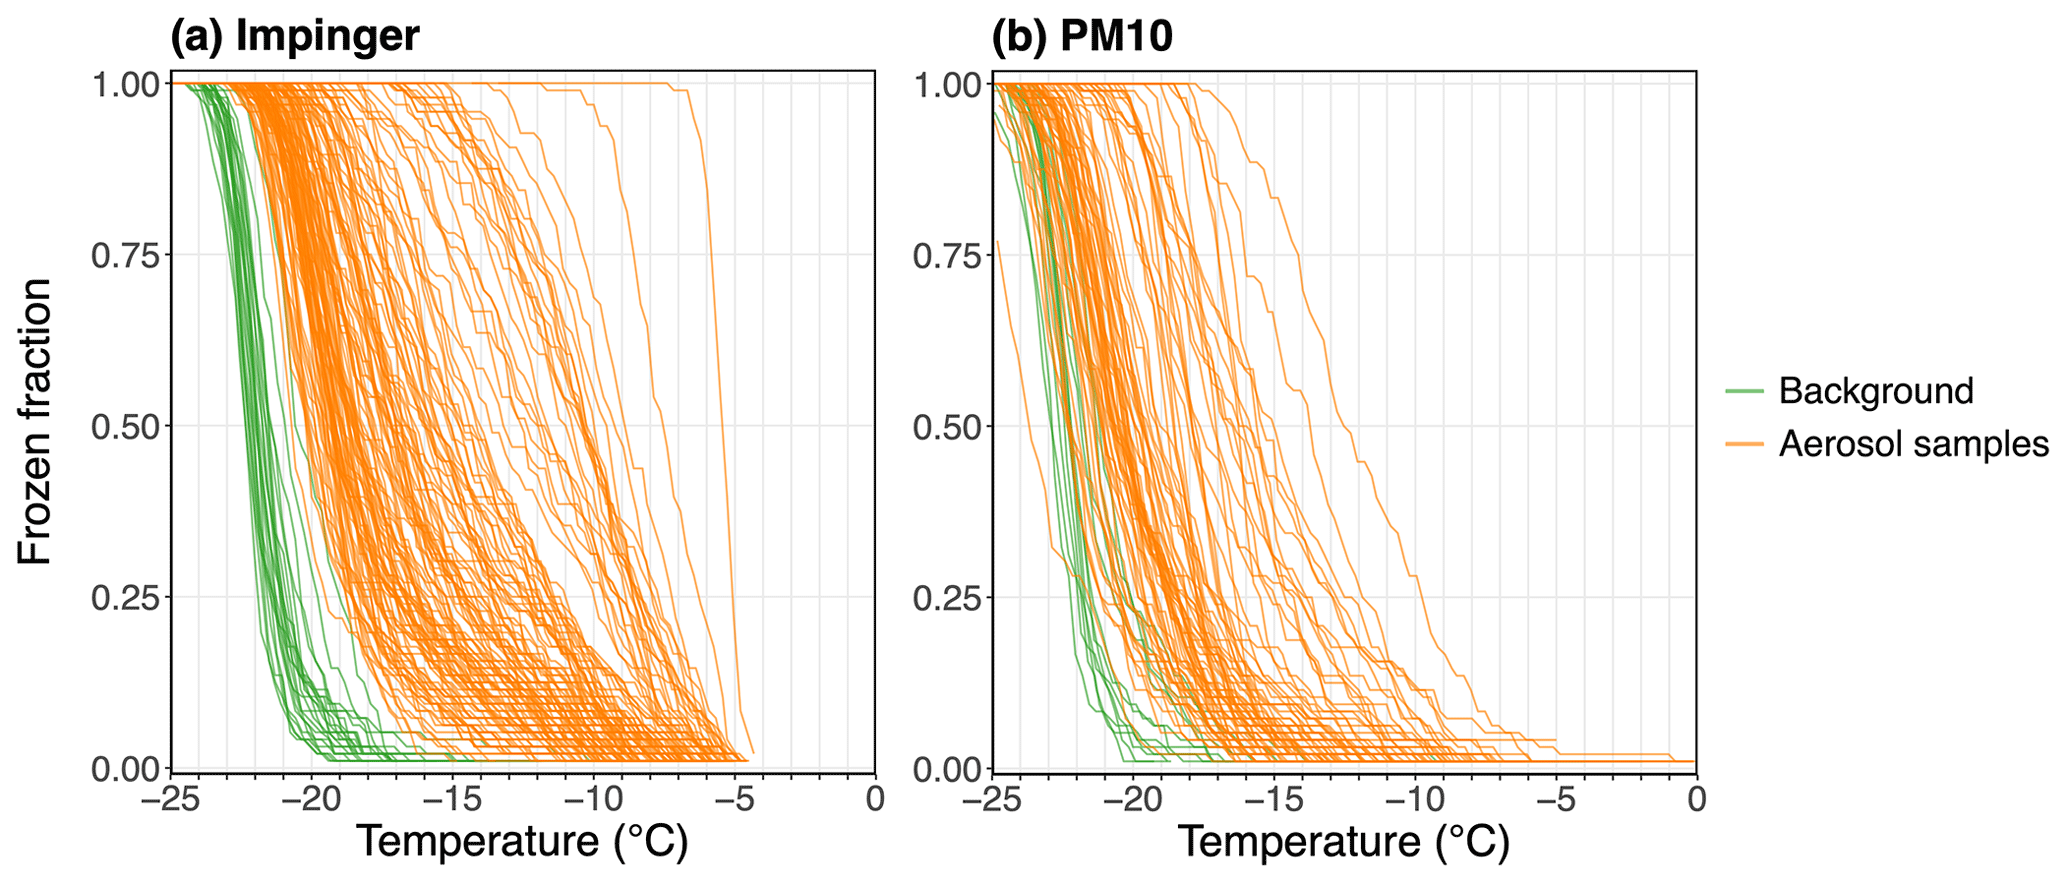
Figure A1Assembly of frozen fraction curves as a function of temperature for aerosol samples and pure water reference experiments conducted with DRINCZ for all measurements from (a) impinger and (b) PM10 samples.
Figure B1 provides full spectra of averaged particle size distribution within the time window for selected case studies presented in Figs. 7 and 8. The INPs collected by the impinger include only particles with aerodynamic diameters larger than 500 nm. Therefore, the high coarse-mode particle concentrations contributed to the high-INP case, but a few particles with diameters larger than approximately 8 µm, which were likely representative of instantaneously enhanced local sources, should explain the higher INP concentrations in the impinger_moderate sample compared to the impinger_low sample. Concerning PM10 samples, the filters collected all particle sizes below 10 µm. The high INP concentration in the PM10_high sample could be attributed to the high particle concentrations with Dp > ca. 2.5 µm. However, compared to the PM10_low sample, particle loading in the PM10_moderate sample was comparable when Dp > 2.5 µm and was instead dominated by those under ca. 2.5 µm.
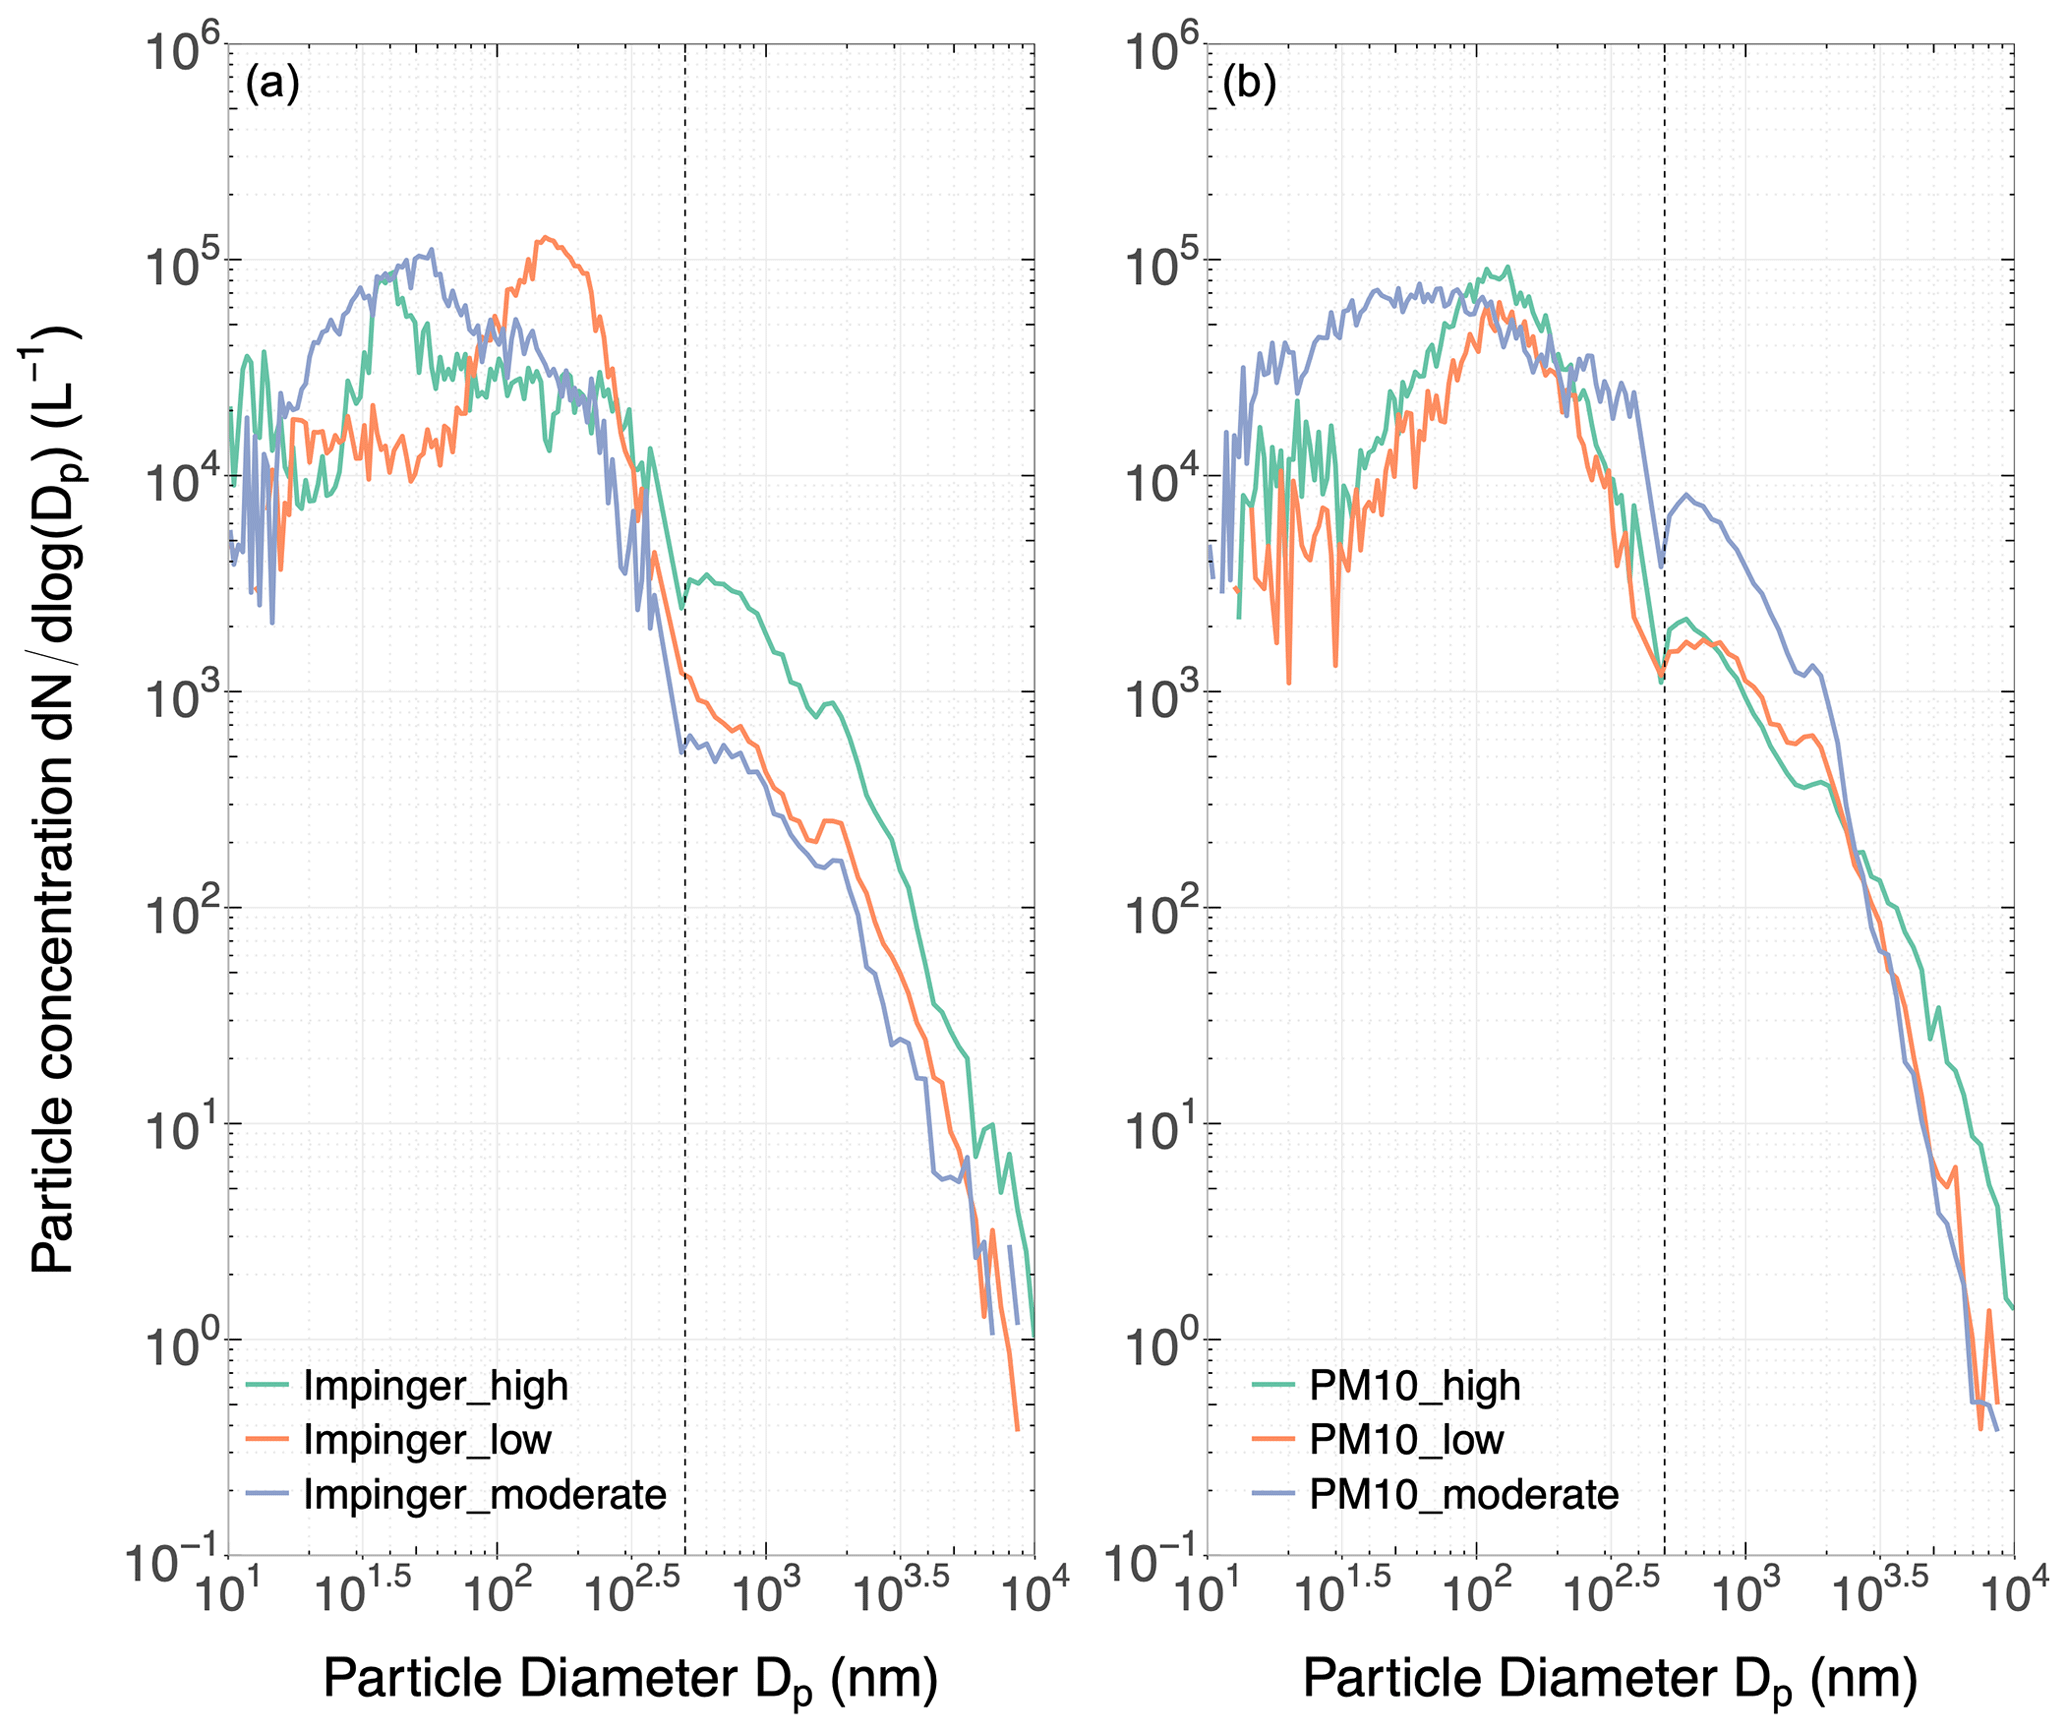
Figure B1Average particle size distribution of selected cases with (a) impinger and (b) PM10 samples. The vertical dashed lines indicate Dp = 500 nm, which is approximately the size boundary of SMPS and APS measurement.
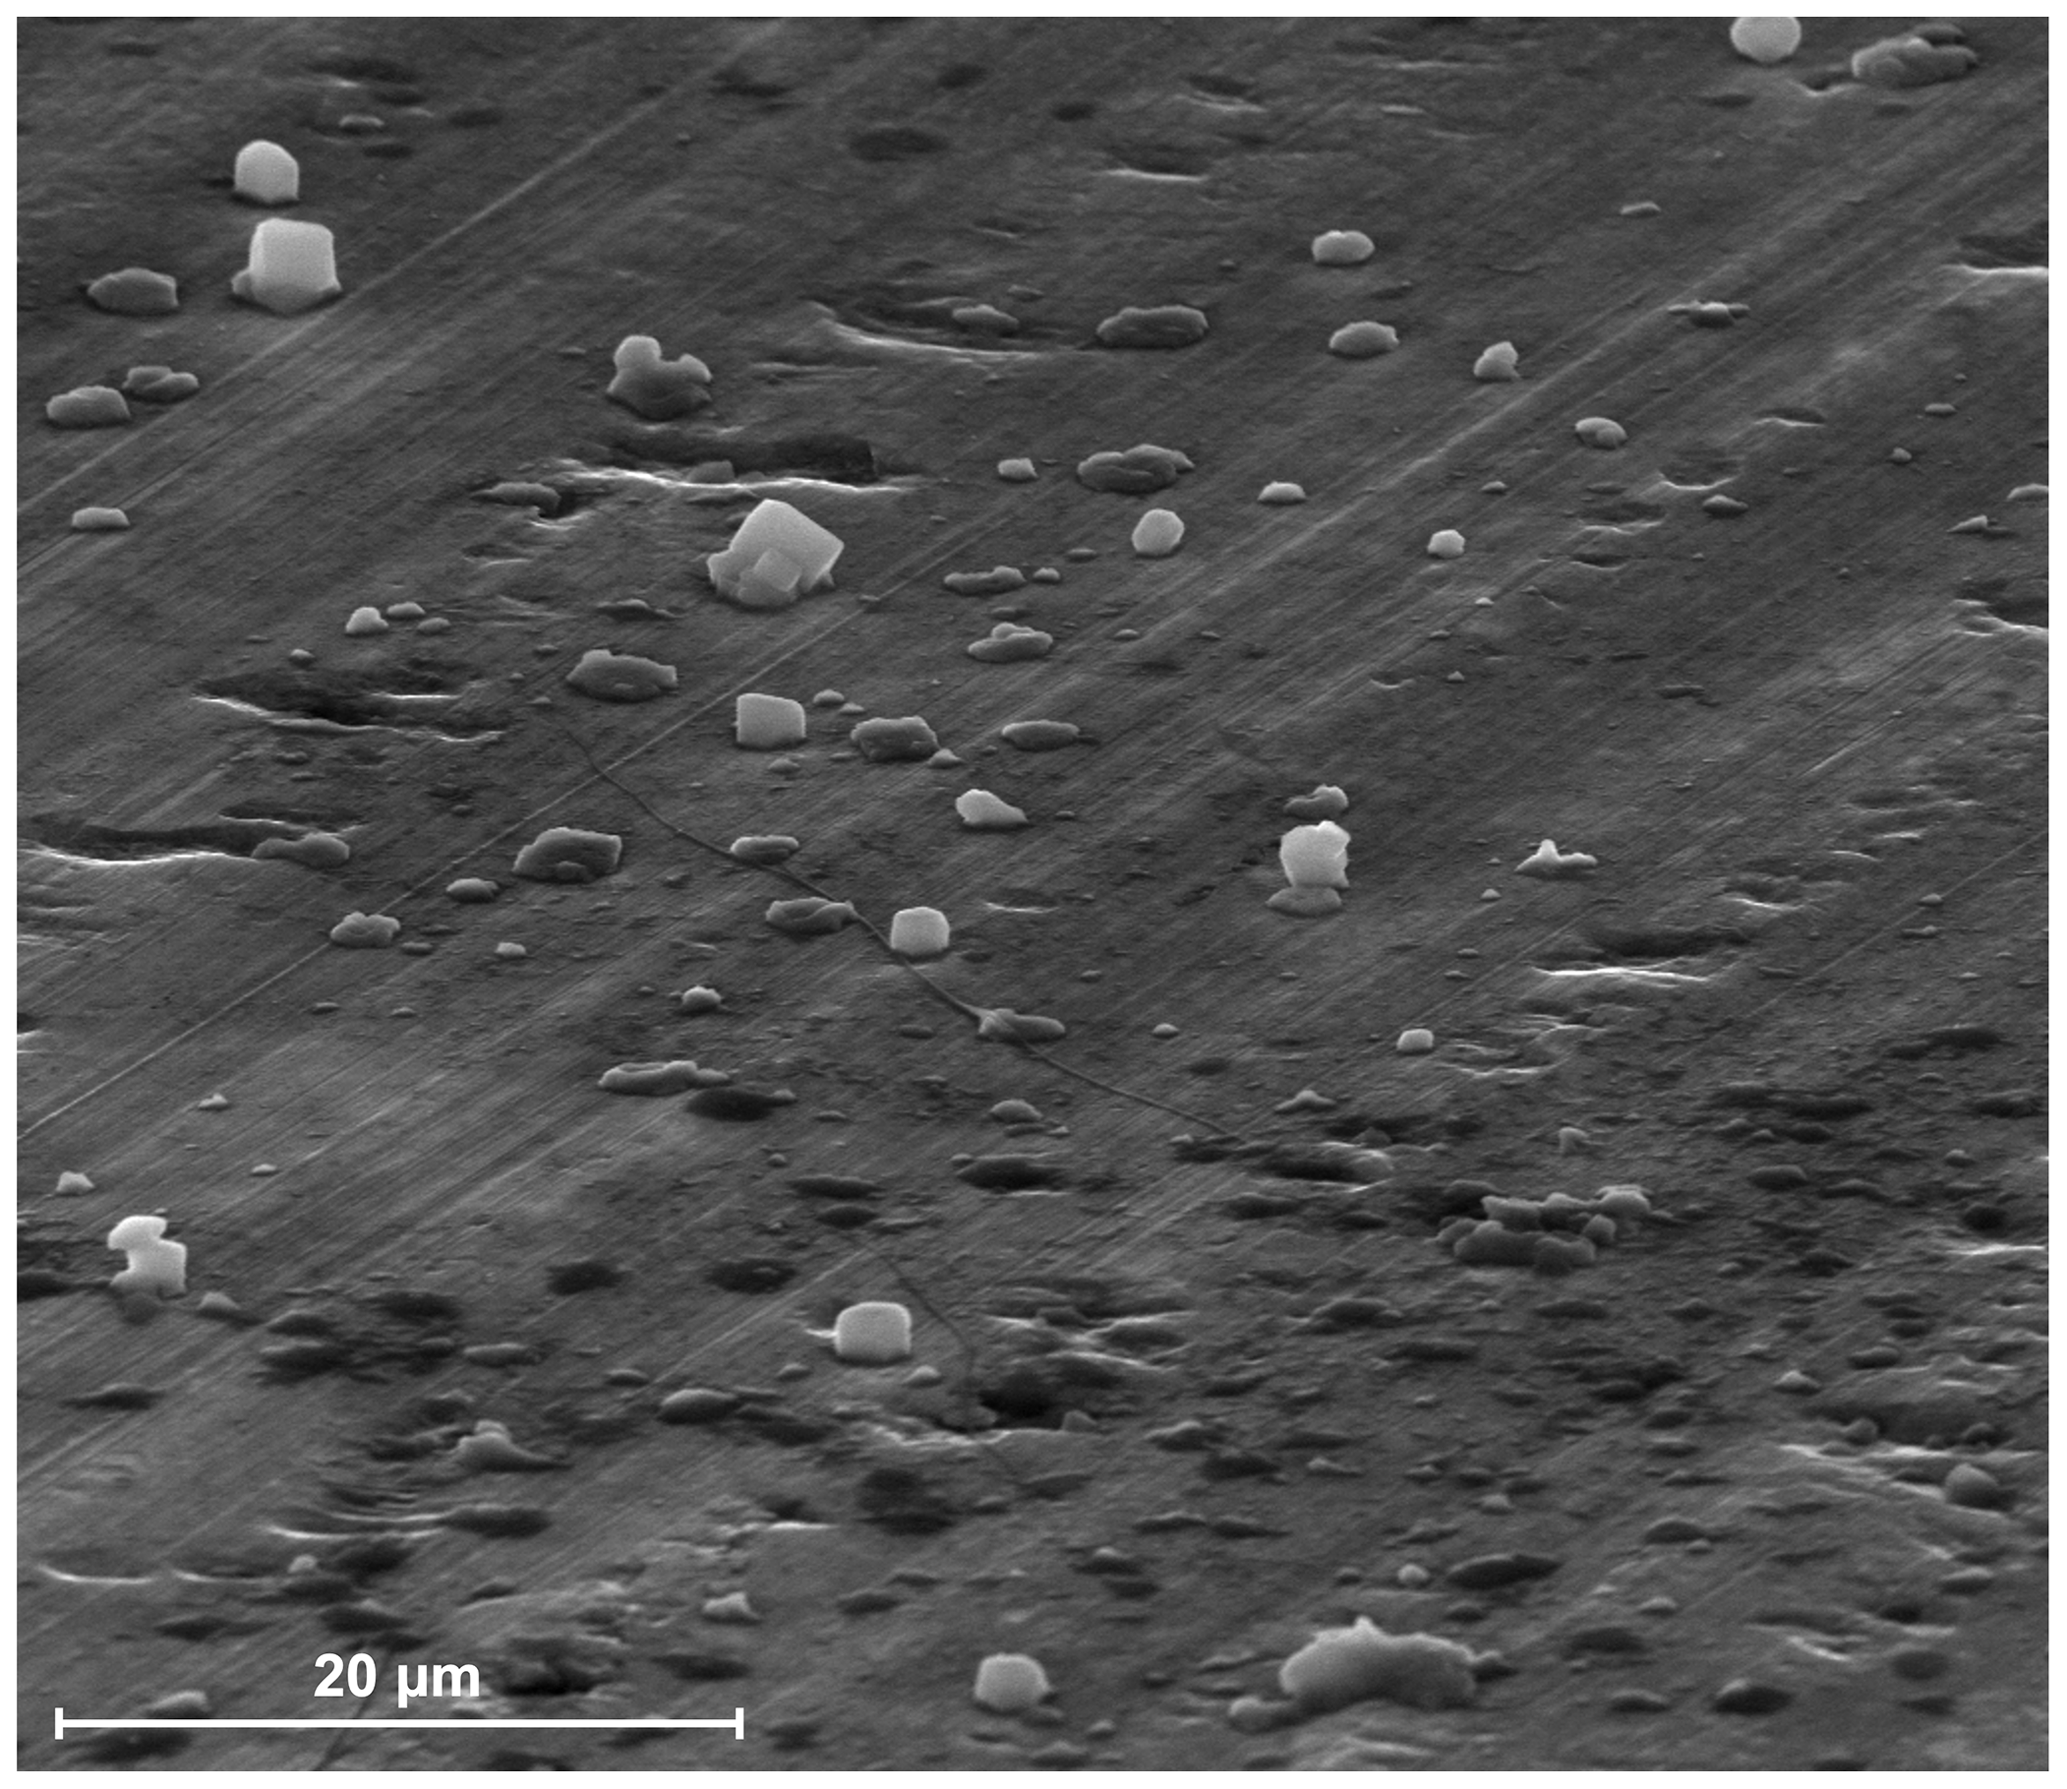
Figure C1SEM image of impinger_high samples in a tilted view. The image captures typical sea salt crystals analyzed by CCSEM-EDX. The CCSEM-EDX analysis covered a 0.5 by 0.5 mm area on the aluminum foil substrates to analyze sufficient particle populations. All particles shown in the image above have therefore been analyzed by CCSEM-EDX.
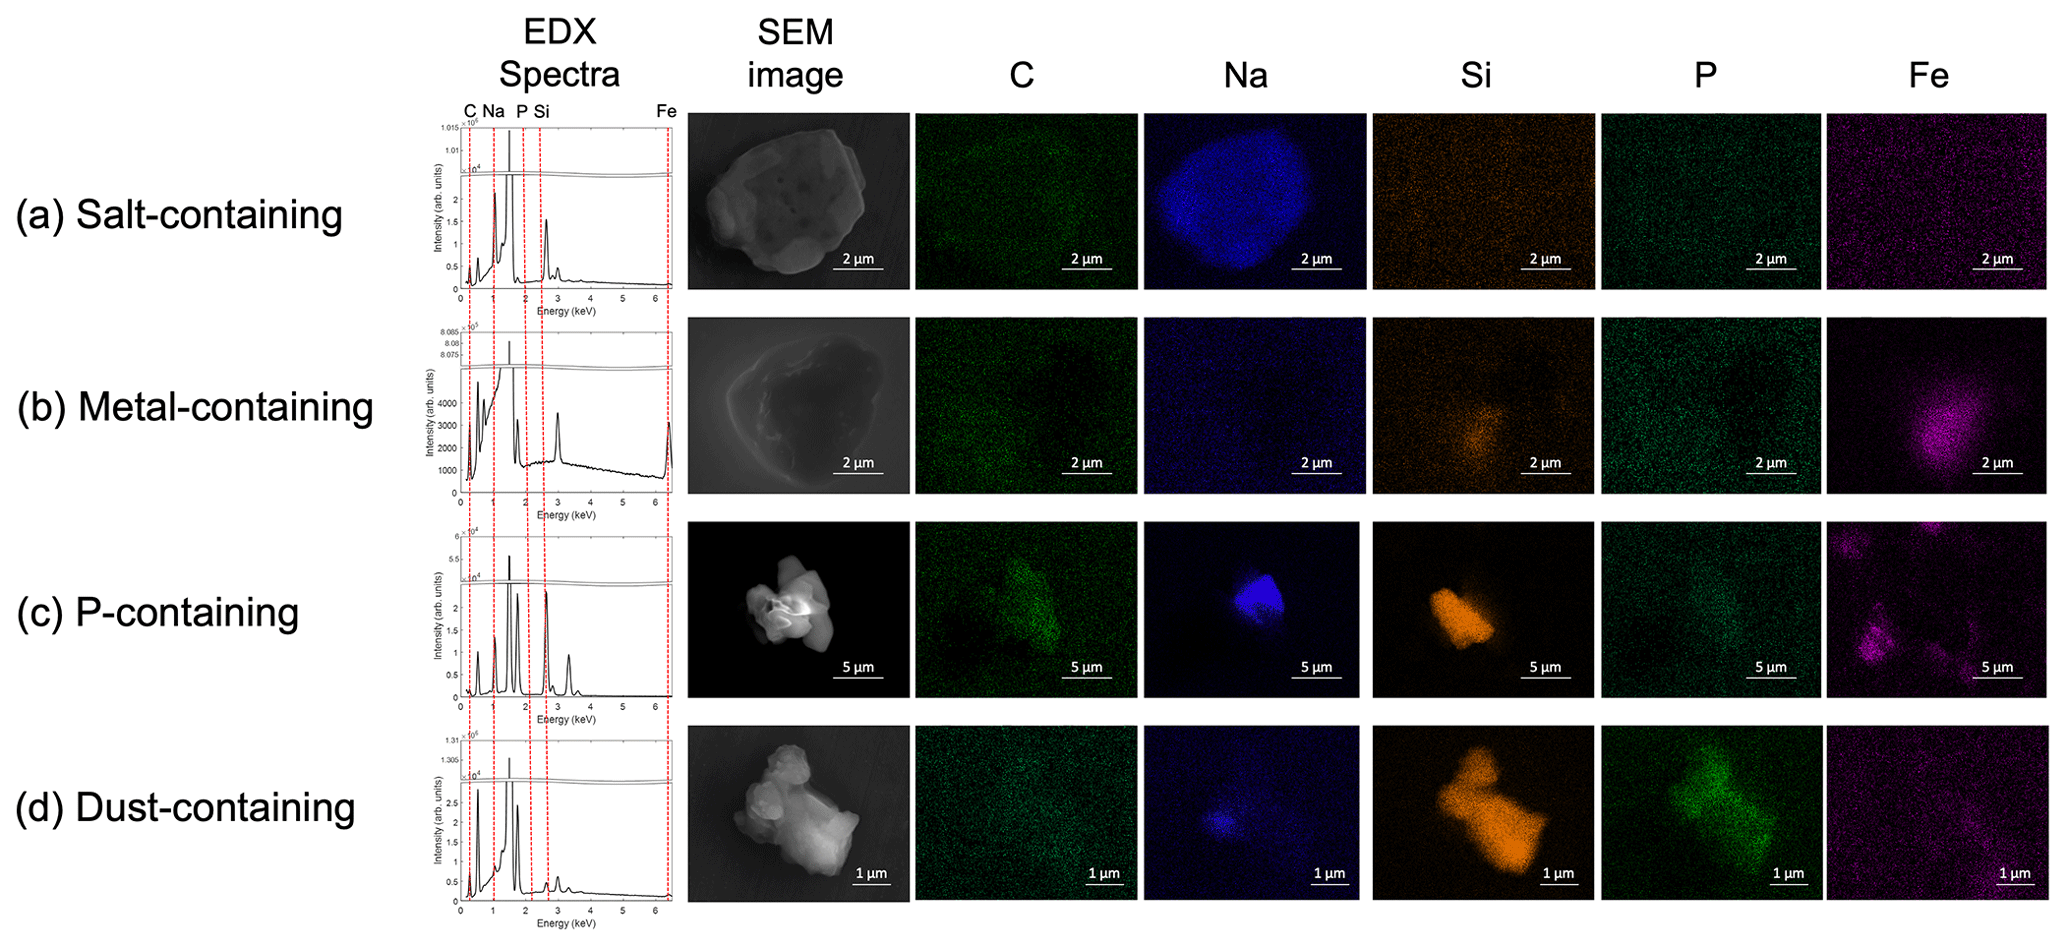
Figure C2Representative SEM images of C, Na, Si, P, and Fe elemental maps and EDX spectra of (a) salt-containing particles, (b) metal-containing particles, (c) P-containing particles, and (d) dust-containing particles from impinger samples.
Table D1Atomic fraction of droplet residuals for selected impinger samples from CCSEM-EDX results.
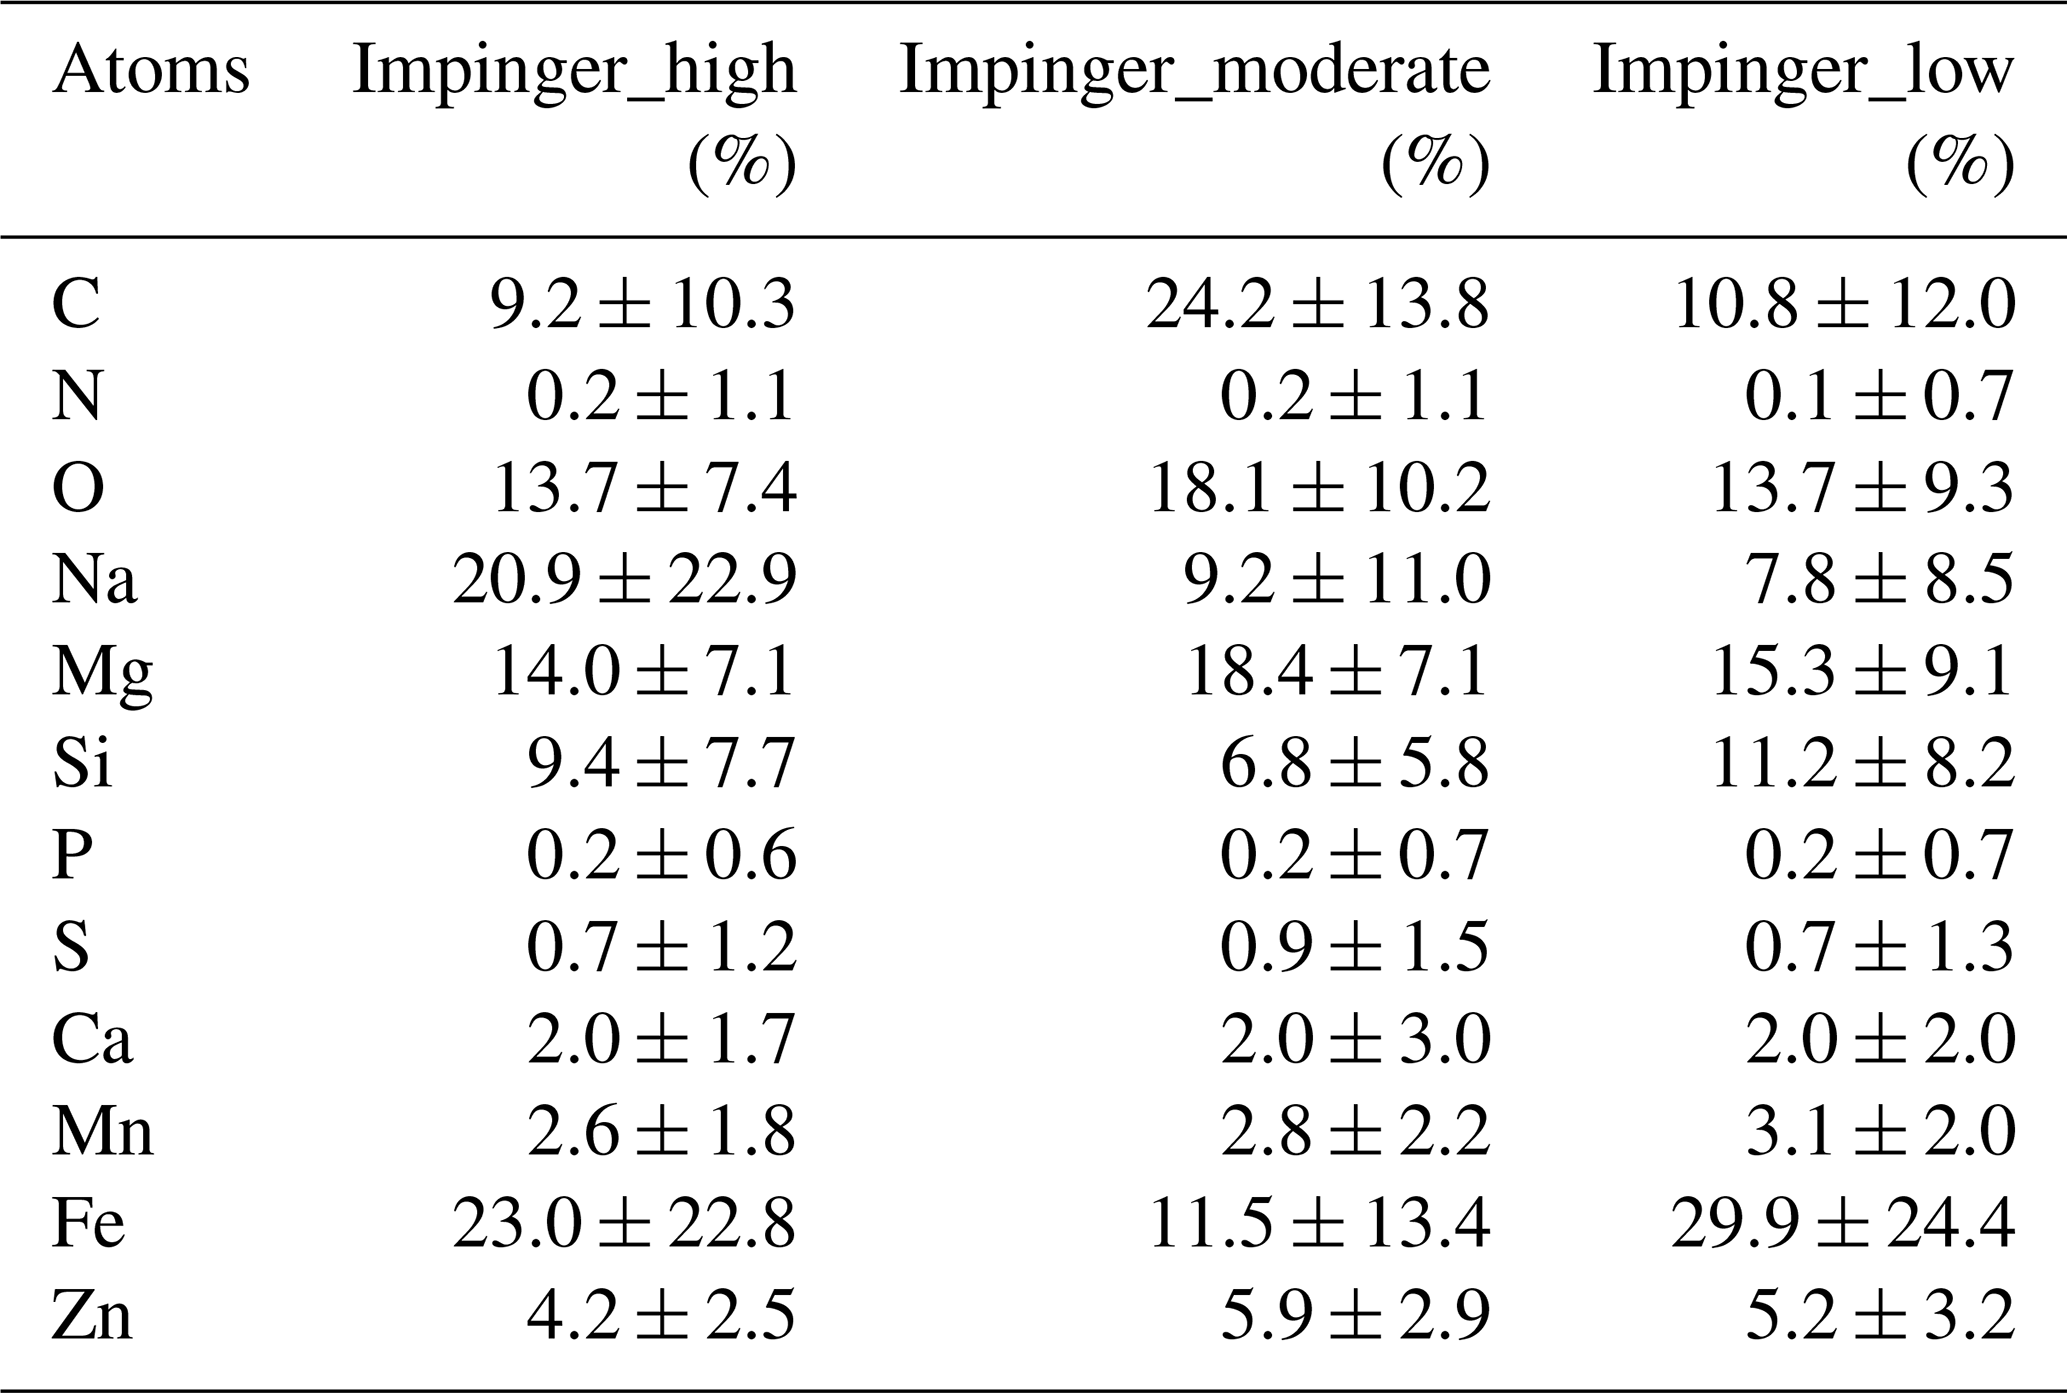
Table D2Atomic fraction of particulate residuals for selected PM10 samples from SEM-EDX results.

The data presented in this study are available at https://doi.org/10.3929/ethz-b-000632439 (Li et al., 2023).
GL performed the data analysis, produced the figures, and wrote the original manuscript draft with contributions from all co-authors. GL and JW performed the INP and aerosol sampling and measurements and post-sample processing and data analyses. EKW conducted and led WT-CRAFT, SEM-EDX, and back trajectory analyses and interpreted the results. ZC and SC were responsible for CCSEM-EDX analysis, data interpretation, and idea input for the study. EKW, AF, SDB, and NH conducted the Raman spectroscopy analysis. JH was involved in organizing the field study and providing feedback on the manuscript. GM and AN provided the WIBS instrument and pre-processed WIBS data. RT provided the ion chromatography data. MM provided meteorological data from the climate change tower next to the GVB observatory. NH conceived the idea of the study and contributed to the data interpretation, idea input, and manuscript feedback. UL was involved in providing feedback on the research ideas and manuscript. ZAK supervised the research processes during campaign planning, experiments, data interpretation, and manuscript writing.
The contact author has declared that none of the authors has any competing interests.
Publisher's note: Copernicus Publications remains neutral with regard to jurisdictional claims in published maps and institutional affiliations.
Guangyu Li and Zamin A. Kanji acknowledge that this project has been made possible by a grant from the Swiss Polar Institute to Frederik Paulsen. Naruki Hiranuma acknowledges the National Science Foundation under grant no. 1941317. The authors thank the staff of the CNR Arctic Station for their support. The WT-CRAFT team acknowledges Hemanth S. K. Vepuri for his support with measurements and analyses. Elise K. Wilbourn and Naruki Hiranuma thank Jacob Hurst for his support with SEM-EDX measurements and analyses. Zezhen Cheng and Swarup China acknowledge support from the Environmental Molecular Sciences Laboratory, a DOE Office of Science User Facility sponsored by the Biological and Environmental Research program under contract no. DE-AC05-76RL01830. We acknowledge all of those involved in the fieldwork associated with the NASCENT project, including technical support from Michael Rösch, Robert O. David, and from the AWIPEV and Norwegian Polar Institute. We would like to thank Sho Ohata and Yutaka Tobo for sharing their research data on black carbon measurement and Stefania Gilardoni for supporting the PSAP data. We want to express our gratitude to Jie Chen and Nadia Shardt for the insightful discussions that they provided.
This research has been supported by the Swiss Polar Institute (GLACE 2019 project no. 9), the Center for Hierarchical Manufacturing, the National Science Foundation (grant no. 1941317), and the Biological and Environmental Research program (grant no. DE-AC05-76RL01830).
This paper was edited by Farahnaz Khosrawi and reviewed by Hinrich Grothe and one anonymous referee.
Alsante, A. N., Thornton, D. C., and Brooks, S. D.: Ice nucleation catalyzed by the photosynthesis enzyme RuBisCO and other abundant biomolecules, Communications Earth & Environment, 4, 51, https://doi.org/10.1038/s43247-023-00707-7, 2023. a
Barry, K. R., Hill, T. C., Moore, K. A., Douglas, T. A., Kreidenweis, S. M., DeMott, P. J., and Creamean, J. M.: Persistence and Potential Atmospheric Ramifications of Ice-Nucleating Particles Released from Thawing Permafrost, Environ. Sci. Technol., 57, 3505–3515, https://doi.org/10.1021/acs.est.2c06530, 2023. a
Beall, C. M., Lucero, D., Hill, T. C., DeMott, P. J., Stokes, M. D., and Prather, K. A.: Best practices for precipitation sample storage for offline studies of ice nucleation in marine and coastal environments, Atmos. Meas. Tech., 13, 6473–6486, https://doi.org/10.5194/amt-13-6473-2020, 2020. a, b
Becagli, S., Ghedini, C., Peeters, S., Rottiers, A., Traversi, R., Udisti, R., Chiari, M., Jalba, A., Despiau, S., Dayan, U., and Temara, A.: MBAS (Methylene Blue Active Substances) and LAS (Linear Alkylbenzene Sulphonates) in Mediterranean coastal aerosols: Sources and transport processes, Atmos. Environ., 45, 6788–6801, https://doi.org/10.1016/j.atmosenv.2011.04.041, 2011. a, b
Becagli, S., Amore, A., Caiazzo, L., Iorio, T. D., Sarra, A. d., Lazzara, L., Marchese, C., Meloni, D., Mori, G., Muscari, G., Nuccio, C., Pace, G., Severi, M., and Traversi, R.: Biogenic Aerosol in the Arctic from Eight Years of MSA Data from Ny Ålesund (Svalbard Islands) and Thule (Greenland), Atmosphere, 10, 349, https://doi.org/10.3390/atmos10070349, 2019. a
Bintanja, R., Van der Linden, E., and Hazeleger, W.: Boundary layer stability and Arctic climate change: A feedback study using EC-Earth, Clim. Dynam., 39, 2659–2673, https://doi.org/10.1007/s00382-011-1272-1, 2012. a
Cheng, Z., Morgenstern, M., Zhang, B., Fraund, M., Lata, N. N., Brimberry, R., Marcus, M. A., Mazzoleni, L., Fialho, P., Henning, S., Wehner, B., Mazzoleni, C., and China, S.: Particle phase-state variability in the North Atlantic free troposphere during summertime is determined by atmospheric transport patterns and sources, Atmos. Chem. Phys., 22, 9033–9057, https://doi.org/10.5194/acp-22-9033-2022, 2022. a
Chou, C., Kanji, Z. A., Stetzer, O., Tritscher, T., Chirico, R., Heringa, M. F., Weingartner, E., Prévôt, A. S. H., Baltensperger, U., and Lohmann, U.: Effect of photochemical ageing on the ice nucleation properties of diesel and wood burning particles, Atmos. Chem. Phys., 13, 761–772, https://doi.org/10.5194/acp-13-761-2013, 2013. a
Conen, F., Stopelli, E., and Zimmermann, L.: Clues that decaying leaves enrich Arctic air with ice nucleating particles, Atmos. Environ., 129, 91–94, https://doi.org/10.1016/j.atmosenv.2016.01.027, 2016. a, b
Creamean, J. M., Cross, J. N., Pickart, R., McRaven, L., Lin, P., Pacini, A., Hanlon, R., Schmale, D. G., Ceniceros, J., Aydell, T., Colombi, N., Bolger, E., and DeMott, P. J.: Ice nucleating particles carried from below a phytoplankton bloom to the Arctic atmosphere, Geophys. Res. Lett., 46, 8572–8581, https://doi.org/10.1029/2019GL083039, 2019. a
Creamean, J. M., Hill, T. C., DeMott, P. J., Uetake, J., Kreidenweis, S., and Douglas, T. A.: Thawing permafrost: an overlooked source of seeds for Arctic cloud formation, Environ. Res. Lett., 15, 084022, https://doi.org/10.1088/1748-9326/ab87d3, 2020. a
Creamean, J. M., Ceniceros, J. E., Newman, L., Pace, A. D., Hill, T. C. J., DeMott, P. J., and Rhodes, M. E.: Evaluating the potential for Haloarchaea to serve as ice nucleating particles, Biogeosciences, 18, 3751–3762, https://doi.org/10.5194/bg-18-3751-2021, 2021. a
David, R. O., Cascajo-Castresana, M., Brennan, K. P., Rösch, M., Els, N., Werz, J., Weichlinger, V., Boynton, L. S., Bogler, S., Borduas-Dedekind, N., Marcolli, C., and Kanji, Z. A.: Development of the DRoplet Ice Nuclei Counter Zurich (DRINCZ): validation and application to field-collected snow samples, Atmos. Meas. Tech., 12, 6865–6888, https://doi.org/10.5194/amt-12-6865-2019, 2019. a, b, c, d, e
DeMott, P. J., Prenni, A. J., Liu, X., Kreidenweis, S. M., Petters, M. D., Twohy, C. H., Richardson, M. S., Eidhammer, T., and Rogers, D. C.: Predicting global atmospheric ice nuclei distributions and their impacts on climate, P. Natl. Acad. Sci. USA, 107, 11217–11222, https://doi.org/10.1073/pnas.0910818107, 2010. a
DeMott, P. J., Prenni, A. J., McMeeking, G. R., Sullivan, R. C., Petters, M. D., Tobo, Y., Niemand, M., Möhler, O., Snider, J. R., Wang, Z., and Kreidenweis, S. M.: Integrating laboratory and field data to quantify the immersion freezing ice nucleation activity of mineral dust particles, Atmos. Chem. Phys., 15, 393–409, https://doi.org/10.5194/acp-15-393-2015, 2015. a, b, c
DeMott, P. J., Hill, T. C. J., McCluskey, C. S., Prather, K. A., Collins, D. B., Sullivan, R. C., Ruppel, M. J., Mason, R. H., Irish, V. E., Lee, T., Hwang, C. Y., Rhee, T. S., Snider, J. R., McMeeking, G. R., Dhaniyala, S., Lewis, E. R., Wentzell, J. J. B., Abbatt, J., Lee, C., Sultana, C. M., Ault, A. P., Axson, J. L., Martinez, M. D., Venero, I., Santos-Figueroa, G., Stokes, M. D., Deane, G. B., Mayol-Bracero, O. L., Grassian, V. H., Bertram, T. H., Bertram, A. K., Moffett, B. F., and Franc, G. D.: Sea spray aerosol as a unique source of ice nucleating particles, P. Natl. Acad. Sci. USA, 113, 5797–5803, https://doi.org/10.1073/pnas.1514034112, 2016. a
Deng, C., Brooks, S. D., Vidaurre, G., and Thornton, D. C. O.: Using Raman Microspectroscopy to Determine Chemical Composition and Mixing State of Airborne Marine Aerosols over the Pacific Ocean, Aerosol Sci. Tech., 48, 193–206, https://doi.org/10.1080/02786826.2013.867297, 2014. a, b
Eirund, G. K., Possner, A., and Lohmann, U.: Response of Arctic mixed-phase clouds to aerosol perturbations under different surface forcings, Atmos. Chem. Phys., 19, 9847–9864, https://doi.org/10.5194/acp-19-9847-2019, 2019. a
Forster, P., Storelvmo, T., Armour, K., Collins, W., Dufresne, J.-L., Frame, D., Lunt, D. J., Mauritsen, T., Palmer, M. D., Watanabe, M., Wild, M., and Zhang, H.: The Earth's Energy Budget, Climate Feedbacks, and Climate Sensitivity, in: Climate Change 2021: The Physical Science Basis. Contribution of Working Group I to the Sixth Assessment Report of the Intergovernmental Panel on Climate Change, edited by: Masson-Delmotte, V., Zhai, P., Pirani, A., Connors, S. L., Péan, C., Berger, S., Caud, N., Chen, Y., Goldfarb, L., Gomis, M. I., Huang, M., Leitzell, K., Lonnoy, E., Matthews, J. B. R., Maycock, T. K., Waterfield, T., Yelekçi, O., Yu, R., and Zhou, B., Cambridge University Press, Cambridge, United Kingdom and New York, NY, USA, 923–1054, https://doi.org/10.1017/9781009157896.009, 2021. a, b, c
Friedman, B., Kulkarni, G., Beránek, J., Zelenyuk, A., Thornton, J. A., and Cziczo, D. J.: Ice nucleation and droplet formation by bare and coated soot particles, J. Geophys. Res.-Atmos., 116, D17203, https://doi.org/10.1029/2011JD015999, 2011. a
Gilardoni, S., Lupi, A., Mazzola, M., Cappelletti, D. M., Moroni, B., Ferrero, L., Markuszewski, P., Rozwadowska, A., Krejci, R., Zieger, P., Tunved, P., Karlsson, L., Vratolis, S., Eleftheriadis, K., and Viola, A. P.: Atmospheric black carbon in Svalbard (ABC Svalbard), SESS report, SIOS, 200–201, 2019. a
Gong, X., Wex, H., Voigtländer, J., Fomba, K. W., Weinhold, K., van Pinxteren, M., Henning, S., Müller, T., Herrmann, H., and Stratmann, F.: Characterization of aerosol particles at Cabo Verde close to sea level and at the cloud level – Part 1: Particle number size distribution, cloud condensation nuclei and their origins, Atmos. Chem. Phys., 20, 1431–1449, https://doi.org/10.5194/acp-20-1431-2020, 2020. a
Graversen, R. G. and Wang, M.: Polar amplification in a coupled climate model with locked albedo, Clim. Dynam., 33, 629–643, https://doi.org/10.1007/s00382-009-0535-6, 2009. a, b
Hall, A.: The Role of Surface Albedo Feedback in Climate, J. Climate, 17, 1550–1568, https://doi.org/10.1175/1520-0442(2004)017<1550:TROSAF>2.0.CO;2, 2004. a, b
Hande, L. B. and Hoose, C.: Partitioning the primary ice formation modes in large eddy simulations of mixed-phase clouds, Atmos. Chem. Phys., 17, 14105–14118, https://doi.org/10.5194/acp-17-14105-2017, 2017. a
Harrington, J. Y. and Olsson, P. Q.: On the potential influence of ice nuclei on surface-forced marine stratocumulus cloud dynamics, J. Geophys. Res.-Atmos., 106, 27473–27484, https://doi.org/10.1029/2000JD000236, 2001. a
Harrington, J. Y., Reisin, T., Cotton, W. R., and Kreidenweis, S. M.: Cloud resolving simulations of Arctic stratus: Part II: Transition-season clouds, Atmos. Res., 51, 45–75, https://doi.org/10.1016/S0169-8095(98)00098-2, 1999. a
Hartigan, J. A. and Wong, M. A.: Algorithm AS 136: A K-Means Clustering Algorithm, J. Roy. Stat. Soc. C-App., 28, 100–108, https://doi.org/10.2307/2346830, 1979. a
Hartmann, M., Adachi, K., Eppers, O., Haas, C., Herber, A., Holzinger, R., Hünerbein, A., Jäkel, E., Jentzsch, C., van Pinxteren, M., Wex, H., Willmes, S., and Stratmann, F.: Wintertime airborne measurements of ice nucleating particles in the high Arctic: A hint to a marine, biogenic source for ice nucleating particles, Geophys. Res. Lett., 47, e2020GL087770, https://doi.org/10.1029/2020GL087770, 2020. a
Hawker, R. E., Miltenberger, A. K., Wilkinson, J. M., Hill, A. A., Shipway, B. J., Cui, Z., Cotton, R. J., Carslaw, K. S., Field, P. R., and Murray, B. J.: The temperature dependence of ice-nucleating particle concentrations affects the radiative properties of tropical convective cloud systems, Atmos. Chem. Phys., 21, 5439–5461, https://doi.org/10.5194/acp-21-5439-2021, 2021. a, b
Hill, T. C. J., DeMott, P. J., Tobo, Y., Fröhlich-Nowoisky, J., Moffett, B. F., Franc, G. D., and Kreidenweis, S. M.: Sources of organic ice nucleating particles in soils, Atmos. Chem. Phys., 16, 7195–7211, https://doi.org/10.5194/acp-16-7195-2016, 2016. a, b, c
Hines, K. M., Bromwich, D. H., Silber, I., Russell, L. M., and Bai, L.: Predicting Frigid Mixed-Phase Clouds for Pristine Coastal Antarctica, J. Geophys. Res.-Atmos., 126, e2021JD035112, https://doi.org/10.1029/2021JD035112, 2021. a
Hiranuma, N., Brooks, S. D., Moffet, R. C., Glen, A., Laskin, A., Gilles, M. K., Liu, P., Macdonald, A. M., Strapp, J. W., and McFarquhar, G. M.: Chemical characterization of individual particles and residuals of cloud droplets and ice crystals collected on board research aircraft in the ISDAC 2008 study, J. Geophys. Res.-Atmos., 118, 6564–6579, https://doi.org/10.1002/jgrd.50484, 2013. a, b
Hiranuma, N., Adachi, K., Bell, D. M., Belosi, F., Beydoun, H., Bhaduri, B., Bingemer, H., Budke, C., Clemen, H.-C., Conen, F., Cory, K. M., Curtius, J., DeMott, P. J., Eppers, O., Grawe, S., Hartmann, S., Hoffmann, N., Höhler, K., Jantsch, E., Kiselev, A., Koop, T., Kulkarni, G., Mayer, A., Murakami, M., Murray, B. J., Nicosia, A., Petters, M. D., Piazza, M., Polen, M., Reicher, N., Rudich, Y., Saito, A., Santachiara, G., Schiebel, T., Schill, G. P., Schneider, J., Segev, L., Stopelli, E., Sullivan, R. C., Suski, K., Szakáll, M., Tajiri, T., Taylor, H., Tobo, Y., Ullrich, R., Weber, D., Wex, H., Whale, T. F., Whiteside, C. L., Yamashita, K., Zelenyuk, A., and Möhler, O.: A comprehensive characterization of ice nucleation by three different types of cellulose particles immersed in water, Atmos. Chem. Phys., 19, 4823–4849, https://doi.org/10.5194/acp-19-4823-2019, 2019. a
Hoose, C. and Möhler, O.: Heterogeneous ice nucleation on atmospheric aerosols: a review of results from laboratory experiments, Atmos. Chem. Phys., 12, 9817–9854, https://doi.org/10.5194/acp-12-9817-2012, 2012. a
Ickes, L., Porter, G. C. E., Wagner, R., Adams, M. P., Bierbauer, S., Bertram, A. K., Bilde, M., Christiansen, S., Ekman, A. M. L., Gorokhova, E., Höhler, K., Kiselev, A. A., Leck, C., Möhler, O., Murray, B. J., Schiebel, T., Ullrich, R., and Salter, M. E.: The ice-nucleating activity of Arctic sea surface microlayer samples and marine algal cultures, Atmos. Chem. Phys., 20, 11089–11117, https://doi.org/10.5194/acp-20-11089-2020, 2020. a
Inoue, J., Tobo, Y., Taketani, F., and Sato, K.: Oceanic Supply of Ice-Nucleating Particles and Its Effect on Ice Cloud Formation: A Case Study in the Arctic Ocean During a Cold-Air Outbreak in Early Winter, Geophys. Res. Lett., 48, e2021GL094646, https://doi.org/10.1029/2021GL094646, 2021. a
Intrieri, J. M., Shupe, M. D., Uttal, T., and McCarty, B. J.: An annual cycle of Arctic cloud characteristics observed by radar and lidar at SHEBA, J. Geophys. Res.-Oceans, 107, SHE 5-1–SHE 5-15, https://doi.org/10.1029/2000JC000423, 2002. a
Irish, V. E., Elizondo, P., Chen, J., Chou, C., Charette, J., Lizotte, M., Ladino, L. A., Wilson, T. W., Gosselin, M., Murray, B. J., Polishchuk, E., Abbatt, J. P. D., Miller, L. A., and Bertram, A. K.: Ice-nucleating particles in Canadian Arctic sea-surface microlayer and bulk seawater, Atmos. Chem. Phys., 17, 10583–10595, https://doi.org/10.5194/acp-17-10583-2017, 2017. a
Jiang, H., Cotton, W. R., Pinto, J. O., Curry, J. A., and Weissbluth, M. J.: Cloud Resolving Simulations of Mixed-Phase Arctic Stratus Observed during BASE: Sensitivity to Concentration of Ice Crystals and Large-Scale Heat and Moisture Advection, J. Atmos. Sci., 57, 2105–2117, https://doi.org/10.1175/1520-0469(2000)057<2105:CRSOMP>2.0.CO;2, 2000. a
Kanji, Z. A., Ladino, L. A., Wex, H., Boose, Y., Burkert-Kohn, M., Cziczo, D. J., and Krämer, M.: Overview of ice nucleating particles, Meteor. Mon., 58, 1.1–1.33, https://doi.org/10.1175/AMSMONOGRAPHS-D-16-0006.1, 2017. a, b, c, d
Kanji, Z. A., Welti, A., Corbin, J. C., and Mensah, A. A.: Black Carbon Particles Do Not Matter for Immersion Mode Ice Nucleation, Geophys. Res. Lett., 47, e2019GL086764, https://doi.org/10.1029/2019GL086764, 2020. a
Kodinariya, T. M. and Makwana, P. R.: Review on determining number of Cluster in K-Means Clustering, Int. J., 1, 90–95, https://www.researchgate.net/publication/313554124 (last access: 21 September 2023), 2013. a
Korolev, A., McFarquhar, G., Field, P. R., Franklin, C., Lawson, P., Wang, Z., Williams, E., Abel, S. J., Axisa, D., Borrmann, S., Crosier, J., Fugal, J., Krämer, M., Lohmann, U., Schlenczek, O., Schnaiter, M., and Wendisch, M.: Mixed-Phase Clouds: Progress and Challenges, Meteor. Mon., 58, 5.1–5.50, https://doi.org/10.1175/AMSMONOGRAPHS-D-17-0001.1, 2017. a, b
Korolev, A., Heckman, I., Wolde, M., Ackerman, A. S., Fridlind, A. M., Ladino, L. A., Lawson, R. P., Milbrandt, J., and Williams, E.: A new look at the environmental conditions favorable to secondary ice production, Atmos. Chem. Phys., 20, 1391–1429, https://doi.org/10.5194/acp-20-1391-2020, 2020. a
Kumar, A., Marcolli, C., Luo, B., and Peter, T.: Ice nucleation activity of silicates and aluminosilicates in pure water and aqueous solutions – Part 1: The K-feldspar microcline, Atmos. Chem. Phys., 18, 7057–7079, https://doi.org/10.5194/acp-18-7057-2018, 2018. a
Kupiszewski, P., Zanatta, M., Mertes, S., Vochezer, P., Lloyd, G., Schneider, J., Schenk, L., Schnaiter, M., Baltensperger, U., Weingartner, E., and Gysel, M.: Ice residual properties in mixed-phase clouds at the high-alpine Jungfraujoch site, J. Geophys. Res.-Atmos., 121, 12343–12362, https://doi.org/10.1002/2016JD024894, 2016. a
Lacher, L., Lohmann, U., Boose, Y., Zipori, A., Herrmann, E., Bukowiecki, N., Steinbacher, M., and Kanji, Z. A.: The Horizontal Ice Nucleation Chamber (HINC): INP measurements at conditions relevant for mixed-phase clouds at the High Altitude Research Station Jungfraujoch, Atmos. Chem. Phys., 17, 15199–15224, https://doi.org/10.5194/acp-17-15199-2017, 2017. a, b, c
Lacher, L., Steinbacher, M., Bukowiecki, N., Herrmann, E., Zipori, A., and Kanji, Z. A.: Impact of Air Mass Conditions and Aerosol Properties on Ice Nucleating Particle Concentrations at the High Altitude Research Station Jungfraujoch, Atmosphere, 9, 363, https://doi.org/10.3390/atmos9090363, 2018. a, b, c
Larkin, P.: Infrared and Raman spectroscopy: principles and spectral interpretation, Elsevier, ISBN 978-0-12-804162-8, 2017. a
Laskin, A., Cowin, J., and Iedema, M.: Analysis of individual environmental particles using modern methods of electron microscopy and X-ray microanalysis, J. Electron Spectrosc., 150, 260–274, https://doi.org/10.1016/j.elspec.2005.06.008, 2006. a
Lata, N. N., Zhang, B., Schum, S., Mazzoleni, L., Brimberry, R., Marcus, M. A., Cantrell, W. H., Fialho, P., Mazzoleni, C., and China, S.: Aerosol Composition, Mixing State, and Phase State of Free Tropospheric Particles and Their Role in Ice Cloud Formation, ACS Earth and Space Chemistry, 5, 3499–3510, https://doi.org/10.1021/acsearthspacechem.1c00315, 2021. a
Lewis, E. R., Lewis, R., and Schwartz, S. E.: Sea salt aerosol production: mechanisms, methods, measurements, and models, American geophysical union, vol. 152, ISBN 087590-417-3, 2004. a
Li, G., Wieder, J., Pasquier, J. T., Henneberger, J., and Kanji, Z. A.: Predicting atmospheric background number concentration of ice-nucleating particles in the Arctic, Atmos. Chem. Phys., 22, 14441–14454, https://doi.org/10.5194/acp-22-14441-2022, 2022. a, b, c, d, e, f, g, h, i
Li, G., Wilbourn, E. K., Cheng, Z., Wieder, J., Fagerson, A., Henneberger, J., Motos, G., Traversi, R., Brooks, S. D., Mazzola, M., China, S., Nenes, A., Lohmann, U., Hiranuma, N., and Kanji, Z. A.: Physicochemical characterization and source apportionment of Arctic ice-nucleating particles observed in Ny-Ålesund in autumn 2019, ETH Zurich [data set], https://doi.org/10.3929/ethz-b-000632439, 2023. a
Lohmann, U.: Possible Aerosol Effects on Ice Clouds via Contact Nucleation, J. Atmos. Sci., 59, 647–656, https://doi.org/10.1175/1520-0469(2001)059<0647:PAEOIC>2.0.CO;2, 2002. a
Lohmann, U. and Neubauer, D.: The importance of mixed-phase and ice clouds for climate sensitivity in the global aerosol–climate model ECHAM6-HAM2, Atmos. Chem. Phys., 18, 8807–8828, https://doi.org/10.5194/acp-18-8807-2018, 2018. a
Mahrt, F., Marcolli, C., David, R. O., Grönquist, P., Barthazy Meier, E. J., Lohmann, U., and Kanji, Z. A.: Ice nucleation abilities of soot particles determined with the Horizontal Ice Nucleation Chamber, Atmos. Chem. Phys., 18, 13363–13392, https://doi.org/10.5194/acp-18-13363-2018, 2018. a
Mason, R. H., Si, M., Chou, C., Irish, V. E., Dickie, R., Elizondo, P., Wong, R., Brintnell, M., Elsasser, M., Lassar, W. M., Pierce, K. M., Leaitch, W. R., MacDonald, A. M., Platt, A., Toom-Sauntry, D., Sarda-Estève, R., Schiller, C. L., Suski, K. J., Hill, T. C. J., Abbatt, J. P. D., Huffman, J. A., DeMott, P. J., and Bertram, A. K.: Size-resolved measurements of ice-nucleating particles at six locations in North America and one in Europe, Atmos. Chem. Phys., 16, 1637–1651, https://doi.org/10.5194/acp-16-1637-2016, 2016. a, b, c
Mazzola, M., Viola, A. P., Lanconelli, C., and Vitale, V.: Atmospheric observations at the Amundsen-Nobile climate change tower in Ny-Ålesund, Svalbard, Rend. Lincei, 27, 7–18, https://doi.org/10.1007/s12210-016-0540-8, 2016. a
McCluskey, C. S., Ovadnevaite, J., Rinaldi, M., Atkinson, J., Belosi, F., Ceburnis, D., Marullo, S., Hill, T. C., Lohmann, U., Kanji, Z. A., O'Dowd, C., Kreidenweis, S. M., and DeMott, P. J.: Marine and Terrestrial Organic Ice-Nucleating Particles in Pristine Marine to Continentally Influenced Northeast Atlantic Air Masses, J. Geophys. Res.-Atmos., 123, 6196–6212, https://doi.org/10.1029/2017JD028033, 2018. a
Moallemi, A., Landwehr, S., Robinson, C., Simó, R., Zamanillo, M., Chen, G., Baccarini, A., Schnaiter, M., Henning, S., Modini, R. L., Gysel-Beer, M., and Schmale, J.: Sources, Occurrence and Characteristics of Fluorescent Biological Aerosol Particles Measured Over the Pristine Southern Ocean, J. Geophys. Res.-Atmos., 126, e2021JD034811, https://doi.org/10.1029/2021JD034811, 2021. a
Morrison, H., De Boer, G., Feingold, G., Harrington, J., Shupe, M. D., and Sulia, K.: Resilience of persistent Arctic mixed-phase clouds, Nat. Geosci., 5, 11–17, https://doi.org/10.1038/ngeo1332, 2012. a
Murray, B., O'sullivan, D., Atkinson, J., and Webb, M.: Ice nucleation by particles immersed in supercooled cloud droplets, Chem. Soc. Rev., 41, 6519–6554, https://doi.org/10.1039/C2CS35200A, 2012. a, b
Murray, B. J., Carslaw, K. S., and Field, P. R.: Opinion: Cloud-phase climate feedback and the importance of ice-nucleating particles, Atmos. Chem. Phys., 21, 665–679, https://doi.org/10.5194/acp-21-665-2021, 2021. a, b
Paramonov, M., Drossaart van Dusseldorp, S., Gute, E., Abbatt, J. P. D., Heikkilä, P., Keskinen, J., Chen, X., Luoma, K., Heikkinen, L., Hao, L., Petäjä, T., and Kanji, Z. A.: Condensation/immersion mode ice-nucleating particles in a boreal environment, Atmos. Chem. Phys., 20, 6687–6706, https://doi.org/10.5194/acp-20-6687-2020, 2020. a, b
Pasquier, J. T., David, R. O., Freitas, G., Gierens, R., Gramlich, Y., Haslett, S., Li, G., Schäfer, B., Siegel, K., Wieder, J., Adachi, K., Belosi, F., Carlsen, T., Decesari, S., Ebell, K., Gilardoni, S., Gysel-Beer, M., Henneberger, J., Inoue, J., Kanji, Z. A., Koike, M., Kondo, Y., Krejci, R., Lohmann, U., Maturilli, M., Mazzolla, M., Modini, R., Mohr, C., Motos, G., Nenes, A., Nicosia, A., Ohata, S., Paglione, M., Park, S., Pileci, R. E., Ramelli, F., Rinaldi, M., Ritter, C., Sato, K., Storelvmo, T., Tobo, Y., Traversi, R., Viola, A., and Zieger, P.: The Ny-Ålesund Aerosol Cloud Experiment (NASCENT): Overview and First Results, B. Am. Meteorol. Soc., 103, E2533–E2558, https://doi.org/10.1175/BAMS-D-21-0034.1, 2022a. a, b
Pasquier, J. T., Henneberger, J., Ramelli, F., Lauber, A., David, R. O., Wieder, J., Carlsen, T., Gierens, R., Maturilli, M., and Lohmann, U.: Conditions favorable for secondary ice production in Arctic mixed-phase clouds, Atmos. Chem. Phys., 22, 15579–15601, https://doi.org/10.5194/acp-22-15579-2022, 2022b. a
Perring, A. E., Schwarz, J. P., Baumgardner, D., Hernandez, M. T., Spracklen, D. V., Heald, C. L., Gao, R. S., Kok, G., McMeeking, G. R., McQuaid, J. B., and Fahey, D. W.: Airborne observations of regional variation in fluorescent aerosol across the United States, J. Geophys. Res.-Atmos., 120, 1153–1170, https://doi.org/10.1002/2014JD022495, 2015. a, b
Petters, M. and Wright, T.: Revisiting ice nucleation from precipitation samples, Geophys. Res. Lett., 42, 8758–8766, https://doi.org/10.1002/2015GL065733, 2015. a, b, c, d, e
Pithan, F. and Mauritsen, T.: Arctic amplification dominated by temperature feedbacks in contemporary climate models, Nat. Geosci., 7, 181–184, https://doi.org/10.1038/ngeo2071, 2014. a
Pöhlker, C., Huffman, J. A., and Pöschl, U.: Autofluorescence of atmospheric bioaerosols – fluorescent biomolecules and potential interferences, Atmos. Meas. Tech., 5, 37–71, https://doi.org/10.5194/amt-5-37-2012, 2012. a
Porter, G. C. E., Adams, M. P., Brooks, I. M., Ickes, L., Karlsson, L., Leck, C., Salter, M. E., Schmale, J., Siegel, K., Sikora, S. N. F., Tarn, M. D., Vüllers, J., Wernli, H., Zieger, P., Zinke, J., and Murray, B. J.: Highly Active Ice-Nucleating Particles at the Summer North Pole, J. Geophys. Res.-Atmos., 127, e2021JD036059, https://doi.org/10.1029/2021JD036059, 2022. a
Pummer, B. G., Budke, C., Augustin-Bauditz, S., Niedermeier, D., Felgitsch, L., Kampf, C. J., Huber, R. G., Liedl, K. R., Loerting, T., Moschen, T., Schauperl, M., Tollinger, M., Morris, C. E., Wex, H., Grothe, H., Pöschl, U., Koop, T., and Fröhlich-Nowoisky, J.: Ice nucleation by water-soluble macromolecules, Atmos. Chem. Phys., 15, 4077–4091, https://doi.org/10.5194/acp-15-4077-2015, 2015. a, b
Rinaldi, M., Hiranuma, N., Santachiara, G., Mazzola, M., Mansour, K., Paglione, M., Rodriguez, C. A., Traversi, R., Becagli, S., Cappelletti, D., and Belosi, F.: Ice-nucleating particle concentration measurements from Ny-Ålesund during the Arctic spring–summer in 2018, Atmos. Chem. Phys., 21, 14725–14748, https://doi.org/10.5194/acp-21-14725-2021, 2021. a, b, c, d
Rolph, G., Stein, A., and Stunder, B.: Real-time Environmental Applications and Display sYstem: READY, Environ. Model. Softw., 95, 210–228, https://doi.org/10.1016/j.envsoft.2017.06.025, 2017. a
Sanchez-Marroquin, A., Arnalds, O., Baustian-Dorsi, K. J., Browse, J., Dagsson-Waldhauserova, P., Harrison, A. D., Maters, E. C., Pringle, K. J., Vergara-Temprado, J., Burke, I. T., McQuaid, J. B., Carslaw, K. S., and Murray, B. J.: Iceland is an episodic source of atmospheric ice-nucleating particles relevant for mixed-phase clouds, Sci. Adv., 6, eaba8137, https://doi.org/10.1126/sciadv.aba8137, 2020. a
Šantl Temkiv, T., Lange, R., Beddows, D., Rauter, U., Pilgaard, S., Dall'Osto, M., Gunde-Cimerman, N., Massling, A., and Wex, H.: Biogenic sources of ice nucleating particles at the high Arctic site villum research station, Environ. Sci. Technol., 53, 10580–10590, https://doi.org/10.1021/acs.est.9b00991, 2019. a
Savage, N. J., Krentz, C. E., Könemann, T., Han, T. T., Mainelis, G., Pöhlker, C., and Huffman, J. A.: Systematic characterization and fluorescence threshold strategies for the wideband integrated bioaerosol sensor (WIBS) using size-resolved biological and interfering particles, Atmos. Meas. Tech., 10, 4279–4302, https://doi.org/10.5194/amt-10-4279-2017, 2017. a, b, c
Schmale, J., Zieger, P., and Ekman, A. M.: Aerosols in current and future Arctic climate, Nat. Clim. Change, 11, 95–105, https://doi.org/10.1038/s41558-020-00969-5, 2021. a, b, c
Schneider, J., Höhler, K., Heikkilä, P., Keskinen, J., Bertozzi, B., Bogert, P., Schorr, T., Umo, N. S., Vogel, F., Brasseur, Z., Wu, Y., Hakala, S., Duplissy, J., Moisseev, D., Kulmala, M., Adams, M. P., Murray, B. J., Korhonen, K., Hao, L., Thomson, E. S., Castarède, D., Leisner, T., Petäjä, T., and Möhler, O.: The seasonal cycle of ice-nucleating particles linked to the abundance of biogenic aerosol in boreal forests, Atmos. Chem. Phys., 21, 3899–3918, https://doi.org/10.5194/acp-21-3899-2021, 2021. a
Schrod, J., Thomson, E. S., Weber, D., Kossmann, J., Pöhlker, C., Saturno, J., Ditas, F., Artaxo, P., Clouard, V., Saurel, J.-M., Ebert, M., Curtius, J., and Bingemer, H. G.: Long-term deposition and condensation ice-nucleating particle measurements from four stations across the globe, Atmos. Chem. Phys., 20, 15983–16006, https://doi.org/10.5194/acp-20-15983-2020, 2020. a, b
Screen, J. A. and Simmonds, I.: The central role of diminishing sea ice in recent Arctic temperature amplification, Nature, 464, 1334–1337, https://doi.org/10.1038/nature09051, 2010. a
Seifried, T. M., Reyzek, F., Bieber, P., and Grothe, H.: Scots Pines (Pinus sylvestris) as Sources of Biological Ice-Nucleating Macromolecules (INMs), Atmosphere, 14, 266, https://doi.org/10.3390/atmos14020266, 2023. a
Serreze, M. C. and Barry, R. G.: Processes and impacts of Arctic amplification: A research synthesis, Global Planet. Change, 77, 85–96, https://doi.org/10.1016/j.gloplacha.2011.03.004, 2011. a
Serreze, M. C., Holland, M. M., and Stroeve, J.: Perspectives on the Arctic's Shrinking Sea-Ice Cover, Science, 315, 1533–1536, https://doi.org/10.1126/science.1139426, 2007. a
Sinha, P. R., Kondo, Y., Koike, M., Ogren, J. A., Jefferson, A., Barrett, T. E., Sheesley, R. J., Ohata, S., Moteki, N., Coe, H., Liu, D., Irwin, M., Tunved, P., Quinn, P. K., and Zhao, Y.: Evaluation of ground-based black carbon measurements by filter-based photometers at two Arctic sites, J. Geophys. Res.-Atmos., 122, 3544–3572, https://doi.org/10.1002/2016JD025843, 2017. a
Solomon, A., de Boer, G., Creamean, J. M., McComiskey, A., Shupe, M. D., Maahn, M., and Cox, C.: The relative impact of cloud condensation nuclei and ice nucleating particle concentrations on phase partitioning in Arctic mixed-phase stratocumulus clouds, Atmos. Chem. Phys., 18, 17047–17059, https://doi.org/10.5194/acp-18-17047-2018, 2018. a
Spielhagen, R. F., Werner, K., Sørensen, S. A., Zamelczyk, K., Kandiano, E., Budeus, G., Husum, K., Marchitto, T. M., and Hald, M.: Enhanced Modern Heat Transfer to the Arctic by Warm Atlantic Water, Science, 331, 450–453, https://doi.org/10.1126/science.1197397, 2011. a
Stein, A. F., Draxler, R. R., Rolph, G. D., Stunder, B. J. B., Cohen, M. D., and Ngan, F.: NOAA's HYSPLIT Atmospheric Transport and Dispersion Modeling System, B. Am. Meteorol. Soc., 96, 2059–2077, https://doi.org/10.1175/BAMS-D-14-00110.1, 2015. a
Storelvmo, T.: Aerosol Effects on Climate via Mixed-Phase and Ice Clouds, Annu. Rev. Earth Pl. Sc., 45, 199–222, https://doi.org/10.1146/annurev-earth-060115-012240, 2017. a
Stroeve, J. C., Serreze, M. C., Holland, M. M., Kay, J. E., Malanik, J., and Barrett, A. P.: The Arctic's rapidly shrinking sea ice cover: a research synthesis, Climatic Change, 110, 1005–1027, https://doi.org/10.1007/s10584-011-0101-1, 2012. a
Tan, I. and Storelvmo, T.: Evidence of strong contributions from mixed-phase clouds to Arctic climate change, Geophys. Res. Lett., 46, 2894–2902, https://doi.org/10.1029/2018GL081871, 2019. a
Thomas, D. and Charvet, A.: An Introduction to Aerosols, in: Aerosol Filtration, Elsevier, 1–30, https://doi.org/10.1016/B978-1-78548-215-1.50001-9, 2017. a
Tobo, Y.: An improved approach for measuring immersion freezing in large droplets over a wide temperature range, Sci. Rep., 6, 1–9, https://doi.org/10.1038/srep32930, 2016. a
Tobo, Y., Adachi, K., DeMott, P. J., Hill, T. C., Hamilton, D. S., Mahowald, N. M., Nagatsuka, N., Ohata, S., Uetake, J., Kondo, Y., and Koike, M.: Glacially sourced dust as a potentially significant source of ice nucleating particles, Nat. Geosci., 12, 253–258, https://doi.org/10.1038/s41561-019-0314-x, 2019. a, b, c, d
Toprak, E. and Schnaiter, M.: Fluorescent biological aerosol particles measured with the Waveband Integrated Bioaerosol Sensor WIBS-4: laboratory tests combined with a one year field study, Atmos. Chem. Phys., 13, 225–243, https://doi.org/10.5194/acp-13-225-2013, 2013. a, b, c, d
Vali, G.: Quantitative Evaluation of Experimental Results an the Heterogeneous Freezing Nucleation of Supercooled Liquids, J. Atmos. Sci., 28, 402–409, https://doi.org/10.1175/1520-0469(1971)028<0402:QEOERA>2.0.CO;2, 1971. a
Vali, G.: Revisiting the differential freezing nucleus spectra derived from drop-freezing experiments: methods of calculation, applications, and confidence limits, Atmos. Meas. Tech., 12, 1219–1231, https://doi.org/10.5194/amt-12-1219-2019, 2019. a, b
Vali, G., DeMott, P. J., Möhler, O., and Whale, T. F.: Technical Note: A proposal for ice nucleation terminology, Atmos. Chem. Phys., 15, 10263–10270, https://doi.org/10.5194/acp-15-10263-2015, 2015. a, b
Vavrus, S.: The Impact of Cloud Feedbacks on Arctic Climate under Greenhouse Forcing, J. Climate, 17, 603–615, https://doi.org/10.1175/1520-0442(2004)017<0603:TIOCFO>2.0.CO;2, 2004. a
Vepuri, H. S. K., Rodriguez, C. A., Georgakopoulos, D. G., Hume, D., Webb, J., Mayer, G. D., and Hiranuma, N.: Ice-nucleating particles in precipitation samples from the Texas Panhandle, Atmos. Chem. Phys., 21, 4503–4520, https://doi.org/10.5194/acp-21-4503-2021, 2021. a
Vergara-Temprado, J., Murray, B. J., Wilson, T. W., O'Sullivan, D., Browse, J., Pringle, K. J., Ardon-Dryer, K., Bertram, A. K., Burrows, S. M., Ceburnis, D., DeMott, P. J., Mason, R. H., O'Dowd, C. D., Rinaldi, M., and Carslaw, K. S.: Contribution of feldspar and marine organic aerosols to global ice nucleating particle concentrations, Atmos. Chem. Phys., 17, 3637–3658, https://doi.org/10.5194/acp-17-3637-2017, 2017. a
Vergara-Temprado, J., Miltenberger, A. K., Furtado, K., Grosvenor, D. P., Shipway, B. J., Hill, A. A., Wilkinson, J. M., Field, P. R., Murray, B. J., and Carslaw, K. S.: Strong control of Southern Ocean cloud reflectivity by ice-nucleating particles, P. Natl. Acad. Sci. USA, 115, 2687–2692, https://doi.org/10.1073/pnas.1721627115, 2018. a
Vignon, E., Alexander, S. P., DeMott, P. J., Sotiropoulou, G., Gerber, F., Hill, T. C. J., Marchand, R., Nenes, A., and Berne, A.: Challenging and Improving the Simulation of Mid-Level Mixed-Phase Clouds Over the High-Latitude Southern Ocean, J. Geophys. Res.-Atmos., 126, e2020JD033490, https://doi.org/10.1029/2020JD033490, 2021. a
Wendisch, M., Macke, A., Ehrlich, A., Lüpkes, C., Mech, M., Chechin, D., Dethloff, K., Velasco, C. B., Bozem, H., Brückner, M., Clemen, H.-C., Crewell, S., Donth, T., Dupuy, R., Ebell, K., Egerer, U., Engelmann, R., Engler, C., Eppers, O., Gehrmann, M., Gong, X., Gottschalk, M., Gourbeyre, C., Griesche, H., Hartmann, J., Hartmann, M., Heinold, B., Herber, A., Herrmann, H., Heygster, G., Hoor, P., Jafariserajehlou, S., Jäkel, E., Järvinen, E., Jourdan, O., Kästner, U., Kecorius, S., Knudsen, E. M., Köllner, F., Kretzschmar, J., Lelli, L., Leroy, D., Maturilli, M., Mei, L., Mertes, S., Mioche, G., Neuber, R., Nicolaus, M., Nomokonova, T., Notholt, J., Palm, M., van Pinxteren, M., Quaas, J., Richter, P., Ruiz-Donoso, E., Schäfer, M., Schmieder, K., Schnaiter, M., Schneider, J., Schwarzenböck, A., Seifert, P., Shupe, M. D., Siebert, H., Spreen, G., Stapf, J., Stratmann, F., Vogl, T., Welti, A., Wex, H., Wiedensohler, A., Zanatta, M., and Zeppenfeld, S.: The Arctic Cloud Puzzle: Using ACLOUD/PASCAL Multiplatform Observations to Unravel the Role of Clouds and Aerosol Particles in Arctic Amplification, B. Am. Meteorol. Soc., 100, 841–871, https://doi.org/10.1175/BAMS-D-18-0072.1, 2019. a
Westbrook, C. D. and Illingworth, A. J.: The formation of ice in a long-lived supercooled layer cloud, Q. J. Roy. Meteor. Soc., 139, 2209–2221, https://doi.org/10.1002/qj.2096, 2013. a
Wex, H., Huang, L., Zhang, W., Hung, H., Traversi, R., Becagli, S., Sheesley, R. J., Moffett, C. E., Barrett, T. E., Bossi, R., Skov, H., Hünerbein, A., Lubitz, J., Löffler, M., Linke, O., Hartmann, M., Herenz, P., and Stratmann, F.: Annual variability of ice-nucleating particle concentrations at different Arctic locations, Atmos. Chem. Phys., 19, 5293–5311, https://doi.org/10.5194/acp-19-5293-2019, 2019. a, b, c
Wieder, J., Mignani, C., Schär, M., Roth, L., Sprenger, M., Henneberger, J., Lohmann, U., Brunner, C., and Kanji, Z. A.: Unveiling atmospheric transport and mixing mechanisms of ice-nucleating particles over the Alps, Atmos. Chem. Phys., 22, 3111–3130, https://doi.org/10.5194/acp-22-3111-2022, 2022. a
Wilson, Theodore W., L. L. A., Alpert, P. A., Breckels, M. N., Brooks, I. M., Browse, J., Burrows, S. M., Carslaw, K. S., Huffman, J. A., Judd, C., Kilthau, W. P., Mason, R. H., McFiggans, G., Miller, L. A., Nájera, J. J., Polishchuk, E., Rae, S., Schiller, C. L., Si, M., Temprado, J. V., Whale, T. F., Wong, J. P. S., Wurl, O., Yakobi-Hancock, J. D., Abbatt, J. P. D., Aller, J. Y., Bertram, A. K., Knopf, D. A., and Murray, B. J.: A marine biogenic source of atmospheric ice-nucleating particles, Nature, 525, 234–238, https://doi.org/10.1038/nature14986, 2015. a
- Abstract
- Introduction
- Methods
- Results and discussion
- Summary and conclusions
- Appendix A: Assembly of frozen fractions with background and aerosol samples
- Appendix B: Particle size distribution of case studies
- Appendix C: SEM image of selected impinger samples
- Appendix D: Atomic fraction for selected samples
- Data availability
- Author contributions
- Competing interests
- Disclaimer
- Acknowledgements
- Financial support
- Review statement
- References