the Creative Commons Attribution 4.0 License.
the Creative Commons Attribution 4.0 License.
 | 19 Sep 2023
Quantifying SAGE II (1984–2005) and SAGE III/ISS (2017–2022) observations of smoke in the stratosphere
Travis Knepp
Using a common analysis approach for data sets produced by the Stratospheric Aerosol and Gas Experiment instruments SAGE II and SAGE III/ISS, we identify 13 likely smoke events based on enhancements in the aerosol extinction coefficient. Nine of these are sufficiently large compared to ambient aerosol levels to compute mean mid-latitude 1020 nm optical depth enhancements that range from 0.0005 to 0.011. We also note that, for large events, the 525 to 1020 nm aerosol extinction coefficient ratio asymptotes at a high extinction coefficient to values between 2 and 3, suggesting that the aerosol radius is relatively small (< 0.3 µm) and relatively consistent from event to event. Most of these events are primarily confined to the lower stratosphere and rarely can be observed above 20 km. We also infer an increase in the frequency of smoke events between the SAGE II (1984–1991, 1996–2005) and SAGE III/ISS (2017-present) periods by almost a factor of 2 and also note that the two largest events occur in the latter data set. However, given the low frequencies overall, we are not confident that the differences can be attributed to changes between the two periods. We also attempt to disentangle the mixing of aerosol in the Northern Hemisphere summer of 1991 from a pyrocumulus event (Baie-Comeau, Quebec) and Mt. Pinatubo and conclude that, while there is evidence for smoke in the lower stratosphere, virtually all of the enhanced aerosol observations in the northern mid-latitudes in the summer of 1991 are associated with the Mt. Pinatubo eruption.
- Article
(11857 KB) - Full-text XML
- BibTeX
- EndNote


The strongest factors to modulate stratospheric aerosol levels are among some of the most spectacular processes that our planet has to offer. Chief among these are volcanic eruptions like the 1991 Mt. Pinatubo eruption, which virtually instantly changed the stratospheric aerosol loading by a factor approaching 100. Other events like the recent Hunga Tonga eruption, while considerably smaller than Mt. Pinatubo's eruption, also strongly modulate stratospheric aerosol levels (Khaykin et al., 2022). While volcanism is the primary driving factor behind long-term aerosol levels and their variability, other factors are also relevant. The non-volcanic background, while perhaps not the definition of spectacular, is mostly driven by the emission of OCS and other sulfur-bearing gas species at the sea or land surface that eventually find their way to the stratosphere and are modified into sulfuric acid aerosol (Kremser et al., 2016). The role of organic aerosol particularly in the lower tropical stratosphere is known but not fully quantified (Murphy et al., 2014). It has also become more recognized that stratospheric aerosol levels particularly in the extended relatively clean period of the last few decades can be significantly modulated by forest and brushfires (Fromm et al., 2010) through (spectacular) cumulus flammagenitus (https://cloudatlas.wmo.int/en/flammagenitus.html, last access: 28 August 2023) that are more commonly called pyrocumulonimbus or pyrocumulus), pyrotornadogenesis, and similar processes. In fact, the intense Australian brushfires in the austral summer of 2019 and 2020 (or simply 2019/2020) had an impact on stratospheric aerosol levels on par with the moderate Raikoke eruption of 2019 and clearly enhanced stratospheric aerosol extinction coefficient in the Southern Hemisphere for well over a year (Kloss et al., 2021). The two largest smoke intrusions into the stratosphere are these Australian fires and a pyrocumuluonimbus event associated with forest fires in British Columbia Canada in August 2017. Both of these events have occurred relatively recently, and this raises the possibility that the impact of intense fire events on the stratosphere has changed or is changing possibly as a part of processes associated with ongoing climate change (Canadell et al., 2021). Herein, we will look at space-based observations of smoke events that span from 1984 through the present. Each event will be characterized based on the observations provided by the instruments rather than by indirectly inferred parameters. Based on these observations, we will discuss differences observed across this period and the ability to infer changes in intensity and/or frequency of these events using these data. Whatever the source, we refer to aerosol associated with fire-related processes as “smoke” without specific assumptions regarding composition, recognizing that such aerosol are likely composed of black and/or brown carbon plus additional materials produced by biomass consumption in a potentially complicated composite aerosol.
Since the late 1970s, a number of space-based instruments have made stratospheric aerosol observations (e.g., Kremser et al., 2016). These instruments make their measurements using diverse methodologies including solar occultation, limb-scattering, and nadir-viewing lidar. Prior to 2002, virtually all of the space-based observations of stratospheric aerosol were based on solar occultation. Among these, the Stratospheric Aerosol and Gas Experiment, or SAGE, series of instruments have formed a key element of the long-term stratospheric aerosol record. There was a break in the solar occultation record following the end of the SAGE II record in 2005 but resumed in 2017 with the SAGE III mission aboard the International Space Station (ISS). After 2002, the Optical Spectrograph and Infra-Red Imaging System (OSIRIS) instrument (Rieger et al., 2019) begins a very long, and continuing, record of higher-frequency limb-scattering observations and, after 2012, similar observations by the Ozone Mapping and Profiler Suite (OMPS) (Taha et al., 2021). Nadir-viewing lidar observations of stratospheric aerosol began in 2006 with the Cloud-Aerosol Lidar with Orthogonal Polarization (CALIOP) instrument that is a part of the Cloud-Aerosol Lidar and Infrared Pathfinder Satellite Observation (CALIPSO) spacecraft (Tackett et al., 2018). Other space-based measurements like the Halogen Occultation Experiment (HALOE), SCanning Imaging Absorption spectroMeter for Atmospheric CHartographY (SCIAMACHY), and others can potentially provide relevant contributions to understanding smoke in the stratosphere.
We focus on the records from the Stratospheric Aerosol and Gas Experiment (SAGE II), which flew aboard the Earth Radiation Budget Satellite (ERBS), spanning 1984 to 2005, and SAGE III/ISS with data since 2017. We focus on these records since they are very compatible data sets that produce aerosol extinction coefficient profiles at essentially the same wavelengths using the same measurement approach and very similar processing algorithms to produce near-global observations. Issues related to uncertainties in characterizing the scattering processes add potential systematic bias to the records from OSIRIS, OMPS, and CALIPSO and make intercomparisons of these records with SAGE and each other more difficult (Kovilakam et al., 2023; Bourassa et al., 2023), and inclusion of these data sets is deferred. The SAGE instruments are key sources of data to the Global Space-based Stratospheric Aerosol Climatology (GloSSAC), and a key outcome of this study is to infer the impact of smoke on this climate data record. SAGE II has been the primary data source for GloSSAC and its predecessors (e.g., SPARC's Assessment of Stratospheric Aerosol Properties) and remains the governing data set against which other contributors are measured. The consistency between SAGE II and SAGE III/ISS can only be indirectly inferred (Kovilakam et al., 2020); however, based on GloSSAC testing, the two data sets are considered to be highly consistent and are treated as such herein. Given this measurement similarity, we focus on data from these two instruments in this study. The goal of this discussion is twofold. One is to assess the frequency, magnitude, and persistence of smoke events in these two data sets and how they impact the GloSSAC climatology. Secondly, to the degree possible, we will infer the differences in the smoke events for the observational times periods covered by SAGE II and SAGE III/ISS. When discussing the observations in general as opposed to those by a specific instrument, we refer to “SAGE” observations for simplicity.
We identify likely smoke events in both data sets as positive outliers in aerosol extinction coefficient and ratio from the broad family of observations as a function of time and latitude. While outliers are a part of both records, we do not attempt to associate every isolated positive outlier with its source since we are primarily interested in events which significantly impact the stratospheric aerosol record at GloSSAC timescales (monthly). While small volcanic and smoke events produce similar perturbations in a single wavelength record, we also demonstrate that for the smoke events discussed below, it is straightforward to distinguish between episodic clusters associated with smoke events and volcanic events in these data sets based on their spectral characteristics. All of the likely smoke cluster events in these data sets can be tied to known large-fire events. While we make no effort to infer the composition of these perturbations, the measured optical properties found for these smoke-derived perturbations are generally consistent with each other and not fresh small to moderate volcanic events. We will also discuss in some detail an outlier event from the summer of 1991 that has been associated with both a volcanic source (Thomason, 1992) and a pyrocumulus event (Fromm et al., 2010). In some cases, while the presence of smoke in the lowermost stratosphere may be inferred from the SAGE observations, not all are considered in depth. Some of these occur in only a handful of observations such as the Conibear Lake fire of 2003, and it would be difficult to conclude anything about their impact, which ultimately must be small. Others occur at altitudes essentially at the tropopause, particularly the Yellowstone fires of 1988, and we are not able to perform a meaningful stratospheric analysis. We note these events but otherwise do not discuss them.
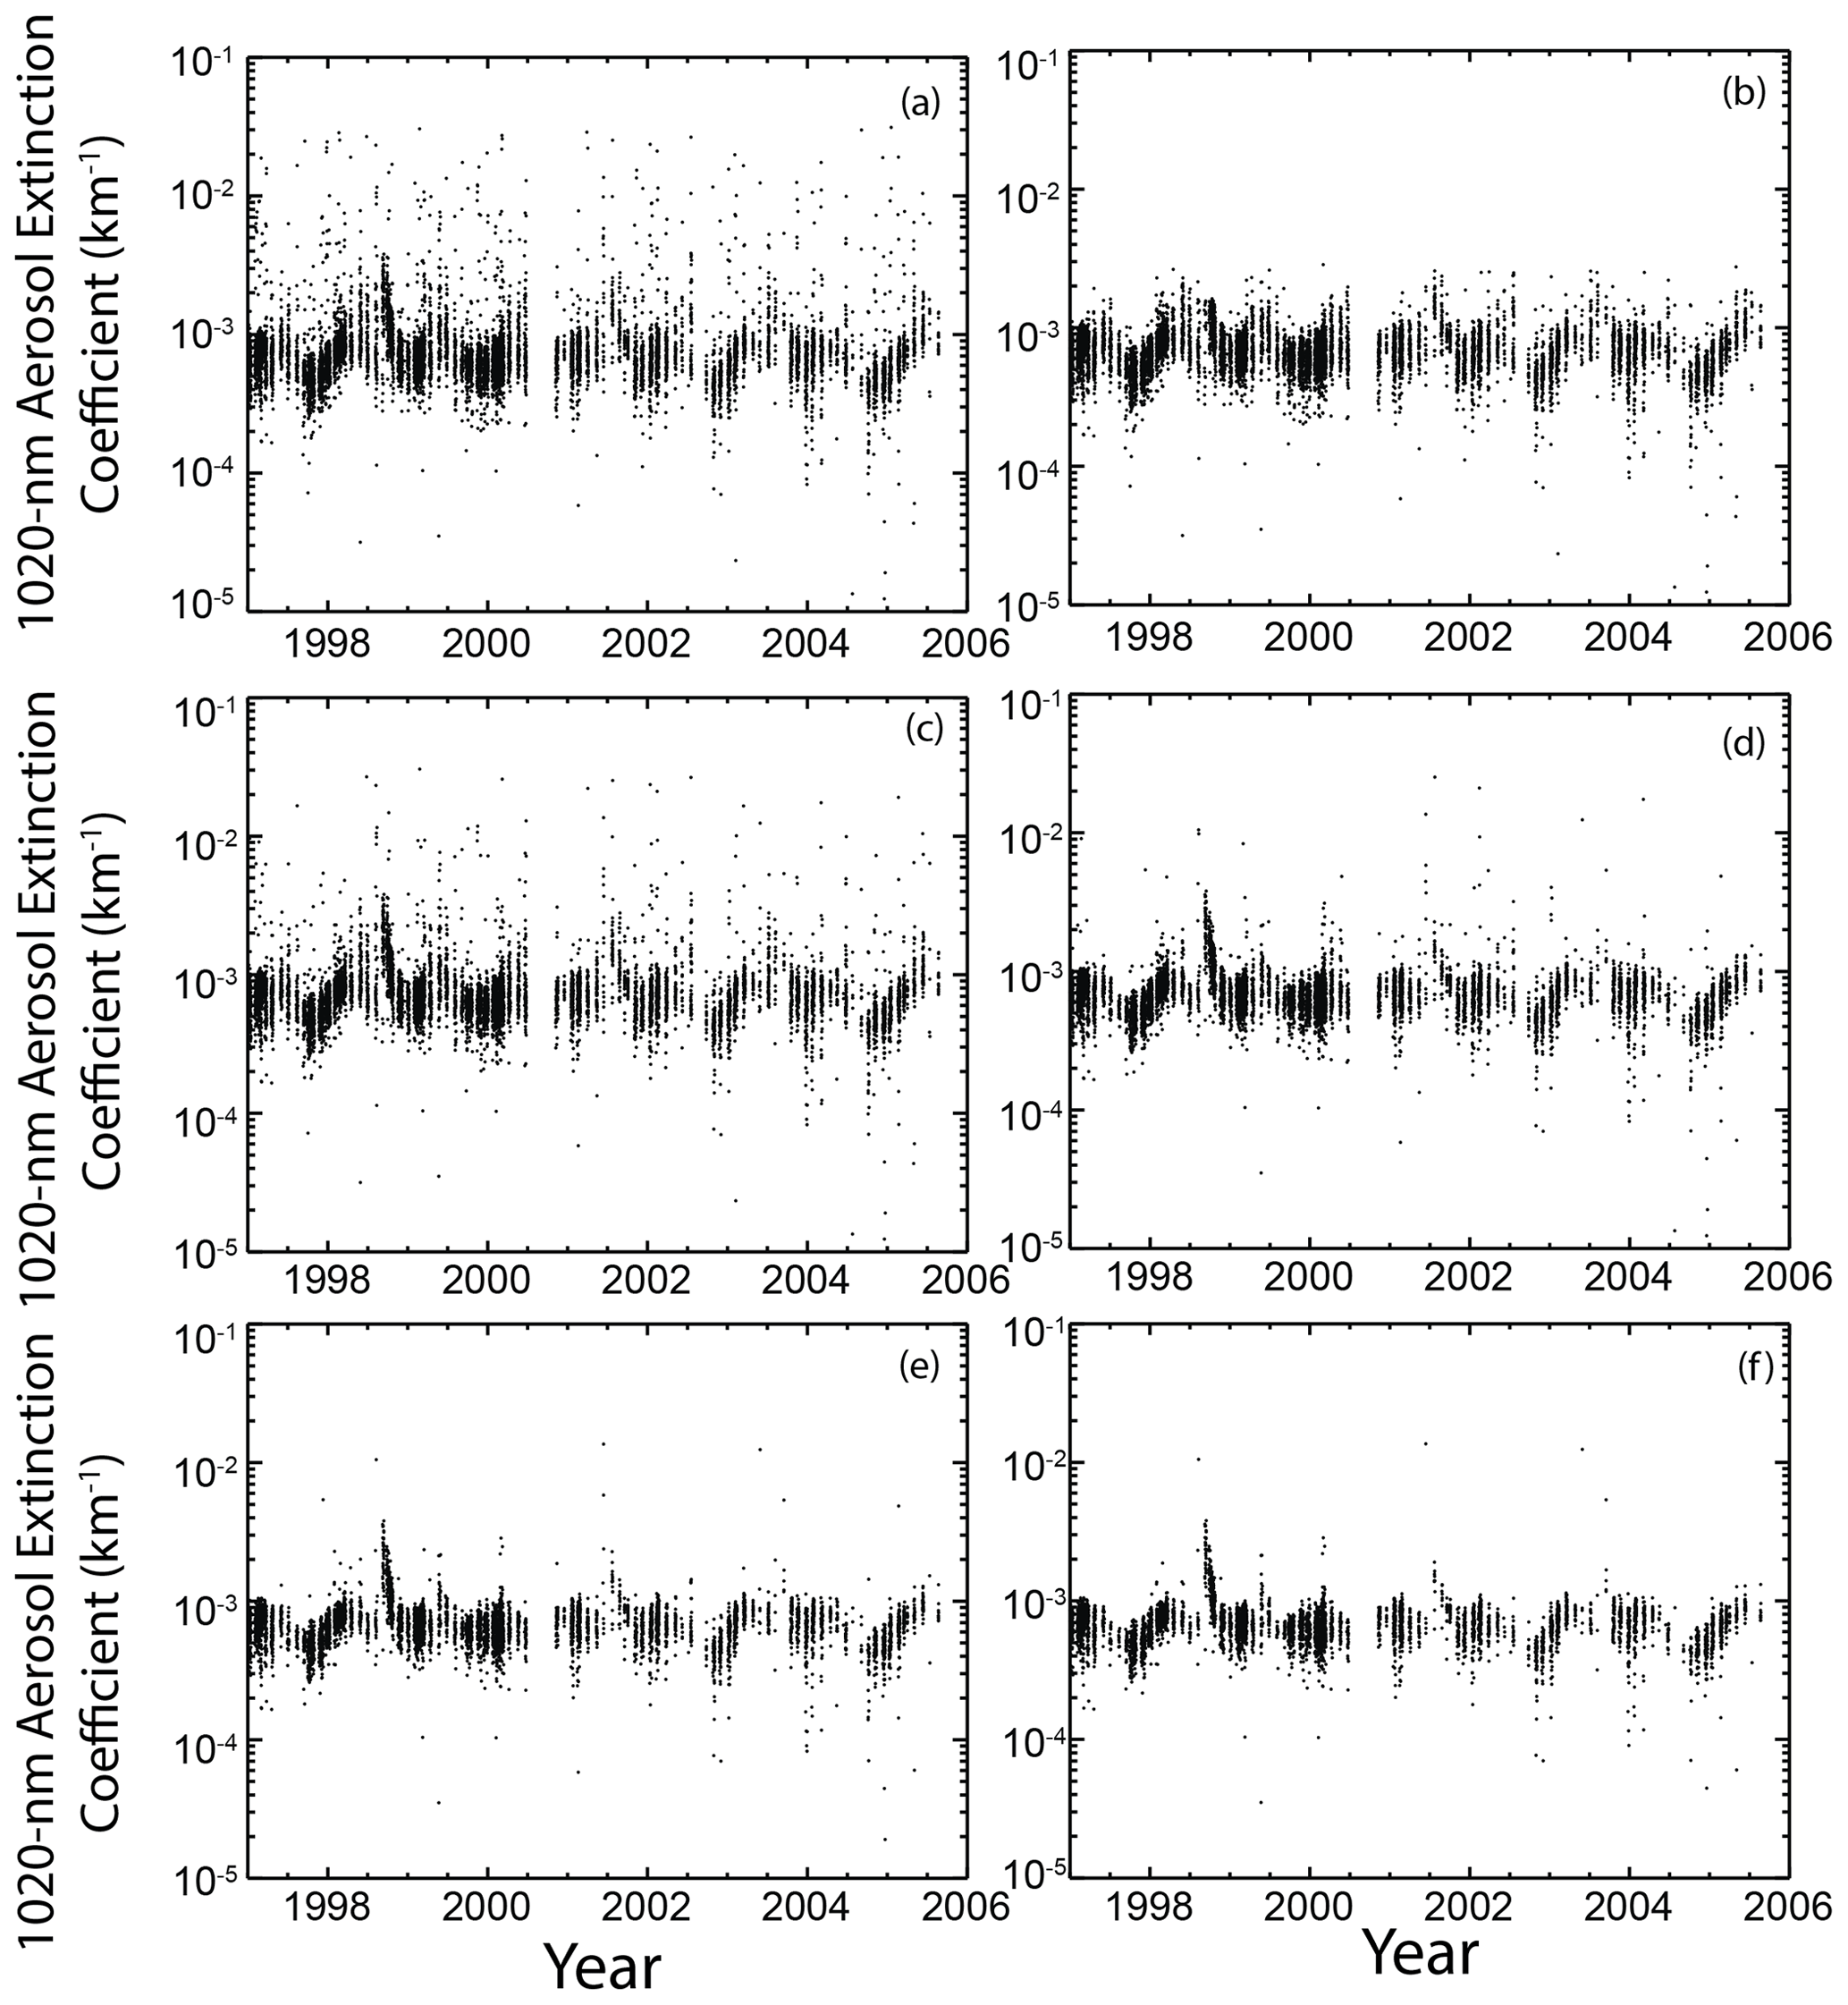
Figure 1The SAGE II 1020 nm extinction coefficient for measurements between 20 and 60∘ N between 1 January 1997 and the end of the mission in August 2005 at 11 km. Frame (a) shows all observations above the MERRA-derived tropopause. Frame (b) shows the same data but “cloud-cleared” using the GloSSAC process. Frames (c)–(f) show the same data as frame (a) but only when 11 km is above the tropopause +0.5 km (c), above the tropopause +1.0 km (d), above the tropopause +1.5 km (e), and above the tropopause +2.0 km (f).
Figure 1 shows the 1020 nm extinction coefficient for all SAGE II measurements between 20 and 60∘ N after 1 January 1997 at 11 km with all data above the Modern-Era Retrospective analysis for Research and Applications (MERRA)-derived tropopause (Fig. 1a), the same data but “cloud-cleared” using the GloSSAC process (Fig. 1b), the same data as (Fig. 1a) above the tropopause +0.5 km (Fig. 1c), above the tropopause +1.0 km (Fig. 1d), above the tropopause +1.5 km (Fig. 1e), and above the tropopause +2.0 km (Fig. 1f). Given the discrete altitude grid of the measurements, data in frames Fig. 1a and b are between 0 and 0.5 km above the tropopause, and frames Fig. 1c through f are similarly affected. The frequency of observations is driven by the sampling characteristic of solar occultation instruments in mid-inclination orbits like both SAGE II and SAGE III/ISS. As can be readily seen in the figure, following an instrument fault in August 2000, there is a 50 % reduction in data taken through the end of the SAGE II mission in August 2005.
In general, all frames in Fig. 1 show a relatively consistent pattern throughout the period with an annual cycle, with a maximum in summer. However, for the most inclusive frames such as Fig. 1a, there is a patina of positive outliers throughout the record. Most of these data points are also associated with decreases in the 525 to 1020 nm extinction coefficient that suggest an increase in particle size of optically effective particles assuming non-absorbing aerosol such as sulfuric acid–water mixtures. In the absence of information suggesting otherwise, high extinction and low ratio data points are most often interpreted as “cloud” or aerosol–cloud mixtures (e.g., Thomason and Vernier, 2013). This observation forms the basis for essentially all mechanisms to identify and remove the effects of clouds on the aerosol observations including for such data sets as GloSSAC (Kovilakam et al., 2023). Despite numerous positive outliers in Fig. 1a, a cluster of enhanced aerosol extinction coefficient values in mid-1998 is clearly seen in this data set in the time frame where material associated with the Norman Wells (NT, Canada) pyrocumulus on 3–4 August 1998 has previously been noted in SAGE II data (Fromm et al., 2000). While the individual observations are similar to aerosol–cloud mixtures routinely observed by SAGE instruments, the extinction coefficient enhancement, while variable, is observed with a high frequency in a narrow temporal window that is inconsistent with the relatively isolated way cloud-affected measurements appear in the rest of this figure and SAGE data in general. Isolating this and other similar clusters is a key part of this analysis.
The data in Fig. 1a are restricted to observations above the tropopause to minimize the impact of cloud presence. However, the tropopause height is from MERRA for SAGE II and subject to uncertainties as much as the SAGE II observations. In addition, SAGE II has a finite vertical field of view (0.5 km), and that along with the data accumulation process used in data production further produces a vertical resolution of about 1 km. As a result, it is not surprising that the presence of cloud is occasionally inferred for observations that nominally represent the lowermost stratosphere. In many applications such as GloSSAC, removing the effects of cloud presence is a critical part of their analysis. The GloSSAC aerosol–cloud mixture identification method (Thomason et al., 2018) is based on both the magnitude of the extinction coefficient (at 1020 nm) and the 525 to 1020 nm extinction coefficient ratio. Using this procedure, Fig. 1b shows the same collection of 1020 nm extinction coefficient observations as in Fig. 1a with all identified cloud–aerosol mixtures observations removed. As can be seen, this process does a reasonable job at removing most, but not all, isolated enhanced aerosol extinction coefficient values in this record. However, we also note that the performance around the elevated extinction coefficient cluster in mid-1998 is concerning as that cluster, as depicted in Fig. 1a, clearly extends to an extinction above 0.003 km−1 but is truncated by the cloud-clearing process for extinction coefficient values at about 0.002 km−1 as shown in Fig. 1b. As we will show below, this truncation occurs because these data points also show a decrease in the aerosol extinction coefficient ratio, and thus their behavior mimics behavior normally associated with aerosol–cloud mixtures and is identified as such by the cloud-clearing process. This truncation of the enhanced aerosol cluster suggests that GloSSAC does not currently do a good job depicting this event in the data set, and some modification of the cloud detection scheme is warranted to properly account for these perturbations.
Since we are focusing on identifying outlier events in the lower stratosphere, clearly employing a cloud identification process that removes a significant fraction of the target events is not appropriate, and an alternative method to retain this sort of enhancement that also limits the influence of clouds on the data analysis is required. We use a straightforward tropopause-based altitude filter that eliminates observations close to but above the reported tropopause altitude. In Fig. 1c to f, each step limiting data's proximity to the tropopause decreases the overall amount of data but clearly reduces the frequency of the aerosol–cloud mixture patina with each step through at least +1.5 km (Fig. 1e). In addition, while there is some impact on the number of data points in the enhanced cluster in mid-1998, it is substantially less affected than using the traditional cloud-clearing approach, and the highest extinctions remain over 0.003 km−1. Furthermore, in Fig. 1e and f, an additional but much weaker cluster of enhanced extinction coefficient values is now more clearly seen in mid-2001, which will be discussed below, as are some small clusters of enhanced aerosol extinction values that may be related to the eruptions of Korovin in May and June 1998, Shishaldin in April 1999 (which is clearer at other altitudes), and Hekla in February 2000 (Pieri et al., 2001). While tropopause-limited filtering works well at all altitudes, a downside of this approach is that inevitably some stratospheric measurements, including outlier measurements, either volcanic or smoke, are eliminated from further consideration. This may impact the inferred frequency of outlier observations and the estimation of the optical impact of all lower stratospheric outlier events due to the proximity of the tropopause. Nonetheless, this is the most straightforward and effective mechanism we have found that minimizes the influence of clouds in the analysis without strongly impacting the frequency and strength of outlier events. Thus, we use tropopause+1.5 km to filter data used below. With this filter, we find that we have sufficient data to produce a meaningful analysis above between 9.5 and 12 km depending on time of year and the overall sampling frequency provided by the instruments. We note that some instances of isolated high aerosol extinction coefficients remain in the data set even after this filtering. While these observations are interesting, we will not consider these aerosol observations since they occur at a low frequency and ultimately have only a marginal impact on the data record. We will focus on positive outlier clusters (multiple observations) spanning multiple altitude levels.
Using data with the tropopause-based altitude filter (TBA), we look at individual years (or 2 years in some cases) for relatively small, transient outlier events (lasting months as opposed to years), in northern and southern mid-latitudes. We focus on time periods where potential outlier events appear in analyses like the one shown in Fig. 1e (with TBA), which we produced for altitudes below 30 km in northern and southern mid-latitudes in three time periods (1985–1991, 1996–2005, and 2017–2022). Rather than show all of the individual figures, we show the presence of these outliers in a different way that we describe below. While our primary interest is to characterize outlier events associated with pyrocumulonimbus and other smoke intrusions into the stratosphere, we also note some small volcanic events and, in one case, an unusual polar stratospheric cloud event whose presence in the SAGE data sets is not generally noted in the literature. Conversely, we purposely neglect well-known, larger volcanic events, shown in Table 1, in the SAGE II and III records as not relevant to the current topic. While we have examined the entire SAGE II record for evidence of outliers, we have not done detailed analyses, nor will we further discuss the period from 1992 to 1995 since the elevated aerosol levels could easily mask the presence of weak outlier events by volcanism or fires. The British Columbia pyrocumulus of 2017 and Australian wildfires of 2019/2020, which stretch the definition of small, transient events, are included in our analysis primarily since the intended culmination of this work is to place them in the context of other, smaller smoke events observed by SAGE II and SAGE III using the same analytic approach.
Table 1Significant volcanic aerosol events in the stratospheric component of the SAGE II and SAGE III/ISS records.
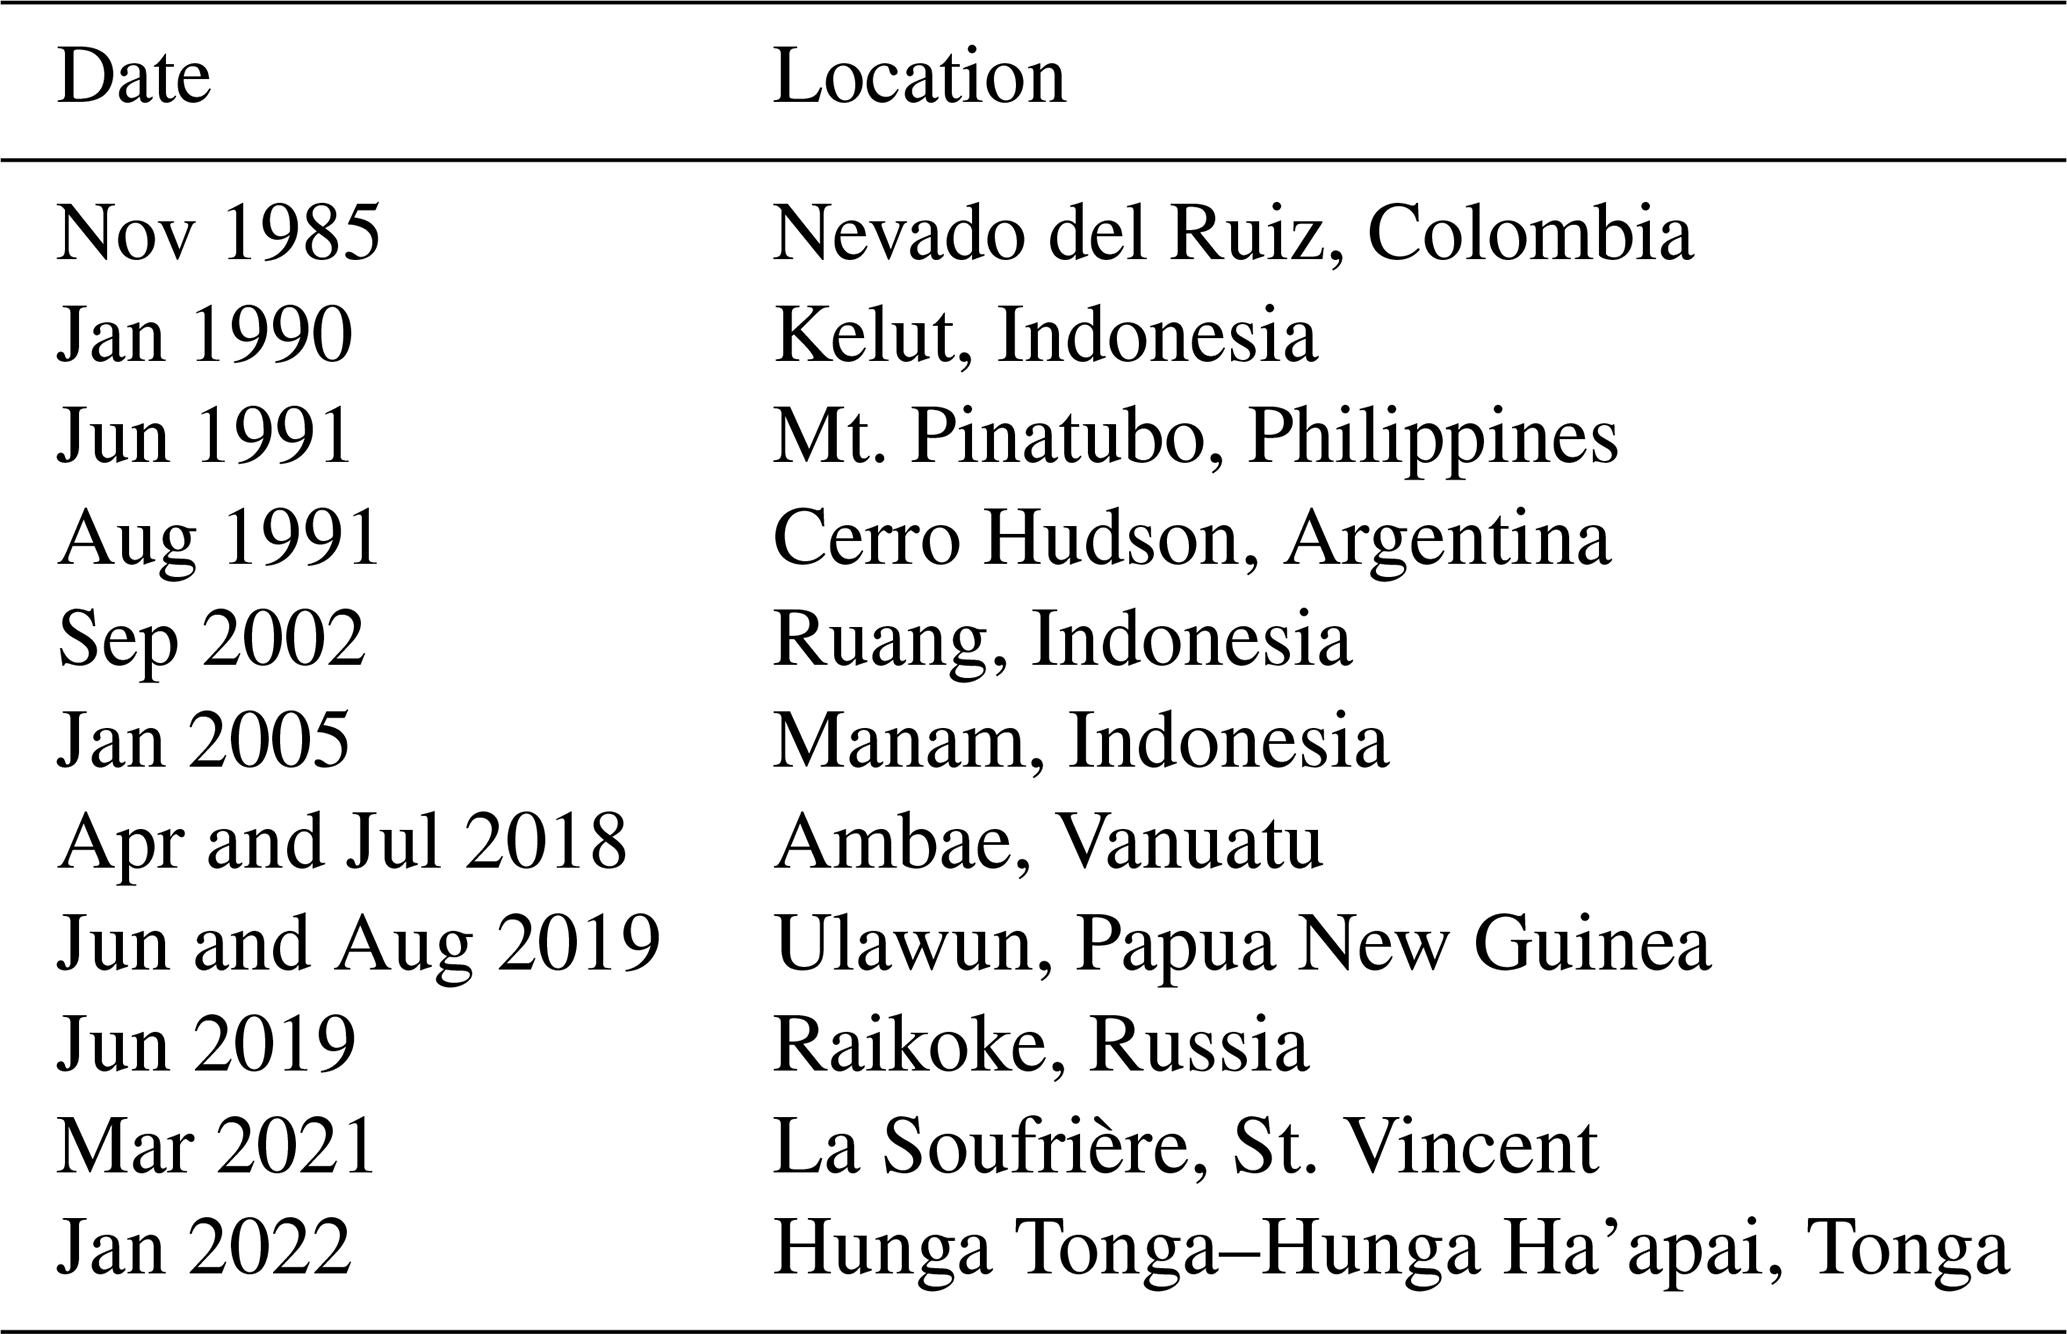

Figure 2SAGE II 1020 nm aerosol extinction coefficient data plotted versus the 525 to 1020 nm extinction coefficient ratio for 1998 with all data above 1.5 km above the tropopause between 30 and 60∘ N in 30 d increments from Julian 1–30 in frame (a) through 331–360 in frame (l). The lines in each frame roughly divide the data into unenhanced, enhanced with a lower extinction ratio (LRE), and enhanced with a higher extinction ratio (HRE) using a technique described in the text.
The data in Fig. 1 are for a single altitude (11 km) chosen specifically because the enhancement in the Northern Hemisphere summer of 1998 is the largest at that altitude. However, we observed similar enhanced aerosol extinction coefficients, but with decreasing frequency, in the same time frame as low as 8 km, where TBA filtering has drastically reduced the available data, and as high as 19 km. Figure 2 shows the distribution of 1020 nm extinction coefficient observations versus the 525 to 1020 nm extinction coefficient ratio (or simply extinction ratio) for 1998 in twelve 30 d segments (months) from Julian days 1–30 to 331–360 for all data passing TBA filtering. The distributions through Julian day 240, Fig. 2a to h, are typical of non-perturbed months with the extinction coefficient inversely correlated with the extinction ratio with the maximum extinction and the largest extinction coefficients, in the densest part of the data scatter, nearly constant or, in this case, slowly decreasing as the Mt. Pinatubo enhancement continues to ebb. In benign situations, where aerosol is considered to be primarily sulfuric acid aerosol, the extinction ratio is generally inversely correlated with the size of the optically dominant aerosol. In these sorts of monthly plots, there is generally a strong correlation between lower extinction coefficient values and increased altitude. Thus, smaller apparent aerosol size occurs with increased altitude. The effect of the Norman Wells pyrocumulus makes its presence obvious in Fig. 2i and j (roughly September and October), with a considerable change from previous periods as the maximum extinction coefficient value increases from about 2 × 10⁴ to 2 × 10⁻³ km−1 or about an order of magnitude. In addition, the extinction ratio at the largest extinctions values drops from a little over 3 to about 2. In the final two periods of 1998, Fig. 2k and l, distributions have begun to substantially return to values observed prior to the perturbation.
To help illustrate the scope and characteristics of the outlier observations, we define two lines based on data in two clean periods in the overall analysis period (1–30 and 31–60 in this case). The first line is defined as the 99.5 percentile of 1020 nm extinction coefficient observations where it exceeds 10−4 km−1 in these clean months. This is the vertical line shown in all Fig. 2 frames. A second line is defined as the median extinction ratio for the same subset of data and is shown in Fig. 2 as the horizontal line between the extinction coefficient line and the righthand side of the figures. These lines divide the space into three crude zones which roughly correspond to unenhanced aerosol (to the left of the extinction coefficient line) and, on the righthand side, enhanced aerosol with a low extinction ratio (the lower section and referred to as low ratio enhancements or LRE) and an increased aerosol extinction coefficient with a higher extinction ratio (the upper section and referred to as high ratio enhancements or HRE). It is not uncommon in any month for a handful of observations to occur in either category due to the statistical nature of the categorization process that occurs most often at the fringes of the zones, the incomplete removal of clouds (primarily in LRE), the presence of polar stratospheric clouds, and sometimes simply due to questionable quality measurements. The frequency of these incidental occasions of either type, as will be shown below, is almost always very low and rarely exceeds 5 % at any altitude in any month. In situations where stratospheric aerosol levels are trending, usually lower, over the analysis period (as can be seen in Fig. 2a through h), the enhancement demarcation can be rather conservative in identifying any type of outlier and thus may produce lower LRE or HRE frequencies than more generous demarcation lines. Conversely, this conservative approach also minimizes false positives, sometimes drastically, that occur primarily in the LRE zone for the period before the event of interest.
Thomason et al. (2021) showed that small to moderate volcanic events often cause an increase in the extinction ratio, and in the context used here those events would be categorized as HRE enhancements. Beyond this situation, significant numbers of observations in the HRE region are not observed. The most common denizens of the LRE zone are aerosol–cloud mixtures (e.g., Kent et al., 2003) which for these plots have been mostly removed. Despite TBA filtering, Fig. 2i and j show substantial numbers of LRE enhancements at levels far beyond the frequency of such observations in other, non-perturbed periods. Perturbations that move the extinction ratio toward 1 (and LRE) are most often associated with cloud presence or intense volcanic events producing very large sulfuric acid aerosol such as following the Mt. Pinatubo eruption of 1991. These are primarily scattering particles (as opposed to absorbing) at SAGE wavelengths, and the decreasing extinction ratio is a response to an increase in the size of the most optically active aerosol. The asymptotic behavior occurs because the relative mix between standard aerosol and cloud shifts toward cloud, and the aerosol extinction coefficient increases at both 525 and 1020 such that the extinction ratio becomes progressively more reflective of cloud properties. Since most ice cloud particles observed by a SAGE instrument are optically large, they essentially all have extinction ratios of about 1, and the more cloud-like the observation the closer the extinction ratio approaches 1. This is a well-known phenomenon and the basis for essentially all cloud detection algorithms for SAGE-like instruments (Thomason and Vernier, 2013; Kovilakam et al., 2023). For the Norman Wells event, as can be seen in Fig. 2i and j, the extinction ratio asymptotes toward something closer to 2, and thus the behavior is similar to SAGE ice cloud observations in possessing an asymptotic behavior that suggests that the measurements are dominated by an optically uniform aerosol from measurement to measurement at high extinctions but to a distinctly not-cloud ratio. Below we will show that this behavior is characteristic of smoke events and discuss what this behavior suggests about the observed smoke aerosol further below.
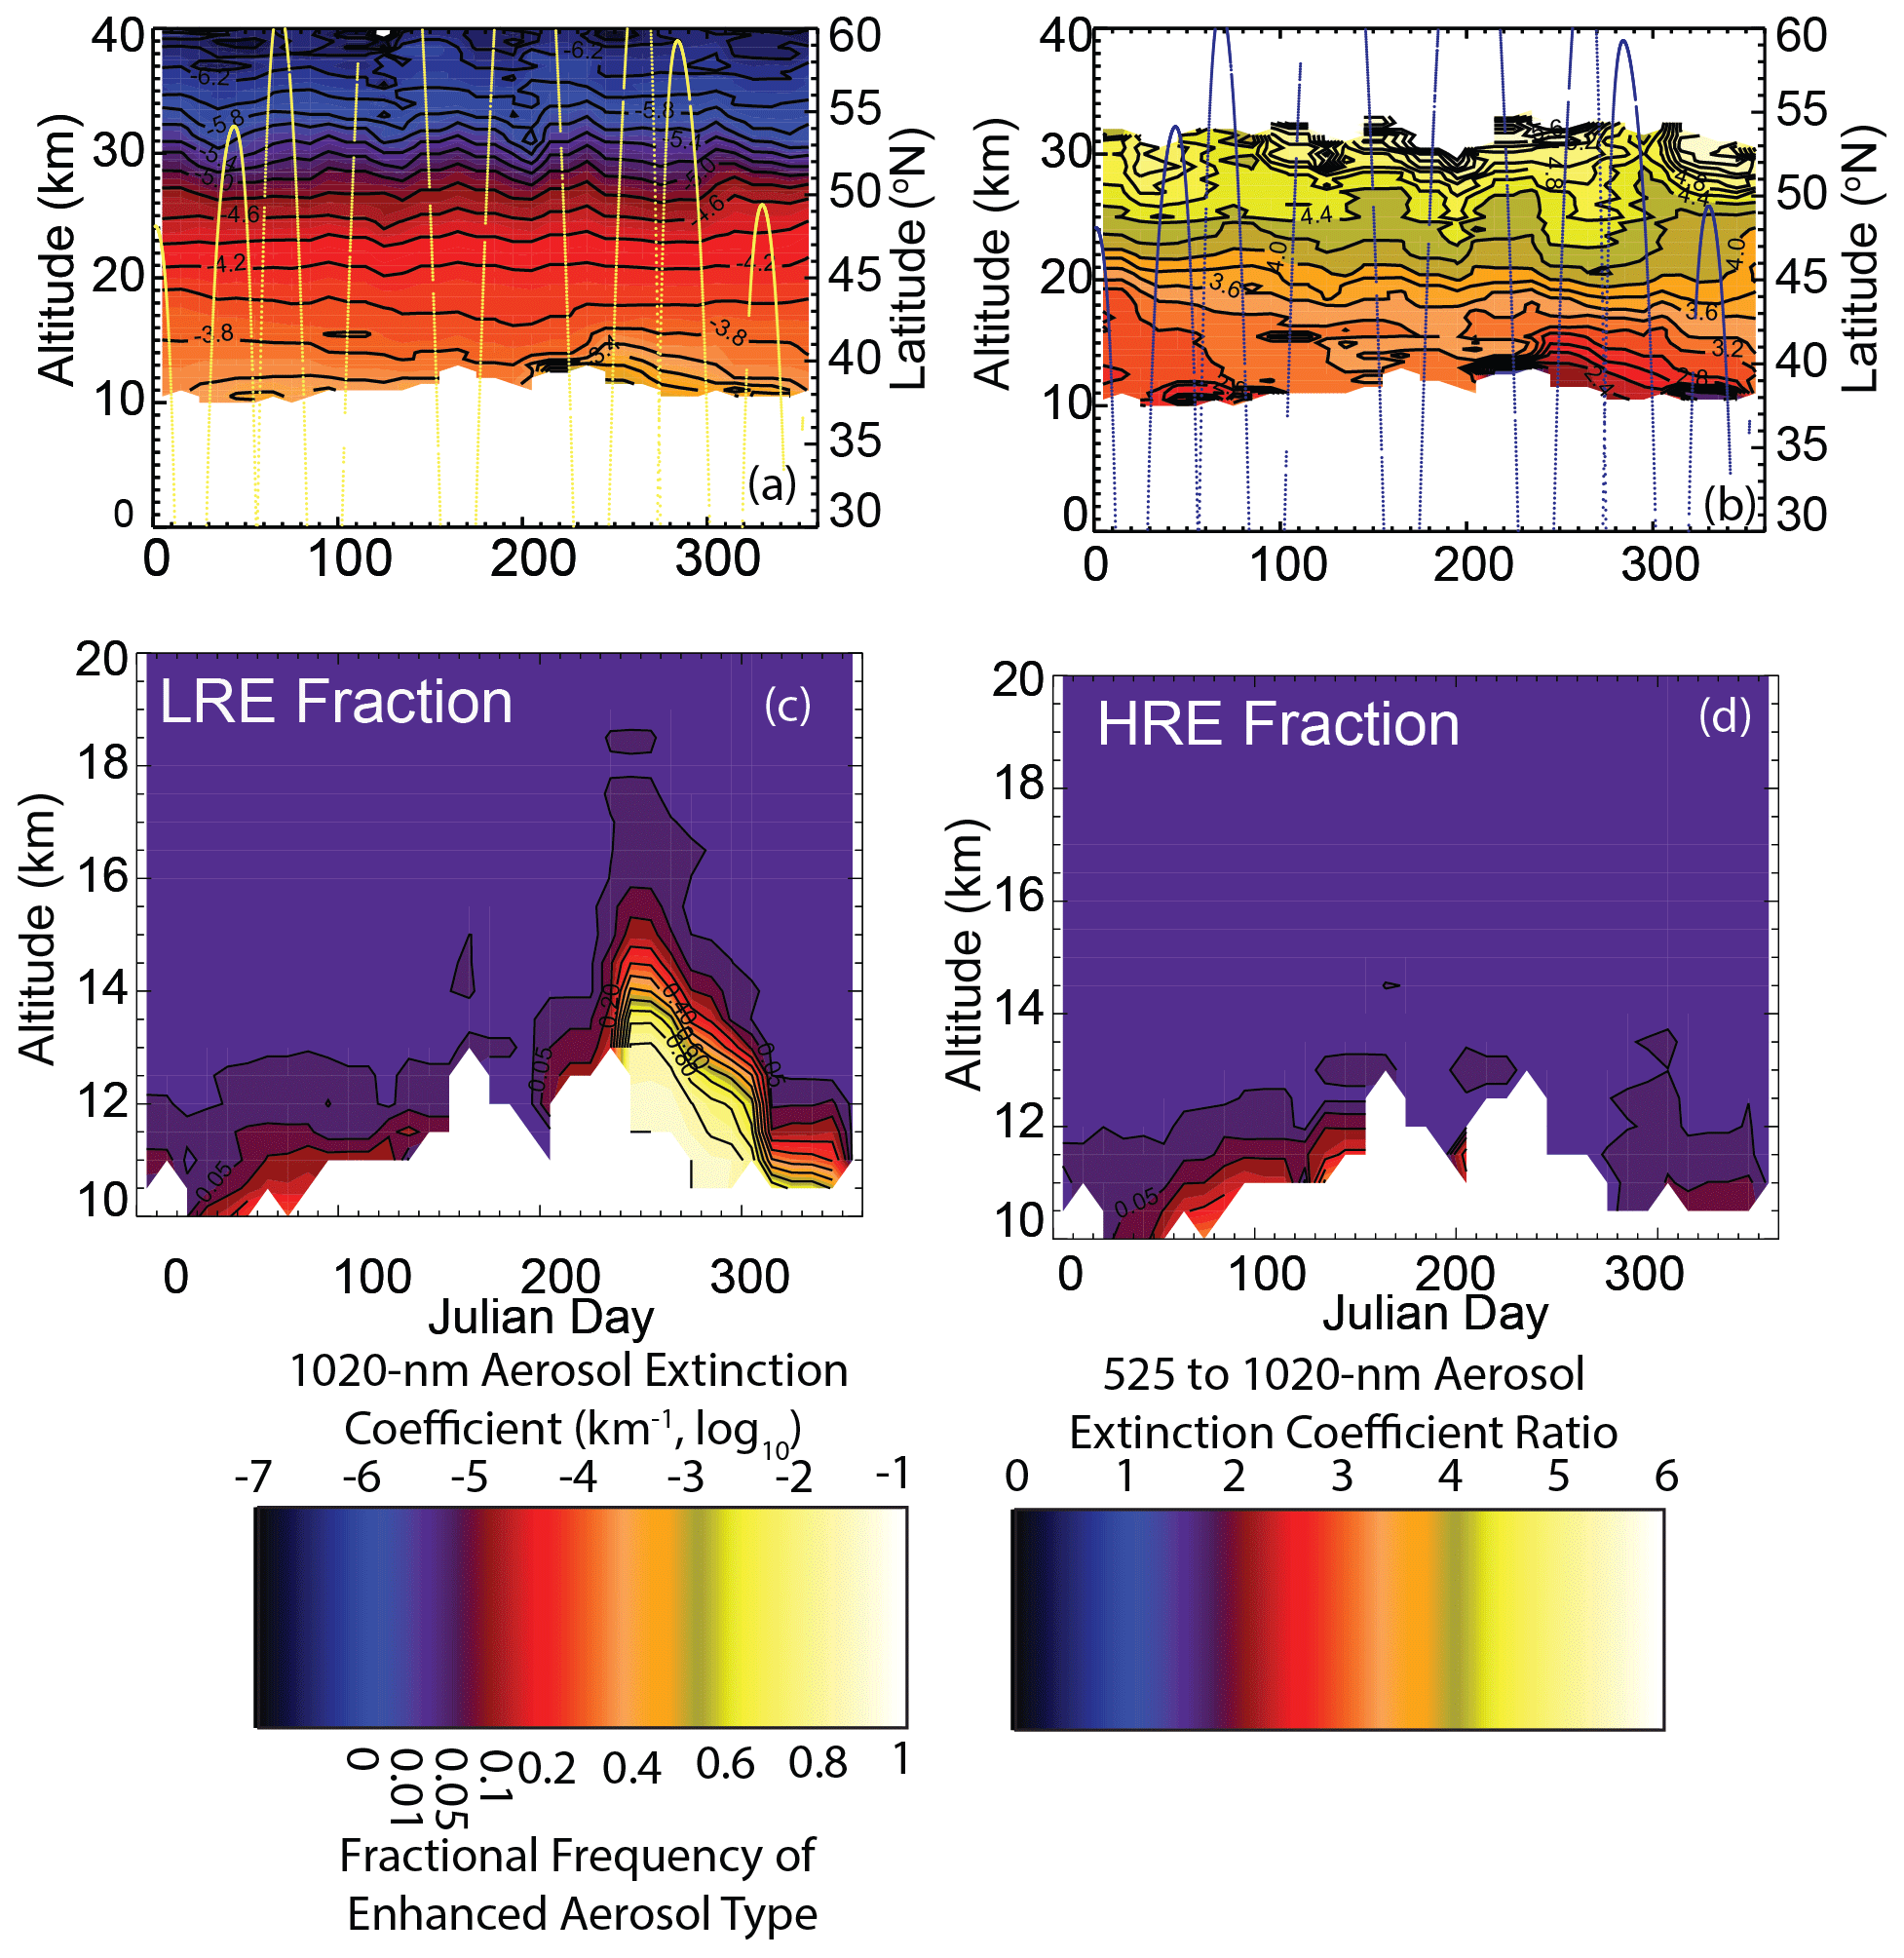
Figure 3SAGE II aerosol data analysis for the 1998 Norman Wells event in the Northern Hemisphere (30–60∘ N) in 10 d averages for the 1020 nm extinction coefficient (a), extinction ratio (b), LRE fraction (c), and HRE fraction (d). Frames (a) and (b) also include the latitude of SAGE observations in yellow and blue, respectively. Occurrences of the LRE and HRE observations follow from the discussion in the text. Note that no occurrences of either type occur above 20 km. The color bars in this figure are applicable to all further color contour plot figures. Contours in the extinction coefficient are spaced in 0.2 increments in log-base-10 space in units of km−1. Extinction ratio contours are spaced in 0.2 increments and contours in the LRE and HRE fraction occur at 0.01, at 0.05, and then every 0.1 from 0.1 to 1.0.
Figure 3 shows the temporal evolution of the mean zonal 1020 nm aerosol extinction coefficient (Fig. 3a), the mean zonal extinction ratio (Fig. 3b), and LRE (Fig. 3c) and HRE (Fig. 3d) frequency during 1998 in 10 d segments. The latitudes of observations are also shown. In general, we observe an enhancement in aerosol extinction beginning around 8 July (Julian day 190) below 14 km that spreads to about 18 km beginning in early September (252). Given that the Norman Wells fire occurs on 4 August (216), the aerosol enhancement seen prior to that date must arise from a different source. That source is most likely the 30 June eruption of Korovin in the Atka Volcanic Complex (Global Volcanism Program, 1998) which produced an ash cloud at 9 km as reported by aircraft. These “early” aerosol enhancements show a low overall frequency of LRE events (no more than 20 % of observations and only at altitudes of 13 km and below). Despite this low frequency the mean extinction ratio reaches values less than 1.6, suggesting the presence of very large aerosol, possibly ash. Beginning in early September, the frequency exceeds 80 % at levels below 13 km through early November with at least some LRE enhancements as high as 18 km. During this period, the mean extinction ratio is less than 2.6 in the optically densest part of the layer, which is significantly less than the earlier periods. The delay in observations of the Norman Wells aerosol is due to the observational pattern of SAGE II, which did not provide northern mid-latitude observations in August 1998. Virtually no observations of HRE aerosol are made through the entire year except in the lowermost regions with data (< 12 km) where measurement noise and incomplete cloud removal by TBA filtering tends to produce low frequency of occurrences of both aerosol types in all months and years.
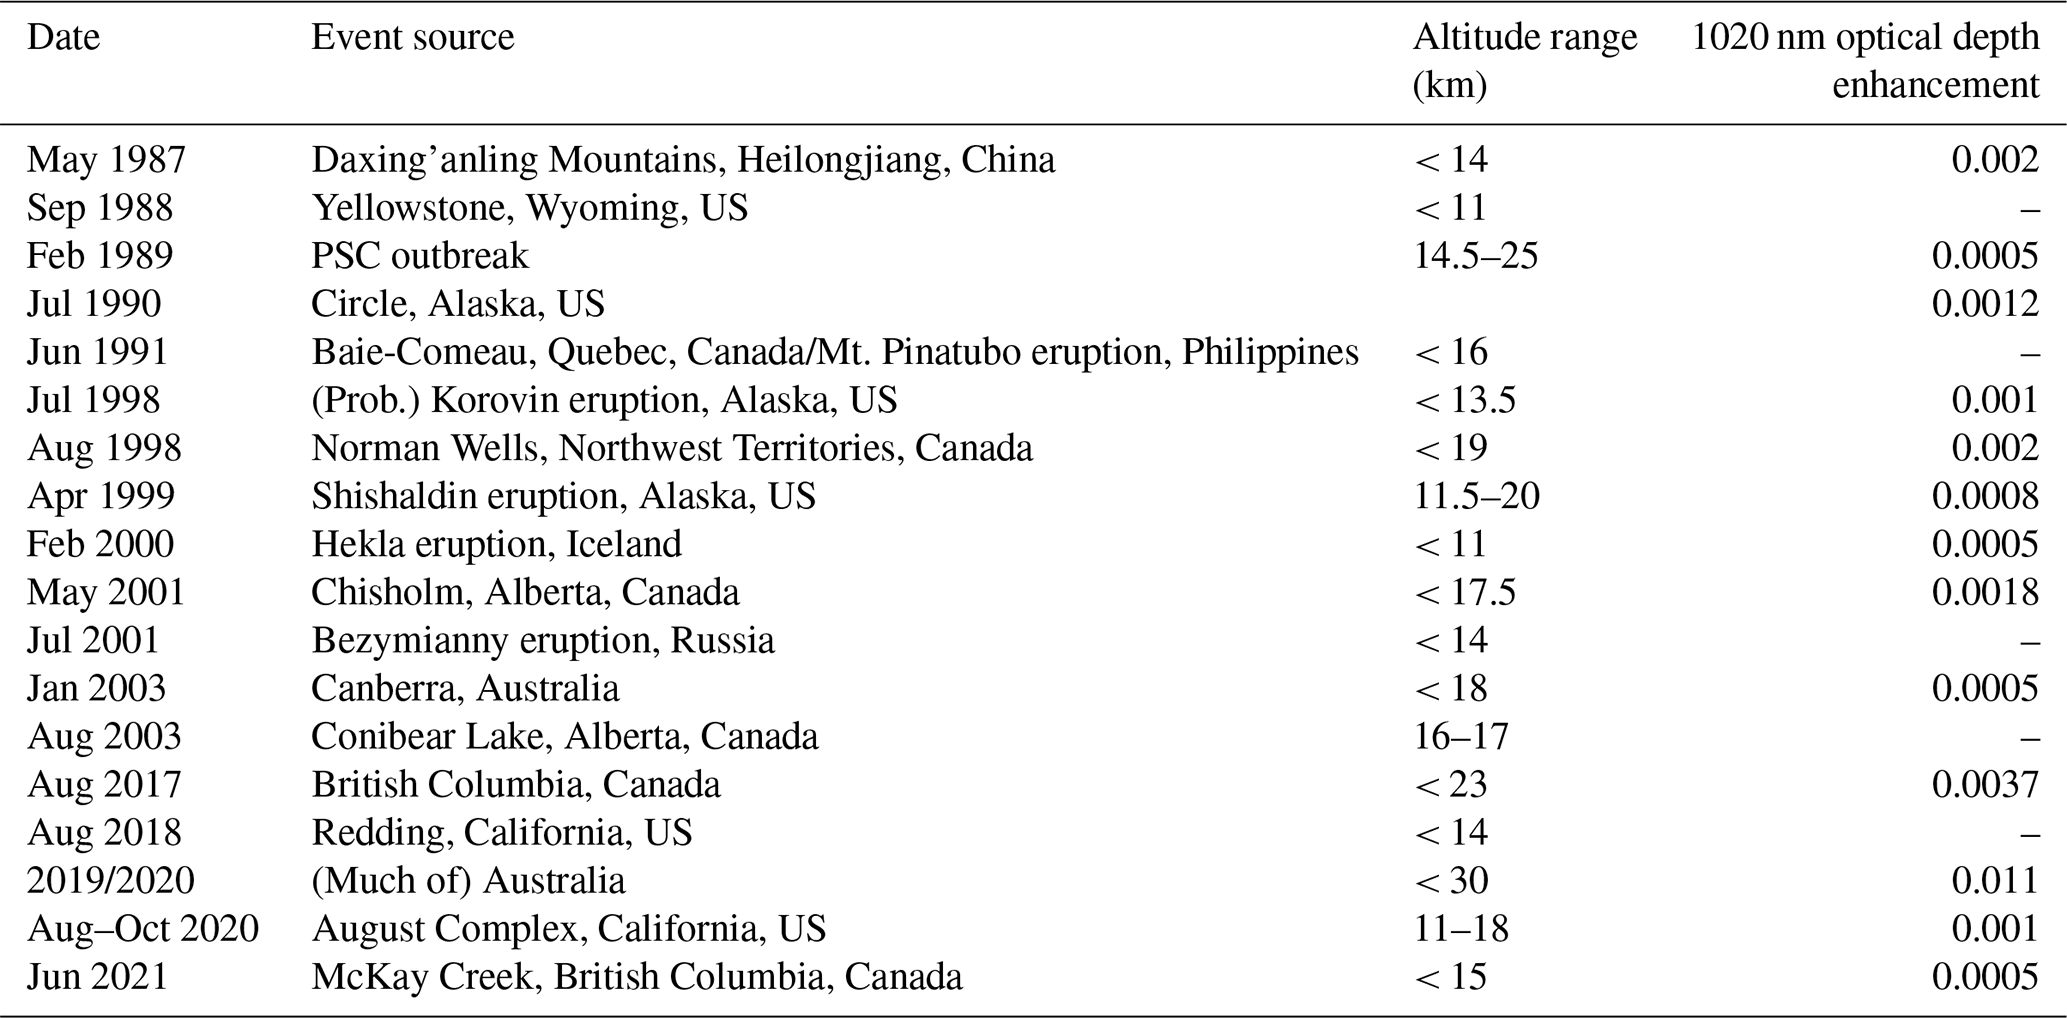
Table 2Table of smoke events and other events discussed in this paper. Smoke events are in bold with other event types denoted in the source column.
Using the analysis in Fig. 3a, we can compute a maximum 10 d zonal magnitude of the perturbation to the stratospheric aerosol optical depth associated with the Norman Wells pyrocumulus event and the preceding (probably) Korovin volcanic event by integrating the vertical extinction coefficient profiles and subtracting the value immediately prior to the event from the maximum value in the few samples immediately following it. This is straightforward when perturbations are large, such as following the Australian fires of 2019/2020, but it can be difficult when the enhancement is small relative to the background level and for absolute optical depth perturbation magnitude on the order of or less than 0.001. The latter difficulty exists because such small variations approach the precision limit of these measurements. In addition, variations in aerosol levels vary seasonally, and long-term trends can mask small perturbations and impose an added challenge for inferring an optical depth perturbation for some of the very weak events we discuss. For the Norman Wells fire, we find a maximum 1020 nm optical perturbation of 0.002 occurring with the first observations, which is slightly larger than the optical depth prior to the event. This enhancement declines to about 0.0005 by the end of the year. For Korovin, we find an optical depth increase of about 0.001 that decreases rapidly after the initial observations as this event appears to have been an extremely short-lived stratospheric feature. From a relative sense both of these perturbations are significant relative to the prior optical depth level (∼ 0.0015); however, the stratospheric aerosol optical depth in 1998 was approaching the lowest ever observed by SAGE II (which occur in 2000). For each event discussed below, we note the maximum estimated optical depth enhancement in Table 2.
In the next section, we apply the above process to the SAGE II (1984–2005) and SAGE III/ISS (2017–2022) observations in the northern and southern mid-latitudes (30 to 60∘) where observations are plentiful and, unlike low latitudes, intrusions of smoke into the stratosphere most often occur. For the SAGE III component of the analysis, we use data from a slightly different wavelength relative to SAGE II (521 nm instead of 525 nm), but we do not distinguish between the extinction ratios computed using SAGE II and SAGE III data considering the small change in wavelength to be of minor importance. From these data, we have identified a total of 18 outlier events which we list in Table 2. Five are identified as non-smoke events, and we discuss these briefly either separately below or as part of the discussion of another event when they occur concurrently (as with Norman Wells and Korovin above). Of the remaining 13, 2, as previously noted, are not amenable to further analysis due to their limited impact on the TBA-filtered stratosphere (Yellowstone and Conibear Lake). An additional three outlier events identified as originating from fires are shown in Fig. 7 but show similarly small enhancements and/or low frequency of observations. These are the Canberra, Australia, event of 2003 (Fromm et al., 2006) that had a zonal mean peak 1020 nm optical depth enhancement of about 0.0005; the Redding, California, fire (Carr) of 2018 (Lareau et al., 2018); and the McKay Creek fire of 2021 (https://earthobservatory.nasa.gov/images/148530/blazes-rage-in-british-columbia, last access: 28 August 2023) for which column optical depth enhancements could not be determined. Of the remaining eight, Norman Wells is discussed above, and six are attributed primarily to pyrocumulus events and similar fire-related phenomena and discussed in some detail below. Finally, in a separate section, we discuss the complex period in the summer of 1991 where aerosol from the Mt. Pinatubo eruption and smoke from Baie-Comeau are present in the Northern Hemisphere lower stratosphere.
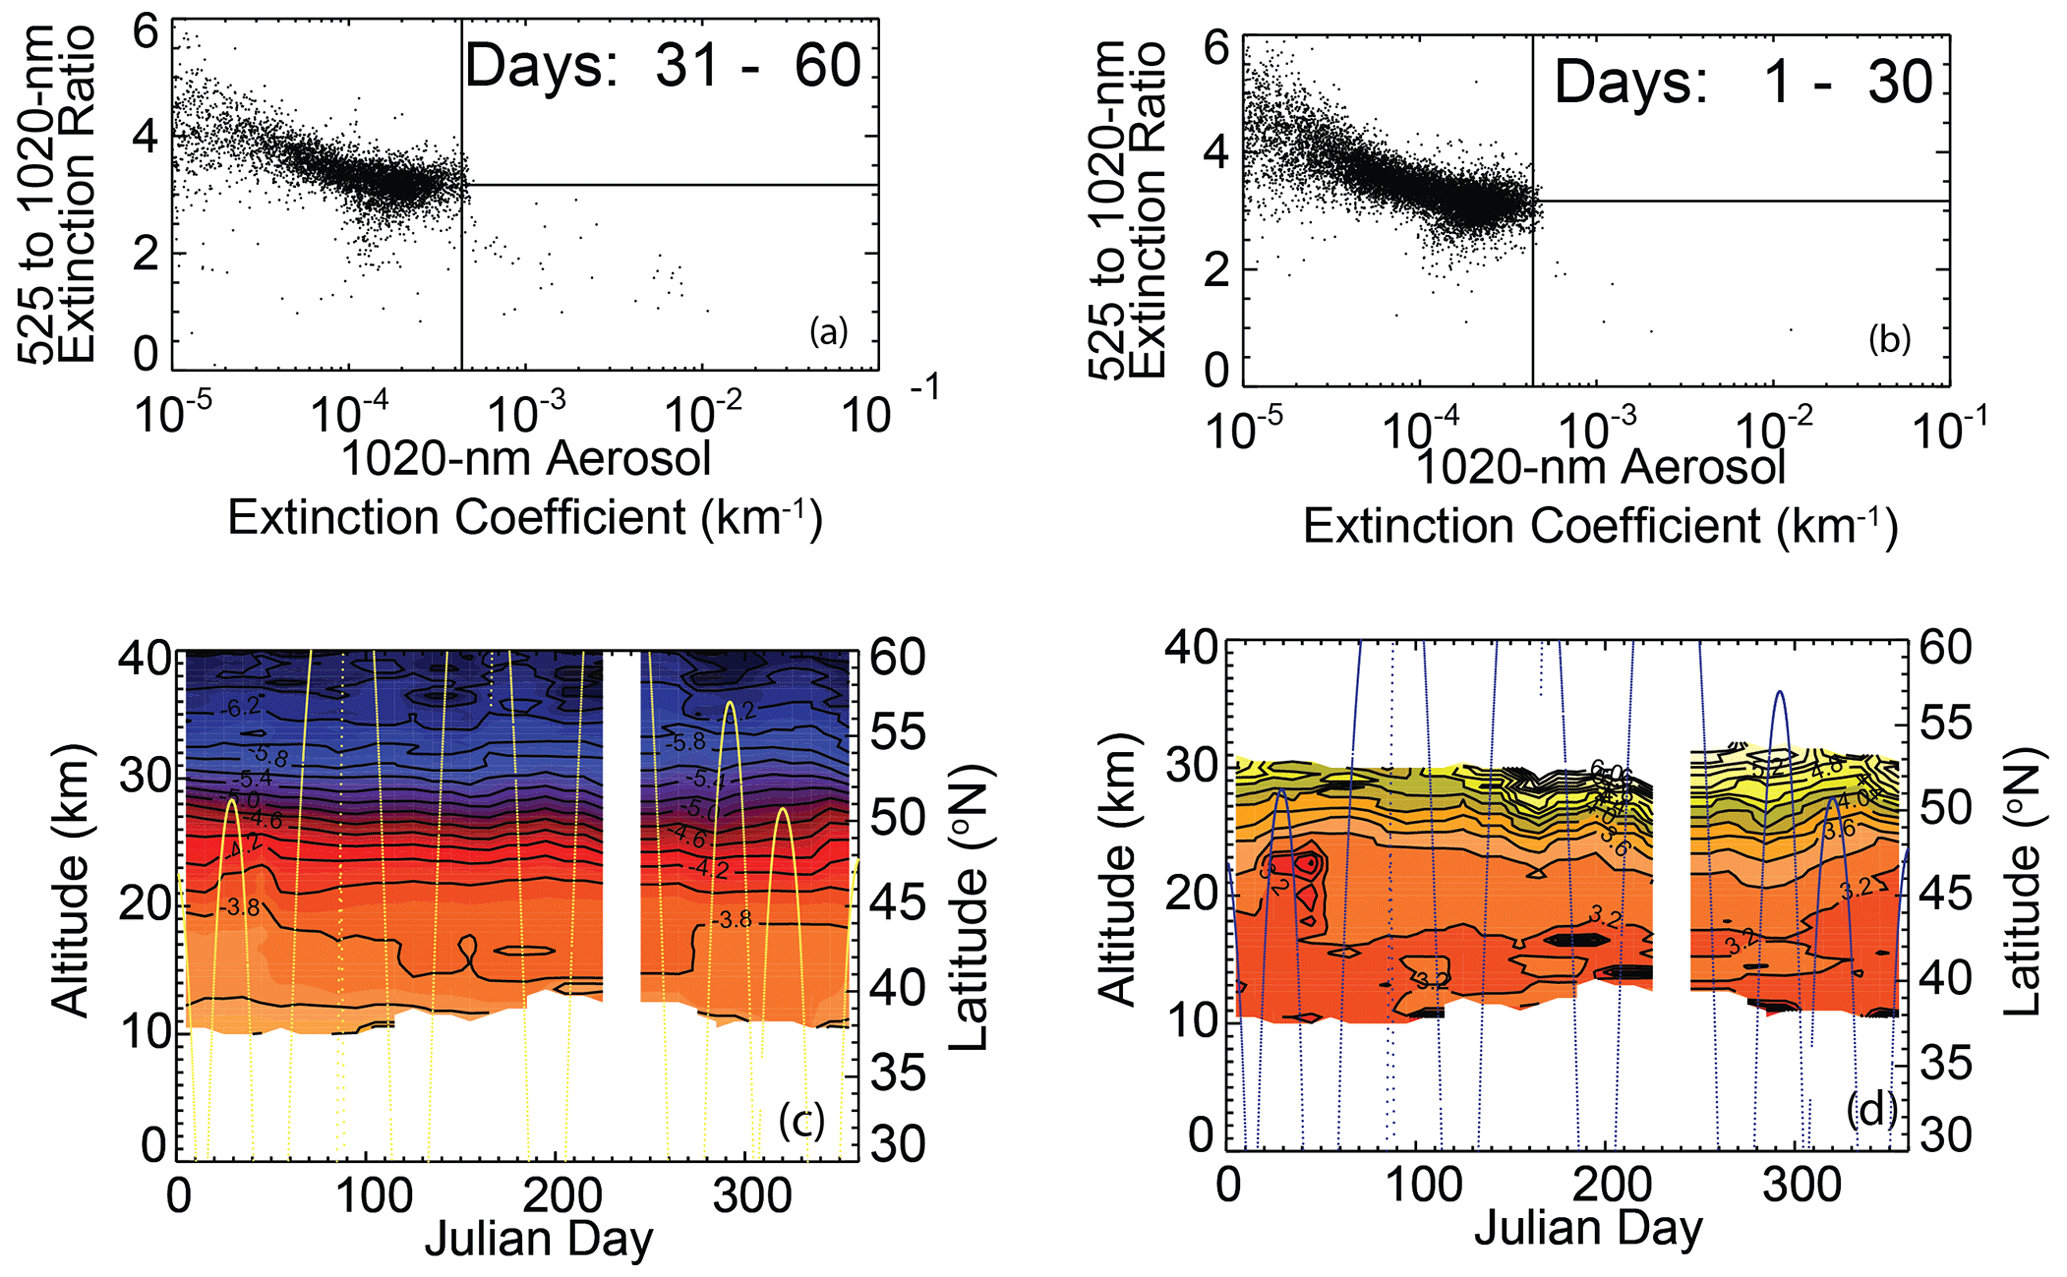
Figure 4SAGE II 1020 nm aerosol extinction coefficient data plotted versus the 525 to 1020 nm extinction coefficient ratio for the 1989 PSC outbreak with all data above 1.5 km above the tropopause between 30 and 60∘ N in 30 d increments for Julian days 31–60 (a) and 1–30 (b). Also, SAGE II aerosol data analysis for 1989 (30–60∘ N) in 10 d averages for the 1020 nm extinction coefficient (c) and extinction ratio (d). The color bars from Fig. 3 apply to this figure. Contours in the extinction coefficient are spaced in 0.2 increments in log-base-10 space in units of km−1. Extinction ratio contours are spaced in 0.2 increments. Frames (c) and (d) also include the latitude of SAGE observations in yellow and blue, respectively.
In analyzing these events, we employ the typing system categories described above using the two demarcation lines. These are determined based primarily on data from winter months in each hemisphere (days 1 to 60 in the north and 211 to 270 in the south) except for some years where this was not possible. In particular, we use Julian days 158 to 210 data in 2017 for the Northern Hemisphere given that day 158 (7 June) is the start for the SAGE III/ISS record and unaffected by any obvious outlier activity. In the Southern Hemisphere, we use wintertime data from 2019 to set the demarcation lines since the enhancement from the Australian fire events of 2019/2020 persists throughout 2020. We use data from 121 to 180 for the Southern Hemisphere in 1991 given the massive and persistent effect of the Mt. Pinatubo eruption throughout the second half of 1991. There is considerable variability in the austral winter months in the SAGE II data as both a very clean polar vortex and polar stratospheric clouds are frequently observed. These features produce apparent outliers but are not included as a part of this analysis. Two SAGE II periods are not closely examined. These are 1984 when only 3 months of data are available and is otherwise unremarkable and 1992 through 1995 when background levels from the 1991 Mt. Pinatubo eruption are sufficiently high that small perturbations from smoke or small eruptions could easily be masked by existing aerosol levels.
4.1 Non-smoke-related outliers
While our interest is primarily in outlier events caused by pyrocumulus and other fire-related sources, we also note a few events that produced clear outliers but are, perhaps, less recognized as being a part of the SAGE II data set. For instance, Pitts et al. (1990) reported on the unusual presence of ice polar stratospheric clouds (PSCs) down to 50∘ N over Europe using SAGE II data from February 1989. While PSCs are commonly observed by SAGE II in the Antarctic mainly in late austral winter and early spring (August and September), they are not common in SAGE II observations in the Northern Hemisphere, and the frequency and latitude of those seen in 1989 are unique in the data set. The effects of these clouds can be seen in Fig. 4a where the enhanced aerosol between Julian days 31 and 60 show a general decrease in the extinction ratio, suggesting the presence of relatively large particles. A modest zonal increase in the 1020 nm aerosol extinction coefficient can be seen around Julian day 50 between 18 and 25 km in Fig. 4b with a concomitant decrease in the extinction ratio, shown in Fig. 4c, over a similar altitude range. The frequency of these observation is quite low and barely exceeds 1 % of the observations at any given 10 d period and shows essentially no enhancement of HRE observations. The low overall frequency is not surprising given the limited longitudinal range of PSC occurrences in the Arctic and the low likelihood of PSC occurrences in this latitude band in general. The total 1020 nm optical depth anomaly for this event peaks at approximately 0.0005.
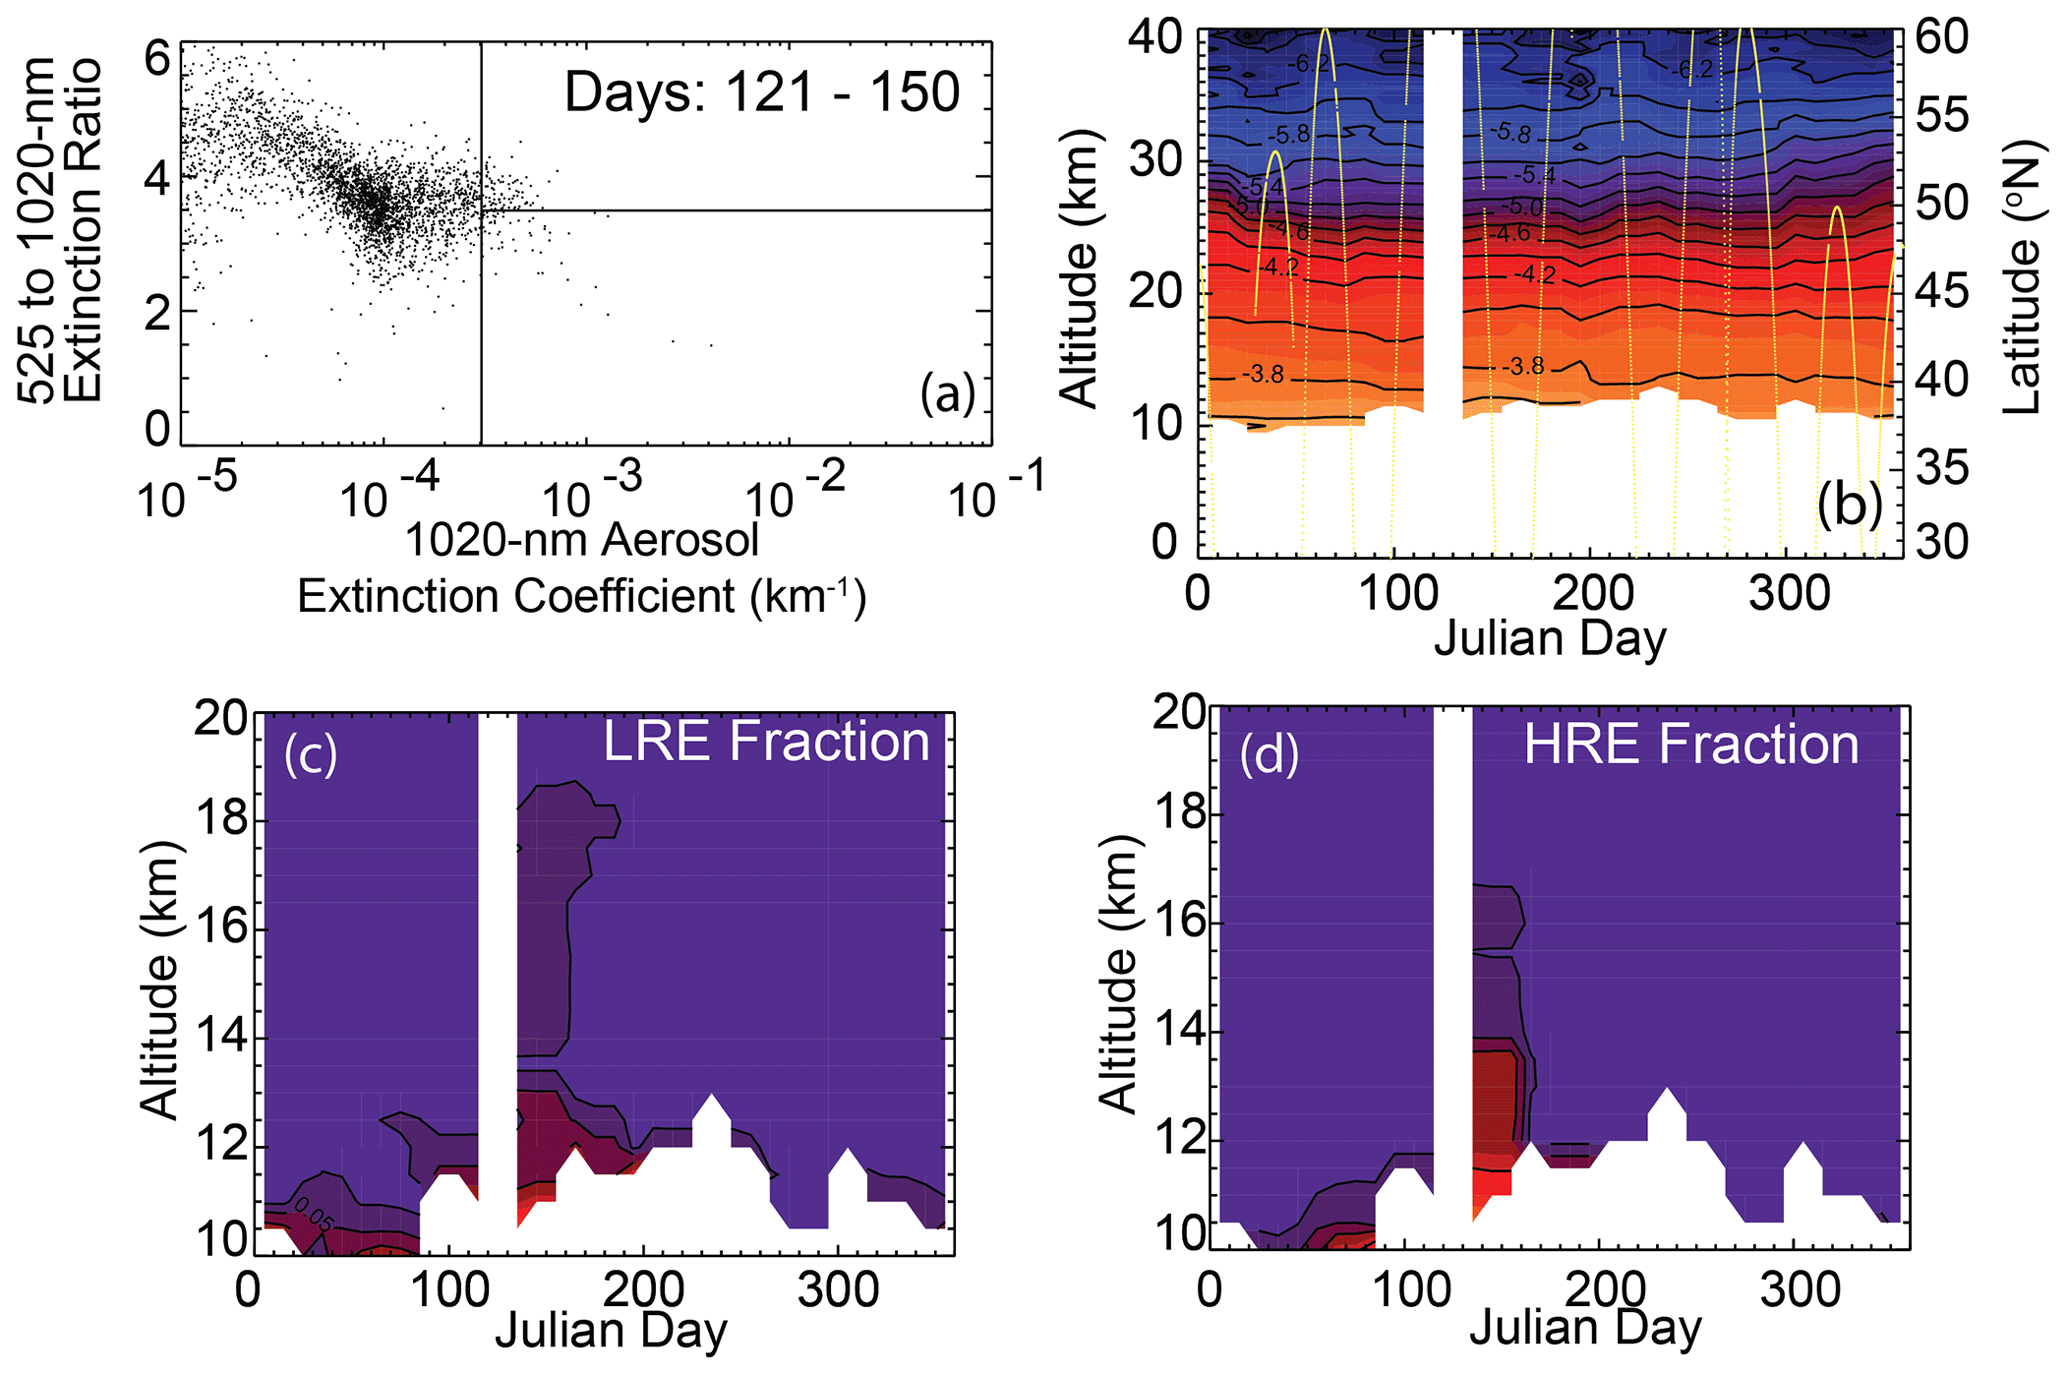
Figure 5SAGE II 1020 nm aerosol extinction coefficient data plotted versus the 525 to 1020 nm extinction coefficient ratio for the 1999 Shishaldin eruption with all data above 1.5 km above the tropopause between 30 and 60∘ N for Julian days 121–150 (a), SAGE II aerosol data analysis for 1999 (30–60∘ N) in 10 d averages for the 1020 nm extinction coefficient (b), LRE fraction (c), and HRE fraction (d). Occurrences of the LRE and HRE observations follow from the discussion in the text. Note that there are no occurrences of either type above 20 km. The color bars from Fig. 3 are applicable to this figure. Contours in the extinction coefficient are spaced in 0.2 increments in log-base-10 space in units of km−1. Contours of the LRE and HRE fraction occur at 0.01, at 0.05, and then every 0.1 from 0.1 to 1.0. Frame (b) also includes the latitude of SAGE observations in yellow.
Like the signal from the eruption of Korovin, observation of the eruption of Shishaldin in April 1999 is not commonly included among volcanic events in the SAGE II data set. An ash plume from the 19 April eruption was reported up to altitudes between 15 and 20 km with a 63 kt SO2 emission reported below 14 km (Global Volcanism Program, 1999). The SAGE II observations shown in Fig. 5a for Julian days 121–150 are consistent with these observations showing a mix between LRE observations, likely the ash, and HRE observations which may reflect new particle formation of sulfuric acid aerosol consistent with observations of other small to moderate volcanic events seen in SAGE observations (Thomason et al., 2021). Figure 5b shows the 1020 nm extinction coefficient over this period, with a modest increase in aerosol extinction below 20 km starting around Julian day 130 after a gap in observations. Overall changes in the extinction ratio are unremarkable in this period and not shown. On the other hand, while frequencies are low, the LRE frequency, shown in Fig. 5c, exceeds 1 % over a broad range of altitude from the lowermost observations to about 19 km. HRE frequencies, shown in Fig. 5d, while smaller in magnitude than the LRE enhancements, exceed 10 % consistently below 13.5 km, with lower frequencies up to about 15 km. Both of these features are consistent with other reports regarding the eruption (Global Volcanism Program, 1999). The total optical depth anomaly associated with this eruption at 1020 nm is about 0.0008.
During the airborne SAGE III Ozone Loss and Validation Experiment (SOLVE) in 2000 (completed unfortunately without SAGE III aboard Meteor 3M), the NASA DC-8 flew through an ash cloud (28 February) from a recent eruption of Hekla (26 February) at 37 000 ft or about 11 km, causing some damage to the aircraft (Pieri et al., 2001). There was also SO2 emissions of 183 kt at and below 11 km. SAGE II observations shown in Fig. 6a for Julian days 61–90 show enhancements in both LRE and HRE categories that persist into April primarily in the HRE category. The 1020 nm extinction coefficient analysis for 2000 is shown in Fig. 6b and shows an increase primarily confined below 12 km which matches the altitudes where both types of enhancement are also found. The extinction ratio analysis shown in Fig. 6c shows an intense increase in the extinction ratio, suggesting large ash particles near the altitude where the NASA DC-8 encountered them. Like the previous events, the maximum optical depth increase at 1020 nm is small and peaks at about 0.0005. As discussed before, all optical depth perturbations below about 0.001 should be considered less robust than larger values given a number of measurement-based and geophysical factors.
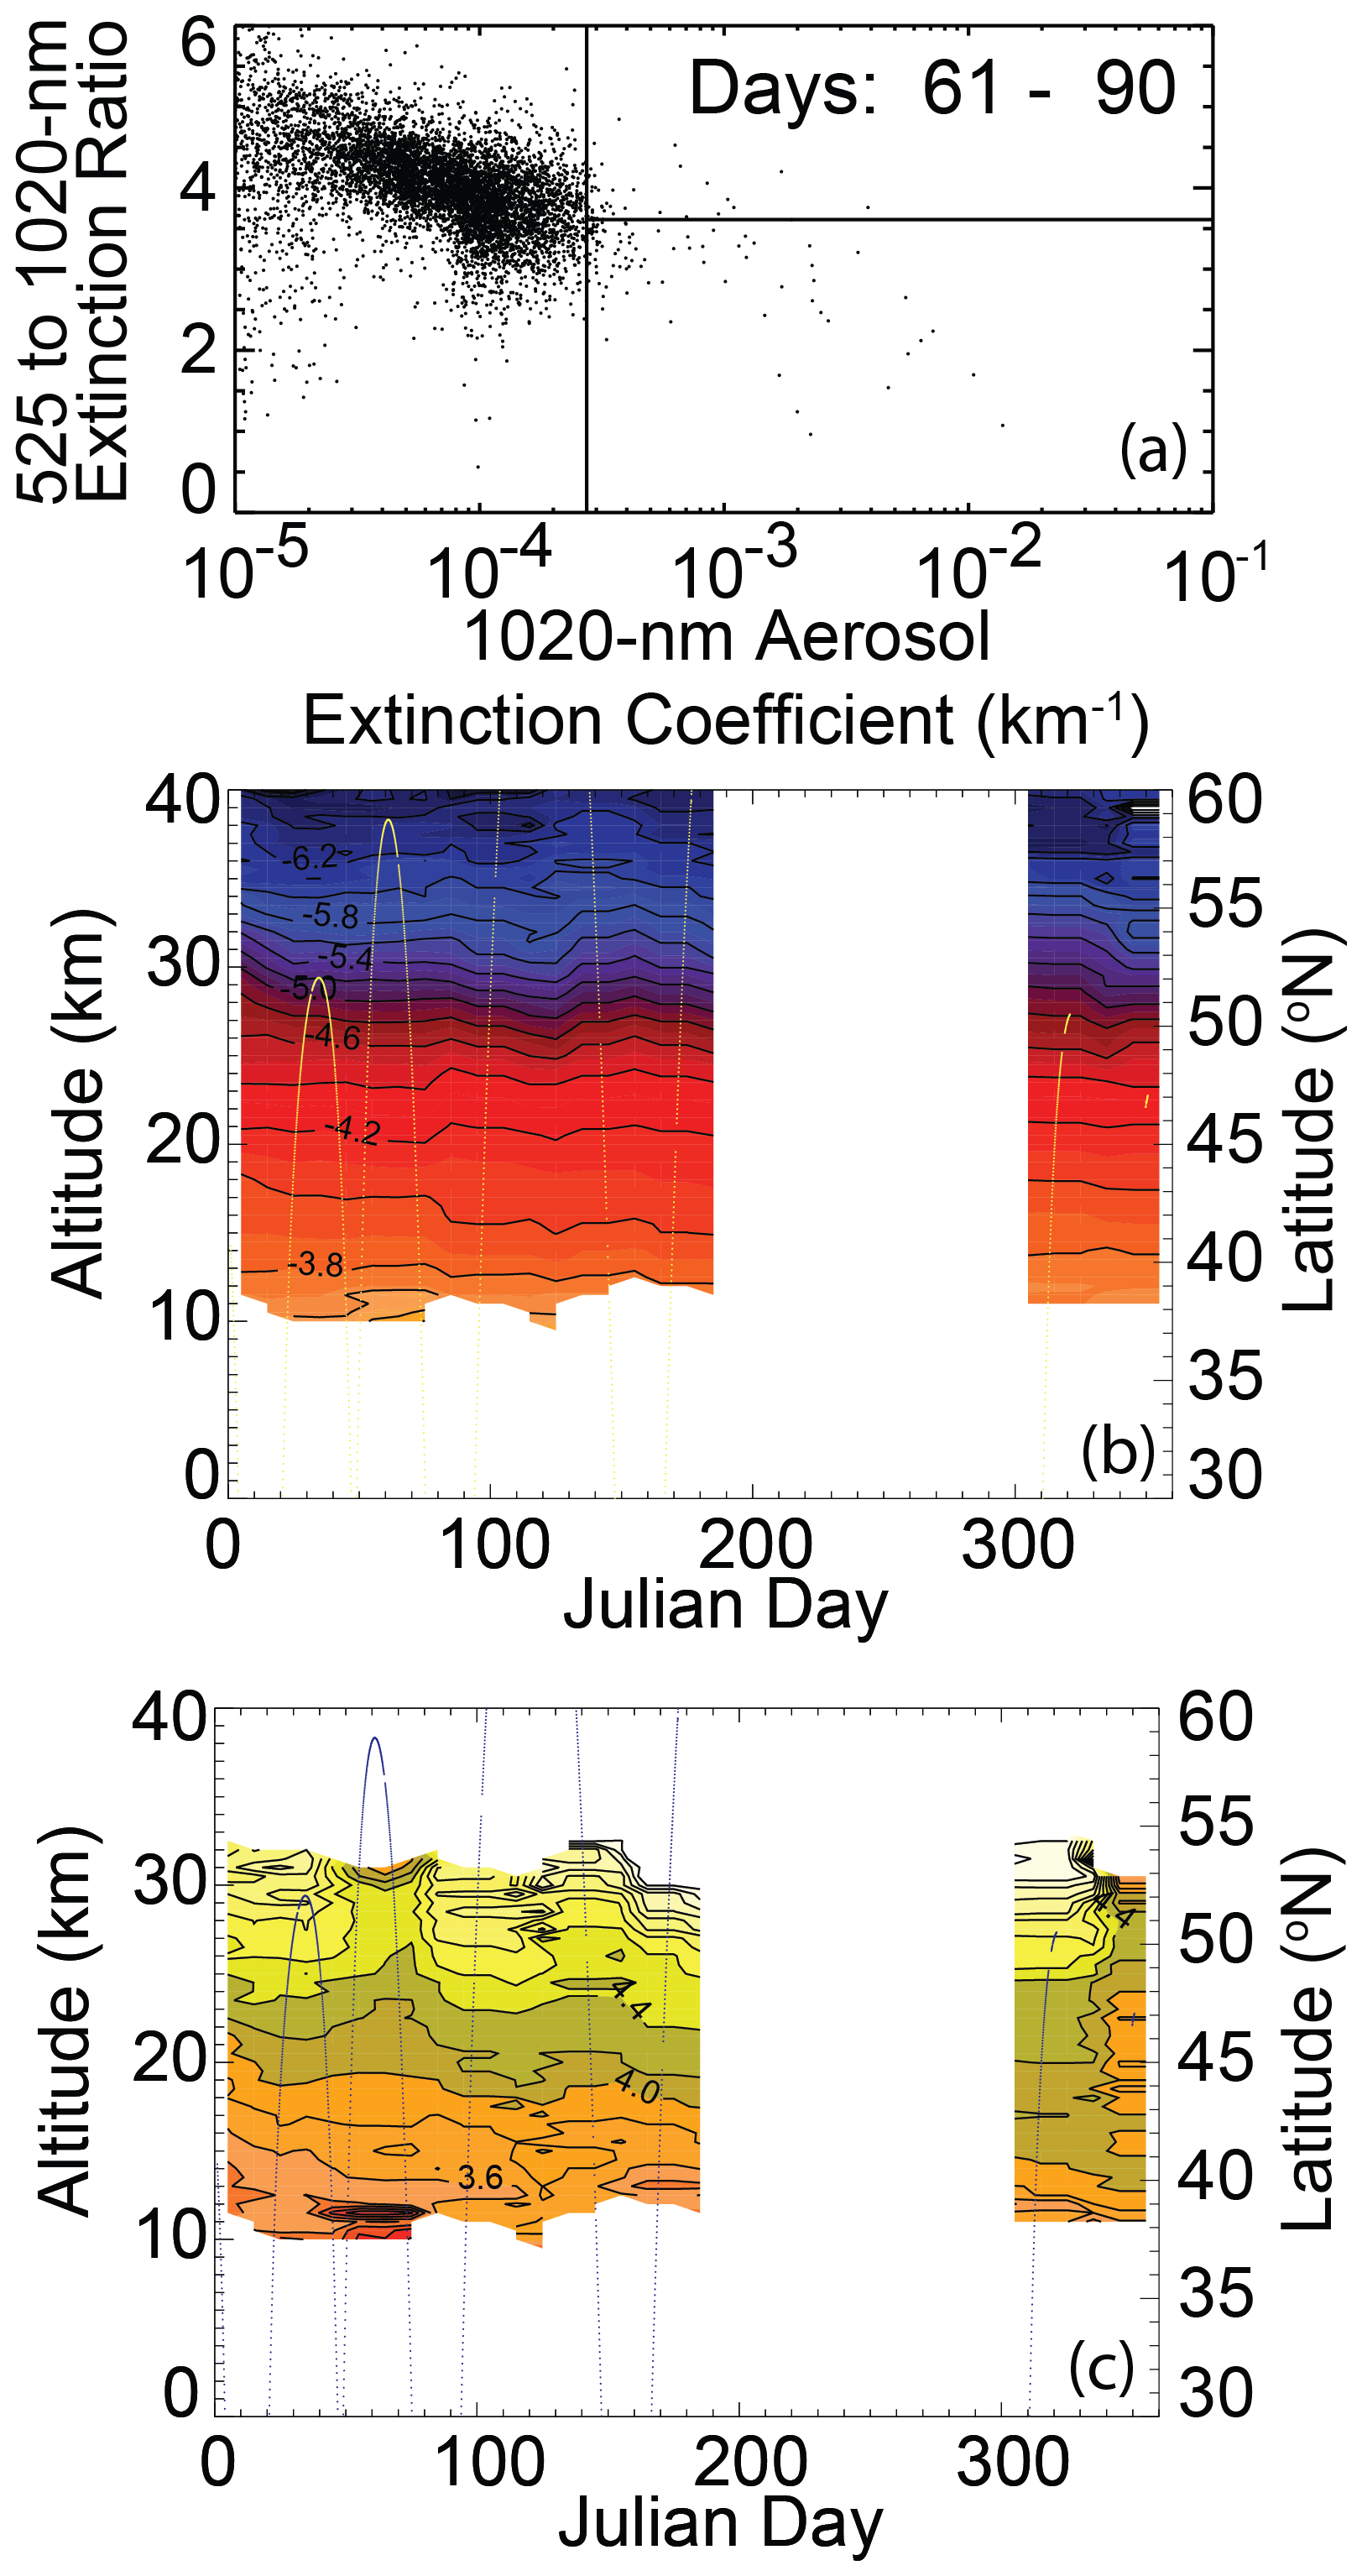
Figure 6SAGE II 1020 nm aerosol extinction coefficient data plotted versus the 525 to 1020 nm extinction coefficient ratio for the 2000 Hekla eruption with all data above 1.5 km above the tropopause between 30 and 60∘ N for Julian days 61–90 (a), SAGE II aerosol data analysis for 2000 (30–60∘ N) in 10 d averages for the 1020 nm extinction coefficient (b), and the aerosol extinction ratio (c). Contours in the extinction coefficient are spaced in 0.2 increments in log-base-10 space in units of km−1. Extinction ratio contours are spaced in 0.2 increments. The color bars from Fig. 3 apply to this figure. Frames (b) and (c) also include the latitude of SAGE observations in yellow and blue, respectively.
4.2 Smoke-related outlier events
Figure 7 shows the scatter plots of the 1020 nm extinction coefficient versus extinction ratio for 10 smoke events including the Norman Wells fire of 1998 in Fig. 7c, which has been discussed in detail above. These include some smoke events whose presence in the SAGE data sets has already been noted: fires located near Circle, Alaska, in 1990 (Fromm et al., 2010) in Fig. 7b; Chisholm, NT, Canada, in 2001 (Rosenfeld et al., 2007; Fromm et al., 2008) in Fig. 7d; British Columbia in 2017 (Bourassa et al., 2019) in Fig. 7f; and the Australian fires of 2019/2020 (Khaykin et al., 2020) in Fig. 7h. In addition, we show observations associated with fires located in the Daxing'anling Mountains, China (1987) (Cahoon et al., 1994), in Fig. 7a and the August Complex in California (2020) (Keeley and Syphard, 2021) in Fig. 7i. These latter events are associated with particular fires based on spatial and temporal coincidence with known large-fire events and the absence of other suitable candidates for the production of the obvious outlier clusters within the SAGE data set. We also include some minor fire events in this figure, including the Canberra fire in 2003 in Fig. 7e; the Redding, California, fire (Carr) in 2018 in Fig. 7g; and McKay Creek, British Columbia, Canada (2021), fire in Fig. 7j.

Figure 7SAGE II 1020 nm aerosol extinction coefficient data plotted versus the 525 to 1020 nm extinction coefficient ratio for all the identified fire-related events in the SAGE II and SAGE III/ISS data sets including Daxing'anling Mountains in China (a); Circle, Alaska, US (b); Norman Wells, Northwest Territories, Canada (c); Chisholm, Alberta, Canada (d); Canberra, Australia (e); British Columbia, Canada (f); Redding, California, US (g); Australia (h); August Complex, California, US (i); and McKay Creek, British Columbia, Canada (j).
Taking Fig. 7 in total, it is clear that there is substantial variability in both the number of observations (the pervasiveness of outlier observations) and the magnitude of the enhancements with the 2017 British Columbia fire, shown in Fig. 7f, and the Australian fires of 2019/2020, shown in Fig. 7h, dwarfing the other events in terms of both the number of observations in the enhanced extinction coefficient categories and the magnitude of the enhancements. It is also clear that the Norman Wells fire, now in Fig. 7c, is the most pervasive and among the largest magnitude of these events in during the SAGE II period (Fig. 7a to e). A common feature to these figures is that virtually all of the enhanced aerosol events fall into the LRE category, with most events producing close to zero entries into the HRE category. As we noted with the Norman Wells smoke event, for none of the events does the extinction ratio appear to asymptote toward 1, though some events are so weak or infrequent that even inferring an asymptotic value exists, much less inferring a value for it, is not possible. For weaker events this is particularly true since the optical properties of the smoke particles are mixed with those of ambient aerosol rather than solely represent one composition or the other. While there is often significant scatter in the ratio data, several of the stronger events appear to asymptote toward a value of approximately 2 like the Norman Wells event. These include the Daxing'anling Mountains fire in 1987 (Fig. 7a), the Chisholm fire of 2001 (Fig. 7d), and the British Columbia fire of 2017 (Fig. 7f). In other cases, it appears that the data asymptotes to values can be somewhat larger, including the Australian fires of 2019/2020 that asymptotes to about 3.
It is difficult to infer what changes in the observed extinction ratio mean for changes in the underlying aerosol size distribution even when there is little uncertainty regarding composition and refractive index (Thomason et al., 2008). With fire-related events, the interpretation of changes in the extinction ratio is more difficult since the complex refractive index may reflect the age of the aerosol, features of the fire itself (what was burning, how hot was it burning), and the process and speed by which it arrived in the stratosphere (Ansmann et al., 2021). The refractive index may be further modified by interactions with pre-existing aerosol, aerosol precursors like SO2 which may be produced by a fire, and other chemical processes (Yu et al., 2019). To our knowledge, in situ inferences of the refractive index of smoke-derived aerosol in the stratosphere have not been performed. Existing laboratory measurements of the optical properties of brown carbon span a large range in both real and imaginary components (see the discussion in Knepp et al., 2022). As a result, interpreting the asymptotic values seen in Fig. 7 is difficult, but a few things can be inferred. That an asymptotic value at a high extinction coefficient exists suggests that, for measurements that are optically dominated by smoke, the optical properties of the aerosol must be reasonably uniform between measurements in order to produce the relatively tight spread in the extinction ratio observed at the highest values of the extinction coefficient. This may also suggest that the composition and size distribution of these particles are also reasonably uniform between measurements. If particles are sufficiently large, their extinction ratio must approach 1 no matter what their complex refractive index is. For scattering aerosol like sulfuric acid/water aerosol and water ice clouds, the 525 to 1020 nm extinction ratio approaches 1 for a particle radius of ∼ 0.5 µm (Thomason and Vernier, 2013). Figure 8 shows the 525 to 1020 nm extinction ratio for a broad range of single-mode log-normal size distributions for both black carbon with refractive index information from Bergstrom et al. (2002) and brown carbon with refractive index information from Sumlin et al. (2018). In these curves, the extinction ratio is strongly dependent on both composition (black vs. brown carbon) and size distribution, but generally all are approaching a value of 1 by a mode radius of 0.3 µm except the narrowest brown carbon curve where it is closer to 0.4 µm. Since the extinction ratio asymptotes are consistently between 2 and 3, Fig. 8 implies that the optically dominant aerosol radius is no larger than 0.3 µm and potentially much smaller. It is likely that brown carbon is more prevalent than black carbon in stratospheric smoke (Yu et al. 2019); therefore, it is reasonable that the extinction ratios from stratospheric smoke more closely resemble the brown carbon curves of Fig. 8 than the black carbon curves. This results in a very coarse determination of particle radius where we can conclude that the optically dominant smoke particles were neither very small (e.g., < 0.1 µm) nor very large (e.g., > 0.3 µm), which is in agreement with in situ observations (Moore et al., 2021, Katich et al., 2023). Given the uncertainties in the particles' complex refractive index, using SAGE measurements to infer more detailed estimates of the aerosol size distribution or bulk properties like surface area density is far more problematic than when applied to circumstances where sulfuric acid aerosol can be safely assumed. Ultimately, other than concluding that the smoke particles are probably optically dominated by aerosol smaller than those inferred for other asymptotic phenomena observed in SAGE data associated with ice clouds and aerosol from large volcanic events like Mt. Pinatubo, it is not possible to fully separate the effects of composition and size distribution for smoke particles using optical measurements from SAGE-like instruments.
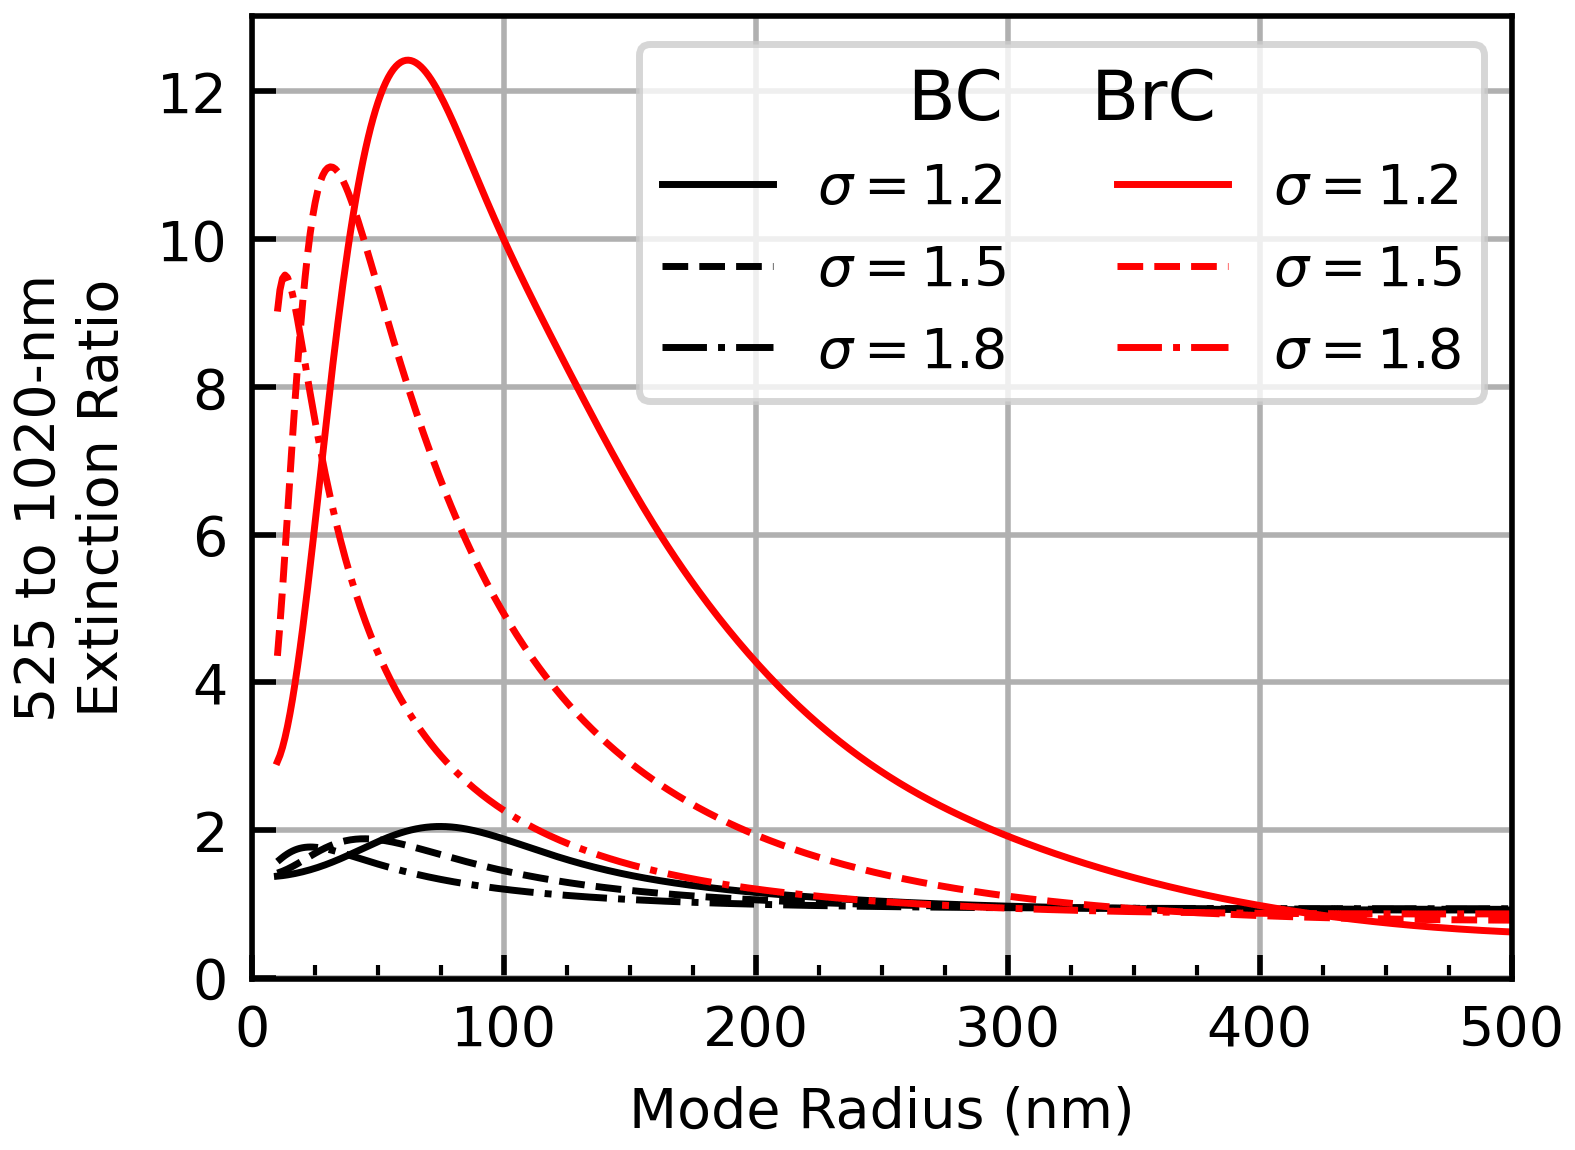
Figure 8Theoretical extinction ratio values as a function of mode radius for single-mode log-normal size distributions for black carbon (black) and brown carbon (red) with a range of widths and using complex refractive information from Bergstrom et al. (2002) for black carbon and Sumlin et al. (2018) for brown carbon.
4.2.1 Noteworthy events
Daxing'anling Mountains 1987
The first outlier event identified as smoke in the SAGE II record is associated with a forest fire (sometimes referred to as the Black Dragon fire) in the Daxing'anling Mountains, Heilongjiang, China, between 6 May and 2 June 1987 (Cahoon et al., 1994; Nath and Nath, 2019). Figure 9a shows the 1020 nm extinction coefficient in 1987 in 10 d segments for the 30 to 60∘ N latitude band data in May 1987 (also seen in Fig. 7a). It shows a significant change in extinction coefficient below 15 km that persists through the end of June and possibly into the late summer. The maximum optical depth enhancement is about 0.002, which decreases substantially by the end of June. Figure 9b shows the frequency of LRE enhancements and shows that the peak frequency of this enhancement exceeded 40 % of all SAGE II measurements around Julian day 160 in the lowermost stratosphere and dropped to less than 5 % by the end June. Changes in the extinction ratio are unremarkable as the ratio in the primary aerosol layer decreases from ∼ 3 prior to the event to about 2.7 in the optically densest layer immediately afterwards. Additional observations from space of the Daxing'anling Mountains fire were made by the Stratospheric Aerosol Measurement (SAM II). SAM II is the first in the SAGE series of instruments with observations of the stratospheric 1000 nm aerosol extinction coefficient between 1978 and 1993 and between 60–80∘ in both hemispheres. The aerosol extinction coefficient at 10 km is shown in Fig. 9c with an enhancement shown in beginning around Julian day 150 (1 June) and lasting to around Julian day 220 (8 August). During this period, the measurement latitude slowly changes from 65 to 70∘ N and provided many observations of this smoke-based aerosol. It is possible, in this case, that SAM II provides a better view of this event than SAGE II thanks to the fortuitous timing of where the event occurred and was transported in latitude and time relative to where SAM II was making observations. In general, solar occultation measurements made from platforms in an inclined orbit like those of SAGE II provide broad latitude coverage but require several weeks to do so. As a result, the timing of events relative to measurement latitudes is an additional hurdle to characterizing short-lived phenomena in the stratosphere. Conversely, the Daxing'anling Mountains fire is the only smoke event found in the SAM II record since the timing of observations apparently lacked the requisite serendipity to capture other events such as the Circle Fire of 1990.
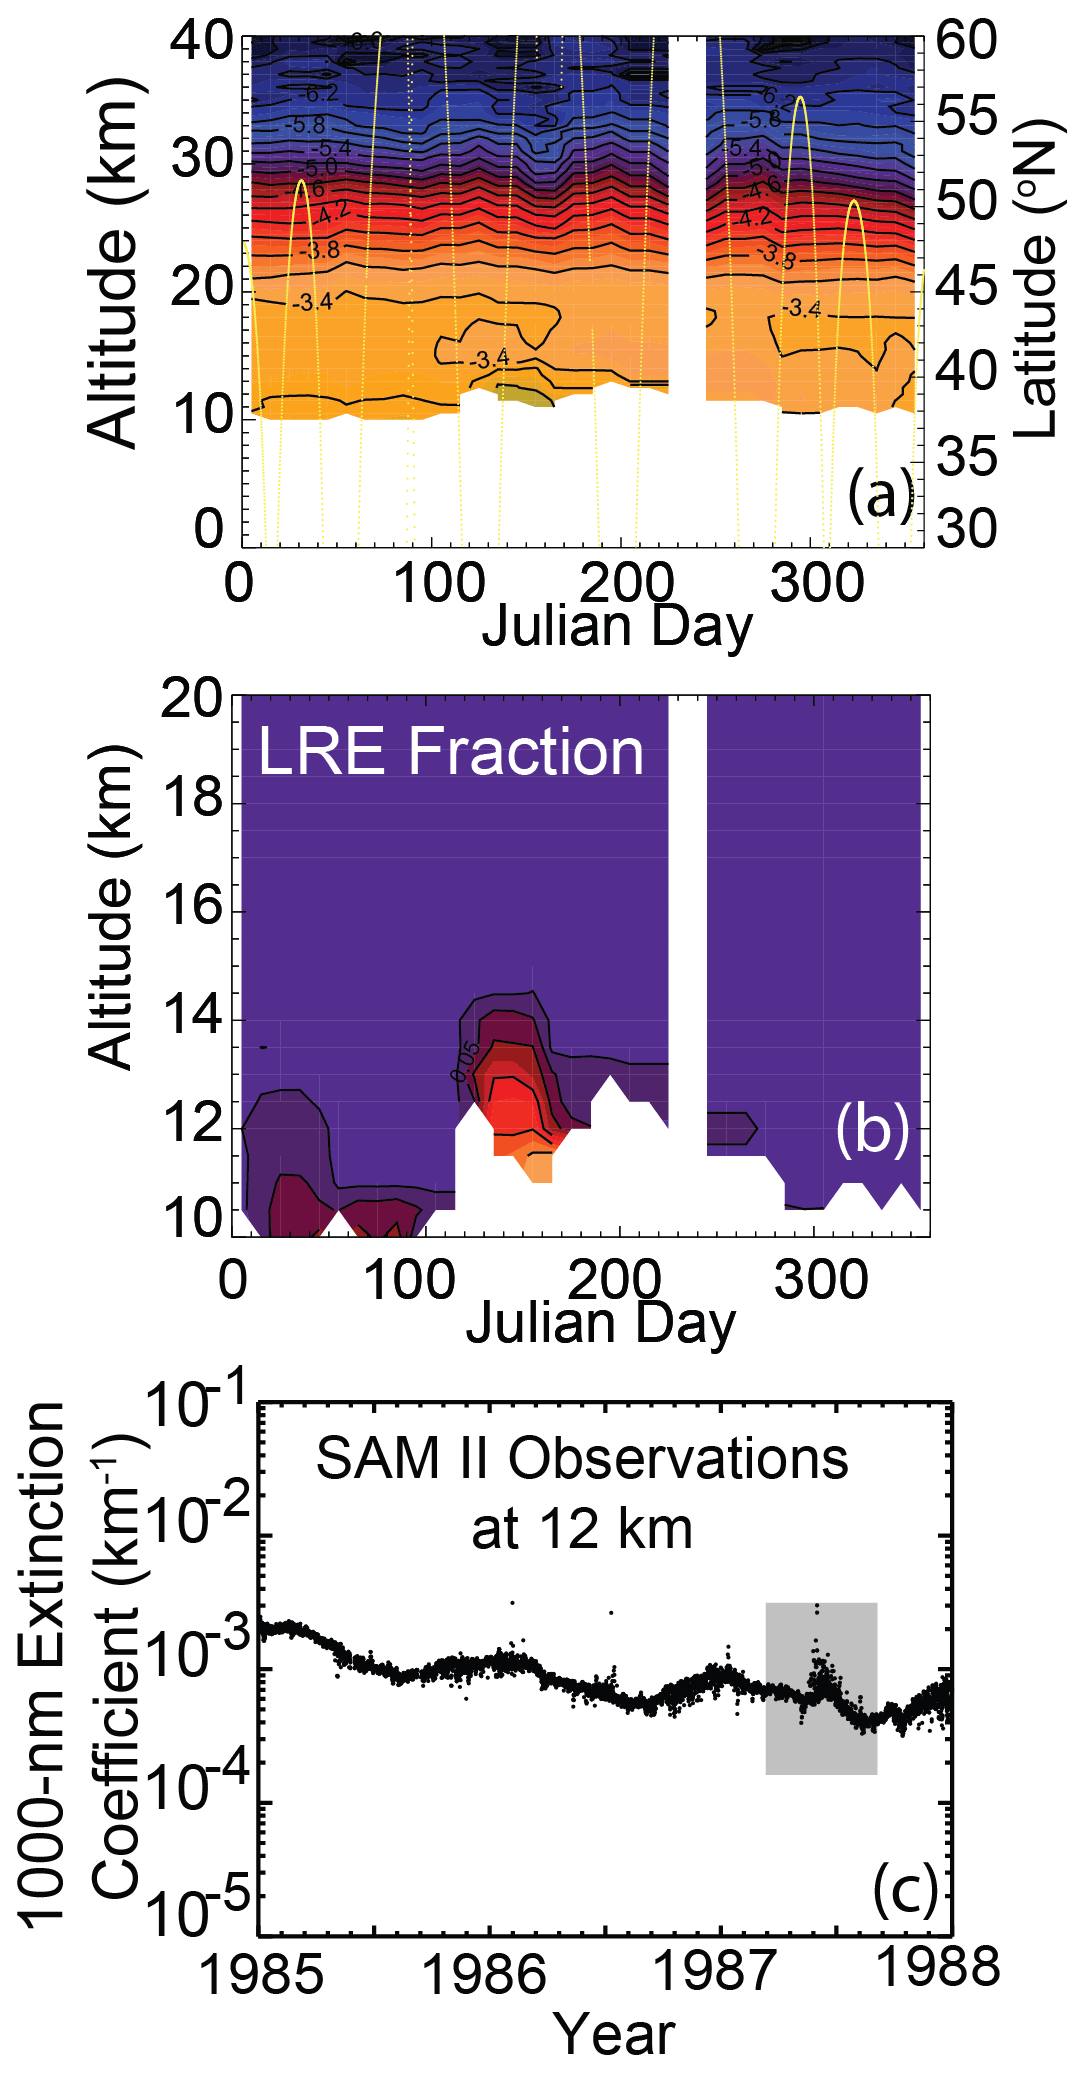
Figure 9SAGE II aerosol data analysis (30–60∘ N) for the 1987 Daxing'anling Mountains event in 10 d averages for the 1020 nm extinction coefficient (a), the LRE fraction based on these data (b), and aerosol extinction coefficient data from SAM II at 12 km with the smoke enhancement highlighted with a gray box. The color bars from Fig. 3 apply to this figure. Contours in the extinction coefficient are spaced in 0.2 increments in log-base-10 space in units of km−1, and the LRE fraction contours are at 0.01, at 0.05, and then every 0.1 from 0.1 to 1.0. Frame (a) also includes the latitude of SAGE observations in yellow.
Circle, Alaska, 1990
The mean zonal 1020 nm extinction coefficient of the Circle, Alaska, fire of 7 July 1990 (Fromm et al., 2010), shown in Fig. 10a, shows an enhanced aerosol extinction starting around Julian day 190 and persisting to around day 300 initially as high as 18 km and with a persistent clear enhancement eventually declining to around 12 km before becoming otherwise undetectable. The peak optical depth enhancement occurs around day 220 with a value on the order of 0.001. There is relatively little change in the mean zonal extinction ratio throughout this event with an average value near 2.8. Conversely Fig. 7b suggests that the largest enhancements have slightly large extinction ratios (> 3) than smaller enhancements. This behavior is reflected in the frequency of LRE and HRE observations shown in Fig. 10b and c. LRE observations dominate the early part of the plume occurring up to 18 km and peaking at 14 km in over 40 % of observations around Julian day 220. HRE events are most common below 13 km and are the dominate enhancement type around Julian day 240 with over 20 % of observations at 11.5 km. The continuous nature of the enhancement shown in Fig. 7b (and observed in subsequent months) suggests that the inference of two types shows the limitations of the LRE and HRE categories as all of this aerosol appears to have the same overall optical character and that, in this case, the asymptotic value is larger than the primary aerosol cluster prior to the event, possibly similar to that observed for the Australian fires of 2019/2020, but incompletely expressed due to the small overall enhancement in aerosol extinction.
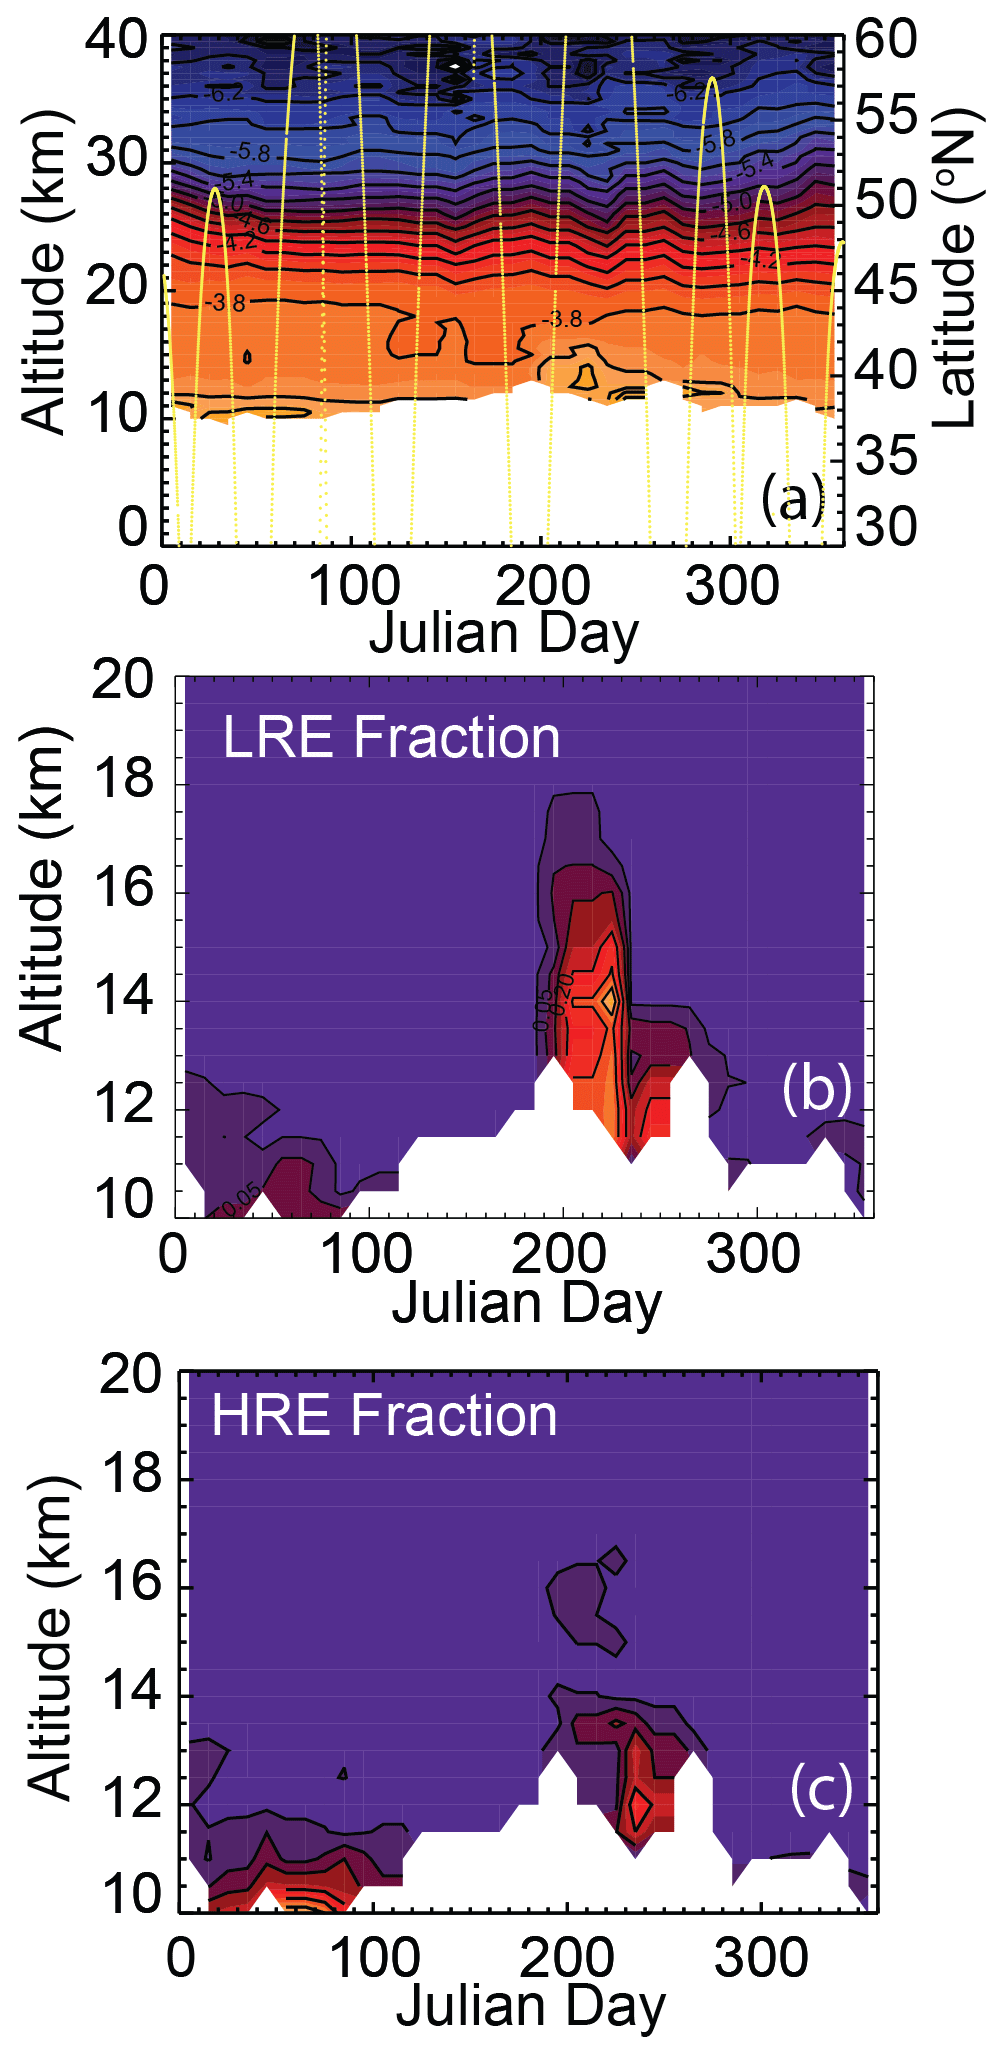
Figure 10SAGE II aerosol data analysis (30–60∘ N) for the 1990 Circle, Alaska, event in 10 d averages for the 1020 nm extinction coefficient (a), the LRE fraction (b), and the HRE fraction (c). Contours in the extinction coefficient are spaced in 0.2 increments in log-base-10 space in units of km−1, and the LRE and HRE fraction contours are at 0.01, at 0.05, and then every 0.1 from 0.1 to 1.0. Frame (a) also includes the latitude of SAGE observations in yellow. The color bars from Fig. 3 apply to this figure. Note that there are no occurrences of LRE or HRE above 20 km.
Chisholm, Canada, 2001
The zonal mean aerosol extinction for 2001 is shown in Fig. 11a with a clear enhancement in the aerosol extinction coefficient associated with the Chisholm, Alberta, fire of 28 May 2001 confined mostly at and below 17 km. This results in a peak optical depth enhancement of about 0.0018, which is close to that for the Daxing'anling Mountains and Norman Wells fires. These three events form a group of similar-sized events as the largest in peak optical depth in the SAGE II data record. Figure 11b shows that the overall frequency of LRE observations in the early summer peaks near 30 % of all observations at 13.5 km and exceeds 10 % over a broad range of altitudes below 17 km. Despite the low overall frequency of observations of the enhanced aerosol coefficient, the aerosol extinction ratio appears to asymptote toward 2 with the increasing aerosol extinction coefficient in manner similar to the Norman Wells event. It is possible that the 7 August eruption of Bezymianny (Russia) (Global Volcanism Report, 2001), which had a plume height reported by ground observers of about 10 km, is responsible for the enhanced frequency of LRE observations below 13 km around Julian day 190 when LRE frequencies reach 70 %, though the overall extinction coefficient enhancement is low. All of the enhancements in the summer of 2001 are located in the LRE zone except, as shown in Fig. 11c, a few HRE observations that appear in August 2001 near 14 km, which, given the timing, may also be associated with the Bezymianny eruption.
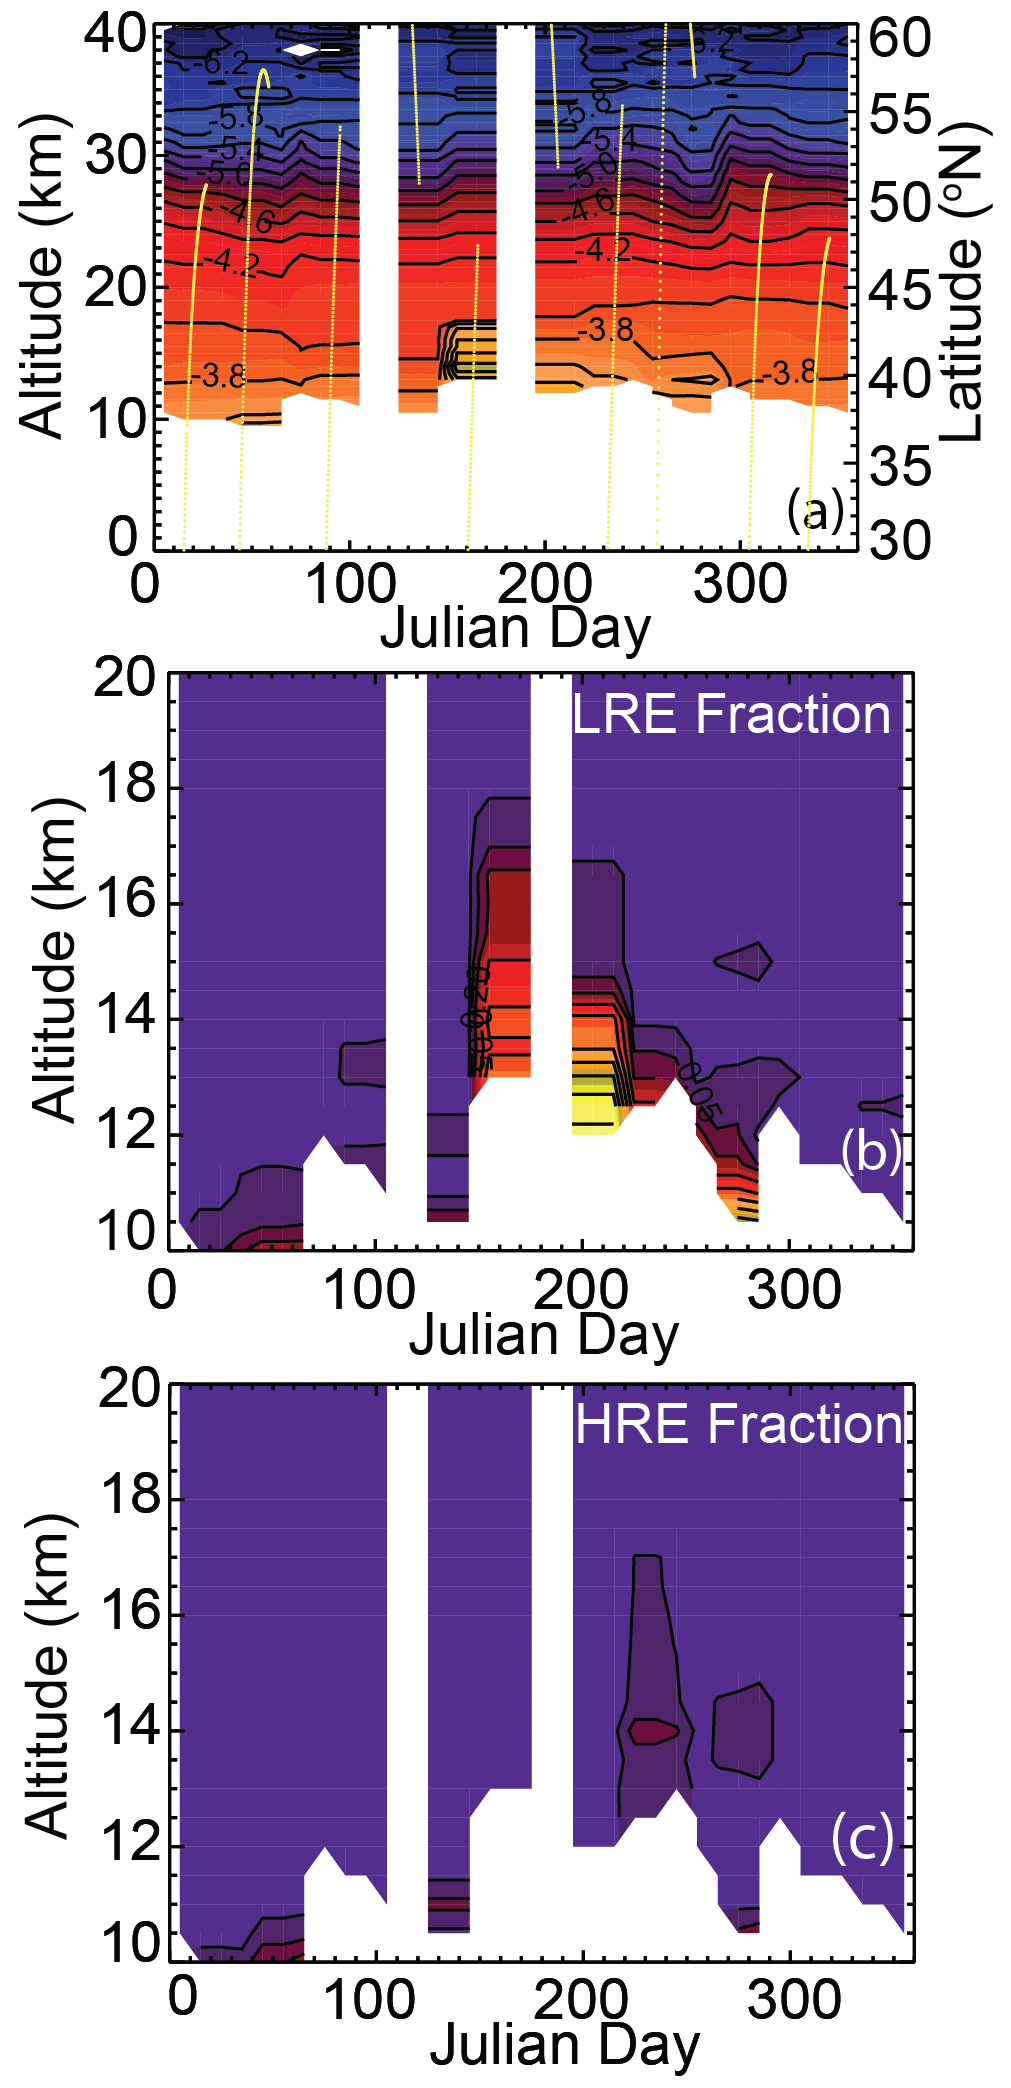
Figure 11SAGE II aerosol data analysis (30–60∘ N) for the 2001 Chisholm, Alberta, Canada, event in 10 d averages for the 1020 nm extinction coefficient (a), the LRE fraction (b), and the HRE fraction (c). Contours in the extinction coefficient are spaced in 0.2 increments in log-base-10 space in units of km−1, and the LRE and HRE fraction contours are at 0.01, at 0.05, and then every 0.1 from 0.1 to 1.0. Frame (a) also includes the latitude of SAGE observations in yellow. The color bars from Fig. 3 apply to this figure.
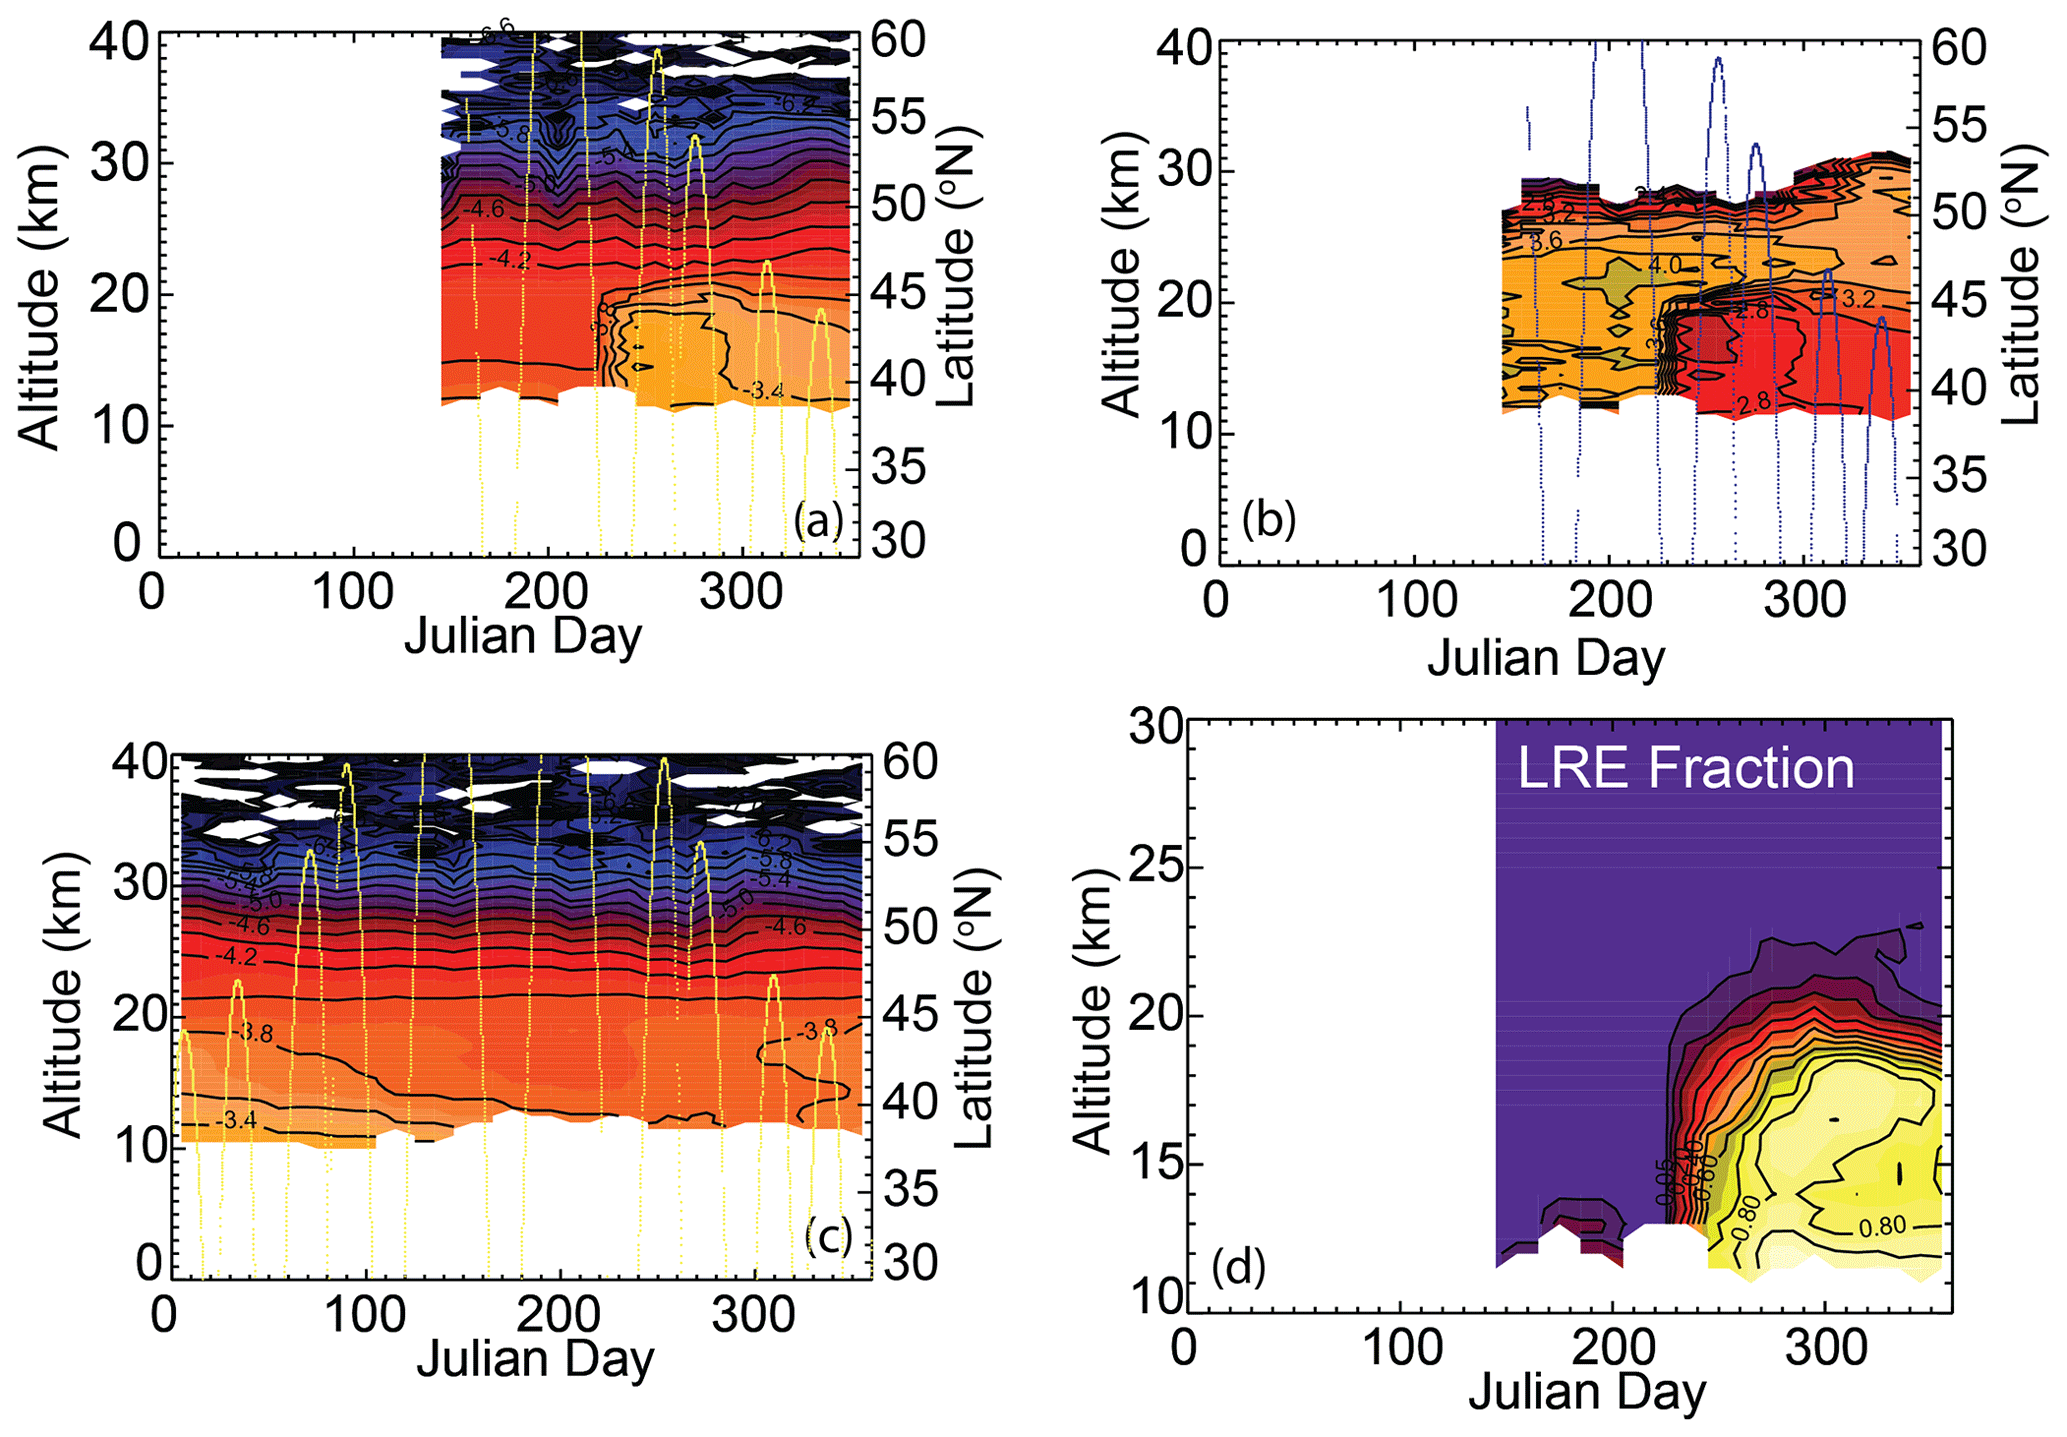
Figure 12SAGE III/ISS 1020 nm aerosol data analysis for the British Columbia event of 2017 (30–60∘ N) in 10 d averages for the 1020 nm extinction coefficient (a) and aerosol extinction ratio (b). SAGE III/ISS 1020 nm aerosol data analysis in 10 d averages for the 1020 nm extinction coefficient in 2018 (c) and LRE fraction in 2017 (d). Contours in the extinction coefficient are spaced in 0.2 increments in log-base-10 space in units of km−1. Extinction ratio contours are spaced in 0.2 increments, and contours in the LRE fraction occur at 0.01, at 0.05, and then every 0.1 from 0.1 to 1.0. The color bars from Fig. 3 apply to this figure. Frames (a) and (c) also include the latitude of SAGE observations in yellow while frame (b) shows them in blue.
British Columbia fire
The data record for the SAGE III mission aboard the International Space Station began in June 2017 and was followed 2 months later by the British Columbia fire of August 2017 (Bourassa et al., 2019), which substantially surpassed all the smoke events observed by SAGE II in 20+ years of observations. Figure 12a shows the zonal mean 1020 nm extinction coefficient for northern mid-latitudes in 2017, from which we infer a 1020 nm optical depth increase of 0.0037 or almost double the maximum optical depth enhancement observed by SAGE II (0.002). This enhancement is the largest observed by a SAGE instrument in the Northern Hemisphere. The extinction ratio, shown in Figs. 7f and 12b, appears to asymptote toward 2 with the increasing extinction coefficient in a pattern that is similar to that seen in smaller events like Norman Wells. The figure shows that the fire-related aerosol is initially located primarily below 19 km but rises to 23 km in the months following the event possibly due to diabatic self-lofting of aerosol (Bourassa et al., 2019). In Fig. 12c, the aerosol extinction coefficient enhancement for 2018 shows that the enhancement can be easily seen as late as mid-2018 or for about 1 year after the event. This is due to a combination of factors including the size of the enhancement in an otherwise fairly low aerosol period and due to the lofting leading to a longer residence time in the stratosphere compared to the smaller events observed by SAGE II. Essentially, all of the enhanced aerosol occurs as LRE, and the frequency of these types, as shown for 2017 in Fig. 12d, reaches 50 % of all observations below 22 km by Julian day 240 and 80 % by Julian day 270, where it remains through the rest of the calendar year. The extent and longevity of the enhanced aerosol stands out compared to its SAGE II equivalents.
Australian fires of 2019/2020
By far the largest fire-related perturbation to the stratosphere is associated with the widescale 2019/2020 Australian brush fires. These fires began as early as September 2019 and persisted into February 2020 and produced large stratospheric impacts. For the purposes of the analysis of this event, we expand the usual time frame from a single year to 2 full years to facilitate understanding the scope of this event. Figure 13a shows the 10 d average 1020 nm extinction coefficient for 30 to 60∘ S for 2019 and 2020. Despite significant fire activity in late 2019 and particularly in December 2019, there is little evidence of significant intrusions of smoke that pass TBA filtering until early January 2020 (around Julian day 370 where day 1 is 1 January 2019) when a distinct layer around 17 km is noted. In the second half of that month into February a substantial enhancement is noted over a broad range of altitudes. SAGE III/ISS observations between Julian days 370 and 420 show enhanced aerosol primarily located below 20 km but with some enhancement between 15 and 27 km in a distinct layer. While the highest extinctions in the densest parts of the layer begin their recovery toward prior aerosol levels, there is clearly an enhancement in the mean extinction coefficient above 20 km that eventually stretches as high as 33 km. The peak optical depth for this band is 0.011 or about 3 times the maximum optical depth enhancement from the British Columbia fire of 2017 and over 5 times larger than any non-volcanic enhancement seen in the SAGE II record. Overall, the enhancement in the aerosol extinction coefficient remains clearly visible in this latitude band through the middle of 2021.
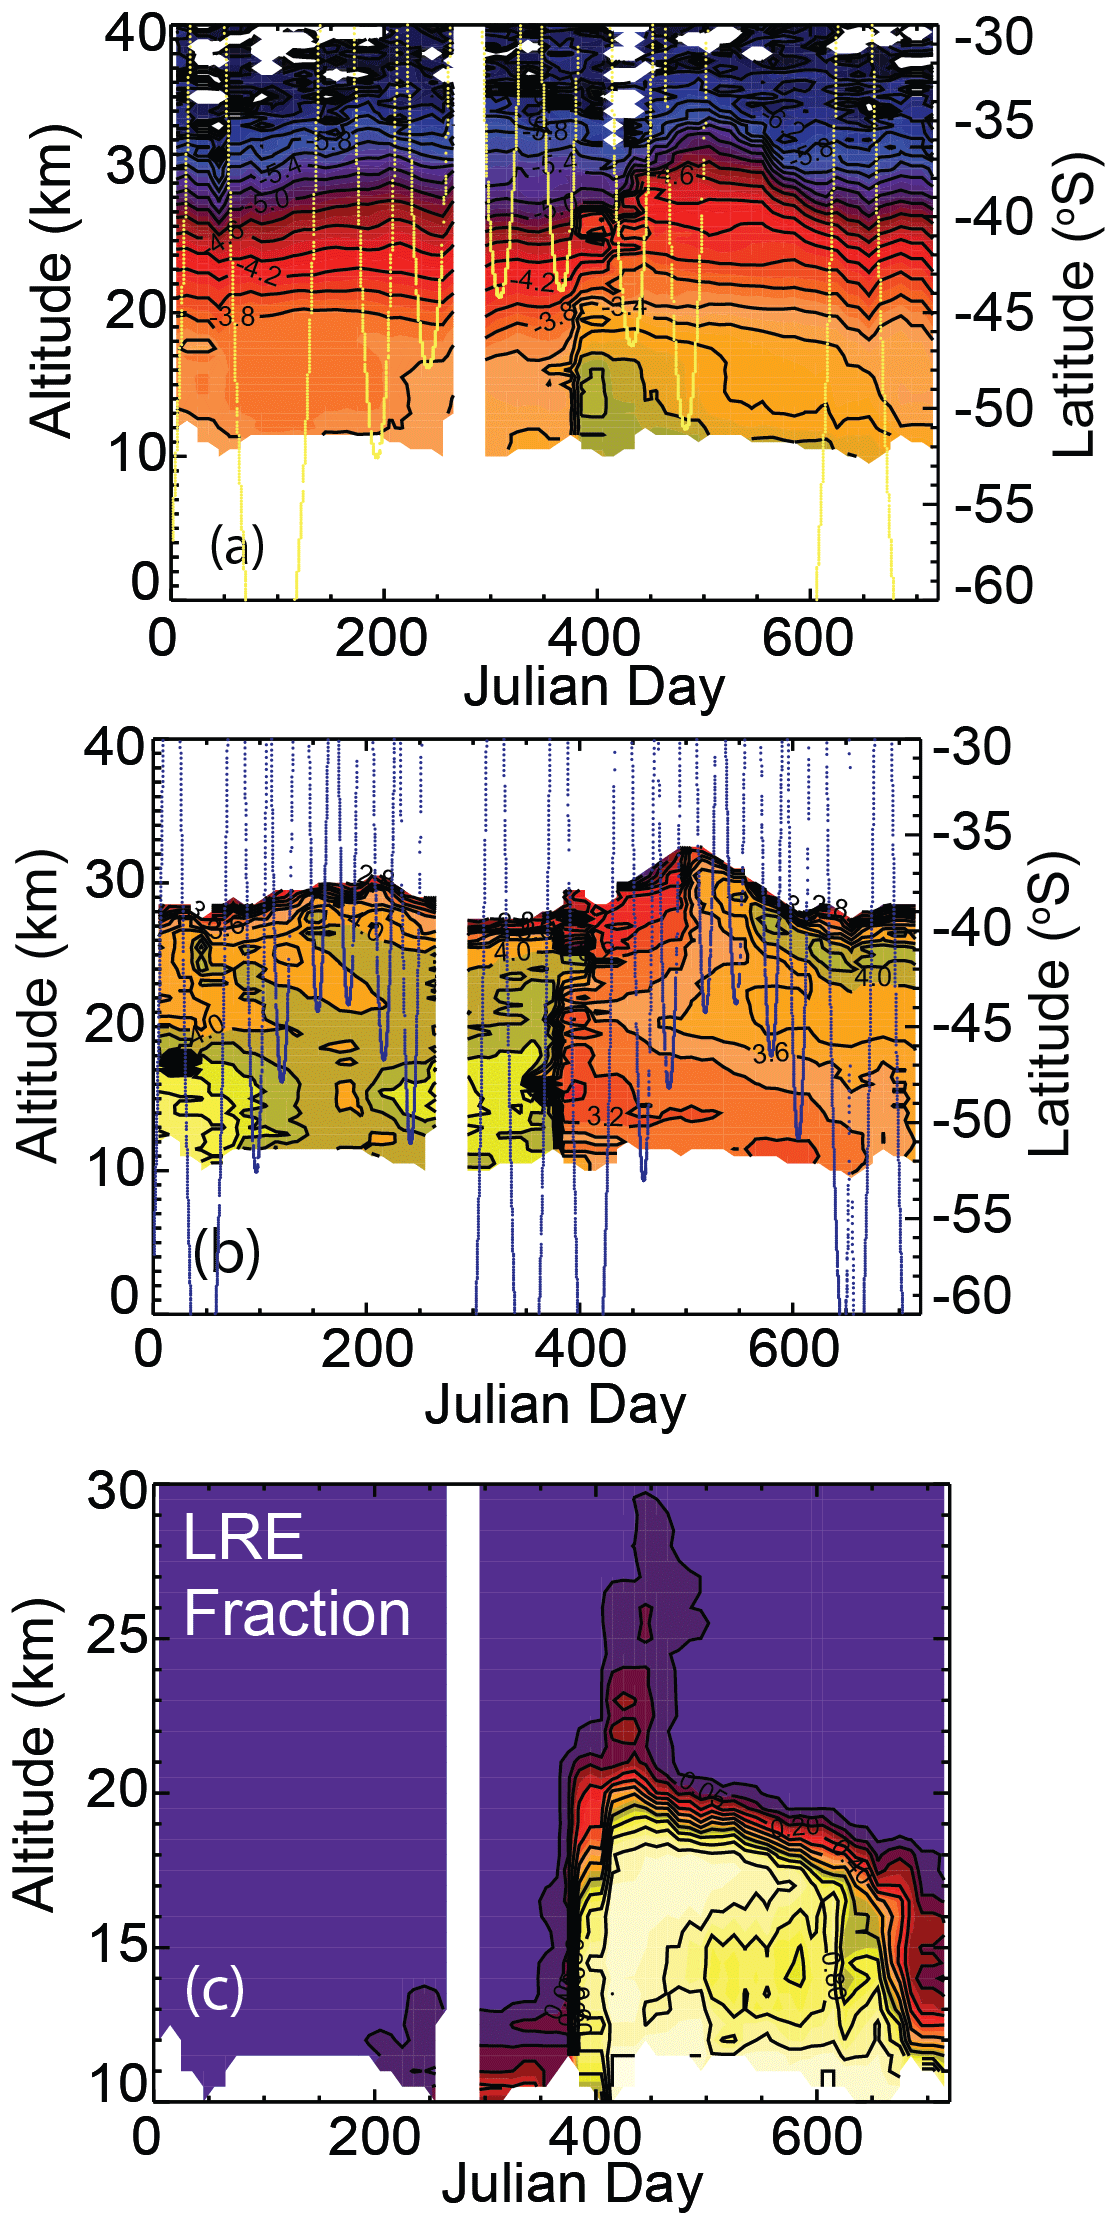
Figure 13SAGE III/ISS 1020 nm aerosol data analysis for the Australian fires of 2019/2020 (30–60∘ S) in 10 d averages for the 1020 nm extinction coefficient (a), aerosol extinction ratio (b), and LRE fraction (c). Note that the analysis spans 2 calendar years. Contours in the extinction coefficient are spaced in 0.2 increments in log-base-10 space in units of km−1. Extinction ratio contours are spaced in 0.2 increments, and contours in the LRE fraction occur at 0.01, at 0.05, and then every 0.1 from 0.1 to 1.0. The color bars from Fig. 3 apply to this figure. Frames (a) and (b) also include the latitude of SAGE observations in yellow and blue, respectively.
As with other events shown in the analysis, the aerosol extinction ratio tends to asymptote toward a fairly consistent value with the increased extinction coefficient. In other events the asymptotic value has been on the order of 2, but with this event, as shown in Fig. 13b, the value is closer to 3. This suggests some difference in the properties of the aerosol that comprise this event though, as previously discussed, it is not possible to infer exactly what those differences are beyond that they are likely some combination of factors that modify the refractive index of the aerosol and/or the size of the aerosol. Figure 13c shows that essentially all of the aerosol enhancements for this event fall into the LRE category. Aerosol of this type become dominant below 15 km around Julian day 370 as over 80 % of all observations. This becomes essentially all observations below 18 km through Julian day 600, but the frequency decreases rapidly after that to just a few percent of all observations by the end of 2020. It is interesting to note that while the enhancement of the aerosol extinction coefficient to such unusual altitudes is extremely interesting, they are, by the counting mechanism employed herein, identified in at most 1 % of all events above 25 km and at most 10 % for all events above 20 km.
August Complex, California
Despite their common name, the August Complex fires of 2020 are a series of fires in California that span from August through October of that year (Keeley and Syphard, 2021). For this event, as shown in Fig. 14a, enhanced aerosol is observed in the SAGE III/ISS data from Julian day 244 (September) through the end of the year that yields a maximum 1020 nm optical depth enhancement of about 0.001. Unlike other events where the maximum optical depth occurs over a narrow time frame, the maximum for the August Complex occurs in a broad period encompassing October through the end of the year. The extinction ratio, shown in Fig. 14b, shows a distinct minimum below 15 km beginning about day 290 and extending to the end of the year. Like other events, at the largest extinction coefficient values despite low overall frequency of enhanced aerosol, the asymptotic value is close to 2, though the overall frequency of enhanced aerosol exceeds 1 % (and never 5 %) mostly between 12 and 16.5 km after about Julian day 250.
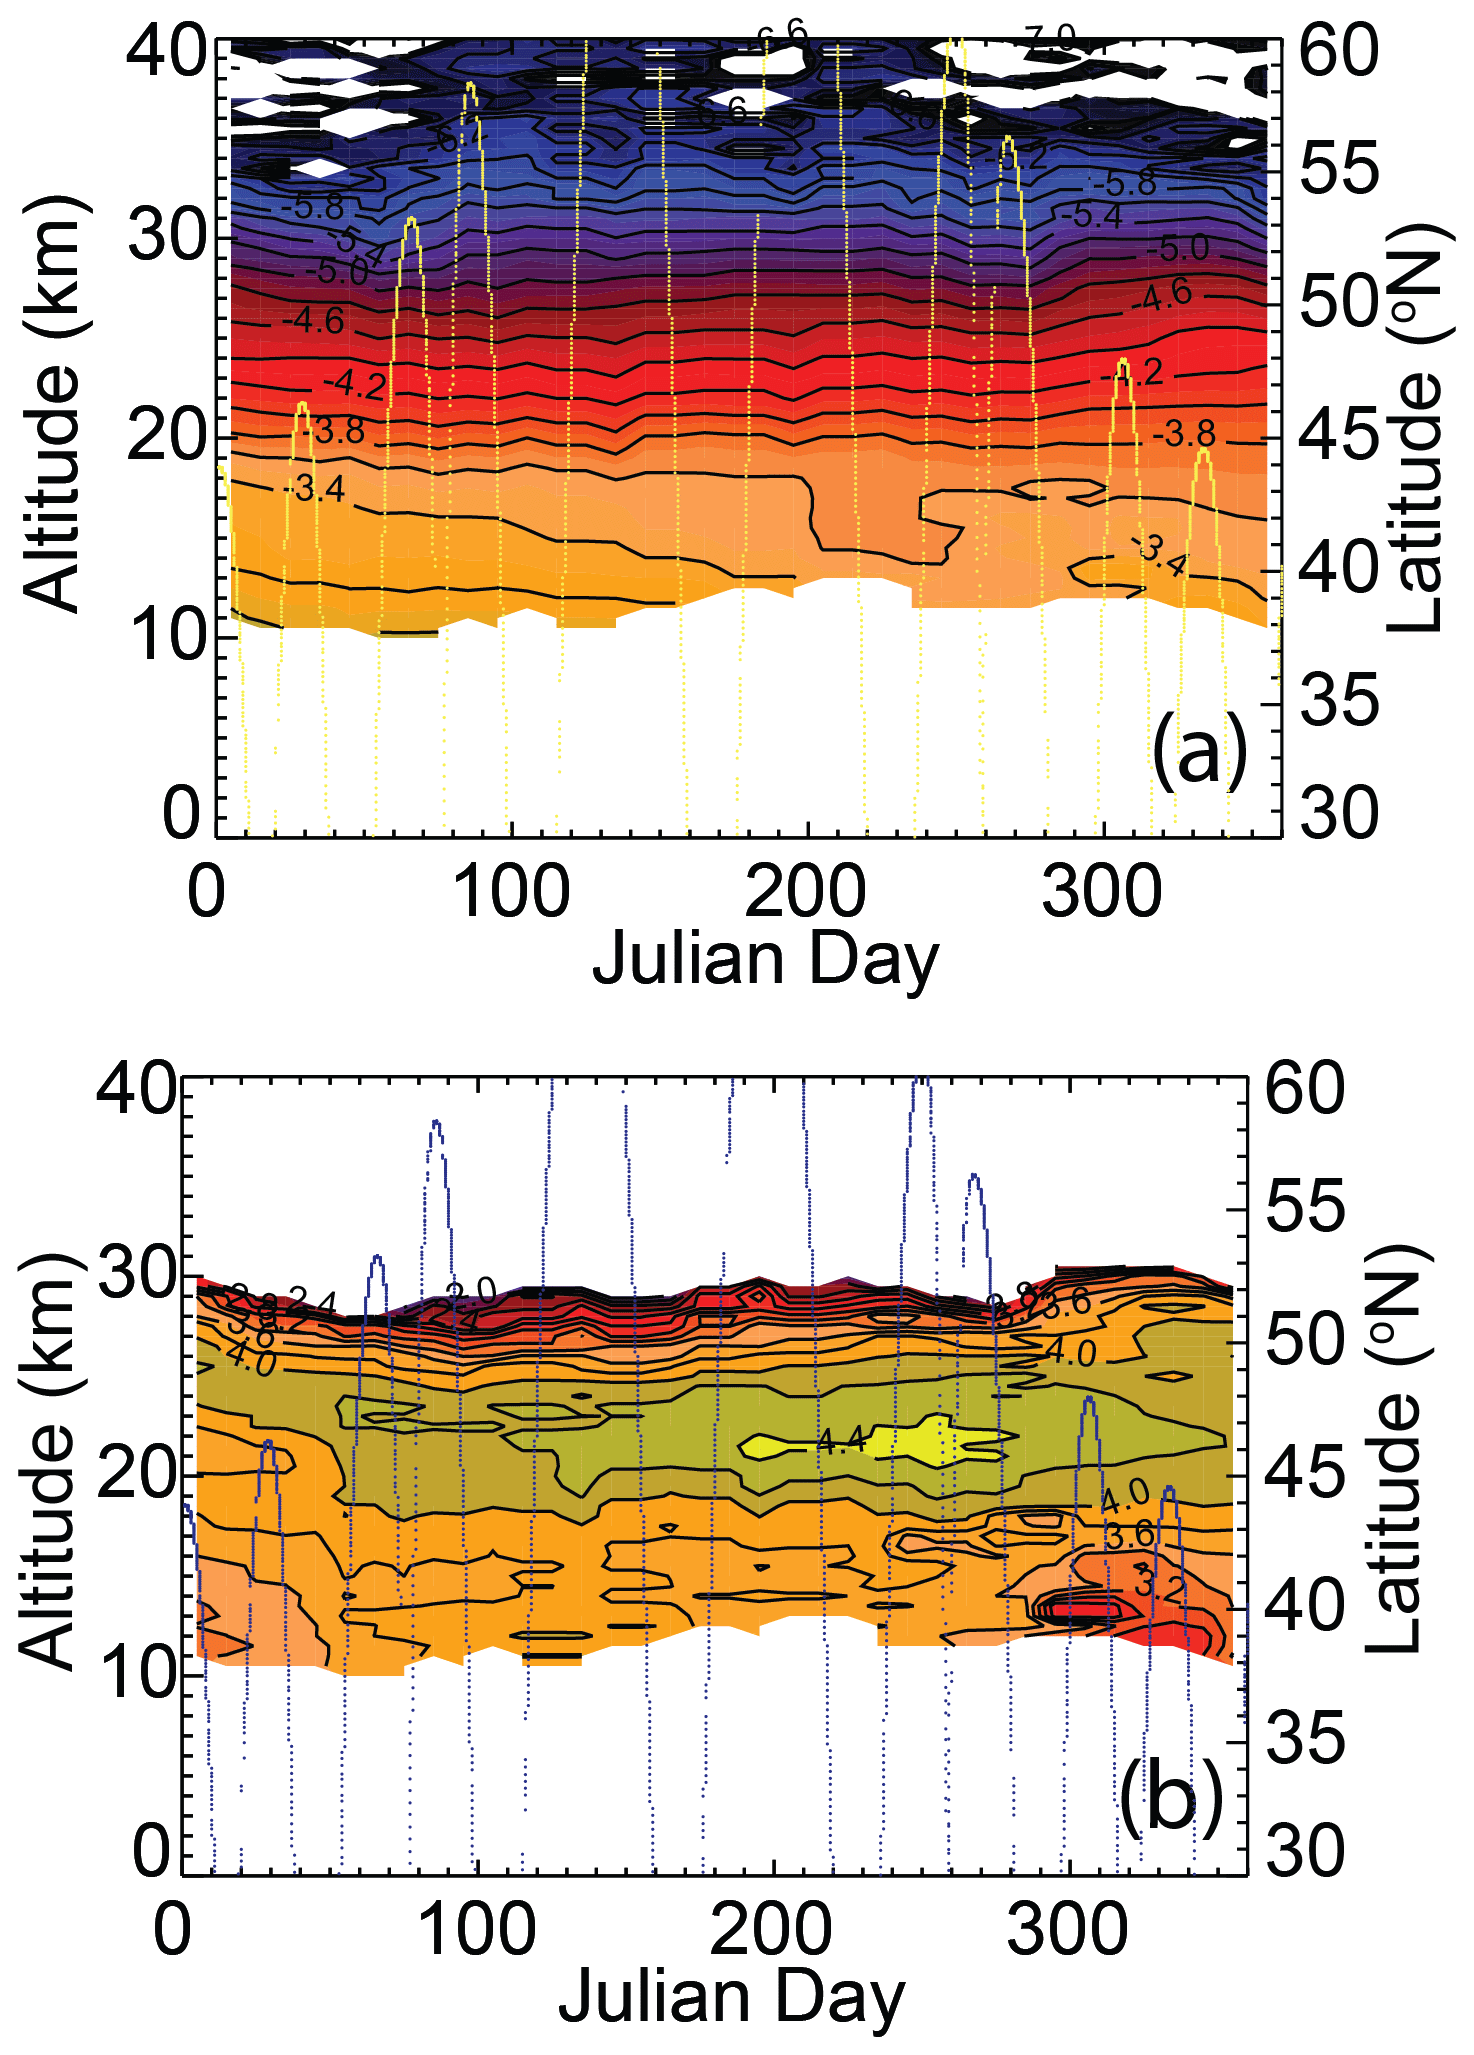
Figure 14SAGE III/ISS 1020 nm aerosol data analysis for the 2020 August Complex in California (30–60∘ N) in 10 d averages for the 1020 nm extinction coefficient (a) and aerosol extinction ratio (b). Note that the analysis spans 2 calendar years. Contours in the extinction coefficient are spaced in 0.2 increments in log-base-10 space in units of km−1. Extinction ratio contours are spaced in 0.2 increments. The color bars from Fig. 3 apply to this figure. Frames (a) and (b) also include the latitude of SAGE observations in yellow and blue, respectively.
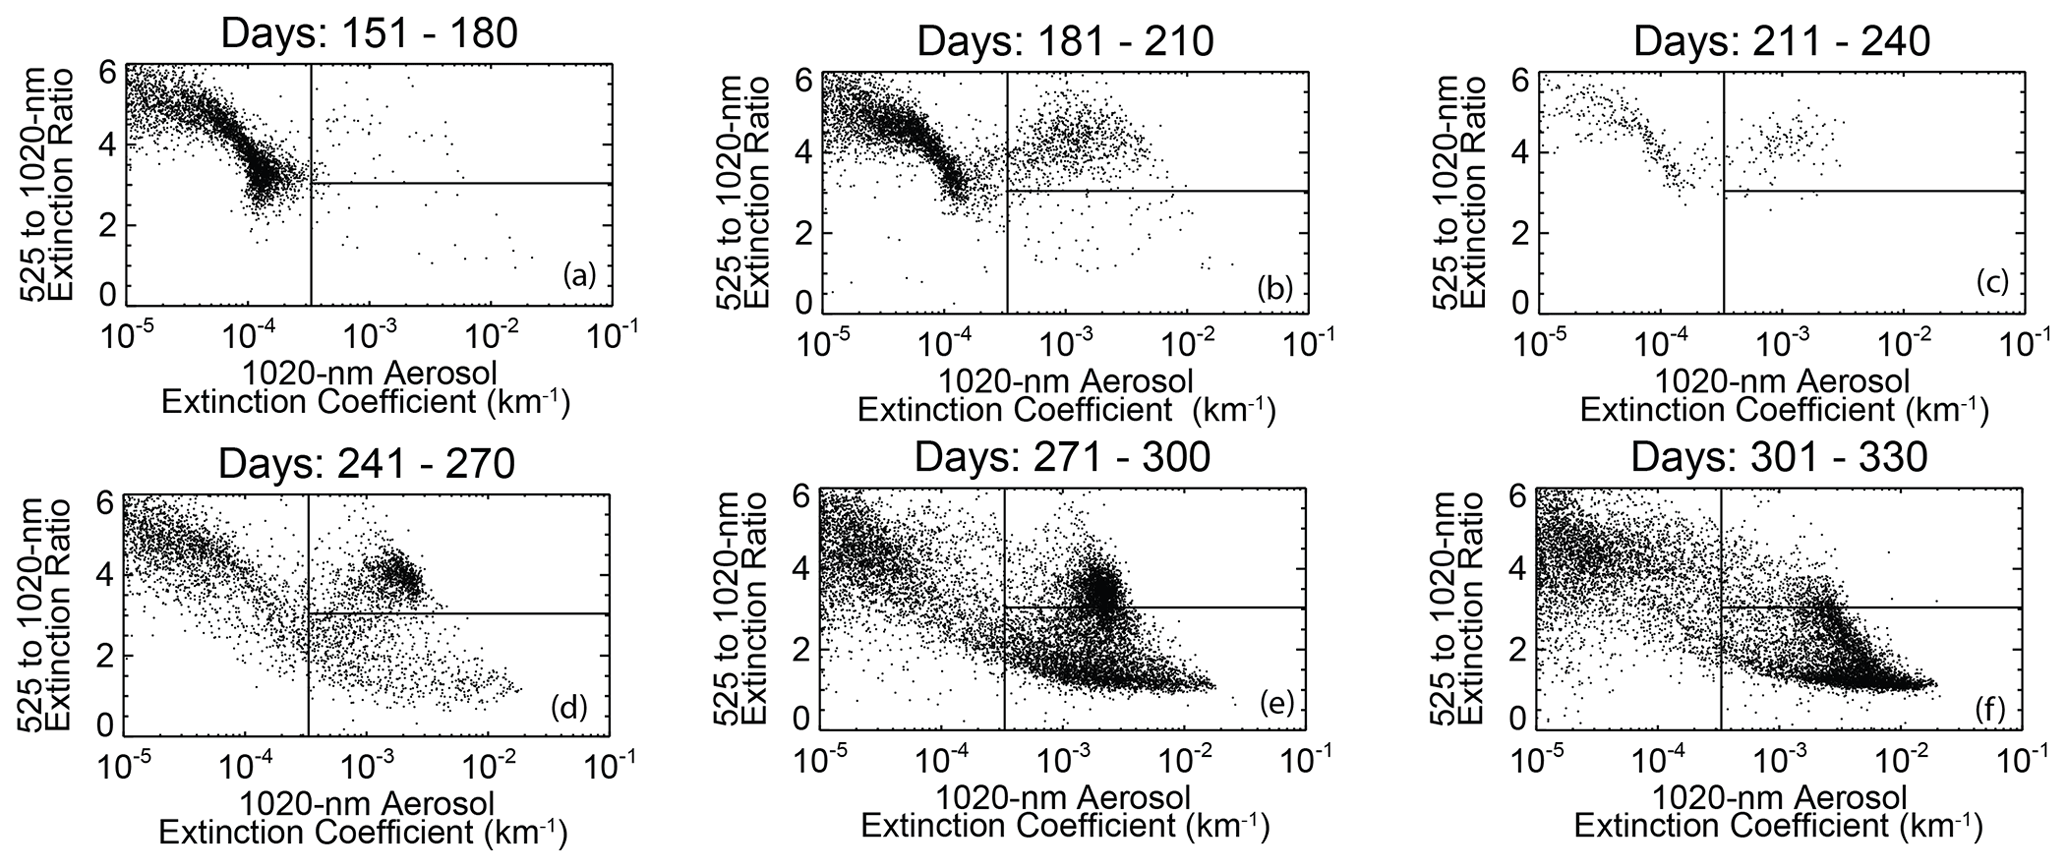
Figure 15SAGE II 1020 nm aerosol extinction coefficient data plotted versus the 525 to 1020 nm extinction coefficient ratio for Julian day periods from 151–180 (∼ May) through 301–330 (∼ November) in the Northern Hemisphere in 1991.
The eruption of Mt. Pinatubo (15∘ N) in June 1991 is by far the largest stratospheric aerosol perturbation of the space-based measurement era (after 1978), increasing the stratospheric optical depth in the tropics to levels in excess of 0.2 (Kovilakam et al., 2020) and creating a global stratospheric aerosol enhancement that persisted until about 2000. This event had its first major eruption on 12 June (day 163), with others leading up to a main eruption on 16 June (day 167). Figure 15 shows the scatter plots of the 1020 nm extinction coefficient versus extinction ratio for 1991 for 30 d periods from Julian day 151 through Julian day 330. These plots are quite different than those for those fire events described above as they show a clear cluster of observations occurring in the HRE space that forms with a center near the extinction coefficient of 0.001 km−1 and an extinction ratio of 4 that grows in frequency through at least the 271–300 period with a similar extinction coefficient value but with a slowly decreasing extinction ratio. This cluster was initially interpreted by Thomason (1992) as a new particle size mode created by the Mt. Pinatubo eruption. Later interpretations (Fromm et al., 2010; Gerasimov et al., 2019) noted the likely presence of smoke from the Baie-Comeau (49∘ N) fire (24–30 June 1991; Julian days 175–181), and Fromm et al. (2010) suggested that the ubiquitous observation of enhanced aerosol in the summer of 1991 was primarily associated with the fire event, while observations from Tomsk, Russia (56∘ N) (Gerasimov et al., 2019), suggest the presence of aerosol from Pinatubo in the lower stratosphere by mid-July. If the former assessment is correct, then the Baie-Comeau event would be a candidate for the largest smoke event in the SAGE record, and thus a critical analysis of this pair of events is important.
Initially, the scatter of the enhanced aerosol extinction coefficient in northern mid-latitudes (30–60∘ N) for Julian day periods from 151–180 shows a mix of enhancements that are dispersed across both the LRE and HRE regions. These data primarily occur in the last week of June, so potentially appropriate for either source. However, the HRE events occur exclusively at latitudes below 40∘ N and increase in frequency toward 30∘ N in an altitude range between 12 and 18 km and are observed beginning on day 174. The early LRE observations also occur primarily below 40∘ N in the altitude range between 13 and 19 km but do not appear consistently until Julian day 178. There is a gap in observations in this latitude band between Julian days 182 and 200. By Julian days 201–210, both enhancement types are observed over a broad range of latitude primarily below 20 km. In the 211–240 Julian day period, when the total number of observations are relatively low, we observe essentially no LRE-enhanced observations but an increased relative frequency of HRE enhancements which are shown in Fig. 16a for all of 1991. Here we see the low frequency of HRE events in late June becoming, by day 200, nearly all of the observations below 15 km with substantial presence up to 20 km. The high frequency of HRE observations persists until Julian day 300 when the combination of LRE enhancements at these altitudes and a loss of data due to the overall stratospheric opacity of the stratosphere due to the Mt. Pinatubo eruption effectively terminate HRE observations. Observations by SAGE II in the southern mid-latitudes are informative. Figure 17a shows the distribution of observations for Julian days 211–240, which, while not identical to Northern Hemisphere observations, is very similar to the Northern Hemisphere shown in Fig. 15d (the same time period) with a mix of observations in both LRE and HRE areas. In Fig. 17b, the frequency of HRE observations is less extensive than in the Northern Hemisphere but still nearly ubiquitous below 15 km after Julian day 220. These must be associated with the Mt. Pinatubo eruption and cannot be related to the Baie-Comeau fire.
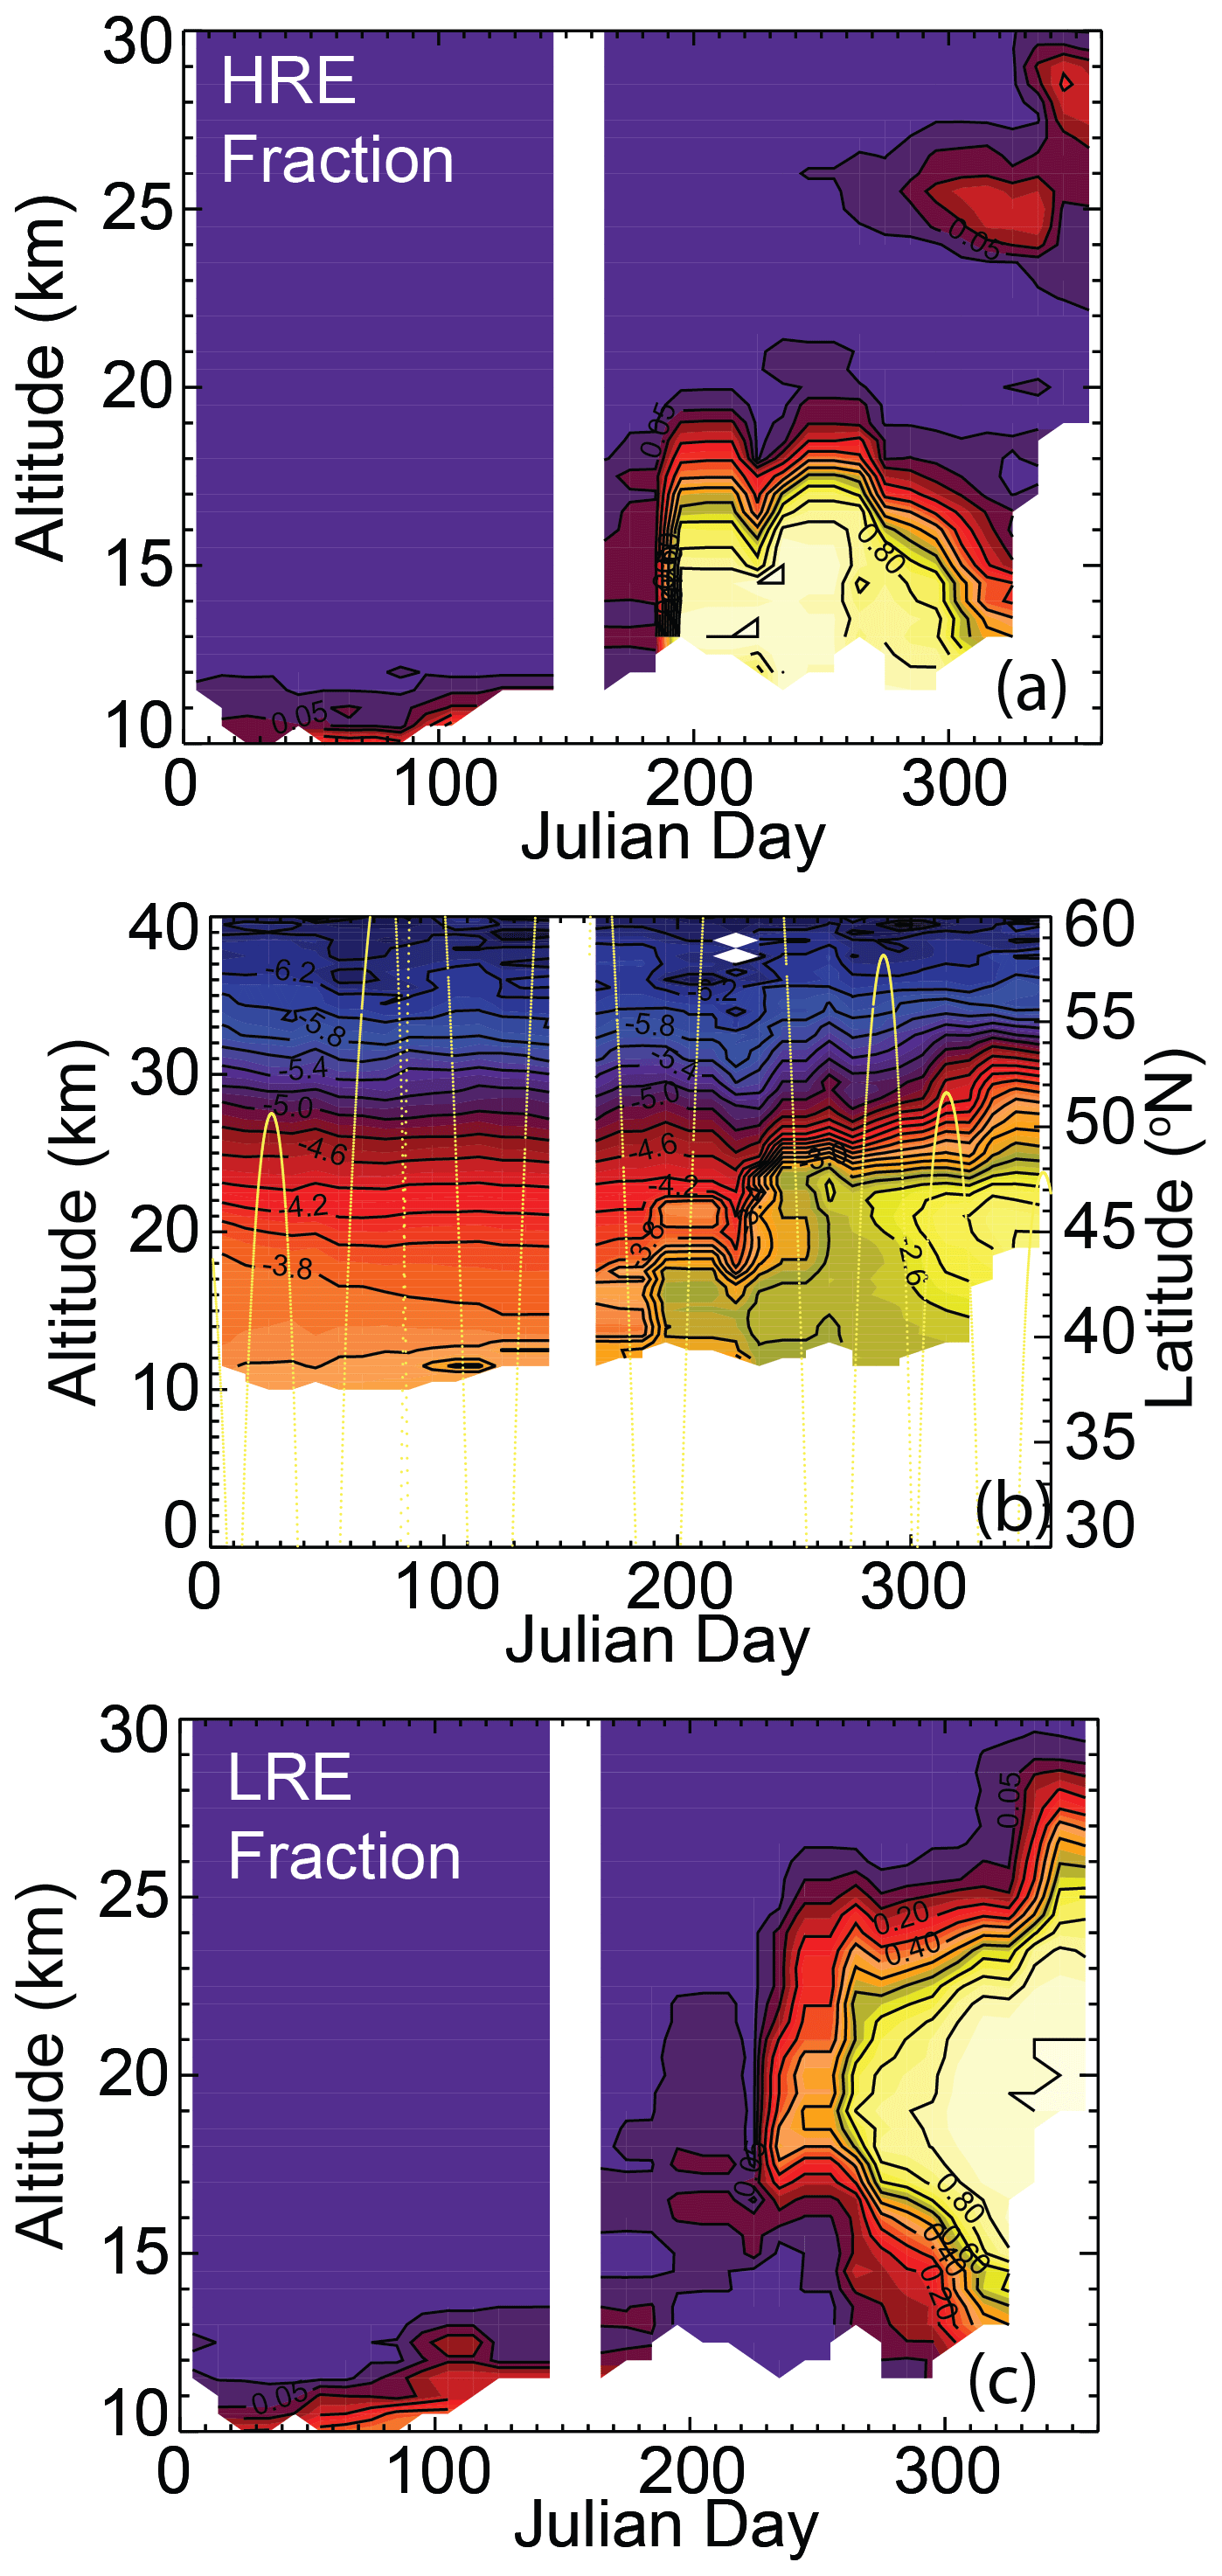
Figure 16SAGE II 1020 nm aerosol data analysis for 1991 (30–60∘ N) in 10 d averages for the HRE fraction (a), 1020 nm extinction coefficient (b), and LRE fraction (c). Contours in the extinction coefficient are spaced in 0.2 increments in log-base-10 space in units of km−1. Contours in the HRE and LRE fraction occur at 0.01, at 0.05, and then every 0.1 from 0.1 to 1.0. The color bars from Fig. 3 apply to this figure. Frame (b) also includes the latitude of SAGE observations in yellow.
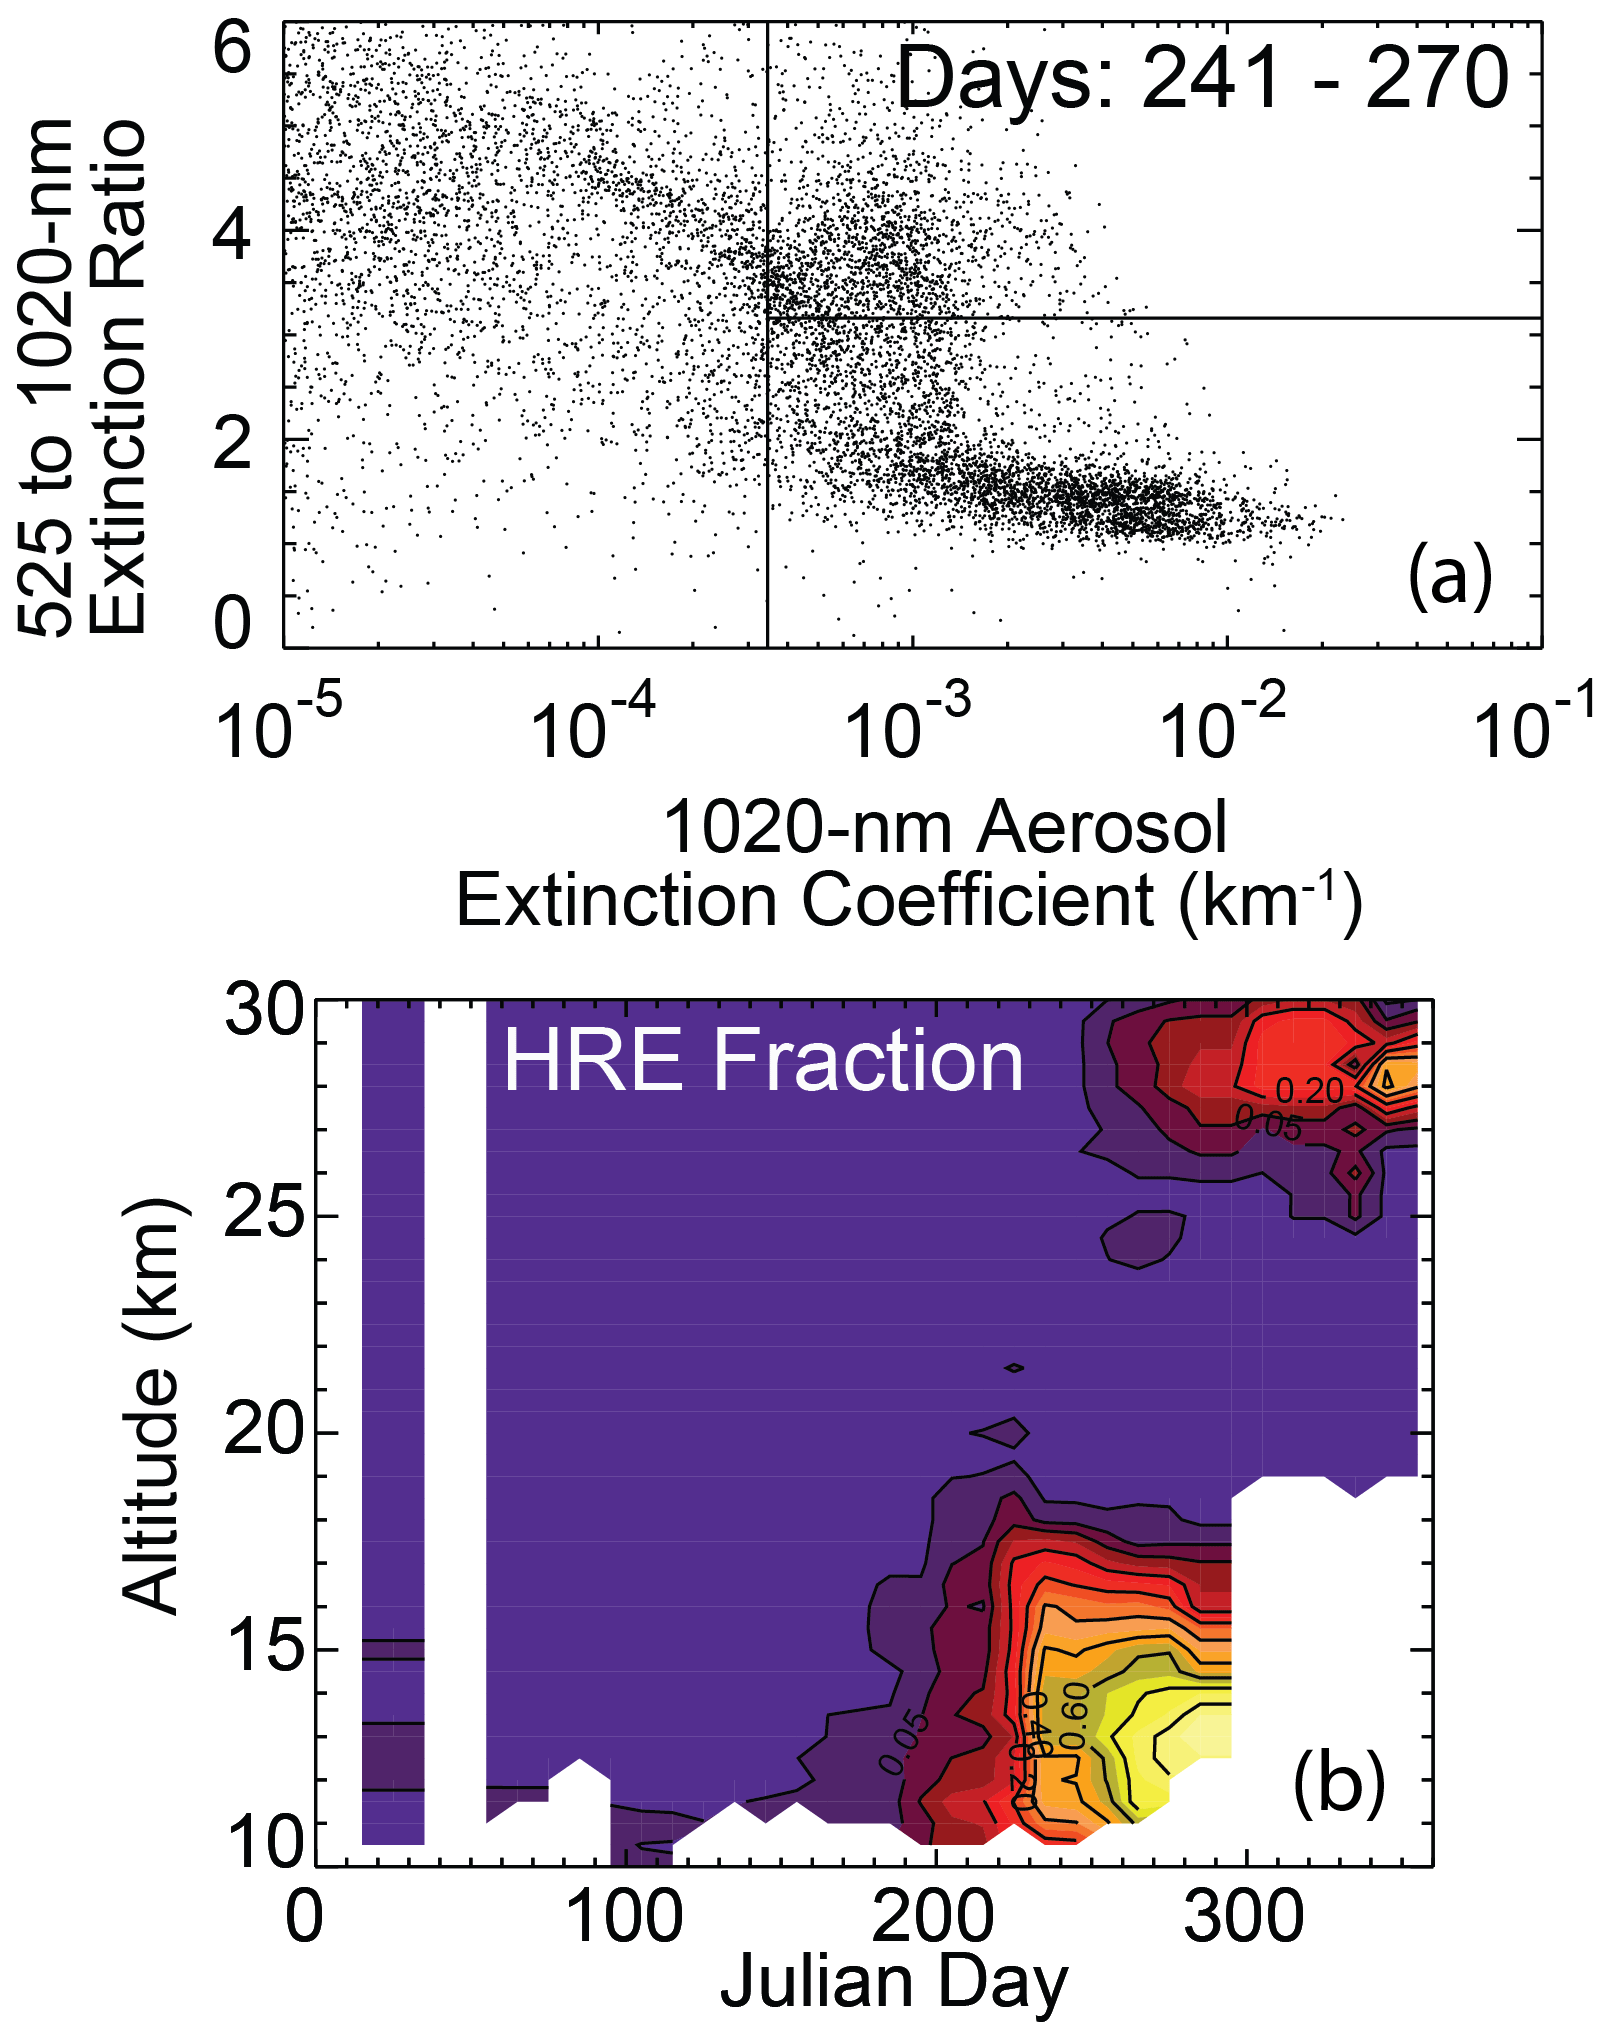
Figure 17SAGE II 1020 nm aerosol extinction coefficient data plotted versus the 525 to 1020 nm extinction coefficient ratio for 1991 with all data above 1.5 km above the tropopause between 30 and 60∘ S for Julian days 241–270 (a) and the HRE fraction (c). Contours in the HRE fraction occur at 0.01, at 0.05, and then every 0.1 from 0.1 to 1.0. The color bars from Fig. 3 apply to this figure.
It is interesting that there are also HRE observations made above 25 km after the denser parts of the Mt. Pinatubo arrive in both hemispheres. This suggests that the HRE observations in this period could be related to the mechanism suggested by Thomason et al. (2021). This paper addresses the observed behavior of small to moderate eruptions and how the extinction ratio is related to the extinction coefficient enhancement in the core of these eruptions. These events show a tendency to have a high extinction ratio for smaller extinction coefficient enhancements and are thus similar to HRE observations. It is plausible that less optically dense parts of a much larger event like Mt. Pinatubo's 1991 eruption could produce similar increases in the extinction ratio. In fact, the center of the HRE cluster in Fig. 15b has an extinction ratio of ∼ 4 for an extinction coefficient enhancement of 0.001 km−1 that is consistent with the relationship shown in Fig. 8b of Thomason et al. (2021). This process may come into play in the lower altitudes where extinction coefficient levels are low but also in the high altitudes above the main aerosol layer where, as shown in Fig. 16a, observations of HRE aerosol are inferred above optically dense portions of the aerosol layer as shown in the 1020 nm extinction coefficient analysis for 1991 depicted in Fig. 16b. Alternatively, as shown in Fig. 8, the aerosol extinction ratio in the range observed during this period is nominally possible with a brown carbon composition. However, no other SAGE-observed smoke event produces a significant number of HRE observations and much less such a unique HRE feature. When seen in conjunction with the Southern Hemisphere observations, this makes the association of aerosol enhancements in the Northern Hemisphere in the summer of 1991 with the Baie-Comeau fire rather than the Mt. Pinatubo eruption untenable as one is forced to infer a completely different mechanism for the formation of these aerosol than any other pyrocumulus or fire-related event seen by a SAGE instrument from a fire event that is otherwise unremarkable. LRE events, shown in Fig. 16c, occur at low frequencies below 22 km until about Julian day 240, when they become common between 17 and 25 km and dominate below 28 km by the end of the year as the Mt. Pinatubo aerosol spreads across the Northern Hemisphere.
We do not exclude the presence of smoke in the northern mid-latitudes during the summer of 1991. The works by Fromm et al. (2010) and by Gerasimov et al. (2019) suggest that smoke is present in the lower stratosphere through at least July. For instance, using back-trajectory analysis, Fromm et al. (2010) showed that an isolated but extremely enhanced SAGE II aerosol extinction coefficient observation (> 0.01 km−1) can be traced to the time and location of the Baie-Comeau fire. However, the extinction ratio for this observation is 1.04, so thus it is a distinctly LRE observation and consistent with smoke observations elsewhere in the SAGE record. Similarly, smoke observations reported by Gerasimov et al. (2019) between 12 and 16 km are also observed in the SAGE II data set over a similar altitude range in late June and early July 1991 as depicted in Fig. 16c. The extinction ratios of these SAGE II observations are between 1 and 3 and produce an average ratio of 2.6–2.8 when mixed with non-enhanced aerosol observations in the extinction ratio analysis shown in Fig. 16a. These observations are also consistent with other observations of smoke by SAGE II. While these observations are consistent with smoke, we cannot conclude that all LRE observations in this period and in this latitude band are smoke from the Baie-Comeau fire. SAGE instruments cannot reliably distinguish between aerosol like ash and smoke. As a result, the attribution of a source of each of the LRE observations to Baie-Comeau or large aerosol from one of the several Mt. Pinatubo eruptions cannot be done definitively. Ultimately, it is clear that the vast bulk of enhanced aerosol observed in the Northern Hemisphere in the second half of 1991 is associated with the Mt. Pinatubo eruption and not the Baie-Comeau fire and that Thomason (1992) is essentially correct in their inference of an interesting feature of volcanic impacts on the stratosphere. This feature can be viewed as a precursor for the work in Thomason et al. (2021). Given the presence of volcanic aerosol, inferring a magnitude for the enhancement of stratospheric optical depth by the fire component of this pair of events is not possible.
While we do not attempt to identify the source of isolated outliers in SAGE aerosol extinction coefficient measurements in the stratosphere, we nonetheless detect clusters of enhanced extinction coefficient values from 13 smoke events in the SAGE II and SAGE III/ISS data sets. Of these, we are able to compute a column 1020 nm optical depth enhancement for nine events that range from 0.0005 to 0.011. The remaining four events are a combination of the low frequency of observations and are somewhat hidden by the presence of other variability in stratospheric aerosol levels so that it is difficult to detect a meaningful column signal. Excluding 1992 through 1995 due to high aerosol levels from the Mt. Pinatubo eruption of 1991, the SAGE II period has five fire events from which a column optical depth perturbation may be determined over 17 years of observations, or roughly one fire event every 3 years. All but one of these events are in the Northern Hemisphere. The maximum optical depth values in the SAGE II period have several similarly sized events on the order of 0.002. These values are on the order of background stratospheric optical depth levels for middle and high latitudes. The SAGE III/ISS record has five total events, of which we were able to compute optical depth values for four. With a record approaching 6 years, this works out to about one measurable optical depth every 1.5 years or about twice the rate observed in the SAGE II record. Furthermore, while two of the SAGE III/ISS fire events are quite small, the other two, the British Columbia fire of 2017 and the Australian bushfires of 2019/2020, are the two largest events in the combined data set at roughly double (0.0037) and 5 times (0.011) the size of the largest events in the SAGE II record. Since both of these large events occur in the SAGE III/ISS record and in light of the rate difference between the two periods, it is tempting to infer a trend or, at least, a change between the two periods; however, the data records are relatively short compared to the observed rate of the fire events. It is also difficult to formulate a statistical test to compare the rate of fire events impacting the stratosphere between the two periods, particularly given the low number of events. Another complicating factor is that the largest fire event in the record (the 2019/2020 Australian brushfires) is not even the largest known Australian brushfire in areal extent. For instance, the 1974/1975 Australian brushfire season consumed over 117 ×106 ha (https://knowledge.aidr.org.au/resources/bushfire-new-south-wales-1974/, last access: 20 August 2023) compared to 24.3 ×10⁶ ha for the 2019/2020 season (Binskin et al., 2020). While it is likely that area-burned is not a good stand-in for stratospheric impact, the 1974/1975 season occurs prior to global space-based observations of stratospheric aerosol, and its effect on the stratosphere is undocumented. At this point, it remains possible that the Australian brushfire season of 2019/2020 is simply a rare event rather than a harbinger of change and that using even the relatively long records that the combined SAGE record provides to infer a change in smoke frequency should be undertaken with caution.
Using the SAGE instruments' 525 and 1020 nm aerosol extinction coefficient measurements to characterize these events yields some interesting results. In particular, we observe that the larger and more widespread events show a tendency for the ratio of these measurements to asymptote toward a relatively well-behaved value for progressively larger extinction coefficient values. When this asymptotic value is observed, the value is usually close to 2, except for the large Australian brushfires of 2019/2020, where the value is closer to 3. This contrasts with observations of large aerosol such as ice clouds where the asymptotic value is about 1. This suggests that, while acknowledging substantial uncertainty in composition and size distribution of the observed smoke-based aerosol, the radius of the particles dominating extinction must be relatively small compared to ice cloud particles, probably less than 0.3 µm, and shows a surprising degree of consistency from event to event. An aerosol perturbation in the summer of 1991 has been attributed primarily to both Mt. Pinatubo and a fire in Baie-Comeau, Canada. While we infer the possible presence of smoke in limited numbers of SAGE II observations in June and early July 1991, we find that the distinct high-extinction-ratio cluster observed in this period is inconsistent with the optical behavior of all other smoke events observed by SAGE instruments and is simultaneously observed in the Southern Hemisphere, strongly indicating that this feature of enhanced aerosol events in this period is the result of the Mt. Pinatubo eruption and not the Baie-Comeau fire.
As shown in Fig. 1 and the associated discussion, the current version of GloSSAC (v2.1) underestimates the impact of pyrocumulus on stratospheric aerosol levels during the SAGE II period as the current cloud-clearing algorithm confuses smoke in the vicinity of the tropopause with cloud presence. This is partly due to the fact that the current SAGE II cloud algorithm does not account for the presence of smoke in the stratosphere. A more robust cloud algorithm has been developed for the SAGE III/ISS period (Kovilakam et al., 2023), which accounts for the presence of smoke that was required by the two large-smoke events that appear in that data set. This algorithm can distinguish between cloud, smoke, and enhance volcanic aerosol. Porting this algorithm to SAGE II should be straightforward, and we expect substantial improvements to the SAGE II depictions, primarily the Norman Wells event, in the next release. Given the episodic nature of SAGE measurements at middle to high latitudes, the ability to observe an event in real time is a matter of some serendipity. This is demonstrated by the contrast of SAGE II and SAM II observations of the Daxing'anling Mountains fire in 1987, where the SAM II observations of that event are generally more ubiquitous and more intense than how it is observed in the SAGE II record. While the SAGE II and SAGE III/ISS records are unlikely to entirely miss a significant event as they will persist and spread across a greater latitude extent, the way in which these events are observed in time and space may impact the interpretation of how intense they are and other characteristics of their optical properties.
The frequency of low-intensity volcanic impacts and pyrocumulus and other fire events on the stratosphere is sufficiently similar that some mixing of the event types is inevitable. This has been seen at least in the case of the Norman Wells fire event and the Korovin eruption in 1998 and possibly the Chisholm fire in 2001, with an eruption by Bezymianny. An event that we do not consider herein, an aerosol perturbation by the 2020 eruption of Raikoke, may have also been a mix of pyrocumulus effects and the volcanic aerosol (Ohneiser et al., 2021; Boone et al., 2022, Knepp et al., 2022). While GloSSAC does not discriminate between aerosol modulations by their source or composition, other applications may be affected by unresolved composition knowledge, and the possibility of diverse coincidence events should be considered. A corollary to the sampling issue is the existence of fire events like those of the August Complex of 2021, which persist for long periods of time, possibly injecting aerosol into the stratosphere multiple times and turning what is normally a discrete event into a more protracted and perhaps less obvious enhancement.
We generally find that most smoke events remain or are observable only in the lowermost stratosphere and that only the largest events are observed to have appreciable impacts above 20 km, and even these do not persist for long periods of time. Their relatively short lifetime is somewhat ordained to follow that seen for middle- and high-latitude volcanic events, which similarly do not persist for long periods due to the general circulation of the stratosphere. Only the two largest events remain readily observable in the SAGE III/ISS record for as long as a year, with the British Columbia event lasting about 1 year as a distinct enhancement and the Australian brushfire effect lasting perhaps 18 months. We do not suggest that the smoke-based aerosol is entirely gone but simply that the aerosol extinction levels have returned roughly to the values observed prior to the enhancement. It should also be noted that given the very different optical properties of the smoke-based aerosol relative to sulfuric acid aerosol, particularly significant absorption at visible and near-infrared wavelengths, equivalent optical depth enhancements do not imply equivalent climate effects. Finally, it must be acknowledged that the impacts of pyrocumulus and other fire events on stratospheric are small and transient compared to the moderate-to-large volcanic events, particularly ones that occur in the tropics, which are also a part of the SAGE record. Chief among these is the Mt. Pinatubo eruption of 1991, which caused a global optical depth enhancement of about 0.2 at 1020 nm (Thomason et al., 2018) and persisted for nearly a decade. It remains, by far, the outstanding event affecting stratospheric aerosol levels since the start of space-based measurements in 1978.
SAGE II (https://doi.org/10.5067/ERBS/SAGEII/SOLAR_BINARY_L2-V7.0, Thomason, 2013) and SAGE III/ISS (https://doi.org/10.5067/ISS/SAGEIII/SOLAR_HDF5_L2-V5.2, Thomason, 2020a) data are accessible at the NASA Atmospheric Science Data Center. GloSSAC v2.2 (https://doi.org/10.5067/GLOSSAC-L3-V2.2, Thomason, 2020b) is available from the same location.
LWT developed the analysis tools used throughout the paper and was the primary author of the manuscript. TNK provided insight into the optical characteristics of smoke particles, including Fig. 8 and the associated text.
The contact author has declared that none of the authors has any competing interests.
Publisher's note: Copernicus Publications remains neutral with regard to jurisdictional claims in published maps and institutional affiliations.
The authors would like to thank the anonymous reviewers and helpful comments from Micheal Fromm, Adam Bourassa, and the SAGE team.
Larry W. Thomason and Travis Knepp are supported by NASA's Earth Science Division as a part of the ongoing development, production, assessment, and analysis of SAGE data sets.
This paper was edited by Matthias Tesche and reviewed by two anonymous referees.
Ansmann, A., Ohneiser, K., Mamouri, R.-E., Knopf, D. A., Veselovskii, I., Baars, H., Engelmann, R., Foth, A., Jimenez, C., Seifert, P., and Barja, B.: Tropospheric and stratospheric wildfire smoke profiling with lidar: mass, surface area, CCN, and INP retrieval, Atmos. Chem. Phys., 21, 9779–9807, https://doi.org/10.5194/acp-21-9779-2021, 2021.
Binskin, M., Bennett, A., and Macintosh, A.: Royal Commission into National Natural Disaster Arrangements: report, The Commission, Canberra, p. 115, ISBN: 978-1-921091-45-2, 2020.
Bergstrom, R. W., Russell, P. B., and Hignett, P.: Wavelength Dependence of the Absorption of Black Carbon Particles: Predictions and Results from the TARFOX Experiment and Implications for the Aerosol Single Scattering Albedo, J. Atmos. Sci., 59, 567–577, https://doi.org/10.1175/1520-0469(2002)059<0567:WDOTAO>2.0.CO;2, 2002.
Boone, C. D., Bernath, P. F., Labelle, K., and Crouse, J.: Stratospheric aerosol composition observed by the Atmospheric Chemistry Experiment following the 2019 Raikoke eruption, J. Geophys. Res.-Atmos, 127, e2022JD036600, https://doi.org/10.1029/2022JD036600, 2022.
Bourassa, A. E., Rieger, L. A., Zawada, D. J., Khaykin, S., Thomason, L. W., and Degenstein, D. A.: Satellite limb observations of unprecedented forest fire aerosol in the stratosphere, J. Geophys. Res., 124, 9510–9519, https://doi.org/10.1029/2019JD030607, 2019.
Bourassa, A. E., Zawada, D. J., Rieger, L. A., Warnock, T. W., Toohey, M., and Degenstein, D. A.: Tomographic retrievals of Hunga Tonga-Hunga Ha'apai volcanic aerosol, Geophys. Res. Lett., 50, e2022GL101978, https://doi.org/10.1029/2022GL101978, 2023.
Cahoon, D., Stocks, B., Levine, J., Cofer III, W. R., and Pierson, J. M.: Satellite analysis of the severe 1987 forest fires in northern China and southeastern Siberia, J. Geophys. Res., 99, 18627–18638, 1994.
Canadell, J. G., Meyer, C. P., Cook, G. D., Dowdy, A., Briggs, P., Knauer, J., Pepler, A., and Haverd, V.: Multi-decadal increase of forest burned area in Australia is linked to climate change, Nat. Commun., 12, 6921, https://doi.org/10.1038/s41467-021-27225-4, 2021.
Fromm, M., Alfred, J., Hoppel, K., Hornstein, J., Bevilacqua, R., Shettle, E., Servranckx, R., Li, Z., and Stocks, B.: Observations of boreal forest fire smoke in the stratosphere by POAM III, SAGE II, and lidar in 1998, Geophys. Res. Lett., 27, 1407–1410, https://doi.org/10.1029/1999GL011200, 2000.
Fromm, M., Tupper, A., Rosenfeld, D., Servranckx, R., and McRae, R.: Violent pyro-convective storm devastates Australia's capital and pollutes the stratosphere, Geophys. Res. Lett., 33, L05815, https://doi.org/10.1029/2005GL025161, 2006.
Fromm, M., Shettle, E. P., Fricke, K. H., Ritter, C., Trickl, T., Giehl, H., Gerding, M., Barnes, J. E., O'Neill, M., Massie, S. T., Blum, U., McDermid, I. S., Leblanc, T., and Deshler, T.: Stratospheric impact of the Chisholm pyrocumulonimbus eruption: 2. Vertical profile perspective, J. Geophys. Res., 113, D08203, https://doi.org/10.1029/2007JD009147, 2008.
Fromm, M., Lindsey, D. T., Servranckx, R., Yue, G., Trickl, T., Sica, R., Doucet, P., and Godin-Beekmann, S.: The Untold Story of Pyrocumulonimbus, B. Am. Meteoril. Soc., 91, 1193–1209, https://doi.org/10.1175/2010BAMS3004.1, 2010.
Gerasimov, V. V., Zuev, V. V., and Savelieva, E. S.: Traces of Canadian Pyrocumulonimbus Clouds in the Stratosphere over Tomsk in June–July 1991, Atmos. Ocean Opt., 32, 316–323, https://doi.org/10.1134/S1024856019030096, 2019.
Global Volcanism Program: Report on Atka Volcanic Complex (United States), edited by: Wunderman, R., Bulletin of the Global Volcanism Network, 23:6,. Smithsonian Institution, https://doi.org/10.5479/si.GVP.BGVN199806-311160, 1998.
Global Volcanism Program: Report on Shishaldin (United States), edited by: Wunderman, R., Bulletin of the Global Volcanism Network, 24:4, Smithsonian Institution, https://doi.org/10.5479/si.GVP.BGVN199904-311360, 1999.
Global Volcanism Program: Report on Bezymianny (Russia), edited by: Wunderman, R., Bulletin of the Global Volcanism Network, 26:7, Smithsonian Institution. https://doi.org/10.5479/si.GVP.BGVN200107-300250, 2001.
Katich, J. M., Apel, Bourgeois, E., Brock, C., Bui, T., Campuzano-Jost, P. Commane, R., Daube, B., Dollner, M., Fromm, M., Froyd, K., Hills, A., Hornbrook, R., Jimenez, I., Kupc, A., Lamb, K., McKain, K., Moore, F., Murphy, D., Nault, B., Peischl, J., Perring, A., Peterson, D., Ray, E., Rosenlof, K., Ryerson, T., Schill, G., Schroder, G., Weinzier, B., Thompson, C., Williamson, C., Wofsy, S., Yu, P., and Schwarz, J.: Pyrocumulonimbus affect average stratospheric aerosol composition, Science, 379, 815–820, https://doi.org/10.1126/science.add3101, 2023.
Keeley, J. and Syphard, A.: Large California wildfires: 2020 fires in historical context, Fire Ecol., 17, 22, https://doi.org/10.1186/s42408-021-00110-7, 2021.
Kent, G. S., Trepte, C. R., Wang, P. H., and Lucker, P. L.: Problems in separating aerosol and cloud in the Stratospheric Aerosol and Gas Experiment (SAGE) II data set under conditions of lofted dust: Application to the Asian deserts, J. Geophys. Res.-Atmos., 108, 4410, https://doi.org/10.1029/2002jd002412, 2003.
Khaykin, S., Legras, B., Bucci, S., Sellitto, P., Isaksen, L., Tence, F., Bekki, S., Bourassa, A., Rieger, L., Zawada, D., Jumulet, J., and Godin-Beekmann, S.: The 2019/20 Australian wildfires generated a persistent smoke-charged vortex rising up to 35 km altitude, Commun. Earth Environ., 1, 22, https://doi.org/10.1038/s43247-020-00022-5, 2020.
Khaykin, S., Podglajen, A., Ploeger, F., Grooß, J.-U., Tence, F., Bekki, S., Khlopenkov, K., Bedka, K., Rieger, L., Baron, A., Godin-Beekmann, S., Legras, B., Sellitto, P., Sakai, T., Barnes, J., Uchino, O., Morino, I., Nagai, T., Wing, R., Baumgarten, G., Gerding, M., Duflot, V., Payen, G., Jumelet, J., Querel, R., Liley, B., Bourassa, A., Clouser, B., Feofilov, A., Hauchecorne, A., and Ravetta, F.: Global perturbation of stratospheric water and aerosol burden by Hunga eruption, Commun. Earth Environ., 3, 316, https://doi.org/10.1038/s43247-022-00652-x, 2022.
Kloss, C., Berthet, G., Sellitto, P., Ploeger, F., Taha, G., Tidiga, M., Eremenko, M., Bossolasco, A., Jégou, F., Renard, J.-B., and Legras, B.: Stratospheric aerosol layer perturbation caused by the 2019 Raikoke and Ulawun eruptions and their radiative forcing, Atmos. Chem. Phys., 21, 535–560, https://doi.org/10.5194/acp-21-535-2021, 2021.
Knepp, T. N., Thomason, L., Kovilakam, M., Tackett, J., Kar, J., Damadeo, R., and Flittner, D.: Identification of smoke and sulfuric acid aerosol in SAGE III/ISS extinction spectra, Atmos. Meas. Tech., 15, 5235–5260, https://doi.org/10.5194/amt-15-5235-2022, 2022.
Kovilakam, M., Thomason, L. W., Ernest, N., Rieger, L., Bourassa, A., and Millán, L.: The Global Space-based Stratospheric Aerosol Climatology (version 2.0): 1979–2018, Earth Syst. Sci. Data, 12, 2607–2634, https://doi.org/10.5194/essd-12-2607-2020, 2020.
Kovilakam, M., Thomason, L., and Knepp, T.: SAGE III/ISS aerosol/cloud categorization and its impact on GloSSAC, Atmos. Meas. Tech., 16, 2709–2731, https://doi.org/10.5194/amt-16-2709-2023, 2023.
Kremser, S., Thomason, L., von Hobe, M., Hermann, M., Deshler,T., Timmreck, C., Toohey, M., Stenke, A., Schwarz, J. P., Weigel, R., Fueglistaler, S., Prata, F. J., Vernier, J.-P., Schlager, H., Barnes, J. E., Antuña-Marrero, J.-C., Fairlie, D., Palm, M., Mahieu, E., Notholt, J., Rex, M., Bingen, C., Vanhellemont, F., Bourassa, A., Plane, J. M. C., Klocke, D., Carn, S. A., Clarisse, L., Trickl, T., Neely, R., James, A. D., Rieger, L., Wilson, J., and Meland, B.: Stratospheric aerosol—Observations, processes, and impact on climate, Rev. Geophys., 54, 278–335, https://doi.org/10.1002/2015RG000511, 2016.
Lareau, N. P., Nauslar, N. J., and Abatzoglou, J. T.: The Carr fire vortex: A case of pyrotornadogenesis?, Geophys. Res. Lett., 45, 13107–13115, https://doi.org/10.1029/2018GL080667, 2018.
Moore, R. H., Wiggins, E. B., Ahern, A. T., Zimmerman, S., Montgomery, L., Campuzano Jost, P., Robinson, C. E., Ziemba, L. D., Winstead, E. L., Anderson, B. E., Brock, C. A., Brown, M. D., Chen, G., Crosbie, E. C., Guo, H., Jimenez, J. L., Jordan, C. E., Lyu, M., Nault, B. A., Rothfuss, N. E., Sanchez, K. J., Schueneman, M., Shingler, T. J., Shook, M. A., Thornhill, K. L., Wagner, N. L., and Wang, J.: Sizing response of the Ultra-High Sensitivity Aerosol Spectrometer (UHSAS) and Laser Aerosol Spectrometer (LAS) to changes in submicron aerosol composition and refractive index, Atmos. Meas. Tech., 14, 4517–4542, https://doi.org/10.5194/amt-14-4517-2021, 2021.
Murphy, D. M., Froyd, K. D., Schwarz, J. P., and Wilson, J. C.: Observations of the chemical composition of stratospheric aerosol particles, Q. J. Roy. Meteor. Soc., 140, 1269–1278, https://doi.org/10.1002/qj.2213, 2014.
Nath, A. and Nath, R.: Identification of Black Dragon forest fire in Amur River Basin Using Satellite Borne NDVI Data and Its Impact on Long Range Transport of Pollutants: A Case Study, Journal of Atmospheric Science Research, 02, 6–10, https://doi.org/10.30564/jasr.v2i3.1182, 2019.
Ohneiser, K., Ansmann, A., Chudnovsky, A., Engelmann, R., Ritter, C., Veselovskii, I., Baars, H., Gebauer, H., Griesche, H., Radenz, M., Hofer, J., Althausen, D., Dahlke, S., and Maturilli, M.: The unexpected smoke layer in the High Arctic winter stratosphere during MOSAiC 2019–2020 , Atmos. Chem. Phys., 21, 15783–15808, https://doi.org/10.5194/acp-21-15783-2021, 2021.
Pieri, D., Ma, C., Simpson, J. J., Hufford, G., Grindle, T., and Grove, C.: Analyses of in-situ airborne volcanic ash from the February 2000 eruption of Hekla Volcano, Iceland, Geophys. Res. Lett., 29, 191–194, https://doi.org/10.1029/2001GL013688, 2001.
Pitts, M. C., Poole, L. R., and McCormick, M. P.: SAGE II observations: Polar stratospheric clouds near 50∘ N, January 31–February 2, 1989, Geophys. Res. Lett., 17, 405–408, https://doi.org/10.1029/GL017i004p00405, 1990.
Rieger, L. A., Zawada, D., J,Bourassa, A. E., and Degenstein, D. A.: A multiwavelength retrieval approach for improved OSIRIS aerosol extinction retrievals, J. Geophys. Res., 124, 7286–7307, https://doi.org/10.1029/2018JD029897, 2019.
Rosenfeld, D., Fromm, M., Trentmann, J., Luderer, G., Andreae, M. O., and Servranckx, R.: The Chisholm firestorm: observed microstructure, precipitation and lightning activity of a pyro-cumulonimbus, Atmos. Chem. Phys., 7, 645–659, https://doi.org/10.5194/acp-7-645-2007, 2007.
Sumlin, B. J., Heinson, Y. W., Shetty, N., Pandey, A., Pattison, R. S., Baker, S., Hao, W. M., and Chakrabarty, R. K.: UV–Vis–IR spectral 875 complex refractive indices and optical properties of brown carbon aerosol from biomass burning, J. Quant. Spectrosc. Ra., 206, 392–398, https://doi.org/10.1016/j.jqsrt.2017.12.009, 2018.
Tackett, J. L., Winker, D. M., Getzewich, B. J., Vaughan, M. A., Young, S. A., and Kar, J.: CALIPSO lidar level 3 aerosol profile product: version 3 algorithm design, Atmos. Meas. Tech., 11, 4129–4152, https://doi.org/10.5194/amt-11-4129-2018, 2018.
Taha, G., Loughman, R., Zhu, T., Thomason, L., Kar, J., Rieger, L., and Bourassa, A.: OMPS LP Version 2.0 multi-wavelength aerosol extinction coefficient retrieval algorithm, Atmos. Meas. Tech., 14, 1015–1036, https://doi.org/10.5194/amt-14-1015-2021, 2021.
Thomason, L. W.: Observations of a new SAGE II aerosol extinction mode following the eruption of Mt. Pinatubo, Geophys. Res. Lett., 19, 2179–2182, https://doi.org/10.1029/92GL02185, 1992.
Thomason, L. W.: append Data following V7.0, https://doi.org/10.5067/ERBS/SAGEII/SOLAR_BINARY_L2-V7.0 (last access: 28 August 2023), 2013.
Thomason, L. W.: SAGE III V5.2 Solar Data Products, https://doi.org/10.5067/ISS/SAGEIII/SOLAR_HDF5_L2-V5.2 (last access: 28 August 2023), 2020a.
Thomason, L. W.: Global Space-based Stratospheric Aerosol Climatology Data, V2.2, https://doi.org/10.5067/GLOSSAC-L3-V2. (last access: 28 August 2023), 2020b.
Thomason, L. W., Burton, S. P., Luo, B.-P., and Peter, T.: SAGE II measurements of stratospheric aerosol properties at non-volcanic levels, Atmos. Chem. Phys., 8, 983–995, https://doi.org/10.5194/acp-8-983-2008, 2008.
Thomason, L. W. and Vernier, J.-P.: Improved SAGE II cloud/aerosol categorization and observations of the Asian tropopause aerosol layer: 1989–2005, Atmos. Chem. Phys., 13, 4605–4616, https://doi.org/10.5194/acp-13-4605-2013, 2013.
Thomason, L. W., Ernest, N., Millán, L., Rieger, L., Bourassa, A., Vernier, J.-P., Manney, G., Luo, B., Arfeuille, F., and Peter, T.: A global space-based stratospheric aerosol climatology: 1979–2016, Earth Syst. Sci. Data, 10, 469–492, https://doi.org/10.5194/essd-10-469-2018, 2018.
Thomason, L. W., Kovilakam, M., Schmidt, A., von Savigny, C., Knepp, T., and Rieger, L.: Evidence for the predictability of changes in the stratospheric aerosol size following volcanic eruptions of diverse magnitudes using space-based instruments, Atmos. Chem. Phys., 21, 1143–1158, https://doi.org/10.5194/acp-21-1143-2021, 2021.
Yu, P., Toon, O. B., Bardeen, C. G., Zhu, Y., Rosenlof, K. H., Portmann, R. W., Thornberry, T. D., Gao, R.-S., and Robock, A.: Black carbon lofts wildfire smoke high into the stratosphere to form a persistent plume, Science, 365, 587–590, https://doi.org/10.1126/science.aax1748, 2019.
- Abstract
- Introduction
- Differentiating between outlier events and clouds
- Identifying and depicting outlier events
- Application to outlier events
- The 1991 Baie-Comeau pyrocumulus and Mt. Pinatubo
- Conclusions
- Code and data availability
- Author contributions
- Competing interests
- Disclaimer
- Acknowledgements
- Financial support
- Review statement
- References