the Creative Commons Attribution 4.0 License.
the Creative Commons Attribution 4.0 License.
 | 15 Sep 2023
Reduction in vehicular emissions attributable to the Covid-19 lockdown in Shanghai: insights from 5 years of monitoring-based machine learning
Meng Wang
Yusen Duan
Zhuozhi Zhang
Qi Yuan
Xinwei Li
Shuwen Han
Juntao Huo
Jia Chen
Yanfen Lin
Junji Cao
Shun-cheng Lee
Exposure to elemental carbon (EC) and NOx is a public health issue that has been gaining increasing interest, with high exposure levels generally observed in traffic environments, e.g., roadsides. Shanghai, home to approximately 25 million in the Yangtze River Delta (YRD) region in eastern China, has one of the most intensive traffic activity levels in the world. However, our understanding of the trend in vehicular emissions and, in particular, in response to the strict Covid-19 lockdown is limited partly due to the lack of a long-term observation dataset and application of advanced mathematical models. In this study, NOx and EC were continuously monitored at a sampling site near a highway in western Shanghai for 5 years (2016–2020). The long-term dataset was used to train the machine learning model, rebuilding NOx and EC in a business-as-usual (BAU) scenario for 2020. The reduction in NOx and EC attributable to the lockdown was found to be smaller than it appeared because the first week of the lockdown overlapped with the Lunar New Year holiday, whereas, at a later stage of the lockdown, the reduction (50 %–70 %) attributable to the lockdown was more significant, consistent with the satellite monitoring of NO2 showing reduced traffic on a regional scale. In contrast, the impact of the lockdown on vehicular emissions cannot be represented well by simply comparing the concentration before and during the lockdown for conventional campaigns. This study demonstrates the value of continuous air pollutant monitoring at a roadside on a long-term basis. Combined with the advanced mathematical model, air quality changes due to future emission control and/or event-driven scenarios are expected to be better predicted.
- Article
(1817 KB) - Full-text XML
-
Supplement
(877 KB) - BibTeX
- EndNote


Shanghai is an economic center of China, acting as a major transport hub. In 2019, the number of civilian vehicles was over 4 million in Shanghai, approximately 13 % higher than that in 2017 (Ministry of Transport, 2020). On average, the daily ridership in Shanghai was over 57 million, with the turnover quantity of motor vehicles of approximately 235 000 000 passenger car unit kilometers (Ministry of Transport, 2020). As a response to the Covid-19 outbreak, strict lockdown measures were initiated in major cities across China in 2020, including the megacity of Shanghai in the Yangtze River Delta (YRD) region (He et al., 2020; Wang et al., 2020; Wu et al., 2021). The lockdown measures started in late January and lasted roughly 1 month, during which normal human activities were constrained substantially (Wang et al., 2020; Lin et al., 2023a). The lockdown measures, such as shutting down cross-city travel and requiring people to stay at home, were strictly implemented to minimize human activities (Liu et al., 2020; Zhao et al., 2020). As a result of these restrictive measures, anthropogenic emissions of air pollutants, in particular, vehicular emissions, have been found to be reduced substantially as evidenced by the evolution of NO2, which is routinely measured at the ground air quality monitoring site, as well as from satellite monitoring (Li et al., 2021; Wu et al., 2021).
The impacts of vehicular emissions of NO2 on public health are significant both through direct harm via inhalation and as a precursor to secondary pollutants such as ozone and particulate matter (PM) (Li et al., 2019; Lu et al., 2019; Lin et al., 2023a). Although NO2 concentration is regulated by air quality standards, NOx (NO + NO2) is only now being limited through new emission standards for new vehicles (Grange et al., 2017). In addition to NOx emissions, on-road vehicles were also a major source of primary PM emissions, comprising various organic and inorganic species (Hallquist et al., 2009; Fuzzi et al., 2015; Lin et al., 2018; Duan et al., 2020; Lin et al., 2020, 2021). Elemental carbon (EC) or black carbon is a major component of fine PM (PM2.5) from vehicular emissions (Chang et al., 2018; Lin et al., 2020; Jia et al., 2021; Wang et al., 2022c). EC is emitted as a result of incomplete combustion of gasoline or diesel in the internal combustion engine (Lin et al., 2020; Jia et al., 2021), with significant health and climate implications (Ramanathan and Carmichael, 2008; Cappa et al., 2012; Rappazzo et al., 2015; Lin et al., 2023b). Because of the intensive traffic activities in Shanghai, exposure to EC has become a public health issue that has been gaining increasing interest, with high individual EC exposure levels generally observed in traffic environments, e.g., roadsides (Lin et al., 2020; Zhou et al., 2020; Jia et al., 2021). With the recent implementation of high emission standards (e.g., China IV and V), gasoline vehicles are generally less polluted, in terms of EC emissions, when compared to diesel vehicles (Lin et al., 2020; Huang et al., 2022). Gasoline-powered vehicles currently comprise over 90 % of the total vehicles in China, with the trend of phasing out of vehicles with old emission standards (i.e., China I–III) (J. Wang et al., 2019; M. Wang et al., 2022a). Nevertheless, on-road vehicular emissions are still one of the major sources of NOx and EC in urban China (Zheng et al., 2018; Jia et al., 2021). Moreover, total vehicular emissions are also impacted by traffic mix and volume, vehicle ages, and vehicle speed, while meteorological variables, e.g., wind speed and wind direction, can impact the measured concentrations of air pollutants, making the quantification of vehicular emissions challenging in the real-world ambient environment.
The strict Covid-19 lockdown measures provided a unique opportunity to study the changes in event-driven vehicular emissions (González-Pardo et al., 2022; Borlaza et al., 2023; Hay et al., 2023; Patel et al., 2023), formulating a scientific basis for designing future air quality mitigation strategies. However, the degree of reduction in vehicular emissions that can be attributable to the Covid-19 outbreak varied greatly in different studies (up to differences of over 2-fold; Jia et al., 2020; Wang et al., 2020; Wu et al., 2021). For example, by directly comparing the NOx concentrations before and during the Covid-19 lockdown period, Jia et al. (2020) found a 56 %–58 % reduction in NOx during the Covid-19 lockdown period in Shanghai. However, the lockdown period overlapped with the Chinese Spring Festival holiday (Wang et al., 2020), during which human activities including traffic were already largely reduced. Moreover, meteorological conditions (e.g., wind speed and direction) may vary, and, therefore, the direct comparison between two different periods does not necessarily reflect the trend in emissions. To decouple the meteorological effects, a meteorological normalization or de-weathering process was first proposed by Grange and Carslaw (2019) using a tree-based machine learning algorithm. Vu et al. (2019) developed the de-weathering process to investigate the seasonal trend of typical air pollutants routinely measured in Beijing, and the de-weathered pollutants showed a good agreement with the primary emissions from the emission inventory. Using a similar de-weathering process and taking into account the holiday effects, Dai et al. (2021) showed that the reduction (−15.4 %) in NO2 attributable to the Covid-19 lockdown was, on average, roughly half of the total reduction (−29.5 %) by comparing the measured and counterfactual NO2 in a business-as-usual (BAU) scenario during the overlapping period in 31 major Chinese cities. The decline in NO2 attributable to the lockdowns was also shown to be not as large as expected in an analysis of 11 cities globally after a de-weathering process (Shi et al., 2021). However, most of these tree-based machine learning studies did not quantify the importance of the input variables, making these the machine learning process non-explainable or like a “black box” (Wang et al., 2022a; Lin et al., 2023a). An explainable machine learning algorithm such as the SHapley Additive exPlanation (SHAP) can quantify the impact of meteorological variables (Lundberg et al., 2020; X. Qin et al., 2022; Wang et al., 2022a). However, few studies have applied the explainable machine learning algorithm to study the trend in vehicular emissions. Moreover, most previous studies focused on the changes in the measured NO2 concentrations, which were routinely measured at an air quality monitoring site (Wang et al., 2020), while few studies reported vehicular EC emissions based on long-term (years) measurement, therefore, limiting our understanding of vehicular PM2.5 emissions under such a policy intervention and more importantly our ability to predict future air quality changes with similar emission control strategies.
In this study, hourly EC and NOx were continuously measured for 5 years (2016–2020) at a sampling site near a highway in western Shanghai. A machine learning model, i.e., random forest, was applied to train the model to rebuild the measured EC and NOx using meteorological and temporal variables as the model input (Grange et al., 2018; Grange and Carslaw, 2019; Grange et al., 2021; Wang et al., 2022a; Lin et al., 2023a). The SHAP algorithm (Lundberg et al., 2020) was used to quantify the impact of meteorological variables on the measured EC and NOx. A business-as-usual (BAU) scenario was assumed in 2020 and compared with the measured EC and NOx, quantifying the reduction attributable to the lockdown measures. Implications of future emission control measures on vehicular emissions are discussed.
2.1 Field sampling
Measurements of NOx and EC were conducted continuously from 2016 to 2020 (5 years) at a sampling site near a highway at the Dianshan Lake (DSL) supersite (31.09∘ N, 120.98∘ E; approximately 15 m above ground), with two highways (G318 and G50) located approximately 1 km west of the sampling site. The sampling site is located in Qingpu District in western Shanghai (Fig. S1), 50 km west of downtown Shanghai. It is at the intersection of Jiangsu, Shanghai, and Zhejiang provinces. Wind rose analysis showed that the sampling site could be affected by the two nearby highways during both 2016–2019 (normal years) and 2020 (with Covid-19 lockdown measures implemented) (Fig. S2).
Details of the instrument used to measure EC and NOx were provided previously (Jia et al., 2020). Briefly, EC was measured on an hourly basis using a Sunset carbon analyzer (model RT-4, Sunset Laboratory, USA), while hourly NO and NO2 were monitored using a Thermo Scientific gas analyzer (model 42i, Thermo Fisher Scientific, Massachusetts, USA). The seasonal variation in EC and NOx is shown in Fig. S3. For 2015–2019, the median of EC varied in the range of 1.0–1.5 µg m−3 with higher concentrations in winter than in summer. The median of NOx varied in the range of 45–55 µg m−3 with higher concentrations in winter than in summer for 2015–2019. The Covid-19 lockdown measures were implemented in 2020, resulting in lower concentrations of NOx/EC but a similar seasonal trend (Fig. S3). Meteorological variables of air temperature (air_temp; ∘C), wind direction (wd; ∘), wind speed (ws; m s−1), relative humidity (RH; %), pressure (hPa), and rainfall (mm) were measured using a Vaisala automatic weather station (WXT520, Vaisala Ltd., Finland) with a time resolution of 1 h.
Satellite images of NO2 were obtained from the Sentinel-5P Level-3 near-real-time dataset based on the observation of the TROPOspheric Monitoring Instrument (TROPOMI) for 2019 and 2020 (Lin et al., 2023a). The spatial and temporal distribution of vertical column densities (molec. cm−2) of tropospheric NO2 was used to study the changes in vehicular emissions as a response to strict lockdown measures implemented in 2020.
2.2 Data analysis
2.2.1 Machine learning setup and validation
A machine learning algorithm – random forest (Grange et al., 2018; Wang et al., 2022a, b) – was deployed to understand the impact of the Covid-19 lockdown on the exhaust emissions from near highways in 2020 based on a business-as-usual (BAU) scenario. A modeling workflow is shown in Fig. S4. NOx and EC were used as a marker of traffic exhaust emissions because traffic was its main contributor in Shanghai (Jia et al., 2021). In this study, the diurnal patterns of EC and NOx show typical rush hour peaks during both the normal and Covid-19 lockdown periods, consistent with the emission pattern from traffic (Fig. S5).
Meteorological (ws, wd, air_temp, RH, rainfall, and pressure) and time (date_unix, day of the year, weekday, hour of the day, and day of the lunar year) variables were used as model inputs to explain the hourly mean EC and NOx concentrations. The time variable of date_unix is the number of seconds since 1 January 1970. Because the day of the Lunar New Year is different in the Gregorian calendar, it was necessary to include the day of the lunar year to better represent the Chinese Lunar New Year holiday, which usually causes a reduction in pollutant concentration (Wang et al., 2020; Dai et al., 2021). For each random forest, the number of trees in the forest was set to 300, while a minimal nod size was set to 5 following Grange et al. (2018).
The time resolution for the random forest features and the target was 1 h. The Covid-19 lockdown started in late January 2020 and lasted roughly 1 month (see Fig. 1). The number of data points modeled in the random forest model was 6244, covering 1 month before and after the start of the Covid-19 lockdown for the same period for 5 years (Fig. 1). Data with missing values were excluded (8 % of the data). Data before the start of the Lunar New Year (i.e., 24 January 2020) were used to train and test the model with a total number of data points of 5616; 80 % (4493 data points) of the dataset was randomly selected to train the dataset, while the remaining 20 % (1123 data points) of the dataset was used to test the model. The training–testing percentages followed Grange et al. (2021). The random forest model was run using the latest “rmweather” R package (Grange et al., 2018). Based on the built forest, data after the Lunar New Year were estimated using the features during the Covid-19 period, i.e., the BAU scenario (Fig. S4).
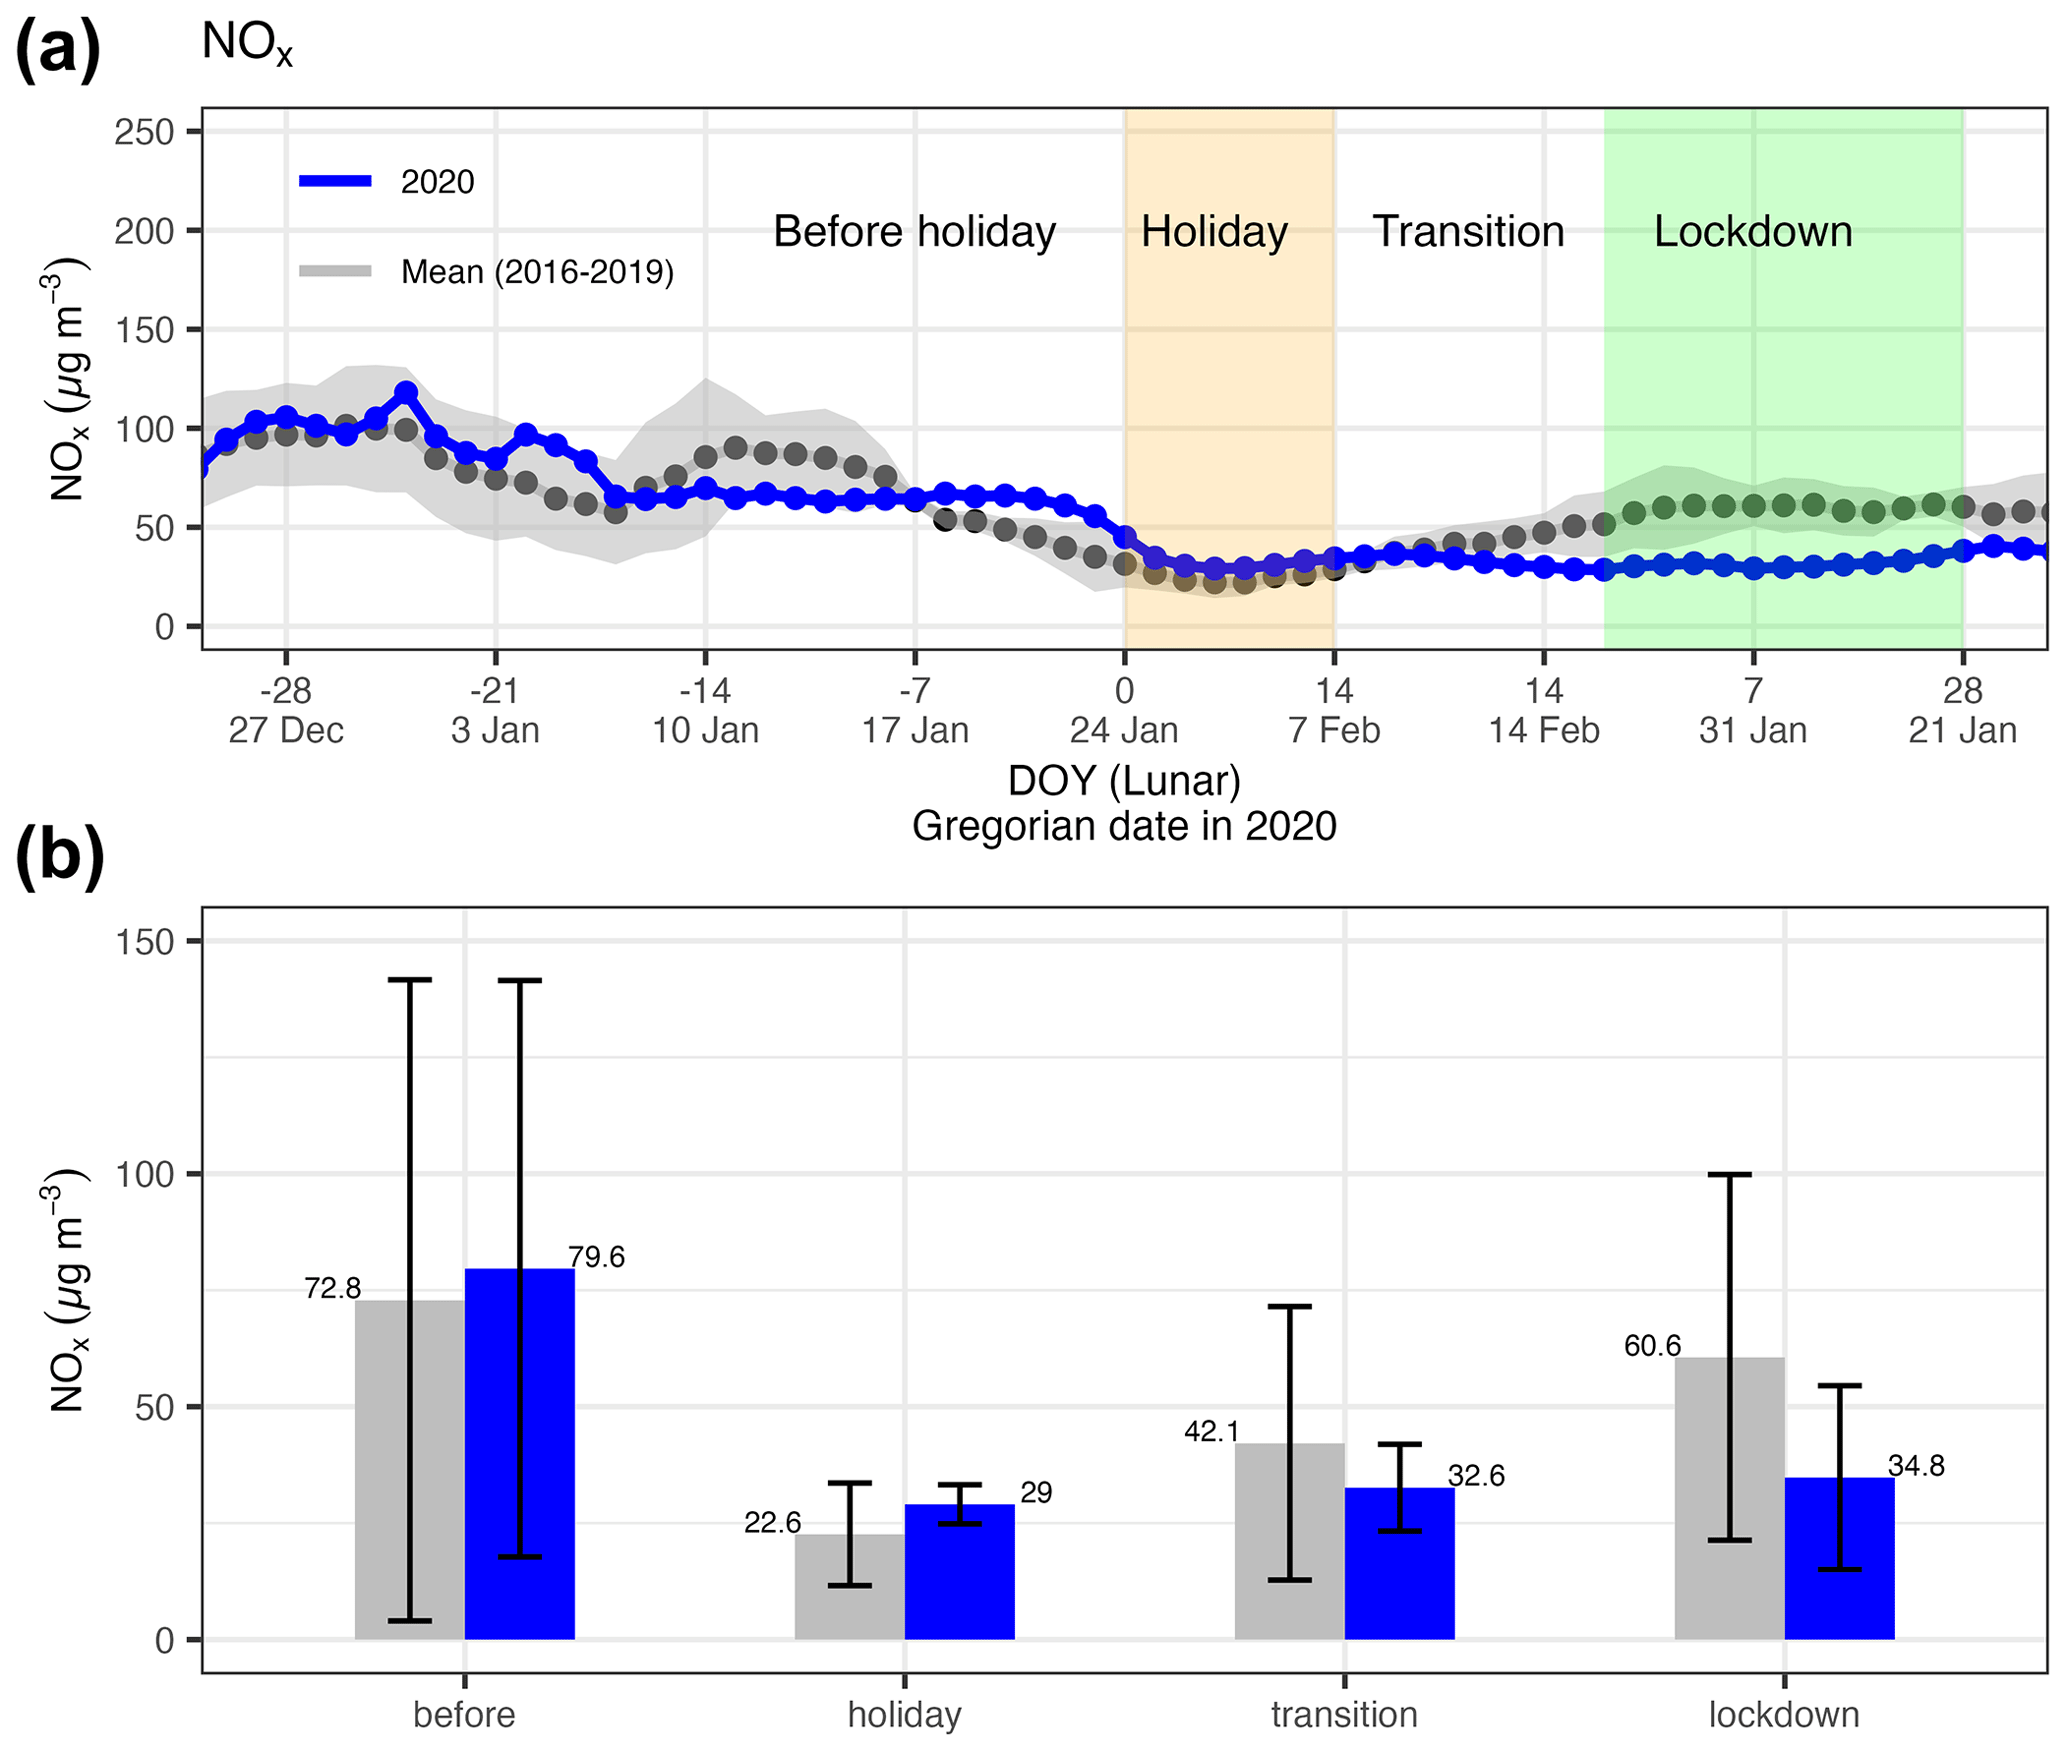
Figure 1(a) Time series (day of the year; DOY) of the measured NOx for 4 weeks before and after the start of the Lunar New Year for the mean of 2016–2019 and 2020 and (b) mean NOx concentrations for different periods, i.e., before the holiday, holiday, transition, and lockdown. The time series in (a) is a 7 d rolling average. The error bar in (b) stands for 1 standard deviation. Note that the lunar DOY for 2016–2019 was on different Gregorian dates, but these dates were grouped together based on the lunar DOY in (a).
Validation of the developed random forest was performed by comparing the time series of the predicted and measured NOx/EC for both the testing and training dataset based on the correlation coefficient R and the root mean square error (RMSE) between the time series of measured and predicted pollutants. The performance of the random forest model was compared to the multilinear regression (MLR) model, in terms of the R value and the RMSE value (Table S1). A good simulation often features a high correlation coefficient (>0̇.6) (Grange et al., 2021; González-Pardo et al., 2022; Y. Qin et al., 2022). The time series of the predicted NOx/EC showed a good agreement with the measured ones with correlation coefficients in the range of 0.89–0.98 and slopes close to unity, suggesting the developed random forest model captured the variation in the target pollutant well. Moreover, the RMSE values are smaller for the random forest model (i.e., 0.27–0.51 for training–testing and 12.94–29.34 µg m−3 for EC and NOx, respectively) than the MLR (0.96 µg m−3 for EC and 47.6 µg m−3 for NOx; Table S1).
2.2.2 Quantification of the reduction in pollutants attributable to the Covid-19 lockdown
Based on the developed random forest model, the estimated NOx and EC concentrations in a BAU scenario were derived (Fig. S3). The BAU scenario assumed everything was the same in 2020 as in the previous years. Because the random forest captured the variation in the target pollutant better than the multilinear regression model (Table S1), the estimated NOx and EC concentrations reflected the corresponding pollutant in a BAU scenario better. The long-term measurements of NOx/EC covered multiple years, which is necessary to train the model for comparison with short-term sampling. The BAU analysis was performed using a function within the rmweather R package (Grange et al., 2018).
The estimated NOx/EC concentrations were compared with the measured ones during the holiday (the first week of the lunar year, 167 data points), transition (from day 8 to the Lantern Festival, i.e., day 15, 206 data points), and after the transition (250 data points), when the lockdown measures were most restrictive. The differences between the estimated and measured NOx/EC are regarded as the portion that can be attributable to the Covid-19 lockdown measures (Grange et al., 2021). Specifically, to get the pollutant concentration in a BAU scenario, a machine learning model was trained by the data over the previous 4 years to capture the variability in pollutant concentrations using the same input variables as detailed in Sect. 2.3.1. After training, the grown forest was used to predict pollutant concentrations experienced beyond the training period during the Covid-19 lockdown. As a result, the time series of the predicted pollutant beyond the training period is a counterfactual, representing the model estimation of pollutant concentrations during the BAU scenario. The pollutant concentrations in the BAU scenario were subsequently compared with what was observed, with the differences (in %; Fig. S4) representing the magnitude of the reduction attributable to the Covid-19 lockdown.
2.2.3 Feature importance analysis using the SHAP algorithm
In this study, SHAP (https://github.com/slundberg/shap, last access: 1 July 2023) was applied to explain the output of the machine learning model, quantifying the importance of the meteorological variables (Lundberg et al., 2020; Oukawa et al., 2022). SHAP is a game-theoretic approach that connects optimal credit allocation with local explanations using classic Shapley values and their related extensions (Lundberg et al., 2020). SHAP analysis was performed using the Python package of SHAP (version 0.41.0) and scikit-learn (version 1.2.0).
SHAP produced an interpretable machine learning model using an additive feature attribution method (Lundberg et al., 2020). SHAP quantified the contribution of the input meteorological variables to a single prediction at a specific time, producing a SHAP value in the same unit as the target pollutant. An overview of which meteorological variables were most important for predicting NOx/EC was obtained based on the SHAP values of every feature for every time point. The SHAP overview plot sorted meteorological variables by the sum of SHAP value magnitudes over the entire sampling period. SHAP values were obtained to show the distribution of the impacts each meteorological variable had on the model output.
3.1 Trend of observed NOx during the holiday period and Covid-19 lockdown
Figure 1a shows the time series of NOx for 4 weeks before and after the start of the Lunar New Year with 5 years (2016–2020) of measurements at the sampling site near a highway in western Shanghai (map shown in Fig. S1). To understand the impact of the Covid-19 lockdown measurements on traffic emissions, we focus on the NOx time series in 2020 in comparison to the averaged time series of NOx (grey line) for the previous 4 years (i.e., the mean of 2016–2019). The beginning of the 2020 lockdown, starting on 24 January, overlapped with the start of the Lunar New Year holiday, when human activities had already been reduced to a large extent as most migrant workers left the city for their hometowns. Therefore, the holiday effects need to be taken into account when evaluating the impact of the national lockdown measures on the measured pollutants at the sampling site near a highway.
For 2016–2019, a large reduction in NOx was seen during the 7 d holiday period when compared to the period before the holiday. After the holiday, NOx levels started to bounce back during the transition period (i.e., the period before the Lantern Festival on day of the year (DOY) 15) and finally reached a similar level after the transition period when compared to that before the holiday (Fig. 1a). Specifically, before the holiday, the mean concentration of NOx was 72.8 µg m−3 (± 68.8 µg m−3; 1 standard deviation), while, during the holiday, NOx concentration was 22.6 µg m−3 (± 11.0 µg m−3). After the holiday, the NOx levels increased from 42.6 µg m−3 (± 29.4 µg m−3) during the transition to 60.6 µg m−3 (± 39.3 µg m−3) after the transition period. As a result, compared to the average NOx level (72.8 µg m−3) before the holiday, NOx was reduced by over 65 % (i.e., 50.2 µg m−3) during the holiday for a normal year.
Similar to 2016–2019, the observed NOx in 2020 was also largely reduced (60 %) during the holiday period when compared to before the holiday (Fig. 1b). Specifically, NOx before the holiday was 79.5 µg m−3 (± 61.9 µg m−3), while it was 29.0 µg m−3 (± 4.2 µg m−3) during the holiday. Because the Covid-19 lockdown started on the same day as the holiday, the reduction in NOx observed at the sampling site attributable to the lockdown measures was smaller than it appeared. In other words, simply comparing the air pollutant concentration during the first 7 d of the lockdown to that before the lockdown would overestimate the impact of Covid-19 on the measured air pollutant when holiday effects were strong.
However, NOx remained at low levels during the transition and after the transition period in 2020, i.e., the last 2 weeks of the lockdown, instead of rapidly rising as observed in 2016–2019 (Fig. 1). The mean concentration during the transition period was 32.6 µg m−3 (± 9.3 µg m−3) and was 34.8 µg m−3 (± 19.7 µg m−3) for the last 2 weeks of the lockdown in 2020, which was 25 % and 50 % lower, respectively, when compared to the same period in 2016–2019. Because it usually takes some time for the control measure to take effect, focusing on the first 7 d of the lockdown may not represent the true impact of the Covid-19 lockdown on air quality. Instead, as the lockdown measures took effect, a large reduction in NOx can be seen in the late stages of the lockdown when NOx was supposed to be increasing. Therefore, we focused on the comparison of NOx during the last 2 weeks of the lockdown (labeled as “lockdown” in Fig. 1 and afterward if not specified otherwise) to study the impact of lockdown measures on traffic emissions at this sampling site (discussed in Sect. 3.4).
3.2 Observed EC reduction attributable to the lockdown control policies
The measured EC at the sampling site near a highway showed a diurnal pattern with a clear morning rush hour peak, consistent with that for NOx (Fig. S5), suggesting EC was mainly affected by the nearby traffic. The measured EC also showed a dependence on wind speed and wind direction, with a higher concentration associated with low wind speed from the southwestern direction, i.e., from the highway (Fig. S6). The conclusion of EC being mainly from traffic is consistent with previous source apportionment studies in Shanghai (Chang et al., 2018; Jia et al., 2021).
Figure 2 shows the time series of EC before and during the 2020 lockdown as well as the average time series of EC (grey line) for the previous 4 years (i.e., the mean of 2016–2019). Similar to NOx, the 2016–2019 EC level during the holiday was reduced due to the reduced traffic (Fig. 2). Specifically, the mean EC concentration was 1.08 µg m−3 (± 1.04 µg m−3) during the holiday, roughly 40 % lower compared to that (1.74 ± 1.22 µg m−3) before the holiday. During the transition period in 2016–2019, EC increased to 1.03 µg m−3 (± 0.72 µg m−3). Afterward, EC increased to 1.53 µgm−3 (± 1.04 µg m−3), very close to the levels before the holiday.
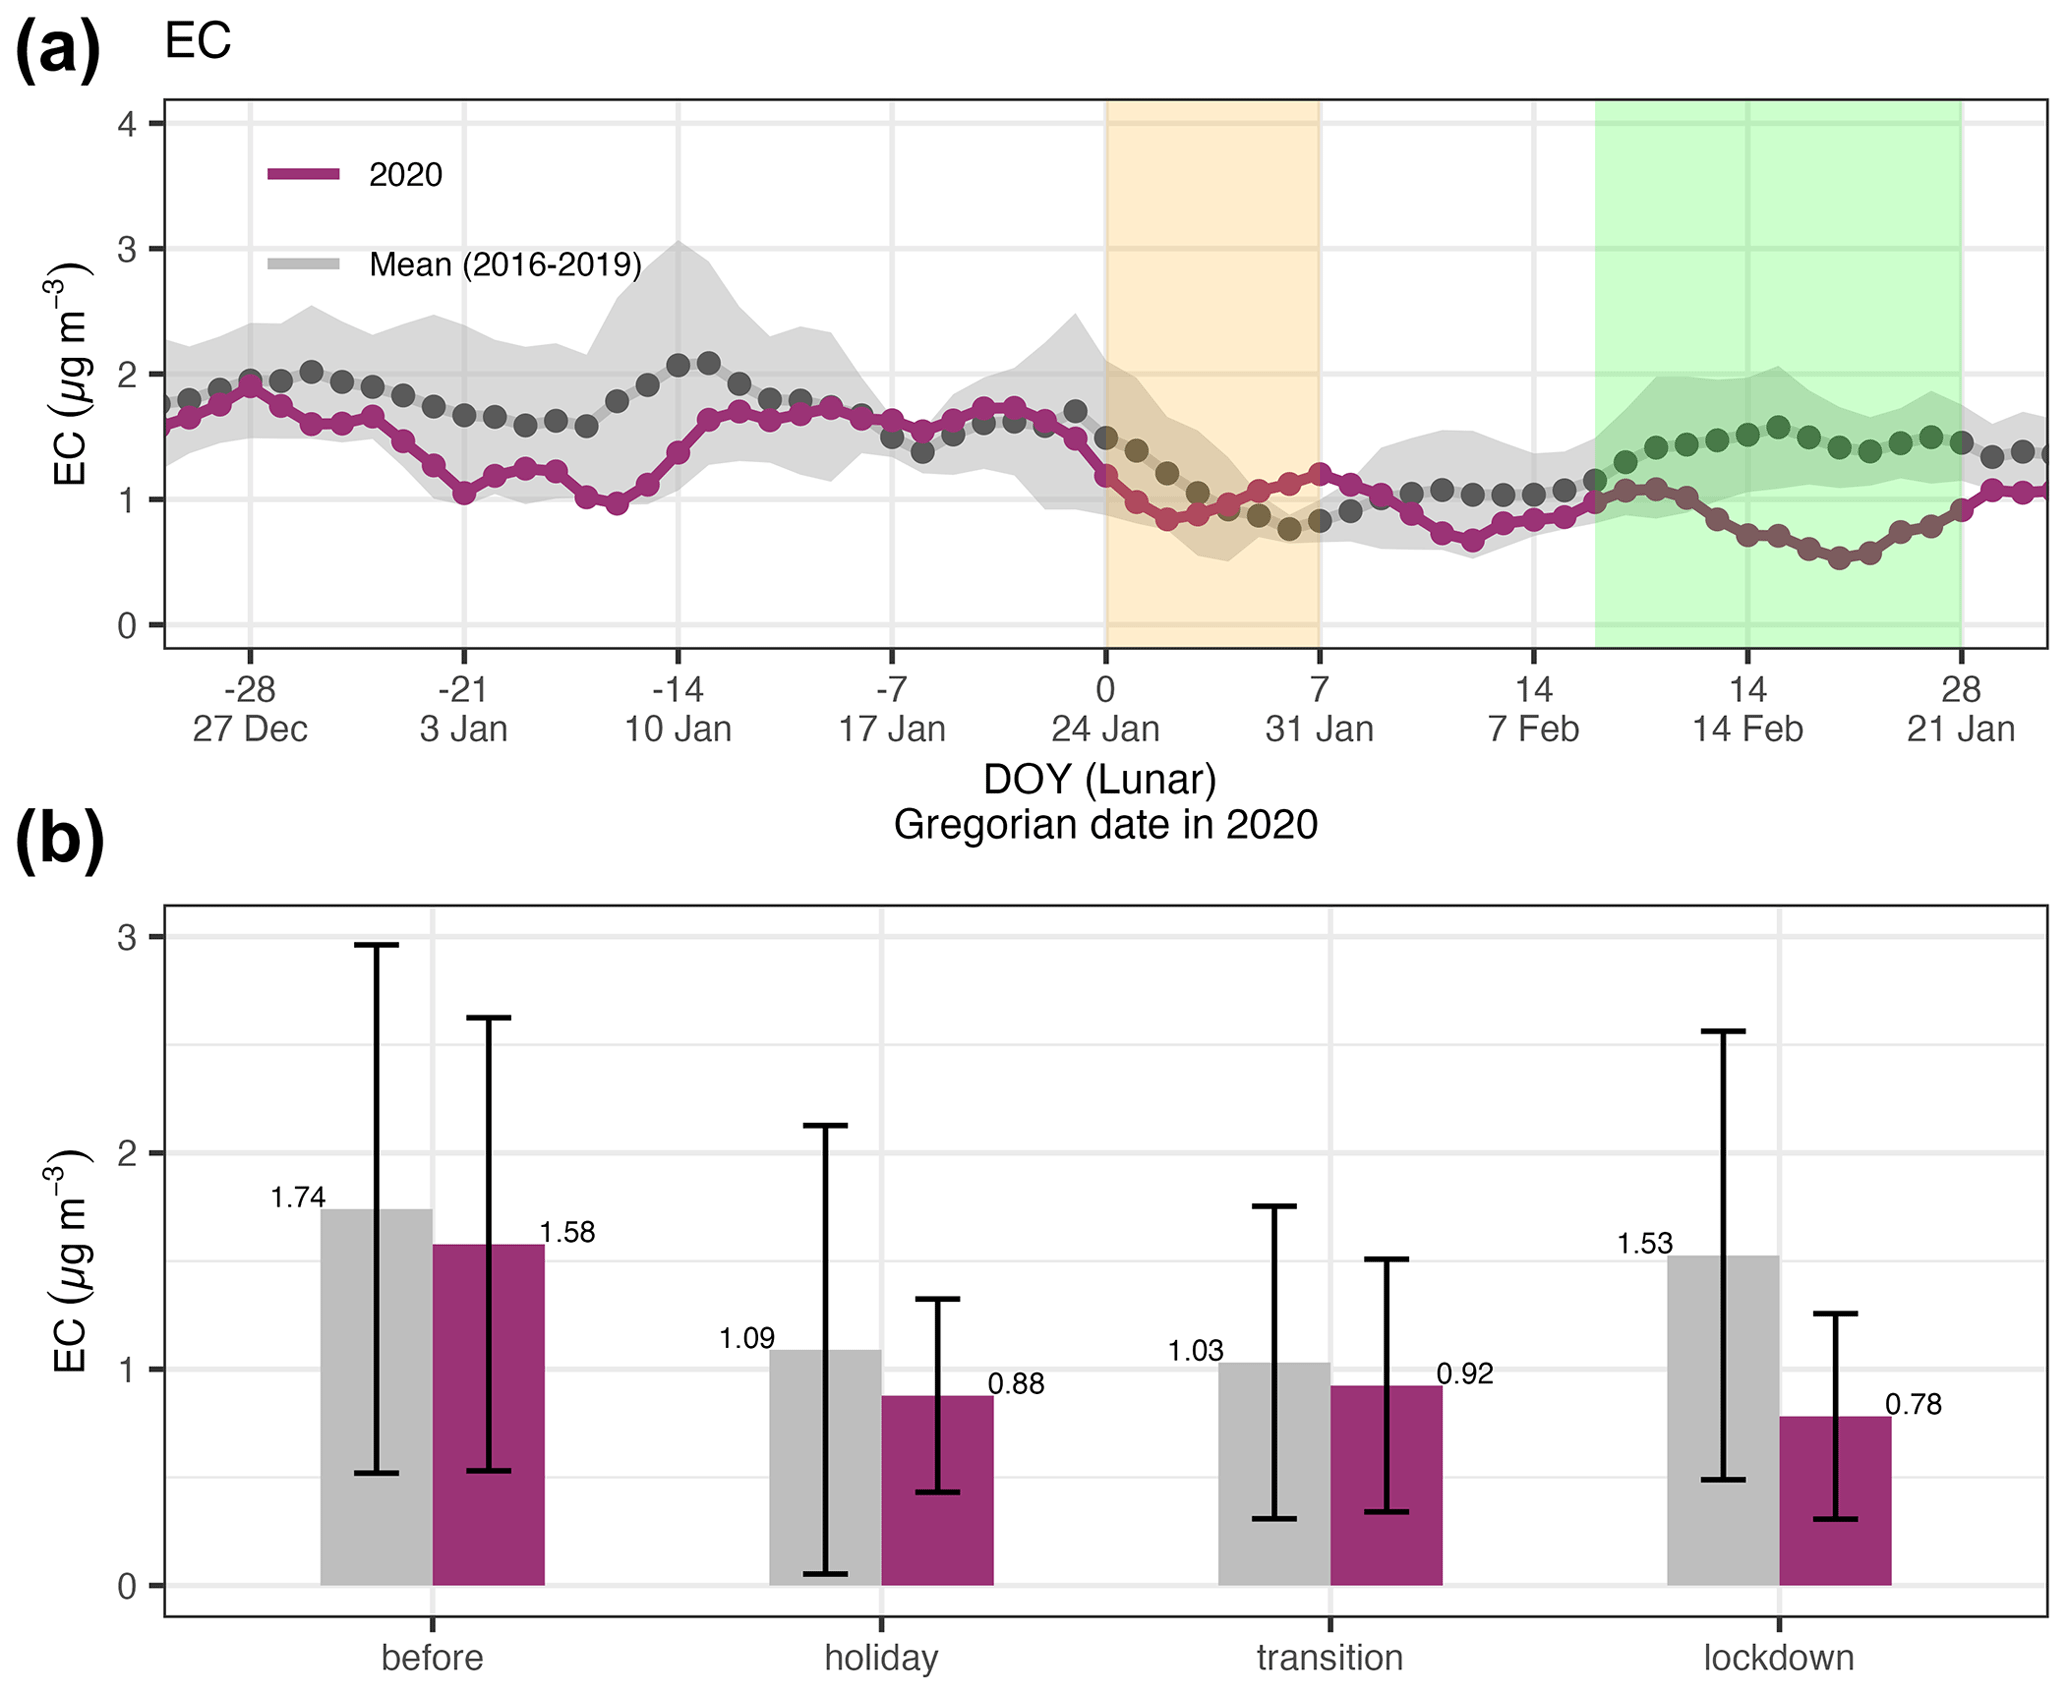
Figure 2(a) Time series (day of the year; DOY) of the measured EC for 4 weeks before and after the start of the Lunar New Year for the mean of 2016–2019 and 2020 and (b) mean EC concentrations for different periods, i.e., before the holiday, holiday, transition, and lockdown. The time series in (a) is a 7 d rolling average. The error bar in (b) stands for 1 standard deviation.
For the 2020 Lunar New Year holiday or the first week of the Covid-19 lockdown, EC was also reduced to a level (0.88 ± 0.45 µg m−3) similar to 2016–2019 (1.08 µg m−3; Fig. 2). Similar to NOx, the EC reduction attributable to the lockdown measures was not as large as it appeared for the period overlapping with the holiday. However, EC remained at a low level during (0.92 ± 0.58 µg m−3) and after the transition (0.78 ± 0.48 µg m−3) period. This is because the month-long lockdown measures kept traffic at a low level for a prolonged time. This is consistent with the pattern observed for NOx, further confirming that the measured EC and NOx at this sampling site near a highway were mainly from traffic emissions. The mean EC concentration during the transition period or roughly the second week of the lockdown in 2020 was 10 % lower than the same period in 2016–2019, while the mean EC concentration during the last 2 weeks of the lockdown was 50 % lower than the same period in 2016–2019. The low level of EC during and after the transition period was due to the lockdown measures, reducing the traffic volume and, therefore, reducing the corresponding traffic-related EC emissions.
3.3 Rebuilding the measured NOx and EC using a machine learning algorithm
The measured mass concentrations of atmospheric NOx and EC were affected by the meteorological variables including wind speed and wind direction (Fig. S6). This is particularly true for multiple years of measurement when the meteorological variables varied over these years. Therefore, the concentration measured at different years was not directly comparable when meteorological variables in addition to emission strength varied across years. Moreover, the relationship between the measured NOx/EC and meteorological conditions was not linear. This is demonstrated by the relatively low values of correlation coefficient (i.e., Pearson's R of 0.45–0.48 and R2 of 0.20–0.23) between the rebuilt NOx/EC and the meteorological parameters using the multilinear regression model (Table S1). Therefore, the multilinear regression model failed to rebuild the measured NOx/EC satisfactorily.
Figure 3a shows the scatterplot between the time series of the rebuilt and measured NOx for the training and testing dataset. The predicted NOx correlated well with the measured NOx with a correlation coefficient (R) of 0.89–0.98, suggesting over 80 % of the data (R2>0.8) can be explained by the machine learning model. This value is higher than that from the multilinear regression model (Table S1). Therefore, the machine learning model demonstrated a better performance than the multilinear regression model in capturing the relationship between NOx and meteorological variables.
Figure 3b shows the scatterplot between the time series of the predicted and measured EC for the training and testing dataset. Similar to NOx, the rebuilt EC correlated well with the measured EC with a correlation coefficient (R) of 0.9–0.98, suggesting over 80 % (R2 of 0.81–0.96) of the EC can be explained by the machine learning model. However, for both NOx and EC, the slope of the linear fit was in the range of 0.67–0.85, suggesting the predicted values were, on average, 13 %–33 % lower than the measured values. By examining the data, the lower-than-unity slope was mainly caused by the data points with high concentrations. These data points can be regarded as outliers that were not captured properly by the machine learning model since these data points deviated largely from the averaged values.
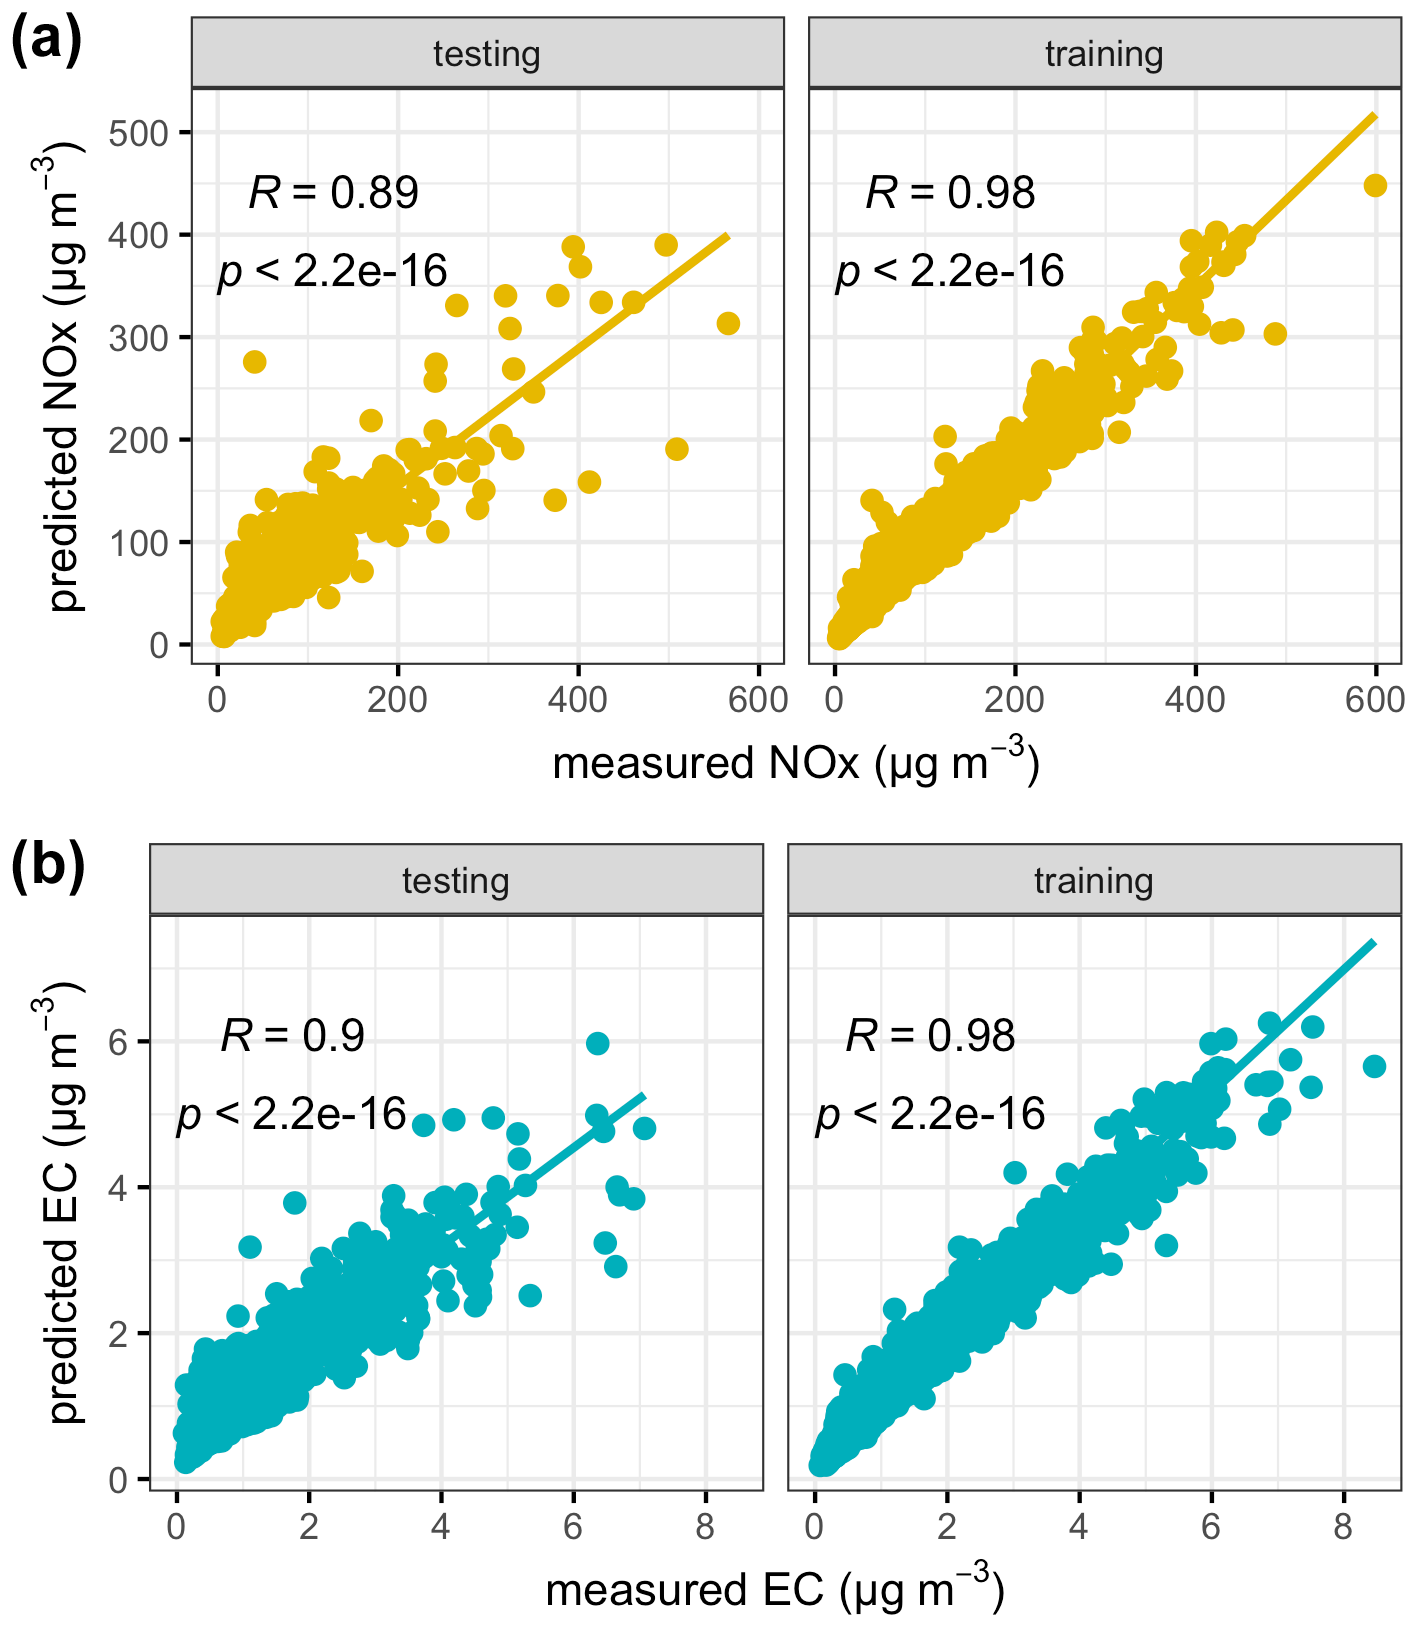
Figure 3Scatterplot between the predicted and measured (a) NOx and (b) EC for the testing and training dataset. Also shown is the linear regression between the predicted and measured values, with the correlation coefficient (R) and p value in the top left.
To evaluate the importance of different meteorological variables, the SHAP model was applied (see Method). Figure 4a and b show the distribution of SHAP values (in µg m−3) obtained during the rebuilding of NOx and EC, respectively, while Fig. 4c and d show the respective mean absolute of the SHAP values. The meteorological variable with a high SHAP value was associated with high importance, whereas a SHAP value closer to 0 means the meteorological variable was less important. For NOx, ws is the most important meteorological variable (Fig. 4), with low ws contributing up to over 100 µg m−3 and high ws contributing negatively to NOx (down to −40 µg m−3). Air temperature, RH, wd, and pressure had SHAP values in the range of −40 to 70 µg m−3, while rainfall was least important with SHAP values of < 10 µg m−3 (Fig. 4a and c). Similarly, ws was also the important variable for EC, with low ws contributing positively to the EC (SHAP value of up to over 2 µg m−3, Fig. 4b). Wd, pressure, air temperature, and RH had similar SHAP values (< 1.5 µg m−3). Although rainfall was less important, high rainfall was associated with low SHAP values (Fig. 4b and d), consistent with the wet deposition of aerosol.
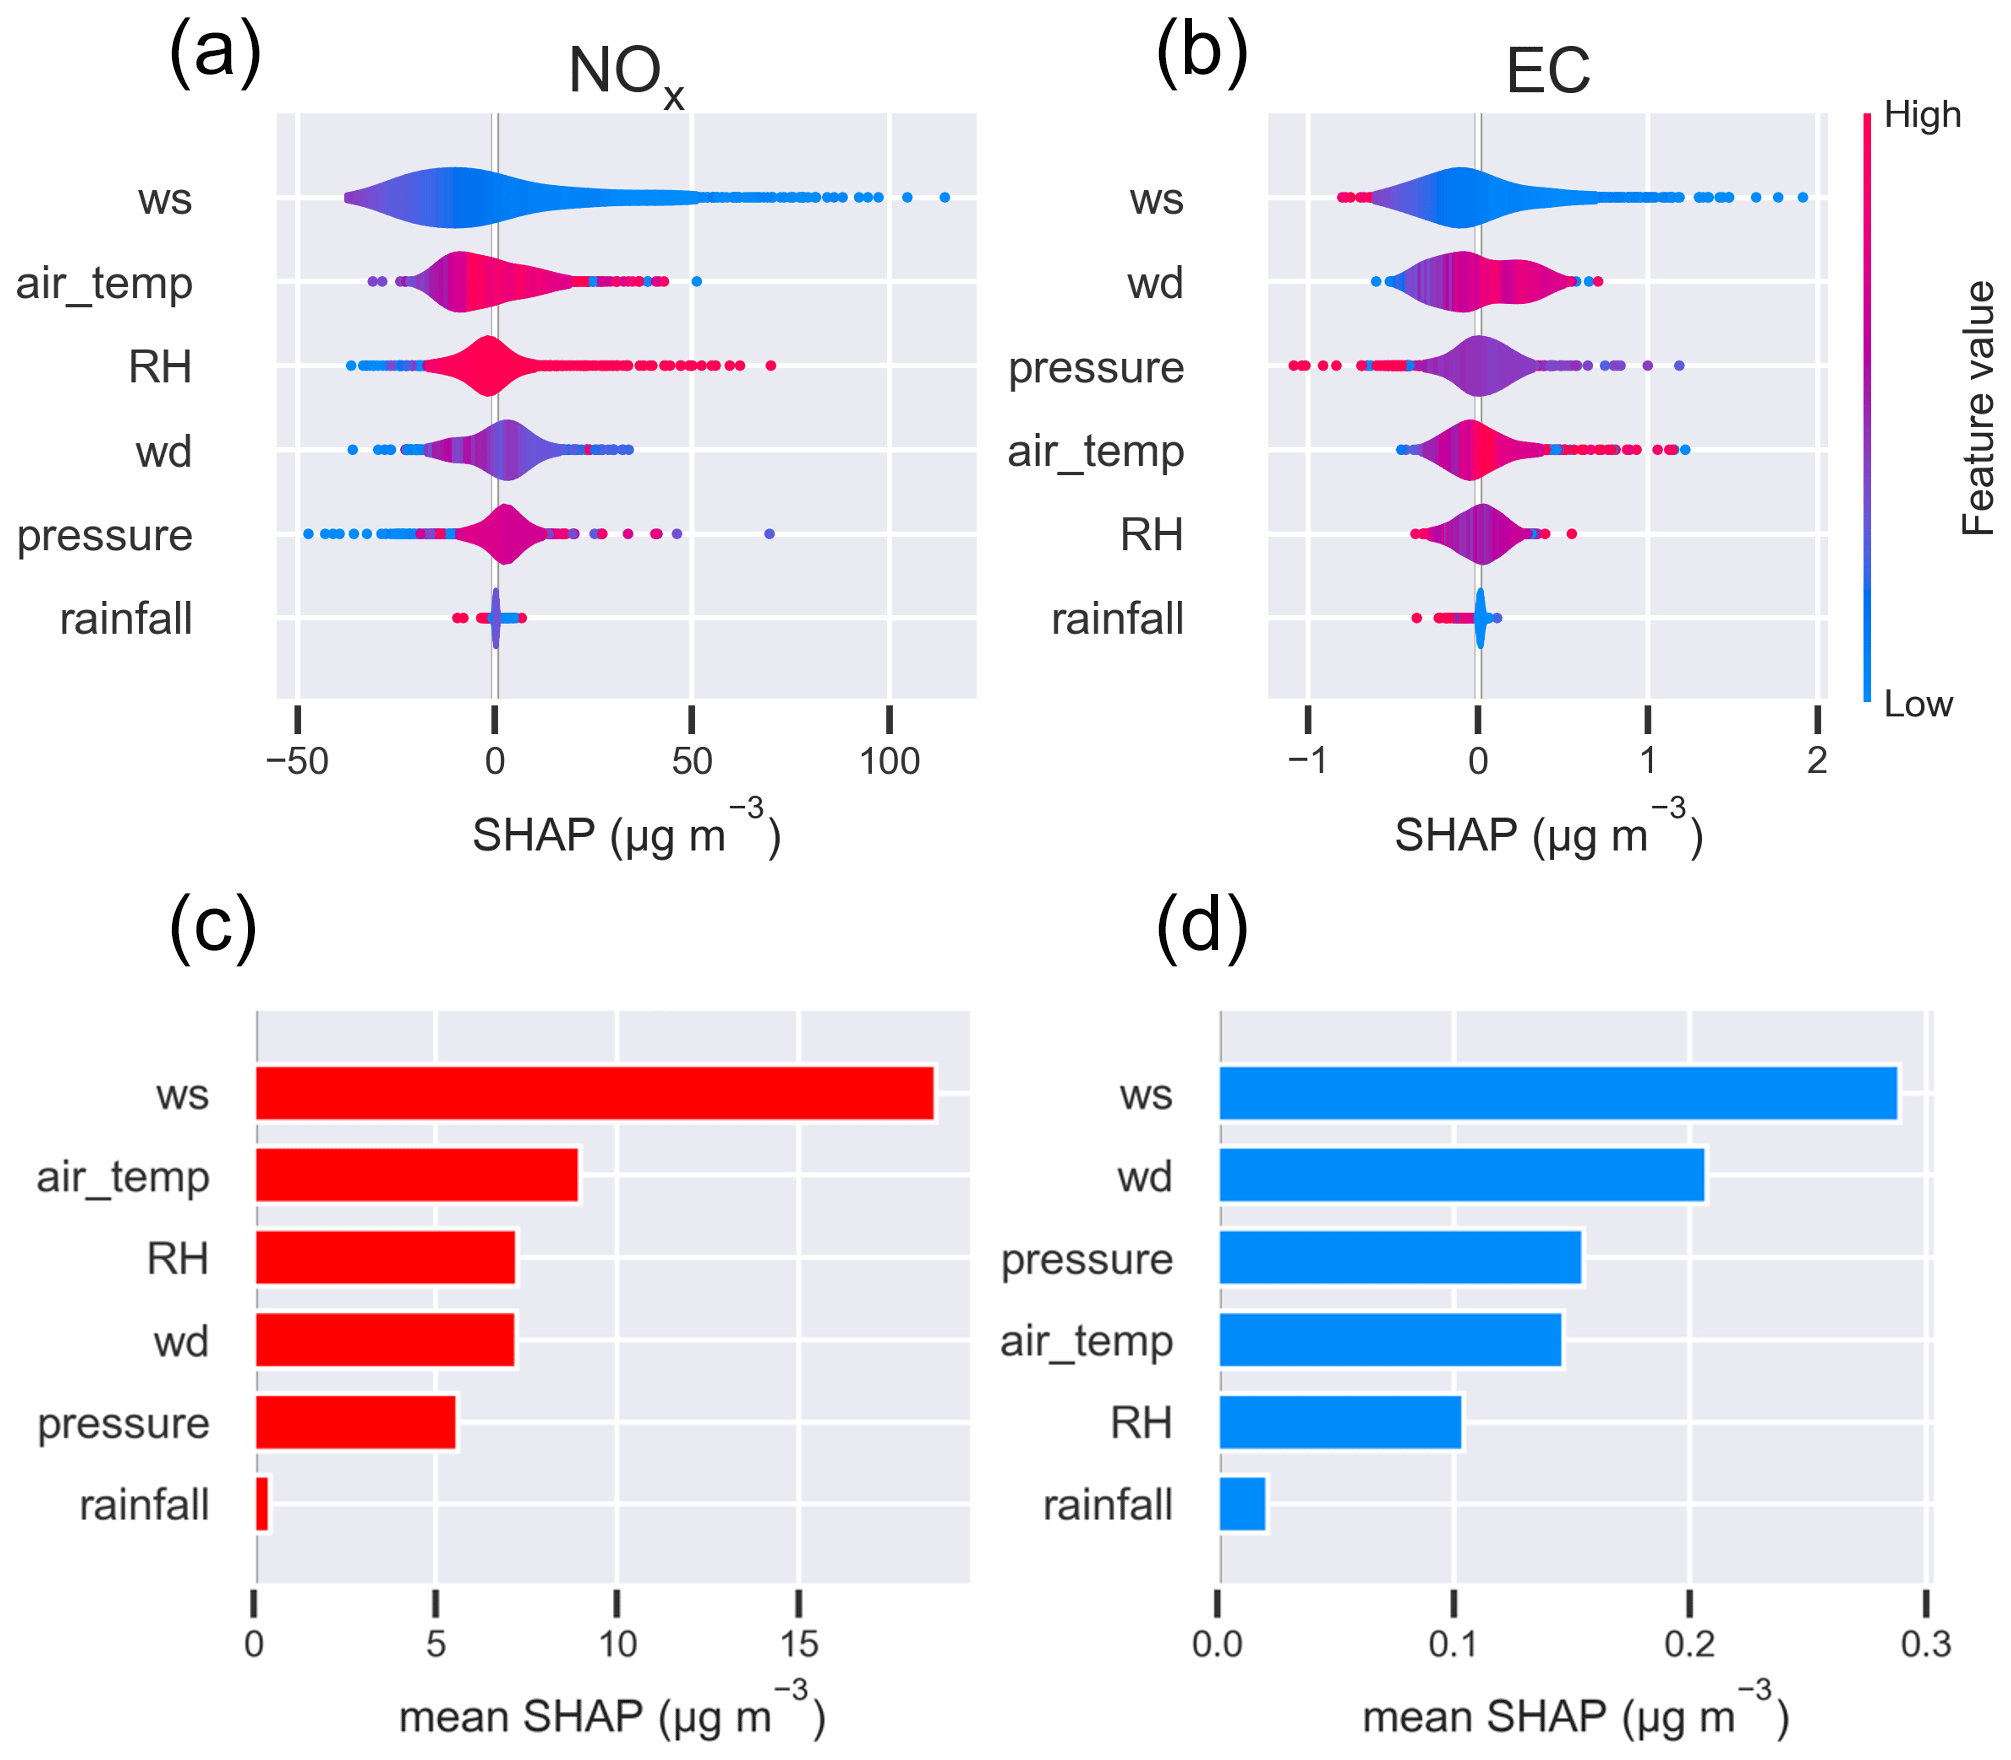
Figure 4Distribution of SHAP values (in µg m−3) for the meteorological variables, i.e., features when building the random forest model, for (a) NOx and (b) EC and mean absolute SHAP values for (c) NOx and (d) EC.
3.4 Trend of meteorologically normalized NOx and EC: a business-as-usual scenario
To evaluate the impact of the lockdown in 2020 on NOx/EC emissions at this sampling site near a highway, a business-as-usual (BAU) scenario was assumed. The BAU scenario in 2020 assumed that everything was similar to what would happen previously, i.e., without the lockdown measures. For the BAU scenario in 2020, NOx and EC would drop during the holiday but increase their concentration levels during the transition and reach a level similar to that before the holiday (Fig. 5), as in 2016–2019 (Figs. 1 and 2). Through the comparison of the 2020 BAU to the measured NOx/EC in 2020, the reduction in NOx/EC attributable to Covid-19 can be quantitatively evaluated.
NOx and EC concentrations during the holiday, transition, and lockdown periods were normalized to that before the holiday (Fig. 5). For BAU in 2020, NOx during the holiday was reduced to 53 % of the level before the holiday. In comparison, the measured NOx during the holiday was 36 % of the level before the holiday. Therefore, the difference (17 %) between BAU 2020 and 2020 was attributable to the Covid-19 control measures. In other words, the measured NOx was roughly 30 % lower than it would be without the control measures. During the transition period, the NOx level for BAU 2020 returned to ∼ 75 % of the level before the holiday. In comparison, the measured NOx was only 40 % of that before the holiday. Therefore, the measured NOx was approximately 45 % lower than BAU 2020. After the transition period, NOx returned to a level similar to that before the holiday for BAU 2020. However, the measured NOx was only 40 % of that before the holiday. As a result, the NOx reduction attributable to the Covid-19 lockdown measures was the most significant after the transition period, which was approximately 60 % of BAU 2020. Therefore, the month-long lockdown measures kept NOx at a low level consistently, demonstrating the effectiveness of the lockdown in reducing traffic emissions as the lockdown measures continued.
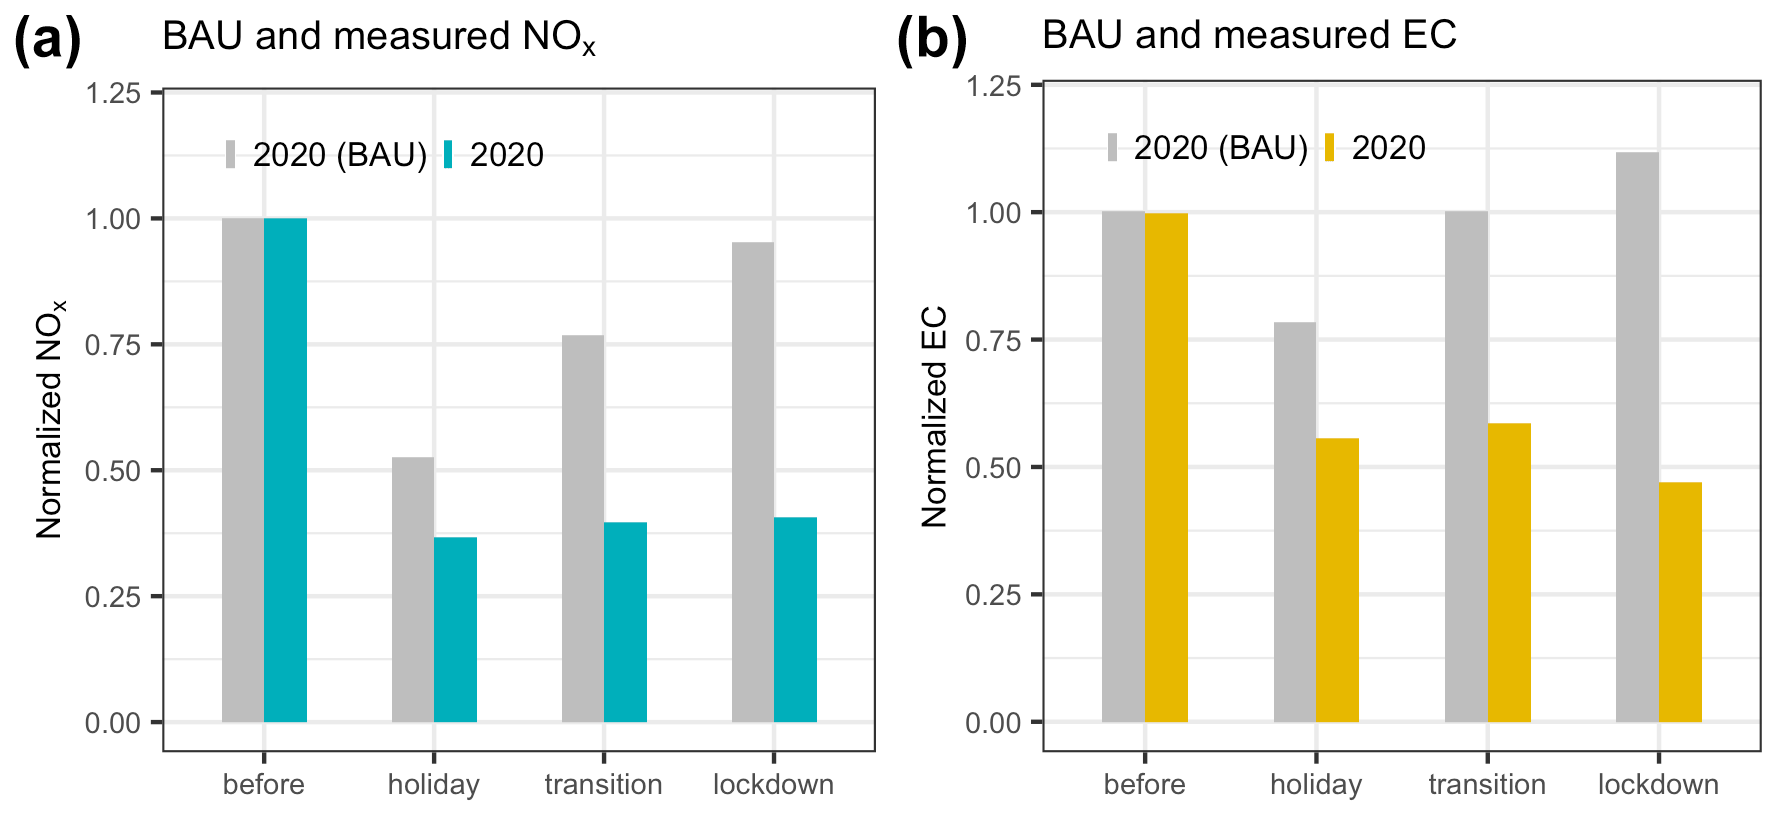
Figure 5Comparison of (a) NOx and (b) EC evolution between the business-as-usual (BAU) scenario and the measured one in 2020. All concentrations were normalized to the level before the holiday.
Similar to NOx, EC also showed the largest reduction during the lockdown when compared to BAU 2020 (Fig. 5b). Specifically, EC was roughly 60 % lower during the lockdown in 2020 than the BAU scenario in 2020, while the reduction in EC was 40 % and 30 % lower during the transition and holiday periods, respectively. As a result, both NOx and EC showed a similar level of reduction which was attributable to the lockdown measures.
3.5 Reduction in traffic emissions during the Covid-19 lockdown on a regional scale
Figure 6 shows the TROPOMI images of NO2 in the YRD region over the same period, i.e., before the holiday and after the transition, for the years 2019 and 2020. By comparing the vertical column densities of NO2 monitored over the same period in 2019 and 2020, the evolution of satellite monitoring of NO2 showed a trend consistent with that observed from the ground monitoring at the sampling site near a highway (Figs. 1–3). In particular, a great reduction (50 %–70 %) in NO2 during the lockdown period in 2020 was seen when compared to that over the same period in 2019, whereas after the transition period in 2020, NO2 was expected to return to a level similar to that before the holiday, i.e., the BAU scenario discussed in Sect. 3.4. Therefore, the reduction (50 %–70 %) in NO2 in 2020 was attributable to the lockdown measures based on the knowledge gained from the surface monitoring site.
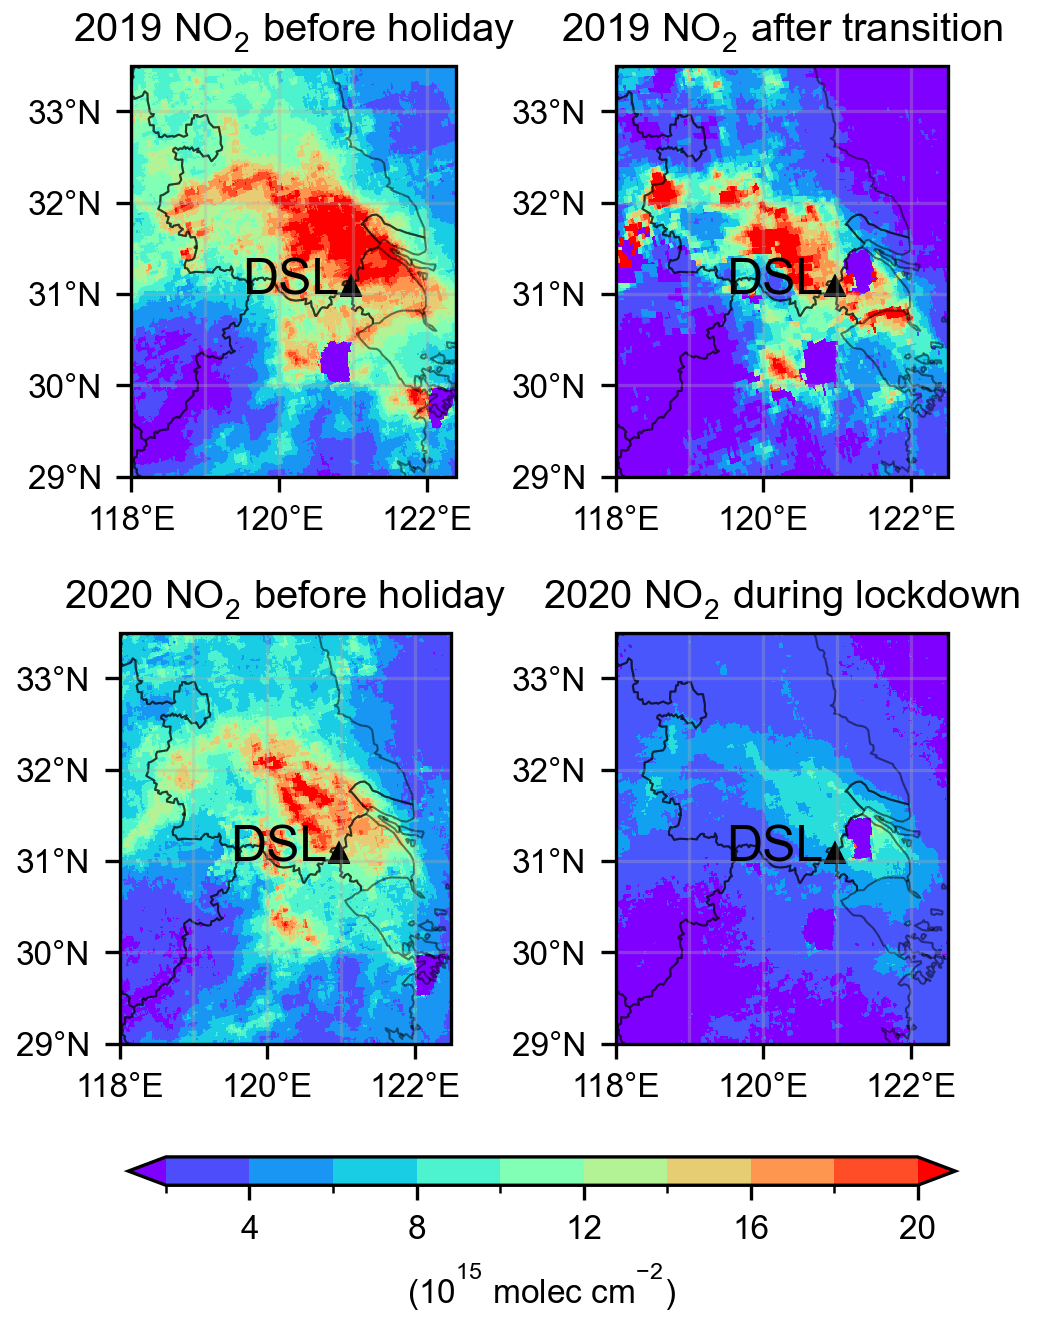
Figure 6The spatial distribution of TROPOMI NO2 over the same period in 2019 and 2020 near the DSL sampling site in western Shanghai in the YRD region.
Specifically, the vertical column concentration of NO2 at DSL was highly elevated before the holiday in 2019, with mean vertical column concentrations of over 18 × 1015 molec. cm−2. After the transition period in 2019, NO2 returned to a slightly lower value (16–18 × 1015 molec. cm−2) compared to that before the holiday. This is consistent with the BAU scenario assumed in 2020 (Fig. 5). In 2020, NO2 before the holiday was similar to the level over the same period in 2019 (18–20 × 1015). However, during the lockdown period, NO2 was 8–10 × 1015, 50 %–70 % lower than in the same period in 2019. Such a reduction was attributable to the lockdown measures. In addition, the satellite images also demonstrate that traffic emissions were largely reduced during the lockdown on a regional scale in the YRD region.
Through the comparison of EC and NOx before and during the lockdown in 2020, as well as the same period in previous years (2016–2019), we showed that determining the reduction in vehicular emissions that could be attributed to the lockdown measures was complicated and cannot be achieved by simply comparing the concentration difference between before and during the lockdown. This is because vehicular emissions have their own trend during the Lunar New Year, when vehicular emissions were largely reduced (Dai et al., 2021). Here, we showed that, due to the overlapping of the first week of the lockdown with the holiday, the reduction in vehicular emissions attributable to the lockdown was smaller than it appeared. This trend can be only revealed from multiple years of continuous measurement and would be easily missed by a conventional field campaign that only lasted a matter of months. For example, Jia et al. (2020) reported a 56 %–58 % reduction in NOx during the Covid-19 lockdown period by directly comparing the NOx concentrations to the period before the holiday in Shanghai. Here, we showed NOx was already reduced by approximately 60 % during the holiday week in a normal year. Such a trend in traffic emissions during the holiday week is consistent with the findings of previous studies (He et al., 2020; Dai et al., 2021; Shi et al., 2021). Considering the holiday effect, Dai et al. (2021) reported a reduction of ∼ 15 % in NO2 attributable to the Covid-19 lockdown period in Shanghai during the holiday week. This value is similar to this study's 17 % reduction in NOx. However, previous studies focusing only on the holiday week may underestimate the impact of the Covid-19 lockdown on air quality over an extended period because the lockdown period lasted more than 1 week. During the last 2 weeks of the lockdown, a 50 %–70 % reduction in both NOx and EC was attributable to the Covid-19 lockdown. Since the lockdown measures often took time to be executed more extensively, the later stages of air pollution reduction may better represent the air quality effect of Covid-19.
Many studies have shown the impact of the lockdown on traffic emissions but with different degrees of reduction that are attributable to the lockdown (Jia et al., 2020; Wang et al., 2020; Shi et al., 2021). Most previous studies focused on gas pollutants, i.e., NO2 probably because NO2 was a regular gas pollutant that is routinely measured at the air quality monitoring sites across the major Chinese cities (He et al., 2020), while few reported the particulate EC emissions from traffic partly due to the scarcity of the dataset. EC is light absorbing and is regarded as a warming agent second only to CO2 (Jacobson, 2001; Cappa et al., 2012; Liu et al., 2015). In addition, EC is one of the major particulate pollutants that can cause adverse health effects (Rappazzo et al., 2015). To the best of our knowledge, this is the first study to illustrate the impact of the lockdown on vehicular EC emissions at a sampling site near a highway based on 5 years of continuous measurement. Such a dataset is rare in the literature since lockdown measures restrict the movement of instrument operators. Only with good maintenance of the instrument at the sampling site could we keep the sampling going on during the strict lockdown.
To decouple the effects of the meteorological variables on the measured NOx and EC, a machine learning model was trained and tested based on the 5-year dataset. The machine learning model emerges as a powerful model in air quality studies, especially the development of SHAP (Lundberg et al., 2020), making the machine learning model explainable rather than a black box as in most previous air quality studies (Grange et al., 2017; Grange and Carslaw, 2019; Vu et al., 2019; Shi et al., 2021). The explainable machine learning model of SHAP showed that meteorological variables, especially ws and wd, were key parameters that affect the measured levels with concentrations of up to 100 µg m−3 for NOx. Low wind speed indicated poor dispersion conditions that favored the buildup of air pollutants, while wind direction pointed to the emission source of nearby traffic. Due to the important the role of meteorological variables, their impact needs to be removed when evaluating the true impact of the lockdown on vehicular emissions. Here, instead of simply comparing the concentration before and during the lockdown, a BAU scenario was assumed in 2020. This relies on the rebuilding power of the mathematical model. However, to train the machine learning model, a large body of datasets is required as the model input. As more datasets are to be collected and used as model input, the performance of machine learning is expected to improve further. Moreover, with more variables, e.g., vehicular types, weight, and road conditions, being monitored and used as input for the model, better prediction power of the machine learning is anticipated. Correspondingly, the air quality improvement in future emission control scenarios can be better predicted.
In this study, we studied the impact of the Covid-19 lockdown on traffic emissions based on a 5-year measurement of NOx and EC using a BAU scenario analysis at a sampling site near a highway in Shanghai. We showed that (1) by simply comparing the concentration before and during the lockdown, the effects of the lockdown on air pollutant emissions may be overestimated and (2) a large reduction (50 %–70 %) in vehicular emissions of NOx and EC was attributed to the lockdown at a later stage that may better represent the impact of lockdown measures on air quality. This value is larger than previous studies because both the holiday effects and meteorological impacts were removed during this period. This large reduction in vehicular emissions at a later stage was consistent with satellite monitoring of NO2. Therefore, the strict lockdown reduced both vehicular gaseous and particulate emissions significantly when holiday and meteorological effects were not affecting the trend analysis. This study demonstrates the importance of continuous monitoring at this Shanghai supersite. When coupled with an advanced mathematical algorithm, insights into the impact of human activities on air pollution can be gained based on long-term monitoring. Air quality improvement in future emission control scenarios is expected to be better predicted.
The data presented in this study are available in the Zenodo data archive https://doi.org/10.5281/zenodo.6473085 (Wang et al., 2022d).
The supplement related to this article is available online at: https://doi.org/10.5194/acp-23-10313-2023-supplement.
MW, ZZ, XL, and SH designed the study. YD, JH, JC, YL, and QF conducted field campaigns. MW, YD, ZZ, and QY conducted data analysis. MW prepared the manuscript with contributions from all co-authors. QF, TW, JC, and SL provided input for revision before submission. QF and SL provided project guidance.
The contact author has declared that none of the authors has any competing interests.
Publisher’s note: Copernicus Publications remains neutral with regard to jurisdictional claims in published maps and institutional affiliations.
This work was supported by the Start-up Fund for RAPs under the Strategic Hiring Scheme (grant no. P0043854); Green Tech Fund (grant no. GTF202110151); Environment and Conservation Fund – Environmental Research, Technology Demonstration and Conference Projects (grant no. ECF 63/2019); RGC Theme-based Research Scheme (grant nos. T24-504/17-N and T31-603/21-N); Key Research and Development Projects of Shanghai Science and Technology Commission (grant no. 20dz1204000); and State Ecology and Environment Scientific Observation and Research Station for the Yangtze River Delta at Dianshan Lake (SEED).
This research has been supported by the Start-up Fund for RAPs under the Strategic Hiring Scheme (grant no. P0043854); Green Tech Fund (grant no. GTF202110151); Environment and Conservation Fund – Environmental Research, Technology Demonstration and Conference Projects (grant no. ECF 63/2019); RGC Theme-based Research Scheme (grant nos. T24-504/17-N and T31-603/21-N); and Key Research and Development Projects of Shanghai Science and Technology Commission (grant no. 20dz1204000).
This paper was edited by Thomas Berkemeier and reviewed by two anonymous referees.
Borlaza, L. J. S., Ngoc Thuy, V. D., Grange, S., Socquet, S., Moussu, E., Mary, G., Favez, O., Hueglin, C., Jaffrezo, J.-L., and Uzu, G.: Impact of COVID-19 lockdown on particulate matter oxidative potential at urban background versus traffic sites, Environ. Sci.-Atmos., 3, 942–953, https://doi.org/10.1039/D3EA00013C, 2023.
Cappa, C. D., Onasch, T. B., Massoli, P., Worsnop, D. R., Bates, T. S., Cross, E. S., Davidovits, P., Hakala, J., Hayden, K. L., Jobson, B. T., Kolesar, K. R., Lack, D. A., Lerner, B. M., Li, S.-M., Mellon, D., Nuaaman, I., Olfert, J. S., Petäjä, T., Quinn, P. K., Song, C., Subramanian, R., Williams, E. J., and Zaveri, R. A.: Radiative Absorption Enhancements Due to the Mixing State of Atmospheric Black Carbon, Science, 337, 1078–1081, https://doi.org/10.1126/science.1223447, 2012.
Chang, Y., Huang, K., Xie, M., Deng, C., Zou, Z., Liu, S., and Zhang, Y.: First long-term and near real-time measurement of trace elements in China's urban atmosphere: temporal variability, source apportionment and precipitation effect, Atmos. Chem. Phys., 18, 11793–11812, https://doi.org/10.5194/acp-18-11793-2018, 2018.
Dai, Q., Hou, L., Liu, B., Zhang, Y., Song, C., Shi, Z., Hopke, P. K., and Feng, Y.: Spring Festival and COVID-19 Lockdown: Disentangling PM Sources in Major Chinese Cities, Geophys. Res. Lett., 48, e2021GL093403, https://doi.org/10.1029/2021GL093403, 2021.
Duan, J., Huang, R.-J., Gu, Y., Lin, C., Zhong, H., Wang, Y., Yuan, W., Ni, H., Yang, L., Chen, Y., Worsnop, D. R., and O'Dowd, C.: The formation and evolution of secondary organic aerosol during summer in Xi'an: Aqueous phase processing in fog-rain days, Sci. Total Environ., 756, 144077, https://doi.org/10.1016/j.scitotenv.2020.144077, 2020.
Fuzzi, S., Baltensperger, U., Carslaw, K., Decesari, S., Denier van der Gon, H., Facchini, M. C., Fowler, D., Koren, I., Langford, B., Lohmann, U., Nemitz, E., Pandis, S., Riipinen, I., Rudich, Y., Schaap, M., Slowik, J. G., Spracklen, D. V., Vignati, E., Wild, M., Williams, M., and Gilardoni, S.: Particulate matter, air quality and climate: lessons learned and future needs, Atmos. Chem. Phys., 15, 8217–8299, https://doi.org/10.5194/acp-15-8217-2015, 2015.
González-Pardo, J., Ceballos-Santos, S., Manzanas, R., Santibáñez, M., and Fernández-Olmo, I.: Estimating changes in air pollutant levels due to COVID-19 lockdown measures based on a business-as-usual prediction scenario using data mining models: A case-study for urban traffic sites in Spain, Sci. Total Environ., 823, 153786, https://doi.org/10.1016/j.scitotenv.2022.153786, 2022.
Grange, S. K. and Carslaw, D. C.: Using meteorological normalisation to detect interventions in air quality time series, Sci. Total Environ., 653, 578–588, https://doi.org/10.1016/j.scitotenv.2018.10.344, 2019.
Grange, S. K., Lewis, A. C., Moller, S. J., and Carslaw, D. C.: Lower vehicular primary emissions of NO2 in Europe than assumed in policy projections, Nat. Geosci., 10, 914–918, https://doi.org/10.1038/s41561-017-0009-0, 2017.
Grange, S. K., Carslaw, D. C., Lewis, A. C., Boleti, E., and Hueglin, C.: Random forest meteorological normalisation models for Swiss PM10 trend analysis, Atmos. Chem. Phys., 18, 6223–6239, https://doi.org/10.5194/acp-18-6223-2018, 2018.
Grange, S. K., Lee, J. D., Drysdale, W. S., Lewis, A. C., Hueglin, C., Emmenegger, L., and Carslaw, D. C.: COVID-19 lockdowns highlight a risk of increasing ozone pollution in European urban areas, Atmos. Chem. Phys., 21, 4169–4185, https://doi.org/10.5194/acp-21-4169-2021, 2021.
Hallquist, M., Wenger, J. C., Baltensperger, U., Rudich, Y., Simpson, D., Claeys, M., Dommen, J., Donahue, N. M., George, C., Goldstein, A. H., Hamilton, J. F., Herrmann, H., Hoffmann, T., Iinuma, Y., Jang, M., Jenkin, M. E., Jimenez, J. L., Kiendler-Scharr, A., Maenhaut, W., McFiggans, G., Mentel, Th. F., Monod, A., Prévôt, A. S. H., Seinfeld, J. H., Surratt, J. D., Szmigielski, R., and Wildt, J.: The formation, properties and impact of secondary organic aerosol: current and emerging issues, Atmos. Chem. Phys., 9, 5155–5236, https://doi.org/10.5194/acp-9-5155-2009, 2009.
Hay, N., Onwuzurike, O., Roy, S. P., McNamara, P., McNamara, M. L., and McDonald, W.: Impact of traffic on air pollution in a mid-sized urban city during COVID-19 lockdowns, Air Qual. Atmos. Health, 16, 1141–1152, https://doi.org/10.1007/s11869-023-01330-3, 2023.
He, G., Pan, Y., and Tanaka, T.: The short-term impacts of COVID-19 lockdown on urban air pollution in China, Nat. Sustain., 3, 1005–1011, https://doi.org/10.1038/s41893-020-0581-y, 2020.
Huang, H., Zhang, J., Hu, H., Kong, S., Qi, S., and Liu, X.: On-road emissions of fine particles and associated chemical components from motor vehicles in Wuhan, China, Environ. Res., 210, 112900, https://doi.org/10.1016/j.envres.2022.112900, 2022.
Jacobson, M. Z.: Strong radiative heating due to the mixing state of black carbon in atmospheric aerosols, Nature, 409, 695–697, https://doi.org/10.1038/35055518, 2001.
Jia, H., Huo, J., Fu, Q., Duan, Y., Lin, Y., Jin, X., Hu, X., and Cheng, J.: Insights into chemical composition, abatement mechanisms and regional transport of atmospheric pollutants in the Yangtze River Delta region, China during the COVID-19 outbreak control period, Environ. Pollut., 267, 115612, https://doi.org/10.1016/j.envpol.2020.115612, 2020.
Jia, H., Pan, J., Huo, J., Fu, Q., Duan, Y., Lin, Y., Hu, X., and Cheng, J.: Atmospheric black carbon in urban and traffic areas in Shanghai: Temporal variations, source characteristics, and population exposure, Environ. Pollut., 289, 117868, https://doi.org/10.1016/j.envpol.2021.117868, 2021.
Li, K., Jacob, D. J., Liao, H., Zhu, J., Shah, V., Shen, L., Bates, K. H., Zhang, Q., and Zhai, S.: A two-pollutant strategy for improving ozone and particulate air quality in China, Nat. Geosci., 12, 906–910, https://doi.org/10.1038/s41561-019-0464-x, 2019.
Li, K., Jacob, D. J., Liao, H., Qiu, Y., Shen, L., Zhai, S., Bates, K. H., Sulprizio, M. P., Song, S., Lu, X., Zhang, Q., Zheng, B., Zhang, Y., Zhang, J., Lee, H. C., and Kuk, S. K.: Ozone pollution in the North China Plain spreading into the late-winter haze season, P. Natl. Acad. Sci. USA, 118, e2015797118, https://doi.org/10.1073/pnas.2015797118, 2021.
Lin, C., Ceburnis, D., Xu, W., Heffernan, E., Hellebust, S., Gallagher, J., Huang, R. J., O'Dowd, C., and Ovadnevaite, J.: The impact of traffic on air quality in Ireland: insights from the simultaneous kerbside and suburban monitoring of submicron aerosols, Atmos. Chem. Phys., 20, 10513–10529, https://doi.org/10.5194/acp-20-10513-2020, 2020.
Lin, C., Huang, R.-J., Ceburnis, D., Buckley, P., Preissler, J., Wenger, J., Rinaldi, M., Facchini, M. C., O'Dowd, C., and Ovadnevaite, J.: Extreme air pollution from residential solid fuel burning, Nat. Sustain., 1, 512–517, 2018.
Lin, C., Huang, R.-J., Duan, J., Zhong, H., and Xu, W.: Primary and Secondary Organic Nitrate in Northwest China: A Case Study, Environ. Sci. Technol. Lett., 8, 947–953, https://doi.org/10.1021/acs.estlett.1c00692, 2021.
Lin, C., Huang, R. J., Zhong, H., Duan, J., Wang, Z., Huang, W., and Xu, W.: Elucidating ozone and PM2.5 pollution in the Fenwei Plain reveals the co-benefits of controlling precursor gas emissions in winter haze, Atmos. Chem. Phys., 23, 3595–3607, https://doi.org/10.5194/acp-23-3595-2023, 2023a.
Lin, C., Ceburnis, D., Vaishya, A., Trubetskaya, A., Tan, Y., Wang, T., Smith, W., Johnson, R., Xu, W., Monaghan, R. F. D., O'Dowd, C., and Ovadnevaite, J.: Air quality – climate forcing double whammy from domestic firelighters, npj Clim. Atmos. Sci., 6, 101, https://doi.org/10.1038/s41612-023-00427-x, 2023b.
Liu, T., Wang, X., Hu, J., Wang, Q., An, J., Gong, K., Sun, J., Li, L., Qin, M., Li, J., Tian, J., Huang, Y., Liao, H., Zhou, M., Hu, Q., Yan, R., Wang, H., and Huang, C.: Driving Forces of Changes in Air Quality during the COVID-19 Lockdown Period in the Yangtze River Delta Region, China, Environ. Sci. Technol. Lett., 7, 779–786, https://doi.org/10.1021/acs.estlett.0c00511, 2020.
Liu, Z., Guan, D., Wei, W., Davis, S. J., Ciais, P., Bai, J., Peng, S., Zhang, Q., Hubacek, K., Marland, G., Andres, R. J., Crawford-Brown, D., Lin, J., Zhao, H., Hong, C., Boden, T. A., Feng, K., Peters, G. P., Xi, F., Liu, J., Li, Y., Zhao, Y., Zeng, N., and He, K.: Reduced carbon emission estimates from fossil fuel combustion and cement production in China, Nature, 524, 335–338, https://doi.org/10.1038/nature14677, 2015.
Lu, K., Fuchs, H., Hofzumahaus, A., Tan, Z., Wang, H., Zhang, L., Schmitt, S. H., Rohrer, F., Bohn, B., Broch, S., Dong, H., Gkatzelis, G. I., Hohaus, T., Holland, F., Li, X., Liu, Y., Liu, Y., Ma, X., Novelli, A., Schlag, P., Shao, M., Wu, Y., Wu, Z., Zeng, L., Hu, M., Kiendler-Scharr, A., Wahner, A., and Zhang, Y.: Fast Photochemistry in Wintertime Haze: Consequences for Pollution Mitigation Strategies, Environ. Sci. Technol., 53, 10676–10684, https://doi.org/10.1021/acs.est.9b02422, 2019.
Lundberg, S. M., Erion, G., Chen, H., DeGrave, A., Prutkin, J. M., Nair, B., Katz, R., Himmelfarb, J., Bansal, N., and Lee, S.-I.: From local explanations to global understanding with explainable AI for trees, Nat. Mach. Intell., 2, 56–67, https://doi.org/10.1038/s42256-019-0138-9, 2020.
Ministry of Transport: Number of Motor Vehicle: Private Owned: Shanghai, https://www.ceicdata.com/en/china/no-of-motor-vehicle-private-owned/cn-no-of-motor-vehicle-private-owned-shanghai, last access: 1 July 2023.
Oukawa, G. Y., Krecl, P., and Targino, A. C.: Fine-scale modeling of the urban heat island: A comparison of multiple linear regression and random forest approaches, Sci. Total Environ., 815, 152836, https://doi.org/10.1016/j.scitotenv.2021.152836, 2022.
Patel, K., Bhandari, S., Gani, S., Kumar, P., Baig, N., Habib, G., Apte, J., and Hildebrandt Ruiz, L.: Factors influencing ambient particulate matter in Delhi, India: Insights from machine learning, Aerosol Sci. Technol., 57, 546–561, https://doi.org/10.1080/02786826.2023.2193237, 2023.
Qin, X., Zhou, S., Li, H., Wang, G., Wang, X., Fu, Q., Duan, Y., Lin, Y., Huo, J., Huang, K., and Deng, C.: Simulation of Spatiotemporal Trends of Gaseous Elemental Mercury in the Yangtze River Delta of Eastern China by an Artificial Neural Network, Environ. Sci. Technol. Lett., 9, 205–211, https://doi.org/10.1021/acs.estlett.1c01025, 2022.
Qin, Y., Ye, J., Ohno, P., Liu, P., Wang, J., Fu, P., Zhou, L., Li, Y. J., Martin, S. T., and Chan, C. K.: Assessing the Nonlinear Effect of Atmospheric Variables on Primary and Oxygenated Organic Aerosol Concentration Using Machine Learning, ACS Earth Space Chem., 6, 1059–1066, https://doi.org/10.1021/acsearthspacechem.1c00443, 2022.
Ramanathan, V. and Carmichael, G.: Global and regional climate changes due to black carbon, Nat. Geosci., 1, 221–227, https://doi.org/10.1038/ngeo156, 2008.
Rappazzo, K. M., Daniels, J. L., Messer, L. C., Poole, C., and Lobdell, D. T.: Exposure to Elemental Carbon, Organic Carbon, Nitrate, and Sulfate Fractions of Fine Particulate Matter and Risk of Preterm Birth in New Jersey, Ohio, and Pennsylvania (2000–2005), Environ. Health Perspect., 123, 1059–1065, https://doi.org/10.1289/ehp.1408953, 2015.
Shi, Z., Song, C., Liu, B., Lu, G., Xu, J., Vu, T. V., Elliott, R. J. R., Li, W., Bloss, W. J., and Harrison, R. M.: Abrupt but smaller than expected changes in surface air quality attributable to COVID-19 lockdowns, Sci. Adv., 7, eabd6696, https://doi.org/10.1126/sciadv.abd6696, 2021.
Vu, T. V., Shi, Z., Cheng, J., Zhang, Q., He, K., Wang, S., and Harrison, R. M.: Assessing the impact of clean air action on air quality trends in Beijing using a machine learning technique, Atmos. Chem. Phys., 19, 11303–11314, https://doi.org/10.5194/acp-19-11303-2019, 2019.
Wang, J., Wu, Q., Liu, J., Yang, H., Yin, M., Chen, S., Guo, P., Ren, J., Luo, X., Linghu, W., and Huang, Q.: Vehicle emission and atmospheric pollution in China: problems, progress, and prospects, PeerJ, 7, e6932, https://doi.org/10.7717/peerj.6932, 2019.
Wang, Y., Wen, Y., Wang, Y., Zhang, S., Zhang, K. M., Zheng, H., Xing, J., Wu, Y., and Hao, J.: Four-Month Changes in Air Quality during and after the COVID-19 Lockdown in Six Megacities in China, Environ. Sci. Technol. Lett., 7, 802–808, https://doi.org/10.1021/acs.estlett.0c00605, 2020.
Wang, M., Duan, Y., Zhang, Z., Huo, J., Huang, Y., Fu, Q., Wang, T., Cao, J., and Lee, S.-C.: Increased contribution to PM2.5 from traffic-influenced road dust in Shanghai over recent years and predictable future, Environ. Pollut., 313, 120119, https://doi.org/10.1016/j.envpol.2022.120119, 2022a.
Wang, M., Zhang, Z., Yuan, Q., Li, X., Han, S., Lam, Y., Cui, L., Huang, Y., Cao, J., and Lee, S.-c.: Slower than expected reduction in annual PM2.5 in Xi'an revealed by machine learning-based meteorological normalization, Sci. Total Environ., 841, 156740, https://doi.org/10.1016/j.scitotenv.2022.156740, 2022b.
Wang, M., Duan, Y., Xu, W., Wang, Q., Zhang, Z., Yuan, Q., Li, X., Han, S., Tong, H., Huo, J., Chen, J., Gao, S., Wu, Z., Cui, L., Huang, Y., Xiu, G., Cao, J., Fu, Q., and Lee, S.: Measurement report: Characterisation and sources of the secondary organic carbon in a Chinese megacity over 5 years from 2016 to 2020, Atmos. Chem. Phys., 22, 12789–12802, https://doi.org/10.5194/acp-22-12789-2022, 2022c.
Wang, M., Duan, Y., Xu, W., Wang, Q., Zhang, Z., Yuan, Q., Li, X., Han, S., Tong, H., Huo, J., Chen, J., Gao, S., Wu, Z., Cui, L., Huang, Y., Xiu, G., Cao, J., Fu, Q., and Lee, S.: Measurement report: characterization and sources of the ambient secondary organic carbon in a Chinese megacity over five years from 2016 to 2020, Zenodo [data set], https://doi.org/10.5281/zenodo.647308, 2022d.
Wu, C.-L., Wang, H.-W., Cai, W.-J., He, H.-d., Ni, A.-N., and Peng, Z.-R.: Impact of the COVID-19 lockdown on roadside traffic-related air pollution in Shanghai, China, Build. Environ., 194, 107718–107718, 10.1016/j.buildenv.2021.107718, 2021.
Zhao, Y., Zhang, K., Xu, X., Shen, H., Zhu, X., Zhang, Y., Hu, Y., and Shen, G.: Substantial changes in nitrate oxide and ozone after excluding meteorological impacts during the COVID-19 outbreak in mainland China, Environ. Sci. Technol. Lett., 7, 402–408, https://doi.org/10.1021/acs.estlett.0c00304, 2020.
Zheng, B., Tong, D., Li, M., Liu, F., Hong, C., Geng, G., Li, H., Li, X., Peng, L., Qi, J., Yan, L., Zhang, Y., Zhao, H., Zheng, Y., He, K., and Zhang, Q.: Trends in China's anthropogenic emissions since 2010 as the consequence of clean air actions, Atmos. Chem. Phys., 18, 14095–14111, https://doi.org/10.5194/acp-18-14095-2018, 2018.
Zhou, H., Lin, J., Shen, Y., Deng, F., Gao, Y., Liu, Y., Dong, H., Zhang, Y., Sun, Q., Fang, J., Tang, S., Wang, Y., Du, Y., Cui, L., Ruan, S., Kong, F., Liu, Z., and Li, T.: Personal black carbon exposure and its determinants among elderly adults in urban China, Environ. Int., 138, 105607, https://doi.org/10.1016/j.envint.2020.105607, 2020.