the Creative Commons Attribution 4.0 License.
the Creative Commons Attribution 4.0 License.
 | 20 Jan 2023
Aerosol–precipitation elevation dependence over the central Himalayas using cloud-resolving WRF-Chem numerical modeling
Pramod Adhikari
Atmospheric aerosols can modulate the orographic precipitation impacting the evolution of clouds through radiation and microphysical pathways. This study implements the cloud-resolving Weather Research and Forecasting model coupled with Chemistry (WRF-Chem) to study the response of the central Himalayan elevation-dependent precipitation to the atmospheric aerosols. The first monsoonal month of 2013 is simulated to assess the effect of aerosols through radiation and cloud interactions. The results show that the response of diurnal variation and precipitation intensities (light, moderate, and heavy) to aerosol radiation and cloud interaction depended on the different elevational ranges of the central Himalayan region. Below 2000 m a.s.l., the total effect of aerosols resulted in suppressed mean light precipitation by 19 % while enhancing the moderate and heavy precipitation by 3 % and 12 %, respectively. In contrast, above 2000 m a.s.l., a significant reduction of all three categories of precipitation intensity occurred with the 11 % reduction in mean precipitation. These contrasting altitudinal precipitation responses to the increased anthropogenic aerosols can significantly impact the hydroclimate of the central Himalayas, increasing the risk for extreme events and influencing the regional supply of water resources.
- Article
(16101 KB) - Full-text XML
-
Supplement
(1171 KB) - BibTeX
- EndNote


The South Asian summer monsoon system, one of the major monsoonal systems on Earth, is located in the region with the persistent occurrence of substantial loadings of atmospheric aerosols (Li et al., 2016). The densely populated and rapidly growing urban centers of the Indo-Gangetic Plain (IGP), located over northern India at the foothills of the Himalayas, experience frequent events of severe air pollution with significant contribution from local anthropogenic activities and remotely transported mineral dust aerosols (Dey and Di Girolamo, 2011; Kumar et al., 2018; Sijikumar et al., 2016). Atmospheric aerosols, from both natural and anthropogenic sources, can impact the weather and climate on a local to global scale through interactions with radiation and cloud, as well as through albedo and hydrologic pathways due to deposition over the snow (e.g., Sarangi et al., 2019; Wu et al., 2018; Andreae and Rosenfeld, 2008; Haywood and Boucher, 2000; Mahowald et al., 2011; Ramanathan and Carmichael, 2008). However, due to inhomogeneous distribution and complex radiation and cloud interaction, aerosol also contributes to the larger uncertainties in assessing the Earth's changing climate (IPCC, 2013).
The aerosol–radiation interaction (ARI) comprises the direct radiative effects, which include the scattering and absorption of solar radiation depending on the optical properties and the semi-direct effect (IPCC, 2013). The semi-direct effect refers to the heating of the cloud due to the absorbing aerosols, which reduces the relative humidity and increases the cloud burn-off process resulting in lower planetary albedo (Hansen et al., 1997; J. Huang et al., 2006; Ackerman et al., 2000). The ARI can alter the surface energy budget, atmospheric thermodynamic structure, convective stability, and tropical–meridional circulation, in turn modulating the frequency and intensity of the monsoonal rainfall (e.g., Li et al., 2016; Ramanathan et al., 2005; Lau et al., 2006). At a daily timescale, the direct radiative effect increases the low-level stability over the polluted urban plains, resulting in enhanced moisture transport towards the downwind mountains and abnormally increasing precipitation (Choudhury et al., 2020; Fan et al., 2015).
IPCC (2013) defines aerosol–cloud interaction (ACI) as the modification of cloud microphysical properties or cloud evolution through the ability of aerosol to act as cloud condensation nuclei (CCN) or ice-nucleating particles (INPs). Polluted clouds or clouds with a higher concentration of CCN increase the number of smaller cloud droplets for a constant liquid water path and enhance the reflection, also known as the first indirect effect (Twomey, 1977). Smaller cloud droplets result in increased cloud lifetime and height and suppress the drizzle precipitation, also known as the second indirect or cloud lifetime effect (Pincus and Baker, 1994; Albrecht, 1989; Rosenfeld, 1999). The continuing and intensified updrafts with the release of latent heat of condensation and freezing and additional thermal buoyancy invigorate the convection strength and cloud development (Rosenfeld et al., 2008; Andreae et al., 2004; Koren et al., 2005). Additionally, Fan et al. (2017) proposed that the increase in latent heat release with CCN concentration strengthens the moisture transport to the windward slope and can invigorate the mixed phase orographic clouds, resulting in higher precipitation over the Sierra Nevada, California.
The locally emitted and transported anthropogenic aerosols can impact the precipitation, vertical temperature distribution, and regional hydroclimate of the Himalayan and the adjacent region. The deep convective activity and southwesterly monsoonal flow incorporate the remote dust and anthropogenic aerosols from the IGP and transport them to the southern slopes of the Himalayas and even to the Tibetan Plateau (Kang et al., 2019; Ji et al., 2015; Vernier et al., 2011). Adhikari and Mejia (2021) indicated that the heavier aerosol loadings contribute to the increased freezing isotherm over the central Himalayas during the monsoonal season. The increasing trend of the freezing level height (FLH) has been reported around the globe (e.g., Wang et al., 2014; Bradley et al., 2009; Zhang and Guo, 2011; Prein and Heymsfield, 2020; Lynn et al., 2020) and can impact the snowline altitude (Wang et al., 2014; Prein and Heymsfield, 2020). The amplified warming of the mountainous terrain or the elevation-dependent warming around the globe can also be associated with the change in snow cover and albedo, radiative and surface fluxes, changes in water vapor and latent heat release, deposition of aerosols on snowpack, and aerosol concentrations (Pepin et al., 2015; Rangwala et al., 2010). Depending on the location and topographical altitude, different factors can dominate elevation-dependent warming; e.g., the radiative impact of concentrated aerosol loading can play a significant role in modulating the temperature over the slopes of the Himalayas and mid-latitude Asia (Pepin et al., 2015; Rangwala and Miller, 2012; Palazzi et al., 2017).
The atmospheric heating due to the accumulated remote dust and carbonaceous aerosols from IGP leads to the northward shift of deep convection and heavier monsoonal rainfall over the foothills of the Himalayas during the early monsoon period (Lau et al., 2006, 2017). Furthermore, the variability in the orographic precipitation has also been linked to the atmospheric aerosols around the globe (Napoli et al., 2019; Wu et al., 2018; Choudhury et al., 2020; Adhikari and Mejia, 2021, 2022). Barman and Gokhale (2022), using a coarse (10 km) resolution WRF-Chem simulation, showed aerosol could modulate the precipitation over the mountainous terrain of northeastern India during the spring season. Also, a case study by Adhikari and Mejia (2022) showed central Himalayan early monsoon precipitation enhanced due to the remotely transported dust aerosols. Cho et al. (2016) suggested that anthropogenic climate forcing modifies the circulation structure, triggers the intense rainfall over northern South Asia, and increases the risk of flood severity. Furthermore, long-term observational studies by Choudhury et al. (2020) and Adhikari and Mejia (2021) showed that the aerosol invigorated cloud development and enhanced the precipitation over the southern slopes of the central Himalayas. The localized extreme weather events over the complex mountainous terrain pose a higher hazard due to flash floods and landslides.
The increased aerosols over the slopes of the Himalayas impacts the microphysical properties of the clouds and can modulate the precipitation pattern over the different elevational band of the Himalayas (Palazzi et al., 2013; Dimri et al., 2022). The climatology of the temperature and precipitation trends and elevation dependence over the Tibetan Plateau (TP) and the Himalayas was recently studied using the climate models (e.g., Palazzi et al., 2017; Ghimire et al., 2018; Dimri et al., 2022) but without including the effect of aerosols. To the best of our knowledge, a study examining the elevation dependence of aerosol–cloud interaction and precipitation response to aerosols over the central Himalayan region is lacking. A better understanding of aerosol–cloud interaction on elevation-dependent precipitation and temperature of this mountainous region is crucial to assess the hydrologic and climate risks for millions of people residing on the adjacent lowlands. This study seeks to examine whether there is an asymmetrical aerosol–cloud response in the orographic forcing process over the southern slopes of the Himalayas and further estimate and evaluate the role of increased anthropogenic aerosols in modulating the surface temperature distribution along the elevational band. To achieve this goal, we implement the Weather Research and Forecasting (WRF) model coupled with Chemistry (WRF-Chem) configured at a cloud-resolving scale (3 km), where the organization of the convection is explicitly resolved, for the first monsoonal month of 2013 after the onset of the monsoon in Nepal. To understand the processes involved in the aerosol–cloud interaction and precipitation elevation dependence, WRF-Chem simulation realizations were performed to isolate the contribution of the ACI and ARI. In Sect. 2, we describe the details of the model used. In Sect. 3, we present and discuss the model evaluation and simulation results. The conclusion of this study is summarized in Sect. 4.
2.1 Model description
In this study, we implement the Weather Research and Forecasting (WRF) model coupled with Chemistry (WRF-Chem) version 4.1.5 for numerical simulations (Grell et al., 2005). WRF-Chem is an advanced online coupled regional model which can simulate the emission, transport, and transformation of trace gases and aerosols with atmospheric feedback processes from radiation and meteorology (Chapman et al., 2009; Fast et al., 2006). WRF-Chem consists of several chemistry components, e.g., emission inventories, aerosol-chemistry mechanism, aqueous and gas phase mechanism, dry and wet deposition, and photolysis, and has been widely used to study aerosol emission and transport (e.g., Dhital et al., 2022; Parajuli et al., 2019) and aerosol–cloud–radiation–climate interaction (e.g., Wu et al., 2018; Fan et al., 2015; Sarangi et al., 2015; Archer-Nicholls et al., 2016; Liu et al., 2020) around the globe.
The Carbon Bond Mechanism (CBM-Z; Zaveri and Peters, 1999), a gas-phase chemistry mechanism coupled with the MOSAIC (Model for Simulating Aerosol Interactions and Chemistry; Zaveri et al., 2008) aerosol module, was utilized. The CBM-Z includes 67 chemical species and 164 reactions and treats the organic compound in a lumped structure approach depending on their internal bond types (Gery et al., 1989; Zaveri et al., 2008). MOSAIC aerosol module simulates all the major aerosol species (including sulfate, nitrate, ammonium, primary organic mass, black carbon, and liquid water) that are deemed to be significant at urban, regional, and global scales (Zaveri et al., 2008). Of note is that the MOSAIC version implemented in this study does not treat the secondary organic aerosols, which are expected to modulate the physical and chemical properties of atmospheric aerosols (Kaul et al., 2011; Hallquist et al., 2009) and can add up the uncertainties in the result. The aerosol size distribution within the MOSAIC aerosol module is represented by a four- or eight-sectional-bin approach. To reduce the computational burden, the aerosol size distribution in the MOSAIC was represented using four bins, ranging between 39 nm and 10 µm based on dry particle diameters. The four-bin approach reasonably produces similar results in comparison to the eight-sized-bin approach (Eidhammer et al., 2014; Zhao et al., 2013). All particles within a bin are considered to be internally mixed, which have similar chemical composition, while particles from different-sized bins are mixed externally (Zaveri et al., 2008).
Composite aerosol optical properties, such as the extinction and scattering coefficient, single scattering albedo, and asymmetry factor, are estimated as a function of the size and chemical composition of aerosols using the volume averaging method with Mie theory (Fast et al., 2006; Chapman et al., 2009). The total integrated aerosol optical properties across all sized bins are then used in the radiation transfer scheme to compute the net radiative effect of aerosols (Chapman et al., 2009; Iacono et al., 2008). The primary aspect of aerosols in impacting cloud evolution and microphysics are the concentration and composition, size distribution, and hygroscopic nature of aerosols (Khain et al., 2016). In a convective cloud, the effect of aerosols on the microphysics is mainly determined by the number of aerosols activated as CCN, which impacts the size and cloud droplet number concentration (Chapman et al., 2009). Aerosols are activated as CCN when the maximum environmental supersaturation is greater than the critical supersaturation of an aerosol, which is a function of aerosol size and composition. The maximum supersaturation of rising air parcels within each size bin is computed as a function of vertical velocity and composition of internally mixed aerosols (Abdul-Razzak and Ghan, 2002). The interstitial aerosols with higher critical supersaturation than maximum ambient supersaturation are not activated as CCN (Chapman et al., 2009). Also, the WRF-Chem can resuspend cloud-borne aerosols to an interstitial state when the cloud particles evaporate within a grid cell (Chapman et al., 2009). The main advantage of using cloud-resolving scales in this aerosol–cloud interaction study is that the activation of aerosols is explicitly resolved by the double-moment microphysics scheme (Archer-Nicholls et al., 2016; Chapman et al., 2009; Yang et al., 2011).
This study uses the anthropogenic emission inventories from the Emissions Database for Global Atmospheric Research–Hemispheric Transport of Air Pollution (EDGAR-HTAP) and EDGARv4.3.2 (Janssens-Maenhout et al., 2015). EDGAR-HTAP is a global monthly emission inventory for the year 2010 at a spatial resolution of 0.1∘ × 0.1∘. The EDGAR-HTAP emission inventory includes the black carbon, organic matter, particulate matter, ammonia, sulfates, oxides of nitrogen, and carbon monoxide, from the major anthropogenic sources from power generation, industry, residential, agriculture, ground and aviation transport, and shipping. The non-methane volatile organic compounds in this study are provided from EDGARv4.3.2. This study utilizes the biogenic emissions from the Model of Emissions of Gases and Aerosols from Nature (MEGAN), which quantifies the net emissions from the terrestrial biosphere at a horizontal resolution of 1 km (Guenther et al., 2006, 2012). Fire INventory from NCAR version 1.5 (FINNv1.5), which provides the global estimates of open episodic fires from different sources in a 1 km spatial and daily temporal resolution (Wiedinmyer et al., 2011), is used as biomass burning emissions. Though fire events are less relevant during the monsoon season (2002–2013) in our area of interest (Matin et al., 2017), we used biomass burning information to include all the primary sources of aerosols.
The Community Atmosphere Model with Chemistry (CAM-Chem), with 0.9∘ × 1.25∘ spatial resolution with 56 vertical levels and six-hourly temporal resolution, is used as initial and boundary conditions for the chemical species (Buchholz et al., 2019). The meteorological forcing in CAM-Chem is driven by the Modern-Era Retrospective analysis for Research and Applications version 2 (MERRA2) reanalysis product (Emmons et al., 2020). Furthermore, the Coupled Model Intercomparison Project Phase 6 (CMIP6) provides the anthropogenic aerosols within CAM-Chem. The ERA5 (Hersbach et al., 2020), a most recent reanalysis product from European Centre for Medium-Range Weather Forecasting (ECMWF), with 31 km spatial and hourly temporal resolution, was used to initialize the model and as boundary conditions for the basic meteorological state parameters.
2.2 Experimental setup
According to the Department of Hydrology and Meteorology (DHM) of Nepal, the onset of the monsoon occurred on 14 June 2013, about a day after a normal onset date over eastern Nepal (DHM Nepal, 2022), and generally covers the entire country within a week. Model simulations were performed for 31 d, from 14 June at 00:00 UTC to 15 July at 00:00 UTC, 2013. The mean precipitation over the central Himalayan region (hereafter “CenHim”; area indicated by the white-colored polygon in Fig. 1b) during the first month of the monsoon (31 d after the monsoonal onset) from 2000–2021 is 11.84 mm d−1, with a standard deviation of 2.97 mm d−1 (see Fig. S1 in the Supplement). For the same period, the CenHim region in 2013 received 14.62 mm d−1 of precipitation, which is within +1 standard deviation of the climatology mean.
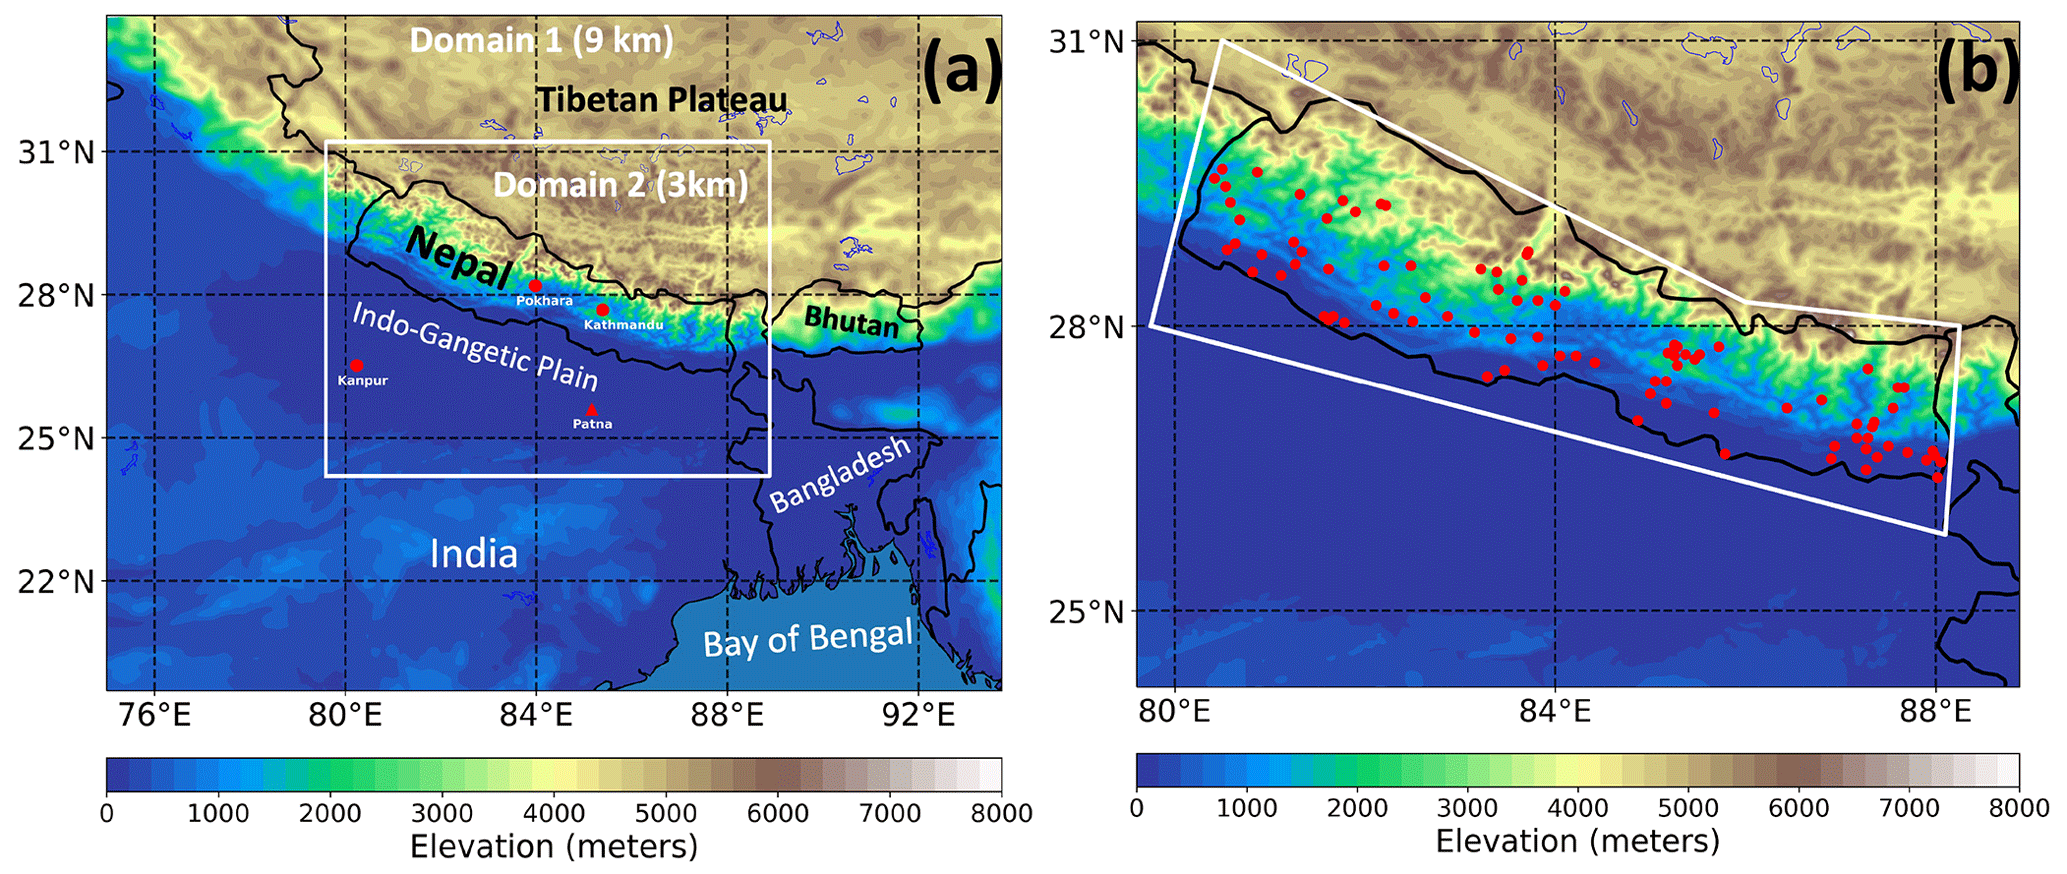
Figure 1(a) The topography of the 9 and 3 km nested grid size domains used in the simulation. The red marker represents the station locations for AERONET (circle) and upper air sounding (triangle). (b) The white-colored polygon represents the central Himalayan region (CenHim) mentioned in the text. The red marker represents the locations of DHM Nepal rain gauge stations.
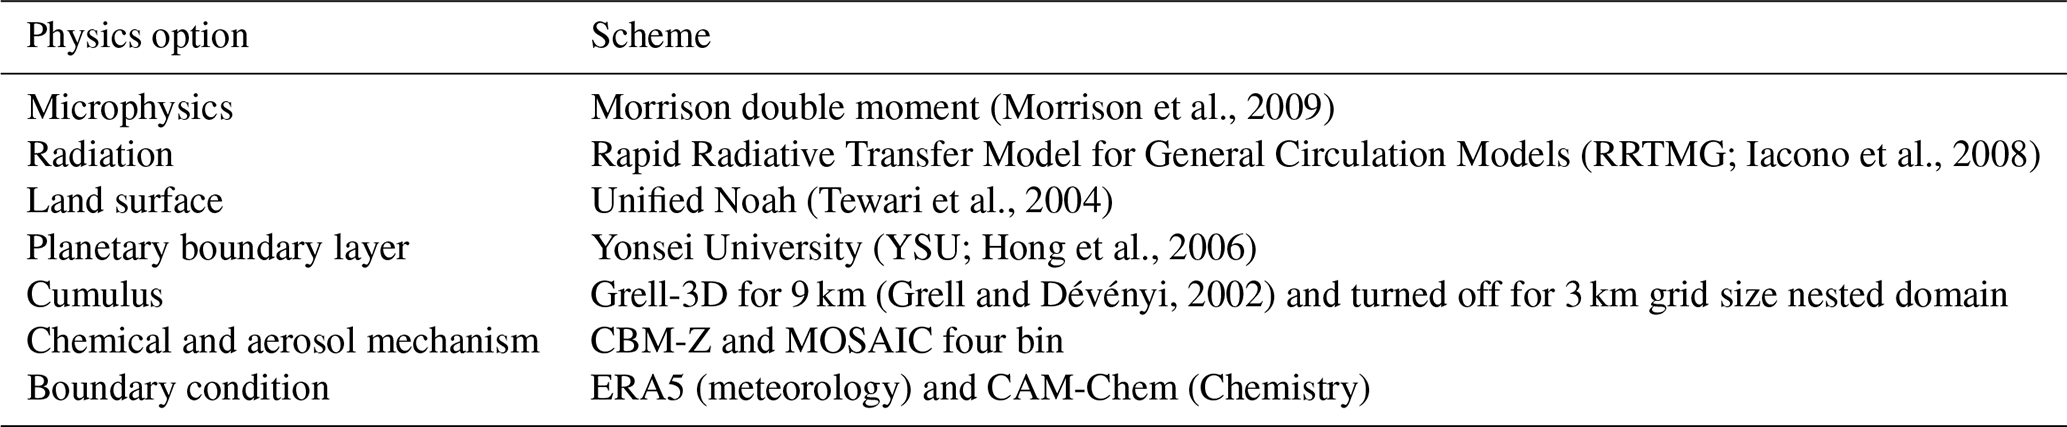
Two one-way nested domains with a horizontal resolution of 9 and 3 km were set up (see Fig. 1). The model was divided into 61 vertical layers with the 50 hPa model top. The 9 km parent domain with 179 × 221 grids covered central and northern/eastern India, Bangladesh, Bhutan, and the TP. The 3 km nested domain with 273 × 321 grid points was designed to include the CenHim, Nepal (with Mount Everest), the areas of most anthropogenic emission sources over the central IGP, and the immediate Himalayan plateau region of Tibet. The summary of the model configuration with the physical parameterizations used in this study is listed in Table 1. The model physics scheme used in the simulation included Morrison double moment for microphysics, Yonsei University (YSU) for the boundary layer, Rapid Radiative Transfer Model for General Circulation Models (RRTMG) for radiation, and Unified Noah for the land surface. The double-moment Morrison microphysics scheme simulates the number and mass mixing ratio of hydrometeors, including cloud droplets, rain, ice, snow, and graupel (Morrison et al., 2009). Previous studies have reasonably implemented the Morrison microphysics, RRTMG, and YSU to simulate and study the aerosol–cloud–precipitation interaction on a cloud-resolving scale (e.g., Kant et al., 2021; Wu et al., 2018). The Grell-3D cumulus parameterization scheme (Grell and Dévényi, 2002) was used for the outer 9 km domain for the cumulus parameterization, while no parameterization was used for the inner 3 km domain. This consideration assumes that the model explicitly resolves convective eddies for the 3 km domain, hence the term cloud-resolving scale. The convection parameterization is linked to significant sources of uncertainty in larger-scale models (Prein et al., 2015), and it is recommended to use a cloud-resolving scale to assess the indirect effect of aerosols in a convective system (Grell et al., 2011; Archer-Nicholls et al., 2016). Furthermore, such fine resolution is necessary to adequately address the altitudinal gradient in the steep mountains with characteristic altitudes ranging from 60 to 8000 m a.s.l. in about 200 km horizontal distance.
Three simulations were performed to assess the sensitivity of the model to aerosol effects. A baseline or control simulation (hereafter “CTL”) includes all the emissions (anthropogenic, biogenic, fire, and aerosols from chemistry boundary conditions). CTL includes the aerosol–radiation interaction, indirect effect of aerosols, wet scavenging, and dry deposition of aerosols. To isolate the direct effect of aerosol, the second simulation that resembles the CTL simulation is performed, but by turning off aerosol–radiation interaction (hereafter “NoARI”). The comparison between the CTL and NoARI enables the assessment of effect of aerosol–radiation interaction (ARI effect; Wu et al., 2018). The third experiment resembles the CTL, but it is performed by multiplying the anthropogenic aerosols from the boundary condition and emission inventory by a factor of 10 % (hereafter “CLEAN”). Reducing polluted aerosol concentration to a more pristine environment has been implemented previously in studying the impact of aerosols on clouds and precipitation (e.g., Manoj et al., 2021; Fan et al., 2013, 2007). Since the CLEAN scenario is not entirely aerosol-free, the presence of the 10 % anthropogenic aerosols and contribution from the fire and biogenic emissions can influence the assessment of the ACI effect. So, we attempt to broadly examine the microphysical effect of anthropogenic aerosols by comparing NoARI to CLEAN simulations (ACI effect). For completeness and as an effort to assess the uncertainty of anthropogenic aerosol loading in the region, a fourth simulation was performed using CTL but doubling aerosol concentration (D_AERO). Early results in this study suggested that the CTL simulation predicted a relatively low AOD compared to remote sensing retrievals. We use results and discuss the effect of the D_AERO simulations when necessary. Also, unless mentioned, we examine and present the results using the analysis from the inner domain.
To examine the aerosol–precipitation elevation dependence, we divided the CenHim into 30 different bins at an increasing interval of 200 m up to 6000 m and one bin for elevation above 6000 m above sea level (a.s.l.). Figure 2 shows the elevation distribution of the number of grid points in the CenHim and the corresponding mean CTL precipitation. The relatively small number of grid points at higher elevations suggests a drop in the statistical robustness of the analyses. When possible, we perform statistical significance tests using the Student t test at the 90 % confidence level to control for the statistical signal and noise. The maximum number of grid points (7113) is present below 200 m, while only 176 grid points are present above 6000 m over the CenHim. The diurnal variation and the elevation dependency of each variable are obtained by computing the average among all the grid points within each bin of the elevational range.
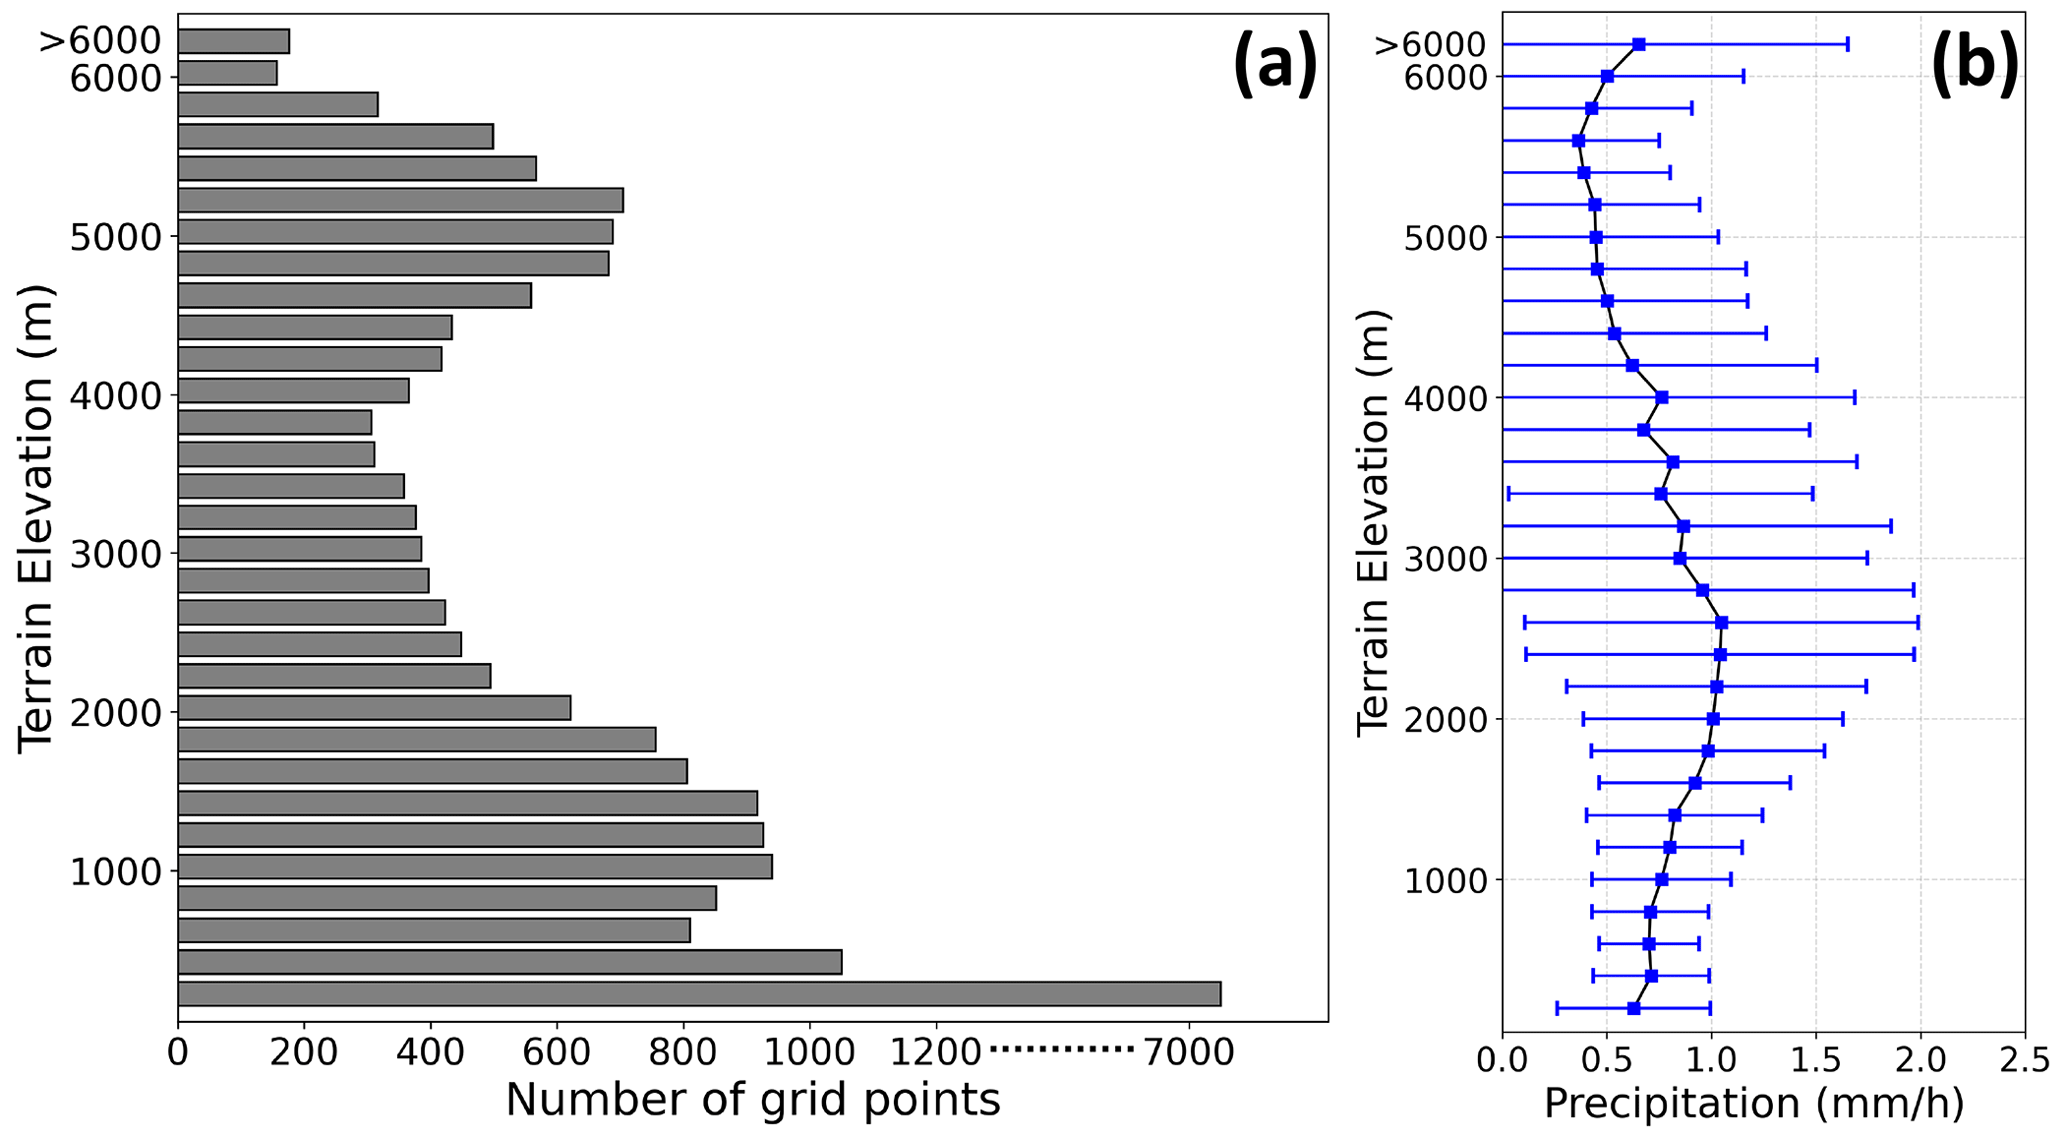
Figure 2(a) The total number of grids per elevation range for 200 m bins up to 6000 m and one bin above 6000 m. (b) Variation of CTL mean (±1 standard deviation) precipitation over the CenHim as a function of altitude.
2.3 Model evaluation
CTL precipitation fields were evaluated using the sparsely distributed network of 90 rain gauge stations measuring daily accumulations (measured at 03:00 UTC) and provided by the Department of Hydrology and Meteorology, Nepal (see Fig. 1b). The altitudinal station distribution ranges from 60 to 2744 m a.s.l. The spatial distribution of simulated precipitation was compared with the half-hourly Integrated Multi-satellite Retrievals for Global Precipitation Measurement (IMERG) level-3 data at 0.1∘ × 0.1∘ horizontal resolution (Huffman et al., 2019a).
CTL-simulated 550 nm aerosol optical depth (AOD) is evaluated against the AOD retrievals from three ground-based Aerosol Robotic Network (AERONET version 3, level 2.0; Kathmandu Bode, Pokhara, and Kanpur; see Fig. 1a) stations, satellite-based Moderate Resolution Imaging Spectroradiometer available at 10 km grid size (MODIS Terra (MOD04_L2; sensed at 10:30 LST) and Aqua (MYD04_L2; sensed at 13:30 LST)), and MERRA2 reanalysis product (three-hourly; 0.5∘ × 0.625∘ spatial resolution). The spatial distribution of simulated AOD is compared with the MODIS (level 3; 1∘ × 1∘) and MERRA2 reanalysis product (three-hourly; 0.5∘ × 0.625∘ spatial resolution). The combined Dark Target and Deep Blue 550 nm AOD product from Terra and Aqua aboard MODIS satellites is used for comparison. AERONET AOD data were obtained for 10:00 to 11:00 LST (±30 min of Terra overpass time) and 13:00 to 14:00 LST (±30 min of Aqua overpass time) to match up the MODIS overpass times. For time consistency, we used 10:45 LST (05:00 UTC) and 13:45 LST (08:00 UTC) as the nearest simulated AOD times. The AERONET and MODIS retrievals of aerosol properties are limited during the monsoonal season since they provide the AOD data measured in cloud-free conditions.
Since no upper air soundings are available in CenHim, radiosonde observations from http://weather.uwyo.edu/upperair/sounding.html (last access: 14 March 2022) at the Patna station, located south of CenHim (25.60∘ N, 85.1∘ E, 60 m a.s.l.; only available at 00:00 UTC; see Fig. 1a) were used to evaluate upper-air meteorological parameters (temperature, zonal and meridional wind components, and mixing ratio). Sounding data were interpolated at 36 pressure levels between 100 and 975 hPa with an increment of 25 hPa.
3.1 Model evaluation
Figure 3 shows the time series of the simulated AOD compared with the ground- and satellite-based AOD from AERONET and MODIS Aqua and Terra. Though limited data points are available for comparison, the CTL consistently underestimated the AOD, while D_AERO is comparable in magnitude with remotely sensed AOD (Fig. 3). Figure 4 shows the spatial distribution of mean MODIS, MERRA2, and simulated AOD during the simulation period. Though the CTL underestimated the AOD in magnitude, it captured the spatial distribution of AOD compared to MODIS (Fig. 4a) and MERRA2 (Fig. 4b). Due to the higher emission rate, the aerosol is heavily concentrated over the foothills and the IGP compared to the higher elevation of the mountainous terrain. The variation in the AOD along with the topographical transect from lower to higher elevation is clearly illustrated in Fig. 4. Not surprisingly, simulated AOD is lower for the CLEAN simulation over the entire domain, with the differences being maximum in the lowlands (Fig. 4e). Although higher mountainous terrain is polluted compared to the CLEAN scenario, the CTL AOD shows that it remains pristine compared to IGP due to the strong stratification of aerosol emission with elevation and limited transport due to the topographical barrier. The doubling of the anthropogenic aerosols in D_AERO resulted in increased AOD comparable to the MODIS and MERRA2 products (Fig. 4d). It should be noted that MODIS and MERRA2 are at coarser resolution and might have some biases related to the scale differences.
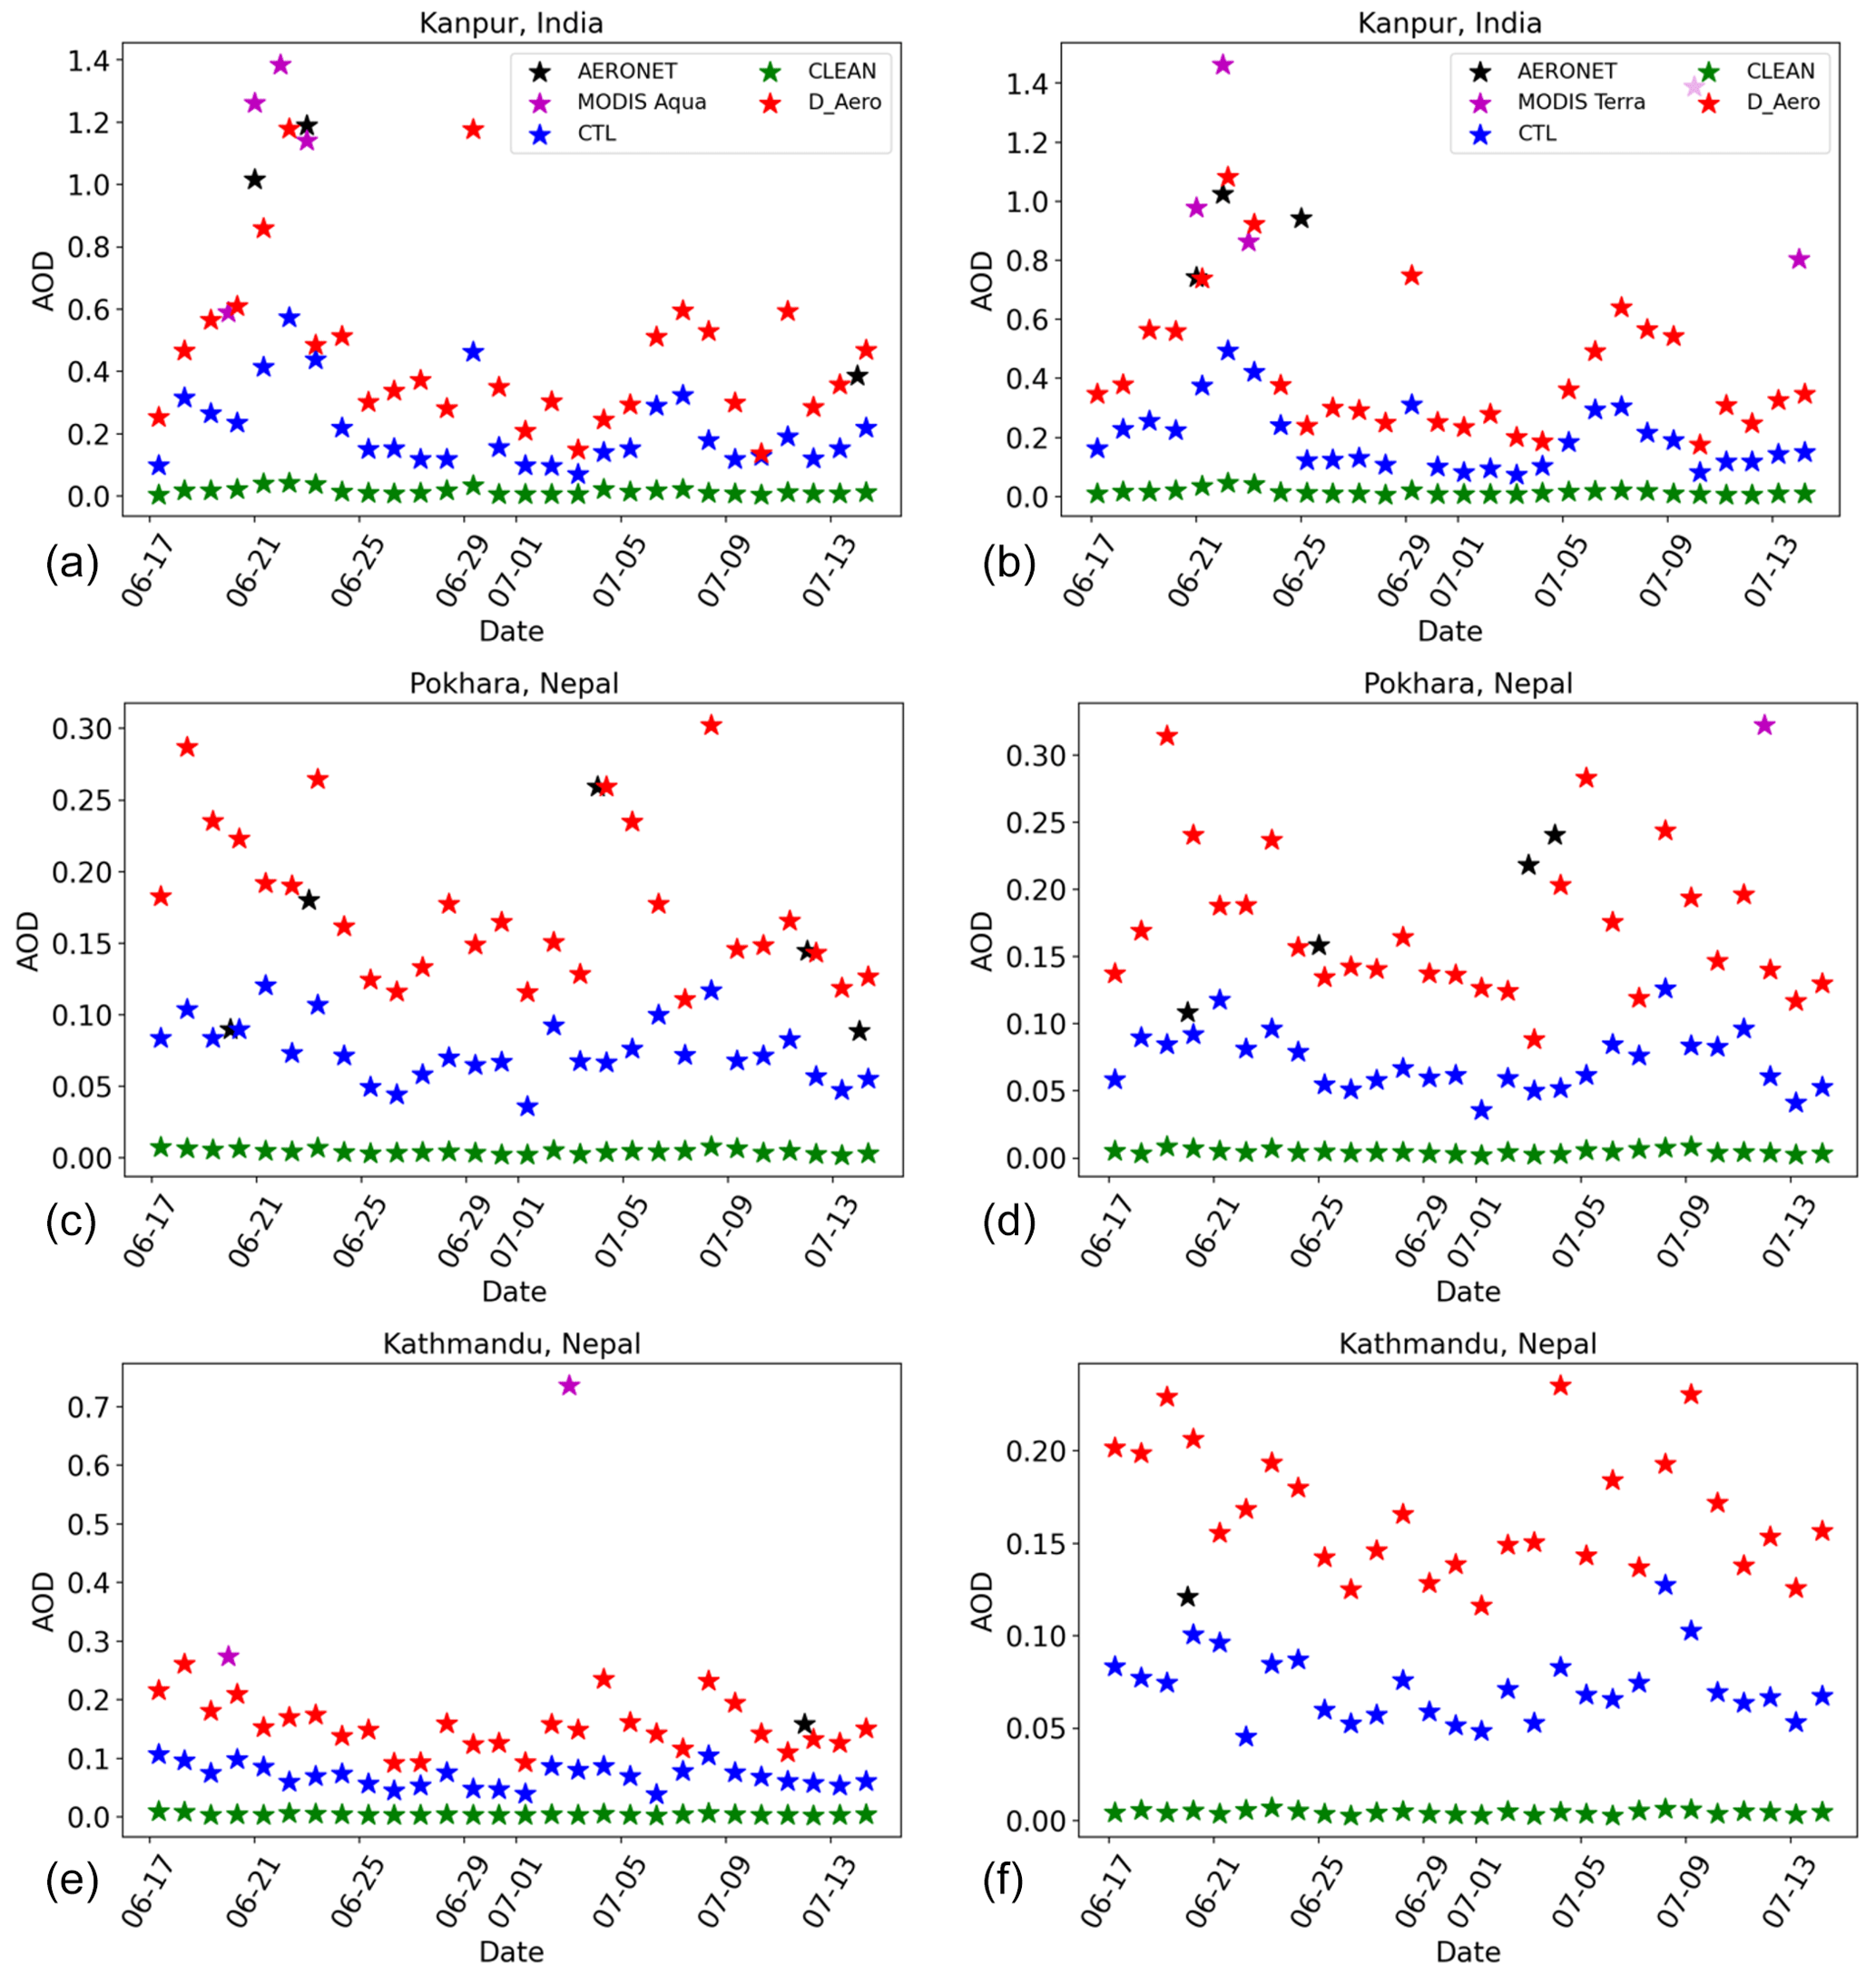
Figure 3The simulated AERONET and MODIS Aqua (a, c, e) and Terra (b, d, f) AOD at three AERONET stations (Kanpur, Pokhara, and Kathmandu; see Fig. 1a for location).

Figure 4(a) Spatial distribution of mean MODIS (Aqua and Terra averaged), (b) MERRA2, (c) CTL, (d) D_AERO, and (e) the mean differences of AOD between CTL and CLEAN simulations. The black contour represents the terrain elevation of 2000 m a.s.l. The missing data in the MODIS product is due to cloud contamination during the retrieval process of aerosol properties.
Underestimation of AOD by WRF-Chem is a well-known model bias and has also been reported in the East Asian monsoon region (Wu et al., 2013), Indian monsoon region (Soni et al., 2018; Govardhan et al., 2015), and Indo-Gangetic Plain during monsoon by around 50 % (Sarangi et al., 2015). Also, regional climate model (RegCM4) underestimated AODs by a factor of 2 to 5 over South Asia in the period 2005 to 2007 (Nair et al., 2012). Mues et al. (2018) showed that the EDGAR HTAP v2.2 implemented with WRF-Chem underestimates the black carbon concentration over the Kathmandu valley by 80 % in May of 2013, and one of the reasons might be the underrepresentation of mobile emissions. The lower estimation of the aerosol emission over Nepal by the global emission inventory is mainly due to the coarser resolution, emission factors, and lack of residential energy consumption consideration (Sadavarte et al., 2019). Other limitations that might contribute to the lower estimation of aerosol loading might be due to the different year used for emission inventory preparation (for 2010) and simulation in this study, the lack of representation of secondary organic aerosols, and not accounting for all major sources of emissions (e.g., emission due to infrastructure construction). Despite these well-known structural errors that have been attributed to emissions inventory and potentially result in low biases in the impact of aerosols, our results can provide meaningful insight into the role of aerosols in modulating the elevation dependence precipitation.
The mean temperature, mixing ratio, and zonal and meridional wind bias profiles from the simulated output sampled from the upper-air-sounding observations at the Patna location are shown in Fig. S2. The model exhibits the vertical easterly systematic bias between 950 and 300 hPa. Above 900 hPa, a dry bias (significant above 575 hPa) and northerly biases are present. The cool bias prevails below 775 hPa, while the warm bias is present in the middle to upper troposphere. Though both the domains revealed a similar bias pattern, the cloud-resolving domain exhibited smaller biases.
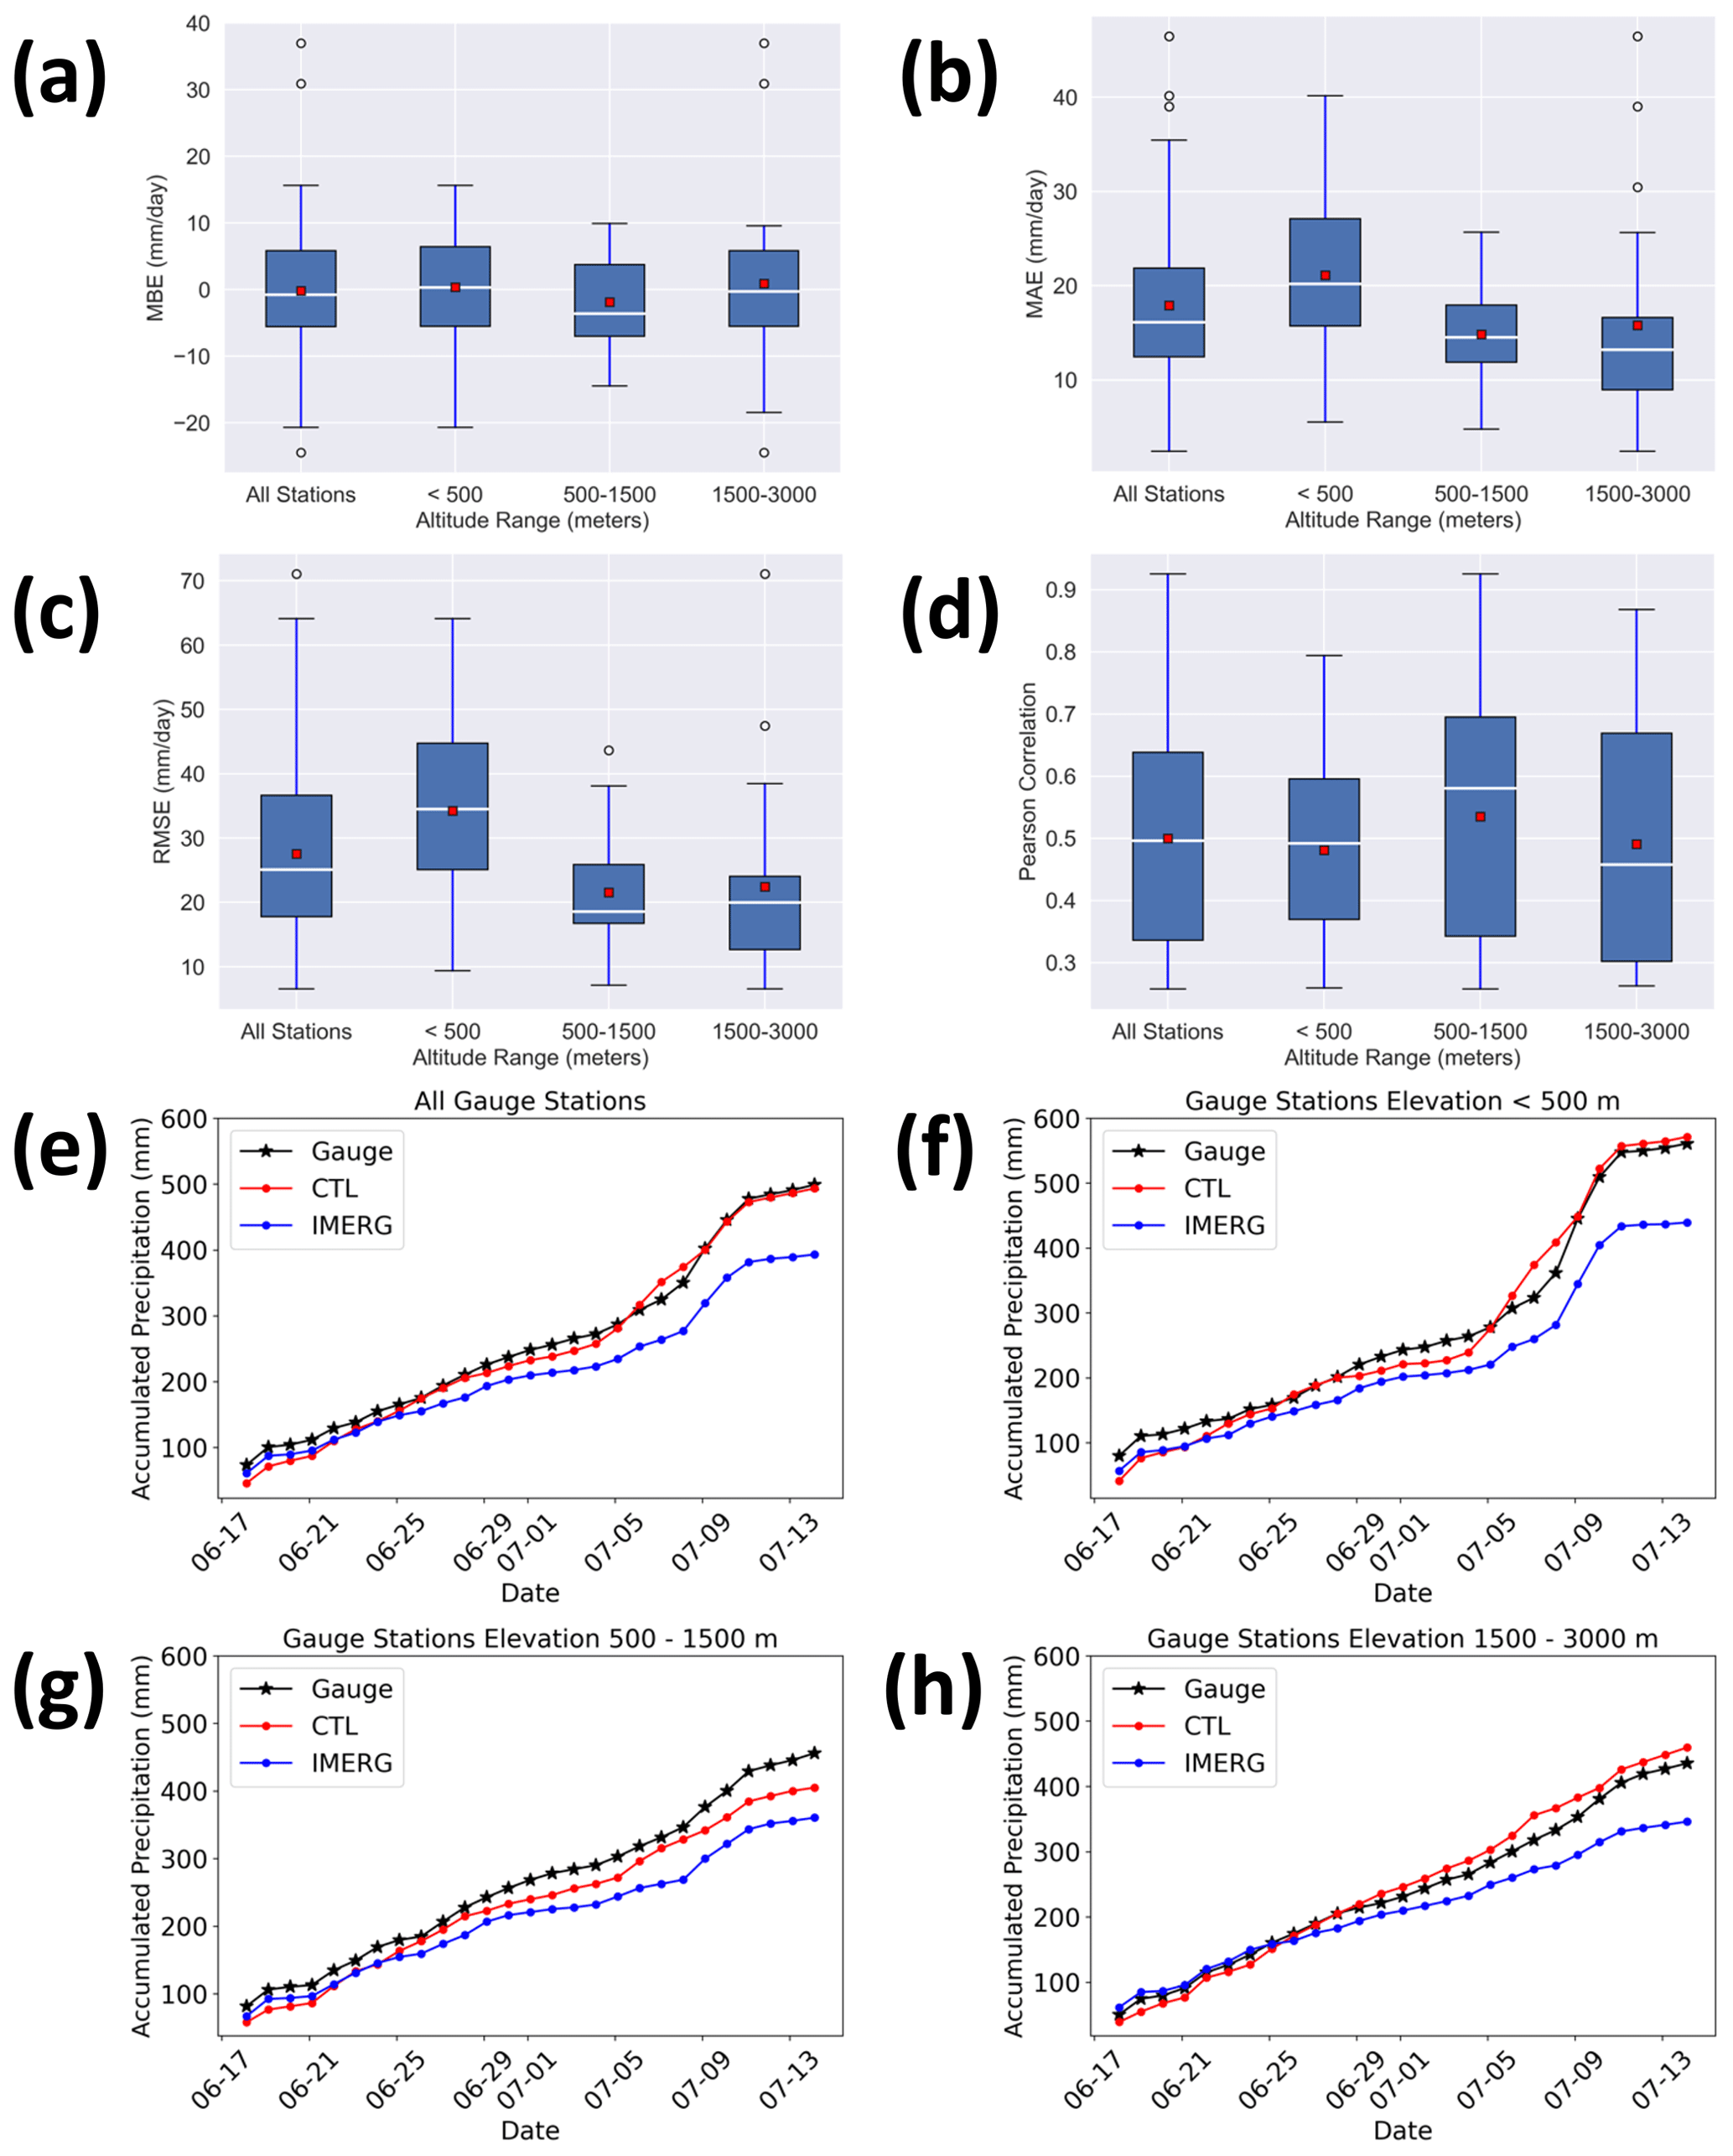
Figure 5Box plots show the median, interquartile range, and extreme distribution for each of the error statistics – (a) MBE, (b) MAE, (c) RMSE, and (d) Pearson correlation – between the simulated and the rain gauge stations over Nepal, at an altitude that ranges below 500 m (41 stations), between 500 and 1500 m (28 stations), and between 1500 and 3000 m (21 stations). The red color marker at the center of the box represents the mean value. Time series of averaged accumulated precipitation at DHM rain gauge stations, CTL, and IMERG; (e) all rain gauge stations; stations located (f) below 500 m a.s.l., (g) between 500 and 1500 m, and (h) between 1500 and 3000 m terrain elevation.
Figure 5a–d show the error statistics of daily precipitation at different gauge stations and simulated precipitation at the nearest grid point over Nepal. The biases in the simulated precipitation varied with elevation, where low-land areas (< 500 m a.s.l.) depicted the larger bias, while the altitude between 500 and 1500 m exhibited the smallest bias. The mean bias estimation (MBE) across the rain gauge stations was lower by 0.29 mm d−1 with a mean root mean square error (RMSE) of 27.52 mm d−1. The daily mean accumulated precipitation from the model correlated well (correlation coefficient of 0.5) with the gauge station data. The maximum mean correlation was observed for the elevation between 500 and 1500 m, the range of altitude that also depicted the minimum RMSE and MAE. Though there is some overestimation or underestimation of the precipitation and higher RMSE, there is a good agreement on the onset and accumulated precipitation between the simulation and rain gauge stations (Fig. 5e–h). Also, as suggested earlier, the lower concentration of aerosols can add up to the biases in the simulated precipitation. The manual recording of the gauge station data and the undercatch or losses due to wind speed/direction can add up to the uncertainties in the precipitation data collection (Talchabhadel et al., 2017) and these model evaluation assessments. Also, since most rain gauge stations are over the valley floor, the precipitation simulated over the mountaintop cannot be compared with the observational network.
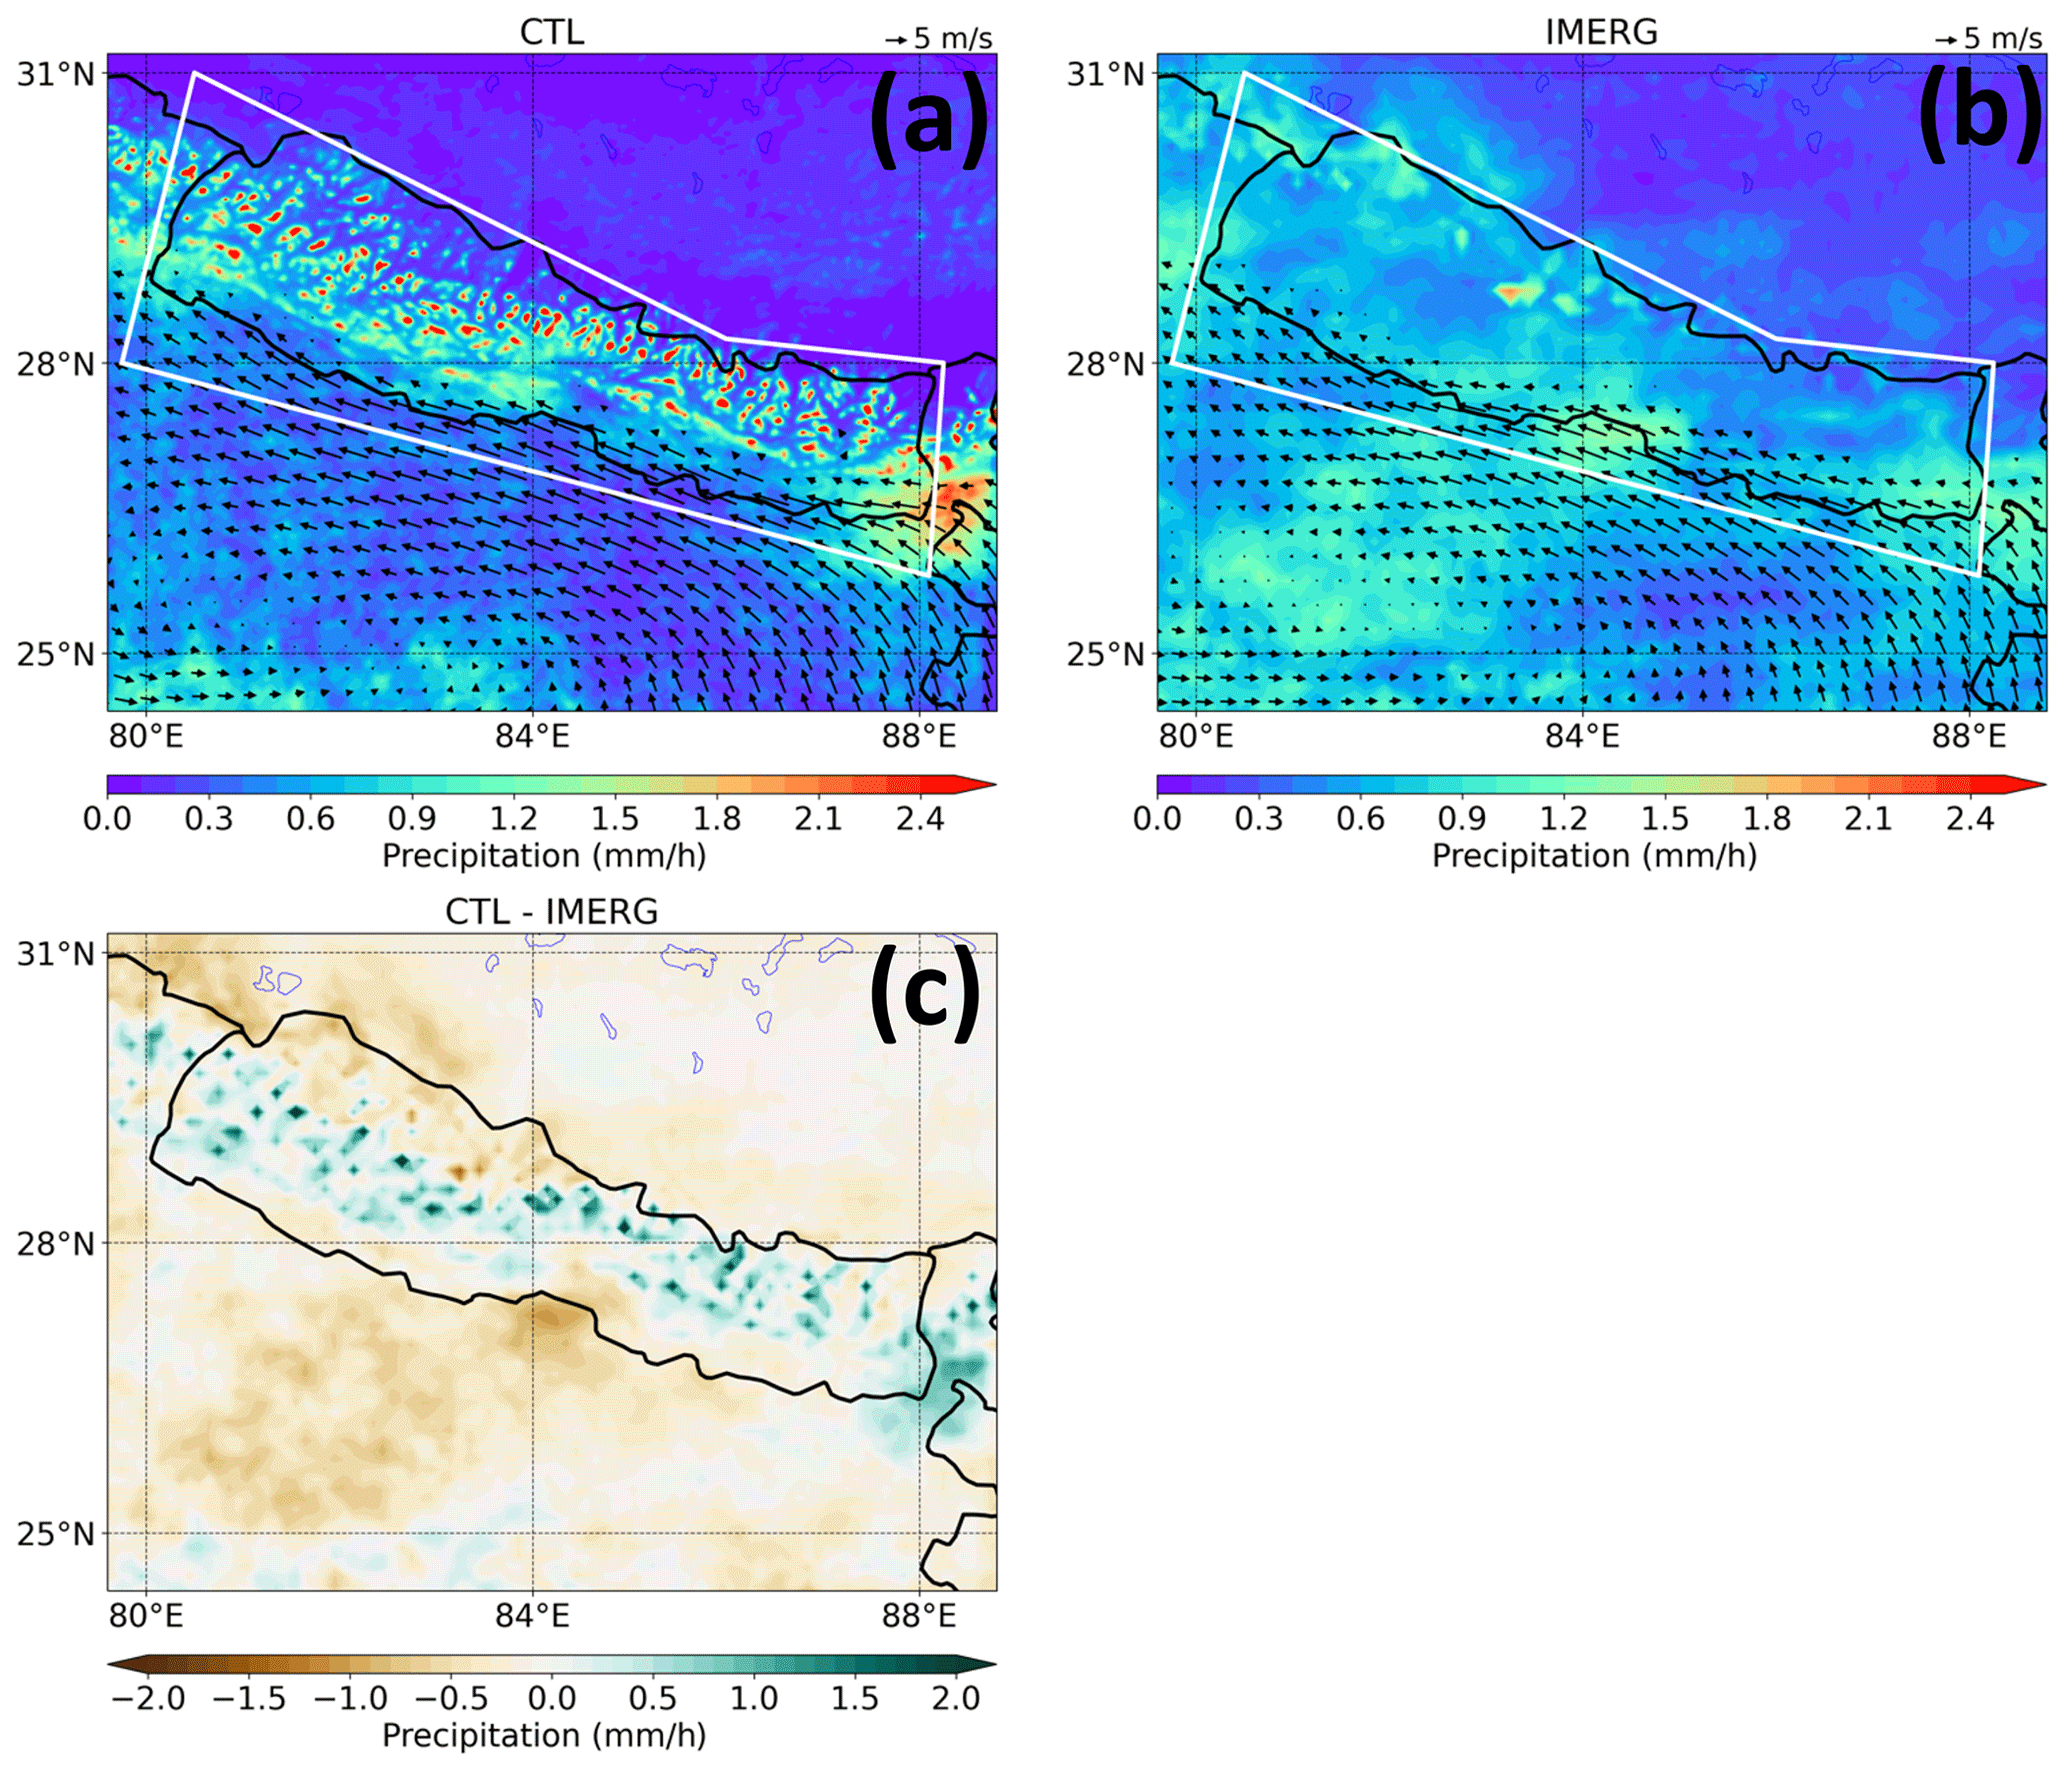
Figure 6Hourly mean precipitation from (a) CTL (3 km) with 925 hPa wind vectors and (b) IMERG (0.1∘; ∼ 10 km) with 925 hPa wind from ERA5 (∼ 25 km). (c) Mean hourly bias of CTL relative to IMERG. The white-colored polygon represents the CenHim. The 3 km CTL precipitation is re-gridded to 10 km resolution to match up with the IMERG spatial resolution using the bilinear interpolation method.
Figure 6 shows the mean hourly precipitation estimates from IMERG, CTL, and the bias of CTL relative to the IMERG estimation. Compared to IMERG, the model underestimated the precipitation amount over the IGP, while the wet bias of the model is pronounced over the mountains of the CenHim. In general, though some biases in precipitation exist, the model showed the overall feature of the precipitation distribution with lower rainfall over the lowlands, maximum mountainous precipitation associated with orographic forcing, and reduced leeward precipitation over northwestern Nepal and the TP. The point precipitation pattern over the peaks of the mountain might be due to the strong orographic lifting associated with the convective cells. The overestimation of the precipitation by the WRF-Chem has also been reported in other studies over the Himalayan region (e.g., Barman and Gokhale, 2022; Sicard et al., 2021; Adhikari and Mejia, 2022) and can be associated with the uncertainties from the physical parameterizations (e.g., Baró et al., 2015; Zhang et al., 2021). However, note that the finer-resolution simulation better resolves the orographic forcing and can represent the precipitation over the complex terrain. Also, IMERG is at a coarser resolution than the model, and some biases might be related to the scale differences. The underprediction of accumulated precipitation by IMERG is evident over the rain gauge stations throughout the CenHim (Fig. 5e–h) and is consistent with Sharma et al. (2020a). The pronounced differences over the higher terrains of CenHim can also be associated with the underprediction of extreme precipitation events (> 25 mm d−1) by IMERG (Sharma et al., 2020b), which might be related to the weak detection of the shallow orographic forced precipitation event (Cao et al., 2018; Arulraj and Barros, 2019; Shige and Kummerow, 2016).
3.2 Aerosol effect on precipitation
Figure 7a–c show the effect of aerosol on the spatial distribution of the mean hourly precipitation. Due to the total effect of aerosols, precipitation increases over the elevation below 2000 m a.s.l. except for the region just south of Nepal, with a pronounced enhancement by the ACI effect. At the same time, the reduced precipitation occurred over the high-elevation region of the entire CenHim due to the total effect of aerosol. Figure 8a shows the diurnal variation of precipitation as a function of terrain elevation. Minimum precipitation occurred throughout the elevations during the late morning (09:00 to 12:00 local time, LT). The mid-altitude range, especially between 1000 and 2000 m a.s.l., of CenHim experiences double peaks with stronger daytime and weaker nighttime precipitation (Fig. 8a). The averaging of the entire CenHim might influence the diurnal features of intraregional precipitation; however, the diurnal pattern is consistent with the satellite-based findings of Fujinami et al. (2021). The surface heating and the orographic forcing enhance the convergence of daytime upslope moisture flow resulting in higher daytime precipitation over the southern slopes (Fujinami et al., 2021). In contrast, the adjacent foothills (below 600 m a.s.l.) are characterized by single midnight to early morning peak due to the convergence of stronger nocturnal jets with the downslope winds (Fujinami et al., 2021; Terao et al., 2006). Precipitation over the higher elevation above 5000 m a.s.l. and in the TP (not shown) is characterized by the afternoon peak and is consistent with Liu et al. (2022).

Figure 7Spatial distribution of the differences in hourly mean precipitation due to the (a) total aerosol effect (CTL–CLEAN), (b) ARI effect (CTL–NoARI), and (c) ACI effect (NoARI–CLEAN). The blue-colored polygon represents the CenHim, whereas the pink-colored contour indicates the 2000 m a.s.l. terrain elevation.

Figure 8Elevation-dependent precipitation for (a) CTL, (b) aerosol effect (CTL–CLEAN), (c) ARI effect (CTL–NoARI), and (d) ACI effect (NoARI–CLEAN) and their diurnal variability. Only the differences that are significant at the 90 % confidence level based on the Student t test are plotted.
The diurnal variation of precipitation due to the aerosol effect as a function of elevation is presented in Fig. 8b–d and shows an inconsistent response to the anthropogenic aerosols along the elevational gradient. Significant enhancement of precipitation occurred due to aerosols over the lower elevation (below 2000 m a.s.l.) from the early morning to noon. In contrast, the aerosol suppressed afternoon (14:00 to 18:00 LT) precipitation over the lower elevation. The significant suppression of precipitation is observed over the higher terrain above 3000 m a.s.l. during most of the day. Both the ARI effect and ACI effect of aerosols tend to reduce the precipitation over the higher elevation above 3000 m a.s.l. The afternoon suppression of precipitation over the lowlands (below 2000 m a.s.l.) is dominated by the ARI effect (Fig. 8c). It is noteworthy that, though the ACI effect of aerosols suppressed the nighttime (after 18:00 LST) precipitation below 1000 m a.s.l., it extended the enhancement of precipitation to the higher elevation up to 3600 m a.s.l. (Fig. 8d). This can be attributed to the microphysical effect of aerosols delaying the conversion of smaller cloud droplets to raindrops and enhancing the cloud lifetime, resulting in larger advection time for orographic clouds, increasing the downwind precipitation (Givati and Rosenfeld, 2004; Choudhury et al., 2019).
Variability in the amount of hourly precipitation increases from lower to higher altitudes (Fig. 2b), possibly due to the orographic feature associated with the abrupt change in the topographical gradient. To further investigate the response of elevation-dependent precipitation to the aerosols, we classified the mean precipitation intensity into heavy (> 1.04 mm h−1), moderate (between 0.42 and 1.04 mm h−1), and light (< 0.42 mm h−1) precipitation regime. A similar classification procedure has also been implemented by Sharma et al. (2020b) for daily accumulated precipitation over the Nepal Himalayas and for hourly precipitation over eastern China by Shao et al. (2022). Figures 9 and 10 show the differences and relative change (%) in elevation dependence of the precipitation regime in precipitation due to different effects of aerosols and reveal a contrasting elevational response. Though the ACI effect slightly enhances the light precipitation below 1000 m a.s.l., the ARI effect dominates and monotonically suppresses the mean light precipitation by 17 % over the CenHim, whereas the ACI effect enhances the precipitation below 3000 m a.s.l. and shows a most prominent impact on moderate to heavy precipitation regimes. In contrast to the lower elevation, above 3000 m a.s.l., the ACI effect of aerosols suppressed all regimes of the precipitation intensity. The elevation between 1000 and 3000 m a.s.l. acts as the region below and above which the different intensity of precipitation responds in the opposite direction to the effect of aerosols. The maximum increment (43 %) in heavy precipitation due to the aerosol effect occurred over the elevation bin between 200–400 m a.s.l. (Fig. 10). Similarly, the total precipitation was enhanced by 18 % over the 200–400 m bin, while 5400–5600 m elevation experienced the maximum reduction (21 %). Below 2000 m a.s.l., due to the total effect of aerosols, the mean light precipitation is suppressed by 19 %, while moderate and heavy precipitation is enhanced by 3 % and 12 %, respectively. In contrast, above 2000 m a.s.l., a significant suppression of all three categories of precipitation intensity is noticed with the 11 % reduction in mean precipitation.
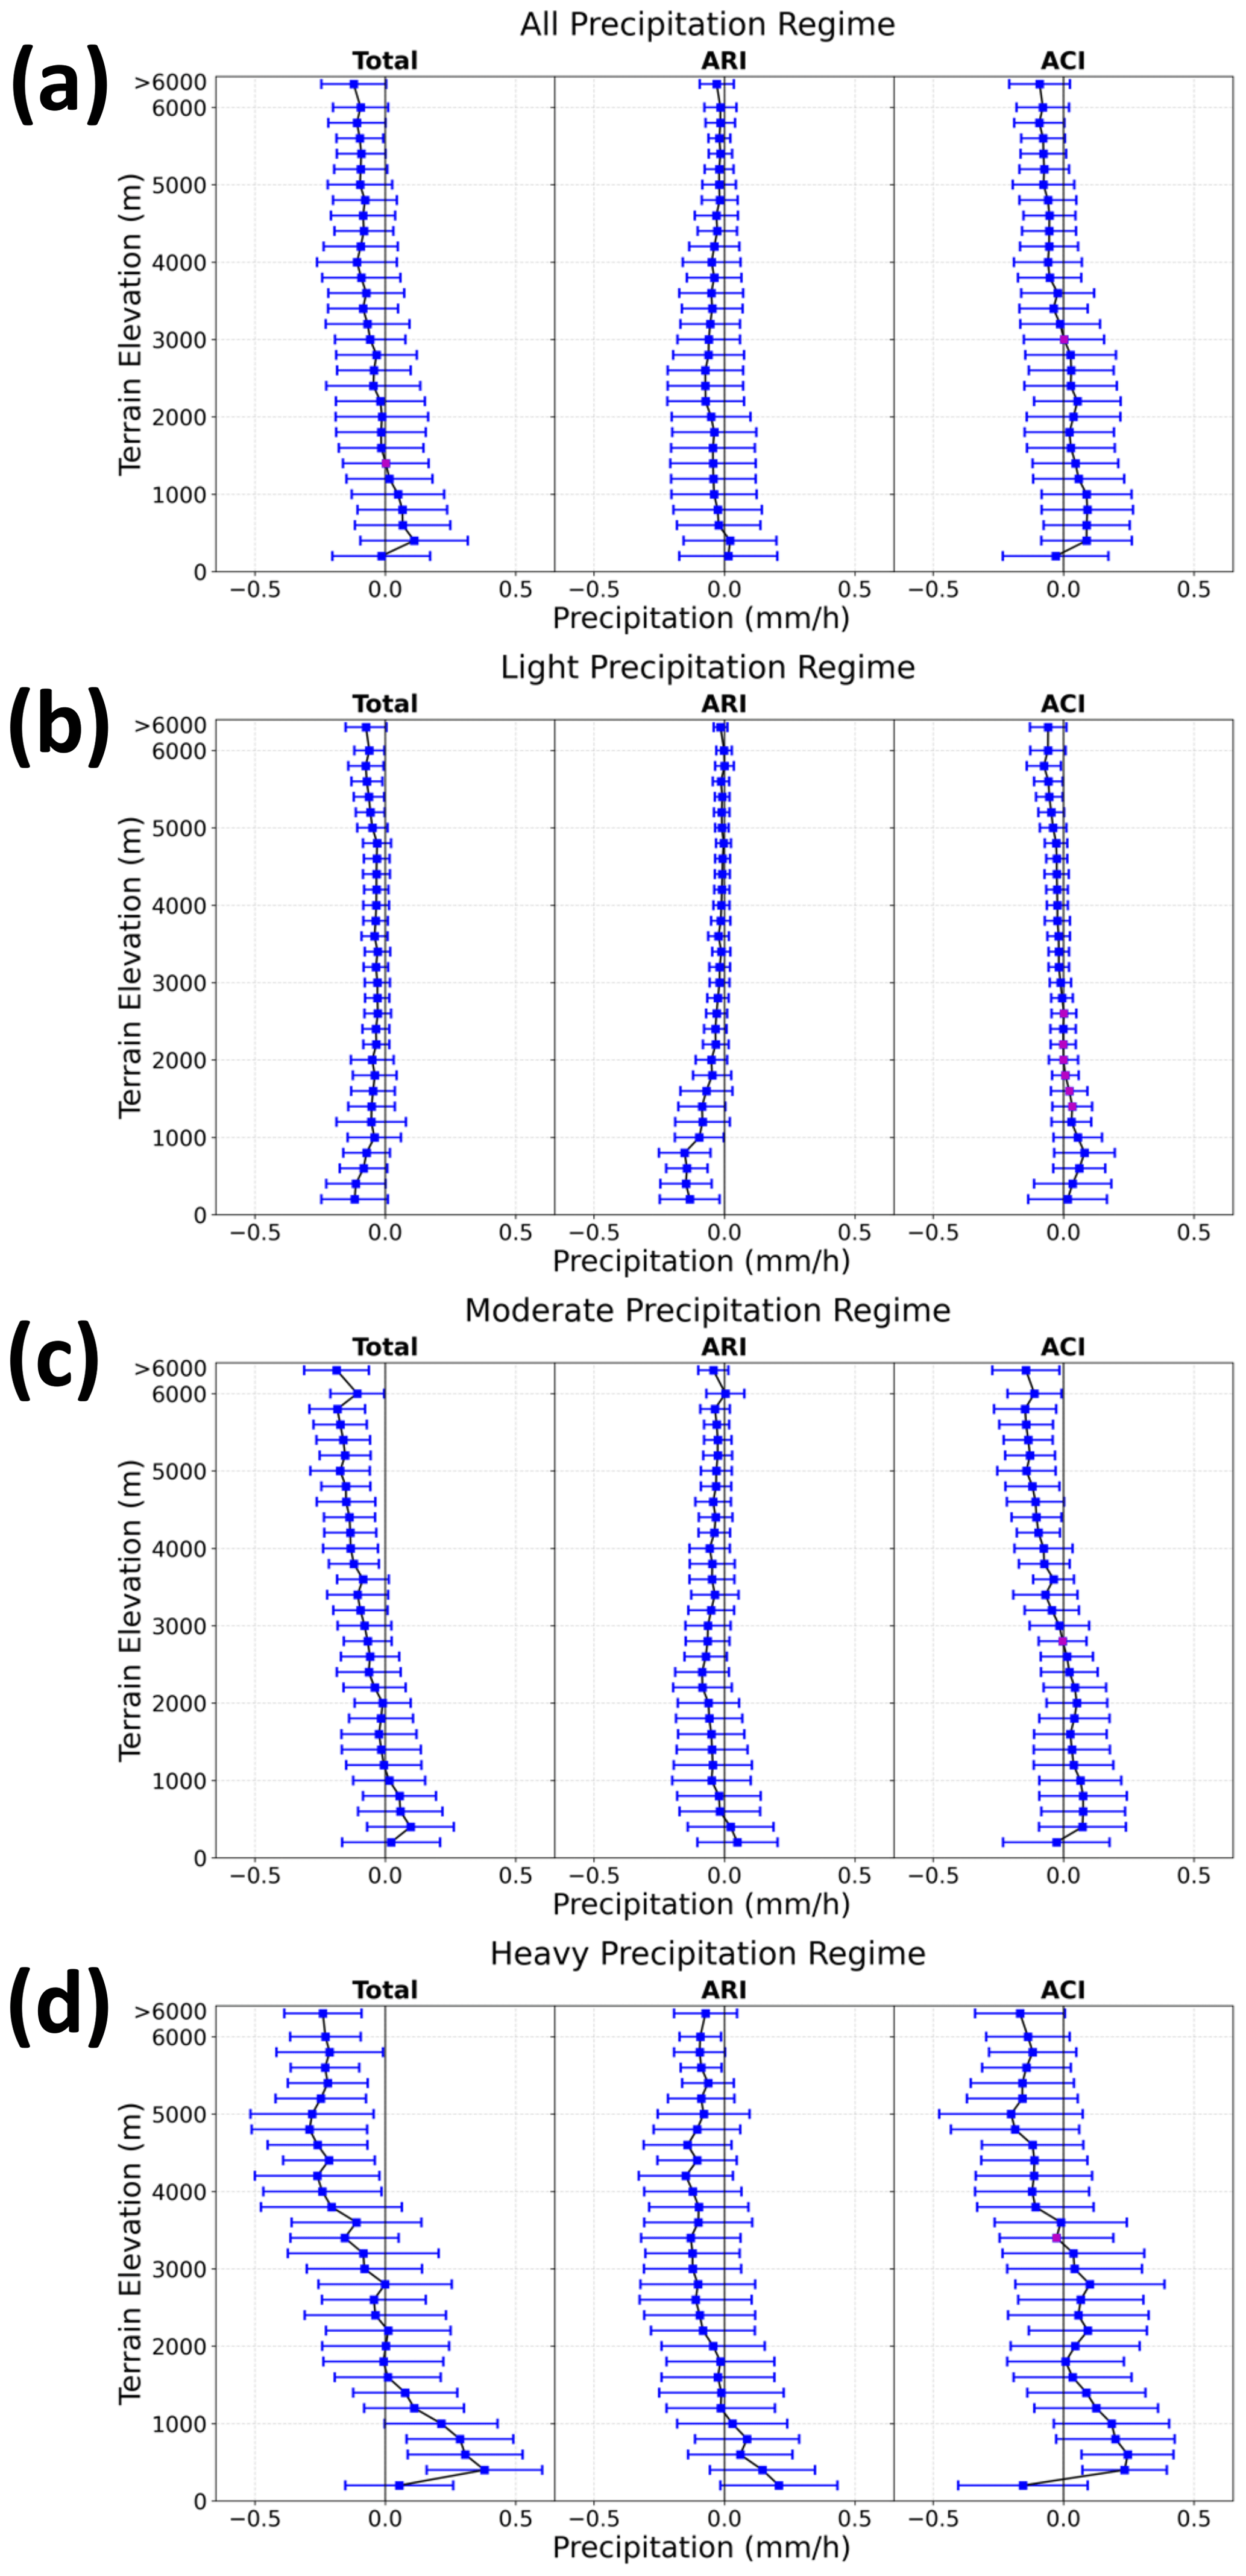
Figure 9Elevational variability in different regime – (a) all, (b) light, (c) moderate, and (d) heavy – precipitation differences due to aerosols. The blue dots and error bars represent the mean and ±1 standard deviation. The pink dot indicates that the differences between the two simulations are not significant at the 90 % confidence interval based on the Student t test.
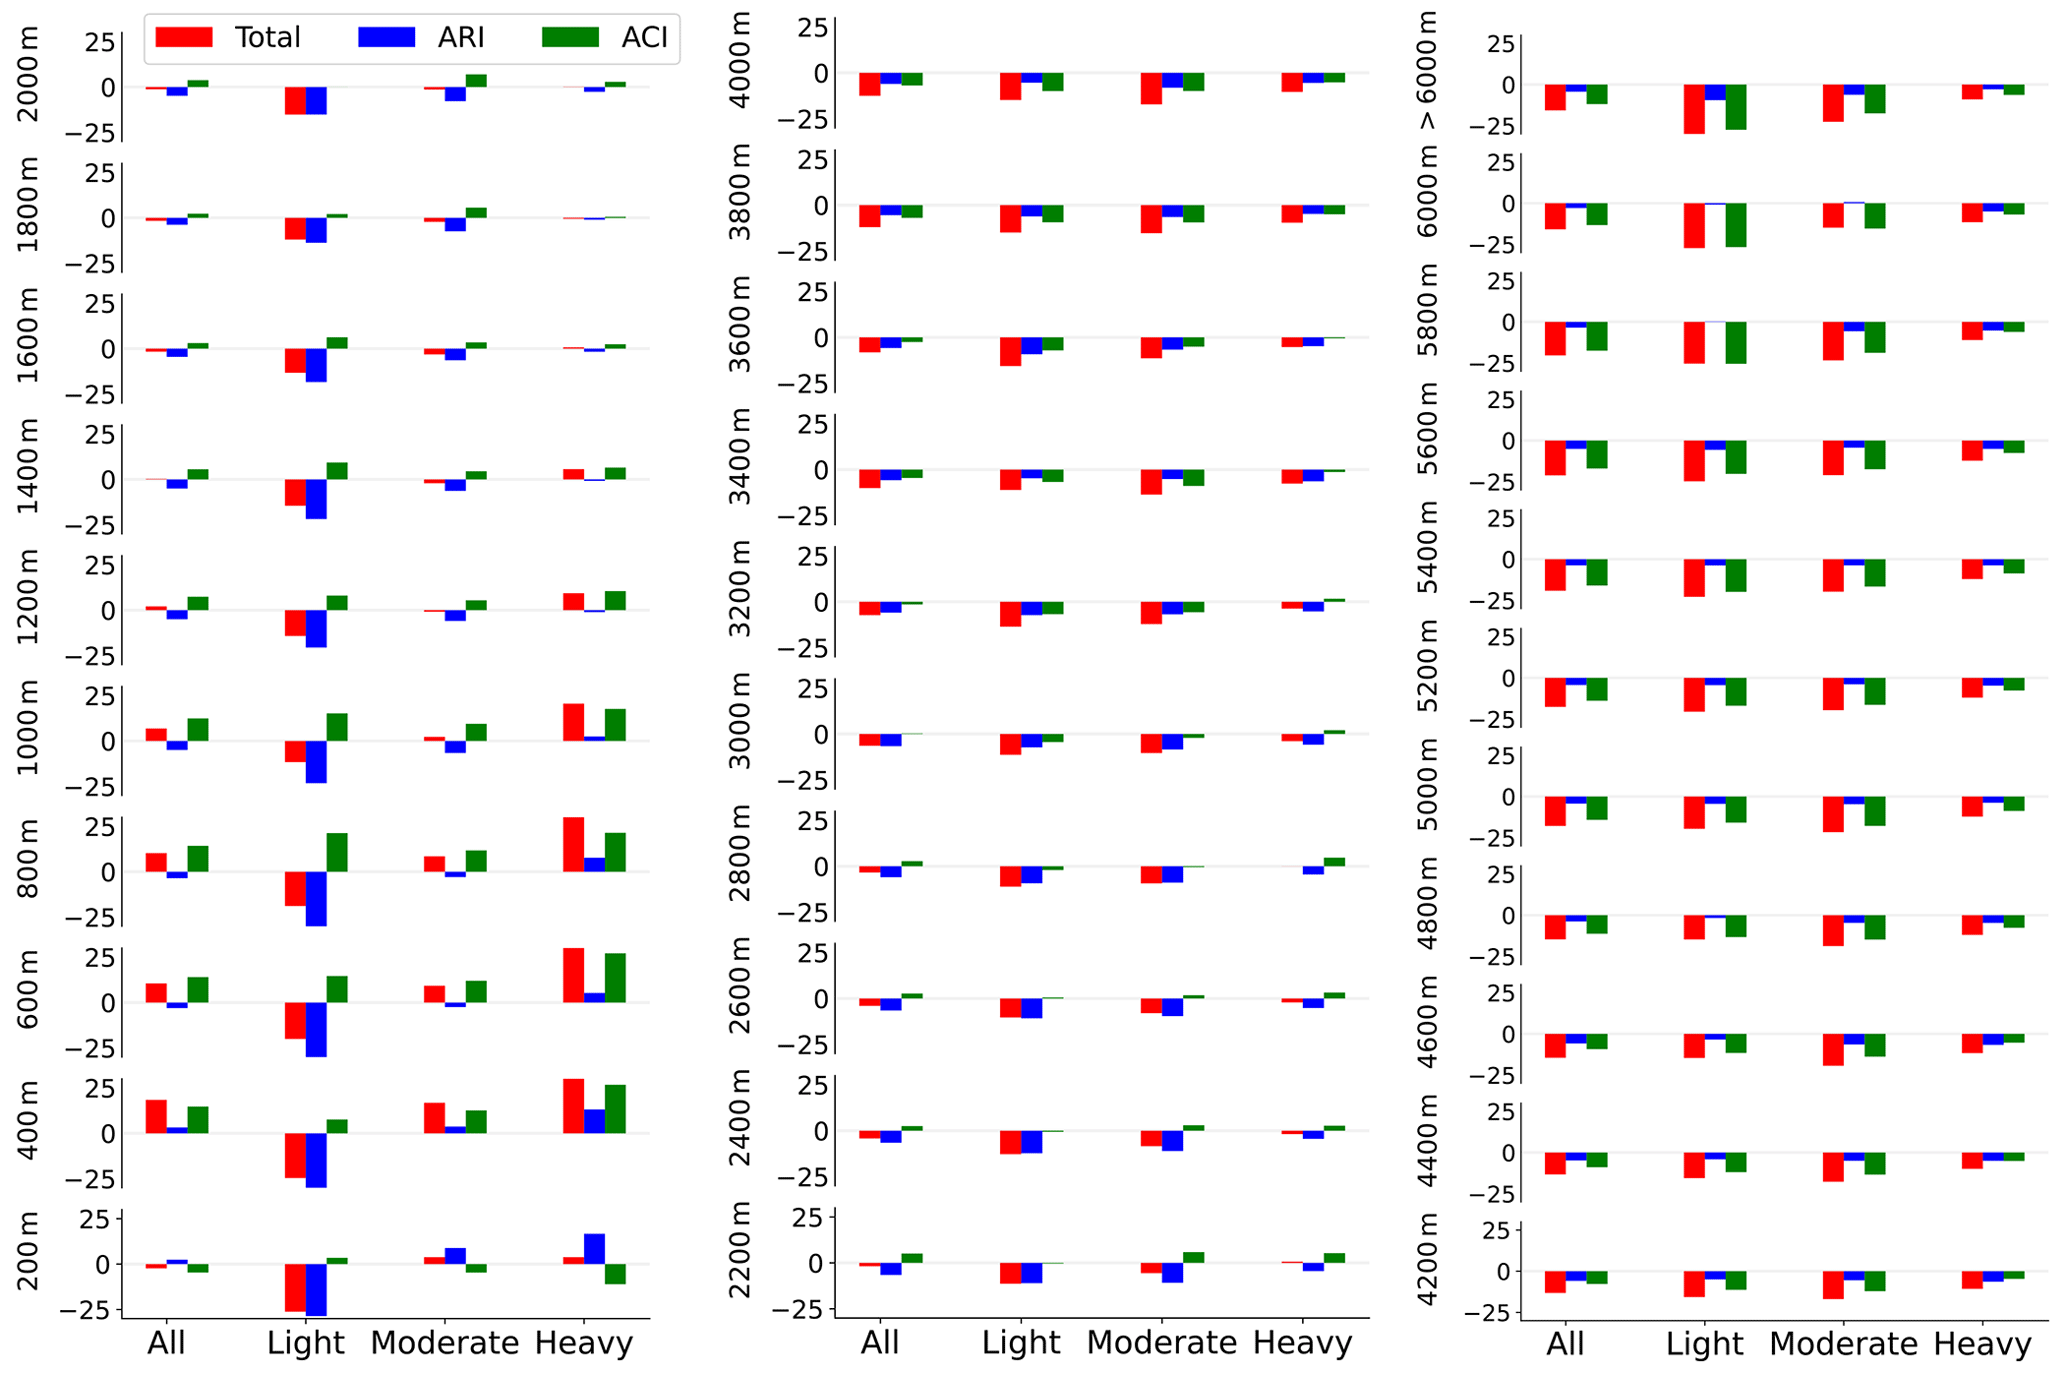
Figure 10Relative change (%) in precipitation due to different effects of aerosols for all the elevational bins.
Likewise, in our results, Wu et al. (2018) showed that ACI suppressed the mountaintop (> 2500 m a.s.l.) precipitation by 11 % over the Sierra Nevada. Similarly, Napoli et al. (2022) also showed that the indirect effect of aerosol resulted in suppressed summer precipitation in a polluted environment by 20 % above 2000 m a.s.l. of Great Alpine Region. In contrast to the enhanced precipitation in our result, these studies simulated the suppressed precipitation even in the lower elevations of these mid-latitude mountainous region. This discrepancy might be associated with the differences in the aerosol concentration from the heavily polluted upwind region of IGP, enhanced moisture supply along with the monsoonal flow, and the steeper terrain of the Himalayas enhancing the orographic forcing and convection compared to the Great Alpine and the Sierra Nevada.
In comparison to the CLEAN scenario, the elevation-dependent precipitation showed a similar response in the diurnal cycle and spatial pattern to the increase in aerosols from CTL to D_AERO, besides the smaller changes in the magnitude (not shown). The doubling in aerosols resulted in increased monthly mean heavy precipitation below 2000 m a.s.l. by 16 % (4 % higher compared to CTL run) and suppressed precipitation above the 2000 m a.s.l. by 8 % (similar to CTL run) compared to the CLEAN simulation. No significant differences were noted in the change in light precipitation due to the doubling of aerosols. It might be related to the non-linear responses of aerosol concentration to the convective intensity, microphysical, and dynamical effect (Fan et al., 2013; Chang et al., 2015). Due to the stronger convection in the heavy precipitation regime, the potentiality of the aerosol getting activated to cloud droplets increases in the presence of a higher aerosol concentration.
3.3 Aerosol effect on clouds
Figure 11a shows the CTL-simulated diurnal elevation of cloud fraction over the CenHim and resembles the diurnal precipitation pattern. The higher elevation above 4000 m has lower cloud coverage throughout the day due to the limited atmospheric moisture reaching the higher elevation. The ACI effect increases the cloud fraction over most of the elevation throughout the day due to the enhanced activation of aerosol as cloud droplets (Fig. 11d). However, the ARI effect reduces the cloud coverage early in the morning below 2000 m a.s.l., and the suppression propagates higher in elevation during the afternoon and evening (Fig. 11c), which might be associated with the weaker surface heating limiting the wind flows towards the slope of the mountain and afternoon orographic cloud development. Although there is a noisier and a less consistent diurnal-elevation relationship, the total aerosol effect is mostly that of enhancement of cloud cover. This result is consistent with long-term satellite retrieval of cloudiness during high aerosol concentration days (Adhikari and Mejia, 2021).
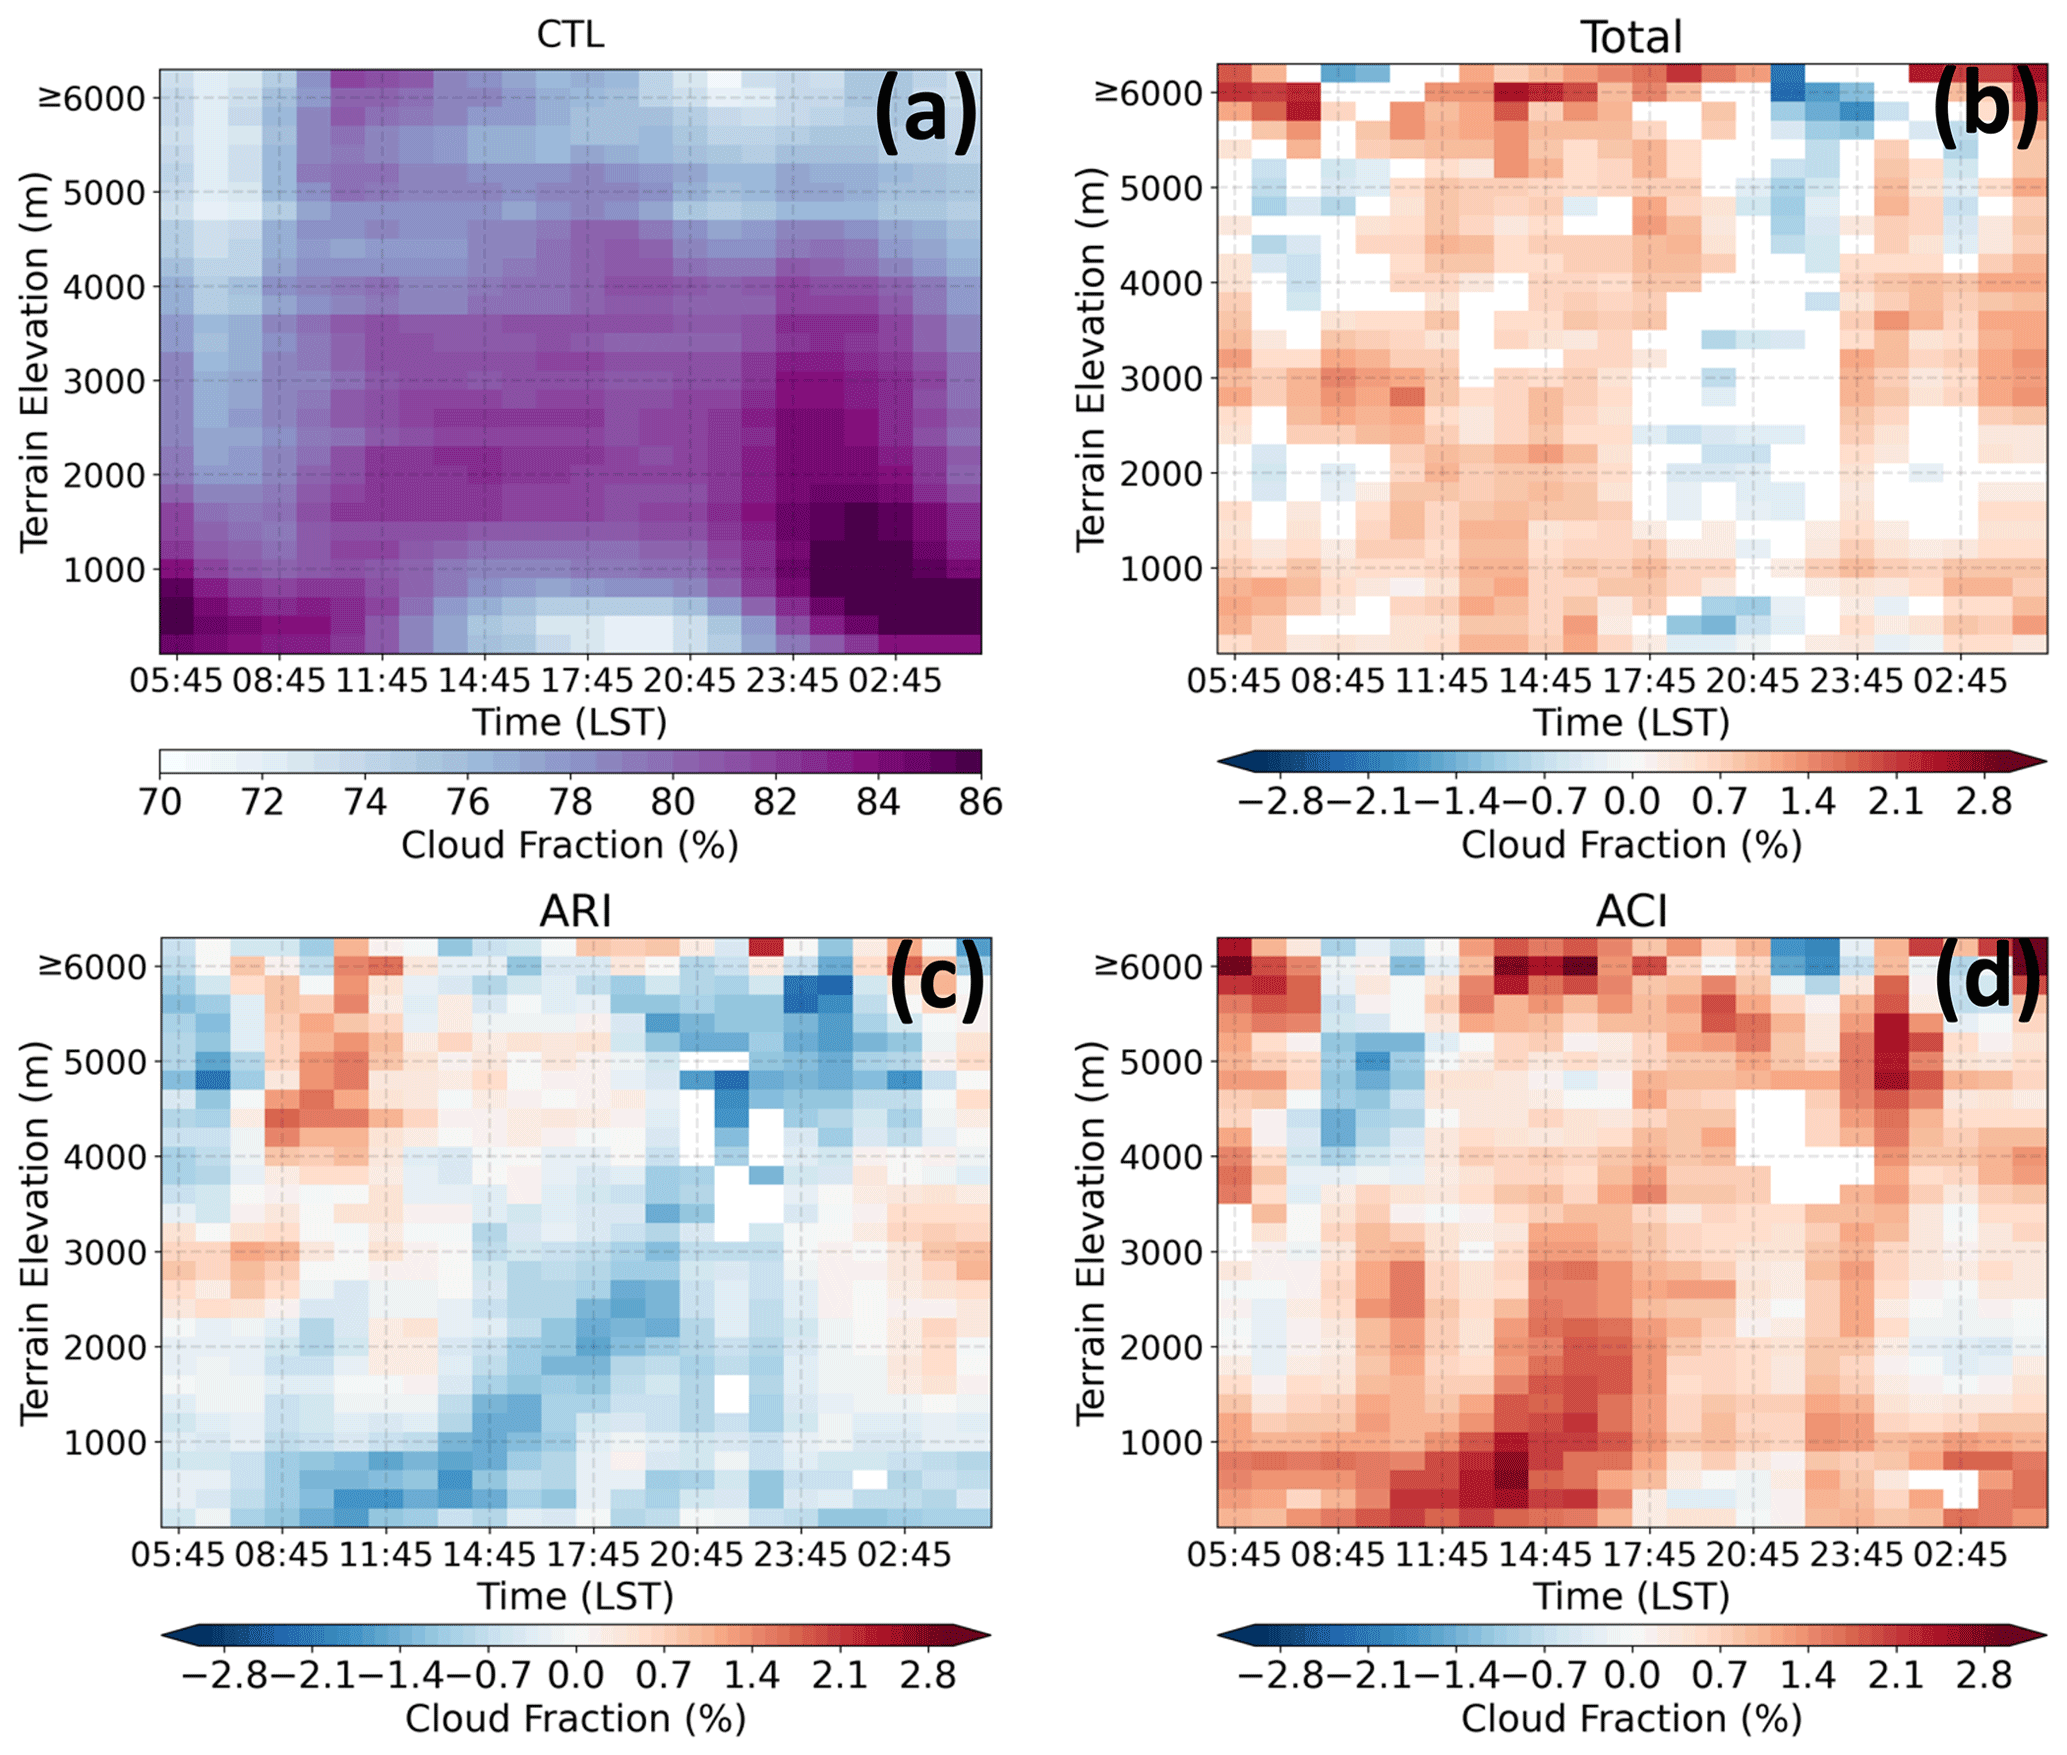
Figure 11Elevation-dependent cloud fraction for (a) CTL, (b) aerosol effect (CTL–CLEAN), (c) ARI effect (CTL–NoARI), and (d) ACI effect (NoARI–CLEAN) and their diurnal variability. Only the differences that are significant at the 90 % confidence level based on the Student t test are plotted.
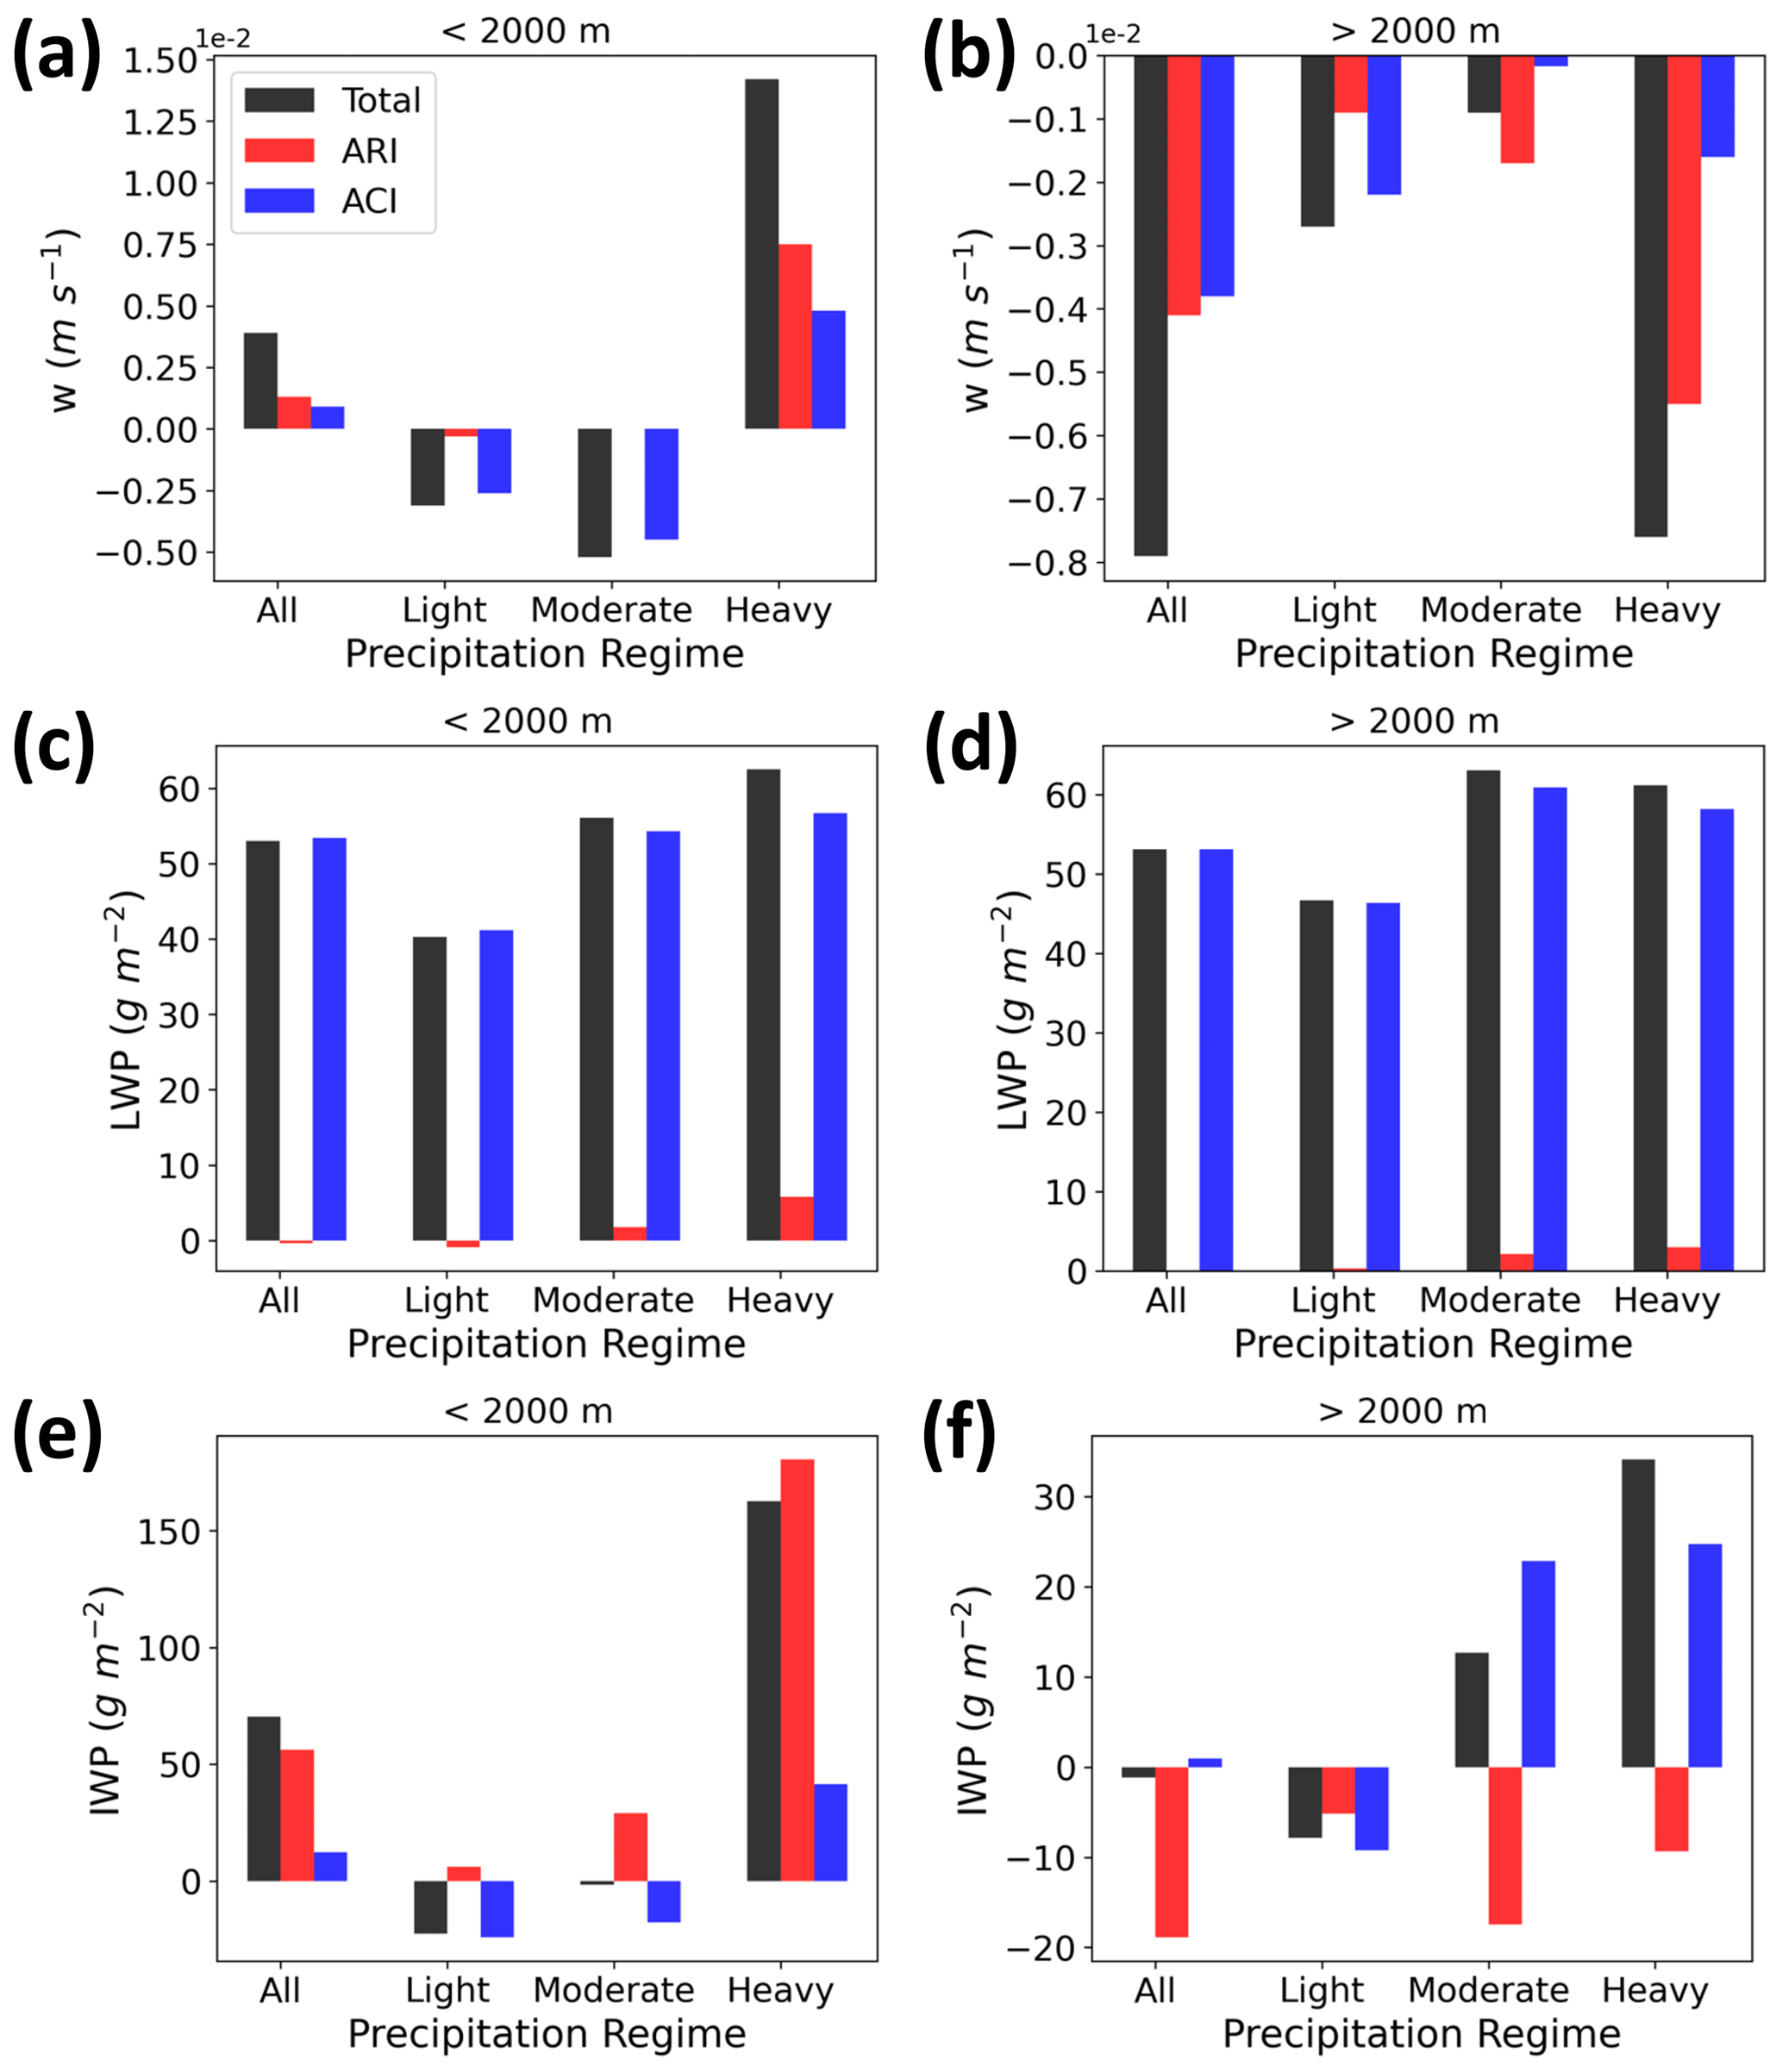
Figure 12Mean perturbation of (a, b) vertical velocity, (c, d) LWP, and (e, f) IWP over the CenHim region for the terrain elevation below (a, c, e) and above (b, d, f) surface elevation of 2000 m a.s.l., for total, light, moderate, and heavy precipitation regime.
To further investigate the impact of anthropogenic aerosols on clouds and precipitation, the effect of aerosols on vertical velocity, LWP (liquid water path), and IWP (ice water path) is performed by dividing the terrain elevation below and above 2000 m a.s.l. (Fig. 12), where the mean precipitation responded differently to the aerosols. Increased cloud coverage over the CenHim due to the aerosol effect is associated with the ACI effect, resulting in enhanced cloud liquid water path (LWP) for all precipitation regimes (Fig. 12c–d), while ARI significantly contributes to the increase in ice water path (IWP; by 10 %) below 2000 m a.s.l. (Fig. 12e) along with the slight but upward of 5 % increase in mean vertical velocity (Fig. 12a). The ARI-modulated increase in IWP below 2000 m a.s.l., where the amount of aerosol loading is higher, can be attributed to the warming of the atmosphere, resulting in the evaporation of droplets and contributing to an increased upward moisture flux to the higher altitudes, resulting in the formation of the ice. Other modeling studies have also reported an increment in the cloud ice water content due to the radiative heating effect of biomass burning (Liu et al., 2020) and dust aerosols (Dipu et al., 2013). In contrast, reduced IWP above 2000 m a.s.l. due to ARI might be dominated by the surface cooling effect suppressing the cloud development. The minimal ACI effect in IWP is due to the lack of a model treating the activation of aerosol to ice nuclei.
The aerosol-modulated vertical velocity below 2000 m a.s.l. (Fig. 12a) suggests the convective strength is suppressed/enhanced for the light/heavy precipitation regime. Additionally, due to the total aerosol effect, the number of strong updraft events (mean vertical velocity higher than 0.5 m s−1) increased by 10 % below 2000 m a.s.l. (except for the lowest elevational bin below 200 m a.s.l.) and reduced by 11 % above 2000 m a.s.l. (not shown). Along with the stronger convection, the enhanced IWP and LWP indicate the invigoration of the cloud, resulting in increased heavier precipitation below 2000 m a.s.l. In contrast, the suppressed convection and more aerosol activated as a higher number of smaller cloud droplets resulted in a nonprecipitating cloud suppressing the light precipitation over the entire CenHim. Figure S3 shows a clear difference in the vertically integrated cloud droplet number concentration between the simulations, with an increasing order from the CLEAN (lowest), CTL, and D_AERO (highest) simulations, in a similar order of aerosol concentration. Similarly, more aerosols are activated as cloud droplets over the lower-elevation belt (< 2000 m a.s.l.) compared to relatively cleaner higher mountainous regions (> 2000 m a.s.l.).
The suppression of light and enhanced heavy precipitation due to modulated convective strength by anthropogenic aerosol is consistent with a simulated study over eastern China by Shao et al. (2022). The increased precipitation over the foothills with an invigorated convection is consistent with our other study based on satellite retrieval over the southern slopes of the central Himalayas (Adhikari and Mejia, 2021). Regardless of the meteorological forcing, Adhikari and Mejia (2021) showed a positive association of the aerosol loadings with the colder and deeper clouds, resulting in enhanced precipitation. Also, another satellite-based study by Choudhury et al. (2020) suggests the higher aerosol loading with the increased moist static energy significantly contributed to the extreme precipitation events over the Himalayan foothills. Similar to our findings, a case study by Adhikari and Mejia (2022) also showed that long-range-transported natural mineral dust aerosols modulated the microphysical properties of clouds and enhanced the precipitation by 9.6 % over the mid-mountainous (500–3000 m a.s.l.) region of the Nepal Himalayas. However, our results indicate the contrasting response of precipitation at different elevational bands to the increased aerosols. Similarly, during the spring season, Barman and Gokhale (2022) showed that the atmospheric heating due to absorbing aerosol played a role in an increased influx of moisture with enhanced instability over the lower terrain, enhancing the rainfall while limiting the moisture over the higher terrain of northeastern India.
3.4 Aerosol effect on temperature and radiation
Figure 13a shows the diurnal variation of decreasing temperature with increasing variability from low to high elevations. The diurnal-elevation surface cooling effect due to anthropogenic aerosols during the daytime is stronger throughout the elevational ranges (Fig. 13b–d). The daytime surface temperature cooling of −1.3 ∘C is likely due to the total effect of aerosols over the terrain elevation above 4000 m a.s.l., with the ACI effect contributing to most of the cooling (−1.1 ∘C). The daytime variation of change in surface temperature is consistent with the all-sky downwelling shortwave radiation flux at the surface (hereafter SW; Fig. 14). Consistent with our results, over the Great Alpine Region of Europe, Napoli et al. (2022) reported high-elevation strong daytime surface cooling related to the enhancement of polluted orographic clouds with upslope winds blocking solar radiation. Another striking feature in Fig. 13 is the smaller but significant nighttime surface temperature warming (+0.03 ∘C) above 2000 m a.s.l., likely related to enhanced cloudiness (Fig. 11) favoring the trapping of the longwave radiation (Fig. S4). Our results indicate that the ACI effect of aerosols can significantly contribute to nighttime warming over the higher elevation and contribute to warming by 0.08 ∘C.
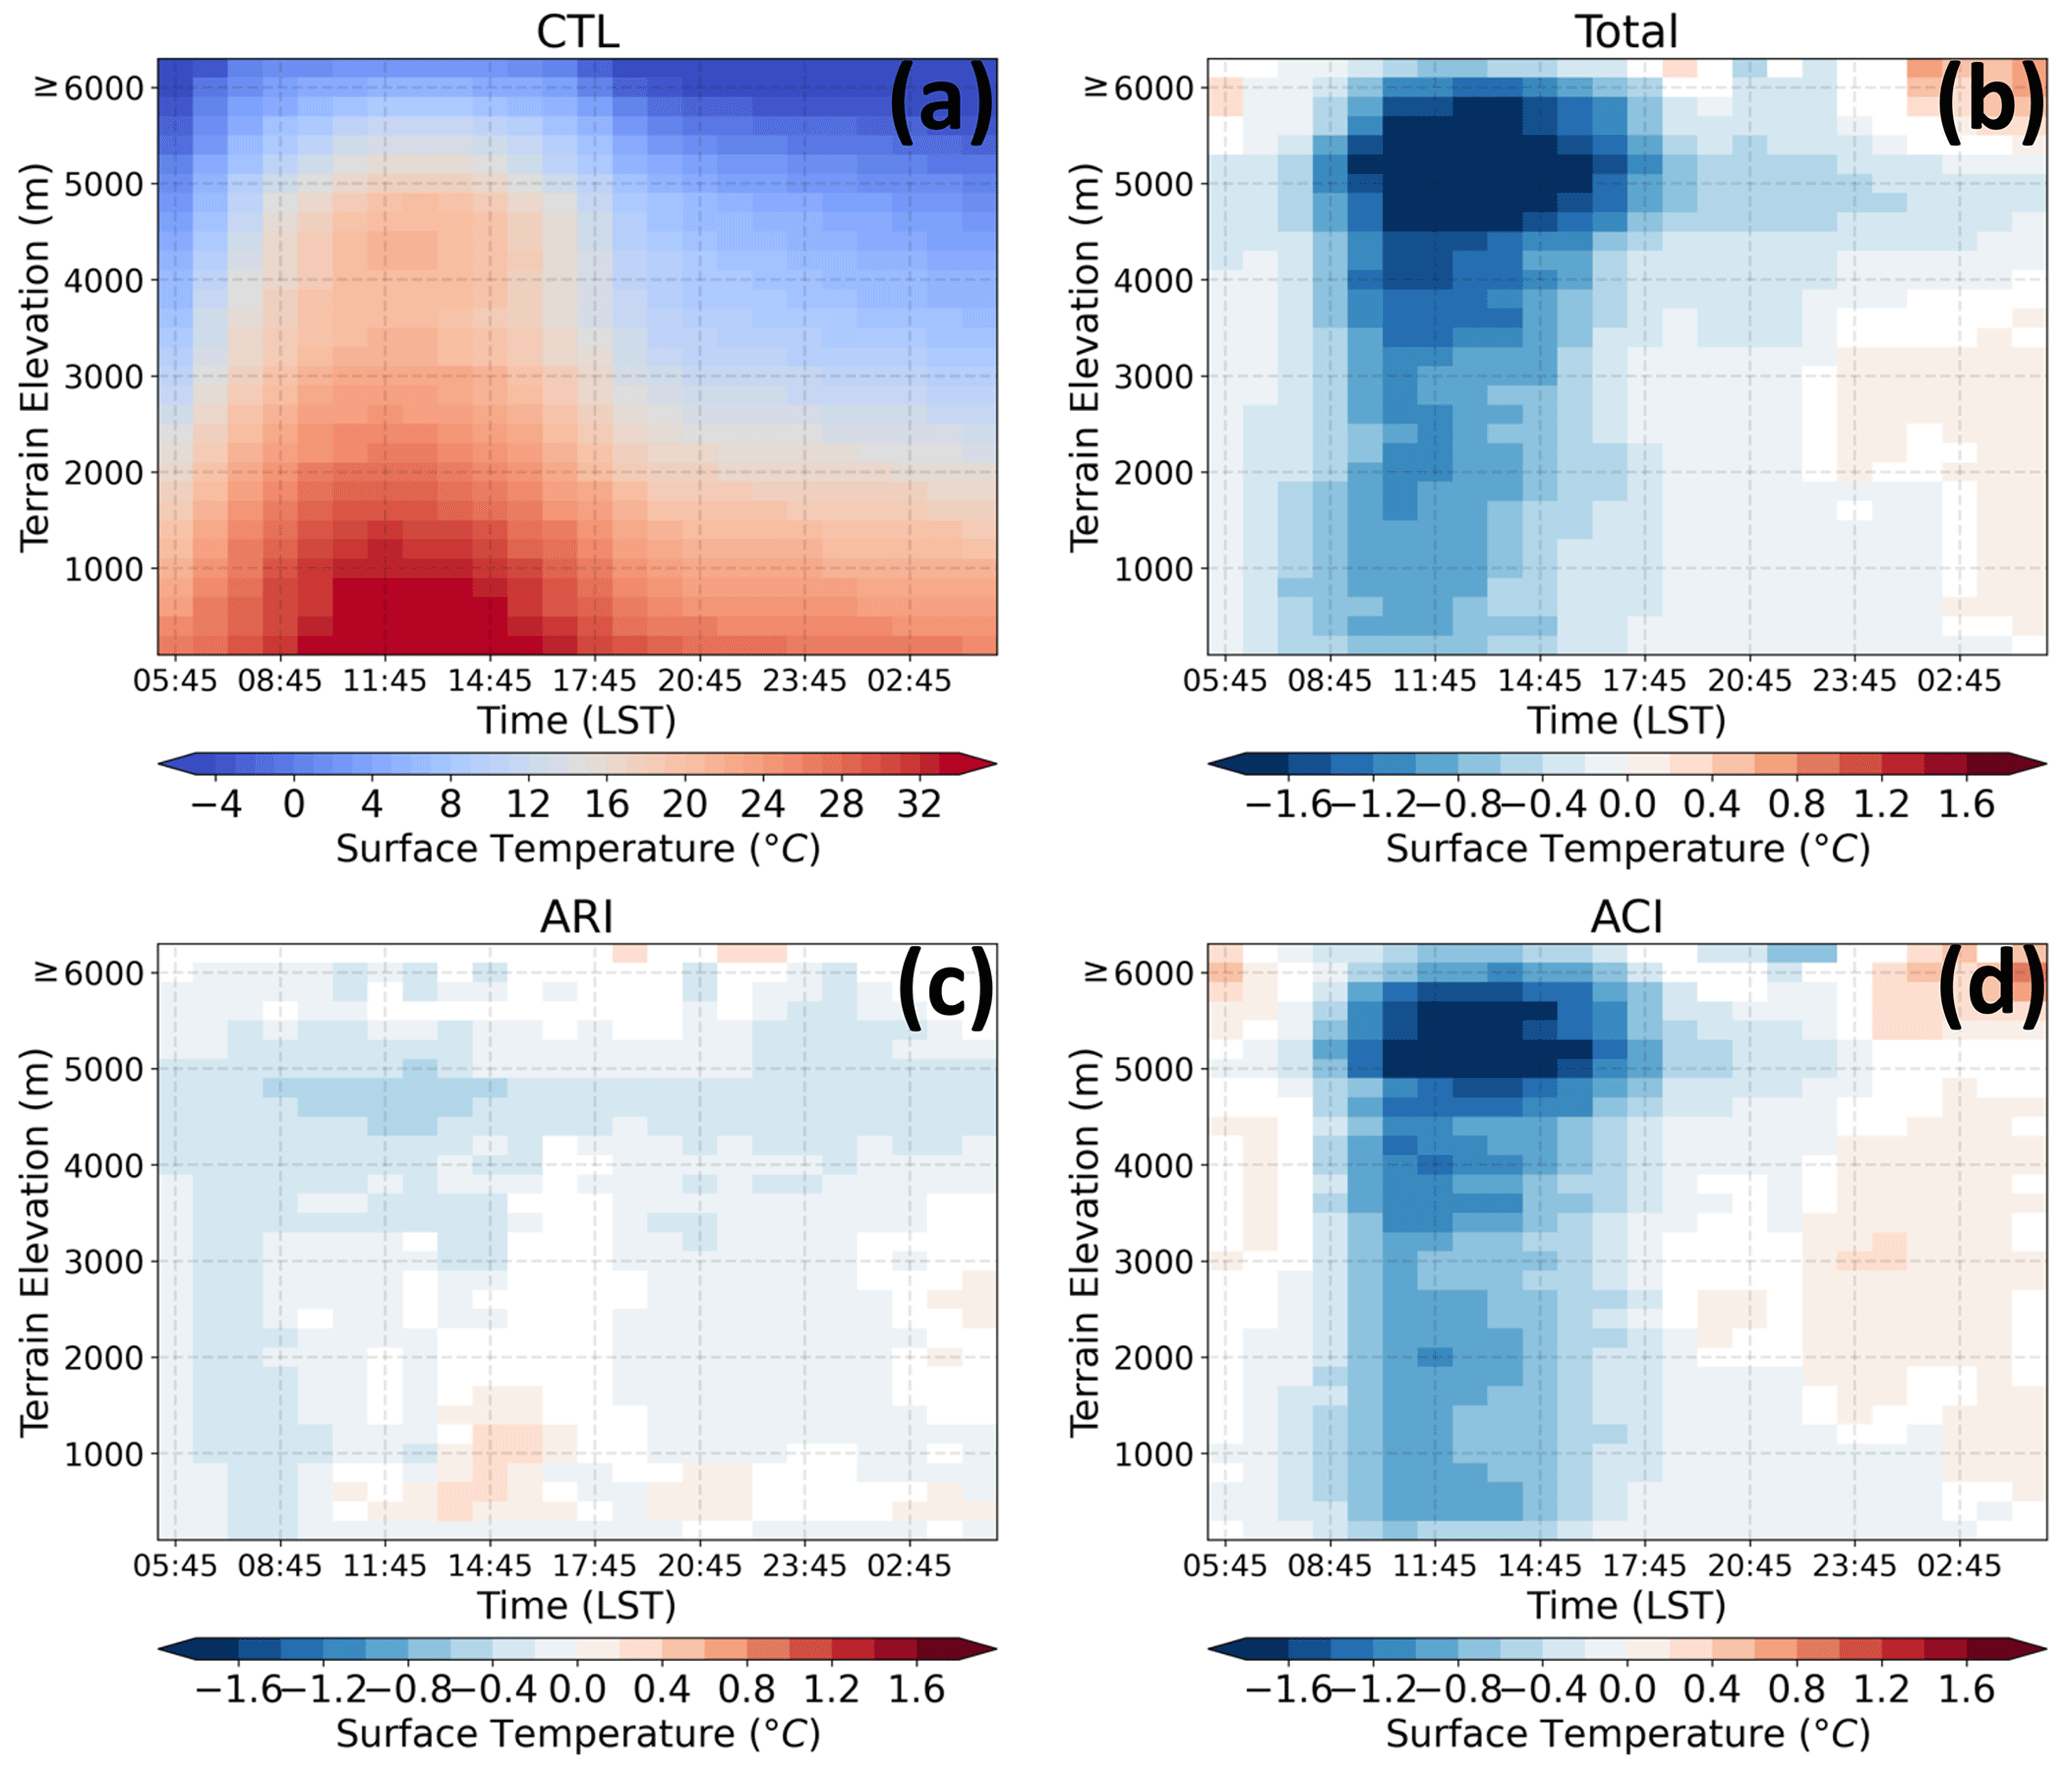
Figure 13Elevation-dependent temperature for (a) CTL, (b) aerosol effect (CTL–CLEAN), (c) ARI effect (CTL–NoARI), and (d) ACI effect (NoARI–CLEAN) and their diurnal variability. Only the differences that are significant at the 90 % confidence level based on the Student t test are plotted.
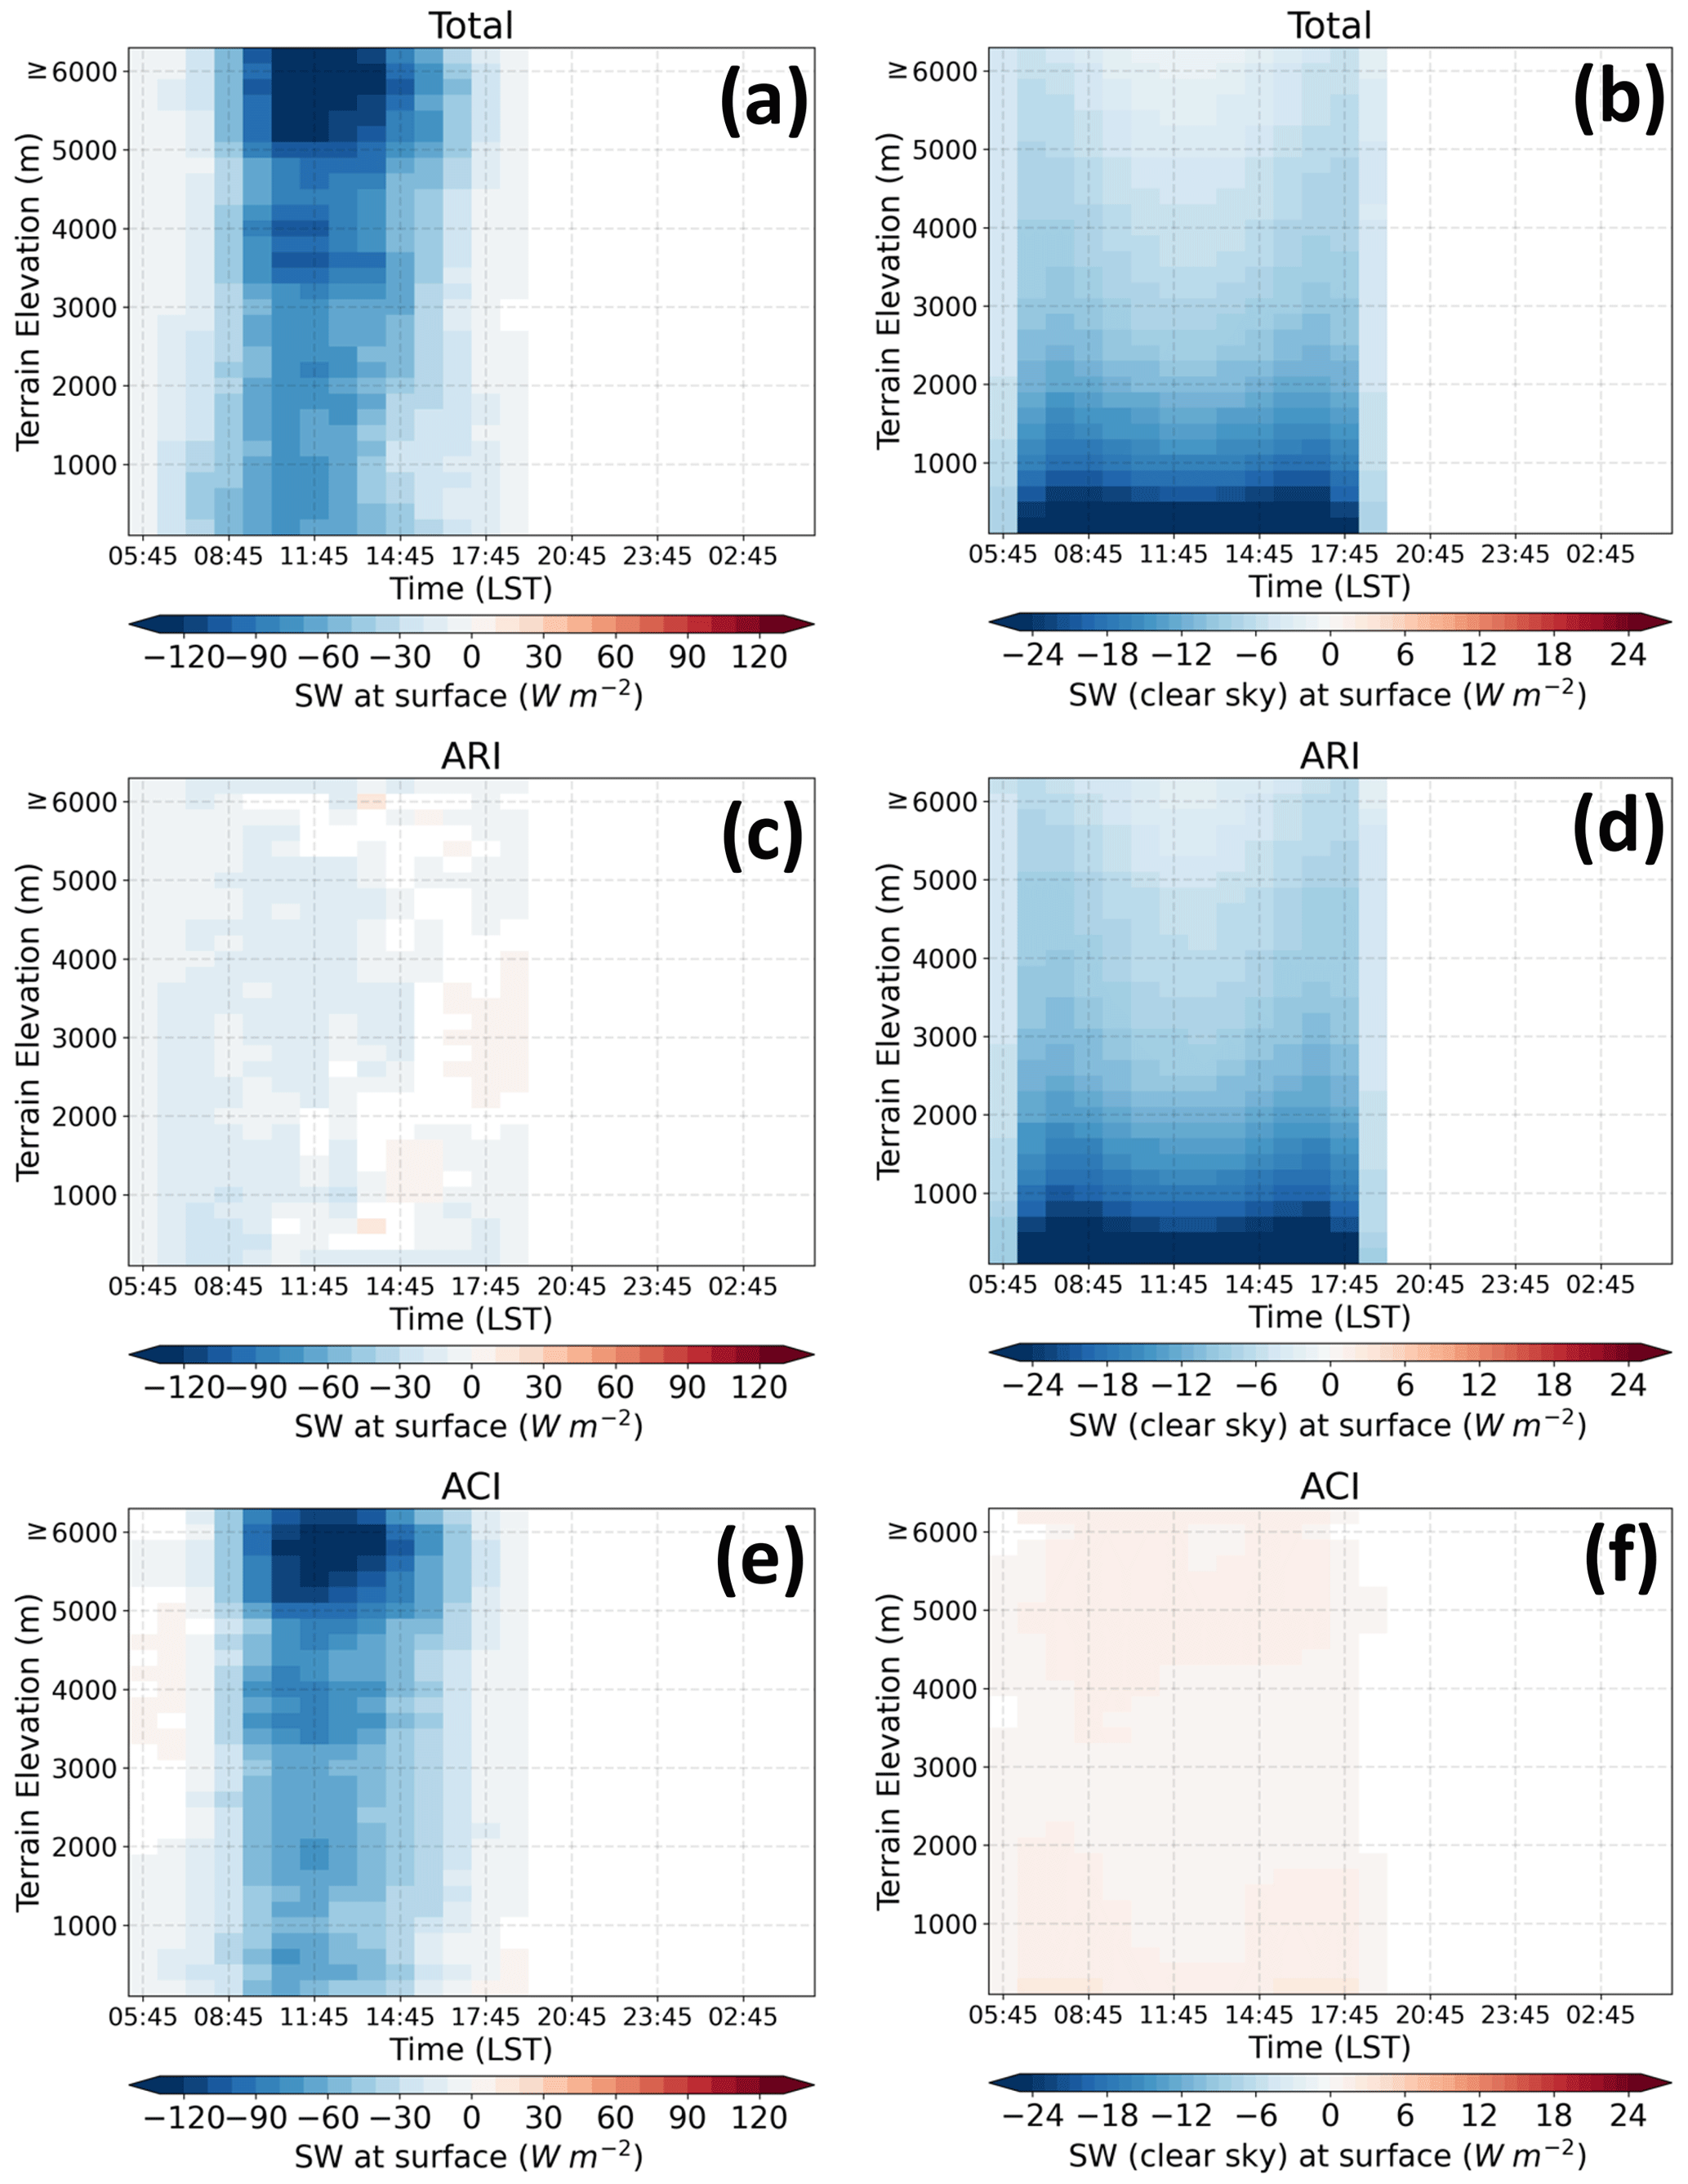
Figure 14Elevation-dependent all-sky (a, c, e) and clear-sky (b, d, f) downwelling shortwave radiation at the surface due to the (a, b) aerosol effect (CTL–CLEAN), (c, d) ARI effect (CTL–NoARI), and (e, f) ACI effect (NoARI–CLEAN) and their diurnal variability. Only the differences that are significant at the 90 % confidence level based on the Student t test are plotted.
A prominent increase in minimum temperature in the recent decades over the higher elevation of the Himalayan region has also been reported in previous studies (e.g., Dimri et al., 2022; Liu et al., 2009). The enhanced nighttime minimum temperature has also been attributed to the enhanced cloud cover over the higher topographical elevation (Rangwala and Miller, 2012; Liu et al., 2009) and increased cloud liquid water path due to the aerosol indirect effect over East Asia (Y. Huang et al., 2006). Notably, the lack of aerosol–snow interaction and deposition of light-absorbing aerosols on the snow surfaces in our simulation can add uncertainties to simulated temperature differences. The deposition of absorbing aerosol on snow has a crucial impact on the snow-darkening effect, the surface temperature, and the radiative forcing of the snowcapped Himalayan region (Qian et al., 2015; Sarangi et al., 2019). Wu et al. (2018) showed that the inclusion of aerosol–snow interaction in the model simulation resulted in a significant increase in the surface temperature of the snowcapped mountain of the Sierra Nevada.
Figure 14a, c and e show aerosol total, ARI, and ACI effects on the diurnal-elevational variation of all-sky SW, highlighting the stronger reduction of SW due to the aerosol effect at high elevations. The terrain elevation above 4000 m a.s.l. noted the reduction of SW by −82.8 W m−2, and the largest contribution is from the ACI effect of aerosols (Fig. 14e). The negative shortwave radiative perturbation at the surface due to the ACI effect is stronger and can be attributed to the higher cloud liquid water path (LWP) and enhanced cloud albedo due to more aerosols activated as condensation nuclei (Twomey, 1977). The stronger reduction of midday all-sky SW over the higher elevation compared to the lower elevation is due to the ACI effect, which results in the formation of persistent polluted orographic clouds along with the upslope wind due to the ACI effect. A distinct difference in the impact of an elevational gradient in the SW for the clear-sky (excluding cloud; Fig. 14b, d and f) and all-sky (including cloud) conditions is also noted. The reduction of the clear-sky SW due to the aerosols at the terrain elevation below 1200 m is stronger (−21 W m−2) where the aerosol loadings are higher and is dominated by the ARI effect of aerosols. The higher elevation above 4000 m a.s.l. experienced the smaller negative perturbation of clear-sky SW radiation (> −5 W m−2). This change in clear-sky SW in a relatively polluted environment at a higher elevation is consistent with a study by Marcq et al. (2010) reporting a similar change near the base camp (5079 m a.s.l.) of Mount Everest.
The presence of steep mountainous terrain and orographic distribution drives the very complex and non-linear precipitation system over the central Himalayan region. Despite the importance of the hydrological processes of the Himalayas, research studying the impact of aerosols in modulating the elevation-dependent precipitation over the central Himalayas using cloud-resolving numerical simulation has not been performed until now.
The first monsoonal month of 2013 (14 June to 15 July) is simulated using a high-resolution cloud-resolving WRF-Chem numerical model to understand the impact of aerosols on the elevation-dependent precipitation over the very complex terrain of the central Himalayan region. In addition to explicitly resolving the cloud evolution, the detailed topographical representation by the cloud-resolving scale model better simulates the emission and transport processes of aerosols. So, the cloud-resolving simulation is important to provide better insight and quantify the impact of aerosol on elevation-dependent precipitation over complex terrain. In addition to the CTL (baseline) simulation, two different numerical experiments were performed, similar to the CTL run but turning off the aerosol radiation feedback and reducing the anthropogenic aerosols to 10 % of CTL. The comparison between the simulation experiments allowed us to assess and discuss the relative impact of aerosol radiation and cloud interaction on the diurnal variation and different regimes of elevation-dependent precipitation and temperature.
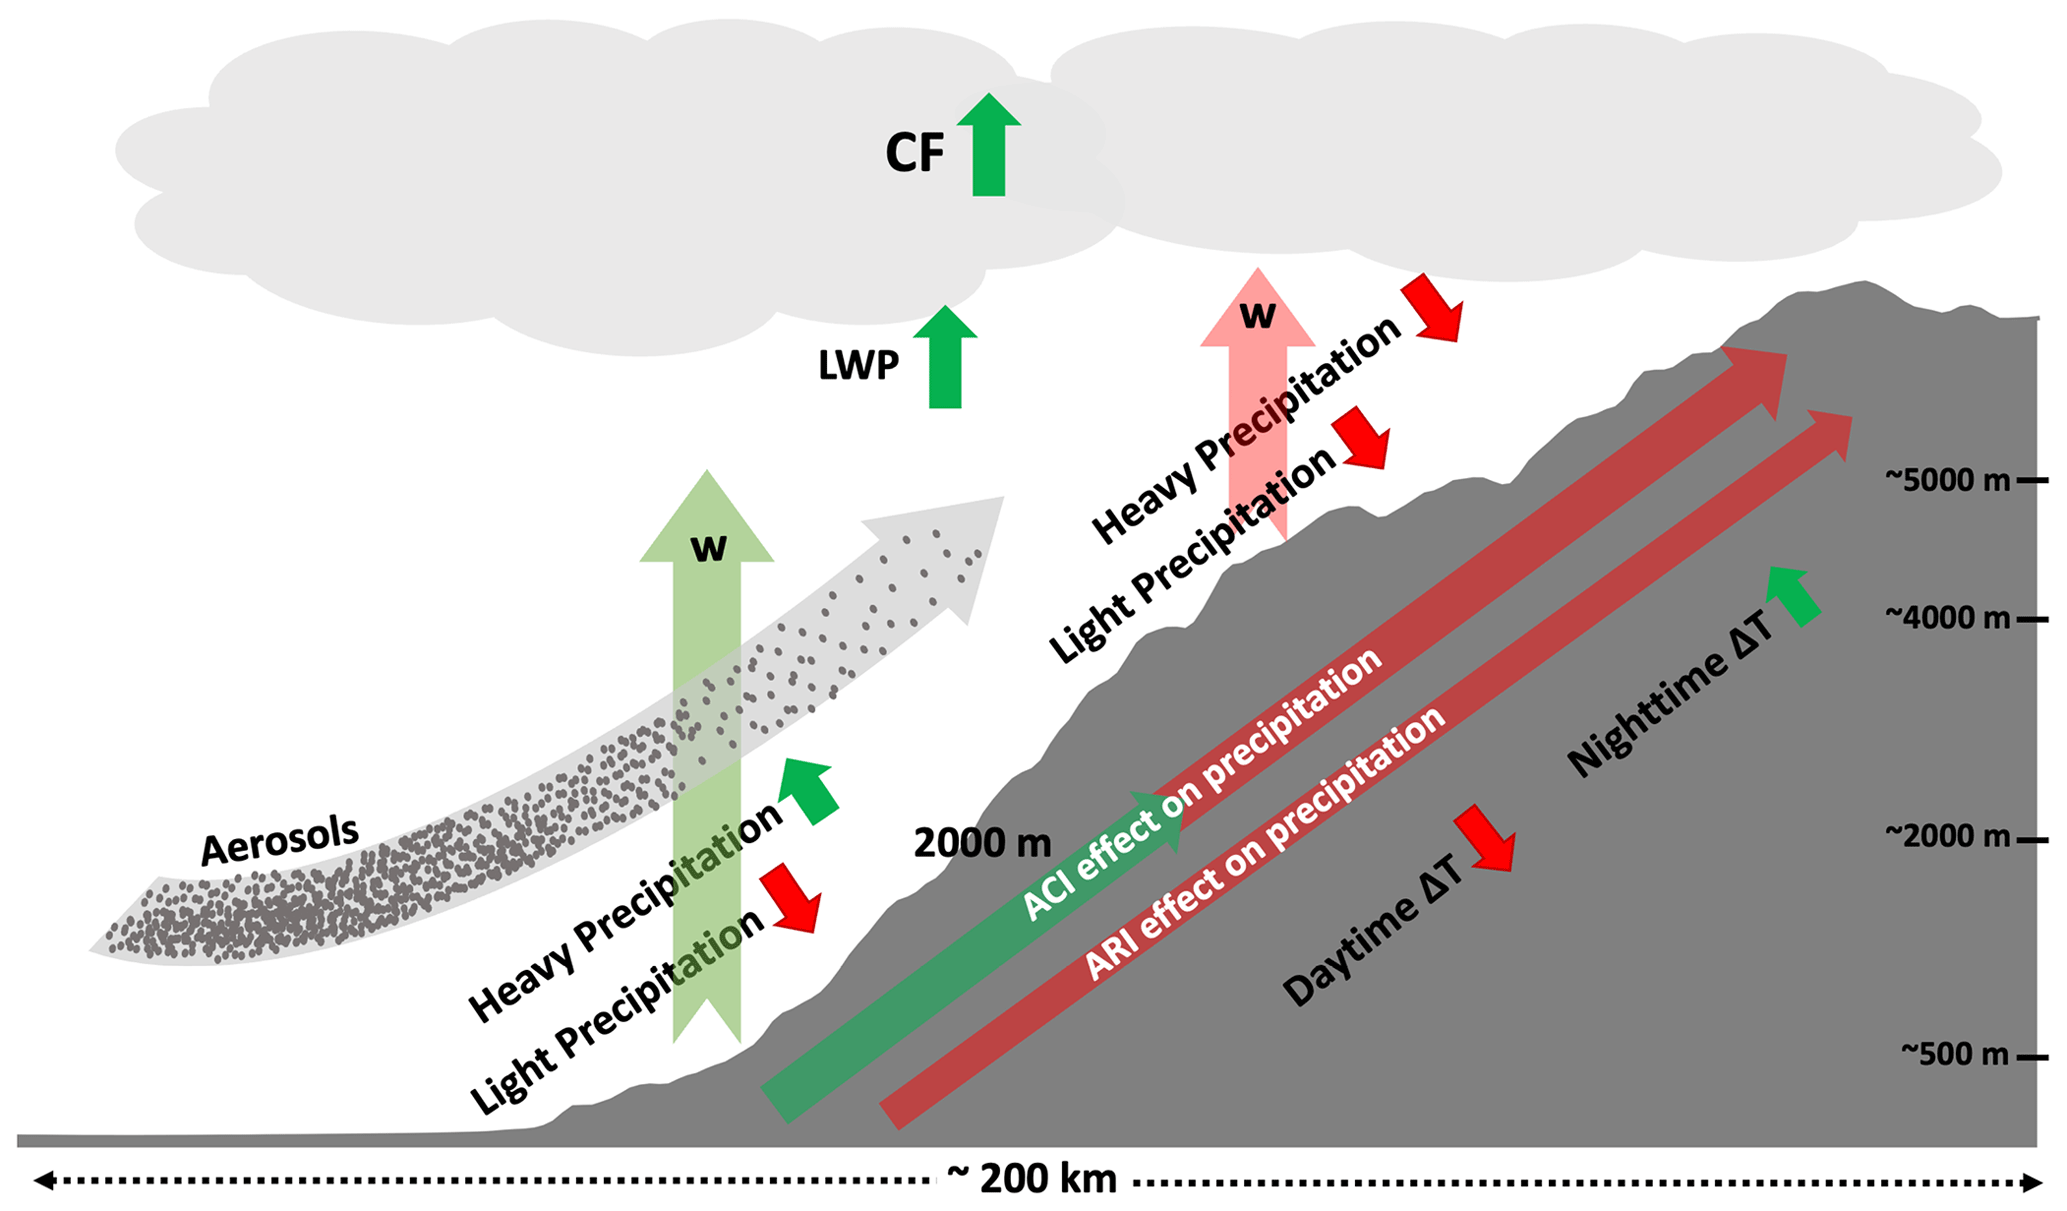
Figure 15Schematic representing the relative impact of the different effects of aerosols on elevation-dependent precipitation. Green and red arrows represent the increasing and decreasing magnitude of different parameters, respectively. The shaded gray area represents the characteristic elevation of the southern slopes across the central Himalayan region.
Figure 15 illustrates the summaries of our main conclusions. We showed that the total effect of anthropogenic aerosols cooled the daytime surface monotonically from lower to higher elevations. The higher elevation showed a strong diurnal variation in surface temperature, with a strong cooling above 4000 m a.s.l. during the daytime (by −1.3 ∘C) and nighttime warming (+0.03 ∘C) above 2000 m a.s.l. The increased LWP and cloud coverage during daytime with higher aerosol concentration is attributed to the reduced SW and daytime temperature, while nighttime warming is due to the trapping of longwave radiation.
Our modeling experiment showed an altitudinal differential response by precipitation (intensity and diurnal variation) to the anthropogenic aerosols. The mid-elevation range, generally between 1000 and 3000 m a.s.l., acts as a transition layer where the diurnal variation and various intensities of precipitation respond differently to the ARI, ACI, and total effect of aerosols. The total effect of aerosols tends to enhance the precipitation below 2000 m a.s.l., while a significant reduction of precipitation occurs above 2000 m a.s.l. with a dominating contribution from the ACI effect. The total effect of aerosols reduced the mean light precipitation by 17 %. However, along with the stronger convection below 2000 m a.s.l. the ACI effect dominated and resulted in the enhancement of the heavy precipitation by 12 %, in contrast to the reduction by 8 % over the higher elevations. The result of our study can have a broader impact and suggests that enhanced heavy precipitation over the elevation below 2000 m a.s.l. can increase the risk for extreme events (floods and landslides), while the suppressed high-elevation precipitation can be critical for the regional supply of water resources (Immerzeel et al., 2010).
The numerical simulation implemented in this study has several limitations. Due to the limited computational resources, few sensitivity simulations were performed to assess the precipitation response to the different effects of aerosols. Lack of complete effects of aerosols in the model, such as INP activation and formation of secondary organic aerosols, can induce and add up the biases in our result. In this simulation, the contribution from the impact of aerosol–surface–snow interaction is not included, which can also play a part in modulating the mountaintop surface temperature and orographic precipitation (Wu et al., 2018). The SNICAR (Snow, Ice, and Aerosol Radiation) model (Flanner et al., 2007), capable of simulating the snow surface albedo and aerosol radiative effect in snow, can be coupled with the WRF-Chem to study the aerosol–snow interaction (Zhao et al., 2014). Also, it is noted that there are biases in assessing the ACI effect associated with the presence of 10 % aerosols and contribution from the fire and biogenic emissions in the CLEAN scenario. Furthermore, the 3 km grid sizes might be relatively coarser to resolve the orographic forcing and mountain–valley circulation of the steep and complex topography of the Himalayas. Due to the inhomogeneity in the aerosol distribution over the complex topography, an improved emission inventory with diurnal distribution will help advance the current understanding of the diurnal impact of aerosols on temperature distribution and the convective/precipitation process. There is a need for continuous data collection from a denser distribution of observational networks (e.g., AERONET and weather stations) with more meteorological variables along the elevational transect of the Himalayan topography, especially over the high-elevation region. It not only quantifies the long-term trend and pattern of the sensitive regions but also helps evaluate and constrain numerical modeling studies in complex terrain.
Despite some biases and existing uncertainties in the model, our results underline the noticeable impact of aerosols on elevation-dependent precipitation. Though we simulated only the first month of the monsoon, our results indicate that the anthropogenic aerosol plays a significant role in enhancing (suppressing) the low-elevation (high-elevation) precipitation. The underlying aerosol–precipitation–elevation relationships may vary during different states of the monsoon as the abundance of aerosols tends to decrease during the mature to demise stage of the monsoon. Hence, longer-term simulations with a complete parametrization scheme to include the ice phase aerosol–cloud interaction and aerosol–snow interaction pathways and a better emission inventory with characterization are warranted to deepen our understanding of such elevation dependence. This could be the future scope and extension of this study.
The MODIS data are available through the following link: https://doi.org/10.5067/MODIS/MOD08_D3.006 (Platnick, 2015). The IMERG data are available through the following link: https://doi.org/10.5067/GPM/IMERG/3B-HH/06 (Huffman et al., 2019b). The DHM rain gauge station precipitation data can be requested through the following link: https://www.dhm.gov.np/request-data (last access: 20 February 2022; Department of Hydrology and Meteorological Nepal, 2022). The upperair-sounding data are available through the following link: http://weather.uwyo.edu/upperair/sounding.html (last access: 14 March 2022; Department of Atmospheric Science, 2022). The AERONET data are available through the following link: https://aeronet.gsfc.nasa.gov/cgi-bin/webtool_aod_v3 (last access: 11 November 2022; Aerosol Robotic Network, 2022). The WRF-Chem model code is distributed by NCAR: https://github.com/wrf-model (last access: 1 February 2021; National Center for Atmospheric Research, 2021).
The supplement related to this article is available online at: https://doi.org/10.5194/acp-23-1019-2023-supplement.
PA and JFM designed the numerical experiments, and PA performed the simulations. PA and JFM performed the analysis and interpreted the results. PA prepared the original draft of the manuscript with equal contributions from JFM.
The contact author has declared that neither of the authors has any competing interests.
Publisher’s note: Copernicus Publications remains neutral with regard to jurisdictional claims in published maps and institutional affiliations.
The authors would like to thank the Division of Atmospheric Sciences, Desert Research Institute (DRI), and the University of Nevada Reno for supporting this research. We would like to acknowledge high-performance computing support from Cheyenne (Computational and Information Systems Laboratory, 2019) provided by NCAR's Computational and Information Systems Laboratory, sponsored by the National Science Foundation. We also thank NASA for providing the IMERG, AERONET, and MERRA2 data. We also thank the Department of Hydrology and Meteorology of Nepal for providing the precipitation data from the rain gauge stations. We would like to acknowledge Douglas Lowe (University of Manchester) and the Atmospheric Chemistry Observations and Modeling Laboratory (ACOM) of NCAR for providing the WRF-Chem preprocessor tool.
This paper was edited by Ari Laaksonen and reviewed by Sharad Gokhale and one anonymous referee.
Abdul-Razzak, H. and Ghan, S. J.: A parameterization of aerosol activation 3. Sectional representation, J. Geophys. Res.-Atmos., 107, AAC 1-1–AAC 1-6, https://doi.org/10.1029/2001JD000483, 2002.
Ackerman, A. S., Toon, O. B., Stevens, D. E., Heymsfield, A. J., Ramanathan, V., and Welton, E. J.: Reduction of Tropical Cloudiness by Soot, Science, 288, 1042–1047, https://doi.org/10.1126/science.288.5468.1042, 2000.
Aerosol Robotic Network: AERONET data, Goddard Space Flight Center, USA [data set], https://aeronet.gsfc.nasa.gov/cgi-bin/webtool_aod_v3, last access: 11 November 2022.
Adhikari, P. and Mejia, J. F.: Influence of aerosols on clouds, precipitation and freezing level height over the foothills of the Himalayas during the Indian summer monsoon, Clim. Dynam., 57, 395–413, https://doi.org/10.1007/s00382-021-05710-2, 2021.
Adhikari, P. and Mejia, J. F.: Impact of transported dust aerosols on precipitation over the Nepal Himalayas using convection-permitting WRF-Chem simulation, Atmos. Environ. X, 15, 100179, https://doi.org/10.1016/j.aeaoa.2022.100179, 2022.
Albrecht, B. A.: Aerosols, Cloud Microphysics, and Fractional Cloudiness, Science, 245, 1227–1230, https://doi.org/10.1126/science.245.4923.1227, 1989.
Andreae, M. O. and Rosenfeld, D.: Aerosol–cloud–precipitation interactions. Part 1. The nature and sources of cloud-active aerosols, Earth-Sci. Rev., 89, 13–41, https://doi.org/10.1016/j.earscirev.2008.03.001, 2008.
Andreae, M. O., Rosenfeld, D., Artaxo, P., Costa, A. A., Frank, G. P., Longo, K. M., and Silva-Dias, M. A. F.: Smoking rain clouds over the Amazon, Science, 303, 1337–1342, https://doi.org/10.1126/science.1092779, 2004.
Archer-Nicholls, S., Lowe, D., Schultz, D. M., and McFiggans, G.: Aerosol–radiation–cloud interactions in a regional coupled model: the effects of convective parameterisation and resolution, Atmos. Chem. Phys., 16, 5573–5594, https://doi.org/10.5194/acp-16-5573-2016, 2016.
Arulraj, M. and Barros, A. P.: Improving quantitative precipitation estimates in mountainous regions by modelling low-level seeder-feeder interactions constrained by Global Precipitation Measurement Dual-frequency Precipitation Radar measurements, Remote Sens. Environ., 231, 111213, https://doi.org/10.1016/j.rse.2019.111213, 2019.
Barman, N. and Gokhale, S.: Aerosol influence on the pre-monsoon rainfall mechanisms over North-East India: A WRF-Chem study, Atmos. Res., 268, 106002, https://doi.org/10.1016/j.atmosres.2021.106002, 2022.
Baró, R., Jiménez-Guerrero, P., Balzarini, A., Curci, G., Forkel, R., Grell, G., Hirtl, M., Honzak, L., Langer, M., Pérez, J. L., Pirovano, G., San José, R., Tuccella, P., Werhahn, J., and Žabkar, R.: Sensitivity analysis of the microphysics scheme in WRF-Chem contributions to AQMEII phase 2, Atmos. Environ., 115, 620–629, https://doi.org/10.1016/j.atmosenv.2015.01.047, 2015.
Bradley, R. S., Keimig, F. T., Diaz, H. F., and Hardy, D. R.: Recent changes in freezing level heights in the Tropics with implications for the deglacierization of high mountain regions, Geophys. Res. Lett., 36, L17701, https://doi.org/10.1029/2009GL037712, 2009.
Buchholz, R. R., Emmons, L. K., Tilmes, S., and The CESM2 Development Team: CESM2.1/CAM-chem instantaneous output for boundary conditions, UCAR/NCAR-Atmospheric Chemistry Observations and Modeling Laboratory, https://doi.org/10.5065/NMP7-EP60, 2019.
Cao, Q., Painter, T. H., Currier, W. R., Lundquist, J. D., and Lettenmaier, D. P.: Estimation of Precipitation over the OLYMPEX Domain during Winter 2015/16, J. Hydrometeorol., 19, 143–160, https://doi.org/10.1175/JHM-D-17-0076.1, 2018.
Chang, D., Cheng, Y., Reutter, P., Trentmann, J., Burrows, S. M., Spichtinger, P., Nordmann, S., Andreae, M. O., Pöschl, U., and Su, H.: Comprehensive mapping and characteristic regimes of aerosol effects on the formation and evolution of pyro-convective clouds, Atmos. Chem. Phys., 15, 10325–10348, https://doi.org/10.5194/acp-15-10325-2015, 2015.
Chapman, E. G., Gustafson Jr., W. I., Easter, R. C., Barnard, J. C., Ghan, S. J., Pekour, M. S., and Fast, J. D.: Coupling aerosol-cloud-radiative processes in the WRF-Chem model: Investigating the radiative impact of elevated point sources, Atmos. Chem. Phys., 9, 945–964, https://doi.org/10.5194/acp-9-945-2009, 2009.
Cho, C., Li, R., Wang, S.-Y., Yoon, J.-H., and Gillies, R. R.: Anthropogenic footprint of climate change in the June 2013 northern India flood, Clim. Dynam., 46, 797–805, https://doi.org/10.1007/s00382-015-2613-2, 2016.
Choudhury, G., Tyagi, B., Singh, J., Sarangi, C., and Tripathi, S. N.: Aerosol-orography-precipitation – A critical assessment, Atmos. Environ., 214, 116831, https://doi.org/10.1016/j.atmosenv.2019.116831, 2019.
Choudhury, G., Tyagi, B., Vissa, N. K., Singh, J., Sarangi, C., Tripathi, S. N., and Tesche, M.: Aerosol-enhanced high precipitation events near the Himalayan foothills, Atmos. Chem. Phys., 20, 15389–15399, https://doi.org/10.5194/acp-20-15389-2020, 2020.
Computational and Information Systems Laboratory, Cheyenne: HPE/SGI ICE XA System (University Community Computing), National Center for Atmospheric Research, Boulder, CO, https://doi.org/10.5065/D6RX99HX, 2019.
Dey, S. and Di Girolamo, L.: A decade of change in aerosol properties over the Indian subcontinent, Geophys. Res. Lett., 38, L14811, https://doi.org/10.1029/2011GL048153, 2011.
Department of Atmospheric Science: Upper-air-sounding data, Department of Atmospheric Science, University of Wyoming [data set], http://weather.uwyo.edu/upperair/sounding.html, last access: 14 March 2022.
Department of Hydrology and Meteorological Nepal: Precipitation data from meteorological stations, Department of Hydrology and Meteorological Nepal [data set], https://www.dhm.gov.np/request-data, last access: 20 February 2022.
Dhital, S., Kaplan, M. L., Orza, J. A. G., and Fiedler, S.: The Extreme North African Haboob in October 2008: High-Resolution Simulation of Organized Moist Convection in the Lee of the Atlas, Dust Recirculation and Poleward Transport, J. Geophys. Res.-Atmos., 127, e2021JD035858, https://doi.org/10.1029/2021JD035858, 2022.
DHM Nepal: Monsoon onset and withdrawal date information, https://www.dhm.gov.np/uploads/dhm/climateService/monsoon_onset_n_withdrawal_English_6_June_20221.pdf, last access: 19 June 2022.
Dimri, A. P., Palazzi, E., and Daloz, A. S.: Elevation dependent precipitation and temperature changes over Indian Himalayan region, Clim. Dynam., 59, 1–21, https://doi.org/10.1007/s00382-021-06113-z, 2022.
Dipu, S., Prabha, T. V., Pandithurai, G., Dudhia, J., Pfister, G., Rajesh, K., and Goswami, B. N.: Impact of elevated aerosol layer on the cloud macrophysical properties prior to monsoon onset, Atmos. Environ., 70, 454–467, https://doi.org/10.1016/j.atmosenv.2012.12.036, 2013.
Eidhammer, T., Barth, M. C., Petters, M. D., Wiedinmyer, C., and Prenni, A. J.: Aerosol microphysical impact on summertime convective precipitation in the Rocky Mountain region, J. Geophys. Res.-Atmos., 119, 11709–11728, https://doi.org/10.1002/2014JD021883, 2014.
Emmons, L. K., Schwantes, R. H., Orlando, J. J., Tyndall, G., Kinnison, D., Lamarque, J.-F., Marsh, D., Mills, M. J., Tilmes, S., Bardeen, C., Buchholz, R. R., Conley, A., Gettelman, A., Garcia, R., Simpson, I., Blake, D. R., Meinardi, S., and Pétron, G.: The Chemistry Mechanism in the Community Earth System Model Version 2 (CESM2), J. Adv. Model. Earth Syst., 12, e2019MS001882, https://doi.org/10.1029/2019MS001882, 2020.
Fan, J., Zhang, R., Li, G., and Tao, W.-K.: Effects of aerosols and relative humidity on cumulus clouds, J. Geophys. Res.-Atmos., 112, D14204, https://doi.org/10.1029/2006JD008136, 2007.
Fan, J., Leung, L. R., Rosenfeld, D., Chen, Q., Li, Z., Zhang, J., and Yan, H.: Microphysical effects determine macrophysical response for aerosol impacts on deep convective clouds, P. Natl. Acad. Sci. USA, 110, E4581–E4590, https://doi.org/10.1073/pnas.1316830110, 2013.
Fan, J., Rosenfeld, D., Yang, Y., Zhao, C., Leung, L. R., and Li, Z.: Substantial contribution of anthropogenic air pollution to catastrophic floods in Southwest China, Geophys. Res. Lett., 42, 6066–6075, https://doi.org/10.1002/2015GL064479, 2015.
Fan, J., Leung, L. R., Rosenfeld, D., and DeMott, P. J.: Effects of cloud condensation nuclei and ice nucleating particles on precipitation processes and supercooled liquid in mixed-phase orographic clouds, Atmos. Chem. Phys., 17, 1017–1035, https://doi.org/10.5194/acp-17-1017-2017, 2017.
Fast, J. D., Gustafson, W. I., Easter, R. C., Zaveri, R. A., Barnard, J. C., Chapman, E. G., Grell, G. A., and Peckham, S. E.: Evolution of ozone, particulates, and aerosol direct radiative forcing in the vicinity of Houston using a fully coupled meteorology-chemistry-aerosol model, J. Geophys. Res.-Atmos., 111, D21305, https://doi.org/10.1029/2005JD006721, 2006.
Flanner, M. G., Zender, C. S., Randerson, J. T., and Rasch, P. J.: Present-day climate forcing and response from black carbon in snow, J. Geophys. Res.-Atmos., 112, D11202, https://doi.org/10.1029/2006JD008003, 2007.
Fujinami, H., Fujita, K., Takahashi, N., Sato, T., Kanamori, H., Sunako, S., and Kayastha, R. B.: Twice-Daily Monsoon Precipitation Maxima in the Himalayas Driven by Land Surface Effects, J. Geophys. Res.-Atmos., 126, e2020JD034255, https://doi.org/10.1029/2020JD034255, 2021.
Gery, M. W., Whitten, G. Z., Killus, J. P., and Dodge, M. C.: A photochemical kinetics mechanism for urban and regional scale computer modeling, J. Geophys. Res.-Atmos., 94, 12925–12956, https://doi.org/10.1029/JD094iD10p12925, 1989.
Ghimire, S., Choudhary, A., and Dimri, A. P.: Assessment of the performance of CORDEX-South Asia experiments for monsoonal precipitation over the Himalayan region during present climate: part I, Clim. Dynam., 50, 2311–2334, https://doi.org/10.1007/s00382-015-2747-2, 2018.
Givati, A. and Rosenfeld, D.: Quantifying Precipitation Suppression Due to Air Pollution, J. Appl. Meteorol. Clim., 43, 1038–1056, https://doi.org/10.1175/1520-0450(2004)043<1038:QPSDTA>2.0.CO;2, 2004.
Govardhan, G., Nanjundiah, R. S., Satheesh, S. K., Krishnamoorthy, K., and Kotamarthi, V. R.: Performance of WRF-Chem over Indian region: Comparison with measurements, J. Earth Syst. Sci., 124, 875–896, https://doi.org/10.1007/s12040-015-0576-7, 2015.
Grell, G., Freitas, S. R., Stuefer, M., and Fast, J.: Inclusion of biomass burning in WRF-Chem: impact of wildfires on weather forecasts, Atmos. Chem. Phys., 11, 5289–5303, https://doi.org/10.5194/acp-11-5289-2011, 2011.
Grell, G. A. and Dévényi, D.: A generalized approach to parameterizing convection combining ensemble and data assimilation techniques, Geophys. Res. Lett., 29, 38-1–38-4, https://doi.org/10.1029/2002GL015311, 2002.
Grell, G. A., Peckham, S. E., Schmitz, R., McKeen, S. A., Frost, G., Skamarock, W. C., and Eder, B.: Fully coupled “online” chemistry within the WRF model, Atmos. Environ., 39, 6957–6975, https://doi.org/10.1016/j.atmosenv.2005.04.027, 2005.
Guenther, A., Karl, T., Harley, P., Wiedinmyer, C., Palmer, P. I., and Geron, C.: Estimates of global terrestrial isoprene emissions using MEGAN (Model of Emissions of Gases and Aerosols from Nature), Atmos. Chem. Phys., 6, 3181–3210, https://doi.org/10.5194/acp-6-3181-2006, 2006.
Guenther, A. B., Jiang, X., Heald, C. L., Sakulyanontvittaya, T., Duhl, T., Emmons, L. K., and Wang, X.: The Model of Emissions of Gases and Aerosols from Nature version 2.1 (MEGAN2.1): an extended and updated framework for modeling biogenic emissions, Geosci. Model Dev., 5, 1471–1492, https://doi.org/10.5194/gmd-5-1471-2012, 2012.
Hallquist, M., Wenger, J. C., Baltensperger, U., Rudich, Y., Simpson, D., Claeys, M., Dommen, J., Donahue, N. M., George, C., Goldstein, A. H., Hamilton, J. F., Herrmann, H., Hoffmann, T., Iinuma, Y., Jang, M., Jenkin, M. E., Jimenez, J. L., Kiendler-Scharr, A., Maenhaut, W., McFiggans, G., Mentel, Th. F., Monod, A., Prévôt, A. S. H., Seinfeld, J. H., Surratt, J. D., Szmigielski, R., and Wildt, J.: The formation, properties and impact of secondary organic aerosol: current and emerging issues, Atmos. Chem. Phys., 9, 5155–5236, https://doi.org/10.5194/acp-9-5155-2009, 2009.
Hansen, J., Sato, M., and Ruedy, R.: Radiative forcing and climate response, J. Geophys. Res.-Atmos., 102, 6831–6864, https://doi.org/10.1029/96JD03436, 1997.
Haywood, J. and Boucher, O.: Estimates of the direct and indirect radiative forcing due to tropospheric aerosols: A review, Rev. Geophys., 38, 513–543, https://doi.org/10.1029/1999RG000078, 2000.
Hersbach, H., Bell, B., Berrisford, P., Hirahara, S., Horányi, A., Muñoz-Sabater, J., Nicolas, J., Peubey, C., Radu, R., Schepers, D., Simmons, A., Soci, C., Abdalla, S., Abellan, X., Balsamo, G., Bechtold, P., Biavati, G., Bidlot, J., Bonavita, M., De Chiara, G., Dahlgren, P., Dee, D., Diamantakis, M., Dragani, R., Flemming, J., Forbes, R., Fuentes, M., Geer, A., Haimberger, L., Healy, S., Hogan, R. J., Hólm, E., Janisková, M., Keeley, S., Laloyaux, P., Lopez, P., Lupu, C., Radnoti, G., de Rosnay, P., Rozum, I., Vamborg, F., Villaume, S., and Thépaut, J.-N.: The ERA5 global reanalysis, Q. J. Roy. Meteor. Soc., 146, 1999–2049, https://doi.org/10.1002/qj.3803, 2020.
Hong, S.-Y., Noh, Y., and Dudhia, J.: A New Vertical Diffusion Package with an Explicit Treatment of Entrainment Processes, Mon. Weather Rev., 134, 2318–2341, https://doi.org/10.1175/MWR3199.1, 2006.
Huang, J., Lin, B., Minnis, P., Wang, T., Wang, X., Hu, Y., Yi, Y., and Ayers, J. K.: Satellite-based assessment of possible dust aerosols semi-direct effect on cloud water path over East Asia, Geophys. Res. Lett., 33, L19802, https://doi.org/10.1029/2006GL026561, 2006.
Huang, Y., Dickinson, R. E., and Chameides, W. L.: Impact of aerosol indirect effect on surface temperature over East Asia, P. Natl. Acad. Sci. USA, 103, 4371–4376, https://doi.org/10.1073/pnas.0504428103, 2006.
Huffman, G. J., Stocker, E. F., Bolvin, D. T., Nelkin, E. J., and Tan, J.: GPM IMERG Early Precipitation L3 Half Hourly 0.1 degree x 0.1 degree V06, Goddard Earth Sciences Data and Information Services Center (GES DISC), Greenbelt, MD, https://doi.org/10.5067/GPM/IMERG/3B-HH-E/06, 2019a.
Huffman, G. J., Stocker, E. F., Bolvin, D. T., Nelkin, E. J., and Tan, J.: GPM IMERG Final Precipitation L3 Half Hourly 0.1 degree x 0.1 degree V06, Greenbelt, MD, Goddard Earth Sciences Data and Information Services Center (GES DISC) [data set], https://doi.org/10.5067/GPM/IMERG/3B-HH/06, 2019b.
Iacono, M. J., Delamere, J. S., Mlawer, E. J., Shephard, M. W., Clough, S. A., and Collins, W. D.: Radiative forcing by long-lived greenhouse gases: Calculations with the AER radiative transfer models, J. Geophys. Res.-Atmos., 113, D13103, https://doi.org/10.1029/2008JD009944, 2008.
Immerzeel, W. W., van Beek, L. P. H., and Bierkens, M. F. P.: Climate Change Will Affect the Asian Water Towers, Science, 328, 1382–1385, https://doi.org/10.1126/science.1183188, 2010.
IPCC: Climate change 2013: The Physical Science Basis, Working Group I Contribution to the Fifth Assessment Report of the Intergovernmental Panel on Climate, edited by: Stocker, T. F., Qin, D., Plattner, G.-K., Tignor, M., Allen, S. K., Boschung, J., Nauels, A., Xia, Y., Bex, V., and Midgley, P. M., Cambridge University Press, 1553 pp., ISBN 978-1-107-05799-9, 2013.
Janssens-Maenhout, G., Crippa, M., Guizzardi, D., Dentener, F., Muntean, M., Pouliot, G., Keating, T., Zhang, Q., Kurokawa, J., Wankmüller, R., Denier van der Gon, H., Kuenen, J. J. P., Klimont, Z., Frost, G., Darras, S., Koffi, B., and Li, M.: HTAP_v2.2: a mosaic of regional and global emission grid maps for 2008 and 2010 to study hemispheric transport of air pollution, Atmos. Chem. Phys., 15, 11411–11432, https://doi.org/10.5194/acp-15-11411-2015, 2015.
Ji, Z., Kang, S., Cong, Z., Zhang, Q., and Yao, T.: Simulation of carbonaceous aerosols over the Third Pole and adjacent regions: distribution, transportation, deposition, and climatic effects, Clim. Dynam., 45, 2831–2846, https://doi.org/10.1007/s00382-015-2509-1, 2015.
Kang, S., Zhang, Q., Qian, Y., Ji, Z., Li, C., Cong, Z., Zhang, Y., Guo, J., Du, W., Huang, J., You, Q., Panday, A. K., Rupakheti, M., Chen, D., Gustafsson, Ö., Thiemens, M. H., and Qin, D.: Linking atmospheric pollution to cryospheric change in the Third Pole region: current progress and future prospects, Natl. Sci. Rev., 6, 796–809, https://doi.org/10.1093/nsr/nwz031, 2019.
Kant, S., Panda, J., Rao, P., Sarangi, C., and Ghude, S. D.: Study of aerosol-cloud-precipitation-meteorology interaction during a distinct weather event over the Indian region using WRF-Chem, Atmos. Res., 247, 105144, https://doi.org/10.1016/j.atmosres.2020.105144, 2021.
Kaul, D. S., Gupta, T., Tripathi, S. N., Tare, V., and Collett, J. L.: Secondary Organic Aerosol: A Comparison between Foggy and Nonfoggy Days, Environ. Sci. Technol., 45, 7307–7313, https://doi.org/10.1021/es201081d, 2011.
Khain, A., Lynn, B., and Shpund, J.: High resolution WRF simulations of Hurricane Irene: Sensitivity to aerosols and choice of microphysical schemes, Atmos. Res., 167, 129–145, https://doi.org/10.1016/j.atmosres.2015.07.014, 2016.
Koren, I., Kaufman, Y. J., Rosenfeld, D., Remer, L. A., and Rudich, Y.: Aerosol invigoration and restructuring of Atlantic convective clouds, Geophys. Res. Lett., 32, L14828, https://doi.org/10.1029/2005GL023187, 2005.
Kumar, M., Parmar, K. S., Kumar, D. B., Mhawish, A., Broday, D. M., Mall, R. K., and Banerjee, T.: Long-term aerosol climatology over Indo-Gangetic Plain: Trend, prediction and potential source fields, Atmos. Environ., 180, 37–50, https://doi.org/10.1016/j.atmosenv.2018.02.027, 2018.
Lau, K. M., Kim, M. K., and Kim, K. M.: Asian summer monsoon anomalies induced by aerosol direct forcing: the role of the Tibetan Plateau, Clim. Dynam., 26, 855–864, https://doi.org/10.1007/s00382-006-0114-z, 2006.
Lau, W. K. M., Kim, K.-M., Shi, J.-J., Matsui, T., Chin, M., Tan, Q., Peters-Lidard, C., and Tao, W. K.: Impacts of aerosol–monsoon interaction on rainfall and circulation over Northern India and the Himalaya Foothills, Clim. Dynam., 49, 1945–1960, https://doi.org/10.1007/s00382-016-3430-y, 2017.
Li, Z., Lau, W. K.-M., Ramanathan, V., Wu, G., Ding, Y., Manoj, M. G., Liu, J., Qian, Y., Li, J., Zhou, T., Fan, J., Rosenfeld, D., Ming, Y., Wang, Y., Huang, J., Wang, B., Xu, X., Lee, S.-S., Cribb, M., Zhang, F., Yang, X., Zhao, C., Takemura, T., Wang, K., Xia, X., Yin, Y., Zhang, H., Guo, J., Zhai, P. M., Sugimoto, N., Babu, S. S., and Brasseur, G. P.: Aerosol and monsoon climate interactions over Asia, Rev. Geophys., 54, 866–929, https://doi.org/10.1002/2015RG000500, 2016.
Liu, L., Cheng, Y., Wang, S., Wei, C., Pöhlker, M. L., Pöhlker, C., Artaxo, P., Shrivastava, M., Andreae, M. O., Pöschl, U., and Su, H.: Impact of biomass burning aerosols on radiation, clouds, and precipitation over the Amazon: relative importance of aerosol–cloud and aerosol–radiation interactions, Atmos. Chem. Phys., 20, 13283–13301, https://doi.org/10.5194/acp-20-13283-2020, 2020.
Liu, X., Cheng, Z., Yan, L., and Yin, Z.-Y.: Elevation dependency of recent and future minimum surface air temperature trends in the Tibetan Plateau and its surroundings, Global Planet. Change, 68, 164–174, https://doi.org/10.1016/j.gloplacha.2009.03.017, 2009.
Liu, Z., Gao, Y., and Zhang, G.: How well can a convection-permitting-modelling improve the simulation of summer precipitation diurnal cycle over the Tibetan Plateau?, Clim. Dynam., 58, 3121–3138, https://doi.org/10.1007/s00382-021-06090-3, 2022.
Lynn, E., Cuthbertson, A., He, M., Vasquez, J. P., Anderson, M. L., Coombe, P., Abatzoglou, J. T., and Hatchett, B. J.: Technical note: Precipitation-phase partitioning at landscape scales to regional scales, Hydrol. Earth Syst. Sci., 24, 5317–5328, https://doi.org/10.5194/hess-24-5317-2020, 2020.
Mahowald, N., Ward, D. S., Kloster, S., Flanner, M. G., Heald, C. L., Heavens, N. G., Hess, P. G., Lamarque, J.-F., and Chuang, P. Y.: Aerosol Impacts on Climate and Biogeochemistry, Annu. Rev. Env. Resour., 36, 45–74, https://doi.org/10.1146/annurev-environ-042009-094507, 2011.
Manoj, M. G., Lee, S.-S., and Li, Z.: Competing aerosol effects in triggering deep convection over the Indian Region, Clim. Dynam., 56, 1815–1835, https://doi.org/10.1007/s00382-020-05561-3, 2021.
Marcq, S., Laj, P., Roger, J. C., Villani, P., Sellegri, K., Bonasoni, P., Marinoni, A., Cristofanelli, P., Verza, G. P., and Bergin, M.: Aerosol optical properties and radiative forcing in the high Himalaya based on measurements at the Nepal Climate Observatory-Pyramid site (5079 m a.s.l.), Atmos. Chem. Phys., 10, 5859–5872, https://doi.org/10.5194/acp-10-5859-2010, 2010.
Matin, M. A., Chitale, V. S., Murthy, M. S. R., Uddin, K., Bajracharya, B., and Pradhan, S.: Understanding forest fire patterns and risk in Nepal using remote sensing, geographic information system and historical fire data, Int. J. Wildland Fire, 26, 276–286, https://doi.org/10.1071/WF16056, 2017.
Morrison, H., Thompson, G., and Tatarskii, V.: Impact of Cloud Microphysics on the Development of Trailing Stratiform Precipitation in a Simulated Squall Line: Comparison of One- and Two-Moment Schemes, Mon. Weather Rev., 137, 991–1007, https://doi.org/10.1175/2008MWR2556.1, 2009.
Mues, A., Lauer, A., Lupascu, A., Rupakheti, M., Kuik, F., and Lawrence, M. G.: WRF and WRF-Chem v3.5.1 simulations of meteorology and black carbon concentrations in the Kathmandu Valley, Geosci. Model Dev., 11, 2067–2091, https://doi.org/10.5194/gmd-11-2067-2018, 2018.
Nair, V. S., Solmon, F., Giorgi, F., Mariotti, L., Babu, S. S., and Moorthy, K. K.: Simulation of South Asian aerosols for regional climate studies, J. Geophys. Res.-Atmos., 117, D04209, https://doi.org/10.1029/2011JD016711, 2012.
Napoli, A., Crespi, A., Ragone, F., Maugeri, M., and Pasquero, C.: Variability of orographic enhancement of precipitation in the Alpine region, Sci. Rep., 9, 13352, https://doi.org/10.1038/s41598-019-49974-5, 2019.
Napoli, A., Desbiolles, F., Parodi, A., and Pasquero, C.: Aerosol indirect effects in complex-orography areas: a numerical study over the Great Alpine Region, Atmos. Chem. Phys., 22, 3901–3909, https://doi.org/10.5194/acp-22-3901-2022, 2022.
National Center for Atmospheric Research (NCAR): Weather Research and Forecasting Model, National Center for Atmospheric Research [code], https://github.com/wrf-model, last access: 1 February 2021.
Palazzi, E., von Hardenberg, J., and Provenzale, A.: Precipitation in the Hindu-Kush Karakoram Himalaya: Observations and future scenarios, J. Geophys. Res.-Atmos., 118, 85–100, https://doi.org/10.1029/2012JD018697, 2013.
Palazzi, E., Filippi, L., and von Hardenberg, J.: Insights into elevation-dependent warming in the Tibetan Plateau-Himalayas from CMIP5 model simulations, Clim. Dynam., 48, 3991–4008, https://doi.org/10.1007/s00382-016-3316-z, 2017.
Parajuli, S. P., Stenchikov, G. L., Ukhov, A., and Kim, H.: Dust Emission Modeling Using a New High-Resolution Dust Source Function in WRF-Chem With Implications for Air Quality, J. Geophys. Res.-Atmos., 124, 10109–10133, https://doi.org/10.1029/2019JD030248, 2019.
Pepin, N., Bradley, R. S., Diaz, H. F., Baraer, M., Caceres, E. B., Forsythe, N., Fowler, H., Greenwood, G., Hashmi, M. Z., Liu, X. D., Miller, J. R., Ning, L., Ohmura, A., Palazzi, E., Rangwala, I., Schöner, W., Severskiy, I., Shahgedanova, M., Wang, M. B., Williamson, S. N., Yang, D. Q., and Mountain Research Initiative EDW Working Group: Elevation-dependent warming in mountain regions of the world, Nat. Clim. Change, 5, 424–430, https://doi.org/10.1038/nclimate2563, 2015.
Pincus, R. and Baker, M. B.: Effect of precipitation on the albedo susceptibility of clouds in the marine boundary layer, Nature, 372, 250–252, https://doi.org/10.1038/372250a0, 1994.
Platnick, S.: MODIS Atmosphere L3 Daily Product, NASA MODIS Adaptive Processing System, Goddard Space Flight Center, USA [data set], https://doi.org/10.5067/MODIS/MOD08_D3.006, 2015.
Prein, A. F. and Heymsfield, A. J.: Increased melting level height impacts surface precipitation phase and intensity, Nat. Clim. Change, 10, 771–776, https://doi.org/10.1038/s41558-020-0825-x, 2020.
Prein, A. F., Langhans, W., Fosser, G., Ferrone, A., Ban, N., Goergen, K., Keller, M., Tölle, M., Gutjahr, O., Feser, F., Brisson, E., Kollet, S., Schmidli, J., Lipzig, N. P. M. van, and Leung, R.: A review on regional convection-permitting climate modeling: Demonstrations, prospects, and challenges, Rev. Geophys., 53, 323–361, https://doi.org/10.1002/2014RG000475, 2015.
Qian, Y., Yasunari, T. J., Doherty, S. J., Flanner, M. G., Lau, W. K. M., Ming, J., Wang, H., Wang, M., Warren, S. G., and Zhang, R.: Light-absorbing particles in snow and ice: Measurement and modeling of climatic and hydrological impact, Adv. Atmos. Sci., 32, 64–91, https://doi.org/10.1007/s00376-014-0010-0, 2015.
Ramanathan, V. and Carmichael, G.: Global and regional climate changes due to black carbon, Nat. Geosci., 1, 221–227, https://doi.org/10.1038/ngeo156, 2008.
Ramanathan, V., Chung, C., Kim, D., Bettge, T., Buja, L., Kiehl, J. T., Washington, W. M., Fu, Q., Sikka, D. R., and Wild, M.: Atmospheric brown clouds: Impacts on South Asian climate and hydrological cycle, P. Natl. Acad. Sci. USA, 102, 5326–5333, https://doi.org/10.1073/pnas.0500656102, 2005.
Rangwala, I. and Miller, J. R.: Climate change in mountains: a review of elevation-dependent warming and its possible causes, Climatic Change, 114, 527–547, https://doi.org/10.1007/s10584-012-0419-3, 2012.
Rangwala, I., Miller, J. R., Russell, G. L., and Xu, M.: Using a global climate model to evaluate the influences of water vapor, snow cover and atmospheric aerosol on warming in the Tibetan Plateau during the twenty-first century, Clim. Dynam., 34, 859–872, https://doi.org/10.1007/s00382-009-0564-1, 2010.
Rosenfeld, D.: TRMM observed first direct evidence of smoke from forest fires inhibiting rainfall, Geophys. Res. Lett., 26, 3105–3108, https://doi.org/10.1029/1999GL006066, 1999.
Rosenfeld, D., Lohmann, U., Raga, G. B., O'Dowd, C. D., Kulmala, M., Fuzzi, S., Reissell, A., and Andreae, M. O.: Flood or Drought: How Do Aerosols Affect Precipitation?, Science, 321, 1309–1313, https://doi.org/10.1126/science.1160606, 2008.
Sadavarte, P., Rupakheti, M., Bhave, P., Shakya, K., and Lawrence, M.: Nepal emission inventory – Part I: Technologies and combustion sources (NEEMI-Tech) for 2001–2016, Atmos. Chem. Phys., 19, 12953–12973, https://doi.org/10.5194/acp-19-12953-2019, 2019.
Sarangi, C., Tripathi, S. N., Tripathi, S., and Barth, M. C.: Aerosol-cloud associations over Gangetic Basin during a typical monsoon depression event using WRF-Chem simulation, J. Geophys. Res.-Atmos., 120, 10974–10995, https://doi.org/10.1002/2015JD023634, 2015.
Sarangi, C., Qian, Y., Rittger, K., Bormann, K. J., Liu, Y., Wang, H., Wan, H., Lin, G., and Painter, T. H.: Impact of light-absorbing particles on snow albedo darkening and associated radiative forcing over high-mountain Asia: high-resolution WRF-Chem modeling and new satellite observations, Atmos. Chem. Phys., 19, 7105–7128, https://doi.org/10.5194/acp-19-7105-2019, 2019.
Shao, T., Liu, Y., Wang, R., Zhu, Q., Tan, Z., and Luo, R.: Role of anthropogenic aerosols in affecting different-grade precipitation over eastern China: A case study, Sci. Total Environ., 807, 150886, https://doi.org/10.1016/j.scitotenv.2021.150886, 2022.
Sharma, S., Chen, Y., Zhou, X., Yang, K., Li, X., Niu, X., Hu, X., and Khadka, N.: Evaluation of GPM-Era Satellite Precipitation Products on the Southern Slopes of the Central Himalayas Against Rain Gauge Data, Remote Sens., 12, 1836, https://doi.org/10.3390/rs12111836, 2020a.
Sharma, S., Khadka, N., Hamal, K., Shrestha, D., Talchabhadel, R., and Chen, Y.: How Accurately Can Satellite Products (TMPA and IMERG) Detect Precipitation Patterns, Extremities, and Drought Across the Nepalese Himalaya?, Earth and Space Science, 7, e2020EA001315, https://doi.org/10.1029/2020EA001315, 2020b.
Shige, S. and Kummerow, C. D.: Precipitation-Top Heights of Heavy Orographic Rainfall in the Asian Monsoon Region, J. Atmos. Sci., 73, 3009–3024, https://doi.org/10.1175/JAS-D-15-0271.1, 2016.
Sicard, P., Crippa, P., De Marco, A., Castruccio, S., Giani, P., Cuesta, J., Paoletti, E., Feng, Z., and Anav, A.: High spatial resolution WRF-Chem model over Asia: Physics and chemistry evaluation, Atmos. Environ., 244, 118004, https://doi.org/10.1016/j.atmosenv.2020.118004, 2021.
Sijikumar, S., Aneesh, S., and Rajeev, K.: Multi-year model simulations of mineral dust distribution and transport over the Indian subcontinent during summer monsoon seasons, Meteorol. Atmos. Phys., 128, 453–464, https://doi.org/10.1007/s00703-015-0422-0, 2016.
Soni, P., Tripathi, S. N., and Srivastava, R.: Radiative effects of black carbon aerosols on Indian monsoon: a study using WRF-Chem model, Theor. Appl. Climatol., 132, 115–134, https://doi.org/10.1007/s00704-017-2057-1, 2018.
Talchabhadel, R., Karki, R., and Parajuli, B.: Intercomparison of precipitation measured between automatic and manual precipitation gauge in Nepal, Measurement, 106, 264–273, https://doi.org/10.1016/j.measurement.2016.06.047, 2017.
Terao, T., Islam, Md. N., Hayashi, T., and Oka, T.: Nocturnal jet and its effects on early morning rainfall peak over northeastern Bangladesh during the summer monsoon season, Geophys. Res. Lett., 33, L18806, https://doi.org/10.1029/2006GL026156, 2006.
Tewari, M., Chen, F., Wang, W., Dudhia, J., LeMone, M. A., Mitchell, K., Ek, M., Gayno, G., Wegiel, J., and Cuenca, R. H.: Implementation and verification of the unified NOAH land surface model in the WRF model, 20th conference on weather analysis and forecasting/16th conference on numerical weather prediction, Seattle, WA, USA, 14 January 2004, 1115, 2165–2170, 2004.
Twomey, S.: The Influence of Pollution on the Shortwave Albedo of Clouds, J. Atmos. Sci., 34, 1149–1152, https://doi.org/10.1175/1520-0469(1977)034<1149:TIOPOT>2.0.CO;2, 1977.
Vernier, J.-P., Thomason, L. W., and Kar, J.: CALIPSO detection of an Asian tropopause aerosol layer, Geophys. Res. Lett., 38, L07804, https://doi.org/10.1029/2010GL046614, 2011.
Wang, S., Zhang, M., Pepin, N. C., Li, Z., Sun, M., Huang, X., and Wang, Q.: Recent changes in freezing level heights in High Asia and their impact on glacier changes, J. Geophys. Res.-Atmos., 119, 1753–1765, https://doi.org/10.1002/2013JD020490, 2014.
Wiedinmyer, C., Akagi, S. K., Yokelson, R. J., Emmons, L. K., Al-Saadi, J. A., Orlando, J. J., and Soja, A. J.: The Fire INventory from NCAR (FINN): a high resolution global model to estimate the emissions from open burning, Geosci. Model Dev., 4, 625–641, https://doi.org/10.5194/gmd-4-625-2011, 2011.
Wu, L., Su, H., and Jiang, J. H.: Regional simulation of aerosol impacts on precipitation during the East Asian summer monsoon, J. Geophys. Res.-Atmos., 118, 6454–6467, https://doi.org/10.1002/jgrd.50527, 2013.
Wu, L., Gu, Y., Jiang, J. H., Su, H., Yu, N., Zhao, C., Qian, Y., Zhao, B., Liou, K.-N., and Choi, Y.-S.: Impacts of aerosols on seasonal precipitation and snowpack in California based on convection-permitting WRF-Chem simulations, Atmos. Chem. Phys., 18, 5529–5547, https://doi.org/10.5194/acp-18-5529-2018, 2018.
Yang, Q., W. I. Gustafson Jr., Fast, J. D., Wang, H., Easter, R. C., Morrison, H., Lee, Y.-N., Chapman, E. G., Spak, S. N., and Mena-Carrasco, M. A.: Assessing regional scale predictions of aerosols, marine stratocumulus, and their interactions during VOCALS-REx using WRF-Chem, Atmos. Chem. Phys., 11, 11951–11975, https://doi.org/10.5194/acp-11-11951-2011, 2011.
Zaveri, R. A. and Peters, L. K.: A new lumped structure photochemical mechanism for large-scale applications, J. Geophys. Res.-Atmos., 104, 30387–30415, https://doi.org/10.1029/1999JD900876, 1999.
Zaveri, R. A., Easter, R. C., Fast, J. D., and Peters, L. K.: Model for Simulating Aerosol Interactions and Chemistry (MOSAIC), J. Geophys. Res.-Atmos., 113, D13204, https://doi.org/10.1029/2007JD008782, 2008.
Zhang, Y. and Guo, Y.: Variability of atmospheric freezing-level height and its impact on the cryosphere in China, Ann. Glaciol., 52, 81–88, https://doi.org/10.3189/172756411797252095, 2011.
Zhang, Y., Fan, J., Li, Z., and Rosenfeld, D.: Impacts of cloud microphysics parameterizations on simulated aerosol–cloud interactions for deep convective clouds over Houston, Atmos. Chem. Phys., 21, 2363–2381, https://doi.org/10.5194/acp-21-2363-2021, 2021.
Zhao, C., Chen, S., Leung, L. R., Qian, Y., Kok, J. F., Zaveri, R. A., and Huang, J.: Uncertainty in modeling dust mass balance and radiative forcing from size parameterization, Atmos. Chem. Phys., 13, 10733–10753, https://doi.org/10.5194/acp-13-10733-2013, 2013.
Zhao, C., Hu, Z., Qian, Y., Ruby Leung, L., Huang, J., Huang, M., Jin, J., Flanner, M. G., Zhang, R., Wang, H., Yan, H., Lu, Z., and Streets, D. G.: Simulating black carbon and dust and their radiative forcing in seasonal snow: a case study over North China with field campaign measurements, Atmos. Chem. Phys., 14, 11475–11491, https://doi.org/10.5194/acp-14-11475-2014, 2014.