the Creative Commons Attribution 4.0 License.
the Creative Commons Attribution 4.0 License.
 | 11 Sep 2023
Impact of 2020 COVID-19 lockdowns on particulate air pollution across Europe
Jean-Philippe Putaud
Enrico Pisoni
Alexander Mangold
Christoph Hueglin
Jean Sciare
Michael Pikridas
Chrysanthos Savvides
Jakub Ondracek
Saliou Mbengue
Alfred Wiedensohler
Kay Weinhold
Maik Merkel
Laurent Poulain
Dominik van Pinxteren
Hartmut Herrmann
Andreas Massling
Claus Nordstroem
Andrés Alastuey
Cristina Reche
Noemí Pérez
Sonia Castillo
Mar Sorribas
Jose Antonio Adame
Tuukka Petaja
Katrianne Lehtipalo
Jarkko Niemi
Véronique Riffault
Joel F. de Brito
Augustin Colette
Olivier Favez
Jean-Eudes Petit
Valérie Gros
Maria I. Gini
Stergios Vratolis
Konstantinos Eleftheriadis
Evangelia Diapouli
Hugo Denier van der Gon
Karl Espen Yttri
Wenche Aas
To fight against the first wave of coronavirus disease 2019 (COVID-19) in 2020, lockdown measures were implemented in most European countries. These lockdowns had well-documented effects on human mobility. We assessed the impact of the lockdown implementation and relaxation on air pollution by comparing daily particulate matter (PM), nitrogen dioxide (NO2) and ozone (O3) concentrations, as well as particle number size distributions (PNSDs) and particle light absorption coefficient in situ measurement data, with values that would have been expected if no COVID-19 epidemic had occurred at 28 sites across Europe for the period 17 February–31 May 2020. Expected PM, NO2 and O3 concentrations were calculated from the 2020 Copernicus Atmosphere Monitoring Service (CAMS) ensemble forecasts, combined with 2019 CAMS ensemble forecasts and measurement data. On average, lockdown implementations did not lead to a decrease in PM2.5 mass concentrations at urban sites, while relaxations resulted in a +26 ± 21 % rebound. The impacts of lockdown implementation and relaxation on NO2 concentrations were more consistent (−29 ± 17 and +31 ± 30 %, respectively). The implementation of the lockdown measures also induced statistically significant increases in O3 concentrations at half of all sites (+13 % on average). An enhanced oxidising capacity of the atmosphere could have boosted the production of secondary aerosol at those places. By comparison with 2017–2019 measurement data, a significant change in the relative contributions of wood and fossil fuel burning to the concentration of black carbon during the lockdown was detected at 7 out of 14 sites. The contribution of particles smaller than 70 nm to the total number of particles significantly also changed at most of the urban sites, with a mean decrease of −7 ± 5 % coinciding with the lockdown implementation. Our study shows that the response of PM2.5 and PM10 mass concentrations to lockdown measures was not systematic at various sites across Europe for multiple reasons, the relationship between road traffic intensity and particulate air pollution being more complex than expected.
- Article
(3245 KB) - Full-text XML
-
Supplement
(1207 KB) - BibTeX
- EndNote


The first case of COVID-19 (coronavirus disease 2019) in Europe was identified in Italy on 21 February 2020, although recent evidence suggests that the virus had already spread across northern Italy by mid-January (Cerqua and Di Stefano, 2022). National authorities took measures to limit the epidemic's propagation across Europe, and lockdown measures entered into force in various countries from March 2020. These measures led to dramatic decreases in activities such as road traffic (IEA, 2020), and large reductions in air pollutant emissions from these pollution sources were expected. Shortly after the first lockdown measures were implemented, numerous articles unsurprisingly reported on marked improvements in air quality across Europe (see examples in Putaud et al., 2021). These statements were mostly based on simple comparisons between 2020 and previous-year data obtained from remote sensing or in situ observations. Nonetheless, it was quickly shown that the impacts of the lockdown measures on air pollution were quite complex and could not be assessed without implementing sufficiently developed methodologies (Copernicus, 2020; Kroll et al., 2020; Shi et al., 2021; see also quotations in Schiermeier, 2020), including “deweathering” techniques (e.g. Goldberg et al., 2020; Petetin et al., 2020; Venter et al., 2020; Grange et al., 2021; Petit et al., 2021), modelling (Hammer et al., 2021; Yang et al., 2021), or combinations of model and measurement data (Le et al., 2020; Barré et al., 2021; Beloconi et al., 2021; Jiang et al., 2021). The latter were also applied by Putaud et al. (2021) to northern Italy, one of the most polluted areas in Europe and where the first major COVID-19 outbreak occurred in Europe. That work is extended here to about 30 urban and regional background sites across Europe, for which daily in situ measurement data from February to May 2020 are compared to expected data (as if no COVID-19 epidemics had occurred) across the same period. The objectives of this work were (i) to determine the impact of the lockdown measures on particulate air pollution at urban and regional background sites across Europe; (ii) to discuss our findings after assessing the impact of the lockdown measures on key gaseous pollutants, on the aerosol light absorption spectrum and on the shape of particle number size distributions (PNSDs); and (iii) to study the relationship between these impacts and changes in human mobility during lockdowns across Europe. The consequences of the lockdown measures could give an indication of the impact of future car exhaust emission reductions on air pollution across Europe.
This study focuses on the COVID-19 lockdowns that occurred across Europe in spring 2020. For the sake of clarity, the same three periods were considered for all countries: a 3-week period before lockdowns were implemented (A, “ante”, 17 February–8 March 2020), a 6-week period for which mobility was minimal across Europe (D, “during”, 23 March–3 May 2020), and a 3-week period during which lockdown measures were partially or totally relaxed (P, “post”, 11–31 May 2020). Therefore, the 2-week period 9–22 March is excluded from the analysis because lockdown measures were unevenly implemented across Europe at this time. Levels of stringency during periods A, D and P in the various countries are discussed in Sect. 3.1 on the basis of mobility data.
Measurements of particulate matter (PM10 and PM2.5), nitrogen dioxide (NO2) and ozone (O3) surface level concentrations from 16 urban sites and 12 regional background sites located in 13 countries across Europe were examined for the three periods A, D and P. Measurement data from the same periods in 2019, together with model outputs for the same periods in both 2019 and 2020, were used to estimate the expected pollutant concentrations that would have occurred in 2020 if no lockdown measures had been applied. The potential impact of weather conditions on pollutant concentrations was therefore taken into account.
In addition to PM mass concentrations, two other variables characterising particulate air pollution were studied at 13 sites: (i) the absorption Ångström exponent (AÅE), which describes the wavelength dependence of the particle light absorption coefficient and reflects the relative contributions of fossil fuel burning and wood burning to the atmospheric concentration of black carbon (Helin et al., 2021, and references therein), and (ii) the contribution of “small” particles (Nsmall) to the “total” number of particles (Ntot), as a proxy for primary particle emissions. Indeed, vehicle tailpipe emissions have been shown to be dominated by particles whose mobility diameters (Dp) range between 15 and 70 nm (Giechaskiel et al., 2020; Garbariene et al., 2021). Wood combustion particle diameters are highly dependent on the combustion conditions. Particles with Dp < 70 nm can also be emitted by wood burners (Hueglin et al., 1997). The growth of new particles produced during nucleation events also leads to particles in this size range. The number of particles in the size range 15–70 nm shall therefore be considered an upper limit for the number of primary particles. Both the AÅE and are intensive variables; i.e. they are not directly dependent on pollution dispersion and therefore are much less sensitive than pollutant concentrations to weather conditions.
2.1 Mobility data
We could not find any statistical data whose time resolution was good enough (i.e. weekly or better) to assess lockdown impacts on human activities in a consistent way across all 13 countries considered in this study. Therefore, we focused on mobility data as proxies for lockdowns' stringencies. Driving route request data at city and regional scales temporarily made available by Apple® (Fig. S1 in the Supplement) at https://covid19.apple.com/mobility (last access: 21 March 2022) were used as an indicator of road traffic intensity for all sites, except those in Cyprus for which such data were not available.
To assess the relationship between Apple® driving route request data and the actual number of vehicle kilometres driven, monthly motor fuel consumption from Eurostat (https://ec.europa.eu/eurostat, last access: 21 March 2022) and Avenergy Suisse (https://www.avenergy.ch, last access: 21 March 2022) from January to May 2020 was used. For Cyprus, monthly activity data from the national statistical service CYSTAT (https://www.cystat.gov.cy, last access: 21 March 2022) were used.
2.2 Measurement sites
The 28 air pollution measurement sites considered in this study are shown in Fig. 1. Details are listed in Table 1 where sites are sorted from north to south. Twenty-four of these sites constitute twin sites – one urban site and one regional background site in the same area (< 200 km).
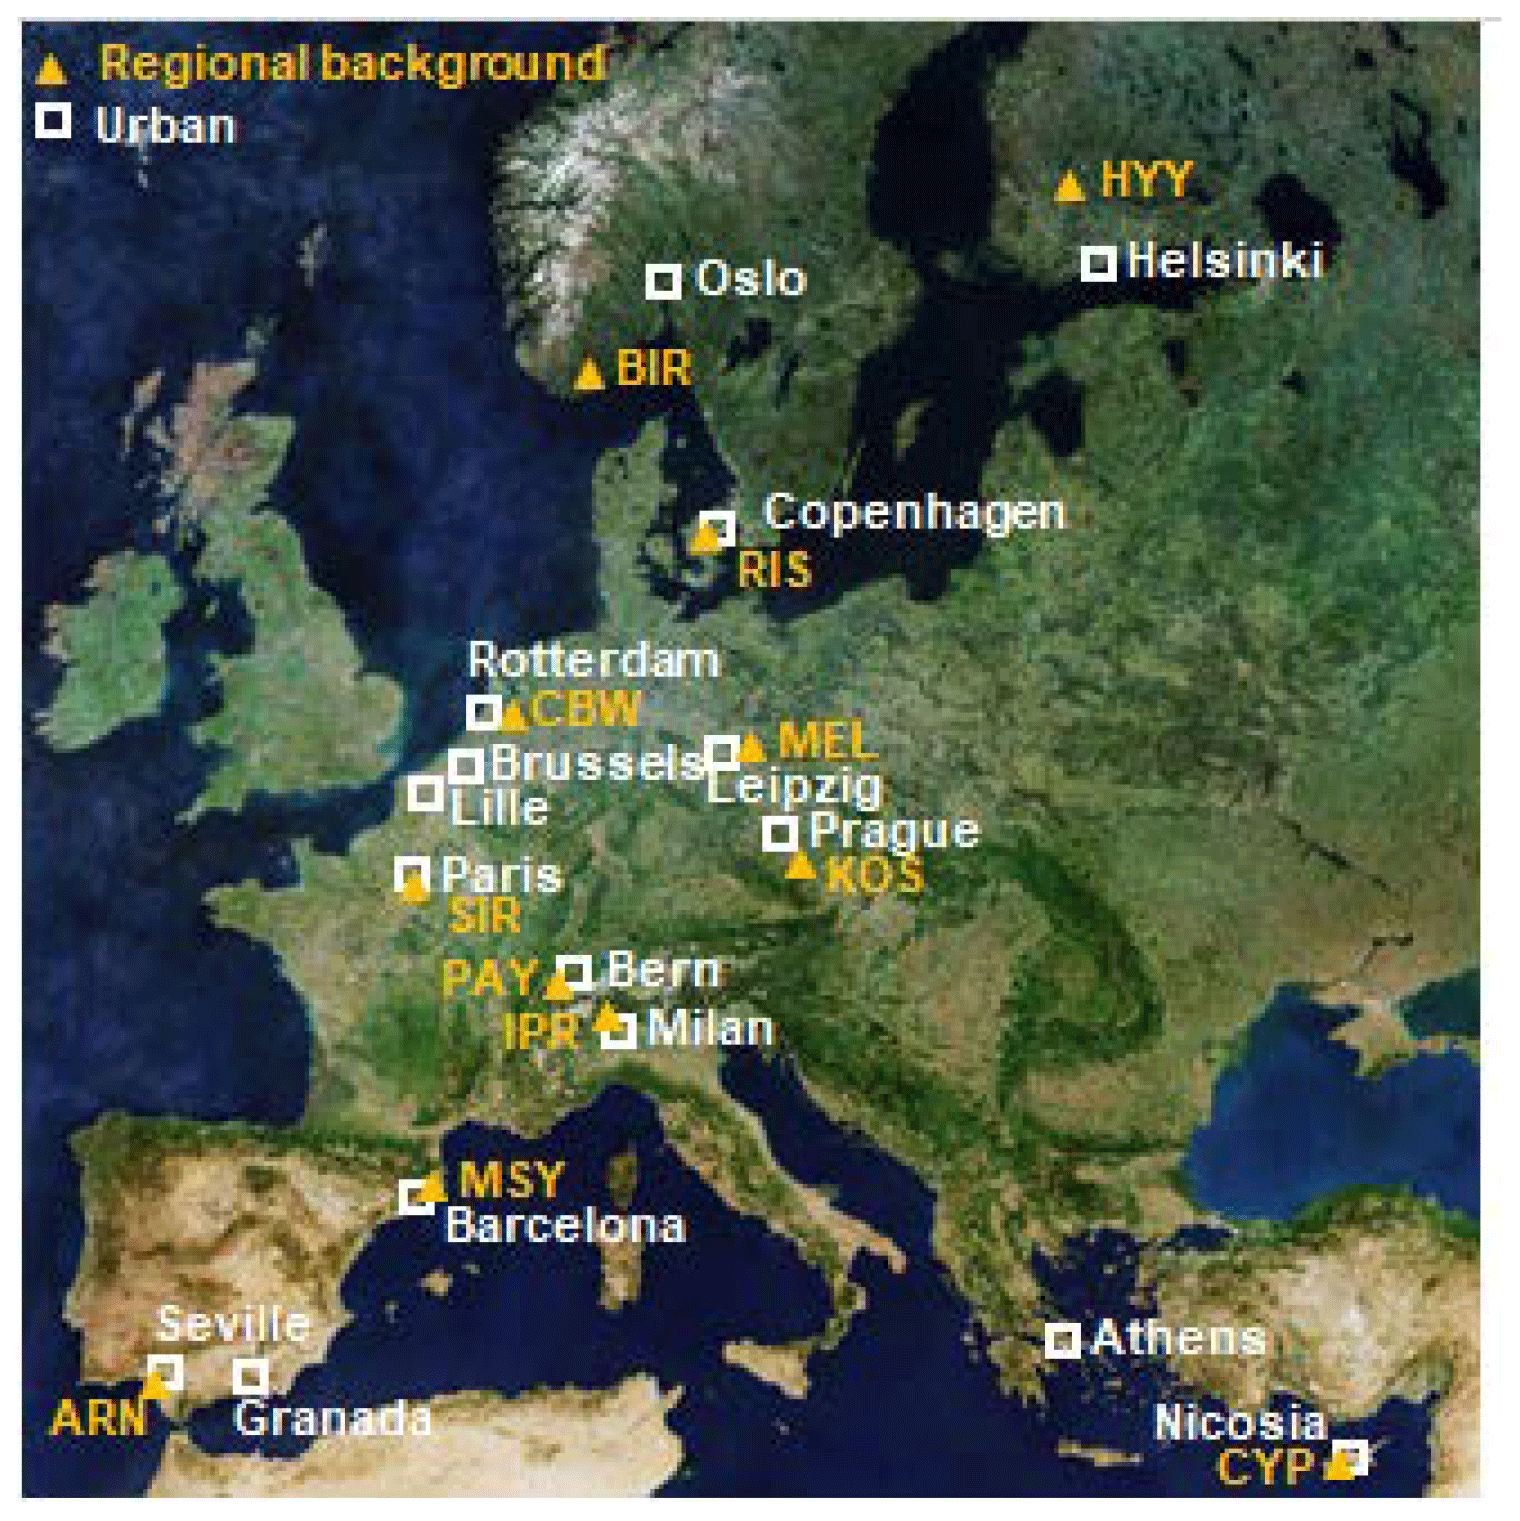
Figure 1Location of the 28 sites across Europe (map background from ESA).
Table 1Measurement site details.
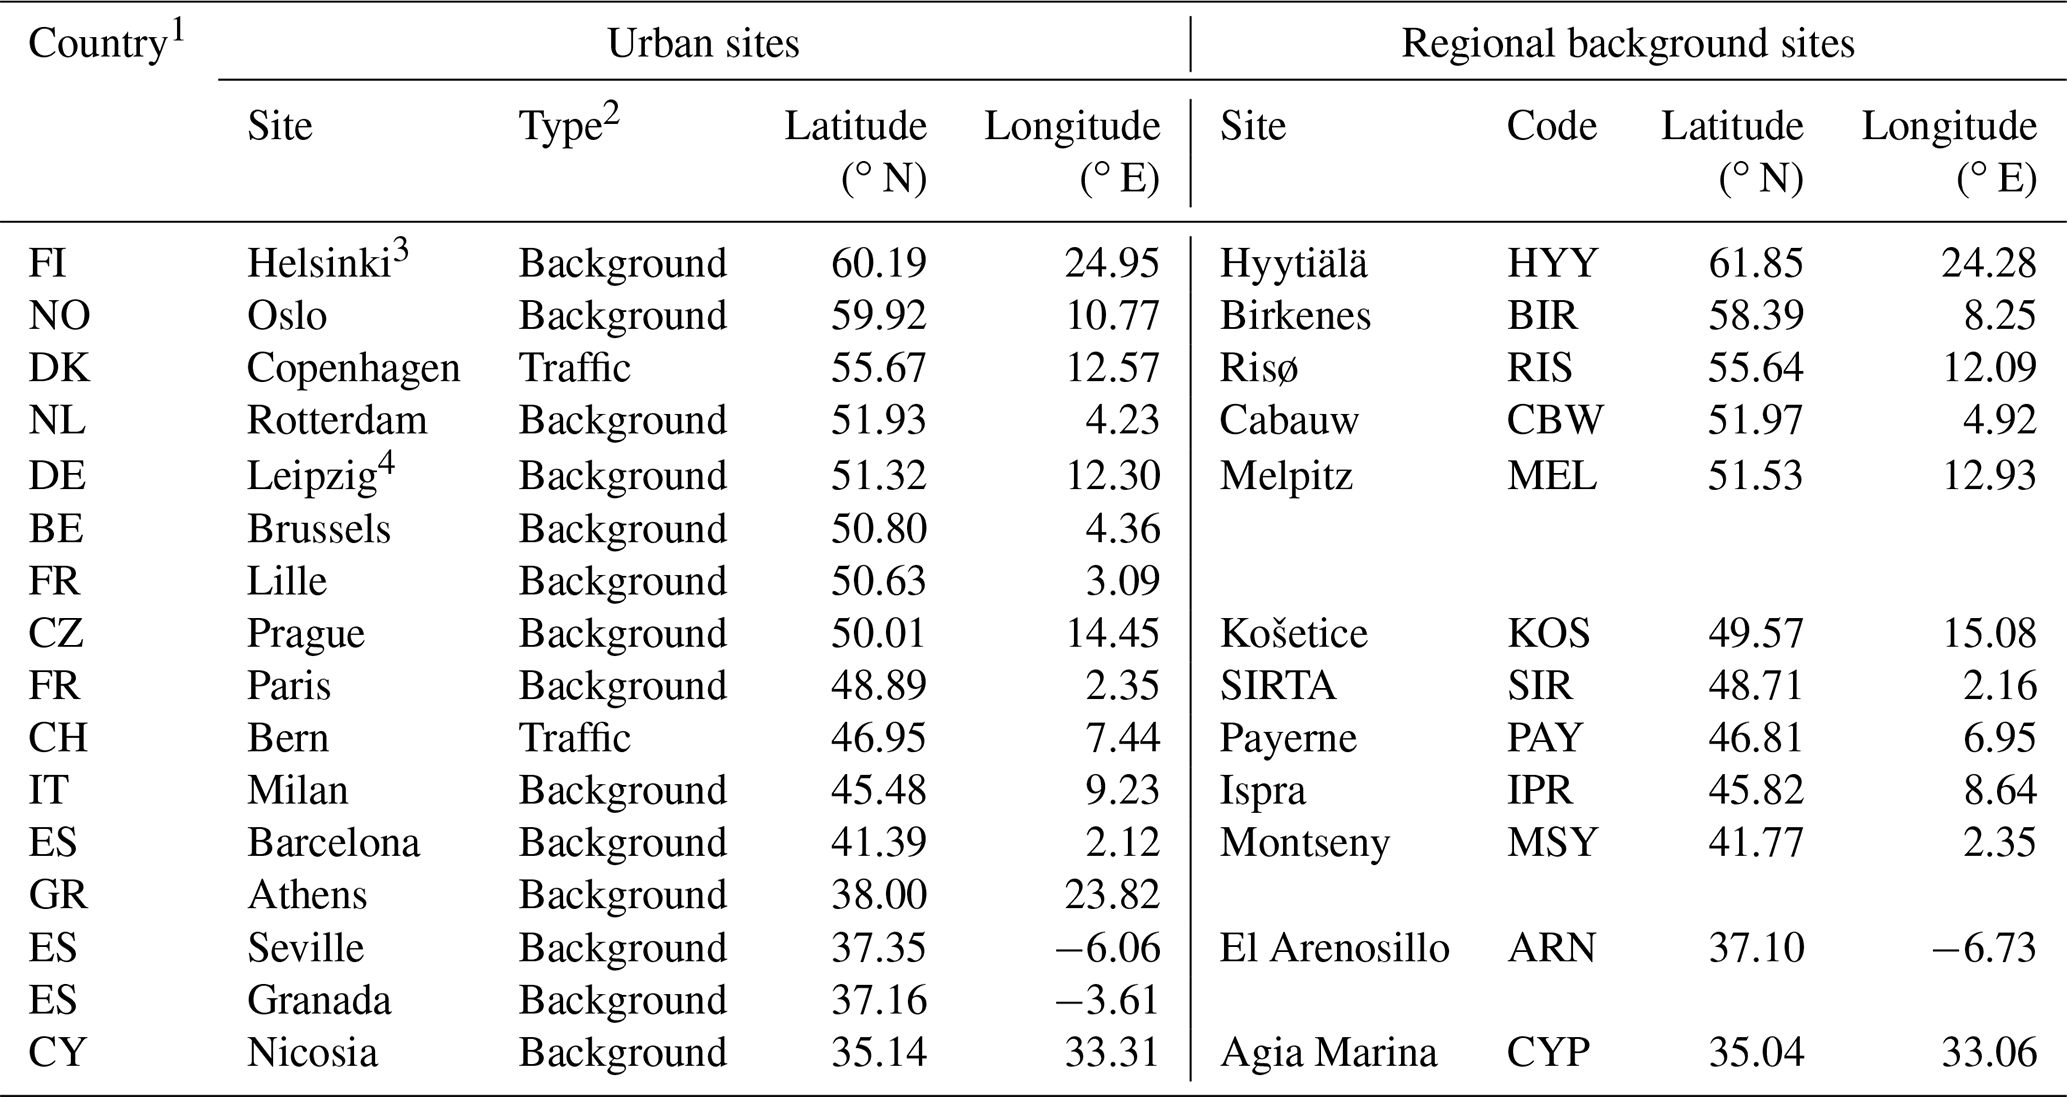
1 Country codes used here and throughout the text denote the following: FI, Finland; NO, Norway; DK, Denmark; NL, the Netherlands; DE, Germany; BE, Belgium; FR, France; CZ, the Czech Republic; CH, Switzerland; IT, Italy; ES, Spain; GR, Greece; and CY, Cyprus.
2 “Background” and “Traffic” stand for “urban background” and
“traffic” sites, respectively.
3 Helsinki PNSD data are from the University of Helsinki science campus
area located at 60.20∘ N, 24.96∘ E.
4 Leipzig PNSD data are from the Leipzig Science Park area located at
51.35∘ N, 12.43∘ E.
2.3 Model data
We used CAMS (Copernicus Atmosphere Monitoring Service) ensemble forecasts for PM10, PM2.5, NO2 and O3 daily surface level mass concentrations calculated as the median of the concentrations computed independently by nine different regional air quality models (Marécal et al., 2015), namely CHIMERE, DEHM, EMEP, EURAD-IM, GEM-AQ, LOTOS-EUROS, MATCH, MOCAGE and SILAM. Each model is based on different schemes describing the formation, dispersion and deposition of reactive gases and particles but uses the same meteorological fields from the ECMWF (European Centre for Medium-Range Weather Forecasts) Integrated Forecasting System and the same pollutant emission data derived from officially reported emissions for previous years, therefore ignoring any potential lockdown effect (Denier van der Gon et al., 2015; Kuenen et al., 2022). The outputs of the nine individual models are interpolated on a common regular 0.1∘ × 0.1∘ latitude × longitude grid (about 10 km × 10 km) on 10 vertical levels from the surface layer (0–40 m) up to about 5 km altitude over Europe (defined as 25∘ W–45∘ E, 30–72∘ N). Median values have low sensitivity to outliers (Riccio et al., 2007), and model ensembles are expected to yield better estimates than individual models (Galmarini et al., 2018).
2.4 Measurement data
PM10, PM2.5, NO2 and O3 measurement data from urban sites in 2019 and 2020 were collected from local air quality monitoring networks, except for Athens, for which PM and NO2 data originated from the ACTRIS (Aerosol, Clouds and Trace gases Research Infrastructure) observatory operated by the National Centre for Scientific Research “Demokritos”. Measurement data from regional background sites were also all produced by ACTRIS observatories operated by research performing organisations or EMEP (co-operative programme for monitoring and evaluation of the long-range transmission of air pollutants in Europe) monitoring sites and were provided by the ACTRIS Data Centre. Pollutant concentrations were measured from 3 to 9 m above the ground with methods listed in Tables S1 and S2.
PNSD and particle light absorption data from 2017 to 2020 originated from the authors' organisations. Data from ACTRIS sites were provided by the ACTRIS Data Centre, and data from other sites were specifically made available for this work. PNSD and particle light absorption coefficients were determined using instruments listed in Table S3.
2.5 Data analysis
Data were analysed as in Putaud et al. (2021). Briefly, 2020 expected daily concentrations (Exp2020) were estimated from 2020 CAMS ensemble daily forecasts (CAMS2020) and the ratio between 2019 daily observations (Obs2019) and 2019 CAMS ensemble daily forecasts (CAMS2019) according to Eq. (1):
CAMS ensemble forecasts for 2020 account for actual meteorological conditions and seasonal changes in emission source strengths, ignoring lockdown measures. The ratio Obs represents the time-dependent normalisation of CAMS forecasts to the observations performed at each measurement site, as estimated from 2019 data. Applying this normalisation factor to CAMS 2020 forecasts aims at correcting for the bias between CAMS forecasts and observation data, which can vary across the year. It should be noted that only sites for which forecasts and observations reasonably agreed (R2≥ 0.5) across February–May 2019 were considered in this study (see Table S4). Obviously, expected concentrations (Exp2020) cannot be compared to observations (Obs2020) on a daily basis, since Exp2020 values are affected by random variations in the daily Obs ratio. Instead, mean Obs ratios were compared for the three periods A (before lockdowns), D (during lockdowns) and P (after lockdowns), as defined in Sect. 2. The statistical significance of the difference in Obs ratios between the three time periods A, D and P was assessed by applying a two-sided t test to the averages , and , defined as
The null hypotheses ( and ) were tested at 95% confidence assuming unequal variances.
The mean Obs ratios plotted and discussed below were calculated as
Particle light absorption Ångström exponent (AÅE) values were calculated as the slope of the linear regression between the logarithm of the particle light absorption coefficients and the logarithm of the wavelengths (WLs) of the light sources used in the multi-wavelength absorption photometers across the whole WL range available below 900 nm. WL ranges were different across the various sites (Table S3) but constant at each site. AÅE values were calculated across the ultraviolet–near-infrared range (370–880 nm) for the urban sites in Lille (FR), Bern (CH), Athens (GR) and Nicosia (CY) and the regional background sites SIR (FR), PAY (CH), IPR (IT) and MSY (ES). At Brussels (BE), measurements were available at 370 and 660 nm, and at ARN (ES), HYY (FI) and KOS (CZ), they were available in the visible range (470–660 nm) only.
The ratio of the number of small particles (Nsmall) to the total number of particles (Ntot) was calculated from PNSD measurements. Nsmall was calculated by integrating PNSD from 15 to 70 nm at all sites, except Copenhagen and RIS (DK), for which the PNSD lower bound was 41 nm. Ntot was calculated by integrating PNSDs from 15 nm to the upper bound of the distribution at all sites except both sites in Denmark (41 nm). The upper bound was 800 nm at most but not all sites (Table S3) and was constant at each site across the time period 2017–2020.
Particle light absorption coefficients and PNSDs are not computed by the CAMS model. Therefore, 2017–2019 measurement data were used to calculate the expected values of the absorption Ångström exponent (AÅE) and the contribution of small particles to the total particle number concentration () for sites at which measurements were available for at least 2 years between 2017 and 2019 across the studied period (17 February–31 May). Both being intensive variables (i.e. intrinsic aerosol properties), these variables are much less sensitive to weather conditions than, for example, atmospheric concentrations. Daily values expected for 2020 (Exp2020) were calculated as the average of 2017–2019 data, and lockdowns' impacts were assessed comparing the arithmetic means of Obs (, and ) for the three time periods A, D and P, as described above.
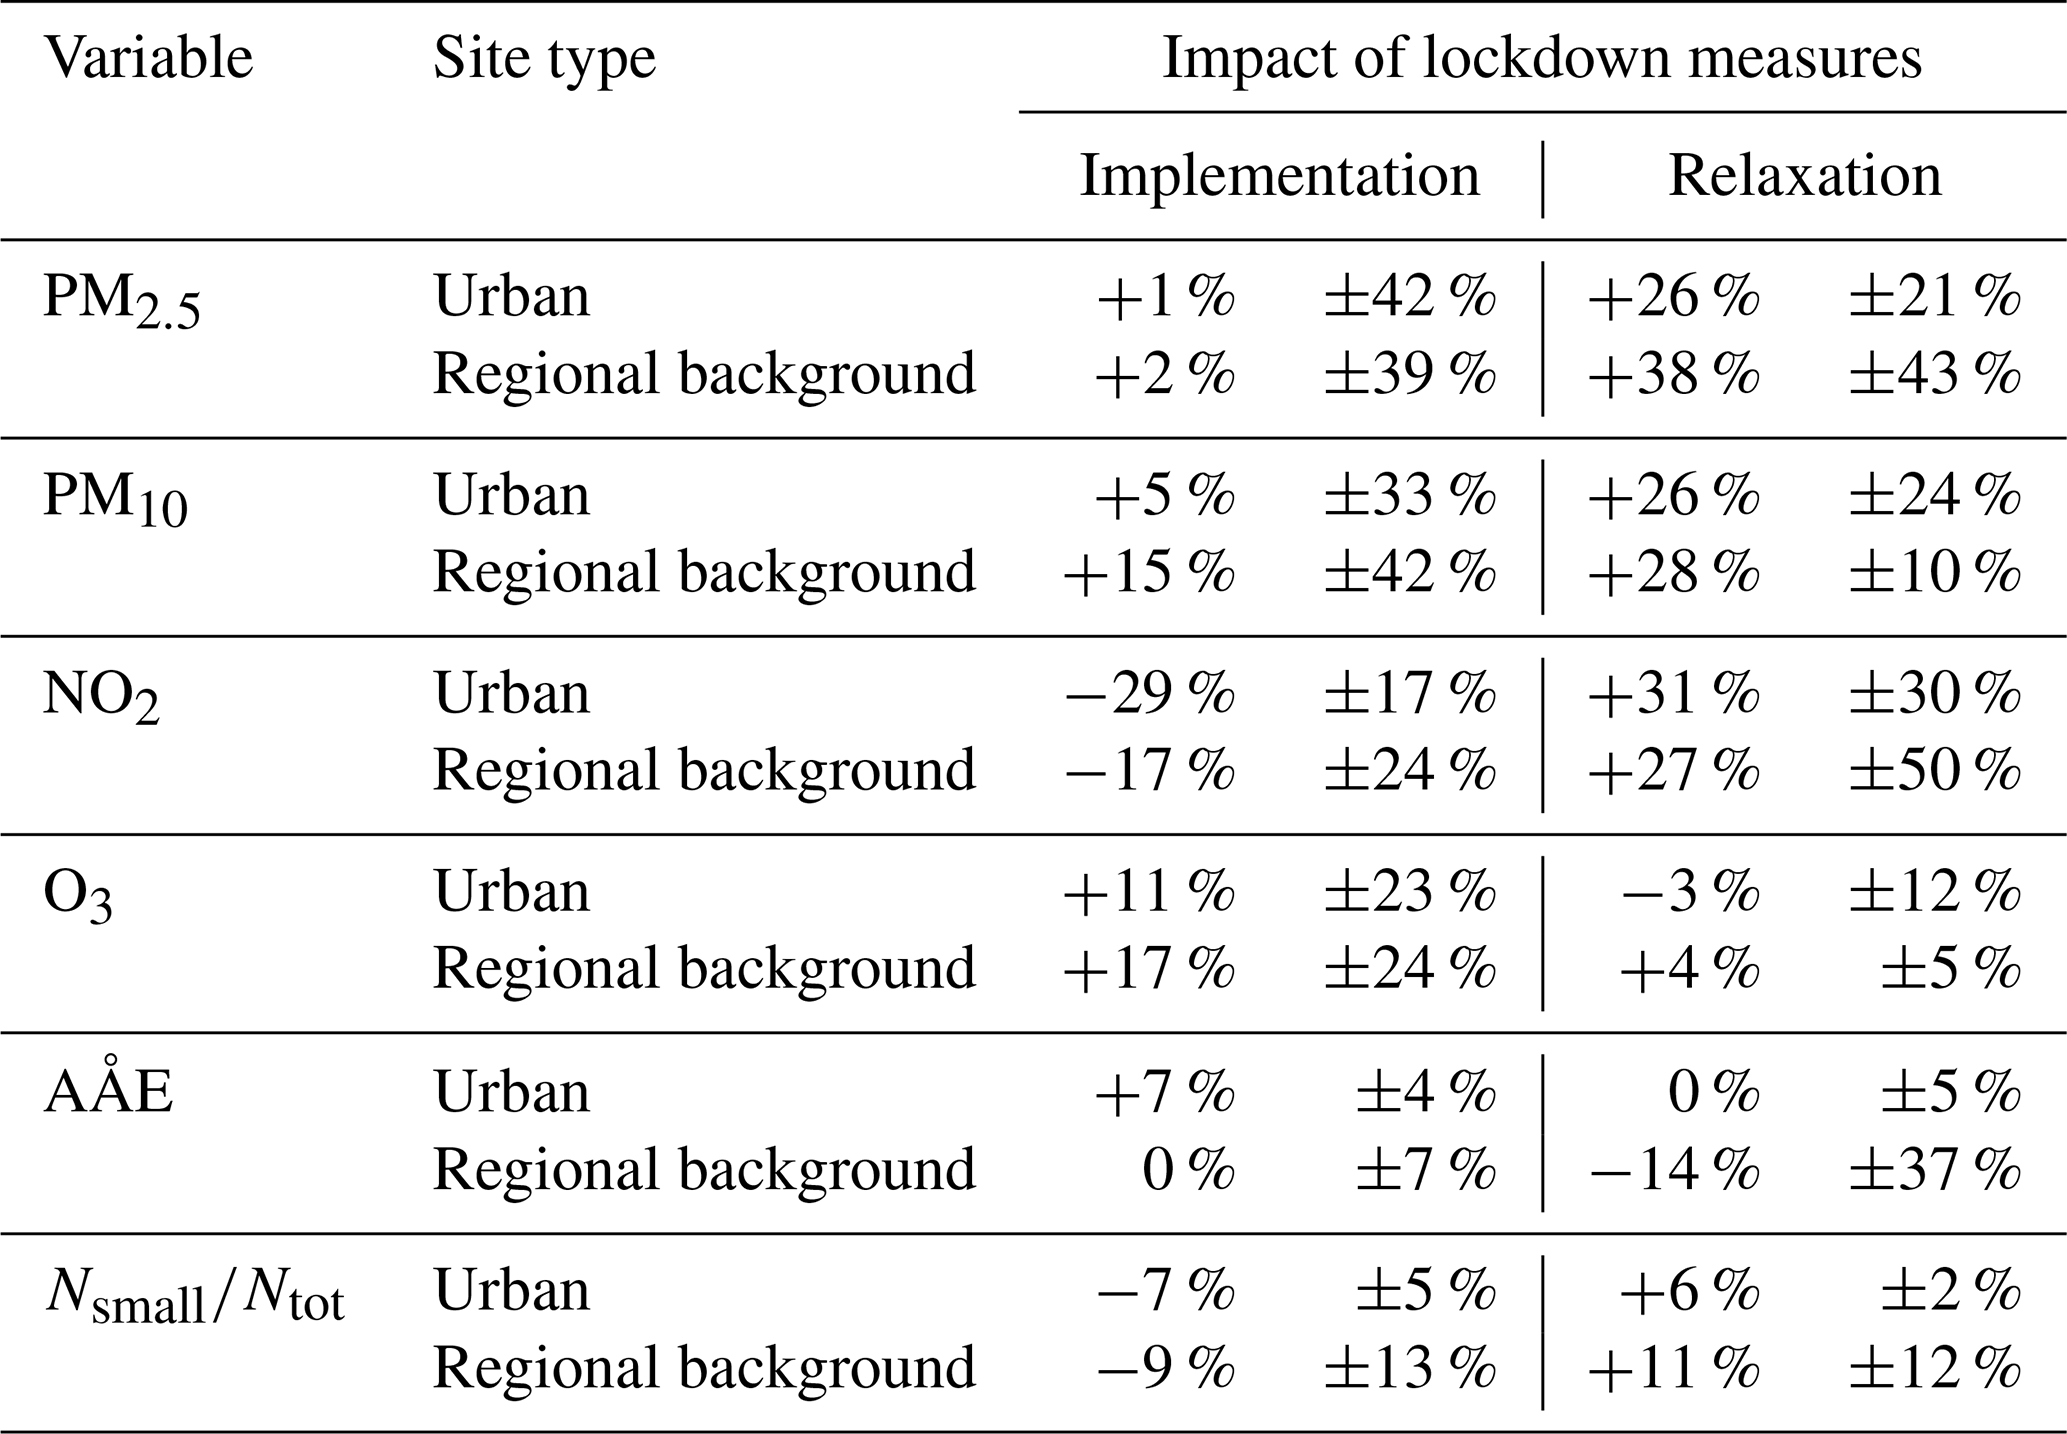
The mean impacts of the lockdown implementation and relaxation discussed below and listed in Table 2 were calculated for each variable as
where indices represent the sites considered for each variable. Mean impacts were expressed as percentages (%).
Table 2Mean impacts of the lockdown measures' implementation and relaxation (%) as computed from the 2020 observed expected ratios shown in Figs. 2 to 8.
3.1 Impact of lockdown measures on road traffic intensity
Biases in traffic intensity estimates derived from mobility data have been reported in business-as-usual conditions (Meppelink et al., 2020). However, data relative to the lockdown period in the USA have highlighted a clear covariation between Apple® mobility data and gasoline demand (Ou et al., 2020), which is in turn a robust indicator for the cumulative distance covered by cars. We compared monthly mean motor fuel consumptions and Apple® driving direction requests for the 12 countries of this study for which data were available. Table S5 shows that gasoline national consumptions are generally well correlated with country mean driving direction requests across January–May 2020, while diesel consumptions are anti-correlated or not significantly correlated with driving direction requests in all countries but 3 (FR, IT, ES). This suggests that Apple® driving direction requests are good qualitative proxies for personal car traffic but not for commercial (diesel-powered) vehicular traffic. This is confirmed by data from Athens, for which a reduction between A and D of up to 70 % and 40 % in light-duty-vehicle and heavy-duty-vehicle traffic, respectively, was reported (Eleftheriadis et al., 2021), which can be compared with a −73 % decrease in driving route requests. However, changes in gasoline consumption were smaller everywhere than the variations in Apple® driving route requests (range 38 %–88 %, average 59 %), as shown in Table S5.
For the set of cities where urban measurement sites were located, the Apple® mobility data show that driving route requests dropped by −31 % (Helsinki) to −90 % (Seville) between periods A and D and increased again by +40 % (Helsinki) to +270 % (Paris) between periods D and P (Fig. 2). The data recorded in the areas surrounding the regional background sites and/or the urban sites show similar variations, except in the Vysočina region (central Czech Republic), where driving route request numbers (−27 %) fell much less than in Prague (−60 %) and reached their pre-lockdown value again (period A) when lockdown measures were relaxed (period P).
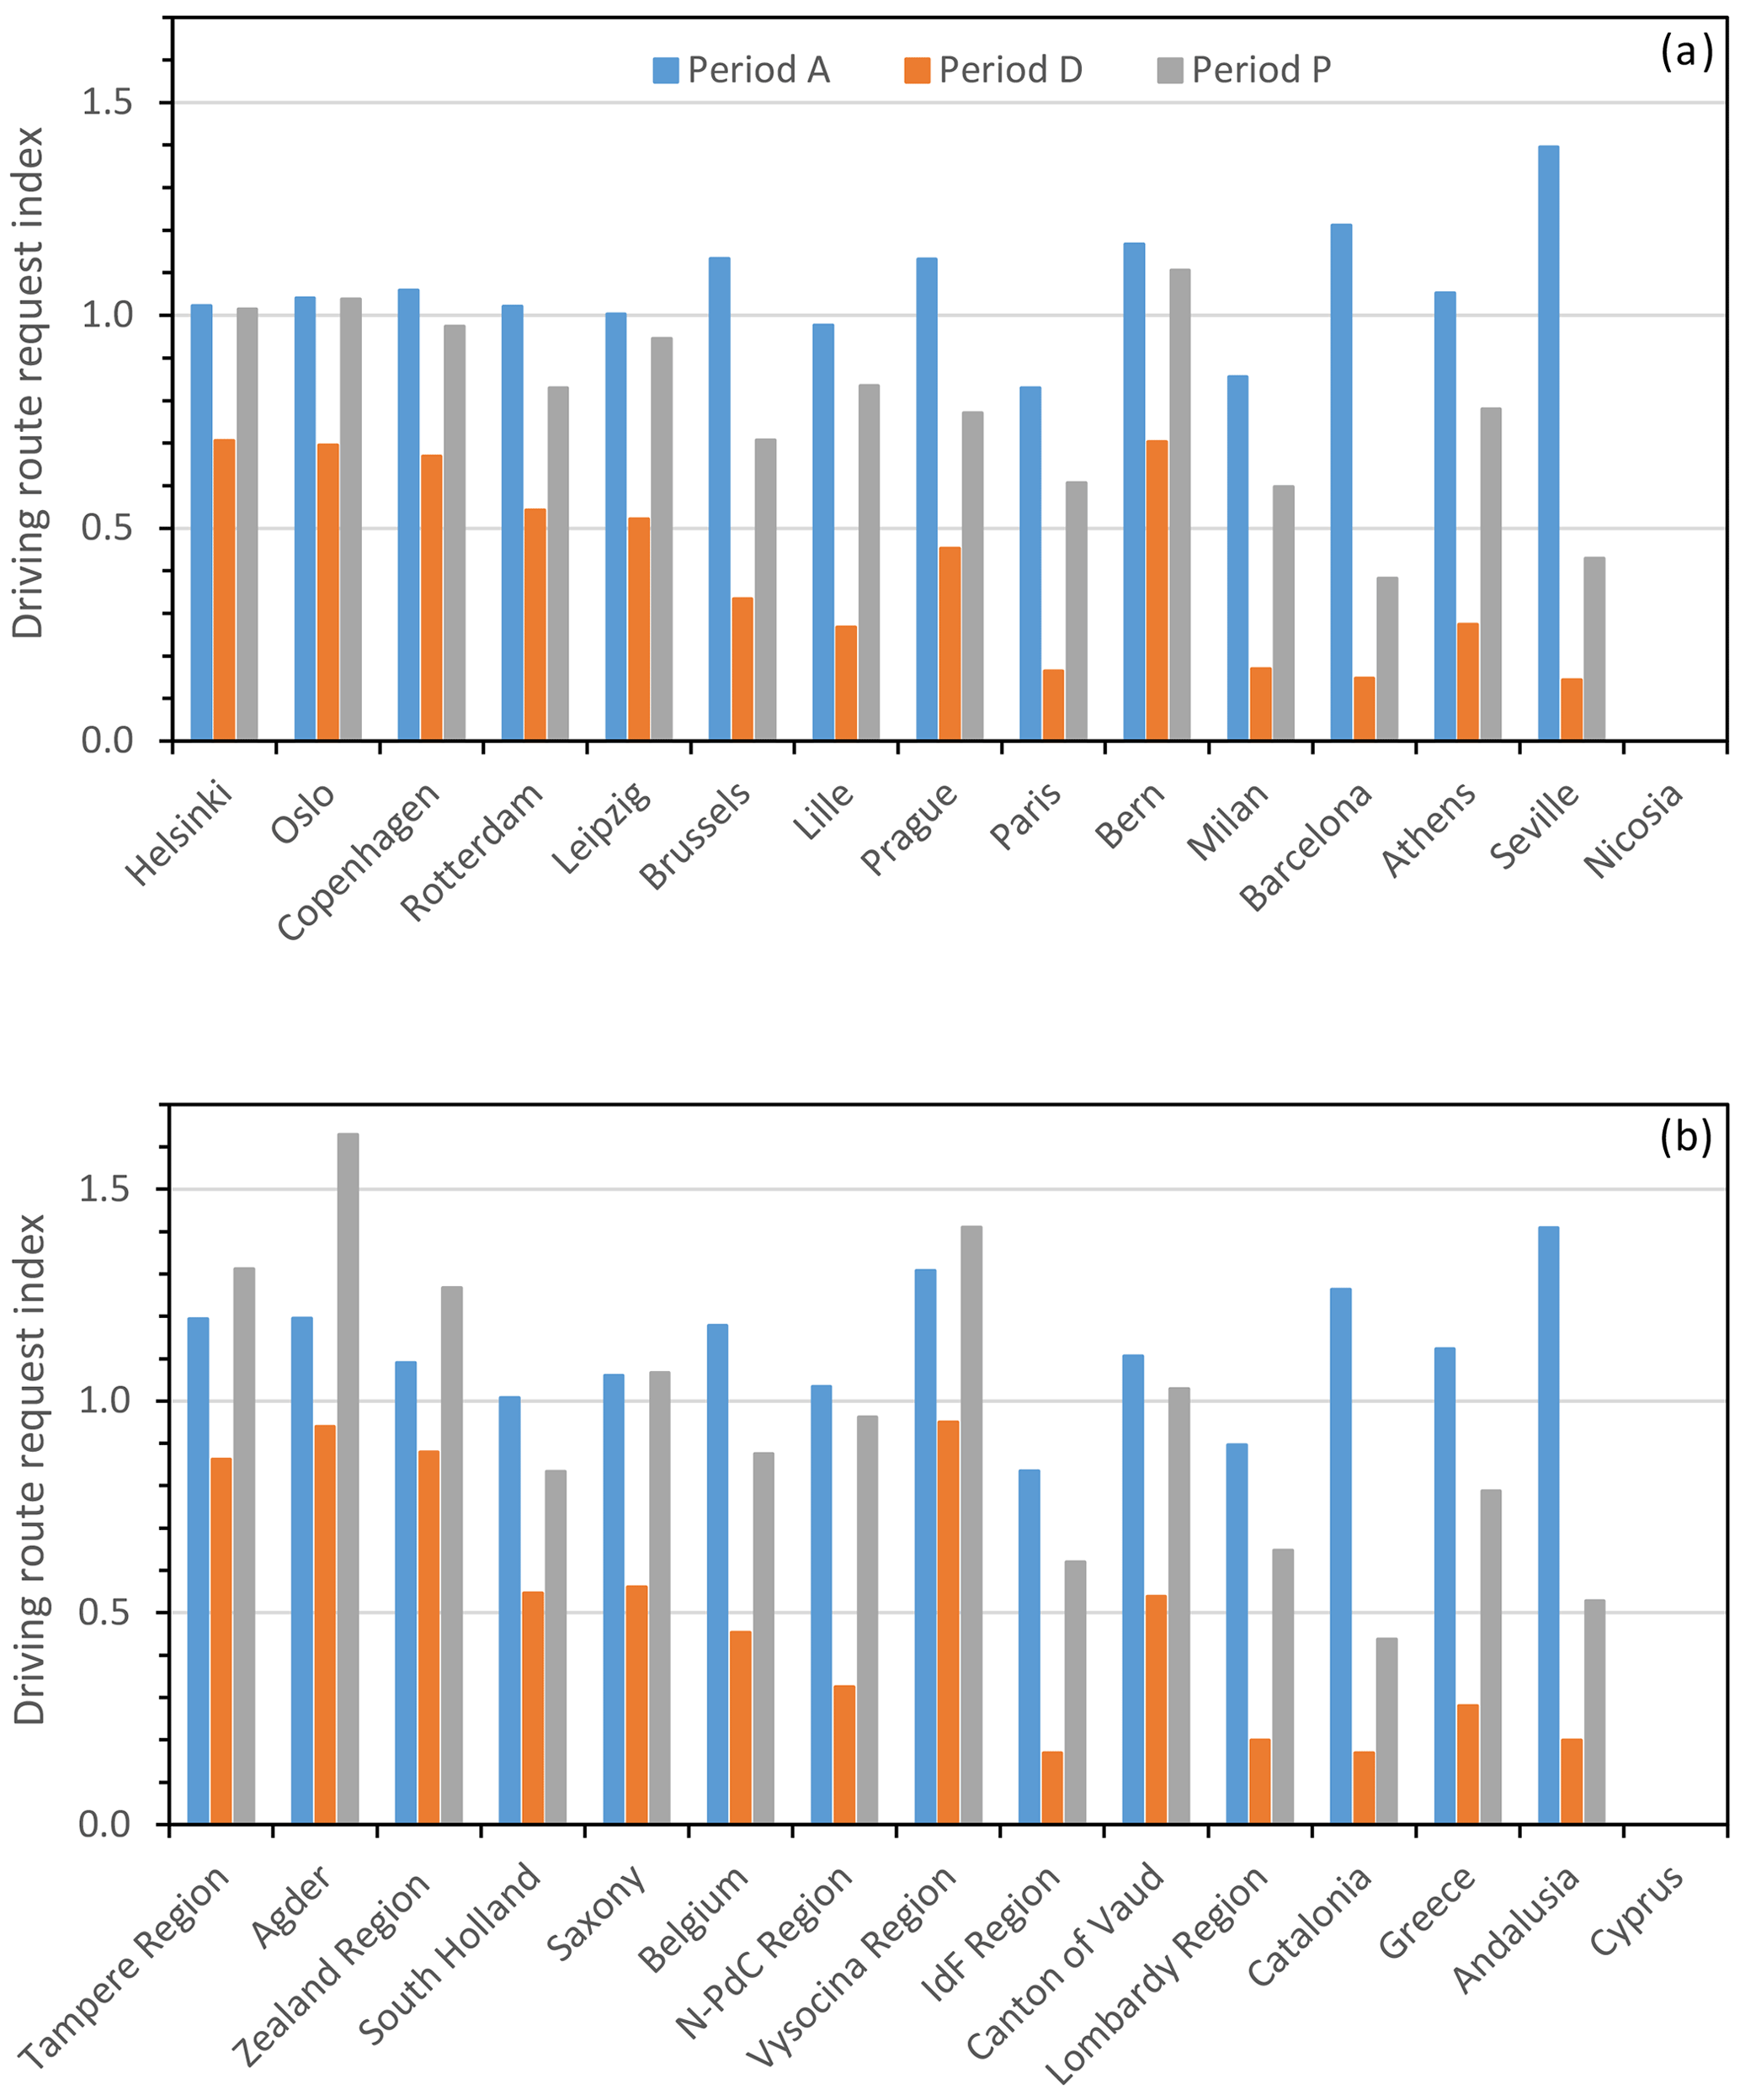
Figure 2Driving route request indices during period A (17 February–8 March), D (23 March–3 May) and P (11–31 May) in cities where measurement sites were located (a) and in areas where regional background sites and/or urban sites were located (b). Apple® mobility indices are relative to data of 13 January 2020. Data from 11 and 12 May 2020 are missing. N-PdC and IdF stand for the French “Nord-Pas-de-Calais” and “Île-de-France” regions, respectively. There are no data for Cyprus (see Fig. S1).
According to monthly mean data available from CYSTAT, the road transport index in Cyprus decreased by −21 % in March 2020, decreased by a further −35 % in April 2020 and increased again by +18 % in May 2020 (Fig. S2), in line with the mobility data collected for the other sites.
These data suggest that at least passenger car traffic strongly decreased as lockdown measures were implemented (period D) in all countries considered in this study and particularly in Belgium, France, Italy, Spain, Greece and Cyprus. They also suggest that the road traffic intensity was generally greater by the end of May 2020 (period P) than during lockdown periods (period D) at all sites but did not reach the intensities observed before (period A) at sites in Belgium, France, Italy, Spain, Greece and possibly Cyprus. However, 2020 monthly automotive fuel consumption data suggest that light-duty-vehicle and heavy-duty-vehicle traffic (diesel) was much less reduced than private-car (diesel + gasoline) traffic during the first lockdown period across Europe (Sect. 2.1, Table S5).
3.2 Impact of lockdown measures on PM mass concentrations
It is reiterated here that only sites for which the correlation between modelled and measured PM mass concentrations was satisfactory (positive slope, R2 ≥ 0.5) across the February–May 2019 period were considered (Table S4).
Figure 3 shows the mean observed expected PM2.5 and PM10 mass concentration ratios (Eq. 3) at urban sites during the three time periods A, D and P. The differences between these three values represent our estimates of the lockdown measures' impacts on pollutant atmospheric concentrations. As already observed across Europe (EEA, 2020; Shi et al., 2021) and the USA (Bekbulat et al., 2021), there was no systematic response of PM mass concentrations to the lockdown measures at urban sites. Indeed, the implementation of lockdown measures in March led to statistically significant decreases in PM2.5 concentrations in Oslo, Rotterdam and Barcelona (3 out of 10 sites) and to a significant decrease in PM10 concentration in Barcelona and Seville (2 out of 12 sites) only. On average (Table 2), the implementation of the lockdown measures resulted in minor increases in PM2.5 and PM10 mass concentration of +1 ± 42 and +5 ± 33 %, respectively. In contrast, the relaxation of lockdown measures in May led to statistically significant increases in PM2.5 concentrations in Helsinki, Rotterdam, Brussels, Prague, Bern and Barcelona (6 out of 10 sites) and to a significant increase in PM10 concentrations in Rotterdam, Lille, Prague, Paris, Milan, Barcelona and Nicosia (7 out of 12 sites). On average, the relaxation of the lockdown measures led to PM2.5 and PM10 concentration increases of +26 ± 21 and +26 ± 24 %, respectively. At locations where impacts were significant, lockdown measures had very similar impacts on PM2.5 and PM10 concentrations. Lockdown impacts on PM concentrations in cities did not generally reflect well the variations in road traffic intensity expected from the driving road request data (Fig. 2), as illustrated by Fig. S3.
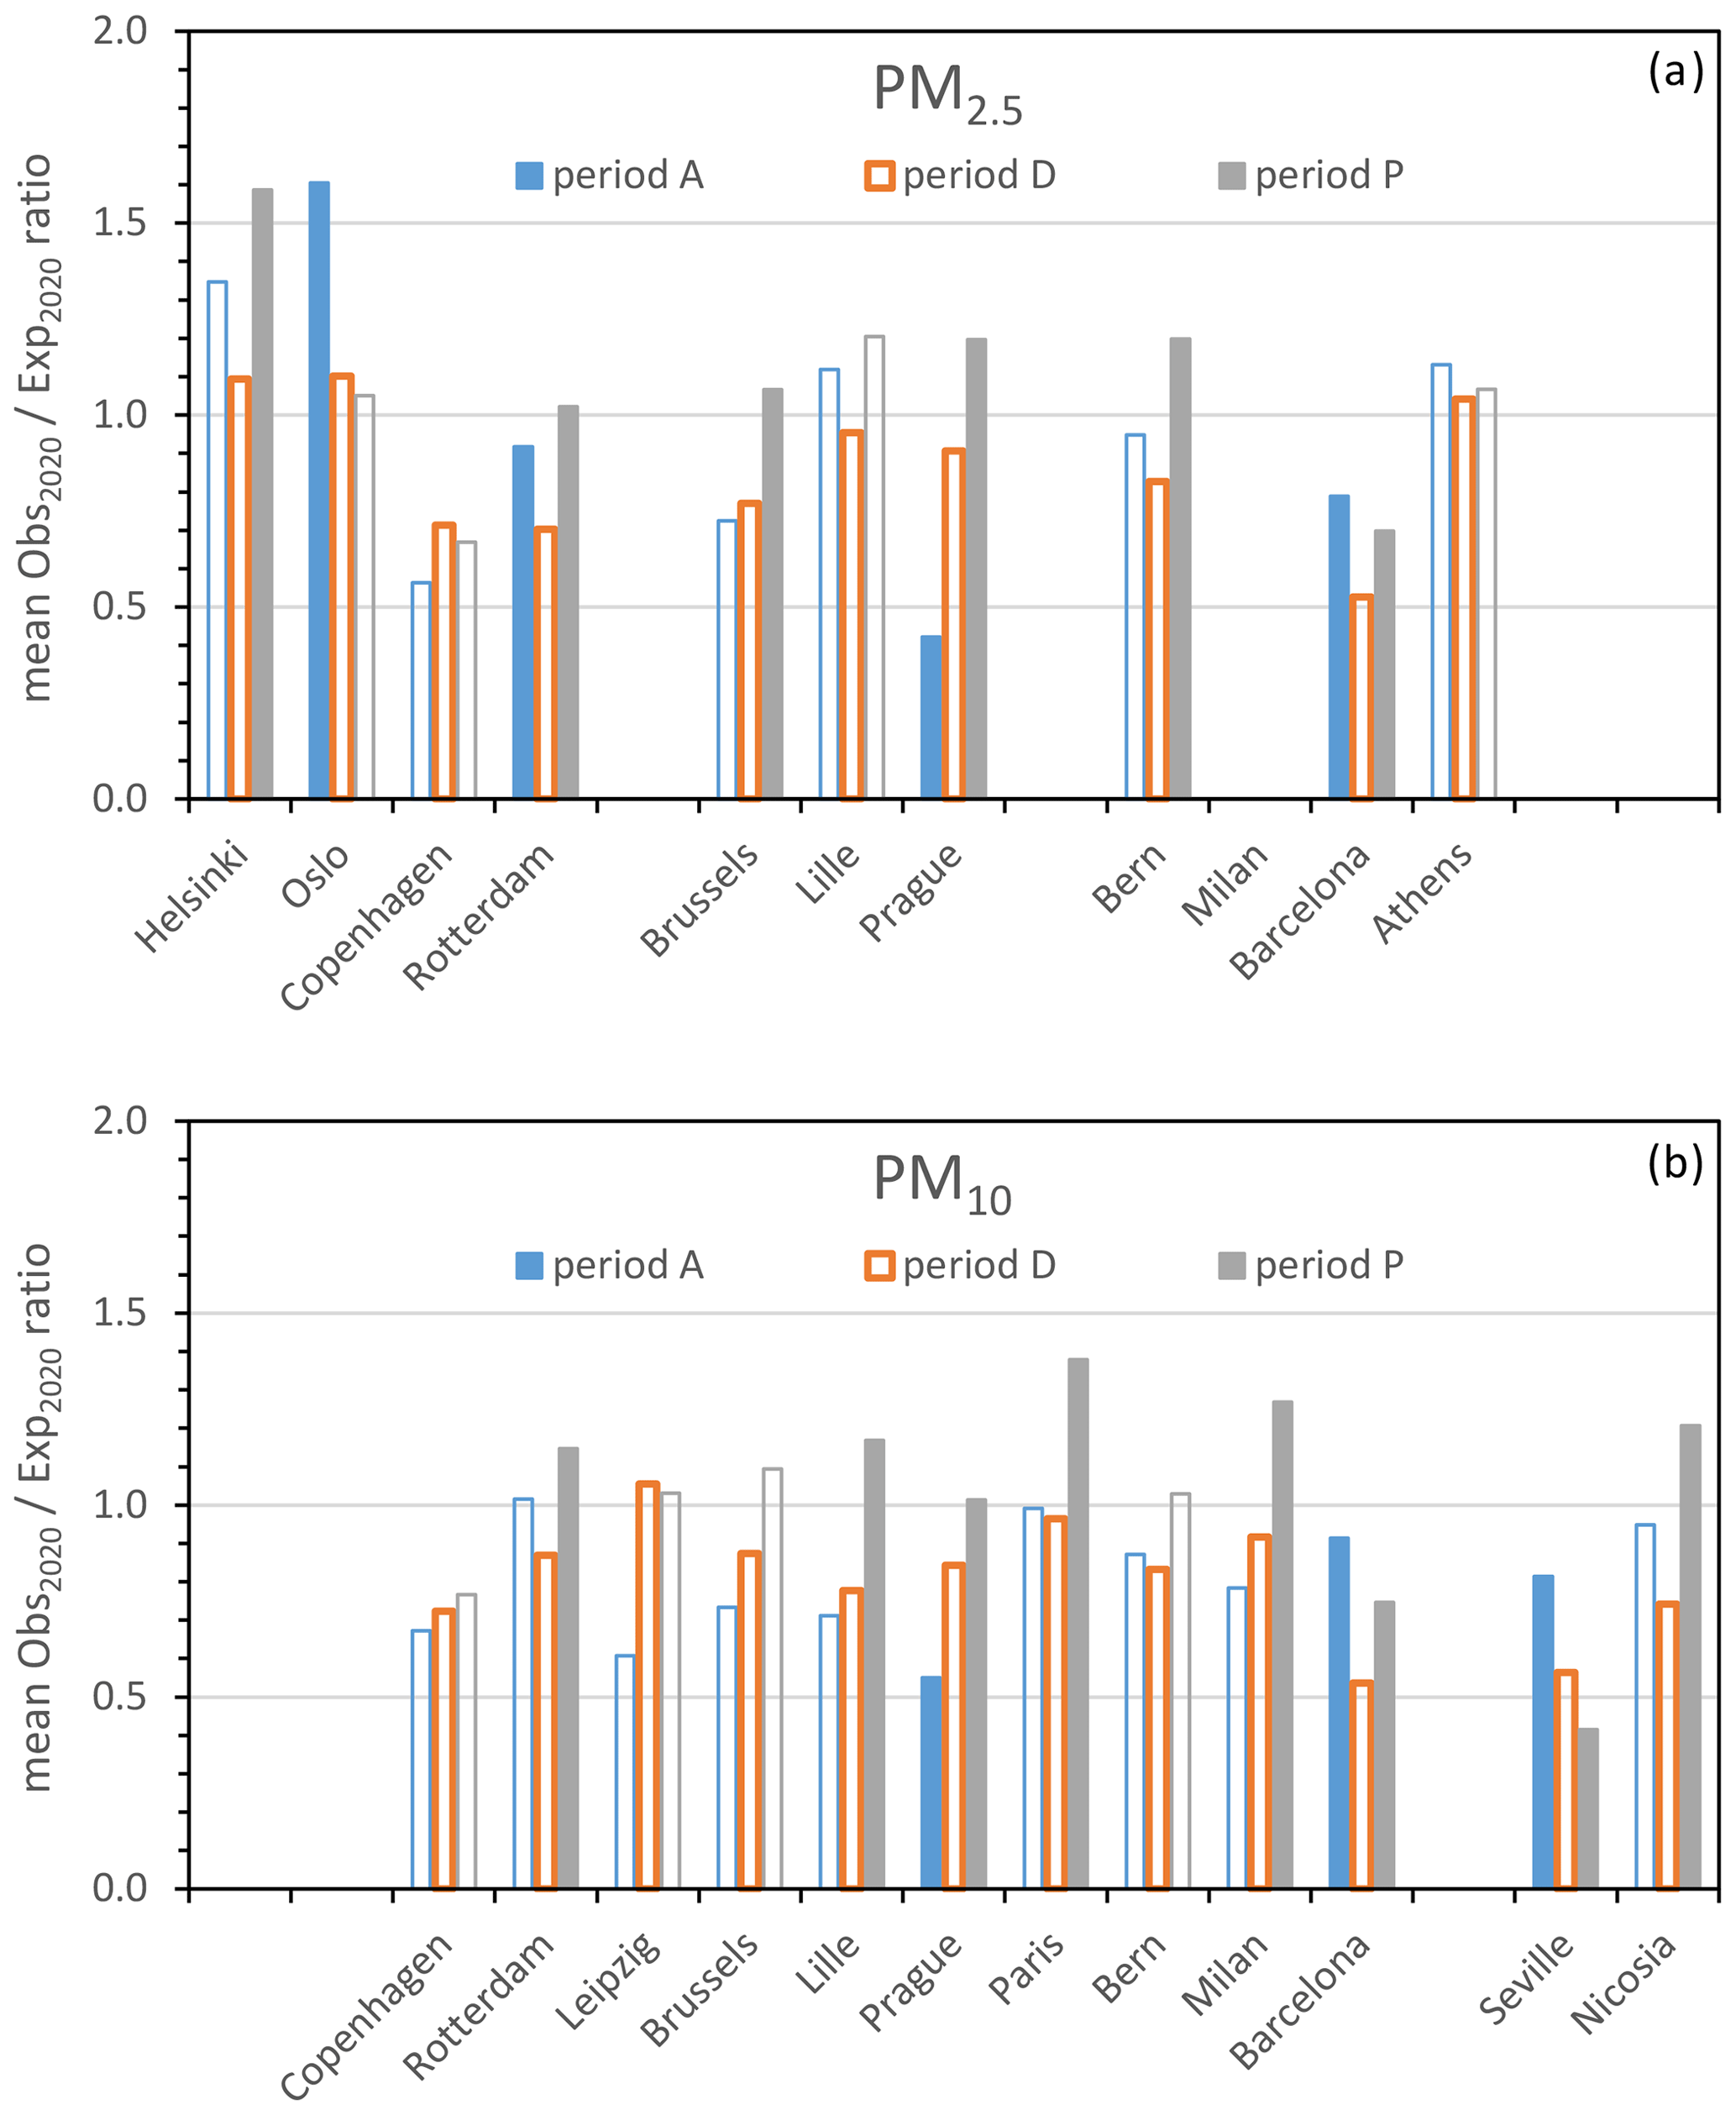
Figure 3Mean observed expected PM2.5 (a) and PM10 (b) concentration ratios (Eq. 3) during periods A (before), D (during lockdowns) and P (after) at urban sites. Filled bars indicate means which are statistically different from the mean during lockdown periods (D).
Advection from surrounding areas has been shown to contribute to PM concentrations in European cities (e.g. Kiesewetter et al., 2015; Thunis et al., 2018; Pommier et al., 2020). For example, modelling indicates that sources outside the greater city area contribute between 35 % (Paris, Athens) and 94 % (Nicosia) to PM2.5 urban background concentrations in the cities considered here (Thunis et al., 2017).
Figure 4 shows the mean observed expected PM2.5 and PM10 mass concentration ratios (Eq. 3) during the three time periods A, D and P at regional background sites located in the regions of the cities mentioned above. The implementation of lockdown measures led to statistically significant decreases in PM2.5 concentration in BIR (NO) and in PM10 concentrations in BIR and MEL (DE) only (3 out of 16 entries), while their relaxation resulted in significant increases in PM2.5 concentrations in BIR, CBW (NL), MEL, KOS (CZ) and SIR (FR) and in PM10 concentrations in BIR, CBW, MEL, SIR, PAY (CH) and IPR (IT), i.e. 11 out of 16 entries. At regional background sites, lockdown implementations resulted, on average, in +2 ± 39 and +15 ± 42 % increases in PM2.5 and PM10 mass concentrations, respectively. Their relaxation resulted in further +38 ± 43 and +28 ± 10 % increases in PM2.5 and PM10 concentrations, respectively. Comparing PM data with the driving route request data in Fig. 2 (bottom) suggests no significant impact of private-car traffic intensity on regional background PM levels (Fig. S4).
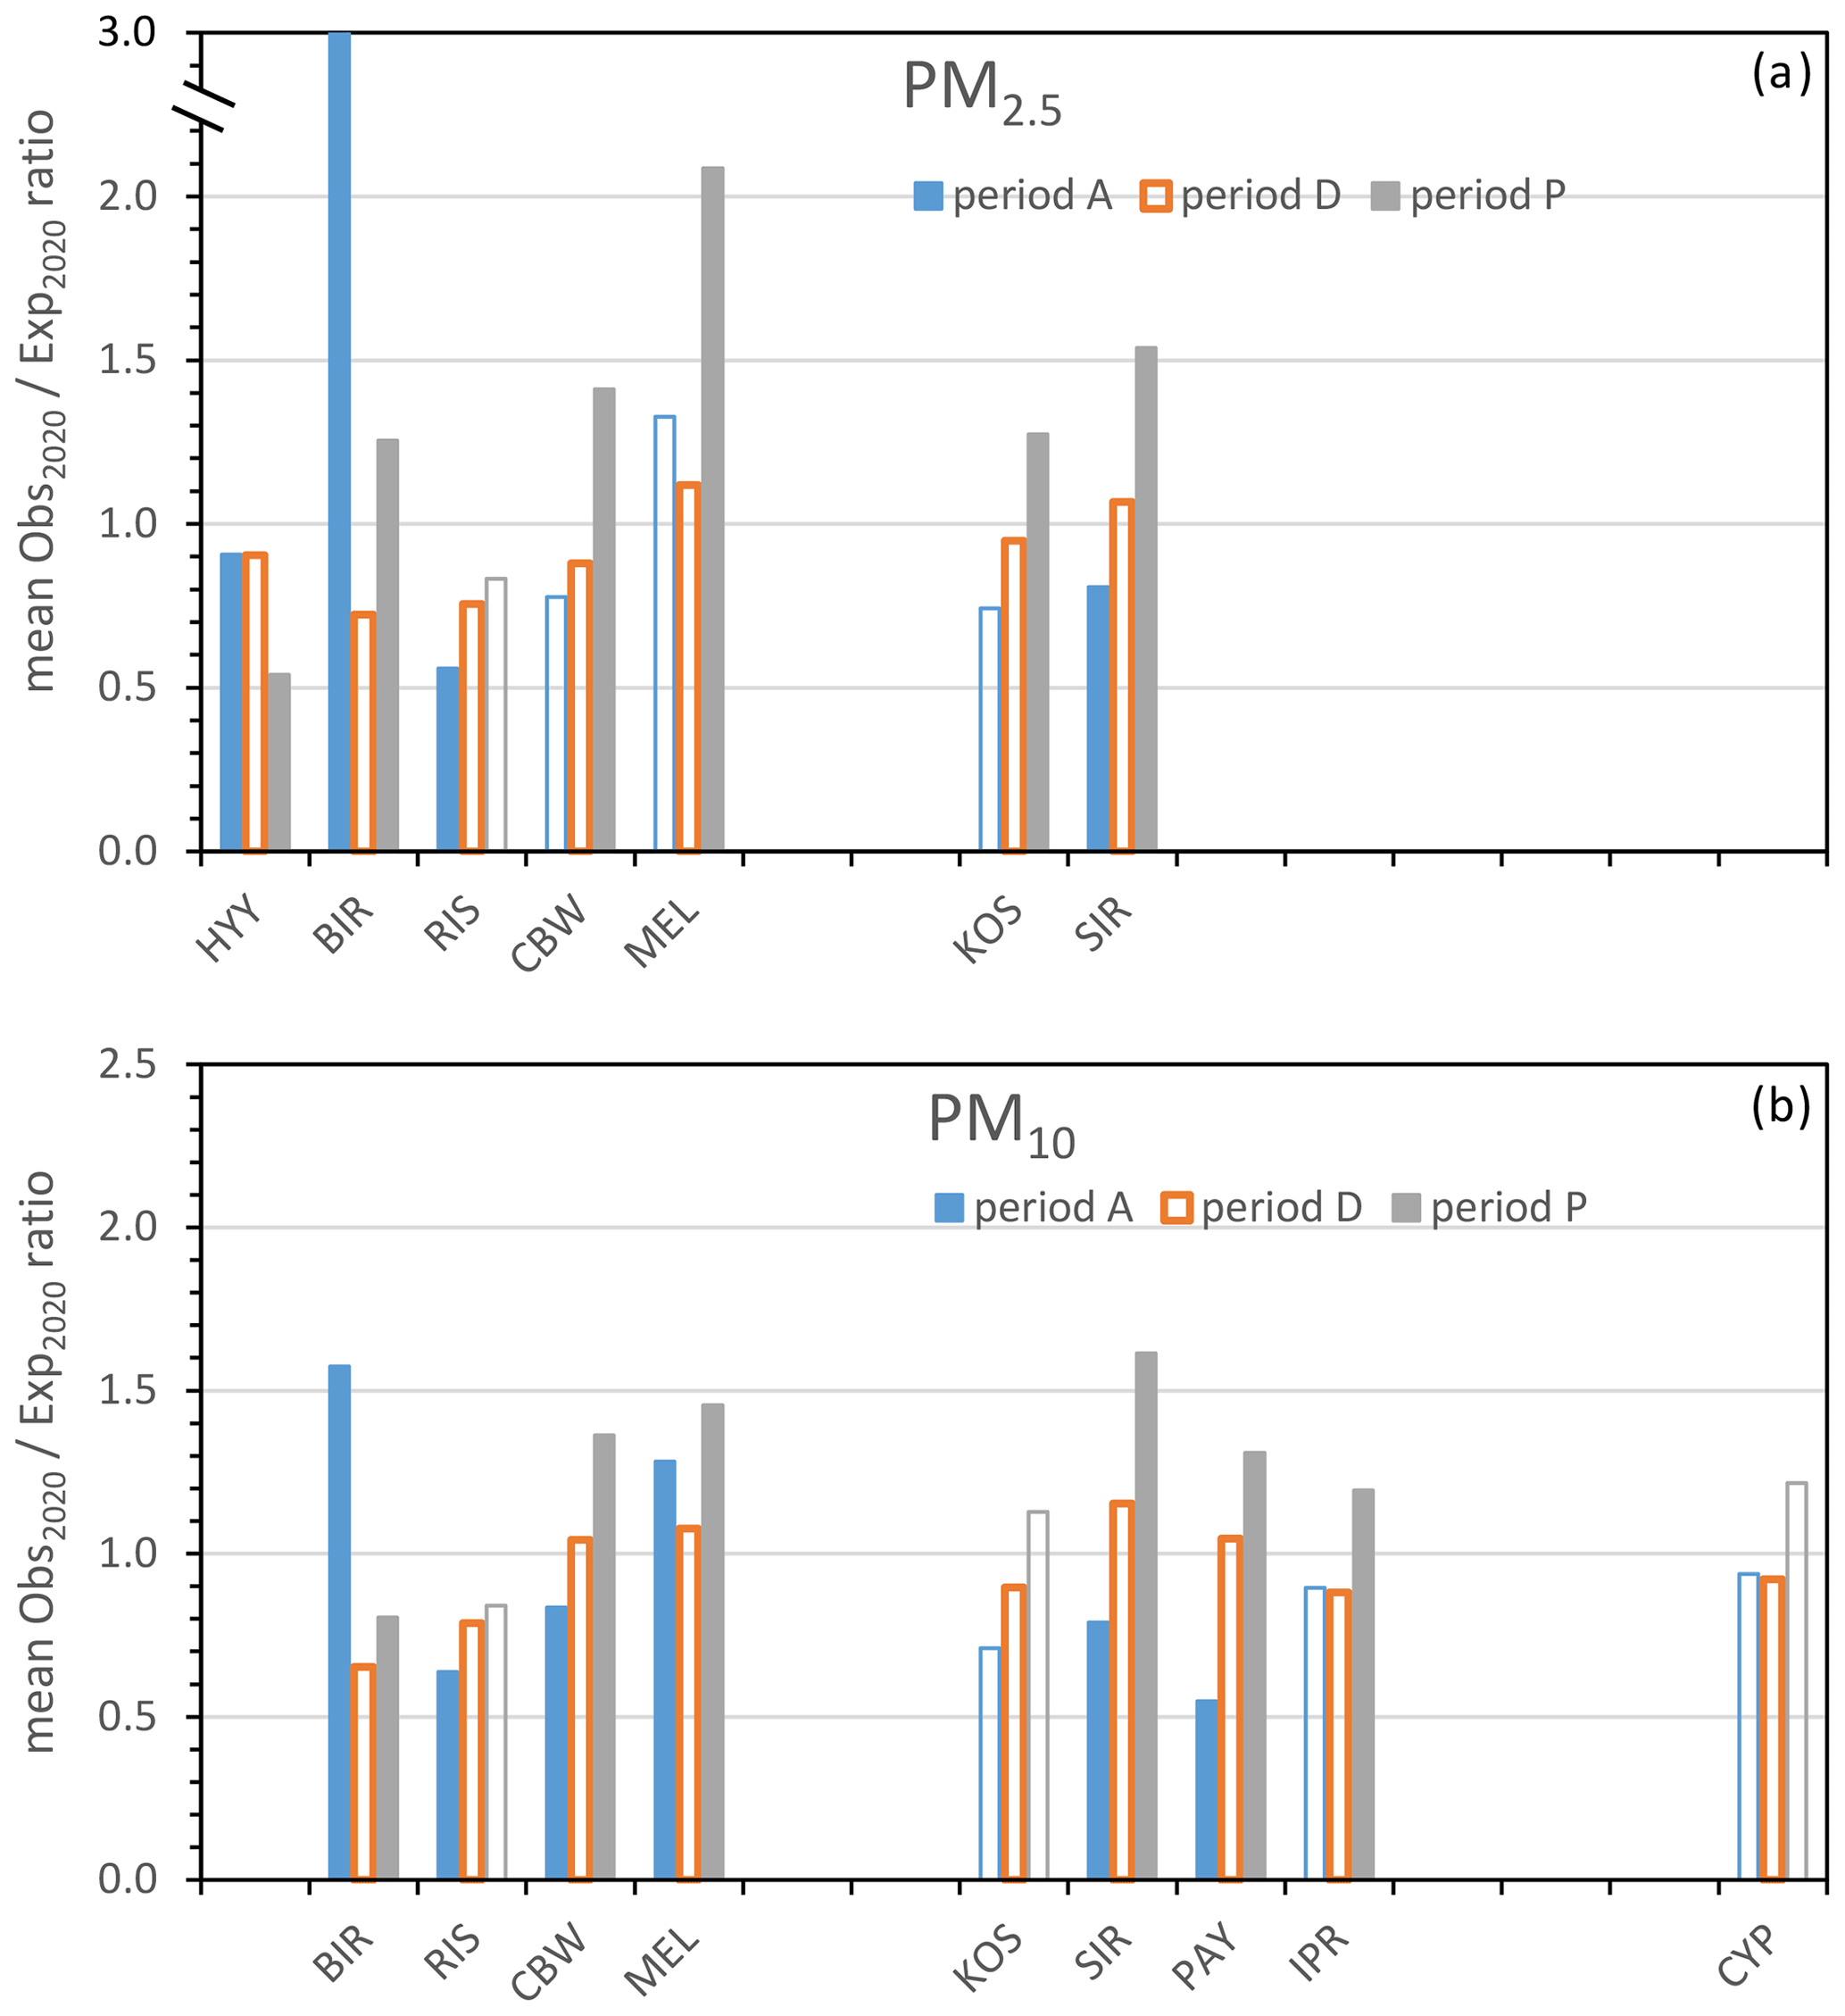
Figure 4Mean observed expected PM2.5 (a) and PM10 (b) concentration ratios (Eq. 3) during periods A (before lockdowns), D (during lockdowns) and P (after lockdowns) at regional background sites. Filled bars indicate means which are statistically different from the mean during lockdown periods (D).
There is generally no correspondence between twin sites in terms of significant lockdown impacts on PM concentrations (urban and regional background sites located in the same area), except for Oslo–BIR (PM decrease from A to D), and Rotterdam–CBW, Prague–KOS, Paris–SIR and Milan–IPR (PM increase from D to P).
Due to the multiplicity of PM primary and secondary sources, further atmospheric variables such as gaseous pollutant concentrations and PM intrinsic characteristics shall be examined to investigate the lack of dramatic drops in PM mass concentrations resulting from the reduction in private-car traffic when lockdown measures were implemented at the sites considered in this study.
3.3 Impact of lockdown measures on NO2 concentrations
Road traffic is a major source of NOx (nitrogen oxides) in Europe (EEA, 2020). For the 15 cities considered in this study, the contribution of road traffic to annual NOx emissions ranges from 35 % in Rotterdam to 95 % in Athens (Degraeuwe et al., 2019). Road traffic intensity variations are therefore expected to significantly affect NO2 concentrations. Diesel engines are by far the largest contributors to road traffic NOx emissions in most countries across Europe, a noticeable exception being Greece (2016 data). However, for all 13 countries considered, the passenger car fleet emits the largest share of NOx (60 %–90 %), far ahead that of the light-duty plus heavy-duty vehicle fleet. Since mobility restrictions presumably affected mostly passenger cars (Sect. 3.1), dramatic variations in driving route requests (as a proxy for vehicle kilometres) are expected to result in significant changes in road traffic NOx emissions.
Lockdown measure implementations led to statistically significant decreases in NO2 concentrations in Helsinki, Copenhagen, Rotterdam, Brussels, Lille, Paris, Bern, Milan and Barcelona, i.e. in 9 of 13 cities. At sites where no significant reduction in NO2 concentrations occurred, there were no significant decreases in nitrogen oxide (NO) concentrations either (Fig. S5), indicating no substantial abatement of NOx emissions. On average, the implementation of lockdown measures resulted in NO2 concentration decreasing by −29 ± 17 %. Lockdown measure relaxations led to significant rebounds in NO2 concentrations in Copenhagen, Brussels, Lille, Prague, Paris, Milan and Seville (7 of 13 cities). The mean increase in NO2 concentration resulting from the lockdown termination was +31 ± 30 %. Although the impact of the lockdown measures was more systematic for NO2 than for PM concentrations (Fig. S6), there is no significant correlation between the impact on NO2 concentration and the reduction in driving route requests from period A to period D and only a marginally significant correlation between the impact on NO2 concentration and the increase in driving route requests from period D to period P (Fig. S3).
Lockdown measures also resulted in significant decreases in NO2 concentrations at 6 of the 12 regional background sites (HYY, FI; CBW, NL; SIR, FR; PAY, CH; IPR, IT; CYP, CY). Their relaxation led to significant increases in NO2 at three sites only, namely CBW (NL), MEL (DE) and SIR (FR). On average, the implementation and relaxation of lockdown measures resulted in a −17 ± 24 % decrease and +27 ± 50 % increase in NO2 concentration at regional background sites, respectively. There is no statistically significant correlation (95 % confidence level) between the lockdown impact on NO2 concentrations and the changes in route request data from period A to period D and from period D to period P at the regional background sites (Fig. S4).
Figure 5 shows that there is generally no matching in NO2 ratio variations from period A to period D and from period D to period P, between urban sites and regional background sites in surrounding areas (with a few exceptions including Paris–SIR and Bern–PAY), which suggests that NO2 concentrations at urban and regional background sites are controlled by different sources and/or atmospheric processes.
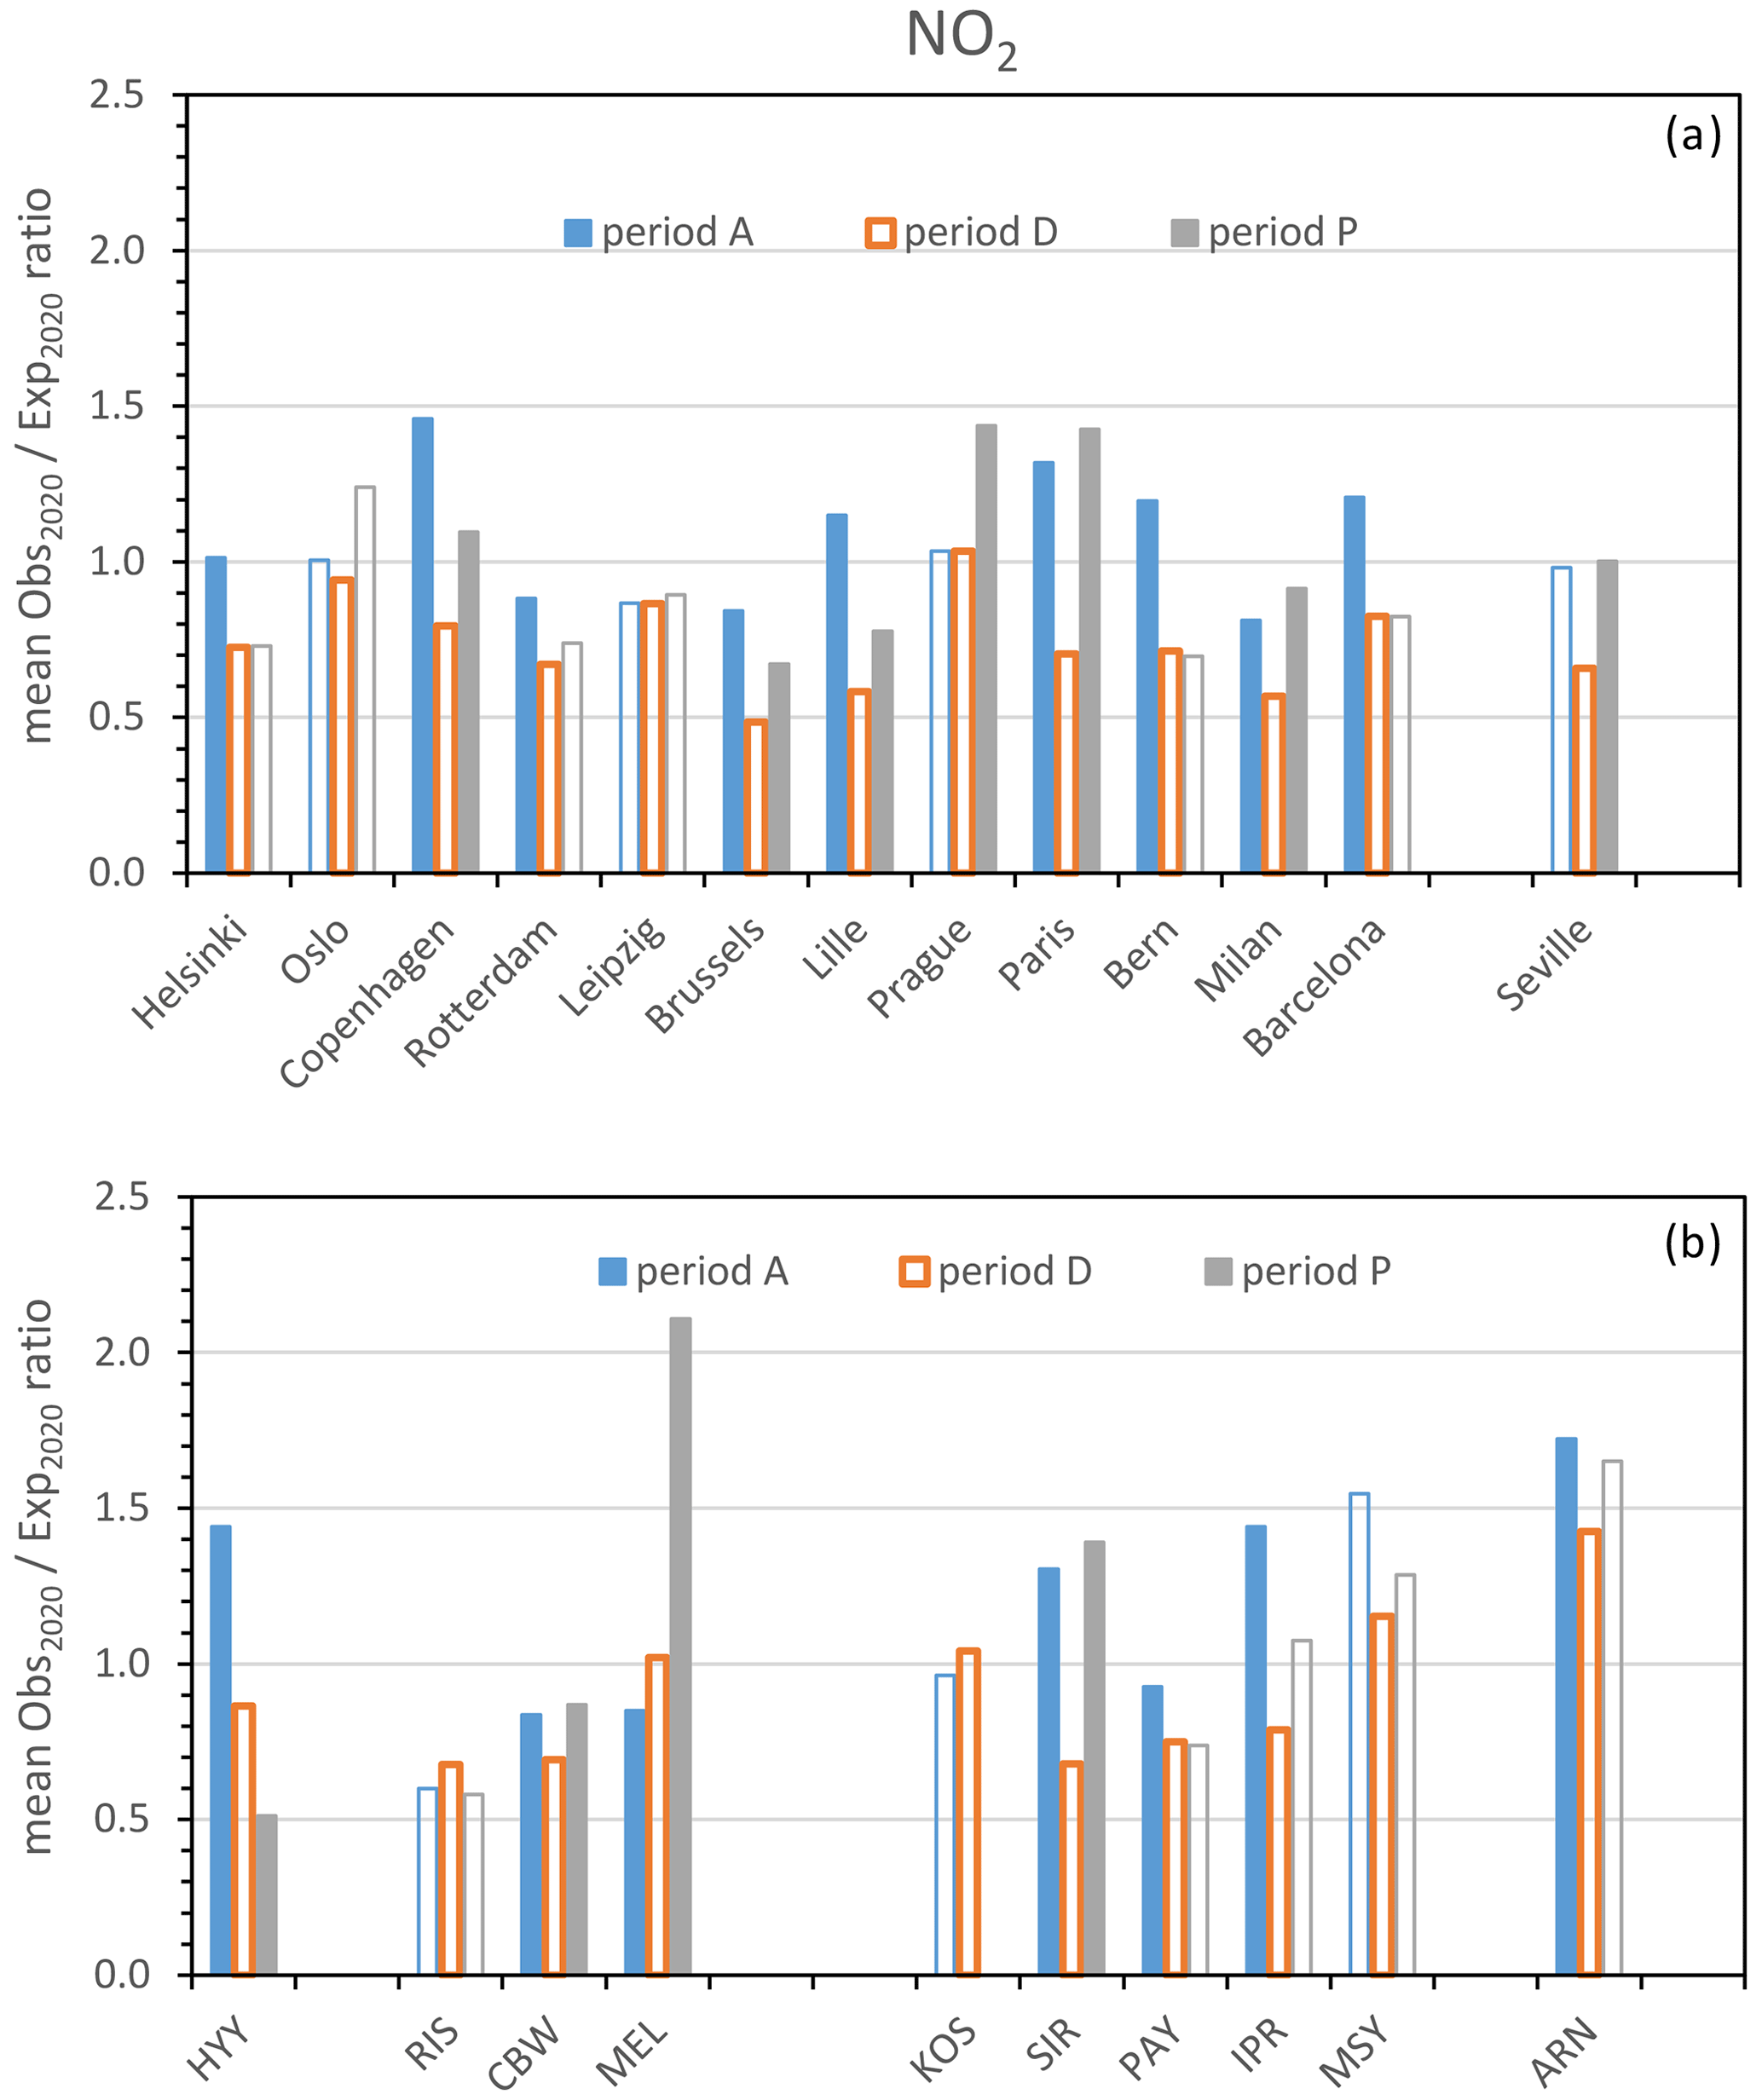
Figure 5Mean observed expected NO2 concentration ratios (Eq. 3) during periods A, D and P. Filled bars indicate means which are statistically different from the mean during lockdown periods (D). No data are available from KOS for time period P.
The lack of systematic correlation between the variations in the Apple® driving route request index and the changes in NO2 concentrations due to the lockdown implementation and relaxation measures suggests that the linkage between passenger car traffic and NOx emissions was not that straightforward under such circumstances. However, NO2 being an important precursor of secondary PM and the vehicles that emit most NOx being also those which emit most primary PM, the lack of a dramatic impact of lockdowns on PM concentrations compared to their clear effect on NO2 concentrations at many sites emphasises the variety of PM sources and the complexity of secondary formation processes.
3.4 Impact of lockdown measures on O3 concentrations
Implementations of lockdown measures induced statistically significant increases in O3 concentrations in Brussels, Lille, Paris, Barcelona and Nicosia, i.e. in 5 cities out of 12, with Milan being on the edge (Fig. 6a). There were no cities where lockdown measures led to a significant decrease in O3. This is consistent with photochemical O3 production not being limited by the availability of NOx in urban areas and with a reduction in O3 titration by NO resulting from an abatement in NOx emissions during the lockdown periods. On average, the implementation of the lockdown measures resulted in an increase of +11 ± 23 % in O3 concentration in cities. Also at the regional background sites BIR (NO), KOS (CZ), SIR (FR), IPR (IT) and ARN (ES), the effect of the lockdown measures was a significant increase in O3 concentrations, and at no sites was a significant decrease in O3 detected. This is again consistent with an excess of NOx in O3 photochemical formation at those sites, at least during this period of the year (February–April). The significant increase in O3 after the lockdown measure relaxation (period P) in BIR (NO) and ARN (ES) could be explained by a shift in the O3 photochemical production to the “NOx-limited” regime at these regional background sites, resulting from increased emissions of biogenic volatile organic species in May. On average, the impact of lockdown measure implementation and relaxation on O3 concentration at regional background sites was estimated to be +17 ± 24 and +4 ± 5 %, respectively.
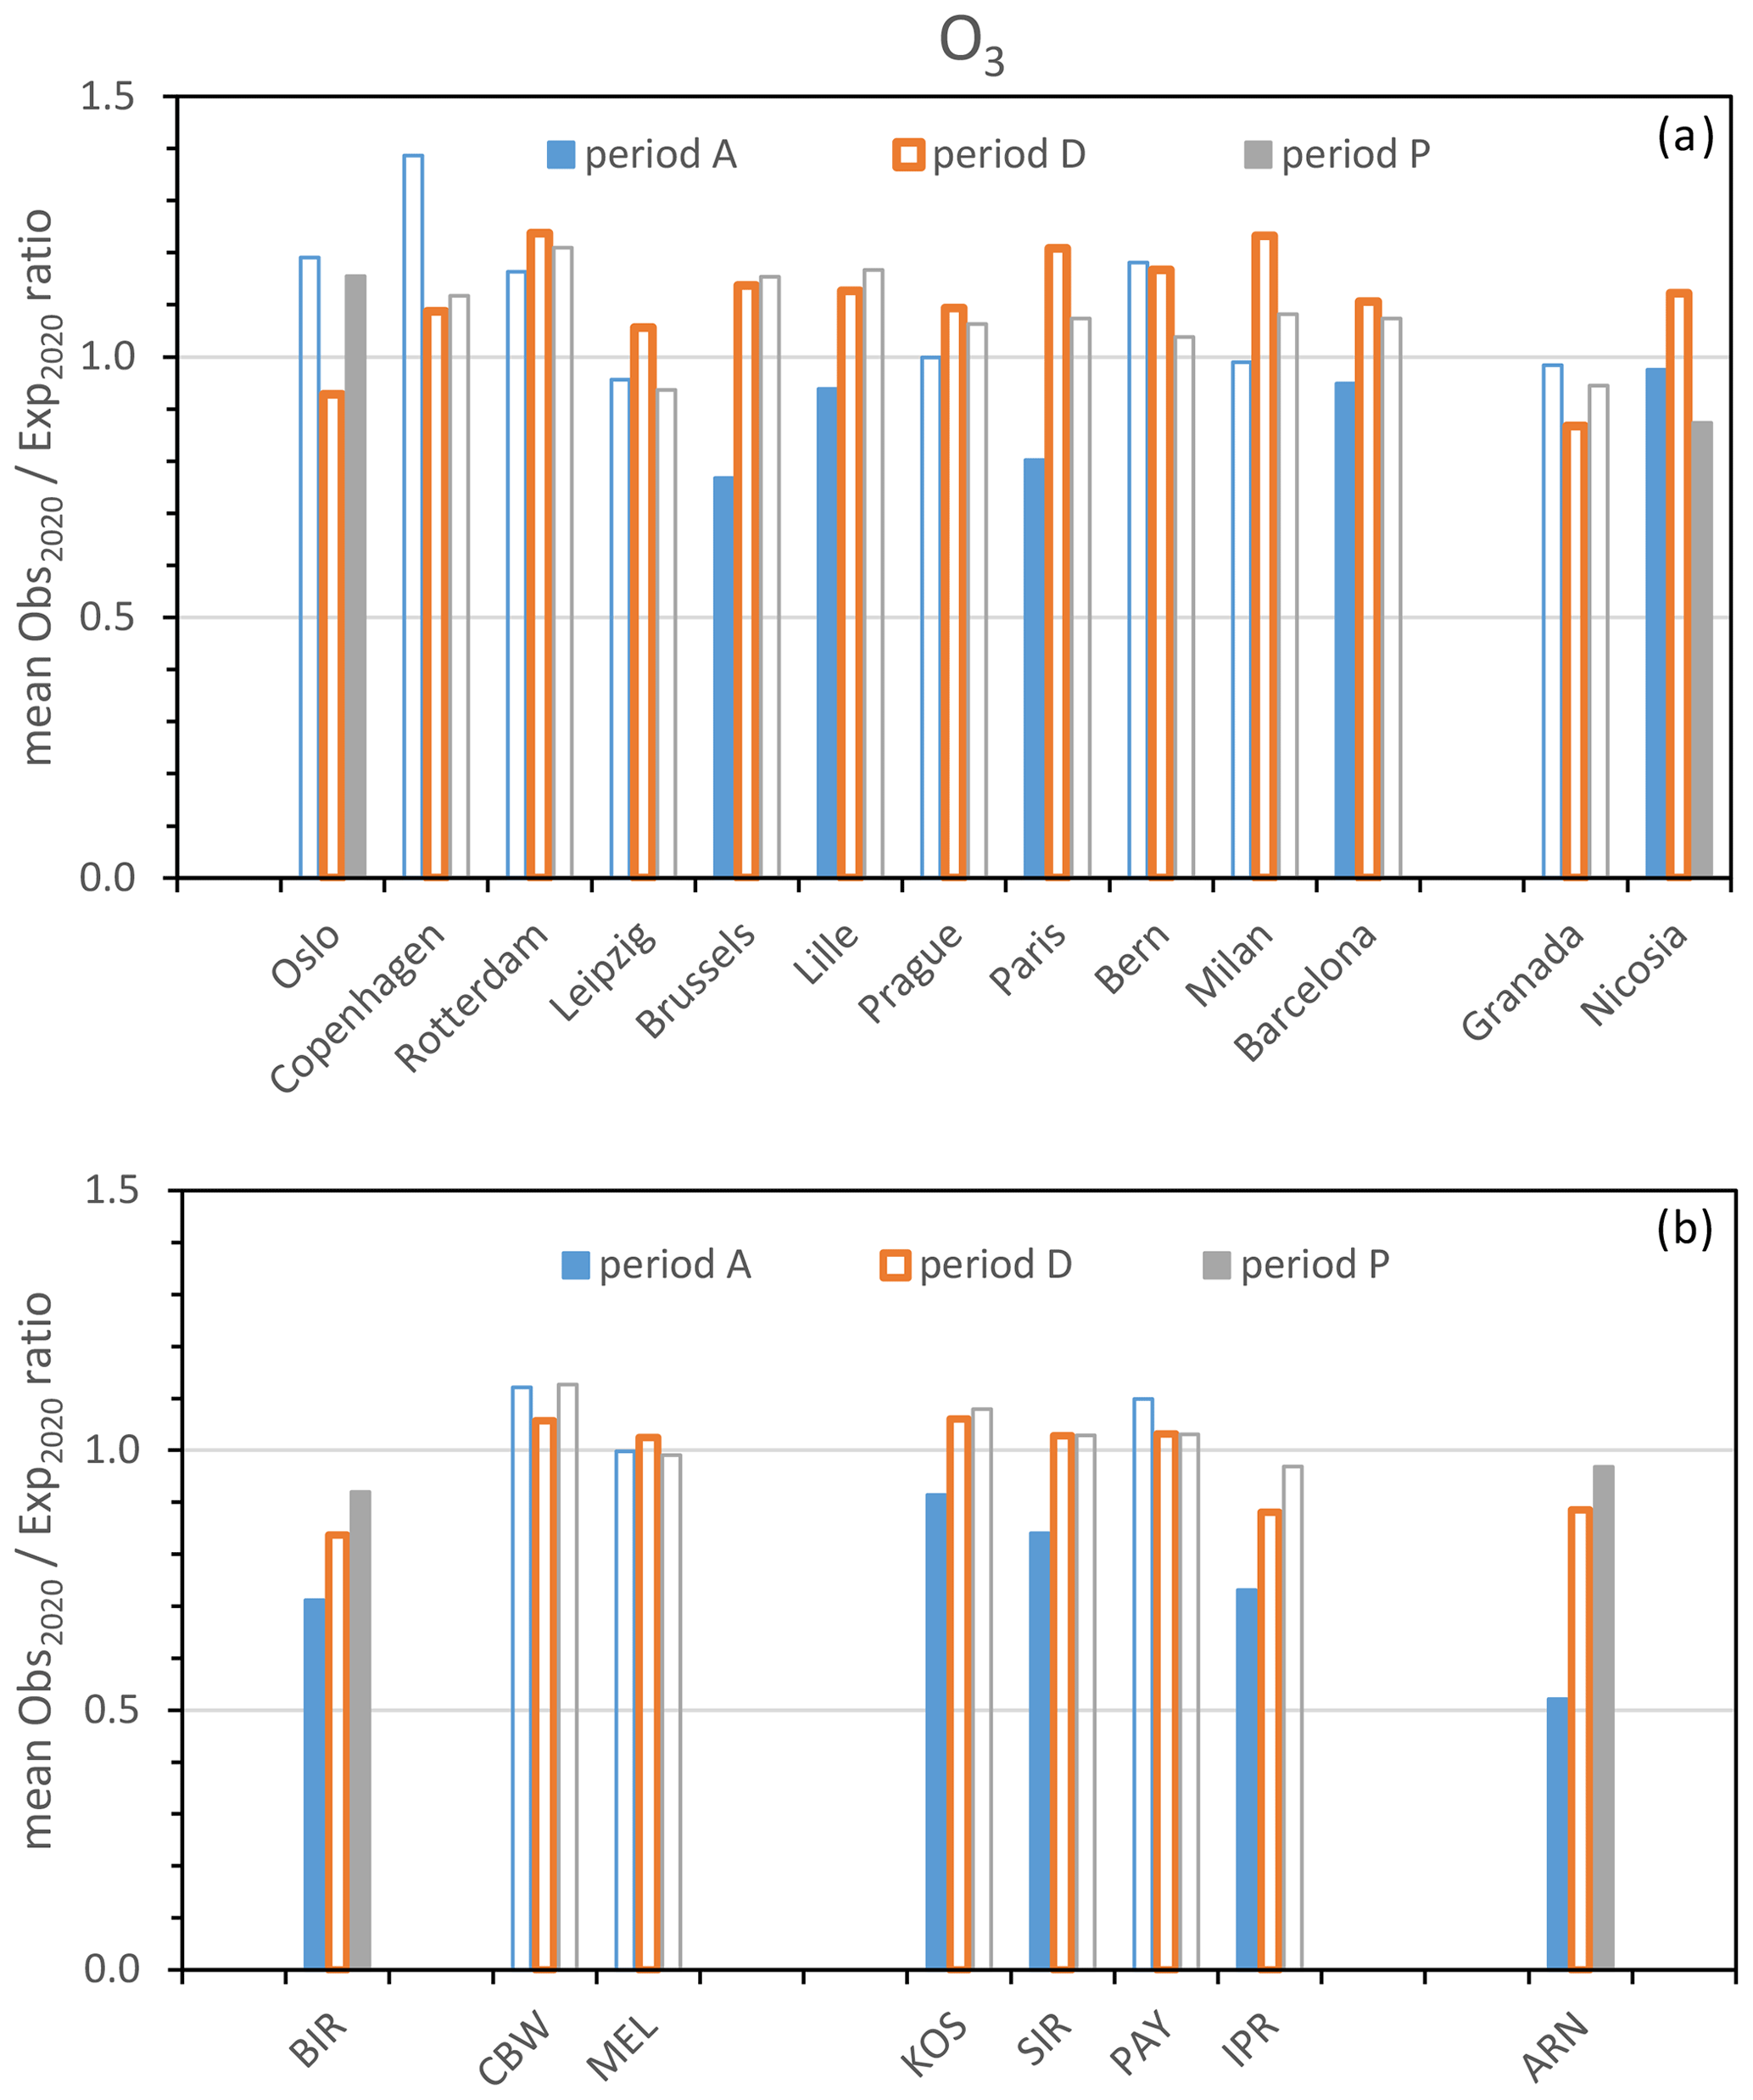
Figure 6Mean observed expected O3 concentration ratios (Eq. 3) during periods A, D and P. Filled bars indicate means which are statistically different from the means during lockdown periods (D).
Increased O3 concentrations reflect an increase in the oxidising capacity of the atmosphere. The increased oxidising capacity of the atmosphere was invoked to explain the lack of a systematic decrease in PM concentrations resulting from the lockdown measures (e.g. Kroll et al., 2020): the expected decrease in PM primary emissions would be compensated (or even over-compensated) by an increased production of secondary aerosol resulting from a faster oxidation of PM gaseous precursors to condensable material. Actually, increased aerosol surface area and Aitken mode particle growth rates were observed for the lockdown period in Athens (Eleftheriadis et al., 2021), together with increases in O3 and PM2.5 concentrations. This hypothesis is to some extent also supported by recent modelling works (Clappier et al., 2021), suggesting that in the areas surrounding Rotterdam, Bern, Milan and Barcelona, reduction in NOx emissions would lead to enhanced secondary PM formation resulting from the increased oxidising capacity of the atmosphere. However, the magnitude of this phenomenon during the 2020 lockdown could only be assessed on the basis of detailed PM chemical composition data (including not only sulfate and nitrate, but also secondary organics), which are not available at the sites located in the areas considered in our study.
In the following sections, other possibilities will be examined by making use of specific aerosol properties, which are not part of regulated air pollution metrics.
3.5 Impact of the lockdown measures on aerosol intrinsic characteristics
A reason why lockdown impacts on PM mass concentrations were smaller than expected could be the compensation of the decrease in road traffic emissions by the increase in domestic heating emissions, resulting from people staying at home (Altuwayjiri et al., 2021). Since wood (or wood pellets) is one of the fuels used for domestic heating, any decrease in road traffic compared to domestic heating emissions would result in an increase in the AÅE. We also deemed it important to assess how clear the lockdown effects on primary particle emissions from vehicle engines were. This is why the contribution of small particles (Dp < 70 nm) to the total particle number () was examined. The measurement data needed to calculate these intensive variables were not available for all the 28 sites considered in this study (see Table S3). Therefore, data from urban and regional background sites are not split into separate figures for these two variables.
3.5.1 Particle light absorption spectral dependence
A statistically significant impact of the lockdown measure implementation and relaxation on the particle light absorption spectral dependence was detected in Lille (FR), Athens (GR) and ARN only (Fig. 7). At both urban sites, 2020 AÅE values were very similar to the 2017–2019 averages for periods A and P and significantly greater than them during the lockdown period (D). AÅE values also significantly increased as lockdown measures were implemented in Oslo (NO) and SIR (FR), while AÅE values significantly decreased as lockdown measures were relaxed in IPR (IT). No significant change in 2020 AÅE values (as compared with 2017–2019) could be observed for the lockdown period (D) in BIR (NO), Brussels (BE), KOS (CZ), Bern (CH), PAY (CH) and MSY (ES). On average (all site types), the AÅE increased by +3 ± 6 and decreased by −8 ± 28 % as lockdown measures were implemented and relaxed. In short, the expected increase in the AÅE resulting from a decrease in particle emissions from traffic and a stagnation or increase in particulate emissions from wood burning during the lockdown period was not systematically observed across the sites considered in this study. Therefore, increased emissions from domestic heating during the lockdown would have contributed to maintaining unexpectedly high PM mass concentrations in certain places across Europe, but this phenomenon was apparently not relevant in many areas.
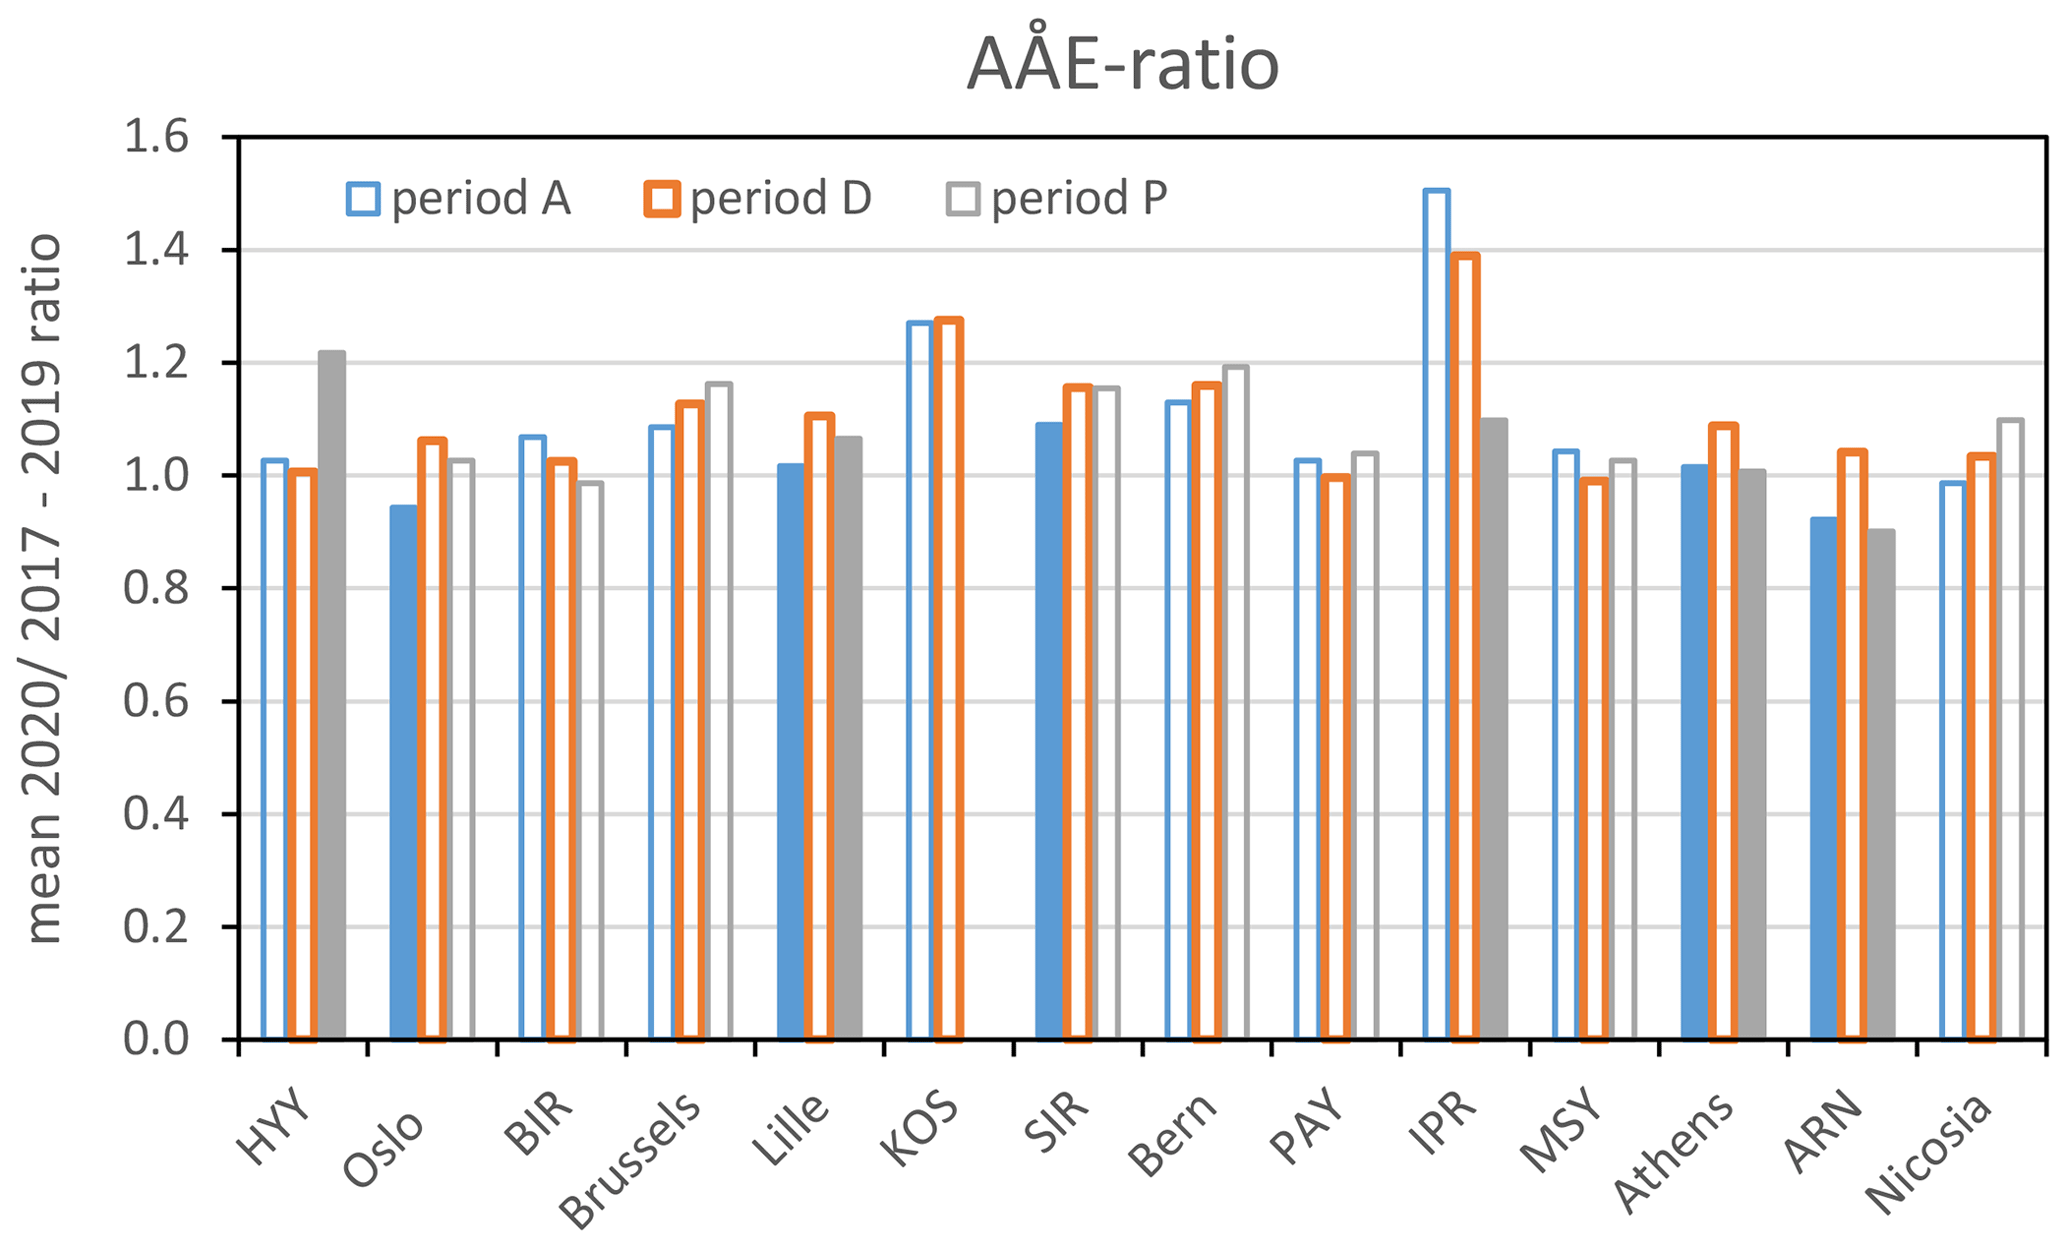
Figure 7Mean 2020 (2017 to 2019) AÅE ratios during periods A, D and P. Filled bars indicate means which are statistically different from the means during lockdown periods (D). No data are available for KOS during period P.
3.5.2 Particle number size distribution
At three of the five urban sites for which data were available (Leipzig, Athens and Granada), the implementation of the lockdown measures in 2020 coincided with a statistically significant decrease in the ratio as compared to the same time periods in 2017–2019 (Fig. 8). A significant increase in this ratio occurred as lockdown measures were relaxed at only two of the six urban sites with relevant data (Copenhagen and Barcelona). On average, the implementation and relaxation of lockdown measures corresponded to a decrease by −7 ± 5 % and an increase by +6 ± 2 %, respectively, in the ratio.
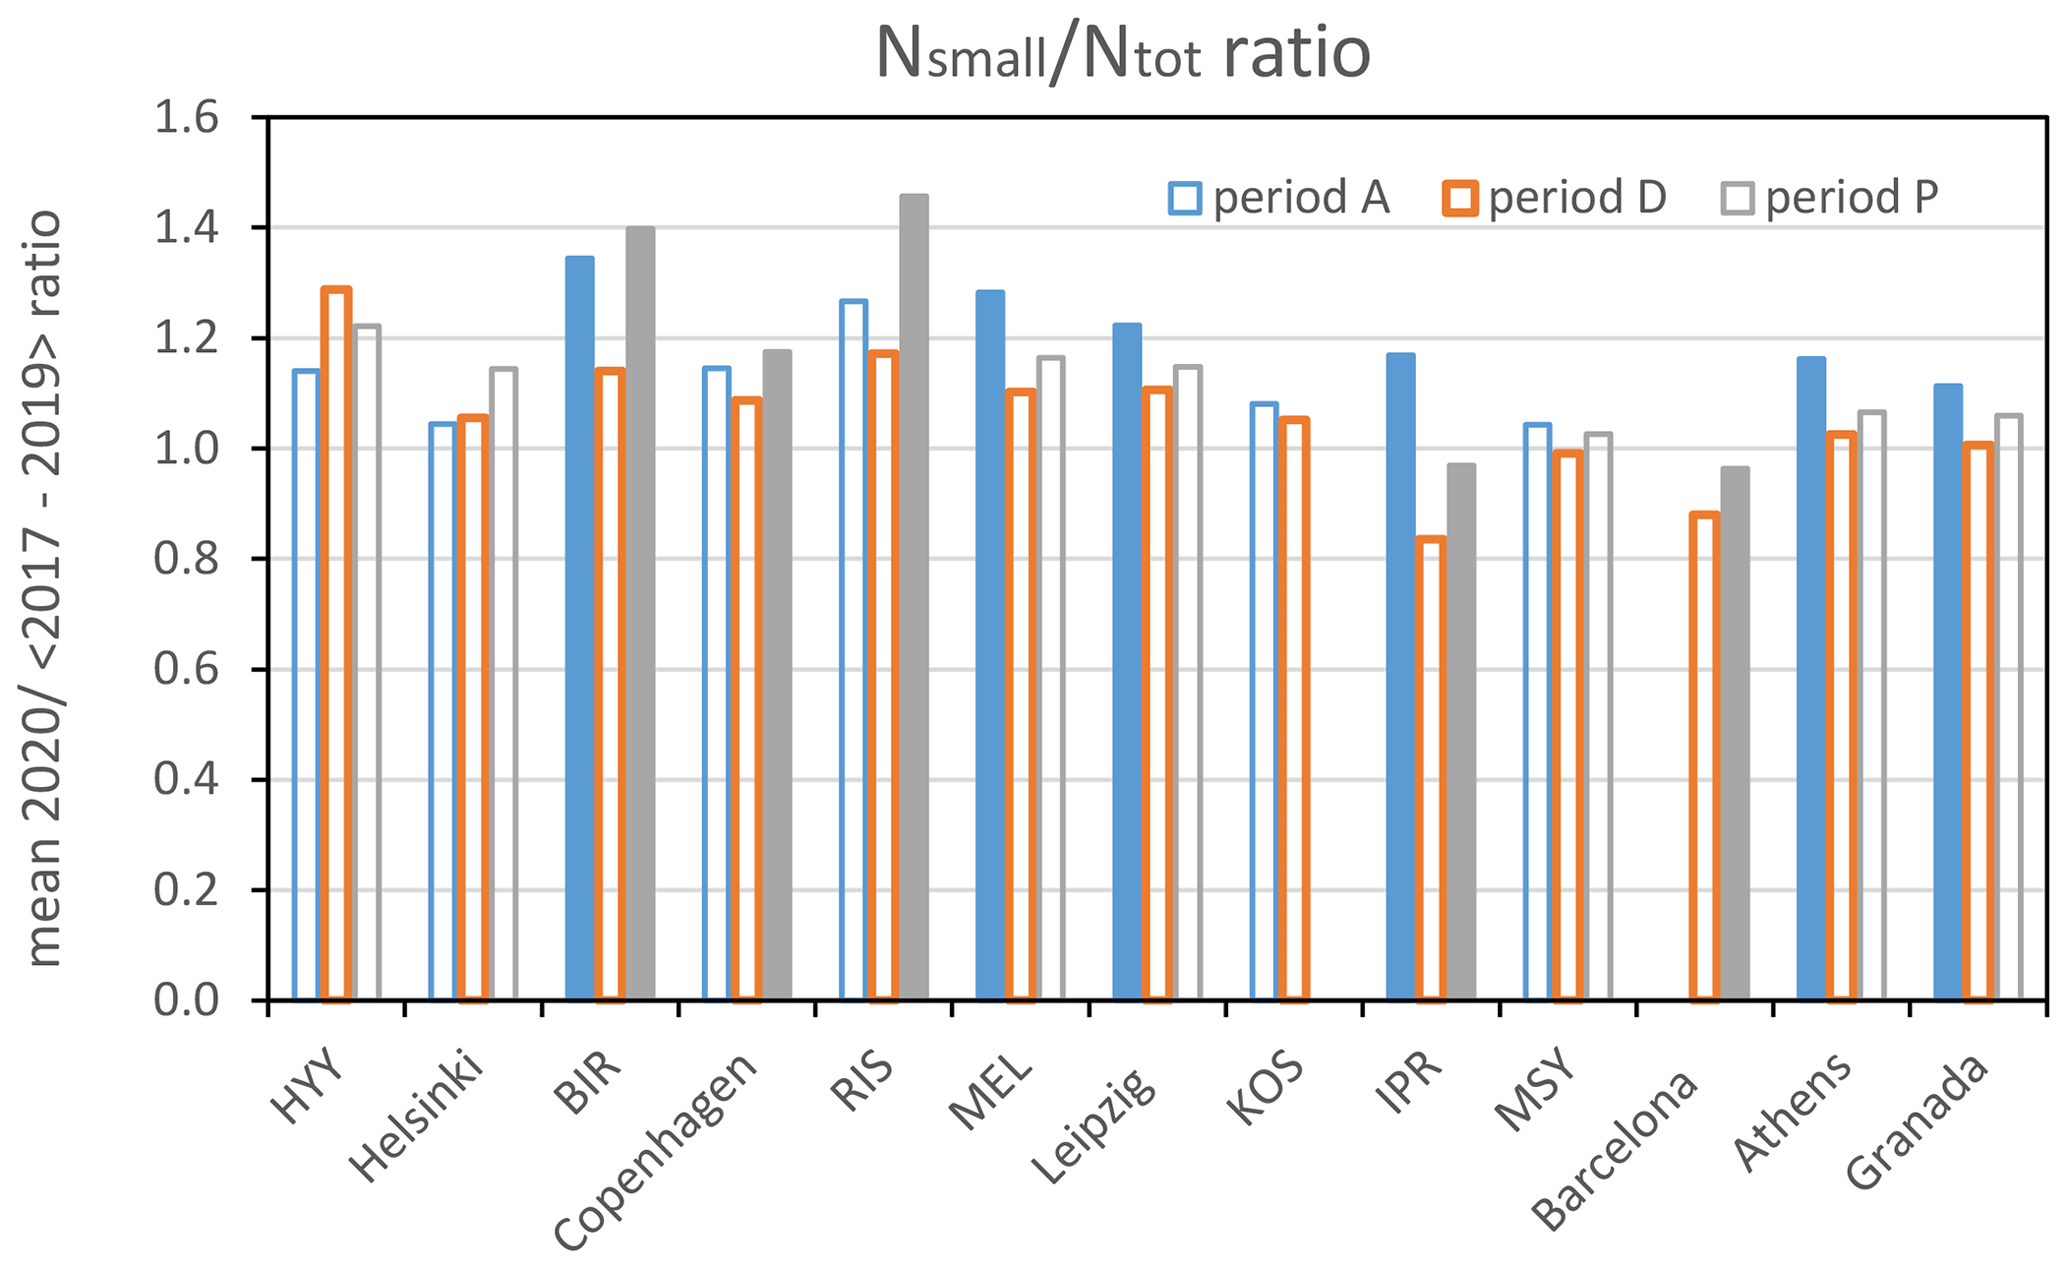
Figure 8Mean 2020 (2017 to 2019) ratios during periods A, D and P. Filled bars indicate means which are statistically different from the means during lockdown periods (D). No data are available for KOS during period P and for Barcelona during period A.
These observations suggest that the decrease in traffic resulting from the implementation of the lockdown measures led on average to a significant but moderate decrease in the number concentration of primary ultrafine particles (which dominate the 15–70 nm size range in urban environments). The lack of a complete return to usual PNSDs after the lockdown period ended can be explained by only partial recovery in human mobility in Athens (GR) and Granada (ES) but not in Leipzig (DE), where mobility almost completely (95 %) recovered.
During the lockdown period (D), statistically significant changes in the contribution of small particles to the whole PNSD () were also detected at four out of six regional background sites, i.e. BIR (NO), RIS (DK), MEL (DE) and IPR (IT). Variations in RIS and MEL reflected quite well the variations in the nearby cities of Copenhagen and Leipzig. Clear decreases and increases in corresponding to the lockdown measures' implementation and relaxation, respectively, can be noticed at both BIR (NO) and IPR (IT). The variations observed in IPR can easily be related to the variations in the driving route request index for the densely populated and traffic-impacted Lombardy region. In contrast, it is surprising to observe such significant changes in the PNSD in BIR, located in a region (Agder) where the driving mobility index remained relatively high, even during the lockdown period. Lockdown measures also had a huge impact on PM mass concentration in BIR (Fig. 3), but providing a specific explanation for the case of BIR is beyond the scope of this study. On average, the implementation and relaxation of lockdown measures coincided with a decrease by −9 ± 13 % and an increase by +11 ± 12 %, respectively, in the ratio at regional background sites.
In short, except for the two sites located in Finland, the lockdown periods coincided with unusually low shares of small particles () at all sites, although differences were not all statistically significant. This suggests that the lockdown measures did have an impact on primary particle emissions. However, considering the huge changes in the driving route request index for a vast majority of sites in this study, the impact on PNSD was not quite as dramatic. This suggests that private cars do not contribute a large share of the overall emission of 15–70 nm particles at the sites we studied or that the decrease in this specific source was compensated for by increases in other sources (possibly including nucleation and growth of new particles) during the lockdown periods.
Specific impacts on air pollution of the implementation and relaxation of lockdown measures to prevent the spread of COVID-19 were determined by comparing observations with expected data for the period 17 February–31 May 2020 (Table 2).
Driving direction request data suggest that the reduction in car passenger traffic resulting from the lockdown measures was much more pronounced in southern Europe than in northern Europe. Regardless of the variations in these human mobility indicators, we did not observe statistically significant decreases in PM2.5 and PM10 mass concentrations at most of the European urban sites considered in our analysis. Consequently, the implementation of lockdown measures in March 2020 did not lead on average to a decrease in PM2.5 and/or PM10 mass concentrations across these sites. In contrast, the relaxation of the lockdown measures in May 2020 led to an increase in PM2.5 and/or PM10 concentrations at more than half of the cities studied, resulting in a mean increase of +26 % in both PM2.5 and PM10 concentrations. At regional background sites, the implementation of the lockdown measures yielded a significant impact at an even more limited number of sites, whereas their relaxation resulted in PM2.5 and/or PM10 mass concentration increases at most of them. The asymmetrical response of PM mass concentrations to the implementation and relaxation of lockdown measures suggests a relationship that is more complex than expected between road traffic intensity and PM mass concentrations. By looking at a range of other atmospheric variables, we gained more insights into this phenomenon.
Regarding key gaseous pollutants, NO2 concentrations significantly decreased at of the urban sites due to the implementation of lockdown measures and significantly re-increased at of them due to lockdown measure relaxation. On average, the implementation and relaxation of lockdowns resulted in a notable −29 % decrease and in a +31 % rebound in NO2 concentration, respectively. These figures suggest that mobility restrictions did translate into decreases in road traffic NOx emissions. However, the extent of the changes in NO2 concentrations did not correlate well with the changes in human mobility. This disparity could be attributed to the fact that driving route request indices differently reflected the number of kilometres driven in various countries and to different proportions of vehicles complying with the various Euro emission standards across Europe.
The implementation of lockdown measures also altered the oxidising capacity of the atmosphere, potentially resulting in the formation of a larger quantity of secondary aerosols during lockdown periods, despite lower levels of gaseous precursors. Specifically, our study revealed a significant increase in O3 concentrations (an indicator of the oxidising capacity of the atmosphere) due to the lockdown implementation at one-half of the urban and regional background sites. The production of secondary particulate matter could have been boosted at these sites. Modelling work by Clappier et al. (2021) demonstrated that decreases in NOx emissions would result in increased secondary PM concentrations in some areas of Europe. Nevertheless, additional data pertaining to the aerosol chemical composition would be needed to ascertain whether this process exerted a substantial impact on PM mass concentrations as lockdown measures were implemented at the studied sites located in these areas.
Possible changes in some intrinsic aerosol properties (such as the light absorption spectrum and the particle size distribution shape) were also assessed in this work. The occurrence of significantly higher AÅE values during the lockdown periods at a few sites in Norway, France, Italy, Greece and Spain indicates a relatively large contribution of black carbon from wood burning as compared to fossil fuel burning during these periods. Therefore, the decrease in PM concentrations associated with traffic-related sources could have been partially offset by an increase in PM concentrations related to domestic heating activities at these sites. However, this phenomenon was apparently not generalised throughout Europe.
Regarding PNSD, a statistically significant lockdown effect was observed at most of the studied sites. On average, moderate −7 % and −9 % decreases were observed in the contribution of small particles to the total particle number concentration across urban and regional background sites, respectively. These figures indicate that the implementation of lockdown measures resulted in a decrease in primary particle emissions (predominantly in the 15–70 nm range) compared to the production of secondary particles (mainly in the range of 100 nm to a few hundreds of nanometres). Consequently, it is suggested that measures leading to a reduction in passenger car traffic (such as lockdown measures) would likely have a larger impact on particle number concentrations (which are strongly dependent on the abundance of small particles) than on PM mass concentrations (which are more sensitive to the number of particles in the range of 70 nm to several hundreds of nanometres) in urban areas.
Our results on PM10 and PM2.5 align with previous studies that similarly reported limited impacts of lockdowns on PM mass concentrations over Europe and the USA (Archer et al., 2020; Bekbulat et al., 2021; Shi et al., 2021; Querol et al., 2021). However, they contrast with other findings that indicated substantial reductions in PM mass concentrations in several big European and American cities due to the COVID-19 lockdown measures (Chauhan and Singh, 2020; Beloconi et al., 2021; Jiang et al., 2021). Several factors could help explain these contrasting observations: (i) the effectiveness of lockdown measures in reducing PM mass concentrations can vary across different regions due to variations in factors such as population density, variability in the pollution sources such as industrial activities and transportation patterns, and local meteorological conditions; (ii) the level of stringency, duration and adherence to lockdown measures can vary between different countries or even within different regions of the same country; (iii) the response of different PM chemical constituents to lockdown measures can vary, leading to varying observations across studies when only whole PM10 or PM2.5 mass concentrations are considered; and (iv) the existing pollution levels before the implementation of lockdown measures can influence the magnitude of changes observed during the lockdown period. If the baseline pollution levels were already low, the impact of lockdown measures may be less detectable compared to areas with higher initial pollution levels.
Overall, this comprehensive study encompassing 28 European sites enhances our understanding of the human mobility restriction on particulate air pollution, leveraging the unique circumstances of COVID-19 lockdowns. In particular, we highlighted the complexity of PM mass concentration responses to the COVID lockdown measures implemented throughout Europe, which arise from a combination of several factors. These include uneven levels of stringency across different European countries, evidenced compensation between road traffic and domestic heating emissions at some sites, and the potential for heightened formation of secondary PM at other sites. Quantitatively assessing the distinct contributions of these phenomena across Europe remains an important task for future research and goes beyond the scope of this study. Nevertheless, the “experiment” presented by the COVID-19 lockdowns suggests that the ongoing decrease in exhaust emissions by the passenger car fleet might yield quite contrasting impacts on air quality in European cities.
Observation data from ACTRIS observatories are available from the ACTRIS Data Centre (NILU, 2011) at https://actris.nilu.no (last access: 29 June 2023) and from the EBAS database (NILU, 2023) at https://ebas-data.nilu.no/ (last access: 29 June 2023). Observation data from urban sites are available from local air quality monitoring networks and from the Air Quality e-Reporting datahub at https://www.eea.europa.eu/data-and-maps/data/aqereporting (last access: 29 June 2023, EEA, 2022). Model forecasts for all sites are available from CAMS European air quality forecasts (Marecal et al., 2015) at https://ads.atmosphere.copernicus.eu/cdsapp#!/dataset/cams-europe-air-quality-forecasts?tab=form (last access: 24 March 2023).
The supplement related to this article is available online at: https://doi.org/10.5194/acp-23-10145-2023-supplement.
Conceptualisation and methodology: JPP and EP. Formal analysis: JPP. Investigation: JPP, AM, CH, JS, MP, JO, SM, KW, MM, LP, DvP, AM, CN, CR, NP, SC, MS, JAA, TP, KL, JN, VR, JFdB, AC, OF, JEP, VG, MIG, SV, ED, HDvdG, KEY and WA. Original draft preparation: JPP. Review and editing: EP, AM, CH, MP, JO, SM, AW, LP, HH, AM, AA, NP, SC, MS, JAA, KL, JN, VR, JFdB, AC, KE, HDvdG and WA.
One of the co-authors is a member of the editorial board of Atmospheric Chemistry and Physics. The peer-review process was guided by an independent editor, and the authors have also no other competing interests to declare.
The information and views set out are those of the authors and do not
necessarily reflect the official opinion of the European Commission.
Publisher’s note: Copernicus Publications remains neutral with regard to jurisdictional claims in published maps and institutional affiliations.
The research presented here relied on the data and products made available open access by the Copernicus Atmosphere Monitoring Service (CAMS) of the Copernicus programme of the European Union, in particular the CAMS policy service, https://policy.atmosphere.copernicus.eu/ (last access: 21 March 2022).
PNSD and particle light absorption data were provided by the ACTRIS Data Centre developed under the European Union's Horizon 2020 research and innovation programme under grant no. 654109 (ACTRIS-2). Data quality assurance has been supported by the ACTRIS IMP project of the European Commission under grant no. 871115.
The Belgian Interregional Environment Agency (IRCEL – CELINE) is acknowledged for the provision of PM10, PM2.5, NO, NO2 and O3 data from Brussels.
The Czech Hydrometeorological Institute provided air quality monitoring data from Prague (Libuš). Conditions of data utilisation are available via the following link (in Czech): https://www.chmi.cz/files/portal/docs/uoco/historicka_data/OpenIsko_data (last access: 21 March 2022).
Data from Leipzig-West were kindly provided by the Saxon State Office for Environment, Agriculture and Geology (LfULG).
IMT Nord Europe acknowledges financial support from the Labex CaPPA project, which is funded by the French National Research Agency (ANR) through the PIA (Programme d'Investissement d'Avenir) under contract ANR-11-LABX-0005-01, and the CLIMIBIO project, financed by both the Regional Council of Hauts-de-France and the European Regional Development Fund (ERDF). IMT Nord Europe participated in the COST Action CA16109 COLOSSAL. The ATOLL site (Lille) is one of the French ACTRIS National Facilities and contributes to the CARA programme of the LCSQA funded by the French Ministry of Ecological Transition.
Airparif and Atmo Hauts-de-France, the French agencies for air quality monitoring in the Île-de-France and Hauts-de-France regions, respectively, kindly provided open access to air quality data.
ARPA Lombardia kindly provided air quality data from Milan.
The Rotterdam EPA (DCMR) kindly provided air quality measurements in Rotterdam.
This research has been supported by the European Commission, Horizon 2020 (grants nos. 654109 and 871115).
This paper was edited by Yuan Wang and reviewed by two anonymous referees.
Altuwayjiri, A., Soleimanian, E., Moroni, S., Palomba, P., Borgini, A., De Marco, C., Ruprecht, A. A., and Sioutas, C.: The impact of stay-home policies during Coronavirus-19 pandemic on the chemical and toxicological characteristics of ambient PM2.5 in the metropolitan area of Milan, Italy, Sci. Total Environ., 758, 143582, https://doi.org/10.1016/j.scitotenv.2020.143582, 2021.
Archer, C. L., Cervone, G., Golbazi, M., Al Fahel, N., and Hultquist, C.: Changes in air quality and human mobility in the USA during the COVID-19 pandemic, B. Atmos. Sci. Technol., 1, 491–514, https://doi.org/10.1007/s42865-020-00019-0, 2020.
Barré, J., Petetin, H., Colette, A., Guevara, M., Peuch, V.-H., Rouil, L., Engelen, R., Inness, A., Flemming, J., Pérez García-Pando, C., Bowdalo, D., Meleux, F., Geels, C., Christensen, J. H., Gauss, M., Benedictow, A., Tsyro, S., Friese, E., Struzewska, J., Kaminski, J. W., Douros, J., Timmermans, R., Robertson, L., Adani, M., Jorba, O., Joly, M., and Kouznetsov, R.: Estimating lockdown-induced European NO2 changes using satellite and surface observations and air quality models, Atmos. Chem. Phys., 21, 7373–7394, https://doi.org/10.5194/acp-21-7373-2021, 2021.
Bekbulat, B., Apte, J. S., Millet, D. B., Robinson, A. L., Wells, K. C., Presto, A. A., and Marshall, J. D.: Changes in criteria air pollution levels in the US before, during, and after Covid-19 stay-at-home orders: Evidence from regulatory monitors, Sci. Total Environ., 769, 144693, https://doi.org/10.1016/j.scitotenv.2020.144693, 2021.
Beloconi, A., Probst-Hensch, N. M., and Vounatsou, P.: Spatio-temporal modelling of changes in air pollution exposure associated to the COVID-19 lockdown measures across Europe, Sci. Total Environ., 787, 147607, https://doi.org/10.1016/j.scitotenv.2021.147607, 2021.
CAMS: European air quality forecasts, CAMS [data set], https://ads.atmosphere.copernicus.eu/cdsapp#!/dataset/cams-europe-air-quality-forecasts?tab=form (last access: 24 March 2023), 2020.
Cerqua, A. and Di Stefano, R.: When did coronavirus arrive in Europe?, Stat. Method. Appl., 31, 181–195, doi.org/10.1007/s10260-021-00568-4, 2022.
Chauhan, A. and Singh, R. P.: Decline in PM2.5 concentrations over major cities around the world associated with COVID-19, Environ. Res., 187, 109634, https://doi.org/10.1016/j.envres.2020.109634, 2020.
Clappier, A., Thunis, P., Beekmann, M., Putaud, J. P., and Demeij, A.: Impact of SOx, NOx and NH3 emission reductions on PM2.5 concentrations across Europe: Hints for future measure development, Environ. Int., 156, 106699, https://doi.org/10.1016/j.envint.2021.106699, 2021.
Copernicus: Flawed estimates of the effects of lockdown measures on air quality derived from satellite observations, https://atmosphere.copernicus.eu/flawed-estimates-effects-lockdown-measures-air-quality-derived-satellite-observations (last access: 24 March 2023), 2020.
Degraeuwe, B., Pisoni, E., Peduzzi, E., De Meij, A., Monforti-Ferrario, F., Bodis, K., Mascherpa, A., Astorga-Llorens, M., Thunis, P., and Vignati, E.: Urban NO2 Atlas, EUR 29943 EN, Publications Office of the European Union, Luxembourg, ISBN 978-92-76-10387-5, https://doi.org/10.2760/538816, 2019.
Denier van der Gon, H. A. C., Bergström, R., Fountoukis, C., Johansson, C., Pandis, S. N., Simpson, D., and Visschedijk, A. J. H.: Particulate emissions from residential wood combustion in Europe – revised estimates and an evaluation, Atmos. Chem. Phys., 15, 6503–6519, https://doi.org/10.5194/acp-15-6503-2015, 2015.
EEA: Air quality in Europe – 2020 report, EEA Report No 11/2020, 164 pp., https://www.eea.europa.eu/publications/air-quality-in-europe-2020-report (last access: 24 March 2023), 2020.
EEA: Air Quality e-Reporting datahub, EEA [data set], https://www.eea.europa.eu/data-and-maps/data/aqereporting (last access: 29 June 2023), 2022.
Eleftheriadis, K., Gini, M. I., Diapouli, E., Vratolis, S., Vasilatou, V., Fetfatzis, P., and Manousakas, M. I.: Aerosol microphysics and chemistry reveal the COVID19 lockdown impact on urban air quality, Sci. Rep., 11, 14477, https://doi.org/10.1038/s41598-021-93650-6, 2021.
Galmarini, S., Kioutsioukis, I., Solazzo, E., Alyuz, U., Balzarini, A., Bellasio, R., Benedictow, A. M. K., Bianconi, R., Bieser, J., Brandt, J., Christensen, J. H., Colette, A., Curci, G., Davila, Y., Dong, X., Flemming, J., Francis, X., Fraser, A., Fu, J., Henze, D. K., Hogrefe, C., Im, U., Garcia Vivanco, M., Jiménez-Guerrero, P., Jonson, J. E., Kitwiroon, N., Manders, A., Mathur, R., Palacios-Peña, L., Pirovano, G., Pozzoli, L., Prank, M., Schultz, M., Sokhi, R. S., Sudo, K., Tuccella, P., Takemura, T., Sekiya, T., and Unal, A.: Two-scale multi-model ensemble: is a hybrid ensemble of opportunity telling us more?, Atmos. Chem. Phys., 18, 8727–8744, https://doi.org/10.5194/acp-18-8727-2018, 2018.
Garbariene, I., Dudoitis, V., Ulevicius, V., Plauškaite-Šukiene, K., Kilikevicius, A.; Matijošius, J., Rimkus, A., Kilikeviciene, K., Vainorius, D., Maknickas, A., Borodinas, S., and Bycenkiene, S.: Application of Acoustic Agglomeration Technology to Improve the Removal of Submicron Particles from Vehicle Exhaust, Symmetry, 13, 1200, https://doi.org/10.3390/sym13071200, 2021.
Giechaskiel, B.: Particle Number Emissions of a Diesel Vehicle during and between Regeneration Events, Catalysts, 10, 587, https://doi.org/10.3390/catal10050587, 2020.
Goldberg, D. L., Anenberg, S. C., Griffin, D., McLinden, C. A., Lu, Z., and Streets, D. G.: Disentangling the Impact of the COVID-19 Lockdowns on Urban NO2 from Natural Variability, Geophys. Res. Lett., 47, e2020GL089269, https://doi.org/10.1029/2020GL089269, 2020.
Grange, S. K., Lee, J. D., Drysdale, W. S., Lewis, A. C., Hueglin, C., Emmenegger, L., and Carslaw, D. C.: COVID-19 lockdowns highlight a risk of increasing ozone pollution in European urban areas, Atmos. Chem. Phys., 21, 4169–4185, https://doi.org/10.5194/acp-21-4169-2021, 2021.
Hammer, M. S., van Donkelaar, A., Martin, R. V., McDuffie, E. E., Lyapustin, A., Sayer, A. M., Hsu, N. C., Levy, R. C., Garay, M. J., Kalashnikova, O. V., and Kahn, R. A.: Effects of COVID-19 lockdowns on fine particulate matter concentrations, Sci. Adv., 7, eabg7670, https://doi.org/10.1126/sciadv.abg7670, 2021.
Helin, A., Virkkula, A., Backman, J., Pirjola, L., Sippula, O., Aakko-Saksa, P., Väätäinen, S., Mylläri, F., Järvinen, A., Bloss, M., Aurela, M., Jakobi, G., Karjalainen, P., Zimmermann, R., Jokiniemi, J., Saarikoski, S., Tissari, J., Rönkkö, T., Niemi, J. V., and Timonen, H.: Variation of absorption Ångström exponent in aerosols from different emission sources. J. Geophys. Res.-Atmos., 126, e2020JD034094, https://doi.org/10.1029/2020JD034094, 2021.
Hueglin, C., Gaegauf, C., Künzel, S., and Burtscher, H.: Characterization of Wood Combustion Particles: Morphology, Mobility, and Photoelectric Activity, Environ. Sci. Technol., 31, 3439–3447, https://doi.org/10.1021/es970139i, 1997.
IEA: The impacts of the Covid-19 crisis on global energy demand and CO2 emissions, https://www.iea.org/reports/global-energy-review-2020 (last access: 24 March 2023), 2020.
Jiang, Z., Shi, H., Zhao, B., Gu, Y., Zhu, Y., Miyazaki, K., Lu, X., Zhang, Y., Bowman, K. W., Sekiya, T., and Liou, K.-N.: Modeling the impact of COVID-19 on air quality in southern California: implications for future control policies, Atmos. Chem. Phys., 21, 8693–8708, https://doi.org/10.5194/acp-21-8693-2021, 2021.
Kiesewetter, G., Borken-Kleefeld, J., Schöpp, W., Heyes, C., Thunis, P., Bessagnet, B., Terrenoire, E., Fagerli, H., Nyiri, A., and Amann, M.: Modelling street level PM10 concentrations across Europe: source apportionment and possible futures, Atmos. Chem. Phys., 15, 1539–1553, https://doi.org/10.5194/acp-15-1539-2015, 2015.
Kroll, J. H., Heald, C. L., Cappa, C. D, Farmer, D. K., Fry, J. L., Murphy, G. L., and Steiner, A. L.: The complex chemical effects of COVID-19 shutdowns on air quality, Nat. Chem., 12, 777–779, https://doi.org/10.1038/s41557-020-0535-z, 2020.
Kuenen, J., Dellaert, S., Visschedijk, A., Jalkanen, J.-P., Super, I., and Denier van der Gon, H.: CAMS-REG-v4: a state-of-the-art high-resolution European emission inventory for air quality modelling, Earth Syst. Sci. Data, 14, 491–515, https://doi.org/10.5194/essd-14-491-2022, 2022.
Le, T., Wang, Y., Liu, L., Yang, J., Yung, Y. L., Li, G., and Seinfeld, J. H.: Unexpected air pollution with marked emission reductions during the COVID-19 outbreak in China, Science, 369, 702–706, 2020.
Marécal, V., Peuch, V.-H., Andersson, C., Andersson, S., Arteta, J., Beekmann, M., Benedictow, A., Bergström, R., Bessagnet, B., Cansado, A., Chéroux, F., Colette, A., Coman, A., Curier, R. L., Denier van der Gon, H. A. C., Drouin, A., Elbern, H., Emili, E., Engelen, R. J., Eskes, H. J., Foret, G., Friese, E., Gauss, M., Giannaros, C., Guth, J., Joly, M., Jaumouillé, E., Josse, B., Kadygrov, N., Kaiser, J. W., Krajsek, K., Kuenen, J., Kumar, U., Liora, N., Lopez, E., Malherbe, L., Martinez, I., Melas, D., Meleux, F., Menut, L., Moinat, P., Morales, T., Parmentier, J., Piacentini, A., Plu, M., Poupkou, A., Queguiner, S., Robertson, L., Rouïl, L., Schaap, M., Segers, A., Sofiev, M., Tarasson, L., Thomas, M., Timmermans, R., Valdebenito, Á., van Velthoven, P., van Versendaal, R., Vira, J., and Ung, A.: A regional air quality forecasting system over Europe: the MACC-II daily ensemble production, Geosci. Model Dev., 8, 2777–2813, https://doi.org/10.5194/gmd-8-2777-2015, 2015 (data available at: https://ads.atmosphere.copernicus.eu/cdsapp#!/dataset/cams-europe-air-quality-forecasts?tab=form).
Meppelink, J., van Langen, J., Siebes, A., Spruit, M., and Visvizi, A.: Beware Thy Bias: Scaling Mobile Phone Data to Measure Traffic Intensities, Sustainability, 12, 3631, https://doi.org/10.3390/su12093631, 2020.
NILU: ACTRIS Data Centre, NILU [data set], https://actris.nilu.no/ (last access: 29 June 2023), 2011.
NILU: EBAS, NILU [data set], https://ebas-data.nilu.no/ (last access: 29 June 2023), 2023.
Ou, S., He, X., Ji, W., Chen, W., Sui, L., Gan, Y., Lu, Z., Lin, Z., Deng, S., Przesmitzki, S., and Bouchard, J.: Machine learning model to project the impact of COVID-19 on US motor gasoline demand, Nature Energy, 5, 666–673, https://doi.org/10.1038/s41560-020-0662-1, 2020.
Petetin, H., Bowdalo, D., Soret, A., Guevara, M., Jorba, O., Serradell, K., and Pérez García-Pando, C.: Meteorology-normalized impact of the COVID-19 lockdown upon NO2 pollution in Spain, Atmos. Chem. Phys., 20, 11119–11141, https://doi.org/10.5194/acp-20-11119-2020, 2020.
Petit, J.-E., Dupont, J.-C., Favez, O., Gros, V., Zhang, Y., Sciare, J., Simon, L., Truong, F., Bonnaire, N., Amodeo, T., Vautard, R., and Haeffelin, M.: Response of atmospheric composition to COVID-19 lockdown measures during spring in the Paris region (France), Atmos. Chem. Phys., 21, 17167–17183, https://doi.org/10.5194/acp-21-17167-2021, 2021.
Pommier, M., Fagerli, H., Schulz, M., Valdebenito, A., Kranenburg, R., and Schaap, M.: Prediction of source contributions to urban background PM10 concentrations in European cities: a case study for an episode in December 2016 using EMEP/MSC-W rv4.15 and LOTOS-EUROS v2.0 – Part 1: The country contributions, Geosci. Model Dev., 13, 1787–1807, https://doi.org/10.5194/gmd-13-1787-2020, 2020.
Putaud, J.-P., Pozzoli, L., Pisoni, E., Martins Dos Santos, S., Lagler, F., Lanzani, G., Dal Santo, U., and Colette, A.: Impacts of the COVID-19 lockdown on air pollution at regional and urban background sites in northern Italy, Atmos. Chem. Phys., 21, 7597–7609, https://doi.org/10.5194/acp-21-7597-2021, 2021.
Querol, X., Massagué, J., Alastuey, A., Moreno, T., Gangoiti, G., Mantilla, E., Duéguez, J.J., Escudero, M., Monfort, E., García-Pando, C.P., Oriol Jorba, H. P., Vázquez, V., de la Rosa Alberto Campos, J., Muñóz, M., Monge, S., Hervás, M., Javato, R., and Cornide, M. J.: Lessons from the COVID-19 air pollution decrease in Spain: Now what?, Sci. Total Environ., 779, 146380, https://doi.org/10.1016/j.scitotenv.2021.146380, 2021.
Riccio, A., Giunta, G., and Galmarini, S.: Seeking for the rational basis of the Median Model: the optimal combination of multi-model ensemble results, Atmos. Chem. Phys., 7, 6085–6098, https://doi.org/10.5194/acp-7-6085-2007, 2007.
Schiermeier, Q.: Why pollution is plummeting in some cities – but not others, Nature, 580, 313, https://doi.org/10.1038/d41586-020-01049-6, 2020.
Shi, Z., Song, C., Liu, B., Lu, G., Xu, J., Van Vu, T., Elliott, R. J. R., Li, W., Bloss, W. J., and Harrison, R. M.: Abrupt but smaller than expected changes in surface air quality attributable to COVID-19 lockdowns, Sci. Adv., 7, eabd6696, https://doi.org/10.1126/sciadv.abd6696, 2021.
Thunis, P., Degraeuwe, B., Pisoni, E., Trombetti, M., Peduzzi, E., Belis, C. A., Wilson, J., and Vignati, E.: Urban PM2.5 Atlas – Air Quality in European cities, EUR 28804 EN, Publications Office of the European Union, Luxembourg, ISBN 978-92-79-73876-0, https://doi.org/10.2760/336669, 2017.
Thunis, P., Degraeuwe, B., Pisoni, E., Trombetti, M., Peduzzi, E., Belis, C. A., Wilson, J., Clappier, A., and Vignati, E.: PM2.5 source allocation in European cities: A SHERPA modelling study, Atmos. Environ., 187, 93–106, https://doi.org/10.1016/j.atmosenv.2018.05.062, 2018.
Venter, Z. S., Aunan, K., Chowdhury, S., and Lelieveld, J.: COVID-19 lockdowns cause global air pollution declines, P. Natl. Acad. Sci., 117, 18984–18990, https://doi.org/10.1073/pnas.2006853117, 2020.
Yang, J., Wen, Y., Wang, Y., Zhang, S., Pinto, J. P., Pennington, E. A., Wang, Z., Wu, Y., Sander, S. P., Jiang, J. H., Hao, J., Yung, Y. L., and Seinfeld, J. H.: From COVID-19 to future electrification: Assessing traffic impacts on air quality by a machine-learning model, P. Natl. Acad. Sci. USA, 118, e2102705118, https://doi.org/10.1073/pnas.2102705118, 2021.