the Creative Commons Attribution 4.0 License.
the Creative Commons Attribution 4.0 License.
 | 08 Sep 2023
Measurements and calculations of enhanced side- and back-scattering of visible radiation by black carbon aggregates
Carynelisa Haspel
Cuiqi Zhang
Martin J. Wolf
Daniel J. Cziczo
Maor Sela
Aerosol particles have both natural and anthropogenic origins and are ubiquitous in the atmosphere. One particularly important type is carbonaceous aerosol, including a specific subset often termed “elemental carbon” chemically or “black carbon” (BC) radiatively. Carbonaceous aerosol particles have implications for atmospheric chemistry, human health, and climate, both directly and via their ability to act as sites of cloud droplet or ice crystal formation. Laboratory experiments and theory are needed to better understand these particles, specifically their radiative impact. Here we present laboratory measurements of scattering of visible radiation by analogs of atmospheric BC aggregates at scattering angles of 135±20∘ obtained using a depolarizing optical particle counter and accompanying theoretical calculations of scattering by compact and fractal theoretical BC aggregates. We show that, with random orientation, the theoretical calculations reproduce the qualitative behavior of the measurements but are unable to reproduce the highest values of the linear depolarization ratio; we are only able to obtain high values of the linear depolarization ratio using fixed orientation. Both our measurements and our theoretical calculations point to the possibility that fresh, unaged, bare, or uncoated BC aggregates, as opposed to the aged or coated BC or soot that was investigated in previous studies, can exhibit a higher back-scattering linear depolarization than previously assumed.
- Article
(6941 KB) - Full-text XML
- BibTeX
- EndNote


Accurate calculations of the single-scattering properties of black carbon (BC) aerosol particles are important for estimating their radiative forcing of the climate and for interpreting remote-sensing observations, and indeed many previous studies have been dedicated to this topic. See, for example, the excellent review by Kahnert and Kanngießer (2020). These single-scattering properties include the scattering, absorption, and extinction cross sections and the scattering asymmetry factor or the full scattering phase matrix. BC particles are often found in the atmosphere in the form of aggregates of primary particles, and the aggregates are often described using fractal parameters (see, for example, Sorensen, 2001). More extended fractal aggregates are generally considered to be analogs of relatively fresh or unaged BC, while more compact, roughly spherical aggregates are considered to be analogs for BC that has “collapsed” into a quasi-spherical structure after cloud processing or aging (Ma et al., 2013; Sedlacek et al., 2015). Thus, a proper calculation of the radiative properties of BC particles must include a proper description of the aggregate structure (see, e.g., Bond and Bergstrom, 2006; Kahnert and Kanngießer, 2020, and references therein). The aggregate shape of BC particles also causes linearly polarized incident light to become partially depolarized upon scattering (Lu and Sorensen, 1994; Bescond et al., 2013; Paulien et al., 2019). Thus, the linear depolarization ratio (the ratio of cross-polarized scattered intensity to incident intensity) can be a useful quantity for assessing aggregate shape effects in forward calculations and conversely for detecting the presence of aggregate-shaped particles and other nonspherical particles using remote-sensing data.
Sela and Haspel (2021) presented theoretical calculations of scattering of visible radiation by pairs of aggregates comprised of spherical nanoscale primary particles. Each aggregate pair consisted of an ordered aggregate with a simple cubic (SC) configuration and a disordered aggregate with an ideal amorphous solid (IAS) configuration based on the model of Stachurski (2003, 2011, 2013), and the scattering was computed using the multiple-sphere T-matrix (MSTM) model of Mackowski and Mishchenko (1996). Sela and Haspel (2021) found that, holding all other parameters constant, in most cases, the overall scattering and absorption and hence extinction of radiation by ordered aggregates are stronger than for disordered aggregates. At the same time, they found that, holding all other parameters constant, disordered aggregates tend to side-scatter and back-scatter more strongly than ordered aggregates.
To further investigate the influence of the configuration of the primary particles in an aggregate on side- and back-scattering by the aggregate, in the present study, we compare new theoretical calculations of the scattering of visible radiation by aggregates against scattering measurements conducted on analogs of atmospheric BC aggregates whose microphysical and ice nucleation properties were presented in Zhang et al. (2020). The BC sample sets labeled “COJ300” and “R2500U 400 nm” in Zhang et al. (2020) exhibit primary-particle diameters (dpp; nm) and mobility diameters (Dm; 400 nm) that are similar to one another. At the same time, the outer envelopes of the COJ300 samples appear more spherical, while the outer envelopes of the R2500U samples appear more extended (see Fig. 1). This is consistent with the fact that the mean fractal dimension (Df) of the COJ300 samples (2.34 with a 95 % confidence interval range of 2.12–2.56) is higher than the mean fractal dimension of the R2500U samples (1.92 with a 95 % confidence interval range of 1.68–2.16). See Table 1 of Zhang et al. (2020). See also DeCarlo et al. (2004) for a comprehensive discussion of particle morphology parameters. The fact that the BC sample sets COJ300 and R2500U from Zhang et al. (2020) exhibit similar primary-particle diameters and similar mobility diameters but different fractal parameters allows us to isolate the influence of the configuration of the primary particles within the aggregates on their side- and back-scattering properties, holding other factors constant to the greatest possible extent.
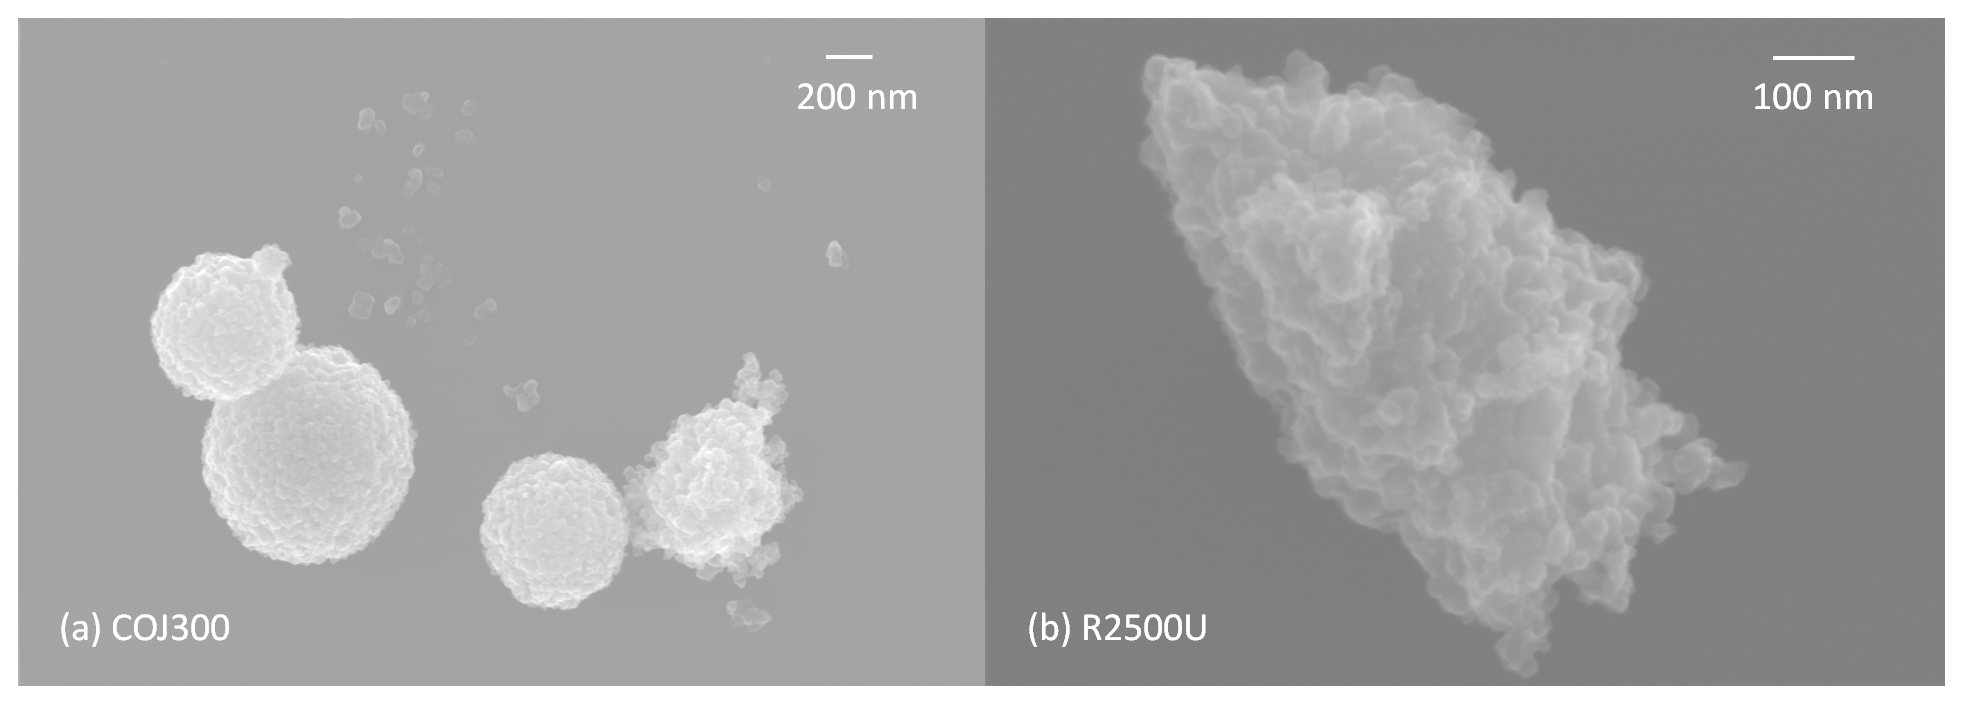
Figure 1SEM images of size-selected 400 nm aggregates from sample sets (a) COJ300 and (b) R2500U.
In the present study, we examine the scattering measurements in an angular range of 135±20∘ obtained with the SPectrometer for Ice Nuclei (SPIN; Garimella et al., 2016) instrumentation at a 670 nm wavelength for the aforementioned two sets of samples, COJ300 and R2500U size-selected at 400 nm, from Zhang et al. (2020). Then, we conduct new theoretical calculations for comparison to the measured scattering in a similar manner to Sela and Haspel (2021), where the aggregates in each set consist of the same number of primary particles, Npp, of the same dpp but differing configurations of the primary particles, and now focusing on BC aggregates. Thus, we can examine whether the side- and back-scattering tendencies found in Sela and Haspel (2021) are reproduced in actual measurements and how the configuration of the primary particles influences these tendencies.
In addition, given that the SPIN measurements are in situ measurements of scattering by individual particles rather than bulk scattering measurements, we have a unique opportunity to examine how the present set of measurements and calculations compares with previous measurements and calculations of side- and back-scattering by bare or uncoated BC aggregates, such as those presented in Bohren and Kho (1985), Lu and Sorensen (1994), Gustafson and Kolokolova (1999), Liu and Mishchenko (2005, 2007), Liu et al. (2008), Burton et al. (2014, 2015), Kahnert and Kanngießer (2020) and references therein, and Romshoo et al. (2021).
2.1 SPIN scattering measurements
Optical measurements were performed using a linear depolarization optical particle counter (OPC) associated with the SPIN instrument (Garimella et al., 2016). The SPIN OPC is equipped with a continuous-wave 500 mW 670 nm wavelength laser (Osela ILS-640-250-FTH-1.5MM-100uM). Particle measurements are made with four optical detectors. See Garimella et al. (2016) for a more complete description of the OPC geometry, including a diagram of the instrumentation. Size is measured based on side-scattering with a detector situated at a zenith angle of 90∘ (i.e., 90∘ from the direction of propagation of the incident laser beam) using a Mangin mirror pair. Three back-scattering detectors measure the scattered photon counts according to polarization. The incident radiation from the laser is polarized with its electric field vector parallel to the scattering plane. Detectors P1 and P2 measure scattered photons with parallel polarization (the same polarization as the incident radiation), while detector S1 measures scattered photons with perpendicular polarization (electric field vectors perpendicular to the plane of the scattering). As mentioned in Sect. 1, these three detectors are each situated at a scattering zenith angle, θsca, of 135∘, with a half-angle of acceptance of 20∘. Detectors P1 and S1 collect photons from the same scattered photon stream after it passes through a 50–50 polarizing beam splitter, while detector P2 collects photons from a separate photon stream that propagates at a different azimuthal angle with respect to the direction of propagation of the incident laser beam (but that still propagates at a scattering zenith angle of 135±20∘). For each of these two photon streams, the scattered laser light propagating at ∘ first passes through a collimating lens, which transforms the scattered rays into parallel rays, followed by a focusing lens, which focuses the rays towards the detector. This lens configuration is intended to provide equal weight to each ray in the range ∘ and approximately unit transmission. Scattering data for each particle are recorded in units of photon counts (photons per second). Given that the incident radiation from the laser is polarized parallel to the scattering plane, a higher photon count registered in detector S1 (in an absolute sense and/or relative to the photon counts registered in detectors P1 and P2) indicates some asymmetry or nonsphericity in the shape of the scattering particles or possibly birefringence or chirality in the scattering particle material. See Droplet Measurement Technologies, Inc. (2013) and Garimella et al. (2016) for more details on the SPIN instrumentation.
Particle generation and characterization of the BC samples followed the methodology outlined in Zhang et al. (2020). The size distributions of measured BC particles follow a Poisson or log-normal distribution. To avoid the influence of multiply charged BC particles, which could reach up to 16 % of the total BC population, size thresholds corresponding with the 90 % quantile of the optical diameter (1310.7 nm for COJ300 and 6769.4 nm for R2500J, respectively) were applied to the particle-by-particle data. This filter accounts for the differences between the optical and mobility diameter while minimizing the impact of doubly and triply charged particles in our data analysis.
The relative humidity (RH) conditions of the SPIN experiments (62 % at −50 ∘C to 68 % at −40 ∘C) were below liquid water saturation. If any water vapor molecules had condensed onto the surfaces of the particles, they would have frozen immediately, resulting in an observable ice crystal signal. Ice crystals were not observed, and we therefore assume that the BC particles examined were dry.
2.2 Theoretical calculations
The theoretical aggregates are based on the mean microphysical properties of the COJ300 and R2500U 400 nm samples from Zhang et al. (2020), as listed in Sect. 1, but we also test the sensitivity of the results to variations in the overall aggregate diameter and to variations in dpp. For each set of aggregates, first, an SC aggregate with a roughly spherical outer envelope is constructed where, in each SC aggregate, the primary particles touch but do not overlap (point contact). Our default SC aggregate has an outer-envelope diameter (Douter-envelope) of 400 nm and a primary-particle diameter of 35 nm.
Next, the IAS model of Stachurski (2003, 2011, 2013) is employed to construct a disordered but very compact and still roughly spherical aggregate with the same values of Douter-envelope, dpp, and Npp as the respective SC aggregate. (Refer to the description of the pairs of aggregates in Sela and Haspel, 2021.) As with the SC aggregates, in the IAS aggregates, the primary particles touch one another but do not overlap, and each aggregate is monodisperse with respect to its primary particles.
Next, the fractal-aggregate-generating code of Mackowski (1995, 2006) is employed to generate two more aggregates based on a sequential cluster–cluster aggregation (CCA) algorithm. One of these two fractal aggregates is more compact in order to mimic the COJ300 samples, while the second of these two fractal aggregates is more extended in order to mimic the R2500U samples. Once again, as with the SC and IAS aggregates, in the CCA aggregates, the primary particles may touch but do not overlap, and each aggregate is monodisperse with respect to its primary particles. The CCA aggregates have the same values of dpp and Npp as the SC and IAS aggregates but do not have the same outer-envelope diameter (which in any case is not a meaningful diameter for such particles; see DeCarlo et al., 2004). The more compact CCA aggregates have a significantly larger outer envelope and a significantly higher porosity than the SC and IAS aggregates. The more extended CCA aggregates have an outer-envelope diameter that is even larger, a porosity that is even higher, and a more fractal appearance. (See, e.g., Figs. 2 and 3, where the explanations of the fractal parameters cited in the captions of Figs. 2 and 3 are contained in the following paragraphs.)
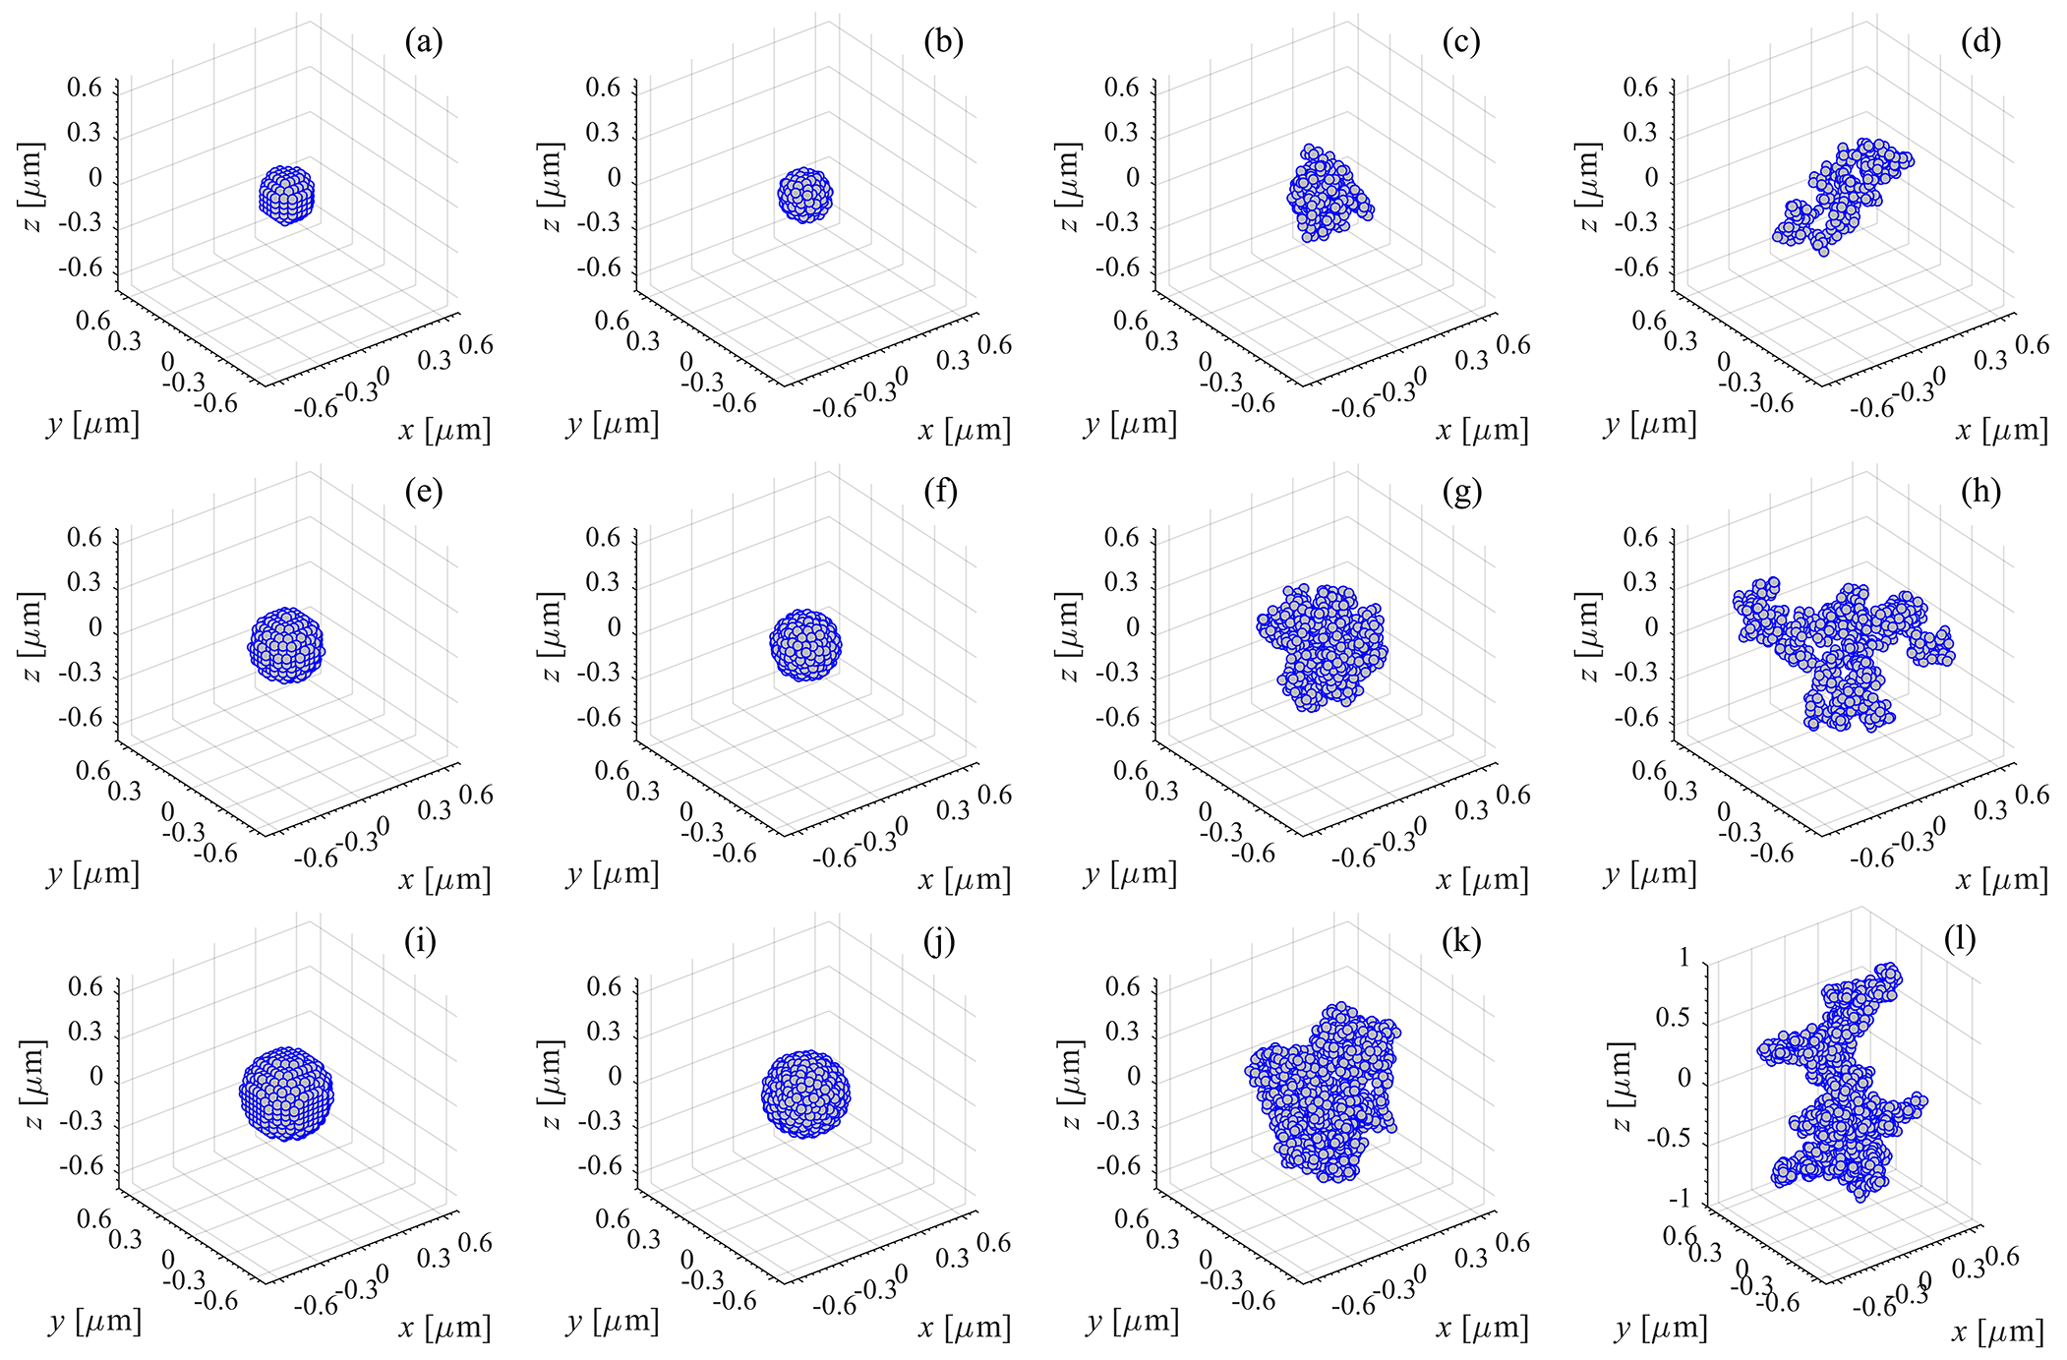
Figure 2Positions of the primary particles for aggregates with dpp=35 nm and varying values of Douter-envelope of the SC aggregate. Row 1 (aggregates with Douter-envelope of the SC aggregate =300 nm, Npp=3174, and dpp=35 nm): (a) SC; (b) IAS; (c) CCA, Df=2.34, kSorensen=1.085; (d) CCA, Df=1.92, kSorensen=1.873. Row 2 (aggregates with Douter-envelope of the SC aggregate =400 nm, Npp=771, and dpp=35 nm): (e) SC; (f) IAS; (g) CCA, Df=2.34, kSorensen=1.085; (h) CCA, Df=1.92, kSorensen=1.873. Row 3 (aggregates with Douter-envelope of the SC aggregate =500 nm, Npp=1529, and dpp=35 nm): (i) SC; (j) IAS; (k) CCA, Df=2.34, kSorensen=1.085; (l) CCA, Df=1.92, kSorensen=1.873. Note the different scale of the z axis in plot (l).
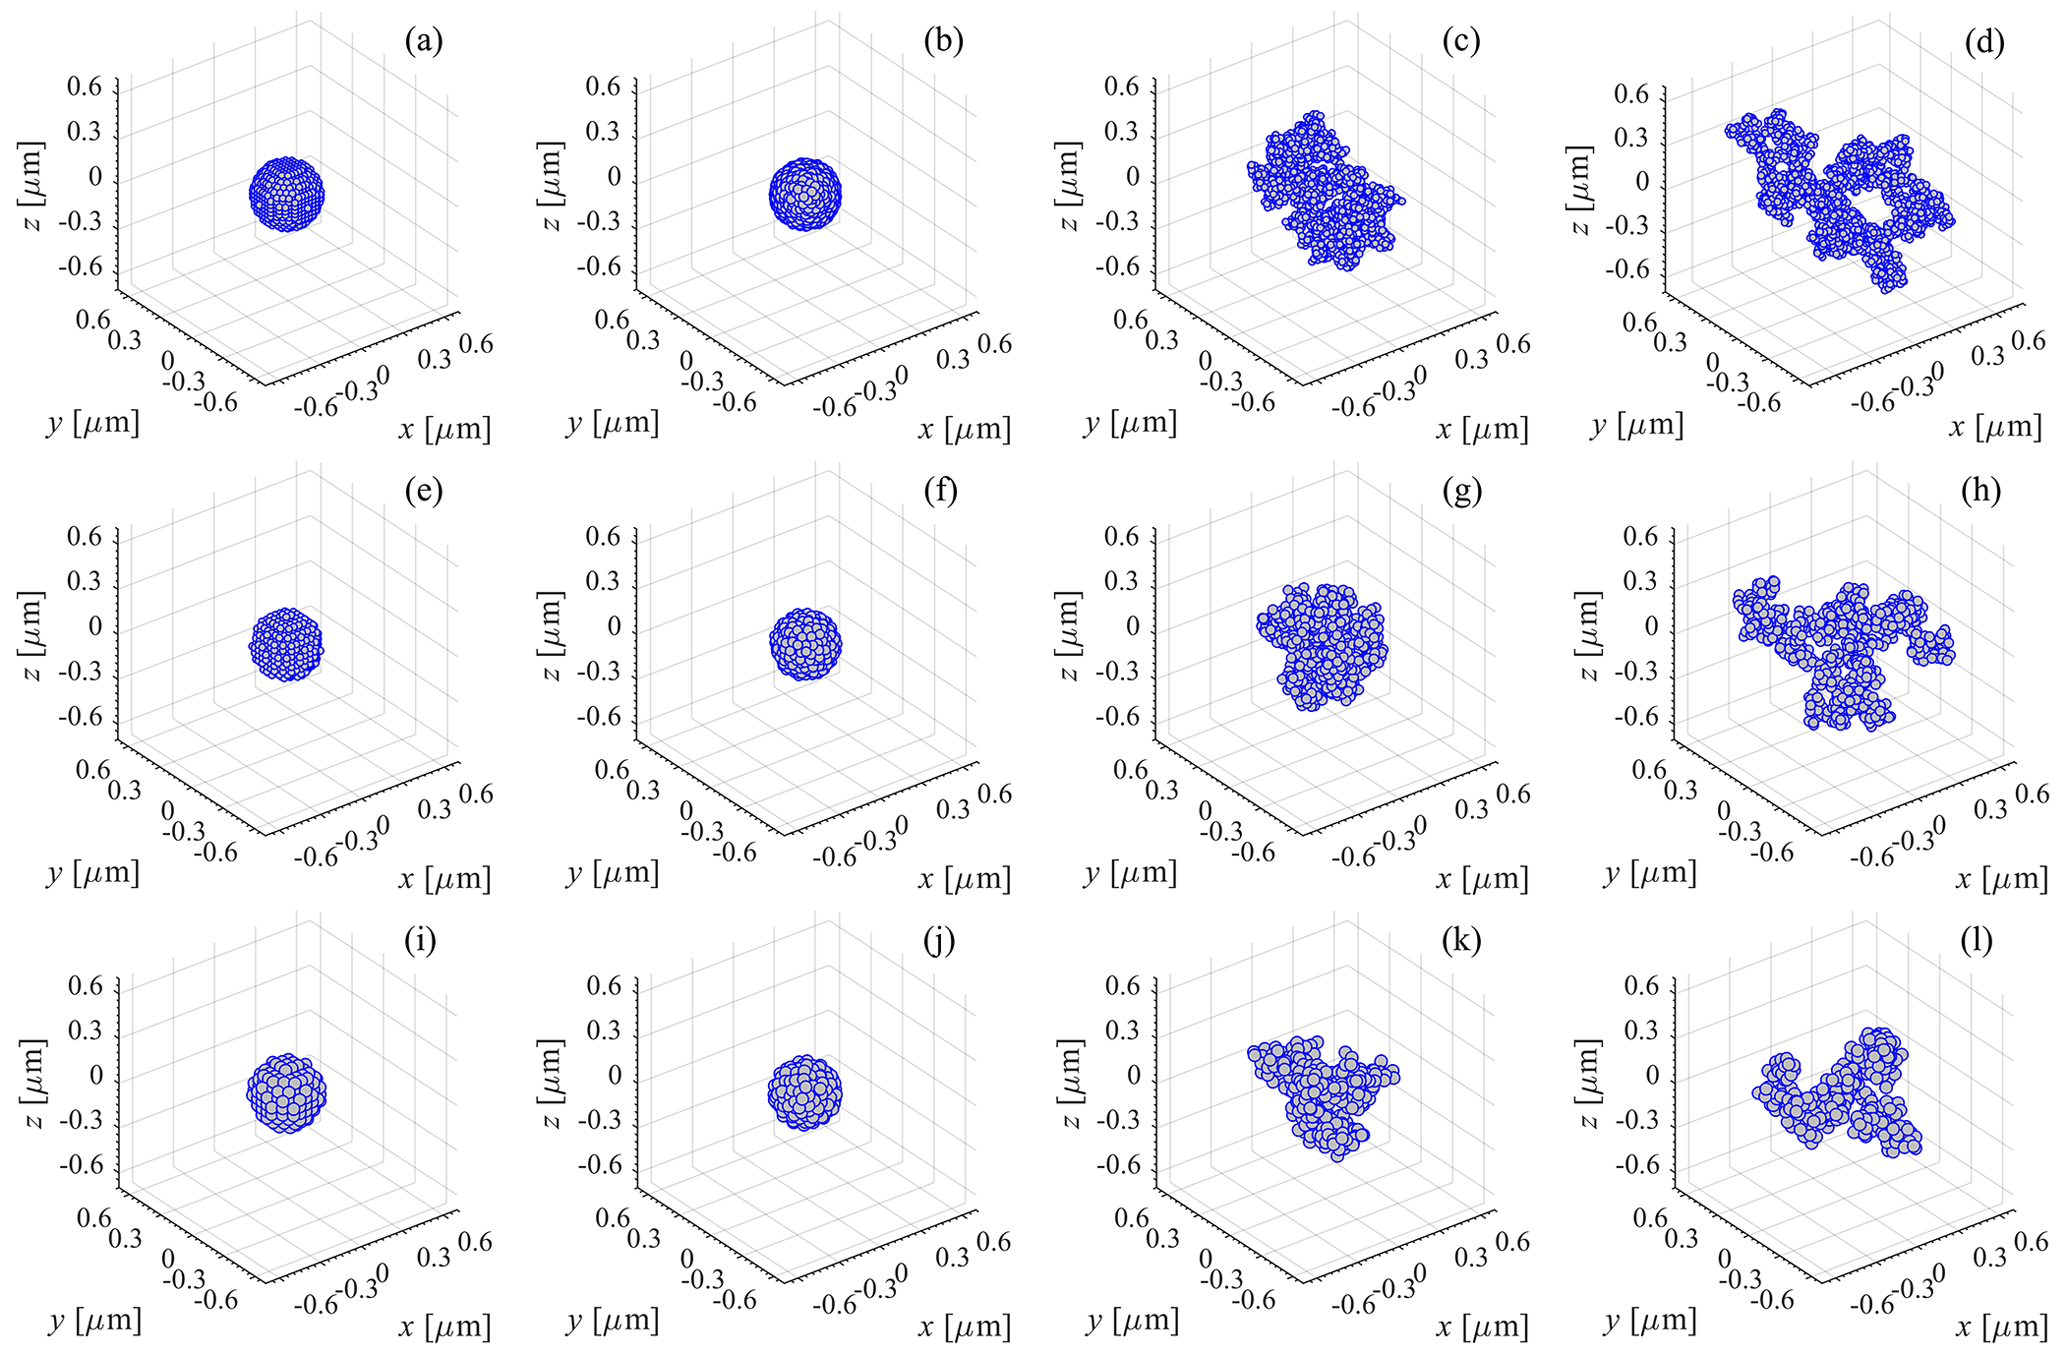
Figure 3Positions of the primary particles for aggregates starting from an SC aggregate with Douter-envelope=400 nm and varying values of dpp. Row 1 (aggregates with Npp=2106 and dpp=25 nm): (a) SC; (b) IAS; (c) CCA, Df=2.34, kSorensen=1.085; (d) CCA, Df=1.92, kSorensen=1.873. Row 2 (aggregates with Npp=771 and dpp=35 nm): (e) SC; (f) IAS; (g) CCA, Df=2.34, kSorensen=1.085; (h) CCA, Df=1.92, kSorensen=1.873. Row 3 (aggregates with Npp=377 and dpp=45 nm): (i) SC; (j) IAS; (k) CCA, Df=2.34, kSorensen=1.085; (l) CCA, Df=1.92, kSorensen=1.873. Note the different scale of the x axis in plot (d).
The input to the fractal-aggregate-generating code of Mackowski (1995, 2006) consists of the value of Npp, the radius of the primary particle (), the 3D fractal dimension (Df), and the fractal pre-factor (labeled here “kSorensen”) from the following relationship (Sorensen, 2001):
where Rg is the radius of gyration. As mentioned in Sect. 1, for COJ300, Df=2.34 with a 95 % confidence interval range of 2.12–2.56, and for R2500U, Df=1.92 with a 95 % confidence interval range of 1.68–2.16 (Zhang et al., 2020). Regarding the fractal pre-factor, by assuming that , where Lmax is the length of the longest dimension of the aggregate periphery, Zhang et al. (2020) wrote a similar relationship to that of Sorensen (2001):
where the fractal pre-factor as defined by Zhang et al. (2020) is labeled kZhang et al.. From this, we can obtain the following relationship between kSorensen and kZhang et al.:
Based on the data from Zhang et al. (2020), e.g., as shown in their Fig. A6c, for COJ300, kZhang et al.=0.42, and for R2500U, kZhang et al.=0.86. By using Eq. (3) together with the respective values of Df above, for COJ300, we obtain kSorensen=1.085, and for R2500U, we obtain kSorensen=1.873. Thus, the CCA aggregates with Df=2.34 and kSorensen=1.085 appear more compact and mimic the COJ300 samples, while the CCA aggregates with Df=1.92 and kSorensen=1.873 appear more extended and mimic the R2500U samples (refer again to Figs. 2 and 3). We also test different realizations of these CCA aggregates, varying the values of Df within the 95 % confidence interval ranges stated above, as well as different realizations of the IAS aggregates.
We note that the fractal-aggregate-generating code of Mackowski (1995, 2006) includes an option to generate aggregates based on diffusion-limited particle–cluster aggregation (PCA). However, as discussed in Mackowski (1995, 2006) and in Filippov et al. (2000), for given values of Df and kSorensen, with the sequential CCA algorithm, Eq. (1) above is fulfilled exactly at each step. Thus, the sequential CCA algorithm should generate more precise fractal aggregates. From preliminary tests (not shown here), we find that, on the whole, scattering calculations on aggregates generated using the sequential CCA option better reproduce some of the tendencies in the measured results than scattering calculations on aggregates generated using the PCA option. Thus, with respect to the fractal aggregates, by default, we present calculations for aggregates generated using the sequential CCA option of the fractal-aggregate-generating code of Mackowski (1995, 2006). However, when we vary the value of Df to its highest value within the 95 % confidence interval range of Df for the COJ300 samples (2.56), the sequential CCA algorithm gives repeated error messages of “clusters did not combine” and produces a list of primary-particle positions that partially overlap one another. Therefore, for this highest value of Df only, we employ the PCA option of the fractal-aggregate-generating code of Mackowski (1995, 2006).
Even though the SC and IAS aggregates are not expected to represent either of the Zhang et al. (2020) sample sets well, these two configurations are useful to test for two reasons. (1) By constructing the SC and IAS aggregates of a given aggregate set first, we can determine how many primary particles of a given value of dpp fit compactly into a sphere of a given value of Douter-envelope. Then, as explained above, we use this same number of primary particles Npp with the same dpp to construct the fractal aggregates of the same set. By doing so, all of the aggregates of a given set possess the same mass equivalent diameter, Dme, but varying configurations of the primary particles, which allows us to isolate the effect of the configuration of the primary particles, holding all other parameters constant to the greatest possible extent. (2) Although the SC and IAS aggregates are the most spherical of each set, they have a roughness on the nanometer scale and are not perfectly symmetric. Thus, even the SC and IAS aggregates should provide a minimal perpendicularly polarized scattered intensity against which the perpendicularly polarized scattered intensity provided by the fractal aggregates can be compared.
In testing the sensitivity of the results to variations in Douter-envelope, we hold dpp constant at 35 nm and change the value of Douter-envelope of the SC aggregate to 300 or 500 nm. In testing the sensitivity of the results to variations in dpp, we hold the value of Douter-envelope of the SC aggregate constant at 400 nm and change the value of dpp to 25 nm or 45 nm. Throughout the sensitivity studies, each individual aggregate is monodisperse with respect to its primary particles.
Once the aggregates are generated, we employ the MSTM model (Mackowski and Mishchenko, 1996) to calculate the extinction efficiency, Qext MSTM, the absorption efficiency, Qabs MSTM, the scattering efficiency, Qsca MSTM, and the 4 × 4 scattering phase matrix, S, of the aggregate at the wavelength of measurement, 670 nm. The default value of the complex refractive index of BC at 670 nm is taken to be 2.0+1.0i (Janzen, 1979; soot G of Fuller et al., 1999; Liu and Mishchenko, 2005, 2007; Liu et al., 2008; Moteki et al., 2010), where the real part, mreal, represents the refractive capability of the material, and the imaginary part, mimag, represents the absorptive capability of the material, but the sensitivity to this choice is also investigated.
The random-orientation option of MSTM (Mackowski, 2013) is used as a proxy for averaging over many different realizations of each of the IAS and fractal aggregates (see, e.g., Mishchenko et al., 2007, for an explanation of this), but we also test the sensitivity of the results to the choice of realization, and we also conduct simulations with fixed orientation.
The intensity of parallel polarized scattered radiation for parallel polarized incident radiation, , is obtained from the elements of the scattering phase matrix outputted from MSTM as
where is the wave number, λ is the wavelength, and σsca is the scattering cross section of the aggregate with respect to unpolarized incident radiation (see also Sect. 3.2 regarding the scattering cross section). Similarly, the intensity of perpendicularly polarized scattered radiation for parallel polarized incident radiation, , is obtained from the elements of S as
and the total intensity of scattered radiation as a function of the scattering angle is given by the sum
In using MSTM and Eqs. (4)–(6), we implicitly assume that the incident laser light is a 100 % coherent plane wave that is 100 % polarized parallel to the scattering plane. The scattered intensity over the range ∘ is calculated as
where μsca≡cosθsca. In implementing Eq. (7) numerically, for each discrete value of the scattering zenith angle , dμsca is calculated explicitly as , i.e., with a span of 1∘. Note that in Eqs. (4) and (5), a factor of , where ε is the electric permittivity of the background material (here assumed to be a vacuum), c is the speed of light in vacuum, and E0 is the amplitude of the electric field of the incident electromagnetic wave (here assumed to be of unit value), which would give the expressions the true dimensionality of radiative intensity, has been suppressed. See Appendix A for a summary of the terms, abbreviations, and symbols used in this study.
3.1 SPIN measurements
A summary of the scattering measurements from the SPIN OPC is given in Table 1. The measurements are presented for the 5th, 25th, 50th, 75th, and 95th percentiles in order to demonstrate the scope of the variability and uncertainty in the data.
Table 1Percentiles of filtered photon counts from the SPIN instrumentation. The percentiles of photon counts are given to a precision of one-tenth of a photon per second, while the ratio is listed to three significant figures.
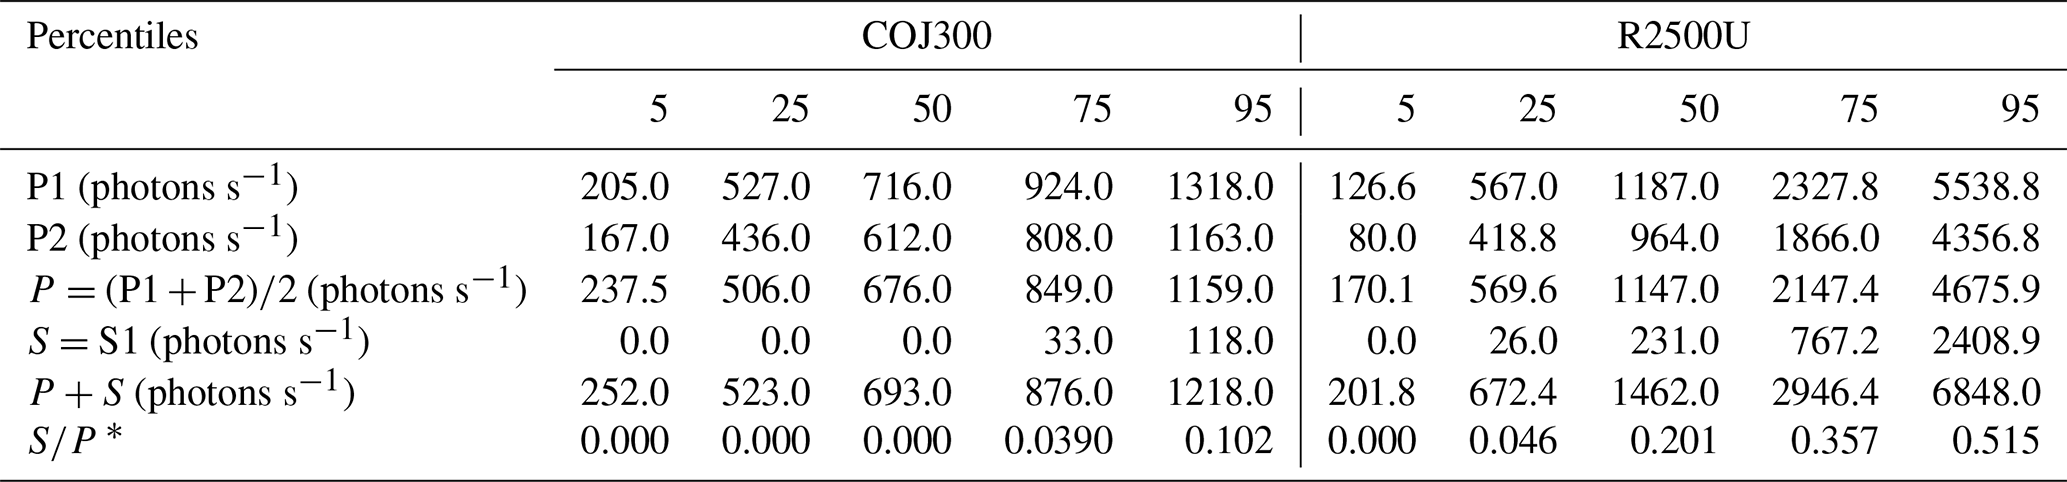
∗ Obtained by dividing the “S” percentiles by the corresponding “P” percentiles.
From Table 1, the photon counts for the more fractal sample set, R2500U, are significantly higher and exhibit more variation than the photon counts for the more spherical sample set, COJ300. This is true both for each polarization individually and for the total P+S. Thus, from the SPIN measurements, we find a stronger scattering signal at scattering angles of 135±20∘ from the more fractal sample set. We note that the P1 photon counts are higher than the P2 photon counts. However, this possibly systematic difference is small compared with the variability in photon counts from particle to particle.
Likewise, from Table 1, we see that the ratio (the linear depolarization ratio, obtained by dividing the “S” percentiles by the corresponding “P” percentiles) for R2500U is significantly higher than the ratio for COJ300. For the R2500U sample set, the median value of is 0.201, with 25th and 75th percentile values of 0.046 and 0.357, respectively, and a 95th percentile value greater than 0.5. In contrast, for the COJ300 sample set, the median value of is 0.0, with 25th and 75th percentile values of 0.0 and 0.039, respectively. Overall, from our measurements, more than half (∼ 60.4 %) of the COJ300 particles have undetectably low S scattering signals and therefore values.
As mentioned in Sect. 2.1, a nonzero value of S when the incident radiation is polarized parallel to the scattering plane indicates some asymmetry or nonsphericity in the shape of the scattering particle (or possibly chirality or birefringence in the scattering particle material). Thus, the higher median for the R2500U sample set corresponds with it being the more fractal sample set, exhibiting more irregular and extended shapes, while the zero median ratio for the COJ300 sample set corresponds well with it being the less fractal sample set, exhibiting shapes that are closer to spherically symmetric. At the same time, the nonzero 75th and 95th percentile values of for COJ300 indicate that some of the COJ300 particles are nonspherical, albeit less so than the R2500U, which also corresponds with the fact that the mean fractal dimension of the COJ300 samples (Df=2.34) is lower than 3.
Below, we examine whether these tendencies are also reproduced in our theoretical calculations.
3.2 Theoretical calculations – sensitivity to Douter-envelope of the SC aggregate
The results for the aggregates shown in Fig. 2 (i.e., for aggregates generated starting with an SC aggregate with Douter-envelope=300 nm and dpp=35 nm, for aggregates generated starting with an SC aggregate with Douter-envelope=400 nm and dpp=35 nm (our default set), and for aggregates generated starting with an SC aggregate with Douter-envelope=500 nm and dpp=35 nm) are given in Table B1, in Fig. 4, and in Table 2.
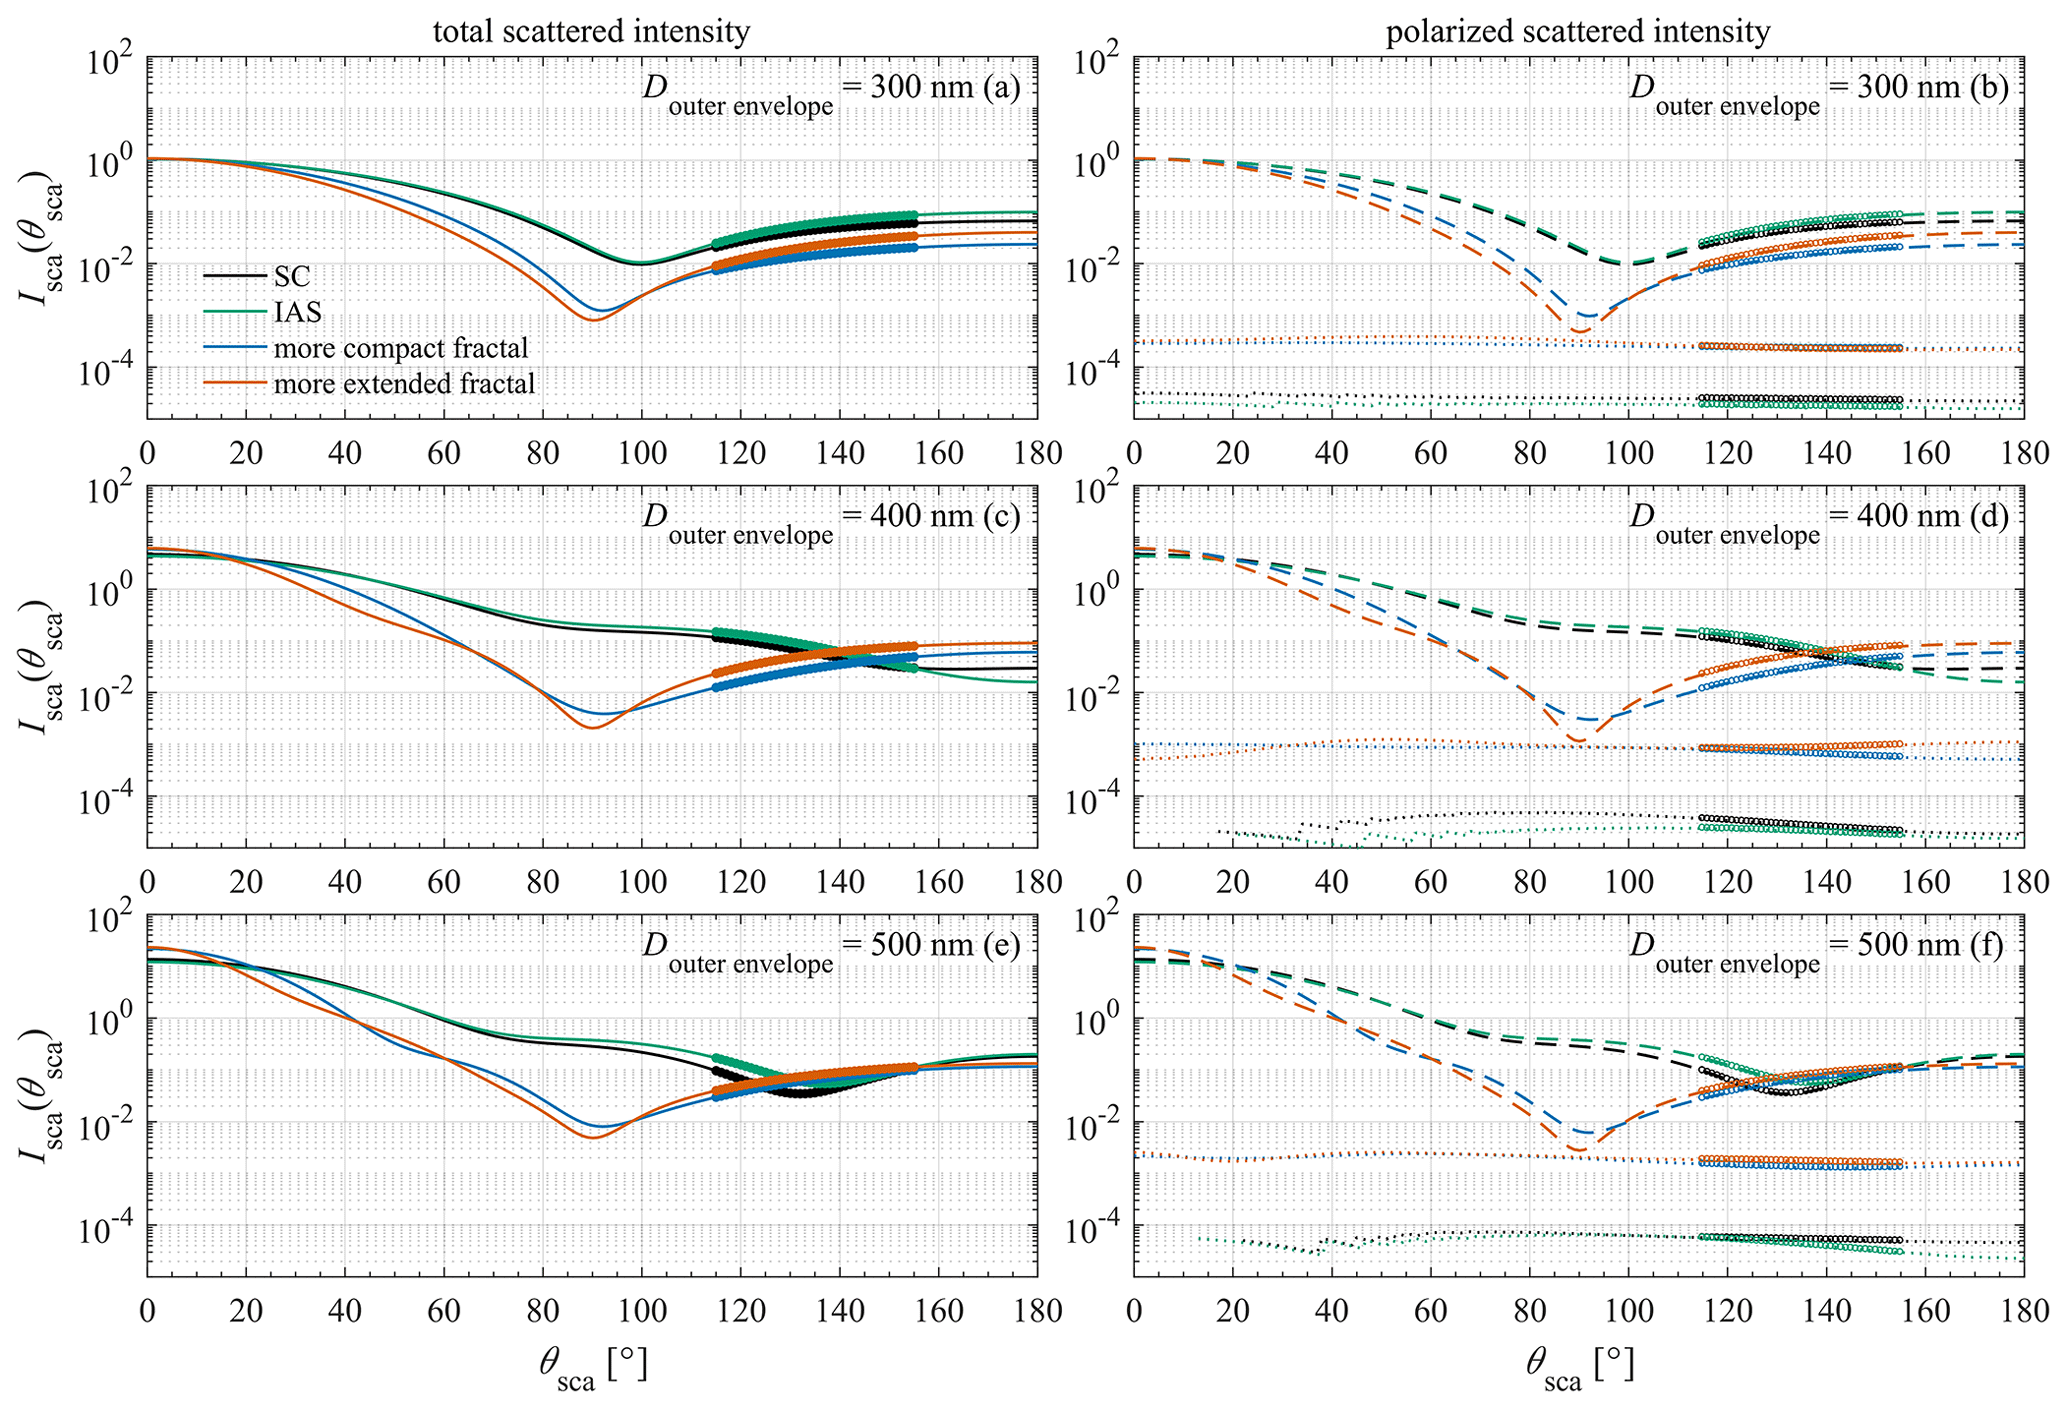
Figure 4Scattered intensity as a function of scattering angle as obtained from MSTM for aggregates generated starting with an SC aggregate with Douter-envelope=300 nm and dpp=35 nm (a, b), for aggregates generated starting with an SC aggregate with Douter-envelope=400 nm and dpp=35 nm (our default set; c, d), and for aggregates generated starting with an SC aggregate with Douter-envelope=500 nm and dpp=35 nm (e, f). Panels (a), (c), and (e) contain the total scattered intensity (solid curves), while panels (b), (d), and (f) contain the scattered intensity polarized parallel (dashed curves) and perpendicular (dotted curves) to the scattering plane. The range ∘ of the calculations is highlighted on each curve with a thicker curve.
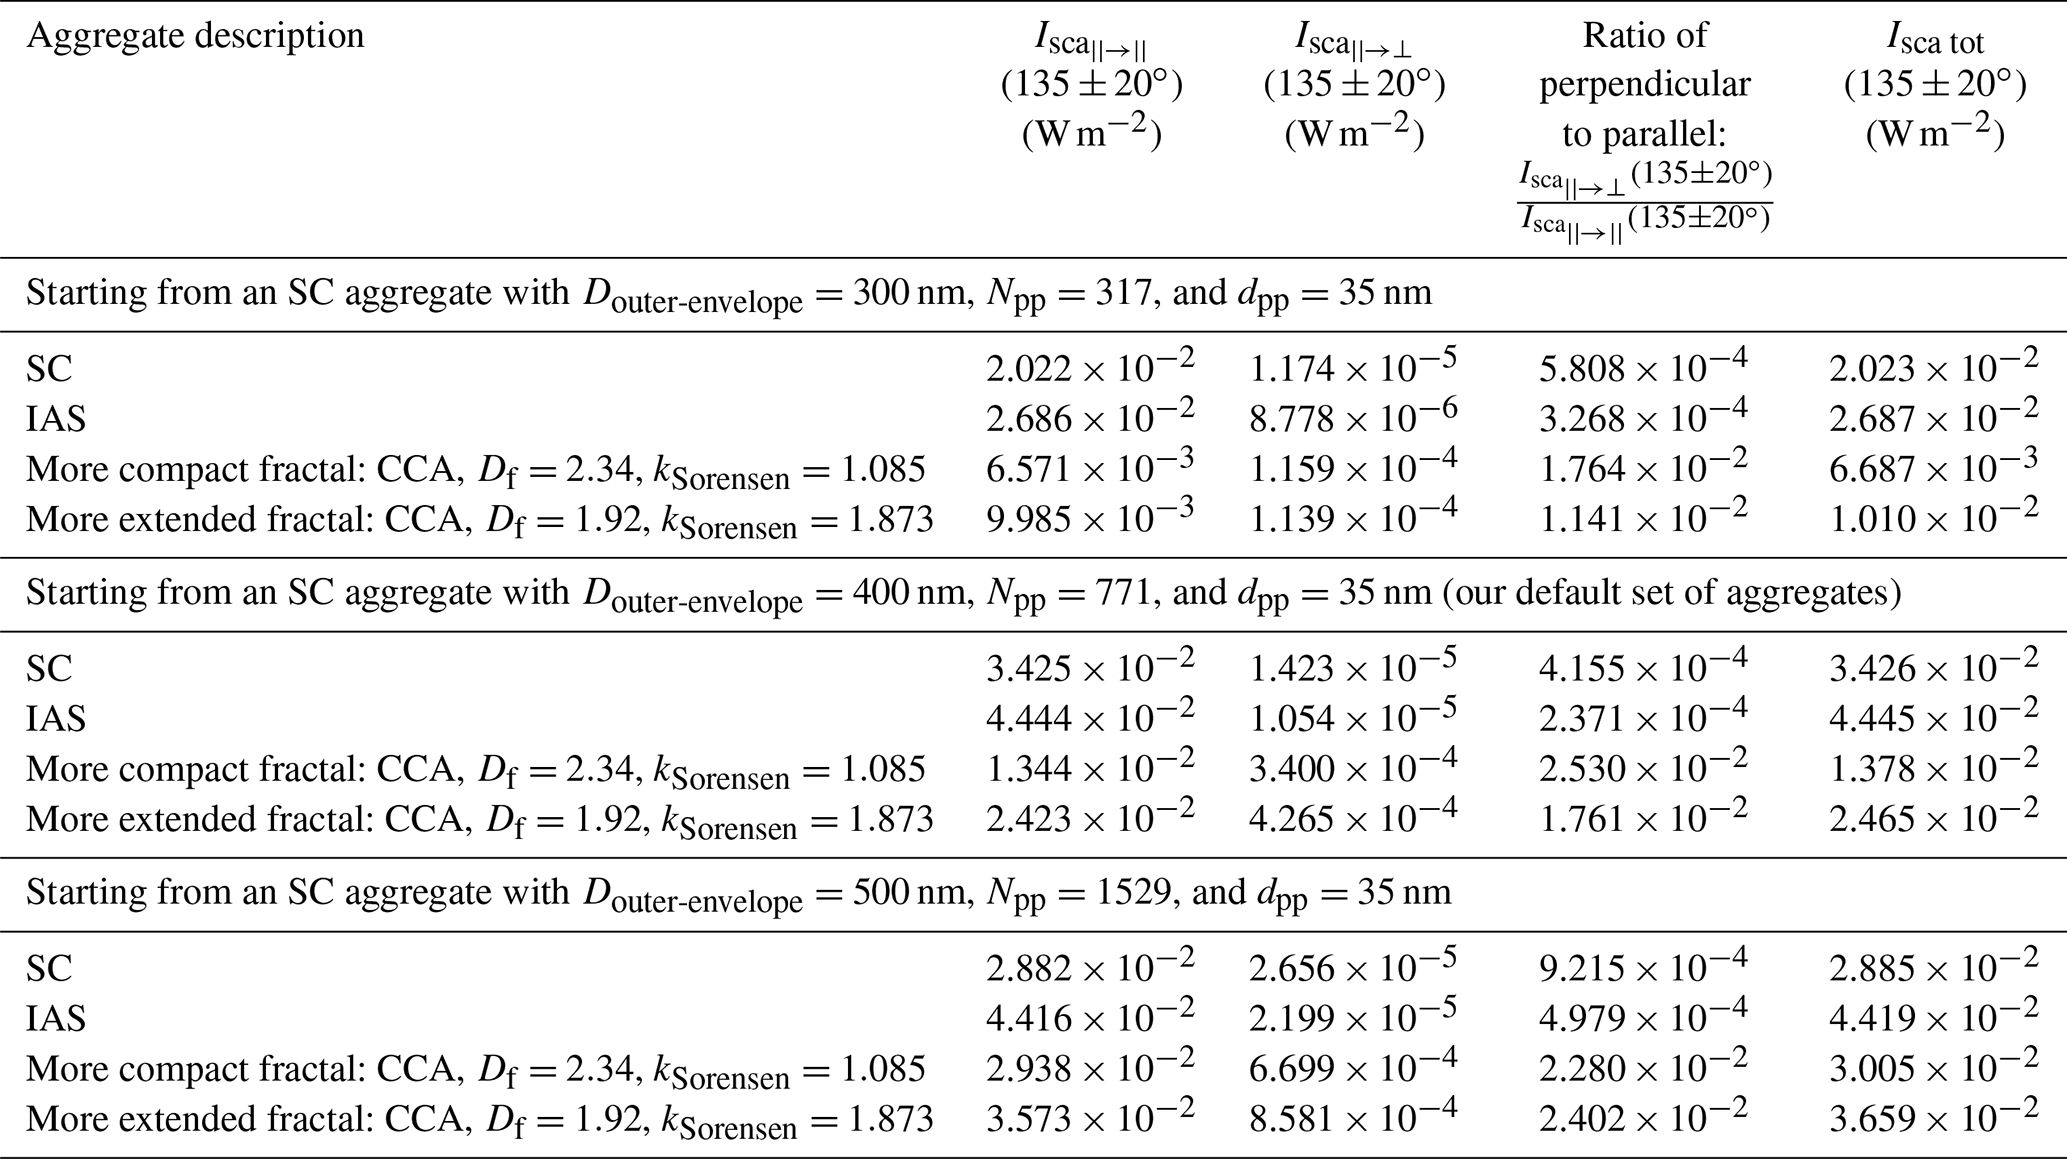
Table 2Scattered intensity over the range ∘ for aggregates generated starting with an SC aggregate with Douter-envelope=300 nm and dpp=35 nm, for aggregates generated starting with an SC aggregate with Douter-envelope=400 nm and dpp=35 nm, and for aggregates generated starting with an SC aggregate with Douter-envelope=500 nm and dpp=35 nm.
In columns 2, 4, and 6 of Table B1, the values of Qext MSTM, Qabs MSTM, and Qsca MSTM of each aggregate as given by MSTM are presented. The efficiencies as given by MSTM are with respect to the volume-mean radius, Rvolume-mean, which is the radius of a sphere that has the same ratio of volume to surface area. For a monodisperse aggregate,
such that the extinction, absorption, and scattering cross sections, respectively (σext, σabs, σsca), are given by
The cross sections calculated based on Eq. (9) are given in columns 3, 5, and 7 of Table B1.
From Table B1, we see that the SC and IAS aggregates tend to have higher extinction, absorption, and scattering cross sections than the fractal aggregates in the same set. This agrees with the findings of Liu and Mishchenko (2005), Liu et al. (2008), and Romshoo et al. (2021), who found that the extinction and scattering cross sections of soot aggregates increase as the aggregates become more compact. (See also the review in Kahnert and Kanngießer, 2020.) For aggregates generated starting with an SC aggregate with Douter-envelope=400 nm and dpp=35 nm and for aggregates generated starting with an SC aggregate with Douter-envelope=500 nm and dpp=35 nm, the SC aggregate exhibits the highest extinction cross section of the set, which corresponds with the results in Sela and Haspel (2021). For aggregates generated starting with an SC aggregate with Douter-envelope=300 nm and dpp=35 nm, the IAS aggregate exhibits the highest extinction cross section of the set.
In Fig. 4a and b, we show the scattered intensity as a function of scattering angle as obtained from MSTM for aggregates generated starting with an SC aggregate with Douter-envelope=300 nm and dpp=35 nm, where the range ∘ is highlighted on each curve with a thicker curve. In Fig. 4a, the total scattered intensity is shown, while in Fig. 4b, the scattered intensity is separated according to polarization. From Fig. 4a, we see that the SC aggregate (black curve) exhibits a slightly higher scattered intensity in the direct forward direction (θsca=0∘) than the IAS aggregate (green curve), while the IAS aggregate exhibits a higher scattered intensity at scattering angles of 135±20∘ than the SC aggregate, both of which agree with the results of Sela and Haspel (2021). In addition, the more extended fractal aggregate (CCA, Df=1.92, kSorensen=1.873; red curve) exhibits a higher scattered intensity at scattering angles of 135±20∘ than the more compact fractal aggregate (CCA, Df=2.34, kSorensen=1.085; blue curve), which agrees with the SPIN measurements. However, the two fractal aggregates exhibit lower scattered intensities at scattering angles of 135±20∘ than both the SC aggregate and the IAS aggregate, and this is due to the fact that the very compact SC and IAS aggregates exhibit higher scattering cross sections (refer to Table B1) and scatter more overall than the two fractal aggregates.
From Fig. 4b, we see that, as expected, all of the aggregates exhibit significantly more parallel polarized scattered intensity (the same polarization as the incident radiation; dashed curves) than perpendicularly polarized scattered intensity (dotted curves). Also as expected, we see that the SC and IAS aggregates exhibit a minimal but nonzero perpendicularly polarized scattered intensity (dotted black curve and dotted green curve, respectively). As mentioned in Sect. 2.2, these two aggregates are the most spherical of each set but contain a roughness on the nanometer scale and are not perfectly symmetric. (Refer also to Figs. 2 and 3.) From Fig. 4b, we also see that, as with the total intensity, the more extended fractal aggregate (CCA, Df=1.92, kSorensen=1.873; red dashed curve) exhibits a higher parallel polarized scattered intensity at scattering angles of 135±20∘ than the more compact fractal aggregate (CCA, Df=2.34, kSorensen=1.085; blue dashed curve), but at the same time, these two fractal aggregates exhibit lower parallel polarized scattered intensities at scattering angles of 135±20∘ than the SC aggregate (black dashed curve) and the IAS aggregate (green dashed curve). Finally, from Fig. 4b, we see that, at this size, the two fractal aggregates exhibit perpendicularly polarized scattered intensities at scattering angles of 135±20∘ that are very similar to one another (dotted blue curve and dotted red curve, respectively).
In Fig. 4c and d, we show the scattered intensity as a function of scattering angle as obtained from MSTM for aggregates generated starting with an SC aggregate with Douter-envelope=400 nm and dpp=35 nm (our default set of aggregates). In Fig. 4c, the total scattered intensity is shown, while in Fig. 4d, the scattered intensity is separated according to polarization. We can see that the tendencies exhibited in Fig. 4c and d are similar to the tendencies exhibited in Fig. 4a and b, but with several distinctions. (1) There is more of a difference in the scattered intensity at scattering angles of 135±20∘ between the more extended fractal aggregate and the more compact fractal aggregate, with the more extended fractal aggregate exhibiting a clearly higher total scattered intensity at scattering angles of 135±20∘, a clearly higher parallel polarized scattered intensity at scattering angles of 135±20∘, and a clearly higher perpendicularly polarized scattered intensity at scattering angles of 135±20∘ than the more compact fractal aggregate, which agrees with the results from the SPIN measurements. In fact, we find that, in this way, this default set of aggregates mimics the results from the SPIN measurements better than any set of aggregates that we tested. (2) In the range ∘, the curves of parallel polarized scattered intensity for the two fractal aggregates cross the curves of parallel polarized scattered intensity for the SC and IAS aggregates, which means that their values in that range are more comparable to those of the SC and IAS aggregates.
In Fig. 4e and f, we show the scattered intensity as a function of scattering angle as obtained from MSTM for aggregates generated starting with an SC aggregate with Douter-envelope=500 nm and dpp=35 nm. We can see that the tendencies exhibited in Fig. 4e and f are similar to the tendencies exhibited in Fig. 4a and b and in Fig. 4c and d, respectively. However, from Fig. 4e and f, we see that there is less of a difference in the scattered intensity at scattering angles of 135±20∘ between the more extended fractal aggregate and the more compact fractal aggregate as compared with the difference in scattered intensity at scattering angles of 135±20∘ exhibited by the fractal aggregates in our default set of aggregates.
In Table 2, we list the values of scattered intensity over the range ∘ corresponding with the curves in Fig. 4. From Table 2, we see the same tendencies as exhibited in Fig. 4 but now quantified. For example, looking at the values for aggregates generated starting with an SC aggregate with Douter-envelope=400 nm and dpp=35 nm (again, our default set of aggregates), the value of (135±20∘) is higher for the more extended fractal aggregate ( W m−2) than for the more compact fractal aggregate ( W m−2). Likewise, the value of (135±20∘) is higher for the more extended fractal aggregate ( W m−2) than for the more compact fractal aggregate ( W m−2), and the value of Isca tot (135±20∘) is higher for the more extended fractal aggregate ( W m−2) than for the more compact fractal aggregate ( W m−2). These tendencies resemble the tendencies from the SPIN measurements.
However, referring to Table 1, the relative differences in scattered photon counts between the R2500U samples and the COJ300 samples are larger than the relative differences in scattered intensity between the more extended fractal aggregate and the more compact aggregate shown in Table 2. For example, from the values in Table 1, the ratio of the median value of P+S for R2500U to the median value of P+S for COJ300 is 2.11, whereas, from the values in Table 2, the ratio of the value of Isca tot (135±20∘) for the more extended fractal aggregate from our default set of aggregates to the value of Isca tot (135±20∘) for the more compact fractal aggregate from our default set of aggregates is 1.79. In addition, referring to Table 1, the highest ratio of perpendicularly polarized scattered intensity to parallel polarized scattered intensity listed, i.e., the value of corresponding with the 95th percentile, is 0.055 for the COJ300 sample set and is 0.375 for the R2500U sample set. Both of these values of are higher than the values of for the fractal aggregates in Table 2, which range from to . This indicates that there were some samples measured in the SPIN measurements, especially in the R2500U sample set, that exhibit higher linear depolarization ratios than the theoretical aggregates shown in Fig. 2.
3.3 Theoretical calculations – sensitivity to dpp
Results for aggregates generated starting with an SC aggregate with our default value of Douter-envelope=400 nm but with a smaller primary-particle diameter of dpp=25 nm and results for aggregates generated starting with an SC aggregate with our default value of Douter-envelope=400 nm but with a larger primary-particle diameter of dpp=45 nm are shown in Table B2, in Fig. 5, and in Table 3. The tendencies shown in Table B2, in Fig. 5a, b, e, and f, and in Table 3 are similar to those for our default set of aggregates. (Note that the scattered intensities as a function of scattering angle for our default set of aggregates from Fig. 4c and d are repeated as Fig. 5c and d for ease of comparison.) However, with dpp=25 nm and with dpp=45 nm, again, there is less of a difference in the scattered intensity at scattering angles of 135±20∘ between the more extended fractal aggregates and the more compact fractal aggregates as compared with the difference exhibited by the fractal aggregates from our default set of aggregates with dpp=35 nm. Thus, once again, we find that our default set of aggregates mimics the results from the SPIN measurements better than any set of aggregates that we tested.
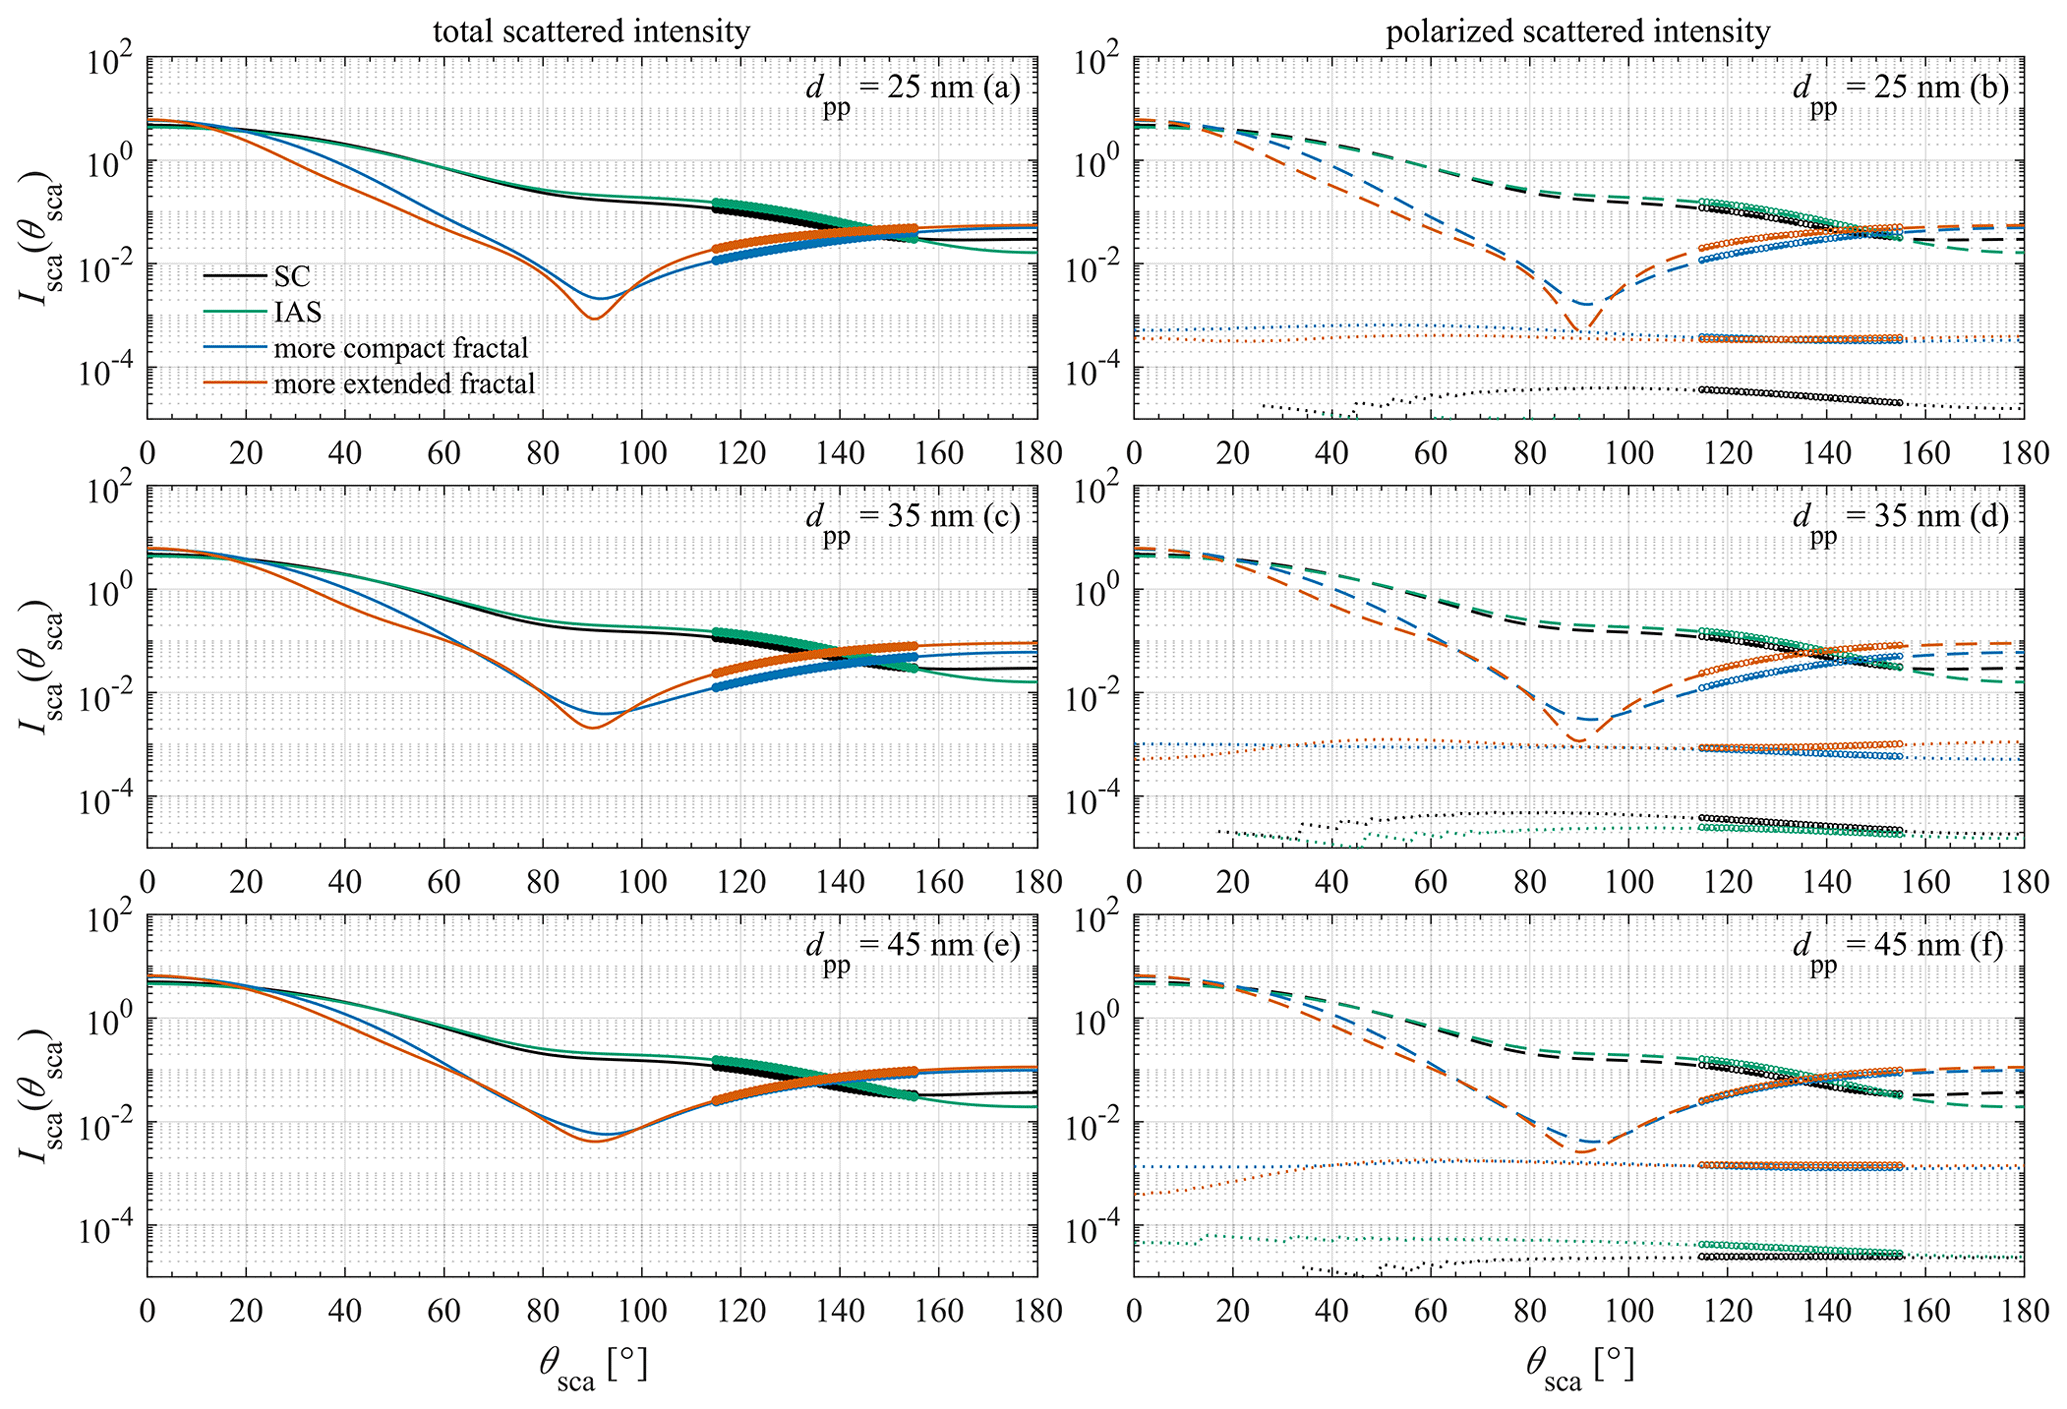
Figure 5Scattered intensity as a function of scattering angle as obtained from MSTM for aggregates generated starting with an SC aggregate with Douter-envelope=400 nm and dpp=25 nm (a, b), for aggregates generated starting with an SC aggregate with Douter-envelope=400 nm and dpp=35 nm (our default set; c, d), and for aggregates generated starting with an SC aggregate with Douter-envelope=400 nm and dpp=45 nm (e, f). Panels (a), (c), and (e) contain the total scattered intensity (solid curves), while panels (b), (d), and (f) contain the scattered intensity polarized parallel (dashed curves) and perpendicular (dotted curves) to the scattering plane. The range ∘ of the calculations is highlighted on each curve with a thicker curve.
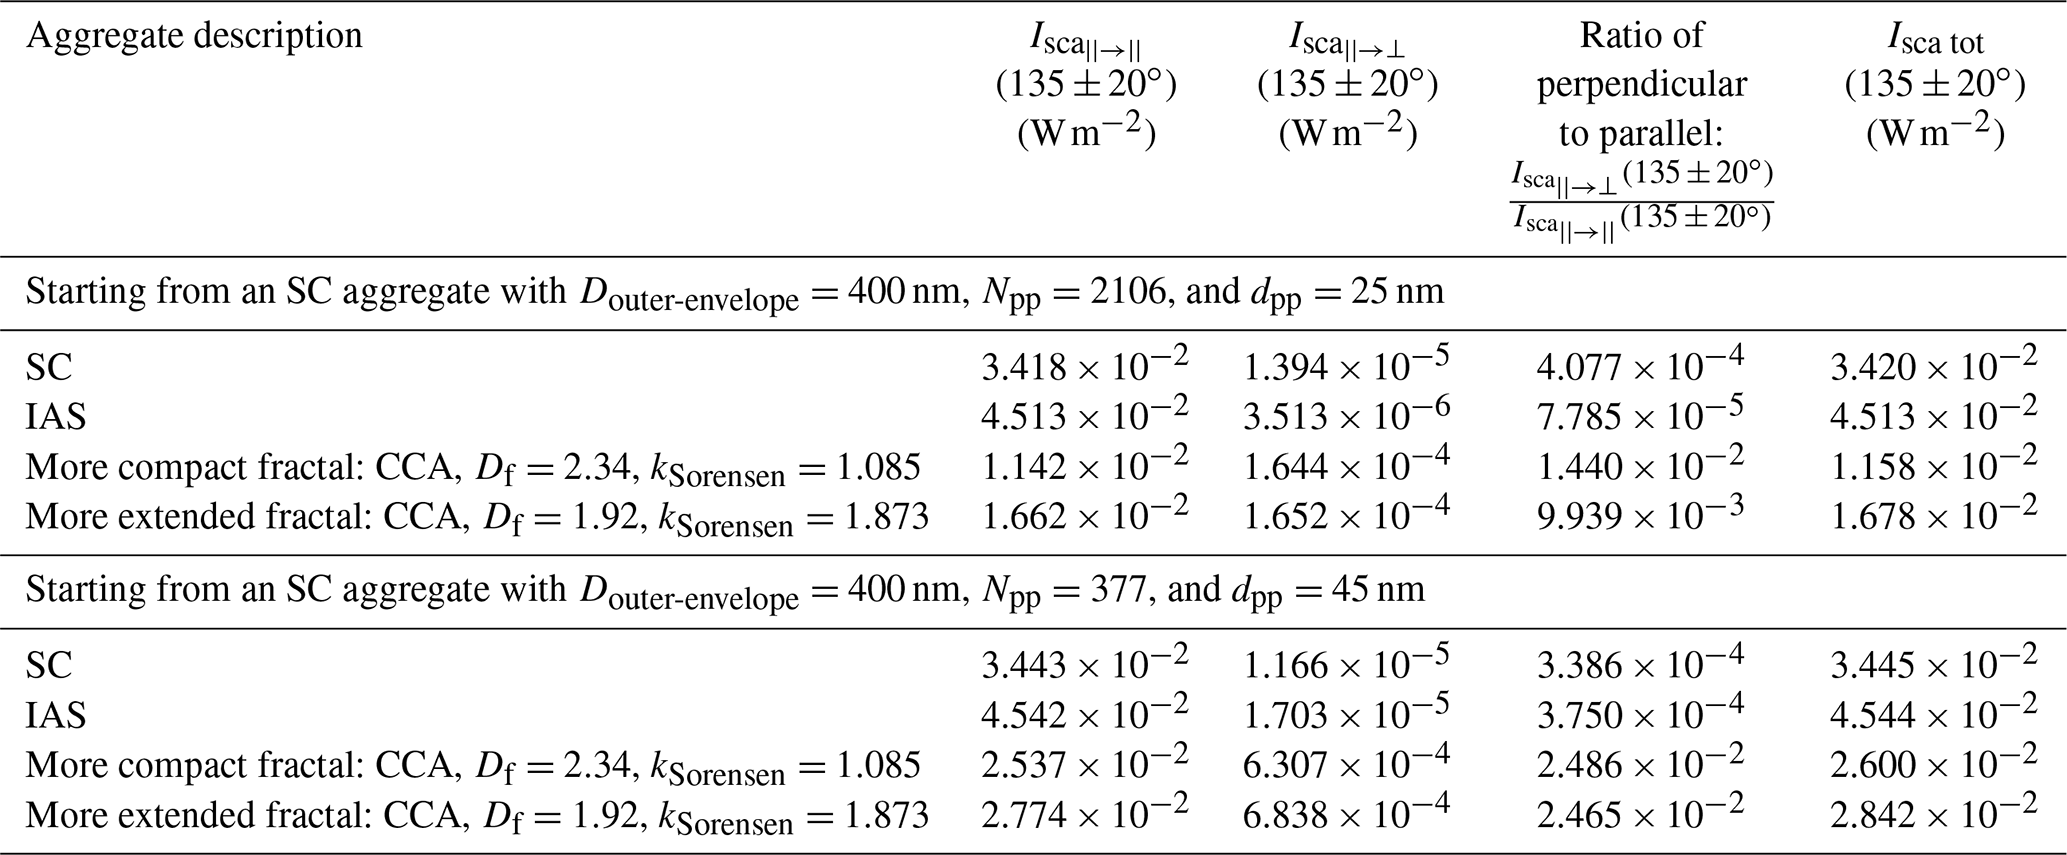
Table 3Scattered intensity over the range ∘ for aggregates generated starting with an SC aggregate with Douter-envelope=400 nm and dpp=25 nm and 45 nm, respectively.
3.4 Theoretical calculations – sensitivity to the complex refractive index
To test the sensitivity of our results to the assumed complex refractive index, we repeat the calculations on our default aggregates (aggregates generated starting with an SC aggregate with Douter-envelope=400 nm and dpp=35 nm) with three additional complex refractive indices that have been tabulated for non-graphitic light-absorbing carbon: (1) , the lowest complex refractive index from Table 5 of Bond and Bergstrom (2006); (2) , the complex refractive index in the middle of the range from Table 5 of Bond and Bergstrom (2006) and that adopted by Bond et al. (2006); and (3) , the complex refractive index retrieved by Moteki et al. (2010). These complex refractive indices were not necessarily tabulated at the identical wavelength of 670 nm, but they bracket a reasonable range of possible values of refractive indices of black carbon at wavelengths relevant to incident solar radiation (500–1064 nm) (Janzen, 1979; Fuller et al., 1999; Bond and Bergstrom, 2006; Bond et al., 2006; Liu and Mishchenko, 2005, 2007; Liu et al., 2008; Moteki et al., 2010). (See also the review in Kahnert and Kanngießer, 2020.) For this sensitivity test, each of these three additional complex refractive indices in turn is set to be the complex refractive index of the primary particles in the aggregate. Results for our default aggregates but with primary-particle complex refractive indices of , , and , respectively, are shown in Table B3, in Fig. 6, and in Table 4.
Table 4Scattered intensity over the range ∘ for aggregates generated starting with an SC aggregate with Douter-envelope=400 nm and dpp=35 nm with different primary-particle refractive indices.
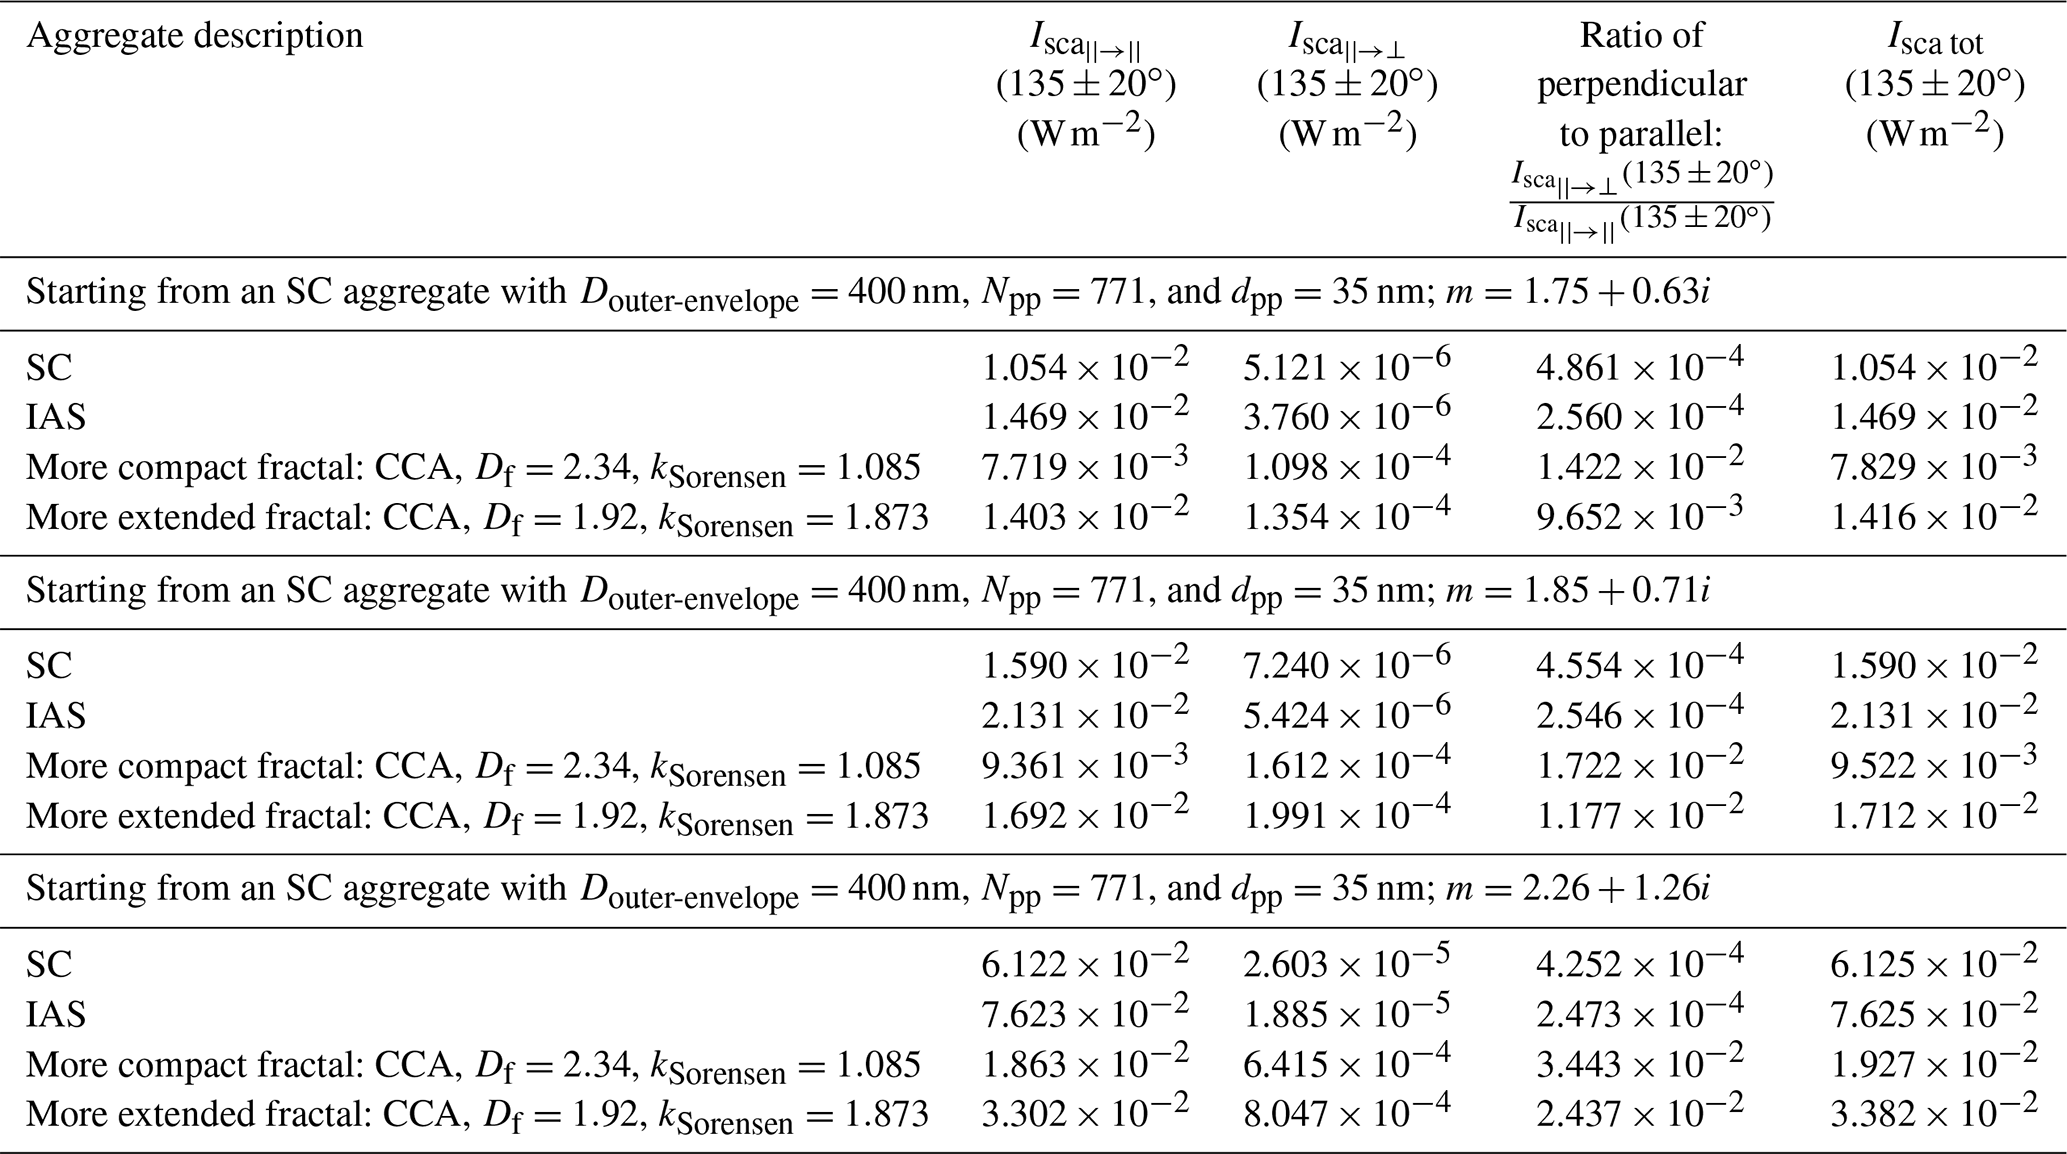
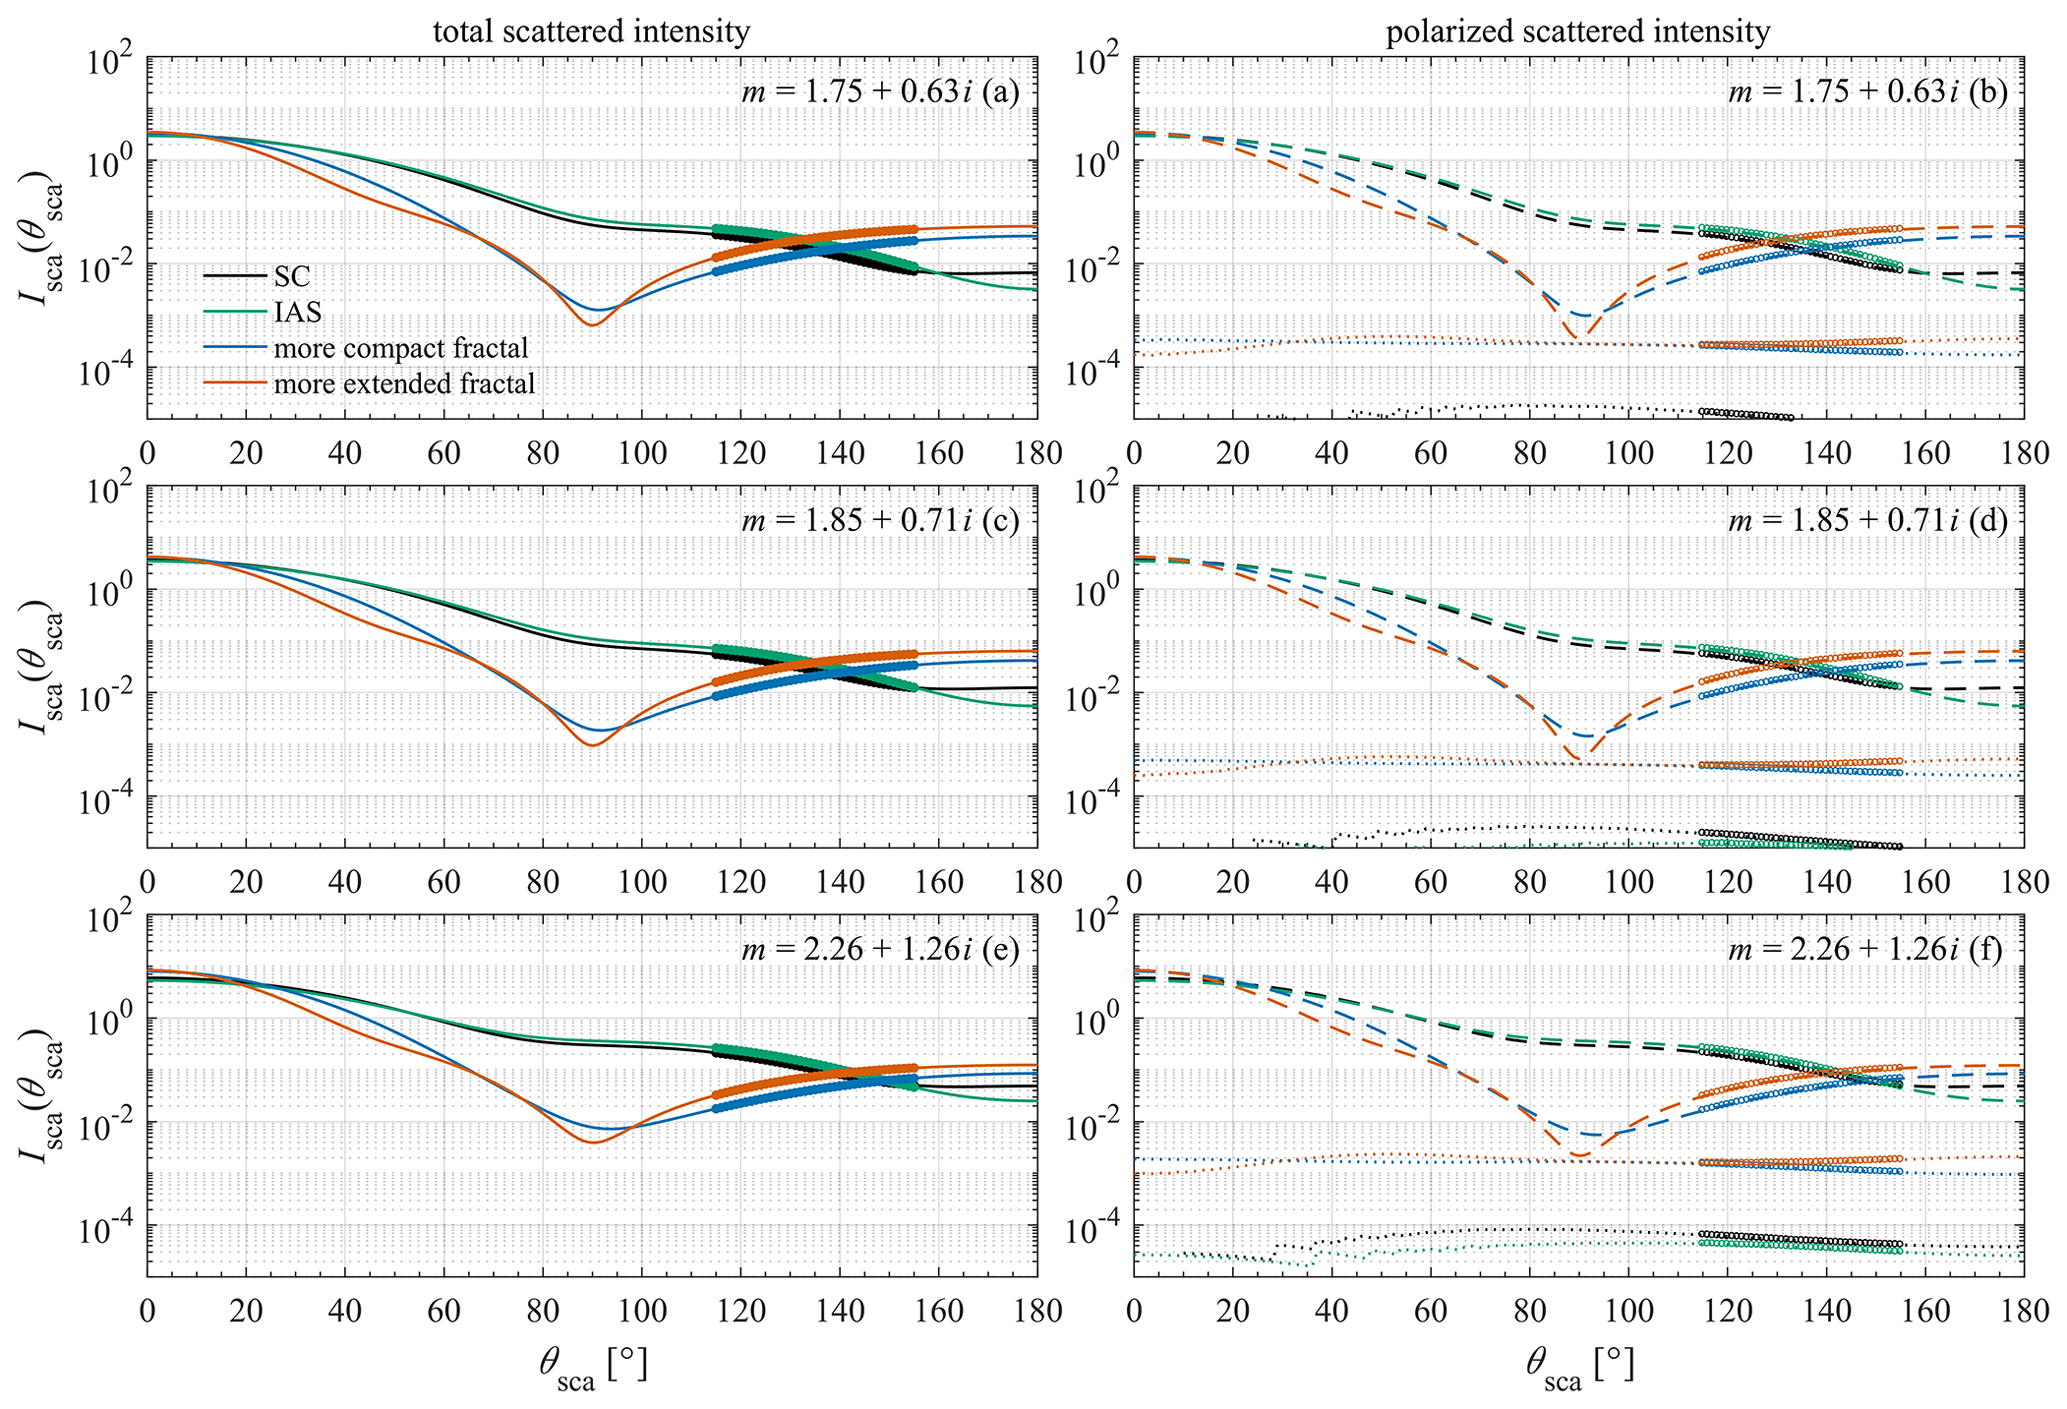
Figure 6Scattered intensity as a function of scattering angle as obtained from MSTM for our default aggregates (aggregates generated starting with an SC aggregate with Douter-envelope=400 nm and dpp=35 nm), with primary-particle refractive index (a, b), with primary-particle refractive index (c, d), and with primary-particle refractive index (e, f). Panels (a), (c), and (e) contain the total scattered intensity (solid curves), while panels (b), (d), and (f) contain the scattered intensity polarized parallel (dashed curves) and perpendicular (dotted curves) to the scattering plane. The range ∘ of the calculations is highlighted on each curve with a thicker curve.
From Table B3, we see that the higher the complex refractive index of the primary particles, the higher the extinction, absorption, and scattering cross sections of the aggregates, respectively, as would be expected. (See also Liu et al., 2008.) From Fig. 6, we see that the higher the complex refractive index, the farther towards the end of the ∘ range the curves of parallel polarized scattered intensity for the two fractal aggregates cross the curves of parallel polarized scattered intensity for the SC and IAS aggregates. From Table 4, we also see that, for the fractal aggregates, the ratio of perpendicularly polarized parallel polarized scattered radiation in the angular range ∘ increases with the magnitude of the refractive index, which agrees with the findings of Bescond et al. (2013) regarding the direct back-scattering depolarization caused by BC aggregates. Aside from that, the tendencies shown in Table B3, in Fig. 6, and in Table 4 are quite similar to those for our default set of aggregates.
3.5 Theoretical calculations – sensitivity to realizations of aggregate-generating algorithms
Liu and Mishchenko (2007) found that varying the geometrical configuration of the primary particles in a soot cluster for fixed values of Df, kSorensen, Npp, and dpp has a weak effect on scattering and absorption in the visible part of the spectrum. Here we test the sensitivity to aggregate realization in a similar manner but with respect to the Zhang et al. (2020) experimental configuration and our associated theoretical aggregate parameters. We test additional realizations of the IAS aggregate of default size, the more compact fractal aggregate of default size, and the more extended fractal aggregate of default size, respectively, where the values of Npp (771) and dpp (35 nm) are identical for all of the realizations. First, we create two additional realizations of the IAS aggregate of default size, five additional realizations of the more compact fractal aggregate of default size with its default fractal parameters (CCA, Df=2.34, kSorensen=1.085), and five additional realizations of the more extended fractal aggregate of default size with its default fractal parameters (CCA, Df=1.92, kSorensen=1.873). Then we create six additional realizations of the more compact fractal aggregate of default size with the minimum value of Df within the 95 % confidence interval range mentioned in Sects. 1 and 2.2 for the COJ300 samples (CCA, Df=2.12, kSorensen=0.992), six additional realizations of the more compact fractal aggregate of default size with the maximum value of Df within the 95 % confidence interval range for the COJ300 samples (PCA, Df=2.56, kSorensen=1.186), six additional realizations of the more extended fractal aggregate of default size with the minimum value of Df within the 95 % confidence interval range for the R2500U samples (CCA, Df=1.68, kSorensen=1.700), and six additional realizations of the more extended fractal aggregate of default size with the maximum value of Df within the 95 % confidence interval range for the R2500U samples (CCA, Df=2.16, kSorensen=2.065). Note that, in deriving the 95 % confidence interval range of Df, the regression parameter kZhang et al. was held constant. Accordingly, for each new value of Df, a new value of kSorensen was calculated from Eq. (3) using the value of kZhang et al. for the corresponding sample set. Note also that, as stated in Sect. 2.2, when we vary the value of Df to its highest value within the 95 % confidence interval range for the COJ300 samples, which is Df=2.56, we employ the PCA option of the fractal-aggregate-generating algorithm rather than the CCA option, while for all of the other realizations, we employ the CCA option of the fractal-aggregate-generating algorithm.
In Table B4, we list the ranges of the values of extinction, absorption, and scattering cross sections for all of the realizations of the aggregate-generating algorithms. From Table B4, we see again that the most compact aggregates (SC, IAS, PCA with Df=2.56 and kSorensen=1.186, and CCA with Df=2.16 and kSorensen=2.065) tend to have the highest extinction cross sections and scattering cross sections, which again agrees with the results of Liu and Mishchenko (2005), Liu et al. (2008), and Romshoo et al. (2021).
In Fig. 7, we show the scattered intensity as a function of scattering angle as obtained from MSTM for all of the realizations of the aggregate-generating algorithms. From Fig. 7a and b, we see that there is hardly any discernable difference in the scattering patterns of the three IAS realizations (green curves), with just a small amount of discernable spread only in the very low values of perpendicularly polarized scattered intensity.
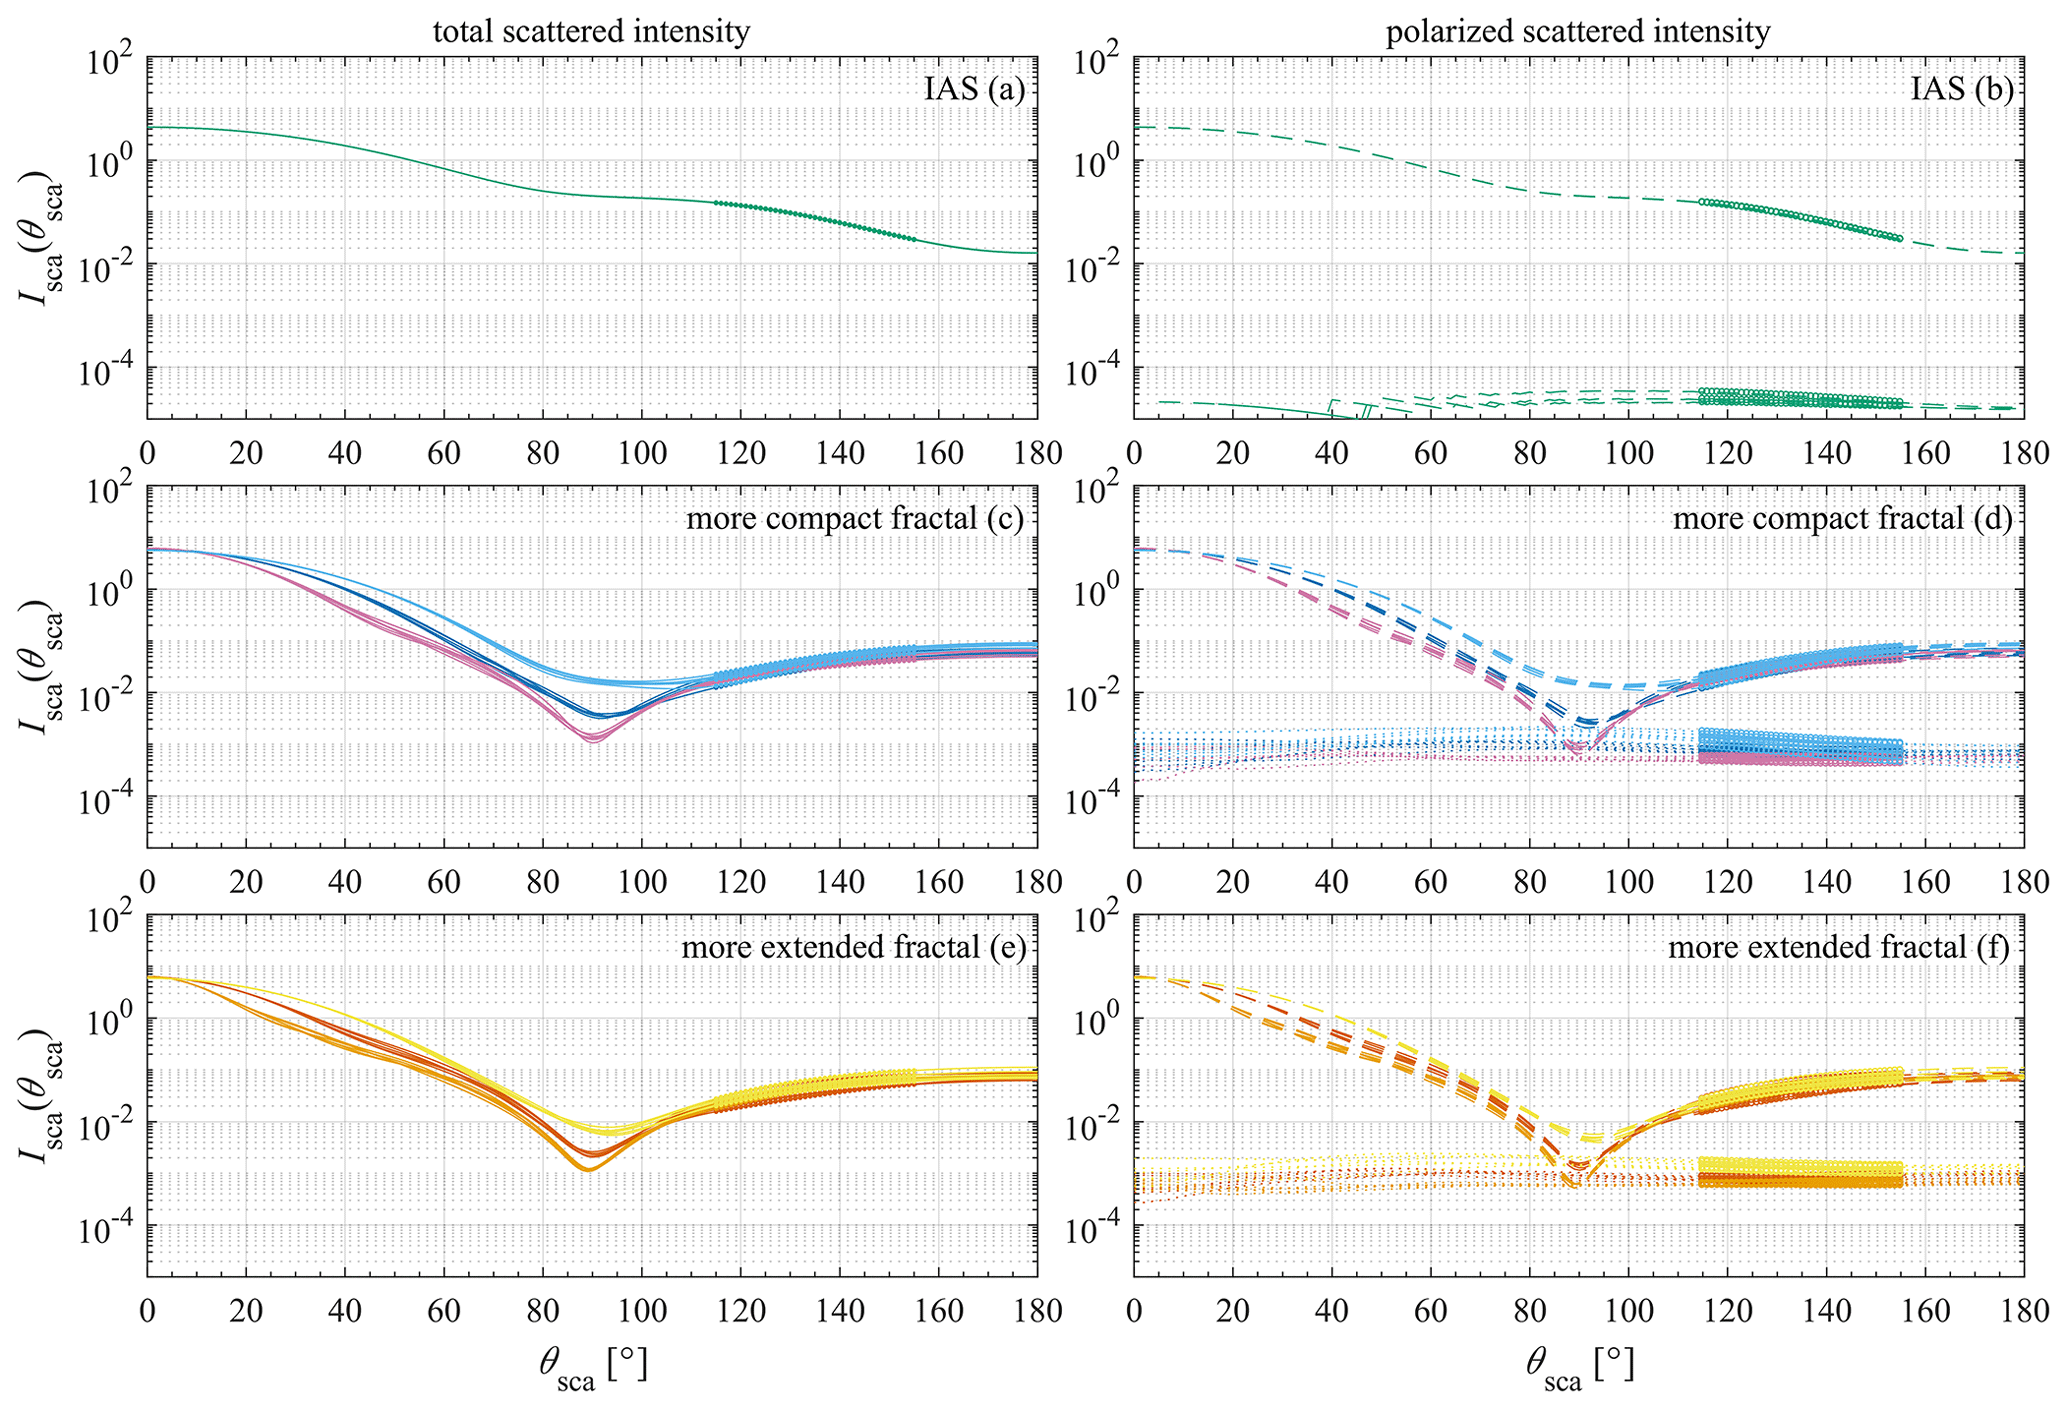
Figure 7Scattered intensity as a function of scattering angle as obtained from MSTM for different realizations of the default IAS, default more compact fractal aggregate, and default more extended fractal aggregate (all generated starting with an SC aggregate with Douter-envelope=400 nm and dpp=35 nm): (a, b) different realizations of the default IAS aggregate (green curves); (c, d) different realizations of the default more compact fractal aggregate (purple curves: Df=2.12, kSorensen=0.992; blue curves: Df=2.34, kSorensen=1.085; light-blue curves: PCA rather than CCA, Df=2.56, kSorensen=1.186); (e, f) different realizations of the default more extended fractal aggregate (orange curves: Df=1.68, kSorensen=1.700; red curves: Df=1.92, kSorensen=1.873; yellow curves: Df=2.16, kSorensen=2.065). Panels (a), (c), and (e) contain the total scattered intensity (solid curves), while panels (b), (d), and (f) contain the scattered intensity polarized parallel (dashed curves) and perpendicular (dotted curves) to the scattering plane. The range ∘ of the calculations is highlighted on each curve with a thicker curve.
From Fig. 7c to f, where each color represents a group of realizations of fractal aggregates with identical values of Df, kSorensen, Npp, and dpp, we see that, as Liu and Mishchenko (2007) found, there is indeed a similarity to the scattering patterns of each group of curves. However, at the same time, there is some discernable spread in the scattering patterns, including in the range ∘. From Fig. 7c to f, we see that, within each graph, the more compact the fractal aggregate, the higher the values of scattered intensity over nearly the entire range of scattering angles, including over the range ∘. In Fig. 7c and d, which are different realizations of the more compact fractal aggregate (CCA, Df=2.34, kSorensen=1.085), the light-blue curves (PCA, Df=2.56, kSorensen=1.186) lie largely above the blue curves (CCA, Df=2.34, kSorensen=1.085), which in turn lie largely above the purple curves (CCA, Df=2.12, kSorensen=0.992). In Fig. 7e and f, which are different realizations of the more extended fractal aggregate (CCA, Df=1.92, kSorensen=1.873), the yellow curves (CCA, Df=2.16, kSorensen=2.065) lie largely above the red curves (CCA, Df=1.92, kSorensen=1.873), which in turn lie largely above the orange curves (CCA, Df=1.68, kSorensen=1.700). This is true of the total scattered intensity and of the parallel polarized and perpendicularly polarized scattered intensities, and it corresponds with the fact that the scattering cross sections of the more compact fractal aggregates as calculated from the output of MSTM are higher than the scattering cross sections of the more extended fractal aggregates. (Refer to Table B4.)
Only in the direct forward-scattering direction does the scattered intensity of the more extended fractal aggregates in each graph increase above the scattered intensity of the more compact fractal aggregates, and this is only to a small extent that is difficult to discern by eye from the graphs. This is despite the fact that the extinction cross sections of the more extended aggregates are lower than the extinction cross sections of the more compact aggregates (again, refer to Table B4) and is probably due to the larger overall outer envelopes of the more extended aggregates (refer to Figs. 2 and 3). Due to the larger overall outer envelopes of the more extended aggregates, their normalized scattering phase functions exhibit stronger and narrower forward-scattering peaks (see, e.g., Bohren and Kho, 1985; Gustafson and Kolokolova, 1999; and Liu and Mishchenko, 2005, their Fig. 2). Even though the elements of the scattering phase matrix are multiplied by σsca in converting from S to Isca(θsca) in Eqs. (4) and (5), the multiplication by σsca is not enough to increase the directly forward-scattered intensity in the broader forward-scattering peak exhibited by the more compact aggregates to values greater than the directly forward-scattered intensity in the narrower forward-scattering peak exhibited by the more extended aggregates.
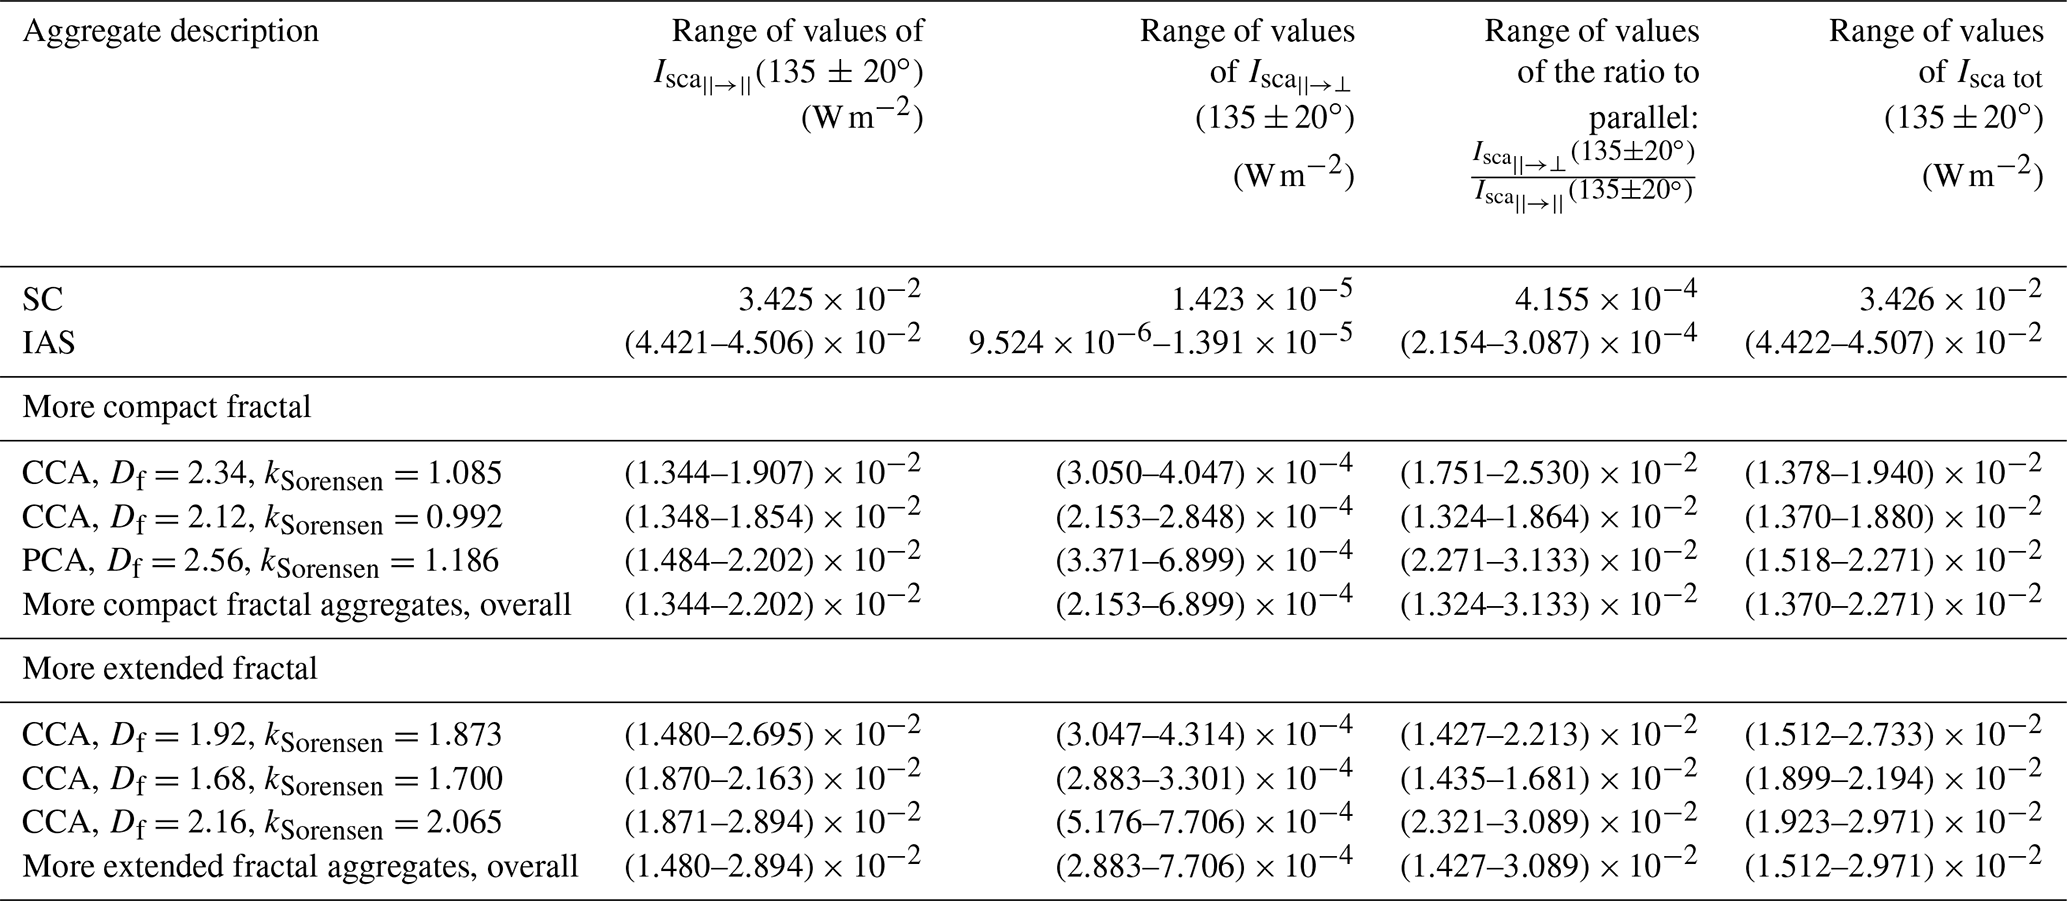
In Table 5, we list the ranges of values of scattered intensity over the range ∘ corresponding with Fig. 7. As was evident from Fig. 7, we can see from Table 5 that, within each category, the more compact the fractal aggregate, the higher the values of scattered intensity in the angular range . However, the overall range of perpendicularly polarized scattered intensity in the angular range ∘ for the more extended fractal aggregates ((2.883–7.706) × 10−4) is higher than the overall range of perpendicularly polarized scattered intensity in the angular range ∘ for the more compact fractal aggregates ((2.153–6.899) × 10−4), and both of these ranges of intensity values encompass values that are more than 1 order of magnitude higher than the values of perpendicularly polarized scattered intensity for the SC aggregate (1.423 × 10⁻⁵) and for the IAS aggregates (9.524 × 10⁻⁶–1.391 × 10⁻⁵), all of which agrees with the direction of the SPIN measurements. On the other hand, the highest ratio of perpendicularly polarized scattered intensity to parallel polarized scattered intensity in the angular range ∘ among all of the fractal aggregates is 3.133 × 10⁻², which is lower than the 95th percentile value of the ratio of either of the sample sets from the SPIN measurements (0.102 and 0.515, respectively; refer to Table 1).
Table 5Ranges of values of scattered intensity over the range ∘ for different realizations of aggregates generated starting with an SC aggregate with Douter-envelope=400 nm and dpp=35 nm. The values for the single SC realization from Table 2 are also included here for reference.
In Sect. 3.6, we explore the range of values obtained with these same aggregate realizations but with fixed aggregate orientation in the MSTM model calculations.
3.6 Theoretical calculations – fixed orientation versus random orientation
As described in Sect. 2.2, by default, all of the theoretical calculations presented up to this point were obtained using the random-orientation option of MSTM. On the one hand, we do not expect a particular orientation of the particles in the SPIN OPC to have been dominant; as a whole, the particles would have been more or less randomly oriented during the measurement. On the other hand, as an individual particle passed through the SPIN system, it would have been in some individual orientation. While we cannot ensure that the fixed orientation of an individual realization that we generated would be the same as the orientation that a particular aggregate had as it passed through the SPIN system, it is still worthwhile examining how removing the random-orientation option in the MSTM calculations changes the range of calculated scattered intensity values. To this end, in this section, we conduct calculations on the same realizations as in Sect. 3.5 but now with each aggregate in fixed orientation. In Table B5, we list the ranges of values of extinction, absorption, and scattering cross sections for all of the realizations of the aggregate-generating algorithms, with each aggregate in fixed orientation. From Table B5, we see once again that the most compact aggregates (SC, IAS, PCA with Df=2.56 and kSorensen=1.186, and CCA with Df=2.16 and kSorensen=2.065) tend to have the highest extinction cross sections and scattering cross sections, which again agrees with the results of Liu and Mishchenko (2005), Liu et al. (2008), and Romshoo et al. (2021). We also see that the ranges of values in Table B5 are a little broader than the ranges of values in Table B4, as expected. The ranges of relative differences between the values used to construct Table B5 and the values used to construct Table B4 are given in Table C1. From Table C1, the relative difference in extinction cross sections between fixed and random orientation reaches as high as 0.094, and this is for one of the more extended fractals with Df=1.92, kSorensen=1.873. The relative difference in absorption cross sections between fixed and random orientation reaches as high as 0.066, and this is for one of the more extended fractals with Df=2.16, kSorensen=2.065. The relative difference in scattering cross sections between fixed and random orientation reaches as high as 0.24, and this is for one of the more extended fractals with Df=1.92, kSorensen=1.873 for which the cross section increases from 5.803 × 10⁻¹⁴ m2 with random orientation to 7.189 × 10⁻¹⁴ m2 with fixed orientation.
In Table 6, we list the ranges of values of scattered intensity in the angular range ∘ with each aggregate in fixed orientation. As expected, overall, with fixed orientation, the ranges of the values of scattered intensity in the angular range ∘ are much broader, with the lowest value of each range significantly lower and the highest value of each range significantly higher than the respective values in Table 5, but the tendencies are the same as those seen in Table 5. As in Table 5, we see from Table 6 that the overall range of perpendicularly polarized scattered intensity in the angular range ∘ for the more extended fractal aggregates (5.601 × 10⁻⁵–1.965 × 10⁻³) is higher than the overall range of perpendicularly polarized scattered intensity in the angular range ∘ for the more compact fractal aggregates (5.858 × 10⁻⁶–8.439 × 10⁻⁴), and both of these ranges of intensity values encompass values that are more than 1 order of magnitude higher than the values of perpendicularly polarized scattered intensity for the SC aggregate in fixed orientation (2.030 × 10⁻⁶) and for the IAS aggregates in fixed orientation ((1.065–7.332) × 10−6).
Table 6Ranges of values of scattered intensity over the range ∘ for different realizations of aggregates generated starting with an SC aggregate with Douter-envelope=400 nm and dpp=35 nm when the aggregates are in fixed orientation rather than random orientation. The values for the single SC realization from Table 2 are also included here for reference.
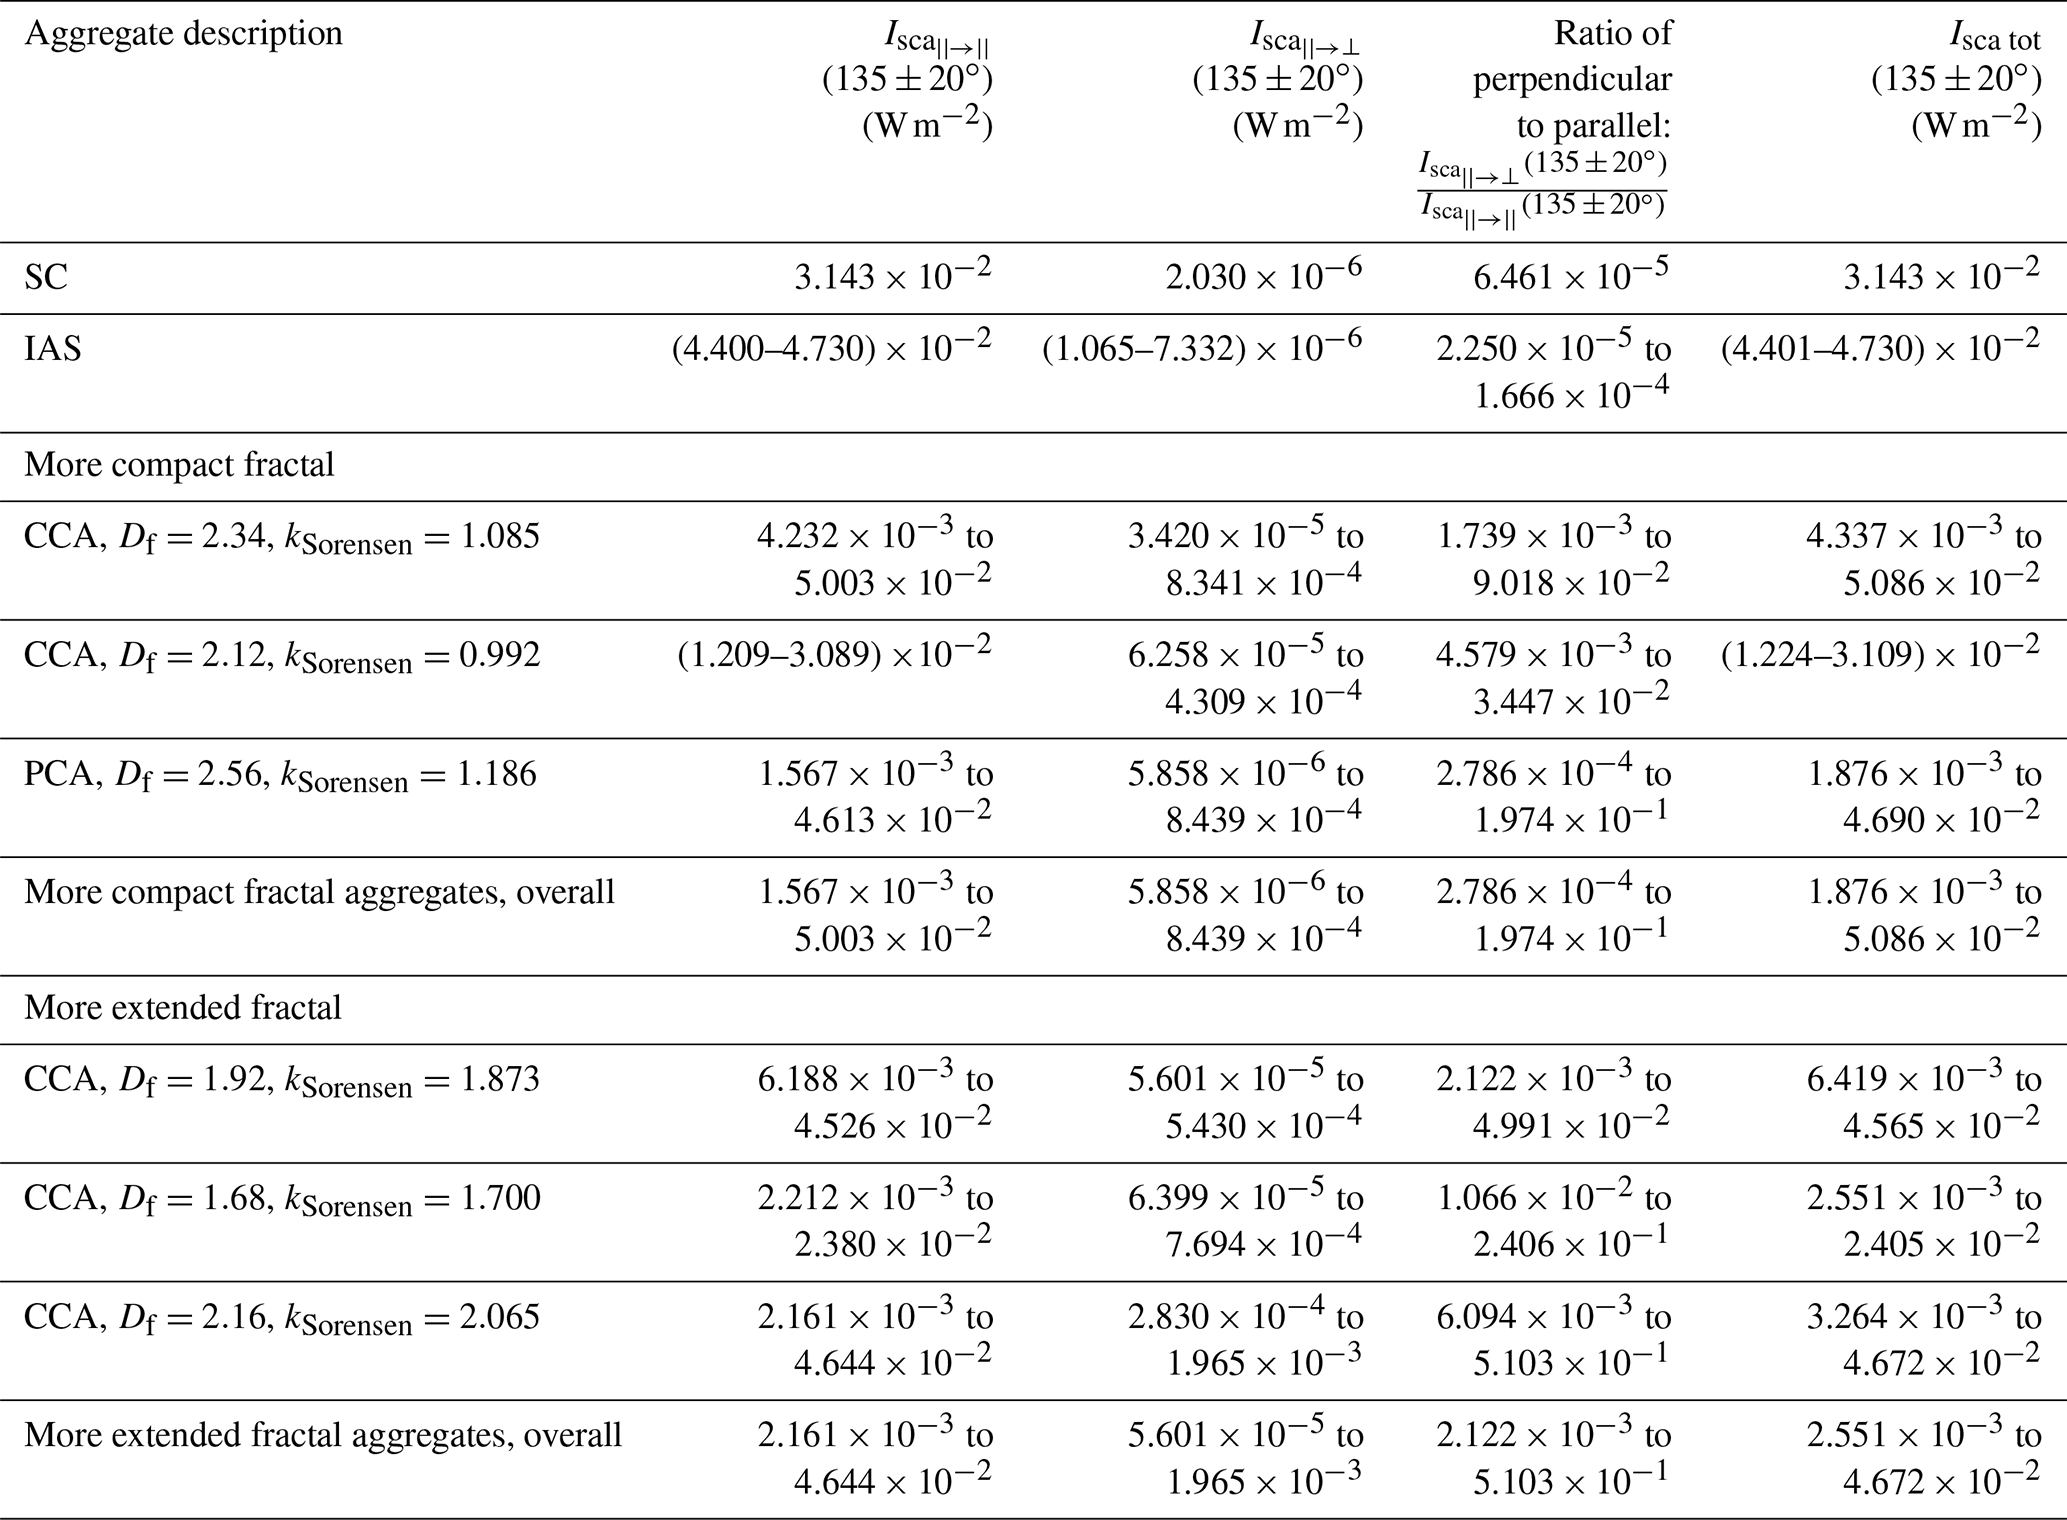
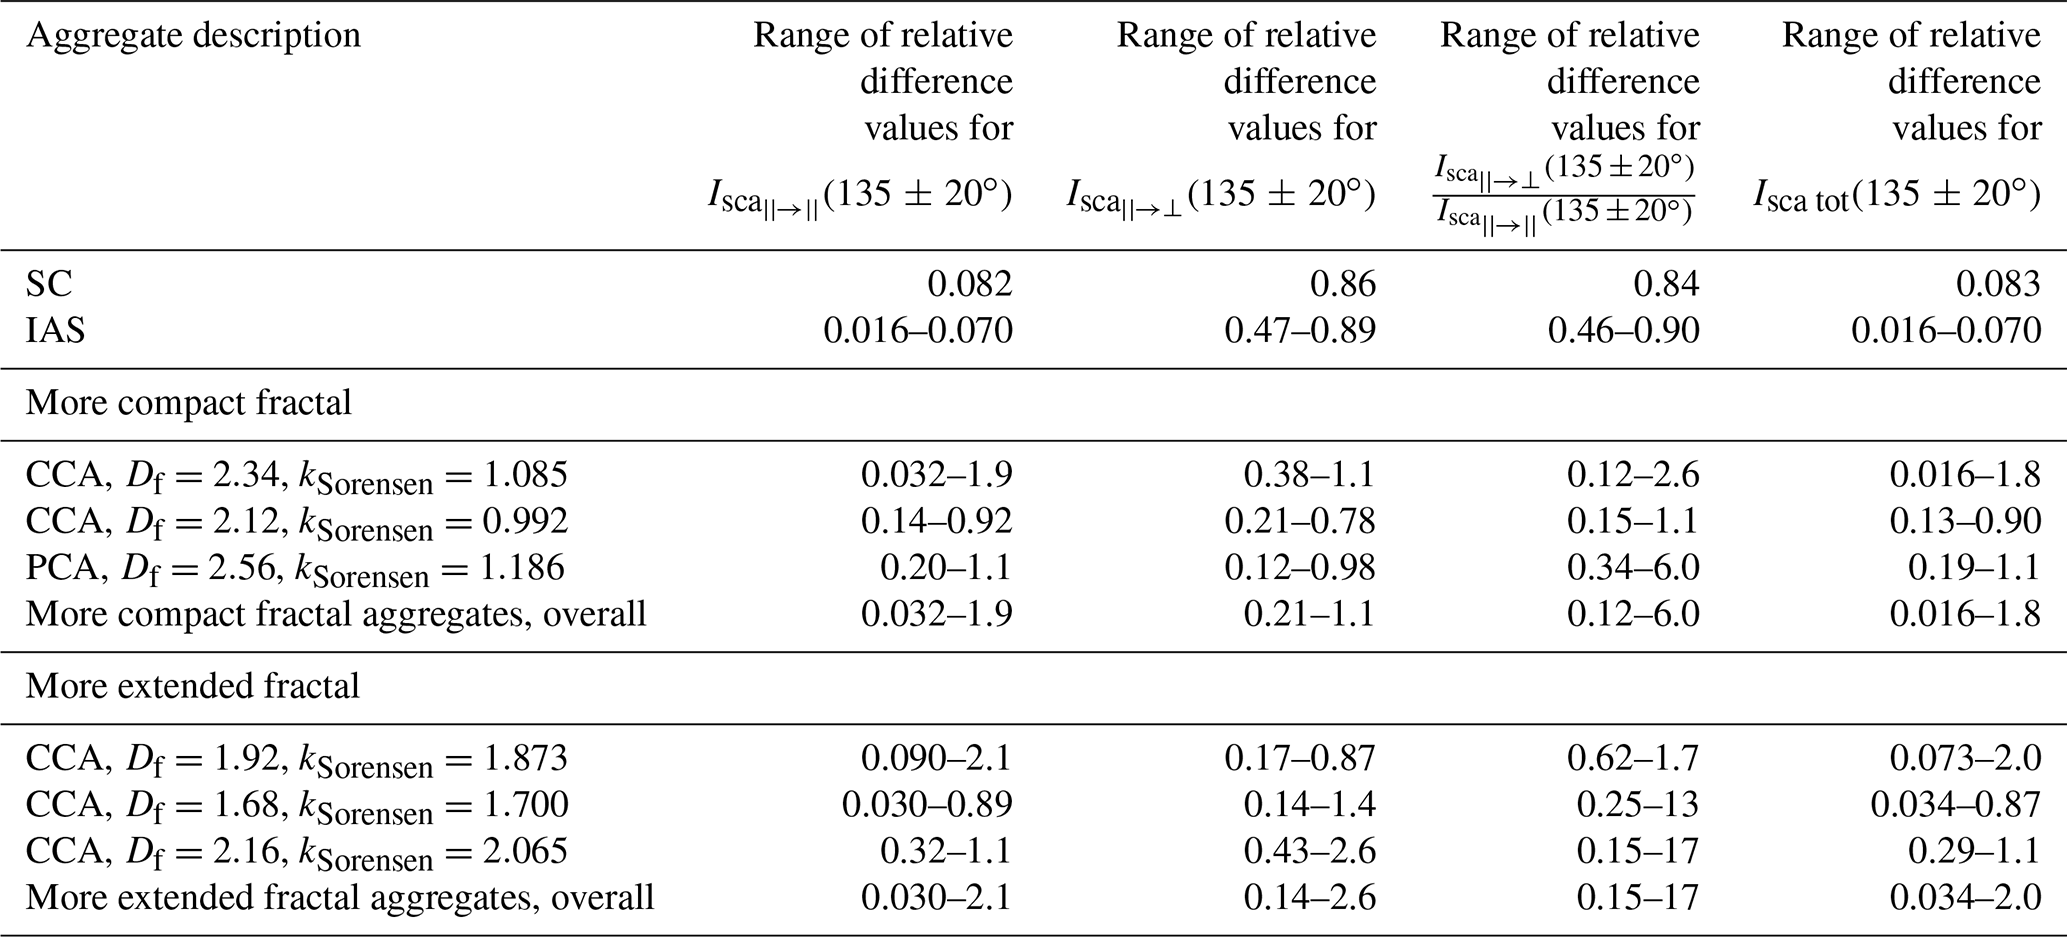
In addition, from Table 6, we can see that the highest ratio of perpendicularly to parallel polarized scattered intensity in the angular range ∘ among all of the more compact fractal aggregates is 1.974 × 10⁻¹, and the highest ratio of perpendicularly to parallel polarized scattered intensity in the angular range ∘ among all of the more extended fractal aggregates is 5.103 × 10⁻¹. These values are comparable to the 95th percentile values of the ratio of the sample sets from the SPIN measurements (again, 0.102 and 0.515, respectively; refer to Table 1). Thus, we find that individual aggregates in fixed orientation can reproduce the highest ratios of perpendicularly to parallel polarized scattered intensity exhibited by the samples from the SPIN measurements. The ranges of relative differences between the values used to construct Table 6 and the values used to construct Table 5 are given in Table C2. From Table C2, the relative difference in between fixed and random orientation reaches as high as 2.1, and this is for one of the more extended fractals with Df=1.92, kSorensen=1.873. The relative difference in between fixed and random orientation reaches as high as 2.6, and this is for one of the more extended fractals with Df=2.16, kSorensen=2.065. Notably, the relative difference in the ratio of perpendicularly to parallel polarized scattered intensity between fixed and random orientation reaches as high as 17, and this is also for one of the more extended fractals with Df=2.16, kSorensen=2.065 for which increases from 2.766 × 10⁻² with random orientation to 5.103 × 10⁻¹ with fixed orientation. The relative difference in Isca tot (135 ± 20∘) between fixed and random orientation reaches as high as 2.0, and this is for one of the more extended fractals with Df=1.92, kSorensen=1.873.
As mentioned in Sects. 2.1 and 3.1, a larger value of perpendicularly polarized scattered intensity for parallel polarized incident intensity indicates some asymmetry or nonsphericity in the shape of the scattering particles or possibly some birefringence or chirality in the scattering particle material. This might lead one to expect that the more fractal or extended the aggregate, the larger the value of the perpendicularly polarized scattered intensity obtained. However, in computing the absolute value of scattered intensity (rather than the normalized scattering phase matrix), the elements of each scattering phase matrix are weighted by the total scattering cross section of the aggregate (refer to Eqs. 4 and 5). Thus, the higher scattering cross sections exhibited by the more compact aggregates of each set of realizations (refer to Sect. 3.5) give more weight to their calculated scattered intensity.
We find that, combining these two facts, the aggregates that possess a relatively high porosity but that are not too extended in shape are those that exhibit the highest perpendicularly polarized scattered intensity. Indeed, the realizations of the fractal aggregate generated using PCA with Df=2.56 and kSorensen=1.186 exhibit the highest values of the perpendicularly polarized scattered intensity of all of the more compact fractal aggregates, and the realizations of aggregates generated using CCA with Df=2.16 and kSorensen=2.065 exhibit the highest values of the perpendicularly polarized scattered intensity of all of the more extended fractal aggregates (refer to the discussion of Fig. 7 and to Tables 5 and 6).
In addition, as presented in Sects. 3.2–3.5, we find that, using the random-orientation option of MSTM on our theoretical aggregates, we are able to reproduce the qualitative behavior of the SPIN measurements when we compare our calculations to the median values of those measurements. That is, the overall range of perpendicularly polarized scattered intensity in the angular range ∘ for the more extended theoretical fractal aggregates is consistently higher than the overall range of perpendicularly polarized scattered intensity in the angular range ∘ for the more compact theoretical fractal aggregates.
Although the measurements and theory agree qualitatively, quantitative agreement is not always observed. As described in Sect. 3.2–3.5, we found that, using the random-orientation option of MSTM on our theoretical aggregates, the highest values of the ratio of perpendicularly polarized scattered intensity to parallel polarized scattered intensity in the angular range ∘ exhibited by our theoretical aggregate realizations are not as high as the highest ratios exhibited by the COJ300 and R2500U 400 nm samples from the SPIN measurements.
As shown in Sect. 3.6, only with fixed orientation do some values of the ratio of perpendicularly polarized scattered intensity to parallel polarized scattered intensity in the angular range ∘ resemble the ratios in the 95th percentile of the measured values. In fact, for individual aggregates, an even higher measured value of the ratio is possible. The bottom row of Table 1 was obtained by dividing the row labeled “S” by the row labeled “P”, but if we were to present the different percentiles of based on the value of for individual aggregates, the 95th percentile value of would actually be ∼ 1.0. We did not obtain a value of close to 1.0 for any of our theoretical aggregates.
A number of reasons for the lack of quantitative agreement are possible. Foremost, we note that there could be differences between the specifications of our theoretical aggregates and the actual chemical and physical properties of the measured aggregates. As described in Sects. 1 and 2.2, in our simulations, the aggregates in each set consist of the same number of primary particles of the same primary particle size but differing primary-particle configurations. Thus, we are able to make an apples-to-apples comparison in which all of the parameters in each set of aggregates are held constant except for the configurations of the primary particles. However, from observations (e.g., Fig. 1), the primary-particle size can vary within the same aggregate as well as from aggregate to aggregate, and the number of primary particles can vary from aggregate to aggregate even within the same sample set. As found by Bescond et al. (2013) and Liu and Mishchenko (2005) and as reviewed in Kahnert and Kanngießer (2020), the direct back-scatter depolarization ratio can vary with primary-particle size and with the number of primary particles. On the other hand, Paulien et al. (2019) (also reviewed in Kahnert and Kanngießer, 2020) found that the number of primary particles does not have a significant impact on the direct back-scatter depolarization ratio. For the cases we tested, we found that when all of the other parameters are held constant, the ratio increases with dpp and with Npp for the more extended fractal aggregate (Df=1.92; kSorensen=1.873) but not for the more compact fractal aggregate (Df=2.34; kSorensen=1.084). (Refer to Tables 2 and 3.) Thus, we cannot say for certain whether further variations in dpp and Npp beyond what we already tested would reconcile the quantitative discrepancies.
Aside from further variations in dpp and Npp, there could be additional differences in the configuration of the primary particles within the aggregates beyond what our various realizations of the aggregate-generating algorithms covered. When inspecting the SEM images, such as our Fig. 1, the viewing angle can mask additional asymmetry in the overall structure. Perhaps there is some chirality of shape (a slight helicity or handedness of some other form) in the aggregates examined in the SPIN measurements that the theoretical aggregate-generating algorithms we employed do not fully reproduce. Alternatively, as investigated in Lu and Sorensen (1994) and Bescond et al. (2013) and as reviewed in Kahnert and Kanngießer (2020), effects such as overlapping of primary particles and “necking” can increase the linear depolarization ratio in the direct back-scattering direction to as high as 0.03, but this value is still significantly lower than the highest ratios we measured. (Interestingly, Lu and Sorensen, 1994, suggested necking in an attempt to reconcile the fact that their calculations underestimated the depolarization of forward-scattered radiation.) It seems less likely, but there could also be a measure of intrinsic chirality or birefringence in the BC material itself used to generate the SPIN measurement samples; such possible intrinsic chirality or birefringence was not considered in our theoretical calculations.
We believe that the orientation of the particles throughout our experimental setup, and specifically in the detection region of the optical particle counter, is random. There remains a possibility that we do not fully understand the flow in this region and that it could lead to an organized orientation.
Yet another possibility concerns the contribution of Rayleigh scattering due to the presence of air in the chamber in the SPIN measurements. However, this is likely to be a minor effect due to both the weak depolarizing ability of air molecules ( 0.02; see, e.g., Sassen, 2000) and the low intensity of scattered radiation from Rayleigh scattering as compared to the intensity of scattered radiation from the aggregates, which would give the Rayleigh depolarization signal only a small weight in the overall depolarization signal. Likewise, while carbonaceous particles, such as soot, can exhibit Raman scattering (see, e.g., Le et al., 2022), the Raman scattered signal is by nature very weak and only exhibits depolarization if the new vibrational mode to which the molecules transition is asymmetric enough. Other technical aspects of the measurements, such as deviations of the incident wave from being a 100 % coherent plane wave that is 100 % polarized parallel to the scattering plane would likely also only have a minor effect.
Carbonaceous aerosol particles are ubiquitous in the atmosphere. Their ability to impact atmospheric chemistry, human health, and climate has led to numerous studies of their morphological, chemical, cloud formation, and radiative properties (see, e.g., Bond et al., 2006; Bond and Bergstrom, 2006; Liu and Mishchenko, 2018; Kahnert and Kanngießer, 2020; Romshoo et al., 2021, and references therein). In this study, we analyzed laboratory measurements of scattering of visible radiation at scattering angles of 135±20∘ by analogs of bare (uncoated) atmospheric BC aggregates obtained with the SPIN instrumentation, and using the MSTM model, we conducted theoretical calculations of scattering of visible radiation by theoretical BC aggregates constructed based on the measured morphological parameters of the laboratory-generated aggregates. As discussed in Sect. 4, we found that, using the random-orientation option of MSTM on our theoretical aggregates, we are able to reproduce the qualitative behavior of the SPIN measurements when we compare our calculations to the median values of those measurements. However, using the random-orientation option of MSTM on our theoretical aggregates, the highest values of the ratio of perpendicularly polarized scattered intensity to parallel polarized scattered intensity in the angular range ∘ exhibited by our theoretical aggregate realizations are not as high as the highest ratios exhibited by the COJ300 and R2500U 400 nm samples from the SPIN measurements. We found that only with fixed orientation do some values of the ratio of perpendicularly polarized scattered intensity to parallel polarized scattered intensity resemble the ratios in the 95th percentile of the measured values.
We note that relatively high values of the back-scattering linear depolarization ratio were also obtained in the field measurements of Burton et al. (2015) (original and corrigendum). Liu and Mishchenko (2018) demonstrated that they were only able to reproduce such high values of the back-scattering linear depolarization ratio by simulating aged soot containing large amounts of refractory materials along with black carbon, not with bare soot. Similarly, Kahnert and Kanngießer (2020) state in their review that, in most cases typical for atmospheric BC, the depolarization ratio of bare BC aggregates rarely exceeds the range 0.01–0.03. In this work, we demonstrated that even bare black carbon can exhibit high values of in the side- and back-scattering directions and that we can reproduce such high values in calculations of single scattering by bare BC aggregates if we use fixed orientation. However, it is important to note that the angles we inspected in the back-scattering hemisphere are not in the exact direct back-scattering direction considered in Burton et al. (2015) and Liu and Mishchenko (2018).
There are several opportunities for future work in this area. On the experimental side, other existing instruments, such as the Droplet Measurement Technologies Single Particle Soot Photometer (SP2) (Schwarz et al., 2015) or a custom-designed instrument to measure a wider range of scattering angles, might be useful in future work. Likewise, a wider range of experimental BC analog samples, more in-depth imaging, and more sophisticated size selection would provide even better experimental statistics. On the theoretical side, additional realizations further varying the 3D aggregate structure (such as varying the internal size distribution of the primary particles in each aggregate, further varying the arrangement of the primary particles, and further varying the number of primary particles) and further varying the chemical properties of the black carbon could be investigated. In addition, variations in the plane of scattering could be explored.
We conclude that our results might have important implications for remote sensing of soot aerosol via lidar back-scattering, as variations in the scattering cross section, in the scattering phase function in the back-scatter direction, and in the extinction cross section all potentially influence the intensity and depolarization of the lidar signal. The received photon number per lidar pulse is proportional to the scattering cross section times the scattering phase function in the back-scatter direction and decreases exponentially over the path of the lidar beam to and from the target as a function of the extinction cross section. Furthermore, such a direct comparison of theory to laboratory experiments of light scattering by BC aggregates as we conducted here represents an additional step towards a better overall understanding of the impact aerosol particles have on our environment and our climate system.
| Abbreviation or symbol | Term |
| BC | Black carbon |
| SC | Simple cubic |
| IAS | Ideal amorphous solid |
| CCA | Cluster–cluster aggregation |
| PCA | Particle–cluster aggregation |
| COJ300 | Sample set of more compact fractal aggregates from Zhang et al. (2020) |
| R2500U | Sample set of more extended fractal aggregates from Zhang et al. (2020) |
| SPIN | SPectrometer for Ice Nuclei |
| P1, P2, S1 | SPIN detectors |
| OPC | Optical particle counter |
| SP2 | Droplet Measurement Technologies Single Particle Soot Photometer |
| Photon count for parallel polarized incident radiation averaged over the two SPIN detectors | |
| S=S1 | Photon count for perpendicular polarized incident radiation |
| P+S | Total photon count parallel plus perpendicularly polarized from the SPIN detectors |
| Linear depolarization ratio from the measurements | |
| RH | Relative humidity |
| Dm | Mobility diameter |
| Douter-envelope | Outer-envelope diameter |
| Npp | Number of primary particles |
| dpp | Primary-particle diameter |
| app | Primary-particle radius |
| Df | Fractal dimension |
| kSorensen | Fractal pre-factor as defined by Sorensen (2001) |
| kZhang et al. | Fractal pre-factor as defined by Zhang et al. (2020) |
| Rg | Radius of gyration |
| Rvolume-mean | Volume-mean radius |
| Lmax | Length of the longest dimension of the aggregate periphery |
| m | Complex refractive index of the aerosol material |
| mreal | Real part of the refractive index of the aerosol material |
| mimag | Imaginary part of the refractive index of the aerosol material |
| MSTM | Multiple-sphere T-matrix model |
| Qext MSTM | Extinction efficiency as given by MSTM |
| Qabs MSTM | Absorption efficiency as given by MSTM |
| Qsca MSTM | Scattering efficiency as given by MSTM |
| σext | Extinction cross section |
| σabs | Absorption cross sections |
| σsca | Scattering cross section |
| θsca | Scattering zenith angle |
| μsca | Cosine of the scattering zenith angle |
| Isca(θsca) | Intensity of scattered radiation as a function of the scattering zenith angle |
| Intensity of parallel polarized scattered radiation for parallel polarized incident radiation | |
| Intensity of perpendicularly polarized scattered radiation for parallel polarized incident radiation | |
| Isca tot | Total intensity of scattered radiation |
| Linear depolarization ratio from the calculations | |
| S | Scattering matrix |
| k | Wave number |
| λ | Wavelength |
| ε | Electric permittivity of the background material |
| c | Speed of light in a vacuum |
| E0 | Amplitude of the electric field of the incident electromagnetic wave |
Table B1Values of extinction, absorption, and absorption efficiencies as well as values of extinction, absorption, and scattering cross sections for aggregates generated starting with an SC aggregate with Douter-envelope=300 nm and dpp=35 nm, for aggregates generated starting with an SC aggregate with Douter-envelope=400 nm and dpp=35 nm, and for aggregates generated starting with an SC aggregate with Douter-envelope=500 nm and dpp=35 nm.
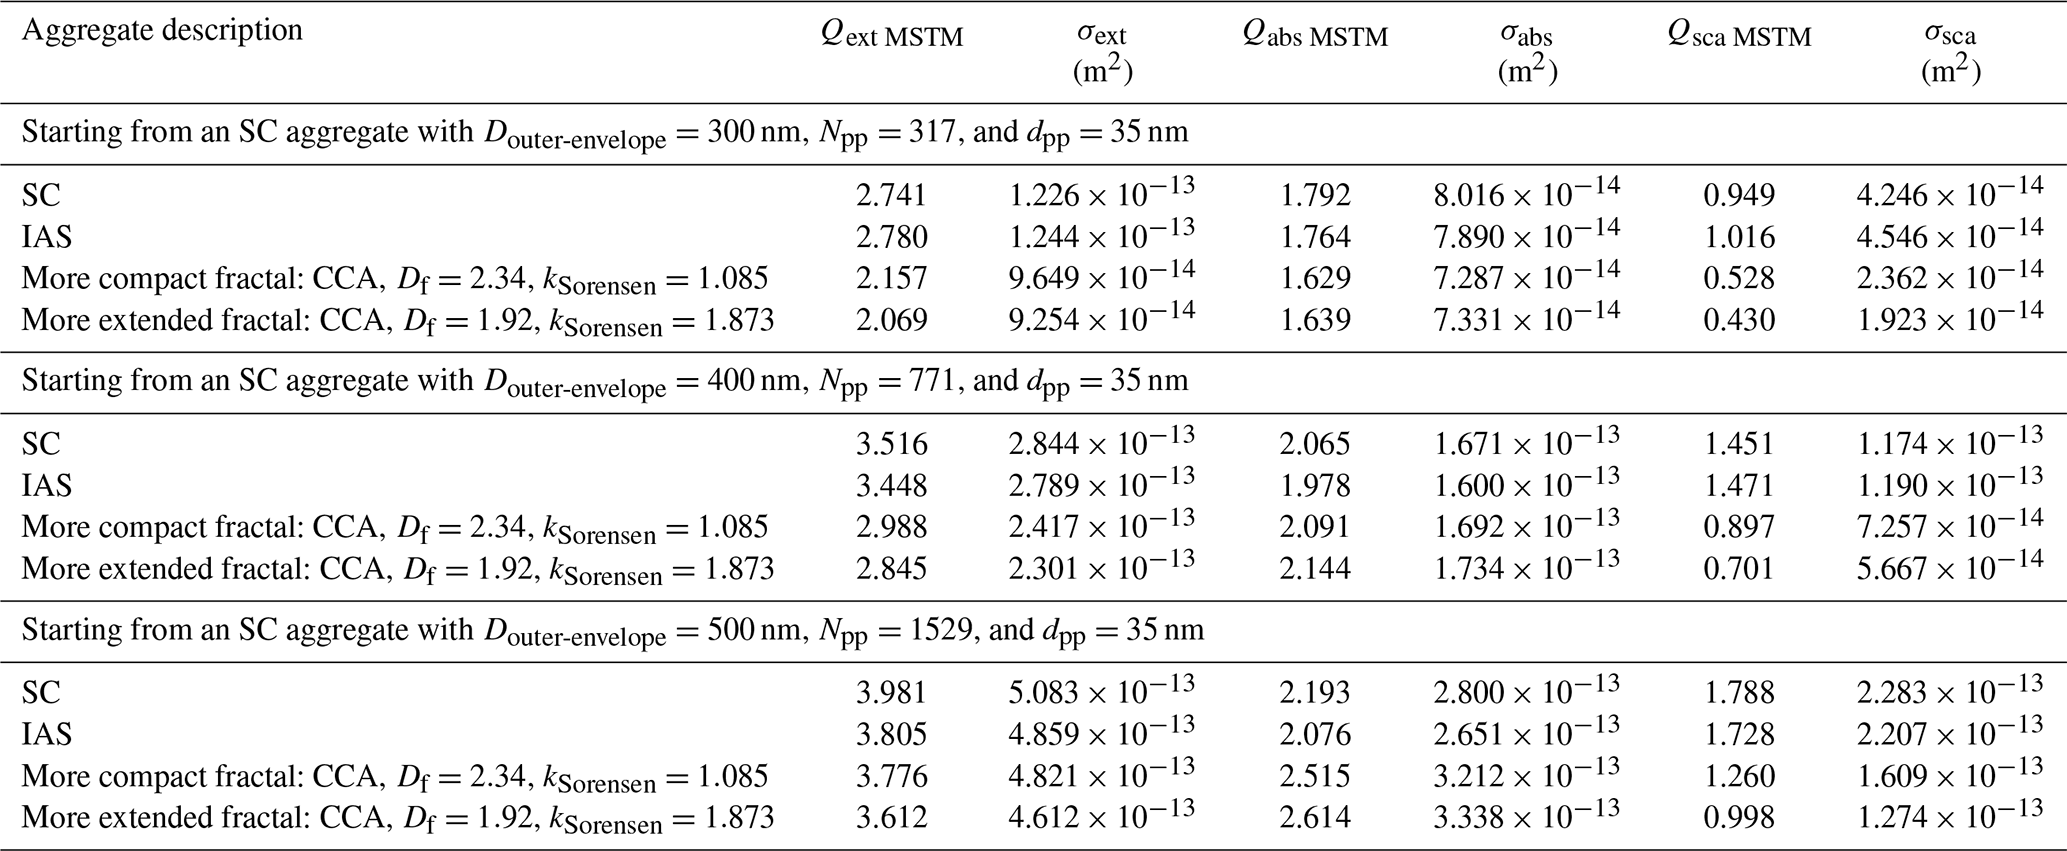
Table B2Values of extinction, absorption, and absorption efficiencies as well as values of extinction, absorption, and scattering cross sections for aggregates generated starting with an SC aggregate with Douter-envelope=400 nm and dpp=25 nm and dpp=45 nm, respectively.
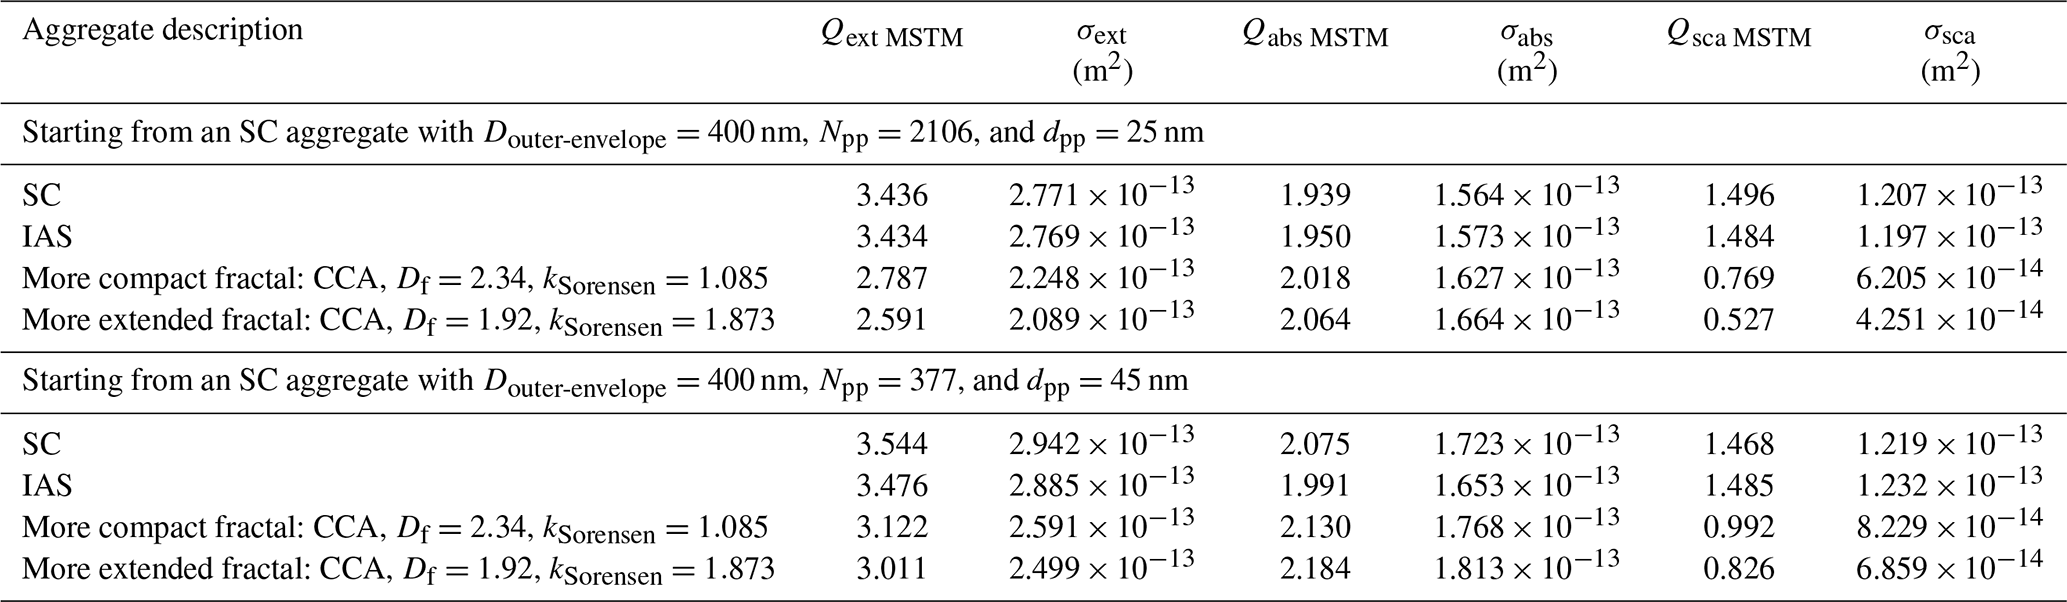
Table B3Values of extinction, absorption, and absorption efficiencies as well as values of extinction, absorption, and scattering cross sections for aggregates generated starting with an SC aggregate with Douter-envelope=400 nm and dpp=35 nm with varying primary-particle refractive indices.
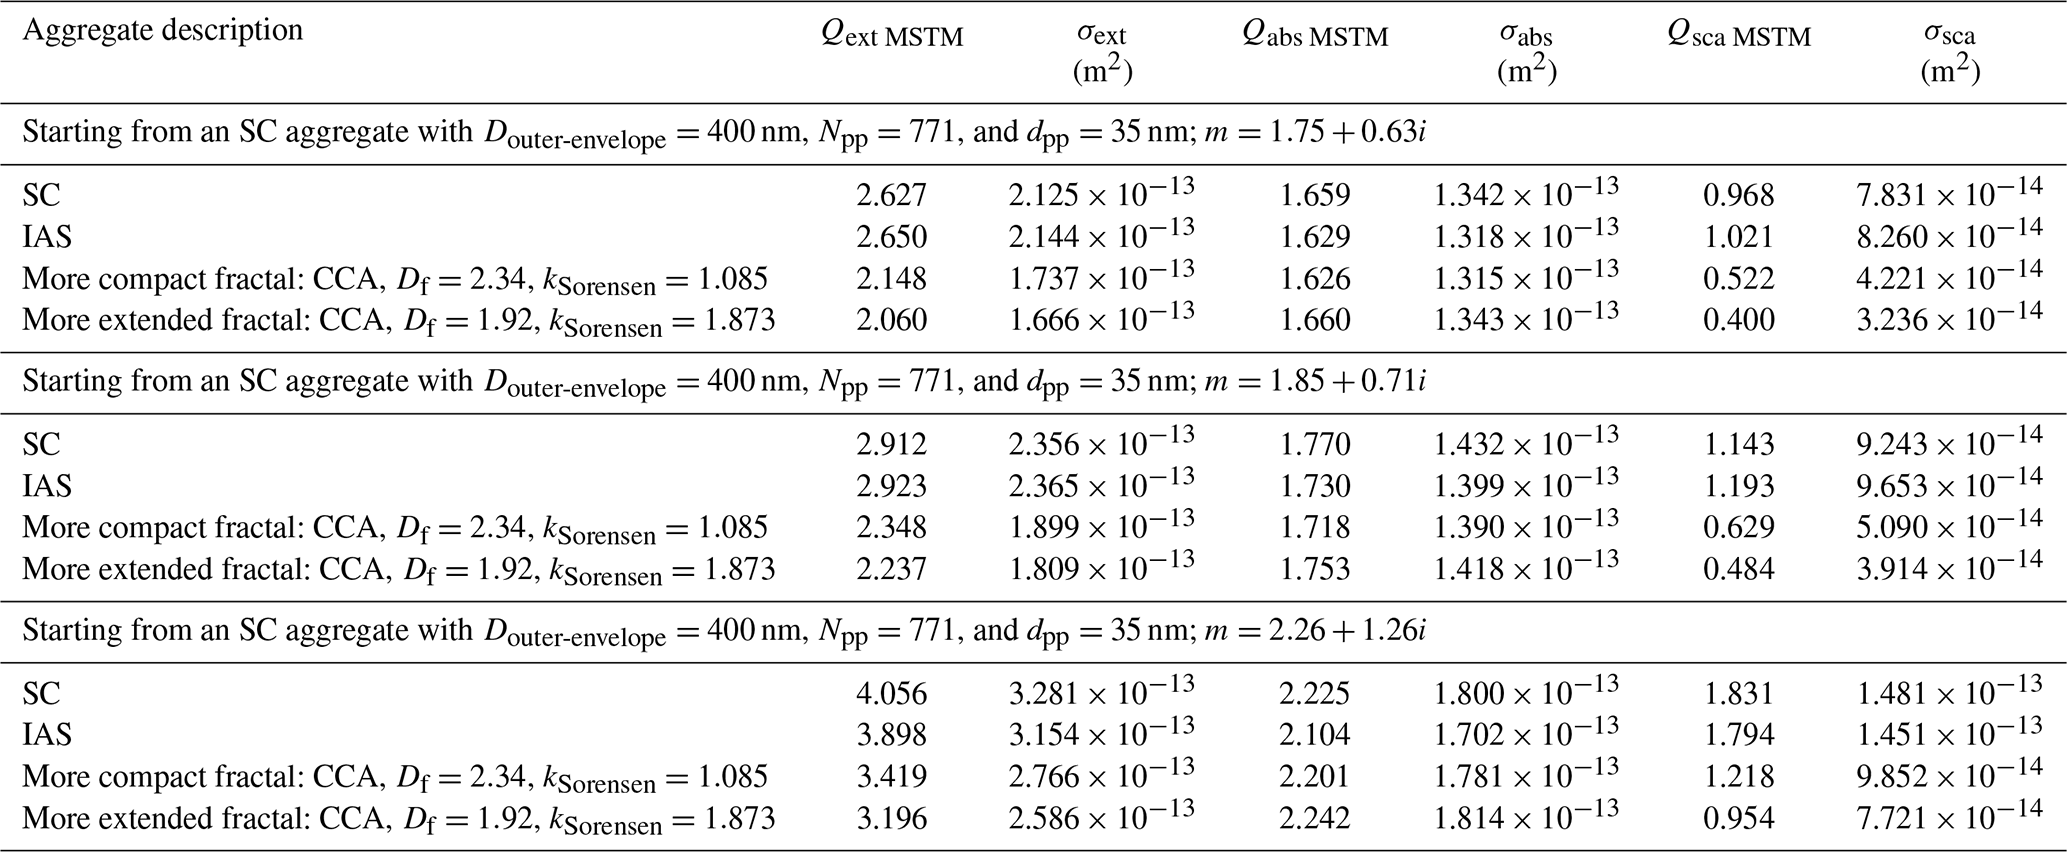
Table B4Ranges of values of extinction, absorption, and absorption cross sections for different realizations of aggregates generated starting with an SC aggregate with Douter-envelope=400 nm and dpp=35 nm. The values for the single SC realization from Table B1 are also included here for reference.
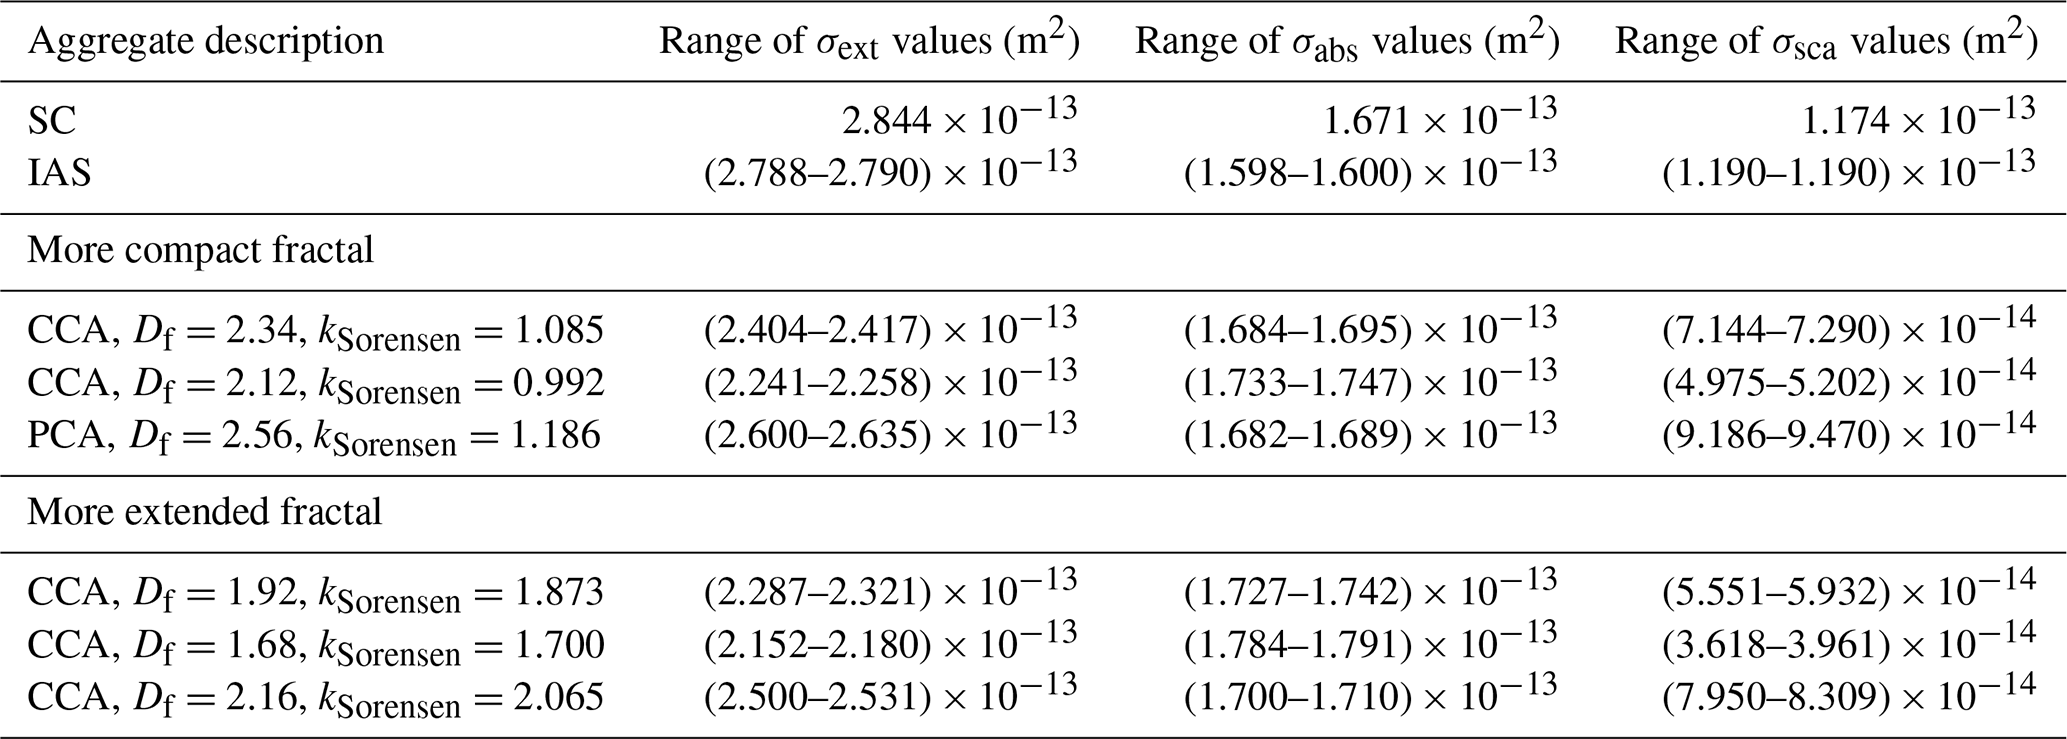
Table B5Ranges of values of extinction, absorption, and absorption cross sections for different realizations of aggregates generated starting with an SC aggregate with Douter-envelope=400 nm and dpp=35 nm when the aggregates are in fixed orientation rather than random orientation. The values for the single SC realization in fixed orientation are also included here for reference.
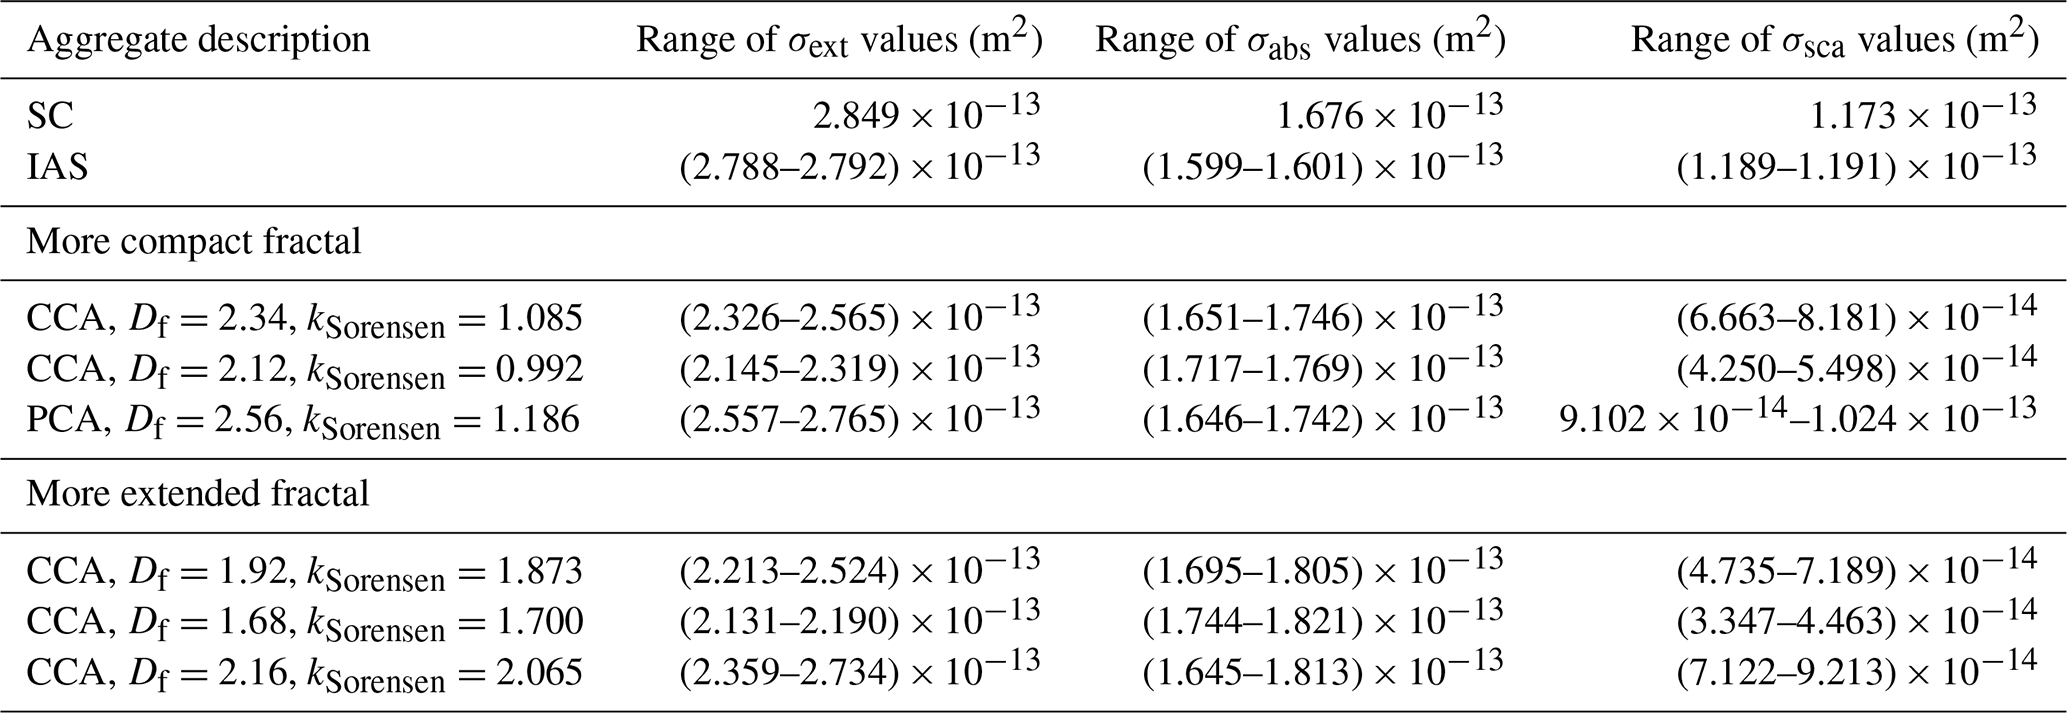
Table C1Range of values of relative differences in the values of extinction, absorption, and absorption cross sections between fixed orientation and random orientation for the different realizations of aggregates generated starting with an SC aggregate with Douter-envelope=400 nm and dpp=35 nm. Each value of relative difference is calculated as the absolute value of (fixed − random) random and is listed to two significant figures.
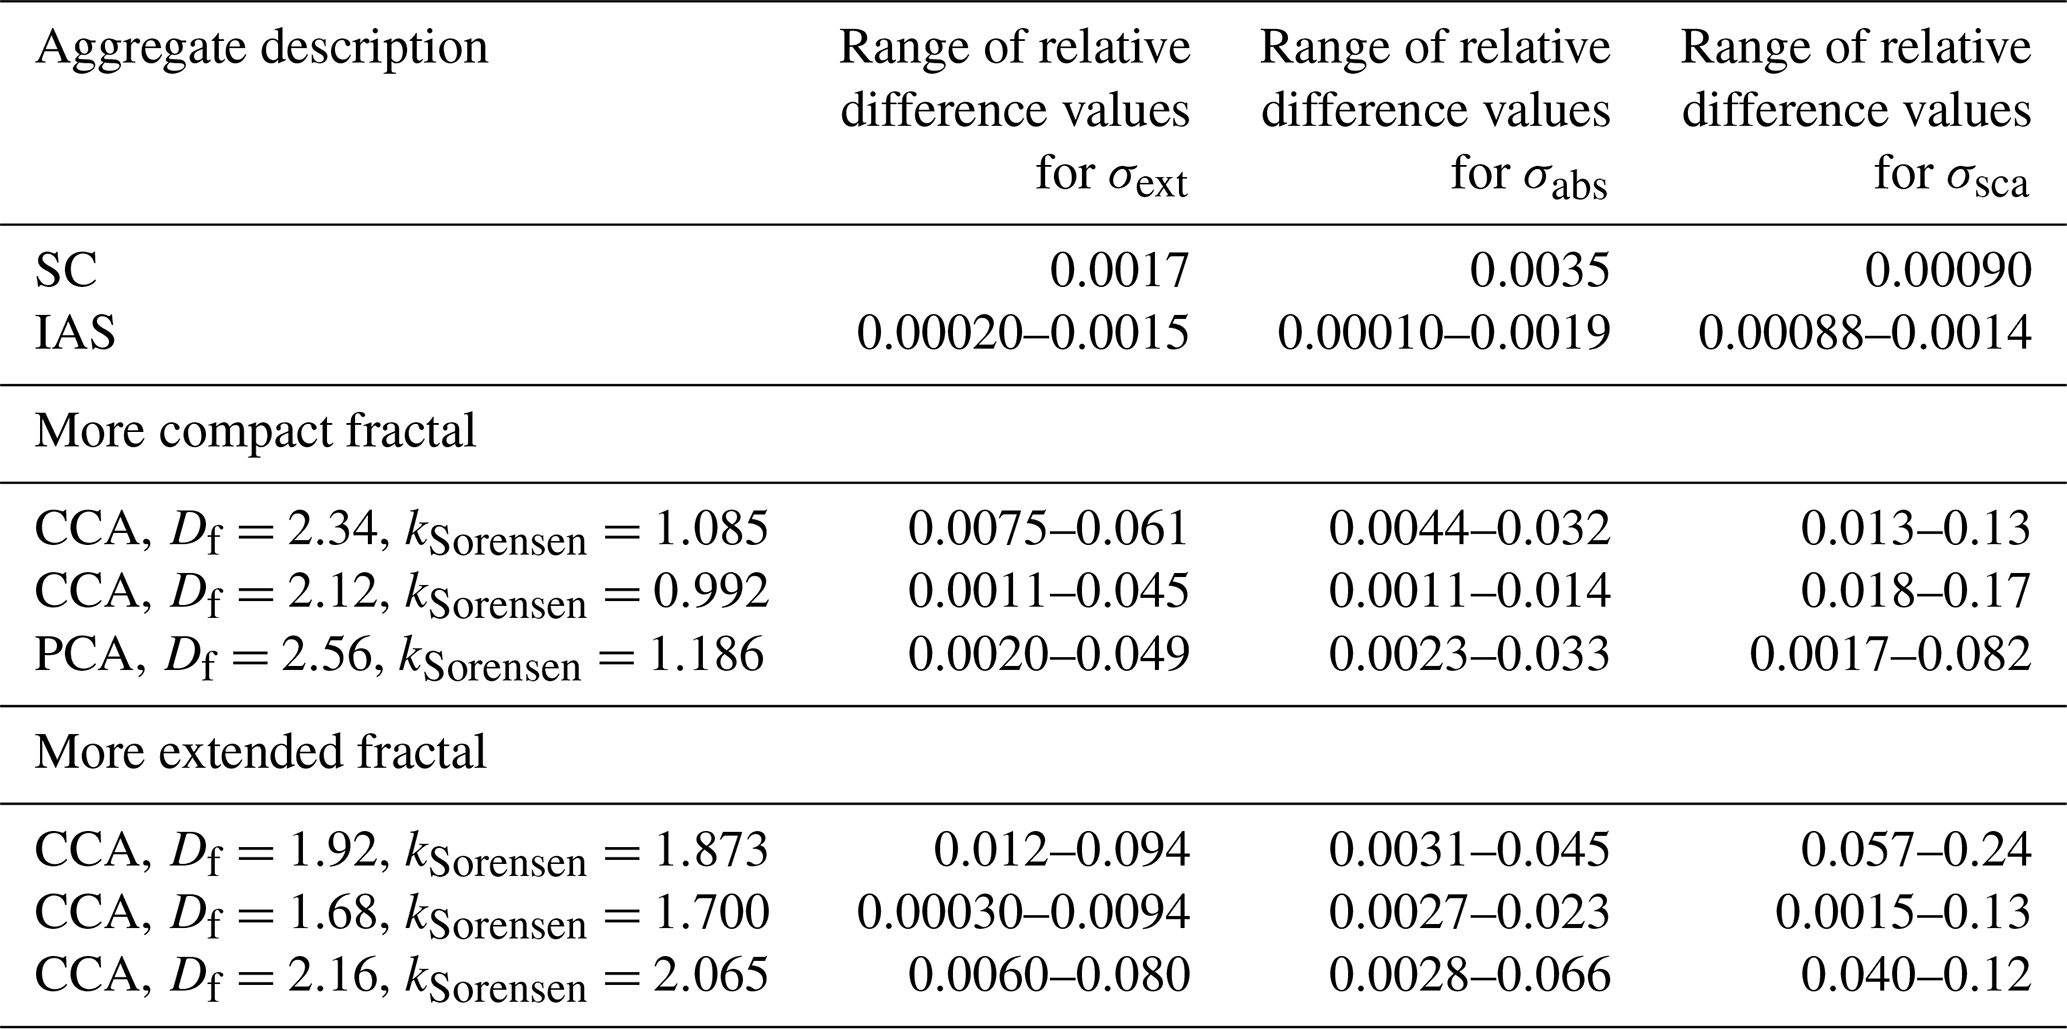
Table C2Range of values of relative differences in the values of scattered intensity over the range ∘ between fixed orientation and random orientation for the different realizations of aggregates generated starting with an SC aggregate with Douter-envelope=400 nm and dpp=35 nm. Each value of the relative difference is calculated as the absolute value of (fixed − random) random and is listed to two significant figures.
The data and model output from this study are available from the authors by request.
CZ and MJW carried out the laboratory experiments under the supervision of DJC. CH performed the calculations and prepared the manuscript with contributions from all of the co-authors. DJC and CH acquired the funding for the project leading to this publication.
The contact author has declared that none of the authors has any competing interests.
Publisher's note: Copernicus Publications remains neutral with regard to jurisdictional claims in published maps and institutional affiliations.
We thank Daniel Mackowski for supplying the aggregate-generating algorithm, for consultation on its use, and for helpful discussions on MSTM in general; Ynon Hefets for helpful discussions on polarization and suggestions for future simulations; Ofir Shoshanim and Jonas Gienger for helpful discussions on scattering experiments; Droplet Measurement Technologies, Inc. and Sarvesh Garimella for useful information on the SPIN instrument; and Yue Zhang and Leonid Nichman for assistance with the black carbon measurements. We also thank the two anonymous referees for their helpful suggestions.
This work was supported by the MIT International Science and Technology Initiatives (MISTI) Israel Seed Fund (2017–2018). Carynelisa Haspel is supported by the Israel Science Foundation (grant nos. 1872/17 and 2187/21).
This paper was edited by Stefania Gilardoni and reviewed by two anonymous referees.
Bescond, A., Yon, J., Girasole, T., Jouen, C., Rozé, C., and Coppalle, A.: Numerical investigation of the possibility to determine the primary particle size of fractal aggregates by measuring light depolarization, J. Quant. Spectrosc. Ra., 126, 130–139, 2013.
Bohren, C. F. and Kho, G.: Forward-scattering corrected extinction by nonspherical particles, Appl. Optics, 24, 1023–1029, 1985.
Bond, T. C. and Bergstrom, R. W.: Light absorption by carbonaceous particles: An investigative review, Aerosol Sci. Tech., 40, 27–67, 2006.
Bond, T. C., Habib, G., and Bergstrom, R. W.: Limitations in the enhancement of visible light absorption due to mixing state, J. Geophys. Res., 111, D20211, https://doi.org/10.1029/2006JD007315, 2006.
Burton, S. P., Vaughan, M. A., Ferrare, R. A., and Hostetler, C. A.: Separating mixtures of aerosol types in airborne High Spectral Resolution Lidar data, Atmos. Meas. Tech., 7, 419–436, https://doi.org/10.5194/amt-7-419-2014, 2014.
Burton, S. P., Hair, J. W., Kahnert, M., Ferrare, R. A., Hostetler, C. A., Cook, A. L., Harper, D. B., Berkoff, T. A., Seaman, S. T., Collins, J. E., Fenn, M. A., and Rogers, R. R.: Observations of the spectral dependence of linear particle depolarization ratio of aerosols using NASA Langley airborne High Spectral Resolution Lidar, Atmos. Chem. Phys., 15, 13453–13473, https://doi.org/10.5194/acp-15-13453-2015, 2015.
DeCarlo, P. F., Slowik, J. G., Worsnop, D. R., Davidovits, P., and Jimenez, J. L.: Particle morphology and density characterization by combined mobility and aerodynamic diameter measurements. Part 1: Theory, Aerosol Sci. Tech., 38:1185–1205, 2004.
Droplet Measurement Technologies, Inc.: SPIN Operator Manual, DOC-0328 Revision B-3, Software Version 4.0.0, Droplet Measurement Technologies, Inc., Boulder, CO, USA, http://www.dropletmeasurement.com (last access: 28 August 2023), 2013.
Filippov, A. V., Zurita, M., and Rosner, D. E.: Fractal-like aggregates: Relation between morphology and physical properties, J. Colloid Interf. Sci., 229, 261–273, 2000.
Fuller, K. A., Malm, W. C., and Kreidenweis, S. M.: Effects of mixing on extinction by carbonaceous particles, J. Geophys. Res., 104, 15941–15954, 1999.
Garimella, S., Kristensen, T. B., Ignatius, K., Welti, A., Voigtländer, J., Kulkarni, G. R., Sagan, F., Kok, G. L., Dorsey, J., Nichman, L., Rothenberg, D. A., Rösch, M., Kirchgäßner, A. C. R., Ladkin, R., Wex, H., Wilson, T. W., Ladino, L. A., Abbatt, J. P. D., Stetzer, O., Lohmann, U., Stratmann, F., and Cziczo, D. J.: The SPectrometer for Ice Nuclei (SPIN): an instrument to investigate ice nucleation, Atmos. Meas. Tech., 9, 2781–2795, https://doi.org/10.5194/amt-9-2781-2016, 2016.
Gustafson, Bo Å. S. and Kolokolova, L.: A systematic study of light scattering by aggregate particles using the microwave analog technique: Angular and wavelength dependence of intensity and polarization, J. Geophys. Res., 104, 31711–31720, 1999.
Janzen, J.: The refractive index of colloidal carbon, J. Colloid Interf. Sci., 69, 436–447, 1979.
Kahnert, M. and Kanngießer, F.: Modelling optical properties of atmospheric black carbon aerosols, J. Quant. Spectrosc. Ra., 244, 106849, 2020.
Le, K. C., Lefumeux, C., and Pino, T.: Watching soot inception via online Raman spectroscopy, Combust. Flame, 236, 111817, https://doi.org/10.1016/j.combustflame.2021.111817, 2022.
Liu, L. and Mishchenko, M. I.: Effects of aggregation on scattering and radiative properties of soot aerosols, J. Geophys. Res., 110, D11211, https://doi.org/10.1029/2004JD005649, 2005.
Liu, L. and Mishchenko, M. I.: Scattering and radiative properties of complex soot and soot-containing aggregate particles, J. Quant. Spectrosc. Ra., 106, 262–273, 2007.
Liu, L. and Mishchenko, M. I.: Scattering and radiative properties of morphologically complex carbonaceous aerosols: A systematic modeling study, Remote Sens.-Basel, 10, 1634, https://doi.org/10.3390/rs10101634, 2018.
Liu, L., Mishchenko, M. I., and Arnott, W. P.: A study of radiative properties of fractal soot aggregates using the superposition T-matrix method, J. Quant. Spectrosc. Ra., 109, 2656–2663, 2008.
Lu, N. and Sorensen, C. M.: Depolarized light scattering from fractal soot aggregates, Phys. Rev. E, 50, 3109–3115, https://doi.org/10.1103/PhysRevE.50.3109, 1994.
Ma, X., Zangmeister, C. D., Gigault, J., Mulholland, G. W., and Zachariah, M. R.: Soot aggregate restructuring during water processing, J. Aerosol Sci., 66, 209–219, https://doi.org/10.1016/j.jaerosci.2013.08.001, 2013.
Mackowski, D. W.: Electrostatics analysis of radiative absorption by sphere clusters in the Rayleigh limit: Application to soot particles, Appl. Optics, 34, 3535–3545, 1995.
Mackowski, D. W.: A simplified model to predict the effects of aggregation on the absorption properties of soot particles, J. Quant. Spectrosc. Ra., 100, 237–249, 2006.
Mackowski, D. W.: MSTM (code manual), Version 3.0, Department of Mechanical Engineering Auburn University, Auburn, AL 36849, USA, https://www.eng.auburn.edu/~dmckwski/scatcodes/mstm-manual-2013-v3.0.pdf (last access: 23 December 2020), 2013.
Mackowski, D. W. and Mishchenko, M. I.: Calculation of the T matrix and the scattering matrix for ensembles of spheres, J. Opt. Soc. Am. A, 13, 2266–2278, 1996.
Mishchenko, M. I., Liu, L., Mackowski, D. W., Cairns, B., and Videen, G.: Multiple scattering by random particulate media: Exact 3D results, Opt. Express, 6, 2822–2836, 2007.
Moteki, N., Kondo, Y., and Nakamura, S.: Method to measure refractive indices of small nonspherical particles: Application to black carbon particles, J. Aerosol Sci., 41, 513–521, 2010.
Paulien, L., Ceolato, R., Soucasse, L, Enguehard, F., and Soufiani, A.: Lidar-relevant radiative properties of soot fractal aggregate ensembles, J. Quant. Spectrosc. Ra., 241, 106706, https://doi.org/10.1016/j.jqsrt.2019.106706, 2019.
Romshoo, B., Müller, T., Pfeifer, S., Saturno, J., Nowak, A., Ciupek, K., Quincey, P., and Wiedensohler, A.: Optical properties of coated black carbon aggregates: numerical simulations, radiative forcing estimates, and size-resolved parameterization scheme, Atmos. Chem. Phys., 21, 12989–13010, https://doi.org/10.5194/acp-21-12989-2021, 2021.
Sassen, K.: Lidar Backscatter Depolarization Technique for Cloud and Aerosol Research, in: Light Scattering by Nonspherical Particles, Theory, Measurements, and Applications, edited by: Mishchenko, M. I., Hovenier, J. W., and Travis, L. D., Academic Press, New York, ISBN 978-0124986602, 2000.
Schwarz, J. P., Perring, A. E., Markovic, M. Z., Gao, R. S., Ohata, S., Langridge, J., Law, D., McLaughlin, R., and Fahey, D. W.: Technique and theoretical approach for quantifying the hygroscopicity of black-carbon-containing aerosol using a single particle soot photometer, J. Aerosol Sci., 81, 110–126, https://doi.org/10.1016/j.jaerosci.2014.11.009, 2015.
Sedlacek, A. J., Lewis, E. R., Onasch, T. B., Lambe, A. T., and Davidovits, P.: Investigation of refractory black carbon containing particle morphologies using the Single-Particle Soot Photometer (SP2), Aerosol Sci. Tech., 49, 872–885, https://doi.org/10.1080/02786826.2015.1074978, 2015.
Sela, M. and Haspel, C.: Direct comparison between single-scattering properties of ordered and disordered aggregates of nano-sized scattering centers, Appl. Optics, 60, 10893–10900, 2021.
Sorensen, C. M.: Light scattering by fractal aggregates: A review, Aerosol Sci. Tech., 35, 648–687, https://doi.org/10.1080/02786820117868, 2001.
Stachurski, Z. H.: Definition and properties of ideal amorphous solids, Phys. Rev. Lett. 90, 155502, https://doi.org/10.1103/PhysRevLett.90.155502, 2003.
Stachurski, Z. H.: On structure and properties of amorphous materials, Materials, 4, 1564–1598, 2011.
Stachurski, Z. H.: A theoretical model of an ideal amorphous solid, Physcs. Proc., 48, 55–58, 2013.
Zhang, C., Zhang, Y., Wolf, M. J., Nichman, L., Shen, C., Onasch, T. B., Chen, L., and Cziczo, D. J.: The effects of morphology, mobility size, and secondary organic aerosol (SOA) material coating on the ice nucleation activity of black carbon in the cirrus regime, Atmos. Chem. Phys., 20, 13957–13984, https://doi.org/10.5194/acp-20-13957-2020, 2020.
- Abstract
- Introduction
- Methods
- Results
- Discussion
- Summary and conclusions
- Appendix A: Summary of the terms, abbreviations, and symbols used in the text
- Appendix B: Tables of calculated efficiencies and cross sections
- Appendix C: Relative differences between fixed and random orientation
- Code and data availability
- Author contributions
- Competing interests
- Disclaimer
- Acknowledgements
- Financial support
- Review statement
- References