the Creative Commons Attribution 4.0 License.
the Creative Commons Attribution 4.0 License.
 | 03 Jan 2023
In situ microphysics observations of intense pyroconvection from a large wildfire
David E. Kingsmill
Jeffrey R. French
Neil P. Lareau
This study characterizes the size and shape distributions of 10 µm to 6 mm diameter particles observed during six penetrations of wildfire-induced pyroconvection near Boise, Idaho, USA, by a research aircraft over the period 29–30 August 2016. In situ measurements by the aircraft include winds, atmospheric state, and bulk water content and particle concentration, size, and shape. These observations are complemented by data from airborne and ground-based radars. One of the penetrations is through a subsaturated smoke–ash plume with negligible cloud liquid water content that is characterized by an updraft of almost 36 m s−1. The size distribution of number concentration is very similar to that documented previously for a smoke plume from a prescribed fire, and particle shapes exhibit qualitative and quantitative attributes comparable to ash particles created in a burn chamber. Particles sampled during this penetration are most likely pyrometeors composed of ash. Pyrocumulus clouds are probed in the other penetrations where values of relative humidity and cloud liquid water content are larger, but updrafts are weaker. Compared to the smoke-plume penetration, size distributions are mostly characterized by larger concentration, and particle shapes exhibit a higher degree of circular symmetry. Particle composition in these pyrocumulus penetrations is most likely a combination of hydrometeors (ice particles) and pyrometeors (ash).
- Article
(15372 KB) - Full-text XML
- BibTeX
- EndNote


Wildfires are one of the most impactful natural hazards across the globe. Along with the injuries, loss of life, and destruction of property that wildfires directly influence, emissions from wildfires can create significant negative health effects, even at distances far from and times long after the source emissions (e.g., Johnston et al., 2012; Thelen et al., 2013; Xu et al., 2020; O'Dell et al., 2020). Not surprisingly, the corresponding economic impacts of wildfires are substantial (e.g., Ashe et al., 2009; Jones et al., 2016; Jones and Berrens, 2017; Wang et al., 2021). These impacts have grown over the last several decades due to a trend of increasing wildfire frequency, size, and severity (e.g., Westerling et al., 2006; Dennison et al., 2014; Westerling, 2016; Parks and Abatzoglou, 2020). This trend is often attributed to enhanced fuel aridity brought about by anthropogenic global warming (e.g., Flannigan et al., 2009; Yue et al., 2013; Barbero et al., 2015; Abatzoglou and Williams, 2016).
Pyroconvection occurs when fire-released heat, moisture, and/or aerosols induce or augment convection in the atmosphere (McCarthy et al., 2018). One manifestation of pyroconvection is the plume of smoke and ash that a wildfire generates. If the heat produced by a wildfire is sufficiently intense and atmospheric conditions are appropriate, smoke–ash plumes can rise to a level where they become saturated with water vapor and form pyrocumulus clouds (American Meteorological Society, 2022a). Pyrocumulus clouds (pyroCus) are sometimes capable of developing into pyrocumulonimbus clouds (pyroCbs) that can generate precipitation, downdrafts, and lightning (American Meteorological Society, 2022b). Some particularly intense pyroCbs have been associated with fire-induced tornadoes (Fromm et al., 2006; Lareau et al., 2018, 2022).
Wildfire-induced pyroconvection contains particles with a diversity of composition, phase (in the case of hydrometeors), size, and shape. The most comprehensive documentation of these particles has been for smoke particulates less than ∼ 20 µm diameter within plumes at various distances downwind of wildfires (e.g., Radke et al., 1978, 1991; Reid et al., 2005; Kleinman et al., 2020). A large fraction (80 %–90 %) of the smoke aerosol particles are in the accumulation mode (0.1–2 µm diameter), while a smaller fraction (∼ 10 %) are in the coarse mode (2–20 µm diameter). These smoke particulates are primarily composed of carbonaceous material (50 %–60 % organic carbon and 5 %–10 % black carbon) and exhibit a variety of forms such as chain aggregates, solid irregulars, and spherical shapes. Most observations of these aerosol particles have been achieved with in situ sampling by research aircraft. However, four relatively recent studies employed satellite remote sensing to document smoke particulates (Jethva and Torres, 2011; Konovalov et al., 2017; Junghenn-Noyes et al., 2020a, b). These relatively small-sized smoke particulates are responsible for most of the negative health effects from wildfire emissions.
The size of cloud droplets in pyroCu and pyroCb has also received some attention. Andreae et al. (2004) report in situ observations of droplets in pyroconvective clouds characterized by a modal diameter of 12 µm with a distribution tail extending to ∼ 40 µm. In addition, Rosenfeld et al. (2007) use satellite observations of a violent pyroCb to retrieve cloud-droplet effective radii, whose median values did not exceed 11 μm. Results from both studies are consistent with the notion that smoke from biomass burning can lead to smaller cloud-droplet sizes, which has been hypothesized to inhibit precipitation (Rosenfeld and Lensky, 1998; Rosenfeld, 1999).
Another category of high-impact particles contained within pyroconvection is firebrands, which are actively burning pieces of combustion debris that can be transported up to several tens of kilometers downstream of the main fire front to initiate spot fires and facilitate rapid fire spread (Williams, 1982; Koo et al., 2010). Firebrands are significantly larger than smoke particulates in plumes and cloud droplets in pyroCu and pyroCb. Laboratory studies have quantified firebrand size and shape characteristics in association with the burning of individual Douglas fir and Korean pine trees (Manzello et al., 2007, 2009, respectively). Cylindrically shaped combustion debris of 30–50 mm length and 3–5 mm diameter are produced. Field studies have also been employed to document firebrand characteristics in the aftermath of experimental fires (El Houssami et al., 2016; Thomas et al., 2017; Filkov et al., 2017) and wildfires (Manzello and Foote, 2014) that consumed coniferous forest. Results from these efforts indicate the presence of cylindrically shaped combustion debris more than 30 mm in length, but they occur in relatively low numbers. Most firebrands have a less elongated, irregular shape with maximum dimensions of 5–30 mm. Remote sensing has not yet been employed to characterize the size and shape of firebrands. However, results from these in situ studies have informed the use of ground-based radar to detect and track firebrands (McCarthy et al., 2019b).
The characteristics of pyroconvection particles smaller than firebrands (i.e., diameter 5 mm) but larger than smoke particulates and cloud droplets (i.e., diameter 20 µm) have been explored to a much lesser extent. In their review of biomass burning emissions, Reid et al. (2005) mention the existence of giant ash particles with diameters greater than 20 µm, extending up to and exceeding 1 mm. Likewise, Andreae et al. (2004) allude to giant ash particles with diameters that range from a submillimeter scale to a few centimeters. However, neither study provides direct evidence to support these assertions. To our knowledge, the only explicit, in situ documentation of ash particles with diameters larger than ∼ 20 µm is contained in Fig. 28.6 of Radke et al. (1991). This figure shows the number-concentration size distribution of ash particles in association with a smoke–ash plume from a prescribed fire. The largest ash particles have diameters on the order of several millimeters. Radke et al. (1991) state that the presence of such large ash particles was typical for all the large fires they studied. Unfortunately, they provide only minimal additional information to contextualize these giant-ash observations. For example, the location of the observations relative to the fire is not indicated, and the dynamic character of the plume (i.e., depth, vertical motions) is not described. Additionally, the shapes of these particles are not documented.
With the dearth of in situ observations, other approaches have been employed to document giant ash particles. Baum et al. (2015) use a laboratory burn chamber to create samples of ash from the combustion of messmate eucalypt biomass. Shapes of the resulting ash particles are primarily planar or cylindrical and are characterized by areas ranging from 0.2 mm2 (the minimum detectable area for their imaging instrument) to ∼ 20 mm2. This range of particle area corresponds to an equivalent circle diameter range of ∼ 0.5 to ∼ 5 mm, which is consistent with the diameters of giant ash particles observed in smoke–ash plumes by Radke et al. (1991). The shapes of giant ash particles from biomass burning have also been examined remotely using polarimetric radar observations of smoke–ash plumes (Banta et al., 1992; Melnikov et al., 2008; Lang et al., 2014; Lareau and Clements, 2016; McCarthy et al., 2018, 2019b; Zrnic et al., 2020). These observations, particularly differential reflectivity (ZDR: difference between logarithmic reflectivity from horizontal and vertical polarizations) and correlation coefficient (ρhv: correlation between horizontally and vertically polarized radar return signals), suggest that giant ash particles fall with a horizontal orientation (ZDR2 dB) and have irregular shapes (ρhv0.4)
In situ measurements of pyroCu and pyroCb particles larger than a few tens of microns (i.e., cloud droplets) have only recently been reported in the peer-reviewed literature. Peterson et al. (2022) document the size distributions of particles from a few microns to a few millimeters in the middle to upper portions of active pyroCbs and adjacent detached anvils. This sampling occurs at temperatures of −40, −31, and −18 ∘C. Particles larger than ∼ 15 µm are assumed to be composed of ice based on the qualitative character of a few optical array probe images. However, no quantitative analysis of particle shape is provided. Analysis of pyroCu and pyroCb particles has more commonly been accomplished remotely with the use of polarimetric radar observations to discriminate between giant ash particles and rimed ice particles, such as graupel and hail (Lang et al., 2014; Lareau and Clements, 2016; McCarthy et al., 2018, 2019b). Specifically, graupel and hail are thought to be characterized by relatively small ZDR and relatively large ρhv compared to giant ash particles.
McCarthy et al. (2019a) introduced the term “pyrometeor” to describe all debris of a pyrogenic origin with diameters greater than or equal to a millimeter. The stated intent of this definition was to differentiate smoke particulates from larger pyroconvection particles capable of scattering transmitted radiation from radars operating at S-band (∼ 10 cm wavelength), C-band (∼ 5 cm wavelength), and X-band (∼ 3 cm wavelength). Unfortunately, this definition excludes ash particles between ∼ 20 µm diameter (i.e., the upper boundary of smoke particulates) and 1 mm. Therefore, this study defines the term pyrometeor as all debris of a pyrogenic origin with diameters greater than or equal to 20 µm. Pyrometeors include both ash particles and firebrands and are distinct from hydrometeors (liquid or solid water particles).
As the preceding discussion has highlighted, in situ observations of pyroconvection particles are lacking, especially for particles larger than smoke particulates and cloud droplets. McCarthy et al. (2019a) emphasized this point in their review of the use of weather radar for wildfire research and described one reason why it is so problematic. Specifically, they noted that the scarcity of these observations has impeded the application of radar to study pyroconvection caused by wildfires. This dearth of in situ measurements also negatively impacts the validation and improvement of various models employed to simulate wildfires and related pyroconvection (e.g., Coen et al., 2013; Peace et al., 2015; Kochanski et al., 2016; Toivanen et al., 2019). The present study takes steps toward addressing these issues through analysis of in situ microphysics data collected by a research aircraft during penetrations of pyroconvection over the period 29–30 August 2016 (Clements et al., 2018; Rodriguez et al., 2020). This pyroconvection was caused by the Pioneer Fire, a large wildfire in the intermountain US region northeast of Boise, Idaho. Size distributions of number concentration and area concentration are characterized for particles spanning the diameter range of 10 µm to 6 mm in smoke–ash plumes and pyroCu. Also, particle shapes are examined with both qualitative and quantitative approaches. Finally, all of these in situ observations are placed in context by employing airborne Doppler radar observations to characterize the depth and vertical motions of the sampled pyroconvection.
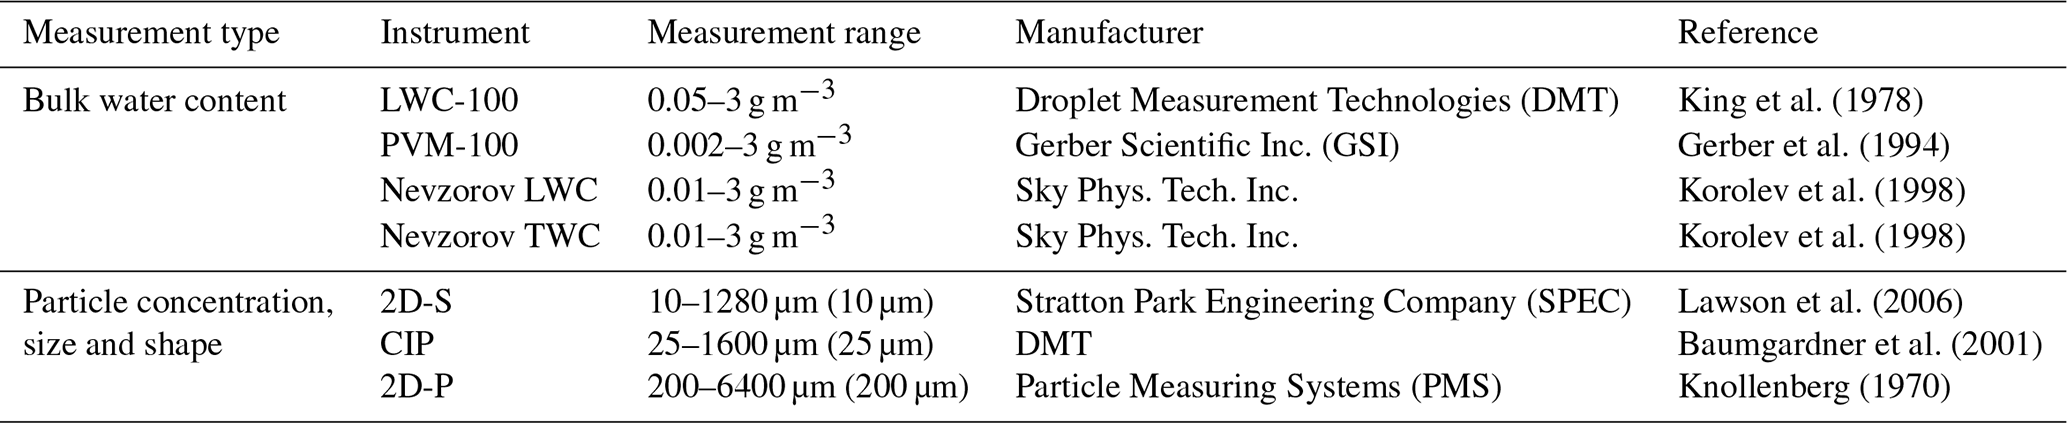
The principal observing platform used in this study is the University of Wyoming King Air (UWKA) research aircraft. A diverse collection of in situ and remote sensing instrumentation was installed on the UWKA (Wang et al., 2012). Standard flight-level parameters are derived with in situ sensors that measure navigation (e.g., 3D position, ground speed, airspeed, and orientation), winds (e.g., horizontal wind speed and direction and vertical air velocity), and atmospheric state (e.g., pressure, temperature, and water vapor content). This study uses versions of these parameters temporally degraded to 1 Hz from raw data sampled at 100–1000 Hz. In situ microphysics data used in this study can be divided into two different measurement types: bulk water content and particle concentration, size, and shape (Table 1). Four different sensors are employed to characterize bulk water content. Liquid water content (LWC) is quantified with the LWC-100 probe and the PVM-100 probe. The Nevzorov probe is composed of two sensors: one to measure LWC and the other to measure total condensed water content (TWC). In combination, the sensors on the Nevzorov probe quantify both LWC and ice water content (IWC). IWC can be subject to much greater uncertainty than LWC or TWC since it is the difference between those measures. The measurement range, manufacturer, and relevant reference for these probes are listed in Table 1. Particle concentration, size, and shape are characterized with three different optical array probes (OAPs). The Two-Dimensional Stereo (2D-S) probe provides particle shadowgraph images in two orthogonal planes: one oriented vertically (2D-SV) and the other horizontally (2D-SH). Images from the 2D-S cover the size range of 10–1280 µm, with 10 µm resolution. The Cloud Imaging Probe (CIP) produces images at 25 µm resolution from 25–1600 µm, while the Two-Dimensional Precipitation (2D-P) probe produces images at 200 µm resolution from 200–6400 µm. Both the CIP and 2D-P are oriented vertically.
Table 1Characteristics of UWKA in situ microphysics data used in this study. The measurement range for each instrument is listed. Size resolutions for the 2D-S, CIP and 2D-P instruments are indicated in parentheses.
Data from all three OAPs are quality-controlled and quantitatively processed with the University of Illinois/Oklahoma OAP Processing Software (McFarquhar et al., 2018). First, artificial images are identified and rejected. These include zero area images, split images, “streakers” (i.e., unrealistically long and narrow images), and images resulting from ice particle shattering (Field et al., 2006). The approaches to identify artificial images are based on experiences with sampling hydrometeors. It is unclear whether sampling pyrometeors leads to the same types of artifacts. Accepted images are then analyzed to determine their diameter (D; diameter of minimum enclosing circle), aspect ratio (ASPr; semi-minor axis length divided by semi-major axis length), area (A), area ratio (Ar; area divided by area of minimum enclosing circle), and fine-detail ratio (Fr; Holroyd, 1987), defined as the perimeter times diameter divided by area. Distributions of number concentration ( and area concentration ( as a function of diameter are derived for the size bins of each probe at 1 s resolution. Calculation of sample volume employs the reconstruction technique described by Heymsfield and Parrish (1978). The size distributions of are used to derive total concentration (NT) and area-weighted mean diameter (:
where i is the size bin index, and ΔD is the bin width, which is set to the resolution of each probe.
The UWKA remote sensing instrument used in this study is the Wyoming Cloud Radar (WCR), a W-band (∼ 3.2 mm wavelength) pulsed Doppler radar. Data from two WCR antennae are employed: one pointed downward near nadir with a beamwidth of 0.5∘ and the other pointed upward near zenith with a beamwidth of 0.7∘. Along-track sampling of the data is at intervals of ∼ 5 m, and range resolution is ∼ 15 m. Reflectivity from the WCR is sensitive to ∼ −35 dBZe at 1 km range and accurate to ∼ 3 dBZe. The Doppler radial velocity is unambiguous over the range of ±15.8 m s−1 (i.e., the Nyquist velocity). WCR data are edited to remove noise and ground clutter and de-aliased to correct folded radial velocities.
This study also employs data from a ground-based remote sensing instrument, namely the National Weather Service (NWS) Doppler radar located in Boise, Idaho (KCBX). Scans of reflectivity, ZDR, and ρhv at various elevation angles are used to provide context for the pyroconvection associated with the Pioneer Fire. Also, a volumetric “echo top” product is utilized to characterize the maximum height of reflectivity more than 18 dBZe for each column of range gates (Lakshmanan et al., 2013). Use of the 18 dBZe threshold may underestimate the true tops of smoke–ash plumes since radar detections for ash are characteristically lower than for hydrometeors.
The Pioneer Fire started on 18 July 2016 in the Boise National Forest (BNF) northeast of Boise and consumed a total of 76 081 ha (188 000 acres, 761 km2) over the next 2 months. Terrain in the BNF varies from ∼ 1 to ∼ 2.5 km m.s.l. (Fig. 1a), and vegetation is primarily composed of coniferous trees including ponderosa pine, Douglas fir, and Engelmann spruce. This study focuses on the 29–30 August period when the Pioneer Fire rapidly advanced toward the northeast. Fire perimeters produced by the National Infrared Operations (NIROPS) Unit of the U.S. Forest Service and obtained from the National Interagency Fire Center (National Interagency Fire Center, 2016) show that the fire consumed 11 736 ha (29 000 acres, 117 km2) in ∼ 24 h.
The UWKA sampled pyroconvection associated with the Pioneer Fire from ∼ 22:30 UTC 29 August to ∼ 01:30 UTC 30 August (Fig. 1b), which represents late afternoon into early evening relative to local time. Maximum KCBX echo top heights during this period were ∼ 12 km m.s.l. and displaced northeast of the fire due to advection by the prevailing southwest winds (not shown). A photograph taken from the UWKA at 22:38 UTC looking toward the northeast provides a visual perspective of the pyroconvection (Fig. 1c). Smoke- and ash-filled plumes emanating from the fire are evident at low levels. At higher levels, where some of the plumes become water saturated, pyroCu are apparent.
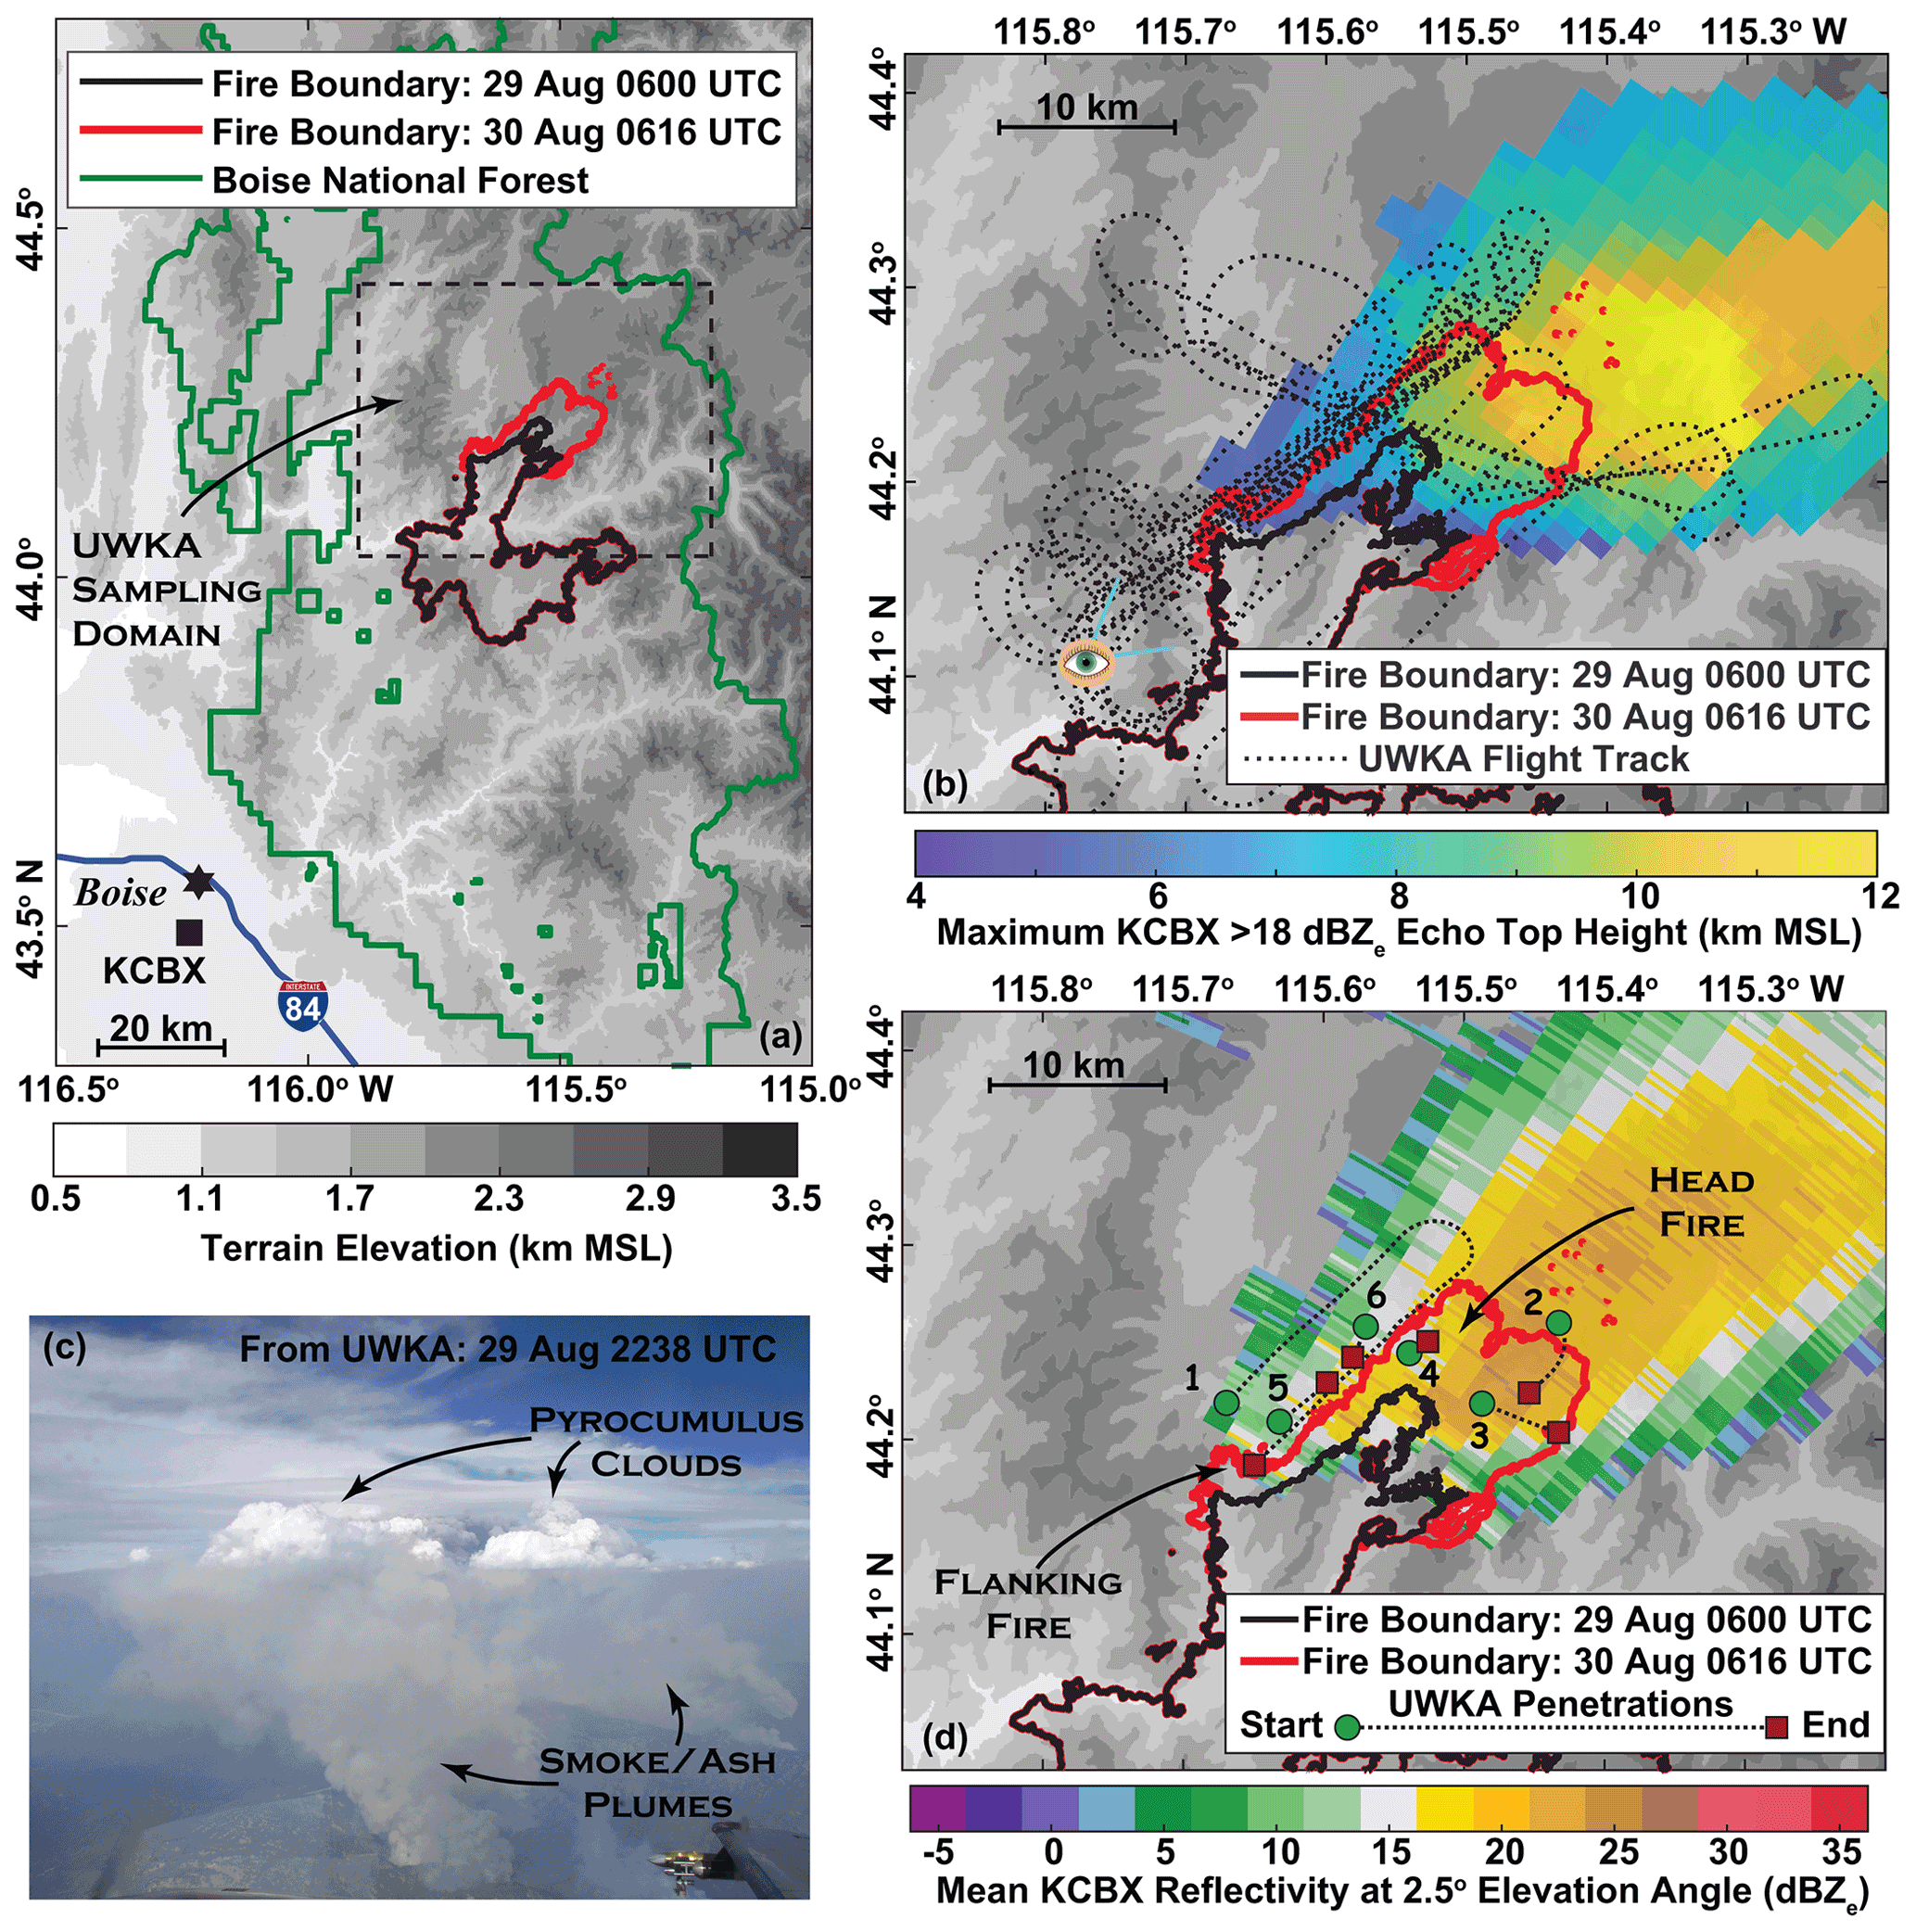
Figure 1(a) Topographic map of the study area northeast of Boise, Idaho. Gray scale at bottom indicates terrain height. The boundary for the Boise National Forest is shown by green lines. Perimeters of the Pioneer Fire at 06:00 UTC 29 August 2016 and 06:16 UTC 30 August 2016 are indicated with black and red lines, respectively. Location of the KCBX radar is shown by the filled black square. Dashed black rectangle indicates the UWKA sampling domain shown in (b) and (d). (b) Maximum KCBX > 18 dBZe echo top heights for the period 22:30 UTC 29 August 2016 to 01:30 UTC 30 August 2016. Color scale at bottom indicates plotted values. Terrain heights and fire perimeters from (a) are also shown. Dashed black lines indicate the UWKA flight track for this period. (c) Photograph taken from the UWKA at 22:38 UTC 29 August 2016. Location of the photograph is indicated by the eyeball in (b) and is directed towards the northeast. (d) Mean KCBX reflectivity at 2.5∘ elevation for the period 22:40 UTC 29 August 2016 to 00:30 UTC 30 August 2016. Color scale at bottom indicates plotted values. Terrain heights and fire perimeters from (a) are also shown. Locations of the head fire and flanking fire are indicated. Dashed black lines show the locations of pyroconvection penetrations by the UWKA during this period, with green circles and red squares indicating the start and end of each penetration, respectively. Numbers next to each starting point indicate the numeric order of the penetrations (Table 2).
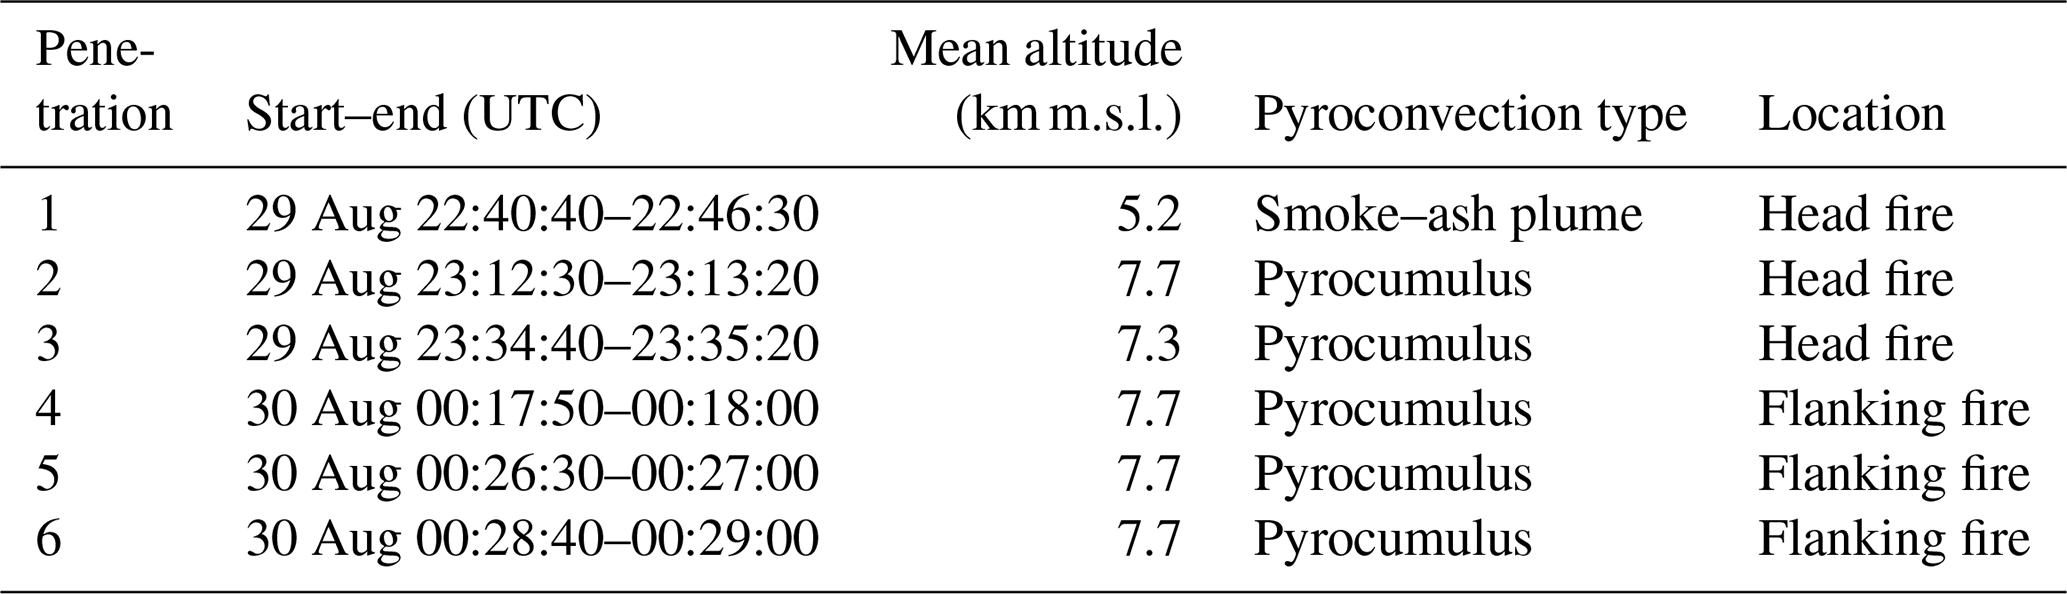
Six penetrations of pyroconvection were executed by the UWKA (Table 2). The first penetration went through a smoke–ash plume at 5.2 km m.s.l., while the remaining five penetrations went through pyroCus at 7.3–7.7 km m.s.l. Locations of the penetrations relative to the fire provide additional context (Fig. 1d). The first three penetrations sample pyroconvection generated by the rapidly northeastward advancing area of the fire called the “head fire”. Pyroconvection produced by a “flanking fire” that developed to the west-southwest of the head fire after penetration 1 is the focus of penetrations 4–6. Mean KCBX reflectivity at 2.5∘ elevation during the period of these penetrations shows maximum values of 20–25 dBZe located southwest of the peak echo top heights. This displacement is reasonable given that the KCBX 2.5∘ beam height is ∼ 6 km m.s.l. at the position of the maximum values (a little lower to the southwest and a little higher to the northeast), and the maximum echo top heights are ∼ 12 km m.s.l.
Table 2Time periods and altitudes of the six pyroconvection penetrations examined in this study. Pyroconvection type and location of the penetrations relative to the fire are indicated (see Fig. 1d).
3.1 Penetration 1: smoke–ash plume
Penetration 1 involves a straight track toward the northeast followed by a 180∘ right turn that leads into a straight track toward the southwest (Fig. 1d). The turn of this penetration is at a range of ∼ 105 km from KCBX, where the 1.5∘ elevation scan is at ∼ 4.4 km m.s.l., and the 2.5∘ elevation scan is at ∼ 6.2 km m.s.l. These heights straddle the 5.2 km m.s.l. UWKA flight altitude of the penetration. Reflectivity is significantly larger at 2.5∘ (Fig. 2a) compared to 1.5∘ (Fig. 2d), especially in the area near the turn where values reach 25 dBZe. The polarimetric fields (ZDR and ρhv) are relatively noisy, with large variations over short horizontal distances (Fig. 2b, c, e, f). ZDR in this area is as small as ∼ 0 dB and as large as ∼ 7 dB (Fig. 2b, e), which makes it difficult to conclude anything about particle orientation. ρhv shows somewhat less variation, with most values less than 0.5 (Fig. 2c, f), which is suggestive of irregularly shaped particles.
Data from the WCR provide context for the vertical structure of pyroconvection sampled during this period (Fig. 3). The WCR is disabled until 22:41:08 UTC, and only the down antenna is in operation for the remainder of the plotted interval. Additionally, WCR data are not shown during the turn since pointing angles of the down antenna are far from nadir and vary significantly, making the data difficult to interpret.
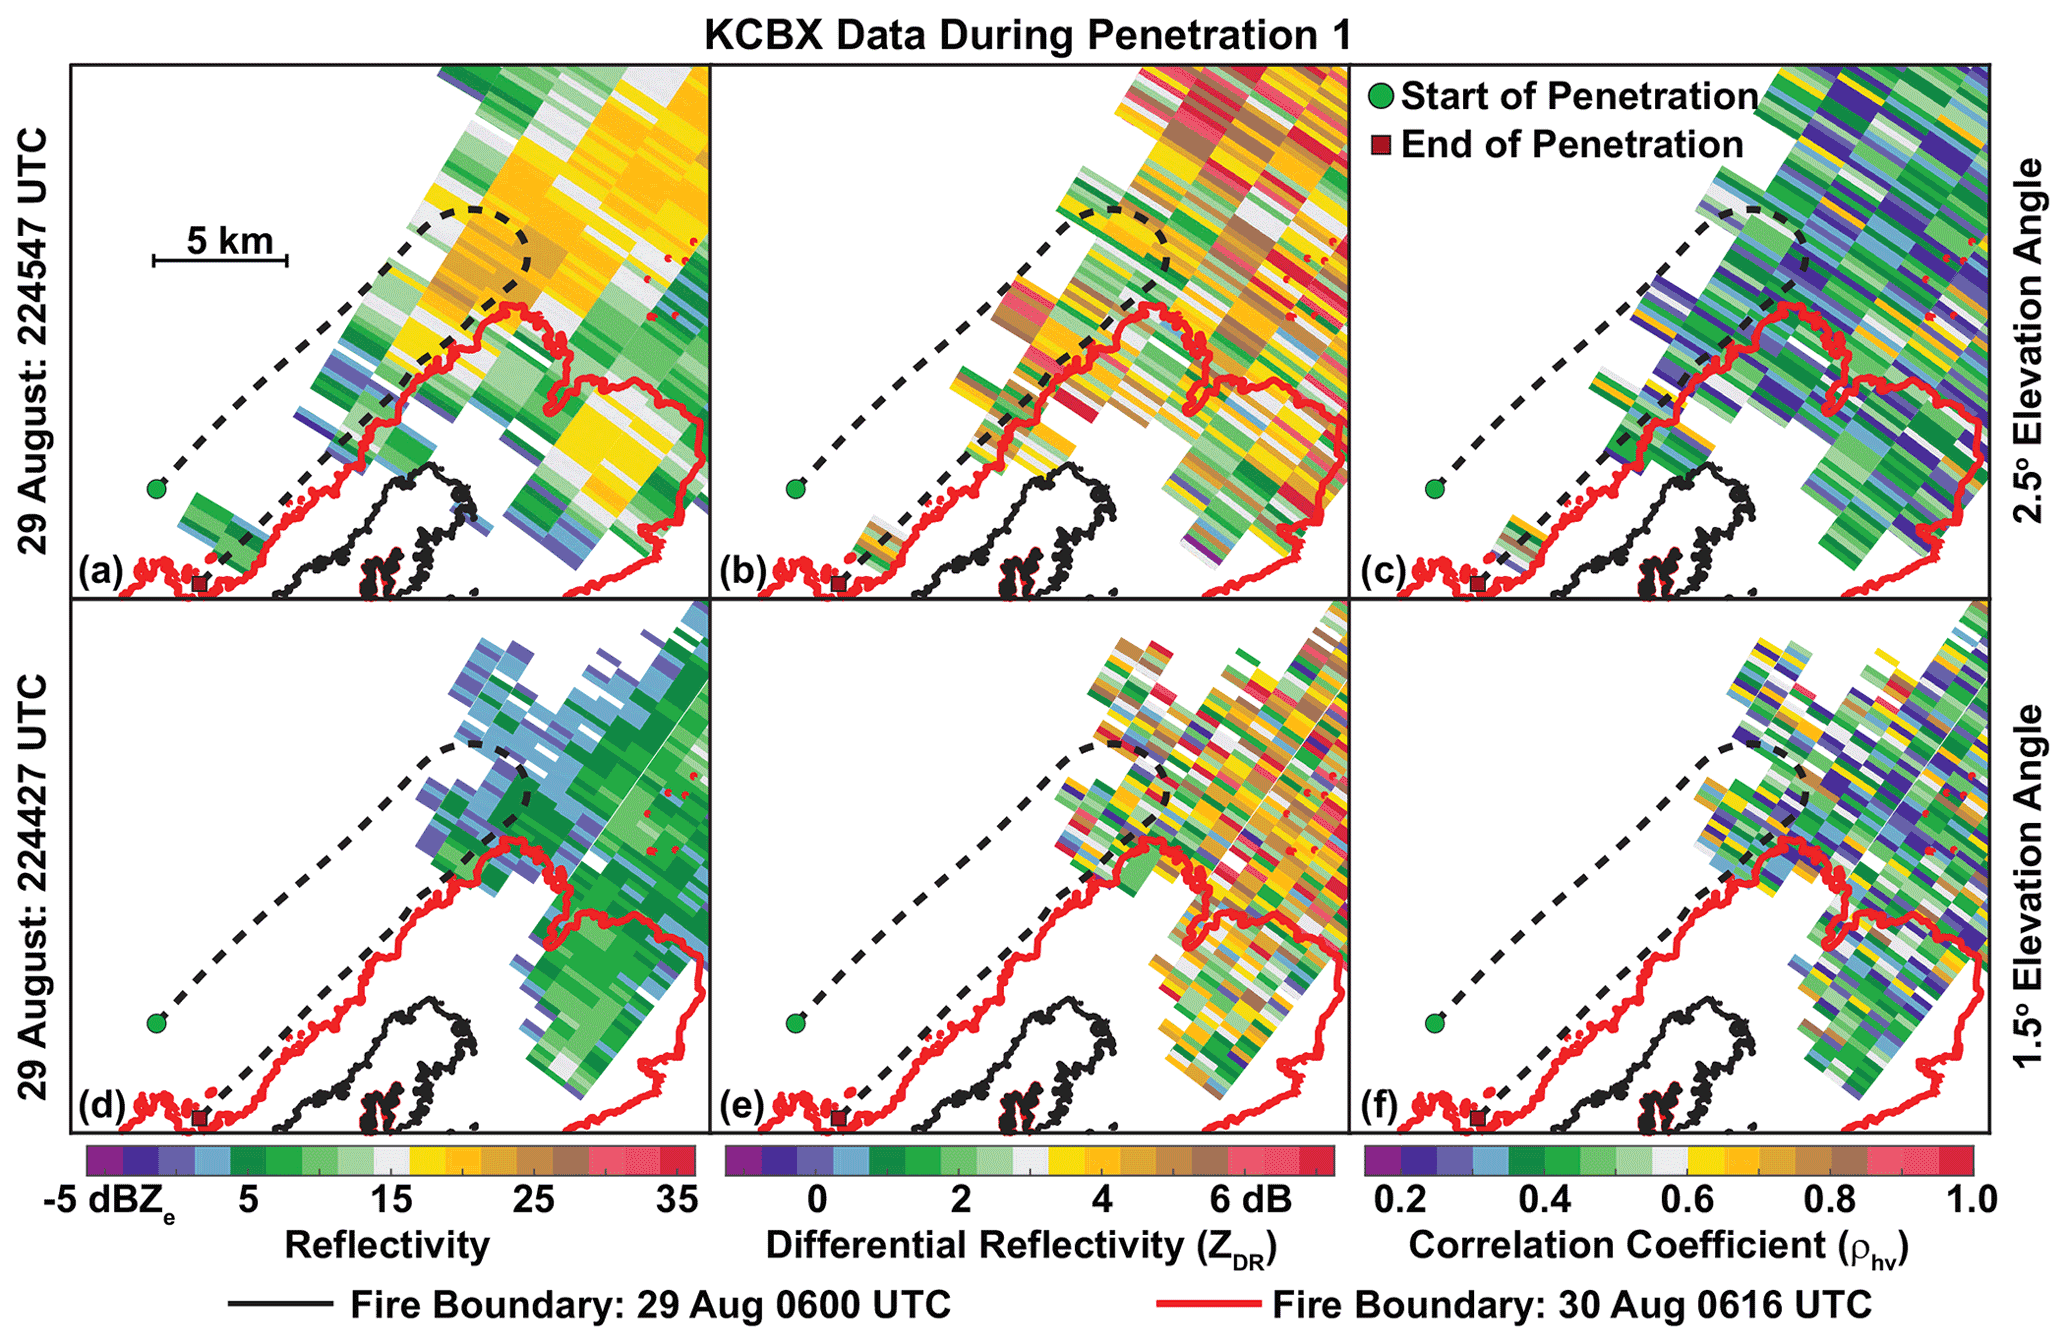
Figure 2KCBX data approximately coincident with the execution of penetration 1. Left column (a, d) shows reflectivity, middle column (b, e) shows differential reflectivity (ZDR), and right column (c, f) shows correlation coefficient (ρhv). Color scales at bottom of each column indicate plotted values. Top row (a–c) is for data at 22:45:47 UTC 29 August 2016 (2.5∘ elevation angle), and bottom row (d–f) is for data at 22:44:27 UTC 29 August 2016 (1.5∘ elevation angle). Perimeters of the Pioneer Fire at 06:00 UTC 29 August 2016 and 06:16 UTC 30 August 2016 are indicated with black and red lines, respectively. Dashed black lines show the location of penetration 1, with green circles and red squares indicating the start and end of the penetration, respectively.
WCR reflectivity is primarily less than −15 dBZe prior to the turn, but maximum values of −5–0 dBZe are evident after the turn (Fig. 3a). The higher magnitude reflectivity cells are up to ∼ 1 km wide and extend 0.5–2.5 km in depth. Some cells are tied to the surface (e.g., 22:44:40 and 22:47:10 UTC), while others appear cut off from the surface and extend above 4 km m.s.l., often up to flight level. It is notable that maximum values of WCR reflectivity are −5–0 dBZe, while maximum values of KCBX reflectivity along penetration 1 after the turn are 15–20 dBZe (Fig. 1d). Some of this discrepancy may be related to mismatched sample volumes, but that does not explain a 20 dBZe offset. A more important factor may be that KCBX operates at a wavelength of ∼ 10.7 cm (S-band), while the WCR operates at a wavelength of ∼ 3.2 mm (W-band). Scattering characteristics of pyroconvection particles are likely different at these two wavelengths. Results from the present study will be used to address this issue in a future investigation.
WCR radial velocity from the down antenna is effectively vertical air velocity (Fig. 3b), with positive (negative) radial velocities toward (away from) the radar at flight level representing updrafts (downdrafts). This assumes that the fall speed of pyroconvection particles is negligible compared to the magnitude of vertical air motions. The magnitude of vertical velocity is significantly larger after the turn, especially for updrafts where values greater than 10 m s−1 are common. Indeed, updrafts exceeding 20 m s−1 are evident near the flight level during the first 1–2 min after the turn. Most of the updraft maxima after the turn are collocated with cells of higher magnitude reflectivity (Fig. 3a). Downdrafts are apparent, but their magnitude is smaller than that for updrafts (Fig. 3b). Also, downdrafts are more limited in vertical extent compared to updrafts.
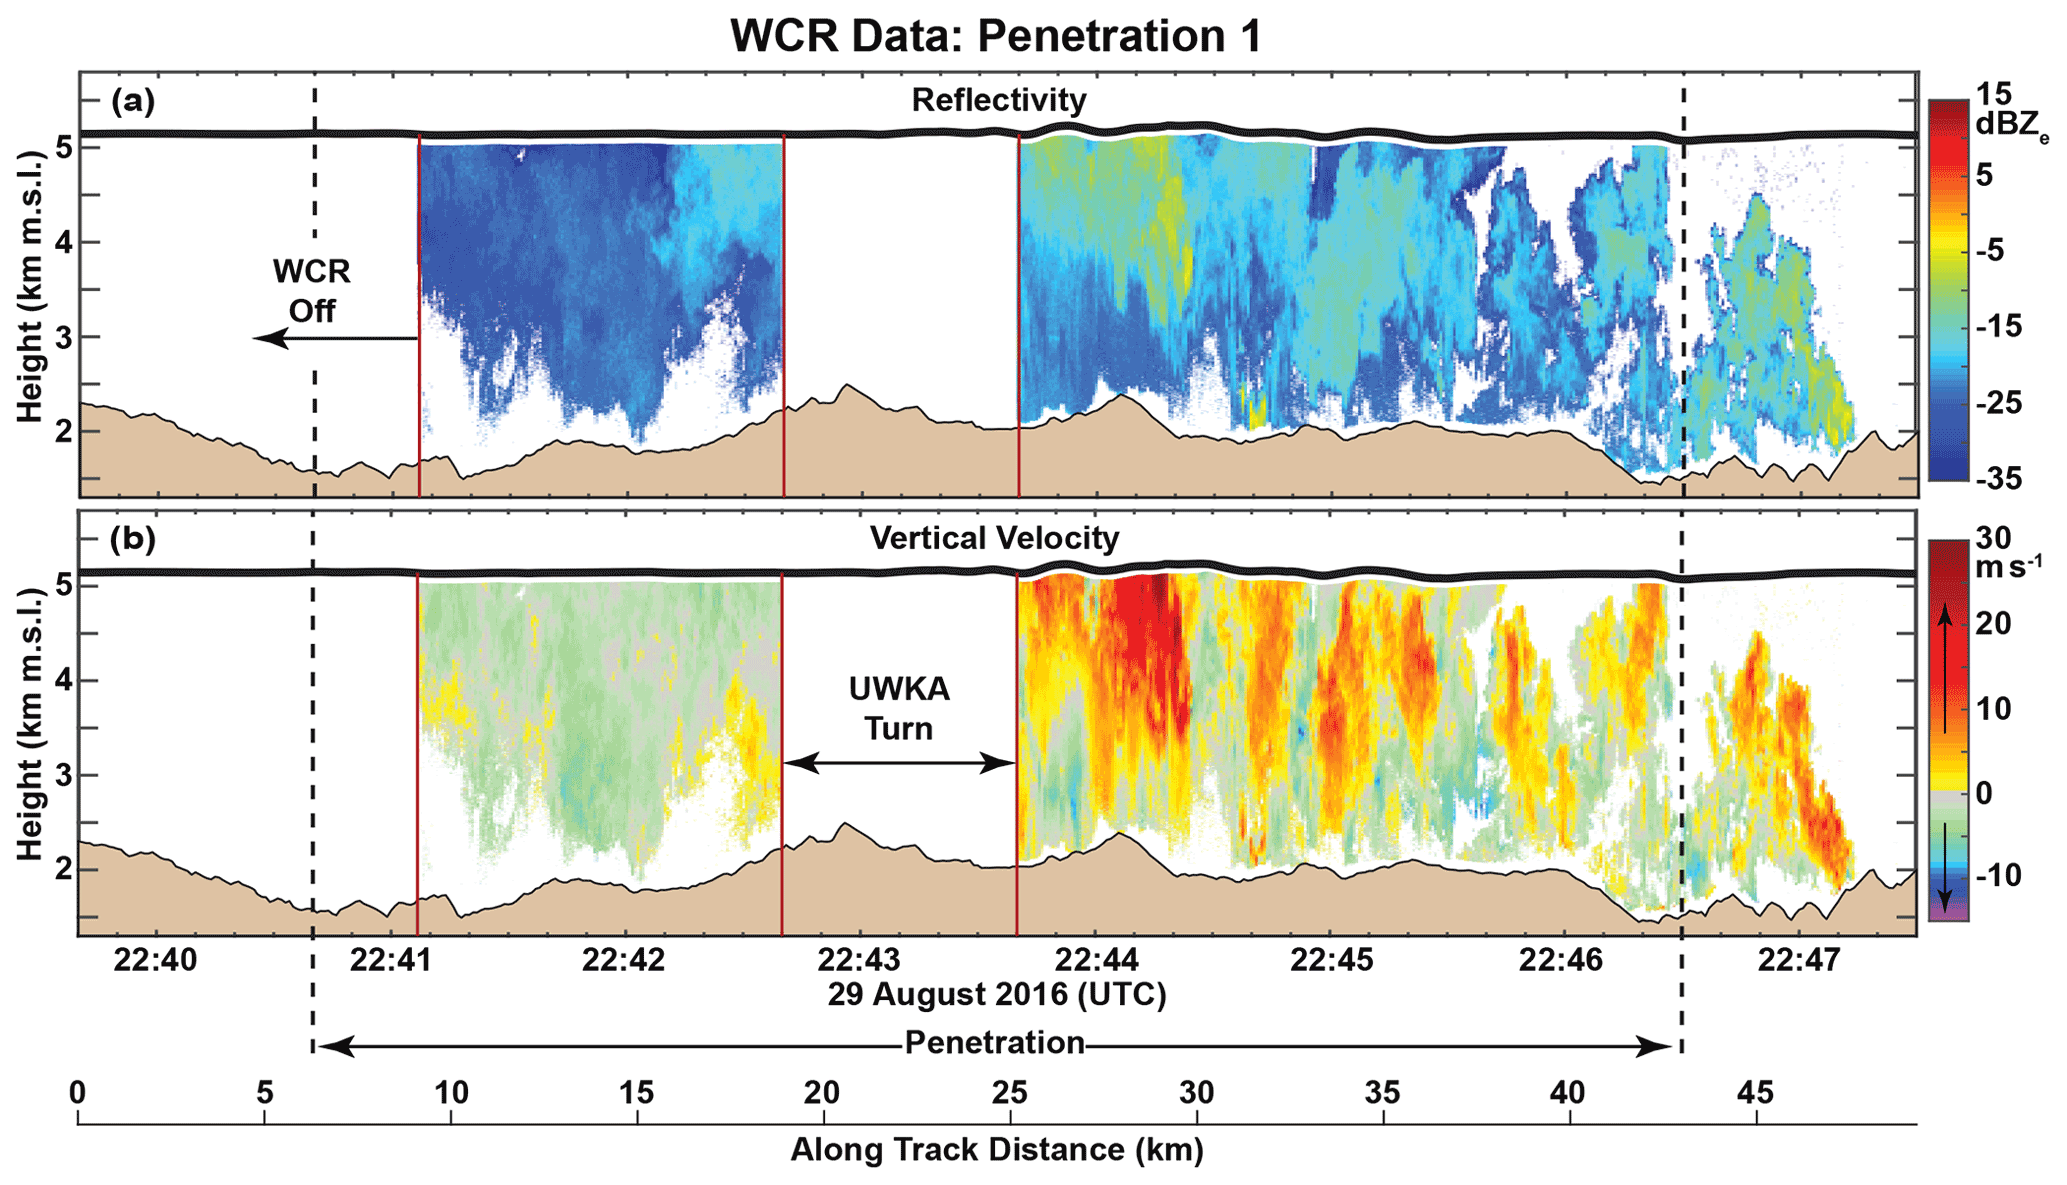
Figure 3UWKA WCR (a) reflectivity and (b) radial velocity (effectively vertical velocity) data for penetration 1 (Fig. 1d, Table 2) and 60 s before and after the penetration (bounded by vertical, dashed black lines). Color scales to the right of each panel indicate plotted values. Aircraft track shown by the bold black lines near the top of each panel. Underlying topography indicated by the filled tan outline at the bottom of each panel. Along-track distance for the penetration shown at bottom. Periods without WCR data bounded by vertical red lines.
Vertical air velocity at flight level (Fig. 4a) is negative during most of the period before the turn, with downdrafts as large as 5 m s−1. Thereafter on the penetration, vertical motions are mostly upward and more erratic, especially 22:43:00–22:45:00 UTC. This period is highlighted by two updraft peaks of more than 16 m s−1 (22:43:40–22:44:00 UTC) and a single updraft peak of almost 36 m s−1 (22:44:00–22:44:20 UTC). These peaks in flight-level vertical air velocity occur at the same times that strong updrafts are evident near flight level in the WCR radial velocity data (Fig. 3b). Air temperature during the penetration varies between ∼ −6 and ∼ −2 ∘C (Fig. 4b). The warmest air is coincident with the updraft peaks just after the turn and suggests that the updrafts are associated with positive buoyancy (Rodriguez et al., 2020). Relative humidity is less than 80 % across the entire penetration and decreases to as little as 20 % at some points. Also, bulk water content (Fig. 4c) is very small, with values that are near or below the sensitivity thresholds for the Nevzorov, LWC-100, and PVM-100 probes (Table 1). The subsaturated relative humidity in combination with negligible water content suggests that cloud droplets are not present. As a result, the pyroconvection sampled during this penetration is best described as a smoke–ash plume rather than pyroCu. Additional support for this assertion is provided by Rodriguez et al. (2020), who used temperature and water vapor profiles from a radiosonde launched at Boise to estimate cloud base at ∼ 6 km m.s.l., which is several hundred meters above the flight altitude of penetration 1.
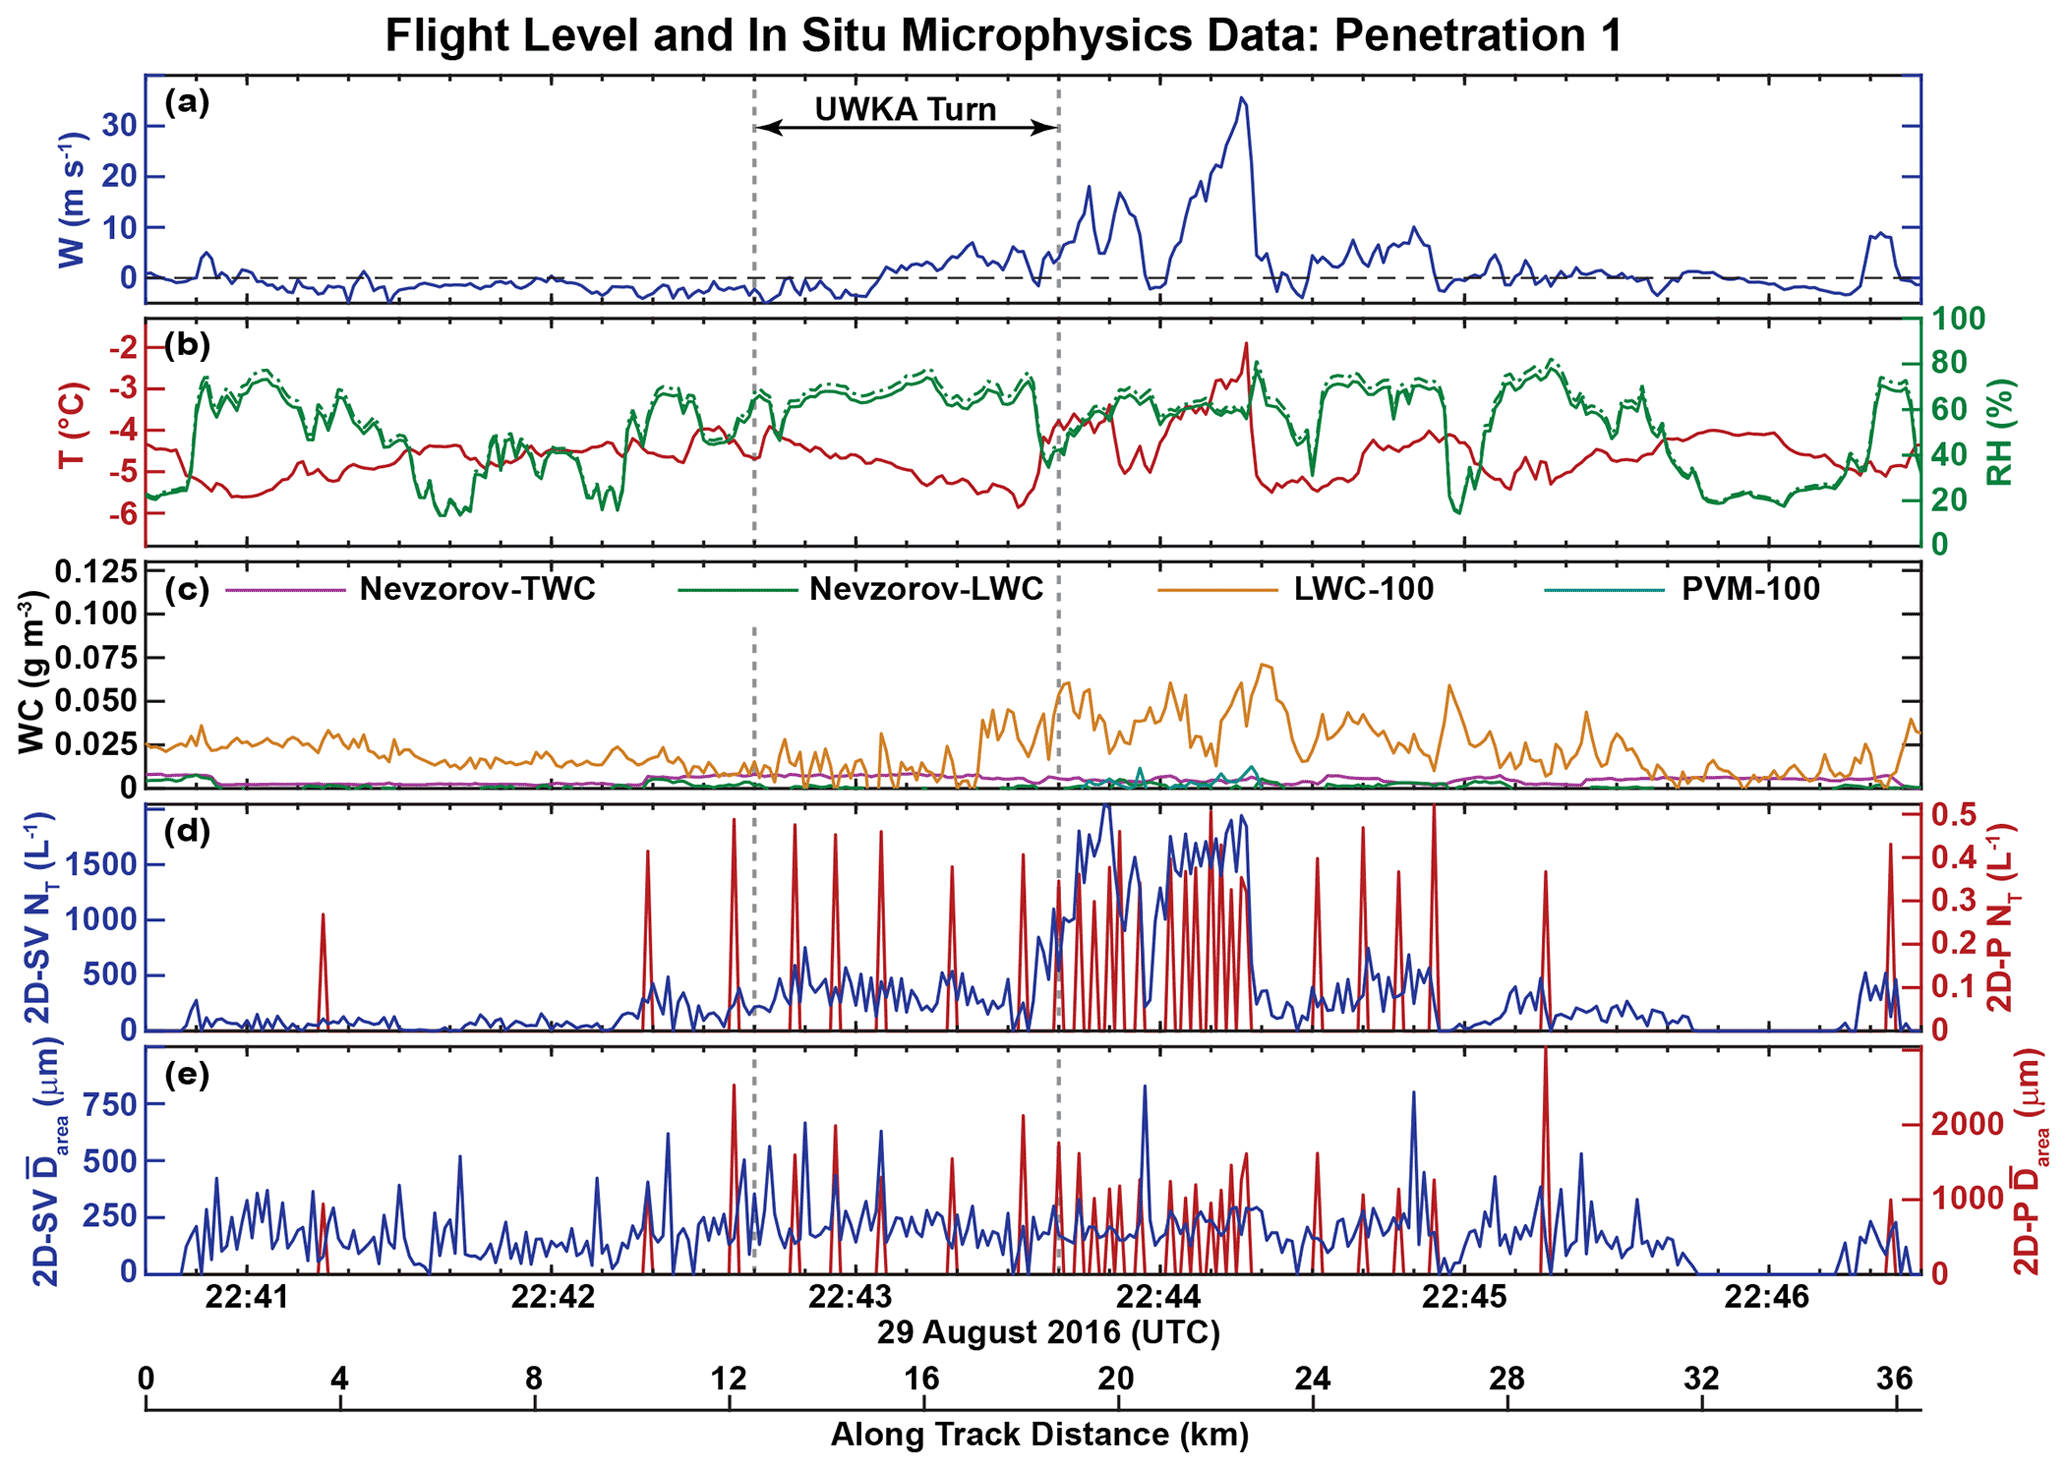
Figure 4UWKA flight-level and in situ microphysics data for penetration 1 (Fig. 1d, Table 2). (a) Vertical air velocity (blue), (b) temperature (red), relative humidity with respect to liquid (solid green) and relative humidity with respect to ice (dashed green), (c) bulk water content (WC) from the Nevzorov TWC probe (magenta), Nevzorov LWC probe (green), LWC-100 probe (gold), and PVM-100 probe (cyan), (d) total concentration (NT) from the 2D-SV probe (blue) and 2D-P probe (red), and (e) area-weighted mean diameter ( from the 2D-SV probe (blue) and 2D-P probe (red). Along-track distance for the penetration shown at bottom.
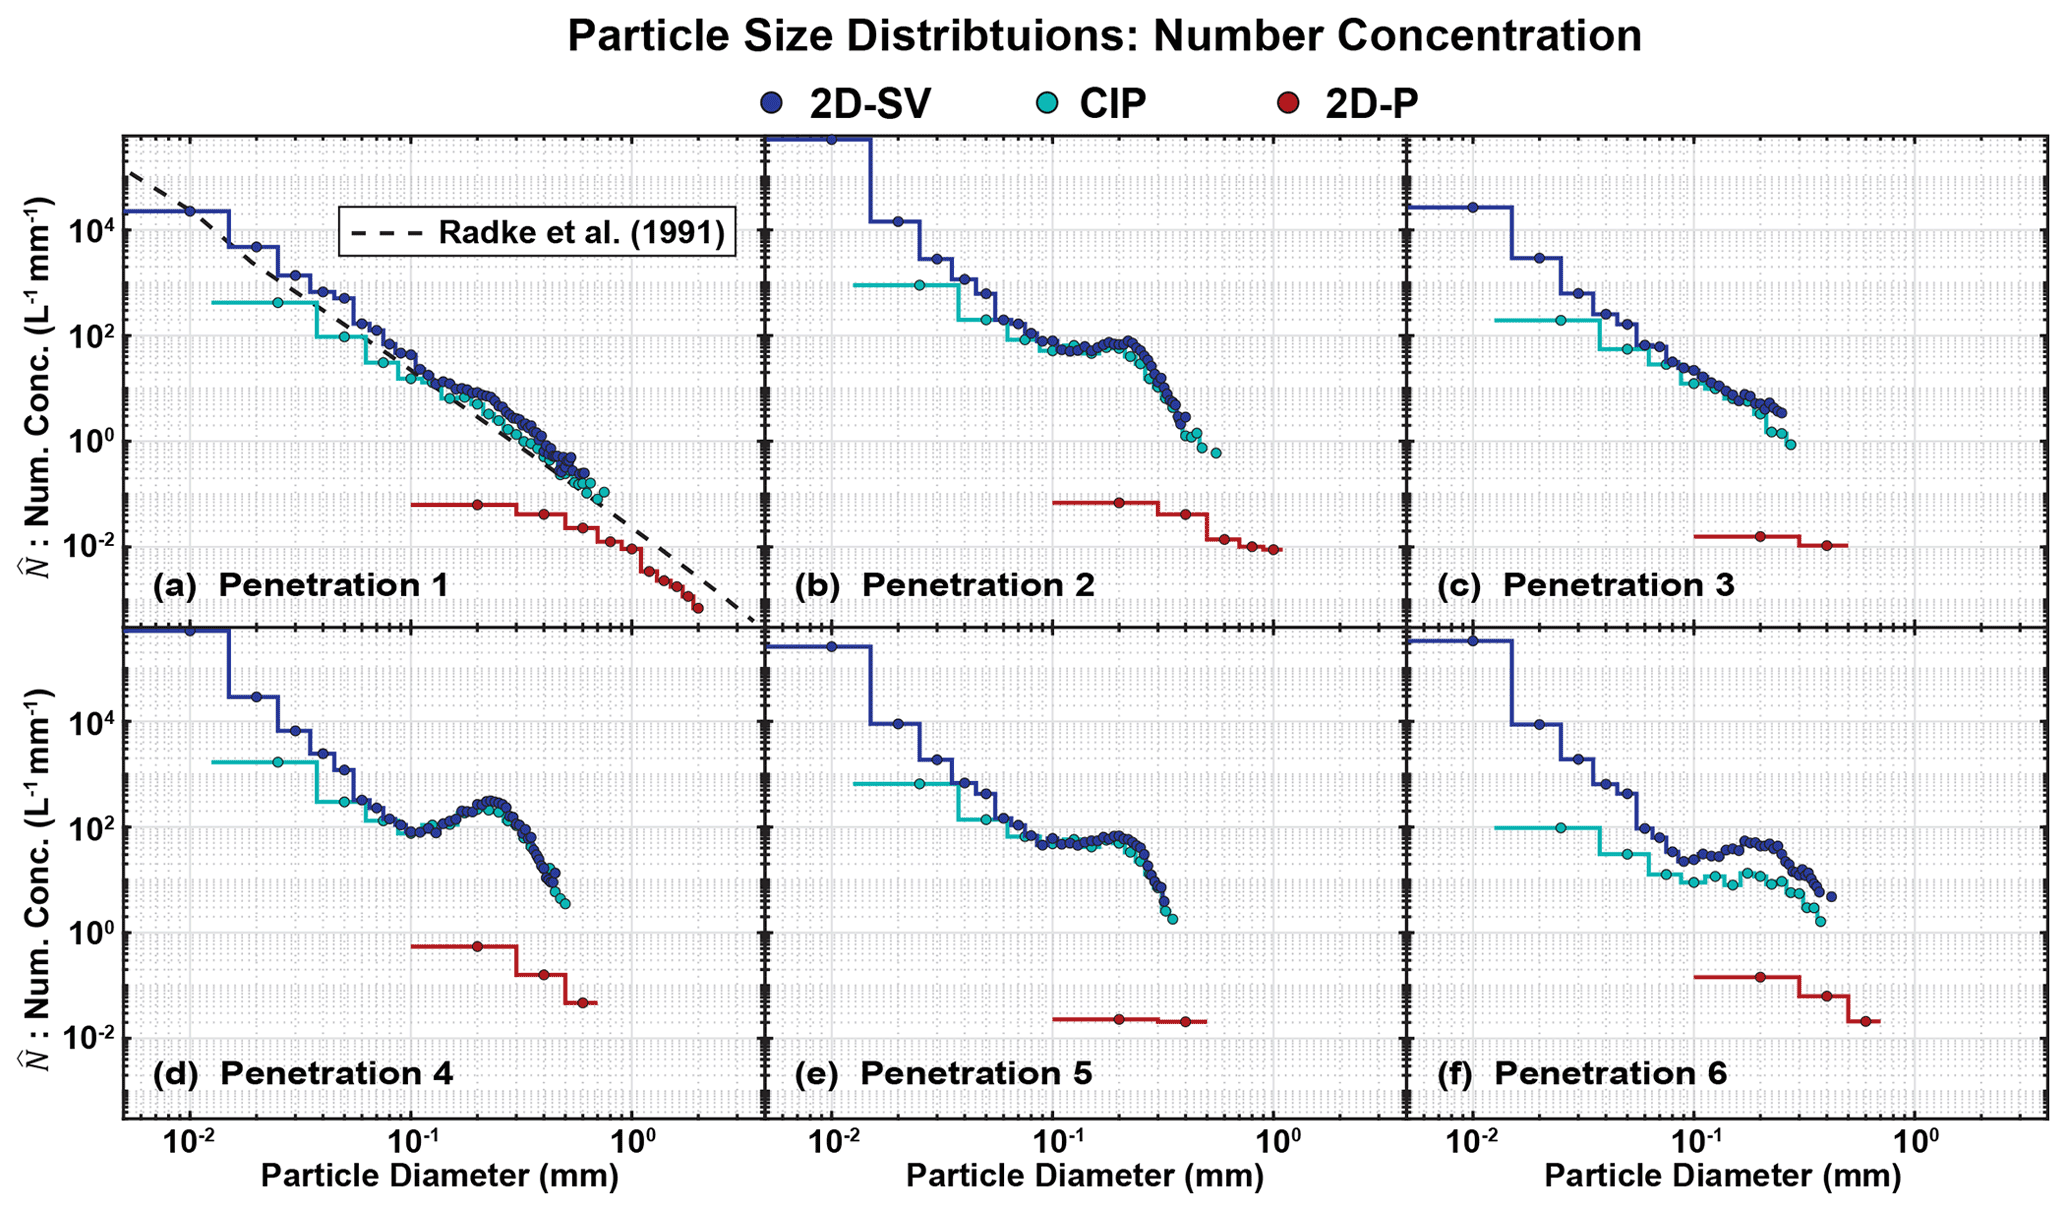
Figure 5Size distributions of particle number concentration ( for (a–f) penetrations 1–6 (Fig. 1d, Table 2). Data from the 2D-SV, CIP, and 2D-P probes indicated by the filled blue, cyan, and red circles, respectively. Number-concentration size distribution of giant ash particles from Radke et al. (1991) also plotted in (a).
Total concentrations (NT) from the 2D-SV probe (i.e., particles larger than 10 µm) are almost all greater than zero during the penetration (Fig. 4d). Maximum values of ∼ 2000 L−1 are evident 22:43:40–22:44:20 UTC and coincident with the strong updrafts referenced previously. Smaller but still elevated 2D-SV NT of ∼ 400 L−1 is apparent in the 80 s prior to and 40 s after this period. NT from the 2D-P probe (i.e., particles larger than 200 µm) is only sporadically greater than zero, sometimes reaching values of 0.4–0.5 L−1. No particles are being detected by the probe at the other times. Area-weighted mean diameters ( from the 2D-SV are mostly ∼ 200 µm during the penetration (Fig. 4e). However, there are occasional spikes of reaching 500–800 µm. from the 2D-P is only nonzero at times where the corresponding NT is nonzero and reaches maximum values of 2000–3000 µm.
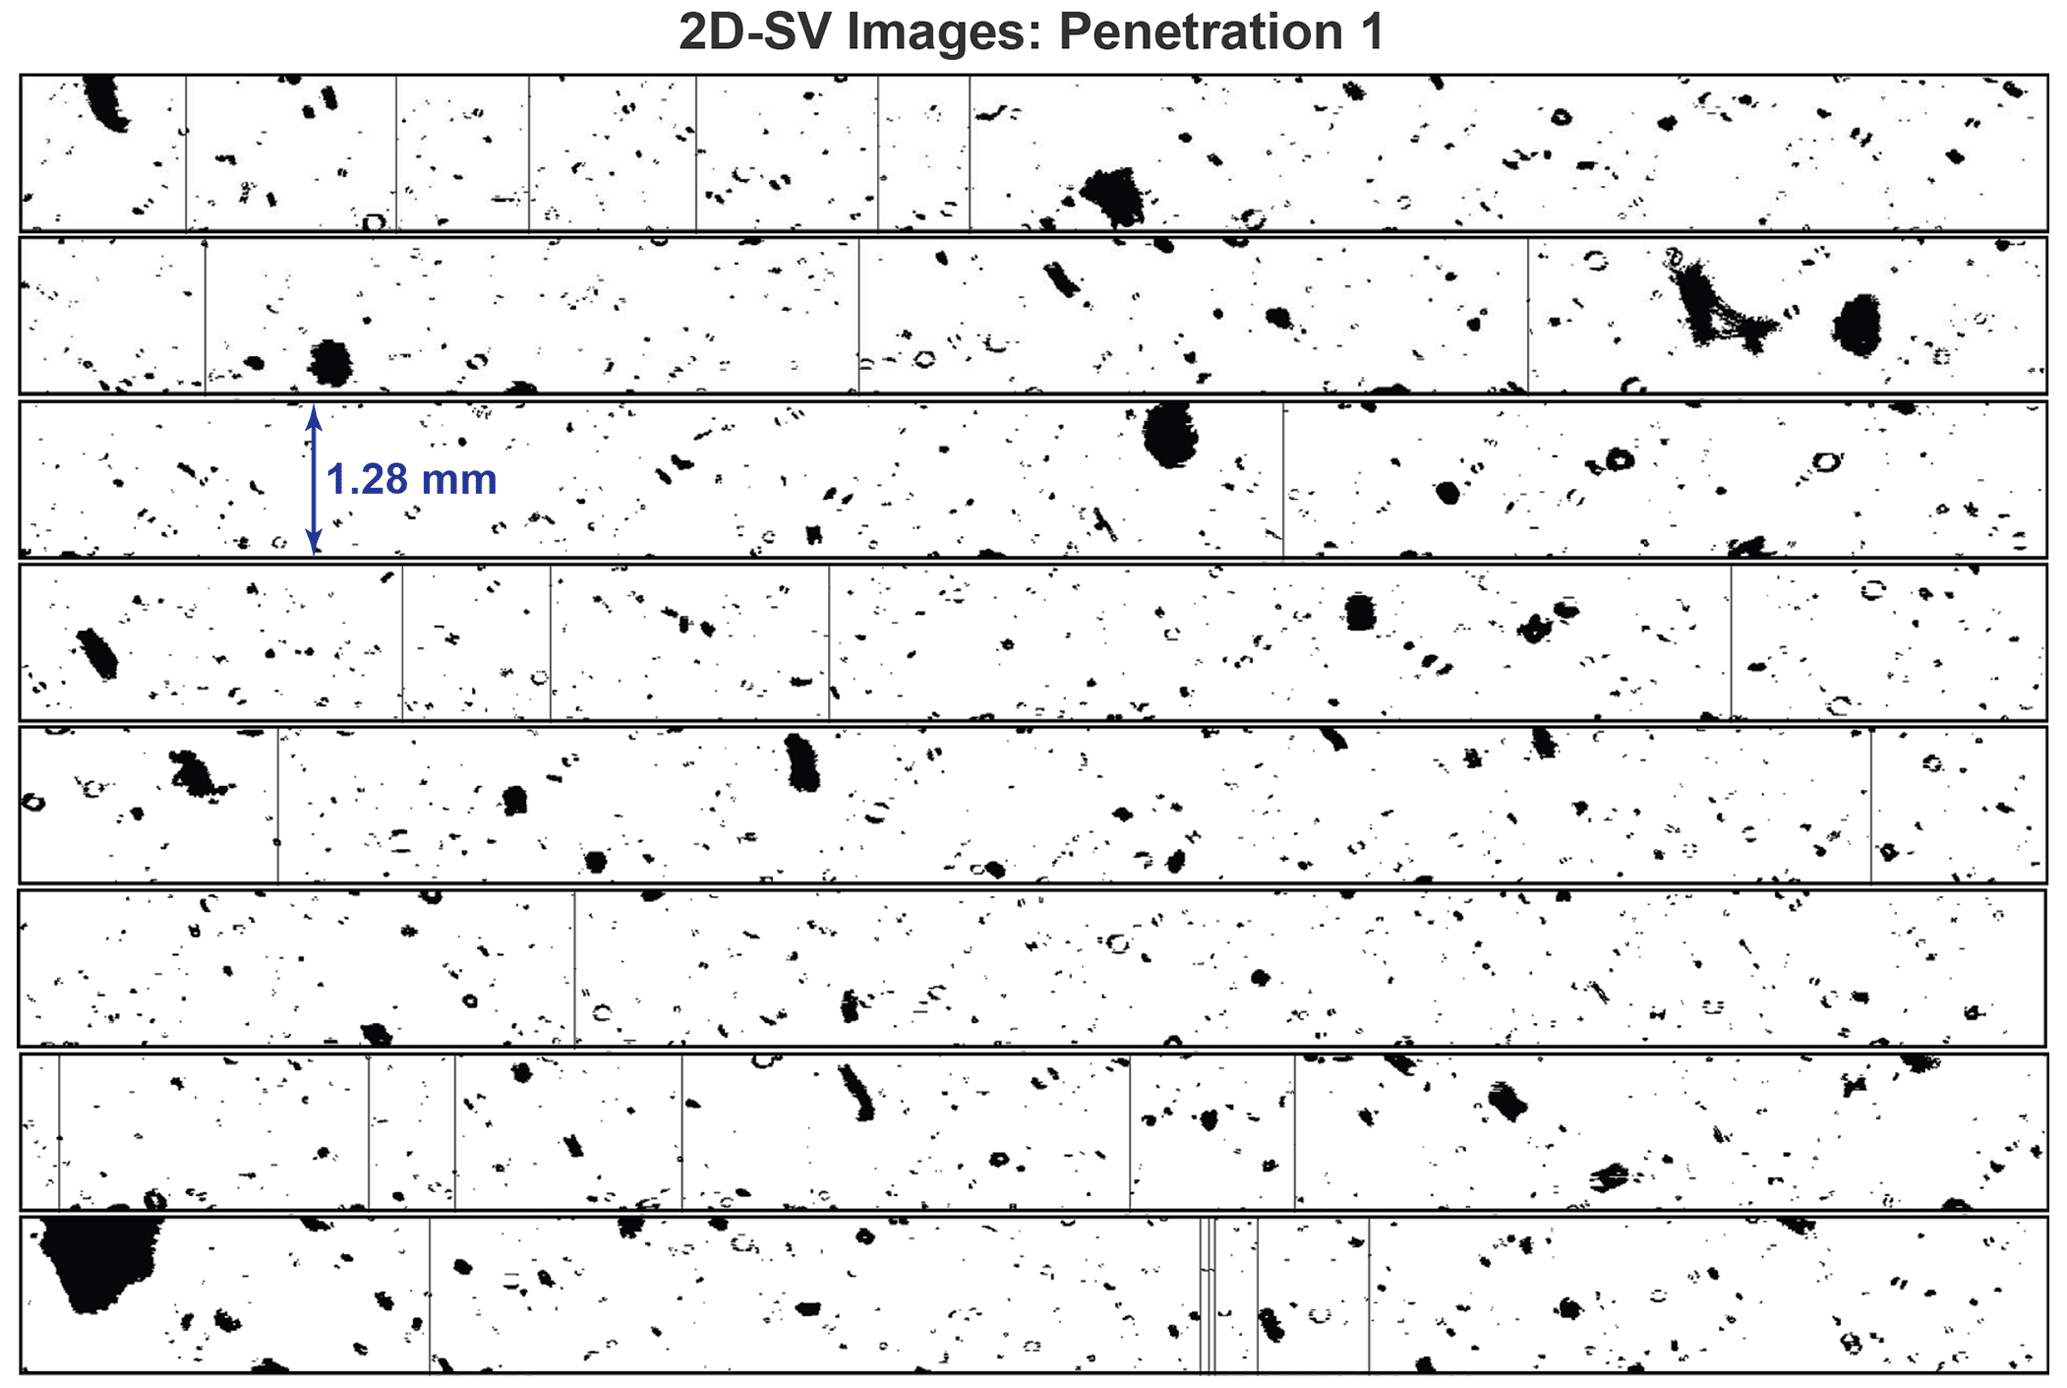
Figure 7Sampling of 2D-SV particle images for penetration 1 (Fig. 1d, Table 2). Vertical distance of each horizontal strip represents 1.28 mm.
The mean particle size distribution over penetration 1 has number concentrations ( that span 8 orders of magnitude for diameters 10 to 2000 µm (Fig. 5a). Mean from the 2D-SV is 2.2×10⁴ L−1 mm−1 at 10 µm diameter, while mean from the 2D-P is L−1 mm−1 at 2000 µm diameter. There is very good overlap between the 2D-SV and CIP measurements of mean . In contrast, there is essentially no overlap of mean from the 2D-P with mean from the 2D-SV and CIP. The significantly lower concentrations from the 2D-P likely result from the slower electronics of this older probe. To constrain sampling uncertainty, mean from a given probe is only plotted for size bins that contain at least 10 particles. Without this threshold, maximum detected particle diameters from the 2D-SV, CIP, and 2D-P extend to 1700, 2300, and 5800 µm, respectively. The number-concentration size distribution of giant ash particles from Fig. 28.6 of Radke et al. (1991) is also plotted in Fig. 5a. These data were collected in a smoke–ash plume generated by a prescribed fire where the primary fuel was chaparral. There is remarkable agreement between the size distribution from the present study and that from Radke et al. (1991).
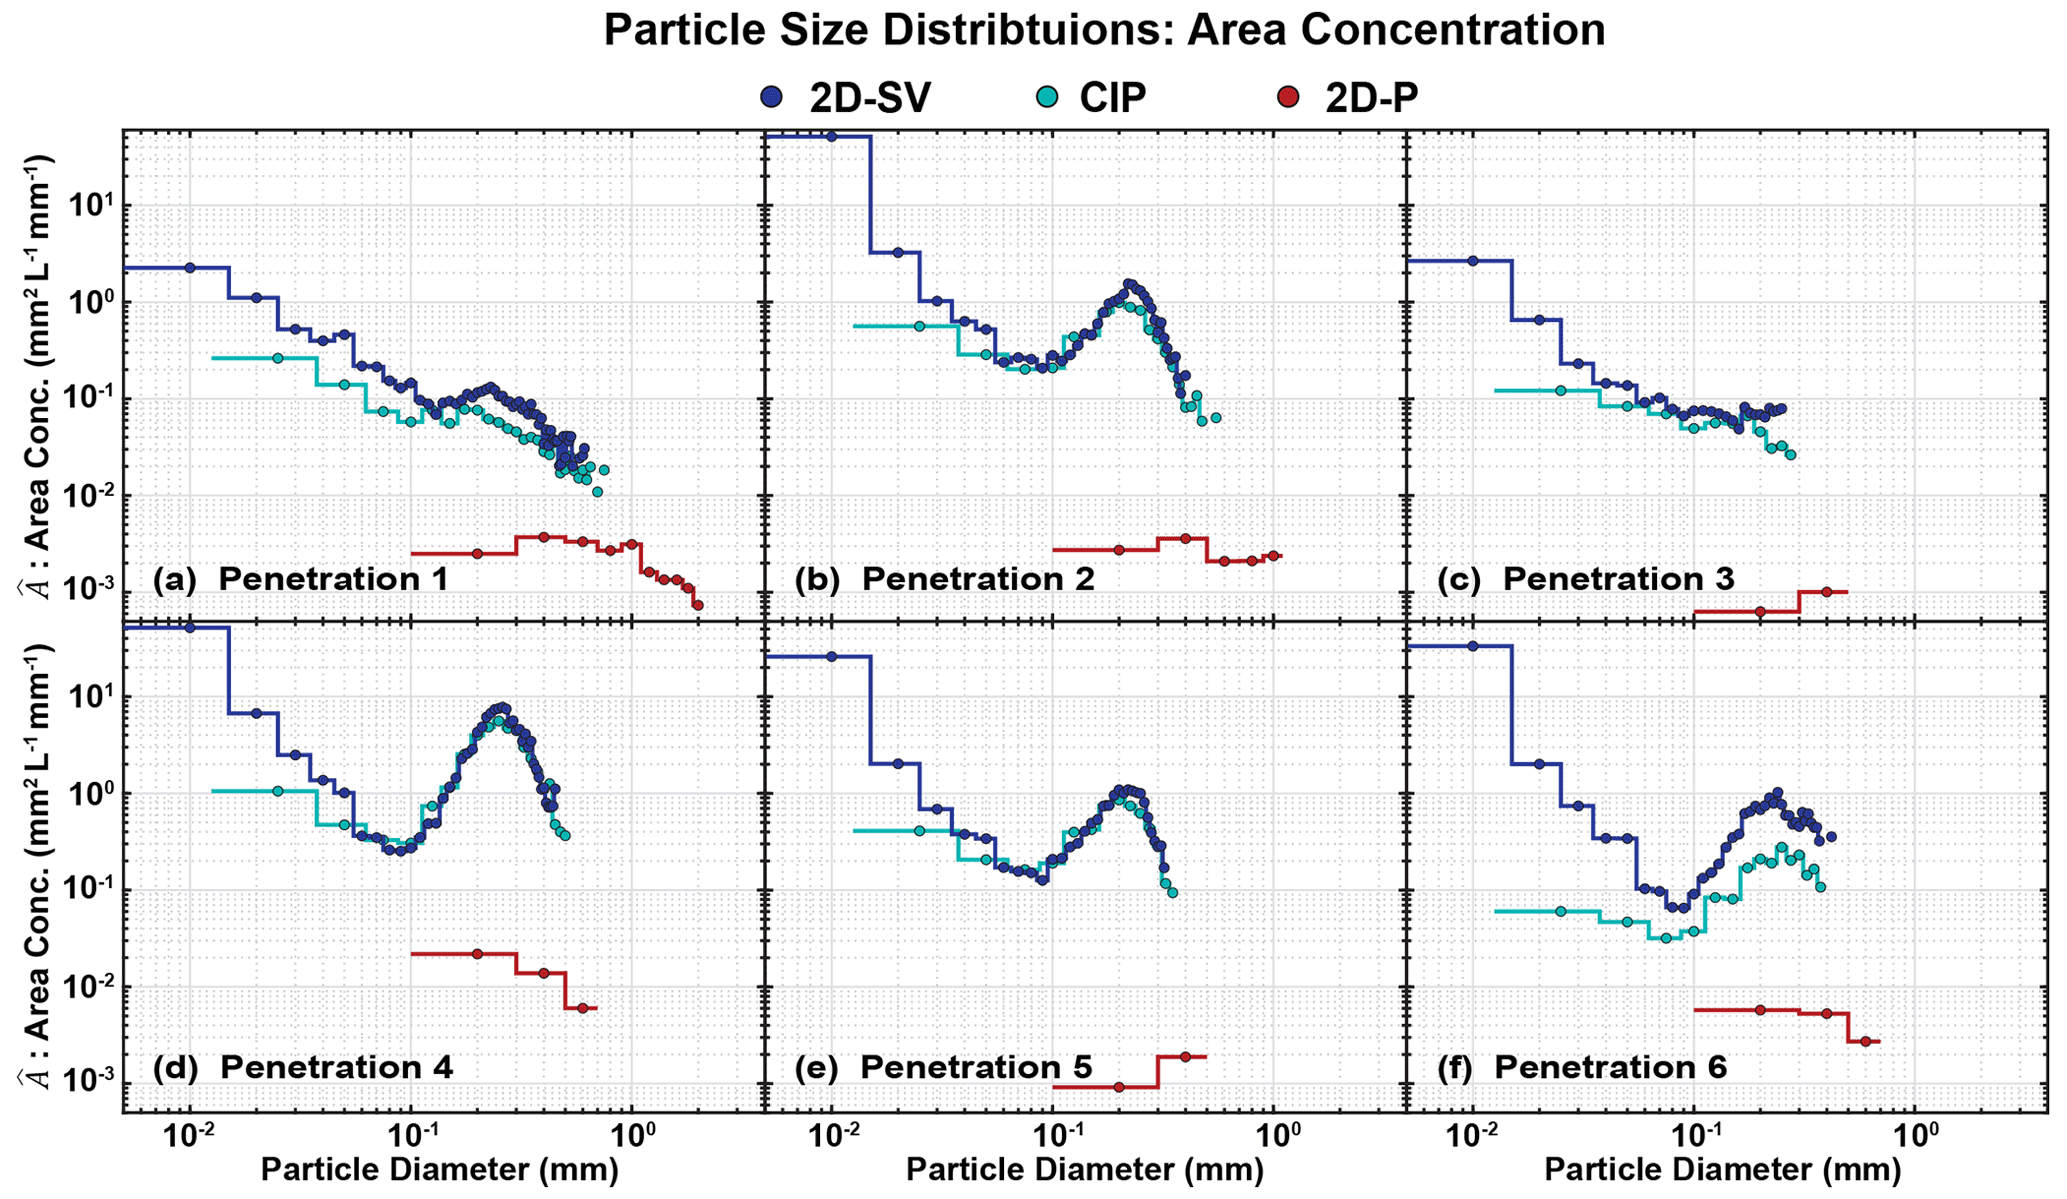
Area concentrations () as a function of diameter averaged over penetration 1 are shaped differently than those for (Fig. 6a). Most notably, the size distribution of is bimodal in nature. A secondary peak is evident in the 2D-SV and CIP data over the 150–400 µm diameter range. from the 2D-P exhibits a broad peak from 300–1000 mm that may be related to the secondary peak observed by the 2D-SV and CIP. However, the 2D-P is not sensitive enough to detect the primary peak of the distribution.
A sampling of 2D-SV particle images during penetration 1 indicates a distinct lack of circular symmetry (Fig. 7). Most particles are characterized by rough edges. Ice crystal aggregates sometimes have this type of appearance, but constituent ice crystal shapes (e.g., needles and dendrites) are usually apparent to some degree. That is not the case with these images. Flight-level air temperatures of −6 to −2 ∘C would allow for the existence of ice crystals during the penetration (Fig. 4b). However, values of Nevzorov TWC are effectively zero (Fig. 4c), indicating that ice particles are likely not present. Also, the updrafts (Fig. 4a) evident when 2D-SV concentrations are highest (Fig. 4d) suggest that these particles originate from below the aircraft where temperatures are above freezing, which virtually eliminates ice particles as an explanation for the shapes exhibited in Fig. 7. A more reasonable hypothesis is that these are images of pyrometeors, specifically ash particles. While their sizes are smaller, the shapes of these particles bear a striking resemblance to ash particles created in a burn chamber as shown in Fig. 7 of Baum et al. (2015).
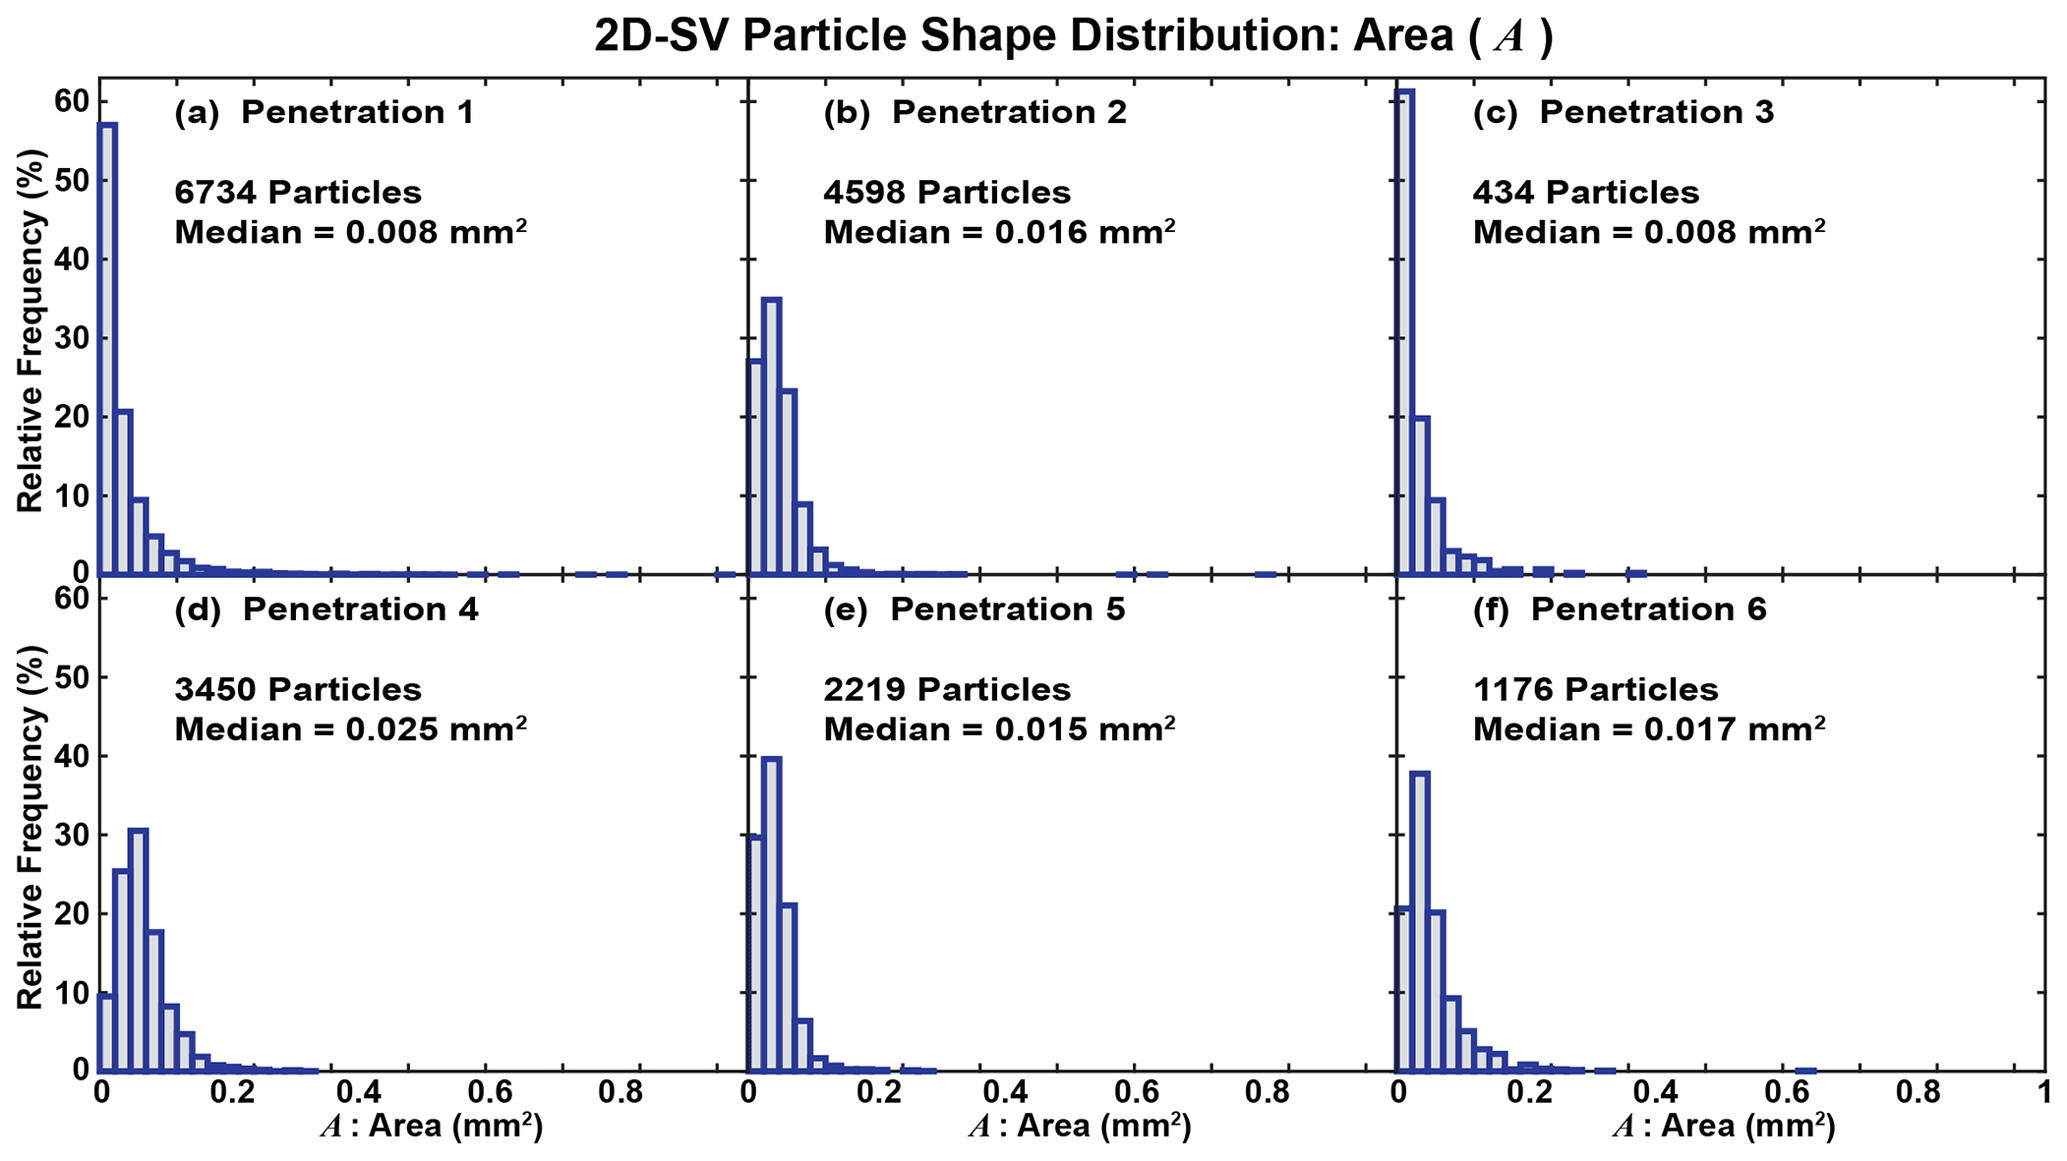
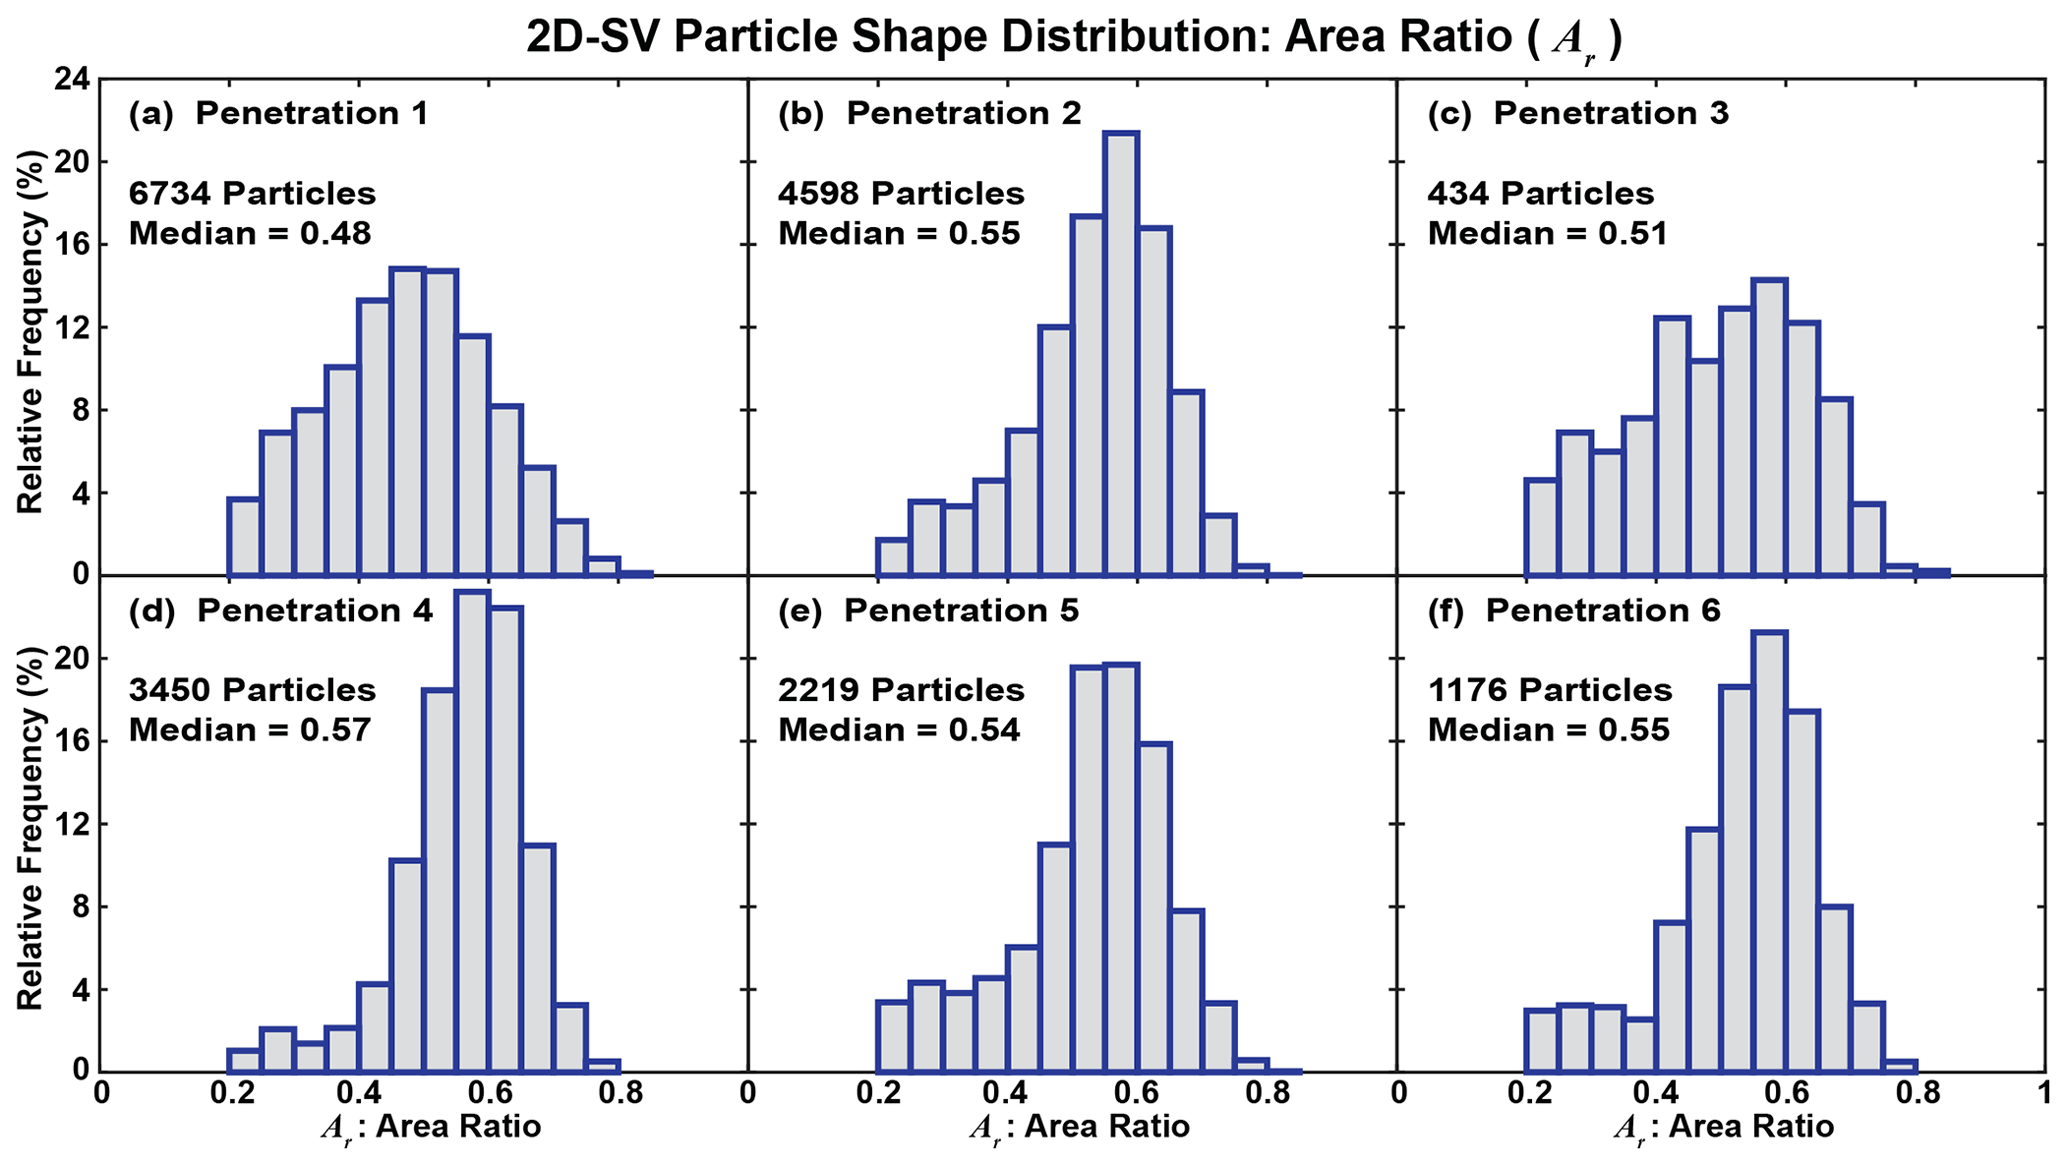
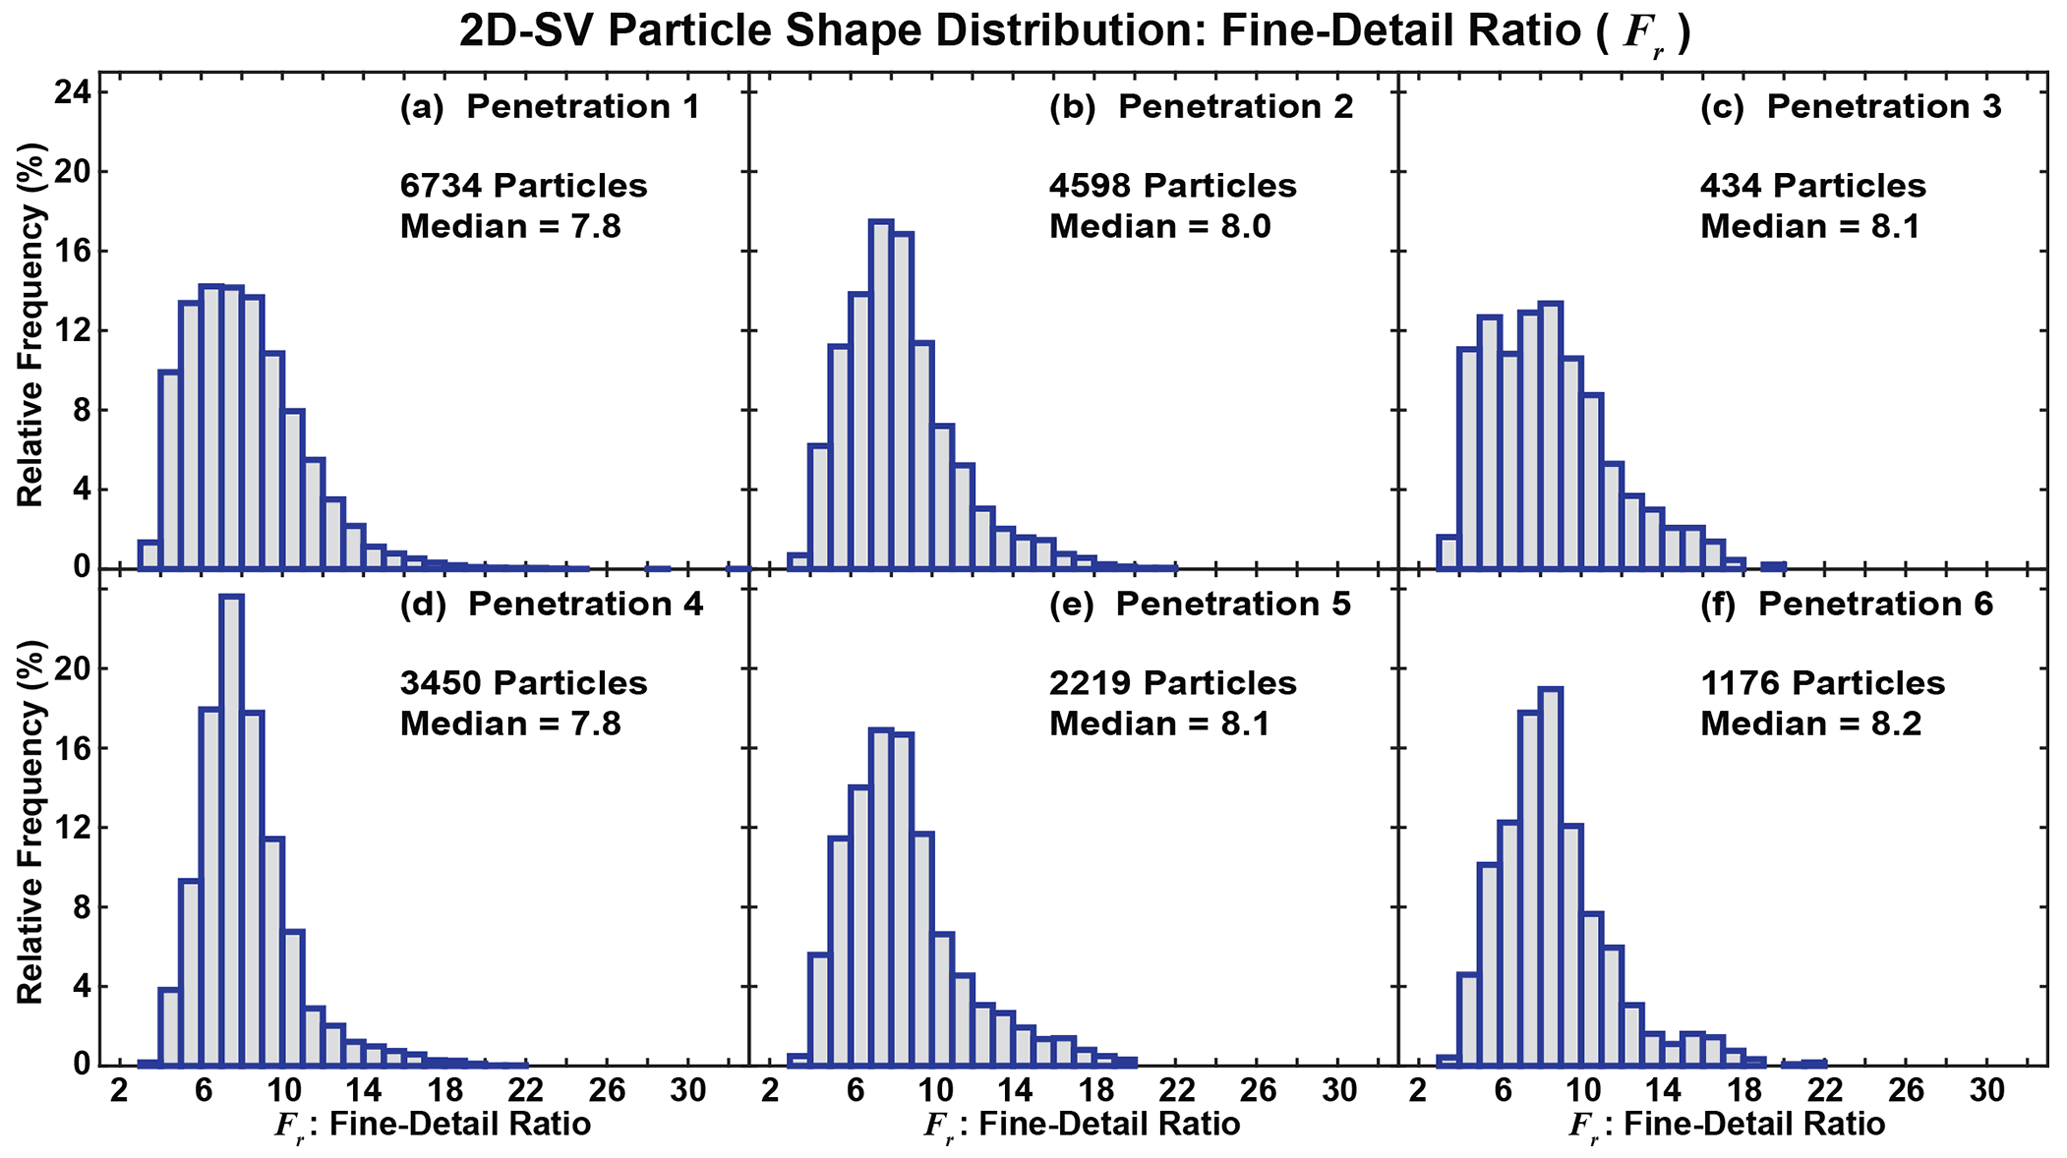
A more quantitative description of 2D-SV particle shapes from penetration 1 is accomplished by analyzing each accepted particle to determine aspect ratio (ASPr), area (A), area ratio (Ar), and fine-detail ratio (Fr). To bolster data quality, 2D-SV images containing fewer than 25 pixels or that touch one or both diode-array edges are excluded from the particle shape distribution analysis. This approach yields 6734 images to quantify particle shape. The ASPr distribution has a median of 0.72 and is negatively skewed with values as small as 0.2 (Fig. 8a). As ASPr decreases, particles are characterized by more elongated shapes. The mode and negatively skewed nature of this ASPr distribution is very similar to that documented in Fig. 6 of Baum et al. (2015). A dominant mode in the A distribution exists in the smallest area bin (Fig. 9a). This distribution is characterized by a median of 0.008 mm2 and a long tail that extends to 0.41 mm2. Baum et al. (2015) present a distribution of A in their Fig. 3 that is structured similarly (i.e., a dominant mode in the smallest area bin with a long tail) but has values of area that are a factor of ∼ 50 larger due to the relative coarseness of their measurement techniques. The distribution of Ar is mostly symmetric and centered on a median of 0.48 (Fig. 10a). This median and the fact that values are no larger than 0.85 quantitatively confirm the lack of circular symmetry that is qualitatively evident in the sampling of 2D-SV images (Fig. 7). Many studies have employed Ar to discriminate between different ice particle habits (e.g., Heymsfield and Kajikawa, 1987; Heymsfield and McFarquhar, 1996; Heymsfield et al., 2002). If ice particles were suspected as being present during penetration 1, the distribution of Ar in Fig. 10a is suggestive of ice crystal aggregates. Fr has also been employed for ice particle habit discrimination (Holroyd, 1987). Values close to 4 are associated with circular shapes, while values more than ∼ 13 are associated with particles having considerable porosity (e.g., unrimed aggregates) or significant branching (e.g., dendritic ice crystals). The distribution of Fr has a median of 7.8 and is positively skewed with values as large as 33 (Fig. 11a).
3.2 Penetrations 2-6: pyroCu
Penetrations 2–6 are grouped together since, as will be shown, they all sample pyroCus. These penetrations are much shorter in duration (<60 s) and flown at higher levels (7.3–7.7 km m.s.l.) than penetration 1 (Table 2, Fig. 1d). KCBX operates in a clear-air mode, specifically volume coverage pattern 32 (VCP 32; NOAA, 2017), until about 00:05 UTC 30 August, which is between penetrations 3 and 4. Thereafter, KCBX switches to VCP 212, which is a less sensitive operating mode optimized for sampling precipitation. KCBX polarimetric data from VCP 212 look significantly different than those from VCP 32 collected just before the transition (not shown). As a result of relatively weak reflectivity (<25 dBZe) and lower sensitivity, polarimetric data collected during VCP 212 operations are deemed unreliable (e.g., Melnikov and Zrnić, 2007; Ivić et al., 2013). Therefore, only KCBX polarimetric data that accompany penetrations 2 and 3 are shown in Fig. 12. Penetration 2 (3) is at a range of ∼ 105 km (∼ 100 km) from KCBX, where the 2.5∘ elevation scan is at ∼ 6.2 km m.s.l. (∼ 5.9 km m.s.l.), and the 3.5∘ elevation scan is at ∼ 8.0 km m.s.l. (∼ 7.7 km m.s.l.). In both penetrations, the center of the 3.5∘ elevation scan is only about 300–400 m above the UWKA flight altitude. The areal extent of reflectivity is smaller at 3.5∘ (Fig. 12a, g) compared to 2.5∘ (Fig. 12d, j). Like penetration 1, ZDR is too noisy to infer particle orientation characteristics (Fig. 12b, e, h, k), and ρhv is small enough (mostly <0.5) to suggest the presence of irregularly shaped particles (Fig. 12c, f, i, l).
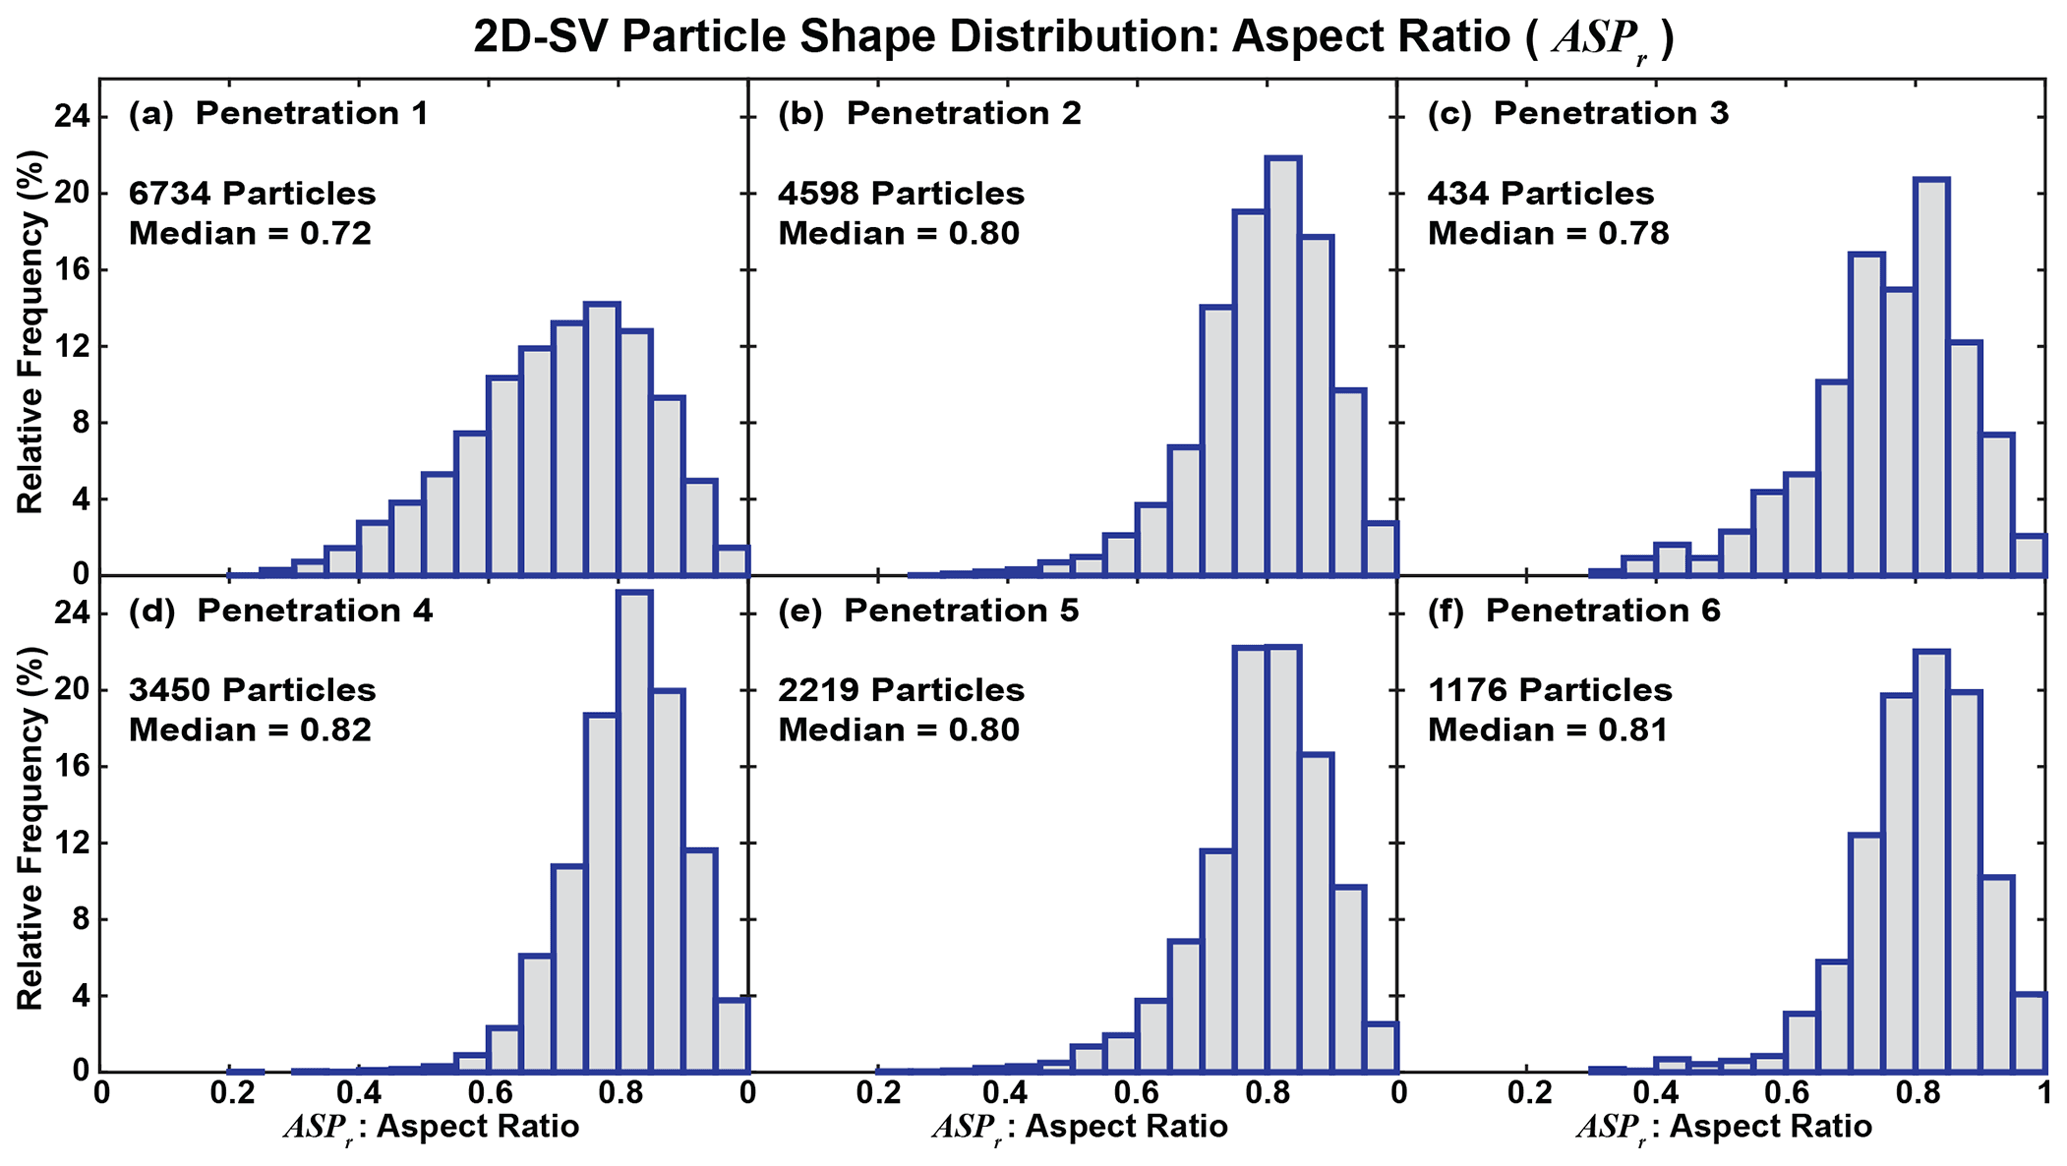
Figure 8Histograms of 2D-SV particle aspect ratio (ASPr) for (a–f) penetrations 1–6 (Fig. 1d, Table 2). Number of particles and distribution median indicated for each penetration.
The vertical structure of pyroconvection sampled during penetrations 3–5 is shown in Fig. 13. WCR data are not available for penetration 2 due to a malfunction and not shown for penetration 6 since the aircraft is turning throughout. The three penetrations supplemented with WCR data indicate passage through the tops of pyroconvective cells confined to the lowest ∼ 5 km a.g.l. (Fig. 13a–c). Lower parts of these cells are tied to the surface in some locations (00:16:55 and 00:18:15 UTC in Fig. 13b and 00:25:55 UTC in Fig. 13c). Reflectivity is also evident above the aircraft in association with penetrations 4–5 (Fig. 13b, c). These echoes are from altostratus and altocumulus clouds unrelated to emissions from the fire. Maximum reflectivity in association with pyroconvection from penetrations 3–5 is mainly −10–−5 dBZe, which is slightly weaker than observed during penetration 1 (Fig. 3a). The exception is reflectivity near the surface at ∼ 00:18:15 UTC immediately after penetration 4 (Fig. 13b), where values are almost 15 dBZe. These larger values of reflectivity are likely an indication of active combustion at the surface. Updrafts larger than 10 m s−1 are common in the pyroconvection sampled during penetrations 3–5 (Fig. 13d–f). However, the strongest updrafts, some exceeding 25 m s−1, are below flight level, often near the locations where cells are tied to the surface. Downdrafts are smaller in magnitude and spatial scale compared to updrafts, which is like that seen during penetration 1 (Fig. 3b).
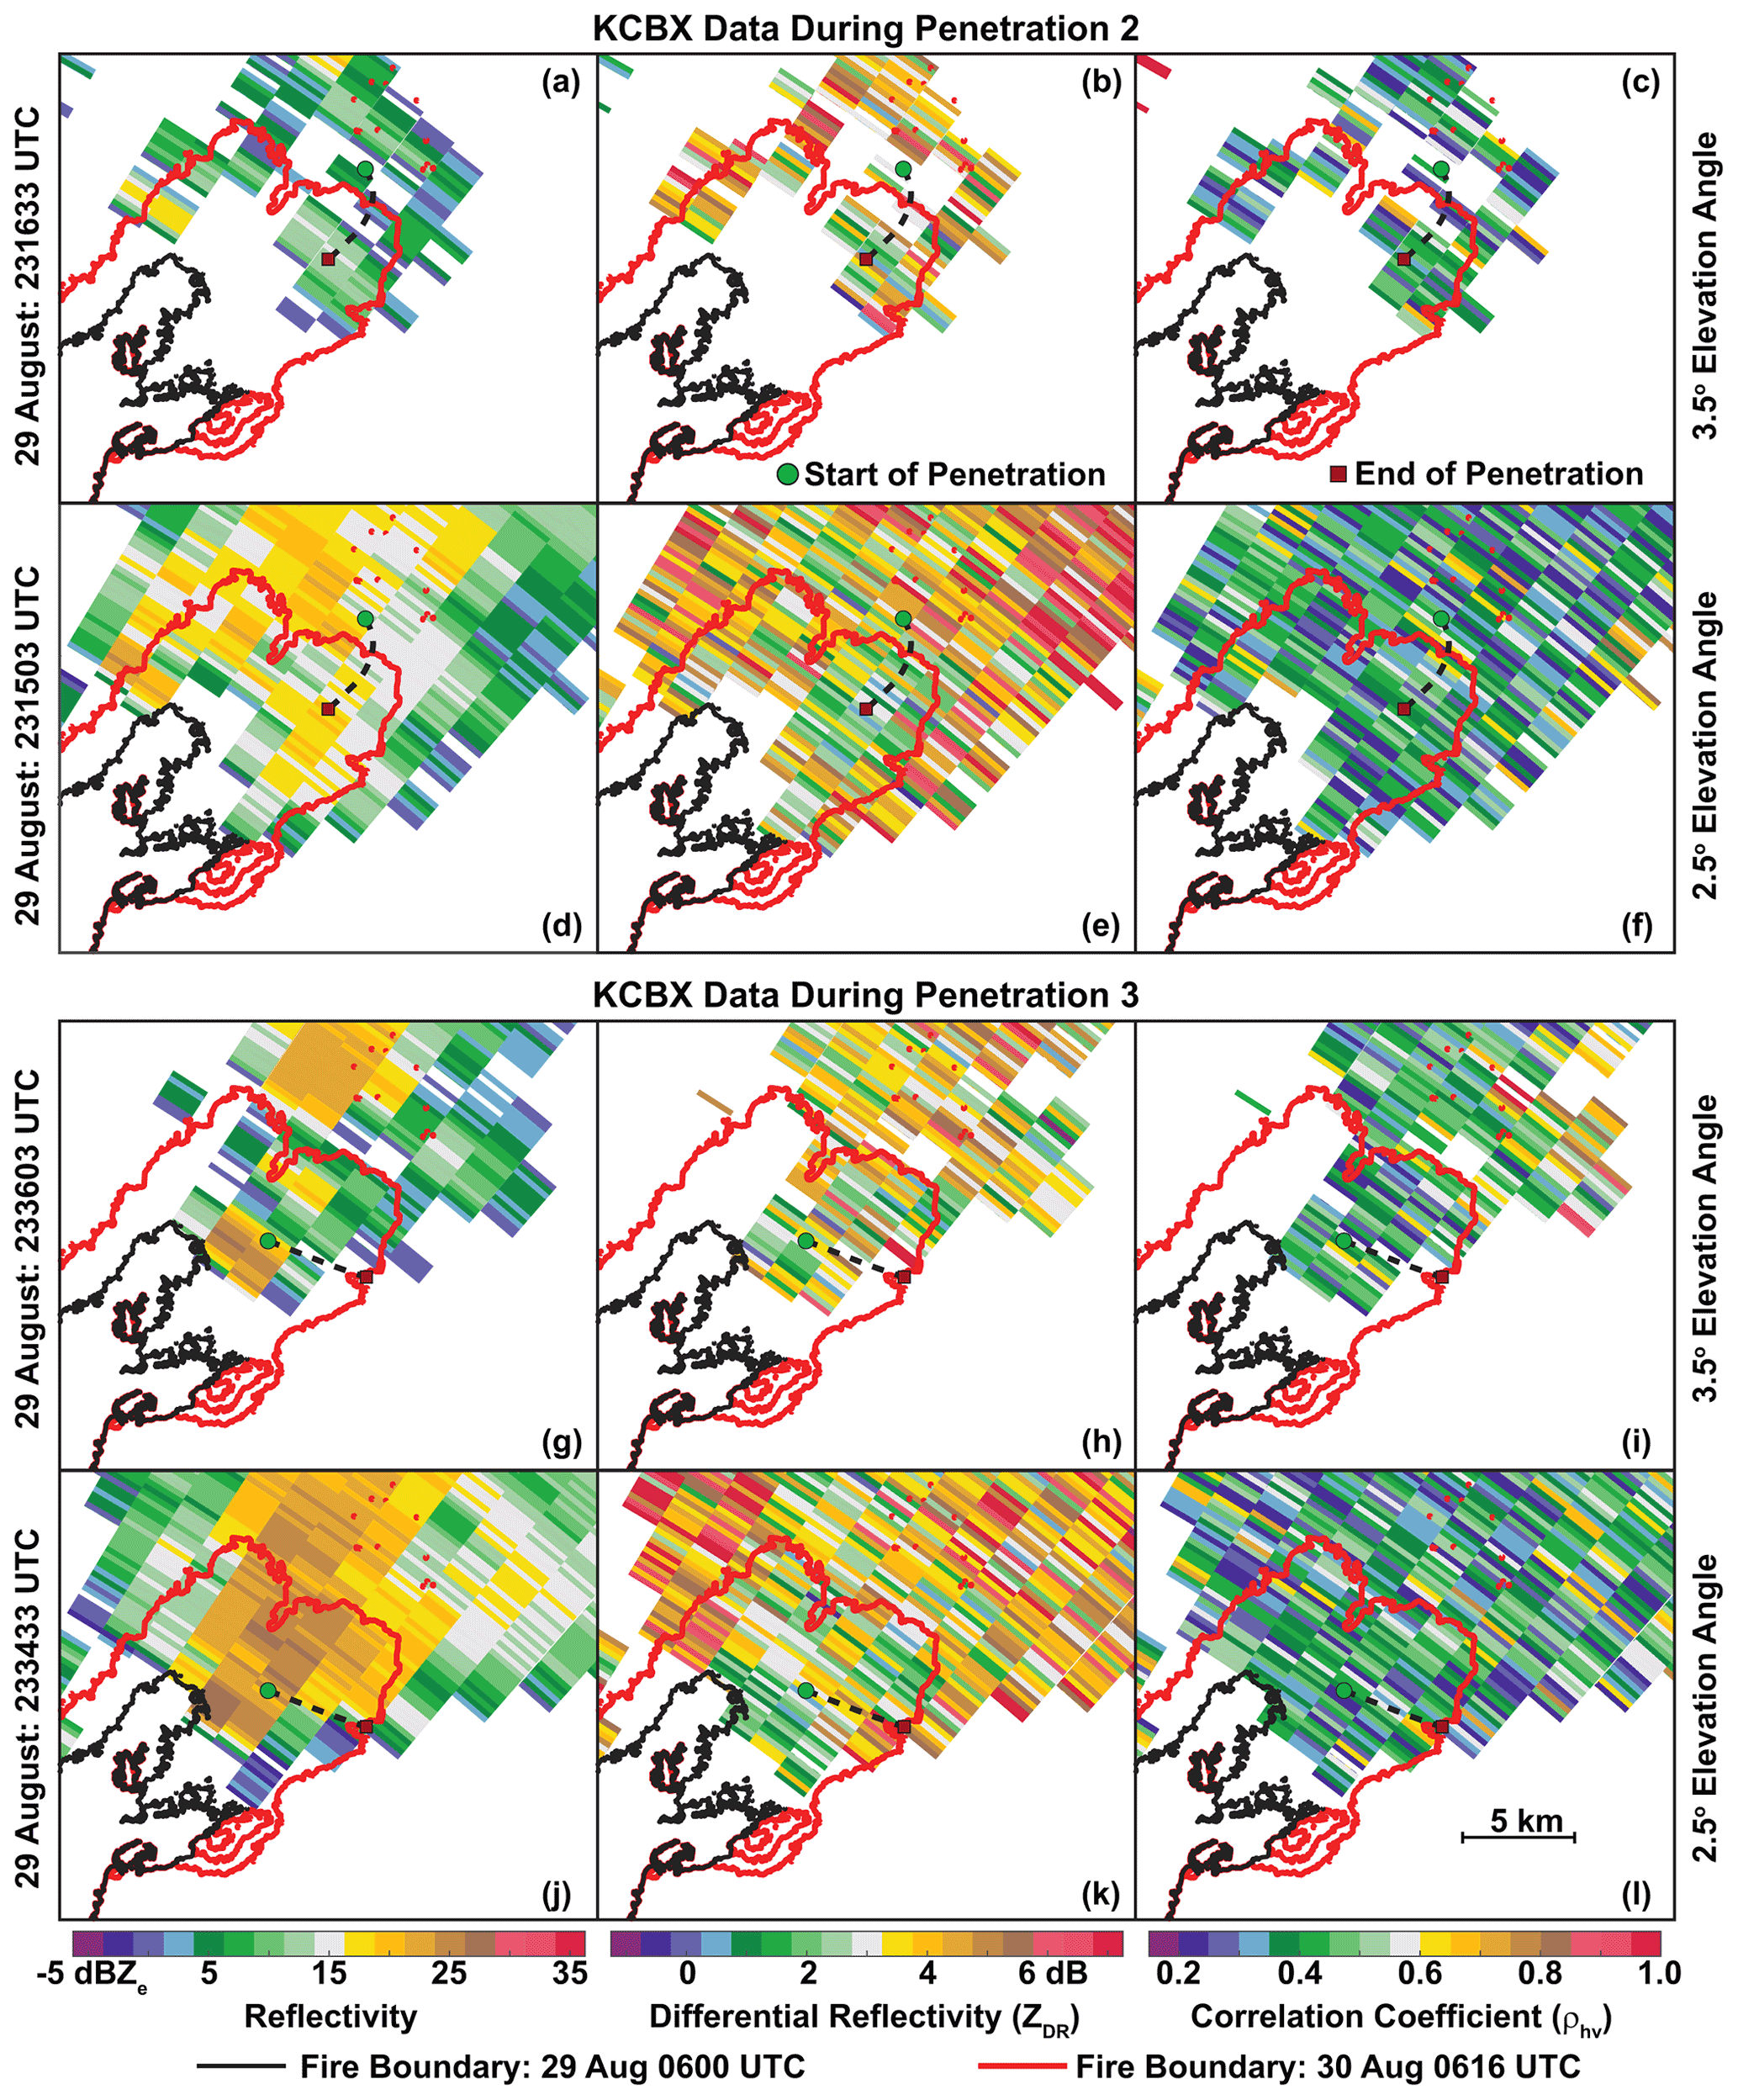
Figure 12KCBX data approximately coincident with the execution of penetration 2 (a–f) and penetration 3 (g–l). Left column (a, d, g, j) shows reflectivity, middle column (b, e, h, k) shows differential reflectivity (ZDR), and right column (c, f, i, l) shows correlation coefficient (ρhv). Color scales at bottom of each column indicate plotted values. Top row (a–c) is for data at 23:16:33 UTC 29 August 2016 (3.5∘ elevation angle), second row (d–f) for data at 23:15:03 UTC 29 August 2016 (2.5∘ elevation angle), third row (g–i) for data at 23:36:03 UTC 29 August 2016 (3.5∘ elevation angle), and fourth row (j–l) for data at 23:34:33 UTC 29 August 2016 (2.5∘ elevation angle). Perimeters of the Pioneer Fire at 06:00 UTC 29 August 2016 and 06:16 UTC 30 August 2016 are indicated with black and red lines, respectively. Dashed black lines show the locations of penetrations 2 and 3, with green circles and red squares indicating the start and end of each penetration, respectively.
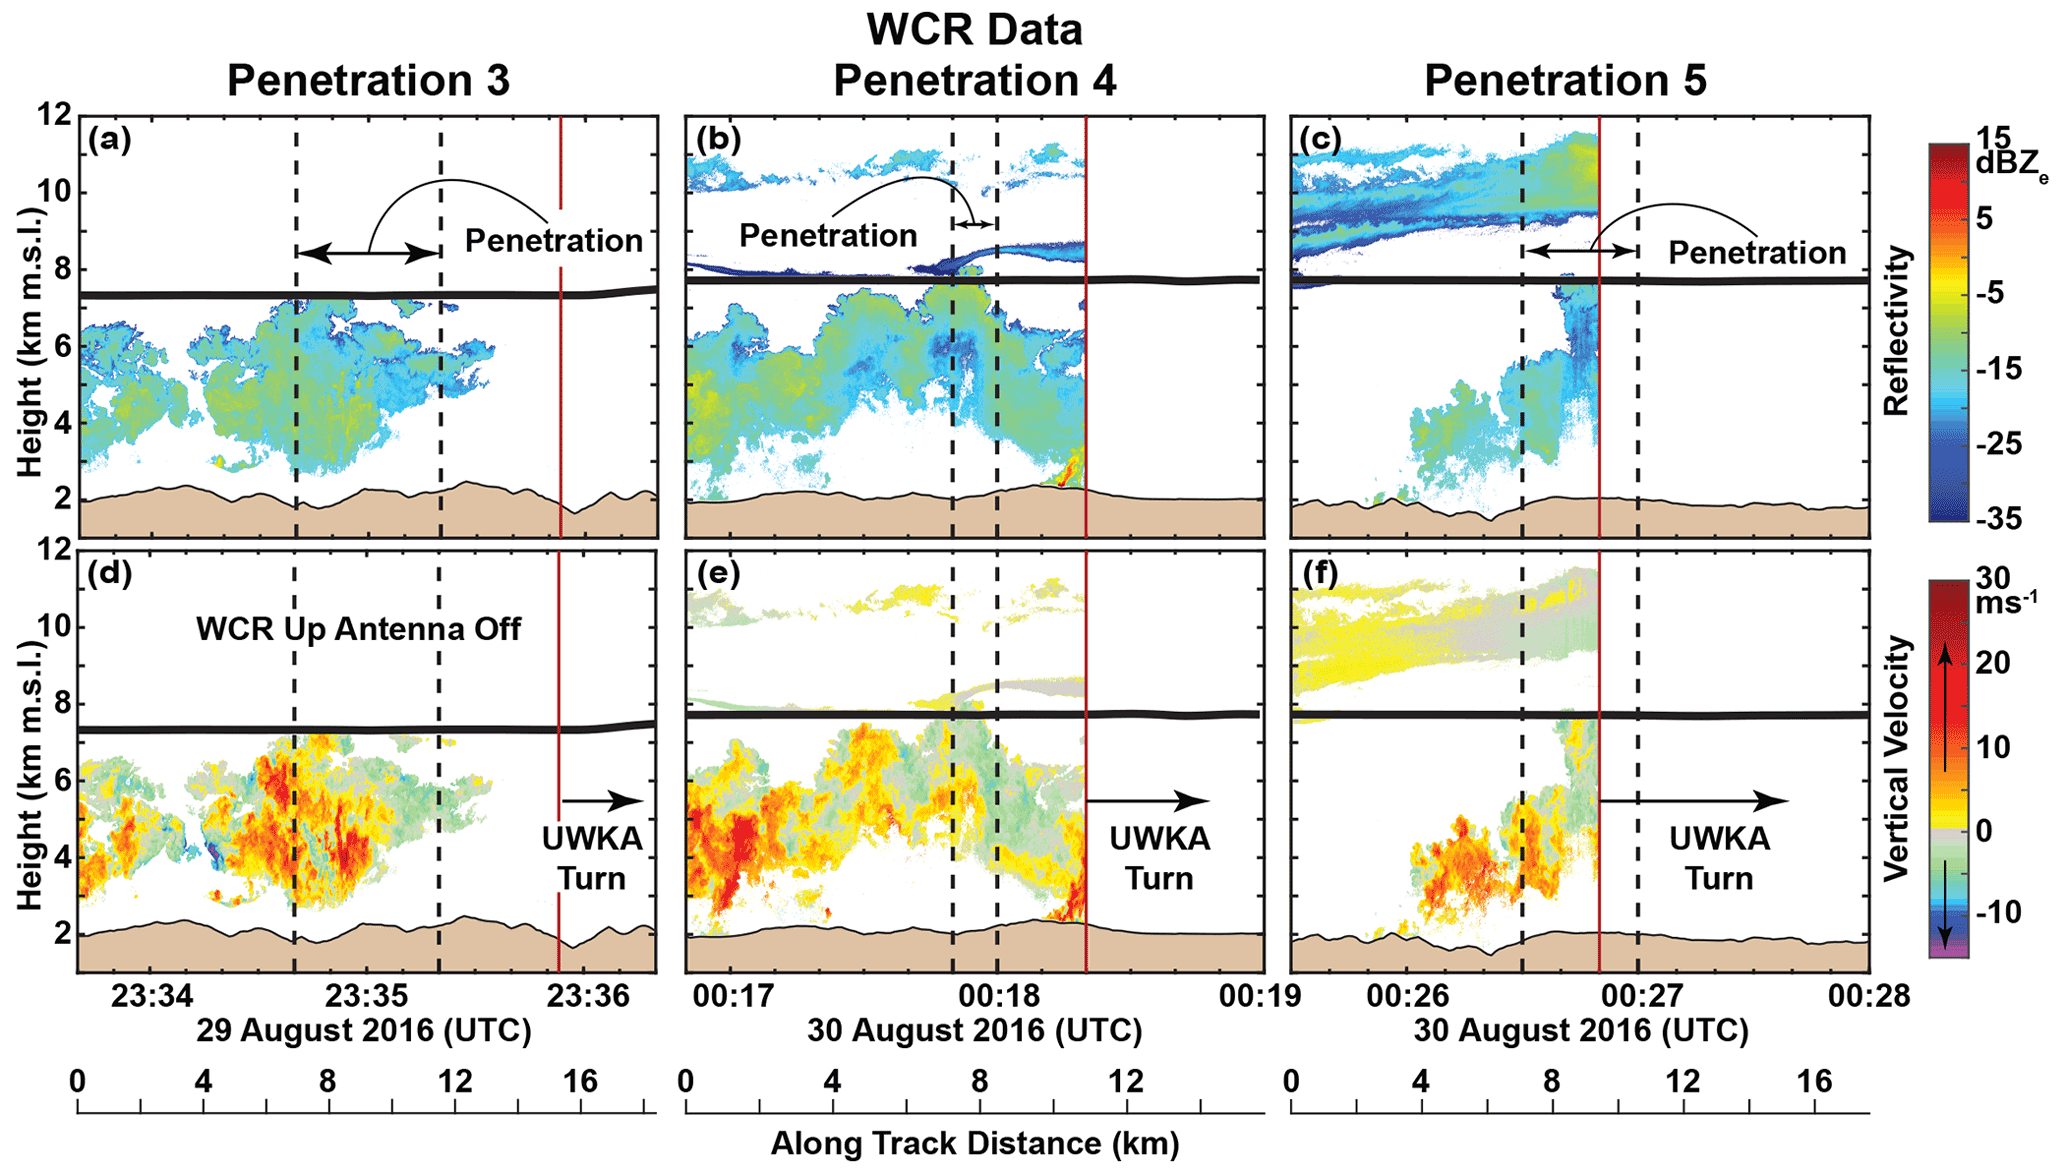
Figure 13UWKA WCR (a–c) reflectivity and (d–f) radial velocity (effectively vertical velocity) data for (a, d) penetration 3, (b, e) penetration 4, and (c, f) penetration 5 (Fig. 1d, Table 2) and 60 s before and after each of the penetrations (bounded by the vertical, dashed black lines). Color scales to the right of each row indicate plotted values. Aircraft track shown by the bold black lines near the middle of each panel. Underlying topography indicated by the filled tan outline at the bottom of each panel. Along-track distance for the penetrations shown at bottom. Periods without WCR data bounded by vertical red lines.
Maximum updrafts at flight level are smaller during penetrations 2–6 (Fig. 14a–e) compared to penetration 1 (Fig. 4a). Penetrations 2–3 are characterized by updrafts that are slightly larger than 5 m s−1 (Fig. 14a, b), penetrations 4 and 6 by updrafts less than 1 m s−1 (Fig. 14c, e), and penetration 5 by no updrafts at all (Fig. 14d). Downdrafts during penetrations 2–6 (Fig. 14a–e) are of comparable magnitude to that observed during penetration 1 (Fig. 4a). Air temperatures across penetrations 2–6 vary between ∼ −26 and ∼ −21 ∘C (Fig. 14f–j), which is significantly colder than penetration 1 (Fig. 4b) due to the higher flight altitudes. Interestingly, there are relatively cold temperatures in the updraft core of penetration 2 (Fig. 14f), which may be a signature of pyroconvection overshooting its equilibrium level. Maximum values of relative humidity are generally larger during penetrations 2–6 compared to penetration 1, with values exceeding 85 % during penetrations 2–5 (Fig. 14f–i). Significant values of bulk water content are present in penetrations 2–6 (Fig. 14k–o), a stark contrast with the negligible values observed in penetration 1. The substantial cloud liquid water content observed during penetrations 2–6 suggests that this pyroconvection is best described as pyroCu. Measurements from the PVM-100 probe produce consistently larger values of cloud liquid water content (∼ 0.6 to ∼ 1.2 g m−3) compared to those from the Nevzorov LWC and LWC-100 probes (∼ 0.2 to ∼ 0.8 g m−3). Notably, values of total condensed water content from the Nevzorov TWC probe are always lower than values of cloud liquid water content from the Nevzorov LWC probe. This artifact is likely due to the lower collection efficiency of the Nevzorov TWC probe compared to the Nevzorov LWC probe for cloud droplets less than 20 µm in diameter (Korolev et al., 1998; Schwarzenboeck et al., 2009). Data from the PVM-100 probe indicate cloud-droplet effective radii (Re) of ∼ 5 µm during penetrations 2–6 (Fig. 14k–o).
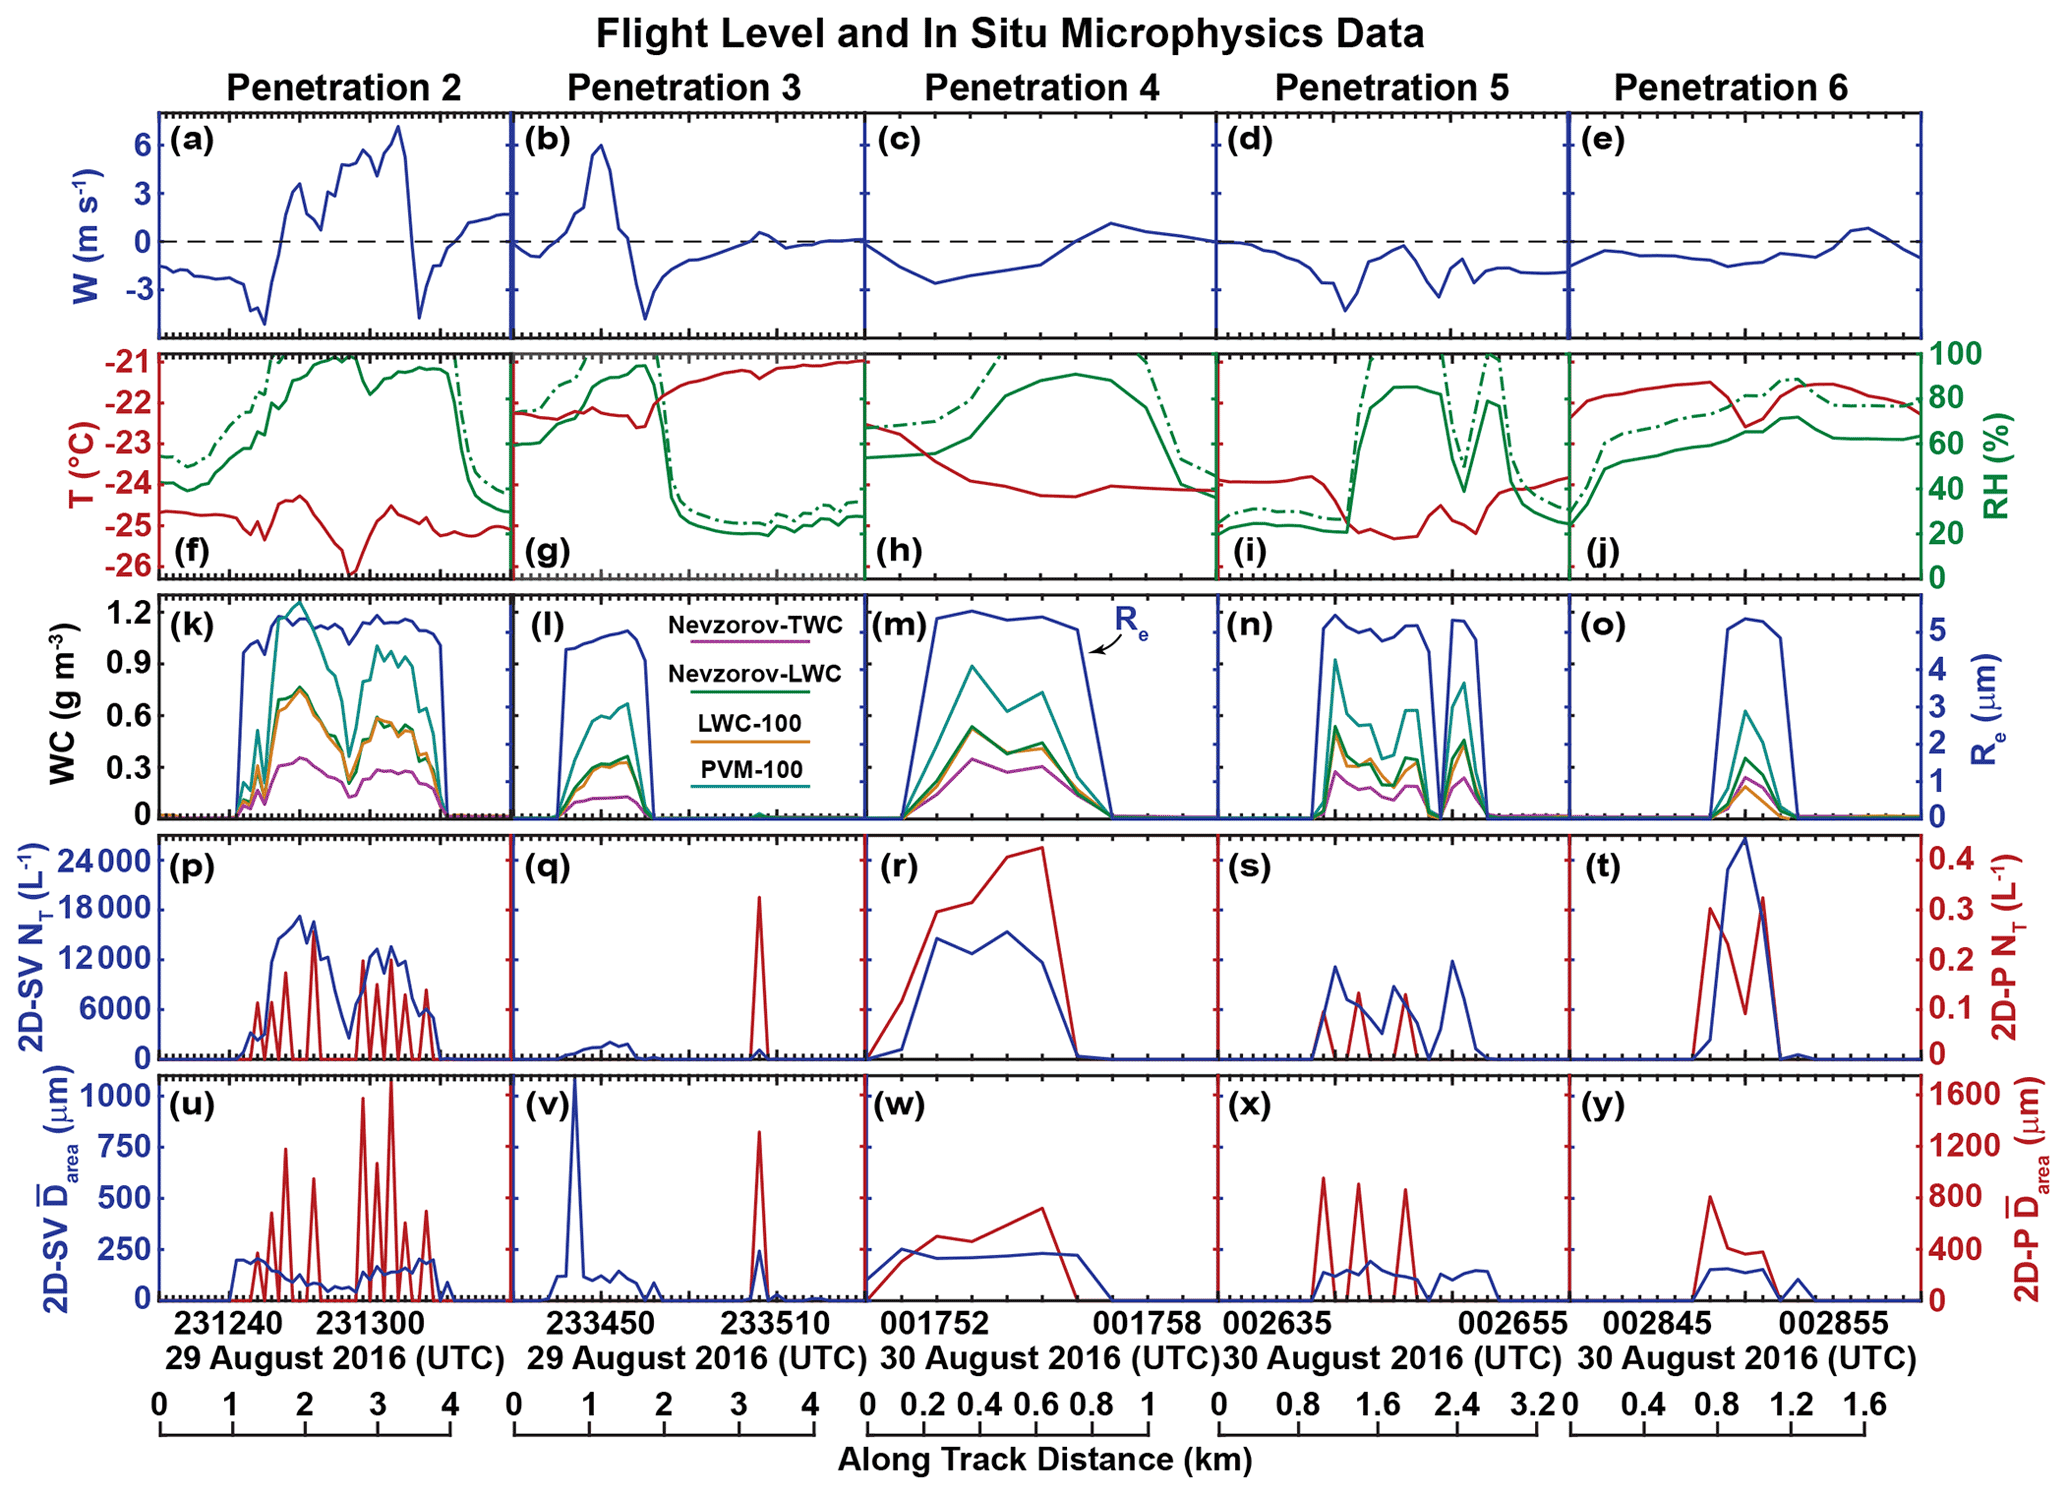
Figure 14UWKA flight-level and in situ microphysics data for penetrations 2–6 (Fig. 1d, Table 2). (a–e) Vertical air velocity (blue), (f–j) temperature (red), relative humidity with respect to liquid (solid green) and relative humidity with respect to ice (dashed green), (k–o) bulk water content (WC) from the Nevzorov TWC probe (magenta), Nevzorov LWC probe (green), LWC-100 probe (gold), and PVM-100 probe (cyan), and cloud-droplet effective radii (Re) from the PVM-100 probe (blue), (p–t) total concentration (NT) from the 2D-SV probe (blue) and 2D-P probe (red), and (u–y) area-weighted mean diameter ( from the 2D-SV probe (blue) and 2D-P probe (red). Along-track distance for each penetration shown at bottom.
Particle characteristics as measured by the 2D-SV during penetrations 2 and 4–6 (Fig. 14p, r–t, u, w–y) differ substantially from the smoke–ash plume sampled during penetration 1 (Fig. 4d–e). Specifically, maximum values of 2D-SV NT are about 1 order of magnitude larger (Fig. 14p, r–t), and maximum values of 2D-SV are smaller by a factor of ∼ 3–5 (Fig. 14u, w–y). This tendency may be due to high concentrations of small cloud droplets. The outlier in this trend is penetration 3, where maximum values of 2D-SV NT and (Fig. 14q, v) are comparable to those observed during penetration 1 (Fig. 4d–e). Differences are also evident in 2D-P particle characteristics. Maximum 2D-P is smaller for penetrations 2–6 (Fig. 14u–y) compared to penetration 1 (Fig. 4e) but only by a factor of ∼ 2–4. Maximum 2D-P NT is slightly smaller for the pyroCu penetrations (Fig. 14p–t vs. Fig. 4d), perhaps owing to the smaller values of maximum 2D-P and the fact that the 2D-P is not able to detect small cloud droplets.
The mean particle size distribution of over penetration 3 (Fig. 5c) is like that observed in penetration 1 (Fig. 5a) for 2D-SV and CIP measurements up to ∼ 300 µm in diameter. However, unlike penetration 1, particles larger than 400 µm are not observed, even by the 2D-P. The other pyroCu penetrations are all characterized by considerably different size distributions of (Fig. 5b, d–f) compared to penetration 1 (Fig. 5a). Specifically, mean from the 2D-SV and CIP is larger in penetrations 2 and 4–6 by more than an order of magnitude over the 10–500 µm diameter range (Fig. 5b, d–f), especially at smaller diameters. Particles larger than 500 µm are detected in low concentrations by the 2D-P but only up to 600–1000 µm, which is smaller than observed during penetration 1 (Fig. 5a). The size distributions of for penetrations 2 and 4–6 are also characterized by a bimodal structure, with secondary peaks in the 200–300 µm diameter range (Fig. 5b, d–f). This type of bimodal structure is not evident in penetration 1 (Fig. 5a).
Mean particle size distributions of over penetrations 2–6 (Fig. 5b–f) are significantly different from those documented for pyroCb in Fig. 11 of Peterson et al. (2022). One difference is that the particle number concentrations detected in Peterson et al. (2022) are generally larger than those observed in the present study. Also, the Peterson et al. (2022) study observes particles that are larger than 1 mm, whereas almost all the pyroCu particles in the present study are less than 1 mm. These differences are perhaps not surprising given that the pyroCbs in Peterson et al. (2022) are associated with ground-based NWS radar reflectivity larger than 40 dBZe, likely indicative of substantial hydrometeor generation in the deep clouds they sampled from −40 to −18 ∘C. In contrast, KCBX radar reflectivity from the present study maximizes at ∼ 25 dBZe (Figs. 1d, 12a, d, g, j).
Size distributions of are bimodal for penetrations 2 and 4–6 (Fig. 6b, d–f). While this structure is also evident in penetration 1 (Fig. 6a), it is considerably more pronounced during penetrations 2 and 4–6, with mean 1–2 orders of magnitude larger over the 150–400 µm diameter range. Interestingly, the size distribution of during penetration 3 (Fig. 6c) is, like penetration 1 (Fig. 6a), up to ∼ 100 µm, but at larger diameters, a bimodal structure is not evident (Fig. 6c).
The 2D-SV images sampled during penetrations 2–6 (Fig. 15) are characterized by a relatively high ratio of small (diameter <50 µm) particles, whose shape is ill-defined due to the resolution of the probe. Given the presence of substantial cloud liquid water content (Fig. 14k–o), these small particles are likely cloud droplets. Such small particles are not evident in the 2D-SV imagery from penetration 1 (Fig. 7). For particles larger than ∼ 50 µm, 2D-SV imagery from penetrations 2–6 (Fig. 15) qualitatively suggests a somewhat higher degree of circular symmetry than observed during penetration 1. However, many of these larger particles are still characterized by rough edges.
Quantitative analysis of 2D-SV images from penetrations 2–6 provides a more robust description of particle shapes and how they compare with those from penetration 1. After excluding images containing fewer than 25 pixels or that touch one of both edge diodes, penetrations 2–6 employ 4598, 434, 3450, 2219, and 1176 images, respectively, to quantify particle shape. The ASPr distributions for penetrations 2–6 (Fig. 8b–f) are narrower and have larger medians than observed during penetration 1 (Fig. 8a). Penetration 3 exhibits an A distribution with a mode and median like penetration 1 (Fig. 9c vs. Fig. 9a). In contrast, penetrations 2 and 4–6 have A distributions with larger medians and modes that exist in the second or third area bins (Fig. 9b, d–f). Fewer particles with A greater than 0.1 mm2 are evident in penetrations 2–6 (Fig. 9b–f) than in penetration 1 (Fig. 9a). The Ar distribution of penetration 3 is also like that of penetration 1 (Fig. 10c vs. Fig. 10a) in terms of breadth, median, and relative symmetry about the median. Penetrations 2 and 4–6 are characterized by narrower and negatively skewed distributions of Ar with larger medians (Fig. 10b, d–f). These larger values of Ar coupled with the larger values of ASPr in penetrations 2–6 are consistent with the qualitative observation of greater circular symmetry in particles sampled during the pyroCu penetrations (Fig. 15) compared to penetration 1 (Fig. 7). The distributions of Fr from penetrations 2–6 (Fig. 11b–f) are generally like that from penetration 1 (Fig. 11a).
While particles less than 50 µm in diameter during penetrations 2–6 are likely cloud droplets, the nature of larger particles is unclear since ice particles, pyrometeors, and a combination of the two are plausible explanations. Pyrometeors in the form of ash particles could be lofted upward to the tops of the pyroCus, especially in penetrations 2–3, where updrafts larger than 1 m s−1 are observed (Fig. 14a, b). Likewise, ice particles are possible since air temperatures at flight level are well below freezing (Fig. 14f–j). Also, conditions of ice supersaturation are evident in four of the five penetrations (Fig. 14f–i). Finally, the distributions of Ar and Fr in Figs. 10b–f and 11b–f, respectively, are consistent with values expected for ice particles. If these larger particles are composed of ice, they should produce a signal in the Nevzorov TWC (NEVTWC) data, whereas ash particles should not be detectable by the Nevzorov probe. However, this analysis is complicated by the presence of small cloud droplets. Cloud droplets also produce a signal in the NEVTWC data; however the magnitude of that signal depends not only on the water content, but also on the size of the droplets themselves. For the same liquid water contents, the signal in NEVTWC will increase by ∼ 50 % as droplet effective radii increase from ∼ 5 to ∼ 15 µm, while over the same range of radii, the signal in NEVLWC only increases by ∼ 2 % (Fig. 4 and Eq. 13 of Korolev et al., 1998). Thus, clouds composed of liquid, even when devoid of ice, will have different signals in NEVTWC and NEVLWC depending on droplet size regardless of liquid water content.
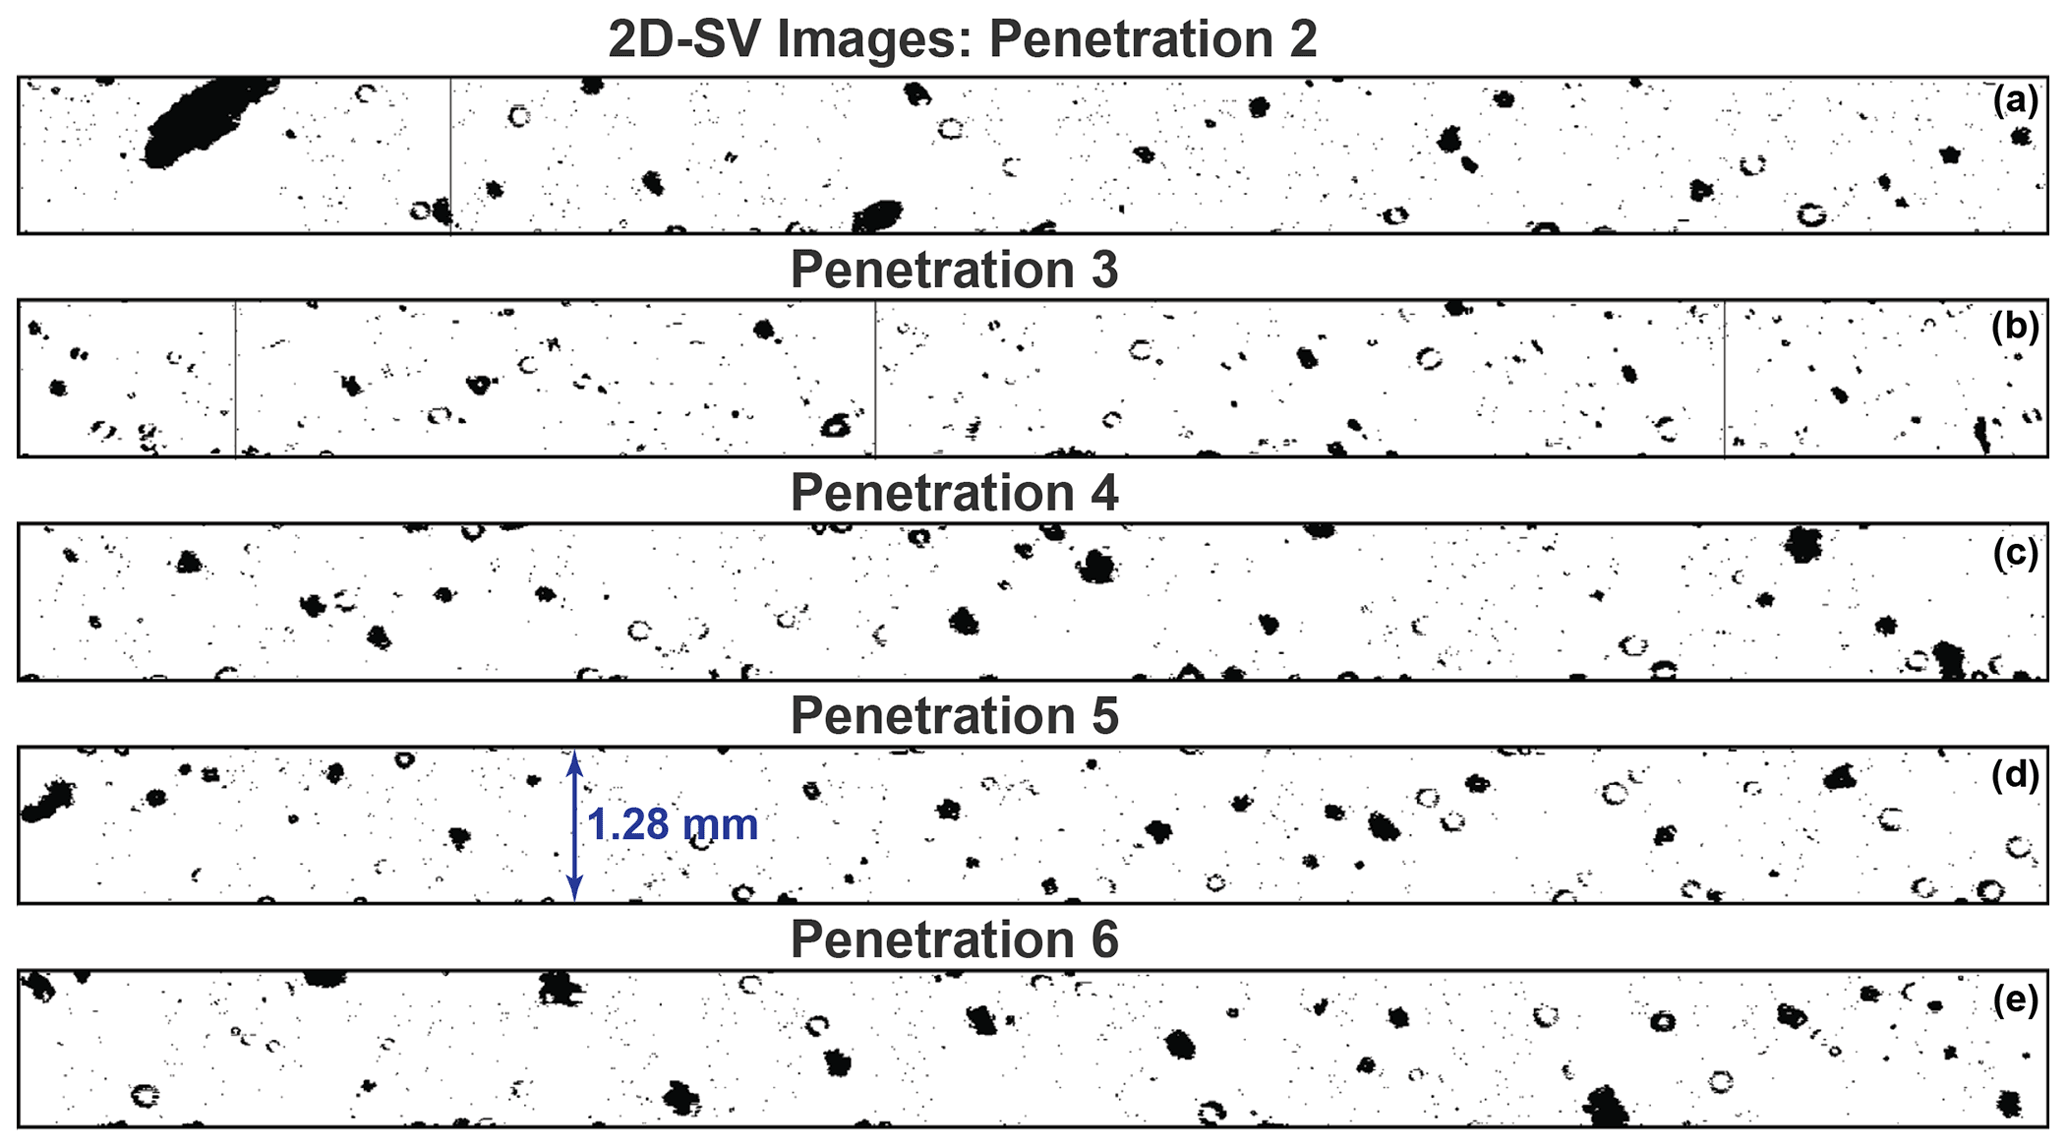
Figure 15Sampling of 2D-SV particle images for penetrations 2–6 (Fig. 1d, Table 2). Vertical distance of each horizontal strip represents 1.28 mm.

Figure 16UWKA water content data for (a–e) penetrations 2–6 (Fig. 1d, Table 2). TWC from the Nevzorov TWC probe (magenta), LWC from the Nevzorov LWC probe (green), and IWC derived from OAP size distributions using a mass–diameter relation (blue). Ratio of TWC from Nevzorov TWC probe to LWC from Nevzorov LWC probe (NEVr) shown at selected times. Along-track distance for each penetration shown at bottom.
Values of NEVTWC, NEVLWC and the ratio of these signals (NEV are presented for penetrations 2 through 6 in Fig. 16. Following the discussion in the previous paragraph and the definition of NEVr, an increase in NEVr may result from either (or both) an increase in droplet effective radius and/or an increase in IWC. In penetration 3, NEVr is 0.36 (Fig. 16b). Assuming the cloud is devoid of ice, this value corresponds to a droplet effective radius of ∼ 2.5 µm. If, on the other hand, ice were present, then the radius would be even smaller. This radius is about half of that measured by the PVM-100 probe across all penetrations (Fig. 14k–o), suggesting that the PVM may be overestimating the droplet effective radius by a factor of 2. NEVr varies from 0.36 to 0.69 across all five penetrations. If cloud-droplet effective radii are assumed to be the same across these penetrations, then the variations in NEVr might be explained by the presence of ice particles. To further investigate the possible presence of ice, an independent measure of IWC is needed. Size distributions of OAP number concentration at 1 Hz are integrated over diameter with a mass–diameter relationship for ice crystal aggregates from Brown and Francis (1995) to derive IWC (OAPIWC). The derivation is restricted to particles having diameters greater than or equal to 50 µm to eliminate the contribution of cloud droplets. Results of this analysis show that the smallest OAPIWC occurs during penetration 3, which coincides with the smallest NEVr (Fig. 16b). The largest and next largest OAPIWC are observed in penetrations 4 and 6, respectively, where NEVr is largest (Fig. 16c, e). These trends suggest that ice particles larger than 50 µm diameter are present in the data produced by the Nevzorov probe and OAPs. However, this analysis does not eliminate the possibility that pyrometeors are also in the sample volume. Indeed, many of the measurements from penetration 3 show more similarity to those for the smoke–ash plume in penetration 1 than those for the pyroCu in penetrations 2 and 4–6. This suggests that the particles sampled during penetration 3 might be composed of a greater proportion of pyrometeors than the particles sampled during the other pyroCu penetrations. The reasons for this difference are not clear. Penetration 3 is executed at 7.3 km m.s.l., about 400 m lower than penetrations 2 and 4–6 but still 2.1 km higher than penetration 1 (Table 2). Also, there is no evidence to indicate that underlying vegetation associated with penetration 3 is significantly different than that for penetrations 2 and 4–6.
This study has characterized the size and shape distributions of 10 µm to 6 mm diameter particles sampled during penetrations of pyroconvection by the UWKA research aircraft over the period 29–30 August 2016. The pyroconvection, in the form of both smoke–ash plumes and pyroCus, was produced by the Pioneer Fire, a large wildfire (ultimately 76 081 ha) located northeast of Boise, Idaho (Fig. 1). In situ measurements by the UWKA included standard flight-level parameters (e.g., navigation, winds, and atmospheric state), bulk water content, and particle concentration, size, and shape. Additionally, airborne Doppler radar observations from the WCR were used to characterize the depth and vertical motions of the sampled pyroconvection.
Penetration 1 probed a smoke–ash plume at 5.2 km m.s.l. characterized by strong updrafts, many larger than 10 m s−1 and one of almost 36 m s−1 (Figs. 3b, 4a). This penetration spanned a temperature range of −6 to −2 ∘C, was subsaturated with relative humidity less than 80 %, and contained negligible amounts of bulk water content (Fig. 4b, c). The size distribution of number concentration was very similar to that documented by Radke et al. (1991) for a smoke–ash plume from a prescribed fire (Fig. 5a). Also, particle shapes exhibited qualitative and quantitative attributes (Figs. 7, 8a, 9a) comparable to ash particles created in a burn chamber by Baum et al. (2015). These comparisons support the conclusion that particles sampled during penetration 1 were most likely pyrometeors composed of ash, an assertion bolstered by the argument that these particles originated from below the aircraft where above-freezing temperatures virtually eliminate ice particles as an explanation for their composition.
PyroCus were sampled during penetrations 2–6 at 7.3–7.7 km m.s.l. While there were some strong updrafts larger than 10 m s−1 at lower levels (Fig. 13d–f), updrafts at flight level (Fig. 14a–e) were weaker than those observed during penetration 1. Temperatures were colder, spanning a range of −26 to −21 ∘C, and relative humidity was generally larger, often exceeding 85 % and sometimes nearing saturation with respect to liquid (Fig. 14f–j). Measured values of cloud liquid water content (Fig. 14k–o) were also significantly larger than observed during penetration 1. Size distributions of number concentration in penetrations 2 and 4–6 (Fig. 5b, d–f) were characterized by considerably larger concentrations than penetration 1. Also, the size distributions in penetrations 2 and 4–6 exhibited bimodal structures, with a secondary a peak at 200–300 µm. This bimodal structure was not evident in penetration 1. Qualitative and quantitative analysis of particle shapes for penetrations 2 and 4–6 (Figs. 15, 8b, d–f, 10b, d–f) suggested a somewhat higher degree of circular symmetry compared to penetration 1. Particle composition in the pyroCu penetrations was more ambiguous than in the smoke–ash plume penetration where pyrometeors were likely present. Evidence was presented to suggest that hydrometeors in the form of ice particles were sampled in the pyroCu penetrations (Fig. 16). However, the joint existence of pyrometeors in the form of ash particles was not eliminated as a possibility, particularly for penetration 3, where the size and shape distributions were more like penetration 1 than the other pyroCu penetrations.
The in situ observations documented in this study contribute to our knowledge of wildfire-induced pyroconvection particles larger than smoke particulates and cloud droplets. These data could be used to validate and improve models that simulate wildfires and related pyroconvection. They also could be employed to advance the application of radar to study pyroconvection by relating particle size distributions to reflectivity values. However, the sample size is still relatively small. Additional in situ observations are needed across a broad spectrum of pyroconvective features from smoke–ash plumes to pyroCus to pyroCbs. These in situ observations should occur in concert with observations that can document vertical motions in the pyroconvection and fire characteristics at the surface, including fire radiative power. Obtaining such in situ observations is not a trivial matter given the highly turbulent nature of pyroconvection and safety concerns in operating aircraft in those environments. Efforts should be undertaken to identify and develop research aircraft that can meet those challenges, whether they are crewed or uncrewed.
The UWKA data used in this study are available at https://www.uwyo.edu/atsc/uwka/facility-data-requests.html (last access: August 2019, University of Wyoming, 2022). The KCBX radar data used in this study are available at https://www.ncdc.noaa.gov/nexradinv/chooseday.jsp?id=kcbx (last access: April 2017, NOAA, 2022).
DEK led the funding acquisition, developed the project methodology, created visualizations, and wrote the original draft. DEK and NPL shared in conceptualizing the study. DEK and JRF both contributed to formal data analysis. DEK, JRF, and NPL were all involved in data curation and editing the paper.
The contact author has declared that none of the authors has any competing interests.
Publisher’s note: Copernicus Publications remains neutral with regard to jurisdictional claims in published maps and institutional affiliations.
We acknowledge and are thankful for the efforts of staff at the University of Wyoming King Air Research Aircraft Facility in planning and executing the aircraft mission described in this study as well as processing the data that were collected. Adam Majewski of the University of Wyoming assisted in processing some of the optical array probe data from the flight. Craig B. Clements of San José State University was a vital collaborator in securing funding to support the aircraft mission. Discussions with Sandra E. Yuter of North Carolina State University assisted in the interpretation of KCBX polarimetric radar data.
This research has been supported by the National Science Foundation (grant no. AGS-1719243).
This paper was edited by Timothy Garrett and reviewed by two anonymous referees.
Abatzoglou, J. T. and Williams, A. P.: Impact of anthropogenic climate change on wildfire across western US forests, P. Natl. Acad. Sci. USA, 113, 11770–11775, https://doi.org/10.1073/pnas.1607171113, 2016.
American Meteorological Society: Pyrocumulus, Glossary of Meteorology, http://glossary.ametsoc.org/wiki/Pyrocumulus, last access: July 2022a.
American Meteorological Society: Pyrocumulonimbus, Glossary of Meteorology, http://glossary.ametsoc.org/wiki/Pyrocumulonimbus, last access: July 2022b.
Andreae, M. O., Rosenfeld, D., Artaxo, P., Costa, A. A., Frank, G. P., Longo, K. M., and Silva-Dias, M. A. F.: Smoking rain clouds over the Amazon, Science, 303, 1337–1342, https://doi.org/10.1126/science.1092779, 2004.
Ashe, B., McAneney, K. J., and Pitman, A. J.: Total cost of fire in Australia, J. Risk Res., 12, 121–136, https://doi.org/10.1080/13669870802648528, 2009.
Banta, R. M., Olivier, L. D., Holloway, E. T., Kropfli, R. A., Bartram, B. W., Cupp, R. E., and Post, M. J.: Smoke-column observations from two forest fires using Doppler lidar and Doppler radar, J. Appl. Meteorol., 31, 1328–1349, https://doi.org/10.1175/1520-0450(1992)031<1328:SCOFTF>2.0.CO;2, 1992.
Barbero, R., Abatzoglou, J. T., Larkin, N. K., Kolden, C. A., and Stocks, B.: Climate change presents increased potential for very large fires in the contiguous United States, Int. J. Wildland Fire, 24, 892–899, https://doi.org/10.1071/WF15083, 2015.
Baum, T. C., Thompson, L., and Ghorbani, K.: The nature of fire ash particles: Microwave material properties, dynamic behavior, and temperature correlation, IEEE J. Sel. Topics Appl. Earth Observ. Remote Sens., 8, 480–492, https://doi.org/10.1109/JSTARS.2014.2386394, 2015.
Baumgardner, D., Jonsson, H., Dawson, W., O'Connor, D., and Newton, R.: The cloud, aerosol, and precipitation spectrometer (CAPS): A new instrument for cloud investigations, Atmos. Res., 59–60, 251–264, https://doi.org/10.1016/S0169-8095(01)00119-3, 2001.
Brown, P. R. A. and Francis, P. N.: Improved measurements of the ice water content in cirrus using a total-water probe, J. Atmos. Ocean. Technol., 12, 410–414, https://doi.org/10.1175/1520-0426(1995)012<0410:IMOTIW>2.0.CO;2, 1995.
Clements, C. B., Lareau, N. P., Kingsmill, D. E., Bowers, C. L., Camacho, C. P., Bagley, R., and Davis, B.: RaDFIRE – The Rapid Deployments to Wildfires Experiment: Observations from the fire zone, B. Am. Meteorol. Soc., 99, 2539–2559, https://doi.org/10.1175/BAMS-D-17-0230.1, 2018.
Coen, J. L., Cameron, M., Michalakes, J., Patton, E. G., Riggan, P. J., and Yedinak, K. M.: WRF-fire: Coupled weather–wildland fire modeling with the weather research and forecasting model, J. Appl. Meteorol. Climatol., 52, 16–38, https://doi.org/10.1175/JAMC-D-12-023.1, 2013.
Dennison, P. E., Brewer, S. C., Arnold, J. D., and Moritz, M. A.: Large wildfire trends in the western United States, 1984–2011, Geophys. Res. Lett., 41, 2928–2933, https://doi.org/10.1002/2014GL059576, 2014.
El Houssami, M., Mueller, E., Thomas, J. C., Simeoni, A., Filkov, A., Skowronski, N., Gallagher, M. R., Clark, K., and Kremens, R.: Experimental procedures characterizing firebrand generation in wildland fires, Fire Technol., 52, 731–751, https://doi.org/10.1007/s10694-015-0492-z, 2016.
Field, P. R., Heymsfield, A. J., and Bansemer, A.: Shattering and particle interarrival times measured by optical array probes in ice clouds, J. Atmos. Ocean. Technol., 23, 1357–1371, https://doi.org/10.1175/JTECH1922.1, 2006.
Filkov, A., Prohanov, S., Mueller, E., Kasymov, D., Martynov, P., El Houssami, M., Thomas, J. Skowronski, N., Butler, B., Gallagher, M., Clark, K., Mell, W., Kremens, R., Hadden, R. M., and Simeoni, A.: Investigation of firebrand production during prescribed fires conducted in a pine forest, Proc. Combust. Inst., 36, 3263–3270, https://doi.org/10.1016/j.proci.2016.06.125, 2017.
Flannigan, M. D., Krawchuk, M. A., de Groot, W. J., Wotton, B. M., and Gowman, L. M.: Implications of changing climate for global wildland fire, Int. J. Wildland Fire, 18, 483–507, https://doi.org/10.1071/WF08187, 2009.
Fromm, M., Tupper, A., Rosenfeld, D., Servranckx, R., and McRae, R.: Violent pyro-convective storm devastates Australia's capital and pllutes the stratosphere, Geophys. Res. Lett., 33, L05815, https://doi.org/10.1029/2005GL025161, 2006.
Gerber, H., Arends, B., and Ackerman, A.: New microphysics sensor for aircraft use, Atmos. Res., 31, 235–252, https://doi.org/10.1016/0169-8095(94)90001-9, 1994.
Heymsfield, A. J. and Kajikawa, M.: An improved approach to calculating terminal velocities of plate-like crystals and graupel, J. Atmos. Sci., 44, 1088–1099, https://doi.org/10.1175/1520-0469(1987)044<1088:AIATCT>2.0.CO;2, 1987.
Heymsfield, A. J. and McFarquhar, G. M.: High albedos of cirrus in the tropical Pacific warm pool: Microphysical interpretations from CEPEX and from Kwajalein, Marshall Islands, J. Atmos. Sci., 53, 2424–2451, https://doi.org/10.1175/1520-0469(1996)053<2424:HAOCIT>2.0.CO;2, 1996.
Heymsfield, A. J. and Parrish, J. L.: A computational technique for increasing the effective sampling volume of the PMS two-dimensional particle size spectrometer, J. Appl. Meteor., 17, 1566–1572, https://doi.org/10.1175/1520-0450(1978)017<1566:ACTFIT>2.0.CO;2, 1978.
Heymsfield, A. J., Bansemer, A., Field, P. R., Durden, S. L., Stith, J. L., Dye, J. E., Hall, W., and Grainger, C. A.: Observations and parameterizations of particle size distributions in deep tropical cirrus and stratiform precipitating clouds: Results from in situ observations in TRMM field campaigns, J. Atmos. Sci., 59, 3457–3491, https://doi.org/10.1175/1520-0469(2002)059<3457:OAPOPS>2.0.CO;2, 2002.
Holroyd III., E. W.: Some techniques and uses of 2D-C habit classification software for snow particles, J. Atmos. Ocean. Technol., 4, 498–511, https://doi.org/10.1175/1520-0426(1987)004<0498:STAUOC>2.0.CO;2, 1987.
Ivić, I. R., Curtis, C., and Torres, S. M.: Radial-based noise power estimation for weather radars, J. Atmos. Ocean. Technol., 30, 2737–2753, https://doi.org/10.1175/JTECH-D-13-00008.1, 2013.
Jethva, H. and Torres, O.: Satellite-based evidence of wavelength-dependent aerosol absorption in biomass burning smoke inferred from Ozone Monitoring Instrument, Atmos. Chem. Phys., 11, 10541–10551, https://doi.org/10.5194/acp-11-10541-2011, 2011.
Johnston, F. H., Henderson, S. B., Chen Y., Randerson, J. T., Marlier, M., Defries, R. S., Kinney, P., Bowman, D. M., and Brauer, M.: Estimated global mortality attributable to smoke from landscape fires, Environ. Health Perspect., 120, 695–701, https://doi.org/10.1289/ehp.1104422, 2012.
Jones, B. A. and Berrens, R. P.: Application of an original wildfire smoke health cost benefits transfer protocol to the western US, 2005–2015, Environ. Manage., 60, 809–822, https://doi.org/10.1007/s00267-017-0930-4, 2017.
Jones, B. A., Thacher, J. A., Chermak, J. M., and Berrens, R. P.: Wildfire smoke health costs: a methods case study for a Southwestern US `mega-fire', J. Environ. Econ. Policy, 5, 181–199, https://doi.org/10.1080/21606544.2015.1070765, 2016.
Junghenn-Noyes, K. T., Kahn, R. A., Sedlacek, A., Kleinman, L., Limbacher, J. A., and Li, Z.: Wildfire smoke particle properties and evolution, from space-based multi-angle imaging, Remote Sens., 12, 769, https://doi.org/10.3390/rs12050769, 2020a.
Junghenn-Noyes, K. T., Kahn, R. A., Limbacher, J. A., Li, Z., Fenn, M. A., Giles, D. M., Hair, J. W., Katich, J. M., Moore, R. H., Robinson, C. E., Sanchez, K. J., Shingler, T. J., Thornhill, K. L., Wiggins, E. B., and Winstead, E. L.: Wildfire smoke particle properties and evolution, from space-based multi-angle imaging II: The Williams Flats Fire during the FIREX-AQ campaign, Remote Sens., 12, 3823, https://doi.org/10.3390/rs12223823, 2020b.
King, W. D., Parkin, D. A., and Handsworth, R. J.: A hot-wired liquid water device having fully calculable response characteristics, J. Appl. Meteor., 17, 1809–1813, https://doi.org/10.1175/1520-0450(1978)017<1809:AHWLWD>2.0.CO;2, 1978.
Kleinman, L. I., Sedlacek III, A. J., Adachi, K., Buseck, P. R., Collier, S., Dubey, M. K., Hodshire, A. L., Lewis, E., Onasch, T. B., Pierce, J. R., Shilling, J., Springston, S. R., Wang, J., Zhang, Q., Zhou, S., and Yokelson, R. J.: Rapid evolution of aerosol particles and their optical properties downwind of wildfires in the western US, Atmos. Chem. Phys., 20, 13319–13341, https://doi.org/10.5194/acp-20-13319-2020, 2020.
Knollenberg, R. G.: The optical array: An alternative to scattering or extinction for airborne particle size determination, J. Appl. Meteor., 9, 86–103, https://doi.org/10.1175/1520-0450(1970)009<0086:TOAAAT>2.0.CO;2, 1970.
Kochanski, A. K., Jenkins, M. A., Yedinak, K., Mandel, J., Beezley, J., and Lamb, B.: Toward an integrated system for fire, smoke and air quality simulations, Int. J. Wildland Fire, 25, 534–546, https://doi.org/10.1071/WF14074, 2016.
Konovalov, I. B., Beekmann, M., Berezin, E. V., Formenti, P., and Andreae, M. O.: Probing into the aging dynamics of biomass burning aerosol by using satellite measurements of aerosol optical depth and carbon monoxide, Atmos. Chem. Phys., 17, 4513–4537, https://doi.org/10.5194/acp-17-4513-2017, 2017.
Koo, E., Pagni, P. J., Weise, D. R., and Woycheese, J. P.: Firebrands and spotting ignition in large-scale fires, Int. J. Wildland Fire, 19, 810–843, https://doi.org/10.1071/WF07119, 2010.
Korolev, A. V., Strapp, J. W., Isaac, G. A., and Nevzorov, A. N.: The Nevzorov airborne hot-wire LWC–TWC probe: Principle of operation and performance characteristics, J. Atmos. Ocean. Technol., 15, 1495–1510, https://doi.org/10.1175/1520-0426(1998)015<0708:EOTAOP>2.0.CO;2, 1998.
Lakshmanan, V., Hondl, K., Potvin, C. K., and Preignitz, D.: An improved method for estimating radar echo-top height, Wea. Forecast., 28, 481–488, https://doi.org/10.1175/WAF-D-12-00084.1, 2013.
Lang, T. J., Rutledge, S. A., Dolan, B., Krehbiel, P., Rison, W., and Lindsey, D. T.: Lightning in wildfire smoke plumes observed in Colorado during summer 2012, Mon. Weather Rev., 142, 489–507, https://doi.org/10.1175/mwr-d-13-00184.1, 2014.
Lareau, N. P. and Clements, C. B.: Environmental controls on pyrocumulus and pyrocumulonimbus initiation and development, Atmos. Chem. Phys., 16, 4005–4022, https://doi.org/10.5194/acp-16-4005-2016, 2016.
Lareau, N. P., Nauslar, N. J., and Abatzoglou, J. T.: The Carr fire vortex: A case of pyrotornadogenesis? Geophys. Res. Lett., 45, 13107–13115, https://doi.org/10.1029/2018GL080667, 2018.
Lareau, N. P., Nauslar, N. J., Bentley, E., Roberts, M., Emmerson, S., Brong, B., Mehle, M., and Wallman, J.: Fire-generated tornadic vortices, B. Am. Meteorol. Soc., 103, E1296–E1320, https://doi.org/10.1175/BAMS-D-21-0199.1, 2022.
Lawson, R. P., O'Connor, D., Zmarzly, P., Weaver, K., Baker, B. A., Mo, Q., and Jonsson, H.: The 2D-S (stereo) probe: Design and preliminary tests of a new airborne, high-speed, high-resolution particle imaging probe, J. Atmos. Ocean. Technol., 23, 1462–1471, https://doi.org/10.1175/JTECH1927.1, 2006.
Manzello, S. L. and Foote, E. I. D.: Characterizing firebrand exposure from wildland-urban interface (WUI) fires: Results from the 2007 Angora fire, Fire Technol., 50, 105–124, https://doi.org/10.1007/s10694-012-0295-4, 2014.
Manzello, S. L., Maranghides, A., and Mell, W. E.: Firebrand generation from burning vegetation, Int. J. Wildland Fire, 16, 458–462, https://doi.org/10.1071/WF06079, 2007.
Manzello, S. L., Maranghides, A., Shields, J. R., Mell, W. E., Hayashi, Y., and Nii, D.: Mass and size distribution of firebrands generated from burning Korean pine (Pinus koraiensis) trees, Fire Mater., 33, 21–31, https://doi.org/10.1002/fam.977, 2009.
McCarthy, N., McGowan, H., Guyot, A., and Dowdy, A.: Mobile X-pol radar: A new tool for investigating pyroconvection and associated wildfire meteorology, B. Am. Meteorol. Soc., 99, 1177–1195, https://doi.org/10.1175/BAMS-D-16-0118.1, 2018.
McCarthy, N., Guyot, A., Dowdy, A., and McGowan, H.: Wildfire and weather radar: A review, J. Geophys. Res.-Atmos., 124, 266–286, https://doi.org/10.1029/2018JD029285, 2019a.
McCarthy, N. F., Guyot, A., Protat, A., Dowdy, A. J., and McGowan, H.: Tracking pyrometeors with meteorological radar using unsupervised machine learning, Geophys. Res. Lett., 46, https://doi.org/10.1029/2019GL084305, 2019b.
McFarquhar, G. M., Finlon, J. A., Stechman, D. M., Wu, W., Jackson, R. C., and Freer, M.: University of Illinois/Oklahoma Optical Array Probe (OAP) Processing Software, Version 3.2, https://doi.org/10.5281/ZENODO.1285969, 2018.
Melnikov, V. M. and Zrnić, D. S.: Autocorrelation and cross-correlation estimators of polarimetric variables, J. Atmos. Ocean. Technol., 24, 1337–1350, https://doi.org/10.1175/JTECH2054.1, 2007.
Melnikov, V. M., Zrnic, D. S., Rabin, R. M., and Zhang, P.: Radar polarimetric signatures of fire plumes in Oklahoma, Geophys. Res. Lett., 35, L14815, https://doi.org/10.1029/2008GL034311, 2008.
National Interagency Fire Center: Incident specific data, National Interagency Fire Center, ftp://ftp.wildfire.gov/public/incident_specific_data/great_basin/2016_Incidents/Pioneer/ (last access: 4 November 2021), 2016.
NOAA: Operational modes and volume coverage patterns. WSR-88D meteorological observations: Part C: WSR-88D products and algorithms, Federal Meteorological Handbook 11, FCM-H11C-2017, Office of the Federal Coordinator for Meteorological Services and Supporting Research, 5-1–5-24, https://www.icams-portal.gov/resources/ofcm/fmh/FMH11/fmh11partC.pdf (last access: July 2022), 2017.
NOAA: NEXRAD Inventory: Choose Day and Product, https://www.ncdc.noaa.gov/nexradinv/chooseday.jsp?id=kcbx, NOAA [data set], last access: April 2017, 2022.
O'Dell, K., Hornbrook, R. S., Permar, W., Levin, E. J. T., Garofalo, L. A., Apel, E. C., Blake, N. J., Jarnot, A., Pothier, M. A., Farmer, D. K., Hu, L., Campos, T., Ford, B., Pierce, J. R., and Fischer, E. V.: Hazardous air pollutants in fresh and aged western US wildfire smoke and implications for long-term exposure, Environ. Sci. Technol., 54, 11838–11847, https://doi.org/10.1021/acs.est.0c04497, 2020.
Parks, S. A. and Abatzoglou, J. T.: Warmer and drier fire seasons contribute to increases in area burned at high severity in western US forests from 1985 to 2017, Geophys. Res. Lett., 47, 10 pp., https://doi.org/10.1029/2020GL089858, 2020.
Peace, M., Mattner, T., Mills, G., Kepert, J., and McCaw, L.: Fire-modified meteorology in a coupled fire–atmosphere model, J. Appl. Meteorol. Climatol., 54, 704–720, https://doi.org/10.1175/JAMC-D-14-0063.1, 2015.
Peterson, D. A., Thapa, L. H., Saide, P. E., Soja, A. J., Gargulinski, E. M., Hyer, E. J., Weinzierl, B., Dollner, M., Schöberl, M., Papin, P. P., Kondragunta, S., Camacho, C. P., Ichoku, C., Moore, R. H., Hair, J. W., Crawford, J. H., Dennison, P. E., Kalashnikova, O. V., Bennese, C. E., Bui, T. P., DiGangi, J. P., Diskin, G. S., Fenn, M. A., Halliday, H. S., Jimenez, J., Nowak, J. B., Robinson, C., Sanchez, K., Shingler, T. J., Thornhill, L., Wiggins, E. B., Winstead, E., and Xu, C.: Measurements from inside a thunderstorm driven by wildfire: The 2019 FIREX-AQ field experiment, B. Am. Meteorol. Soc., https://doi.org/10.1175/BAMS-D-21-0049.1, 2022.
Radke, L. F., Stith, J. L., Hegg, D. A., and Hobbs, P. V.: Airborne studies of particles and gases from forest fires, J. Air Pollut. Control Assoc., 28, 30-34, https://doi.org/10.1080/00022470.1978.10470566, 1978.
Radke, L. F., Hegg, D. A., Hobbs, P. V., Nance, J. D., Lyons, J. H., Laursen, K. K., Weiss, R. E., Riggan, P. J., and Ward, D. E.: Particulate and trace gas emissions from large biomass fires in North America, in: Global Biomass Burning: Atmospheric, Climatic, and Biospheric Implications, edited by: Levine, J. S., MIT Press, Cambridge, Massachusetts, 209–224, ISBN 9780262121590, 1991.
Reid, J. S., Koppmann, R., Eck, T. F., and Eleuterio, D. P.: A review of biomass burning emissions part II: intensive physical properties of biomass burning particles, Atmos. Chem. Phys., 5, 799–825, https://doi.org/10.5194/acp-5-799-2005, 2005.
Rodriguez, B., Lareau, N. P., Kingsmill, D. E., and Clements, C. B.: Extreme pyroconvective updrafts during a megafire, Geophys. Res. Lett., 47, e2020GL089001, https://doi.org/10.1029/2020GL089001, 2020.
Rosenfeld, D.: TRMM observed first direct evidence of smoke from forest fires inhibiting rainfall, Geophys. Res. Lett., 26, 3105–3108, https://doi.org/10.1029/1999GL006066, 1999.
Rosenfeld, D. and Lensky, I. M.: Satellite-based insights into precipitation formation processes in continental and maritime convective clouds, B. Am. Meteor. Soc., 79, 2457–2476, https://doi.org/10.1175/1520-0477(1998)079<2457:SBIIPF>2.0.CO;2, 1998.
Rosenfeld, D., Fromm, M., Trentmann, J., Luderer, G., Andreae, M. O., and Servranckx, R.: The Chisholm firestorm: observed microstructure, precipitation and lightning activity of a pyro-cumulonimbus, Atmos. Chem. Phys., 7, 645–659, https://doi.org/10.5194/acp-7-645-2007, 2007.
Schwarzenboeck, A., Mioche, G., Armetta, A., Herber, A., and Gayet, J.-F.: Response of the Nevzorov hot wire probe in clouds dominated by droplet conditions in the drizzle size range, Atmos. Meas. Tech., 2, 779–788, https://doi.org/10.5194/amt-2-779-2009, 2009.
Thelen, B., French, N. H., Koziol, B. W., Billmire, M., Owen, R. C., Johnson, J., Ginsberg, M., Loboda, T., and Wu, S.: Modeling acute respiratory illness during the 2007 San Diego wildland fires using a coupled emissions-transport system and generalized additive modeling, Environ. Health, 12, 94–115, https://doi.org/10.1186/1476-069X-12-94, 2013.
Thomas, J. C., Mueller, E. V., Santamaria, S., Gallagher, M., El Houssami, M., Filkov, A., Clark, K., Skowronski, N., Hadden, R. M., Mell, W., and Simeoni, A.: Investigation of firebrand generation from an experimental fire: Development of a reliable data collection methodology, Fire Saf. J., 91, 864–871, https://doi.org/10.1016/j.firesaf.2017.04.002, 2017.
Toivanen, J., Engel, C. B., Reeder, M. J., Lane, T. P., Davies, L., Webster, S., and Wales, S.: Coupled atmosphere-fire simulations of the Black Saturday Kilmore East wildfires with the unified model, J. Adv. Model. Earth Syst., 11, 210–230, https://doi.org/10.1029/2017MS001245, 2019.
University of Wyoming: King Air Research Aircraft, PRojects and data requests, University of Wyoming [data set], https://www.uwyo.edu/atsc/uwka/facility-data-requests.html, last access: August 2019.
Wang, D., Guan, D., Zhu, S., Mac Kinnon, M., Geng, G., Zhang, Q., Zheng, H., Lei, T., Shao, S. Gong, P., and Davis, S. J.: Economic footprint of California wildfires in 2018, Nat. Sustain., 4, 252–260, https://doi.org/10.1038/s41893-020-00646-7, 2021.
Wang, Z., French, J., Vali, G., Wechsler, P., Haimov, S., Rodi, A., Deng, M., Leon, D., Snider, J., Peng, L., and Pazmany, A. L.: Single aircraft integration of remote sensing and in situ sampling for the study of cloud microphysics and dynamics, B. Am. Meteorol. Soc., 93, 653–668, https://doi.org/10.1175/BAMS-D-11-00044.1, 2012.
Westerling, A. L.: Increasing western US forest wildfire activity: sensitivity to changes in the timing of spring, Phil. Trans. R. Soc. B, 371, 20150178, https://doi.org/10.1098/rstb.2015.0178, 2016.
Westerling, A. L., Hidalgo, H. G., Cayan, D. R., and Swetnam, T. W.: Warming and earlier spring increase western U.S. forest wildfire activity, Science, 313, 940–943, https://doi.org/10.1126/science.1128834, 2006.
Williams, F. A.: Urban and wildland fire phenomenology, Prog. Energy Combust. Sci., 8, 317–354, https://doi.org/10.1016/0360-1285(82)90004-1, 1982.
Xu, R., Yu, P., Abramson, M. J., Johnston, F. H., Samet, J. M., Bell, M. L., Haines, A., Ebi, K. L., Li, S., and Guo, Y.: Wildfires, global climate change, and human health, N. Engl. J. Med., 383, 2173–2181, https://doi.org/10.1056/NEJMsr2028985, 2020.
Yue, X., Mickley, L. J., Logan, J. A., and Kaplan, J. O.: Ensemble projections of wildfire activity and carbonaceous aerosol concentrations over the western United States in the mid-21st century, Atmospheric. Environ., 77, 767–780, https://doi.org/10.1016/j.atmosenv.2013.06.003, 2013.
Zrnic, D., Zhang, P., Melnikov, V., and Mirkovic, D.: Of fire and smoke plumes, polarimetric radar characteristics, Atmosphere, 11, 363, https://doi.org/10.3390/atmos11040363, 2020.