the Creative Commons Attribution 4.0 License.
the Creative Commons Attribution 4.0 License.
 | 04 Aug 2022
PM10 variation, composition, and source analysis in Tuscany (Italy) following the COVID-19 lockdown restrictions
Fabio Giardi
Silvia Nava
Giulia Calzolai
Giulia Pazzi
Massimo Chiari
Andrea Faggi
Bianca Patrizia Andreini
Chiara Collaveri
Elena Franchi
Guido Nincheri
Alessandra Amore
Silvia Becagli
Mirko Severi
Rita Traversi
Franco Lucarelli
To control the spread of COVID-19, exceptional restrictive measures were taken in March 2020 that imposed a radical change on the lifestyle of millions of citizens around the world, albeit for a short period. The national lockdown, which lasted from 10 March to 18 May 2020 in Italy, was a unique opportunity to observe the variation in air quality in urban environments under conditions comprising almost total traffic restriction and a strong reduction in work activities. In this paper, the data from 17 urban monitoring sites in Tuscany are presented, and the PM and NO2 concentrations in the 2 months before the start of the lockdown and the 2 months after lockdown are compared with the corresponding months of the previous 3 years. The results show that the total loads of PM2.5 and PM10 (particulate matter with an aerodynamic diameter smaller than 2.5 and 10 µm, respectively) decreased, but they did not exhibit significant changes compared to previous years, whereas NO2 underwent a drastic reduction. For three of these sites, the chemical composition of the collected samples was measured using thermal–optical techniques, ion chromatography, and particle-induced X-ray emission analysis, and the application of multivariate positive matrix factorization analysis also allowed for PM10 source identification and apportionment. Using these analyses, it was possible to explain the low sensitivity of PM10 to the lockdown effects as being due to different, sometimes inverse, behaviors of the different sources that contribute to PM. The results clearly indicate a decline in pollution levels related to urban traffic and an increase in the concentration of sulfate for all sites during the lockdown period.
- Article
(2383 KB) - Full-text XML
- BibTeX
- EndNote


Starting in the city of Wuhan (the capital of Hubei Province in China) in early 2020, the SARS-CoV-2 virus quickly spread around the world and was declared a pandemic by the World Health Organization (WHO, 2021). The spread of the virus forced many countries to impose severe restrictions on their population, including temporary suspensions on travel, nonessential activities, and social gatherings, in order to minimize physical contact between people and, thus, the spread of the acute respiratory disease (COVID-19) caused by the virus. A few weeks after Italy's first confirmed case of SARS-CoV-2 (30 January), it became one of the first countries to be heavily affected by the spread of COVID-19. Thus, the Italian government, following the example of the city of Wuhan, intervened in order to avoid overloading the national health system and to protect the health of the entire population, especially the most vulnerable people. Initially, after the rapid increase in the cases of infection, admissions to intensive care, and deaths in many provinces in northern Italy (mainly in the Lombardy region), areas were quarantined; this meant that it was not possible to enter or exit the affected regions, and travel restrictions, school closures, and the closure of nonessential businesses were implemented. As the health situation also worsened in the rest of the country, a national lockdown was proclaimed on 10 March 2020 (DPCM, 2021), and the restrictions imposed on the most affected areas were extended to the whole country, including a ban on gathering both outdoors and indoors. During the lockdown, which lasted until 3 May 2020, travel was only permitted for necessary activities, including health reasons, grocery shopping, and proven work needs. Therefore, the abovementioned restrictions on the population drastically reduced numerous anthropogenic activities which, especially in inhabited centers, are a source of both gaseous and particulate air pollution.
Besides the desired result of containing the pandemic by lowering the infection curve (Signorelli et al., 2020), the restriction measures implemented during the lockdown may have provided other benefits, albeit temporary, to the health of the population in all of the affected cities around the world that adopted a lockdown policy. In fact, the result was a period with the almost total absence of traffic both outside and inside of the urban centers as well as the reduction of many industrial activities. This represents an extreme (almost non-replicable) case in which at least one of the main sources of urban pollution is drastically reduced. This precious window has allowed us to study how the pollutants that are typically used to define air quality respond to a quick decline in anthropogenic emissions over a period of weeks, and it has also offered a valuable and unprecedented opportunity to assess how a significant abatement of road traffic impacted urban air quality.
Recently, many studies have focused on the consequences of the lockdown on the air quality in many cities worldwide. Most of these investigations have concerned large cities where vehicular traffic is one of the main sources of air pollution, and their results have involved the pollution indicators monitored by environmental regulatory agencies. In most cases, ambient PM10 (particulate matter with an aerodynamic diameter smaller than 10 µm), PM2.5 (particulate matter with an aerodynamic diameter smaller than 2.5 µm), NO2, SO2, and CO concentrations decreased significantly during the COVID-19 lockdown, either compared against the pre-lockdown period (Collivignarelli et al., 2020; Selvam et al., 2020; Chu et al., 2021; Connerton et al., 2020) or against the same period in previous years (Sharma et al., 2020; Jain and Sharma, 2020; Kerimray et al., 2020; Gualtieri et al., 2020). In all of these scenarios, ozone displayed an inverse trend – a slight increase in concentration – although cases have been reported in which its increase was much more pronounced (Lian et al., 2020; Hasim et al., 2021). These studies document that there have been improvements on a metropolitan or regional scale, but there have also been cases in which the inverse was observed, such as an increase in some of these pollutants (Mor et al., 2021; Broomandi et al., 2020) or the lack of a decrease in ozone (Singh et al., 2020).
The large variation in these short-term findings can be ascribed to factors not related to COVID-19, such as meteorology and fluctuations in other regional emissions. In particular, meteorology may play an important role in the observed changes, significantly influencing the atmospheric concentrations of the substances present in the atmosphere (Y. Zhao et al., 2020). In the Northern Hemisphere, for example, starting in March, with the arrival of spring, the air quality improves, mainly due to the enhanced dispersion capabilities of the atmosphere (e.g., the greater height of the mixing layer), except for the pollutants produced by photochemical reaction, like sulfates and ozone, which show increased concentrations in the warm months (Gerasopoulos et al., 2006). This indicates that the generation of secondary pollutants is not only affected by emission reductions but is also influenced by multiple factors that make the many studied cases hardly comparable. For this reason, the impact of the traffic reduction on air quality is highly variable among different cities depending on the meteorological conditions (Xiang et al., 2020; Wang et al., 2020).
Furthermore, the increase in ozone highlights the essential role that secondary reactions play in the formation of fine particles. This is especially true in large urban centers because human health is more damaged by the presence of fine and secondary particles, which have been estimated to be responsible for over 8 million premature deaths per year (Burnett et al., 2018). The observed increase in ozone is closely related to the change in emissions that occurred in the cities. Due to their short lifetime in the atmosphere, nitrogen oxides (namely NO and NO2), linked to traffic as a by-product of combustion, decrease until they are no longer able to neutralize the formation of ozone which, without its main removal mechanism and a comparable reduction in the emissions of volatile organic compounds, start to accumulate in the atmosphere. This effect, known as the “weekend effect” (Sicard et al., 2020a; Schipa et al., 2009; Blanchard et al., 2008), is observable in large cities on weekends due to the drastic drop in vehicular traffic compared with weekdays; however, during the COVID lockdown period, the increase in the ozone levels was much more pronounced than the weekend effect (Sicard et al., 2020b). The consequence of this was an increased oxidative capacity of the atmosphere due to the large presence of ozone, which can lead to the formation of a large amount of secondary PM2.5 and, therefore, to greater health risks.
As many studies of air quality changes during the pandemic are based on networks of regulatory monitors, analyses of the chemical composition of particulate matter during the same period are still missing or are sparse, as they are not mandatory (Hicks et al., 2021; Wang et al., 2021a). Only a few studies have estimated that variations occurred in the composition of the PM due to the source apportionment obtained from receptor models (Dai et al., 2020; Zheng et al., 2020; Wang et al., 2021b).
Therefore, in this work, the comparison of the main monitored pollutants between 2020 and previous years was combined with the chemical analysis of the particulate matter in order to understand what changes in air quality occurred during the COVID-19 lockdown period and to elucidate the temporal variations in the main local sources in a metropolitan area where traffic is a predominant source of local air pollution. The comparison between a period of regular anthropogenic emissions and one in which some of these have been highly reduced or almost completely removed can help to better distinguish the sources that contribute most to air pollution in cities and to investigate the impact that changes in primary pollutant emissions have on secondary chemical reactions. Such analyses can also be useful in view of possible future policy interventions aimed at reducing the load of particulate matter in urban centers.
2.1 Sampling
PM10 daily mass concentrations before and after the national lockdown were studied in three areas and one settlement in Tuscany between 1 January and 30 April 2020. Several sampling sites were selected in each area, resulting in the selection of a total of 17 air quality monitoring stations in the Tuscany air quality monitoring network managed by the Environmental Protection Agency of Tuscany. The sites and areas are shown in Table 1 and Fig. 1.

Table 2Sampling periods of the subset samples used for PM10 chemical speciation.


Figure 1The locations of the 17 sampling sites divided into the four metropolitan areas.
PM10 daily mass concentrations were obtained at each sampling site using mass analyzers (FAI SWAM-DC and FAI SWAM 5a monitor, FAI Instruments, Italy) and applying the UNI EN 16450 method for ambient air measurement with an automated continuous measurement system (AMS), based on the use of β-ray attenuation, whereas PM2.5 concentrations were measured for eight sites using the same method.
At 3 of the previously mentioned 17 sampling sites (namely FI-3, FI-1, and PO-2), aerosol samples were collected on quartz-fiber filters (applying the UNI 12341 method) on a daily basis (from midnight to midnight) using low-volume (2.3 m3 h−1) samplers (HYDRA dual channel sampler, FAI Instruments, Italy); the same filters were then analyzed to obtain the chemical composition.
A total of 112 samples were collected in the period before the national lockdown (BL, i.e., before 9 March 2020) and in the period during the lockdown (DL). The observation periods are shown in Table 2; it should be noted that the 28 and 29 March are always excluded from these periods due to a very intense dust transport event from the Caspian Sea, which would lead to incorrect interpretations of the seasonal averages and source identification because it is not representative of the typical values of that period.
2.2 Chemical analysis
In order to perform two different chemical analysis techniques, the filters were cut in three parts. One was analyzed by ion chromatography (IC; Metrohm 930 Compact IC Flex) after extraction in ultrapure Milli-Q water in an ultrasonic bath of the soluble component to quantify inorganic cations (Na+, K+, Mg2+, Ca2+, ) and inorganic anions (Cl−, , ), applying the UNI EN 16913 method. The quantification limits considered were calculated from the study of blank filters, and the results are as follows: Cl−, 0.55 µg m−3; , 0.157 µg m−3; , 0.181 µg m−3; , 0.025 µg m−3; Na+ 3.8, µg m−3; K+, 0.091 µg m−3; Mg2+, 0.32 µg m−3; and Ca2+, 0.74 µg m−3.
The second part of the filter was analyzed by particle-induced X-ray emission (PIXE) which allowed the measurement of the concentrations of all of the elements with an atomic number Z>16. The analyses were carried out with the 3 MV Tandetron accelerator at the LABEC (LAboratorio di tecniche nucleari per i BEni Culturali) laboratory in Florence with the external setup described in Lucarelli et al. (2018, 2014), Chiari et al. (2021), and Calzolai et al. (2006). Using suitable membranes, like Teflon or Nuclepore filters, and advanced setups, this technique allows the analysis of elements with Z>10; however, as the particulate matter in this work was collected on quartz-fiber filters, the high Si content of these substrata prevented the detection of elements from Na to P. Each sample was irradiated with a 3.0 MeV proton beam (10–150 nA intensity) for 90 s. The beam was collimated to about 2 mm2, and filter scanning was carried out to analyze most of the deposit area. Elemental concentrations were obtained using a calibration curve from a set of thin standards. Measurement accuracy was tested using a NIST RM 8785 (National Institute of Standards and Technology, USA) standard. The minimum detection limits (MDLs) were of the order of few nanograms per cubic meter for the low-Z elements, down to a minimum value of 0.2 ng m−3 for Cu–Zn. The total uncertainties for elemental concentrations were determined by the sum of independent uncertainties on certified thicknesses of the standards (5 %), deposition area (2 %), airflow (2 %), and X-ray counting statistics (2 %–20 %). The uncertainties increase when concentrations approach the minimum detectable limits (MDLs).
The third part of the filter was used to analyze the carbonaceous components of the particulate matter. Total carbon, organic carbon, and elemental carbon (TC, OC, and EC, respectively) were analyzed by thermal–optical transmittance (TOT) analysis, using a Sunset Laboratory analyzer implementing a protocol similar to that of the National Institute for Occupational Safety and Health (NIOSH; reference method CEN/TC 264; Giannoni et al., 2016). Detection limits were 200 ng m−3, and uncertainties were 5 %–10 % for OC and TC and 10 %–20 % for EC.
2.3 Receptor model
The concentration data obtained by the chemical analysis were employed to perform a source apportionment study using the positive matrix factorization (PMF) method. Briefly, PMF is a multivariate receptor modeling technique based on a weighted least squares fit approach (Paatero and Tapper, 1994) that uses non-negativity constraints and weighs data values with realistic error estimates. The model uses the following equation:
where n is the number of samples; m is the measured chemical species; p represents the factors; X is the matrix of the known concentrations of the species; G and F are matrices to be determined and represent the contributions and the composition of the factors, respectively; and E is the residual matrix, which is the difference between the real concentrations and those reconstructed by the model. The preparation of the input data and their uncertainties followed the guidelines suggested by Polissar et al. (1998). The model was applied to the whole dataset of the three sampling sites combined in order to increase the statistical significance of the analysis. The final analysis was carried out using the EPA PMF 5.0 software. Results for a varying number of factors were examined and, in order to find the most realistic solution, many parameters were observed, such as Q values (the values of the function minimized by the model), the residual distribution, the physical meaning of the factors (looking at the chemical profile and contributions), G-space plots, and bootstrap and displacement analysis.
Data analysis and visualization were carried out using R language (R Core Team, 2021).
3.1 Changes in PM concentration
The PM10 concentration values at the stations covered by this study were evaluated with respect to the reference territorial context of the surroundings, three homogeneous areas of Tuscany (the plain of Lucca, Prato and Pistoia, and the coast) and an agglomeration (Florence). The data of each station were compared with the data of the stations present in the same homogeneous area.
The concentrations of PM10 in March and April 2020, when the COVID-19 restrictions were applied, were assessed against the monthly mean values of the previous years, 2017–2019. The mean value of the 3-year period from 2017 to 2019 was taken as a reference. To verify the stationarity of the means with respect to this period, the months of January and February, not subject to the restrictions, are also taken into consideration.

Figure 2Plain of Lucca area: PM10 (a) absolute variation and (b) percentage variation between monthly means of 2020 and 2017–2019.
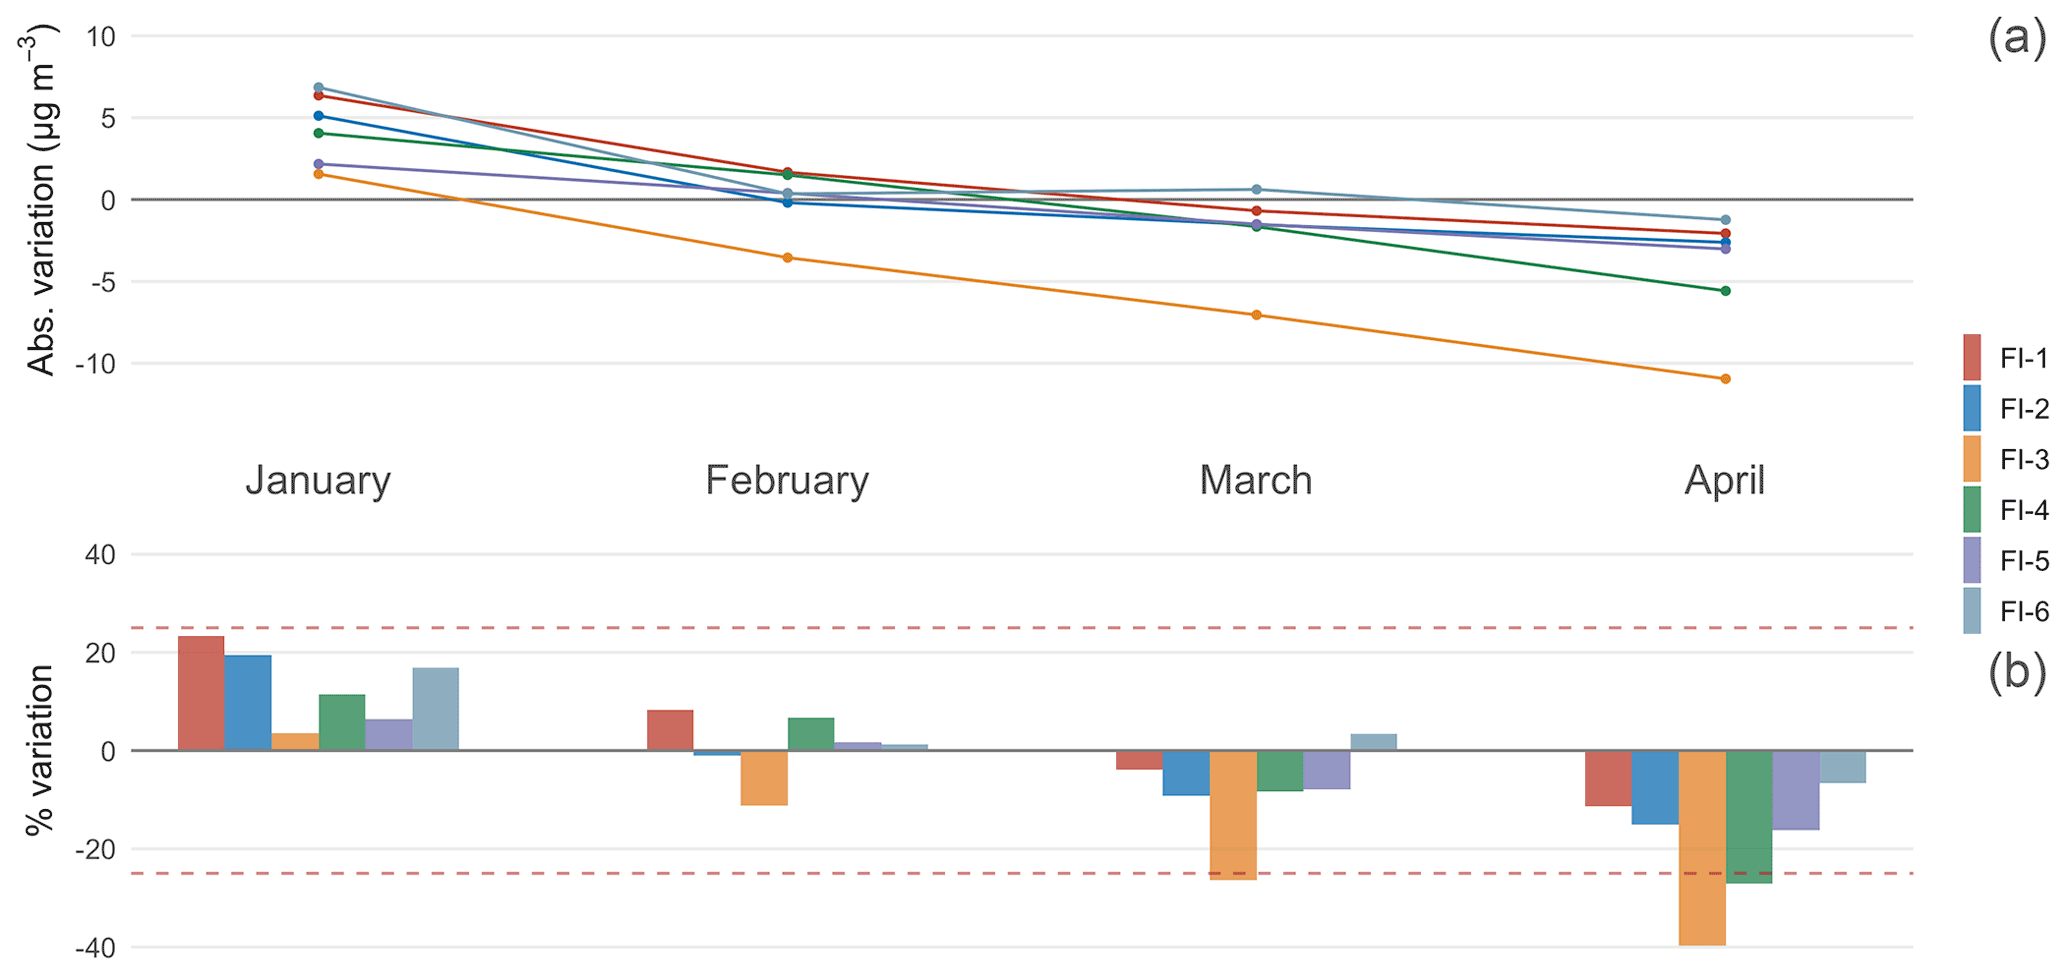
Figure 3Florentine agglomeration: PM10 (a) absolute variation and (b) percentage variation between monthly means of 2020 and 2017–2019.

Figure 4Prato–Pistoia area: PM10 (a) absolute variation and (b) percentage variation between monthly means of 2020 and 2017–2019.
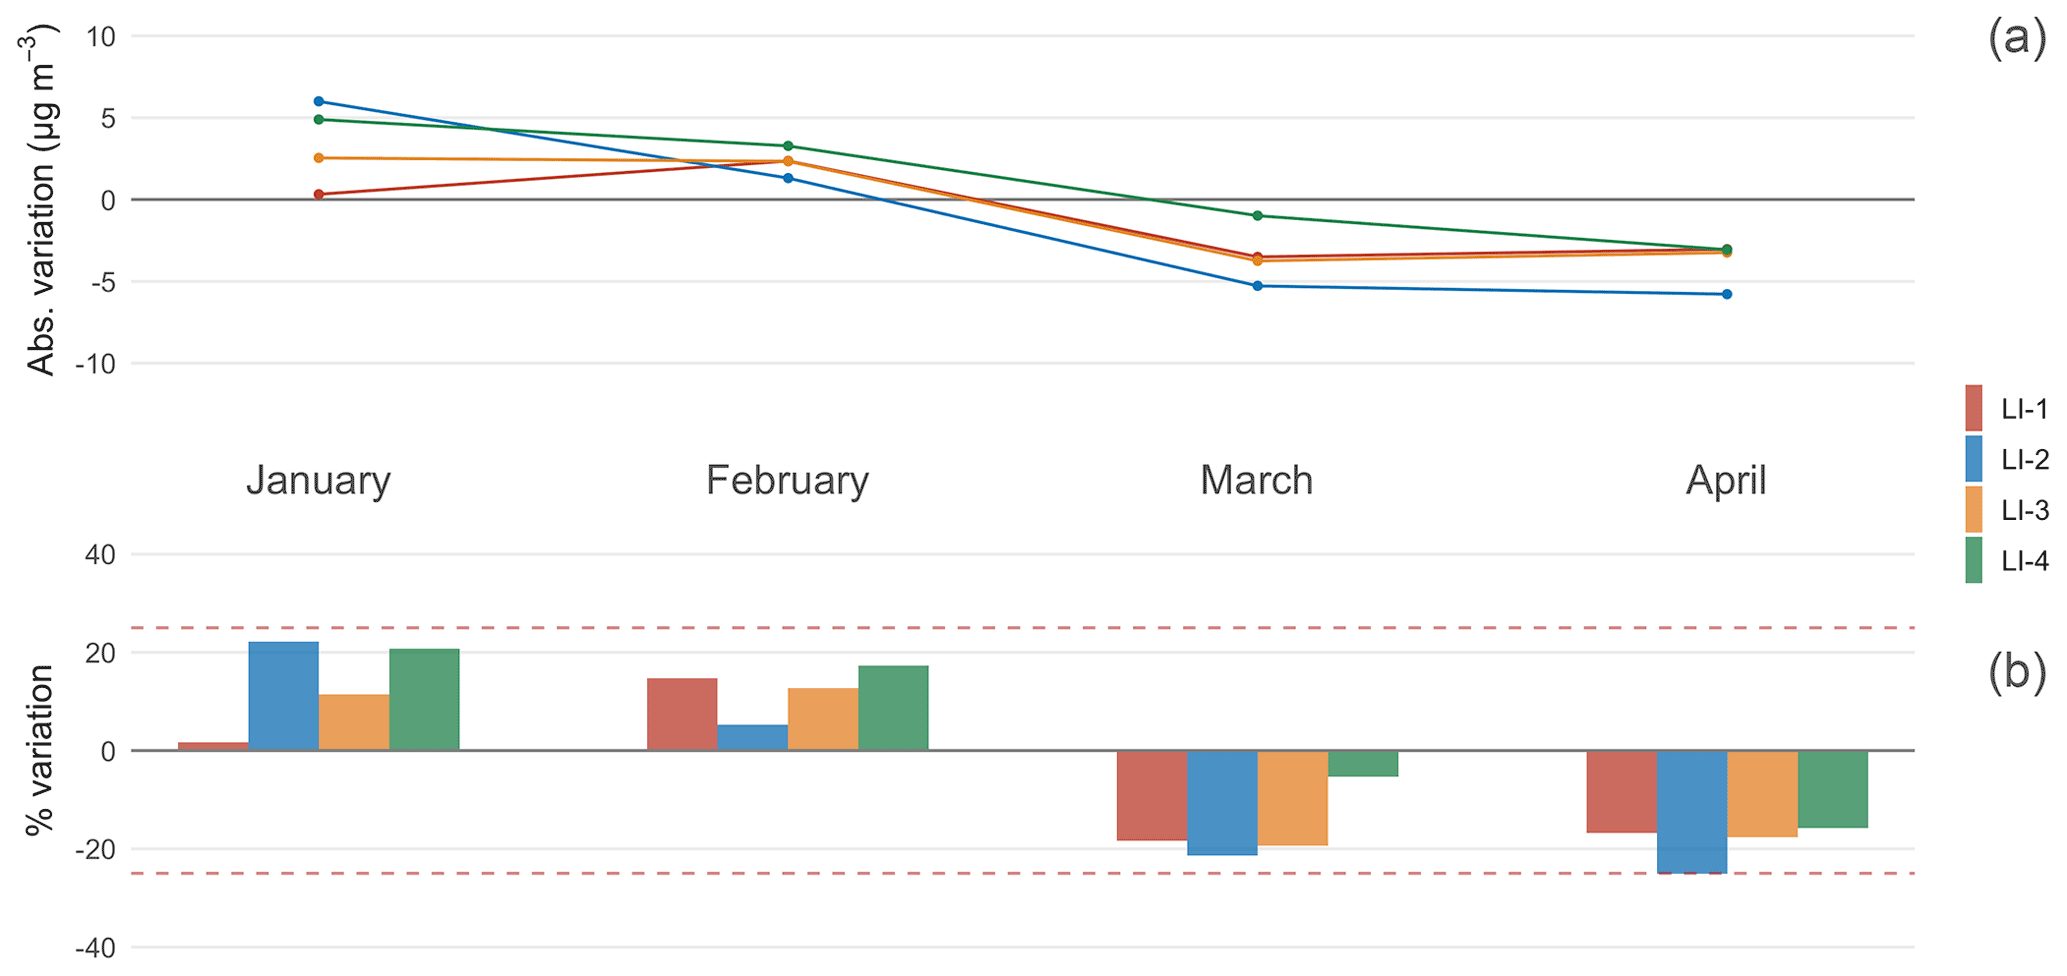
Figure 5Livorno and coastal area: PM10 (a) absolute variation and (b) percentage variation between monthly means of 2020 and 2017–2019.
Figures 2–5 show both the monthly variation percentages and the absolute differences (in µg m−3) for PM10 detected at the stations in each area or agglomeration. A variation is considered significant if it exceeds 25 %; therefore, the range from −25 % to +25 % is delimited by red dotted lines that refer only to percentage values.
3.1.1 LU stations
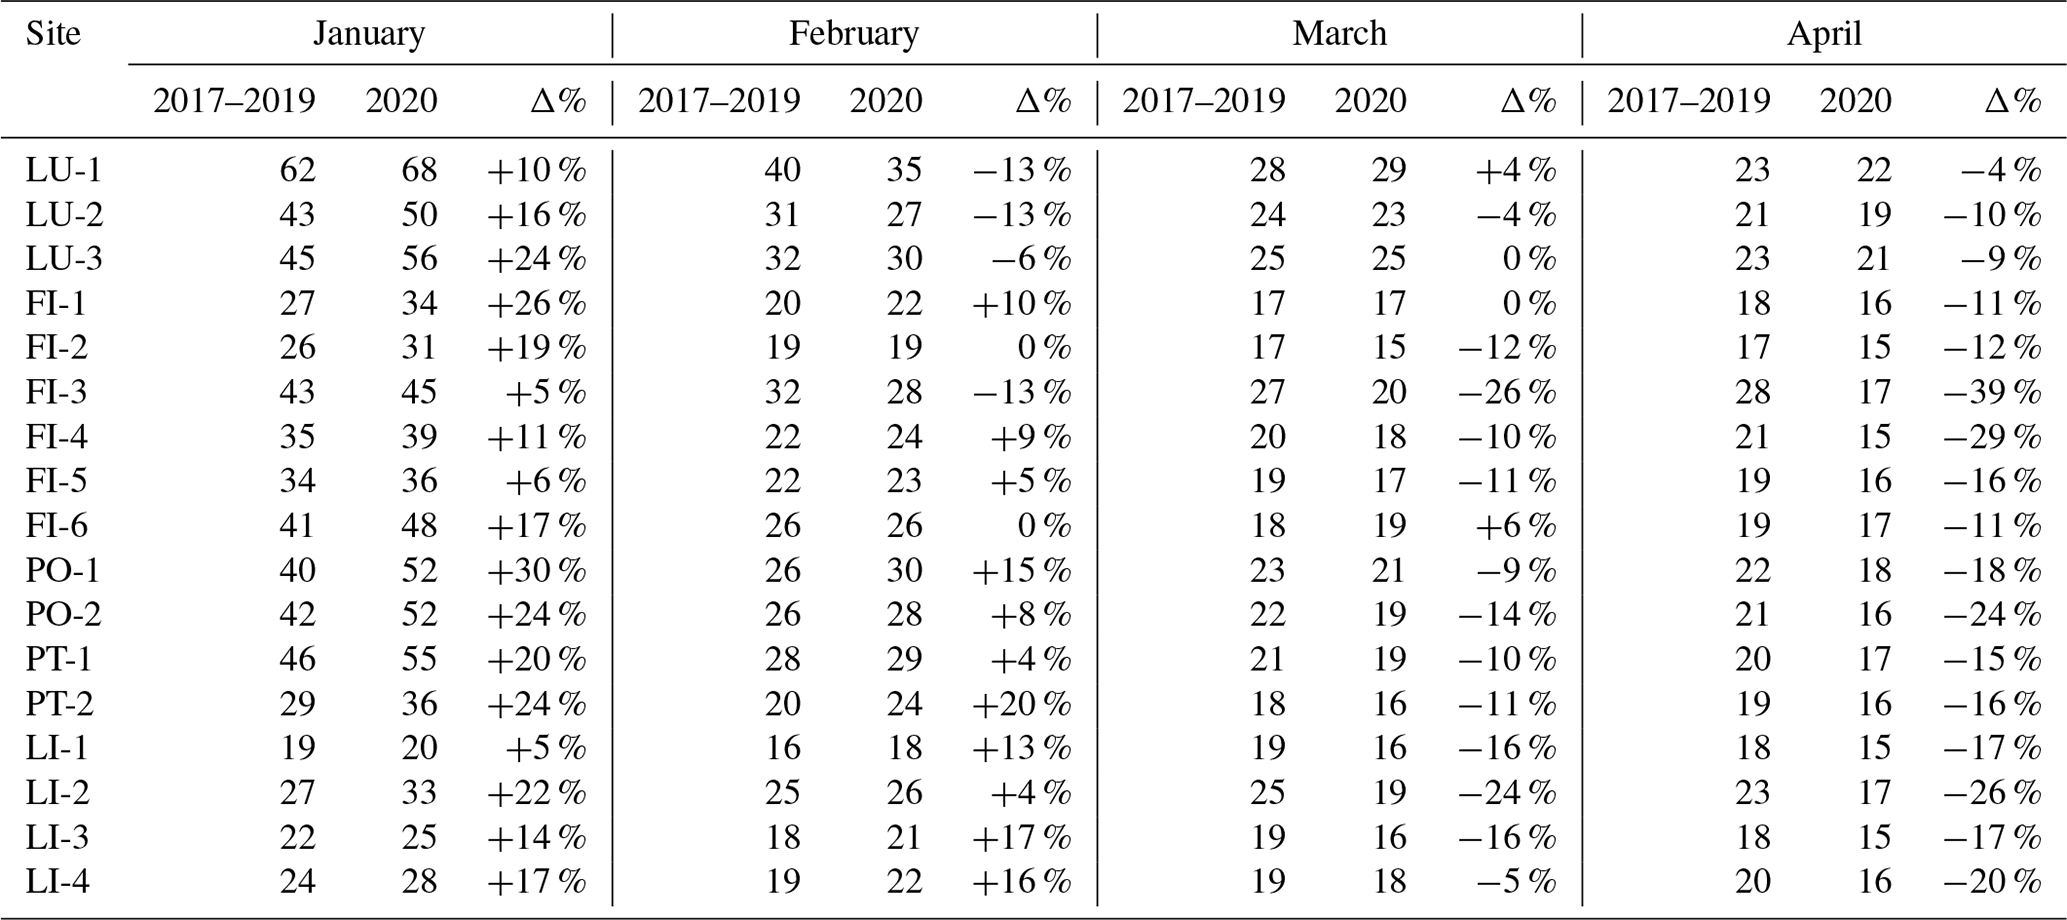
In the homogeneous plain of Lucca area, PM10 monitoring is carried out at the LU-1 and LU-2 stations (both urban background) and the LU-3 station (urban traffic). In this area, the PM values are homogeneous and high in the winter season. The annual means are lower than the limit set by the regulations (40 µg m−3), but the annual number of exceedances of the daily mean is larger than the limit value of 35, especially at the LU-1 station. Figure 2 shows general consistency in the monthly means of PM10 with respect to the value of the 3-year period, with the greatest positive changes in January. In the other months, the monthly means vary with respect to the 3-year period by a few micrograms per cubic meter (Table 3), and the percentage variations are less than 25 %.
Table 3PM10 monthly mean concentrations (µg m−3) for 2017–2019 and 2020 as well as the percentage variation (Δ%).
3.1.2 FI stations
There are six PM10 measurement stations in the agglomeration of Florence: two urban traffic (FI-4 and FI-3) and four urban backgrounds (FI-1, FI-2, FI-5, and FI-6).
The values recorded in January 2020 (Table 3, Fig. 3) are higher than the previous 3-year mean; however, the percentage variations, except for FI-1 (+26 %), are contained within 25 %, even if they have a positive sign at all of the stations, and the maximum absolute variation is around 6 µg m−3 for the FI-6 and FI-1 stations. In February, the monthly means of 2020 are consistent with the previous 3-year period, and the most significant variation is found at FI-3 which has a mean lower than that of the 3-year period (just over 3 µg m−3) and a percentage variation of −11 %. In March and April, the decrease at the FI-3 station is greater than 25 %: monthly means decrease from 27 to 20 µg m−3 in March and from 28 to 17 µg m−3 in April. The March and April values of the FI-3 station are similar to the values at the background stations for the same period. The other stations did not show significant changes in March, whereas a generalized decrease in values can be observed in April; however, variations over 25 % were only observed at the FI-4 and FI-3 urban traffic stations for this month.
3.1.3 PO stations
In the Prato–Pistoia area, there are four reference stations for the measurement of PM10: two in Prato (urban background, PO-2, and urban traffic, PO-1) and two in Pistoia (both urban background). In this region, the variations in the monthly means from January to April have a very clear and consistent trend among all of the stations: January and, to a lesser extent, February are characterized by monthly means higher than those of the previous 3-year period, whereas March and April show lower monthly means. The variations are generally contained within 25 % (with the sole exception of PO-1 in January), and the most significant reduction is observed at the PO-2 station in April which varies from a mean of 21 µg m−3 in 2017–2019 to a mean of 16 µg m−3 in 2020 (Table 3, Fig. 4).
3.1.4 LI stations
In the coastal area of Livorno there are four reference stations (LI-1 to LI-4). This region shows limited increases in the PM10 monthly mean compared to the previous 3 years in January and February as well as limited reductions in March and April. The only station that at least partially reflects the decline in anthropogenic activities in the months of March and April is the LI-2 urban traffic station, which shows a reduction of close to 25 % in the 2 months. The monthly means of PM10 at the LI-2 station for 2020 are similar to those of LI-1 and LI-3 (the urban background stations of the city) in the 3-year period from 2017 to 2019 (Table 3, Fig. 5).
3.1.5 PM2.5 throughout the regional network
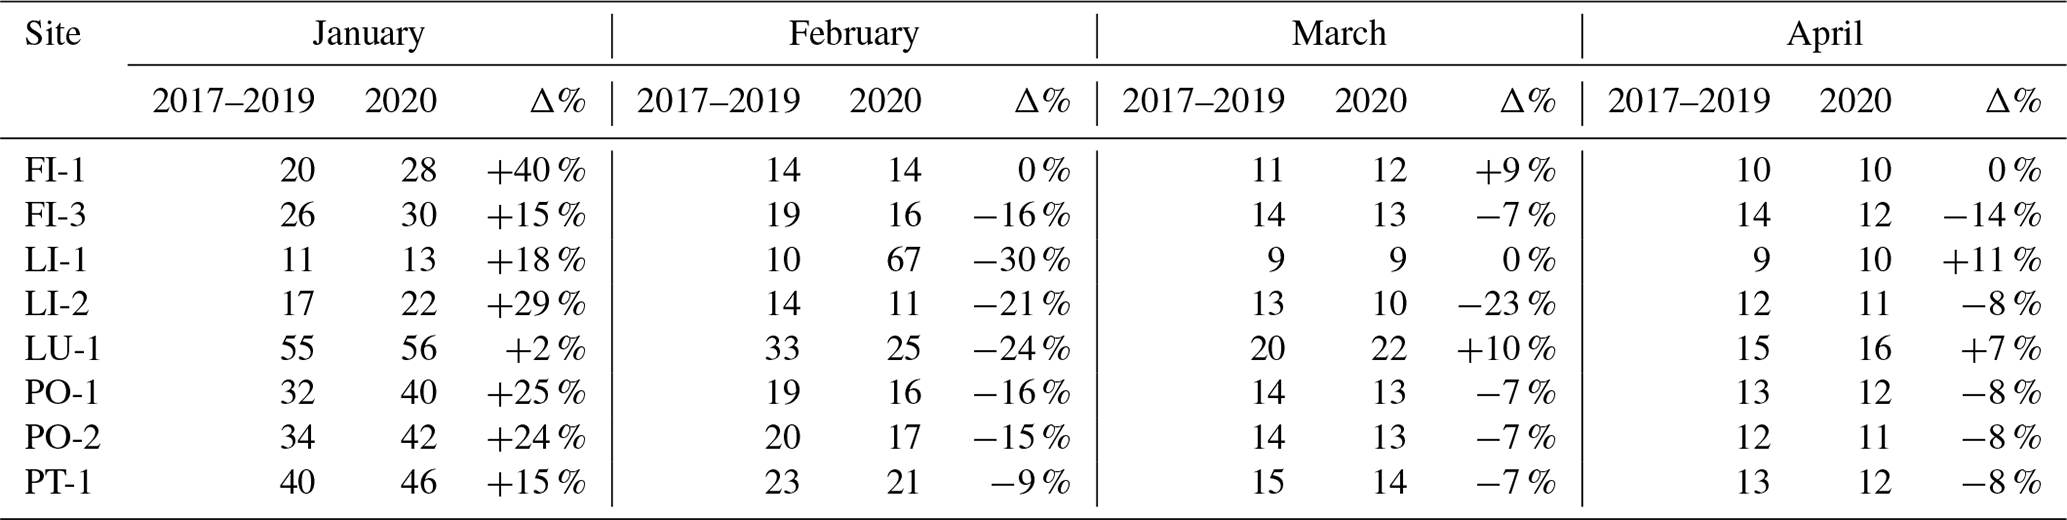
Although we have a lot of data about PM10, as it is both measured at all monitoring sites and collected on filters that can then be analyzed, we only have the mass for a small number of sites for PM2.5. Table 4 shows the monthly means for the 3-year period from 2017 to 2019 and for 2020 for the PM2.5 monitoring stations in the study areas. Generally positive variation in January and the substantial stability of the means in the other months are observed. The month that records the greatest reductions is February 2020, with a value of −8 µg m−3 at LU-1. In March and April, the variations are always contained within ±3 µg m−3 for all stations, regardless of the station type.
Table 4PM2.5 monthly mean concentrations (µg m−3) for 2017–2019 and 2020 as well as the percentage variation (Δ%).
Among the three stations whose PM10 composition has been analyzed (FI-1 and FI-3 in Fig. 3 and PO-2 in Fig. 4), those showing a significant variation in PM10 in the months of March and April are the FI-3 station and, to a much lesser extent, the PO-2 station, which, despite being an urban background station, has always shown a good correlation with the traffic station located in the same city. This correlation suggests that traffic is an important component of the background composition in that area. The only station with significant variations of more than 25 % is FI-3, which can be considered the most characteristic station with respect to traffic sources at the regional level. As previously mentioned, the FI-3 station moves to urban background values in the months of March and April 2020; moreover, interestingly, there are no significant variations in PM2.5 at this station, probably because the traffic decrease leads to a lower resuspension of urban dust that only affects PM10.
3.2 NO2 variation
At 16 of the 17 monitoring stations (excluding FI-2), measurement of the atmospheric concentration of nitrogen dioxide is also active; thus, in this case, it was possible to compare the values of the first months of 2020 with those collected during the prior 3 years. At all stations, there is a net reduction in the NO2 concentration in the months of March and April. Figure 6 shows the comparisons for the monitoring stations grouped by metropolitan area. The greatest reduction during the lockdown months is observed for the metropolitan area of Florence: the average decline is around −18 %, but peaks of −40 % and −22 % are observed for the FI-3 and FI-4 stations, respectively (the stations most exposed to urban traffic). These results are in line with the NO2 reductions observed in other regions and in large cities affected by heavy traffic emissions (Baldasano, 2020; Keller et al., 2021; Huang and Sun, 2020; EEA, 2021). On the contrary, in the area of Lucca, despite the fact that the concentrations in 2020 are lower than those in prior years, there is a much smaller difference between the first 2 months before the lockdown and the following months. This is likely because this area is less affected by traffic restrictions, as it is more industrial and less densely populated than Florence; in Florence, traffic is generally more intense and some of the monitoring stations are located on large city avenues.
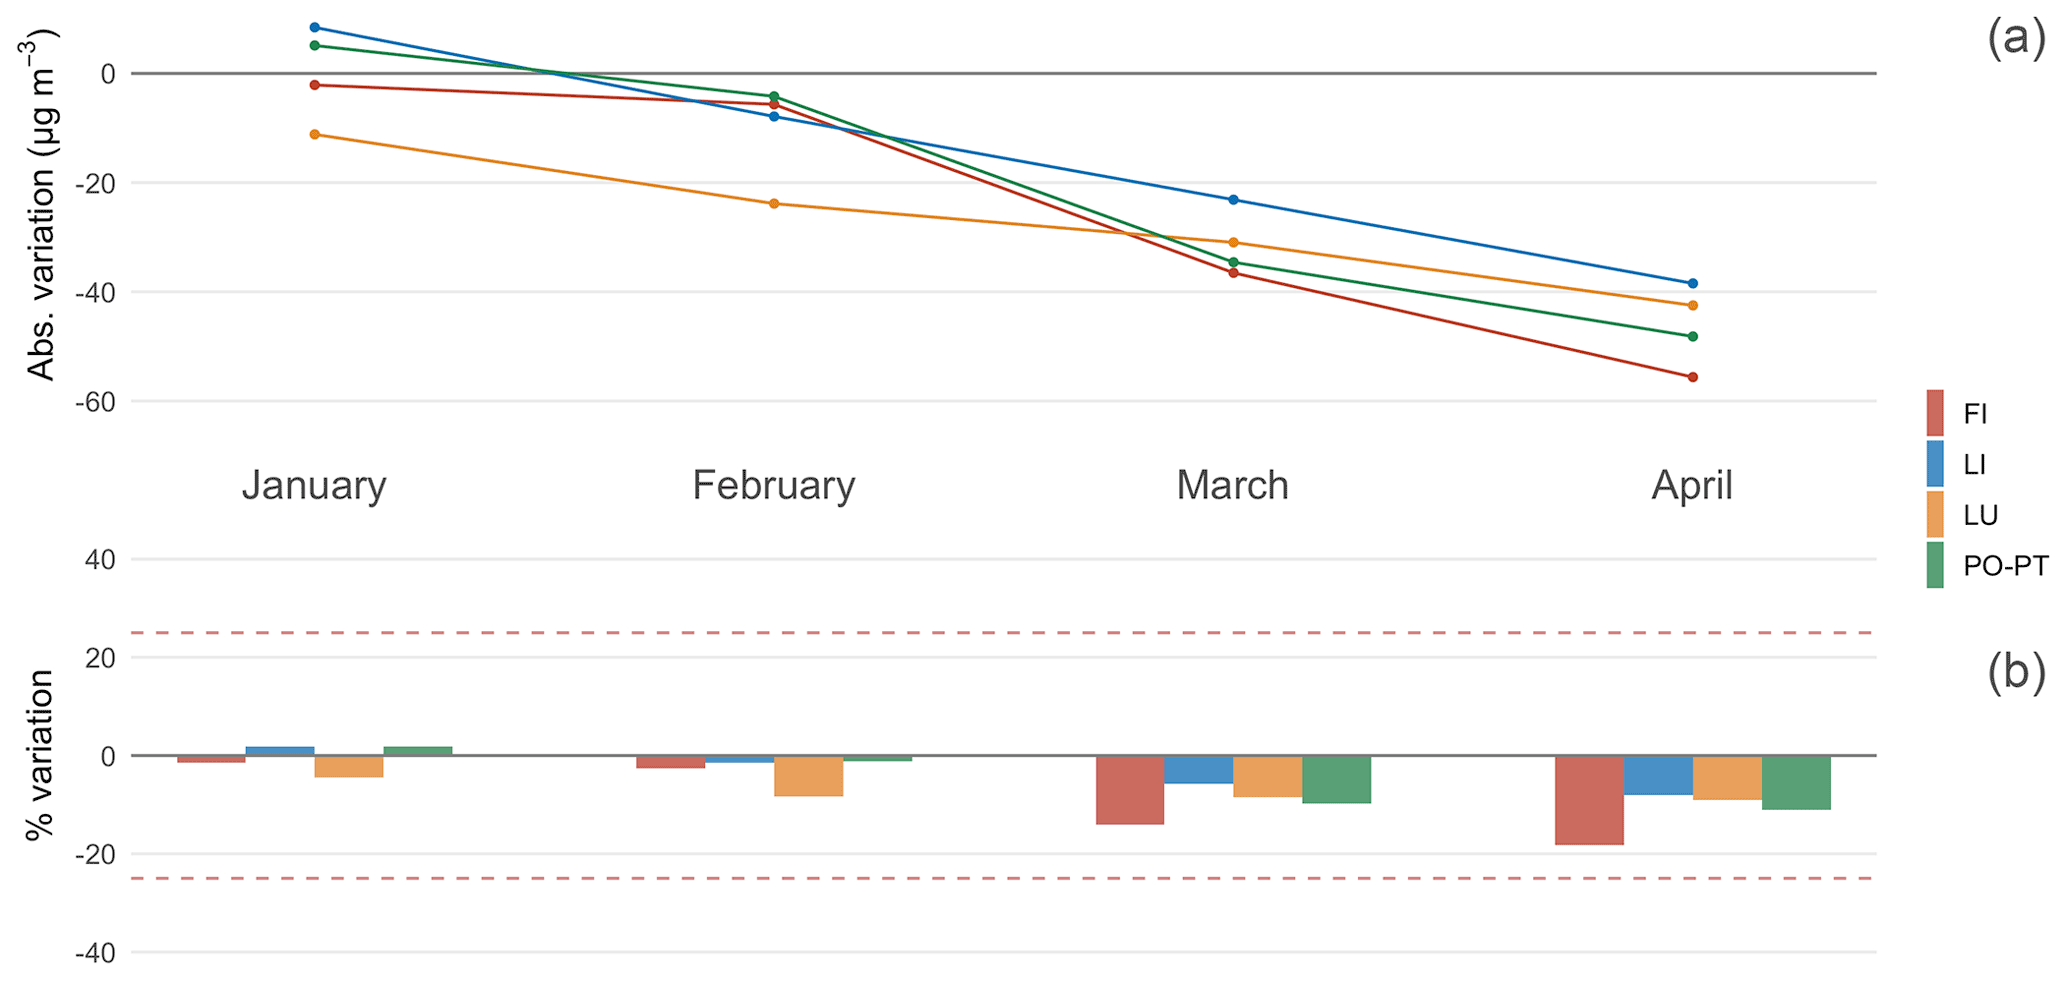
Figure 6NO2 (a) absolute variation and (b) percentage variation between monthly means of 2020 and 2017–2019 in the four considered areas.
3.3 Changes in chemical composition
From the samples of the three sites dedicated to chemical analysis (FI-3, FI-1, and PO-2), combining the results of ion chromatography, PIXE, and thermal–optical analysis, a dataset was obtained comprising a total of 33 chemical species, including the mass of PM10. The analysis of such a large number of species, including the main and trace species, was undertaken in order to represent the atmospheric particulate load as well as possible, minimize the unexplained fraction, and detect the highest number of source markers. For each of the three sites, the samples were divided into two periods, as seen in Table 2: using 10 March 2020 as reference (the beginning of the national lockdown), the dates were split into before the lockdown (BL) and during the lockdown (DL) periods. However, contrary to what we have seen so far regarding the variation in the PM10 and PM2.5 concentrations in 2020 compared to the 3 years before the lockdown, it was only possible to make a comparison within 2020 for the chemical analyses. In fact, given the exceptional nature of the event, the chemical analyses were performed on filters that would normally have only been used for environmental monitoring (required by law), which does not routinely include chemical speciation.
Table 5Average concentrations (± standard deviation) of the main chemical species for the three sampling sites and their relative variation between the period before lockdown (BL) and during lockdown (DL).
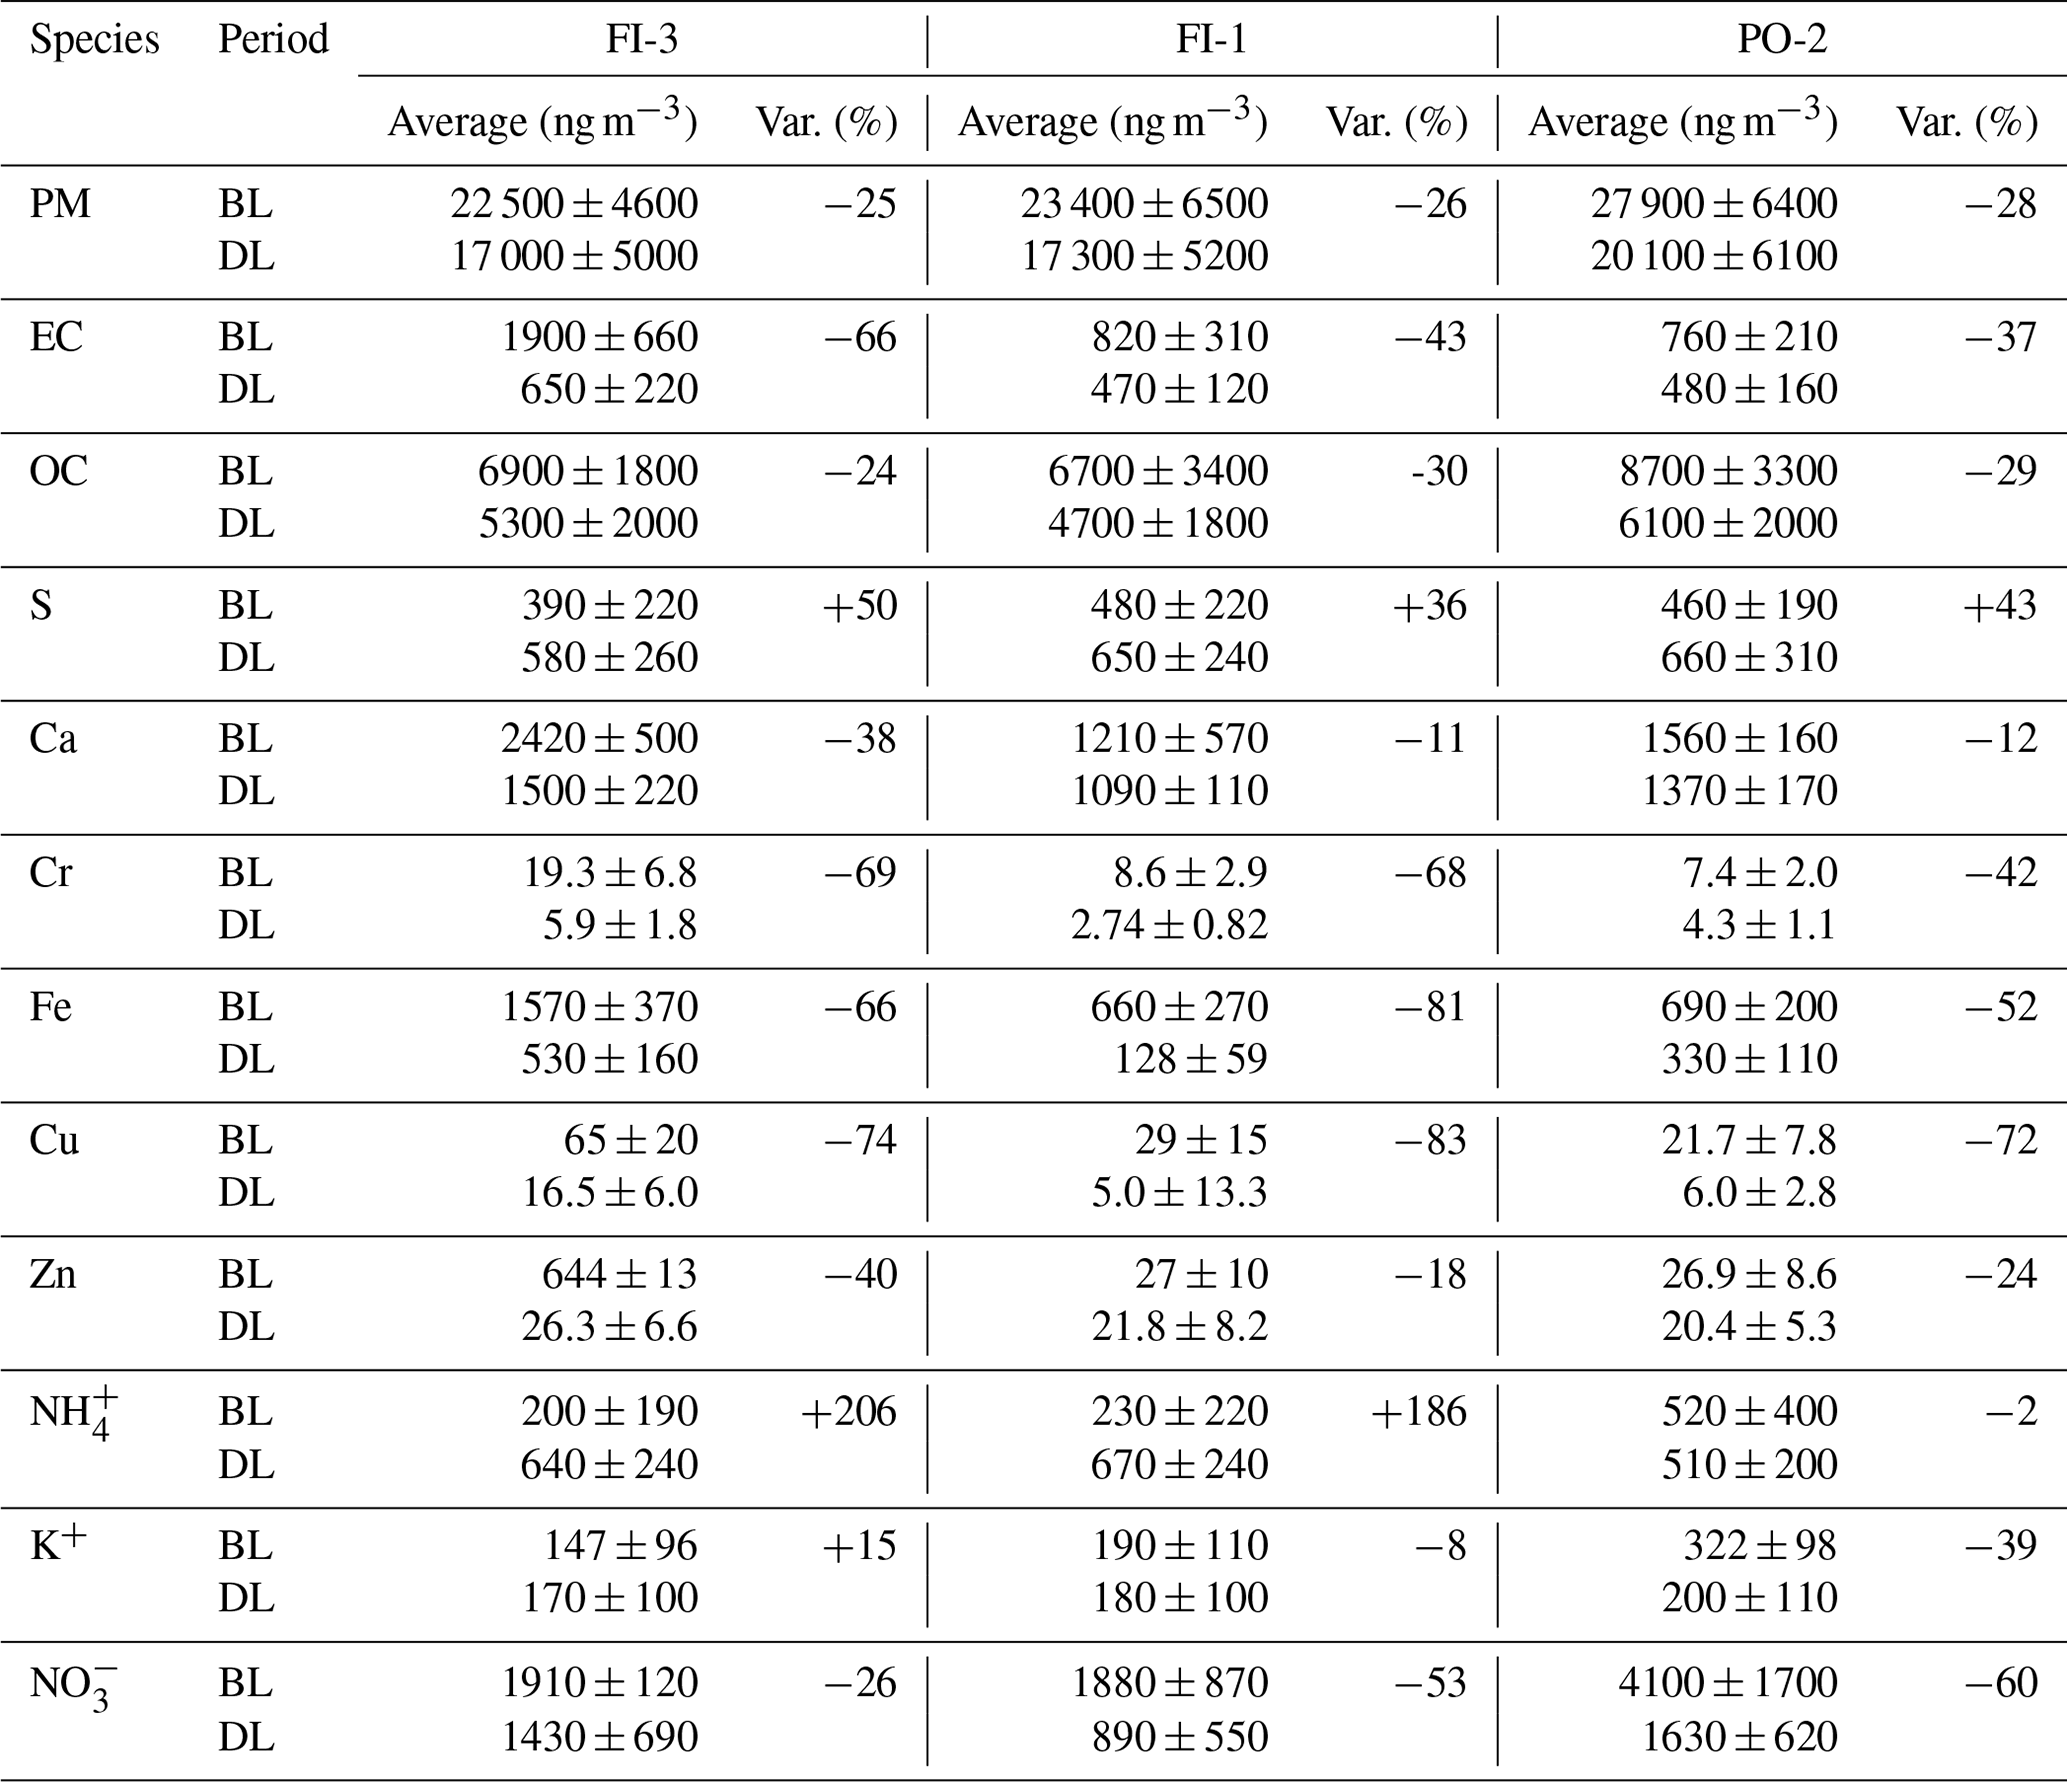
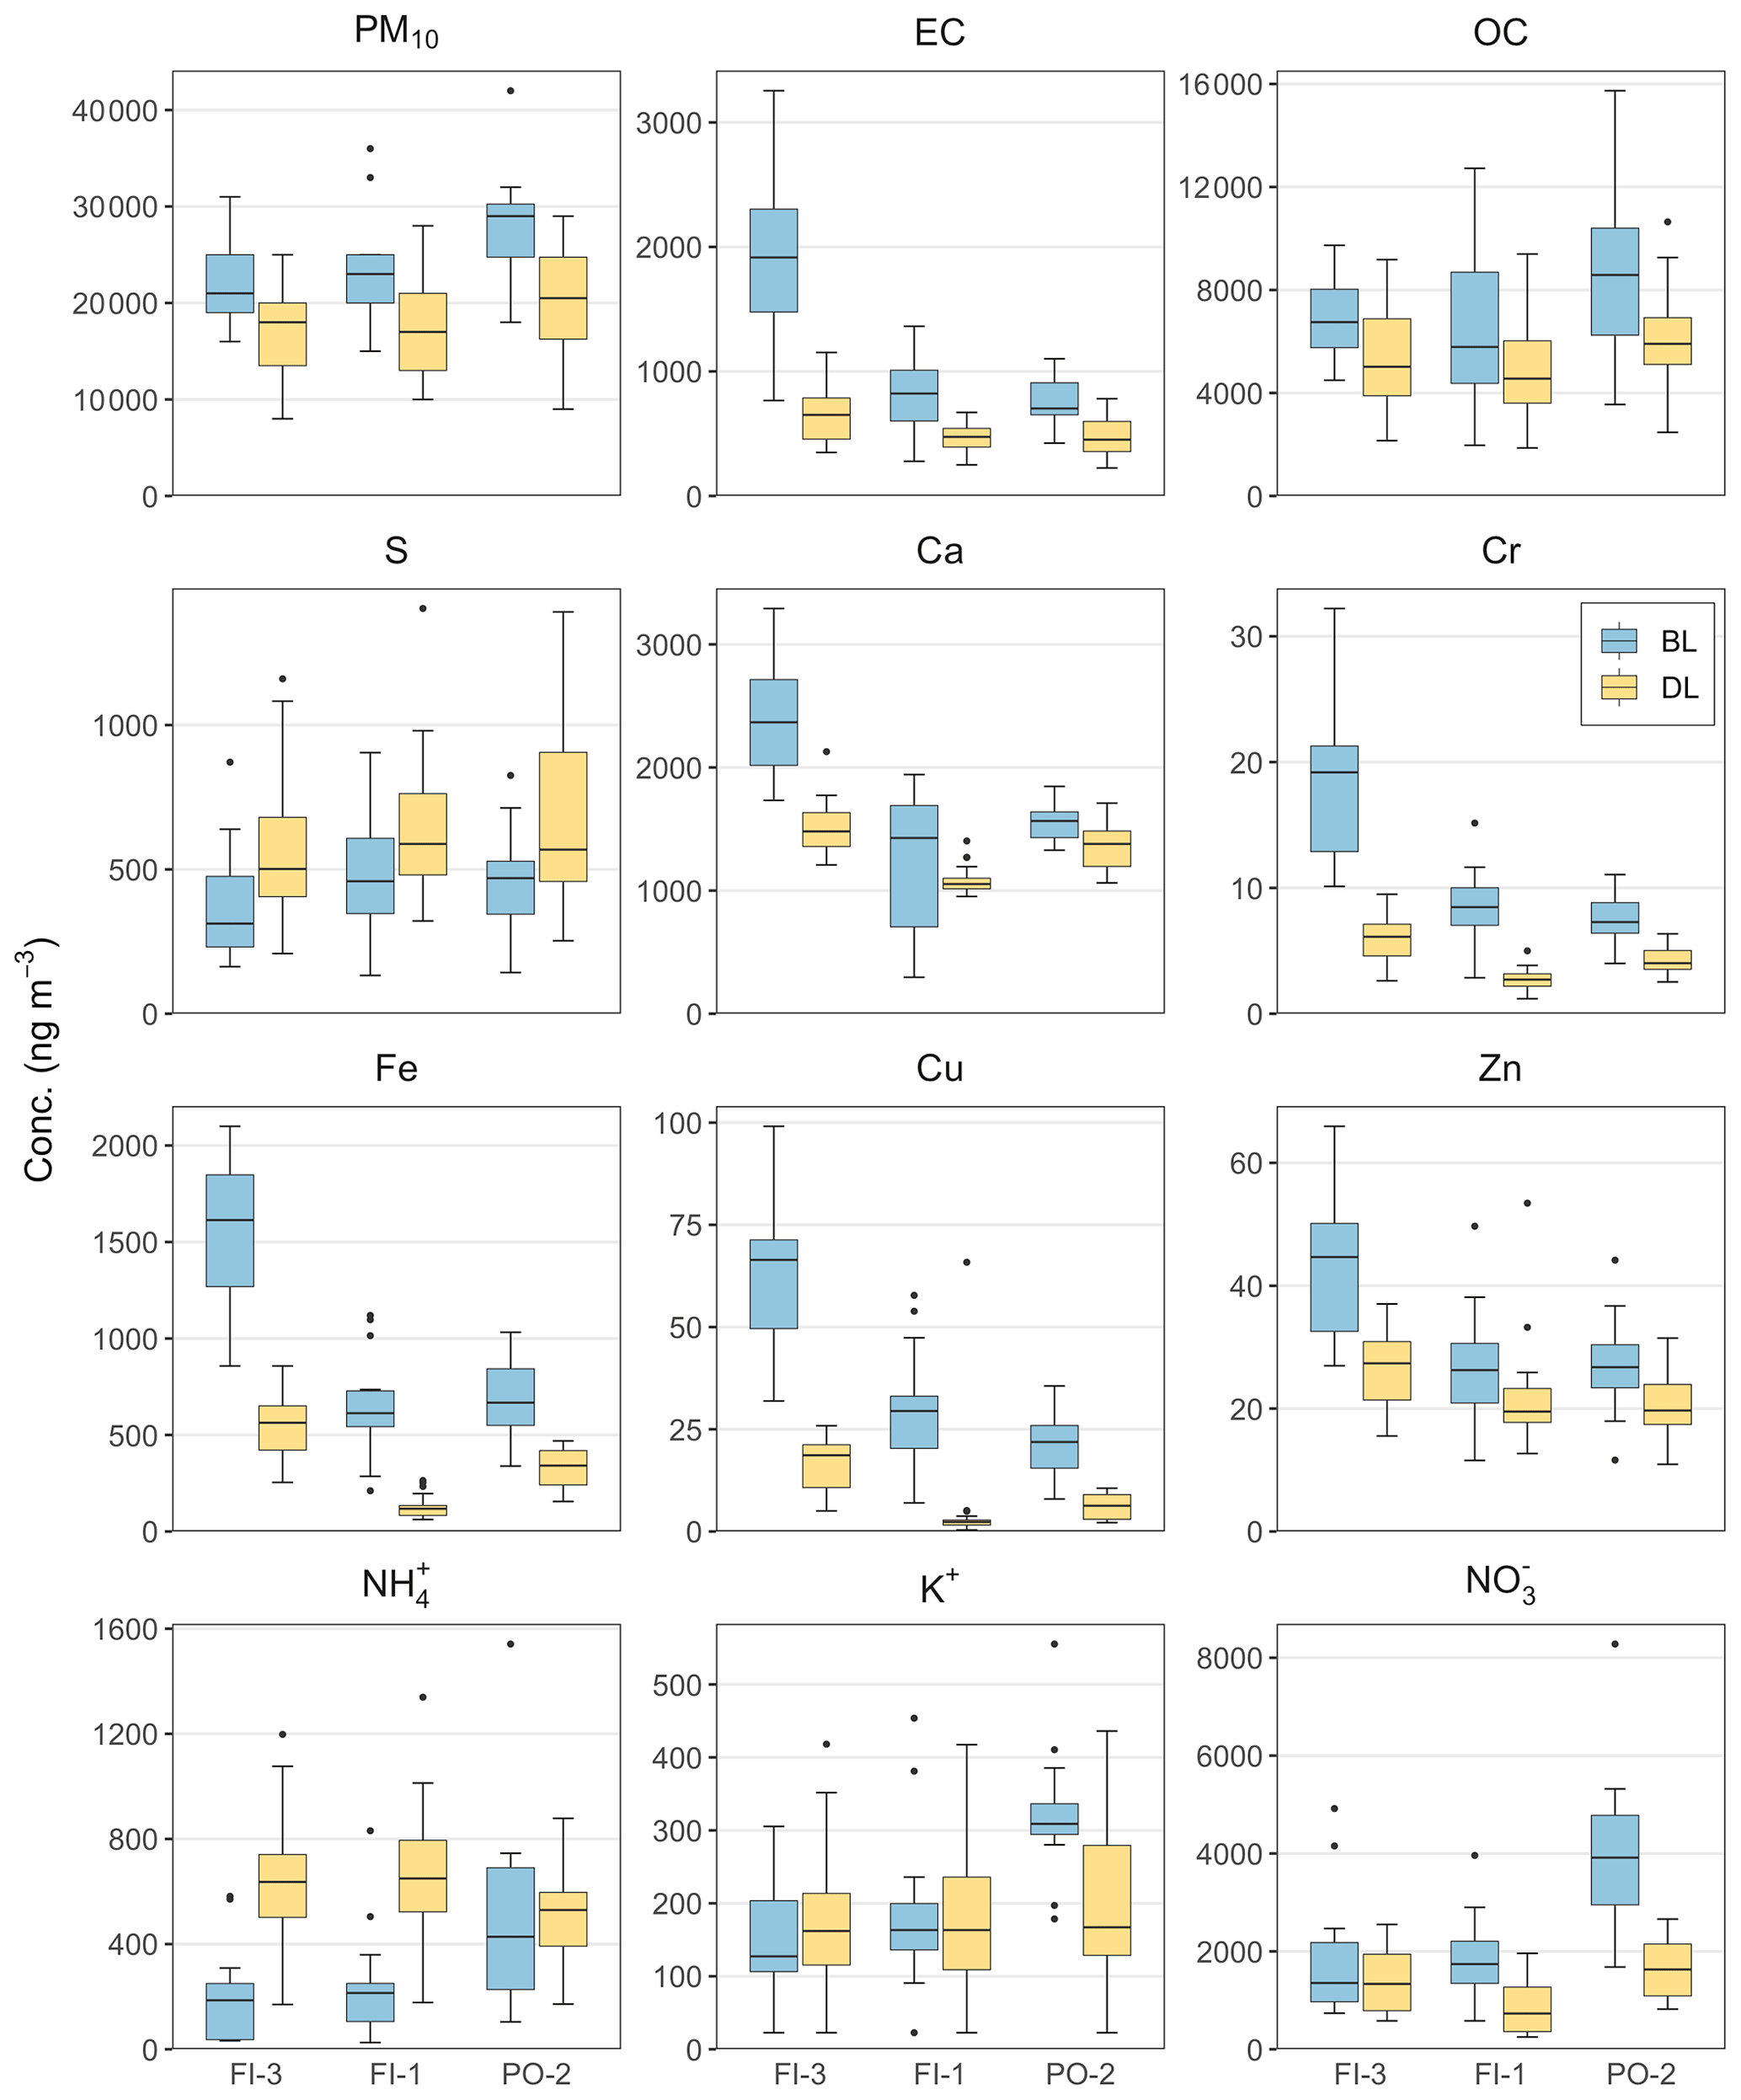
Figure 7Comparison between the period before the lockdown (BL) and during the lockdown (DL) for the main chemical markers for each of the three sites. Boxes represent the interquartile range (IQR; between the 25th and 75th percentile) and the median (line inside the boxes), whiskers cover the range of the samples over and under 1.5⋅ IQR, and the points are outliers.
Table 5 shows the average concentrations of the main chemical species in the atmosphere and the percentage variations between the two periods, and Fig. 7 shows the comparisons of the value distributions of these species between the two periods using box plots. In both cases, the major species and the markers of the main urban sources are reported for each of the three sites.
With respect to the total mass of particulate matter, all three sites are, on average, in line with the same slight reduction (from −25 % to −28 %) during the observed periods. A similar decrease in the averages of the periods is observed for organic carbon (between 24 % and 30 %), whereas a stronger decrease is observed for the elemental carbon fraction (between 37 % and 66 %), especially at the traffic site. Among the main species, a significant reduction is observed for iron (between 52 % and 81 %) and, observing the distribution of species (Fig. 7), a very marked difference between the two periods is evident. In fact, the concentration values of the period before the beginning of the lockdown are rarely exceeded by those of the following period at each site. The same behavior is observed for some elements present at lower concentrations. In fact, chromium and copper have a spatial distribution similar to Fe, and their decrease at the three sites is also close to the percentages of Fe (between 42 % and 69 % and between 72 % and 83 %, respectively). The same trend can be observed for zinc, even if the difference between the two periods is less marked (between 18 % and 40 %). The decreases observed for Fe, Cu, and Zn are in line with the interruption of vehicular traffic during the lockdown period. From these elements, which are markers of brake and tire abrasion (Gietl et al., 2010; Wik and Dave, 2009), a significant reduction in the source of non-exhaust traffic can be confirmed for all sites. The percentage decreases in Fe and Cu are very high in the agglomeration of Florence (always above 66 %) and slightly lower at the Prato site. As for the absolute values of the concentrations recorded during the two periods, it is important to note that these values drop significantly at the urban traffic site (FI-3) during the lockdown and are slightly lower than those of the two urban background sites under unrestricted traffic conditions; thus, the urban traffic site is effectively turned into an urban background site during the lockdown.
With respect to calcium, the difference between the traffic site and the other two background sites is even more evident. At all of the sites there is a decrease in the averages between the two periods; however, although these decreases are very low for the background sites (between −11 % and −12 %) and even lower than those of the total PM, the decrease is greater for the traffic site (−38 %). The relatively large extent of such a decrease suggests that the traffic restriction period heavily affected the concentration of this element (which is both a marker of natural mineral inputs and urban dust due to particle resuspension caused by traffic or by people strolling by) in areas in which vehicular traffic is one of the major sources. Moreover, in this case, the absolute concentrations at the traffic site during the lockdown period dropped to the values recorded in February at the two background sites.
Potassium and nitrate show a notable decrease at PO-2 (−39 % and −60 %, respectively), and nitrate also shows a notable decrease at FI-1 (−53 %). However, both species do not appear to be affected by the considerable reduction in the other species seen for the traffic site. In this case, ammonium seems to be influenced by geographical position given the fact that notable increases are only observed at the two sites in Florence (with an increase of about 3 times) while concentrations remain within the same range of values in Prato. The increase in the ammonium concentration can be ascribed to agricultural activities that were not interrupted during the national lockdown. Furthermore, this period was characterized by a condition of regional atmospheric stability with weak winds and an almost complete absence of precipitation.
Moreover, the increase in solar radiation also seems to have favored the accumulation of some pollutants of secondary origin. In fact, sulfur (S), present in the atmosphere mainly as sulfate, shows a substantial increase at all of the sites (between 36 % and 50 %) with no particular differences between one site and the other.
The results obtained here with regard to the chemical composition are in line with those seen in the work of Massimi et al. (2022), who assessed the impact of the lockdown in the city of Rome, considering three different sites in terms of position and type; taking into account the variability between the sites, the same variations were found between the periods before and during the lockdown, especially for elements from anthropogenic sources.
3.4 Source identification and their changes
PMF analysis was performed on a single dataset that combines the chemical composition data of the three sites described previously (FI-1, FI-3, and PO-2), assuming that the profile of the main aerosol sources found by the model is the same at all of the sites (Regione Toscana, 2021). In total, 107 observations were used, and, according to the signal-to-noise ratio suggested by Polissar et al. (1998), 19 chemical species were selected in addition to the PM10 mass: 13 species obtained from PIXE analysis; 3 species obtained from ion chromatography; organic and elemental carbon; and insoluble potassium obtained from the difference between total potassium (from PIXE, not used in PMF) and soluble potassium (from IC). All of the species were selected as strong variables in the model, and PM10 was used as the total variable (with 400 % uncertainty).
PMF led to the identification of six sources: secondary nitrate, combustion, traffic, marine, soil dust, and sulfate. These final factors were chosen after examining multiple solutions with a different number of factors (from five to eight) based on the real meaning of their chemical profiles, their temporal trends, and the residuals of all of the chemical species. The ratio between Q and its expected theory value was 1.11. The correlation between the mass of the particulate matter measured by weight and the mass reconstructed by the model was good (slope = 0.94 and R2=0.98). The study of uncertainties was also performed using the bootstrap (BS) and displacement (DISP) method. For BS, the number of factors correctly mapped for 100 runs (with a correlation threshold equal to 0.6) was never under 99 %, whereas no swaps were observed between the factors and the largest decrease in Q was −0.031 for DISP.
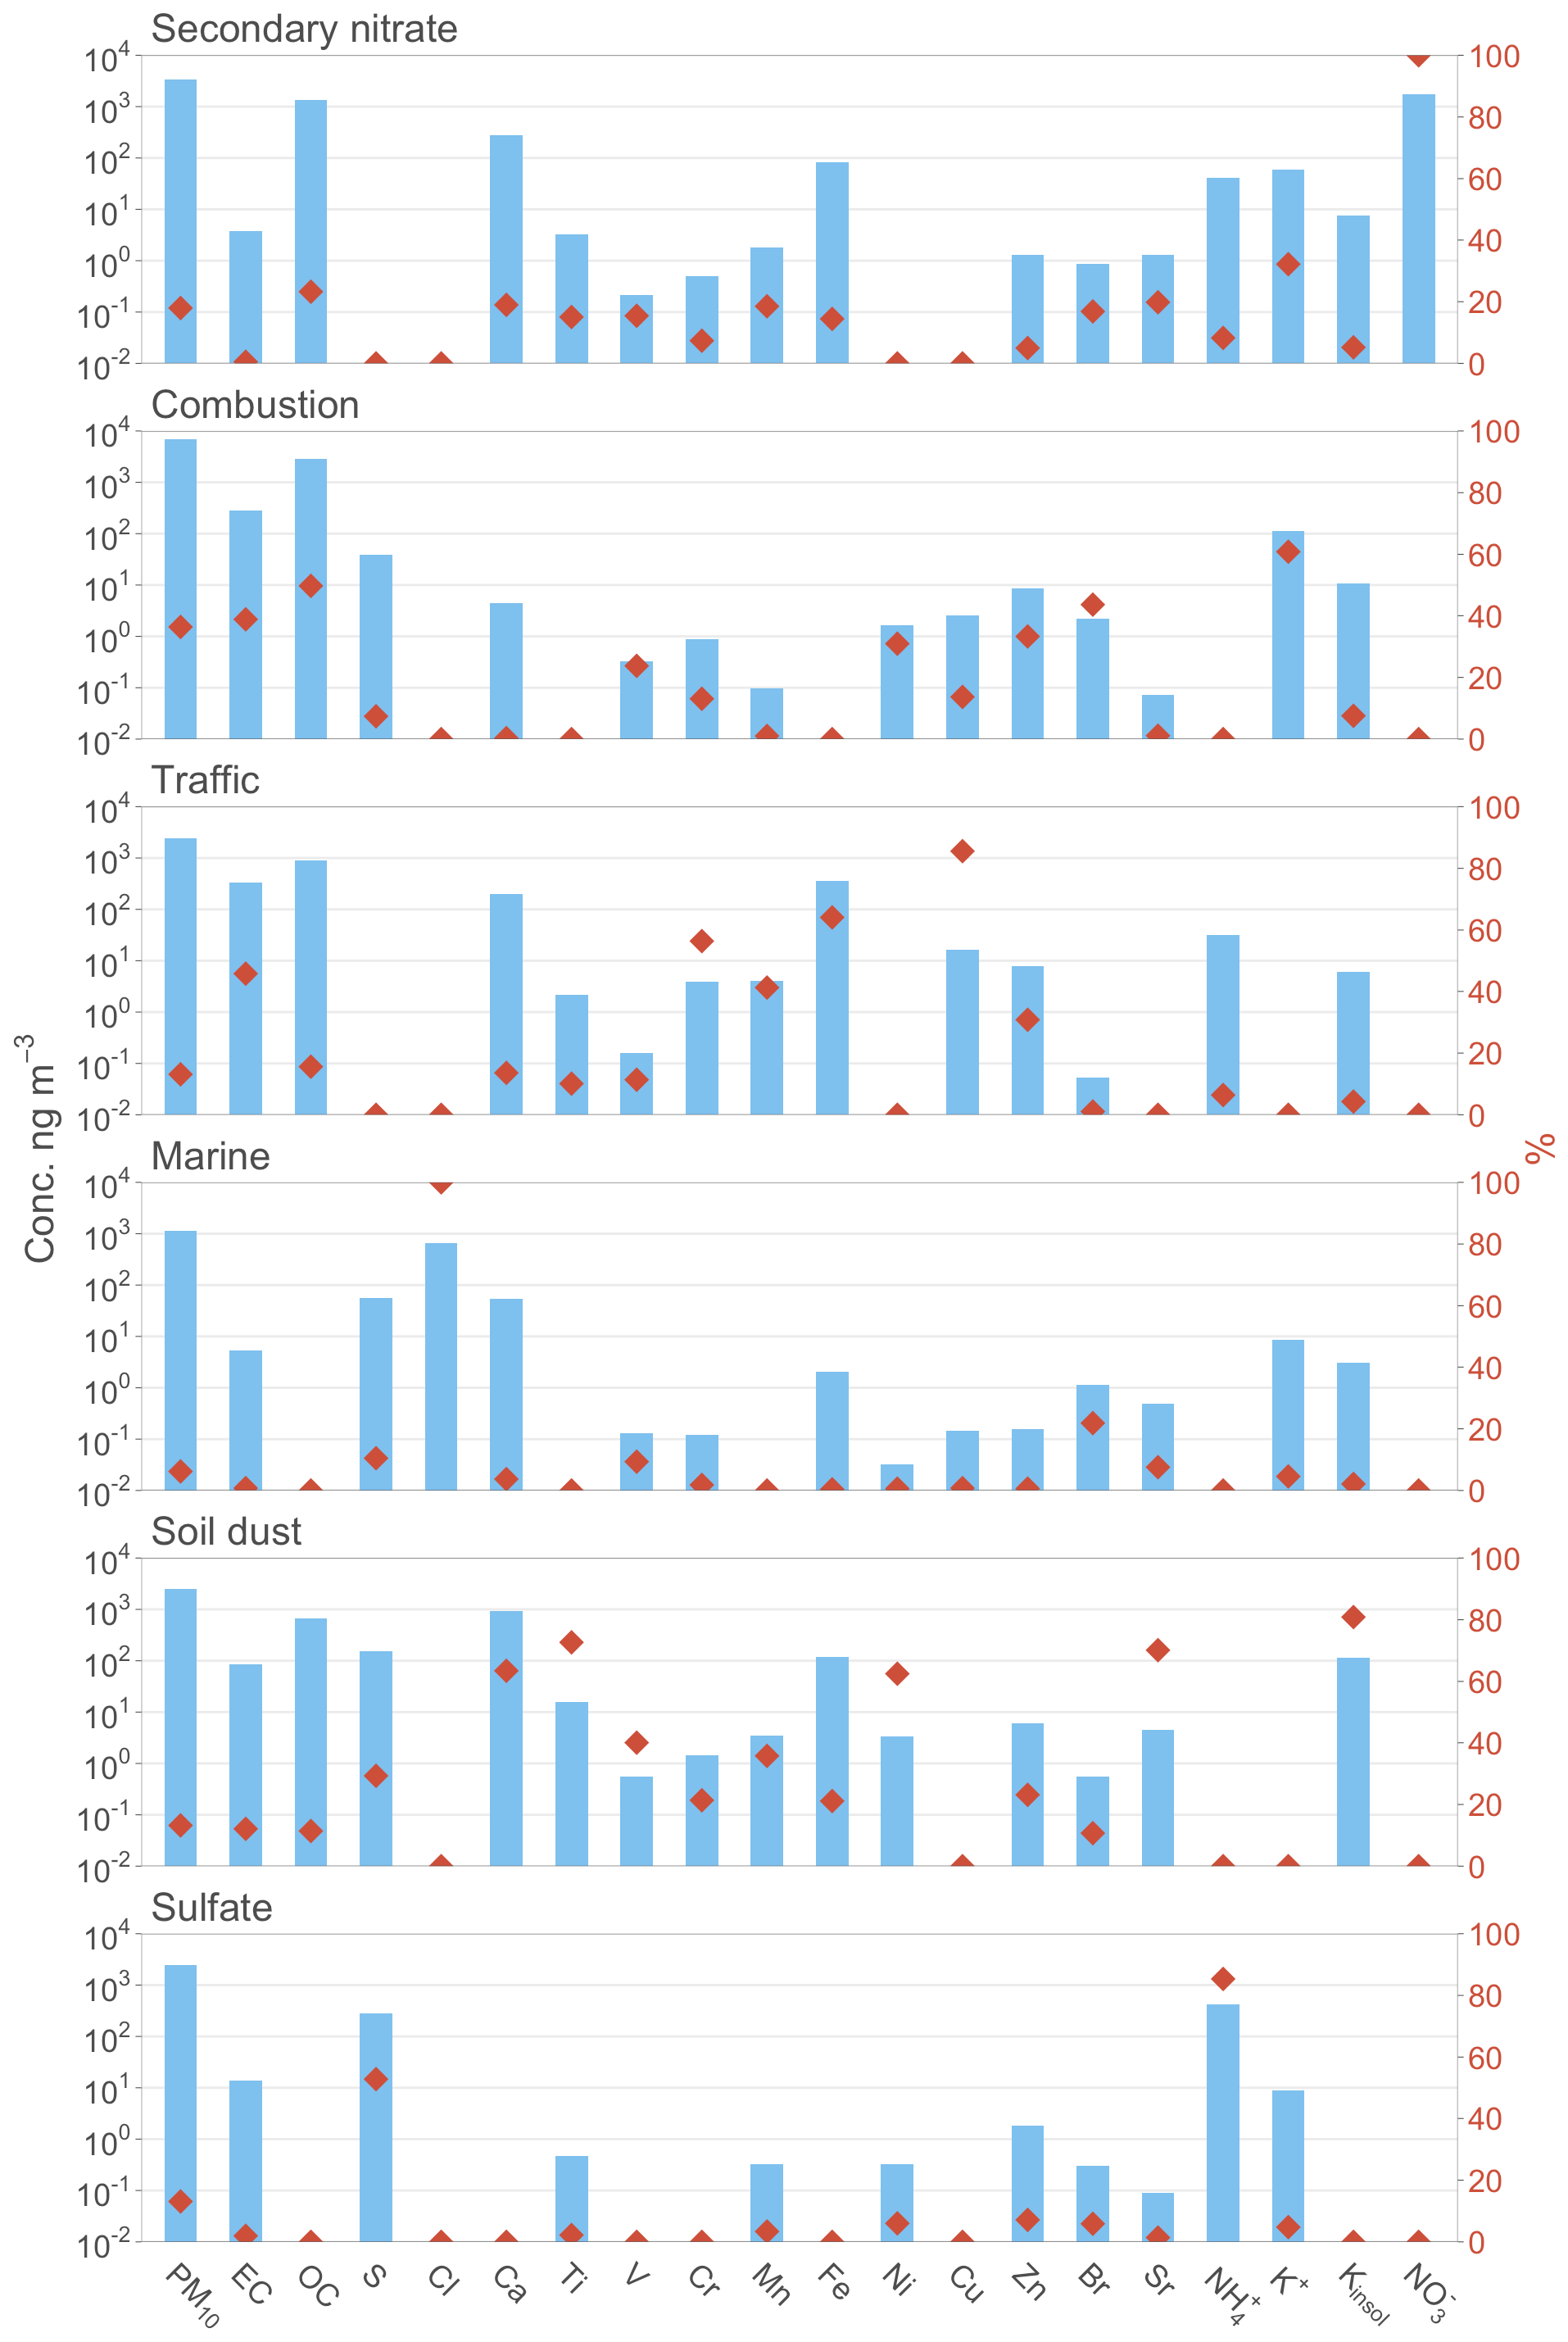
Figure 8Chemical profiles of the factors obtained by PMF analysis, showing the mass contribution (in ng m−3) of each species within each source (blue bars) and the average percentage contribution of each source to the total concentration of each element (red points)
The chemical profiles of the sources found in the final solution are shown in Fig. 8, which displays the average concentrations of the elemental contributions in each factor (blue bars, left axis) and their percentages relative to the total concentration of the element (red dots, right axis).
The assignment of the physical source corresponding to each factor was done based on the markers of their chemical profile. The first factor is called secondary nitrate because it is mainly composed of and . It is associated with a secondary component produced by local combustion processes, mainly vehicular emissions but also domestic heating (Nava et al., 2020), which are the main sources of NOx that is, in turn, oxygenated to (Seinfeld, 1986). The presence of calcium in the chemical profile of this source is due to the formation of the salt (CaNO3)2 which forms under dry conditions and in the presence of CaCO3 (Amato et al., 2016). Another important component is OC, representing the condensation of semi-volatile organics on the high specific surface area of ammonium nitrate particles.
With respect to the second factor, the high concentrations and percentages of elemental carbon, organic carbon, and soluble potassium (39 %, 50 % and 61 %, respectively) allow one to recognize this source as biomass burning for domestic heating (Nava et al., 2015; Sharma et al., 2016; Piazzalunga et al., 2011). The ratio (about 11) in its profile is within the ranges reported in the literature for a biomass burning source (Vincente and Alves, 2018). The metropolitan area of Florence and Prato is well supplied with natural gas, but there are many chimneys in the suburbs, on the hills, and inside the residential areas; moreover, due to recent tax incentives, many residential houses have been equipped with small wood or pellet stoves (Nava et al., 2020). In quantitative terms, this is the source that gives the highest contribution to the mass of the particulate.
Factor three has been associated with urban traffic because it is mainly composed of OC and EC and is traced by specific elements like Fe, Cu, and Zn, as reported in the literature (Viana et al., 2008; Ntziachristos et al., 2007; Matthaios et al., 2022). It includes both exhaust and non-exhaust emissions. Cu (explaining 86 %), Fe (explaining 64 %), Ca, Mn, and Zn in this factor are associated with vehicles' wheel and brake wear as well as the resuspension of urban dust particles due to vehicular traffic (Harrison et al., 2012; Thorpe and Harrison, 2008; Charron et al., 2019; Handler et al., 2008; Gillies et al., 2001). The ratio (of about 3) is similar that found at other urban background sites (Amato et al., 2016).
Although it was not possible to analyze Na, the high loading of Cl in the fourth factor, which is totally assigned to this factor, allows one to recognize the marine source. The analysis of back trajectories confirm the attribution of this source, as the sea spray originates from the Tyrrhenian Sea, carried by strong westerly winds, whereas the arrival of marine particles from the east is inhibited due to the presence of the Apennine Mountains. S and Ca in this factor are due to their presence in sea salt (Bertram et al., 2018), as has been found in other works (Manousakas et al., 2021; Gugamsetty et al., 2012).
The fifth source is identified as soil dust, as it includes all of the crustal elements that have been analyzed: Ca, Ti, Mn, Fe, Sr, and insoluble K. These elements are the major constituents of airborne soil and road dust; Ca may be also due to local construction activities.
Finally, the sixth factor almost exclusively contains S and ammonium, with these two species also showing a high explained percentage in this factor (53 % and 85 %, respectively). Although sulfate ion concentrations were available from ion chromatography (which has a good correlation with elemental sulfur), total sulfur was used for PMF analysis because it also provides information on sulfur that is not in the form of sulfates. This factor was then referred to as sulfate, as it was seen that this chemical species is closely associated with ammonium because they neutralize each other in the atmosphere by forming salts; furthermore, sulfate is a species that is always present as background in this area as a secondary product of the oxidation of SO2 (Gen et al., 2019). In past studies, it has been seen that this species is a regional background in Tuscany, with similar values throughout the regional territory (Regione Toscana, 2021).
Table 6Average concentrations (± standard deviation) of the six sources for the three sampling sites as well as their relative variation between the period before the lockdown (BL) and during the lockdown (DL).
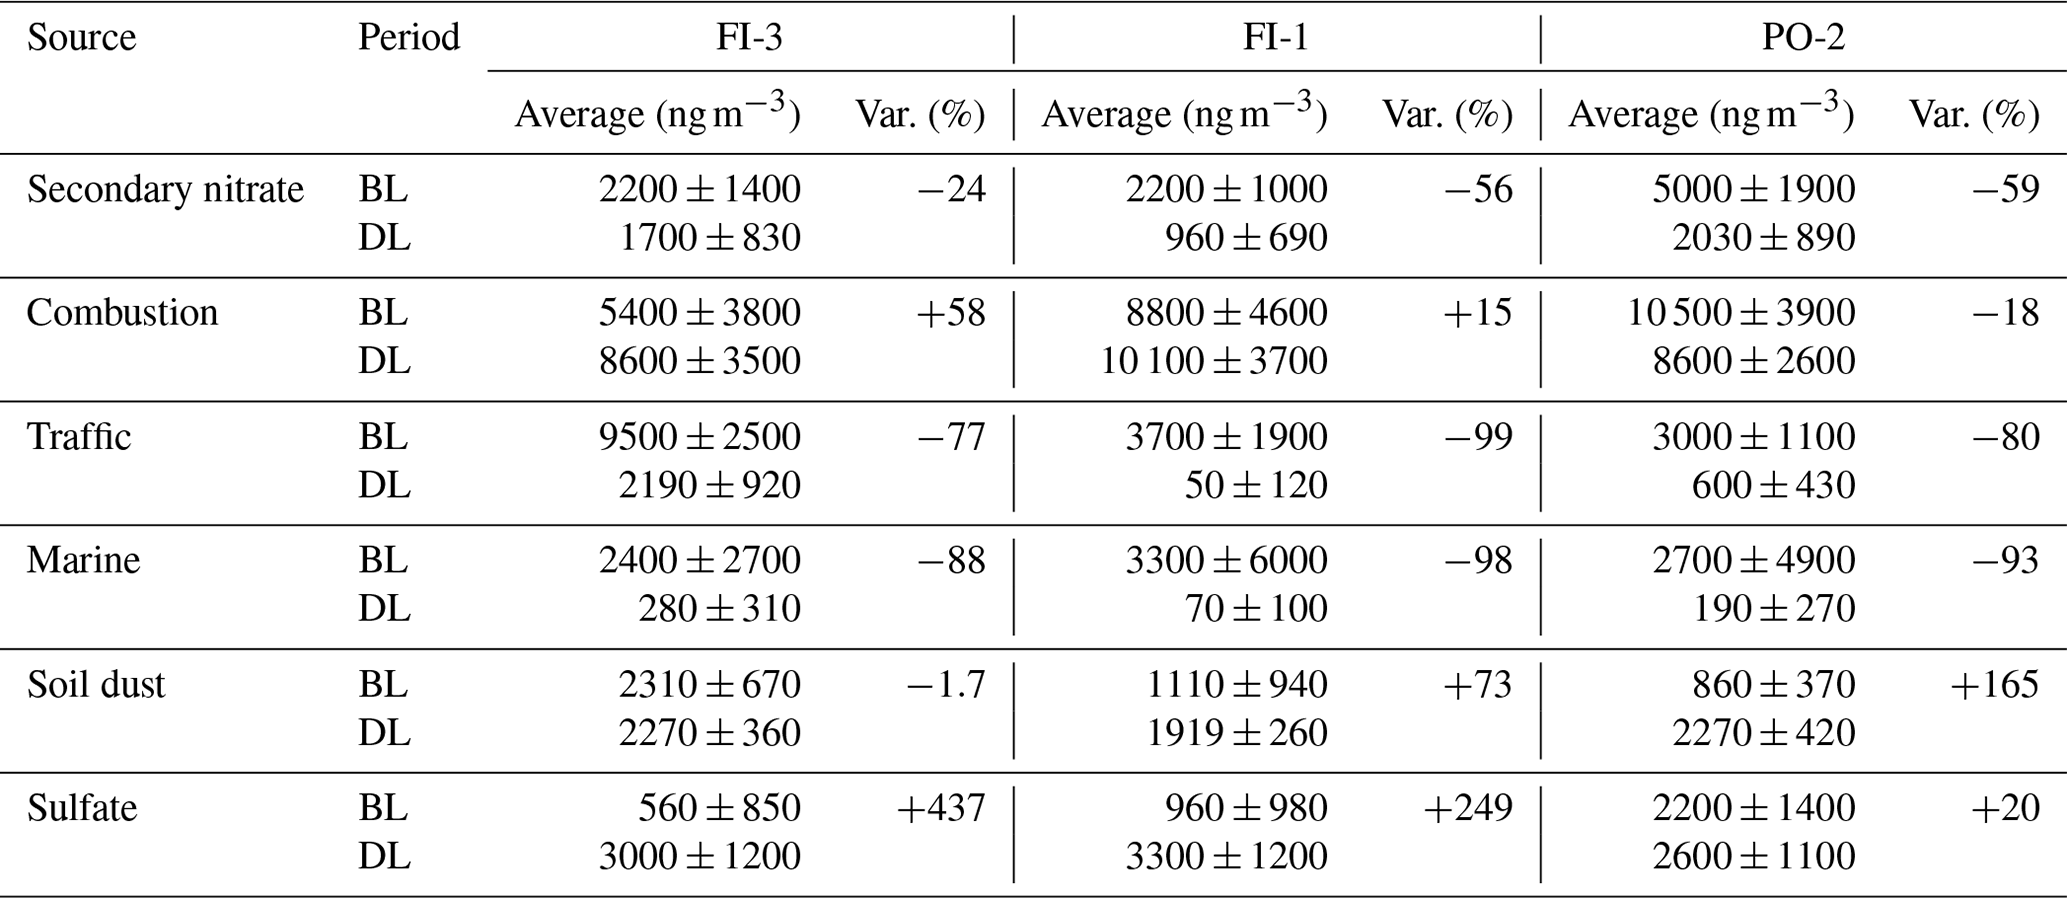
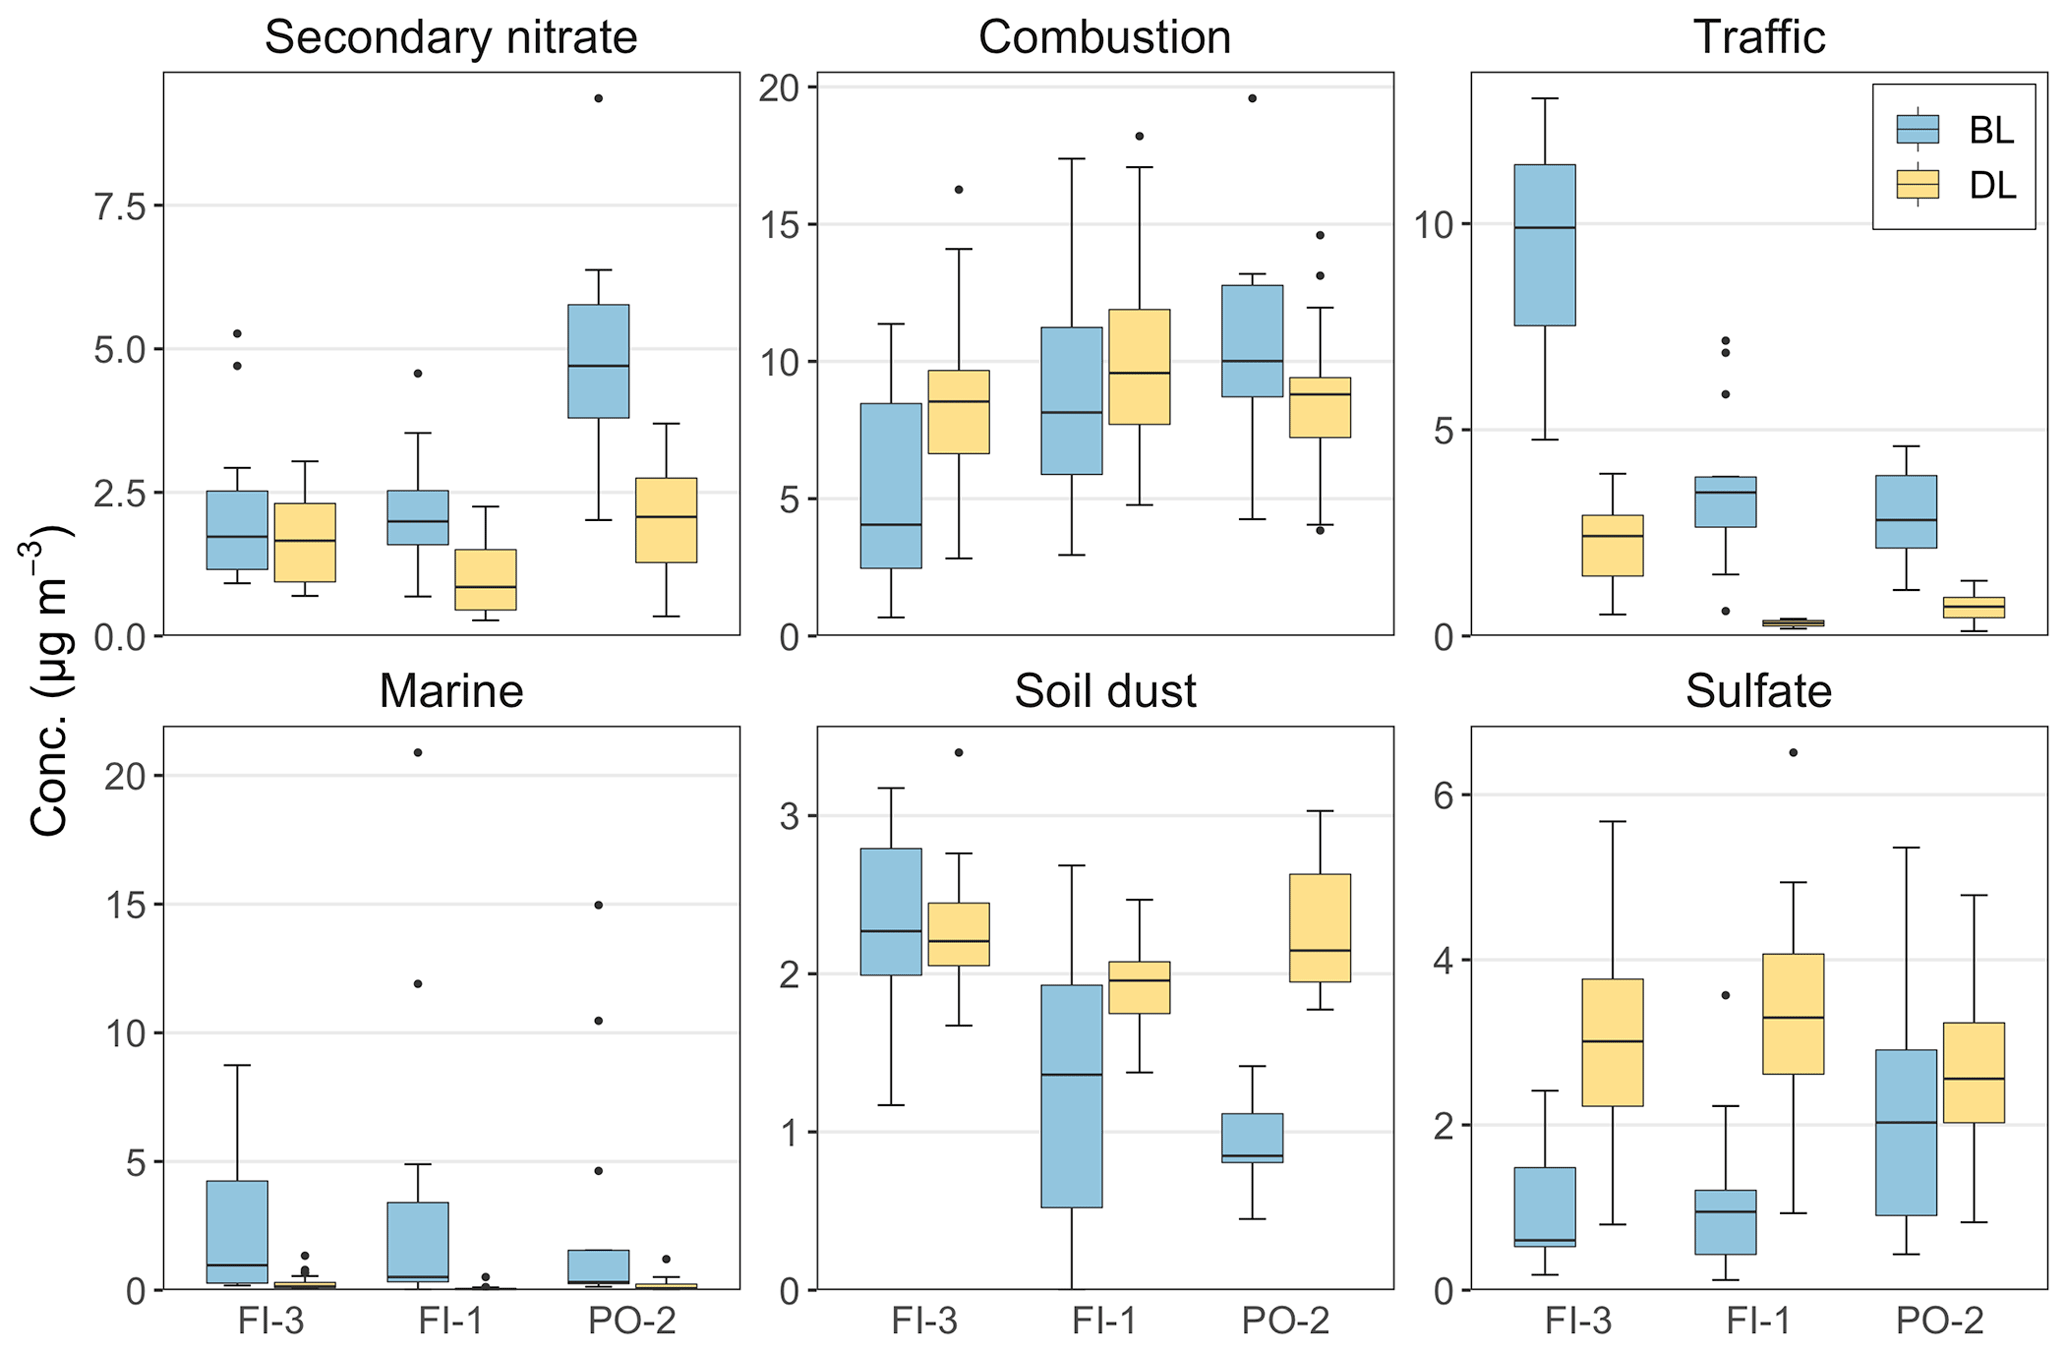
Figure 9Comparison between the period before the lockdown (BL) and during the lockdown (DL) for each source obtained from the PMF analysis for each of the three sites. Boxes represent the interquartile range (IQR; between the 25th and 75th percentile) and the median (line inside the boxes), whiskers cover the range of the samples over and under 1.5⋅ IQR, and the points are outliers.
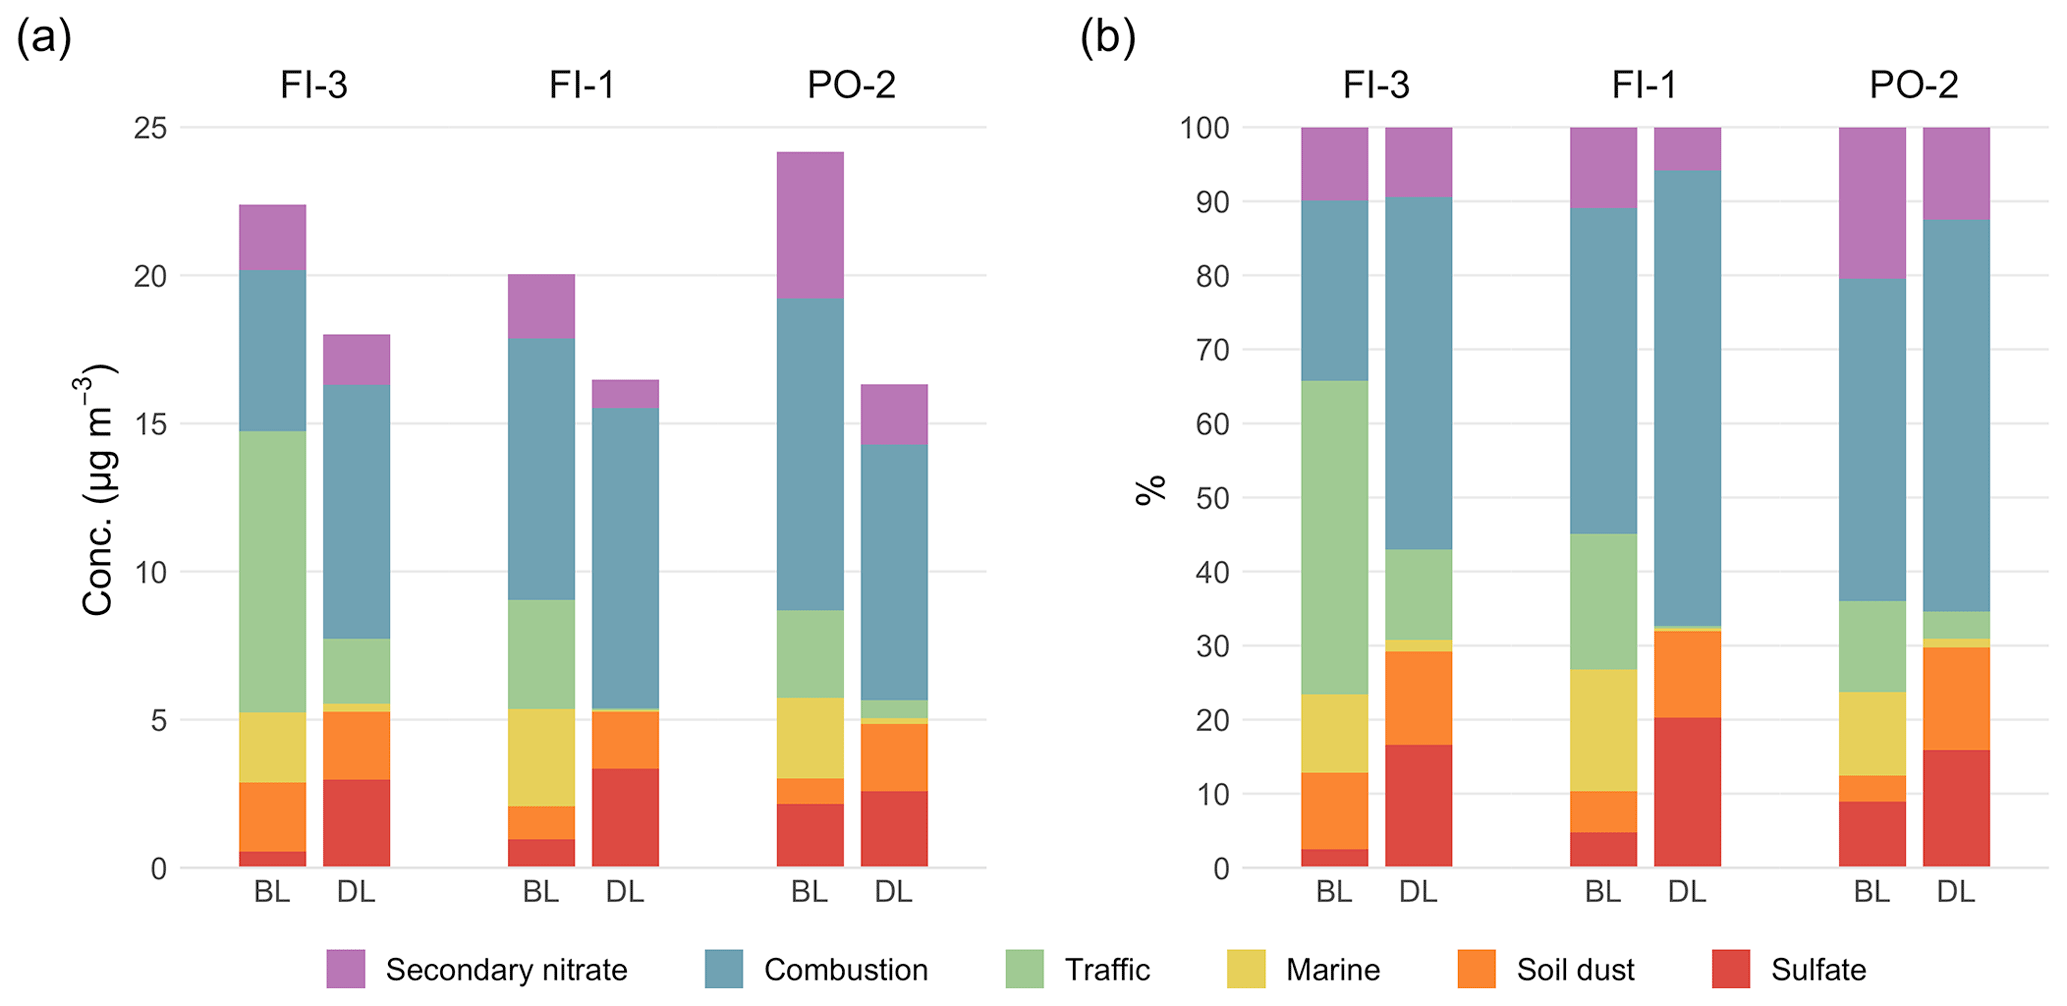
Figure 10Comparison between the two periods for the (a) concentrations and (b) percentages of the sources obtained from the PMF analysis for each of the three sites.
As for the abovementioned comparison made for the chemical species, the samples for the source attribution were divided into the before and during lockdown periods. Table 6 shows the averages of the contribution of the sources in the two periods as well as their relative variation for each of the three sites, Fig. 9 shows the distribution of values, and Fig. 10 shows a comparison of both the concentrations and the percentages of the sources in the two periods.
The two factors that show a significant variation at all of the monitored sites are those related to the respective marine and traffic sources. Regarding the marine source, as it is natural, we can exclude that its strong decrease between the two periods is correlated with the lockdown restrictions. From the calculated back trajectories, it has been seen that such a big difference could, in this case, be due to the change in the atmospheric transport. Before the lockdown, the air masses that reached the sampling sites mainly came from the Tyrrhenian Sea and remained at low altitude, whereas they came from the opposite direction during the lockdown, reaching the sampling sites from higher altitudes and, thus, bringing air masses with a lower marine aerosol content. The difference observed for the traffic source is, in contrast, a direct consequence of the restrictions on vehicular circulation imposed by the government in order to reduce the spread of COVID-19. For the urban background sites FI-1 and PO-2, the average reduction of this source was 99 % and 80 %, respectively, while FI-3, which is an urban traffic site, exhibited a decrease of 77 % and recorded the greatest decrease in absolute concentration. At this latter site, the weight of the traffic source on the total particulate load decreased considerably between the two periods, lowering its contribution from 42 % of PM10 (the main source) to only 12 % (Fig. 10b). It is possible that such a strong reduction in the traffic source at FI-1, which is mainly residential, is due to the presence of some schools in that area that were closed during the lockdown period.
The results obtained for the traffic source were then compared with the data provided by the National Autonomous Company of State Roads (ANAS) and by Google. ANAS, thanks to its automatic statistical traffic detection system, reported a 53 % reduction in total vehicle traffic on the main state roads in Tuscany (compared with the previous month) in its March Traffic Observatory report, while the monthly reduction was 43 % in the April report, leading to a total reduction of 73 % in April compared with February (ANAS, 2021). The data presented by Google, on the other hand, are related to the mobility of users anonymously detected for the services normally offered by the platform and made public during the pandemic period for study purposes (Google, 2021). For comparison with the results of this work, data corresponding to the same days as the analyzed samples were used if they related to mobility that was classified as being towards workplaces and public places, such as public transport hubs (i.e., subway, bus, and train stations); recreational and retail businesses (i.e., restaurants, cafes, and shopping centers); and public parks. Travel to supermarkets, grocery stores, and pharmacies was excluded. Using the average of the days from 3 January to 6 February 2020 as the starting baseline (baseline decided by Google), these data show that travel was reduced by 76 % on average in Tuscany between the lockdown period and the prior period. Although the data used in these analyses present some internal approximations, as ANAS only presents counts made only on major roads and Google only tracks connected phones to and from places of interest, they proved to be consistent with the results for the traffic source identified using PMF that showed an average decrease of 85 %.
The nitrate source is also observed to decrease for all sites, which is likely due to the effect of rising temperatures, although not with significantly high variations. The comparison of the trends of this secondary source and NO2, its main primary precursor, shows a different behavior for each of the three sites: PO-2 shows the highest decrease in secondary nitrate (−59 %), which is more evident as it already had very high initial concentrations, but only −37 % for NO2; at FI-1, the two values are very close (−56 % and −50 %, respectively); and the secondary sources at FI-3 only have a variation of −24 %, but NO2 decreases by 39 %. Therefore, although NO2 decreases similarly at the three sites, this is not also observed for its secondary products, which decrease at the two underlying sites but do not show a significant decrease at the traffic site; this shows inertia in the removal of these secondary products. The abovementioned pattern is probably due to the complexity and nonlinearity of the processes in the atmosphere that lead to the formation of secondary nitrate from primary NOx.
The combustion source shows an evident increase only at the FI-3 site, but the distribution of concentration values does not show a particular difference between the two periods at any of the sites. During the lockdown period, combustion becomes the main source of particulate matter for the FI-3 site (48 %); for the other sites, it also intensifies its influence, reaching 62 % for FI-1 and 53 % for PO-2 (Fig. 10b).
The pattern observed for secondary nitrates is explained by observing its behavior along with that of the traffic and combustion sources, which are the two sources that have a greater weight in the formation of NOx (the precursor of nitrates in the atmosphere). At the PO-2 site, a decrease in both the traffic and the combustion sources is observed, and (along with these two strong reductions in emissions) secondary nitrates are also affected, with a significant decrease in their atmospheric concentration. On the other hand, with respect to the FI-3 site, the combustion source, which increases during the lockdown, shows a contrasting trend to the traffic source, which significantly decreases; this opposite behavior of the traffic and combustion sources results in the maintenance of the same concentrations of secondary nitrates. The third site (FI-1) shows an intermediate behavior: with a very strong reduction in the traffic source and a modest increase in the combustion source, FI-1 shows a marked reduction in secondary nitrates. Although the formation of secondary nitrates in the atmosphere is mainly triggered by the photochemical activity of solar radiation, which was particularly favorable for this type of reaction in the period considered for this work, especially as it was combined with atmospheric stability, this behavior confirms the direct connection of each of the two primary sources with secondary nitrate formation (Fan et al., 2020; Z. Y. Zhao et al., 2020).
The factor representing the crustal fraction of particulate matter is the one showing the greatest difference between the two periods at the three sites. As can also be seen from Fig. 9, it spans from a fairly constant contribution at FI-3 to an increase of 165 % at PO-2. Being a natural source, this inconsistent behavior among the three sites may be ascribed to variability in the local sources of crustal dust around the sampling sites. Due to the atmospherically stabile conditions in the region, the only evident effect of the restrictions on this source was the leveling of its contribution, bringing it to almost constant values for all of the sites and canceling initial differences that could be due to different intensities of resuspension caused by different levels of traffic and anthropogenic activities.
Finally, the sulfate source, which consists almost exclusively of sulfur and ammonium, is the only one that shows an increase at all sites, even if almost irrelevant at the PO-2 site. On the other hand, the increase at the two Florence sites was considerable, reaching respective averages of +440 % and +250 %; increases at these sites were also favored by rising temperatures and solar radiation, which facilitate gas-to-particle conversion.
3.5 Comparison with past campaigns
Two of the three sites analyzed with respect to the chemical composition of the particulate matter in this work have been used in the past in two respective sampling campaigns: FI-3 was one of the sites used in the PATOS (Atmospheric Particulate in Tuscany) regional project (Nava et al., 2015) in 2006, while FI-1 was used in the AIRUSE (Air quality mitigation measures in urban areas from Southern Europe) European project (Amato et al., 2016) in 2013. Therefore, by using the data from these two prior campaigns, it was possible to perform a comparison with the samples collected in this work in 2020. The comparison (shown in Fig. 11) was made using only the days of the year covered by the 2020 samples (i.e., from February to April) which were divided, as described above, after 10 March of each considered year. For both campaigns, source apportionment with PMF had been performed. The chemical profiles of the sources of this work are consistent with the analogous sources of the past two campaigns, although different numbers of factors were found by the PMF analysis. The shown comparison refers only to the common sources found in the campaigns.
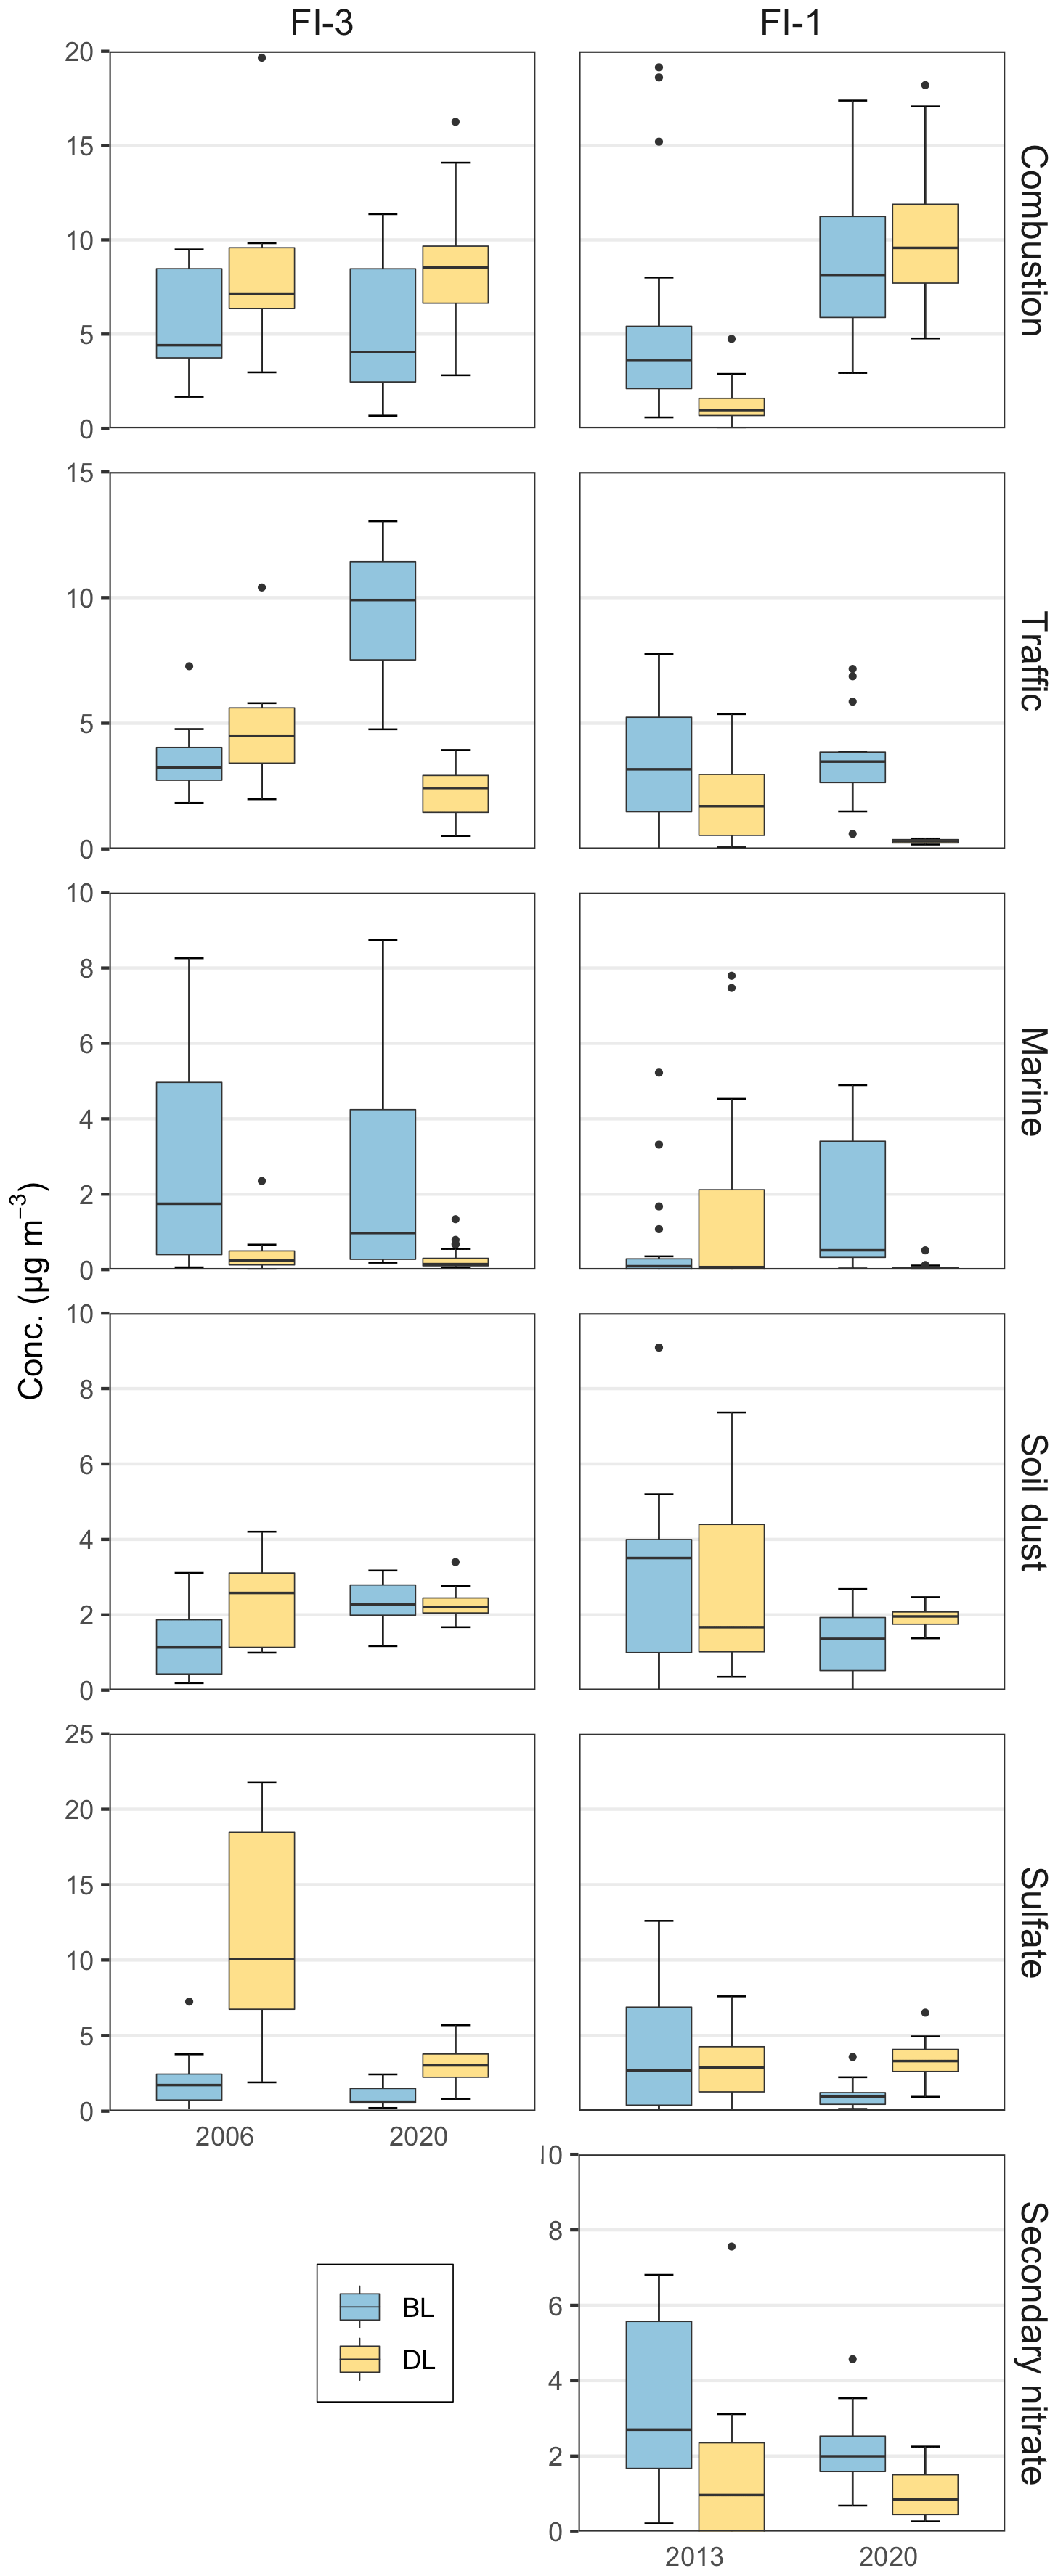
Figure 11Comparison between the period before the lockdown (BL) and during the lockdown (DL) for the 2020 samples and those collected in two prior campaigns: the PATOS regional campaign in 2006 for the FI-3 site and the AIRUSE European campaign in 2013 for the FI-1 site.
Leaving aside the comparison of natural sources that are almost exclusively subject to variations due to atmospheric transport conditions, such as the wind intensity and the origin of the air masses, we found that the greatest difference in the anthropogenic sources is observed for the traffic source. The large decrease described above is in sharp contrast to the almost complete absence of change in concentrations in the previous years, where, although the median value changes, the distribution of values remains approximately within the same range. With respect to the combustion source, the slight increase observed at both FI-1 and FI-3 is in contrast to the trend found in the 2013 campaign, which observed a decrease in the same period. The cause of this difference is probably due to the increased use of domestic heating by citizens forced home by the restrictions. Finally, secondary sulfates and nitrates show a clear change between the two periods of 2020, but their behavior does not differ significantly from what has been observed in the previous campaigns. The comparison with these two past campaigns confirms and strengthens the interpretation that the observed effects, especially for primary anthropogenic contributions, are related to the lockdown and not to the weather conditions in March and April 2020.
To control the rapid spread of the SARS-CoV-2 virus, Italy imposed national lockdown policies in March 2020. Due to social distancing regulations imposed for health reasons, many urban and industrial activities drastically decreased or even ceased. Among these, the restriction of vehicular traffic was one of the most important consequences observed in the weeks following the lockdown. One of the resulting side effects of the abovementioned restrictions was an improvement in the air quality, especially in urban centers. These particular conditions offered a unique and powerful window of opportunity to study air quality in the absence of a major source of air pollution in urban areas.
This work evaluates the impact of almost traffic-free conditions and the relative absence of other anthropogenic sources on the air quality in Tuscany between March and April 2020, in particular in the metropolitan area of Florence, using the chemical characterization of particulate matter and the study of its sources, obtained by implementing PMF receptor modeling. The variations in the chemical composition of the particulate matter load and of the source contributions were then investigated by comparing the weeks of lockdown with those immediately preceding it and, where possible, with previous years.
The comparison between the periods before and after the lockdown shows that the concentrations of Fe, Cr, Cu, and (albeit to a lesser degree) Ca have been significantly reduced at all of the sites.
As these elements are linked to the abrasion of brakes and tires and the resuspension of urban dust due to vehicular traffic, it follows that, even in the distribution of sources, the factor recognized as traffic shows a decrease of between 77 % and 99 %. In the same period, we also see a sharp decrease in NO2 compared with the previous 3 years. However, the strong reduction in traffic and its related pollutants (i.e., marker elements and NO2) did not lead to a drop in the total PM2.5 load. Even the concentration of PM10, although it decreased in the months of lockdown, did not undergo major changes that can be attributed to the decrease in traffic: in the case of urban background sites, this was due to the fact that the traffic does not represent a large fraction of the total; for the traffic site, it was because its decrease was compensated for by an increase in sulfates and combustion particulates (biomass burning). The sulfate source is, in fact, the PM10 fraction that increased for all sites due to the increase in solar radiation and the period of atmospheric stability in the months of March and April.
It can be hypothesized that the relatively minor decrease in particulate matter compared with traffic pollution is due to both the presence of large concentrations of precursor pollutants, such as ammonia from agriculture, in a concentration sufficient to produce PM of secondary origin along with sulfate, and high consumption for domestic heating under meteorological conditions that limited the dispersion of pollutants and produced emissions of the primary component.
Despite the evident reduction in traffic pollution, the presence of other sources, in particular the presence of particulate matter of secondary origin, which has different formation and removal rates from those of PM of primary origin, makes it difficult to evaluate the effects of the lockdown on the presence of pollutants under conditions with the almost total reduction of some anthropogenic activities typical of urban areas. Furthermore, for this reason, this study confirms the complex nature of atmospheric pollution, even in the case of the isolation of an important urban source of primary emission. The exceptional nature of the event certainly helps to isolate some sources of particulate matter, but some dynamics still remain to be understood, especially with respect to the removal of particulate matter of secondary origin. However, it should be noted that the lockdown period (the implementation of the restrictions to cope with the spread of the SARS-CoV-2 virus) is restricted to a few months of a single season and cannot give an indication of the effect that such restrictions could have had during another period of the year when the loads of the sources could be different.
The code used for data cleaning and analysis in this study is available from the corresponding author upon request.
The data that support the findings of this study are available from the corresponding author upon request.
FL and BPA planned the campaign. SN, GC, GP, MC, AA, FG, AF, CC, EF, and GN performed the measurements. FG, AF, CC, EF, and GN analyzed the data. FG, AF, CC, EF, and GN wrote the manuscript, and FL, BPA, EF, RT, MS, and SB reviewed and edited it.
The contact author has declared that none of the authors has any competing interests.
Publisher’s note: Copernicus Publications remains neutral with regard to jurisdictional claims in published maps and institutional affiliations.
This article is part of the special issue “Quantifying the impacts of stay-at-home policies on atmospheric composition and properties of aerosol and clouds over the European regions using ACTRIS related observations (ACP/AMT inter-journal SI)”. It is not associated with a conference.
We thank Dennis Dalle Mura, Roberto Fruzzetti, Tiziana Cecconi, Marco Stefanelli, and Stefano Fortunato (ARPAT) for PM10 and PM2.5 sample collection and for managing the AMS described in this study.
This paper was edited by Willy Maenhaut and reviewed by two anonymous referees.
Amato, F., Alastuey, A., Karanasiou, A., Lucarelli, F., Nava, S., Calzolai, G., Severi, M., Becagli, S., Gianelle, V. L., Colombi, C., Alves, C., Custódio, D., Nunes, T., Cerqueira, M., Pio, C., Eleftheriadis, K., Diapouli, E., Reche, C., Minguillón, M. C., Manousakas, M.-I., Maggos, T., Vratolis, S., Harrison, R. M., and Querol, X.: AIRUSE-LIFE+: a harmonized PM speciation and source apportionment in five southern European cities, Atmos. Chem. Phys., 16, 3289–3309, https://doi.org/10.5194/acp-16-3289-2016, 2016. a, b, c
ANAS: Osservatorio del traffico, https://www.stradeanas.it/it/le-strade/osservatorio-del-traffico (last access: 16 May 2022), 2021. a
Baldasano, J. M.: COVID-19 lockdown effects on air quality by NO2 in the cities of Barcelona and Madrid (Spain), Sci. Total Environ., 741, 140353, https://doi.org/10.1016/j.scitotenv.2020.140353, 2020. a
Bertram, T. H., Cochran, R. E., Grassian, V. H., and Stone, E. A.: Sea spray aerosol chemical composition: elemental and molecular mimics for laboratory studies of heterogeneous and multiphase reactions, Chem. Soc. Rev., 47, 2374–2400, https://doi.org/10.1039/c7cs00008a, 2018. a
Blanchard, C. L., Tanenbaum, S., and Lawson, D. R.: Differences between weekday and weekend air pollutant levels in Atlanta; Baltimore; Chicago; Dallas-Fort Worth; Denver; Houston; New York; Phoenix; Washington, DC; and surrounding areas, J. Air Waste Manage., 58, 1598–1615, https://doi.org/10.3155/1047-3289.58.12.1598, 2008. a
Broomandi, P., Karaca, F., Nikfal, A., Jahanbakhshi, A., Tamjidi, M., and Kim, J. R.: Impact of COVID-19 event on the air quality in Iran, Aerosol Air Qual. Res., 20, 1793–1804, https://doi.org/10.4209/aaqr.2020.05.0205, 2020. a
Burnett, R., Chen, H., Szyszkowicz, M., Fann, N., Hubbell, B., Pope, C. A., Apte, J. S., Brauer, M., Cohen, A., Weichenthal, S., Coggins, J., Di, Q., Brunekreef, B., Frostad, J., Lim, S. S., Kan, H., Walker, K. D., Thurston G. D., Hayes, R. B., Lim, C. C., Turner, M. C., Jerrett, M., Krewski, D., Gapstur, S. M., Diver, W. R., Ostro, R., Goldberg, D., Crouse, D. L., Martin, R. V., Peters, P., Pinault, L., Tjepkema, M., van Donkelaar, A., Villeneuve, P. J., Miller, A. B., Yin, P., Zhou, M., Wang, L., Janssen, N. A. H., Marra, M., Atkinson, R. W., Tsang, H., Quoc Thach, T., Cannon, J. B., Allen, R. T., Hart, J. E., Laden, F., Cesaroni, G., Forastiere, F., Weinmayr, G., Jaensch, A., Nagel, G., Concin, H., and Spadaro, J. V.: Global estimates of mortality associated with long-term exposure to outdoor fine particulate matter, P. Natl. Acad. Sci. USA, 115, 9592–9597, https://doi.org/10.1073/pnas.1803222115, 2018. a
Calzolai, G., Chiari, M., García Orellana, I., Lucarelli, F., Migliori, A., Nava, S., and Taccetti, F.: The new external beam facility for environmental studies at the Tandetron accelerator of LABEC, Nucl. Instrum. Meth. B, 249, 928–931, https://doi.org/10.1016/j.nimb.2006.03.193, 2006. a
Charron, A., Polo-Rehn, L., Besombes, J.-L., Golly, B., Buisson, C., Chanut, H., Marchand, N., Guillaud, G., and Jaffrezo, J.-L.: Identification and quantification of particulate tracers of exhaust and non-exhaust vehicle emissions, Atmos. Chem. Phys., 19, 5187–5207, https://doi.org/10.5194/acp-19-5187-2019, 2019. a
Chiari, M., Barone, S., Bombini, A., Calzolai, G., Carraresi, L., Castelli, L., Czelusniak, C., Fedi, M. E., Gelli, N., Giambi, F., Giardi, F., Giuntini, L., Lagomarsino, S., Liccioli, L., Lucarelli, L., Manetti, M., Massi, M., Mazzinghi, A., Nava, S., Ottanelli, P., Sciortino, S., Ruberto, C., Sodi, L., Taccetti, F., and Mandò, P. A.: LABEC, the INFN ion beam laboratory of nuclear techniques for environment and cultural heritage, Eur. Phys. J. Plus, 123, 1–28, https://doi.org/10.1140/epjp/s13360-021-01411-1, 2021. a
Chu, B., Zhang, S., Liu, J., Ma, Q., and He, H.: Significant concurrent decrease in PM2.5 and NO2 concentrations in China during COVID-19 epidemic, J. Environ. Sci.-China, 99, 346–353, https://doi.org/10.1016/j.jes.2020.06.031, 2021. a
Collivignarelli, M. C., Abbà, A., Bertanza, G., Pedrazzani, R., Ricciardi, P., and Carnevale Miino, M.: Lockdown for CoViD-2019 in Milan: What are the effects on air quality?, Sci. Total Environ., 732, 1–9, https://doi.org/10.1016/j.scitotenv.2020.139280, 2020. a
Connerton, P., de Assunção, J. V., de Miranda, R. M., Slovic, A. D., Pérez-Martínez, P. J., and Ribeiro, H.: Air quality during covid-19 in four megacities: Lessons and challenges for public health, Int. J. Env. Res. Pub. He., 17, 1–24, https://doi.org/10.3390/ijerph17145067, 2020. a
Dai, Q., Liu, B., Bi, X., Wu, J., Liang, D., Zhang, Y., Feng, Y., and Hopke, P. K.: Dispersion normalized PMF provides insights into the significant changes in source contributions to PM2.5 after the Covid-19 outbreak, Environ. Sci. Technol., 54, 9917–9927, https://doi.org/10.1021/acs.est.0c02776, 2020. a
DPCM: DECRETO DEL PRESIDENTE DEL CONSIGLIO DEI MINISTRI 8 marzo 2020 [Decree of the President of the Council of Ministers], https://www.gazzettaufficiale.it/eli/id/2020/03/08/20A01522/sg, last access: 24 August 2021. a
EEA (European Environment Agency): Air pollution goes down as Europe takes hard measures to combat coronavirus, https://www.eea.europa.eu/highlights/air-pollution-goes-down-as, last access: 24 August 2021. a
Fan, M.‐Y., Zhang, Y.‐L., Lin, Y.‐C., Cao, F., Zhao, Z.‐Y., Sun, Y., Yanmei, Q., Fu, P., and Wang, Y.: Changes of emission sources to nitrate aerosols in Beijing after the clean air actions: Evidence from dual isotope compositions, J. Geophys. Res.-Atmos., 125, e2019JD031998, https://doi.org/10.1029/2019JD031998, 2020. a
Gen, M., Zhang, R., Huang, D. D., Li, Y., and Chan, C. K.: Heterogeneous SO2 oxidation in sulfate formation by photolysis of particulate nitrate, Environ. Sci. Technol. Lett., 6, 86–91, https://doi.org/10.1021/acs.estlett.8b00681, 2019. a
Gerasopoulos, E., Kouvarakis, G., Vrekoussis, M., Donoussis, C., Mihalopoulos, N., and Kanakidou, M.: Photochemical ozone production in the Eastern Mediterranean, Atmos. Environ., 40, 3057–3069, https://doi.org/10.1016/j.atmosenv.2005.12.061, 2006. a
Giannoni, M., Calzolai, G., Chiari, M., Cincinelli, A., Lucarelli, F., Martellini, T., and Nava, S.: A comparison between thermal-optical transmittance elemental carbon measured by different protocols in PM2.5 samples, Sci. Total Environ., 571, 195–205, https://doi.org/10.1016/j.scitotenv.2016.07.128, 2016. a
Gietl, J. K., Lawrence, R., Thorpe, A. J., and Harrison, R. M.: Identification of brake wear particles and derivation of a quantitative tracer for brake dust at a major road, Atmos. Environ., 44, 141–146, https://doi.org/10.1016/j.atmosenv.2009.10.016, 2010. a
Gillies, J. A., Gertler, A. W., Sagebiel, J. C., and Dippel, W. A.: On-Road Particulate Matter (PM2.5 and PM10) Emissions in the Sepulveda Tunnel, Los Angeles, California, Environ. Sci. Technol., 35, 1054–1063, https://doi.org/10.1021/es991320p, 2001. a
Google: COVID-19 Community Mobility Reports, https://www.google.com/covid19/mobility, last access: 24 August 2021. a
Gualtieri, G., Brilli, L., Carotenuto, F., Vagnoli, C., Zaldei, A., and Gioli, B.: Quantifying road traffic impact on air quality in urban areas: A Covid19-induced lockdown analysis in Italy, Environ. Pollut., 267, 115682, https://doi.org/10.1016/j.envpol.2020.115682, 2020. a
Gugamsetty, B., Wei, H., Liu, C. N., Awasthi, A., Hsu, S. C., Tsai, C. J., Roam, G. D., Wu, Y. C., and Chen, C. F.: Source Characterization and Apportionment of PM10, PM2.5 and PM0.1 by Using Positive Matrix Factorization, Aerosol Air Qual. Res., 12, 476–491, https://doi.org/10.4209/aaqr.2012.04.0084, 2012. a
Handler, M., Puls, C., Zbiral, J., Marr, I., Puxbaum, H., and Limbeck, A.: Size and composition of particulate emissions from motor vehicles in the Kaisermühlen-Tunnel, Vienna, Atmos. Environ., 42, 2173–2186, https://doi.org/10.1016/j.atmosenv.2007.11.054, 2008. a
Harrison, R. M., Jones, A. M., Gietl, J., Yin, J., and Green, D. C.: Estimation of the Contributions of Brake Dust, Tire Wear, and Resuspension to Nonexhaust Traffic Particles Derived from Atmospheric Measurements, Environ. Sci. Technol., 46, 6523–6529, https://doi.org/10.1021/es300894r, 2012. a
Hashim, B. M., Al-Naseri, S. K., Al-Maliki, A., and Al-Ansari, N.: Impact of COVID-19 lockdown on NO2, O3, PM2.5 and PM10 concentrations and assessing air quality changes in Baghdad, Iraq, Sci. Total Environ., 754, 141978, https://doi.org/10.1016/j.scitotenv.2020.141978, 2021. a
Hicks, W., Beevers, S., Tremper, A. H., Stewart, G., Priestman, M., Kelly, F. J., Lanoisellé, M., Lowry, D., and Green, D. C.: Quantification of non-exhaust particulate matter traffic emissions and the impact of COVID-19 lockdown at London Marylebone road, Atmosphere-Basel, 12, 190, https://doi.org/10.3390/atmos12020190, 2021. a
Huang, G. and Sun, K.: Non-negligible impacts of clean air regulations on the reduction of tropospheric NO2 over East China during the COVID-19 pandemic observed by OMI and TROPOMI, Sci. Total Environ., 745, 141023, https://doi.org/10.1016/j.scitotenv.2020.141023, 2020. a
Jain, S. and Sharma, T.: Social and travel lockdown impact considering coronavirus disease (Covid-19) on air quality in megacities of india: Present benefits, future challenges and way forward, Aerosol Air Qual. Res., 20, 1222–1236, https://doi.org/10.4209/aaqr.2020.04.0171, 2020. a
Keller, C. A., Evans, M. J., Knowland, K. E., Hasenkopf, C. A., Modekurty, S., Lucchesi, R. A., Oda, T., Franca, B. B., Mandarino, F. C., Diaz Suarez, M. V., Ryan, R. G., Fakes, L. H., and Pawson, S.: Global impact of COVID-19 restrictions on the surface concentrations of nitrogen dioxide and ozone, Atmos. Chem. Phys., 21, 3555–3592, https://doi.org/10.5194/acp-21-3555-2021, 2021. a
Kerimray, A., Baimatova, N., Ibragimova, O. P., Bukenov, B., Kenessov, B., Plotitsyn, P., and Karaca, F.: Assessing air quality changes in large cities during COVID-19 lockdowns: The impacts of traffic-free urban conditions in Almaty, Kazakhstan, Sci. Total Environ., 730, 139179, https://doi.org/10.1016/j.scitotenv.2020.139179, 2020. a
Lian, X., Huang, J., Huang, R., Liu, C., Wang, L., and Zhang, T.: Impact of city lockdown on the air quality of COVID-19-hit of Wuhan city, Sci. Total Environ., 742, 140556, https://doi.org/10.1016/j.scitotenv.2020.140556, 2020. a
Lucarelli, F., Calzolai, G., Chiari, M., Giannoni, M., Mochi, D., Nava, S., and Carraresi, L.: The upgraded external-beam PIXE/PIGE set-up at LABEC for very fast measurements on aerosol samples, Nucl. Instrum. Meth. B, 318, 55–59, https://doi.org/10.1016/j.nimb.2013.05.099, 2014. a
Lucarelli, F., Calzolai, G., Chiari, M., Nava, S., and Carraresi, L.: Study of atmospheric aerosols by IBA techniques: The LABEC experience, Nucl. Instrum. Meth. B, 417, 121–127, https://doi.org/10.1016/j.nimb.2017.07.034, 2018. a
Manousakas, M., Diapouli, E., Belis, C. A., Vasilatou, V., Gini, M., Lucarelli, F., Querol, X., and Eleftheriadis, K.: Quantitative assessment of the variability in chemical profiles from source apportionment analysis of PM10 and PM2.5 at different sites within a large metropolitan area, Environ. Res., 192, 110257, https://doi.org/10.1016/j.envres.2020.110257, 2021. a
Massimi, L., Pietrodangelo, A., Frezzini, M. A., Ristorini, M., De Francesco, N., Sargolini, T., Amoroso, A., Di Giosa, A., Canepari, S., and Perrino, C.: Effects of COVID-19 lockdown on PM10 composition and sources in the Rome Area (Italy) by elements' chemical fractionation-based source apportionment, Atmos. Res., 266, 105970, https://doi.org/10.1016/j.atmosres.2021.105970, 2022. a
Matthaios V. N., Lawrence, J., Martins, M. A. G., Ferguson, S. T., Wolfson, J. M., Harrison, R. M., and Koutrakis, P.: Quantifying factors affecting contributions of roadway exhaust and non-exhaust emissions to ambient PM10–2.5 and PM2.5–0.2 particles, Sci. Total Environ., 835, 155368, https://doi.org/10.1016/j.scitotenv.2022.155368, 2022. a
Mor, S., Kumar, S., Singh, T., Dogra, S., Pandey, V., and Ravindra, K.: Impact of COVID-19 lockdown on air quality in Chandigarh, India: Understanding the emission sources during controlled anthropogenic activities, Chemosphere, 263, 127978, https://doi.org/10.1016/j.chemosphere.2020.127978, 2021. a
Nava, S., Lucarelli, F., Amato, F., Becagli, S., Calzolai, G., Chiari, M., Giannoni, M., Traversi, R., and Udisti, R.: Biomass burning contributions estimated by synergistic coupling of daily and hourly aerosol composition records, Sci. Total Environ., 511, 11–20, https://doi.org/10.1016/j.scitotenv.2014.11.034, 2015. a, b
Nava, S., Calzolai, G., Chiari, M., Giannoni, M., Giardi, F., Becagli, S., Severi, M., Traversi, R., and Lucarelli, F.: Source apportionment of PM2.5 in Florence (Italy) by PMF analysis of aerosol composition records, Atmosphere-Basel, 11, 484, https://doi.org/10.3390/atmos11050484, 2020. a, b
Ntziachristos, L., Ning, Z., Geller, M. D., Sheesley, R. J., Schauer, J. J., and Sioutas, C.: Fine, ultrafine and nanoparticle trace element compositions near a major freeway with a high heavy-duty diesel fraction, Atmos. Environ., 41, 5684–5696, https://doi.org/10.1016/j.atmosenv.2007.02.043, 2007. a
Paatero, P. and Tapper, U.: Positive matrix factorization: A non-negative factor model with optimal utilization of error estimates of data values, Environmetrics, 5, 111–126, https://doi.org/10.1002/env.3170050203, 1994. a
Piazzalunga, A., Belis, C., Bernardoni, V., Cazzuli, O., Fermo, P., Valli, G., and Vecchi, R.: Estimates of wood burning contribution to PM by the macro-tracer method using tailored emission factors, Atmos. Environ., 45, 6642–6649, https://doi.org/10.1016/j.atmosenv.2011.09.008, 2011. a
Polissar, A. V., Hopke, P. K., Paatero, P., Malm, W. C., and Sisler, J. F.: Atmospheric aerosol over Alaska, 2. Elemental composition and sources, J. Geophys. Res., 103, 19045–19057, https://doi.org/10.1029/98JD01212, 1998. a, b
R Core Team: R: A language and environment for statistical computing. R Foundation for Statistical Computing, Vienna, Austria, https://www.R-project.org/ (last access: 16 May 2022), 2021. a
Regione Toscana: Progetto PATOS Particolato Atmosferico in Toscana, https://www.regione.toscana.it/-/progetto-patos-particolato-atmosferico-in-toscana (last access: 16 May 2022), 2021. a, b
Schipa, I., Tanzarella, A., and Mangia, C.: Differences between weekend and weekday ozone levels over rural and urban sites in Southern Italy, Environ. Monit. Assess., 156, 509–523, https://doi.org/10.1007/s10661-008-0501-5, 2009. a
Seinfeld, J. H.: Atmospheric Chemistry and Physics of Air Pollution, Wiley, New York, NY, USA, ISBN 9780471828570, 1986. a
Selvam, S., Muthukumar, P., Venkatramanan, S., Roy, P. D., Manikanda Bharath, K., and Jesuraja, K.: SARS-CoV-2 pandemic lockdown: Effects on air quality in the industrialized Gujarat state of India, Sci. Total Environ., 737, 140391, https://doi.org/10.1016/j.scitotenv.2020.140391, 2020. a
Sharma, S., Zhang, M., Anshika, Gao, J., Zhang, H., and Kota, S. H.: Effect of restricted emissions during COVID-19 on air quality in India, Sci. Total Environ., 728, 138878, https://doi.org/10.1016/j.scitotenv.2020.138878, 2020. a
Sharma, S. K., Sharma, A., Saxena, M., Choudhary, N., Masiwal, R., Mandal, T. K., and Sharma, C.: Chemical characterization and source apportionment of aerosol at an urban area of Central Delhi, India, Atmos. Pollut. Res., 7, 110–121, https://doi.org/10.1016/j.apr.2015.08.002, 2016. a
Sicard, P., Paoletti, E., Agathokleous, E., Araminienė, V., Proietti, C., Coulibaly, F., and De Marco, A.: Ozone weekend effect in cities: Deep insights for urban air pollution control, Environ. Res., 191, 110193, https://doi.org/10.1016/j.envres.2020.110193, 2020a. a
Sicard, P., De Marco, A., Agathokleous, E., Feng, Z., Xu, X., Paoletti, E., Dieguez Rodriguez, J. J., and Calatayud, V.: Amplified ozone pollution in cities during the COVID-19 lockdown, Sci. Total Environ., 735, 139542, https://doi.org/10.1016/j.scitotenv.2020.139542, 2020b. a
Signorelli, C., Scognamiglio, T., and Odone, A.: COVID-19 in Italy: Impact of containment measures and prevalence estimates of infection in the general population, Acta Biomed., 91, 175–179, https://doi.org/10.23750/abm.v91i3-S.9511, 2020. a
Singh, V., Singh, S., Biswal, A., Kesarkar, A. P., Mor, S., and Ravindra, K.: Diurnal and temporal changes in air pollution during COVID-19 strict lockdown over different regions of India, Environ. Pollut., 266, 115368, https://doi.org/10.1016/j.envpol.2020.115368, 2020. a
Thorpe, A. and Harrison, R. M.: Sources and properties of non-exhaust particulate matter from road traffic: A review, Sci. Total Environ., 400, 270–282, https://doi.org/10.1016/j.scitotenv.2008.06.007, 2008. a
Viana, M., Kuhlbusch, T. A., Querol, X., Alastuey, A., Harrison, R. M., Hopke, P. K., Winiwarter, W., Vallius, M., Szidat, S., Prévôt, A. S. H., Hueglin, C., Bloemen, H., Wåhlin, P., Vecchi, R., Miranda, A. I., Kasper-Giebl, A., Maenhaut, W., and Hitzenberger, R.: Source apportionment of PM in Europe: A review of methods and results, J. Aerosol Sci., 39, 827–849, https://doi.org/10.1016/j.jaerosci.2008.05.007, 2008. a
Vicente, E. D. and Alves, C. A.: An overview of particulate emissions from residential biomass combustion, Atmos. Res., 199, 159–185, https://doi.org/10.1016/j.atmosres.2017.08.027, 2018. a
Wang, H., Miao, Q., Shen, L., Yang, Q., Wu, Y., Wei, H., Yin, Y., Zhao, T., Zhu, B., and Lu, W.: Characterization of the aerosol chemical composition during the COVID-19 lockdown period in Suzhou in the Yangtze River Delta, China, J. Environ. Sci.-China, 102, 110–122, https://doi.org/10.1016/j.jes.2020.09.019, 2021a. a
Wang, H., Miao, Q., Shen, L., Yang, Q., Wu, Y., and Wei, H.: Air pollutant variations in Suzhou during the 2019 novel coronavirus (COVID-19) lockdown of 2020: High time-resolution measurements of aerosol chemical compositions and source apportionment, Environ. Pollut., 271, 116298, https://doi.org/10.1016/j.envpol.2020.116298, 2021b. a
Wang, P., Chen, K., Zhu, S., Wang, P., and Zhang, H.: Severe air pollution events not avoided by reduced anthropogenic activities during COVID-19 outbreak, Resour. Conserv. Recy., 158, 104814, https://doi.org/10.1016/j.resconrec.2020.104814, 2020. a
WHO (World Health Organization): Regional Office for Europe: WHO announces COVID-19 outbreak a pandemic, http://www.euro.who.int/en/health-topics/health-emergencies/coronavirus-covid-19/news/news/2020/3/who-announces-covid-19-outbreak-a-pandemic, last access: 24 August 2021. a
Wik, A. and Dave, G.: Occurrence and effects of tire wear particles in the environment – A critical review and an initial risk assessment, Environ. Pollut., 157, 1–11, https://doi.org/10.1016/j.envpol.2008.09.028, 2009. a
Xiang, J., Austin, E., Gould, T., Larson, T., Shirai, J., Liu, Y., Marshall, J., and Seto, E.: Impacts of the COVID-19 responses on traffic-related air pollution in a Northwestern US city, Sci. Total Environ., 747, 141325, https://doi.org/10.1016/j.scitotenv.2020.141325, 2020. a
Zhao, Y., Zhang, K., Xu, X., Shen, H., Zhu, X., Zhang, Y., Hu, Y., and Shen, G.: Substantial changes in nitrogen dioxide and ozone after excluding meteorological impacts during the COVID-19 outbreak in mainland China, Environ. Sci. Tech. Let., 7, 402–408, https://doi.org/10.1021/acs.estlett.0c00304, 2020. a
Zhao, Z. Y., Cao, F., Fan, M.-Y., Zhang, W.-Q., Zhai, X.-Y., Wang, Q., and Zhang, Y.-L.: Coal and biomass burning as major emissions of NOX in Northeast China: Implication from dual isotopes analysis of fine nitrate aerosols, Atmos. Environ., 242, 117762, https://doi.org/10.1016/j.atmosenv.2020.117762, 2020. a
Zheng, H., Kong, S., Chen, N., Yan, Y., Liu, D., Zhu, B., Xu, K, Cao, W., Ding, Q., Lan, B., Zhang, Z., Zheng, M., Fan, Z., Cheng, Y., Zheng, S., Yao, L., Bai, Y., Zhao, T., and Qi, S.: Significant changes in the chemical compositions and sources of PM2.5 in Wuhan since the city lockdown as COVID-19, Sci. Total Environ., 739, 140000, https://doi.org/10.1016/j.scitotenv.2020.140000, 2020. a