the Creative Commons Attribution 4.0 License.
the Creative Commons Attribution 4.0 License.
 | 03 Aug 2022
Arctic spring and summertime aerosol optical depth baseline from long-term observations and model reanalyses – Part 2: Statistics of extreme AOD events, and implications for the impact of regional biomass burning processes
Jianglong Zhang
Norm T. O'Neill
Jeffrey S. Reid
Travis D. Toth
Blake Sorenson
Edward J. Hyer
James R. Campbell
Keyvan Ranjbar
In a companion paper (Xian et al., 2022, part 1 of the study), we present an Arctic aerosol optical depth (AOD) climatology and trend analysis for 2003–2019 spring and summertime periods derived from a combination of aerosol reanalyses, remote-sensing retrievals, and ground observations. Continued from the previous discussion and as the second part of the study, we report the statistics and trends of Arctic AOD extreme events using the U.S. Navy Aerosol Analysis and Prediction System ReAnalysis version 1 (NAAPS-RA v1), the sun photometer data from the AErosol RObotic NETwork (AERONET) sites, and the oceanic Maritime Aerosol Network (MAN) measurements. Here, extreme AOD events are defined as events with AOD exceeding the 95th percentile (denoted “AOD95”) of AOD distributions for given locations using 6-hourly or daily AOD data. While AERONET and MAN data estimate the Arctic median 550 nm AOD value to be 0.07, the 95th percentile value is 0.24. Such extreme events are dominated by fine-mode aerosol particles, largely attributable to biomass burning (BB) smoke events for the North American Arctic, the Asian Arctic, and most areas of the Arctic Ocean. However, extreme AOD events for the lower European Arctic are more attributable to anthropogenic and biogenic fine particles. The extreme-event occurrence dominance of sea salt is largely limited to the North Atlantic and Norwegian Sea. The extreme AOD amplitudes of anthropogenic and biogenic fine-mode and sea salt AOD are, however, significantly lower than those regions where extreme smoke AOD is dominant. Even for sites distant from BB source regions, BB smoke is the principal driver of AOD variation above the AOD95 threshold.
Maximum AOD values in the high Arctic in 2010–2019 have increased compared to 2003–2009, indicating stronger extreme BB smoke influence in more recent years. The occurrence of extreme smoke events tended to be more equally distributed over all months (April–August) during the 2003–2009 period while being more concentrated in the late season (July–August) during the 2010–2019 period. The temporal shift of the occurrence of AOD extreme events is likely due to improved control of early-season agriculture burning, climate-change-related increases in summertime lightning frequencies, and a reduction in anthropogenic pollution over the 2010–2019 period.
- Article
(14935 KB) - Full-text XML
- Companion paper
- Companion paper
-
Supplement
(867 KB) - BibTeX
- EndNote


Warming faster than the rest of the world, the Arctic is a focal point for global warming (Serreze and Francis, 2006; Serreze and Barry, 2011). Interactions between the atmosphere, ocean, land surface, and sea ice, compounded by numerous human factors make the Arctic climate system challenging to predict, with large diversity between current numerical model outcomes (IPCC, 2021). Aerosol particles from anthropogenic and natural sources affect regional energy balance through direct radiative processes and indirect cloud processes (Quinn et al., 2008; Flanner, 2013; Sand et al., 2013; Markowicz et al., 2021; Yang et al., 2018). When deposited on the surface of snow and ice, light-absorbing aerosol particles, including dust and black/brown carbon from biomass burning and anthropogenic emissions, can trigger albedo feedbacks and accelerate melting (Hansen and Nazarenko, 2004; Jacobson, 2004; Flanner et al., 2007; Skiles et al., 2018; Dang et al., 2017; Kang et al., 2020).
Arctic aerosol concentrations are in general relatively low, with spring and summertime median/mean 550 nm aerosol optical depths (AODs) of 0.06–0.07 (e.g., Tomasi et al., 2007; Saha et al., 2010; AboEl-Fetouh et al., 2020) as compared to a global mean of roughly 0.20 over land and 0.12 over water (e.g., Levy et al., 2010; Lynch et al., 2016; Schutgens et al., 2020; Sogacheva et al., 2020). Extreme AOD events do occur within the Arctic, mostly associated with large-scale transport from lower latitudes. Biomass burning (BB) smoke from boreal wildfires, for example, can episodically result in record-high Arctic AOD (Lund Myhre et al., 2007; Stohl et al., 2007; Markowicz et al., 2016; Ranjbar et al., 2019). Some strong smoke events were recorded during intensive field campaigns, including the Arctic Research of the Composition of the Troposphere from Aircraft and Satellites (ARCTAS) and the Aerosol, Radiation, and Cloud Processes affecting Arctic Climate (ARCPAC) campaigns in the summer of 2008 (Matsui et al., 2011; Saha et al., 2010; McNaughton et al., 2011). More extreme BB smoke cases in the Arctic can be found in Sect. 3.3.
Extreme AOD events cause large perturbations in regional energy balance (e.g., Lund Myhre et al., 2007; Stone et al., 2008; Lisok et al., 2018). For example, a BB smoke transport event from North America to the high-Arctic region of Svalbard in early July 2015 led to the 500 nm AOD exceeding 1.2 at Spitsbergen (Markowicz et al., 2016). The 2 d mean aerosol direct radiative forcing was estimated to cause overall cooling (−79 W m−2 at the surface and −47 W m−2 at the top of the atmosphere). However, a corresponding atmospheric heating rate profile was solved of up to 1.8 K d−1 within the BB plume (Lisok et al., 2018). Over bright snow and ice surfaces, or above clouds, top of the atmosphere BB smoke forcing can turn from negative to positive (i.e., warming) by reducing columnar albedo (Yoon et al., 2019; Markowicz et al., 2021).
Although the microphysical impacts of aerosol particles on Arctic clouds and precipitation processes are generally more difficult to measure and quantify, Arctic clouds are generally believed to be more sensitive to changes in the relatively low concentration of aerosols compared with the lower latitudes (Prenni et al., 2007; Mauritsen et al., 2011; Birch et al., 2012; Coopman et al., 2018; Wex et al., 2019). Extreme aerosol events correspond with an influx of relatively large concentrations of potential cloud condensation nuclei (CCN) and/or ice-nucleating particles (INPs), in what is otherwise a comparatively pristine background environment (Mauritsen et al., 2011; Leck and Svensson, 2015). Such extreme events will accordingly have observable impacts on cloud albedo, lifetime, phase, and probability of precipitation (e.g., Lance et al., 2011; Zhao and Garrett, 2015; Zamora et al., 2016; Bossioli et al., 2021) and further influence the regional energy budget. Dry deposition (and blowing snow processes), as well as wet deposition of BB smoke particles, can also trigger sustained surface radiative forcing by inducing surface snow discoloration and attendant surface albedo reduction (Warren and Wiscombe, 1980; Stohl et al., 2007; Hadley and Kirchstetter, 2012).
Extreme aerosol events, especially BB smoke events, often modulate the interannual variability of Arctic AOD (Xian et al., 2022), as well as to the total annual aerosol budget in the Arctic. The modeling study by DeRepentigny et al. (2021) shows, in comparison with BB emissions characterized by a fixed annual cycle, that the inclusion of interannually varying BB emissions leads to larger Arctic climate variability and enhanced sea ice loss. Their finding illustrates the unique sensitivity of climate-relevant processes to regional aerosol interannual variability and further suggests that extreme aerosol events play an important Arctic climate role. It is accordingly important to understand how extreme aerosol-event statistics change with the changing Arctic climate to better inform climate simulations and our baseline understanding of how the region is poised to evolve.
This is the second of two papers examining spring and summertime Arctic AOD climatologies and their trends. In Part 1 (Xian et al., 2022), we report a baseline Arctic AOD climatology from the AErosol RObotic NETwork (AERONET), the Maritime Aerosol Network (MAN), and satellite AOD data for those two seasons and the skill of three reanalysis AOD products in simulating those climatologies. The reanalyses and spaceborne retrievals show consistent climatological spatial patterns and trends. Overall, AOD exhibits a multi-year negative trend for springtime and a positive trend for summertime during 2003–2019, due to an overall decrease in sulfate/anthropogenic pollution and a significant summertime increase in BB smoke. This second paper focuses on the statistics and trends of extreme Arctic AOD events. The data and methods we employ are described in Sect. 2, while results are provided in Sect. 3. Conclusions are presented in Sect. 4.
2.1 AERONET
The AErosol RObotic NETwork (AERONET) is a federated ground-based sun photometer network with over 600 active sites across the globe. AERONET's Cimel photometers measure sun and sky radiance at several wavelengths, ranging from the near-ultraviolet to the near-infrared. While the exact set of bands depend on the model, all Cimel configurations include 440, 670, 870, and 1020 nm bands. All the sites used here also included 380 and 500 nm bands. The network has been providing high-accuracy daytime measurements of aerosol optical properties since the 1990s (Holben et al., 1998, 2001). Cloud-screened and quality-assured Version 3 Level 2 AERONET data (Giles et al., 2019) are used in this study.
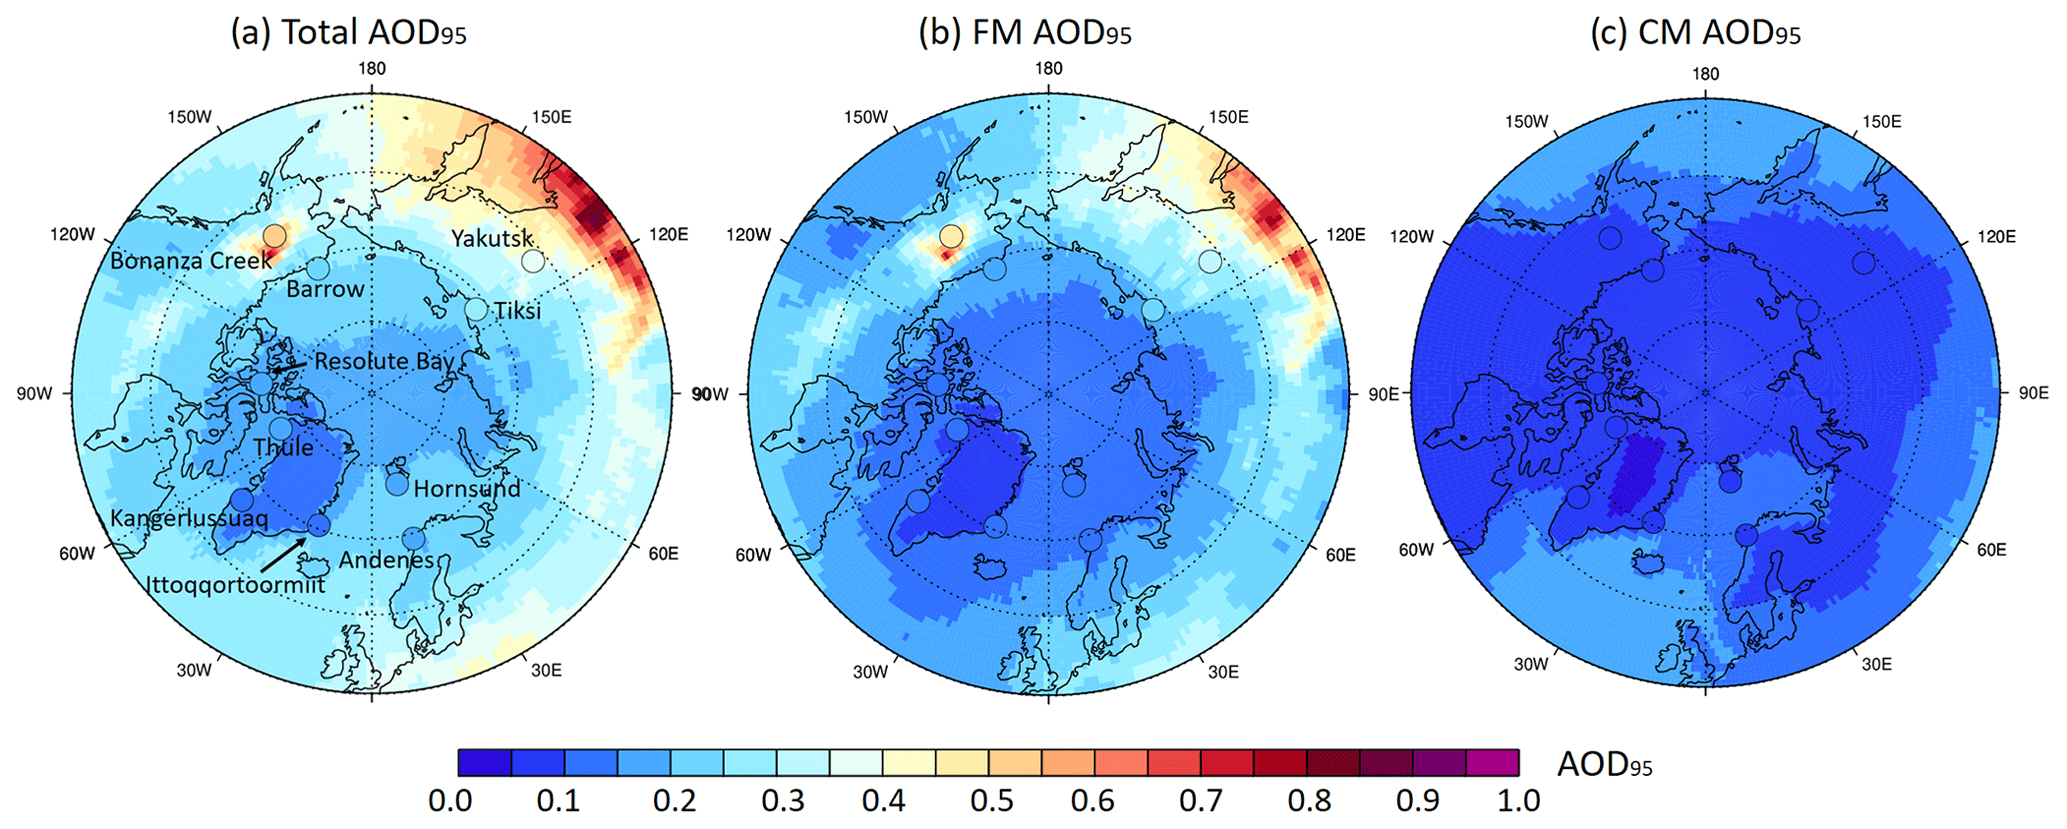
Figure 1Total, FM, and CM AOD at the 95th percentile (AOD95) for the March–August time frame from the NAAPS-RA and the 10 AERONET sites based on 6-hourly data between 2003–2019.
Fine-mode (FM) and coarse-mode (CM) AOD at 550 nm are derived based on the spectral deconvolution algorithm (SDA) of O'Neill et al. (2001, 2003) and averaged over 6 h time bins. The same 10 AERONET sites employed in Part 1, were selected (Fig. 1 of this paper) for this study. Those sites had been chosen based on their regional representativeness as well as the availability of data records between January 2003 and December 2019 period of study.
Optically thin clouds, mostly cirrus, occasionally contaminate CM aerosol retrievals in Level 2, Version 3 AERONET data (Ranjbar et al., 2022). Data were manually inspected and retrievals screened using Moderate Resolution Imaging Spectroradiometer (MODIS) imagery at visible wavelengths from NASA Worldview (https://worldview.earthdata.nasa.gov/, last access: 15 May 2022) and by comparing the 6-hourly U.S. Navy Aerosol Analysis and Prediction System ReAnalysis version 1 (NAAPS-RA v1) with AERONET AODs. This step is likely an incomplete one, given the likely lower sensitivity of MODIS imagers to thin clouds (Marquis et al., 2017). As such, CM AODs that deviate by more than the 3σ level from the background climatological mean were also removed (as per AboEl-Fetouh et al., 2020).
2.2 AERONET Marine Aerosol Network AOD datasets
The Marine Aerosol Network (MAN) is part of the broader AERONET global network: in this case however, it is limited to AODs collected over open water. Handheld Microtops sun photometers are deployed during research cruises of opportunity (Smirnov et al., 2009, 2011). Data processing is similar to that of AERONET with product nomenclature similar to AERONET. Level 2 data acquired above 70∘ N in the 2003–2019 period are used in this study. FM and CM AOD at 550 nm are derived using the SDA and averaged over 6 h time bins.
2.3 NAAPS AOD reanalysis v1
The Navy Aerosol Analysis and Prediction System (NAAPS) AOD reanalysis (NAAPS-RA) v1 was developed at the U.S. Naval Research Laboratory. It provides speciated AOD and concentrations at a global scale with 1∘ × 1∘ latitude–longitude and 6 h resolution for 2003–2019 (Lynch et al., 2016). NAAPS-RA is driven by the Navy Operational Global Analysis and Prediction System (NOGAPS; Hogan and Rosmond, 1991), with satellite precipitation applied within the tropics to mitigate model precipitation errors (Xian et al., 2009). NAAPS-RA features the assimilation of quality-controlled AOD retrievals from MODIS and Multi-angle Imaging SpectroRadiometer (MISR) (Zhang and Reid, 2006; Hyer et al., 2011; Shi et al., 2011, 2013) with the Navy Atmospheric Variational Data Assimilation System for AOD (NAVDAS-AOD, Zhang et al., 2008). A first-order approximation of secondary organic aerosol (SOA) processes is adopted. Production of SOA from its precursors is assumed to be instantaneous and is included with the original anthropogenic species to form a combined anthropogenic and biogenic fine (ABF) species. In other words, ABF is a mixture of sulfate, BC, organic aerosols, and secondary organic aerosols from non-BB sources. Monthly anthropogenic emissions come from a 2000–2010 average of the ECMWF MACC inventory (e.g., Granier et al., 2011). BB smoke is derived from the Fire Locating and Modeling of Burning Emissions inventory (FLAMBE, Reid et al., 2009). This version of FLAMBE uses MODIS near-real-time satellite-based thermal anomaly data to initialize the smoke source where corrections that minimize the impact of inter-orbit variations are applied to the MODIS data (Lynch et al., 2016). FLAMBE processing is applied consistently through the reanalysis time period while a smoke particle emission climatology and its spring and summertime trends (both north of 50 and 60∘ N) are provided in Fig. 12 of Part 1 (Xian et al., 2022). Dust is emitted dynamically and is a function of modeled friction velocity to the fourth power, surface wetness, and surface erodibility. In this model run, erodibility is adopted from Ginoux et al. (2001) with regional tuning. Sea salt modeling is the same as Witek et al. (2007), and sea salt emission is driven dynamically by sea surface wind.
Table 1Geographical coordinates along with the total, FM, and CM AOD statistics (2003–2019 depending on availability) for AERONET and 6-hourly NAAPS-RA 550 nm performance indicators versus AERONET. These numbers are given as information: as indicated above, the table statistics in Part 1 were explicitly computed using monthly binned data (which were, in turn, derived from the 6 h data). The second to last row shows the same statistics for MAN AODs acquired north of 70∘ N as the bias reference. “n” represents the total number of 6 h AODs for 2003–2019, including a small amount of AERONET data from September besides the March–August time frame.
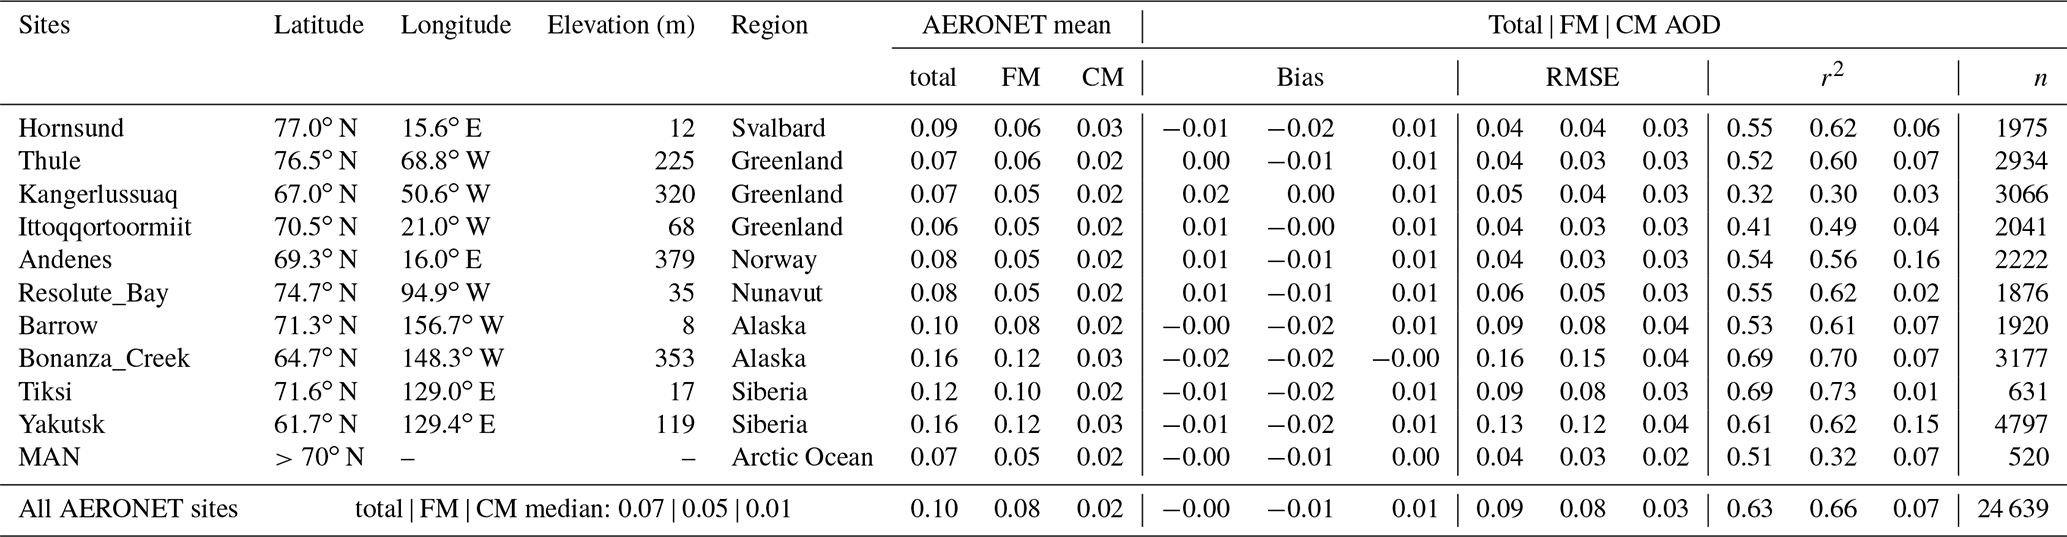
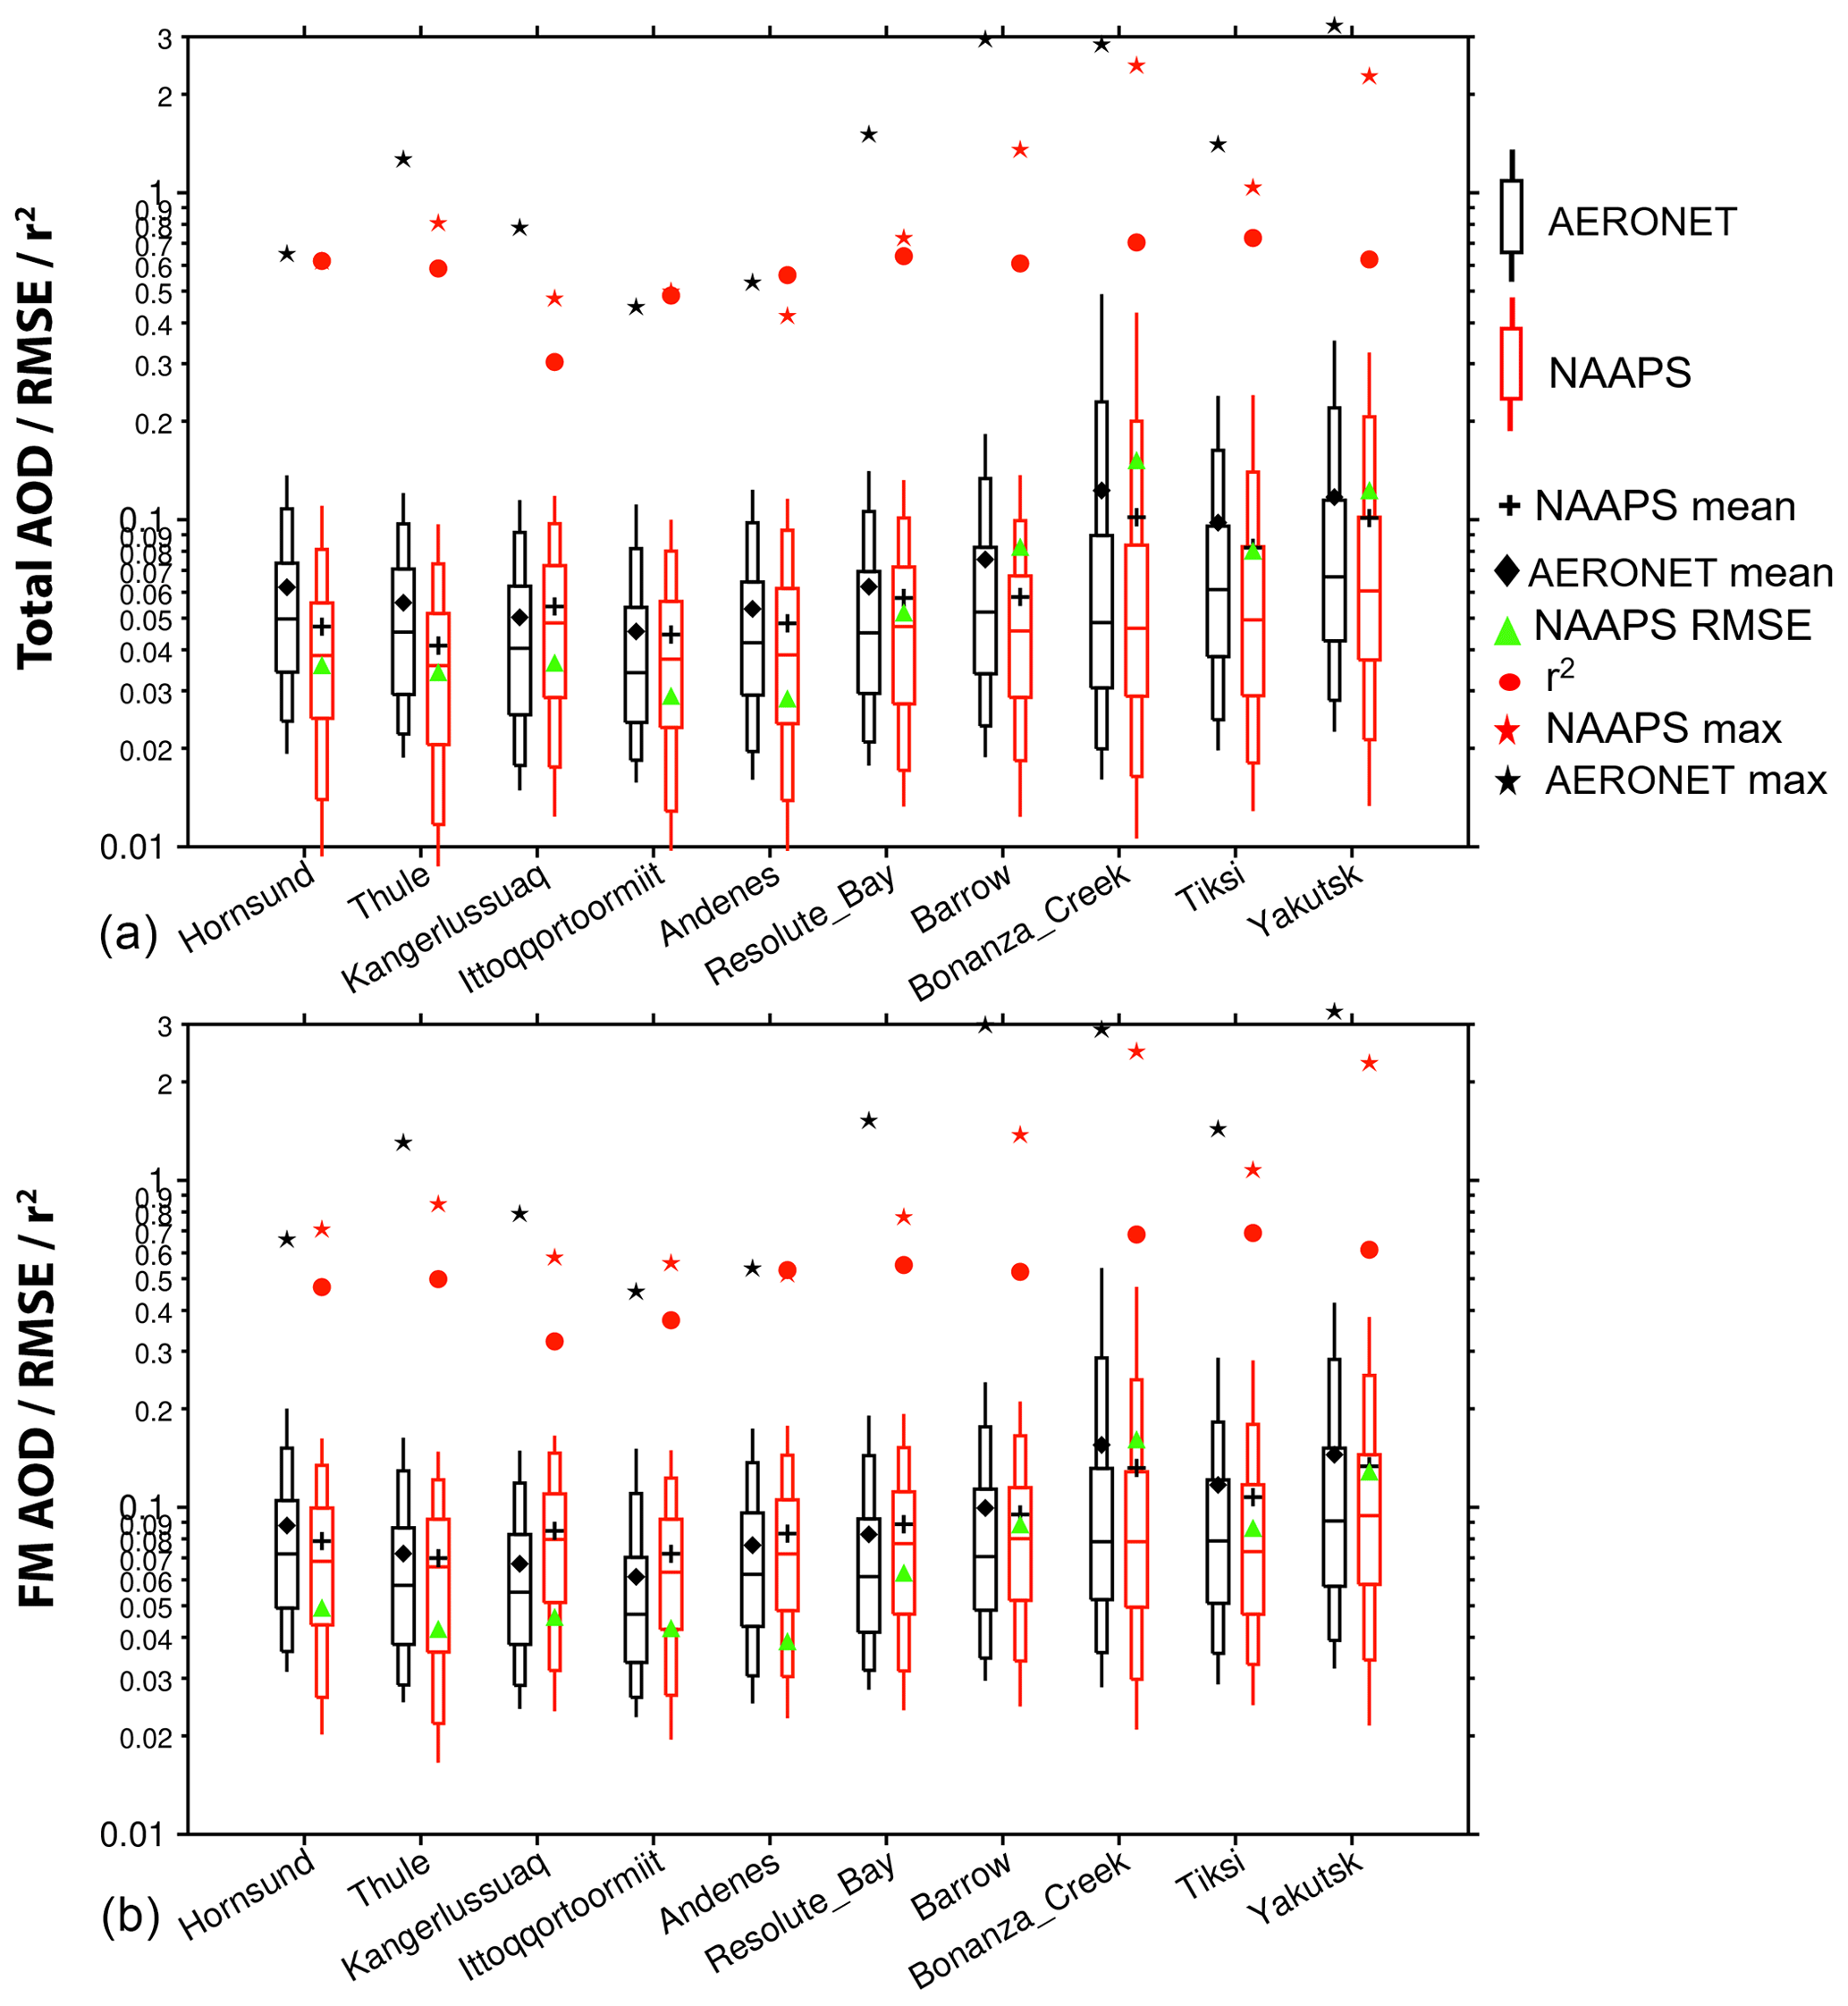
Figure 2Comparison of the 6-hourly NAAPS-RA and pairwise AERONET V3L2 data for (a) total AOD and (b) FM AOD at 550 nm. The segments from the top to the bottom of the box and whiskers represent, in order, the 95th, 90th, 75th, 50th, 25th, 10th, and 5th percentiles of data for the 10 AERONET sites of Table 1 and Fig. 1 for the 2003–2019 time period. Also shown are the site means of the NAAPS-RA and AERONET AODs and the NAAPS-RA RMSE, the coefficient of determination (r2) between the NAAPS-RA and AERONET, and the maximum AERONET and NAAPS-RA AODs. Note that values greater than 3.0 are not shown.
Verification of monthly binned NAAPS-RA total AODs at 550 nm using monthly binned AERONET data from 10 Arctic sites (Tables 2–4 of Part 1, Xian et al., 2022) shows that NAAPS-RA is able to capture the AOD interannual variability. The spatial distributions and magnitudes of climatological and seasonal AOD averages and their trends for 2003–2019 are also consistent with those derived from MODIS, MISR, and the Cloud-Aerosol Lidar with Orthogonal Polarization (CALIOP) (Part 1). NAAPS-RA is also shown to be able to capture biomass burning smoke transport events into the polar regions in various case studies (e.g., Markowicz et al., 2016, 2017; Khan et al., 2017, 2018, 2019; Ranjbar et al., 2019; AboEl-Fetouh et al., 2022).
2.4 Data analysis methods
Our study period is January 2003 to December 2019, the same principal study period as used in Part 1. We define extreme events as those corresponding to AOD exceeding the 95th percentile mark in 6 h or daily AOD data at a specific location or across a given region (the region north of 70∘ N for example). We employ 6 h AERONET AODs as well as speciated daily and 6 h NAAPS-RA AOD to depict the frequency and magnitude of the large FM AOD events. Pairwise data are used for verification. “Pairwise” refers to those NAAPS-RA AODs that correspond to a resampled AERONET or MAN AOD whose ±3 h bin contains at least one AERONET/MAN retrieval. Three independent aerosol reanalysis products were used in Part 1 of the study. For this study, the NAAPS-RA reanalysis was chosen given its slightly better performance in terms of FM and total-AOD bias, RMSE, and r2 scores (Part 1) as well as its capability of separating BB smoke from other aerosol species. To simplify some of the discussion below, we frequently employed the symbol “AODn” to represent the AOD associated with the nth percentile of its cumulative (histogram) distribution. One important application of this AODn formulation is to employ a particular value (AOD95) as a threshold for the definition of extreme events (see Sect. 3.1 below). AOD75, AOD90, AOD99, AOD99.5, and maximum AOD are also calculated to show AOD gradients for high AODs. A local extreme total-AOD event for the NAAPS-RA means AOD >AOD95 for the model grid cell of 1∘ × 1∘ (latitude–longitude). Again, we define the Arctic and the high Arctic as regions north of 60 and 70∘ N, respectively. To reference source influences from lower latitudes, the area of 50–90∘ N is included for context.
Regional statistics and trends of extreme AOD events are presented in this section: 6 h AERONET AOD as well as speciated daily and 6 h NAAPS-RA AOD are employed to characterize the frequency and magnitude of strong FM AOD events.
3.1 Verification of NAAPS-RA AOD over the Arctic
The reanalysis performance for 6 h time bins was evaluated in order to study extreme events. Our choice of AOD95 as an extreme-event threshold was influenced by the fact that it was an upper-limit cumulative probability indicator that was robust. We reasoned, at the same time, that it should be comparable with the analog parameter derived from NAAPS-RA. Figure 1 displays NAAPS-RA AOD95 overplotted with those from the 10 selected AERONET sites for spring and summertime 2003–2019. NAAPS-RA appears to successfully capture the AOD95 amplitude and spatial pattern as well as those of FM AOD95 and CM AOD95. It also shows that FM is the main contributor to AOD95 in the Arctic.
Detailed geographical coordinates of the 10 AERONET sites employed in our study are included in Table 1 as well as the simulation performance indicators of NAAPS-RA 550 nm total, FM, and CM AOD. These AERONET parameters are an analog to parameters used in the first part of the study and its Table 1 statistics, except that the averaging period extends across both the spring and summer seasons, as the averaging period is mostly confined to the April–August time frame. NAAPS-RA performance indicators relative to MAN data are shown in Figs. S1 and S2.
NAAPS-RA performance for this large averaging period is reasonable for FM and total AOD, though it is less skillful at predicting CM AOD. The FM AOD exhibits an average (Table 1) bias over all stations of −0.01, a root-mean-square error (RMSE) of 0.08, and a coefficient of determination (r2) of 0.66. RMSE values for total and FM AOD are generally large for sites vulnerable to strong smoke influence, e.g., Bonanza Creek, Barrow, Tiksi, and Yakutsk. Total-AOD r2 values are mostly between 0.5–0.7 except for Kangerlussuaq and Ittoqqortoormiit. FM AOD r2 values exceed those of the total AOD for all sites except Kangerlussuaq. The 6 h binned Table 1 total-AOD bias is similar to the monthly binned NAAPS-RA bias results of Table 2 in Part 1 (Xian et al., 2022). This is due to the numerous 6 h samples included in the averaging process. In contrast, the Table 1 RMSE values are roughly doubled, and the r2 values drop by about 20 % relative to those of Tables 3 and 4 of Part 1 (Xian et al., 2022). This suggests Table 1 model shortcomings in capturing finer temporal-scale AERONET-AOD variations. This is also consistent with model performance for regions other than the Arctic and is generally a common result for numerical aerosol models (Lynch et al., 2016; Yumimoto et al., 2017)
The lower CM vs. FM skill of the NAAPS-RA might be a reflection of AERONET limitations as one approaches typical instrumental errors ∼0.01 in total AOD or they could be a reflection of simulation and/or reanalysis limitations as one approaches very small values of CM AOD. The lack of model representation of CM smoke and possible soil particles associated with severe burning events may also contribute. At the same time, it must be recognized that residual cloud contamination in AERONET and MAN data cannot be ruled out as a “false” indicator of poor simulation skill. Cloud screening issues aside, a lower CM vs. FM correlation skill is a common feature of both the Table 1 and 4 (Part 1, Xian et al., 2022) reanalyses. However, modeled monthly CM AOD correlation is slightly more skillful than the averages derived from 6 h data (Table 4 in Part 1, Xian et al., 2022, vs. Table 1 in this paper) inasmuch as the seasonal CM signal associated with dust and sea salt aerosols is apparently better resolved in the former case. The better model skill in seasonal CM simulation is likely due to the relative insensitivity of the model to the higher-frequency components of the reference data in the latter case. It is also noted that the NAAPS-RA is generally less skillful in the Arctic region relative to global reanalyses (see Fig. 7 in Lynch et al., 2016). This is understandable given that there are little satellite-based AOD data available to constrain the model through assimilation in the Arctic compared to lower latitudes. We note however that Zhang et al. (2021) attempted to address this problem with the assimilation of the Ozone Monitoring Instrument (OMI) aerosol index. To date, no remedy for aerosol data assimilation has yet been implemented in a larger reanalysis quality study.
Table 2AERONET V2L3 FM, CM, and total AOD at 550 nm at different percentiles for the listed Arctic sites along with maximum AOD values in the three columns next to the last column. The percentage of extreme FM events relative to the number of extreme total-AOD events (using our AOD95 extreme-event threshold) is also shown in the last column. The second to last row shows MAN statistics for data acquired north of 70∘ N.

3.2 General statistics of extreme events
Shown in Fig. 1 are NAAPS-RA and AERONET AOD95 values for the March–August time frame and the 2003–2019 period. The values of AOD95 are high (0.4–0.55) over Siberia and Alaska (and over the Yakutsk and Bonanza Creek AERONET stations) due to strong BB smoke influence. North of 70∘ N, the values are mostly between 0.15 to 0.25, with the exception of Greenland where they are largely below 0.15 (weak values that are attributable to the high terrain). It is also shown that (FM AOD)95 has a similar spatial distribution and magnitude as AOD95, suggesting the dominant contribution of FM to AOD95. The contribution of CM is relatively larger over the North Atlantic and European Arctic, though (CM AOD)95 and (FM AOD)95 are comparable in these regions.
The site-by-site, total, and FM AOD ranges are also shown in Fig. 2 from the 6 h AERONET data for all 550 nm retrievals acquired between 2003–2019. In general, the NAAPS-RA largely captures the AERONET FM and total-AOD range. This includes, for example, the AERONET AOD5 to AOD95 values (0.02 to >0.10 for most sites), and the larger 0.02 to 0.4–0.6 range of sites with a known strong BB influence (notably Bonanza Creek and Yakutsk). Mean and median AODs are also comparable to AERONET values. Maximum AERONET FM AODs vary between 0.5 (Ittoqqortoormiit) to <2.0 for most sites and around 3.0 for sites with strong BB smoke influence (see also Table 2). Maximum NAAPS-RA AOD values are often biased low, which is a common challenge for global aerosol models (e.g., Sessions et al., 2015; Xian et al., 2019).
Figure 3(a, b) Cumulative probability distributions of 2003–2019, 6 h total, FM, and CM AOD at 550 nm for AERONET V3 L2 data (solid curves) and pairwise NAAPS-RA (dashed curves). (c, d) Cumulative probability distributions for the corresponding speciated AOD from the NAAPS-RA. (a, c) AOD for sites that are distant from BB source regions, including Barrow, Resolute Bay, Kangerlussuaq, Thule, Andenes, Hornsund and Ittoqqortoormiit (see the discussion of Fig. 3 for emission considerations with respect to the particular site of Barrow). (b), (d) All sites. “n” represents the total number of 6-hourly data points over the 2003–2019 period.
The cumulative probability distributions of 6 h total, FM, and CM AODs are shown in Fig. 3 for AERONET and pairwise NAAPS-RA total and modal AODs and speciated AODs. The median AOD for all AERONET sites in the Arctic (all sites north of 60∘ N) for 2003–2019 is 0.07, while the AOD95 extreme-event threshold is 0.24 with a dominant FM contribution (see also Table 2). The CM AOD median for all measurements is 0.01, with a (CM AOD)95 threshold of only 0.07. Due to a relatively large positive bias in CM AOD of 0.01 below the 95 % threshold, NAAPS-RA total-AOD bias is slightly positive (<0.01) for all sites north of 60∘ N and for the 20 %–80 % cumulative probability range (a positive bias that is generally evident in Table 1).
The negative bias found at the largest CM AOD values could conceivably be associated with an underestimation of the CM AOD generated by sea salt aerosols or local dust in the presence of strong winds or CM smoke and soil particles associated with severe burnings. We should, however, reemphasize this caveat: despite the quality control measures taken to filter out cloud-contaminated AERONET data, the impact of CM residual clouds may still influence estimates of CM AOD.
It is worth noting that BB smoke plays a dominant role compared to other aerosol species above our AOD95 extreme-event threshold (see Fig. 3c and d in particular and note that Fig. 3a and b show the expected dominance of FM AOD). Even for sites distant from BB source regions, including Resolute Bay, Kangerlussuaq, Thule, Andenes, Hornsund, and Ittoqqortoormiit, BB smoke is the principal driver of AOD variations above the AOD95 threshold. To some extent, Barrow can be categorized as being a site that is distant from BB emissions. However, it is also relatively close to the region of Alaska fires, depending on dominant upstream winds and trajectories (see Eck et al., 2009, for details).
The modal and total-AOD values at different percentile levels for the AERONET sites and MAN data collected north of 70∘ N are provided in Table 2. For sites closer to BB sources, including Bonanza Creek, Yakutsk, and Tiksi, the AOD99 and (FM AOD)99 values are around or larger than 1.0, while the maximum values are between 1.4–3.3. For the more distant sites, the AOD99 and (FM AOD)99 values vary between 0.23–0.46, while the maximum values are between 0.45–3.0 (1.5 for Resolute Bay and 3.0 for Barrow). The FM event occurrences for the extreme total-AOD events range from 60 %–99 %, with an average of 86 %, and accordingly dominate CM events statistically. Sites closer to the BB source regions show relative occurrences over 95 %.
Large particles like ash and soil components emitted from vigorous burning during extreme BB smoke events (Reid et al., 2005; Schlosser et al., 2017) can likely be detected as AERONET CM AOD (see, for example, the correlation between the FM and “weak” CM particle size distributions for Bonanza Creek in Fig. 9a of Eck et al., 2009). The extreme AOD events described above are likely dominated by smoke. For example, (FM AOD)99 is 1.64 at Bonanza Creek and 0.92 at Tiksi in Table 2. For events with FM AOD greater than (FM AOD)99, the associated CM AOD means at the two sites showed significantly larger values of 0.05 and 0.03 (significantly larger relative to, for example, the CM AOD means in Table 1). The coherency of the associated CM AOD mean increase with the FM AOD mean increase suggests the presence of detectable CM smoke and/or soil particles induced by severe burning. The inability of the model to simulate potential CM smoke or soil components associated with severe burning could be a contributing reason as to why it performs less well in predicting CM AOD near BB sites.
3.3 Extreme biomass burning smoke AOD cases
A distinct class of extreme smoke cases comes from pyrocumulonimbus (pyroCb) events induced by intense biomass burning sources: these events inject smoke high into the troposphere or even well into the stratosphere (Fromm et al., 2010; Peterson et al., 2017). A significant pyroCb smoke event that occurred over British Columbia in August 2017 led to substantial increases in various optical measures of aerosol concentration in the lower Canadian and European Arctic (Peterson et al., 2018; Torres et al., 2020; Das et al., 2021). Ranjbar et al. (2019) showed that a specific 19 August 2017 smoke event over the high-Arctic PEARL observatory at Eureka, Nunavut, was induced by the British Colombia pyroCb fires and that it was a statistically significant extreme FM AOD event. More recent eastern Siberian fires in June–August 2021 induced more than a dozen cases of elevated smoke intrusion into the high Arctic with some smoke plumes reaching the North Pole and/or its vicinity. For example, on 5 August 2021, operational NAAPS (common chemistry, physics, and BB emission sources with the NAAPS-RA) resolved a smoke plume north of 80∘ N (Fig. 4) with AOD values of 2–3. Smoke AOD over the source region was also 2 to >3 with a similar amplitude to AODs measured at Yakutsk. CALIOP data suggested a 1–6 km high smoke layer in the source region.

Figure 4A 5 August 2021 example of BB smoke intrusion into the high Arctic from fires originating in eastern Siberia. (a) Composite true-color Terra satellite imagery. The red dots represent satellite-detected fire hotspots. (b) Operational NAAPS smoke AOD analysis at 12:00 Z. (c) CALIOP 532 nm attenuated backscatter coefficient showing the smoke layers around the source area. The yellow stars in (a) and (b) represent the location of Yakutsk, which experienced a daily mean total AOD (500 nm) of 2.0 (FM AOD ∼1.9) and an intra-day peak around 2.5 based on AERONET V3L1.5 data. Sources: MODIS-Terra true-color satellite imagery and CALIOP-CALIPSO 532 nm attenuated backscatter coefficient profile (respectively, https://worldview.earthdata.nasa.gov/, last access: 17 July 2022, and https://www-calipso.larc.nasa.gov/, last access: 17 July 2022).
Other extreme or near-extreme smoke events in the Arctic have been reported. A series of intense fires originating in North America led to strong AOD peaks in the summer of 2015 over Svalbard (Markowicz et al., 2016; Lisok et al., 2018). Agricultural fires in eastern Europe in the spring of 2006 caused record-high AODs and pollution levels in the European Arctic (Stohl et al., 2007). The North American boreal fires in the summer of 2004 led to large-amplitude AOD peaks in Alaska and enhanced AODs on a pan-Arctic scale (Stohl et al., 2006).
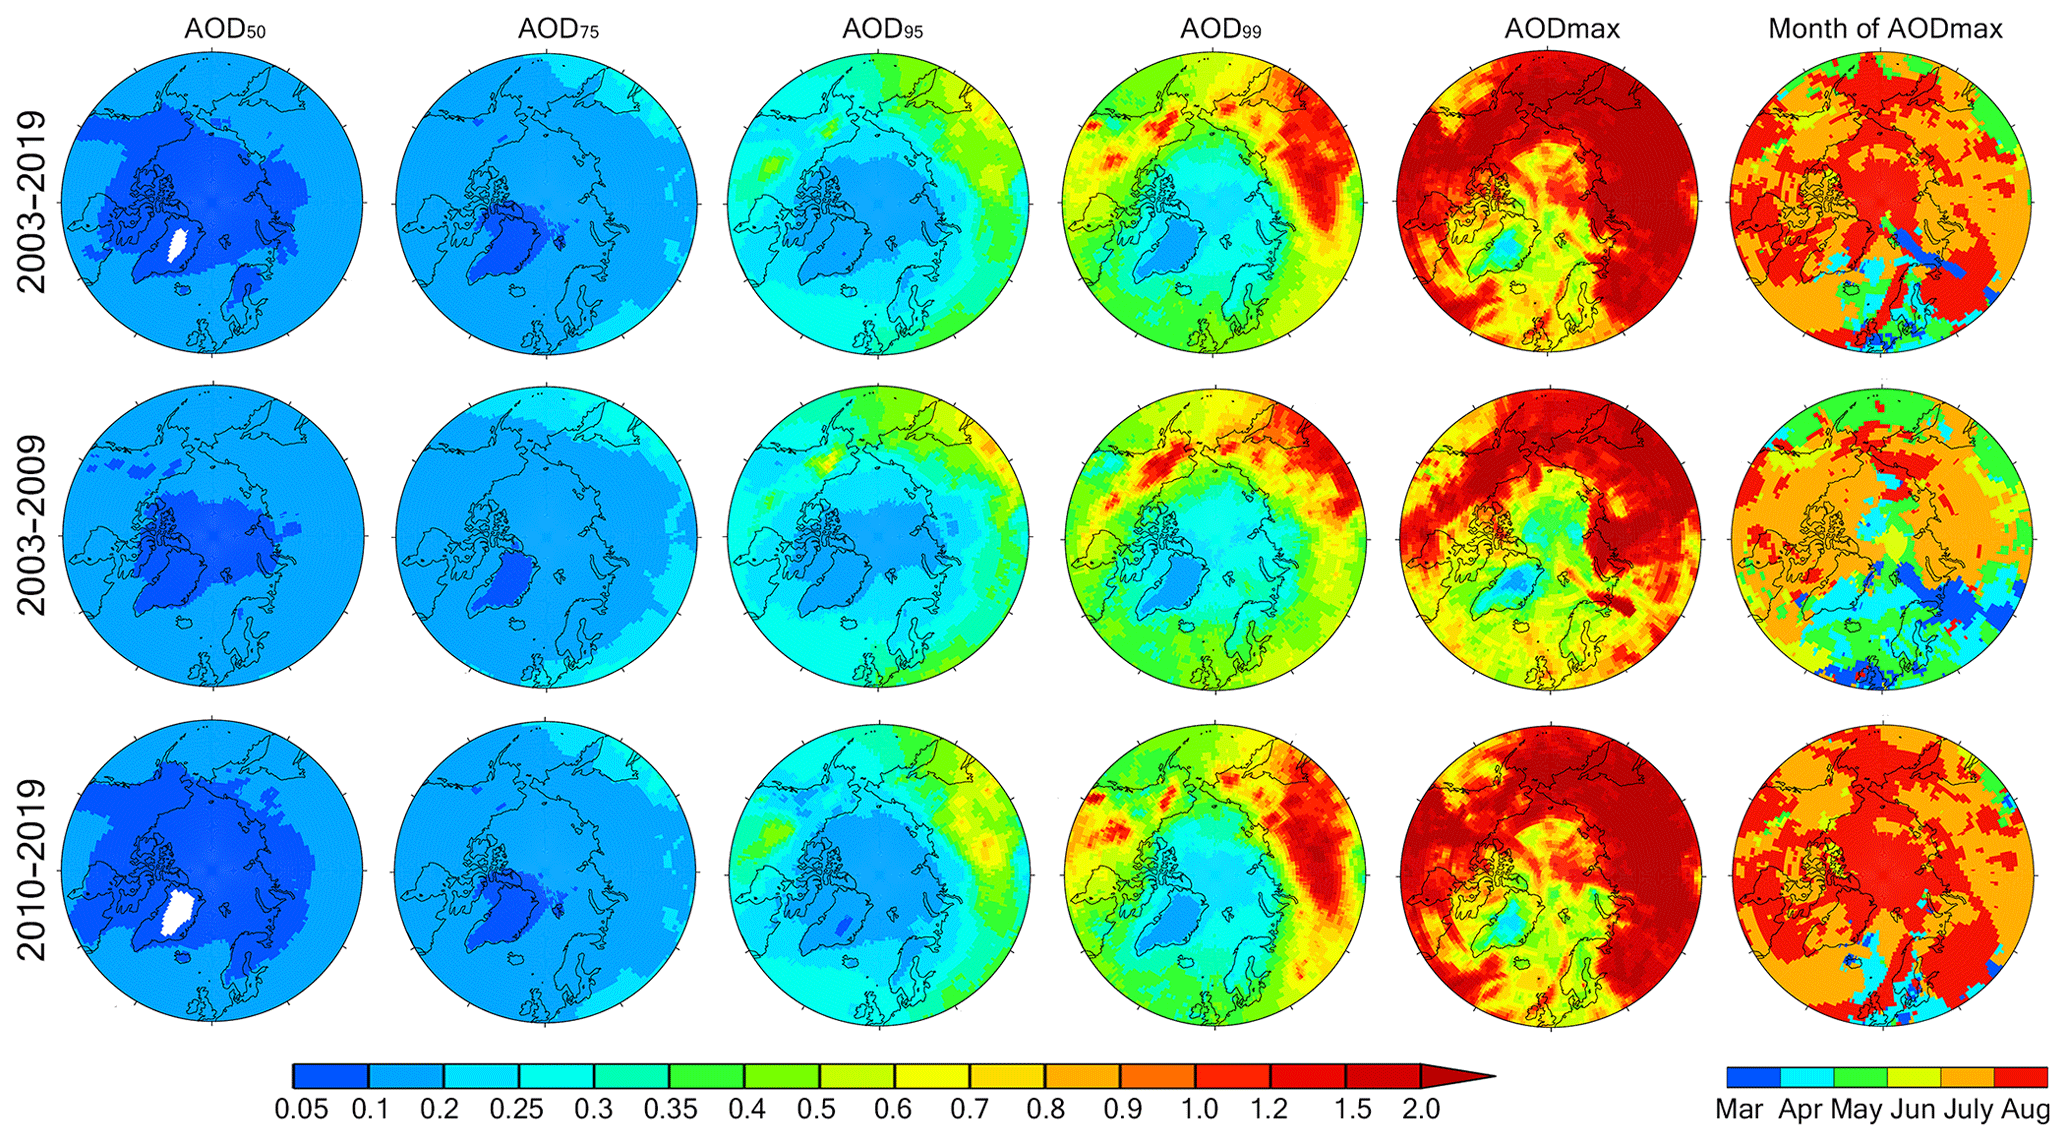
Figure 5NAAPS-RA daily (550 nm) total-AOD maps at different percentile levels for the March–August time frame, the maximum AOD, and (rightmost column) the month that the maximum AOD occurred. The three rows represent, respectively, the sampling periods of 2003–2019, 2003–2009, and 2010–2019. The AOD95 value for 2003–2019 is the same as that of Fig. 1 despite different color scales.
3.4 Geographic distribution of extreme AODs
The NAAPS-RA total-AOD map at different percentile levels locally for March–August 2003–2019 is shown in Fig. 5. We separated the study period into early (2003–2009) and late (2010–2019) subperiods. The end year of the first period was chosen as 2009 given the drop in ABF/sulfate emissions due to the civil Clean Air Acts enacted across the US (e.g., Tosca et al., 2017; Kaku et al., 2018) as well as Europe and China and the attendant decrease in ABF/sulfate AOD in these countries/regions (e.g., Zhang et al., 2017). This ABF/sulfate AOD decrease was also observed in the Arctic, as shown in Fig. 13 of Part 1 (Xian et al., 2022). The median Arctic AOD (less than 0.1 as compared with 0.07 for the AERONET sites from Fig. 3 and Table 2) is an order of magnitude smaller than the maximum AODs. Clear BB smoke features in the North American and Asian boreal burning regions start to emerge in the AOD95 maps (see also Fig. 1). The maximum AOD is high (greater than 2.0) while being relatively low over the Arctic Ocean (∼0.3–1.0) and the North Atlantic, with the lowest values over the generally high-elevation Greenland landmass. The maximum AOD is associated with peak burning activities and generally occurs in July and August. The exception is the Norwegian Sea area, where the maximum AODs occur in March–May. This is possibly associated with a combined high AOD level from anthropogenic pollution, marine aerosols, and springtime agriculture fires.
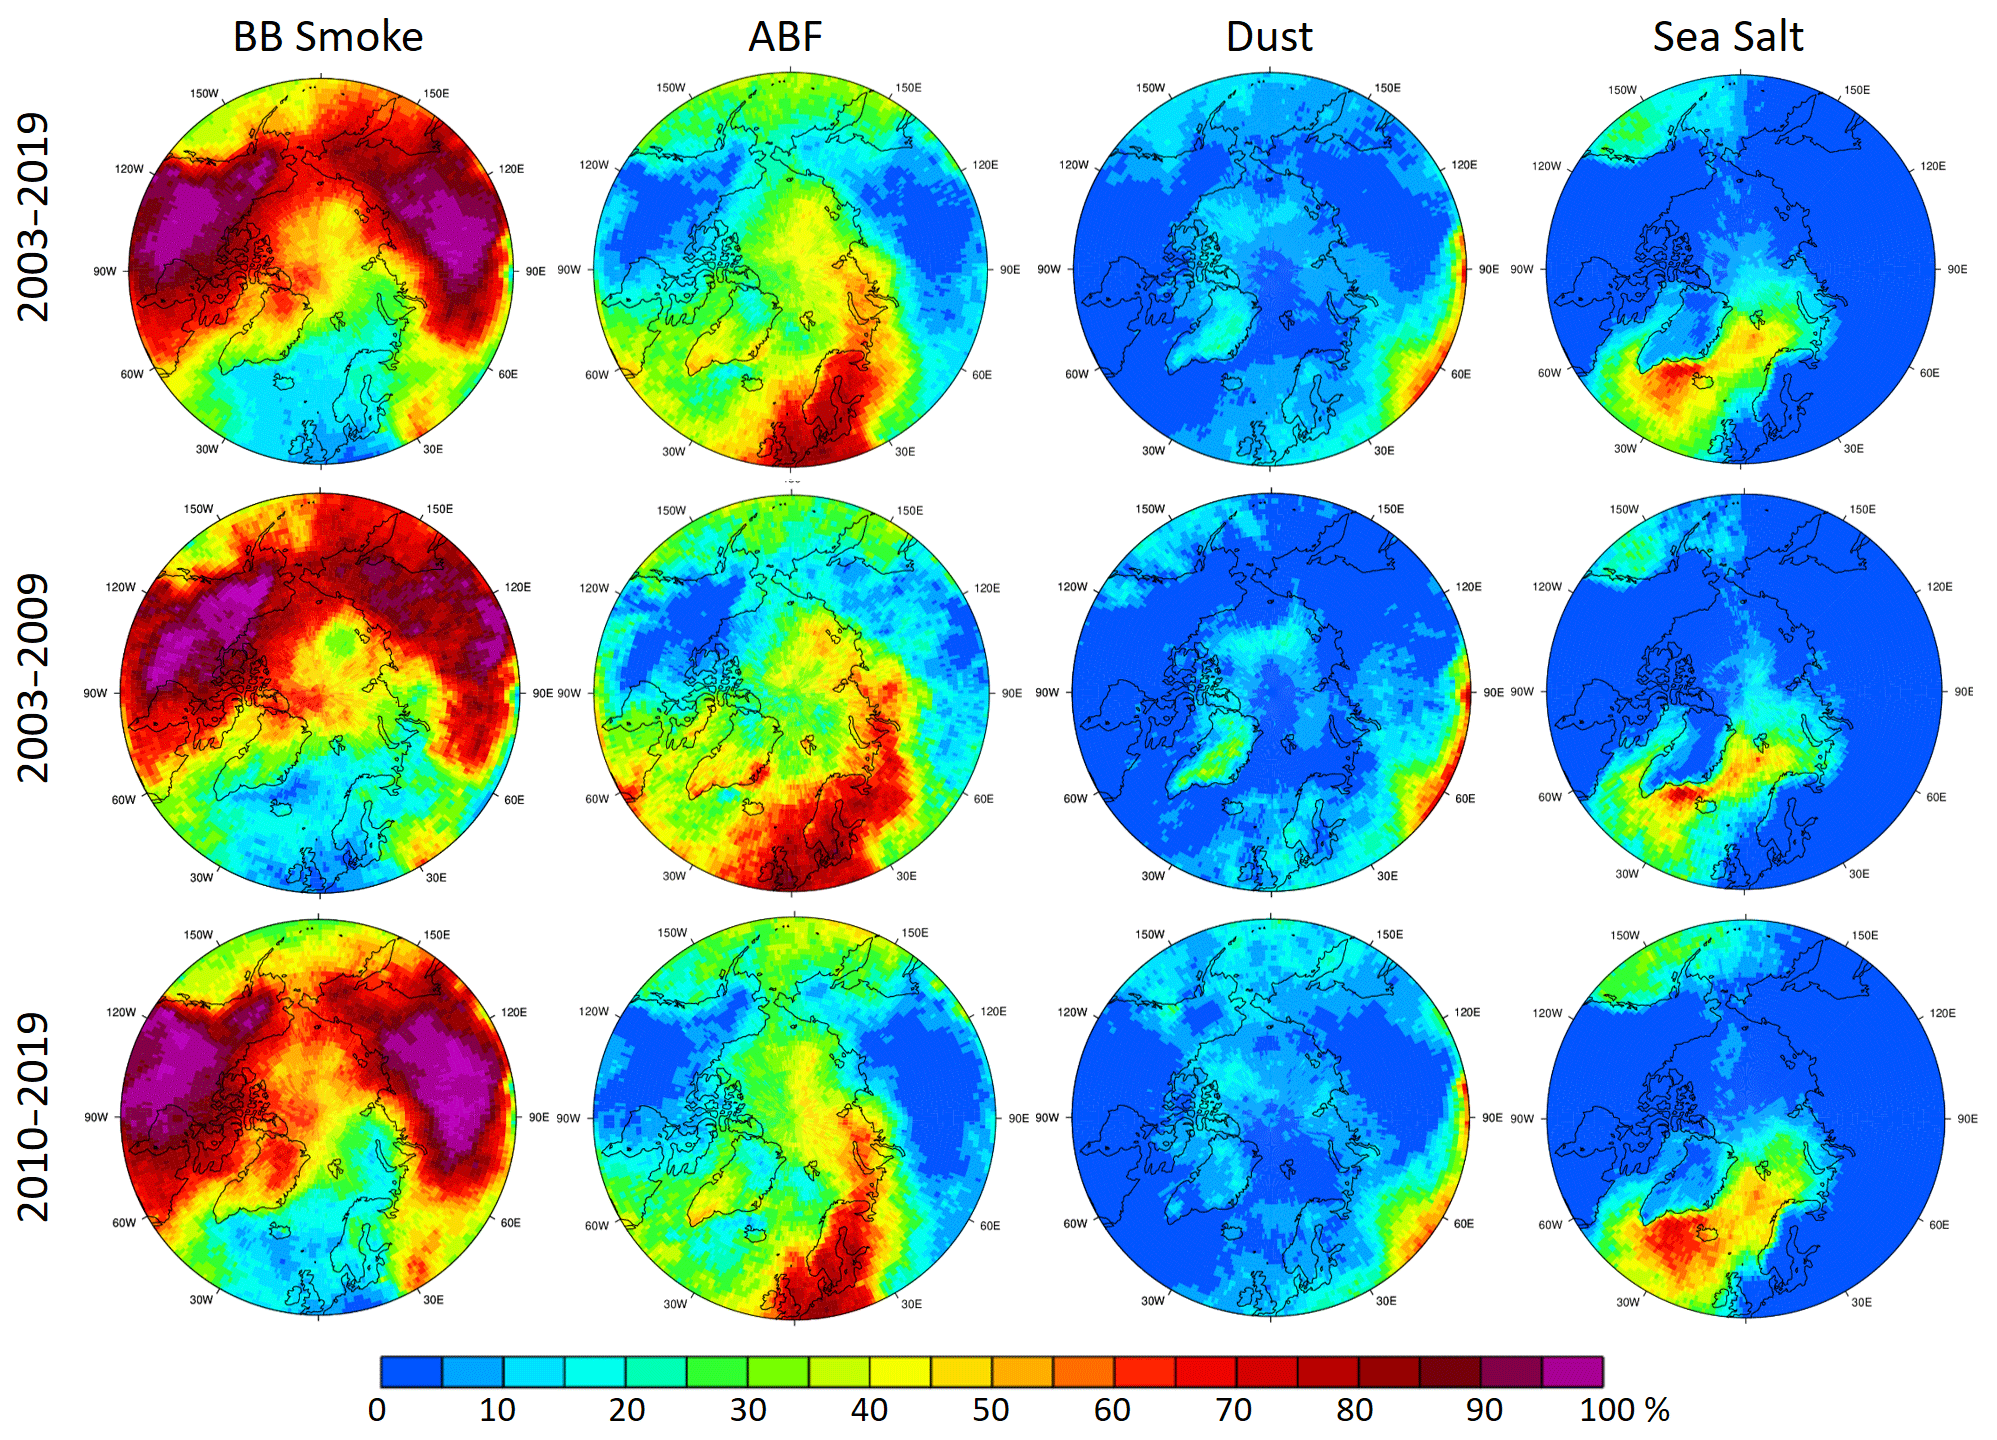
Figure 6Occurrence of different aerosol species (expressed as a percent) relative to the occurrence of total-AOD extreme events (daily total AOD > AOD95 locally) for the March–August time frame. The sampling periods are the same as in Fig. 5.
The occurrence of different aerosol species relative to the occurrence of total AOD for total-AOD extreme events (March–August time frame) are shown in Fig. 6. The occurrence maps accordingly indicate which aerosol species are numerically dominant for extreme AOD events. As expected, BB smoke is the prevailing extreme-event contributor over the North American and Asian Arctic, especially near the boreal source regions and associated transport pathways, as well as most of the Arctic Ocean (except the Barents Sea and the Norwegian Sea). ABF occurrence dominates the low European Arctic. Sea salt particles and, to a lesser extent, ABF are the most significant occurrence contributors in the North Atlantic and the Norwegian Sea. Dust occurrences to extreme AOD events are very small (0 %–10 %) except over the predominantly high-elevation region of Greenland where the relative occurrence of high-altitude African dust dominates the relative occurrence of the other species.
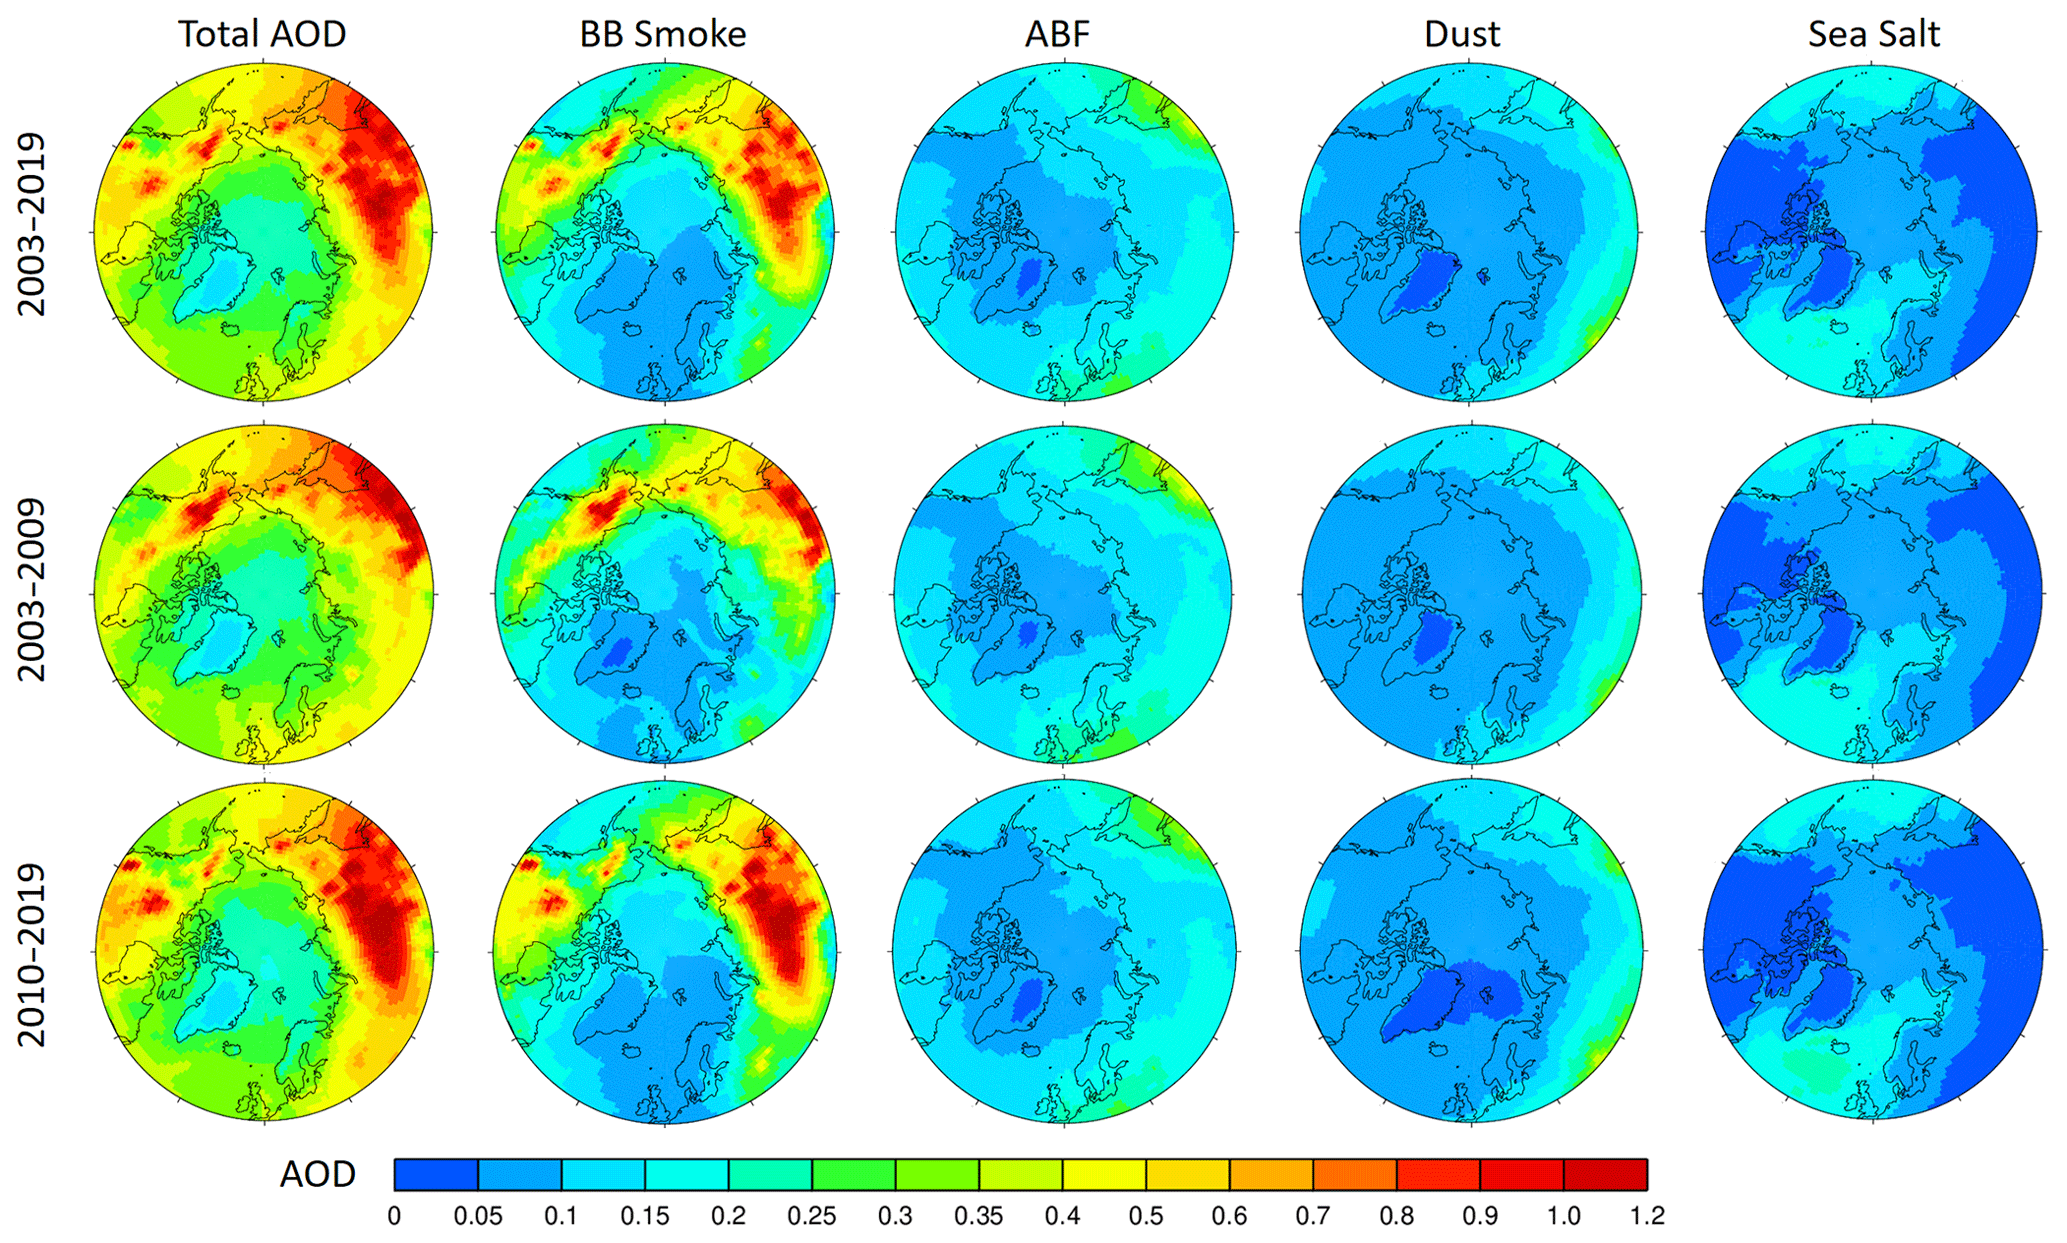
Figure 7Mean speciated and total AODs averaged for days with speciated AOD or total AOD > AOD95 (i.e., the mean value of the top 5 % AOD data) for the March–August time frame. The sampling periods are the same as in Figs. 5 and 6.
In terms of AOD amplitudes for total-AOD extreme events (Fig. 7), BB smoke AOD shows dominant contributions, especially in the areas near the boreal source regions and transport pathways, including most areas of the high Arctic. ABF and sea salt show slightly higher extreme-event AODs than BB smoke over the North Atlantic and European Arctic. The regional extreme AODs are not, however, as large as the extreme AODs in the BB smoke-dominant regions.
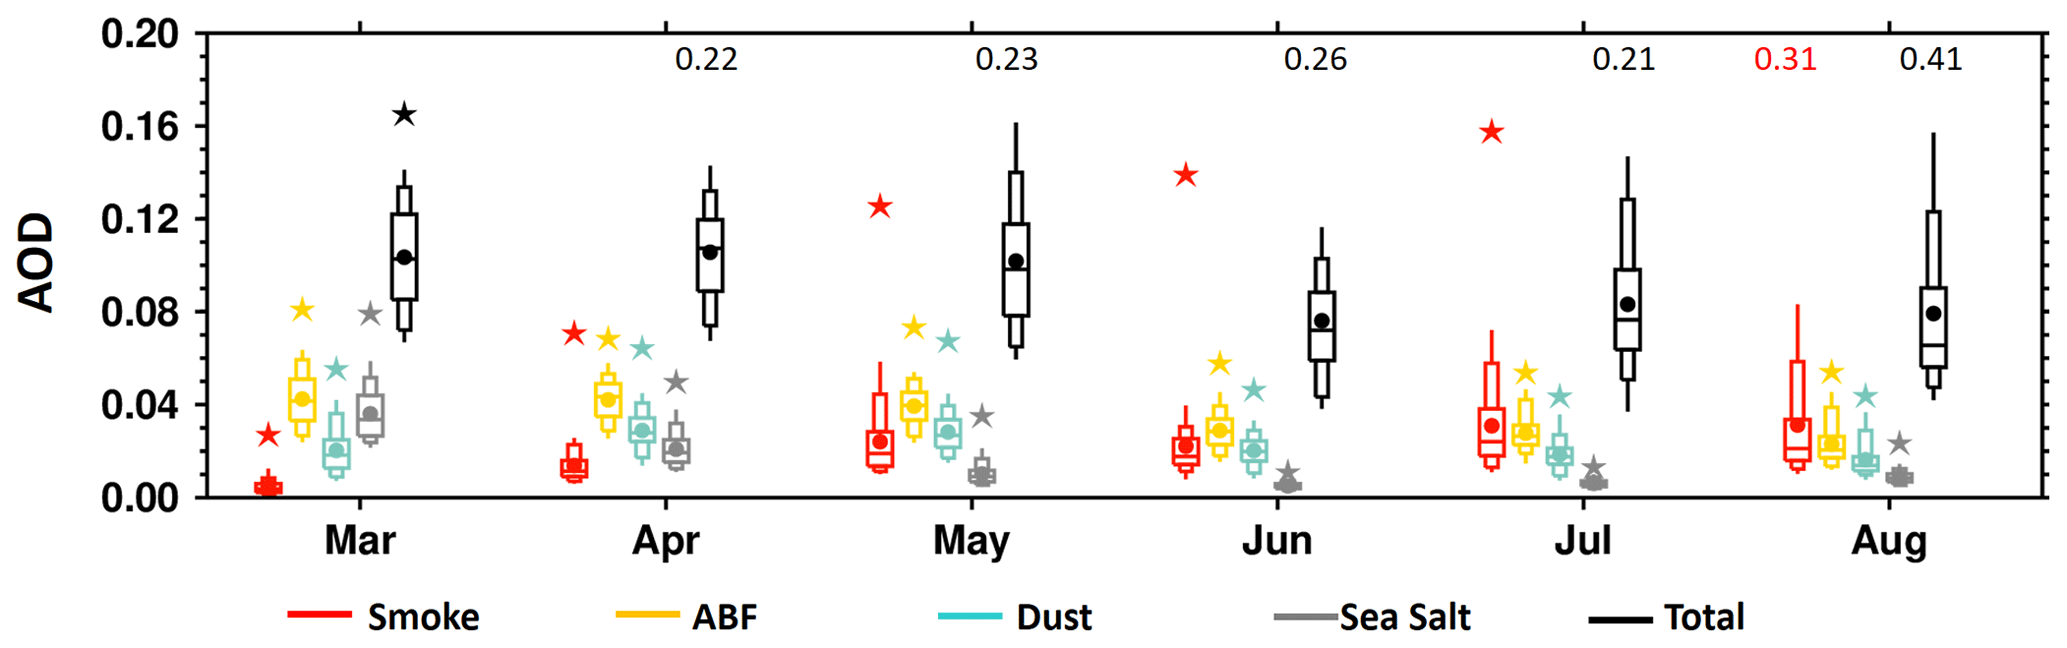
Figure 8Box-and-whisker plot of daily and area-averaged (70–90∘ N) speciated AOD at 550 nm from NAAPS-RA (2003–2019) for different months. The box and whiskers represent AOD at the 95th, 90th, 75th, 50th, 25th, 10th, and 5th percentiles. Mean total AODs are shown as solid black circles and maximum AODs as stars. Maximum AOD values appear as appropriately colored numerical values if they extend beyond the 0.2 plot maximum.
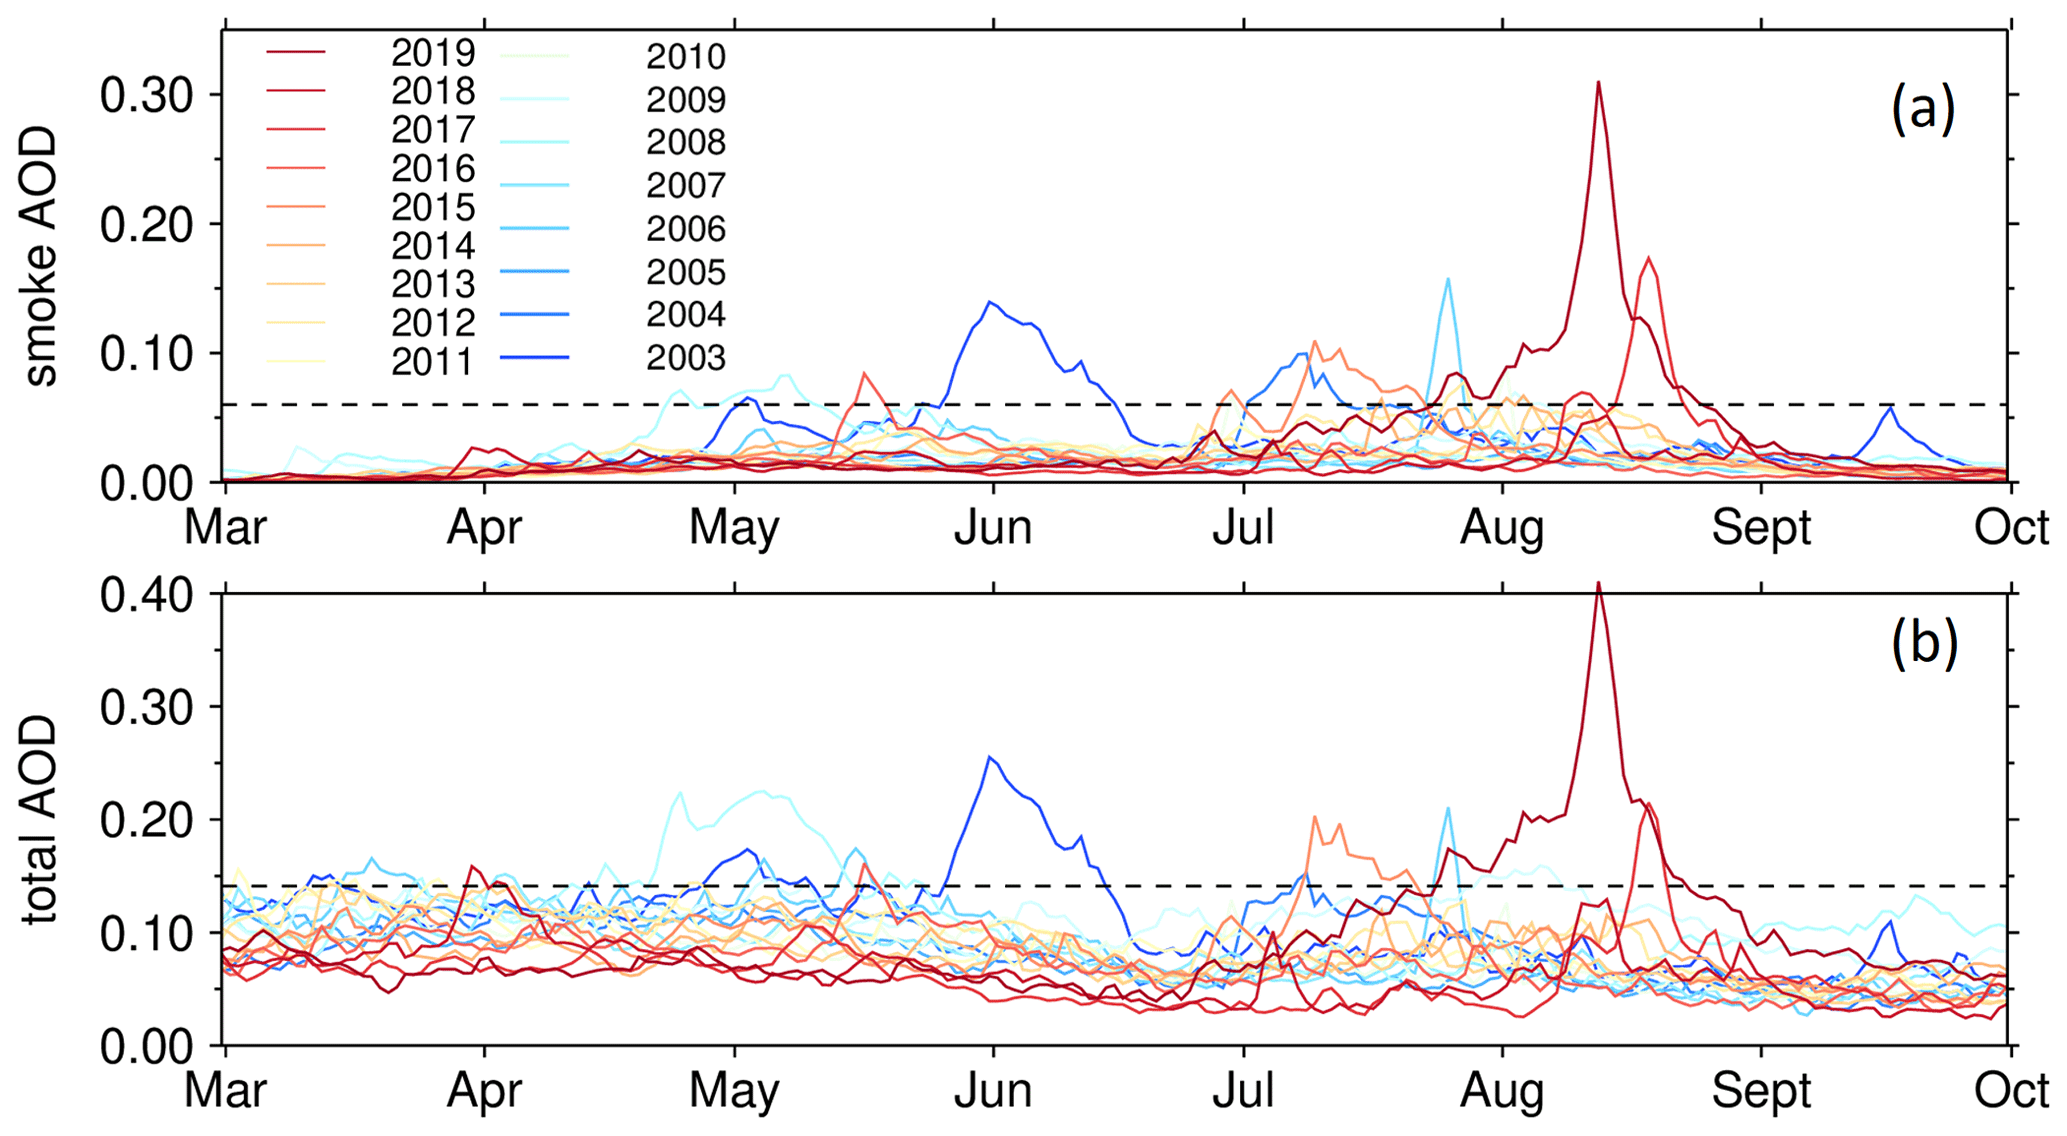
Figure 9Seasonal (March to September) time series of daily mean AODs averaged over the 70–90∘ N high-Arctic area for each individual year of the 2003–2019 period: (a) BB smoke AOD and (b) total AOD. The years before 2010 are shown as cold colors, and years after 2010 are shown as warm colors. The dashed horizontal lines show the smoke AOD95 value of 0.06 and the total-AOD95 value of 0.14 during the study period.
3.5 Seasonality of extreme AOD events
The NAAPS-RA seasonal cycle of total and speciated AOD is shown in Fig. 8 for daily averages across the area north of 70∘ N (a latitude limit which largely excludes BB source regions). The seasonal cycle of monthly mean total AOD shows relatively higher values in March–April–May (MAM) compared with the lower AODs in June–July–August (JJA) and a minimum in June. The spread of the ABF AOD seasonal values is moderately stable, with a relatively higher mean and median in MAM than JJA. Sea salt AOD and its spread are relatively higher in the earlier months (March and April). Dust AOD and spread are generally stable through the season, with a visibly higher mean and median in April and May. Smoke AOD amplitude and spread exhibit the greatest inter-species seasonal variations with the lowest mean and spread in March, increased means and spreads in April, and significantly higher mean and spread in later months. July and August appear to have the largest mean, spread, and maximum smoke AODs (a smoke importance statement that is generally consistent with the results of Fig. 6). These smoke features significantly contribute to the seasonality of total-AOD extremes. It is also noted that the MAM total and smoke AOD means approximately equal their medians but that the JJA means are greater than their medians (and that this is especially true for August). The greater number of smoke AOD extremes in the later season and the attendant consequence of greater positive histogram skewness would explain those relative increases in the mean.
3.6 Trends of extreme AOD events
There is, as shown in Part 1 of the study, a multi-year decreasing MAM trend and an increasing JJA trend for total AOD in the Arctic over the 2003–2019 sampling period. This was attributed to an overall decrease in MAM and JJA sulfate/ABF AOD coupled with a negative trend in MAM and a strong positive trend in JJA for biomass burning smoke AOD. In terms of extreme-event trends, AOD95 (Fig. 5) and the average AOD above AOD95 (Fig. 6) generally increased over the boreal continents from the 2003–2009 to 2010–2019 period (with the notable exception of Alaska and northeastern Siberia in 2010–2019). This is consistent with the positive BB emission trends in JJA north of 50 and 60∘ N (for which the JJA trend dominated the MAM trend inasmuch as JJA was associated with much higher BB emissions; Part 1).
The negligible or slight decrease in high-Arctic AOD50, AOD75, and AOD95 values from the 2003–2009 to the 2010–2019 period (Fig. 5) is likely associated with the generally weak ABF decrease seen in Fig. 7. However, the increase in the maximum AOD value (Fig. 5) and the contribution of BB smoke to AOD extreme events (Fig. 7) in the latter period is an indication of stronger extreme BB smoke influence in more recent years. It is also noted that the maximum high-Arctic AOD occurred later in the season (mostly August) in 2010–2019 compared with the more balanced variation occurring in March through August in 2003–2009. This is likely attributable to overall lower ABF levels in the 2010–2019 period (especially in MAM) and a shift in extreme smoke events to later in the season (see discussion below).
The time series of high-Arctic-averaged daily mean BB smoke and total AOD from March to September for all years between 2003–2019 is shown in Fig. 9. The extreme total-AOD variation is largely dictated by BB smoke. There is also a discernible 2003–2009 to 2010–2019 springtime reduction in extreme total AOD: this, as discussed in the previous paragraph, is likely due to an overall reduction in ABF AOD. The occurrence of extreme smoke events tended to be more equally distributed over all months (April–August) during the 2003–2009 period while being more concentrated in the late season (July–August) during the 2010–2019 period. The extreme smoke and total-AOD trends resembled the extreme smoke occurrence trends: more seasonally balanced during the 2003–2009 period and summertime dominance during the 2010–2019 period. Specific counts of extreme BB smoke days for different months and years and yearly cumulative extreme AODs also support the seasonal shift of extreme smoke events (Table S1).
The occurrence of extreme high-Arctic smoke events thus demonstrates a clear smoke and total-AOD shift from a more balanced spring and summer to the late season (notably the months of July and August; see also Table S1). This is consistent with the temporal shift of fire activity to a later time in Siberia over 2003–2018 (Liu et al., 2021) and the projection of emerging pan-Arctic fire regimes marked by increases in the likelihood of extreme fires later in the growing season (McCarty et al., 2021). An earlier fire season in the boreal region normally suggests a better-managed forest/land with fewer large and destructive fires, while a later fire season indicates the opposite.
The shift of boreal fire activity, and the resulting BB smoke AOD extremes in the Arctic from early season to late season, is probably related to early-season strengthening of agriculture burning regulations and increased summertime lightning frequencies with climate change in the latter decade. For example, the springtime BB smoke AOD peak values in 2003, 2006, and 2008 are all associated with agricultural activity (resulting in fires burning out of control) and widespread high-latitude burning (Korontzi et al., 2006; Stohl et al., 2007; Saha et al., 2010). At the same time, with climate change, lightning activity, and lightning-caused wildfires in summertime high-latitude regions were observed to increase in the past 2 decades (Zhang et al., 2021; Bieniek et al., 2020; Coogan et al., 2020). Also noted is a lengthening of growing season in boreal regions, which implies a lengthening of fire season as well (Park et al., 2016). These factors aside, climate oscillations, including the Arctic Oscillation, Niño–Southern Oscillation (ENSO), and Pacific Decadal Oscillation, also affect boreal fire activities (Balzter et al., 2007; Macias Fauria and Johnson, 2006; Kim et al., 2020). These climate factors modulate interannual variations and possibly the transport dynamics of pollutants from the midlatitudes to the Arctic region (e.g., Eckhardt et al., 2003; Fisher et al., 2010).
The dominant contributor, ABF, to regional extreme AOD occurrence and magnitude in the lower European Arctic decreased slightly from 2003–2009 to 2010–2019 (Figs. 6 and 7): this observation is generally coherent with the Part 1 results showing a pan-Arctic ABF AOD decrease in the 2003–2019 period and Fig. 9. Extreme total-AOD events dominated by sea salt contributions in the North Atlantic and Norwegian Sea increased slightly in 2010–2019. This was possibly due to the observed increase in cyclonic activities (Rinke et al., 2017; Waseda et al., 2021; Valkonen et al., 2021). Although the model simulation of CM AOD is not as skillful as that of FM, trend analysis of CM AOD which is based on relative change is arguably significant.
AOD data from the NAAPS-RA, the ground-based AERONET, and MAN were employed in analyzing the 2003–2019 statistics and trends of extreme Arctic AOD events for spring and summer seasons. Extreme AODs are defined as any AOD greater than the 95th percentile (AOD95) for any given distribution of AODs, whether that distribution is generated by the ensemble of AODs representing the time series of a specific location or of a regional average. Total, FM, and CM AODs at 550 nm from 6 h resolution NAAPS-RA were first validated against AERONET and MAN AOD data. NAAPS-RA was shown to be capable of largely capturing FM and total-AOD ranges and variability. The NAAPS-RA performance in simulating CM AOD was significantly better if the temporal resolution of the all-season statistics was less sensitive to high-frequency dust and sea salt events (i.e., the use of temporal resolution bins of a month rather than 6 h). Statistics of the 6 h Arctic AOD and extreme AOD events were analyzed. Finally, trends of extreme AOD in the Arctic were presented and analyzed.
Baseline statistics for 6-hourly AOD. The median of 6 h total AODs at 550 nm for all Arctic AERONET sites and MAN retrievals over the 2003–2019 period is 0.07, while AOD95 is 0.24. Both the median and AOD95 values show a dominant FM AOD contribution. The CM AOD median is 0.01, while AOD95 is 0.07. The maximum AOD over the 2003–2019 period varies between 0.5–3.0 for measurements made away from BB source regions and 1.5 to greater than 3.0 for measurements made closer to BB source regions. The seasonal NAAPS-RA spread of smoke AOD is much higher than other speciated AODs, including ABF, dust, and sea salt AODs, for all months between May and August; the spread is especially large in July and August. These late-season smoke features significantly contribute to the seasonality and interannual variabilities of extremes in total AOD.
Extreme AOD events. Extreme AOD events using the Arctic spring and summer data are largely attributable to FM AOD events and notably BB smoke transport events in general. Extreme Arctic AOD events show large seasonal and interannual variability, with the interannual AOD variability largely modulated by BB smoke. Extreme AOD occurrences in the North American Arctic, the Asian Arctic, and the high Arctic are dominated by BB smoke events. The occurrence of regionally extreme AOD events is attributed more to ABF in the lower European Arctic. The extreme-event occurrence dominance of sea salt aerosols is largely limited to the North Atlantic and Norwegian Sea. The extreme AOD amplitudes of ABF and sea salt AOD are, however, significantly lower than those regions where smoke AOD is dominant. Even for sites distant from BB source regions, BB smoke is the principal driver of AOD variation above the AOD95 threshold.
Shift of extreme AOD events from spring–summer to summer season. There is an overall increase in the maximum AOD values in the high Arctic in 2010–2019 compared to 2003–2009, suggesting stronger extreme BB smoke influence for more recent years. Extreme AOD events are observed to occur in a more balanced fashion over the entire April–August season during 2003–2009 while being more concentrated in the latter part of the season (i.e., July and August) during 2010–2019. The seasonal shift in extreme smoke AOD events is consistent with the multi-year negative MAM trend and positive JJA trend in BB emissions (north of 50∘ N, Part 1). These trends are likely attributable to early season agricultural burning controls and increased lightning activity and lightning-caused wildfires in summertime in the boreal high-latitude regions on top of the overall lower level, especially in spring, of 2010–2019 vs. 2003–2009 anthropogenic aerosols. The shift in extreme smoke events is consistent with a general multi-year decreasing springtime trend and an increasing summertime trend of BB emissions north of 50∘ N (Part 1, Xian et al., 2022).
Global warming is expected to continue generating drier conditions and increased wildfire activities in the high latitudes (McCarty et al., 2021) and thus render the Arctic more susceptible to extreme smoke events. These events can significantly change the regional aerosol budget by bringing large amounts of smoke aerosols into the Arctic. These extreme smoke events will likely play an increasingly important Arctic aerosol budget role given the decreasing (Part 1) baseline in anthropogenic pollution aerosols over the 2003–2019 period. Smoke aerosols are, notably, much more light-absorbing than anthropogenic sulfate. Also, their different physical and chemical properties relative to anthropogenic aerosols will translate into different efficiencies in their role as CCN and INP. When deposited on surface snow and ice, they impact the surface radiative forcing budget by reducing surface albedo. The climate impacts of BB smoke would, accordingly, differ and possibly counteract the dynamics of anthropogenic aerosols. Therefore, the baseline AOD trends reported in Part 1 and the trends in extreme AOD events reported here are important in terms of implications for the changing Arctic climate. The greater sensitivity of Arctic climate to aerosol forcings relative to other regions of the globe (e.g., Wang et al., 2018), the impact of the extreme BB smoke events and their interannual variability, and trends in Arctic climate warrants further exploration. The statistics of extreme AODs reported here are expected to help in the formulation of climate sensitivity experiments and improve our knowledge of the relative importance of aerosol processes compared to other factors of the changing Arctic climate.
All data supporting the conclusions of this paper are available through the links provided below.
-
AERONET Version 3 Level 2 data: http://aeronet.gsfc.nasa.gov (Giles, 2022a)
-
MAN data: https://aeronet.gsfc.nasa.gov/new_web/maritime_aerosol_network.html (Giles, 2022b)
-
NAAPS RA AOD: https://usgodae.org//cgi-bin/datalist.pl?dset=nrl_naaps_reanalysis&summary=Go (GODAE, 2022).
The supplement related to this article is available online at: https://doi.org/10.5194/acp-22-9949-2022-supplement.
PX designed this study, performed most of the data analysis, and wrote the initial paper. All authors contributed to scientific discussion, revision, and editing of the paper.
The contact author has declared that none of the authors has any competing interests.
Publisher's note: Copernicus Publications remains neutral with regard to jurisdictional claims in published maps and institutional affiliations.
We thank the NASA AERONET and MAN and Environment and Climate change Canada (ECCC) AEROCAN group for the sun photometer data. We acknowledge the use of imagery from the NASA Worldview application (https://worldview.earthdata.nasa.gov, last access: 17 July 2022) and the NASA CALIPSO website (https://www-calipso.larc.nasa.gov/, last access: 17 July 2022).
The authors acknowledge support from NASA's Interdisciplinary Science (IDS) program (grant no. 80NSSC20K1260), NASA's Modeling, Analysis and Prediction (MAP) program (grant no. NNX17AG52G), and the Office of Naval Research Code 322. Norm T. O'Neill and Keyvan Ranjbar's work was supported by the Canadian Space Agency, SACIA-2 project, ref. no. 21SUASACOA, ESS-DA program.
This paper was edited by Hailong Wang and reviewed by two anonymous referees.
AboEl-Fetouh, Y., O'Neill, N. T., Ranjbar, K., Hesaraki, S., Abboud, I., and Sobolewski, P. S.: Climatological-scale analysis of intensive and semi-intensive aerosol parameters derived from AERONET retrievals over the Arctic, J. Geophys. Res.-Atmos., 125, e2019JD031569, https://doi.org/10.1029/2019JD031569, 2020.
AboEl-Fetouh, Y., O'Neill, N. T., Kodros, J. K., Pierce, J. R., Lu, H., Ranjbar, K., and Xian, P.: Seasonal comparisons of GEOS-Chem-TOMAS (GCT) simulations with AERONET-inversion retrievals over sites in the North American and European Arctic, Atmos. Environ., 271, 118852, https://doi.org/10.1016/j.atmosenv.2021.118852, 2022.
Balzter, H., Gerard. F., George. C., Weedon, G., Grey, W., Combal, B., Bartholome, E., Bartalev, S., and Los, S.: Coupling of vegetation growing season anomalies and fire activity with hemispheric and regional-scale climate patterns in central and east Siberia, J. Climate, 20, 3713–3729, https://doi.org/10.1175/JCLI4226, 2007.
Bieniek, P. A., Bhatt, U. S., York, A., Walsh, J. E., Lader, R., Strader, H., Ziel, R., Jandt, R. R., and Thoman, R. L.: Lightning Variability in Dynamically Downscaled Simulations of Alaska's Present and Future Summer Climate, J. Appl. Meteorol. Climatol., 59, 1139–1152, 2020.
Birch, C. E., Brooks, I. M., Tjernström, M., Shupe, M. D., Mauritsen, T., Sedlar, J., Lock, A. P., Earnshaw, P., Persson, P. O. G., Milton, S. F., and Leck, C.: Modelling atmospheric structure, cloud and their response to CCN in the central Arctic: ASCOS case studies, Atmos. Chem. Phys., 12, 3419–3435, https://doi.org/10.5194/acp-12-3419-2012, 2012.
Bossioli, E., Sotiropoulou, G., Methymaki, G., and Tombrou, M.: Modeling extreme warm-air advection in the Arctic during summer: The effect of mid-latitude pollution inflow on cloud properties, J. Geophys. Res.-Atmos., 126, e2020JD033291, https://doi.org/10.1029/2020JD033291, 2021.
Coogan, S. C. P., Cai, X., Jain, P., and Flannigan, M. D.: Seasonality and trends in human- and lightning-caused wildfires ≥2 ha in Canada, 1959–2018, Int. J. Wildland Fire, 29, 473–485, https://doi.org/10.1071/WF19129, 2020.
Coopman, Q., Garrett, T. J., Finch, D. P., and Riedi, J.: High sensitivity of arctic liquid clouds to long-range anthropogenic aerosol transport, Geophys. Res. Lett., 45, 372–381, https://doi.org/10.1002/2017GL075795, 2018.
Dang, C., Warren, S. G., Fu, Q., Doherty, S. J., Sturm, M., and Su, J.: Measurements of light-absorbing particles in snow across the Arctic, North America, and China: Effects on surface albedo, J. Geophys. Res.-Atmos., 122, 10149–10168, https://doi.org/10.1002/2017JD027070, 2017.
Das, S., Colarco, P. R., Oman, L. D., Taha, G., and Torres, O.: The long-term transport and radiative impacts of the 2017 British Columbia pyrocumulonimbus smoke aerosols in the stratosphere, Atmos. Chem. Phys., 21, 12069–12090, https://doi.org/10.5194/acp-21-12069-2021, 2021.
DeRepentigny, P., Jahn, A., Holland, M., Fasullo, J., Lamarque, J.-F., Hannay, C., Mills, M., Bailey, D., Tilmes, S., and Barrett, A.: Impact of CMIP6 biomass burning emissions on Arctic sea ice loss, EGU General Assembly 2021, online, 19–30 April 2021, EGU21-9020, https://doi.org/10.5194/egusphere-egu21-9020, 2021.
Eck, T. F., Holben, B. N., Reid, J. S., Sinyuk, A., Hyer, E. J., O'Neill, N. T., Shaw, G. E., Vande Castle, J. R., Chapin, F. S., Dubovik, O., Smirnov, A., Vermote, E., Schafer, J. S., Giles, D., Slutsker, I., Sorokine, M., and Newcomb, W. W.: Optical properties of boreal region biomass burning aerosols in central Alaska and seasonal variation of aerosol optical depth at an Arctic coastal site, J. Geophys. Res.-Atmos., 114, D11201, https://doi.org/10.1029/2008JD010870, 2009.
Eckhardt, S., Stohl, A., Beirle, S., Spichtinger, N., James, P., Forster, C., Junker, C., Wagner, T., Platt, U., and Jennings, S. G.: The North Atlantic Oscillation controls air pollution transport to the Arctic, Atmos. Chem. Phys., 3, 1769–1778, https://doi.org/10.5194/acp-3-1769-2003, 2003.
Fisher, J. A., Jacob, D. J., Purdy, M. T., Kopacz, M., Le Sager, P., Carouge, C., Holmes, C. D., Yantosca, R. M., Batchelor, R. L., Strong, K., Diskin, G. S., Fuelberg, H. E., Holloway, J. S., Hyer, E. J., McMillan, W. W., Warner, J., Streets, D. G., Zhang, Q., Wang, Y., and Wu, S.: Source attribution and interannual variability of Arctic pollution in spring constrained by aircraft (ARCTAS, ARCPAC) and satellite (AIRS) observations of carbon monoxide, Atmos. Chem. Phys., 10, 977–996, https://doi.org/10.5194/acp-10-977-2010, 2010.
Flanner, M. G.: Arctic climate sensitivity to local black carbon, J. Geophys. Res.-Atmos., 118, 1840–1851, https://doi.org/10.1002/jgrd.50176, 2013.
Flanner, M. G., Zender, C. S., Randerson, J. T., and Rasch, P. J.: Present-day climate forcing and response from black carbon in snow, J. Geophys. Res., 112, D11202, https://doi.org/10.1029/2006JD008003, 2007.
Fromm, M., Lindsey, D. T., Servranckx, R., Yue, G., Trickl, T., Sica, R., Doucet, P., and Godin-Beekmann, S.: The Untold Story of Pyrocumulonimbus, B. Am. Meteorol. Soc., 91, 1193–1210, https://doi.org/10.1175/2010BAMS3004.1, 2010.
Giles, D. M.: AERONET AOD Version 3 Level 2 data, NASA [data set], http://aeronet.gsfc.nasa.gov, last access: 17 July 2022a.
Giles, D. M.: MAN AOD data, NASA [data set], https://aeronet.gsfc.nasa.gov/new_web/maritime_aerosol_network.html, last access 17 July 2022b.
Giles, D. M., Sinyuk, A., Sorokin, M. G., Schafer, J. S., Smirnov, A., Slutsker, I., Eck, T. F., Holben, B. N., Lewis, J. R., Campbell, J. R., Welton, E. J., Korkin, S. V., and Lyapustin, A. I.: Advancements in the Aerosol Robotic Network (AERONET) Version 3 database – automated near-real-time quality control algorithm with improved cloud screening for Sun photometer aerosol optical depth (AOD) measurements, Atmos. Meas. Tech., 12, 169–209, https://doi.org/10.5194/amt-12-169-2019, 2019.
Ginoux, P., Chin, M., Tegen, I., Prospero, J. M., Holben, B., Dubovik, O., and Lin, S.-J.: Sources and distributions of dust aerosols simulated with the GOCART model, J. Geophys. Res., 106, 20255–20273, https://doi.org/10.1029/2000JD000053, 2001.
GODAE: NAAPS-RA AOD data: https://usgodae.org/cgi-bin/datalist.pl?Data_Type=naaps&Parameter=ALL&Provider=ALL&meta=Go, GODAE [data set], last access: 17 July 2022.
Granier, C., Bessagnet, B., Bond, T., D'Angiola, A., van der Gon, H. D., Frost, G. J., Heil, A., Kaiser, J. W., Kinne, S., Klimont, Z., Kloster, S., Lamarque, J.-F., Liousse, C., Masui, T., Meleux, F., Mieville, A., Ohara, T., Raut, J.-C., Riahi, K., Schultz, M. G., Smith, S. J., Thompson, A., van Aardenne, J., van der Werf, G. R., and van Vuuren, D. P.: Evolution of anthropogenic and biomass burning emissions of air pollutants at global and regional scales during the 1980–2010 period, Clim. Change, 109, 163–190, https://doi.org/10.1007/s10584-011-0154-1, 2011.
Hadley, O. L. and Kirchstetter, T. W.: Black-carbon reduction of snow albedo, Nat. Clim. Change, 2, 437–440, https://doi.org/10.1038/nclimate1433, 2012.
Hansen, J. and Nazarenko, L.: Soot climate forcing via snow and ice albedos, P. Natl. Acad. Sci. USA, 101, 423–428, https://doi.org/10.1073/pnas.2237157100, 2004.
Hogan, T. F. and Rosmond, T. E.: The description of the Navy Operational Global Atmospheric Prediction System's spectral forecast model, Mon. Weather Rev., 119, 1786–1815, 1991.
Holben, B. N., Eck, T. F., Slutsker, I., Tanre, D., Buis, J. P., Setzer, A., Vermote, E., Reagan, J. A., Kaufman, Y. J., Nakajima, T., Lavenu, F., Jankowiak, I., and Smirnov, A.: AERONET – A federated instrument network and data archive for aerosol characterization, Remote Sens. Environ., 66, 1–16, https://doi.org/10.1016/S0034-4257(98)00031-5, 1998.
Holben, B. N., Tanré, D., Smirnov, A., Eck, T. F., Slutsker, I.,Abuhassan, N., Newcomb, W. W., Schafer, J. S., Chatenet, B., Lavenu, F., Kaufman, Y. J., Castle, J. V., Setzer, A., Markham, B., Clark, D., Frouin, R., Halthore, R., Karneli, A., O’Neill, N. T., Pietras, C., Pinker, R. T., Voss, K., and Zibordi, G.: An emerging ground-based aerosol climatology: Aerosol optical depth from AERONET, J. Geophys. Res.-Atmos., 106, 12067–12097, https://doi.org/10.1029/2001JD900014, 2001.
Hyer, E. J., Reid, J. S., and Zhang, J.: An over-land aerosol optical depth data set for data assimilation by filtering, correction, and aggregation of MODIS Collection 5 optical depth retrievals, Atmos. Meas. Tech., 4, 379–408, https://doi.org/10.5194/amt-4-379-2011, 2011.
IPCC: Climate change 2021: The physical science basis. Chapter 6, Short-Lived Climate Forcers, edited by: Masson-Delmotte, V., Zhai, P., Pirani, A., Connors, S. L., Péan, C., Berger, S., Caud, N., Chen, Y., Goldfarb, L., Gomis, M. I., Huang, M., Leitzell, K., Lonnoy, E., Matthews, J. B. R., Maycock, T., K., Waterfield, T., Yelekci, O., Yu, R., and Zhou, B., Cambridge University Press, Cambridge, United Kingdom and New York, NY, USA, 817–922, https://doi.org/10.1017/9781009157896.008, 2021.
Jacobson, M. Z.: Climate response of fossil fuel and biofuel soot, accounting for soot's feedback to snow and sea ice albedo and emissivity, J. Geophys. Res., 109, D21201, https://doi.org/10.1029/2004JD004945, 2004.
Kaku, K. C., Reid, J. S., Hand, J. L., Edgerton, E. S., Holben, B. N., Zhang, J., and Holz, R. E.: Assessing the challenges of surface-level aerosol mass estimates from remote sensing during the SEAC4RS and SEARCH campaigns: Baseline surface observations and remote sensing in the southeastern United States, J. Geophys. Res.-Atmos., 123, 7530–7562, https://doi.org/10.1029/2017JD028074, 2018.
Kang, S., Zhang, Y., Qian, Y., and Wang, Y.: A review of black carbon in snow and ice and its impact on the cryosphere, Earth-Sci. Rev., 210, PNNL-SA-154137, https://doi.org/10.1016/j.earscirev.2020.103346, 2020.
Khan, A. L., Wagner, S., Jaffe, R., Xian, P., Williams, M., Armstrong, R., and McKnight, D.: Dissolved black carbon in the global cryosphere: Concentrations and chemical signatures, Geophys. Res. Lett., 44, 6226–6234, https://doi.org/10.1002/2017GL073485, 2017.
Khan, A. L., McMeeking, G., Schwarz, J. P., Xian, P., Welch, K., Berry Lyons, W., and McKnight, D.: Near-surface refractory black carbon observations in the atmosphere and snow in the McMurdo Dry Valleys, Antarctica, and potential impacts of foehn winds, J. Geophys. Res.-Atmos., 123, 2877–2887, https://doi.org/10.1002/2017JD027696, 2018.
Khan, A. L., Klein, A. G., Katich, J. M., and Xian, P.: Local Emissions and Regional Wildfires Influence Refractory Black Carbon Observations Near Palmer Station, Antarctica, Front. Earth Sci., 7, 49, https://doi.org/10.3389/feart.2019.00049, 2019.
Kim, J.-S., Kug, J.-S., Jeong, S.-J., Park, H., and Schaepman-Strub, G.: Extensive fires in southeastern Siberian permafrost linked to preceding Arctic Oscillation, Sci. Adv., 6, eaax3308, https://doi.org/10.1126/sciadv.aax3308, 2020.
Korontzi, S., McCarty, J., Loboda, T., Kumar, S., and Justice, C.: Global distribution of agricultural fires in croplands from 3 years of Moderate Resolution Imaging Spectroradiometer (MODIS) data, Global Biogeochem. Cycles, 20, GB2021, https://doi.org/10.1029/2005GB002529, 2006.
Lance, S., Shupe, M. D., Feingold, G., Brock, C. A., Cozic, J., Holloway, J. S., Moore, R. H., Nenes, A., Schwarz, J. P., Spackman, J. R., Froyd, K. D., Murphy, D. M., Brioude, J., Cooper, O. R., Stohl, A., and Burkhart, J. F.: Cloud condensation nuclei as a modulator of ice processes in Arctic mixed-phase clouds, Atmos. Chem. Phys., 11, 8003–8015, https://doi.org/10.5194/acp-11-8003-2011, 2011.
Leck, C. and Svensson, E.: Importance of aerosol composition and mixing state for cloud droplet activation over the Arctic pack ice in summer, Atmos. Chem. Phys., 15, 2545–2568, https://doi.org/10.5194/acp-15-2545-2015, 2015.
Levy, R. C., Remer, L. A., Kleidman, R. G., Mattoo, S., Ichoku, C., Kahn, R., and Eck, T. F.: Global evaluation of the Collection 5 MODIS dark-target aerosol products over land, Atmos. Chem. Phys., 10, 10399–10420, https://doi.org/10.5194/acp-10-10399-2010, 2010.
Lisok, J., Rozwadowska, A., Pedersen, J. G., Markowicz, K. M., Ritter, C., Kaminski, J. W., Struzewska, J., Mazzola, M., Udisti, R., Becagli, S., and Gorecka, I.: Radiative impact of an extreme Arctic biomass-burning event, Atmos. Chem. Phys., 18, 8829–8848, https://doi.org/10.5194/acp-18-8829-2018, 2018.
Liu, T., Mickley, L. J., and McCarty, J. L.: Global search for temporal shifts in fire activity: potential human influence on southwest Russia and north Australia fire seasons, Environ. Res. Lett., 16, 044023, https://doi.org/10.1088/1748-9326/abe328, 2021.
Lund Myhre, C., Toledano, C., Myhre, G., Stebel, K., Yttri, K. E., Aaltonen, V., Johnsrud, M., Frioud, M., Cachorro, V., de Frutos, A., Lihavainen, H., Campbell, J. R., Chaikovsky, A. P., Shiobara, M., Welton, E. J., and Tørseth, K.: Regional aerosol optical properties and radiative impact of the extreme smoke event in the European Arctic in spring 2006, Atmos. Chem. Phys., 7, 5899–5915, https://doi.org/10.5194/acp-7-5899-2007, 2007.
Lynch, P., Reid, J. S., Westphal, D. L., Zhang, J., Hogan, T. F., Hyer, E. J., Curtis, C. A., Hegg, D. A., Shi, Y., Campbell, J. R., Rubin, J. I., Sessions, W. R., Turk, F. J., and Walker, A. L.: An 11-year global gridded aerosol optical thickness reanalysis (v1.0) for atmospheric and climate sciences, Geosci. Model Dev., 9, 1489–1522, https://doi.org/10.5194/gmd-9-1489-2016, 2016.
Macias Fauria, M. and Johnson, E. A.: Large-scale climatic patterns control large lightning fire occurrence in Canada and Alaska forest regions, J. Geophys. Res., 111, G04008, https://doi.org/10.1029/2006JG000181, 2006.
Markowicz, K. M., Pakszys, R., Ritter, C., Zielensi, T., Udisti, R., Cappelletti, D., Mazzola, M., Shobara, M., Xian, P., Zawadzka, O., Lisok, J., Petelski, T., Makuch, P., and Karasinksi, G.: Impact of North American intense fires on aerosol optical properties measured over the European Arctic in July 2015, J. Geophys. Res.-Atmos., 121, 14487–14512, https://doi.org/10.1002/2016JD025310, 2016.
Markowicz, K. M., Lisok, L., and Xian, P.: Simulations of the effect of intensive biomass burning in July 2015 on Arctic radiative forcing, Atmos. Environ., 171, 248–260, https://doi.org/10.1016/j.atmosenv.2017.10.015, 2017.
Markowicz, K. M., Lisok, J., and Xian, P.: Simulation of longterm direct aerosol radiative forcing over the arctic within the framework of the iAREA project, Atmos. Environ., 244, 117882, https://doi.org/10.1016/j.atmosenv.2020.117882, 2021.
Marquis, J. W., Campbell, J. R., Cummings, J. A., Westphal, D. L., Smith, N. J., Zhang, J., and Bogdanoff, A. S.: Estimating Infrared Radiometric Satellite Sea Surface Temperature Retrieval Cold Biases in the Tropics due to Unscreened Optically Thin Cirrus Clouds, J. Atmos. Ocean. Tech., 2, 355–373, https://doi.org/10.1175/JTECH-D-15-0226.1, 2017.
Matsui, H., Kondo, Y., Moteki, N., Takegawa, N., Sahu, L. K., Zhao, Y., Fuelberg, H. E., Sessions, W. R., Diskin, G., Blake, D. R., Wisthaler, A., and Koike, M.: Seasonal variation of the transport of black carbon aerosol from the Asian continent to the Arctic during the ARCTAS aircraft campaign, J. Geophys. Res.-Atmos., 116, D05202, https://doi.org/10.1029/2010JD015067, 2011.
Mauritsen, T., Sedlar, J., Tjernström, M., Leck, C., Martin, M., Shupe, M., Sjogren, S., Sierau, B., Persson, P. O. G., Brooks, I. M., and Swietlicki, E.: An Arctic CCN-limited cloud-aerosol regime, Atmos. Chem. Phys., 11, 165–173, https://doi.org/10.5194/acp-11-165-2011, 2011.
McCarty, J. L., Aalto, J., Paunu, V.-V., Arnold, S. R., Eckhardt, S., Klimont, Z., Fain, J. J., Evangeliou, N., Venäläinen, A., Tchebakova, N. M., Parfenova, E. I., Kupiainen, K., Soja, A. J., Huang, L., and Wilson, S.: Reviews and syntheses: Arctic fire regimes and emissions in the 21st century, Biogeosciences, 18, 5053–5083, https://doi.org/10.5194/bg-18-5053-2021, 2021.
McNaughton, C. S., Clarke, A. D., Freitag, S., Kapustin, V. N., Kondo, Y., Moteki, N., Sahu, L., Takegawa, N., Schwarz, J. P., Spackman, J. R., Watts, L., Diskin, G., Podolske, J., Holloway, J. S., Wisthaler, A., Mikoviny, T., de Gouw, J., Warneke, C., Jimenez, J., Cubison, M., Howell, S. G., Middlebrook, A., Bahreini, R., Anderson, B. E., Winstead, E., Thornhill, K. L., Lack, D., Cozic, J., and Brock, C. A.: Absorbing aerosol in the troposphere of the Western Arctic during the 2008 ARCTAS/ARCPAC airborne field campaigns, Atmos. Chem. Phys., 11, 7561–7582, https://doi.org/10.5194/acp-11-7561-2011, 2011.
O'Neill, N. T., Eck, T. F., Holben, B. N., Smirnov, A., Dubovik, O., and Royer, A.: Bimodal size distribution influences on the variation of Angstrom derivatives in spectral and optical depth space, J. Geophys. Res., 106, 9787–9806, 2001.
O'Neill, N. T., Eck, T. F., Smirnov, A., Holben, B. N., and Thulasiraman, S.: Spectral discrimination of coarse and fine mode optical depth, J. Geophys. Res., 108, D05212, https://doi.org/10.1029/2002JD002975, 2003.
Park, T., Ganguly, S., Tømmervik, H., Euskirchen, E. S., Høgda, K.-A., Karlsen, S. R., Brovkin, V., Nemani, R. R., and Myneni, R. B.: Changes in growing season duration and productivity of northern vegetation inferred from long-term remote sensing data, Environ. Res. Lett., 11, 084001, https://doi.org/10.1088/1748-9326/11/8/084001, 2016.
Peterson, D. A., Hyer, E. J., Campbell, J. R., Solbrig, J. E., and Fromm, M. D.: A conceptual model for development of intense pyroconvection in western North America, Mon. Weather Rev., 145, 2235–2255, https://doi.org/10.1175/MWR-D-16-0232.1, 2017.
Peterson, D. A., Campbell, J. R., Hyer, E. J., Fromm, M. D., Kablick, G. P., Cossuth, J. H., and Deland, M. T.: Wildfire-driven thunderstorms cause a volcano-like stratospheric injection of smoke, NPJ Clim. and Atmos. Sci., 1, 30, https://doi.org/10.1038/s41612-018-0039-3, 2018.
Prenni, A. J., Harrington, J. Y., Tjernstöm, M., DeMott, P. J., Avramov, A., Long, C. N., Kreidenweis, S. M., Olsson, P. Q., and Verlinde, J.: Can ice-nucleating aerosols affect arctic seasonal climate?, B. Am. Meteorol. Soc., 88, 541–550, https://doi.org/10.1175/BAMS-88-4-541, 2007.
Quinn, P. K., Bates, T. S., Baum, E., Doubleday, N., Fiore, A. M., Flanner, M., Fridlind, A., Garrett, T. J., Koch, D., Menon, S., Shindell, D., Stohl, A., and Warren, S. G.: Short-lived pollutants in the Arctic: their climate impact and possible mitigation strategies, Atmos. Chem. Phys., 8, 1723–1735, https://doi.org/10.5194/acp-8-1723-2008, 2008.
Ranjbar, K., O'Neill, N. T., Lutsch, E., McCullough, E. M., AboEl-Fetouh, Y., Xian, P., Strong, K., Fioletov, V. E., Sesins, G., and Abboud, I.: Extreme smoke event over the high Arctic, Atmos. Environ., 218, 117002, https://doi.org/10.1016/j.atmosenv.2019.117002, 2019.
Ranjbar, K., O'Neill, N. T., and Aboel-Fetouh, Y.: Comment on “Short-cut transport path for Asian dust directly to the Arctic: a case Study” by Huang et al. (2015) in Environ. Res. Lett., Atmos. Chem. Phys., 22, 1757–1760, https://doi.org/10.5194/acp-22-1757-2022, 2022.
Reid, J. S., Koppmann, R., Eck, T. F., and Eleuterio, D. P.: A review of biomass burning emissions part II: intensive physical properties of biomass burning particles, Atmos. Chem. Phys., 5, 799–825, https://doi.org/10.5194/acp-5-799-2005, 2005.
Reid, J. S., Hyer, E. J., Prins, E. M., Westphal, D. L., Zhang, J., Wang, J., Christopher, S. A., Curtis, C. A., Schmidt, C. C., Eleuterio, D. P., Richardson, K. A., and Hoffman, J. P.: Global Monitoring and Forecasting of Biomass-Burning Smoke: Description of and Lessons from the Fire Locating and Modeling of Burning Emissions (FLAMBE) Program, IEEE J. Sel. Top. Appl., 2, 144–162, JSTARS-2009-00034, 2009.
Rinke, A., Maturilli, M., Graham, R. M., Hatthes, H., Handorf, D., Cohen, L., Hudson, S. R., and Moore, J. C.: Extreme cyclone events in the Arctic: Wintertime variability and trends, Environ. Res. Lett., 12 094006, https://doi.org/10.1088/1748-9326/aa7def, 2017.
Saha, A., O'Neill, N. T., Eloranta, E., Stone, R. S., Eck, T. F., Zidane, S., Daou, D., Lupu, A., Lesins, G., and Shiobara, M.: Pan-Arctic sunphotometry during the ARCTAS-A campaign of April 2008, Geophys. Res. Lett., 37, L05803, https://doi.org/10.1029/2009GL041375, 2010.
Sand, M., Berntsen, T. K., Seland, Ø., and Kristjánsson, J. E.: Arctic surface temperature change to emissions of black carbon within Arctic or midlatitudes, J. Geophys. Res.-Atmos., 118, 7788–7798, https://doi.org/10.1002/jgrd.50613, 2013.
Schlosser, J. S., Braun, R. A., Bradley, T., Dadashazar, H., MacDonald, A. B., Aldhaif, A. A., Aghdam, M., Mardi, A. H., Xian, P., and Sorooshian, A.: Analysis of aerosol composition data for western United States wildfires between 2005 and 2015: Dust emissions, chloride depletion, and most enhanced aerosol constituents, J. Geophys. Res.-Atmos., 122, 8951–8966, https://doi.org/10.1002/2017JD026547, 2017.
Schutgens, N., Sayer, A. M., Heckel, A., Hsu, C., Jethva, H., de Leeuw, G., Leonard, P. J. T., Levy, R. C., Lipponen, A., Lyapustin, A., North, P., Popp, T., Poulsen, C., Sawyer, V., Sogacheva, L., Thomas, G., Torres, O., Wang, Y., Kinne, S., Schulz, M., and Stier, P.: An AeroCom–AeroSat study: intercomparison of satellite AOD datasets for aerosol model evaluation, Atmos. Chem. Phys., 20, 12431–12457, https://doi.org/10.5194/acp-20-12431-2020, 2020.
Serreze, M. C. and Barry, R. G.: Processes and impacts of Arctic amplification: A research synthesis, Global Planet. Change, 77, 85–96, https://doi.org/10.1016/j.gloplacha.2011.03.004, 2011.
Serreze, M. C. and Francis, J. A.: The Arctic Amplification Debate, Clim. Change, 76, 241–264, https://doi.org/10.1007/s10584-005-9017-y, 2006.
Sessions, W. R., Reid, J. S., Benedetti, A., Colarco, P. R., da Silva, A., Lu, S., Sekiyama, T., Tanaka, T. Y., Baldasano, J. M., Basart, S., Brooks, M. E., Eck, T. F., Iredell, M., Hansen, J. A., Jorba, O. C., Juang, H.-M. H., Lynch, P., Morcrette, J.-J., Moorthi, S., Mulcahy, J., Pradhan, Y., Razinger, M., Sampson, C. B., Wang, J., and Westphal, D. L.: Development towards a global operational aerosol consensus: basic climatological characteristics of the International Cooperative for Aerosol Prediction Multi-Model Ensemble (ICAP-MME), Atmos. Chem. Phys., 15, 335–362, https://doi.org/10.5194/acp-15-335-2015, 2015.
Shi, Y., Zhang, J., Reid, J. S., Holben, B., Hyer, E. J., and Curtis, C.: An analysis of the collection 5 MODIS over-ocean aerosol optical depth product for its implication in aerosol assimilation, Atmos. Chem. Phys., 11, 557–565, https://doi.org/10.5194/acp-11-557-2011, 2011.
Shi, Y., Zhang, J., Reid, J. S., Hyer, E. J., and Hsu, N. C.: Critical evaluation of the MODIS Deep Blue aerosol optical depth product for data assimilation over North Africa, Atmos. Meas. Tech., 6, 949–969, https://doi.org/10.5194/amt-6-949-2013, 2013.
Skiles S. M., Flanner, M., Cook, J. M., Dumont, M., and Painter, T.: Radiative forcing by light-absorbing particles in snow, Nat. Clim. Change, 8, 964–971, https://doi.org/10.1038/s41558-018-0296-5, 2018.
Smirnov, A., Holben, B. N., Slutsker, I., Giles, D. M., McClain, C. R., Eck, T. F., Sakerin, S. M., Macke, A., Croot, P., Zibordi, G., Quinn, P. K., Sciare, J., Kinne, S., Harvey, M., Smyth, T. J., Piketh, S., Zielinski, T., Proshutinsky, A., Goes, J. I., Nelson, N. B., Larouche, P., Radionov, V. F., Goloub, P., Krishna Moorthy, K., Matarrese, R., Robertson, E. J., and Jourdin, F.: Maritime Aerosol Network as a component of Aerosol Robotic Network, J. Geophys. Res.-Atmos., 114, D06204, https://doi.org/10.1029/2008JD011257, 2009.
Smirnov, A., Holben, B. N., Giles, D. M., Slutsker, I., O'Neill, N. T., Eck, T. F., Macke, A., Croot, P., Courcoux, Y., Sakerin, S. M., Smyth, T. J., Zielinski, T., Zibordi, G., Goes, J. I., Harvey, M. J., Quinn, P. K., Nelson, N. B., Radionov, V. F., Duarte, C. M., Losno, R., Sciare, J., Voss, K. J., Kinne, S., Nalli, N. R., Joseph, E., Krishna Moorthy, K., Covert, D. S., Gulev, S. K., Milinevsky, G., Larouche, P., Belanger, S., Horne, E., Chin, M., Remer, L. A., Kahn, R. A., Reid, J. S., Schulz, M., Heald, C. L., Zhang, J., Lapina, K., Kleidman, R. G., Griesfeller, J., Gaitley, B. J., Tan, Q., and Diehl, T. L.: Maritime aerosol network as a component of AERONET – first results and comparison with global aerosol models and satellite retrievals, Atmos. Meas. Tech., 4, 583–597, https://doi.org/10.5194/amt-4-583-2011, 2011.
Sogacheva, L., Popp, T., Sayer, A. M., Dubovik, O., Garay, M. J., Heckel, A., Hsu, N. C., Jethva, H., Kahn, R. A., Kolmonen, P., Kosmale, M., de Leeuw, G., Levy, R. C., Litvinov, P., Lyapustin, A., North, P., Torres, O., and Arola, A.: Merging regional and global aerosol optical depth records from major available satellite products, Atmos. Chem. Phys., 20, 2031–2056, https://doi.org/10.5194/acp-20-2031-2020, 2020.
Stohl, A., Andrews, E., Burkhart, J. F., Forster, C., Herber, A., Hoch, S. W., Kowal, D., Lunder, C., Mefford, T., Ogren, J. A., Sharma, S., Spichtinger, N., Stebel, K., Stone, R., Strom, J., Torseth, K., Wehrli, C., and Yttri, K. E.: Pan-Arctic enhancements of light absorbing aerosol concentrations due to North American boreal forest fires during summer 2004, J. Geophys. Res.-Atmos., 111, D22214, https://doi.org/10.1029/2006jd007216, 2006.
Stohl, A., Berg, T., Burkhart, J. F., Fjǽraa, A. M., Forster, C., Herber, A., Hov, Ø., Lunder, C., McMillan, W. W., Oltmans, S., Shiobara, M., Simpson, D., Solberg, S., Stebel, K., Ström, J., Tørseth, K., Treffeisen, R., Virkkunen, K., and Yttri, K. E.: Arctic smoke – record high air pollution levels in the European Arctic due to agricultural fires in Eastern Europe in spring 2006, Atmos. Chem. Phys., 7, 511–534, https://doi.org/10.5194/acp-7-511-2007, 2007.
Stone, R. S., Anderson, G. P., Shettle, E. P., Andrews, E., Loukachine, K., Dutton, E. G., Schaaf, C., and Roman III, M. O.: Radiative impact of boreal smoke in the Arctic: Observed and modeled, J. Geophys. Res., 113, D14S16, https://doi.org/10.1029/2007JD009657, 2008.
Tomasi, C., Vitale, V., Lupi, A., Di Carmine, C., Campanelli, M., Herber, A., Treffeisen, R., Stone, R. S., Andrews, E., Sharma, S., Radionov, V., von Hoyningen-Huene, W., Stebel, K., Hansen, G. H., Myhre, C. L.,Wehrli, C., Aaltonen, V., Lihavainen, H., Virkkula, A., Hillamo, R., Ström, J., Toledano, C., Cachorro, V. E., Ortiz, P., de Frutos, A. M., Blindheim, S., Frioud, M., Gausa, M., Zielinski, T., Petelski, T., and Yamanouchi, T.: Aerosols in polar regions: a historical overview based on optical depth and in situ observations, J. Geophys. Res.-Atmos., 112, D16, https://doi.org/10.1029/2007JD008432, 2007.
Torres, O., Bhartia, P. K., Taha, G., Jethva, H., Das, S., Colarco, P., Krotkov, N., Omar, A., and Ahn, C.: Stratospheric Injection of Massive Smoke Plume From Canadian Boreal Fires in 2017 as Seen by DSCOVR-EPIC, CALIOP, and OMPS-LP Observations, J. Geophys. Res.-Atmos., 125, e2020JD032579, https://doi.org/10.1029/2020JD032579, 2020.
Tosca, M, Campbell, J., Garay, G., Lolli, S., Seidel, F., Marquis, J., and Kalashnikova, O.: Attributing accelerated summertime warming in the southeast United States to recent reductions in aerosol burden: indications from vertically-resolved observations, Remote Sens., 9, 674, https://doi.org/10.3390/rs9070674, 2017.
Valkonen, E., Cassano, J., and Cassano, E.: Arctic cyclones and their interactions with the declining sea ice: A recent climatology, J. Geophys. Res.-Atmos., 126, e2020JD034366, https://doi.org/10.1029/2020JD034366, 2021.
Wang, Y., Jiang, J., Su, H., Choi, S., Huang, L., Guo, J., and Yung, Y.: Elucidating the Role of Anthropogenic Aerosols in Arctic Sea Ice Variations, J. Climate, 31, 99–114, https://doi.org/10.1029/2006JD007234, 2018.
Warren, S. G. and Wiscombe, W. J.: A model for the spectral albedo of snow. II: Snow containing atmospheric aerosols, J. of Atmos. Sci., 37, 2734–2745, https://doi.org/10.1175/1520-0469(1980)037<2734:AMFTSA>2.0.CO;2, 1980.
Waseda, T., Nose, T., Kodaira, T., Sasmal, K., and Webb, A.: Climatic trends of extreme wave events caused by Arctic cyclones in the western Arctic Ocean, Polar Sci., 27, 100625, https://doi.org/10.1016/j.polar.2020.100625, 2021.
Wex, H., Huang, L., Zhang, W., Hung, H., Traversi, R., Becagli, S., Sheesley, R. J., Moffett, C. E., Barrett, T. E., Bossi, R., Skov, H., Hünerbein, A., Lubitz, J., Löffler, M., Linke, O., Hartmann, M., Herenz, P., and Stratmann, F.: Annual variability of ice-nucleating particle concentrations at different Arctic locations, Atmos. Chem. Phys., 19, 5293–5311, https://doi.org/10.5194/acp-19-5293-2019, 2019.
Witek, M. L., Flatau, P. J., Quinn, P. K., and Westphal, D. L.: Global sea-salt modeling: Results and validation against multicampaign shipboard measurements, J. Geophys. Res., 112, D08215, https://doi.org/10.1029/2006JD007779, 2007.
Xian, P., Reid, J. S., Turk, J. F., Hyer, E. J., and Westphal, D. L.: Impact of models versus satellite measured tropical precipitation on regional smoke optical thickness in an aerosol transport model, Geophys. Res. Lett., 36, L16805, https://doi.org/10.1029/2009GL038823, 2009.
Xian, P., Reid, J. S., Hyer, E. J., Sampson, C. R., Rubin, J. I., Ades, M., Asencio, N., Basart, S., Benedetti, A., Bhattacharjee, P. S., Brooks, M. E., Colarco, P. R., da Silva, A. M., Eck, T. F., Guth, J., Jorba, O., Kouznetsov, R., Kipling, Z., Sofiev, M., Perez Garcia-Pando, C., Pradhan, Y., Tanaka, T., Wang, J., Westphal, D. L., Yumimoto, K., and Zhang, J.: Current state of the global operational aerosol multi-model ensemble: An update from the International Cooperative for Aerosol Prediction (ICAP), Q. J. Roy. Meteor. Soc., 145, 176–209, https://doi.org/10.1002/qj.3497, 2019.
Xian, P., Zhang, J., O'Neill, N. T., Toth, T. D., Sorenson, B., Colarco, P. R., Kipling, Z., Hyer, E. J., Campbell, J. R., Reid, J. S., and Ranjbar, K.: Arctic spring and summertime aerosol optical depth baseline from long-term observations and model reanalyses – Part 1: Climatology and trend, Atmos. Chem. Phys., 22, 9915–9947, https://doi.org/10.5194/acp-22-9915-2022, 2022.
Yang, Y., Wang, H., Smith, S. J., Easter, R. C., and Rasch, P. J.: Sulfate Aerosol in the Arctic: Source Attribution and Radiative Forcing, J. Geophys. Res.-Atmos., 123, 1899–1918, https://doi.org/10.1002/2017JD027298, 2018.
Yoon, J., Chang, D. Y., Leliveld, J., Pozzer, A., Kim, J., and Yum, S. S.: Empirical evidence of a positive climate forcing of aerosols at elevated albedo, Atmos. Res., 229, 269–279, https://doi.org/10.1016/j.atmosres.2019.07.001, 2019.
Yumimoto, K., Tanaka, T. Y., Oshima, N., and Maki, T.: JRAero: the Japanese Reanalysis for Aerosol v1.0, Geosci. Model Dev., 10, 3225–3253, https://doi.org/10.5194/gmd-10-3225-2017, 2017.
Zamora, L. M., Kahn, R. A., Cubison, M. J., Diskin, G. S., Jimenez, J. L., Kondo, Y., McFarquhar, G. M., Nenes, A., Thornhill, K. L., Wisthaler, A., Zelenyuk, A., and Ziemba, L. D.: Aircraft-measured indirect cloud effects from biomass burning smoke in the Arctic and subarctic, Atmos. Chem. Phys., 16, 715–738, https://doi.org/10.5194/acp-16-715-2016, 2016.
Zhang, J., Reid, J. S., Alfaro-Contreras, R., and Xian, P.: Has China been exporting less particulate air pollution over the past decade?, Geophys. Res. Lett., 44, 2941–2948, https://doi.org/10.1002/2017GL072617, 2017.
Zhang, J. and Reid, J. S.: MODIS Aerosol Product Analysis for Data Assimilation: Assessment of Level 2 Aerosol Optical Thickness Retrievals, J. Geophys. Res.-Atmos., 111, 22207, https://doi.org/10.1029/2005JD006898, 2006.
Zhang, J. L., Reid, J. S., Westphal, D. L., Baker, N. L., and Hyer, E. J.: A system for operational aerosol optical depth data assimilation over global oceans, J. Geophys. Res., 113, D10208, https://doi.org/10.1029/2007JD009065, 2008.
Zhang, Z., Wang, L., Xue, N., and Du, Z.: Spatiotemporal Analysis of Active Fires in the Arctic Region during 2001–2019 and a Fire Risk Assessment Model. Fire, 4, 57, https://doi.org/10.3390/fire4030057, 2021.
Zhao, C. and Garrett, T. J.: Effects of Arctic haze on surface cloud radiative forcing, Geophys. Res. Lett., 42, 557–564, https://doi.org/10.1002/2014GL062015, 2015.
- Article
(14935 KB) - Full-text XML