the Creative Commons Attribution 4.0 License.
the Creative Commons Attribution 4.0 License.
 | 03 Aug 2022
Emissions of organic compounds from western US wildfires and their near-fire transformations
Christos Stamatis
Edward C. Fortner
Rebecca A. Wernis
Paul Van Rooy
Francesca Majluf
Tara I. Yacovitch
Conner Daube
Scott C. Herndon
Nathan M. Kreisberg
Kelley C. Barsanti
Allen H. Goldstein
The size and frequency of wildfires in the western United States have been increasing, and this trend is projected to continue, with increasing adverse consequences for human health. Gas- and particle-phase organic compounds are the main components of wildfire emissions. Some of the directly emitted compounds are hazardous air pollutants, while others can react with oxidants to form secondary air pollutants such as ozone and secondary organic aerosol (SOA). Further, compounds emitted in the particle phase can volatize during smoke transport and can then serve as precursors for SOA. The extent of pollutant formation from wildfire emissions is dependent in part on the speciation of organic compounds. The most detailed speciation of organic compounds has been achieved in laboratory studies, though recent field campaigns are leading to an increase in such measurements in the field. In this study, we identified and quantified hundreds of gas- and particle-phase organic compounds emitted from conifer-dominated wildfires in the western US, using two two-dimensional gas chromatography coupled with time-of-flight mass spectrometry (GC × GC ToF-MS) instruments. Observed emission factors (EFs) and emission ratios are reported for four wildfires. As has been demonstrated previously, modified combustion efficiency (MCE) was a good predictor of particle-phase EFs (e.g., R2=0.78 and 0.84 for sugars and terpenoids, respectively), except for elemental carbon. Higher emissions of diterpenoids, resin acids, and monoterpenes were observed in the field relative to laboratory studies, likely due to distillation from unburned heated vegetation, which may be underrepresented in laboratory studies. These diterpenoids and resin acids accounted for up to 45 % of total quantified organic aerosol, higher than the contribution from sugar and sugar derivatives. The low volatility of resin acids makes them ideal markers for conifer fire smoke. The speciated measurements also show that evaporation of semi-volatile organic compounds took place in smoke plumes, which suggests that the evaporated primary organic aerosol can be a precursor of SOAs in wildfire smoke plumes.
- Article
(3717 KB) - Full-text XML
-
Supplement
(1881 KB) - BibTeX
- EndNote


As a result of fire suppression and climate change, wildfires in the western US are becoming larger and more frequent, leading to deteriorating air quality (Westerling et al., 2006; Dennison et al., 2014; McClure and Jaffe, 2018; Iglesias et al., 2022). While CO and CO2 dominate biomass burning (BB) emissions, organic compounds are more important in the context of air quality (Andreae and Merlet, 2001; Fine et al., 2004; Permar et al., 2021). Also, biomass burning is the main global source of primary carbonaceous aerosols and the second-largest global source of non-methane organic compounds (Bond et al., 2004; Akagi et al., 2011). Many organic compounds directly emitted from biomass burning are hazardous air pollutants (Kim et al., 2018; O'Dell et al., 2020), and the atmospheric transformation of primary wildfire emissions can produce secondary organic aerosol (SOA) and ozone (Jaffe and Wigder, 2012; Gong et al., 2017; Lim et al., 2019; Liang et al., 2022), both of which have negative impacts on human health (Jerrett et al., 2009; Tuet et al., 2017; Wong et al., 2019). Understanding the chemical composition and transformations of biomass burning organic aerosol (BBOA) is therefore needed to predict the impact of wildfire smoke on human health and atmospheric chemistry.
The emissions from wildfires are critical inputs to atmospheric models used for assessing the effects of wildfire smoke. Although significant progress has been made in the chemical characterization of wildfire emissions in recent years, improved understanding of the emission profiles of photochemically reactive compounds, toxic compounds (such as polycyclic aromatic hydrocarbons, PAHs), intermediate-volatile and semi-volatile organic compounds (I/SVOCs), and primary organic aerosol (POA) are still needed (Hatch et al., 2018; Andreae, 2019). Speciated measurements are necessary because even compounds with the same molecular formula (e.g., monoterpenes) can have very different OH reactivities and SOA yields (Atkinson and Arey, 2003; Lee et al., 2006a, b). In addition, as smoke dilutes, organic compounds in the particle phase can evaporate and can produce SOA when these I/SVOCs are then oxidized in the atmosphere (Robinson et al., 2007). Some studies have shown that dilution, evaporation, and subsequent SOA formation in BB smoke plumes contribute more to SOA production than SOA formation from VOCs (Grieshop et al., 2009; Bruns et al., 2016; Palm et al., 2020). These conclusions were mainly based on bulk aerosol property measurements and/or subtracting the contribution from traditional gas-phase SOA precursors. Bulk measurements limit the ability to differentiate specific processes and sources due to the lack of unique signatures (Zhang et al., 2018). Thus, identification and quantification of evaporated POA compounds are needed to better constrain the contribution of this process to SOA formation in BB plumes. Further, identification of particle-phase organic compounds at the molecular level can be useful for identifying marker compounds for source apportionment studies and generally enable better understanding of SOA formation chemistry in wildfire plumes.
One-dimensional gas chromatography-mass spectrometry (GC-MS) has been widely used for molecular-level measurements of biomass burning emissions in both the gas and particle phases. Many organic compounds in BB emissions have been identified and quantified by this technique (Simoneit et al., 1993; Fine et al., 2004; Hornbrook et al., 2011). This method is suitable for the characterization of compounds outstanding in the chromatogram and for targeted quantification of known BB tracers. However, it remains challenging to achieve full or near-full speciation of complex mixtures, such as BB emissions, due to the co-elution of many chemicals from the chromatographic column. It has been shown that unresolved compounds can contribute substantially to SOA formation (Jathar et al., 2014; Zhao et al., 2014). However, non-targeted molecular-level measurements of organic emissions from biomass burning, particularly in the particle phase, remain scarce in the literature.
More complete characterization of complex mixtures of gas- and particle-phase organic compounds is possible using two-dimensional gas chromatography (GC × GC), in which compounds are separated by both volatility and polarity. This method has been used to measure ambient OA composition in many urban and remote sites (An et al., 2021). Through GC × GC analysis, thousands of gas- and particle-phase compounds have been identified and quantified in BB emissions from lab combustion experiments (Hatch et al., 2015, 2018; Jen et al., 2019). Wildfire emissions, however, can be different from laboratory fires. In wildfires, usually the fuel is a complex mixture of biomass from the crown to the understory and soil organic layer, burning at different stages. Many environmental factors such as fuel bed characteristics and meteorology can affect the combustion processes (Ottmar, 2014; Andreae, 2019). In August 2019, the Aerodyne Mobile Laboratory (AML), equipped with a comprehensive suite of real-time instruments (Kolb et al., 2004; Herndon et al., 2005; Yacovitch et al., 2019), sampled ground-based near-source emissions from wildfires in the western US as a part of the Fire Influence on Regional to Global Environments and Air Quality (FIREX-AQ) campaign. In this work, we focus on the analysis of organic gases and particulate matter with diameters less than 2.5 µm (PM2.5) collected using sorbent tubes and filters, respectively, on board the AML. Ground-based observations with the AML had the advantage of allowing sampling very close to the wildfires (sometimes even less than 100 m), which minimized the transformations occurring between emissions and measurements. The main objectives of this research were to (1) measure the emissions of gas- and particle-phase organic compounds from wildfires, explore the factors controlling the emissions, and compare the results with the laboratory fires and to (2) investigate the effect of near-fire transformation of BBOA from the molecular perspective. The results from this work will be important inputs in atmospheric chemistry models and can potentially give public health scientists targets for toxicological studies to better understand the health impacts of wildfire smoke.
2.1 Fires, sampling routes
Smoke from four fires was sampled using the AML in this field campaign: the Nethker Fire near McCall, Idaho, Castle and Ikes Fires in Arizona, and 204 Cow Fire in Oregon. The sizes, fuel information, and canopy conditions of the fires are summarized in Table 1. Although the sizes of the fires varied, fuel in all four fires was dominated by conifers. The perimeters of the fires and the sampling routes of the AML are displayed in Fig. 1. The Castle and Ikes Fires were very close to each other (Fig. 1c). It is hard to separate the influences from the two fires, especially for hourly samples, which were probably affected by emissions from both fires. We therefore consider the Castle and Ikes Fires together as “Arizona Fires”. As shown in Fig. 1, some of the filter and sorbent tube samples were taken when the AML was stationary, while others were taken when the AML was in transit. To avoid self-sampling the exhaust of the AML, the ambient air was sampled from the front of the AML. During stationary sampling, the AML was parked with the sample inlet facing into the wind. More information about the fires and operational details of the AML during this campaign can be found in Sumlin et al. (2021). The entire sampling route of the AML for this campaign can be found in Majluf et al. (2022). We also collected PM2.5 samples at a regional background site at the McCall Activity Barn (longitude −116.115∘, latitude 44.872∘, shown in Fig. 1b).
Table 1Key characteristics of wildfires studied.
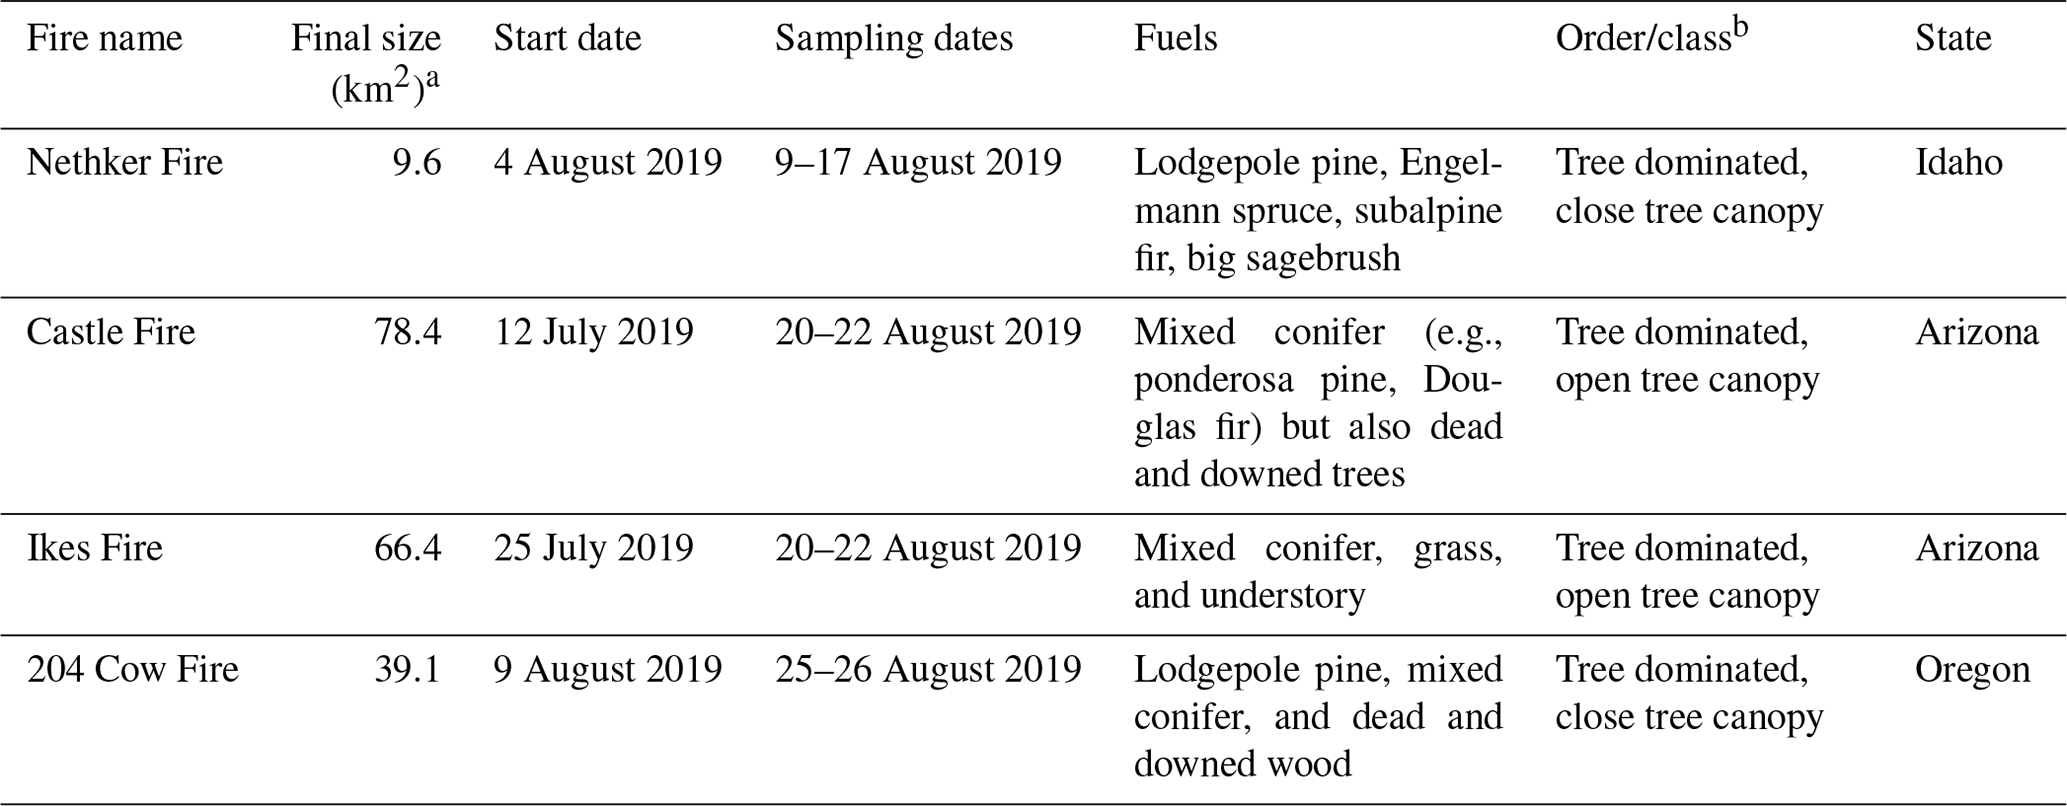
a The final sizes and fuels of fires are accessible at the Incident Information System's website (https://inciweb.nwcg.gov/, last access: 28 July 2022). b The order/class information is taken from the LANDFIRE Existing Vegetation Type database (https://landfire.gov/evt.php, last access: 28 July 2022).
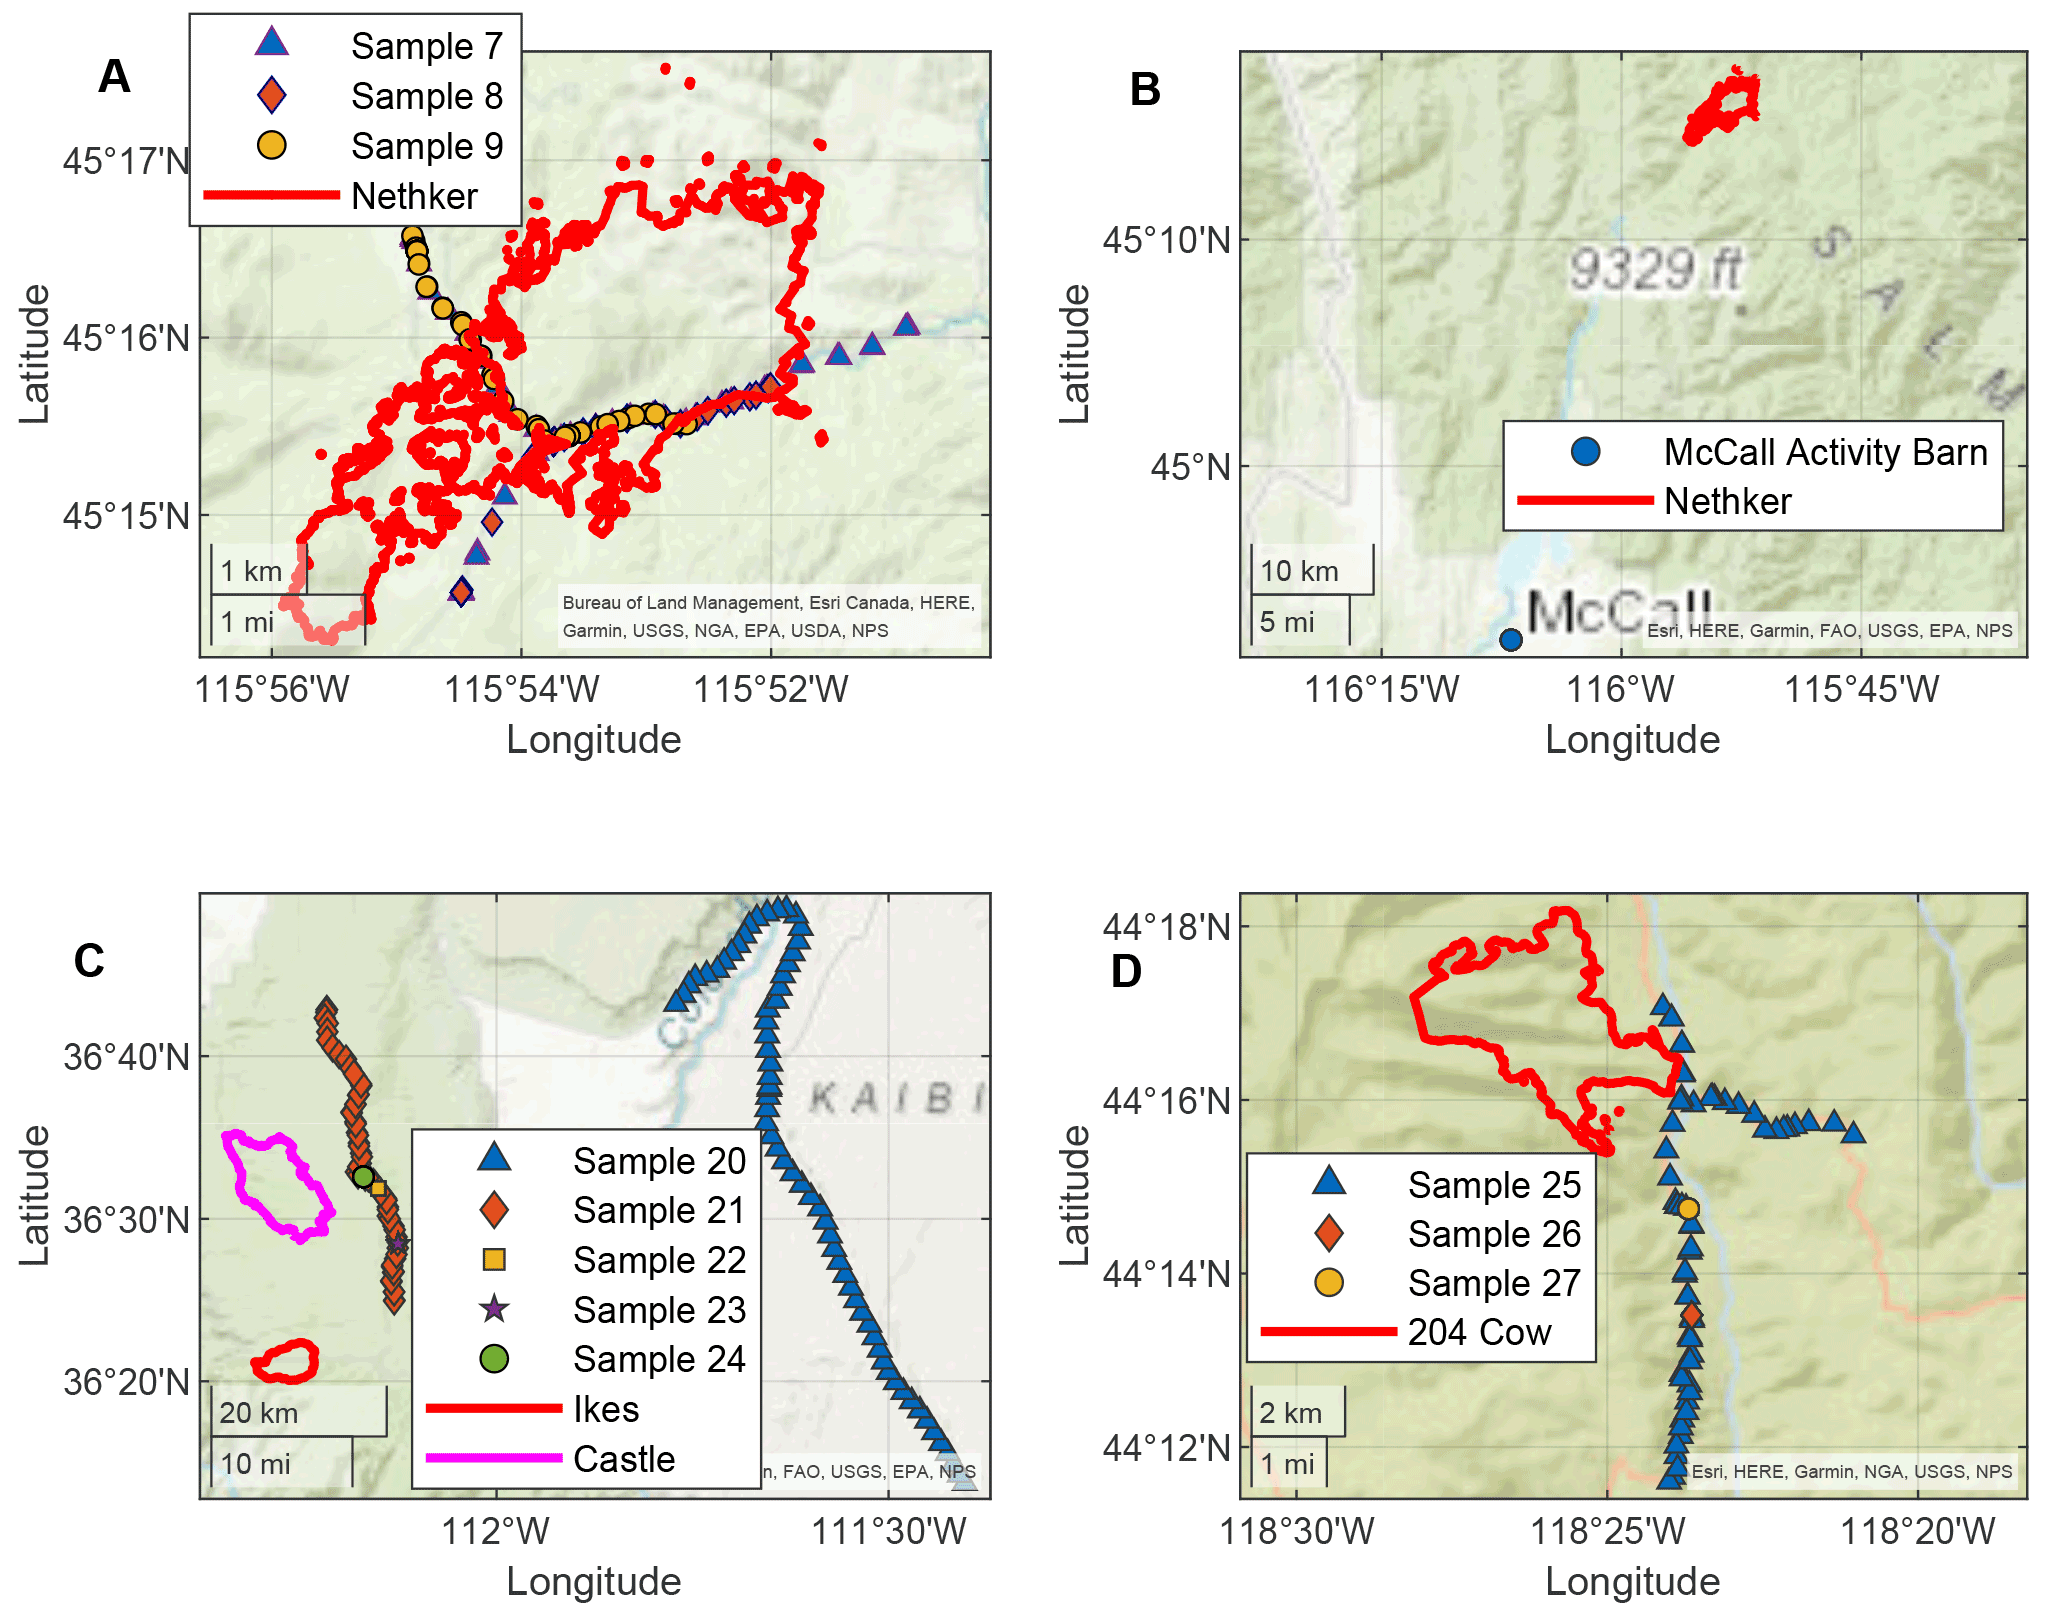
Figure 1Locations of the AML (every minute) when hourly samples were collected and perimeters of the fires (a and b Nethker Fires, c Arizona Fires, d 204 Cow Fire). The AML made multiple trips to the Nethker Fire. Only three samples are shown here as examples. Fire perimeters shown here are the perimeters on or closest to the date when the samples were collected.
2.2 PM2.5 and VOC sampling by DEFCON
We collected 33 hourly samples (including 2 blanks and 5 background samples) on the AML during this campaign, using a custom-made sampler named DEFCON (Direct Emission Fire CON-centrator), which was mounted on the AML. A diagram of this sampler has been published in the supplement of Jen et al. (2019). Outside air was sampled from the front of the AML through a 1.5 m section of (∼0.95 cm) (outer diameter) copper tubing. Air was subsampled at 150 ccm through a glass fiber filter coated with sodium thiosulfate (which removes O3 to avoid oxidation artifacts) onto a dual-bed sorbent tube of Tenax TA () and Carbograph 1 (), which collect the VOCs. The remaining sample flowed at 10 L min−1 through a PM2.5 cyclone to remove particles with diameters larger than 2.5 µm and then through a 47 mm diameter circular quartz filter to collect PM2.5. We encountered a potential leak problem in the VOC channel during the Nethker Fire sampling. Those samples were excluded from our analysis, leaving results from 12 gas-phase samples reported in this work. We also collected 33 3.5 h PM2.5 samples (sampling flow rate: 44 L min−1) on 102 mm diameter quartz filters using a sequential sampler (Yee et al., 2018) at McCall Activity Barn from 14 to 28 August 2019.
2.3 Filter analysis by GC × GC EI/VUV HRToFMS
The filters were stored at −20 ∘C prior to analysis. Filters were analyzed using an offline GC × GC coupled to an electron impact/vacuum ultraviolet light ionization source and a high-resolution time-of-flight mass spectrometer (GC × GC EI/VUV HRToFMS), following the same protocols as Jen et al. (2019) and Liang et al. (2021). Small punches of each filter (with added isotopically labeled internal standards) were thermally desorbed at 320 ∘C in helium flow using a Gerstel Thermal Desorption System. The helium gas stream was saturated with N-Methyl-N-(trimethylsilyl) trifluoroacetamide (MSTFA) for online derivatization (which replaces the hydrogen in -OH, -SH, and -NH2 groups in molecules with a trimethylsilyl group) during thermal desorption. The compounds were trapped at 30 ∘C on a quartz wool glass liner prior to injection onto the first column. Compounds were first separated by volatility with an Rxi-5Sil MS column then by polarity with an Rtx-200 MS column (both from Restek). Electron impact (−70 eV) HR-ToFMS (Tofwerk, ) was then used to ionize and detect the mass fragments of the separated compounds. In addition, vacuum ultraviolet light (VUV, 10.5 eV), a form of soft ionization provided by the Advanced Light Source at Lawrence Berkeley National Laboratory, was used in separate analyses of the same samples to provide parent mass information for individual organic compounds. Details about the columns and thermal programs are listed in Table 2. The chromatograms were analyzed using GC Image software (GC Image, LLC). Observed compounds were classified into aliphatic mono-carboxylic acid (monoacid hereafter), alcohol, alkane (plus a few minor alkenes), aromatic (mono-cyclic only), nitrogen-containing (N-containing), sulfur-containing (S-containing), other oxygenated (non-aromatic and with two or more -OH or -COOH groups), PAH (including substituted/oxygenated), sugar (and sugar derivatives including anhydro-sugars and sugar alcohols), terpenoid (including sesquiterpenoid, diterpenoid, triterpenoid, and resin acid), and unknown groups. Compound identification and classification procedures, which involve matching with authentic standards, comparison with mass spectral libraries, and inference from parent ions, have been described in our previous work (Liang et al., 2021).
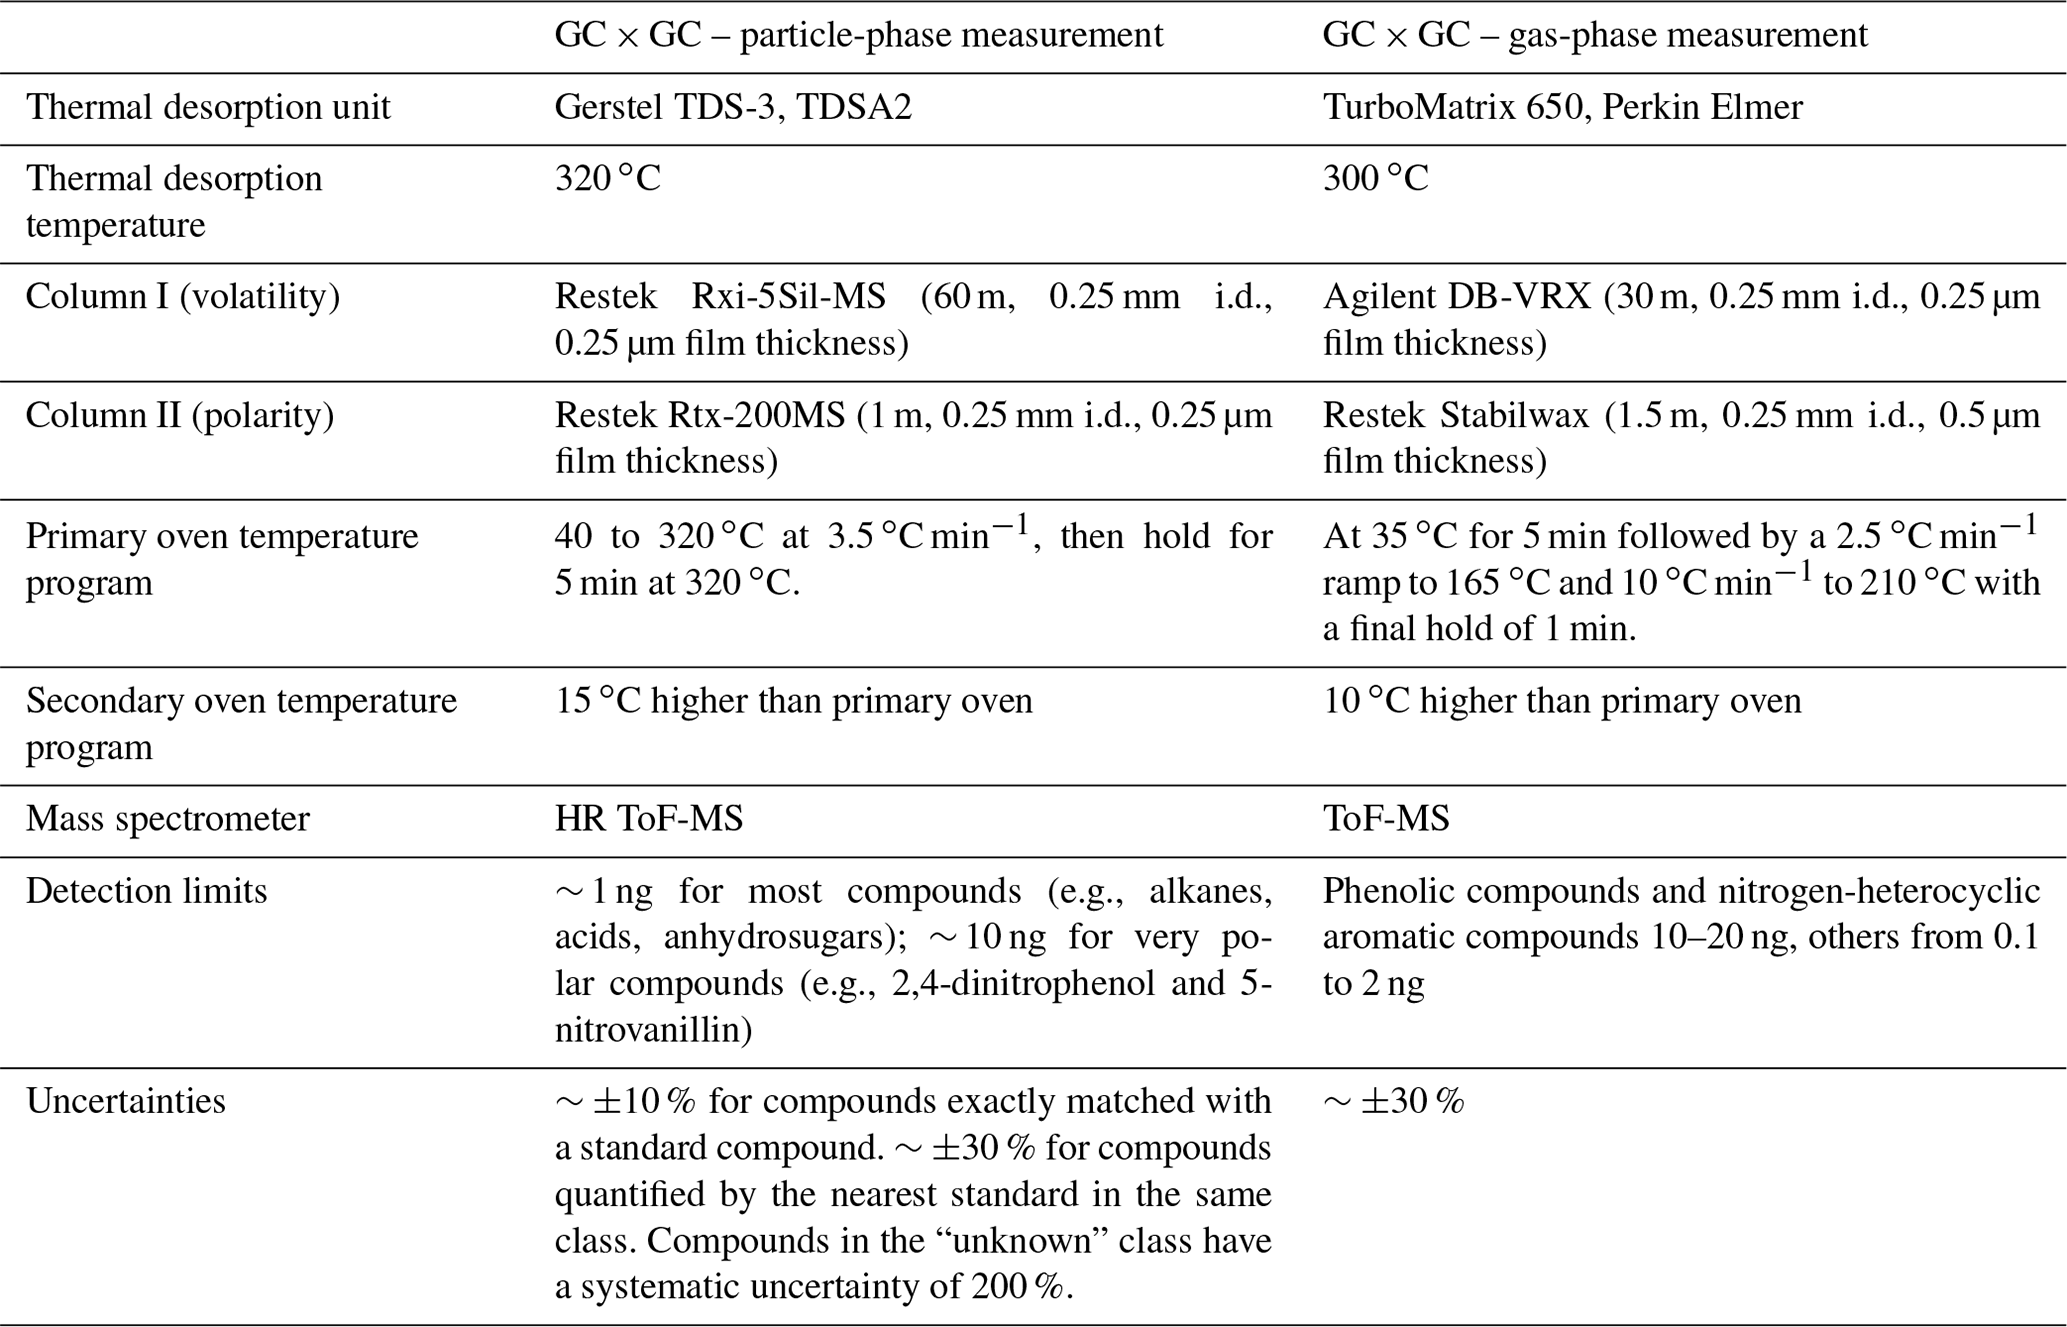
The compound quantification procedure, uncertainty and detection limits were also documented in Jen et al. (2019) and Liang et al. (2021). We upgraded the quantification method by adding more BB-related compounds in our standard mix (list can be found in Supplement Table S1). We injected multiple known concentrations of a 142-compound standard mix along with the internal standard mix to blank filters and obtained a response curve for each compound based on total ion count. Sample compounds within this standard mix were quantified using these curves. Sample compounds not in this standard mix were quantified using the response curve of nearby (linear retention index difference < 200) standard compounds with high-mass spectral cosine similarity (Stein and Scott, 1994; Isaacman-VanWertz et al., 2020) or the nearest compound on the GC × GC space if none of the nearby compounds have high-mass spectral similarity with the compound being quantified. The masses of compounds in the samples were converted to mass concentration in the atmosphere using the sampling flow rate and duration data. We quantified 240 compounds, which include the top 100 compounds (by signal) in three representative samples (one from each fire) as well as potential marker compounds for biomass burning. These compounds cover more than 75 % of the total chromatographic signal of analytes and include almost all the compounds we can identify (details in Supplement Table S1). The subcooled saturation vapor pressure and therefore volatility distribution of particle-phase organic compounds were also estimated, with details described in the Supplement. After that, the saturation vapor pressure vP,i of each compound was converted to the effective saturation mass concentration C* (in µg m−3) by
where MWi is the molecular weight of compound i (before derivatization) in g mol−1. We assume MW = 200 g mol−1 for compounds with unknown formulae, following Isaacman et al. (2011). γi is the unitless activity coefficient of compound i (assumed to be 1), vP,i is in Pa, R is the gas constant (8.314 J mol−1 K−1) and T is the temperature (assume 298 K) (Pankow, 1994; Isaacman et al., 2011).
2.4 VOC analysis by GC × GC ToF-MS
The sorbent tubes were analyzed by another GC × GC ToF-MS instrument (Leco Corp., St. Joseph, MI), following the protocol described in Hatch et al. (2019). In brief, the samples were thermally desorbed at 300 ∘C to a focusing trap, then injected to the GC × GC. The GC × GC comprises a DB-VRX primary column (Agilent, Santa Clara, CA) to separate compounds based on volatility and a Stabilwax secondary column (Restek, Bellefonte, PA) to separate compounds based on polarity. Details about the columns and thermal programs can be found in Table 2. Raw chromatograms were processed and analyzed using the Chromatof software (Leco Corp., St. Joseph, MI). Compound identification and quantification procedures can be found in Hatch et al. (2015, 2019).
2.5 Additional measurements
Punches of filter samples collected from AML and McCall Activity Barn were sent to the Air Quality Research Center at UC Davis for organic carbon (OC) and elemental carbon (EC) analysis by a Sunset Model 5 Lab Carbon Aerosol Analyzer, following the NIOSH870 protocol. In addition to total OC and EC, this analysis also provides thermograms of OC and EC. On the AML, a soot particle aerosol mass spectrometer (SP-AMS) was used to measure the chemical composition of PM2.5 (Fortner et al., 2018; Onasch et al., 2012). The SP-AMS switched between the conventional vaporization mode (standard mode) and the laser vaporization mode (SP mode, in which the conventional heater was also on) but was operating in the SP mode for the majority of the time. For consistency, only data from the SP mode was used. The parameters and (fraction of CO and C2H4O in the total organic signal, respectively) were determined. An Aerodyne Vocus PTR-ToF-MS (Krechmer et al., 2018) was also deployed on the AML for the for VOC measurements. Results from Vocus measurement, such as emission ratios of VOCs and mass spectral signatures of low- and high-temperature pyrolysis products have been documented in Majluf et al. (2022). Concentrations of furan (C4H4O) and acetonitrile (CH3CN) measured by Vocus were used in this study, as markers of short-lived BB VOC and stable BB VOC, which reflect the ages of BB plumes.
A Hemisphere GPS compass (Vector V103) was mounted on the AML to measure its real-time position. Wind speed and direction were measured by an RM Young Model 86000 3D anemometer and were subsequently corrected for vehicle movements using the positioning data. CO was measured by a tunable infrared laser direct absorption spectrometer (TILDAS; Aerodyne Research Inc.); CH4 was measured with a TILDAS C2H6 CH4 instrument (Aerodyne Research Inc.) (McManus et al., 2015). CO2 was measured by a Licor 6262 CO2 H2O analyzer.
2.6 Emission factor, emission ratio, and modified combustion efficiency (MCE) calculations
We calculated emission factors per unit mass of dry fuel burned by the carbon mass balance method (Yokelson et al., 1999) using
In Eq. (2), EFi is the emission factor of compound i or particle-phase OC, EC. Fc is the mass of carbon in the fuel, which varies between 0.45 and 0.55 for different vegetation (Burling et al., 2010). We assume Fc=0.5 in this analysis. MWi is the molecular weight of compound i in g mol−1 (12 g mol−1 for particle-phase OC and EC), and MWc is the atomic weight of carbon (12 g mol−1). ΔXi is the background-subtracted hourly integrated concentration of compound i in moles per m3, and ΔCO, ΔCO2 and ΔCH4 are background-subtracted hourly integrated concentrations of CO, CO2, and CH4 in moles per m3, respectively. To compare the current study with laboratory combustion studies, we also proposed a method to adjust the emission factor based on the emission factor of CO (Supplement Sect .S3). Emission ratios (ERs) with respect to CO are determined by CO. The background level of CO in this field campaign varied between ∼ 80 and ∼ 120 ppb.
Emission from biomass burning is strongly dependent on the combustion efficiency (Yokelson et al., 1999; Akagi et al., 2011; Jen et al., 2019). The modified combustion efficiency, MCE (Eq. 3) is used to indicate the relative contribution from flaming and smoldering combustion.
Higher MCE indicates more complete combustion, in which more of the organic compounds are oxidized fully into CO2. Flaming combustion has MCEs close to one, while smoldering combustion has MCEs between ∼ 0.65 and 0.85 (Akagi et al., 2011). We encountered an interfering source (possibly ecosystem respiration, or multiple fires with different emission characteristics) when calculating the ΔCO2 for some hourly samples. An example is shown in Fig. S1. In such cases, CO2 has relatively poor correlations with CO. To avoid this complication, for EF and MCE calculations, we also required the CO and CO2 within the sampling hour to have an R2 above 0.5. For both EF and ER, a threshold of sample average CO = 500 ppb was used to select samples predominantly affected by wildfire smoke and to reduce the uncertainty associated with the background CO2 estimation. Only 11 filter samples met all the criteria to be included in the EF calculation.
3.1 Organic particulate matter emitted from wildfires
The emission of organic PM is strongly dependent on MCE. Figure 2 shows the EFs of particle-phase OC and EC as a function of MCE. The MCEs span from 0.86 (smoldering dominated) to 0.96 (flaming dominated). Consistent with lab combustion experiments (Jen et al., 2019), the EF of OC decreases with MCE. In Jen et al. (2019), EFOC spanned 2 orders of magnitude (1–100 g kg−1), while the range of EFOC in the current study is within 1 order of magnitude, consistent with the similar fuel composition of the Nethker Fire and the Arizona Fires. However, in contrast to the lab fires in which EFEC increased as MCE increased (Jen et al., 2019), the EFEC has very weak correlation with MCE. The EC OC ratio has no dependence on MCE either (Fig. S2). This is partially because the fire plumes we encountered do not have very high MCE values. According to Pokhrel et al. (2016), the EC OC ratios were almost constant when MCE was below 0.96–0.97 and then increased sharply at higher MCEs. This further suggests that MCE is useful for predicting emissions among similar fuel types.
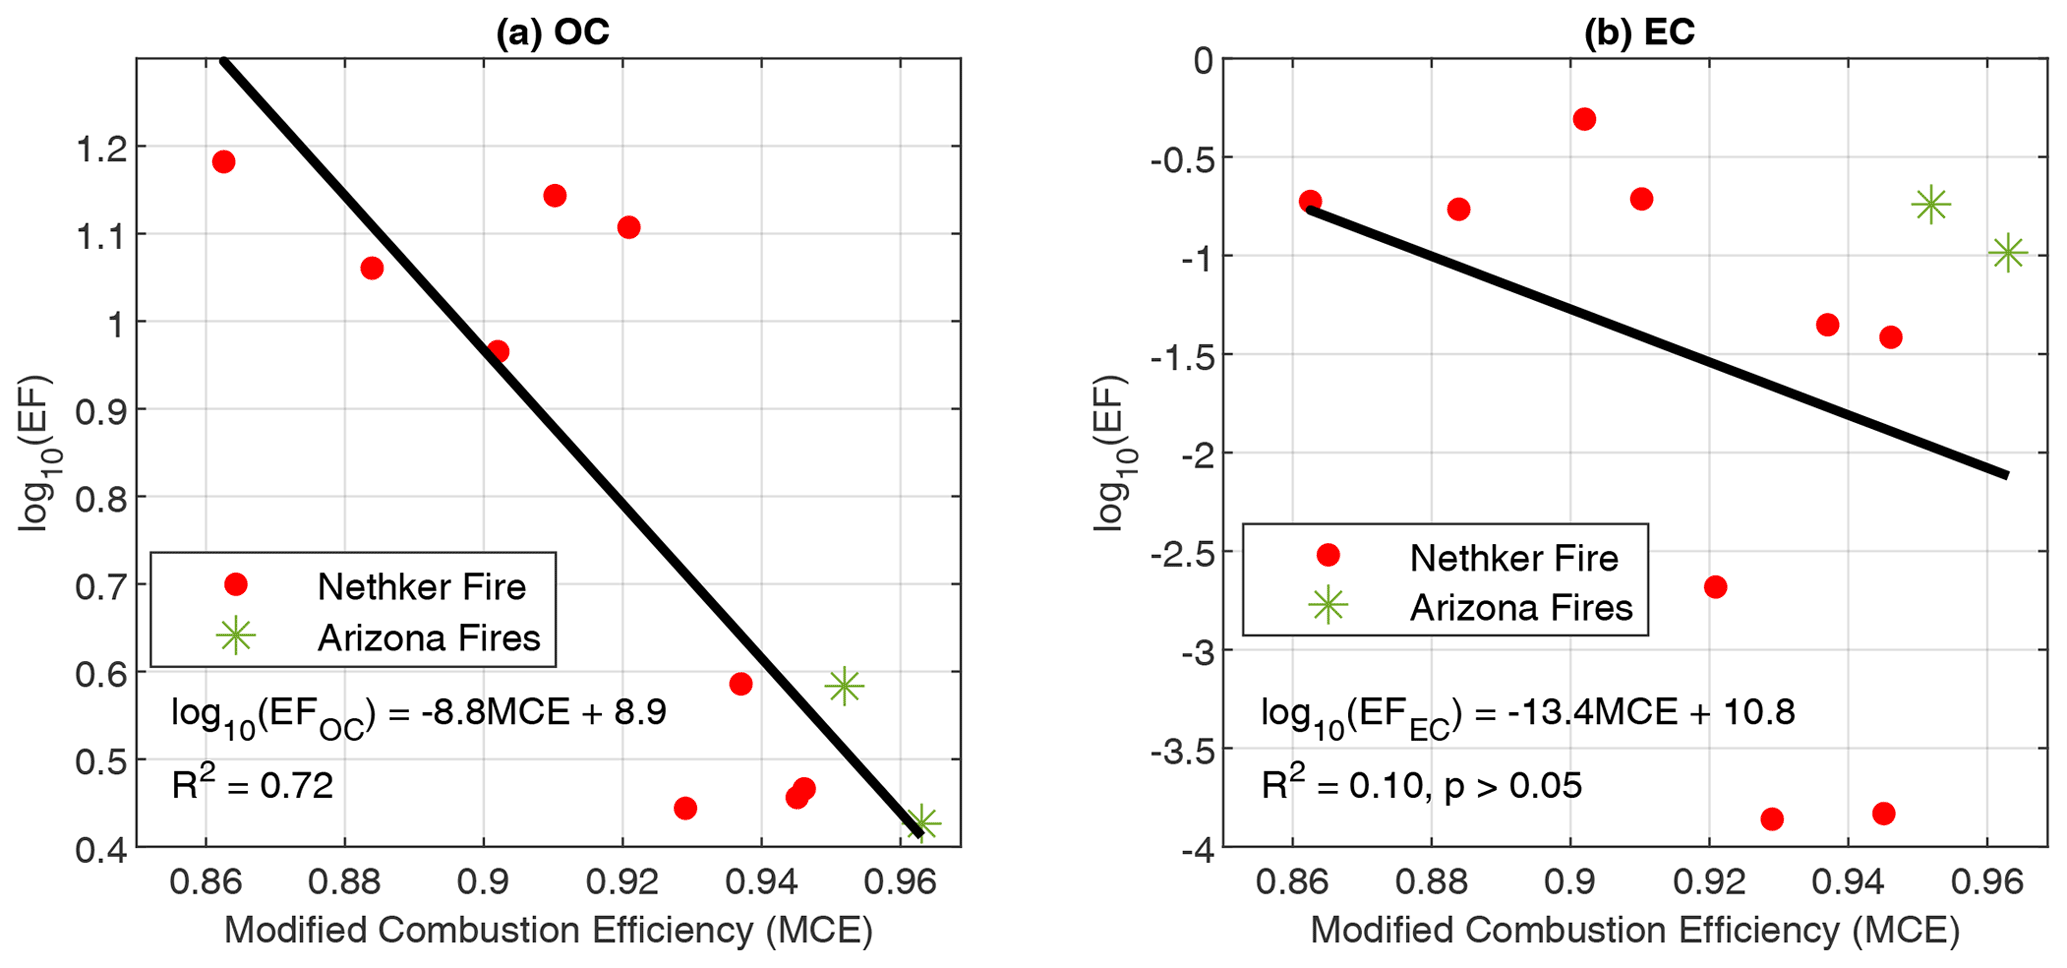
Figure 2(a) Emission factors of OC as a function of modified combustion efficiency (MCE) and (b) EC vs. MCE. Colors indicate the different fires. Black lines indicate the linear fits. Data points from the 204 Cow Fire did not meet the criteria to be used for EF calculations.
The EFs of total quantified OA and most classes of organic compounds also have inversely proportional logarithmic relationships with MCE (Fig. 3). Data points from different fires appear close to the same line. The R2 values of the fits are higher than those reported in Jen et al. (2019), in which values were for a range of fuel species and components, likely because the fuels were more similar in the sampled wildfires than in the laboratory. Nitrogen-containing compounds do not have good correlation with MCE (not shown here) or CH3CN. The nitroaromatic compounds are probably secondary, with some formation very close to the fires. The emissions of reduce nitrogen-containing compounds are dependent on the fuel nitrogen content, which is not directly related to MCE (Coggon et al., 2016). For the EFs of individual compounds observed, 70 % of them also depend on MCE with R2>0.5, most of them with an inverse proportional relationship. Exceptions include 1,2,4-benzenetriol and 3-hydroxybenzoic acid, whose EFs increase with MCE. The emission factors and emission ratios of all the compounds are provided in the Supplement spreadsheet.
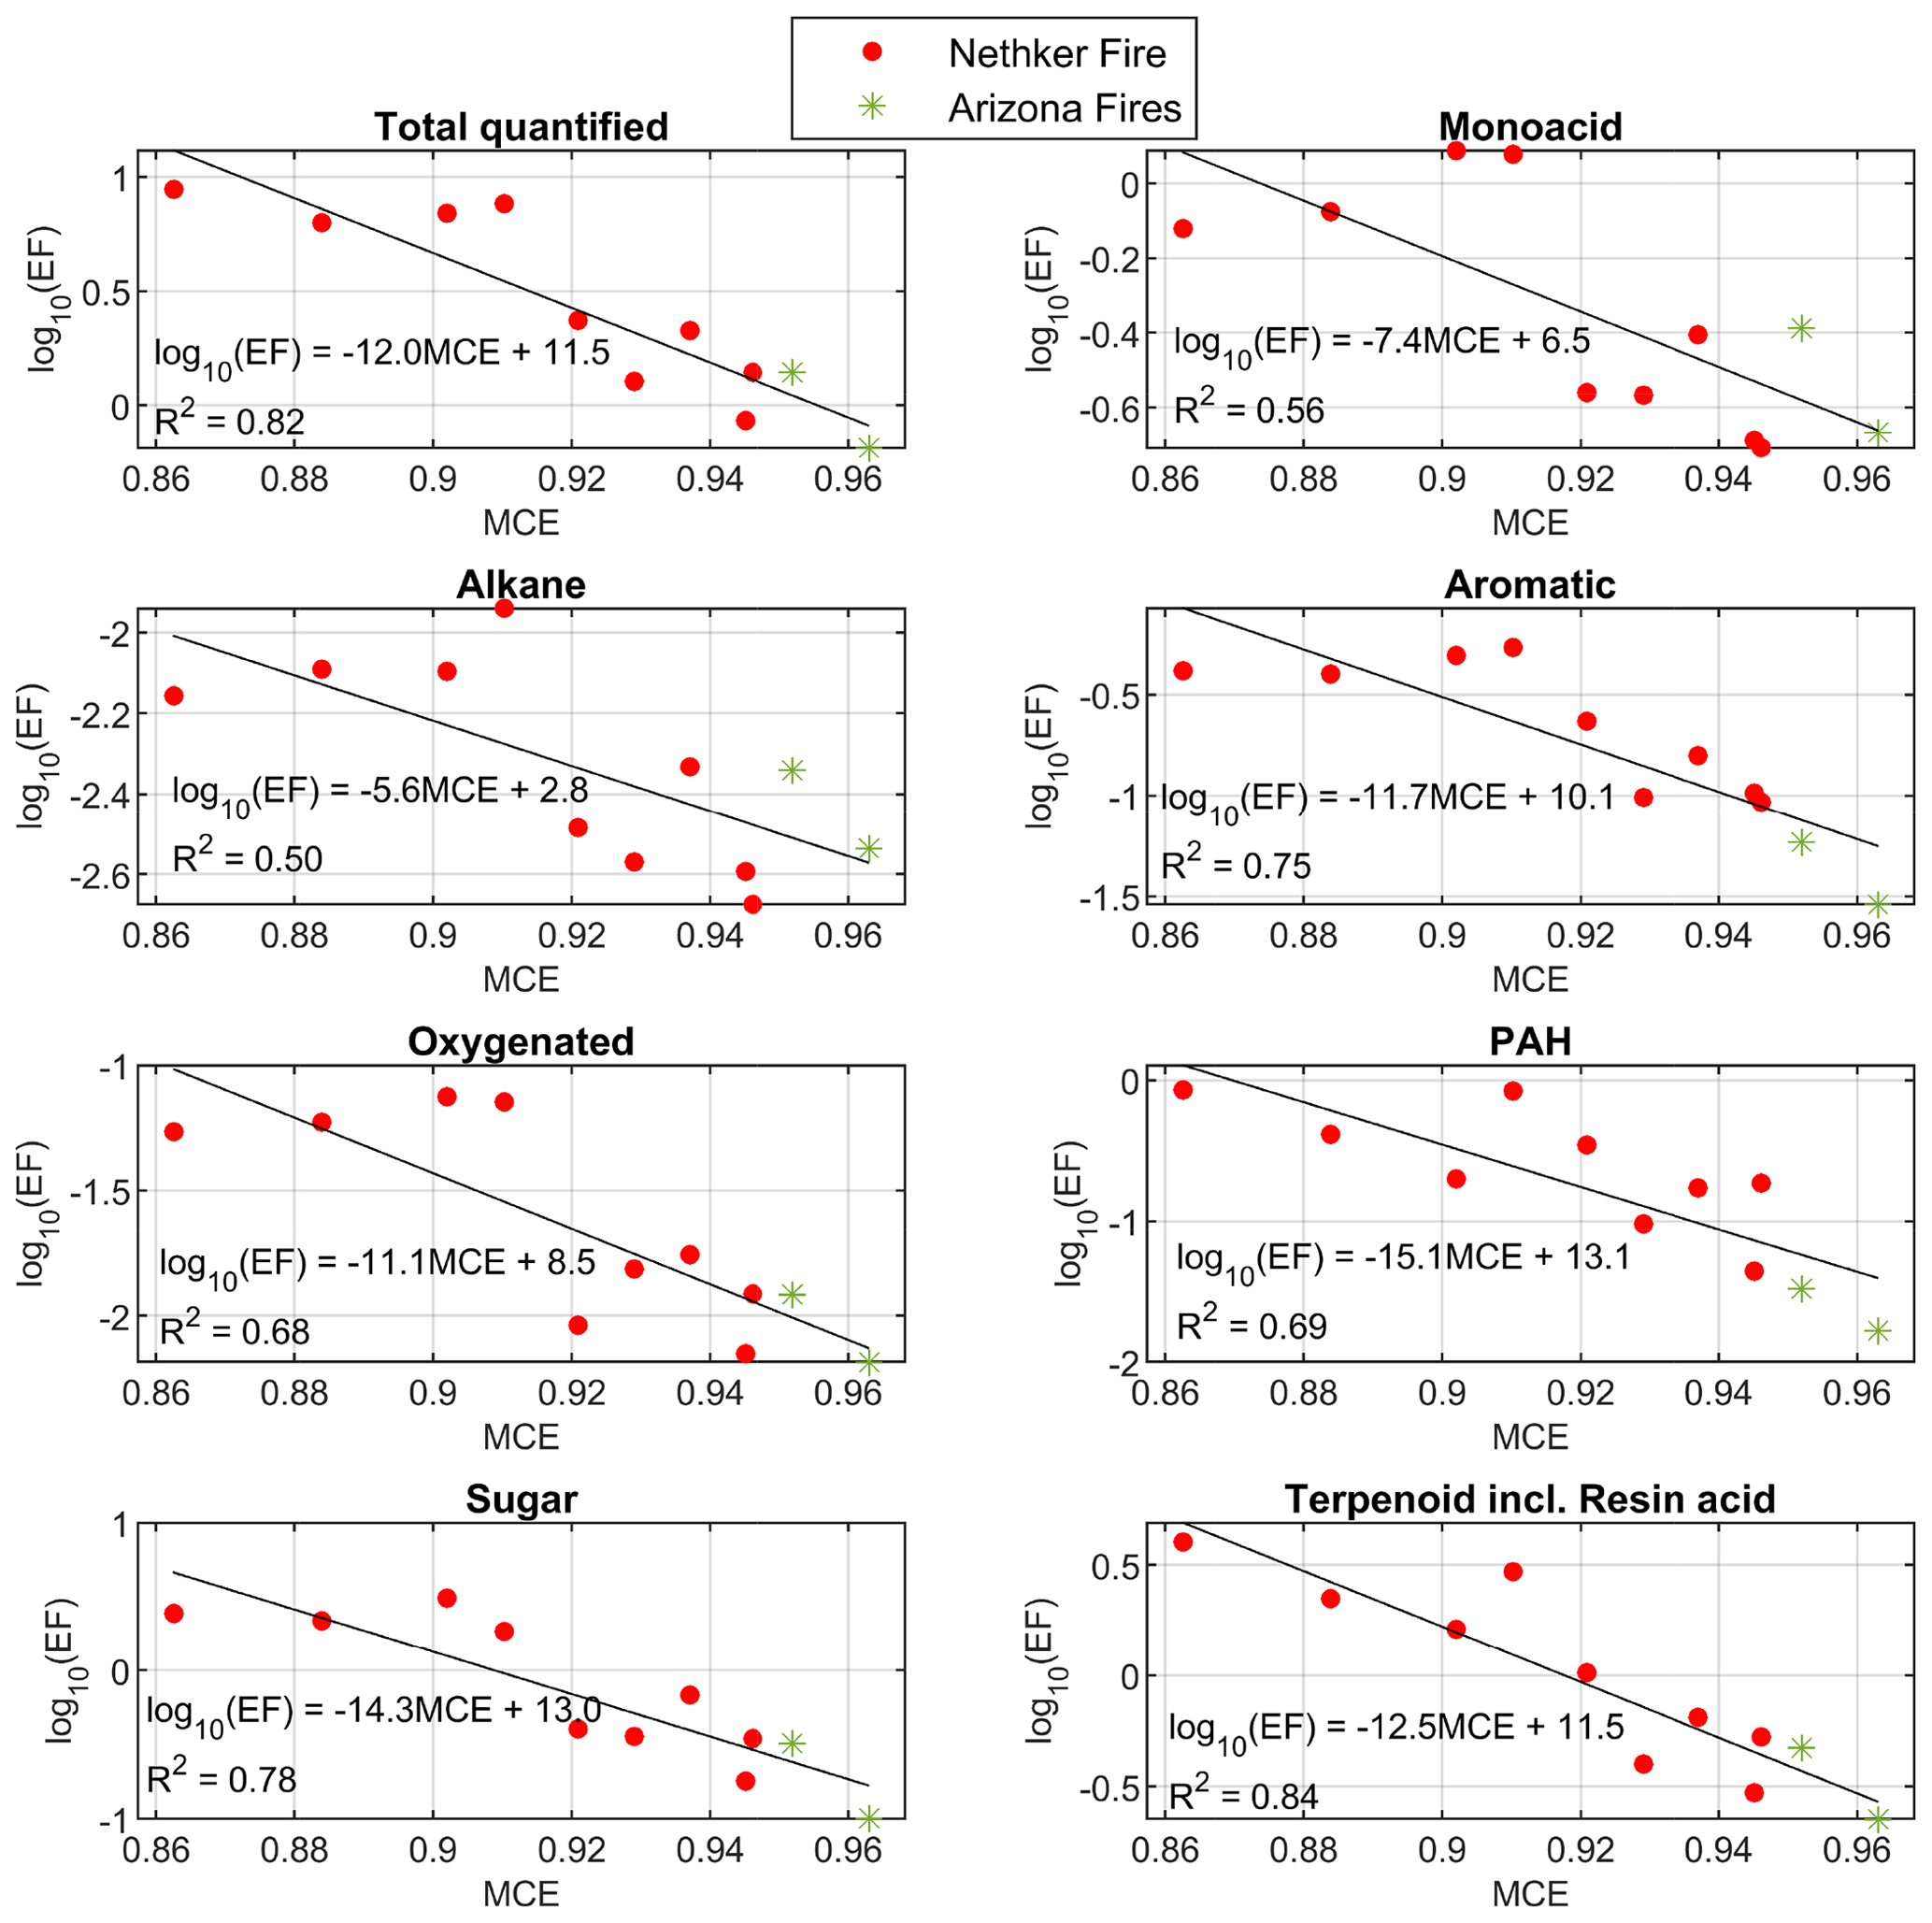
Figure 3Summed emission factors for chemical classes as a function of MCE. Colors indicate the different fires. Black lines indicate the linear fits. Compounds in each class are given in the Supplement spreadsheet. Data points from the 204 Cow Fire did not meet the criteria to be used for EF calculations.
The fits of EF vs. MCE for wildfires (this study) and the Fire Lab combustion experiments (Jen et al., 2019) are shown in Fig. S3 for particle-phase OC, total quantified OA mass, aromatics, PAHs, sugars, and terpenoids. Although for a given MCE the EF was lower for particle-phase OC and total quantified OA mass, markedly higher terpenoids EF (mainly diterpenoids and resin acids) were measured from the wildfires. Terpenoids on average accounted for 36 % (up to ∼ 45 % for two heavily loaded samples) of quantified particle-phase mass, which was comparable or higher than the contribution of sugar and sugar derivatives. Dehydroabietic acid, didehydroabietic acid (6,8,11,13-abietatetraen-18-oic acid), isopimaric acid, pimaric acid and methyl dehydroabietate were among the top 10 compounds in terms of average EFs. The resin acids, which are located in resin ducts, are abundant in conifer stems and needles (Krokene, 2015; Ramage et al., 2017; Eksi et al., 2020; Simoneit et al., 1993). The high contribution of terpenoids in the wildfire smoke samples confirms the dominance of conifers in the fuels burned in the fires we measured. The high emission of diterpenoids and resin acids in wildfires compared to lab combustion likely came from heat-induced evaporative emissions from non-burned forest components in the wildfires. Melting points of these resin acids are between 150 and 200 ∘C, and their 50 % loss temperature in thermogravimetric analysis is around 270–300 ∘C (Schuller and Conrad, 1966). Peak temperatures in flaming and smoldering combustion are 1500–1800 and 450–750 ∘C, respectively (Santoso et al., 2019). Heat from the fires likely drove melting and evaporation of resins, releasing the observed terpenoids and resin acids from biomass that was not burned, and it seems this source represented a substantial fraction of the total emissions. In the Fire Lab 2016 burns of coniferous ecosystem fuel components, the contribution of terpenoids to total quantified OA mass was always lower, at 2 %–20 % (Jen et al., 2019). However, in that study, the EFs are for the fire-integrated samples, which probably have lower evaporative emissions from unburned fuels. The evaporation of volatile compounds after emission but before the smoke was sampled probably played a less important role in causing the high mass fraction of terpenoids in the wildfire samples. We modeled the particle-phase fraction of compounds as smoke dilutes from OA = 400 to 80 µg m−3 (close to the OA of the least concentrated sample used in EF calculation), assuming equilibrium partitioning. The evaporated fraction of sugar caused by this dilution process is estimated to be around 15 %, which cannot cause a large increase in the relative abundance of terpenoids. Also, there is not a clear relationship between terpenoid/total quantified OA vs. OC (Fig. S11).
Based the slopes of the fits of EFs vs. MCE, in both lab combustion and wildfires, the EFs of PAHs have the strongest dependence on MCE among all the chemical classes (largest slope). PAHs on average represent 7.6 % of total quantified OA by EF in this campaign. PAHs are high-temperature pyrolysis products from biomass burning (Collard and Blin, 2014; Sekimoto et al., 2018) or thermal decomposition products of diterpenoids (including resin acids), such as retene (Ramdahl, 1983; Simoneit et al., 1993; Standley and Simoneit, 1994). Most PAHs we observed are probably thermal decomposition products of diterpenoids, as their structures suggest.
The volatility distribution of observed particle-phase organic compounds in three samples is shown in Fig. 4 (in effective saturation mass concentration C* space) and Fig. S4 (in deuterated-alkane retention index space). The samples represent the most heavily loaded (highest OA mass concentration) sample collected near each fire. The fraction of a compound i in the particle phase (Fp,i) can be calculated by
where COA is the total concentration of organic aerosol in µg m−3 (Donahue et al., 2006). When C* for a compound is equal to COA, 50 % of this compound will be in the gas phase and 50 % will be in the particle phase. Sugars and sugar derivatives such as levoglucosan have effective saturation vapor pressures between 10 and 100 µg m−3. Thus, when smoke plumes dilute to those levels, some anhydrosugars such as levoglucosan can evaporate and react with oxidants. That makes them less ideal tracers for BB emission in source apportionment studies (Hennigan et al., 2010). By contrast, as Fig. 4 shows, the diterpenoids and resin acids have effective saturation mass concentrations between 0.1 and 1 µg m−3, which means they are much less prone to evaporation. Given the high abundance of these compounds in conifer fires, we believe these compounds can be useful tracers for biomass burning. Furthermore, diterpenoids and resin acids have lower oxygen to carbon ratios compared to sugars and sugar derivatives. If they eventually evaporate and get oxidized by OH in the gas phase, they are less likely to fragment like sugars (Donahue et al., 2013). Instead, ketones and -OH groups will be preferentially added, which will lower the saturation vapor pressure of the original compound and lead to net SOA formation in the remote atmosphere. That can shift the volatility distribution to the less volatile end.
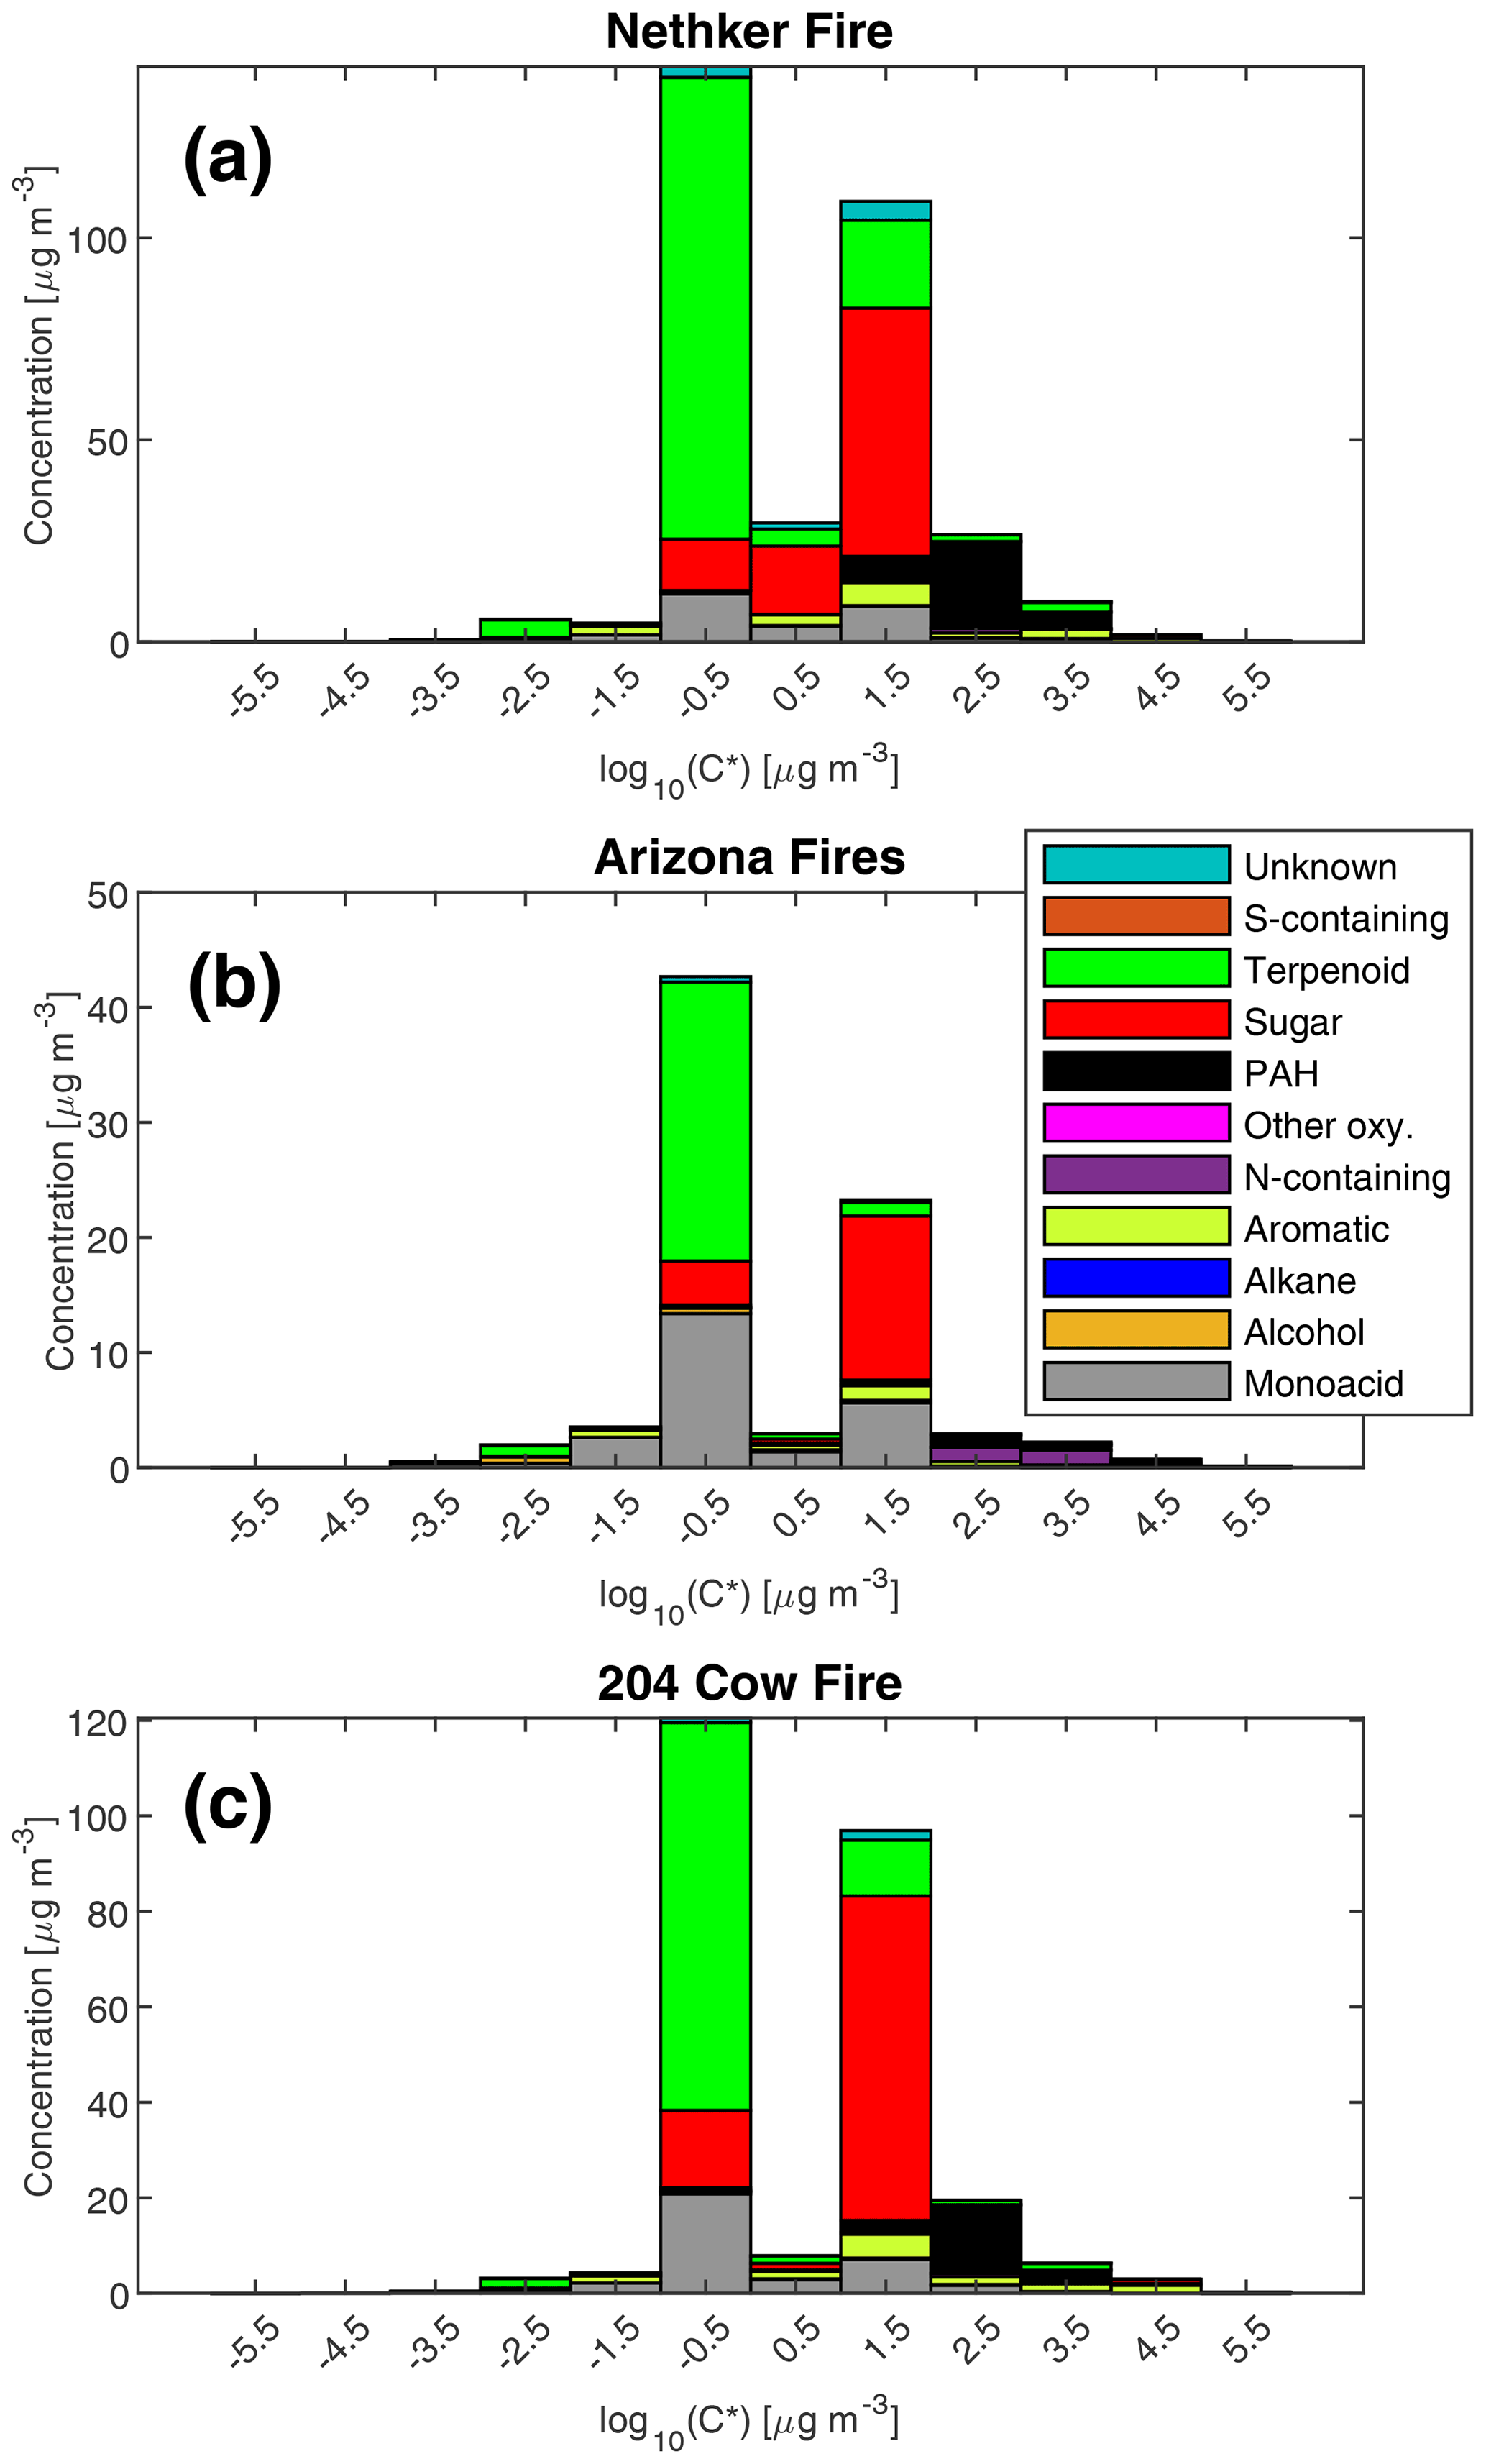
Figure 4Mass distribution of speciated compounds in different effective saturation concentration bins. As an example, the bin centered at −0.5 includes compounds with log10(C*) between −1 and 1 µg m−3. Panel (a) is for the most heavily loaded sample collected near the Nethker Fire (OC = 352 µg m−3). Panel (b) is for the most heavily loaded sample collected near the Arizona Ikes and Castle Fires (OC = 138 µg m−3). Panel (c) is for the most heavily loaded sample collected near the 204 Cow Fire (OC = 260 µg m−3). N=1 for each plot.
3.2 VOC emission from wildfires
The summed EFs for 13 different VOC classes are shown in Fig. 5. EFs and ERs of individual VOCs are given in the data Supplement spreadsheet. Furanoids and monoterpenes have the highest EFs among the measured VOCs. The monoterpene EFs, particularly in the Nethker Fire (1.9 g kg−1), are higher than those measured in smoke samples from coniferous species (0.3 g kg−1 on average) burned during the Fire Lab 2016 study (Hatch et al., 2019), with the exception of the canopy samples from subalpine fir, Douglas fir, ponderosa pine and Engelmann spruce, which have summed EFs of monoterpenes above 1 g kg−1, higher than the summed monoterpene EF from the Arizona Fires (0.7 g kg−1) (Fig. S5). They are also higher than those measured in smoke samples from a mixed conifer prescribed burn in Blodgett Forest (Hatch et al., 2019). The field-adjusted EFs for monoterpenes in the Nethker Fire is also higher than most of the samples in the Fire Lab 2016 study (Fig. S6). The high emission of monoterpenes, in addition to high emission of diterpenoids and resin acids in the particle phase, can be attributed to the distillation of these compounds from plant resin ducts (Hatch et al., 2019; Koss et al., 2018). Lab combustion experiments show such distillation processes happen in the early phase of fires (Koss et al., 2018; Sekimoto et al., 2018). The ubiquity of monoterpenes in our samples collected on different dates indicates the fire fronts probably approached some new fuel continuously. Limited by the number of samples that met the criteria outlined in Sect. 2.6, we were not able to assess the relationship between the VOC EFs and MCE. The ERs of the observed VOCs and terpenes are shown in Figs. S7 and S8. The ERs of furanoids and monoterpenes are higher than in the Fire Lab 2016 study. Alpha-pinene, 3-carene, camphene, beta-phellandrene, beta-pinene and limonene are the most abundant monoterpene species observed in this study. This is very similar to the speciation observed in the prescribed burns in Blodgett Forest, which is consistent with the high similarity of fuels in the two field campaigns. The similarity between the fuels in the two campaigns is also supported by the similar benzonitrilefurfural emission ratios. The log-transformed benzonitrilefurfural ratio has been demonstrated to be a good indicator for different plant tissues (Coggon et al., 2016; Hatch et al., 2019). As shown in Fig. 6, The log-transformed benzonitrile/furfural emission ratio from the wildfires in this study is very close to the ratios of the Blodgett burns. These ratios fall between burning woody fuels and composite fuels (included all individual fuel components) in the Fire Lab 2016 study, indicating the dominance of wood tissue combustion in the wildfires in this study (Fig. 6).
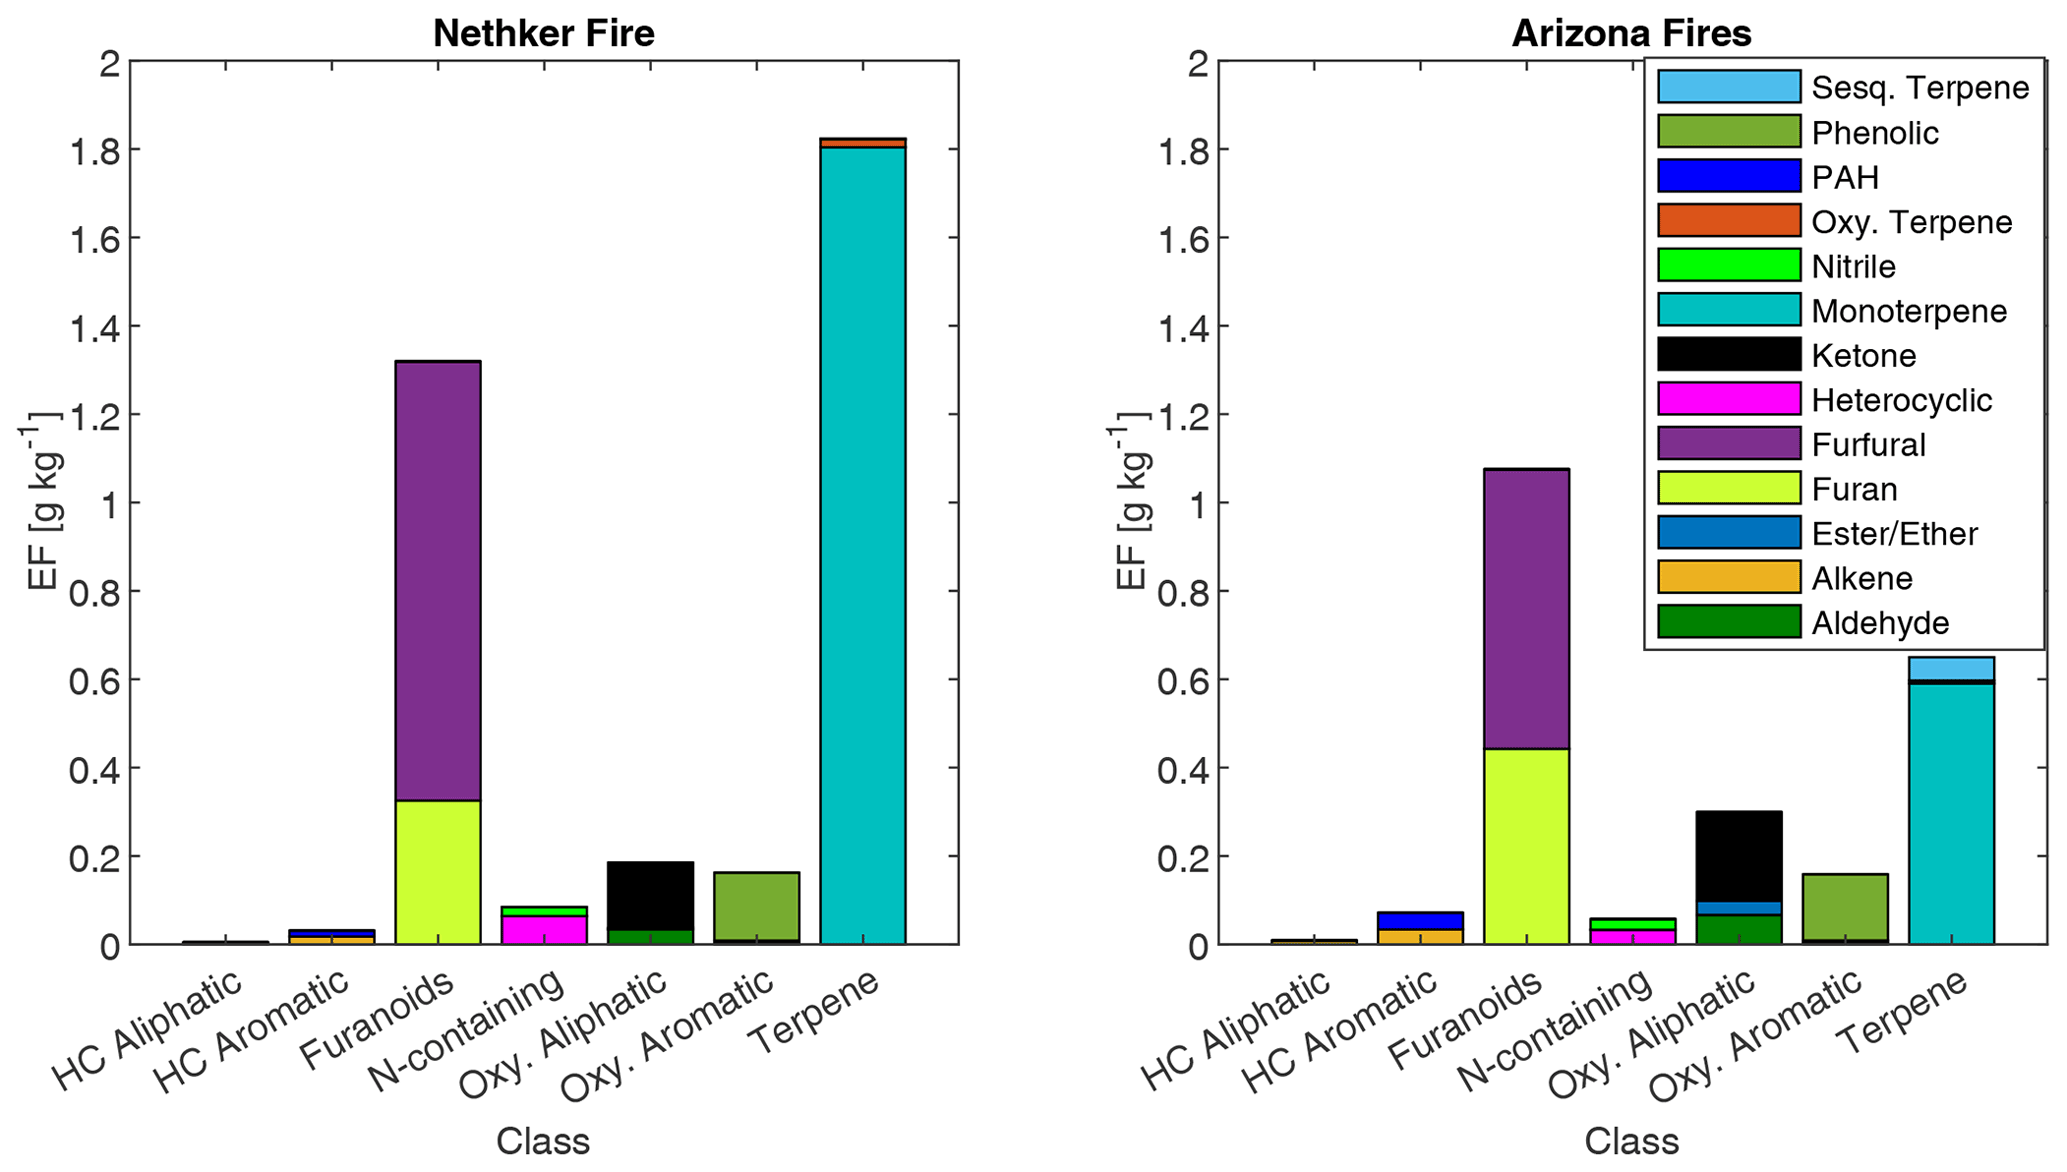
Figure 5Emission factors of observed VOCs from the Nethker Fire (N=1) and Arizona Fires (N=2, averaged), grouped by chemical classification. HC refers to hydrocarbon.
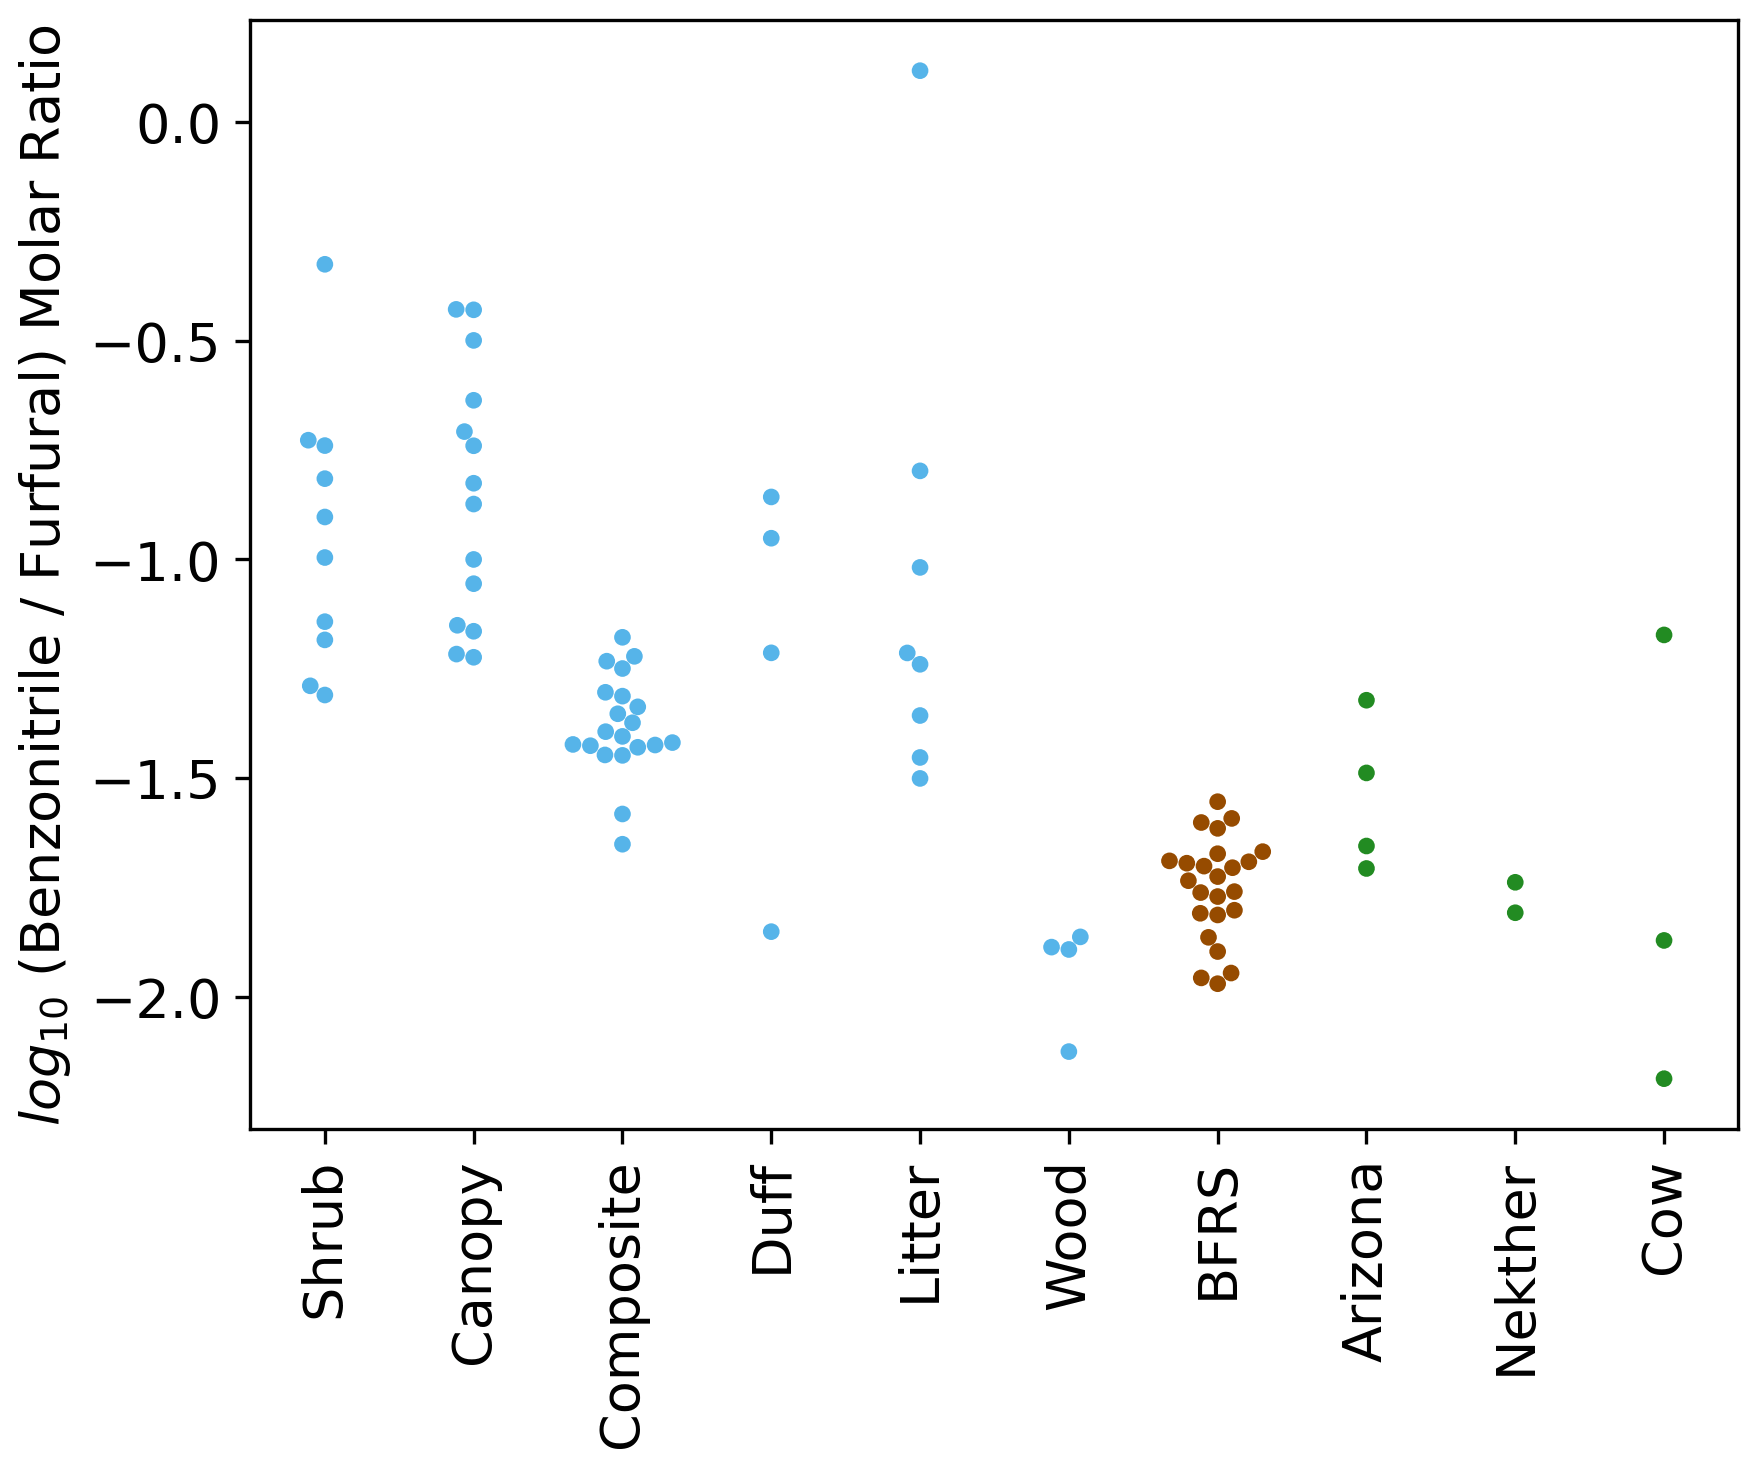
Figure 6Swarm plots of the log-transformed ratio of biomass-burning tracers benzonitrile and furfural for the Fire Lab 2016 laboratory study (shrub, canopy, composite, duff, litter, and wood fuels), the Blodgett study (BFRS) (Hatch et al., 2019), and the wildfires in this study.
There are some differences of monoterpene emissions among the three fires. In the 204 Cow fire, 3-carene is the dominant isomer of monoterpenes, while it is less abundant in the Nethker Fire (Fig. S8). It was reported that 3-carene emission from burning wood is significantly (at least 4 times) higher than burning needles of black spruce and ponderosa pine (Hatch et al., 2015). Since the more definitive acetonitrile/furfural ratio analysis shows the dominance of woody fuels in all three fires, there are probably factors other than the needle/wood fraction caused the difference of 3-carene emissions. β-Phellandrene, which dominates the emissions from lodgepole pines (Hatch et al., 2019), contributes 16 % and 8 % to total monoterpene emitted in the Nethker Fire and the 204 Cow Fire, respectively. It only accounts for 2 % of monoterpene emissions from the Arizona Fires, which agrees with the presence of lodgepole pine as a fuel in the Nethker and 204 Cow Fires and the absence of lodgepole pine in the perimeter of the Arizona Fires. In Fig. 7, we examined the emission profiles of compounds representative of the fuel types, found in Stamatis and Barsanti (2022). Figure 7 suggests that the low abundance of 3-carene in the Nethker Fire emission might be due to the absence of ponderosa pine in that region. Bornyl acetate, the tracer for Douglas fir and subalpine fire smoke (Hatch et al., 2019), accounts for 3 % of terpene emissions in the Nethker Fire but only 0.67 % and 0.13 % of terpene emissions in the Arizona Fires and the 204 Cow Fire, respectively. This difference suggests that Douglas fir or subalpine fir were burned in the Nethker Fire. However, the abundances of bornyl acetate in the emissions from these wildfires are still much smaller than the source signature of burning Douglas fir or subalpine fir (in which ∼ 30 % of monoterpene emitted is bornyl acetate), which were important plants present in the Nethker Fire and the Castle Fire's perimeters. This discrepancy might be caused by the inhomogeneity of fuel distribution, and these fir species were not burned when we took the samples.
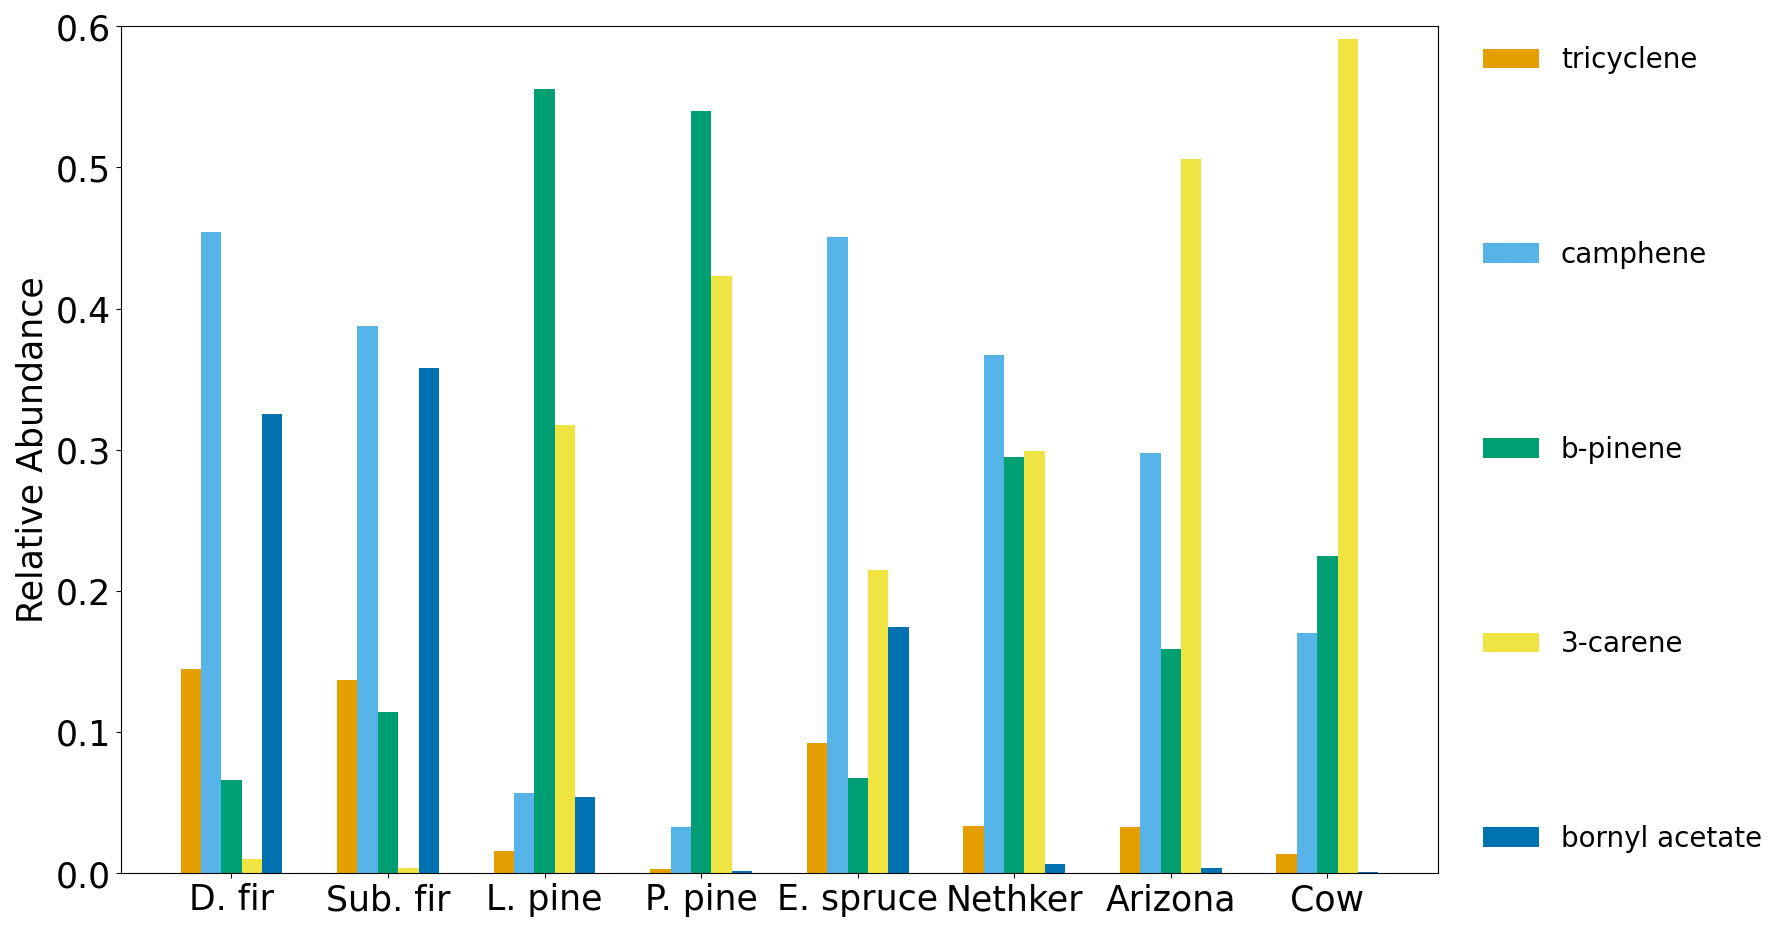
Figure 7Relative abundance of emission ratios for five selected terpenoids in the Fire Lab 2016 study compared to wildfires in this work.
3.3 Near-fire transformation of particle-phase BBOA
3.3.1 Nitrogen-containing compounds and oxygenated compounds
Nitrogen-containing compounds and oxygenated compounds (such as oxygenated aromatic compounds and multifunctional acids) are common markers for aged BBOA (Liang et al., 2021; Bertrand et al., 2018). In the samples collected in this campaign, nitrogen-containing compounds (mainly nitroaromatic compounds) only represent 2.1 % of total quantified OA on average. These compounds were observed from the Fire Lab fresh emission, but they are mainly SOA compounds formed when aromatic compounds react with OH, NO3 and HONO in the presence of NO2 (Bertrand et al., 2018). Since our samples were collected close to fires (most samples were taken within 10 km of the fires, as shown in Fig. 1), the concentration and contribution of nitrogen-containing compounds to total quantified OA were lower than that observed in BBOA measured 50–60 km downwind from northern CA wildfires (Liang et al., 2021). The average nighttime concentration of nitroaromatic compounds were higher by 66 % (although not statistically significantly higher, p>0.05) than in the daytime samples, possibly due to the higher yield of NO3 oxidation (Finewax et al., 2018). This is in agreement with the airborne plume study in FIREX-AQ (Decker et al., 2021), which also found the strong oxidation of phenolic compounds by NO3. In our study, the daytime oxidation of phenolic compounds by NO3 is probably less important than in those airborne plumes, possibly due to NO emission on the ground that consumed NO3. Oxygenated compounds can either be directly emitted or be produced during atmospheric oxidation. The oxygenated compounds have low concentration in most samples, on average representing less than 1 % of total quantified particle-phase OC. As shown in Fig. 3, the EFs of this group of compounds have similar dependence on MCE with other groups of compounds, which indicates these oxygenated compounds observed near the fires are mainly primary emission, instead of atmospheric aging products. Possible BB SOA marker compounds, dicarboxylic acids such as butanedioic acid (succinic acid) and octanedioic acid (suberic acid) were detected, but their contribution to OC is an order of magnitude lower than in the Napa Fire samples. A later-generation daytime oxidation product of BBOA that is typically observed in aged smoke, malic acid, was not detected in any of the samples (including the background samples).
3.3.2 Molecular evidence of primary BBOA evaporation
We tracked the behaviors of individual particle-phase compounds. It is hard to estimate the physical plume age for each sample because the AML was moving when we took most of the samples, due to variable meteorological conditions and fire heterogeneity, particularly in the near field. Instead, we used ln(AcetonitrileFuran) as a metric for photochemical plume age. Furan is a short-lived primary BB VOC, with a lifetime of ∼ 4 h against OH oxidation and ∼ 1 h against NO3 oxidation under typical troposphere conditions (OH concentration = 1.5 × 10⁶ molecule cm−3, NO3 concentration = 2.5 × 10⁸ molecule cm−3) (Kind et al., 1996), while acetonitrile is an inert tracer for biomass burning emissions (Atkinson et al., 2006; Holzinger et al., 1999). It can be expected that ln(AcetonitrileFuran) will increase with plume age, because furan is quickly oxidized in the atmosphere. We chose to use ln(AcetonitrileFuran) as the main metric here because of the continuous high time resolution data available from the Vocus measurements and the ability to compare with simultaneous SP–AMS measurements. In SP–AMS mass spectra, fragment CO is a marker for oxygenated organic aerosol, while fragment C2H4O is a marker for anhydrous sugars such as levoglucosan (Alfarra et al., 2007; Collier et al., 2016; Hodshire et al., 2019). As shown in Fig. S9, ln(AcetonitrileFuran) has strong positive correlations with both (fraction of CO in the total organic signal) and . This supports the use of ln(AcetonitrileFuran) as the metric of plume age. Figure 8 shows that the fraction of summed concentration of observed particle-phase compounds with effective saturation mass concentration µg m−3 (extremely low-volatility organic compounds and low-volatility organic compounds) increased with ln(AcetonitrileFuran). The same trend is observed when and are used as plume age metrics, though there are fewer data points (Fig. S10). This is probably caused by the evaporation of compounds with µg m−3 (SVOCs and IVOCs) and the formation of SOA compounds not measured by GC × GC. We calculated the correlation coefficient (r) between the mass fraction of each compound in total quantified OA and . If the initial emissions for each sample are the same, for each compound, if r>0, its mass fraction in total quantified increased in aging. If r<0, its fraction decreased in aging. The two most abundant primary biomass burning compounds (on average account for 30 % of total quantified OA in Nethker Fire) have r's with different signs. Levoglucosan, which has a µg m−3, has an r of −0.33. In contrast, dehydroabietic acid ( µg m−3), has an r of 0.79. This suggests levoglucosan evaporated during aging. Dehydroabietic acid was probably not formed in aging, but its contribution to total quantified OA increased as the more volatile compounds evaporated. 4-Nitrocatechol, 3-methyl-5-nitrocatechol, and 4-methyl-5-nitrocatechol, with C*s near 103 µg m−3, have rs of 0.85, 0.77, and 0.79. This is consistent with secondary production of the nitrochatechols (Bertrand et al., 2018).
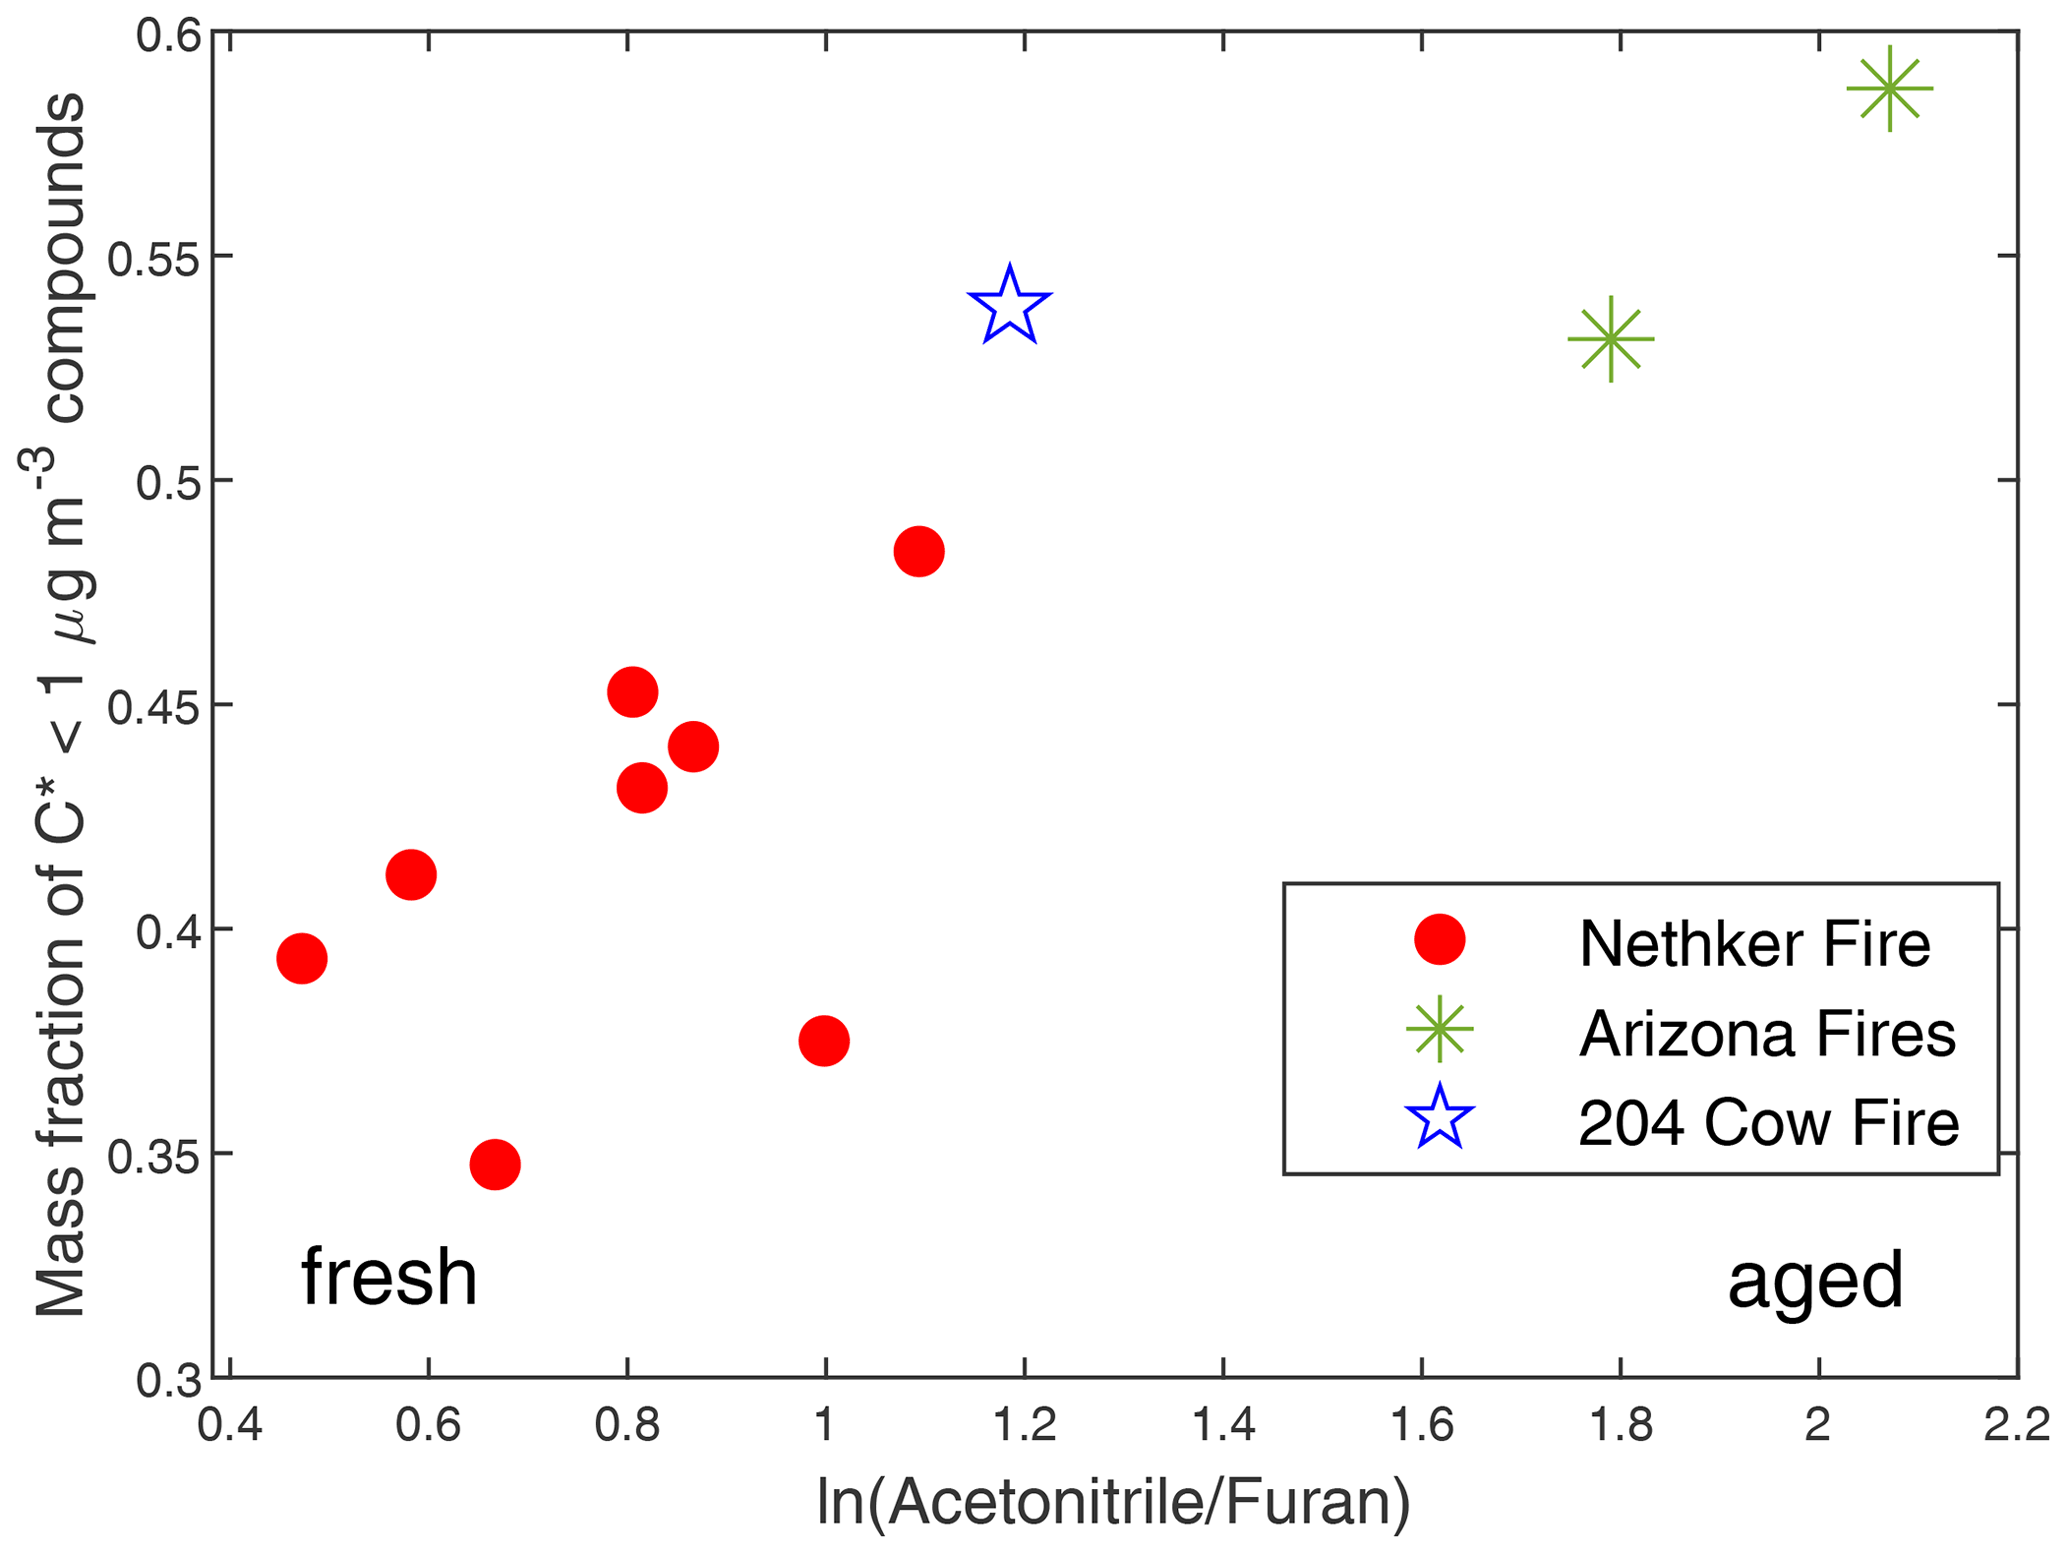
Figure 8Mass fraction of summed concentrations of observed particle-phase compounds with µg m−3 in total quantified OA as a function of photochemical age represented by ln(AcetonitrileFuran).
3.3.3 Evolution of particle-phase semi-volatile OC from wildfires (OC1)
In the Fire Lab 2016 study (Jen et al., 2019), the Napa Fire 2017 study (Liang et al., 2021) and the FIREX-AQ field campaigns in 2019 (this study), we collected biomass burning-related PM2.5 and PM1 (Fire Lab 2016 only) filter samples from different environments and analyzed them for their particle-phase OC and EC following the NIOSH 870 protocol. In this protocol, to determine the concentration of OC, each sample was heated to 310 ∘C in helium for OC1, 475 ∘C to get OC2, and 615 ∘C for OC3 and 870 ∘C for OC4, followed by a charring correction (Bautista et al., 2015; Wu et al., 2016). The OC1 can be seen as the semi-volatile fraction of OC. For filters collected on the AML, the fraction of OC1 in OC has negative correlations with both ln(AcetonitrileFuran) and (coincidentally .85 for both), which suggests OC1 was consistently evaporated in the aging process. The fractions of OC1 in OC for samples across the four campaigns are shown in Fig. 9. We found that the AML samples have the highest fraction of OC1 and are therefore more volatile. The Fire Lab 2016 samples have slightly lower (though not statistically significantly lower than the AML samples) contribution of OC1 to total OC, which is probably related to the combustion process or the fuel (e.g., less evaporation of semi-volatile organic from unburned fuels in laboratory combustion). In samples collected farther away from the wildfires (McCall and Napa), the fractions of OC1 are lower. These observations demonstrate that as the smoke diluted, the IVOCs and SVOCs evaporated from the particle phase (Robinson et al., 2007). The SOA produced from these vapors should be less volatile than the reactants, which potentially contributed to less volatile fractions of OC, consistent with our speciated measurements (Sect. 3.3.2).
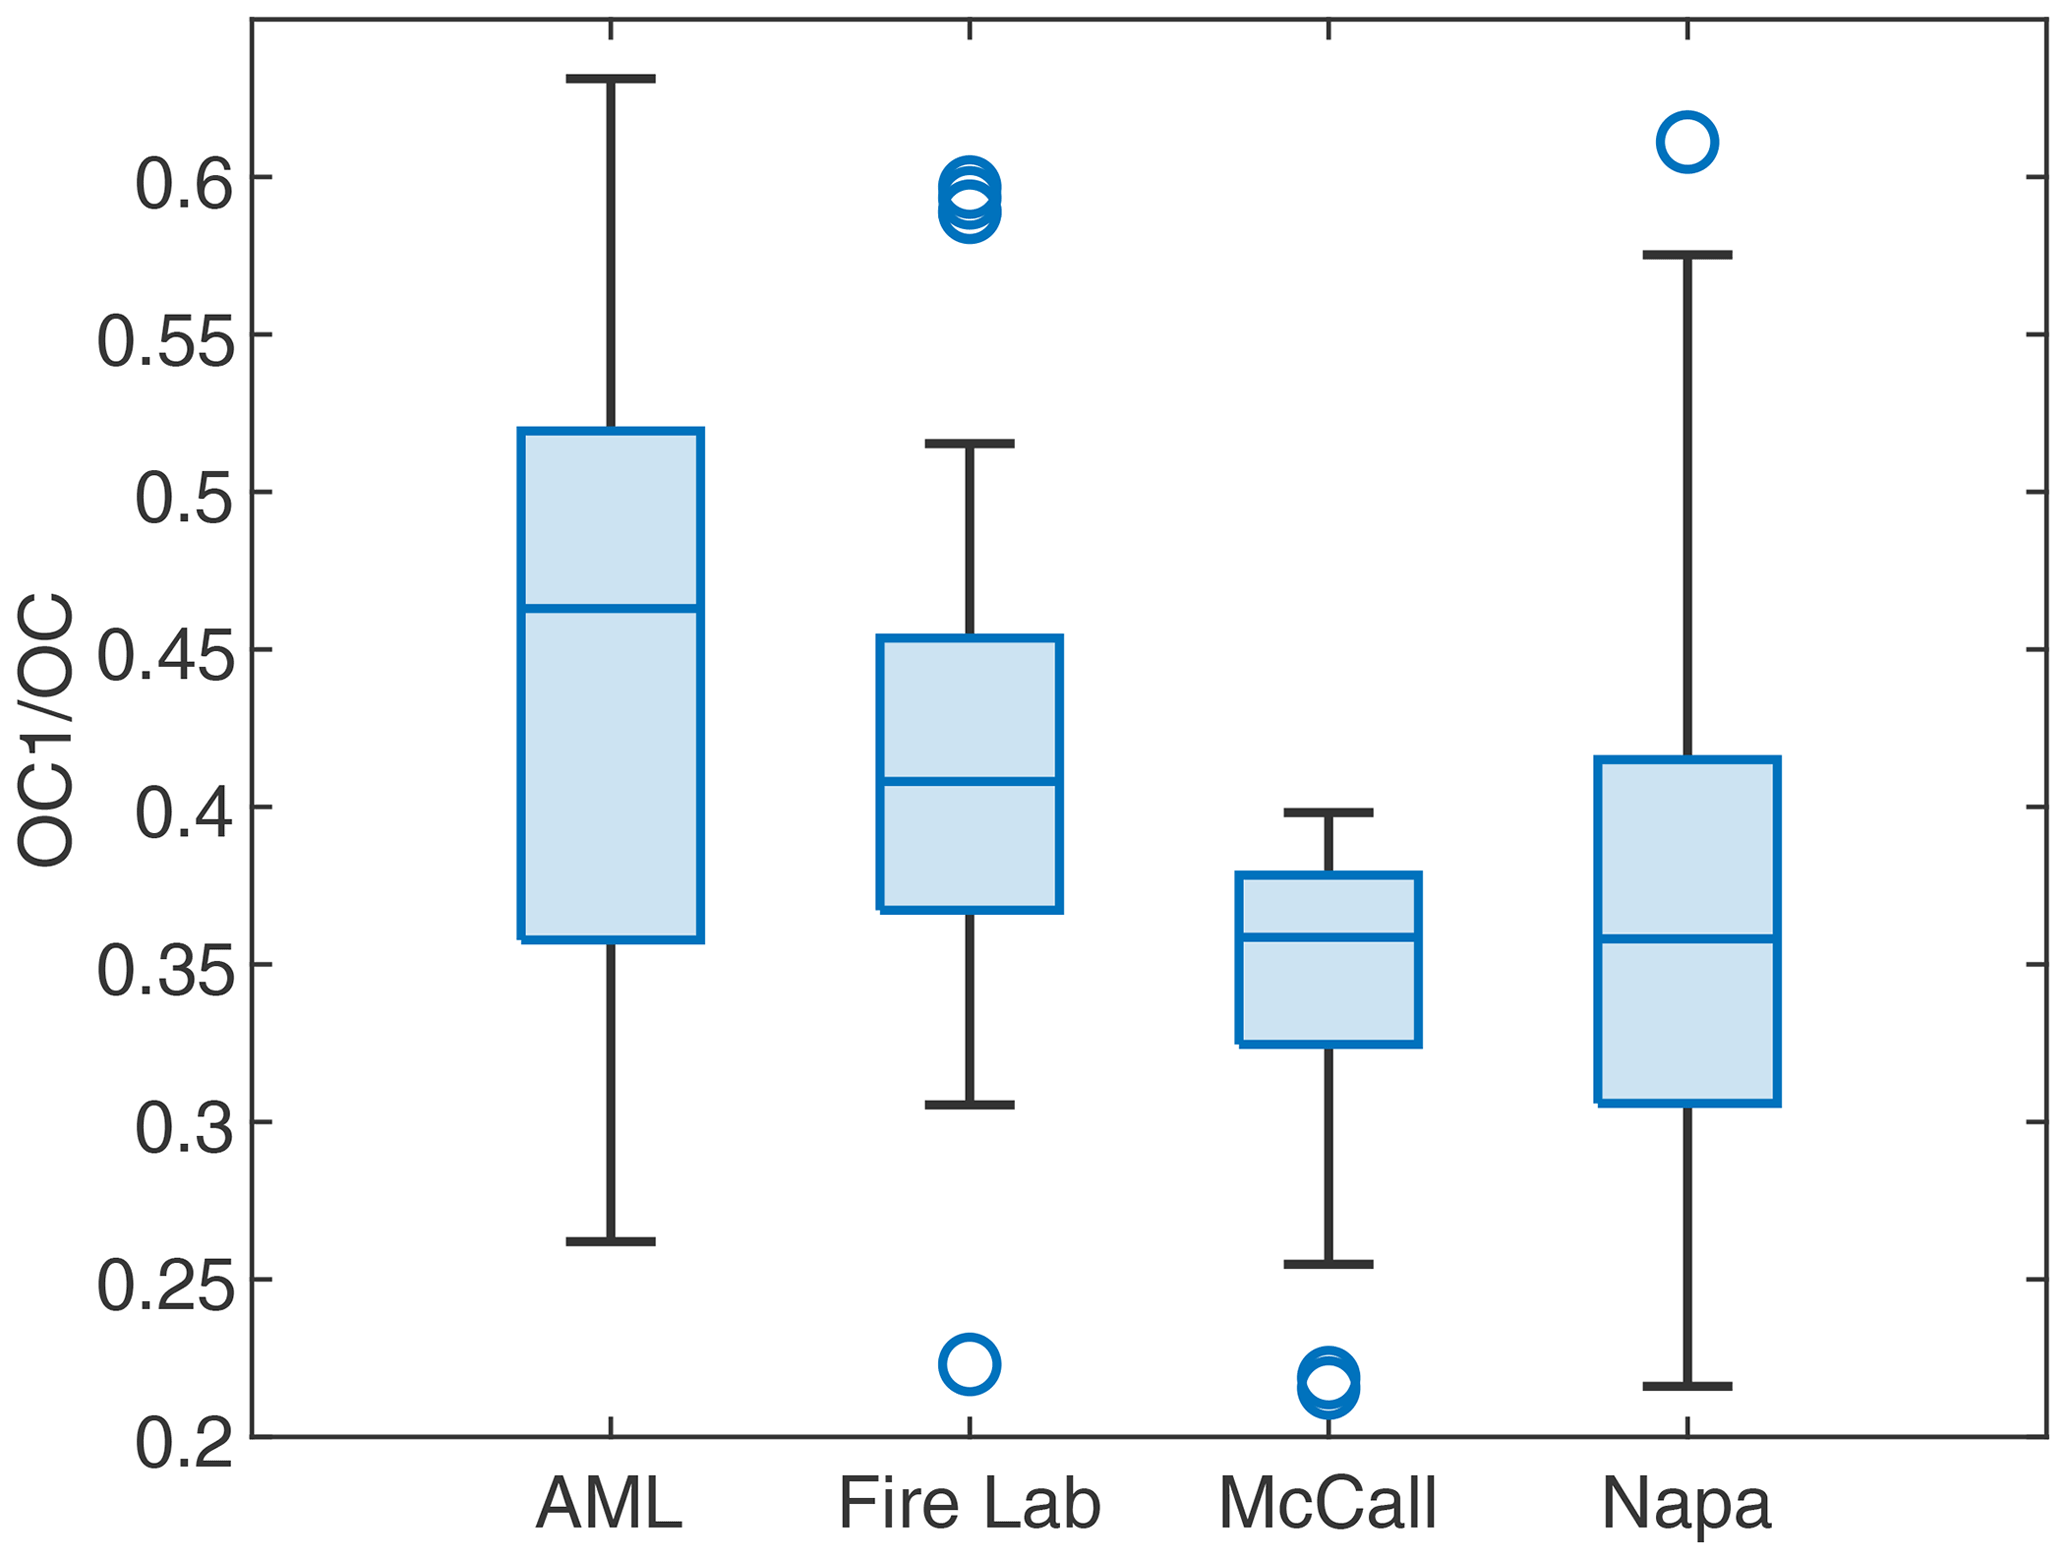
Figure 9Box plot of the fraction of OC1 in OC for wildfire emissions. Each box plot shows the interquartile range with whiskers extended to 1.5 times the interquartile range. Central marks are the medians. Circles denote outliers.
In this work, we analyzed gas- and particle-phase organic compounds emitted from western US wildfires using GC × GC and assessed the gas-particle partitioning behavior of these compounds after emissions, particularly as relevant for SOA formation. Emission factors (EFs) and emission ratios (EFs) were calculated and reported for 72 gas-phase and 240 particle-phase compounds. In agreement with prior laboratory biomass burning studies, we found that MCE was a good predictor of particle-phase organic compound EFs but not for EC. Diterpenoids (including resin acids) were the most abundant particle-phase organic compounds detected in the wildfire smoke samples (accounting for 35 % of total quantified OA on average), likely due to heat-driven evaporation. Similarly, monoterpenes in the gas phase were higher in the wildfire smoke samples than in most Fire Lab 2016 smoke samples. We confirmed that the evaporation of SVOCs took place in smoke plumes from the molecular perspective. Such evaporation led to a decrease of the semi-volatile fraction of particle-phase OC when smoke was transported downwind and diluted. The evaporated compounds may react with atmospheric oxidants to form SOA and O3. The emission profiles reported here can benefit future source apportionment or modeling studies and exposure assessments. They can also help researchers focused on public health to identify compounds for more targeted toxicological studies to better understand the health impacts of wildfire smoke. The compounds identified from our GC × GC analyses can also help researchers with one-dimensional GC-MS in compound identification.
Emission factors and ratios of all the compounds are provided in the Supplement spreadsheet. Data measured by the AMS, VOCUS, and OC EC data can be accessed at https://www-air.larc.nasa.gov/missions/firex-aq/index.html (NASA and NOAA, FIREX-AQ, 2022). Data used in this research are also available from the authors upon request.
The supplement related to this article is available online at: https://doi.org/10.5194/acp-22-9877-2022-supplement.
AHG, KCB, and SCH designed research, and YL, CS, ECF, RAW, PVR, FM, TIY, CD, and SCH performed research. YL, NMK, and AHG devised the sampling plan. NMK contributed research instruments. YL, CS, ECF, and AHG analyzed data. YL, KCB, and AHG wrote the manuscript with input from all the coauthors.
The contact author has declared that none of the authors has any competing interests.
Publisher's note: Copernicus Publications remains neutral with regard to jurisdictional claims in published maps and institutional affiliations.
The authors thank Rob Roscioli and Jordan Krechmer of Aerodyne Research, Inc. for their effort in contributing the AML data. The authors thank Robert Weber, Emily Franklin, and Caleb Arata of UC Berkeley and Oleg Kostko, Bruce Rude, and Kevin Wilson of Lawrence Berkeley National Laboratory for their help during the beamline campaign. We also thank Coty Jen of Carnegie Mellon University for contributing filters from the Fire Lab 2016 study, Emily Franklin for contributing standard solutions, and Afsara Tasnia of UC Riverside for the curation of VOC data. We thank Dennis Baldocchi of UC Berkeley for helpful suggestions. This research used resources of the Advanced Light Source, which is a DOE Office of Science User Facility under contract no. DE-AC02-05CH11231.
This research has been supported by the National Oceanic and Atmospheric Administration (grant nos. NA16OAR4310107, NA16OAR4310103, and NA16OAR4310104) to UCB, UCR, and Aerodyne Research Inc., respectively.
This paper was edited by Steven Brown and reviewed by two anonymous referees.
Akagi, S. K., Yokelson, R. J., Wiedinmyer, C., Alvarado, M. J., Reid, J. S., Karl, T., Crounse, J. D., and Wennberg, P. O.: Emission factors for open and domestic biomass burning for use in atmospheric models, Atmos. Chem. Phys., 11, 4039–4072, https://doi.org/10.5194/acp-11-4039-2011, 2011.
Alfarra, M. R., Prevot, A. S. H., Szidat, S., Sandradewi, J., Weimer, S., Lanz, V. A., Schreiber, D., Mohr, M., and Baltensperger, U.: Identification of the mass spectral signature of organic aerosols from wood burning emissions, Environ. Sci. Technol., 41, 5770–5777, https://doi.org/10.1021/es062289b, 2007.
An, Z., Li, X., Shi, Z., Williams, B. J., Harrison, R. M., and Jiang, J.: Frontier review on comprehensive two-dimensional gas chromatography for measuring organic aerosol, J. Hazard. Mater. Lett., 2, 100013, https://doi.org/10.1016/j.hazl.2021.100013, 2021.
Andreae, M. O.: Emission of trace gases and aerosols from biomass burning – an updated assessment, Atmos. Chem. Phys., 19, 8523–8546, https://doi.org/10.5194/acp-19-8523-2019, 2019.
Andreae, M. O. and Merlet, P.: Emission of trace gases and aerosols from biomass burning, Global Biogeochem. Cy., 15, 955–966, https://doi.org/10.1029/2000GB001382, 2001.
Atkinson, R. and Arey, J.: Atmospheric Degradation of Volatile Organic Compounds, Chem. Rev., 103, 4605–4638, https://doi.org/10.1021/cr0206420, 2003.
Atkinson, R., Baulch, D. L., Cox, R. A., Crowley, J. N., Hampson, R. F., Hynes, R. G., Jenkin, M. E., Rossi, M. J., and Troe, J.: Evaluated kinetic and photochemical data for atmospheric chemistry: Volume II – Gas phase reactions of organic species, Atmos. Chem. Phys., 6, 3625–4055, https://doi.org/10.5194/ACP-6-3625-2006, 2006.
Bautista, A. T., Pabroa, P. C. B., Santos, F. L., Quirit, L. L., Asis, J. L. B., Dy, M. A. K., and Martinez, J. P. G.: Intercomparison between NIOSH, IMPROVE_A, and EUSAAR_2 protocols: Finding an optimal thermal-optical protocol for Philippines OC/EC samples, Atmos. Pollut. Res., 6, 334–342, https://doi.org/10.5094/APR.2015.037, 2015.
Bertrand, A., Stefenelli, G., Jen, C. N., Pieber, S. M., Bruns, E. A., Ni, H., Temime-Roussel, B., Slowik, J. G., Goldstein, A. H., El Haddad, I., Baltensperger, U., Prévôt, A. S. H., Wortham, H., and Marchand, N.: Evolution of the chemical fingerprint of biomass burning organic aerosol during aging, Atmos. Chem. Phys., 18, 7607–7624, https://doi.org/10.5194/acp-18-7607-2018, 2018.
Bond, T. C., Streets, D. G., Yarber, K. F., Nelson, S. M., Woo, J. H., and Klimont, Z.: A technology-based global inventory of black and organic carbon emissions from combustion, J. Geophys. Res.-Atmos., 109, D14203, https://doi.org/10.1029/2003JD003697, 2004.
Bruns, E. A., El Haddad, I., Slowik, J. G., Kilic, D., Klein, F., Baltensperger, U., and Prévôt, A. S. H.: Identification of significant precursor gases of secondary organic aerosols from residential wood combustion, Sci. Rep., 6, 27881, https://doi.org/10.1038/srep27881, 2016.
Burling, I. R., Yokelson, R. J., Griffith, D. W. T., Johnson, T. J., Veres, P., Roberts, J. M., Warneke, C., Urbanski, S. P., Reardon, J., Weise, D. R., Hao, W. M., and de Gouw, J.: Laboratory measurements of trace gas emissions from biomass burning of fuel types from the southeastern and southwestern United States, Atmos. Chem. Phys., 10, 11115–11130, https://doi.org/10.5194/acp-10-11115-2010, 2010.
Coggon, M. M., Veres, P. R., Yuan, B., Koss, A., Warneke, C., Gilman, J. B., Lerner, B. M., Peischl, J., Aikin, K. C., Stockwell, C. E., Hatch, L. E., Ryerson, T. B., Roberts, J. M., Yokelson, R. J., and de Gouw, J. A.: Emissions of nitrogen-containing organic compounds from the burning of herbaceous and arboraceous biomass: Fuel composition dependence and the variability of commonly used nitrile tracers, Geophys. Res. Lett., 43, 9903–9912, https://doi.org/10.1002/2016GL070562, 2016.
Collard, F. X. and Blin, J.: A review on pyrolysis of biomass constituents: Mechanisms and composition of the products obtained from the conversion of cellulose, hemicelluloses and lignin, Renew. Sustain. Energy Rev., 38, 594–608, https://doi.org/10.1016/j.rser.2014.06.013, 2014.
Collier, S., Zhou, S., Onasch, T. B., Jaffe, D. A., Kleinman, L., Sedlacek, A. J., Briggs, N. L., Hee, J., Fortner, E., Shilling, J. E., Worsnop, D., Yokelson, R. J., Parworth, C., Ge, X., Xu, J., Butterfield, Z., Chand, D., Dubey, M. K., Pekour, M. S., Springston, S., and Zhang, Q.: Regional Influence of Aerosol Emissions from Wildfires Driven by Combustion Efficiency: Insights from the BBOP Campaign, Environ. Sci. Technol., 50, 8613–8622, https://doi.org/10.1021/acs.est.6b01617, 2016.
Decker, Z. C. J., Robinson, M. A., Barsanti, K. C., Bourgeois, I., Coggon, M. M., DiGangi, J. P., Diskin, G. S., Flocke, F. M., Franchin, A., Fredrickson, C. D., Gkatzelis, G. I., Hall, S. R., Halliday, H., Holmes, C. D., Huey, L. G., Lee, Y. R., Lindaas, J., Middlebrook, A. M., Montzka, D. D., Moore, R., Neuman, J. A., Nowak, J. B., Palm, B. B., Peischl, J., Piel, F., Rickly, P. S., Rollins, A. W., Ryerson, T. B., Schwantes, R. H., Sekimoto, K., Thornhill, L., Thornton, J. A., Tyndall, G. S., Ullmann, K., Van Rooy, P., Veres, P. R., Warneke, C., Washenfelder, R. A., Weinheimer, A. J., Wiggins, E., Winstead, E., Wisthaler, A., Womack, C., and Brown, S. S.: Nighttime and daytime dark oxidation chemistry in wildfire plumes: an observation and model analysis of FIREX-AQ aircraft data, Atmos. Chem. Phys., 21, 16293–16317, https://doi.org/10.5194/acp-21-16293-2021, 2021.
Dennison, P. E., Brewer, S. C., Arnold, J. D., and Moritz, M. A.: Large wildfire trends in the western United States, 1984–2011, Geophys. Res. Lett., 41, 2928–2933, https://doi.org/10.1002/2014GL059576, 2014.
Donahue, N. M., Robinson, A. L., Stanier, C. O., and Pandis, S. N.: Coupled partitioning, dilution, and chemical aging of semivolatile organics, Environ. Sci. Technol., 40, 2635–2643, https://doi.org/10.1021/es052297c, 2006.
Donahue, N. M., Chuang, W., Epstein, S. A., Kroll, J. H., Worsnop, D. R., Robinson, A. L., Adams, P. J., and Pandis, S. N.: Why do organic aerosols exist? Understanding aerosol lifetimes using the two-dimensional volatility basis set, Environ. Chem., 10, 151–157, https://doi.org/10.1071/EN13022, 2013.
Eksi, G., Kurbanoglu, S., and Erdem, S. A.: Analysis of diterpenes and diterpenoids, Recent Adv. Nat. Prod. Anal., 313–345, https://doi.org/10.1016/B978-0-12-816455-6.00009-3, 2020.
Fine, P. M., Cass, G. R., and Simoneit, B. R. T.: Chemical characterization of fine particle emissions from the wood stove combustion of prevalent united states tree species, Environ. Eng. Sci., 21, 705–721, https://doi.org/10.1089/ees.2004.21.705, 2004.
Finewax, Z., De Gouw, J. A., and Ziemann, P. J.: Identification and Quantification of 4-Nitrocatechol Formed from OH and NO3 Radical-Initiated Reactions of Catechol in Air in the Presence of NOx: Implications for Secondary Organic Aerosol Formation from Biomass Burning, Environ. Sci. Technol., 52, 1981–1989, https://doi.org/10.1021/acs.est.7b05864, 2018.
Fortner, E., Onasch, T., Canagaratna, M., Williams, L. R., Lee, T., Jayne, J., and Worsnop, D.: Examining the chemical composition of black carbon particles from biomass burning with SP-AMS, J. Aerosol Sci., 120, 12–21, https://doi.org/10.1016/j.jaerosci.2018.03.001, 2018.
Gong, X., Kaulfus, A., Nair, U., and Jaffe, D. A.: Quantifying O3 Impacts in Urban Areas Due to Wildfires Using a Generalized Additive Model, Environ. Sci. Technol., 51, 13216–13223, https://doi.org/10.1021/acs.est.7b03130, 2017.
Grieshop, A. P., Logue, J. M., Donahue, N. M., and Robinson, A. L.: Laboratory investigation of photochemical oxidation of organic aerosol from wood fires 1: measurement and simulation of organic aerosol evolution, Atmos. Chem. Phys., 9, 1263–1277, https://doi.org/10.5194/acp-9-1263-2009, 2009.
Hatch, L. E., Luo, W., Pankow, J. F., Yokelson, R. J., Stockwell, C. E., and Barsanti, K. C.: Identification and quantification of gaseous organic compounds emitted from biomass burning using two-dimensional gas chromatography–time-of-flight mass spectrometry, Atmos. Chem. Phys., 15, 1865–1899, https://doi.org/10.5194/acp-15-1865-2015, 2015.
Hatch, L. E., Rivas-Ubach, A., Jen, C. N., Lipton, M., Goldstein, A. H., and Barsanti, K. C.: Measurements of I/SVOCs in biomass-burning smoke using solid-phase extraction disks and two-dimensional gas chromatography, Atmos. Chem. Phys., 18, 17801–17817, https://doi.org/10.5194/acp-18-17801-2018, 2018.
Hatch, L. E., Jen, C. N., Kreisberg, N. M., Selimovic, V., Yokelson, R. J., Stamatis, C., York, R. A., Foster, D., Stephens, S. L., Goldstein, A. H., and Barsanti, K. C.: Highly Speciated Measurements of Terpenoids Emitted from Laboratory and Mixed-Conifer Forest Prescribed Fires, Environ. Sci. Technol., 53, 9418–9428, https://doi.org/10.1021/acs.est.9b02612, 2019.
Hennigan, C. J., Sullivan, A. P., Collett, J. L., and Robinson, A. L.: Levoglucosan stability in biomass burning particles exposed to hydroxyl radicals, Geophys. Res. Lett., 37, L09806, https://doi.org/10.1029/2010GL043088, 2010.
Herndon, S. C., Jayne, J. T., Zahniser, M. S., Worsnop, D. R., Knighton, B., Alwine, E., Lamb, B. K., Zavala, M., Nelson, D. D., McManus, J. B., Shorter, J. H., Canagaratna, M. R., Onasch, T. B., and Kolb, C. E.: Characterization of urban pollutant emission fluxes and ambient concentration distributions using a mobile laboratory with rapid response instrumentation, Faraday Discuss., 130, 327–339, https://doi.org/10.1039/b500411j, 2005.
Hodshire, A. L., Akherati, A., Alvarado, M. J., Brown-Steiner, B., Jathar, S. H., Jimenez, J. L., Kreidenweis, S. M., Lonsdale, C. R., Onasch, T. B., Ortega, A. M., and Pierce, J. R.: Aging Effects on Biomass Burning Aerosol Mass and Composition: A Critical Review of Field and Laboratory Studies, Environ. Sci. Technol., 53, 10007–10022, https://doi.org/10.1021/acs.est.9b02588, 2019.
Holzinger, R., Wameke, C., Hansel, A., Jordan, A., Lindinger, W., Scharffe, D. H., Schade, G., and Crutzen, P. J.: Biomass burning as a source of formaldehyde, acetaldehyde, methanol, acetone, acetonitrile, and hydrogen cyanide, Geophys. Res. Lett., 26, 1161–1164, https://doi.org/10.1029/1999GL900156, 1999.
Hornbrook, R. S., Blake, D. R., Diskin, G. S., Fried, A., Fuelberg, H. E., Meinardi, S., Mikoviny, T., Richter, D., Sachse, G. W., Vay, S. A., Walega, J., Weibring, P., Weinheimer, A. J., Wiedinmyer, C., Wisthaler, A., Hills, A., Riemer, D. D., and Apel, E. C.: Observations of nonmethane organic compounds during ARCTAS – Part 1: Biomass burning emissions and plume enhancements, Atmos. Chem. Phys., 11, 11103–11130, https://doi.org/10.5194/acp-11-11103-2011, 2011.
Iglesias, V., Balch, J. K., and Travis, W. R.: U.S. fires became larger, more frequent, and more widespread in the 2000s, Sci. Adv., 8, 1–10, https://doi.org/10.1126/sciadv.abc0020, 2022.
Isaacman, G., Worton, D. R., Kreisberg, N. M., Hennigan, C. J., Teng, A. P., Hering, S. V., Robinson, A. L., Donahue, N. M., and Goldstein, A. H.: Understanding evolution of product composition and volatility distribution through in-situ GC × GC analysis: a case study of longifolene ozonolysis, Atmos. Chem. Phys., 11, 5335–5346, https://doi.org/10.5194/acp-11-5335-2011, 2011.
Isaacman-VanWertz, G., Lu, X., Weiner, E., Smiley, E., and Widdowson, M.: Characterization of Hydrocarbon Groups in Complex Mixtures Using Gas Chromatography with Unit-Mass Resolution Electron Ionization Mass Spectrometry, Anal. Chem., 92, 12481–12488, https://doi.org/10.1021/acs.analchem.0c02308, 2020.
Jaffe, D. A. and Wigder, N. L.: Ozone production from wildfires: A critical review, Atmos. Environ., 51, 1–10, https://doi.org/10.1016/j.atmosenv.2011.11.063, 2012.
Jathar, S. H., Gordon, T. D., Hennigan, C. J., Pye, H. O. T., Pouliot, G., Adams, P. J., Donahue, N. M., and Robinson, A. L.: Unspeciated organic emissions from combustion sources and their influence on the secondary organic aerosol budget in the United States, P. Natl. Acad. Sci. USA, 111, 10473–10478, https://doi.org/10.1073/pnas.1323740111, 2014.
Jen, C. N., Hatch, L. E., Selimovic, V., Yokelson, R. J., Weber, R., Fernandez, A. E., Kreisberg, N. M., Barsanti, K. C., and Goldstein, A. H.: Speciated and total emission factors of particulate organics from burning western US wildland fuels and their dependence on combustion efficiency, Atmos. Chem. Phys., 19, 1013–1026, https://doi.org/10.5194/acp-19-1013-2019, 2019.
Jerrett, M., Burnett, R. T., Pope, C. A., Ito, K., Thurston, G., Krewski, D., Shi, Y., Calle, E., and Thun, M.: Long-Term Ozone Exposure and Mortality, N. Engl. J. Med., 360, 1085–1095, https://doi.org/10.1056/nejmoa0803894, 2009.
Kim, Y. H., Warren, S. H., Krantz, Q. T., King, C., Jaskot, R., Preston, W. T., George, B. J., Hays, M. D., Landis, M. S., Higuchi, M., Demarini, D. M., and Gilmour, M. I.: Mutagenicity and lung toxicity of smoldering vs. Flaming emissions from various biomass fuels: Implications for health effects from wildland fires, Environ. Health Persp., 126, 017011, https://doi.org/10.1289/EHP2200, 2018.
Kind, I., Berndt, T., Böge, O., and Rolle, W.: Gas-phase rate constants for the reaction of NO3 radicals with furan and methyl-substituted furans, Chem. Phys. Lett., 256, 679–683, https://doi.org/10.1016/0009-2614(96)00513-1, 1996.
Kolb, C. E., Herndon, S. C., Mcmanus, J. B., Shorter, J. H., Zahniser, M. S., Nelson, D. D., Jayne, J. T., Canagaratna, M. R., and Worsnop, D. R.: Mobile laboratory with rapid response instruments for real-time measurements of urban and regional trace gas and particulate distributions and emission source characteristics, Environ. Sci. Technol., 38, 5694–5703, https://doi.org/10.1021/es030718p, 2004.
Koss, A. R., Sekimoto, K., Gilman, J. B., Selimovic, V., Coggon, M. M., Zarzana, K. J., Yuan, B., Lerner, B. M., Brown, S. S., Jimenez, J. L., Krechmer, J., Roberts, J. M., Warneke, C., Yokelson, R. J., and de Gouw, J.: Non-methane organic gas emissions from biomass burning: identification, quantification, and emission factors from PTR-ToF during the FIREX 2016 laboratory experiment, Atmos. Chem. Phys., 18, 3299–3319, https://doi.org/10.5194/acp-18-3299-2018, 2018.
Krechmer, J., Lopez-Hilfiker, F., Koss, A., Hutterli, M., Stoermer, C., Deming, B., Kimmel, J., Warneke, C., Holzinger, R., Jayne, J., Worsnop, D., Fuhrer, K., Gonin, M., and De Gouw, J.: Evaluation of a New Reagent-Ion Source and Focusing Ion-Molecule Reactor for Use in Proton-Transfer-Reaction Mass Spectrometry, Anal. Chem., 90, 12011–12018, https://doi.org/10.1021/acs.analchem.8b02641, 2018.
Krokene, P.: Conifer Defense and Resistance to Bark Beetles, chap. 5., in: Bark Beetles, Biology and Ecology of Native and Invasive Species, 177–207, https://doi.org/10.1016/B978-0-12-417156-5.00005-8, 2015.
Lee, A., Goldstein, A. H., Keywood, M. D., Gao, S., Varutbangkul, V., Bahreini, R., Ng, N. L., Flagan, R. C., and Seinfeld, J. H.: Gas-phase products and secondary aerosol yields from the ozonolysis of ten different terpenes, J. Geophys. Res., 111, D07302, https://doi.org/10.1029/2005JD006437, 2006a.
Lee, A., Goldstein, A. H., Kroll, J. H., Ng, N. L., Varutbangkul, V., Flagan, R. C., and Seinfeld, J. H.: Gas-phase products and secondary aerosol yields from the photooxidation of 16 different terpenes, J. Geophys. Res. Atmos., 111, D17305, https://doi.org/10.1029/2006JD007050, 2006b.
Liang, Y., Jen, C. N., Weber, R. J., Misztal, P. K., and Goldstein, A. H.: Chemical composition of PM2.5 in October 2017 Northern California wildfire plumes, Atmos. Chem. Phys., 21, 5719–5737, https://doi.org/10.5194/acp-21-5719-2021, 2021.
Liang, Y., Weber, R. J., Misztal, P. K., Jen, C. N., and Goldstein, A. H.: Aging of Volatile Organic Compounds in October 2017 Northern California Wildfire Plumes, Environ. Sci. Technol., 56, 1557–1567, https://doi.org/10.1021/acs.est.1c05684, 2022.
Lim, C. Y., Hagan, D. H., Coggon, M. M., Koss, A. R., Sekimoto, K., de Gouw, J., Warneke, C., Cappa, C. D., and Kroll, J. H.: Secondary organic aerosol formation from the laboratory oxidation of biomass burning emissions, Atmos. Chem. Phys., 19, 12797–12809, https://doi.org/10.5194/acp-19-12797-2019, 2019.
Majluf, F. Y., Krechmer, J. E., Daube, C., Knighton, W. B., Dyroff, C., Lambe, A. T., Fortner, E. C., Yacovitch, T. I., Roscioli, J. R., Herndon, S. C., Worsnop, D. R., and Canagaratna, M. R.: Mobile Near-Field Measurements of Biomass Burning Volatile Organic Compounds: Emission Ratios and Factor Analysis, Environ. Sci. Tech. Let., 9, 383–390, https://doi.org/10.1021/acs.estlett.2c00194, 2022.
McClure, C. D. and Jaffe, D. A.: US particulate matter air quality improves except in wildfire-prone areas, P. Natl. Acad. Sci. USA, 115, 7901–7906, https://doi.org/10.1073/pnas.1804353115, 2018.
McManus, J. B., Zahniser, M. S., Nelson, D. D., Shorter, J. H., Herndon, S. C., Jervis, D., Agnese, M., McGovern, R., Yacovitch, T. I., and Roscioli, J. R.: Recent progress in laser-based trace gas instruments: performance and noise analysis, Appl. Phys. B-Lasers O., 119, 203–218, https://doi.org/10.1007/s00340-015-6033-0, 2015.
NASA and NOAA: FIREX-AQ – Fire Influence on Regional to Global Environments and Air Quality, NASA and NOAA [data set], https://www-air.larc.nasa.gov/missions/firex-aq/index.html, last access: 28 July 2022.
O'Dell, K., Hornbrook, R. S., Permar, W., Levin, E. J. T., Garofalo, L. A., Apel, E. C., Blake, N. J., Jarnot, A., Pothier, M. A., Farmer, D. K., Hu, L., Campos, T., Ford, B., Pierce, J. R., and Fischer, E. V.: Hazardous Air Pollutants in Fresh and Aged Western US Wildfire Smoke and Implications for Long-Term Exposure, Environ. Sci. Technol., 54, 11838–11847, https://doi.org/10.1021/acs.est.0c04497, 2020.
Onasch, T. B., Trimborn, A., Fortner, E. C., Jayne, J. T., Kok, G. L., Williams, L. R., Davidovits, P., and Worsnop, D. R.: Soot particle aerosol mass spectrometer: Development, validation, and initial application, Aerosol Sci. Tech., 46, 804–817, https://doi.org/10.1080/02786826.2012.663948, 2012.
Ottmar, R. D.: Wildland fire emissions, carbon, and climate: Modeling fuel consumption, Forest Ecol. Manage., 317, 41–50, https://doi.org/10.1016/J.FORECO.2013.06.010, 2014.
Palm, B. B., Peng, Q., Fredrickson, C. D., Lee, B. H., Garofalo, L. A., Pothier, M. A., Kreidenweis, S. M., Farmer, D. K., Pokhrel, R. P., Shen, Y., Murphy, S. M., Permar, W., Hu, L., Campos, T. L., Hall, S. R., Ullmann, K., Zhang, X., Flocke, F., Fischer, E. V., and Thornton, J. A.: Quantification of organic aerosol and brown carbon evolution in fresh wildfire plumes, P. Natl. Acad. Sci. USA, 117, 29469–29477, https://doi.org/10.1073/pnas.2012218117, 2020.
Pankow, J. F.: An absorption model of gas/particle partitioning of organic compounds in the atmosphere, Atmos. Environ., 28, 185–188, https://doi.org/10.1016/1352-2310(94)90093-0, 1994.
Permar, W., Wang, Q., Selimovic, V., Wielgasz, C., Yokelson, R. J., Hornbrook, R. S., Hills, A. J., Apel, E. C., Ku, I. T., Zhou, Y., Sive, B. C., Sullivan, A. P., Collett, J. L., Campos, T. L., Palm, B. B., Peng, Q., Thornton, J. A., Garofalo, L. A., Farmer, D. K., Kreidenweis, S. M., Levin, E. J. T., DeMott, P. J., Flocke, F., Fischer, E. V., and Hu, L.: Emissions of Trace Organic Gases From Western U.S. Wildfires Based on WE-CAN Aircraft Measurements, J. Geophys. Res.-Atmos., 126, 1–29, https://doi.org/10.1029/2020JD033838, 2021.
Pokhrel, R. P., Wagner, N. L., Langridge, J. M., Lack, D. A., Jayarathne, T., Stone, E. A., Stockwell, C. E., Yokelson, R. J., and Murphy, S. M.: Parameterization of single-scattering albedo (SSA) and absorption Ångström exponent (AAE) with EC / OC for aerosol emissions from biomass burning, Atmos. Chem. Phys., 16, 9549–9561, https://doi.org/10.5194/acp-16-9549-2016, 2016.
Ramage, M. H., Burridge, H., Busse-Wicher, M., Fereday, G., Reynolds, T., Shah, D. U., Wu, G., Yu, L., Fleming, P., Densley-Tingley, D., Allwood, J., Dupree, P., Linden, P. F., and Scherman, O.: The wood from the trees: The use of timber in construction, Renew. Sust. Energ. Rev., 68, 333–359, https://doi.org/10.1016/J.RSER.2016.09.107, 2017.
Ramdahl, T.: Retene – a molecular marker of wood combustion in ambient air, Nature, 306, 580–582, https://doi.org/10.1038/306580a0, 1983.
Robinson, A. L., Donahue, N. M., Shrivastava, M. K., Weitkamp, E. A., Sage, A. M., Grieshop, A. P., Lane, T. E., Pierce, J. R., and Pandis, S. N.: Rethinking organic aerosols: Semivolatile emissions and photochemical aging, Science, 315, 1259–1262, https://doi.org/10.1126/science.1133061, 2007.
Santoso, M. A., Christensen, E. G., Yang, J., and Rein, G.: Review of the Transition From Smouldering to Flaming Combustion in Wildfires, Front. Mech. Eng., 18, 49, https://doi.org/10.3389/fmech.2019.00049, 2019.
Schuller, W. H. and Conrad, C. M.: Thermal Behavior of Certain Resin Acids, J. Chem. Eng. Data, 11, 89–91, https://doi.org/10.1021/je60028a024, 1966.
Sekimoto, K., Koss, A. R., Gilman, J. B., Selimovic, V., Coggon, M. M., Zarzana, K. J., Yuan, B., Lerner, B. M., Brown, S. S., Warneke, C., Yokelson, R. J., Roberts, J. M., and de Gouw, J.: High- and low-temperature pyrolysis profiles describe volatile organic compound emissions from western US wildfire fuels, Atmos. Chem. Phys., 18, 9263–9281, https://doi.org/10.5194/acp-18-9263-2018, 2018.
Simoneit, B. R. T., Rogge, W. F., Mazurek, M. A., Standley, L. J., Hildemann, L. M., and Cass, G. R.: Lignin Pyrolysis Products, Lignans, and Resin Acids as Specific Tracers of Plant Classes in Emissions from Biomass Combustion, Environ. Sci. Technol., 27, 2533–2541, https://doi.org/10.1021/es00048a034, 1993.
Stamatis, C. and Barsanti, K. C.: Development and application of a supervised pattern recognition algorithm for identification of fuel-specific emissions profiles, Atmos. Meas. Tech., 15, 2591–2606, https://doi.org/10.5194/amt-15-2591-2022, 2022.
Standley, L. J. and Simoneit, B. R. T.: Resin diterpenoids as tracers for biomass combustion aerosols, J. Atmos. Chem., 18, 1–15, https://doi.org/10.1007/BF00694371, 1994.
Stein, S. E. and Scott, D. R.: Optimization and testing of mass spectral library search algorithms for compound identification, J. Am. Soc. Mass Spectrom., 5, 859–866, https://doi.org/10.1016/1044-0305(94)87009-8, 1994.
Sumlin, B., Fortner, E., Lambe, A., Shetty, N. J., Daube, C., Liu, P., Majluf, F., Herndon, S., and Chakrabarty, R. K.: Diel cycle impacts on the chemical and light absorption properties of organic carbon aerosol from wildfires in the western United States, Atmos. Chem. Phys., 21, 11843–11856, https://doi.org/10.5194/acp-21-11843-2021, 2021.
Tuet, W. Y., Chen, Y., Fok, S., Champion, J. A., and Ng, N. L.: Inflammatory responses to secondary organic aerosols (SOA) generated from biogenic and anthropogenic precursors, Atmos. Chem. Phys., 17, 11423–11440, https://doi.org/10.5194/acp-17-11423-2017, 2017.
Westerling, A. L., Hidalgo, H. G., Cayan, D. R., and Swetnam, T. W.: Warming and Earlier Spring Increase Western U.S. Forest Wildfire Activity, Science, 313, 940–943, https://doi.org/10.1126/science.1128834, 2006.
Wong, J. P. S., Tsagkaraki, M., Tsiodra, I., Mihalopoulos, N., Violaki, K., Kanakidou, M., Sciare, J., Nenes, A., and Weber, R. J.: Effects of Atmospheric Processing on the Oxidative Potential of Biomass Burning Organic Aerosols, Environ. Sci. Technol., 53, 6747–6756, https://doi.org/10.1021/acs.est.9b01034, 2019.
Wu, C., Huang, X. H. H., Ng, W. M., Griffith, S. M., and Yu, J. Z.: Inter-comparison of NIOSH and IMPROVE protocols for OC and EC determination: implications for inter-protocol data conversion, Atmos. Meas. Tech., 9, 4547–4560, https://doi.org/10.5194/amt-9-4547-2016, 2016.
Yacovitch, T. I., Herndon, S. C., Fortner, E. C., Daube, C., Roscioli, R., Knighton, W. B., Khystov, A., and Campbell, D.: Final Report Application of Next Generation Air Monitoring Methods in the South Coast Air Basin, http://www.aqmd.gov/docs/default-source/compliance/Paramount/mobile-monitoring.pdf (last access: 28 July 2022), 2019.
Yee, L. D., Isaacman-VanWertz, G., Wernis, R. A., Meng, M., Rivera, V., Kreisberg, N. M., Hering, S. V., Bering, M. S., Glasius, M., Upshur, M. A., Gray Bé, A., Thomson, R. J., Geiger, F. M., Offenberg, J. H., Lewandowski, M., Kourtchev, I., Kalberer, M., de Sá, S., Martin, S. T., Alexander, M. L., Palm, B. B., Hu, W., Campuzano-Jost, P., Day, D. A., Jimenez, J. L., Liu, Y., McKinney, K. A., Artaxo, P., Viegas, J., Manzi, A., Oliveira, M. B., de Souza, R., Machado, L. A. T., Longo, K., and Goldstein, A. H.: Observations of sesquiterpenes and their oxidation products in central Amazonia during the wet and dry seasons, Atmos. Chem. Phys., 18, 10433–10457, https://doi.org/10.5194/acp-18-10433-2018, 2018.
Yokelson, R. J., Goode, J. G., Ward, D. E., Susott, R. A., Babbitt, R. E., Wade, D. D., Bertschi, I., Griffith, D. W. T., and Hao, W. M.: Emissions of formaldehyde, acetic acid, methanol, and other trace gases from biomass fires in North Carolina measured by airborne Fourier transform infrared spectroscopy, J. Geophys. Res.-Atmos., 104, 30109–30125, https://doi.org/10.1029/1999JD900817, 1999.
Zhang, H., Yee, L. D., Lee, B. H., Curtis, M. P., Worton, D. R., Isaacman-VanWertz, G., Offenberg, J. H., Lewandowski, M., Kleindienst, T. E., Beaver, M. R., Holder, A. L., Lonneman, W. A., Docherty, K. S., Jaoui, M., Pye, H. O. T., Hu, W., Day, D. A., Campuzano-Jost, P., Jimenez, J. L., Guo, H., Weber, R. J., de Gouw, J., Koss, A. R., Edgerton, E. S., Brune, W., Mohr, C., Lopez-Hilfiker, F. D., Lutz, A., Kreisberg, N. M., Spielman, S. R., Hering, S. V., Wilson, K. R., Thornton, J. A., and Goldstein, A. H.: Monoterpenes are the largest source of summertime organic aerosol in the southeastern United States, P. Natl. Acad. Sci. USA, 115, 2038–2043, https://doi.org/10.1073/pnas.1717513115, 2018.
Zhao, Y., Hennigan, C. J., May, A. A., Tkacik, D. S., De Gouw, J. A., Gilman, J. B., Kuster, W. C., Borbon, A., and Robinson, A. L.: Intermediate-volatility organic compounds: A large source of secondary organic aerosol, Environ. Sci. Technol., 48, 13743–13750, https://doi.org/10.1021/es5035188, 2014.