the Creative Commons Attribution 4.0 License.
the Creative Commons Attribution 4.0 License.
 | 22 Jul 2022
Impact of turbulence on aeolian particle entrainment: results from wind-tunnel experiments
Jie Zhang
Li Shi
Ning Huang
We hypothesize that large eddies play a major role in the entrainment of aeolian particles. To test this, wind-tunnel experiments are carried out to measure the particle entrainment rate for various sizes and flow conditions. Wind-tunnel flows are usually neutrally stratified with no large eddies, which are typically seen in convective atmospheric boundary layers. Here, a novel technique is applied, by deploying a piece of randomly fluttering cloth, to generate large eddies similar to convective eddies, here referred to as quasi-convective turbulence. The characteristics of quasi-convective turbulence are analyzed with respect to neutral turbulence in the Monin–Obukhov similarity framework, and the probability distributions of surface shear stress are examined. We show that for a given mean flow speed and in comparison with neutral flow conditions, quasi-convective turbulence increases the surface shear stress and alters its probability distribution and hence substantially enhances the entrainment of sand and dust particles. Our hypothesis is thus confirmed by the wind-tunnel experiments. We also explain why large eddies are important to aeolian entrainment and transport.
- Article
(2176 KB) - Full-text XML
- BibTeX
- EndNote


The entrainment of sand and dust particles is among the most important quantities to determine in aeolian studies. Based on Bagnold (1941), Owen (1964) showed that the vertically integrated saltation flux Q can be expressed as
where c0 is the Owen coefficient, ρ air density, g acceleration due to gravity, u* friction velocity and u*t threshold friction velocity. By definition, is a descriptor of the surface shear stress τ. Although challenged by some researchers (e.g., Martin and Kok, 2017), it has been shown in numerous studies that Eq. (1) is valid in general, but c0 scatters over a wide range if Eq. (1) is fitted to Q observations (Gillette et al., 1996, 1997; Leys and McTainsh, 1996; Liu et al., 2018). While the large scatter of c0 is not yet fully explained, it is most likely because both u* and u*t are stochastic variables, and hence saltation driven by atmospheric-boundary-layer (ABL) flows is also turbulent (Butterfield, 1991, 1998). In this sense, Eq. (1) is valid only for mean quantities, and , if we assume u*t is constant (this assumption is sufficient for the purpose of our study, but see Shao, 2008, Raffaele et al., 2016, Liu et al., 2018 and Li et al., 2020 for discussions on u*t as a stochastic variable).
Our question here is how turbulence influences aeolian processes, especially the entrainment of sand and dust particles into the atmosphere. Numerous studies on aerodynamic sand and dust entrainment have been carried out (e.g., Greeley and Iversen, 1987; Anderson and Haff, 1988, 1991; Loosmore and Hunt, 2000; Doorschot and Lehning, 2002; Jia and Wang, 2021), but in most of these studies, flow is assumed to be steady, and the effect of turbulence on the entrainment is not accounted for. In reality, the flows and flow-driven aeolian processes are both impossible to stabilize. Although people can analyze the relevant average variables, the existence of nonlinear relations (e.g., Eq. 1) makes it difficult to determine the quantitative relations between the average variables. Butterfield (1991, 1998) investigated the behavior of saltating grains in unsteady flows and found that both the frequency and strength of wind gusts influence the rate of sand transport. Stout and Zobeck (1997) observed that saltation intermittently occurs even when , a phenomenon known as saltation intermittency. Xuan (2004) reported that turbulence decreases u*t or the threshold wind velocity ut and increases saltation intensity and the dust entrainment rate. Klose and Shao (2012) and Klose et al. (2014) developed a parameterization scheme for dust emission by convective turbulence and explained how dust emission can be produced by large eddies in weak mean wind conditions. Based on extensive field measurements, Comola et al. (2019) showed that neglecting saltation intermittency causes biases in the model estimated saltation fluxes. Shao et al. (2020) reported that saltation in unstable ABLs is generally more fully developed than in stable ABLs.
Saltation intermittency in the sense of Stout and Zobeck (1997) is a special case of saltation fluctuation at , with being the time-averaged friction velocity. In general, if (where is the u* derivation from ) and , then we have with . The saltation intermittency Stout and Zobeck (1997) studied is for the case and but . The above discussion suggests that the turbulent (or probabilistic) behavior of u* is of great importance to Q and naturally also to sand and dust entrainment. Because the turbulent behavior of u* is closely related to ABL turbulence, our hypothesis is thus that ABL turbulence significantly influences the entrainment of sand and dust particles.
In stable and neutral ABLs, turbulence is generally weak and more homogeneous and isotropic, but in unstable (or convective) ABLs, turbulence is generally strong due to buoyancy production of turbulent kinetic energy and less homogeneous and isotropic due to the structure of large eddies. It is thus particularly interesting to study the influences of convective turbulence on aeolian processes. Khalfallah et al. (2020) pointed out that dust particle size at emission is dependent on ABL stability. Shao et al. (2020) compared some features of saltation and dust emission in convective and stable ABLs based on the field observations of the Japan-Australian Dust Experiment (JADE; Ishizuka et al., 2008, 2014), but due to the limitations of the field measurements, the role of turbulence in aerodynamic sand and dust entrainment could not be explicitly examined. We are thus motivated to acquire additional data to test our hypothesis.
Wind tunnels are a powerful tool for studying aeolian problems under controlled flow conditions (e.g., Rasmussen and Mikkelsen, 1991; Alfaro et al., 1997; Brown et al., 2008; Zhang et al., 2014). Although several methods have been proposed to generated turbulence in wind tunnels, including spires, roughness elements and grids, all these methods are designed to increase the intensity of turbulence in neutral ABLs but are inadequate for generating large eddies similar to those commonly seen in convective ABLs. Generating convective turbulence in wind tunnels usually requires the use of additional thermal forcing from the surface (e.g., EnFlo stratified flow wind tunnel, Hancock et al., 2013; Hancock and Farr, 2014; Hancock and Zhang, 2015; Hancock and Hayden, 2018), temperature control of recirculating air and floor panels (e.g., Inagaki et al., 2012; Zhang et al., 2013; Kanda and Yamao, 2016), and thermally stratified wind tunnels (e.g., Marucci et al., 2018; Marucci and Carpentieri, 2020). Applying surface heating normally requires a very large wind tunnel. To the best of our knowledge, studying the effect of convective eddies on aeolian processes has never been done in wind-tunnel experiments, mainly because we have so far no adequate means to generate convective turbulence in a wind tunnel for aeolian experiments. Here we apply a simple forced-perturbation technique (using a piece of randomly fluttering cloth) to generate quasi-convective turbulence, namely, turbulence in a neutrally stratified flow but with characteristics of convective turbulence. Aerodynamic sand and dust entrainment rates under various mean-wind and quasi-convective turbulence conditions are measured. We use these wind-tunnel data to study how and why turbulence influences the aerodynamic sand and dust entrainment rate.
We carried out the experiment in the Lanzhou University wind tunnel, which is specially designed for aeolian studies. The technical details of the wind tunnel can be found in Zhang et al. (2014), and hence only the most relevant information is given here. Figure 1 shows the wind-tunnel configuration for the experiment. The working section of the tunnel is about 15 m long, with the first 6 m being the roughness-element section for generation of a turbulent boundary layer. The remaining section is covered by 40-grit sandpaper to simulate a non-erodible sandy surface. One end of the piece of cloth is attached to a horizontal bar located 6 m downstream the roughness-element section and 0.7 m above the tunnel floor, and the other end is allowed to flutter freely. The cloth is a woven fabric (grammage 200 g m−2) with a size of 1 m in width and 1.5 m in length. The cloth size was empirically determined by a series of tests before the formal experiment, to satisfy the requirement on generating quasi-convective turbulence. Two sand trays (285 mm wide, 150 mm long and 13 mm deep, which have been tested as a suitable option for the study of aerodynamic entrainment Li et al., 2020) are placed 1.5 m downstream of the end of the fluttering cloth. The trays filled with sand are mounted flush to the tunnel floor. The sand surface is smoothed before every test. Each tray is weighted before and after each test by an electronic balancer with a precision of 0.01 g in the range 5 kg, to determine the net mass loss of the tested surface. The anemometers, including the hot-wire anemometer (1-D, fixed at 10 mm height and employed only in clear air condition) and the wind profiler (combined by nine pitot tubes and placed at the levels of 6.5, 10, 15, 30, 60, 120, 201, 351 and 501 mm), were located between the trays. The outer diameter of the pitot tubes of the wind profiler is 1 mm, and the inner diameter is 0.5 mm. The wind profiler measures the profile of the mean flow speed with a sampling frequency of 1 Hz, while the hot-wire anemometer measures turbulent fluctuations with a sampling frequency of 1000 Hz. An Irwin sensor is mounted on the central axis of the wind-tunnel floor and is located upwind of the tray. Irwin sensors (Irwin, 1981) are omnidirectional devices for measuring the surface shear stress, which have been used successfully in a number of earlier studies (e.g., Wu and Stathopoulos, 1993; Walter et al., 2012). We manufactured the Irwin sensors used in this study ourselves according to the dimensions given in Gillies et al. (2007), as shown in Fig. 1c. The Irwin-sensor pressure differences are sampled at a frequency of 100 Hz using a Scanivalve attached to a pressure transducer (ZOC33). Prior to the wind-tunnel experiment, the Irwin sensors are calibrated in the wind-tunnel against the wind profiler for various flow conditions.
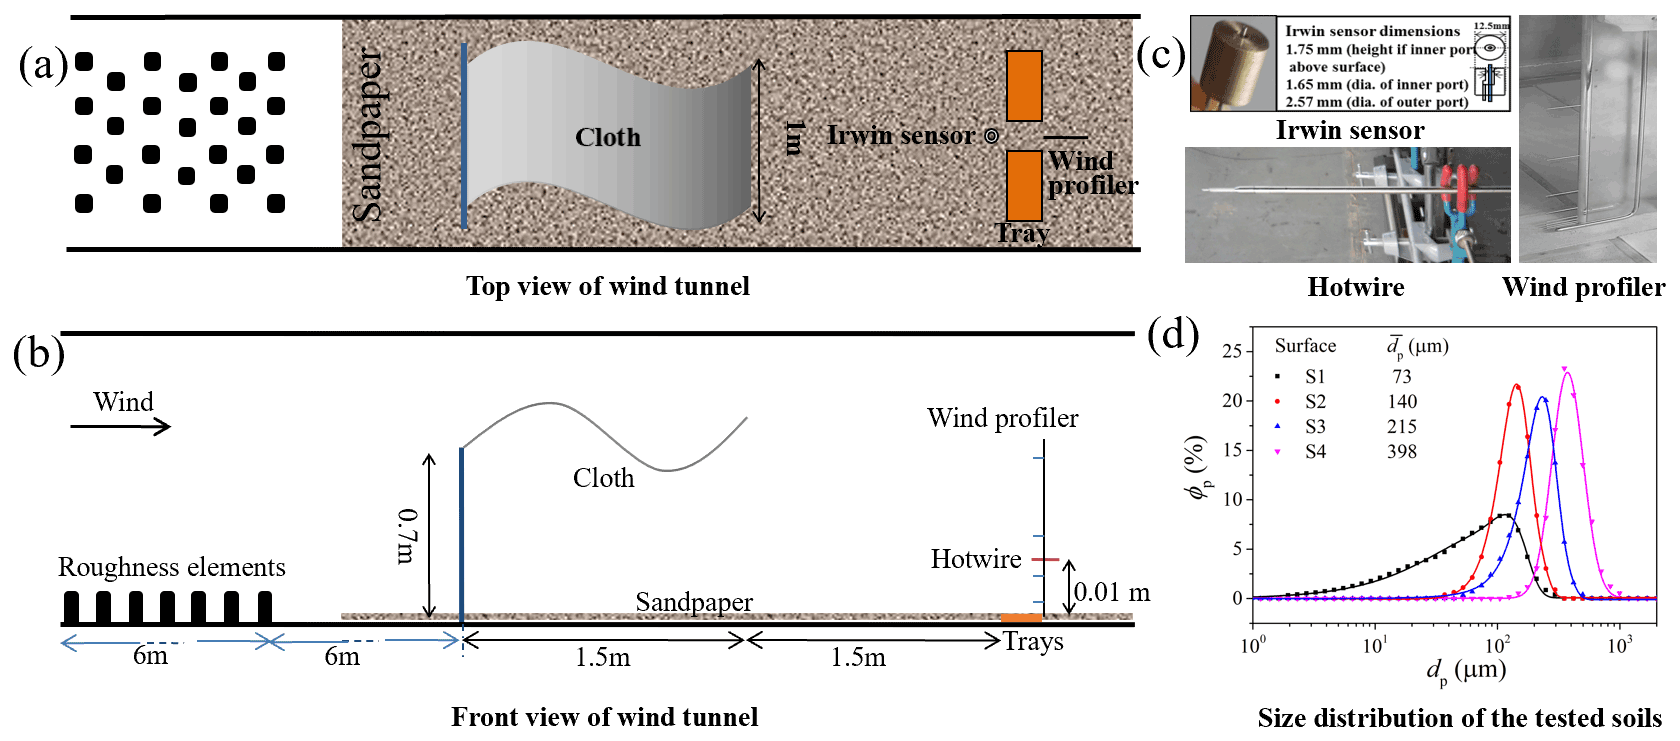
Figure 1(a) Top view of the wind-tunnel configuration. (b) Side view of the wind-tunnel configuration, where a piece of randomly fluttering cloth generates quasi-convective turbulence. (c) The probes employed. The Irwin sensor has a diameter of 12.5 mm. Its inner port has a diameter of 1.65 mm and a height of 1.75 mm, and its outer port diameter is 2.57 mm. (d) The size distributions of four tested soils, where ϕp is the volume fraction, and dp is the particle diameter.
A key requirement for our experiment is to generate turbulence in the wind tunnel with characteristics similar to convective turbulence. In convective ABLs, large eddies develop due to the buoyancy production of turbulent kinetic energy. While horizontal velocity fluctuations are approximately Gaussian-distributed, vertical velocity fluctuations are typically non-Gaussian with a positive skewness, resulting in a positive skewed probability distribution of surface shear stress. As already discussed, convective turbulence is difficult to generate in wind-tunnel flows which are usually neutrally stratified. Here, we use a “forced perturbation” technique to generate turbulence in the wind-tunnel flow, that mimics convective turbulence with energy-containing large eddies and positively skewed velocity probability distribution function (PDF). Such turbulence is referred to here as quasi-convective turbulence. Forced perturbation is achieved using a piece of cloth which flutters (rapid and lightly swing) randomly in the wind-tunnel flow to produce small eddies and flaps with a longer period and greater amplitude to produce large eddies, superposed on the background turbulence. Although quasi-convective turbulence is not the same as convective turbulence, the forced-perturbation method is both simple and efficient to remedy the critical deficit of wind-tunnel flows which lack large eddies with skewed structures.
The wind tunnel is a blow tunnel, with the inlet flow speed controlled by a rotating fan. For our experiment, the fan speed is fixed for each run between 7000 and 12 000 rpm with an interval of 1000 rpm, and the corresponding inlet free wind speed is between 7.7 and 13.7 m s−1. We call the runs with forced perturbation WP runs and those with no forced perturbation NP runs. The entrainment rates are measured for various flow and turbulence combinations, as listed in Table 1. For each run, at least three successful repetitions are made, and the measurement period for each repetition is 5 min. Four different soils are used in the experiment, labeled S1–S4. The mean particle size of the four soils is, respectively 75, 140, 215 and 398 µm. The particle size distributions are approximately lognormal, as shown in Fig. 1d, measured by a Microtrac S3500 laser diffractometer (Microtrac, Montgomeryville, USA). We use NP70_S1 to denote the NP run for fan speed 7000 rpm and soil S1, and following this convention, we name the other runs.
Table 1Summary of wind-tunnel experiments.
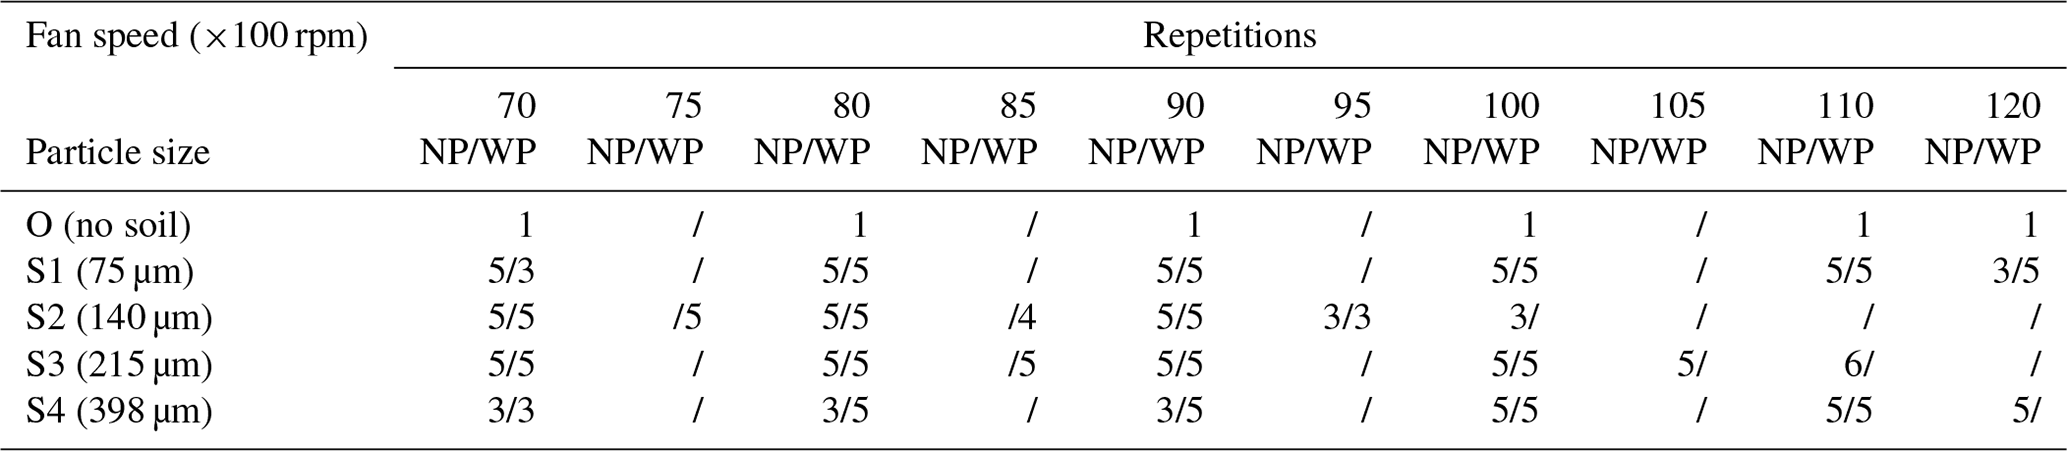
Note that NP – no cloth and WP – with cloth. The tests of 0.5 × 1000 rpm are supplementary. In the case of large surface shear, the erodible surface (S2 and S3) rapidly appeared to be concave, which could affect the test results. We therefore added several tests for low surface shear.
3.1 Forced perturbation
We first examine whether turbulence generated using the forced-perturbation technique has the desired features of convective turbulence. In Fig. 2, the characteristics of V10 mm (horizontal flow velocity in height of 10 mm sensed by the hot-wire anemometer) are compared between the NP70_O and WP70_O runs, including its time series, PDF and power spectrum. As V10mm is measured using a one-dimensional hot-wire anemometer, it is the resultant velocity of its horizontal component, u10 mm, and vertical component, w10 mm. As seen, the forced-perturbation technique effectively generates quasi-convective turbulence, as turbulence for the WP70_O run has an increased variance and a positive skewness, while turbulence for the NP70_O run is weaker and almost Gaussian-distributed. It is shown that the effect of cloth not only enhances the average value of instantaneous wind speed, but also causes the probability of strong wind to increase in the distribution of instantaneous wind speed. While depending on the fluttering mode of the cloth, the quasi-convective turbulence has coherent structures as observed in convective ABLs (Liu and Zheng, 2021). As our main interest is how convective eddies affects aeolian particle entrainment, we did not study the intrinsic mechanisms of how cloth induces large eddies.
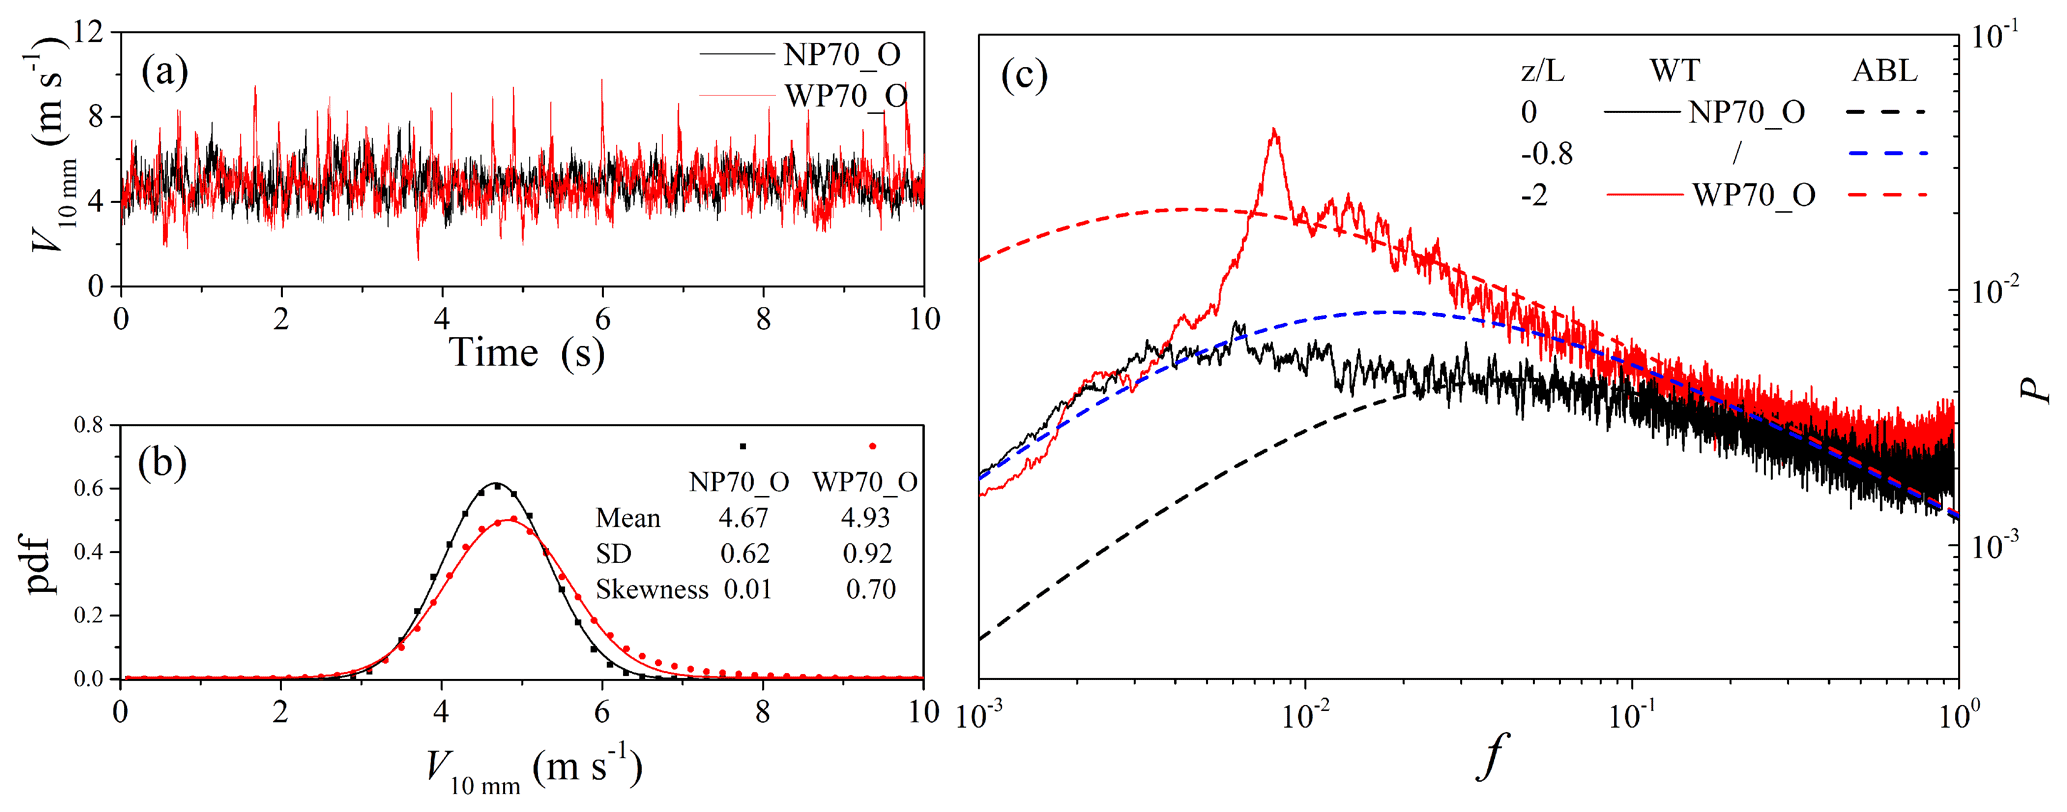
Figure 2(a) A section of 10 s of the V10 mm time series for the NP70_O and WP70_O runs, (b) probability density functions of V10 mm (estimated using a time series of 300 s) and (c) normalized power spectra of V10 mm for WP70_O and NP70_O compared with field-observed power spectra in the atmospheric boundary layer (Kaimal et al., 1972). Z0WT is 1.33 × 10⁻² mm, and Z0ABL is set to 3.10 mm (Wiernga, 1993).
In the MOST (Monin–Obukhov similarity theory) framework, , with z being height and L the Obukhov length, is used as a measure of ABL stability: the ABL is stable, neutral and unstable if ζ>0, =0 and <0, respectively. Kaimal et al. (1972) examined the characteristics of surface-layer turbulence using the MOST and found that the nondimensionalized power spectra of ABL quantities collapse to universal functions, with ζ being the only parameter. They showed that as the ABL stability decreases, the inertial subrange extends to lower frequencies. Plotted in Fig. 2c are the normalized power spectra of V10 mm for NP70 and WP70, denoted as PNP70 and PWP70, respectively. Following Kaimal et al. (1972), we express the normalized frequency as (with n being frequency) and normalized energy spectral density as
with S being the energy density per frequency and ϕϵ the MOST similarity function for the dissipation rate of turbulent kinetic energy:
Following Kaimal and Finnigan (1994), our analysis does not involve the cases of ζ>0. For the wind-tunnel runs, nS(n) is obtained by analyzing the horizontal wind velocity component measured by the hot-wire anemometer, is measured by the Irwin sensor and ϕϵ is calculated using Eq. (3) with ζ=0 for the NP70_O run and for the WP70_O run. For comparison, the ABL velocity power spectra, denoted as PABL, for three different stabilities ζ=0, −0.8 and −2 are plotted. The empirical form given by Kaimal et al. (1972),
is used, where a is an empirical constant set to 1, 0.4 and 0.1 for ζ=0, −0.8 and −2, respectively. In Fig. 2c, is plotted, where z0WT is the roughness length for the wind-tunnel flows and z0ABL that for the field ABL flows. The ratio is the MO number which was excluded in Kaimal et al. (1972). The exclusion is justified because the differences in z0 in their data are not large. However, because z0WT (Table 2) is 2 orders of magnitude smaller than z0ABL, the effect of needs to be considered, and hence the mentioned multiplication is necessary.
Figure 2c reveals that PNP70 and PWP70 are almost the same in the (normalized) frequency range of , as turbulence in this frequency range is attributed to the upstream roughness elements. They are also the almost the same in the high-frequency range of f>0.1. In the energy-containing range , PWP70 shows much increased energy with respect to PNP70, implying that the forced-perturbation technique generated large eddies in the wind-tunnel flow.
Figure 2c also shows that it is generally difficult for the wind tunnel to reproduce the turbulence observed in the ABL. Clearly, compared with and , PNP70 lacks energy in the frequency range of . In contrast, power spectral density in this frequency range is substantially increased if forced perturbation is applied as a comparison of PWP70 and PNP70 reveals. It is seen that PWP70 is fairly similar to , although it still lacks energy for . In summary, Fig. 2 shows that the forced-perturbation technique is effective in generating quasi-convective turbulence, which has a degree of similarity with ABL convective turbulence. This simple technique can be further optimized (e.g., using a combination of fluttering cloths of different materials and different dimensions) to overcome the critical lack of convective eddies in wind-tunnel flows, which has so far seriously limited the usefulness and generalization of the wind-tunnel results.
3.2 Mean wind profile and shear stress
Figure 3 shows the mean wind profiles measured using the pitot tubes. For height z smaller than 0.2 m, the mean wind profiles for both NP runs and WP runs are approximately logarithmic. In the WP runs, the flow speed for z>0.2 m is reduced due to the fluttering cloth which acts as a momentum sink. For z<0.2 m in WP runs, the air flow seems to be accelerated (∼ 0.5 m s−1). It could be a wind-tunnel artifact associated with a small degree of compression of the flow that was redirected beneath the cloth and between the confining walls. For a given fan speed, the fluttering cloth not only enhances the turbulent kinetic energy (Fig. 2), but also modifies the wind profile for z<0.2 m, which will be proved by the following analysis.

Figure 3Mean flow speed profiles for different runs. For all cases, the wind-tunnel floor is covered by sandpaper. The trays filled with particles and mounted flush to the tunnel floor do not affect the measured profiles.
Based on the MOST, the similarity relationship between the mean flow speed and height z, can be expressed as
where κ is the von Karmen constant, and
and
are the similarity functions. For ABL flows, γm=16 is an empirical coefficient (Businger et al., 1971). For the NP runs, Ψm=0 is assumed. By fitting Eq. (5) to measured at z<0.2 m, we estimate and z0. The shear stress (here, air density ρ=1.2 kg m−3) is then used to calibrate the shear stress measured using the Irwin sensor, . But if Ψm is set to 0 for the case of WP, the obtained u* obviously diverges from the data of Irwin sensor. Only when a nonzero Ψm is considered, does the deduced u* agree with the data of Irwin sensor (Table 2). That is why we state that the wind profile for z<0.2 m modifies to be more similar to the one in convective ABL. As both γm and L are unknown for the quasi-convective turbulent flows, it is sensible to write Eq. (7) as
with . By combining the measurements at z<0.2 m and the shear stress measured using the Irwin sensors for the WP runs, ηm can be estimated. The results are summarized in Table 2.
Table 2Friction velocity and roughness length z0 estimated for runs with and with no forced perturbation and different wind-tunnel fan speeds (R2=99 %). The Irwin sensor is calibrated based on the data of wind profiles under the NP condition.
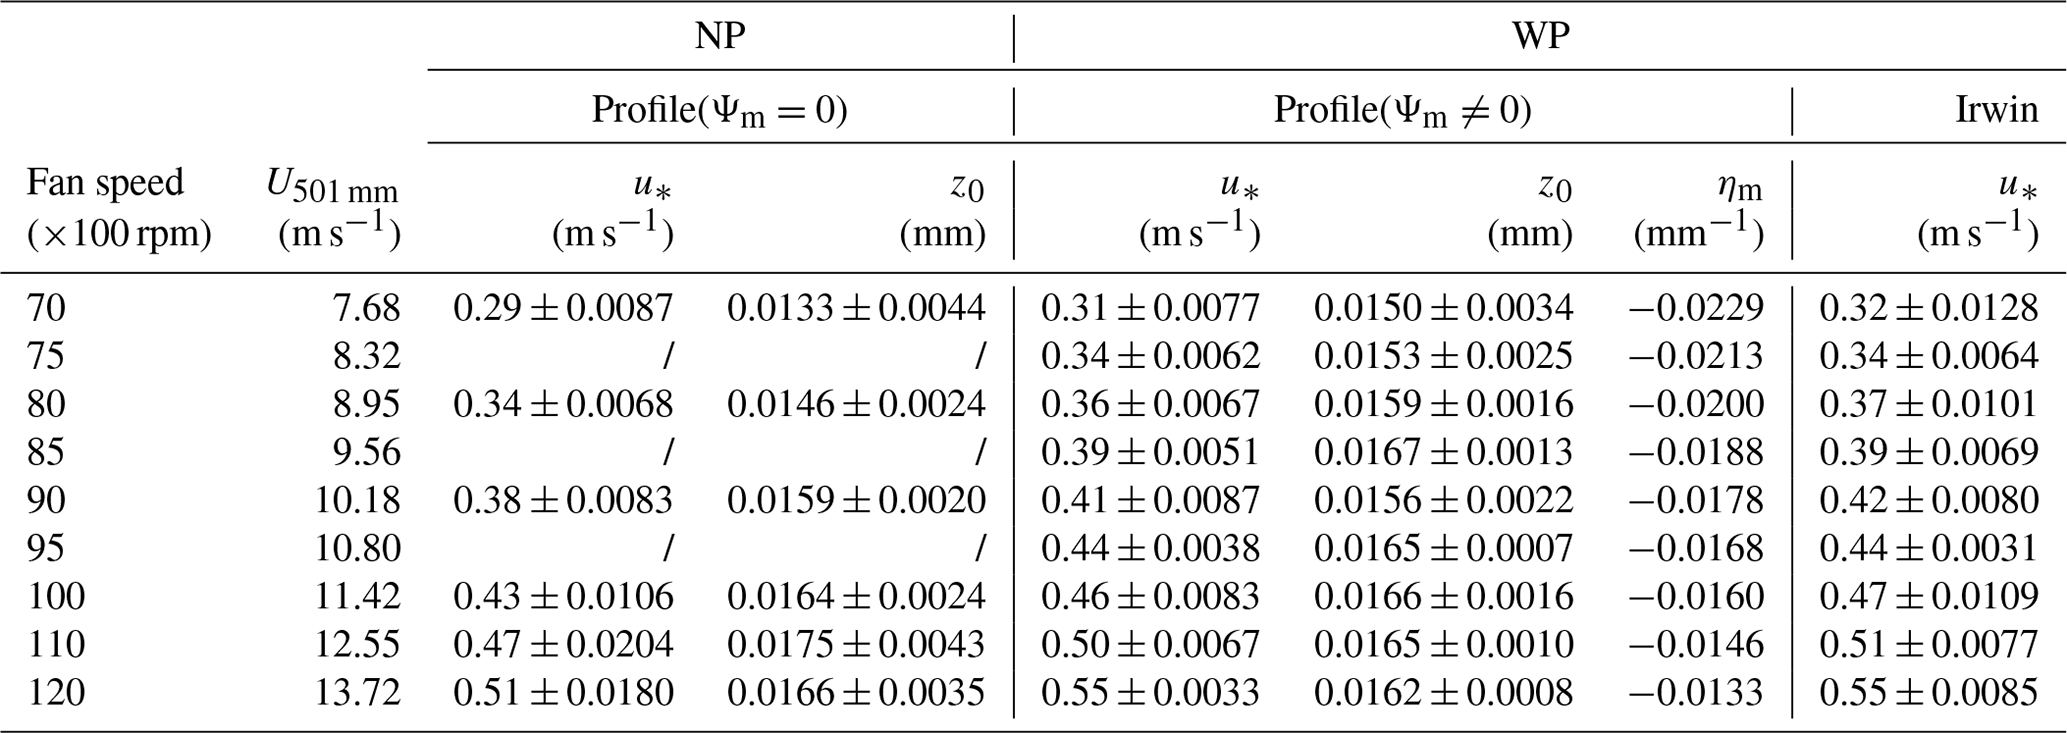
Table 2 shows that forced perturbation leads to an increased , corresponding to an increase of by about 22 % at a fan speed of 7000 rpm and about 16 % at a fan speed of 12 000 rpm. As pointed out in several earlier studies (Klose and Shao, 2012; Li et al., 2020; Shao et al., 2020), we emphasize again that surface shear stress τ is a stochastic variable, which satisfies a probability distribution function p(τ). To facilitate discussions, we explicitly write
with τ′ being the perturbation of τ.
3.3 Aeolian particle entrainment in quasi-convective turbulence
The entrainment rate of sand and dust particles F is estimated from the mass loss of the trays as
where Δmi is the net mass loss (integrated over ΔTi) from the tray during the ith run with run time ΔTi, A is the tray surface area and I is the number of repetitions. Figure 4 shows the entrainment rates of the various particle-size groups measured in the NP and WP runs. It is seen that for all four soils, for a given , the entrainment rates for the WP runs are substantially larger than those for the NP runs. This result suggests that in addition to the mean surface shear stress , the surface shear stress perturbations τ′ significantly influence the entrainment rate. It shows that the slight increase of in quasi-convective conditions is not sufficient alone to explain the measured differences in the entrainment rates of the four soils. It implies that the perturbations of the shear stress τ′ are also responsible for a part of the differences in the entrainment rates. As τ′ is related to the structure of boundary-layer turbulence, it can be said that the structure of boundary-layer turbulence also influences the entrainment rate: for a given mean surface shear stress, convective turbulence is more efficient in lifting particles from the surface into the air. This finding is consistent with the observations of the Japan-Australian Dust Experiment (JADE; Shao et al., 2020); i.e., aeolian sand transport and dust emission are much more intensive in convective ABLs than in stable ABLs.
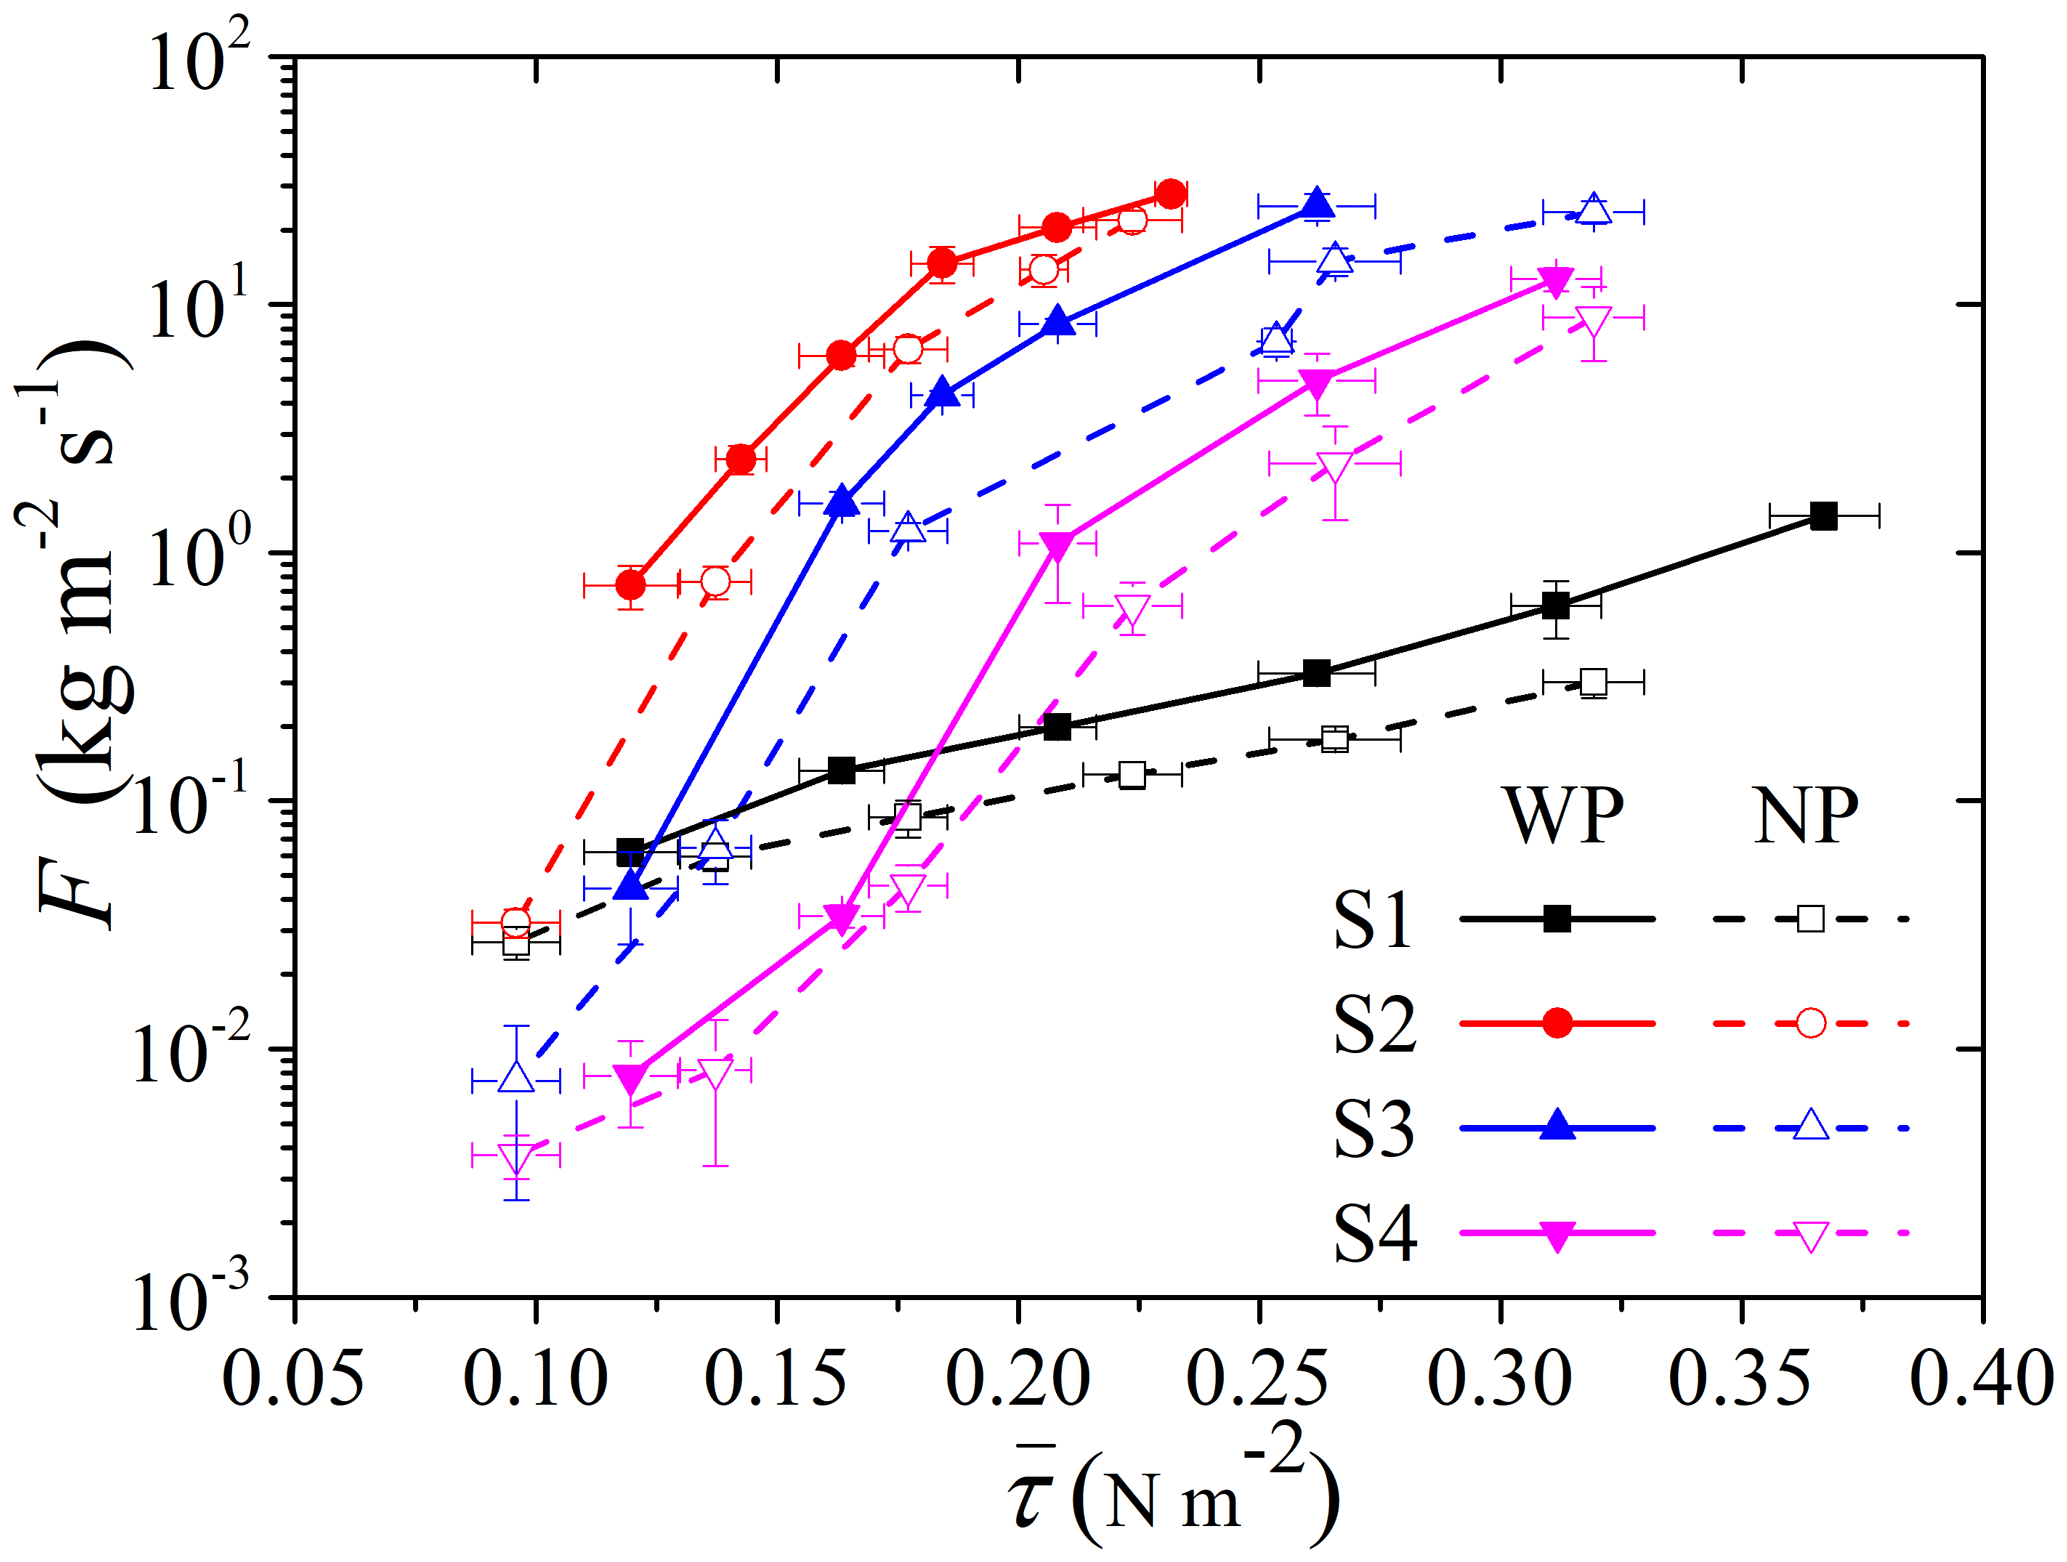
Figure 4Entrainment rate of four different soils observed in the NP and WP runs. Open symbols represent the NP runs and solid symbols the WP runs.
Using the τ measurements of the Irwin sensor, we estimate the PDF of τ, p(τ). Klose et al. (2014) and Shao et al. (2020) suggested that p(τ) is approximately Weibull-distributed and positively skewed:
where K is the shape parameter, and λ is the scaling parameter.
Figure 5 shows as an example p(τ) for the NP and WP runs for a fan speed of 7000, 9000 and 12 000 rpm. As seen, the forced perturbation results in significantly different PDF of τ by slightly increasing and clearly increasing the probability of large τ. It is this increase in the probability of large τ that explains the differences in the dependency between the NP and WP runs seen in Fig. 4.
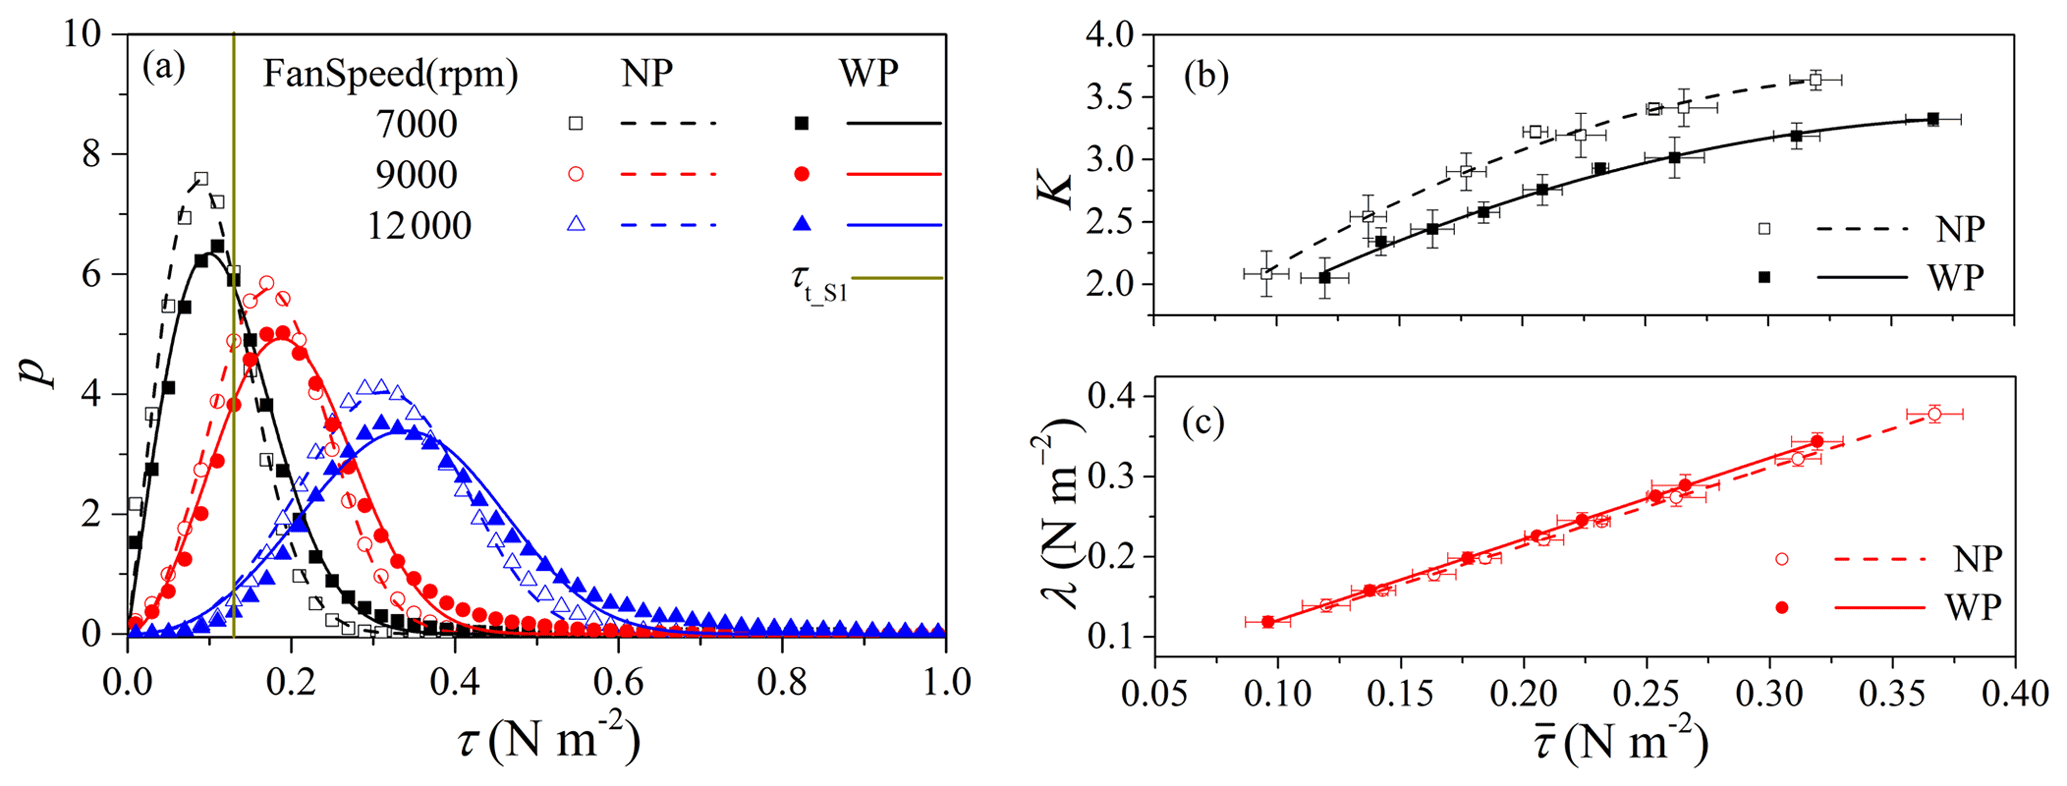
Figure 5(a) Probability density function of surface shear stress τ for NP and WP runs with a fan speed of 7000, 9000 and 12 000 rpm. The dashed gray line marks the threshold shear stress for S1 (τt_S1). The symbols are the results from the Irwin sensors and curves the Weibull distributions. By fitting Eq. (11) to the respective data of the various runs, the corresponding shape parameter K and scaling parameter λ are estimated and plotted against the mean shear stress in (b) and (c), respectively. The curves are polynomial fits. In (b), the solid black line shows and the dashed black line . In (c), the solid red line shows and the dashed red line .
The structure of ABL turbulence, reflected here in p(τ), significantly influences the sand and dust entrainment and saltation fluxes because this depends non-linearly on τ. As explained in Shao (2008, Sect. 6.12.4), for a given particle size, the entrainment rate can be expressed as
with γ being an empirical efficiency parameter for particle entrainment, and τt is the threshold shear stress for particle entrainment. The threshold is in general a stochastic variable (Raffaele et al., 2016; Liu et al., 2018), but for simplicity, we assume it is constant for given particle size. To account for the fluctuations of τ, we estimate
For the four soils tested, S1, S2, S3 and S4, τt is estimated to be 0.13, 0.27, 0.31 and 0.37 N m−2, respectively. Figure 6 shows that Eq. (12) fits well to the measurements for all runs. Equation (12) reveals that convective turbulence may influence both the efficiency parameter, γ, and the statistical behavior of the term, . To facilitate discussion, we rewrite Eq. (12) as
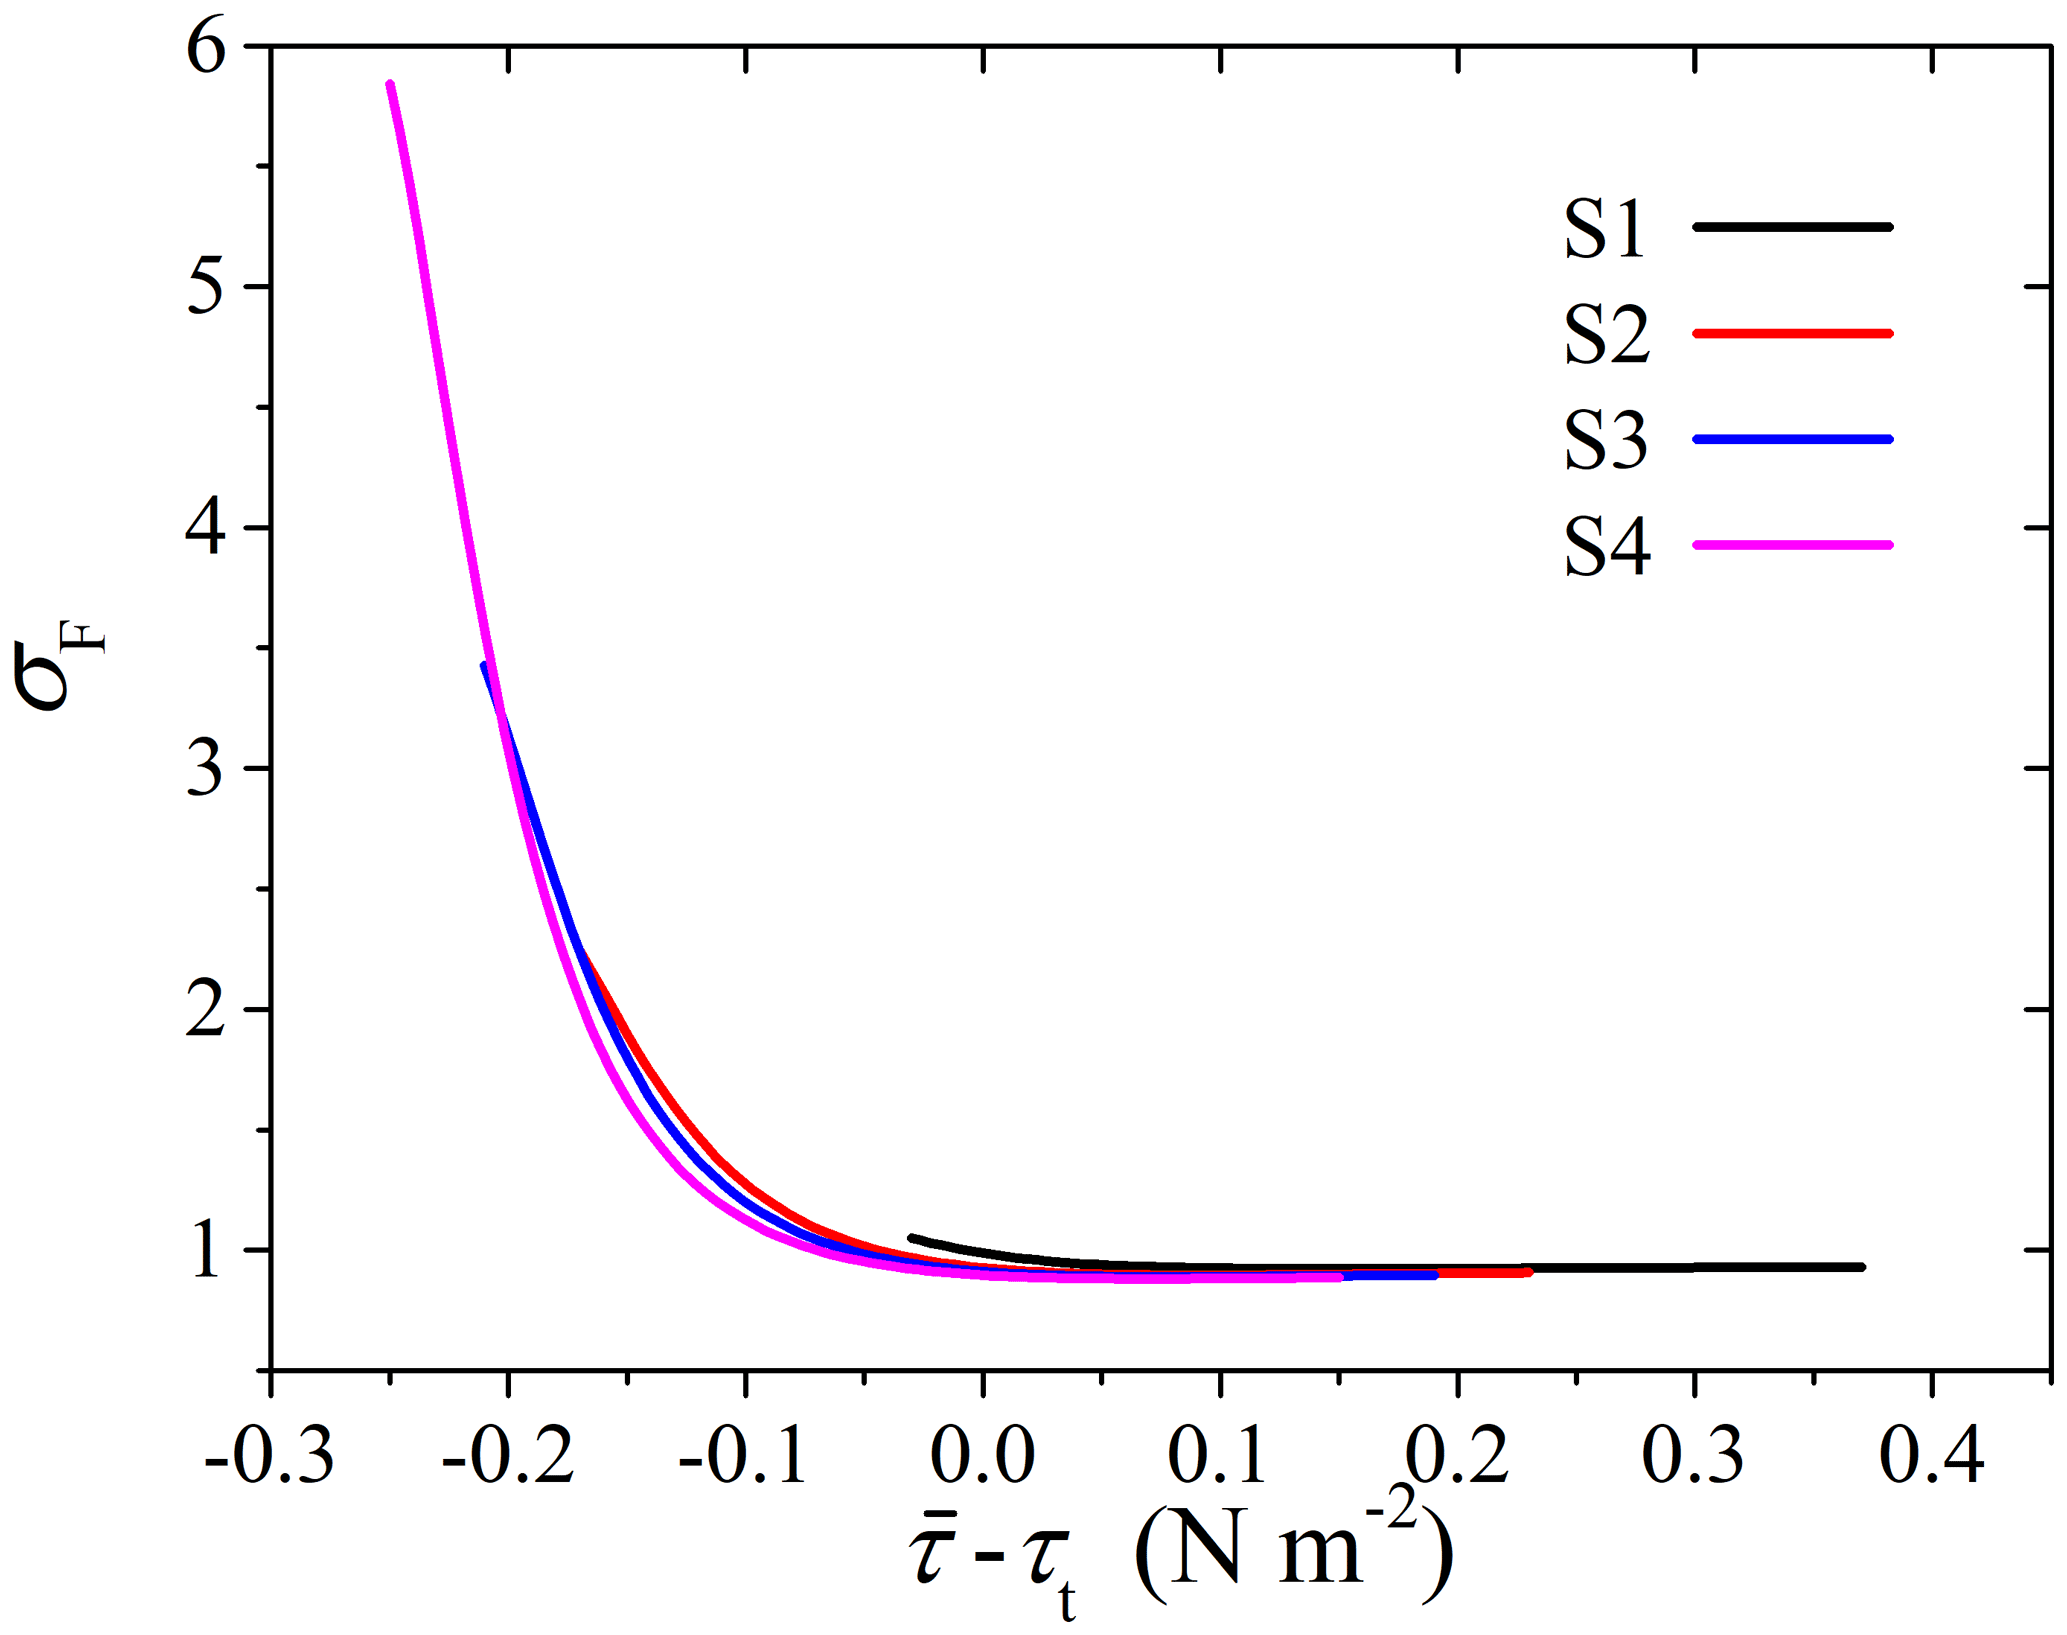
A comparison of for NP and WP runs is shown in Table 3. It is seen that is significantly increased for the WP runs. The low value of for S1 is supposed to be caused by the wide distributed particle size, leading to an increased mean threshold friction velocity when wind speed increases, which means a constant threshold is not suitable in this situation. However, this is beyond the scope of this work, which mainly focuses on the comparison of the WP and NP conditions. Thus, we estimate the ratio σF defined as
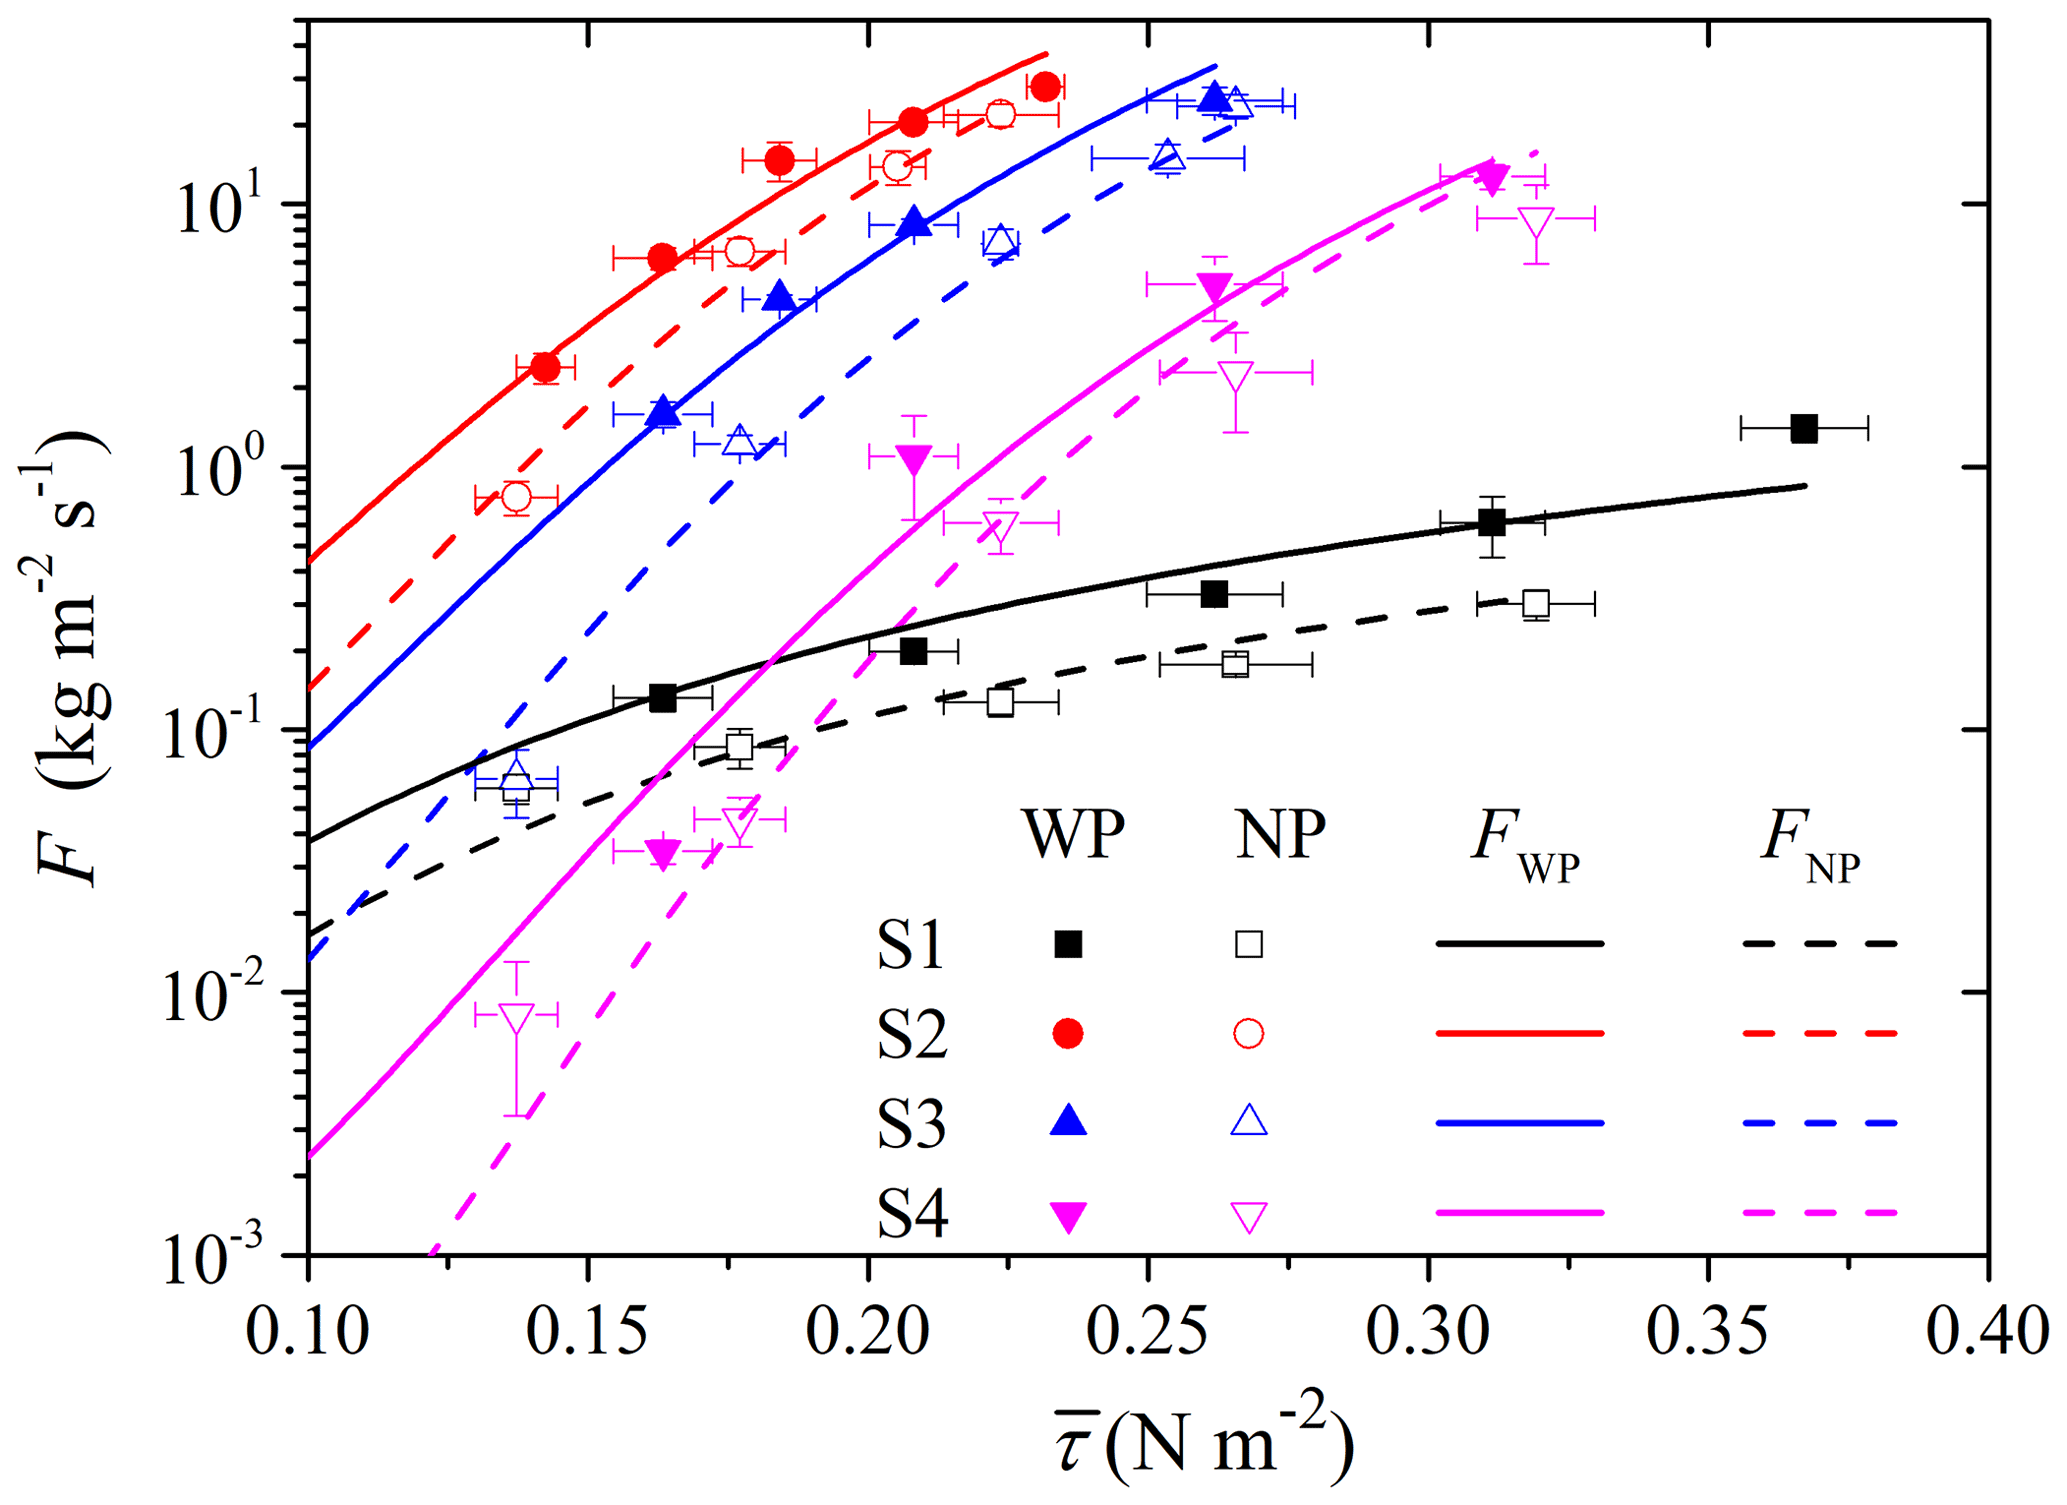
Figure 6Estimated entrainment rates with and without forced perturbation. The dots are experimental data, and lines derive from Eq. (12).
Table 3Threshold shear stress τt and empirical parameter γ for test surfaces.
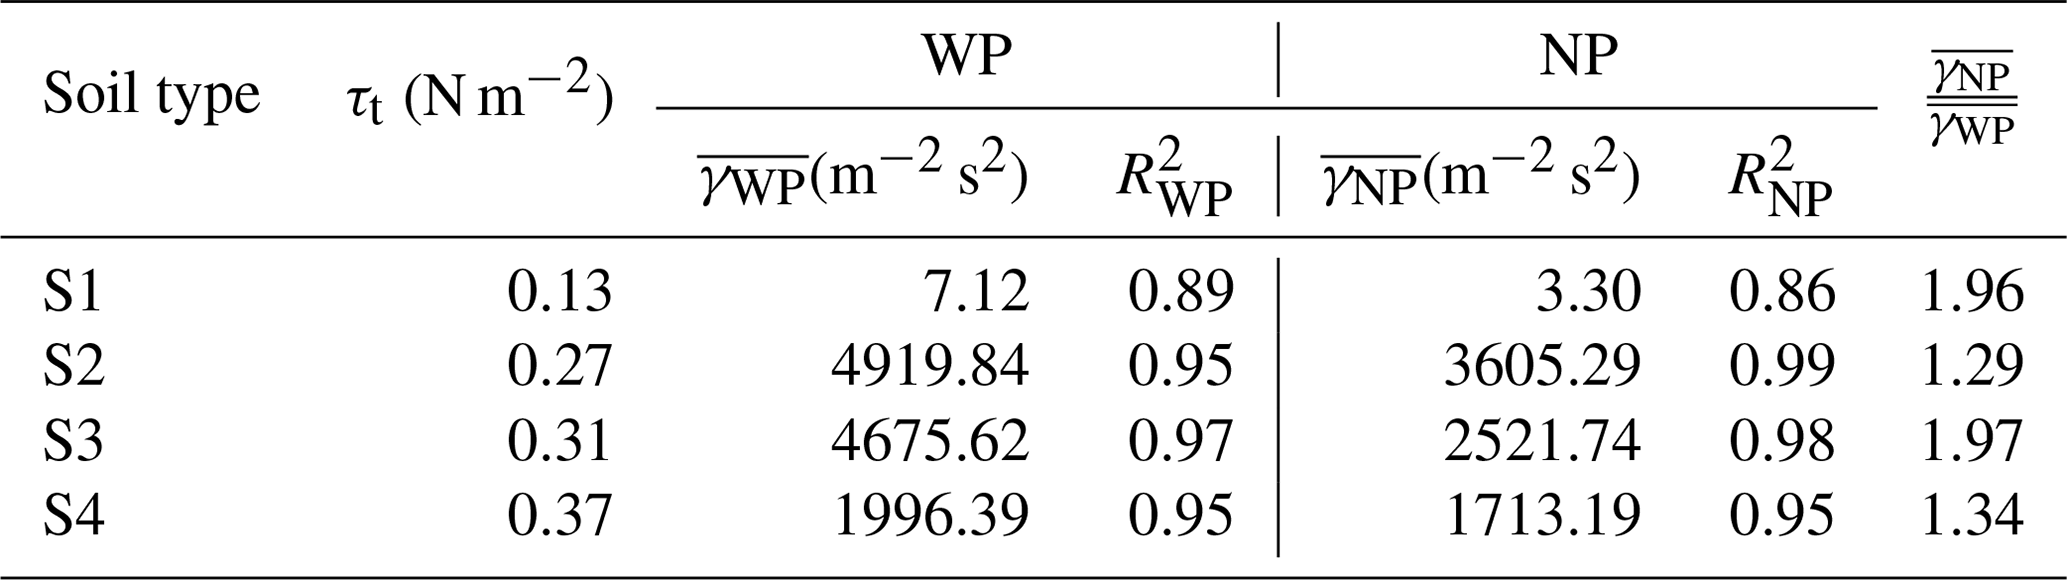
Figure 7 shows the relationship between σF and excess surface shear stress (). A negative exponential law appears to exist. For the conditions with (corresponding to the continuous entrainment defined by Li et al., 2020), σF is close to 1, indicating relatively small influence from the quasi-convective turbulence. But for the conditions with , σF significantly increase with decreasing , reaching up to 6 at N m−2, indicating that the influence of convective turbulence is significant (corresponding to the intermittent entrainment defined by Li et al., 2020). We can thus conclude that convective turbulence may significantly enhance dust entrainment by altering how shear stress acts on the surface, especially for the cases of intermittent entrainment when the mean shear stress is below the threshold. Considering that the lower-than-threshold wind conditions may have a high temporal weight in natural conditions, we believe that this effect deserves particular attention in dust emission schemes.
We carried out wind-tunnel experiments and studied the influences of turbulence structure on aerodynamic entrainment of sand and dust particles. We considered τ to be a stochastic variable and showed that the probability distribution of τ (i.e., p(τ)), in addition to the mean surface shear stress , has a significant impact on aeolian fluxes, as the entrainment rate of sand and dust particles depends non-linearly on surface shear stress, τ. Because the fluctuations of τ are closely related to the structure of ABL turbulence, aeolian fluxes in ABLs of different stabilities can be substantially different even if is the same. The wind-tunnel experiments provided direct data which show that ABL convective large eddies are of particular importance to the entrainment of sand and dust particle, as they not only increase the mean shear stress on the surface, but also increase the probability for instantaneous shear stress to exceed the threshold, leading to intermittent entrainment.
Wind-tunnel flows are normally neutrally stratified and do not contain large eddies similar to those in convective ABLs. By examining the power spectra of turbulence for the NP runs, we showed that wind-tunnel turbulence lacks energy-containing eddies, even compared with ABL flows in neutral conditions. Although advanced techniques for measuring turbulence structure and intensity associated with sediment entrainment and transport have been developed in the past few decades, some focusing on the effects of gusting wind (e.g., Li and McKenna Neuman, 2012; Li and Neuman, 2014), few studies have been done focusing on the effects of ABL convective turbulence. Also, means for generating large-scale eddies (not necessarily convective large eddies) in wind-tunnel simulations for wind engineering applications have not been widely used in aeolian studies due to their complexity and high operational cost. We showed that the deployment of a piece of fluttering cloth is both simple and effective in generating quasi-convective turbulence. By comparing the power spectra of turbulence for the WP runs and NP runs, we found that the energy density in the eddy-energy-containing range is substantially increased. The energy spectrum of quasi-convective eddies agrees reasonably well with that of turbulence in unstable ABL, with . Although the employment of the forced-perturbation technique did not fully reproduce the energy spectra of convective turbulence, this simple technique can be further developed and optimized to obtain the desired turbulent features and overcome a vital limitation to aeolian wind-tunnel experiments.
By comparing the WP runs and NP runs, we found that quasi-convective turbulence increases the mean value (just as in convective ABLs) as well as the variance and skewness of the surface shear stress, all contributing to the entrainment of sand and dust particles. For a given mean shear stress, the entrainment rate for the WP runs is substantially higher than for the NP runs; i.e., convective turbulence is more effective than neutral turbulence in entraining particles into the atmosphere. The enhancing effect is greatest at low wind speeds around threshold and when transport is intermittent and becomes relatively weaker when the mean wind speed is strong enough and dominates over the fluctuations.
The findings of this study obtained through wind-tunnel observations are consistent with the results of Shao et al. (2020). The latter authors showed based on field observations that the PDF of u* can influence the magnitude of saltation flux, Q. With a fixed u* mean, a larger u* variance corresponds to a larger Q. Unstable ABL has in general larger u* variances, which generate stronger saltation bombardment for dust emission and produce the emission of finer dust particles, and saltation in unstable ABLs is generally more fully developed, leading to stronger saltation bombardment. In a more recent study, Yin et al. (2022) demonstrated using large-eddy simulations that dust deposition is also strongly affected by the structure of turbulence. Together with the earlier studies of Shao (2008), Klose and Shao (2012), Klose et al. (2014), Li et al. (2020), Khalfallah et al. (2020), Shao et al. (2020) and Yin et al. (2022), we have shown the critical importance of taking turbulence structure into consideration in aeolian studies and have partly quantified the impact of turbulence on sand and dust entrainment, dust emission, saltation fluxes and dust deposition.
Data are available from Jie Zhang (zhang-j@lzu.edu.cn) or Guang Li (liguang@lzu.edu.cn) upon request.
YS and JZ conceived and designed the wind-tunnel experiment; JZ, GL and LS carried out the experiment, performed the data analyses, and prepared the first draft; and YS and NH organized this study and contributed to its conceptualization, discussions and finalization of the paper.
The contact author has declared that none of the authors has any competing interests.
Publisher’s note: Copernicus Publications remains neutral with regard to jurisdictional claims in published maps and institutional affiliations.
The authors wish to show their great appreciation to Gilles Bergametti, Xueling Cheng and Cheryl McKenna Neuman for their affirmation of this work and constructive suggestions. They are also grateful to Armin Sigmund, who shared his thoughts after reading this manuscript.
This research has been supported by the National Natural Science Foundation of China (grant nos. 41931179 and 42006187), the Major Science and Technology Project of Gansu Province (grant no. 21ZD4FA010), the Second Tibetan Plateau Scientific Expedition and Research Program (grant no. 2019QZKK020611), and the Fundamental Research Funds for the Central Universities (grant no. lzujbky-2020-cd06).
This paper was edited by Guangjie Zheng and reviewed by Gilles Bergametti, Xueling Cheng, and Cheryl McKenna Neuman.
Alfaro, S. C., Gaudichet, A., Gomes, L., and Maillé, M.: Modeling the size distribution of a soil aerosol produced by sandblasting, J. Geophys. Res.-Atmos., 102, 11239–11249, https://doi.org/10.1029/97jd00403, 1997. a
Anderson, R. S. and Haff, P. K.: Simulation of Eolian Saltation, Science, 241, 820–823, https://doi.org/10.1126/science.241.4867.820, 1988. a
Anderson, R. S. and Haff, P. K.: Wind modification and bed response during saltation of sand in air, in: Aeolian Grain Transport 1. Acta Mechanica Supplementum, edited by: Barndorff-Nielsen, O. E. and Willetts, B. B., Vol. 1, Springer, Vienna, https://doi.org/10.1007/978-3-7091-6706-9_2, 1991. a
Bagnold, R. A.: The physics of blown sand and desert dunes, Methuen, New York, https://doi.org/10.1007/978-94-009-5682-7, 1941. a
Brown, S., Nickling, W., and Gillies, J.: A wind tunnel examination of shear stress partitioning for an assortment of surface roughness distributions, J. Geophys. Res.-Earth, 113, F02S06, https://doi.org/10.1029/2007jf000790, 2008. a
Businger, J. A., Wyngaard, J. C., Izumi, Y., and Bradley, E. F.: Flux-profile relationships in the atmospheric surface layer, J. Atmos. Sci, 28, 181–189, https://doi.org/10.1175/1520-0469(1971)028<0181:fprita>2.0.co;2, 1971. a
Butterfield, G.: Grain transport rates in steady and unsteady turbulent airflows, in: Aeolian Grain Transport 1, edited by: Barndorff-Nielsen, O. E. and Willetts, B. B., Springer, 97–122, https://doi.org/10.1007/978-3-7091-6706-9_6, 1991. a, b
Butterfield, G. R.: Transitional behaviour of saltation: wind tunnel observations of unsteady winds, J. Arid. Environ., 39, 377–394, https://doi.org/10.1006/jare.1997.0367, 1998. a, b
Comola, F., Kok, J. F., Chamecki, M., and Martin, R. L.: The Intermittency of Wind-Driven Sand Transport, Geophys. Res. Lett., 46, 13430–13440, https://doi.org/10.1029/2019GL085739, 2019. a
Doorschot, J. J. and Lehning, M.: Equilibrium saltation: mass fluxes, aerodynamic entrainment, and dependence on grain properties, Bound.-Lay. Meteorol., 104, 111–130, https://doi.org/10.1023/a:1015516420286, 2002. a
Gillette, D. A., Herbert, G., Stockton, P. H., and Owen, P.: Causes of the fetch effect in wind erosion, Earth Surf. Processes Landforms, 21, 641–659, https://doi.org/10.1002/(sici)1096-9837(199607)21:7<641::aid-esp662>3.0.co;2-9, 1996. a
Gillette, D. A., Hardebeck, E., and Parker, J.: Large-scale variability of wind erosion mass flux rates at Owens Lake: 2. Role of roughness change, particle limitation, change of threshold friction velocity, and the Owen effect, J. Geophys. Res.-Atmos., 102, 25989–25998, https://doi.org/10.1029/97jd00960, 1997. a
Gillies, J. A., Nickling, W. G., and King, J.: Shear stress partitioning in large patches of roughness in the atmospheric inertial sublayer, Bound.-Lay. Meteorol., 122, 367–396, https://doi.org/10.1007/s10546-006-9101-5, 2007. a
Greeley, R. and Iversen, J. D.: Wind as a geological process: on Earth, Mars, Venus and Titan, 4, CUP Archive, https://doi.org/10.1017/cbo9780511573071, 1987. a
Hancock, P. and Farr, T.: Wind-tunnel simulations of wind-turbine arrays in neutral and non-neutral winds, J. Phys. Conf. Ser., 524, 012166, https://doi.org/10.1088/1742-6596/524/1/012166, 2014. a
Hancock, P. E. and Hayden, P.: Wind-tunnel simulation of weakly and moderately stable atmospheric boundary layers, Bound.-Lay. Meteorol., 168, 29–57, 2018. a
Hancock, P. and Zhang, S.: A wind-tunnel simulation of the wake of a large wind turbine in a weakly unstable boundary layer, Bound.-Lay. Meteorol., 156, 395–413, 2015. a
Hancock, P., Zhang, S., and Hayden, P.: A wind-tunnel artificially-thickened simulated weakly unstable atmospheric boundary layer, Bound.-Lay. Meteorol., 149, 355–380, 2013. a
Inagaki, A., Castillo, M. C. L., Yamashita, Y., Kanda, M., and Takimoto, H.: Large-eddy simulation of coherent flow structures within a cubical canopy, Bound.-Lay. Meteorol., 142, 207–222, 2012. a
Irwin, H. P. A.: A simple omnidirectional sensor for wind-tunnel studies of pedestrian-level winds, J. Wind Eng. Ind. Aerodyn., 7, 219–239, https://doi.org/10.1016/0167-6105(81)90051-9, 1981. a
Ishizuka, M., Mikami, M., Leys, J., Yamada, Y., Heidenreich, S., Shao, Y., and McTainsh, G.: Effects of soil moisture and dried raindroplet crust on saltation and dust emission, J. Geophys. Res.-Atmos., 113, D24212, https://doi.org/10.1029/2008jd009955, 2008. a
Ishizuka, M., Mikami, M., Leys, J. F., Shao, Y., Yamada, Y., and Heidenreich, S.: Power law relation between size-resolved vertical dust flux and friction velocity measured in a fallow wheat field, Aeolian Res., 12, 87–99, https://doi.org/10.1016/j.aeolia.2013.11.002, 2014. a
Jia, S. and Wang, Z.: Simulation of aerodynamic entrainment with interparticle cohesions based on discrete element method, Earth Surf. Process. Landf., 46, 1410–1418, https://doi.org/10.1002/esp.5109, 2021. a
Kaimal, J. C. and Finnigan, J. J.: Atmospheric boundary layer flows: their structure and measurement, Oxford University Press, https://doi.org/10.1093/oso/9780195062397.001.0001, 1994. a
Kaimal, J. C., Wyngaard, J., Izumi, Y., and Coté, O.: Spectral characteristics of surface-layer turbulence, Q. J. Roy. Meteor. Soc., 98, 563–589, https://doi.org/10.1002/qj.49709841707, 1972. a, b, c, d, e
Kanda, I. and Yamao, Y.: Passive scalar diffusion in and above urban-like roughness under weakly stable and unstable thermal stratification conditions, J. Wind Eng. Ind. Aerod., 148, 18–33, 2016. a
Khalfallah, B., Bouet, C., Labiadh, M., Alfaro, S., Bergametti, G., Marticorena, B., Lafon, S., Chevaillier, S., Féron, A., Hease, P., Henry des Tureaux, T., Sekrafi, S., Zapf, P., and Rajot, J. L.: Influence of atmospheric stability on the size distribution of the vertical dust flux measured in eroding conditions over a flat bare sandy field, J. Geophys. Res.-Atmos., 125, e2019JD031185, https://doi.org/10.1029/2019JD031185, 2020. a, b
Klose, M. and Shao, Y.: Stochastic parameterization of dust emission and application to convective atmospheric conditions, Atmos. Chem. Phys., 12, 7309–7320, https://doi.org/10.5194/acp-12-7309-2012, 2012. a, b, c
Klose, M., Shao, Y., Li, X., Zhang, H., Ishizuka, M., Mikami, M., and Leys, J. F.: Further development of a parameterization for convective turbulent dust emission and evaluation based on field observations, J. Geophys. Res.-Atmos., 119, 10441–10457, https://doi.org/10.1002/2014jd021688, 2014. a, b, c
Leys, J. F. and McTainsh, G. H.: Sediment Fluxes and Particle Grain-Size Characteristics of Wind-Eroded Sediments in Southeastern Australia, Earth Surf. Proc. Land., 21, 661–671, https://doi.org/10.1002/(SICI)1096-9837(199607)21:7<661::AID-ESP663>3.0.CO;2-4, 1996. a
Li, B. and McKenna Neuman, C.: Boundary-layer turbulence characteristics during aeolian saltation, Geophys. Res. Lett., 39, L11402, https://doi.org/10.1029/2012GL052234, 2012. a
Li, B. and Neuman, C. M.: A wind tunnel study of aeolian sediment transport response to unsteady winds, Geomorphology, 214, 261–269, 2014. a
Li, G., Zhang, J., Herrmann, H., Shao, Y., and Huang, N.: Study of aerodynamic grain entrainment in aeolian transport, Geophys. Res. Lett., 47, e2019GL086574, https://doi.org/10.1029/2019GL086574, 2020. a, b, c, d, e, f
Liu, D., Ishizuka, M., Mikami, M., and Shao, Y.: Turbulent characteristics of saltation and uncertainty of saltation model parameters, Atmos. Chem. Phys., 18, 7595–7606, https://doi.org/10.5194/acp-18-7595-2018, 2018. a, b, c
Liu, H. and Zheng, X.: Large-scale structures of wall-bounded turbulence in single-and two-phase flows: advancing understanding of the atmospheric surface layer during sandstorms, Flow, 1, https://doi.org/10.1017/flo.2021.6, 2021. a
Loosmore, G. A. and Hunt, J. R.: Dust resuspension without saltation, J. Geophys. Res.-Atmos., 105, 20663–20671, https://doi.org/10.1029/2000jd900271, 2000. a
Martin, R. L. and Kok, J. F.: Wind-invariant saltation heights imply linear scaling of aeolian saltation flux with shear stress, Sci. Adv., 3, e1602569, https://doi.org/10.1126/sciadv.1602569, 2017. a
Marucci, D. and Carpentieri, M.: Stable and convective boundary-layer flows in an urban array, J. Wind Eng. Ind. Aerod., 200, 104140, https://doi.org/10.1016/j.jweia.2020.104140, 2020. a
Marucci, D., Carpentieri, M., and Hayden, P.: On the simulation of thick non-neutral boundary layers for urban studies in a wind tunnel, International Journal of Heat and Fluid Flow, 72, 37–51, 2018. a
Owen, P. R.: Saltation of uniform grains in air, J. Fluid Mech., 20, 225–242, https://doi.org/10.1017/s0022112064001173, 1964. a
Raffaele, L., Bruno, L., Pellerey, F., and Preziosi, L.: Windblown sand saltation: A statistical approach to fluid threshold shear velocity, Aeolian Res., 23, 79–91, https://doi.org/10.1016/j.aeolia.2016.10.002, 2016. a, b
Rasmussen, K. and Mikkelsen, H.: Wind tunnel observations of aeolian transport rates, in: Aeolian Grain Transport 1, edited by: Barndorff-Nielsen, O. E. and Willetts, B. B., Springer, 135–144, https://doi.org/10.1007/978-3-7091-6706-9_8, 1991. a
Shao, Y.: Physics and modelling of wind erosion, Vol. 37, Springer Science & Business Media, https://doi.org/10.1007/978-1-4020-8895-7, 2008. a, b, c
Shao, Y., Zhang, J., Ishizuka, M., Mikami, M., Leys, J., and Huang, N.: Dependency of particle size distribution at dust emission on friction velocity and atmospheric boundary-layer stability, Atmos. Chem. Phys., 20, 12939–12953, https://doi.org/10.5194/acp-20-12939-2020, 2020. a, b, c, d, e, f, g
Stout, J. and Zobeck, T.: Intermittent saltation, Sedimentology, 44, 959–970, https://doi.org/10.1046/j.1365-3091.1997.d01-55.x, 1997. a, b, c
Walter, B., Gromke, C., Leonard, K., Clifton, A., and Lehning, M.: Spatially resolved skin friction velocity measurements using Irwin sensors: a calibration and accuracy analysis, J. Wind Eng. Ind. Aerodyn., 104, 314–321, https://doi.org/10.1016/j.jweia.2012.02.018, 2012. a
Wiernga, J.: Representative roughness parameters for homogeneous terrain, Bound.-Lay. Meteorol., 63, 323–363, https://doi.org/10.1007/bf00705357, 1993. a
Wu, H. and Stathopoulos, T.: Wind-tunnel techniques for assessment of pedestrian-level winds, J. Eng. Mech., 119, 1920–1936, https://doi.org/10.1061/(asce)0733-9399(1993)119:10(1920), 1993. a
Xuan, J.: Turbulence factors for threshold velocity and emission rate of atmospheric mineral dust, Atmos. Environ., 38, 1777–1783, https://doi.org/10.1016/j.atmosenv.2003.12.030, 2004. a
Yin, X., Jiang, C., Shao, Y., Huang, N., and Zhang, J.: Large-eddy-simulation study on turbulent particle deposition and its dependence on atmospheric-boundary-layer stability, Atmos. Chem. Phys., 22, 4509–4522, https://doi.org/10.5194/acp-22-4509-2022, 2022. a, b
Zhang, J., Shao, Y., and Huang, N.: Measurements of dust deposition velocity in a wind-tunnel experiment, Atmos. Chem. Phys., 14, 8869–8882, https://doi.org/10.5194/acp-14-8869-2014, 2014. a, b
Zhang, W., Markfort, C. D., and Porté-Agel, F.: Wind-turbine wakes in a convective boundary layer: A wind-tunnel study, Bound.-Lay. Meteorol., 146, 161–179, 2013. a