the Creative Commons Attribution 4.0 License.
the Creative Commons Attribution 4.0 License.
 | 12 Jul 2022
Contrasting source contributions of Arctic black carbon to atmospheric concentrations, deposition flux, and atmospheric and snow radiative effects
Tatsuhiro Mori
Sho Ohata
Nobuhiro Moteki
Naga Oshima
Kumiko Goto-Azuma
Makoto Koike
Yutaka Kondo
Black carbon (BC) particles in the Arctic contribute to rapid warming of the Arctic by heating the atmosphere and snow and ice surfaces. Understanding the source contributions to Arctic BC is therefore important, but they are not well understood, especially those for atmospheric and snow radiative effects. Here we estimate simultaneously the source contributions of Arctic BC to near-surface and vertically integrated atmospheric BC mass concentrations (MBC_SRF and MBC_COL), BC deposition flux (MBC_DEP), and BC radiative effects at the top of the atmosphere and snow surface (REBC_TOA and REBC_SNOW) and show that the source contributions to these five variables are highly different. In our estimates, Siberia makes the largest contribution to MBC_SRF, MBC_DEP, and REBC_SNOW in the Arctic (defined as >70∘ N), accounting for 70 %, 53 %, and 41 %, respectively. In contrast, Asia's contributions to MBC_COL and REBC_TOA are largest, accounting for 37 % and 43 %, respectively. In addition, the contributions of biomass burning sources are larger (29 %–35 %) to MBC_DEP, REBC_TOA, and REBC_SNOW, which are highest from late spring to summer, and smaller (5.9 %–17 %) to MBC_SRF and MBC_COL, whose concentrations are highest from winter to spring. These differences in source contributions to these five variables are due to seasonal variations in BC emission, transport, and removal processes and solar radiation, as well as to differences in radiative effect efficiency (radiative effect per unit BC mass) among sources. Radiative effect efficiency varies by a factor of up to 4 among sources (1471–5326 W g−1) depending on lifetimes, mixing states, and heights of BC and seasonal variations of emissions and solar radiation. As a result, source contributions to radiative effects and mass concentrations (i.e., REBC_TOA and MBC_COL, respectively) are substantially different. The results of this study demonstrate the importance of considering differences in the source contributions of Arctic BC among mass concentrations, deposition, and atmospheric and snow radiative effects for accurate understanding of Arctic BC and its climate impacts.
- Article
(12896 KB) - Full-text XML
-
Supplement
(3513 KB) - BibTeX
- EndNote


Black carbon (BC) aerosols, emitted into the atmosphere by incomplete combustion of fossil fuels, biofuels, and biomass, heat the atmosphere and modulate the Earth's radiation budget by efficiently absorbing solar radiation (e.g., Bond et al., 2013; IPCC, 2021). This heating by BC also changes the vertical stability of the atmosphere and the distribution of clouds, which in turn modulates the radiation budget (e.g., Koch and Del Genio, 2010; Smith et al., 2018; Stjern et al., 2017). In addition, when BC is transported and deposited in regions where snow and ice are present, such as in the Arctic region, it lowers the albedo of snow and ice surfaces and accelerates snow and ice melting (e.g., Flanner et al., 2007; Hadley and Kirchstetter, 2012; Hansen and Nazarenko, 2004). Arctic warming is progressing about twice as fast as global warming, and BC in the Arctic may contribute to the acceleration of Arctic warming through heating of the atmosphere and heating and melting of snow and ice (e.g., Serreze and Barry, 2011). However, there are large uncertainties in simulations of atmospheric BC concentrations in the Arctic, which vary by 1 or 2 orders of magnitude among existing models (e.g., Eckhardt et al., 2015; Shindell et al., 2008).
Atmospheric BC mass (MBC) concentrations in the Arctic show distinct seasonal variation, being high in winter and spring and low in summer near the surface (e.g., Sharma et al., 2013, 2019; Sinha et al., 2017). In winter and spring, BC emitted from high latitudes such as from Siberia and Europe is transported via the lower troposphere to lower altitudes in the Arctic, whereas anthropogenic BC emitted from midlatitudes such as from Asia is transported long distances via the middle and upper troposphere and reaches higher altitudes in the Arctic (e.g., Stohl, 2006; Matsui et al., 2011a). In summer, when precipitation in the midlatitudes and high latitudes increases, biomass burning in and near the Arctic (Siberia and Alaska) is considered to be the dominant source of atmospheric BC in the Arctic (e.g., Ikeda et al., 2017; Sharma et al., 2013). Unlike atmospheric BC, the rain rate in the Arctic varies seasonally, with a lower rain rate in winter and spring and higher in summer (e.g., Mori et al., 2020; Shen et al., 2017). Thus, the BC deposition flux has been reported to have seasonal variations with maximum fluxes in summer (or less clear seasonal variations than surface atmospheric BC) (Mori et al., 2020, 2021). Furthermore, heating of the atmosphere and snow surfaces in the Arctic by BC is strongly dependent on solar radiation, which is largest in summer (and zero in winter because of the polar night). Therefore, atmospheric concentrations and deposition of BC from spring to fall are important for estimating the heating of the atmosphere and snow surface by BC in the Arctic. Given the seasonal variations in BC emission, transport, and removal processes, as well as in solar radiation, the source contributions to the following five BC variables and their seasonal variations are expected to differ significantly in the Arctic: (1) near-surface atmospheric BC mass concentration (MBC_SRF), (2) vertically integrated atmospheric BC mass concentration (MBC_COL), (3) BC deposition flux (MBC_DEP), (4) BC radiative effect at the top of the atmosphere (TOA) (REBC_TOA), and (5) BC radiative effect at the snow surface (REBC_SNOW).
Many previous studies have estimated source contributions to BC in the Arctic. Most of them have focused on MBC_SRF and MBC_COL, showing that BC in the lower troposphere of the Arctic is mainly transported from high-latitude sources such as Europe, Siberia, and North America, whereas low-latitude sources such as Asia are important contributors to BC in the middle and upper troposphere (e.g., Bourgeois and Bay, 2011; Huang, et al., 2010; Qi et al., 2017; Ren et al., 2020; Sharma et al., 2013; Sobhani et al., 2018; Xu et al., 2017; Zhu et al., 2020). Other studies have estimated the source contributions to MBC_DEP in the Arctic as well as those to MBC_SRF and MBC_COL (Ikeda et al., 2017; Qi and Wang, 2019; Wang et al., 2011). In contrast, few studies have estimated the source contributions to the radiative effects of BC (REBC_TOA and REBC_SNOW) in the Arctic. As far as we know, only Wang et al. (2014) have estimated the source contributions to MBC_SRF, MBC_COL, MBC_DEP, and REBC_TOA in the Arctic. They found strong seasonal variations in source contributions and showed the importance of high-latitude sources. However, their model simulations underestimated observed BC mass concentrations at the surface and in the lower troposphere by about 1 order of magnitude.
To our knowledge, no study has estimated the source contributions to all five of the BC variables described above (MBC_SRF, MBC_COL, MBC_DEP, REBC_TOA, and REBC_SNOW) simultaneously. In addition, although BC emitted from each source may have different microphysical properties (e.g., mixing state) and radiative effect efficiency (radiative effect per unit light BC absorption or per unit BC mass) in the Arctic, these differences among emission sources are not well understood.
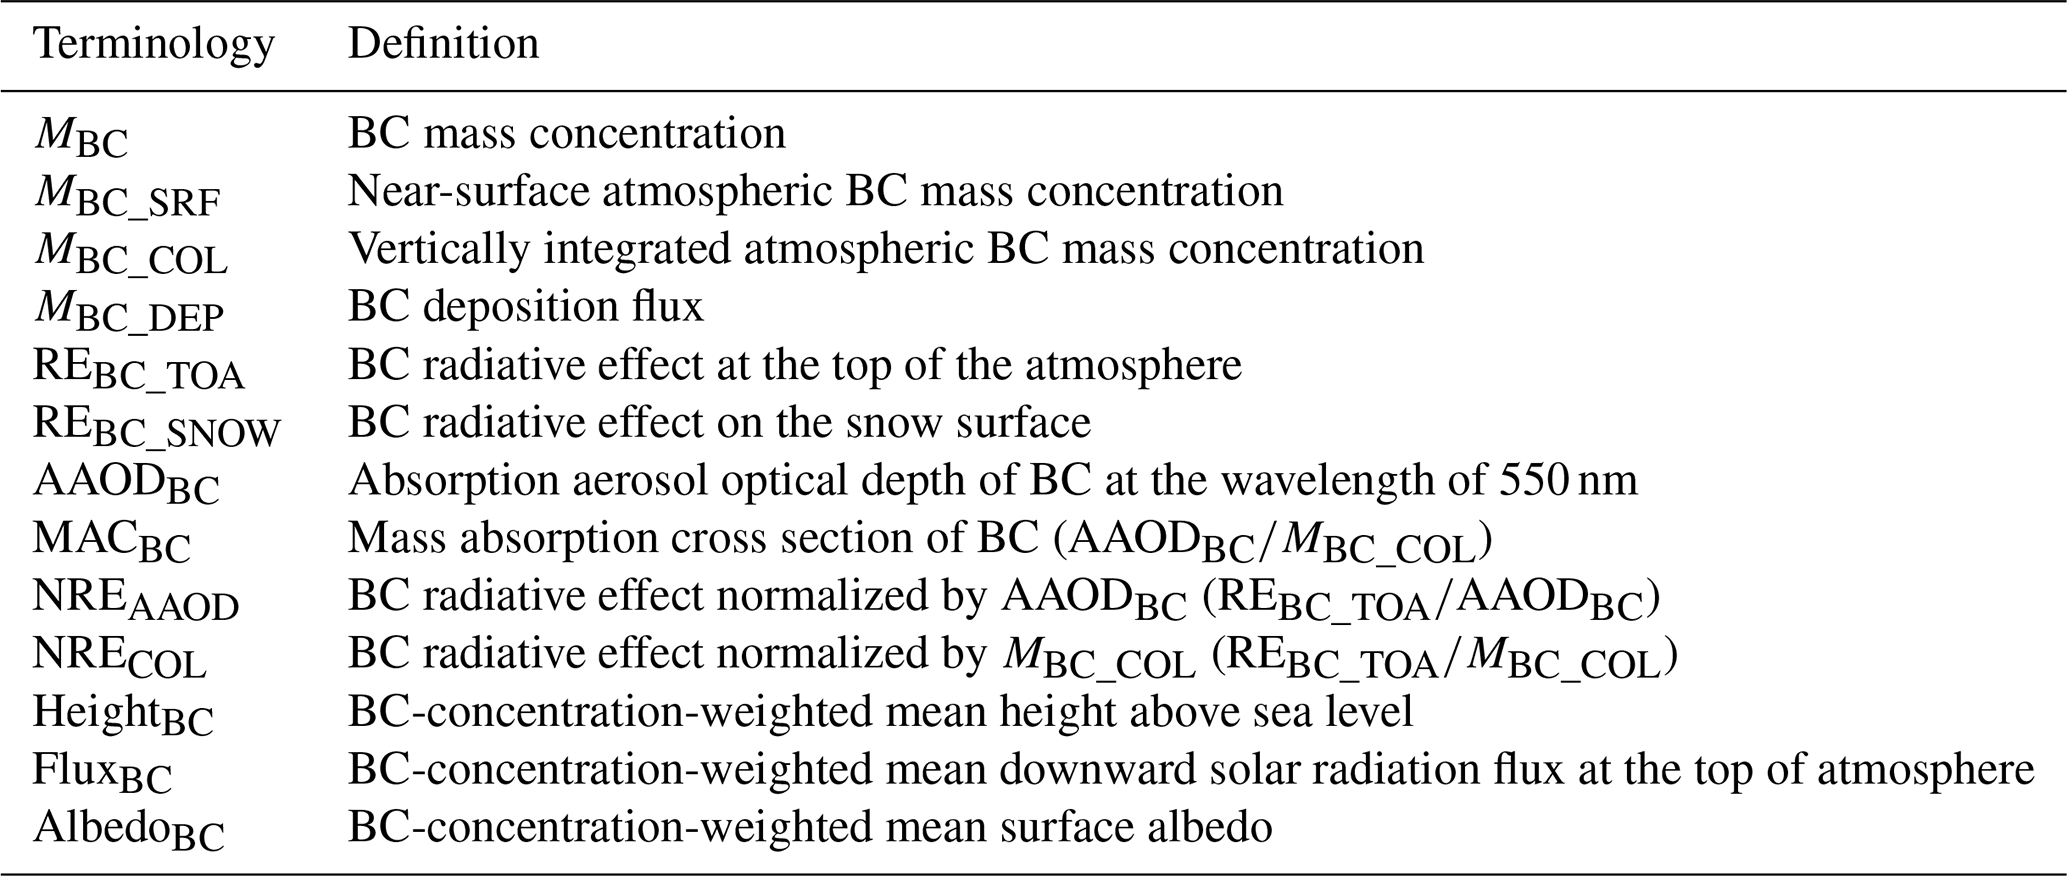
In our previous studies, we have developed a global two-dimensional sectional aerosol model, the Community Atmosphere Model with the Aerosol Two-dimensional bin module for foRmation and Aging Simulation (CAM-ATRAS), that resolves aerosol particle size and the BC mixing state in detail (Matsui, 2017; Matsui and Mahowald, 2017). We have also shown that simulations conducted with this model can reproduce realistically global distributions of MBC observed by surface and aircraft measurements (e.g., Matsui and Mahowald, 2017; Liu and Matsui, 2021b). In this study, we use CAM-ATRAS to estimate the source contributions to BC in the Arctic from 26 sources (13 source regions × 2 source types (anthropogenic and biomass burning)) and show that source contributions to Arctic BC are substantially different among the five BC variables: MBC_SRF, MBC_COL, MBC_DEP, REBC_TOA, and REBC_SNOW. We also show in this study that the radiative effect efficiency of atmospheric BC in the Arctic differs significantly among emission sources and that these differences contribute to the different source contributions to atmospheric concentrations and radiative effects (i.e., MBC_COL and REBC_TOA). Abbreviations for BC used in this study are summarized in Table 1.
2.1 Global climate–aerosol model CAM-ATRAS
We used the Community Atmosphere Model version 5 (CAM5) (Neale et al., 2010) and the Community Land Model version 4 (CLM4) (Oleson et al., 2010) in Community Earth System Model version 1.2.0 (Hurrell et al., 2013). In our previous studies, we implemented our aerosol model ATRAS into CAM5 (Matsui, 2017; Matsui and Mahowald, 2017). In CAM-ATRAS, which considers seven aerosol species (sulfate, nitrate, ammonium, dust, sea salt, organic aerosol, and BC), aerosol particles with dry diameters from 1 to 10 000 nm are classified into 12 particle size bins, and for fine particles (five particle size bins from 40 to 1250 nm), eight BC mixing state bins are used for each size bin. Based on the mass ratio of BC to total dry aerosol (fBC), the BC mixing states are classified into pure BC (fBC = 0.99–1.0), BC-free particles (fBC <0.0001), and six different internally mixed BC particles (fBCs of 0.0001–0.1, 0.1–0.2, 0.2–0.5, 0.5–0.8, 0.8–0.9, and 0.9–0.99). Overall, 47 particle size and mixing state bins are used to represent aerosols. CAM-ATRAS calculates the following aerosol processes for the full two-dimensional bins (47 bins): new particle formation (Matsui et al., 2011b, 2013a); condensation of sulfate, nitrate, and organic aerosols (Matsui et al., 2014a, b); coagulation (Matsui et al., 2013b); activation into cloud droplets (Abdul-Razzak and Ghan, 2000, 2002); aqueous-phase chemistry (Tie et al., 2001); and dry and wet deposition (Liu et al., 2012; Zender et al., 2003). Changes in particle size and mixing state by condensation, coagulation, and aqueous-phase formation are calculated for all the 47 bins, and bin shifting by these processes is calculated by a two-moment (mass and number) advection scheme (Simmel and Wurzler, 2006) for particle size bins and the moving center approach (Jacobson, 1997) for mixing state bins (Matsui, 2017). Optical properties and cloud condensation nuclei (CCN) properties are calculated theoretically (Bohren and Huffman, 1998; Petters and Kreidenweis, 2007) using the particle size and chemical composition of each two-dimensional bin, and aerosol–radiation (Iacono et al., 2000) and aerosol–cloud interactions (Morrison and Gettelman, 2008) are estimated based on these properties (Matsui, 2017). For optical properties, we assumed the core–shell treatment for internally mixed BC in the fine particle size bins (40–1250 nm in diameter) and the well-mixed treatment for the other particles (for pure BC and BC-free particles in the fine particle size bins and for all particles larger than 1250 nm or smaller than 40 nm) (Matsui, 2017). CAM-ATRAS uses lookup tables of optical parameters (extinction coefficient, single scattering albedo, and asymmetry factor) calculated based on the codes for homogeneous and coated spheres (Appendices A and B in Bohren and Huffman, 1998). The core–shell treatment could underestimate the mass absorption cross section of BC (MACBC) for large particles (Forestieri et al., 2018), but as shown by Matsui et al. (2018b), the enhancement of BC absorption by the core–shell treatment is comparable to that by other mixing state assumptions such as the dynamic effective medium approximation (Chylek et al., 1984; Jacobson, 2006) and the Bruggeman mixing rule (Jacobson, 2006).
Model simulations by CAM-ATRAS have been evaluated against various surface, aircraft, and satellite observations for mass concentrations of each aerosol species, number concentrations, size distributions, and optical properties (Gliß et al., 2021; Kawai et al., 2021; Liu and Matsui, 2021a; Matsui and Mahowald, 2017; Matsui et al., 2018a; Matsui and Moteki, 2020; Sand et al., 2021). Mass concentrations, mixing states, and vertical profiles of BC have been validated (Matsui et al., 2018b; Matsui, 2020; Moteki et al., 2019; Ohata et al., 2021a). We have also improved the model representation of activation processes in liquid clouds and of removal processes in convective and mixed-phase clouds, thereby greatly improving the reproducibility of BC observations in the upper troposphere in the tropics and in the middle and lower troposphere in the Arctic (Liu and Matsui, 2021b; Matsui and Liu, 2021). In Liu and Matsui (2021b), we separately represented activated and non-activated aerosols in convective clouds and introduced gradual activation processes of aerosols during upward transport. This representation allows consistent calculations of the transport, activation, and removal processes of aerosols in convective clouds. We also introduced the reduction in precipitation removal efficiency of aerosols in mixed-phase clouds by the Wegener–Bergeron–Findeisen process (Liu and Matsui, 2021b), and following Cozic et al. (2007), we represented precipitation removal efficiency as a function of the ice mass fraction in mixed-phase clouds.
2.2 Tag-tracer method
In addition to the sum of BC from all source regions and types (hereafter referred to as ALL BC), CAM-ATRAS considers two tracer BC variables. The tracer BC variables are considered for all 47 particle size and mixing state bins. Transport, aging, and removal processes and related changes in particle sizes and mixing states of the tracer BC variables are calculated explicitly and in the same way as those of the ALL BC. In the original CAM-ATRAS, these two tracer BC variables are used to calculate anthropogenic (fossil fuel + biofuel) and biomass burning BC from all source regions. In this study, we used these tracer BC variables to calculate anthropogenic and biomass burning BC emitted from each of 13 regions (Fig. 1): Europe (EUR), Siberia (SIB), Greenland (GL), North America north of 50∘ N (NAM (>50∘ N)), North America south of 50∘ N (NAM (<50∘ N)), Central Asia (CAS) 1–4, East Asia (EAS) 1–2, Southeast Asia (SAS), and others. By performing 13 simulations focusing on anthropogenic and biomass burning BC emitted from each source region, the emission, transport, aging, and removal processes and optical and CCN properties of BC from all 26 sources (i.e., 13 regions × 2 types) are calculated separately using the 47 bins for each emission source.
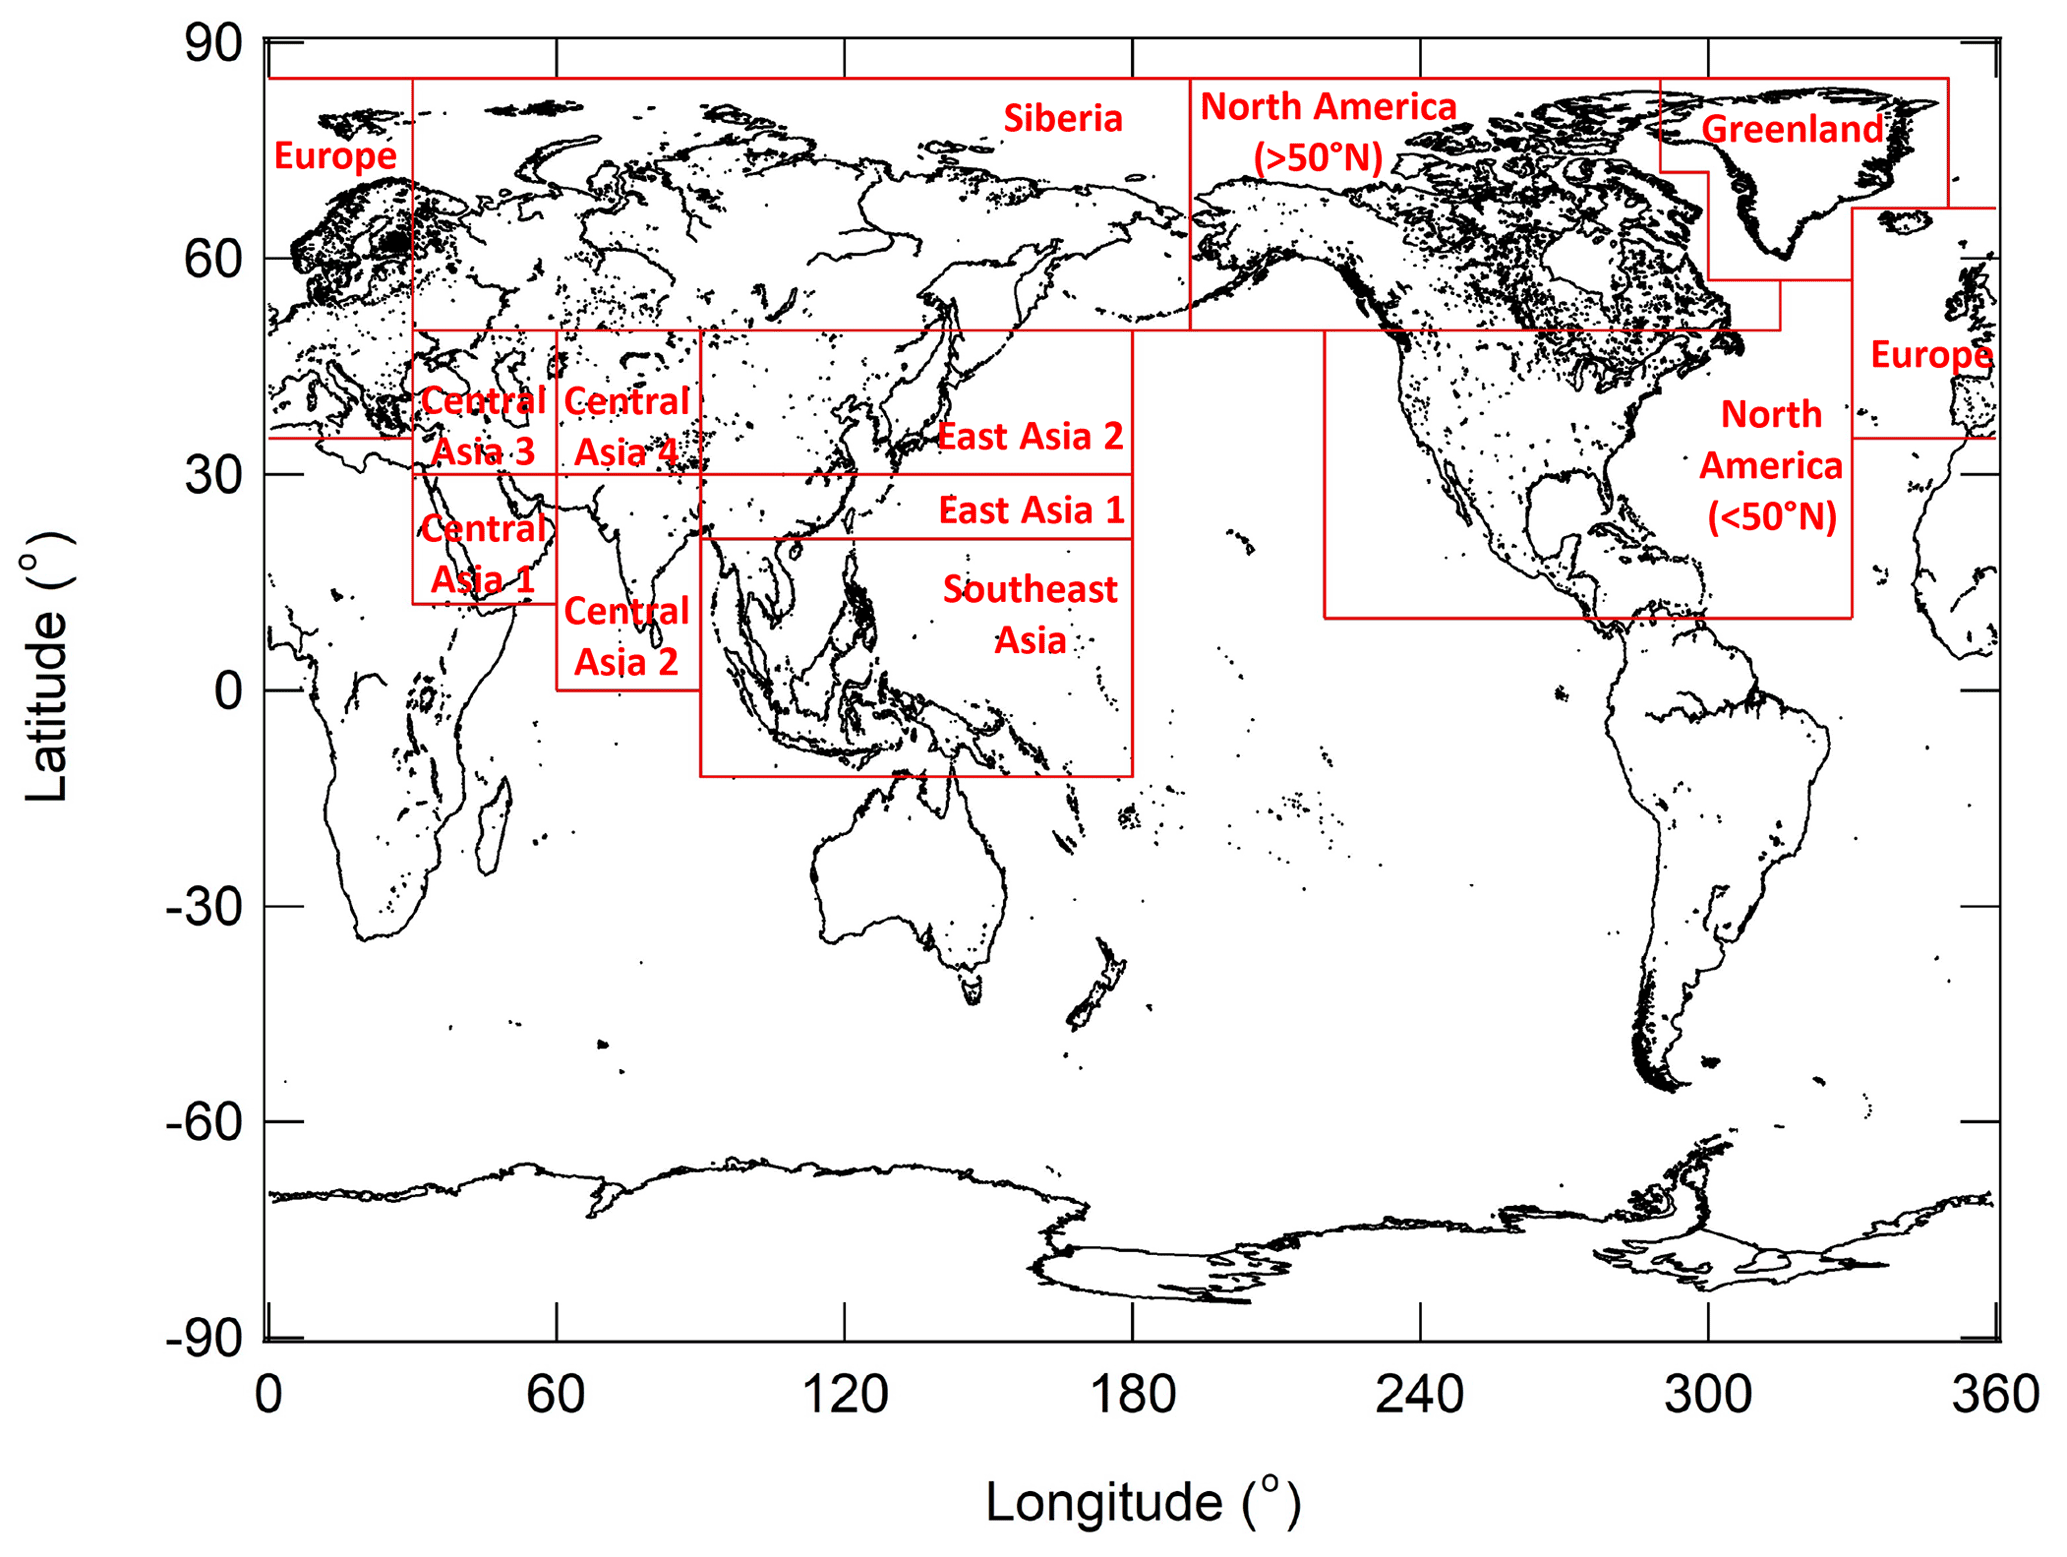
Figure 1The definition of source regions used in this study. The 13 source regions are Europe (EUR), Siberia (SIB), Greenland (GL), North America north of 50∘ N (NAM (>50∘ N)), North America south of 50∘ N (NAM (<50∘ N)), Central Asia (CAS) 1–4, East Asia (EAS) 1–2, Southeast Asia (SAS), and others. Anthropogenic and biomass burning BC from each source region is tracked by tag tracers in global aerosol model simulations using CAM-ATRAS (Sect. 2).
By using these tag-tracer BC variables, source contributions to BC in the Arctic (defined as >70∘ N in this study) were estimated for the five BC variables: MBC_SRF, MBC_COL, MBC_DEP, REBC_TOA, and REBC_SNOW. For MBC_SRF and MBC_DEP, ALL BC and the sum of all BC tags from the 26 sources agree within 0.40 % for the global and Arctic averages (Fig. S1). Regarding the spatial distributions of MBC_SRF and MBC_DEP, ALL BC and the sum of all BC tags show good agreement in almost all grids globally. For MBC_COL, ALL BC and the sum of all BC tags agree within 3.0 % for the global and Arctic averages and within 10 % for all grids in the Arctic (Fig. S1).
REBC_TOA for each source is estimated from the difference between when all BC is considered and when BC from the target source is excluded from all BC. Three radiative transfer calculations (considering ALL BC, excluding anthropogenic BC in the target area from ALL BC, and excluding biomass burning BC in the target area from ALL BC) were performed for each simulation to estimate instantaneous BC radiative effects from the target source. REBC_TOA for ALL BC and that for the sum of all BC tags agree within 10 % for global and Arctic averages and for almost all grids in the Arctic (Fig. S1).
REBC_SNOW is calculated by the Snow, Ice, and Aerosol Radiative (SNICAR) model in CLM4 (Flanner and Zender, 2005; Oleson et al., 2010). Similar to REBC_TOA, we tried to estimate REBC_SNOW for each source from the difference between REBC_SNOW when all BC is considered and when BC of the target source is excluded from all BC. However, using this method, the difference between ALL BC and the sum of all BC tags is more than 10 % in many grids, and it is 20 % and 5.8 % for the global and Arctic averages, respectively (Fig. S1).
Given these results, this online calculation is not used in this study; instead, REBC_SNOW for each source (RE) is estimated offline using Eq. (1):
where i, m, and s denote a horizontal grid, month, and emission source, respectively; RE denotes REBC_SNOW in horizontal grid i and month m when considering BC from all sources (monthly mean); and denotes BC deposition flux in horizontal grid i, month m, and emission source s (monthly mean). Thus, Eq. (1) calculates RE from RE by weighting the contribution of each emission source s to the total BC deposition flux. This offline method assumes that the source contributions to REBC_SNOW in a given month are determined by the source contributions to the BC deposition flux in that month and the previous month (2 months). In reality, BC older than 2 months may contribute to snow surface heating to some extent, and the heating may also depend on the timing and amount of snowfall and variations of snow grain size. Note that varying the weighting period of the deposition flux from 1 to 3 months does not change the estimates of the source contributions (Fig. S2). In addition, the source contributions calculated by the offline calculation (Eq. 1) and those estimated by the online calculation agree well except for Siberia, North America (>50∘ N), and Central Asia: the offline calculation shows a larger contribution from North America (>50∘ N) and a smaller contribution from Siberia and Central Asia than the online calculation (Fig. S2). Considering these results, in this study we mainly use the source contributions to REBC_SNOW estimated by the offline calculation (Eq. 1).
2.3 Simulation setups
Model simulations were performed for 8 years, 2008–2015, and the results for the latter 7 years, 2009–2015, were used for analysis. As described in Sect. 2.2, 13 simulations were performed using the tag-tracer variables for BC emitted from each of the 13 regions shown in Fig. 1. The horizontal resolution was 1.9∘ latitude × 2.5∘ longitude, and the number of vertical layers was 30 (∼ 40 km). All simulations in this study were nudged by the Modern-Era Retrospective analysis for Research and Applications version 2 (MERRA2) for wind speed and direction and temperature in the free troposphere (<800 hPa). Emission data were taken from monthly anthropogenic emissions based on the Community Emissions Data System (Hoesly et al., 2018) and from daily biomass burning emissions based on the Global Fire Emissions Database (GFED) version 4.1 (van der Werf et al., 2017). Although some recent studies have suggested that biomass burning emissions are underestimated (e.g., Reddington et al., 2016; Mallet et al., 2021), the GFED version 4.1 data were used directly in this study. Dust and sea salt emissions were calculated online (Mårtensson et al., 2003; Monahan et al., 1986; Zender et al., 2003). Similar to Matsui et al. (2018b), anthropogenic and biomass burning emissions were assumed to have number median diameters of 70 and 100 nm, respectively (standard deviation 1.8). Given the large uncertainty in the assumption of BC mixing states in emissions (Matsui, 2020), we assumed BC is emitted as pure BC and the other species as BC-free particles (Matsui et al., 2018b). In reality, the mixing state of emitted BC particles depends on the types of sources. Matsui et al. (2018b) made a simulation assuming that 50 % of BC mass is emitted as pure BC and the other 50 % of BC as internally mixed BC with the shell (organic aerosol) to core (BC) diameter ratio of 1.1 for fossil fuel sources and 1.4 for biofuel and biomass burning sources and showed that global-mean REBC_TOA in this simulation is about 10 % larger than that in the simulation assuming pure BC for all BC emissions.
2.4 Observation data
MBC_SRF was observed by a continuous soot monitoring system at Utqiaġvik (formerly Barrow; 71.3∘ N, 156.6∘ W), Ny-Ålesund (78.9∘ N, 11.9∘ E), Alert (82.5∘ N, 62.5∘ W), and Pallas (68.0∘ N, 24.1∘ E) (Ohata et al., 2021b). At Utqiaġvik (formerly Barrow) and Ny-Ålesund, MBC_DEP was also observed by a single-particle soot photometer in 2013–2017 (Mori et al., 2020, 2021). We used these surface observation data of MBC_SRF during 2009–2015 and MBC_DEP during 2013–2017 to evaluate simulated MBC_SRF and MBC_DEP (2009–2015) in the Arctic. We also used observations of MBC in surface snow and the total column of snowpack in Finland (March 2013), Alaska (March 2012–2015), Siberia (March 2013 and April 2015), Greenland (June–July 2012, July–August 2013, July–August 2014, May 2015, and May 2016), and Ny-Ålesund (April 2013) (Mori et al., 2019). In addition, we used aircraft MBC observation data at high latitudes in the Northern Hemisphere during the High-performance Instrumented Airborne Platform for Environmental Research (HIAPER) Pole-to-Pole Observations (HIPPO) campaigns in 2009–2011 (Schwarz et al., 2013; Wofsy, 2011), the Arctic Research of the Composition of the Troposphere from Aircraft and Satellites (ARCTAS) campaigns in April and July 2008 (Kondo et al., 2011; Matsui et al., 2011a, c), and the Polar Airborne Measurements and Arctic Regional Climate Model simulation Project (PAMARCMiP) campaign in March–April 2018 (Ohata et al., 2021a). Global Precipitation Climatology Project monthly data (https://psl.noaa.gov/data/gridded/data.gpcp.html, last access: 4 July 2022) were used to evaluate precipitation amounts in the Arctic.
3.1 Comparisons with observed BC in the Arctic
Model simulations generally reproduce the observed seasonal variations of MBC_SRF (maximum in winter and minimum in summer) well at Utqiaġvik (formerly Barrow), Ny-Ålesund, and Alert (Fig. 2a–c). The simulated / observed ratios of annual-mean MBC_SRF are 0.61 at Utqiaġvik (formerly Barrow; 25 ng m−3 in observations and 15 ng m−3 in simulations), 1.5 at Ny-Ålesund (13 ng m−3 in observations and 18 ng m−3 in simulations), 0.46 at Alert (20 ng m−3 in observations and 9.3 ng m−3 in simulations), and 1.1 at Pallas (29 ng m−3 in observations and 31 ng m−3 in simulations); thus, observations and model simulations agree reasonably well at all sites (Fig. 2a–d). At Utqiaġvik (formerly Barrow), simulated MBC_SRF is underestimated from February to April but agrees with observed MBC_SRF within a factor of 2 in the other months. At Alert, simulated MBC_SRF is also underestimated in late winter and spring but agrees with observations within a factor of 2 except in February–May. At Ny-Ålesund and Pallas, the observed and simulated MBC_SRF agree within a factor of 2, except in January and August–November at Ny-Ålesund and in November at Pallas.
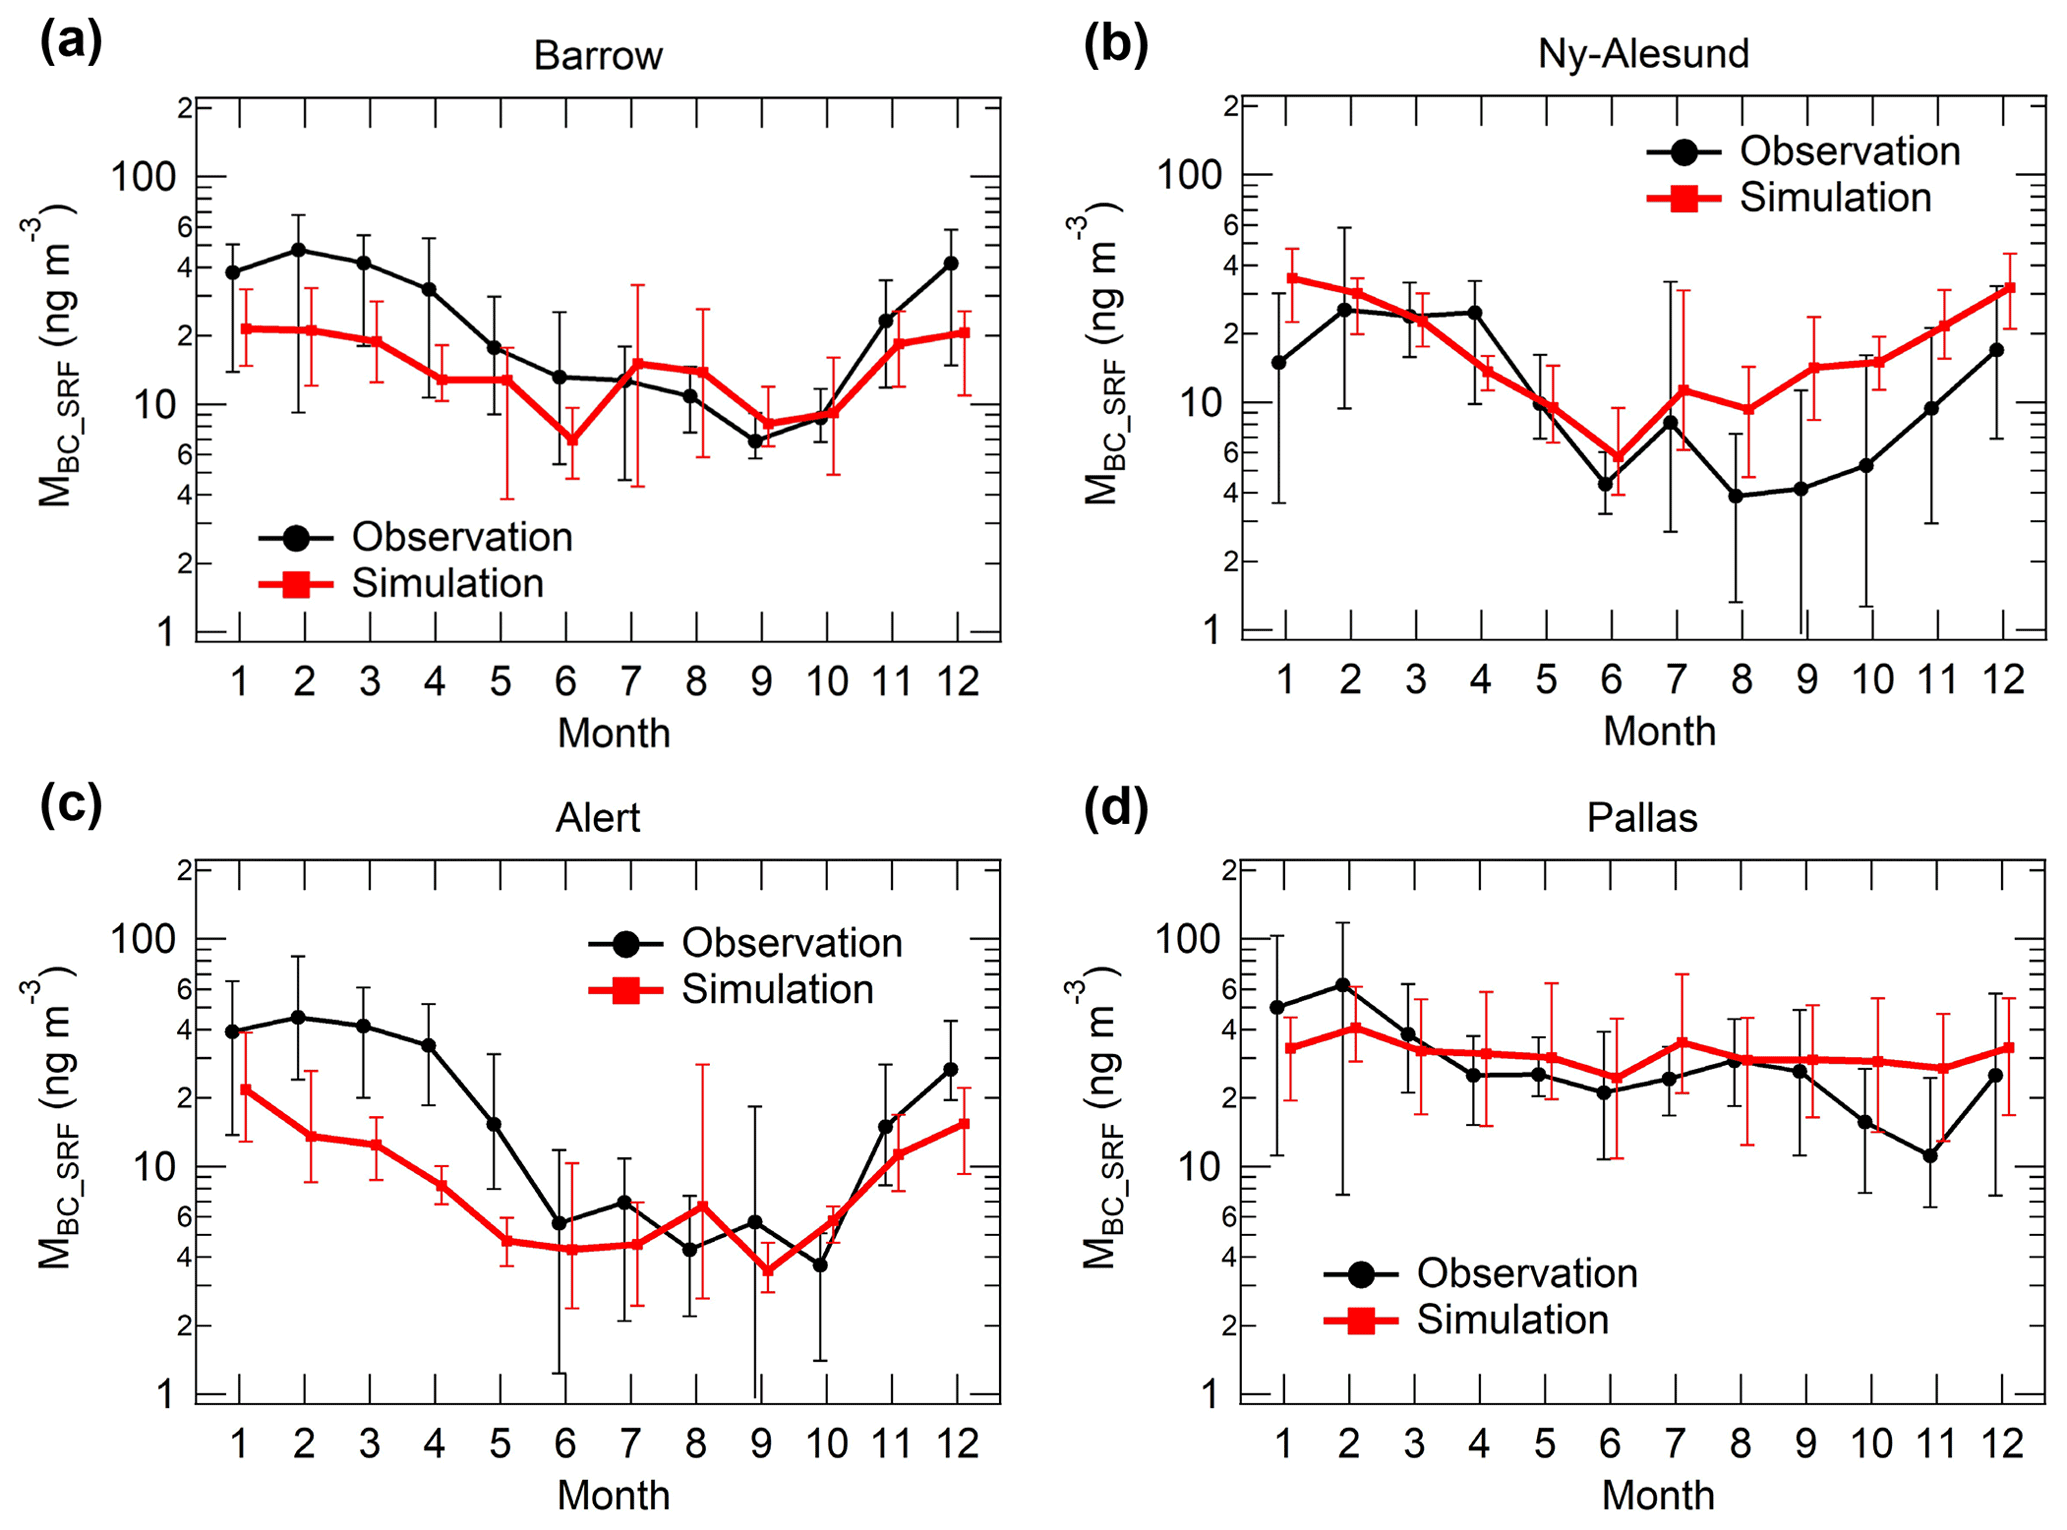
Figure 2Comparisons between observations (black) and model simulations (red) for surface BC mass concentrations (MBC_SRF) at (a) Utqiaġvik (formerly Barrow), (b) Ny-Ålesund, (c) Alert, and (d) Pallas. Model simulations in 2009–2015 were compared with observations in 2009–2015. The error bars show the interannual variability (maximum–minimum ranges) of MBC_SRF. MBC_SRF is shown at standard temperature and pressure in both observations and model simulations.
Observed MBC_DEP (by wet deposition) shows seasonal variation with a maximum in summer at Utqiaġvik (formerly Barrow) and a minimum in summer at Ny-Ålesund (Fig. 3a and b), reflecting seasonal difference of precipitation between the two sites (Mori et al., 2020, 2021). At Utqiaġvik (formerly Barrow), MBC_DEP is overestimated, especially in August, but observed and simulated MBC_DEP agree within a factor of 2 in 7 out of 12 months. At Ny-Ålesund, simulated MBC_DEP is also overestimated in summer, but observed and simulated MBC_DEP agree within a factor of 2 in 6 out of 12 months. The simulated / observed ratio of annual-mean MBC_DEP is 2.3 at Utqiaġvik (formerly Barrow) and 1.5 at Ny-Ålesund. Note that model simulations generally reproduce observed precipitation and its seasonal variations in the Arctic (Figs. S3 and S4).
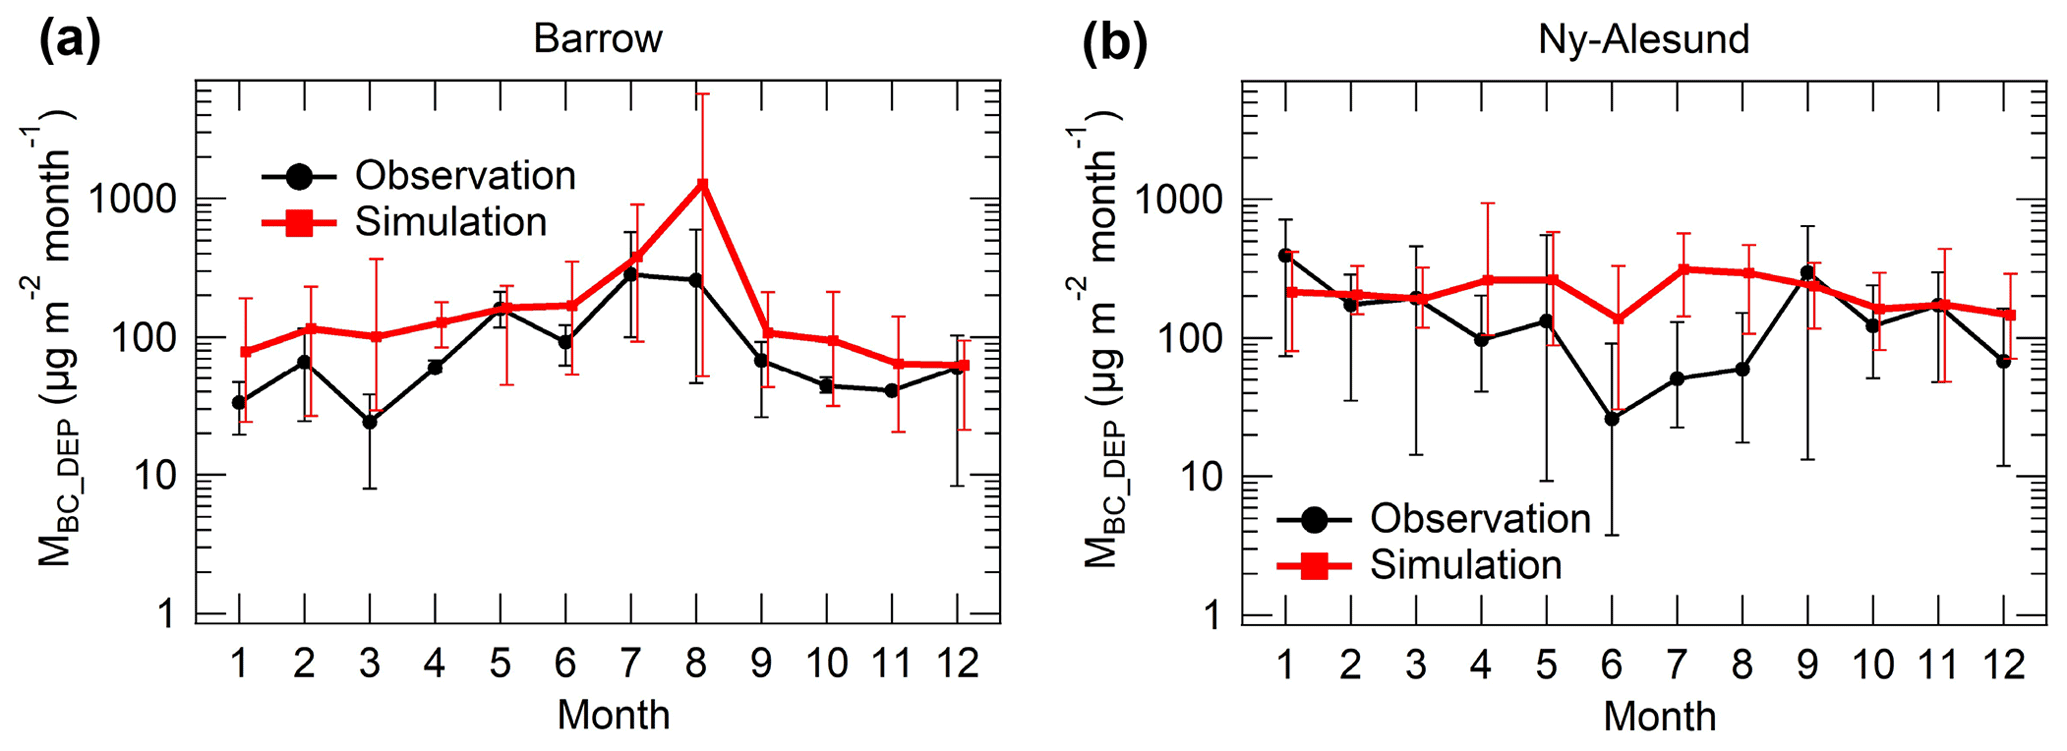
Figure 3Comparisons between observations (black) and model simulations (red) for BC deposition flux (MBC_DEP) at (a) Utqiaġvik (formerly Barrow) and (b) Ny-Ålesund. Model simulations in 2009–2015 were compared with observations in 2013–2017 because MBC_DEP observation data are available during 2013–2017. The error bars show the interannual variability (maximum–minimum ranges) of MBC_DEP.
The vertical profiles of MBC in the Arctic during the HIPPO campaigns generally show good agreement between observations and model simulations (Fig. 4a–e), except in August (HIPPO5). Liu and Matsui (2021b) greatly improved the agreement of the simulated vertical profiles of MBC with observations by improving aerosol removal processes for convective and mixed-phase clouds. The level of agreement of vertical profiles of MBC with observations in this study is similar to that in Liu and Matsui (2021b) for the HIPPO campaigns. The simulations overestimate observed MBC in summer (especially in August), both at Utqiaġvik (formerly Barrow) and in the HIPPO5 campaign (Figs. 2a, 3a, and 4e). Model simulations might overestimate BC emissions from biomass burning sources in and around Alaska in summer because their contributions to Arctic BC are large in summer (Sect. 3.3).

Figure 4Comparisons between observations (black) and model simulations (red) for BC mass concentration (MBC) vertical profiles at high latitudes in the Northern Hemisphere during (a–e) the HIPPO campaigns (a January 2009, b November 2009, c March–April 2010, d June 2011, and e August 2011), (f–g) the ARCTAS campaigns (f April 2008 and g July 2008), and the PAMARCMiP campaign in March–April 2018. For the HIPPO campaigns, simulated MBC concentrations are averaged over the region of 60–80∘ N, 140–170∘ W for the observation year and month. For the other campaigns, simulated MBC concentrations are averaged for 7 years (2009–2015) over the regions of 60–80∘ N, 70–165∘ W in April for ARCTAS-A; 45–87∘ N, 40–135∘ W in July for ARCTAS-B; and 78–85∘ N, 24∘ W–20∘ E in March for PAMARCMiP. For the observed MBC, the means and standard deviations are shown against atmospheric pressure for the HIPPO and ARCTAS campaigns, and the medians and 25th–75th percentiles are shown against altitude for the PAMARCMiP campaign.
We also compare our model simulations with aircraft observations in the ARCTAS and PAMARCMiP campaigns (Fig. 4f–h), although the years of observations and model simulations are not the same. Our model-simulated MBC levels (∼ 10 ng kg−1) during the spring season in the European Arctic (∼ 80∘ N) are generally consistent with the observed MBC in the PAMARCMiP campaign (Fig. 4h). The model simulations underestimate MBC in the ARCTAS campaign (Fig. 4f and g) because it is higher than MBC in the HIPPO and PAMARCMiP campaigns. This might reflect the high activity of biomass burning and the resulting high emissions of BC in 2008, when the ARCTAS campaigns were conducted (Ohata et al., 2021a).
Simulated MBC in snow tends to be about a factor of 2–3 higher than observed MBC in snow in Finland, Alaska, Siberia, and Greenland (Fig. S5). However, the simulated MBC in snow agrees with the observations within a factor of 10 at almost all snow sampling sites (Fig. 5a). In addition, the model simulations generally reproduce the observed features with higher MBC in snow over Finland and Siberia and lower over Alaska and Greenland. The simulated MBC in snow has a spatial distribution with higher concentrations in the Siberian side of the Arctic and lower concentrations in the North American side of the Arctic (Fig. 5b), which is consistent with the results of previous studies (e.g., Flanner et al., 2007).

Figure 5(a) Scatter plot of observed and simulated BC mass concentrations (MBC) in snow in Finland (blue circles), Alaska (light blue), Siberia (green), Greenland (black), and Ny-Ålesund (blue squares). Observed data are taken from Mori et al. (2019). Simulation results (monthly averages) are shown for individual sampling points (latitude, longitude) and periods (years, months). Closed and open circles indicate MBC in column snow and surface snow, respectively. The 1:1 line (solid black line) and the 10:1 and 1:10 lines (dashed lines) are also shown. (b) Simulated MBC in column snow at high latitudes in the Northern Hemisphere in March (2009–2015). Dashed circles indicate the approximate area where snow samplings were performed (Mori et al., 2019).
There are uncertainties in comparisons between observations and model simulations. For example, observation data (e.g., aircraft and snow BC data) and model simulation outputs have different spatial and temporal scales. Observed data are for a specific location and time, with timescales of minutes (aircraft observations) to days (snow observations), whereas in comparisons with aircraft observations, we used monthly model outputs for a specific region (e.g., 60–80∘ N and 140–170∘ W for HIPPO), and in comparisons with snow BC, we used monthly averaged model outputs over a horizontal grid of about 200 km. Observations suggest that snow BC concentrations vary widely over fine spatial and temporal scales, but model outputs do not fully resolve this variability (Fig. 5a). These uncertainties in comparisons between observations and models are seen not only in this study, but in all studies using both observations and model simulations (e.g., Schutgens et al., 2017). Despite these uncertainties in observation–model comparisons, the results obtained in this study are comparable to or better than those obtained by previous studies in terms of the reproducibility of BC observations in the Arctic.
3.2 Spatial distribution of BC
In the Northern Hemisphere, MBC_SRF, MBC_COL, MBC_DEP, and REBC_TOA are largest in East Asia and Central Africa, where REBC_TOA exceeds 2 W m−2 (Fig. 6a–d). Global averages of MBC_SRF, MBC_COL, MBC_DEP, and REBC_TOA are 0.14 µg m−3, 0.15 Tg, 9.6 Tg yr−1, and 0.40 W m−2, respectively, and Arctic (>70∘ N) averages are 0.020 µg m−3, 0.0016 Tg, 0.052 Tg yr−1, and 0.31 W m−2, respectively. The atmospheric lifetime of BC (ratio of MBC_DEP to atmospheric BC burden) is estimated to be 5.6 d for the global average and 11 d for the Arctic average. The global BC lifetime in the simulations is within the range of previous estimates, as summarized in Liu and Matsui (2021b). REBC_SNOW has large values (>1 W m−2) in high mountain areas in the midlatitudes, Siberia, and coastal areas of southern Greenland (Fig. 6e), and the global and Arctic averages are estimated to be 0.047 and 0.19 W m−2.

Figure 6Spatial distributions of (a) MBC_SRF, (b) MBC_COL, (c) MBC_DEP, (d) REBC_TOA, and (e) REBC_SNOW in the Northern Hemisphere. The values in parentheses are global (left) and Arctic (right) mean values (annual mean). Purple shows areas where values are below the minimum shown on the color bars.
Some previous studies have estimated the burden and direct radiative forcing (preindustrial to present-day) of BC for north of 60∘ N. In this study, MBC_COL is estimated to be 0.0043 Tg (>60∘ N), which is slightly lower than the range of previous estimates (e.g., 0.0054–0.0091 Tg in Mahmood et al., 2016). The direct radiative forcing of anthropogenic BC at TOA is 0.17 W m−2 (>60∘ N), which is within the range of the Aerosol Comparisons between Observations and Models (AeroCom)-modeled estimates of 0.03–0.37 W m−2 (median 0.19 W m−2) in Sand et al. (2017). REBC_SNOW is 0.21 W m−2 (>60∘ N), which is also consistent with the AeroCom estimate of 0.17 W m−2 (0.06–0.28 W m−2) reported in Jiao et al. (2014).
Table 2Simulated BC statistics in the Arctic (>70∘ N).
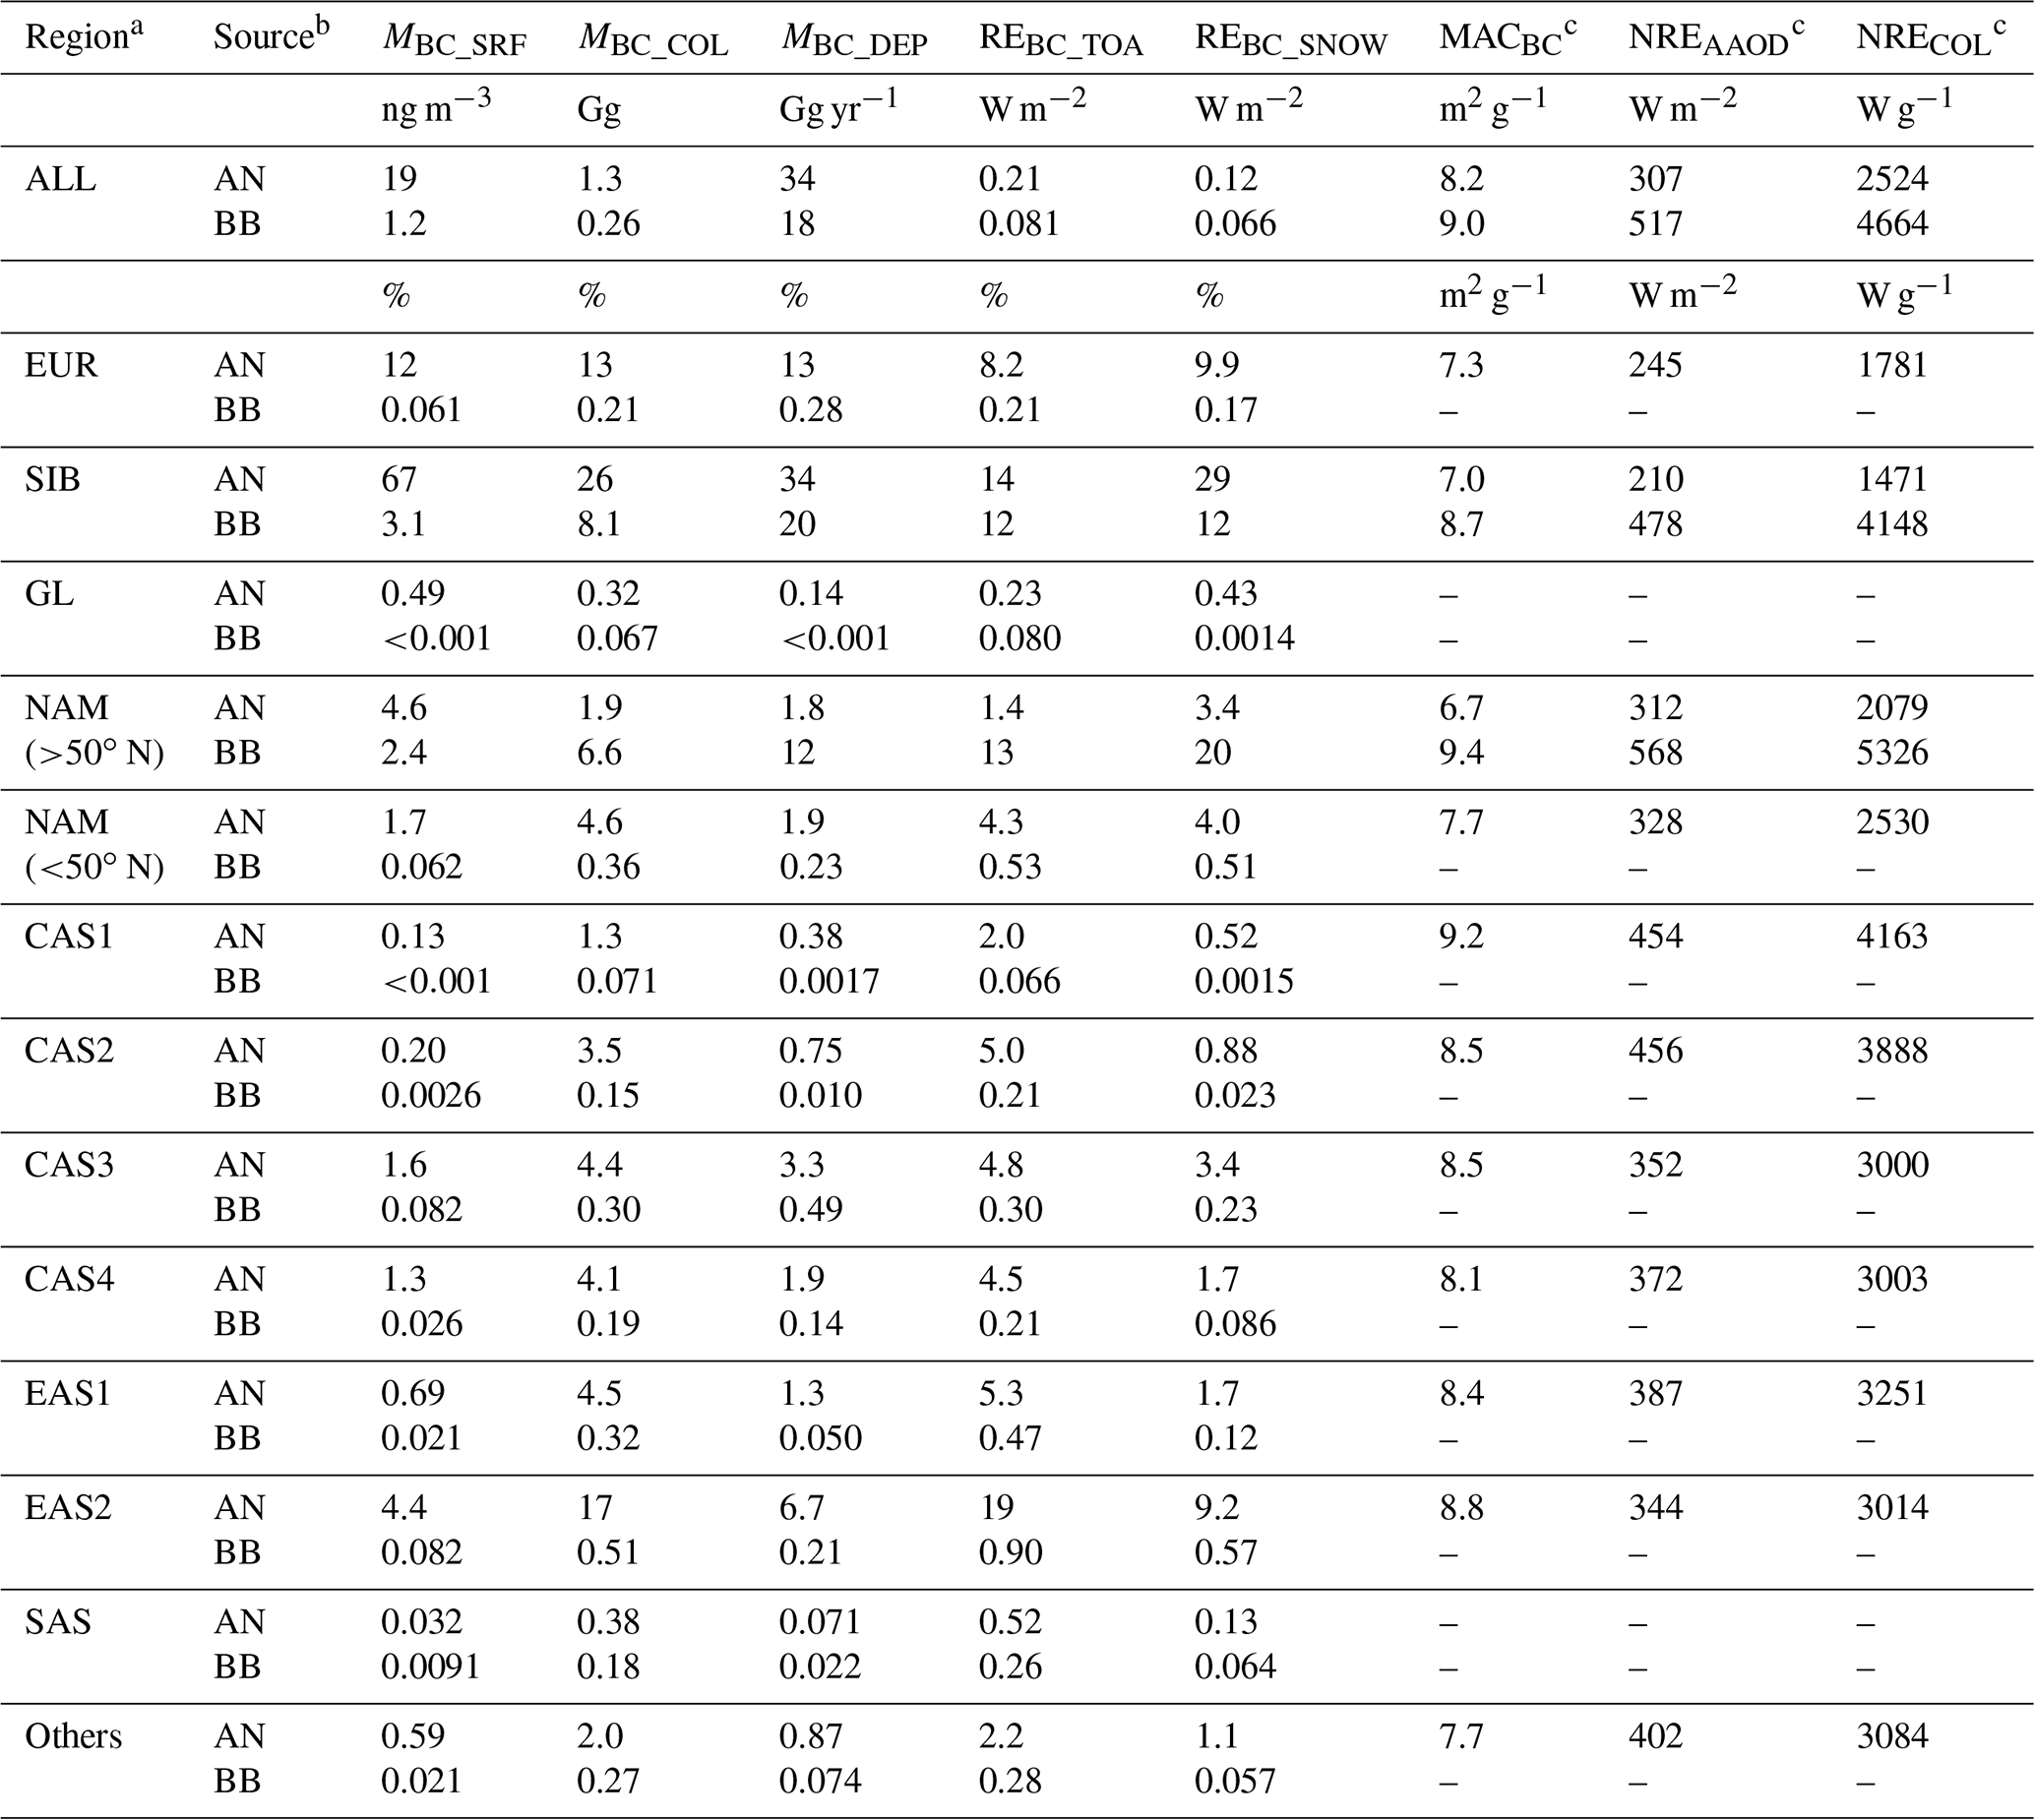
a EUR – Europe, SIB – Siberia, GL – Greenland, NAM – North America, CAS – Central Asia, EAS – East Asia, SAS – Southeast Asia. These regions are defined in Fig. 1. b AN – anthropogenic (fossil fuel + biofuel), and BB – biomass burning. c Values are shown only for regions/sources of which contributions are greater than 1 %.
3.3 Source contributions of Arctic BC
The estimated source contributions to the five variables (MBC_SRF, MBC_COL, MBC_DEP, REBC_TOA, and REBC_SNOW) differ greatly (Fig. 7). For MBC_SRF, the contribution from Siberia is dominant (70 %), followed by Europe (12 %) and Asia (Central Asia + East Asia + Southeast Asia) (8.6 %). Anthropogenic sources account for 94 % of the total. In contrast, for MBC_COL, the contribution from Asia accounts for 37 %, which is larger than the contributions from Siberia (34 %) and Europe (13 %). The larger contribution from Asia is due to BC transport from high-latitude (nearby) sources being dominant near the surface, whereas the contribution of BC transported over long distances from the midlatitudes is larger in the middle and upper troposphere in the Arctic (e.g., Stohl, 2006).
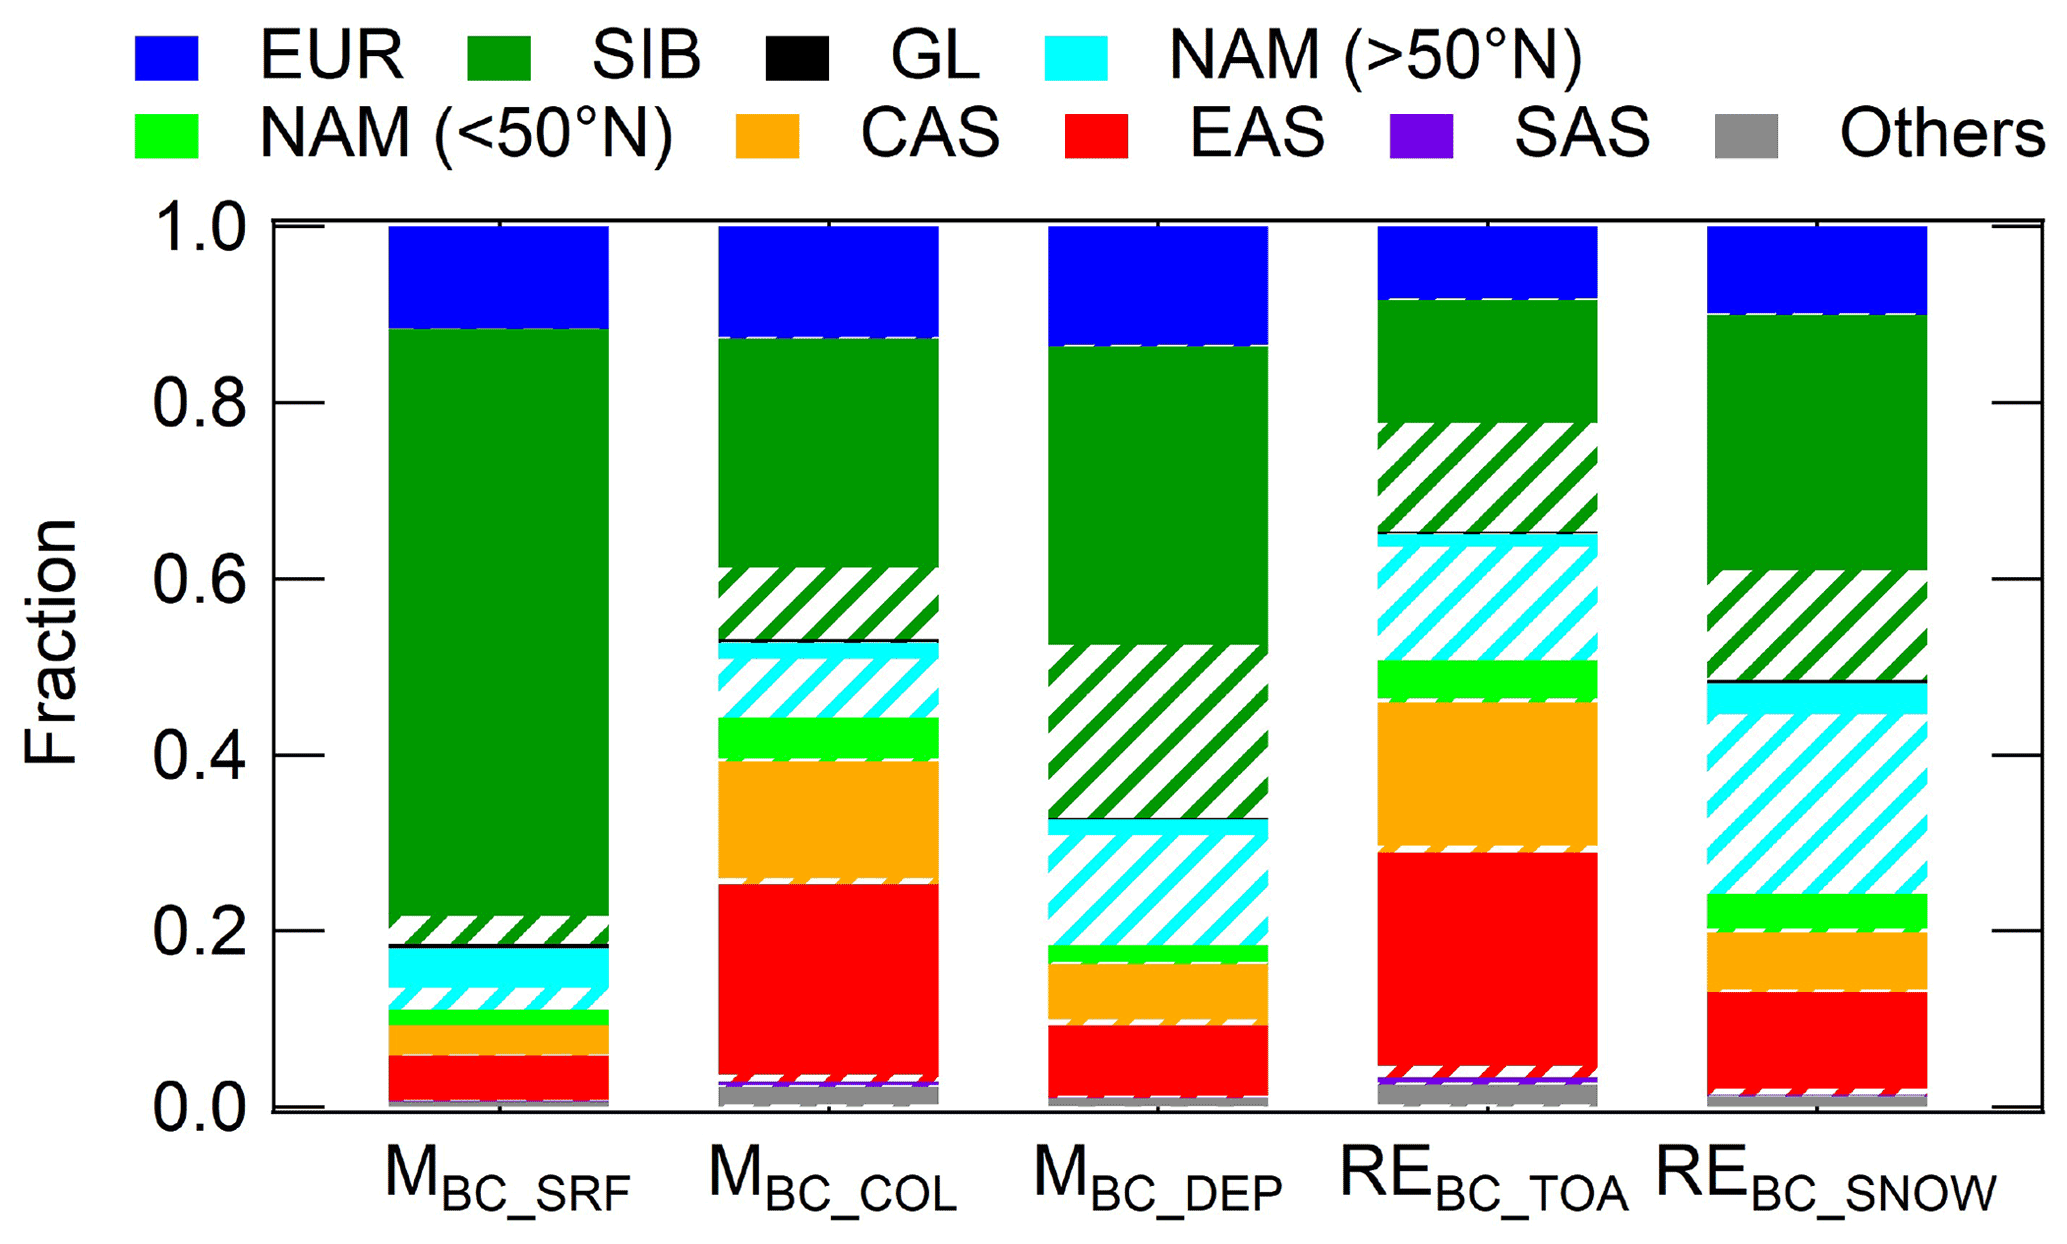
Figure 7Source contributions to MBC_SRF, MBC_COL, MBC_DEP, REBC_TOA, and REBC_SNOW (from left to right) in the Arctic (annual mean). The filled and shaded areas indicate contributions from anthropogenic and biomass burning sources, respectively. EUR, SIB, GL, NAM, CAS, EAS, and SAS denote Europe, Siberia, Greenland, North America, Central Asia, East Asia, and Southeast Asia, respectively.
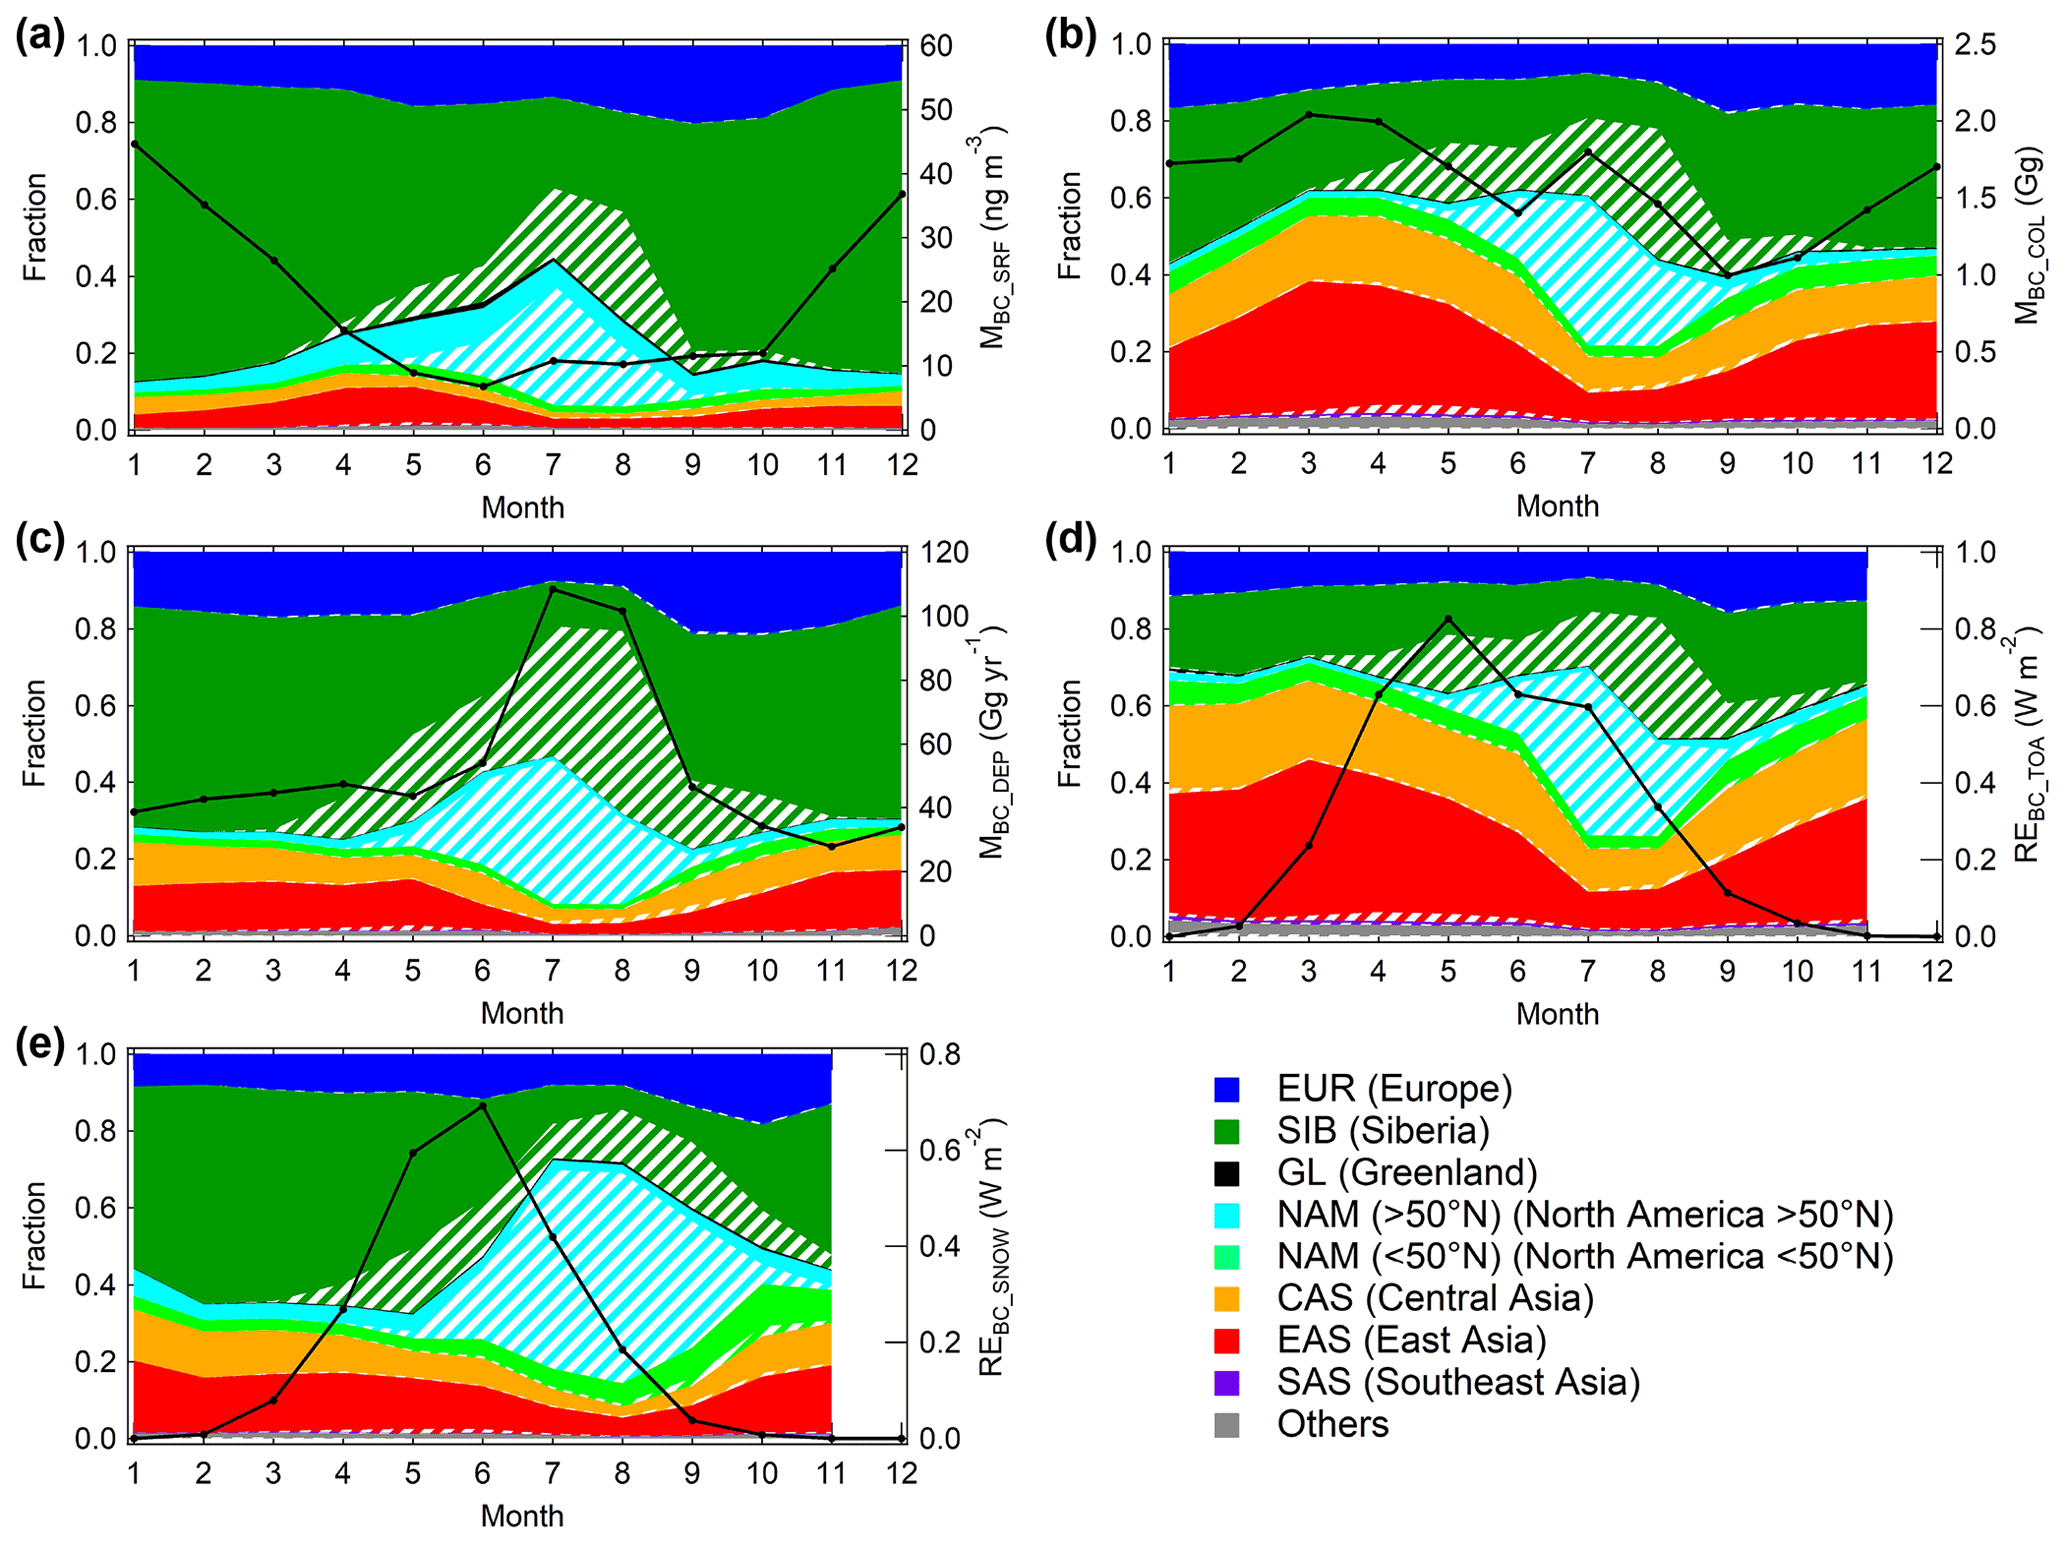
Figure 8Monthly variations of source contributions to (a) MBC_SRF, (b) MBC_COL, (c) MBC_DEP, (d) REBC_TOA, and (e) REBC_SNOW in the Arctic. The filled and shaded areas indicate contributions from anthropogenic and biomass burning sources, respectively. The black lines (right axis) show total BC concentrations, deposition flux, or radiative effects from all sources.
The major contribution from Siberia to MBC_SRF estimated in this study is consistent with some previous studies (e.g., Ikeda et al., 2017). In contrast, other studies have reported a large contribution from Europe and North America to MBC_SRF (e.g., Wang et al., 2014). This difference is due at least partly to the different definitions of the Siberian region among studies and the different years of emissions used (e.g., 2010 in this study and 2000 in earlier studies). The contribution of Siberia is also strongly dependent on the choice of emission inventories because there is a large uncertainty in BC emissions in Siberia; for example, Huang et al. (2015) estimated the largest contribution to be from gas flaring, whereas Winiger et al. (2017) suggested that domestic and transport sources are more important in Siberia than gas flaring.
BC emitted from Asian regions south of 30∘ N (Central Asia 1 and 2, East Asia 1, and Southeast Asia) accounts for 1.1 % of the total MBC_SRF and 10 % of the total MBC_COL in the Arctic. Previous modeling studies have reported that BC emitted from low latitudes in Asia (e.g., Southeast Asia) can be transported to the Arctic (e.g., Koch and Hansen, 2005; Zhao et al., 2021). In the model simulations in this study, however, the contribution of BC emitted from low latitudes (south of 30∘ N) to the Arctic region is small (Table 2).
The contribution of midlatitude (high-latitude) sources to MBC_DEP is larger (smaller) than that to MBC_SRF and smaller (larger) than that to MBC_COL. The largest contribution to MBC_DEP is from Siberia (53 %), followed by North America, Europe, East Asia, and Central Asia. Because BC deposition is caused mainly by cloud and precipitation processes, the source contribution to MBC_DEP depends on the source contribution to atmospheric BC at the altitude where clouds exist (e.g., mainly 2–4 km at Utqiaġvik (formerly Barrow); Mori et al., 2020). MBC_SRF and MBC_COL show seasonal variations with maxima in winter and spring (black lines in Fig. 8a and b), whereas MBC_DEP shows seasonal variation with a maximum in summer (black line in Fig. 8c). Because the contribution of BC from biomass burning sources is large in summer (Fig. 8c), their annual-mean contribution to MBC_DEP (34 %; mainly from Siberia and North America) is larger than that to MBC_SRF and MBC_COL (5.9 % and 17 %, respectively). This result is consistent with recent isotope-based observations showing that the contribution of biomass burning sources to snow BC is larger than their contribution to atmospheric BC (Rodriguez et al., 2020).
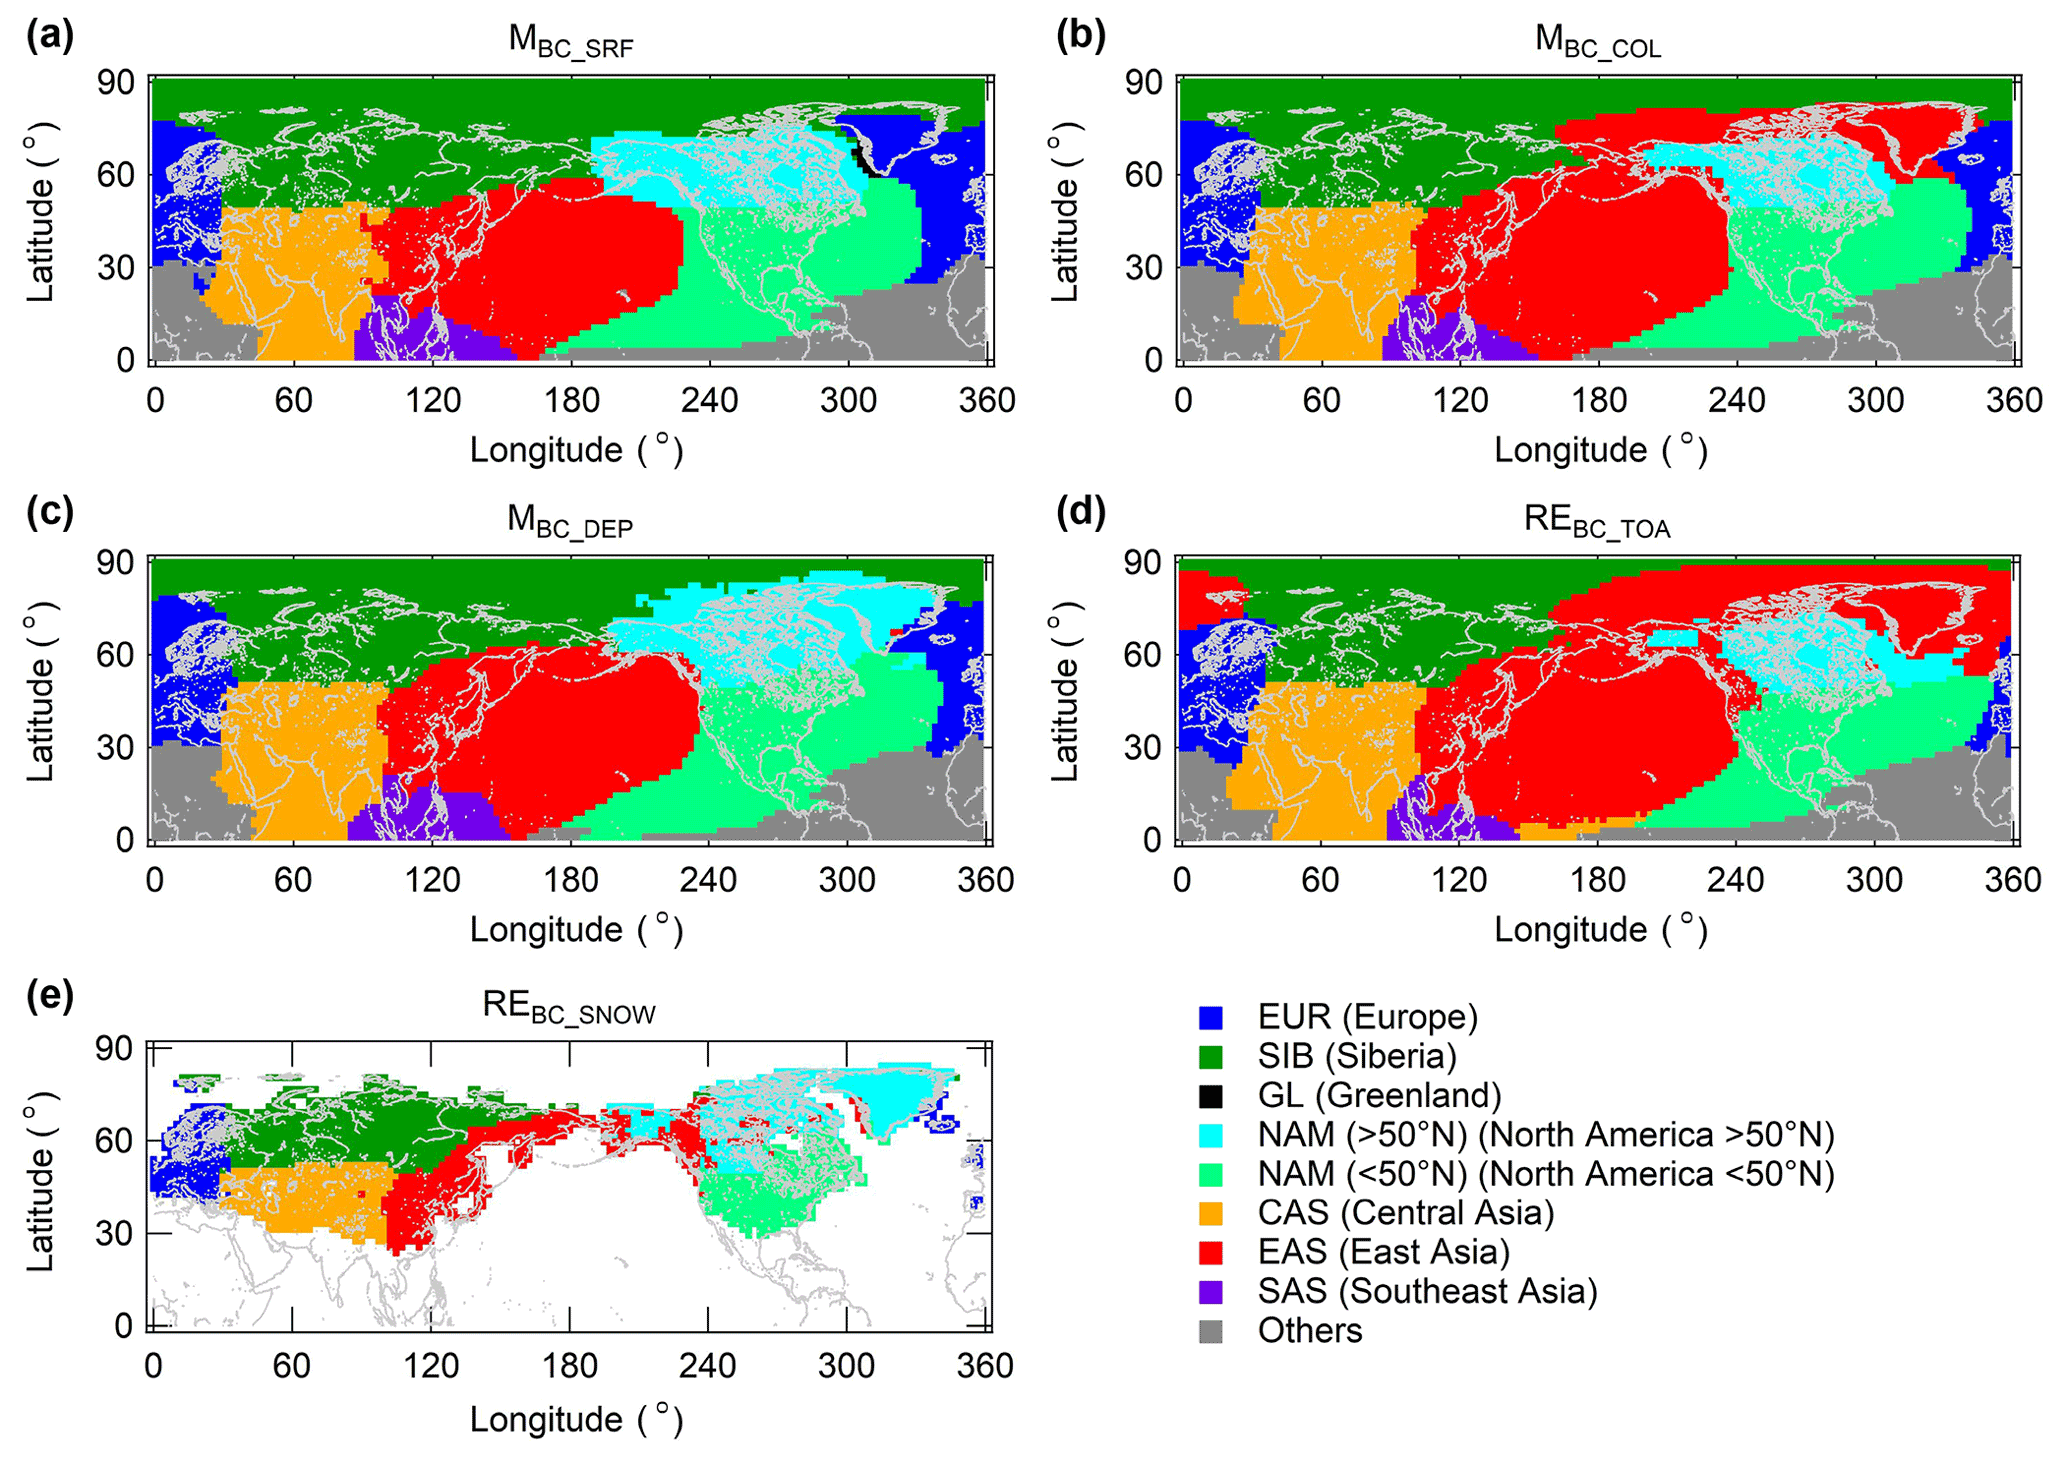
Figure 9Spatial distributions of emission sources with the largest contribution to (a) MBC_SRF, (b) MBC_COL, (c) MBC_DEP, (d) REBC_TOA, and (e) REBC_SNOW among the nine source regions.
The contribution of Asia (East Asia + Central Asia + Southeast Asia) to REBC_TOA is 43 %, which is larger than its contribution to MBC_SRF (8.6 %) and MBC_COL (37 %). In contrast, the contributions of anthropogenic BC from Siberia and Europe to REBC_TOA are 14 % and 8.2 %, respectively, which are smaller than their contributions to MBC_COL (26 % and 13 %, respectively). These results are obtained because the radiative effect per unit MBC_COL (the radiative effect normalized by MBC_COL (NRECOL)) for anthropogenic BC from Asia is larger than that for anthropogenic BC from Siberia and Europe, as discussed in Sect. 3.4. The contribution of biomass burning sources to REBC_TOA (29 %) is larger than that to MBC_COL (17 %) because MBC_COL is higher in winter and early spring when anthropogenic sources dominate (Fig. 8b), whereas REBC_TOA is largest in late spring and summer when the contribution of biomass burning sources is large (Fig. 8d). Annual-mean source contributions are therefore significantly different between REBC_TOA and MBC_COL (Fig. 7).
The source contributions to REBC_SNOW are generally similar to those to MBC_DEP. The contribution from Siberia is largest (41 %), followed by North America (>50∘ N) (24 %) and Asia (19 %) (Fig. 7). The contributions of these sources are large in both online and offline calculations (Sect. 2, Fig. S2). Because REBC_SNOW in the Arctic is largest in late spring and summer in this study (Fig. 8e), the contribution of biomass burning sources to REBC_SNOW (35 %) is larger than that to atmospheric concentrations (5.9 % and 17 % for MBC_SRF and MBC_COL, respectively).
The source contributions to the five variables differ significantly not only on an annual average basis, but also on a monthly basis (Fig. 8). The contribution of anthropogenic BC from Siberia to MBC_SRF reaches 75 % in winter (December–February) (Fig. 8a). The contribution of Asia (East Asia + Central Asia + Southeast Asia) to MBC_SRF is less than 15 % throughout the year, whereas its contributions to MBC_COL and REBC_TOA are large in winter and spring: 52 % to MBC_COL and 63 % to REBC_TOA in March (Fig. 8b and d). The contributions of biomass burning sources to the five variables are largest in summer, 12 %–34 % from Siberia and 19 %–41 % from North America (>50∘ N) (June–August average). The large contribution of biomass burning sources to MBC_SRF and MBC_COL during summer is consistent with previous studies (e.g., Winiger et al., 2019).
Figure 9 shows the spatial distributions of the source regions with the largest contributions to BC among nine source regions: Europe, Siberia, Greenland, North America (>50∘ N), North America (<50∘ N), Central Asia, East Asia, Southeast Asia, and others. The contribution of each emission source is largest near the source. Sources making the largest contributions to Arctic BC differ significantly among the five variables. For MBC_SRF, Siberia's contribution is the largest over 77 % of the total Arctic area (Fig. 9a), followed by Europe (14 %) and North America (>50∘ N) (8.9 %). For MBC_DEP, Siberia's contribution is the largest over 60 % of the total Arctic area (Fig. 9c), followed by North America (>50∘ N) (30 %) and Europe (10 %). There is no area of the Arctic where the contribution of East Asia is the largest for MBC_SRF and MBC_DEP.
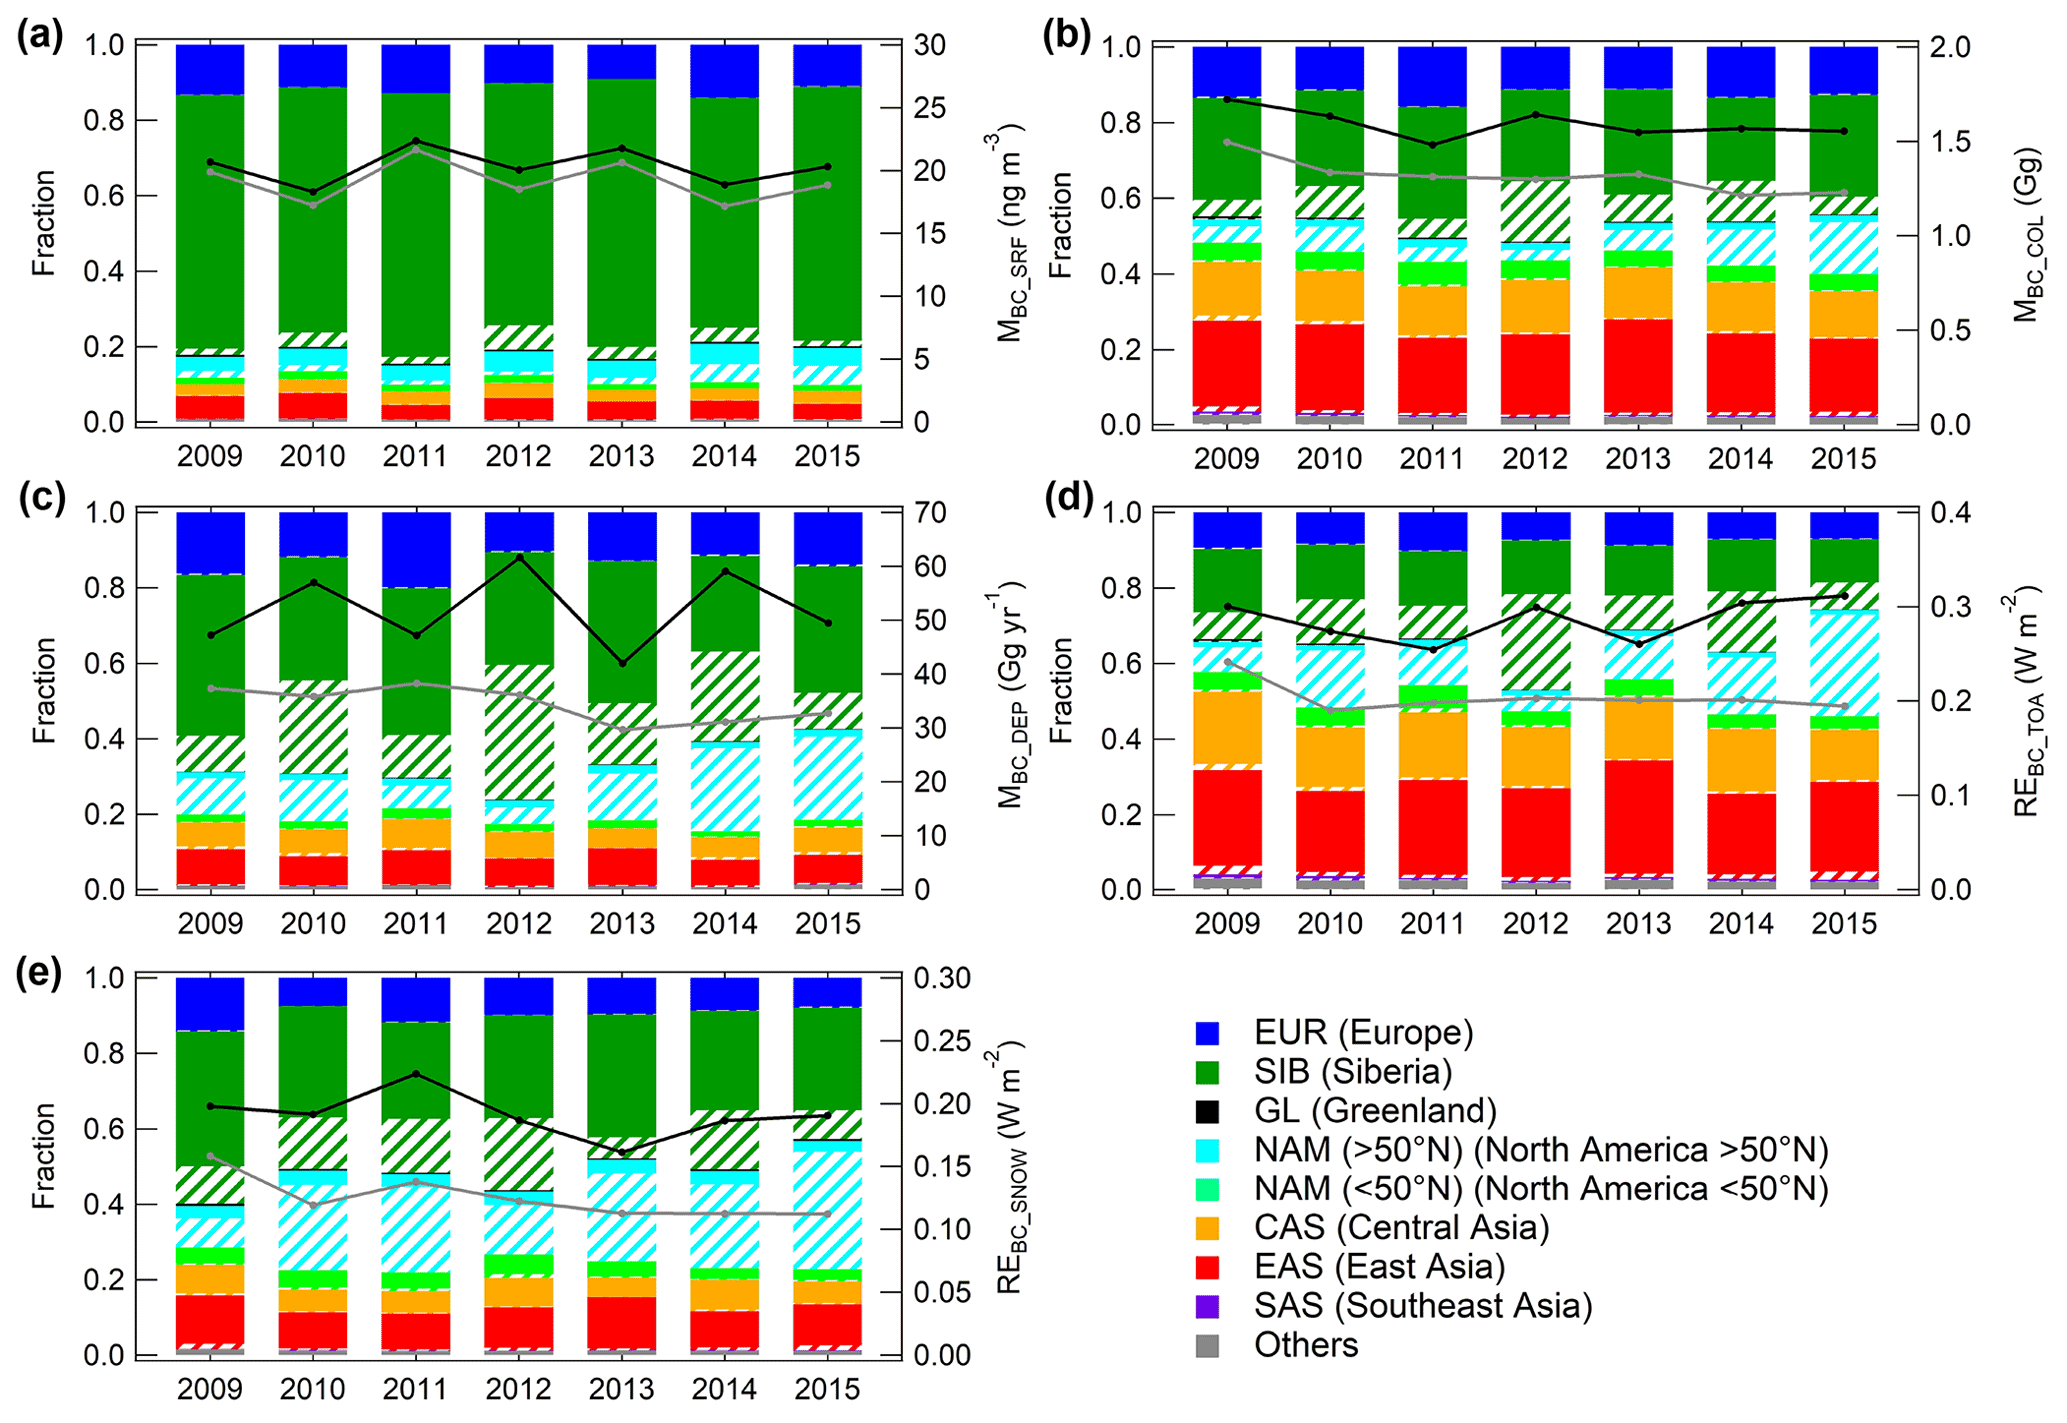
Figure 10Year-to-year variations of annual-mean source contributions to (a) MBC_SRF, (b) MBC_COL, (c) MBC_DEP, (d) REBC_TOA, and (e) REBC_SNOW in the Arctic for the years from 2009 to 2015 (left axis). The filled and shaded areas indicate contributions from anthropogenic and biomass burning sources, respectively. The black and grey lines show BC concentrations, deposition flux, or radiative effects from all (anthropogenic + biomass burning) sources and from anthropogenic sources, respectively (right axis).
Unlike MBC_SRF and MBC_DEP, for MBC_COL, the Arctic area where the contribution of East Asia is the largest extends over the North American side of the Arctic (38 % of the Arctic area) (Fig. 9b), and the area where Siberia's contribution is the largest extends over the Siberian side of the Arctic (53 % of the Arctic area). For REBC_TOA, the contribution from East Asia (Siberia) is the largest over 56 % (39 %) of the Arctic region (Fig. 9d). For REBC_SNOW, which is limited to land areas, North America's (>50∘ N) contribution is the largest over 53 % of the Arctic area (over the North American side of the Arctic), and the contributions of Siberia, Europe, and East Asia are the largest over 40 %, 4.5 %, and 3.2 %, respectively, of the Arctic area (over the Siberian side of the Arctic) (Fig. 9e).
The source contributions of BC show year-to-year variability, mainly in response to interannual variations in BC emissions at midlatitudes and high latitudes (Fig. 10). For the years 2012, 2015, and 2016, BC emissions from biomass burning sources north of 50∘ N are about twice those for the other years, and the contributions from biomass burning sources to MBC_COL and REBC_TOA are larger in the Arctic (Fig. 10b and d). The contributions from biomass burning sources in Siberia and North America (>50∘ N) to MBC_DEP, REBC_TOA, and REBC_SNOW vary between years by a factor of 3.4 to 6.4 (by up to about 20 %), with large interannual variability (Fig. 10, Table S1). Compared with those of biomass burning BC, the source contributions of anthropogenic BC show smaller interannual variability: source contributions generally vary within a factor of 2 (within 10 %). Our anthropogenic BC emissions north of 50∘ N decrease by about 10 % from 2009 to 2015 (Fig. S6a). In addition, the atmospheric lifetime of anthropogenic BC north of 50∘ N is longest in 2009 (Fig. S6b). For these reasons, the source contribution of anthropogenic BC is largest in 2009 and tends to decrease in subsequent years (Fig. 10). Overall, the source contributions to the five BC variables show interannual variation to some extent, but the qualitative source characteristics (e.g., which sources make large contributions) do not change significantly during the simulation periods.
In summary, the results shown in this section demonstrate that the source contributions (Figs. 7 and 8) and the spatial distributions of the areas making the largest contributions (Fig. 9) to Arctic BC differ substantially among MBC_SRF, MBC_COL, MBC_DEP, REBC_TOA, and REBC_SNOW for all years simulated.
3.4 Different radiative effect efficiency among sources
CAM-ATRAS uses 47 bins for each of the 26 emission sources to calculate the particle size and mixing state of BC for each source (Sect. 2). Using this information, in this section, we estimate microphysical properties, absorption aerosol optical depth (AAOD), and radiative effects of BC for all emission sources and investigate their differences. REBC_TOA can be decomposed into three components by Eq. (2) (Matsui et al., 2018b):
where AAODBC is the AAOD of BC at the wavelength of 550 nm. MACBC is defined as the ratio of AAODBC to MBC_COL. The BC radiative effect normalized by AAODBC (NREAAOD) is defined as the ratio of REBC_TOA to AAODBC. The BC radiative effect normalized by MBC_COL (NRECOL; RE or MACBC × NREAAOD) is also used. The global-mean NREAAOD and NRECOL in this study are 151 W m−2 and 1317 W g−1, respectively; these values are consistent with the median values of 130 W m−2 (84–216 W m−2) and 1322 W g−1 (612–2661 W g−1) in the AeroCom Phase II models (Myhre et al., 2013).
Figure 11 shows annual-mean MACBC, NREAAOD, and NRECOL values in the Arctic for eight major BC sources (six anthropogenic and two biomass burning sources). Anthropogenic BC from Europe, Siberia, and North America (>50∘ N) (6.7–7.3 m2 g−1) has lower MACBC than ALL BC (8.4 m2 g−1) (Fig. 11a, Table 2), whereas anthropogenic BC from Asia (Central Asia and East Asia) and biomass burning BC from Siberia and North America (>50∘ N) have higher MACBC values (8.5–9.4 m2 g−1). These differences in MACBC are because the mixing state of BC from each emission source differs. Compared with anthropogenic BC from Siberia, Europe, and North America (>50∘ N), anthropogenic BC particles from Asia have a higher fraction of thickly coated BC particles (which have higher MACBC) and a lower fraction of thinly coated BC particles (which have lower MACBC) (Fig. 12a). The higher fraction of thickly coated BC from Asia might be explained by fast aging processes near their sources, where the concentrations of condensable gases emitted with BC are high, and by the higher fraction of anthropogenic BC from Asia in the upper troposphere in the Arctic (Fig. S7) and its longer lifetime in the Arctic (24–30 d) (Fig. 12b). Biomass burning BC from Siberia and North America (>50∘ N) also has a higher fraction of thickly coated BC particles and a lower fraction of thinly coated BC particles than anthropogenic BC from Siberia, Europe, and North America (>50∘ N) (Fig. 12a), possibly because BC aging processes are faster in summer, when the contribution of biomass burning sources is larger, than in winter. The fraction of thickly coated BC was observed to be high in the Arctic in recent aircraft measurements by Ohata et al. (2021b), consistent with our model simulations, although it is difficult to observe the dependence of BC mixing states on emission sources. Our simulation results indicate the importance of understanding the differences in BC mixing states among sources and the mechanisms that control them in evaluating the source contribution of BC to REBC_TOA in the Arctic.
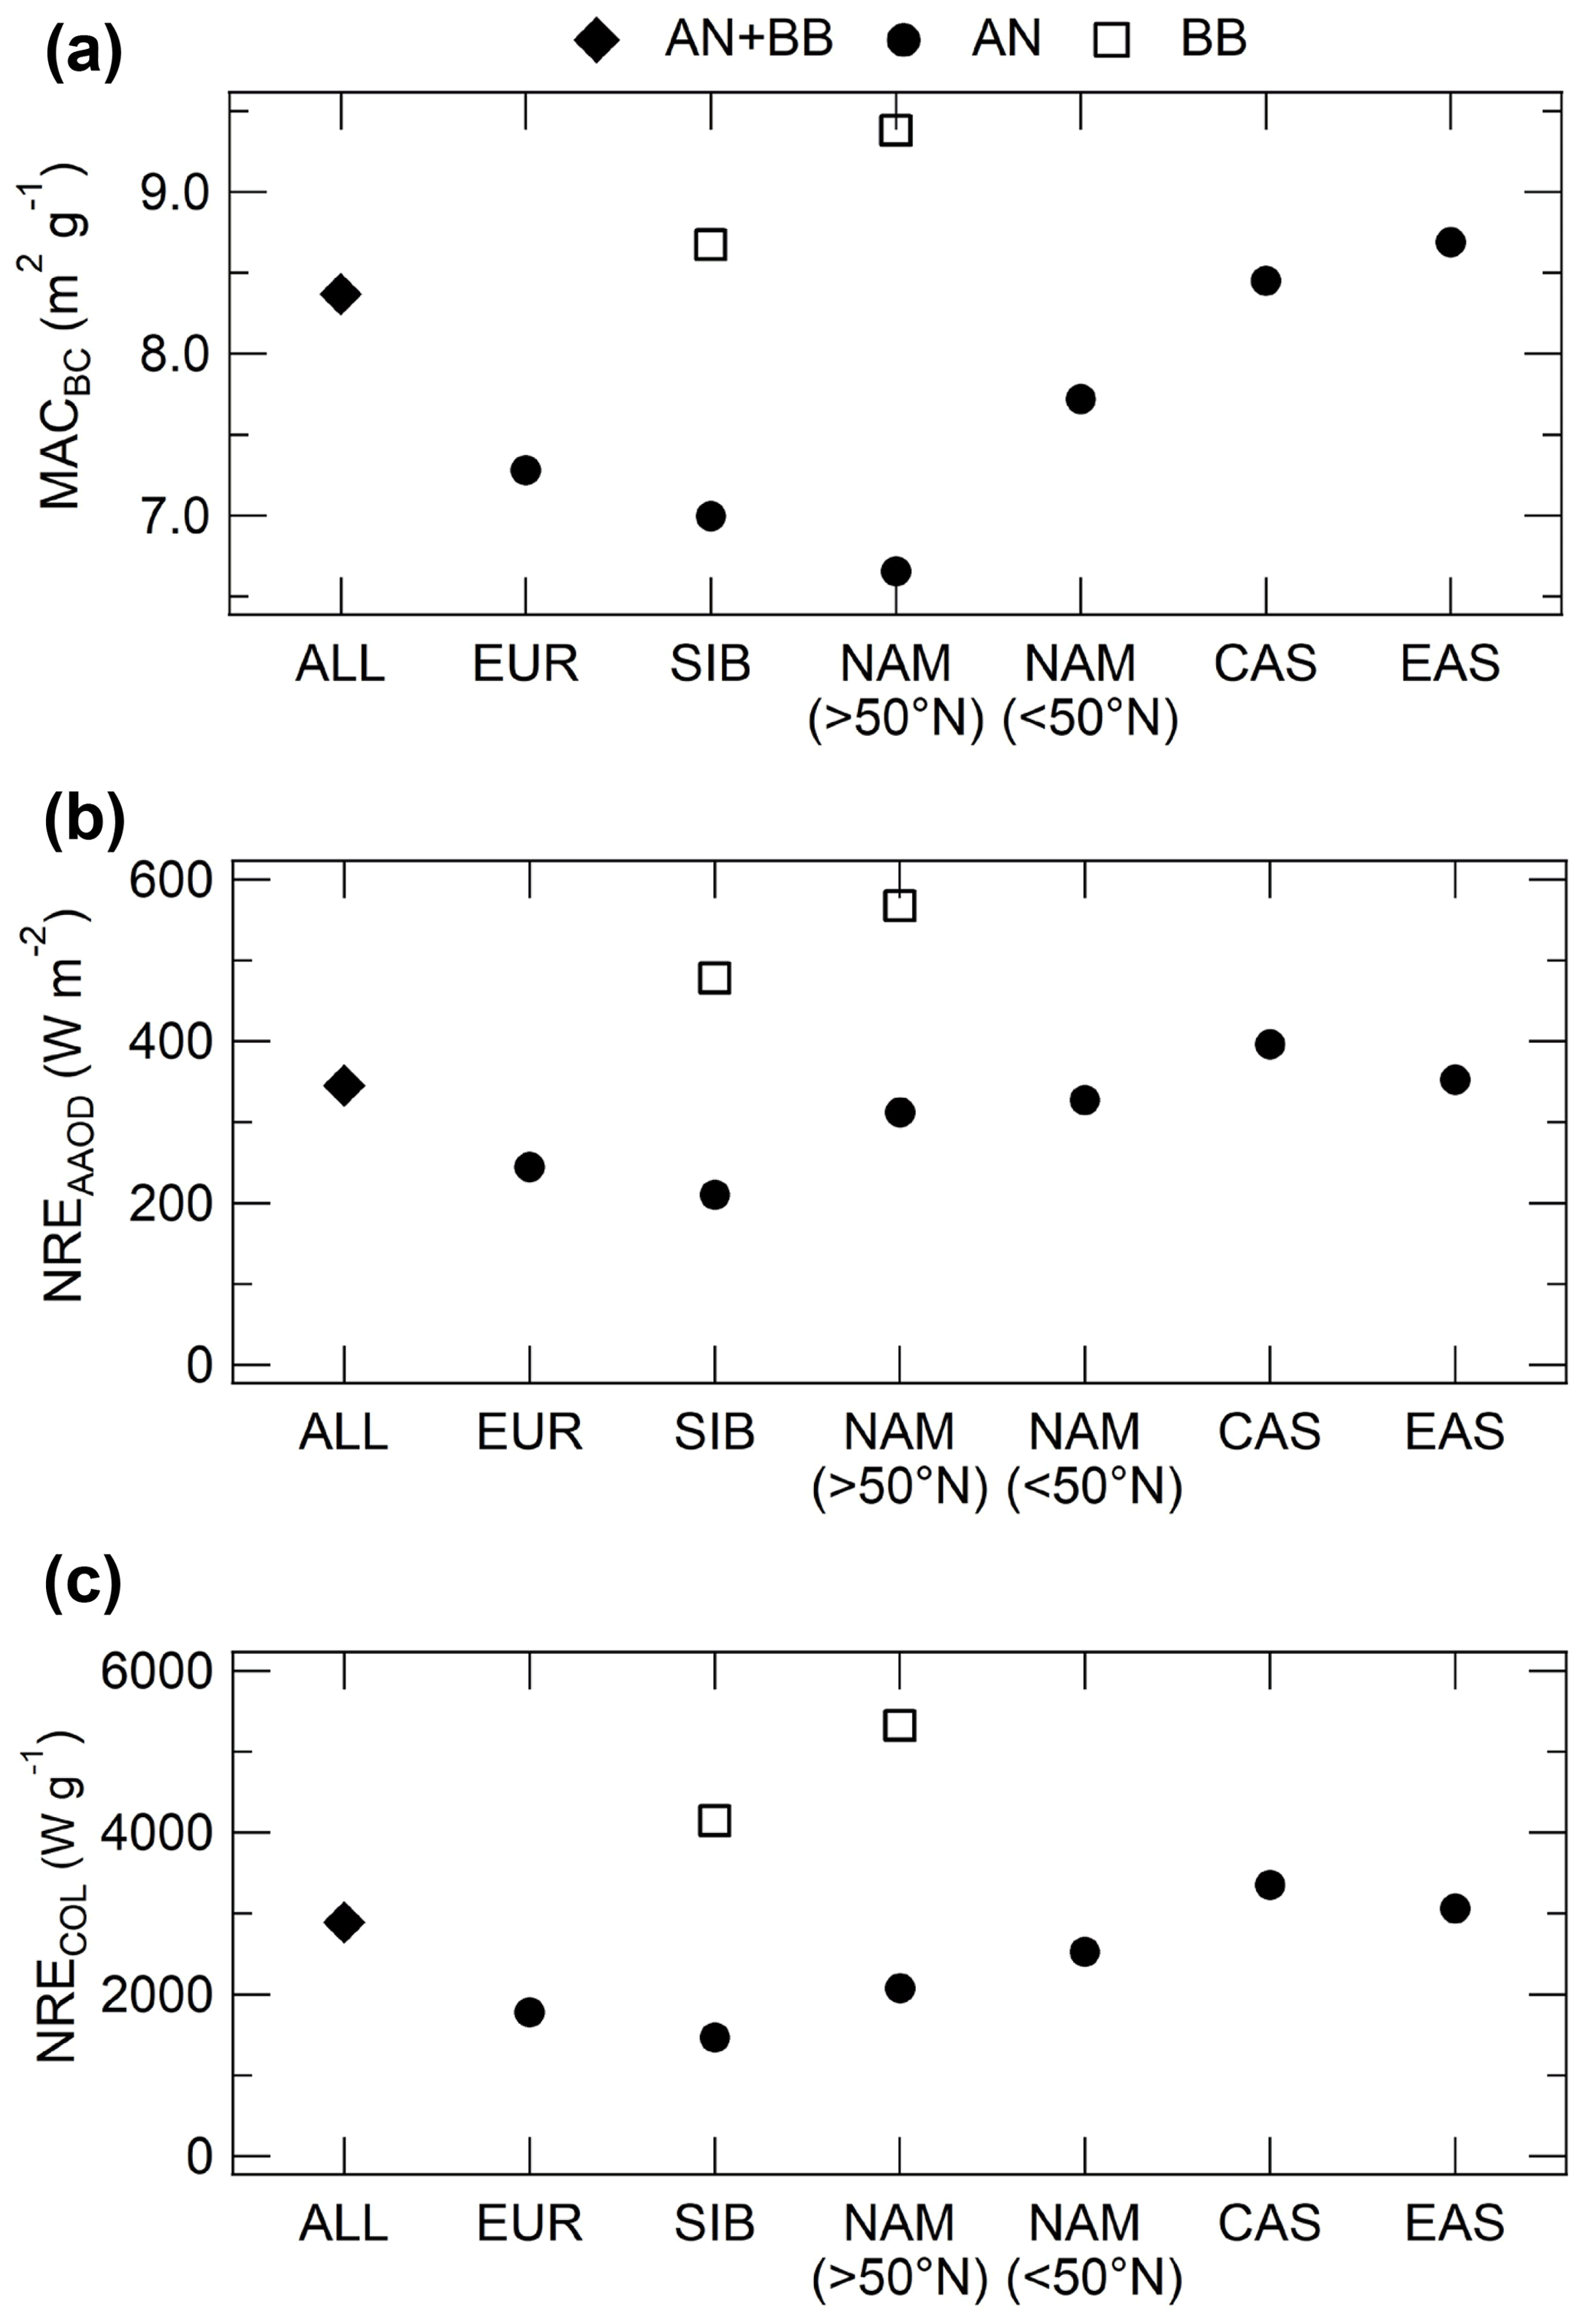
Figure 11Optical properties and radiative effect efficiencies in the Arctic for total BC (ALL; from all sources) and BC from the eight major sources (six anthropogenic (AN) sources and two biomass burning (BB) sources): (a) mass absorption cross section of BC (MACBC), (b) BC radiative effect normalized by absorption aerosol optical depth (AAOD) of BC (NREAAOD; REAAODBC), and (c) BC radiative effect normalized by MBC_COL (NRECOL; RE).

Figure 12(a) BC mixing state distributions for total BC mass (ALL) and for BC mass from the eight major sources (six anthropogenic (AN) sources and two biomass burning (BB) sources). BC particles are gradually shifted from the left (fresh BC with a lower MACBC) to the right (aged BC with a higher MACBC) by aging processes in the atmosphere. (b) Lifetimes in the Arctic for total BC (ALL) and for BC from eight major sources. Lifetimes were defined by the ratio of BC deposition flux to atmospheric BC loading in the Arctic.
Similar to MACBC, NREAAOD also differs substantially among emission sources. The NREAAOD value of anthropogenic BC from Europe and Siberia (210–245 W m−2, Arctic average) is 29 %–39 % lower than that of ALL BC (345 W m−2), whereas that of anthropogenic BC from Asia and biomass burning BC from Siberia and North America (>50∘ N) is 2.1 %–65 % higher (353–568 W m−2). NREAAOD depends on altitude, solar radiation, and surface albedo where BC exists. A higher fraction of BC at high altitudes and where the surface albedo is higher leads to a higher NREAAOD value (e.g., Samset and Myhre, 2015). Solar radiation in the Arctic is highest during the summer. Here, BC-concentration-weighted mean height (HeightBC), mean solar radiation (downward radiation flux at TOA) (FluxBC), and mean surface albedo (AlbedoBC) in the Arctic are defined for each emission source as follows:
where denotes the BC mass concentration in horizontal grid i, vertical grid k, month m, and emission source s; denotes MBC_COL in horizontal grid i, month m, and emission source s; and Height, Fluxi,m, and Albedoi,m are height (above sea level), solar radiation flux, and surface albedo, respectively, in each grid and month. These equations are calculated for grids in the Arctic (>70∘ N) to derive the mean height (HeightBC,s), mean solar radiation flux (FluxBC,s), and mean surface albedo (AlbedoBC,s), weighted by the BC mass concentration from each emission source s. The HeightBC values of anthropogenic BC from Asia (Central Asia + East Asia) (>3500 m in the Arctic) are higher than those of anthropogenic BC from Europe and Siberia (<2000 m) (Fig. 13a). In addition, the FluxBC values of anthropogenic BC from Asia (157–185 W m−2 in the Arctic) are 20 %–40 % higher than those of anthropogenic BC from Europe and Siberia (122–140 W m−2) (Fig. 13b). For these reasons, the NREAAOD values of anthropogenic BC from Asia are higher than those of anthropogenic BC from Europe and Siberia (Fig. 11b). The FluxBC values of biomass burning BC from Siberia and North America (>50∘ N) are 90 %–130 % (1.9–2.3 times) higher than those of ALL BC in the Arctic (Fig. 13b), owing to the larger amounts of biomass burning BC in summer when solar radiation flux is the highest in the Arctic. These higher FluxBC values of biomass burning BC are the main reason why biomass burning BC has a higher NREAAOD than anthropogenic BC (Fig. 11b).
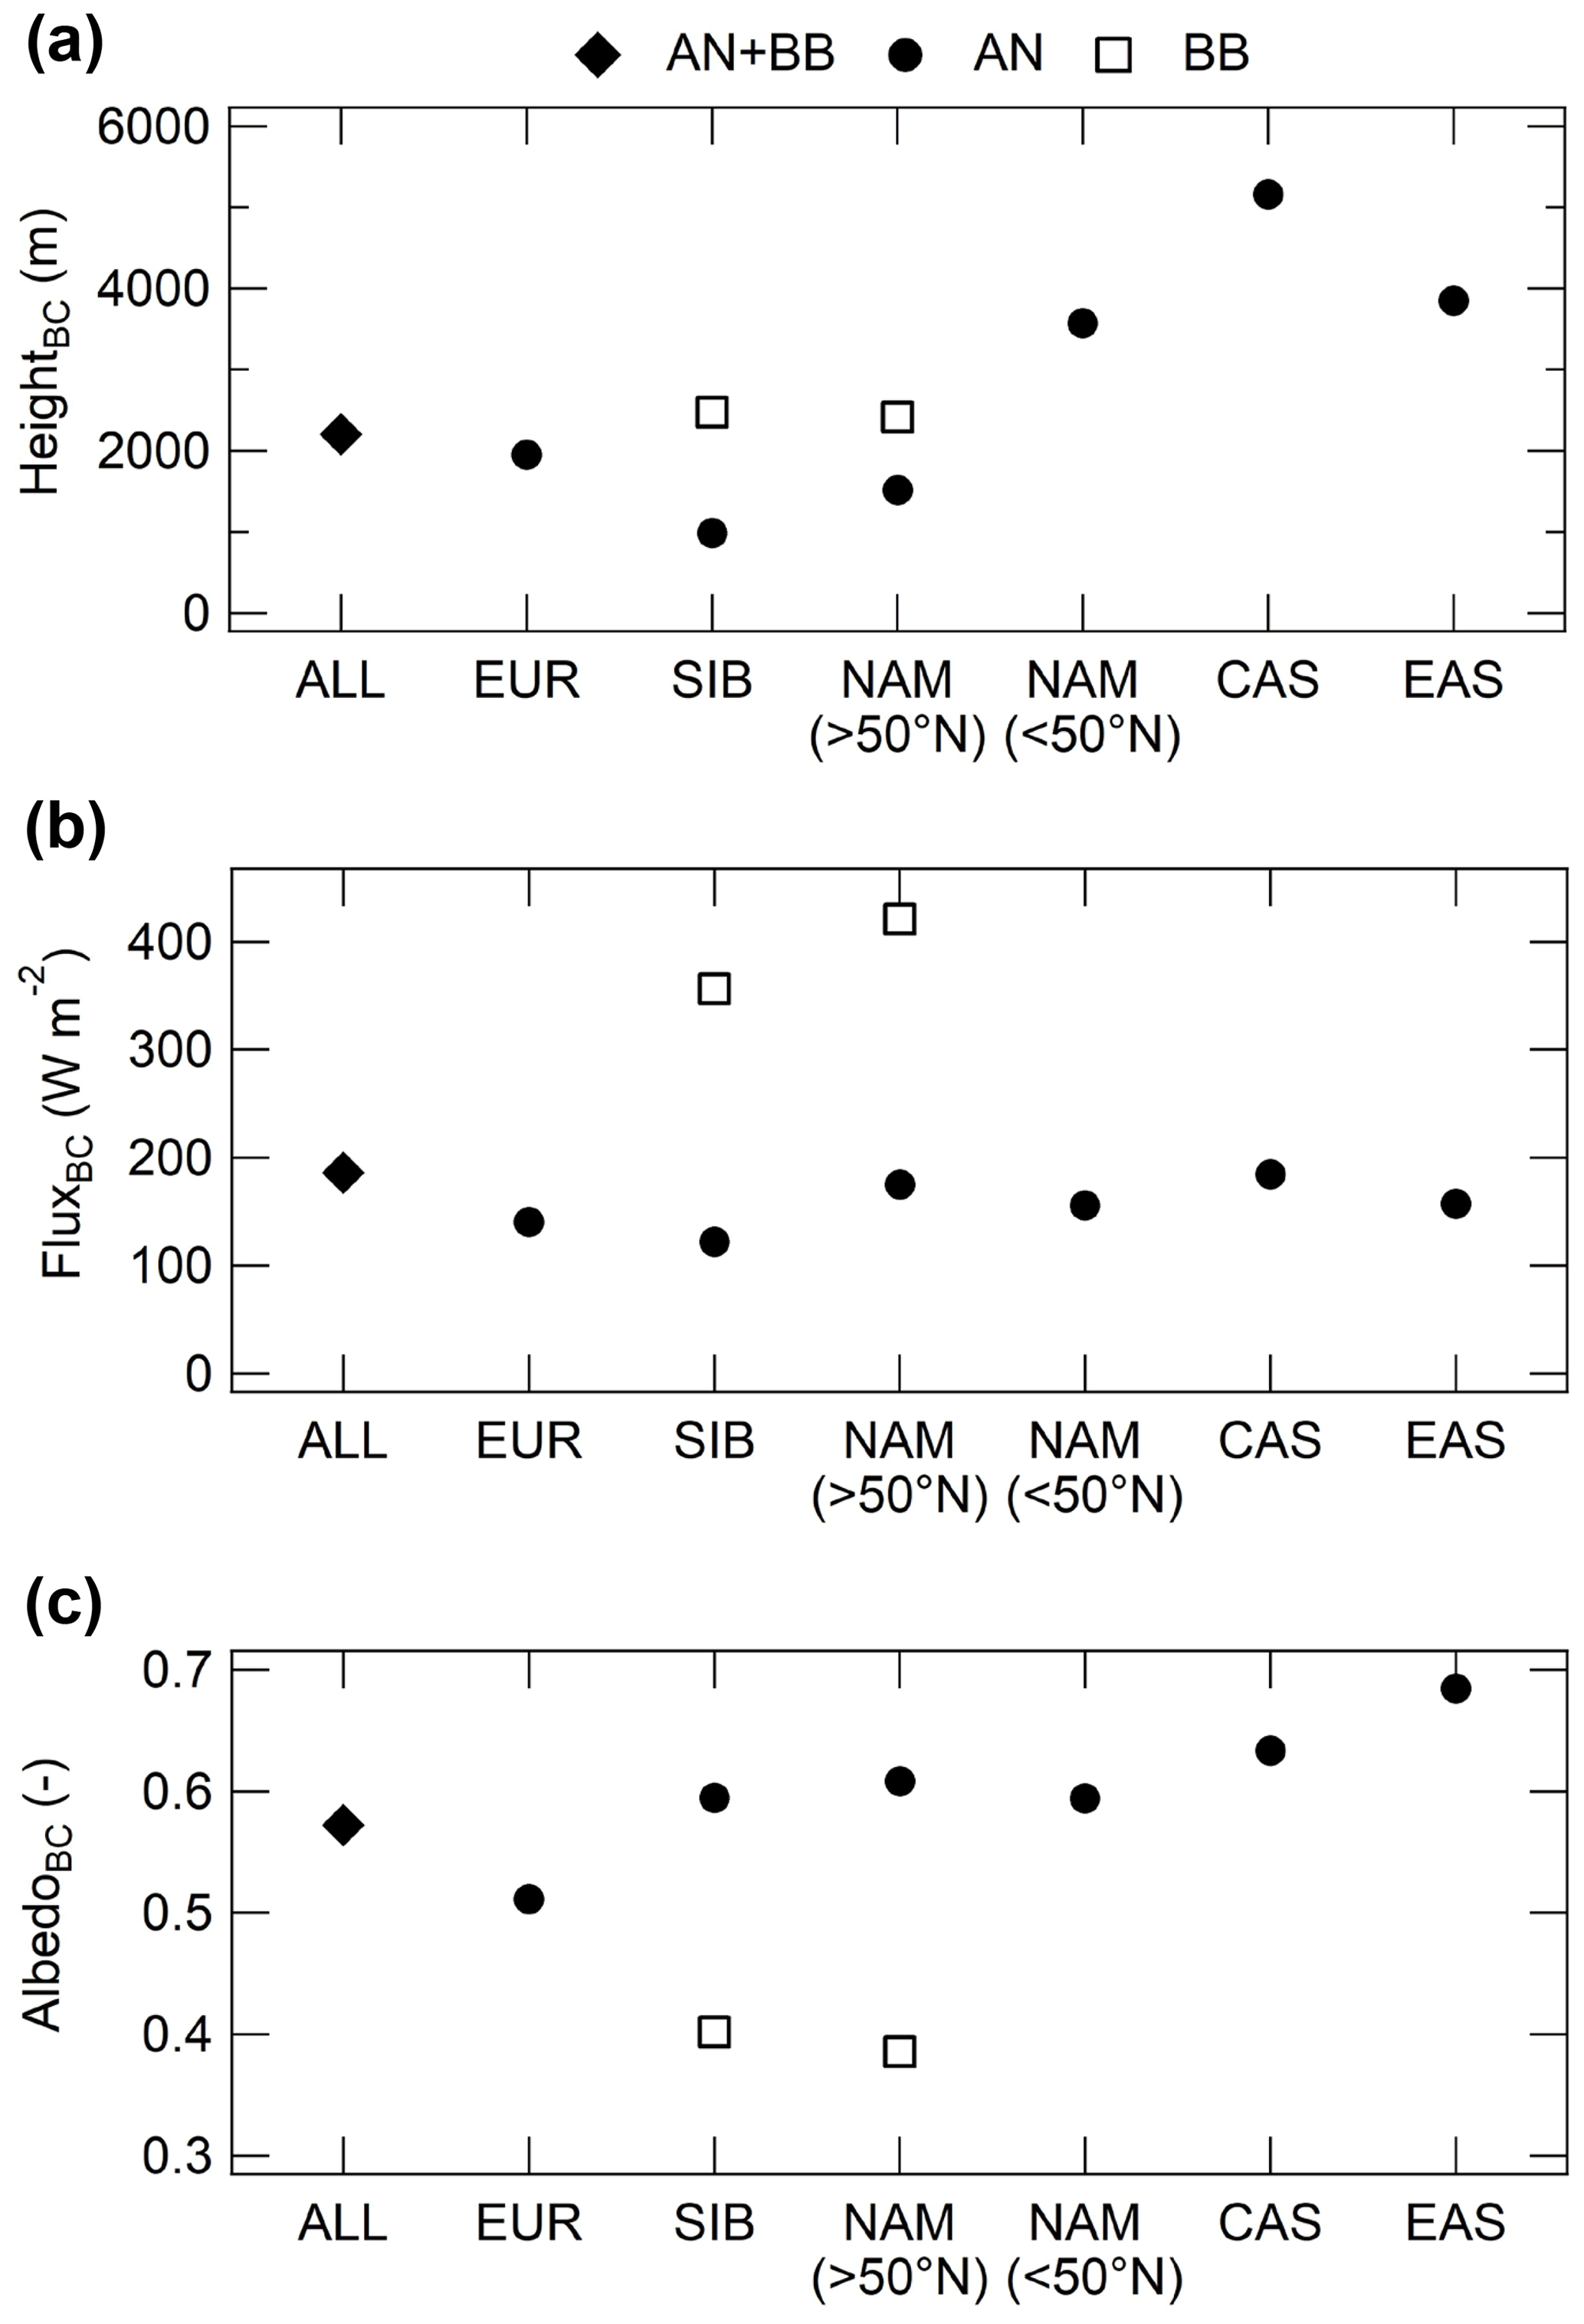
Figure 13(a) Mean height (above sea level) (HeightBC), (b) mean solar radiation flux at the TOA (FluxBC), and (c) mean surface albedo (AlbedoBC) weighted by BC concentrations in the Arctic (Eqs. 3–5) for total BC (ALL) and BC from eight major sources (six anthropogenic (AN) sources and two biomass burning (BB) sources).
NRECOL (the product of MACBC and NREAAOD) of ALL BC in the Arctic in this study is 2888 W g−1, which is lower than the values of around 3000–5000 W g−1 in the AeroCom models (Samset et al., 2013). This lower value is likely because the fraction of Arctic BC existing at lower altitudes is higher in this study (70 % above 500 hPa (below ∼ 5 km)) than in AeroCom models (∼ 40 % below 5 km). NRECOL values of anthropogenic BC from Europe and Siberia are lower (1471–1781 W g−1), and those of anthropogenic BC from Asia (3064–3351 W g−1) and biomass burning BC from Siberia and North America (>50∘ N) (4148–5326 W g−1) are higher (Fig. 11c). NRECOL of anthropogenic BC from Central Asia is 130 % (2.3 times) larger than that of anthropogenic BC from Siberia. NRECOL of biomass burning BC from Siberia and North America (>50∘ N) is 180 % (2.8 times) and 260 % (3.6 times) higher, respectively, than that of anthropogenic BC from Siberia. Thus, NRECOL (REBC_TOA per unit BC mass) in the Arctic differs by a factor of up to about 4 among the emission sources because mixing states, heights, and seasonal variations (solar radiation) are different.
In this study, we estimate the source contributions of Arctic BC to five BC variables, MBC_SRF, MBC_COL, MBC_DEP, REBC_TOA, and REBC_SNOW, and show that the source contributions differ significantly among them. MBC_SRF is dominated by Siberian sources (70 %), whereas the contribution from Siberia (34 %) to MBC_COL is smaller than that from Asia (37 %). These differences can be attributed to the fact that BC transport from high-latitude emission sources is dominant in the lower troposphere in the Arctic, whereas long-range BC transport from midlatitudes is more important in the middle and upper troposphere in the Arctic. The contributions from Siberia and Asia to MBC_DEP are 53 % and 15 %, respectively. The contributions of biomass burning sources to MBC_SRF, MBC_COL, and MBC_DEP are larger during summer months. Because MBC_DEP is highest in summer, the contribution from biomass burning sources to MBC_DEP is larger (20 % from Siberia and 12 % from North America (>50∘ N)) than that to MBC_SRF and MBC_COL. The contribution from Asia (Siberia) to REBC_TOA is 43 % (26 %), which is larger (smaller) than its contribution to MBC_COL. The contribution from biomass burning to REBC_TOA is also large (29 %). The contribution from Siberia to REBC_SNOW is 41 %, which is larger than its contribution to REBC_TOA. REBC_TOA (from all sources) is 0.40 W m−2 globally and 0.31 W m−2 in the Arctic. REBC_SNOW is 0.047 W m−2 globally and 0.19 W m−2 in the Arctic.
We also show that the radiative effect efficiency of BC (NRECOL; RE) in the Arctic from each emission source differs by a factor of up to about 4 (1471–5326 W g−1). Anthropogenic BC from Asia and biomass burning BC from Siberia and North America (>50∘ N) have a higher fraction of thickly coated BC particles and higher MACBC (AAOD) at the wavelength of 550 nm (8.5–9.4 m2 g−1). In contrast, anthropogenic BC from Europe, Siberia, and North America (>50∘ N) has a higher fraction of thinly coated BC particles and lower MACBC (6.7–7.3 m2 g−1). MACBC in the Arctic differs by up to 41 % among emission sources. NREAAOD (REAAODBC) also differs significantly among emission sources because the altitude of BC and incident solar radiation flux (i.e., seasonal variations) are different. NREAAOD of anthropogenic BC from Asia and biomass burning BC from Siberia and North America (>50∘ N) is up to 170 % (2.7 times) greater than that of anthropogenic BC from Siberia and North America (>50∘ N). As a result, NRECOL (product of MACBC and NREAAOD) in the Arctic differs by up to 3.6 times among emission sources.
The results of this study demonstrate that source contributions to BC in the Arctic differ substantially depending on BC variables. The contribution of Asia to REBC_TOA is the largest, whereas Siberia makes the largest contribution to REBC_SNOW. The source contributions to REBC_TOA and REBC_SNOW are quite different from the source contributions to MBC_SRF, MBC_COL, and MBC_DEP. The results also demonstrate the importance of accurately estimating the differences in microphysical properties (e.g., mixing state), altitude, seasonal variations, and the resulting radiative effect efficiency of BC (NRECOL) from different emission sources when estimating the source contributions of BC radiative effects.
Data used in this study are available upon request from the corresponding author (Hitoshi Matsui).
The supplement related to this article is available online at: https://doi.org/10.5194/acp-22-8989-2022-supplement.
HM conceived and designed the research, performed model simulations and data analysis, and wrote the manuscript. TM, SO, NM, NO, KGA, MK, and YK made BC observations for surface atmosphere at Utqiaġvik (formerly Barrow), Ny-Ålesund, Alert, and Pallas and for snow in Finland, Alaska, Siberia, and Greenland and at Ny-Ålesund. NM, SO, MK, and YK made BC observations during the ARCTAS and PAMARCMiP2018 aircraft campaigns. All authors interpreted data, discussed their implications, and contributed to the manuscript.
The contact author has declared that neither they nor their co-authors have any competing interests.
Publisher’s note: Copernicus Publications remains neutral with regard to jurisdictional claims in published maps and institutional affiliations.
We thank the U.S. National Oceanic and Atmospheric Administration (NOAA) Black Carbon Group for providing us their BC data from aircraft measurements.
This research has been supported by the Ministry of Education, Culture, Sports, Science and Technology of Japan and the Japan Society for the Promotion of Science (MEXT/JSPS) KAKENHI grant nos. JP18H03363, JP19H04253, JP19H05699, JP19KK0265, JP20H00196, JP20H00638, and JP22H03722, the MEXT Arctic Challenge for Sustainability phase II (ArCS-II; JPMXD1420318865) project, the Environment Research and Technology Development (grant no. JPMEERF20202003) of the Environmental Restoration and Conservation Agency of Japan, Nagoya University Research Fund, and a grant for the Global Environmental Research Coordination System from the Ministry of the Environment, Japan (grant no. MLIT1753).
This paper was edited by Philip Stier and reviewed by two anonymous referees.
Abdul-Razzak, H. and Ghan, S. J.: A parameterization of aerosol activation: 2. Multiple aerosol types, J. Geophys. Res., 105, 6837–6844, https://doi.org/10.1029/1999JD901161, 2000.
Abdul-Razzak, H. and Ghan, S. J.: A parameterization of aerosol activation: 3. Sectional representation, J. Geophys. Res., 107, 4026, https://doi.org/10.1029/2001JD000483, 2002.
Bohren, C. F. and Huffman, D. R.: Absorption and Scattering of Light by Small Particles, 530 pp., WILEY‐VCH Verlag GmbH & Co. KGaA, Print ISBN 9780471293408, Online ISBN 9783527618156, https://doi.org/10.1002/9783527618156, 1998.
Bond, T. C., Doherty, S. J., Fahey, D. W., Forster, P. M., Berntsen, T., DeAngelo, B. J., Flanner, M. G., Ghan, S., Kärcher, B., Koch, D., Kinne, S., Kondo, Y., Quinn, P. K., Sarofim, M. C., Schultz, M. G., Schulz, M., Venkataraman, C., Zhang, H., Zhang, S., Bellouin, N., Guttikunda, S. K., Hopke, P. K., Jacobson, M. Z., Kaiser, J. W., Klimont, Z., Lohmann, U., Schwarz, J. P., Shindell, D., Storelvmo, T., Warren, S. G., and Zender, C. S.: Bounding the role of black carbon in the climate system: A scientific assessment, J. Geophys. Res.-Atmos., 118, 5380–5552, https://doi.org/10.1002/jgrd.50171, 2013.
Bourgeois, Q. and Bay, I.: Pollution transport efficiency toward the Arctic: Sensitivity to aerosol scavenging and source regions, J. Geophys. Res., 116, D08213, https://doi.org/10.1029/2010JD015096, 2011.
Chylek, P., Ramaswamy, V., and Cheng, R. J: Effect of graphitic carbon on the albedo of clouds, J. Atmos. Sci., 41, 3076–3084, https://doi.org/10.1175/1520-0469(1984)041<3076:EOGCOT>2.0.CO;2, 1984.
Cozic, J., Verheggen, B., Mertes, S., Connolly, P., Bower, K., Petzold, A., Baltensperger, U., and Weingartner, E.: Scavenging of black carbon in mixed phase clouds at the high alpine site Jungfraujoch, Atmos. Chem. Phys., 7, 1797–1807, https://doi.org/10.5194/acp-7-1797-2007, 2007.
Eckhardt, S., Quennehen, B., Olivié, D. J. L., Berntsen, T. K., Cherian, R., Christensen, J. H., Collins, W., Crepinsek, S., Daskalakis, N., Flanner, M., Herber, A., Heyes, C., Hodnebrog, Ø., Huang, L., Kanakidou, M., Klimont, Z., Langner, J., Law, K. S., Lund, M. T., Mahmood, R., Massling, A., Myriokefalitakis, S., Nielsen, I. E., Nøjgaard, J. K., Quaas, J., Quinn, P. K., Raut, J.-C., Rumbold, S. T., Schulz, M., Sharma, S., Skeie, R. B., Skov, H., Uttal, T., von Salzen, K., and Stohl, A.: Current model capabilities for simulating black carbon and sulfate concentrations in the Arctic atmosphere: a multi-model evaluation using a comprehensive measurement data set, Atmos. Chem. Phys., 15, 9413–9433, https://doi.org/10.5194/acp-15-9413-2015, 2015.
Flanner, M. G. and Zender, C. S.: Snowpack radiative heating: Influence on Tibetan Plateau climate, Geophys. Res. Lett., 32, L06501, https://doi.org/10.1029/2004GL022076, 2005.
Flanner, M. G., Zender, C. S., Randerson, J. T., and Rasch, P. J.: Present-day climate forcing and response from black carbon in snow, J. Geophys. Res., 112, D11202, https://doi.org/10.1029/2006JD008003, 2007.
Forestieri, S. D., Helgestad, T. M., Lambe, A. T., Renbaum-Wolff, L., Lack, D. A., Massoli, P., Cross, E. S., Dubey, M. K., Mazzoleni, C., Olfert, J. S., Sedlacek III, A. J., Freedman, A., Davidovits, P., Onasch, T. B., and Cappa, C. D.: Measurement and modeling of the multiwavelength optical properties of uncoated flame-generated soot, Atmos. Chem. Phys., 18, 12141–12159, https://doi.org/10.5194/acp-18-12141-2018, 2018.
Gliß, J., Mortier, A., Schulz, M., Andrews, E., Balkanski, Y., Bauer, S. E., Benedictow, A. M. K., Bian, H., Checa-Garcia, R., Chin, M., Ginoux, P., Griesfeller, J. J., Heckel, A., Kipling, Z., Kirkevåg, A., Kokkola, H., Laj, P., Le Sager, P., Lund, M. T., Lund Myhre, C., Matsui, H., Myhre, G., Neubauer, D., van Noije, T., North, P., Olivié, D. J. L., Rémy, S., Sogacheva, L., Takemura, T., Tsigaridis, K., and Tsyro, S. G.: AeroCom phase III multi-model evaluation of the aerosol life cycle and optical properties using ground- and space-based remote sensing as well as surface in situ observations, Atmos. Chem. Phys., 21, 87–128, https://doi.org/10.5194/acp-21-87-2021, 2021.
Hadley, O. L. and Kirchstetter, T. W.: Black-carbon reduction of snow albedo, Nat. Clim. Change, 2, 437–440, https://doi.org/10.1038/NCLIMATE1433, 2012.
Hansen, J. and Nazarenko, L.: Soot climate forcing via snow and ice albedos, P. Natl. Acad. Sci. USA, 101, 423–428, https://doi.org/10.1073/pnas.2237157100, 2004.
Hoesly, R. M., Smith, S. J., Feng, L., Klimont, Z., Janssens-Maenhout, G., Pitkanen, T., Seibert, J. J., Vu, L., Andres, R. J., Bolt, R. M., Bond, T. C., Dawidowski, L., Kholod, N., Kurokawa, J.-I., Li, M., Liu, L., Lu, Z., Moura, M. C. P., O'Rourke, P. R., and Zhang, Q.: Historical (1750–2014) anthropogenic emissions of reactive gases and aerosols from the Community Emissions Data System (CEDS), Geosci. Model Dev., 11, 369–408, https://doi.org/10.5194/gmd-11-369-2018, 2018.
Huang, K., Fu, J. S., Prikhodko, V. Y., Storey, J. M., Romanov, A., Hodson, E. L., Cresko, J., Morozova, I., Ignatieva, Y., and Cabaniss, J.: Russian anthropogenic black carbon: Emission reconstruction and Arctic black carbon simulation, J. Geophys. Res.-Atmos., 120, 11306–11333, https://doi.org/10.1002/2015JD023358, 2015.
Huang, L., Gong, S. L., Jia, C. Q., and Lavoué, D.: Relative contributions of anthropogenic emissions to black carbon aerosol in the Arctic, J. Geophys. Res., 115, D19208, https://doi.org/10.1029/2009JD013592, 2010.
Hurrell, J. W., Holland, M. M., Gent, P. R., Ghan, S., Kay, J. E., Kushner, P. J., Lamarque, J.-F., Large, W. G., Lawrence, D., Lindsay, K., Lipscomb, W. H., Long, M. C., Mahowald, N., Marsh, D. R., Neale, R. B., Rasch, P., Vavrus, S., Vertenstein, M., Bader, D., Collins, W. D., Hack, J. J., Kiehl, J., and Marshall, S.: The Community Earth System Model: A framework for collaborative research, B. Am. Meteorol. Soc., 94, 1339–1360, https://doi.org/10.1175/BAMS-D-12-00121.1, 2013.
Iacono, M., Mlawer, E., Clough, S., and Morcrette J.-J.: Impact of an improved longwave radiation model, RRTM, on the energy budget and thermodynamic properties of the NCAR community climate model, CCM3, J. Geophys. Res., 105, 14873–14890, 2000.
Ikeda, K., Tanimoto, H., Sugita, T., Akiyoshi, H., Kanaya, Y., Zhu, C., and Taketani, F.: Tagged tracer simulations of black carbon in the Arctic: transport, source contributions, and budget, Atmos. Chem. Phys., 17, 10515–10533, https://doi.org/10.5194/acp-17-10515-2017, 2017.
IPCC: Climate Change 2021: The Physical Science Basis. Contribution of Working Group I to the Sixth Assessment Report of the Intergovernmental Panel on Climate Change, edited by: Masson-Delmotte, V., Zhai, P., Pirani, A., Connors, S. L., Péan, C., Berger, S., Caud, N., Chen, Y., Goldfarb, L., Gomis, M. I., Huang, M., Leitzell, K., Lonnoy, E., Matthews, J. B. R., Maycock, T. K., Waterfield, T., Yelekçi, O., Yu, R., and Zhou, B., Cambridge University Press, in press, 2021.
Jacobson, M. Z.: Development and application of a new air pollution modeling system – II. Aerosol module structure and design, Atmos. Environ., 31, 131–144, https://doi.org/10.1016/1352-2310(96)00202-6, 1997.
Jacobson, M. Z.: Effects of externally-through-internally-mixed soot inclusions within clouds and precipitation on global climate, J. Phys. Chem. A, 110, 6860–6873, https://doi.org/10.1021/jp056391r, 2006.
Jiao, C., Flanner, M. G., Balkanski, Y., Bauer, S. E., Bellouin, N., Berntsen, T. K., Bian, H., Carslaw, K. S., Chin, M., De Luca, N., Diehl, T., Ghan, S. J., Iversen, T., Kirkevåg, A., Koch, D., Liu, X., Mann, G. W., Penner, J. E., Pitari, G., Schulz, M., Seland, Ø., Skeie, R. B., Steenrod, S. D., Stier, P., Takemura, T., Tsigaridis, K., van Noije, T., Yun, Y., and Zhang, K.: An AeroCom assessment of black carbon in Arctic snow and sea ice, Atmos. Chem. Phys., 14, 2399–2417, https://doi.org/10.5194/acp-14-2399-2014, 2014.
Kawai, K., Matsui, H., and Tobo, Y.: High potential of Asian dust to act as ice nucleating particles in mixed-phase clouds simulated with a global aerosol-climate model, J. Geophys. Res.-Atmos., 126, e2020JD034263, https://doi.org/10.1029/2020JD034263, 2021.
Koch, D. and Del Genio, A. D.: Black carbon semi-direct effects on cloud cover: review and synthesis, Atmos. Chem. Phys., 10, 7685–7696, https://doi.org/10.5194/acp-10-7685-2010, 2010.
Koch, D. and Hansen, J.: Distant origins of Arctic black carbon: A Goddard Institute for Space Studies ModelE experiment, J. Geophys. Res., 110, D04204, https://doi.org/10.1029/2004JD005296, 2005.
Kondo, Y., Matsui, H., Moteki, N., Sahu, L., Takegawa, N., Kajino, M., Zhao, Y., Cubison, M. J., Jimenez, J. L., Vay, S., Diskin, G. S., Anderson, B., Wisthaler, A., Mikoviny, T., Fuelberg, H. E., Blake, D. R., Huey, G., Weinheimer, A. J., Knapp, D. J., and Brune, W. H.: Emissions of black carbon, organic, and inorganic aerosols from biomass burning in North America and Asia in 2008, J. Geophys. Res., 116, D08204, https://doi.org/10.1029/2010JD015152, 2011.
Liu, M. and Matsui, H.: Aerosol radiative forcings induced by substantial changes in anthropogenic emissions in China from 2008 to 2016, Atmos. Chem. Phys., 21, 5965–5982, https://doi.org/10.5194/acp-21-5965-2021, 2021a.
Liu, M. and Matsui, H.: Improved simulations of global black carbon distributions by modifying wet scavenging processes in convective and mixed-phase clouds, J. Geophys. Res.-Atmos., 126, e2020JD033890, https://doi.org/10.1029/2020JD033890, 2021b.
Liu, X., Easter, R. C., Ghan, S. J., Zaveri, R., Rasch, P., Shi, X., Lamarque, J.-F., Gettelman, A., Morrison, H., Vitt, F., Conley, A., Park, S., Neale, R., Hannay, C., Ekman, A. M. L., Hess, P., Mahowald, N., Collins, W., Iacono, M. J., Bretherton, C. S., Flanner, M. G., and Mitchell, D.: Toward a minimal representation of aerosols in climate models: description and evaluation in the Community Atmosphere Model CAM5, Geosci. Model Dev., 5, 709–739, https://doi.org/10.5194/gmd-5-709-2012, 2012.
Mahmood, R., von Salzen, K., Flanner, M., Sand, M., Langner, J., Wang, H., and Huang, L.: Seasonality of global and Arctic black carbon processes in the Arctic Monitoring and Assessment Programme models, J. Geophys. Res.-Atmos., 121, 7100–7116, https://doi.org/10.1002/2016JD024849, 2016.
Mallet, M., Nabat, P., Johnson, B., Michou, M., Haywood, J. M., Chen, C., and Dubovik, O.: Climate models generally underrepresent the warming by Central Africa biomass-burning aerosols over the Southeast Atlantic, Sci. Adv., 7, eabg9998, https://doi.org/10.1126/sciadv.abg9998, 2021.
Mårtensson, E. M., Nilsson, E. D., de Leeuw, G., Cohen, L. H., and Hansson H.-C.: Laboratory simulations and parameterization of the primary marine aerosol production, J. Geophys. Res., 108, 4297, https://doi.org/10.1029/2002JD002263, 2003.
Matsui, H.: Development of a global aerosol model using a two-dimensional sectional method: 1. Model design, J. Adv. Model. Earth Syst., 9, 1921–1947, https://doi.org/10.1002/2017MS000936, 2017.
Matsui, H.: Black carbon absorption efficiency under preindustrial and present-day conditions simulated by a size- and mixing-state-resolved global aerosol model, J. Geophys. Res.-Atmos., 125, e2019JD032316, https://doi.org/10.1029/2019JD032316, 2020.
Matsui, H. and Liu, M.: Importance of supersaturation in Arctic black carbon simulations, J. Climate, 34, 7843–7856, https://doi.org/10.1175/JCLI-D-20-0994.1, 2021.
Matsui, H. and Mahowald, N.: Development of a global aerosol model using a two-dimensional sectional method: 2. Evaluation and sensitivity simulations, J. Adv. Model. Earth Syst., 9, 1887–1920, https://doi.org/10.1002/2017MS000937, 2017.
Matsui, H. and Moteki, N.: High sensitivity of Arctic black carbon radiative effects to subgrid vertical velocity in aerosol activation, Geophys. Res. Lett., 47, e2020GL088978, https://doi.org/10.1029/2020GL088978, 2020.
Matsui, H., Kondo, Y., Moteki, N., Takegawa, N., Sahu, L. K., Zhao, Y., Fuelberg, H. E., Sessions, W. R., Diskin, G., Blake, D. R., Wisthaler, A., and Koike, M.: Seasonal variation of the transport of black carbon aerosol from the Asian continent to the Arctic during the ARCTAS aircraft campaign, J. Geophys. Res., 116, D05202, https://doi.org/10.1029/2010JD015067, 2011a.
Matsui, H., Koike, M., Kondo, Y., Takegawa, N., Wiedensohler, A., Fast, J. D., and Zaveri, R. A.: Impact of new particle formation on the concentrations of aerosols and cloud condensation nuclei around Beijing, J. Geophys. Res., 116, D19208, https://doi.org/10.1029/2011JD016025, 2011b.
Matsui, H., Kondo, Y., Moteki, N., Takegawa, N., Sahu, L. K., Koike, M., Zhao, Y., Fuelberg, H. E., Sessions, W. R., Diskin, G., Anderson, B. E., Blake, D. R., Wisthaler, A., Cubison, M. J., and Jimenez, J. L.: Accumulation-mode aerosol number concentrations in the Arctic during the ARCTAS aircraft campaign: Long-range transport of polluted and clean air from the Asian continent, J. Geophys. Res., 116, D20217, https://doi.org/10.1029/2011JD016189, 2011c.
Matsui, H., Koike, M., Takegawa, N., Kondo, Y., Takami, A., Takamura, T., Yoon, S., Kim S.-W., Lim H.-C., and Fast J. D.: Spatial and temporal variations of new particle formation in East Asia using an NPF-explicit WRF-chem model: North-south contrast in new particle formation frequency, J. Geophys. Res.-Atmos., 118, 11647–11663, https://doi.org/10.1002/jgrd.50821, 2013a.
Matsui, H., Koike, M., Kondo, Y., Moteki, N.., Fast, J. D., and Zaveri, R. A.: Development and validation of a black carbon mixing state resolved three-dimensional model: Aging processes and radiative impact, J. Geophys. Res.-Atmos., 118, 2304–2326, https://doi.org/10.1029/2012JD018446, 2013b.
Matsui, H., Koike, M., Kondo, Y., Takami, A., Fast, J. D., Kanaya, Y., and Takigawa, M.: Volatility basis-set approach simulation of organic aerosol formation in East Asia: implications for anthropogenic–biogenic interaction and controllable amounts, Atmos. Chem. Phys., 14, 9513–9535, https://doi.org/10.5194/acp-14-9513-2014, 2014a.
Matsui, H., Koike, M., Kondo, Y., Fast, J. D., and Takigawa, M.: Development of an aerosol microphysical module: Aerosol Two-dimensional bin module for foRmation and Aging Simulation (ATRAS), Atmos. Chem. Phys., 14, 10315–10331, https://doi.org/10.5194/acp-14-10315-2014, 2014b.
Matsui, H., Mahowald, N. M., Moteki, N., Hamilton, D. S., Ohata, S., Yoshida, A., Koike, M., Scanza, R. A., and Flanner, M. G.: Anthropogenic combustion iron as a complex climate forcer, Nat. Commun., 9, 1593, https://doi.org/10.1038/s41467-018-03997-0, 2018a.
Matsui, H., Hamilton, D. S., and Mahowald, N. M.: Black carbon radiative effects highly sensitive to emitted particle size when resolving mixing-state diversity, Nat. Commun., 9, 3446, https://doi.org/10.1038/s41467-018-05635-1, 2018b.
Monahan, E. C., Spiel, D. E., and Davidson, K. L.: A model of marine aerosol generation via whitecaps and wave disruption, in: Oceanic Whitecaps, edited by: Monahan, E. C. and MacNiochaill, G. M., Oceanographic Sciences Library, vol 2, Springer, Dordrecht, https://doi.org/10.1007/978-94-009-4668-2_16, 1986.
Mori, T., Goto-Azuma, K., Kondo, Y., Ogawa-Tsukagawa, Y., Miura, K., Hirabayashi, M., Oshima, N., Koike, M., Kupiainen, K., Moteki, N., Ohata, S., Sinha, P. R., Sugiura, K., Aoki, T., Schneebeli, M., Steffen, K., Sato, A., Tsushima, A., Makarov, V., Omiya, S., Sugimoto, A., Takano, S., and Nagatsuka, N.: Black carbon and inorganic aerosols in Arctic snowpack, J. Geophys. Res.-Atmos., 124, 13325–13356, https://doi.org/10.1029/2019JD030623, 2019.
Mori, T., Kondo, Y., Ohata, S., Zhao, Y., Sinha, P. R., Oshima, N., Matsui, H., Moteki, N., and Koike, M.: Seasonal variation of wet deposition of black carbon in Arctic Alaska, J. Geophys. Res.-Atmos., 125, e2019JD032240, https://doi.org/10.1029/2019JD032240, 2020.
Mori, T., Kondo, Y., Ohata, S., Goto-Azuma, K., Fukuda, K., Ogawa-Tsukagawa, Y., Moteki, N., Yoshida, A., Koike, M., Sinha, P. R., Oshima, N., Matsui, H., Tobo, Y., Yabuki, M., and Aas, W.: Seasonal variation of wet deposition of black carbon at Ny-Ålesund, Svalbard, J. Geophys. Res.-Atmos., 126, e2020JD034110, https://doi.org/10.1029/2020JD034110, 2021.
Morrison, H. and Gettelman. A.: A new two-moment bulk stratiform cloud microphysics scheme in the Community Atmosphere Model, version 3 (CAM4). Part I: Description and numerical tests, J. Climate, 21, 3642–3659, https://doi.org/10.1175/2008JCLI2105.1, 2008.
Moteki, N., Mori, T., Matsui, H., and Ohata, S.: Observational constraint of in-cloud supersaturation for simulations of aerosol rainout in atmospheric models, npj Clim. Atmos. Sci., 2, 6, https://doi.org/10.1038/s41612-019-0063-y, 2019.
Myhre, G., Samset, B. H., Schulz, M., Balkanski, Y., Bauer, S., Berntsen, T. K., Bian, H., Bellouin, N., Chin, M., Diehl, T., Easter, R. C., Feichter, J., Ghan, S. J., Hauglustaine, D., Iversen, T., Kinne, S., Kirkevåg, A., Lamarque, J.-F., Lin, G., Liu, X., Lund, M. T., Luo, G., Ma, X., van Noije, T., Penner, J. E., Rasch, P. J., Ruiz, A., Seland, Ø., Skeie, R. B., Stier, P., Takemura, T., Tsigaridis, K., Wang, P., Wang, Z., Xu, L., Yu, H., Yu, F., Yoon, J.-H., Zhang, K., Zhang, H., and Zhou, C.: Radiative forcing of the direct aerosol effect from AeroCom Phase II simulations, Atmos. Chem. Phys., 13, 1853–1877, https://doi.org/10.5194/acp-13-1853-2013, 2013.
Neale, R. B., Chen, C.-C., Gettelman, A., Lauritzen, P. H., Park, S., Williamson, D. L., Conley, A. J., Garcia, R., Kinnison, D., Lamarque, J.-F., Marsh, D., Mills, M., Smith, A. K., Tilmes S., Vitt, F., Morrison, H., Cameron-Smith, P., Collins, W. D., Iacono, M. J., Easter, R. C., Ghan, S. J., Liu, X., Rasch, P. J., and Taylor, M. A.: Description of the NCAR Community Atmosphere Model (CAM 5.0), NCAR/TN-486C STR, available at: http://www.cesm.ucar.edu/models/cesm1.0/cam/docs/description/cam5_desc.pdf (last access: 4 July 2022), 2010.
Ohata, S., Koike, M., Yoshida, A., Moteki, N., Adachi, K., Oshima, N., Matsui, H., Eppers, O., Bozem, H., Zanatta, M., and Herber, A. B.: Arctic black carbon during PAMARCMiP 2018 and previous aircraft experiments in spring, Atmos. Chem. Phys., 21, 15861–15881, https://doi.org/10.5194/acp-21-15861-2021, 2021a.
Ohata, S., Mori, T., Kondo, Y., Sharma, S., Hyvärinen, A., Andrews, E., Tunved, P., Asmi, E., Backman, J., Servomaa, H., Veber, D., Eleftheriadis, K., Vratolis, S., Krejci, R., Zieger, P., Koike, M., Kanaya, Y., Yoshida, A., Moteki, N., Zhao, Y., Tobo, Y., Matsushita, J., and Oshima, N.: Estimates of mass absorption cross sections of black carbon for filter-based absorption photometers in the Arctic, Atmos. Meas. Tech., 14, 6723–6748, https://doi.org/10.5194/amt-14-6723-2021, 2021b.
Oleson, K. W., Lawrence, D. M., Bonan, G. B., Flanner, M. G., Kluzek, E., Lawrence, P. J., Levis, S., Swenson, S. C., Thornton, P. E., Dai, A., Decker, M., Dickinson, R., Feddema, J., Heald, C. L., Hoffman, F., Lamarque, J.-F., Mahowald, N., Niu, G.-Y., Qian, T., Randerson, J., Running, S., Sakaguchi, K., Slater, A., Stöckli, R., Wang, A., Yang, Z.-L., Zeng, X., and Zeng, X.: Technical description of version 4.0 of the community land model (CLM) (NCAR/TN-478+STR), National Center for Atmospheric Research, http://www.cesm.ucar.edu/models/cesm1.2/clm/CLM4_Tech_Note.pdf (last access: 4 July 2022), 2010.
Petters, M. D. and Kreidenweis, S. M.: A single parameter representation of hygroscopic growth and cloud condensation nucleus activity, Atmos. Chem. Phys., 7, 1961–1971, https://doi.org/10.5194/acp-7-1961-2007, 2007.
Qi, L. and Wang, S.: Sources of black carbon in the atmosphere and in snow in the Arctic, Sci. Total Environ., 691, 442–454, https://doi.org/10.1016/j.scitotenv.2019.07.073, 2019.
Qi, L., Li, Q., Henze, D. K., Tseng, H.-L., and He, C.: Sources of springtime surface black carbon in the Arctic: an adjoint analysis for April 2008, Atmos. Chem. Phys., 17, 9697–9716, https://doi.org/10.5194/acp-17-9697-2017, 2017.
Reddington, C. L., Spracklen, D. V., Artaxo, P., Ridley, D. A., Rizzo, L. V., and Arana, A.: Analysis of particulate emissions from tropical biomass burning using a global aerosol model and long-term surface observations, Atmos. Chem. Phys., 16, 11083–11106, https://doi.org/10.5194/acp-16-11083-2016, 2016.
Ren, L., Yang, Y., Wang, H., Zhang, R., Wang, P., and Liao, H.: Source attribution of Arctic black carbon and sulfate aerosols and associated Arctic surface warming during 1980–2018, Atmos. Chem. Phys., 20, 9067–9085, https://doi.org/10.5194/acp-20-9067-2020, 2020.
Rodriguez, B. T., Huang, L., Santos, G. M., Zhang, W., Vetro, V., Xu, X., Kim, S., and Czimczik, C. I.: Seasonal cycle of isotope-based source apportionment of elemental carbon in airborne particulate matter and snow at Alert, Canada, J. Geophys. Res.-Atmos., 125, e2020JD033125, https://doi.org/10.1029/2020JD033125, 2020.
Samset, B. H. and Myhre, G.: Climate response to externally mixed black carbon as a function of altitude, J. Geophys. Res.-Atmos., 120, 2913–2927, https://doi.org/10.1002/2014JD022849, 2015.
Samset, B. H., Myhre, G., Schulz, M., Balkanski, Y., Bauer, S., Berntsen, T. K., Bian, H., Bellouin, N., Diehl, T., Easter, R. C., Ghan, S. J., Iversen, T., Kinne, S., Kirkevåg, A., Lamarque, J.-F., Lin, G., Liu, X., Penner, J. E., Seland, Ø., Skeie, R. B., Stier, P., Takemura, T., Tsigaridis, K., and Zhang, K.: Black carbon vertical profiles strongly affect its radiative forcing uncertainty, Atmos. Chem. Phys., 13, 2423–2434, https://doi.org/10.5194/acp-13-2423-2013, 2013.
Sand, M., Samset, B. H., Balkanski, Y., Bauer, S., Bellouin, N., Berntsen, T. K., Bian, H., Chin, M., Diehl, T., Easter, R., Ghan, S. J., Iversen, T., Kirkevåg, A., Lamarque, J.-F., Lin, G., Liu, X., Luo, G., Myhre, G., Noije, T. V., Penner, J. E., Schulz, M., Seland, Ø., Skeie, R. B., Stier, P., Takemura, T., Tsigaridis, K., Yu, F., Zhang, K., and Zhang, H.: Aerosols at the poles: an AeroCom Phase II multi-model evaluation, Atmos. Chem. Phys., 17, 12197–12218, https://doi.org/10.5194/acp-17-12197-2017, 2017.
Sand, M., Samset, B. H., Myhre, G., Gliß, J., Bauer, S. E., Bian, H., Chin, M., Checa-Garcia, R., Ginoux, P., Kipling, Z., Kirkevåg, A., Kokkola, H., Le Sager, P., Lund, M. T., Matsui, H., van Noije, T., Olivié, D. J. L., Remy, S., Schulz, M., Stier, P., Stjern, C. W., Takemura, T., Tsigaridis, K., Tsyro, S. G., and Watson-Parris, D.: Aerosol absorption in global models from AeroCom phase III, Atmos. Chem. Phys., 21, 15929–15947, https://doi.org/10.5194/acp-21-15929-2021, 2021.
Schutgens, N., Tsyro, S., Gryspeerdt, E., Goto, D., Weigum, N., Schulz, M., and Stier, P.: On the spatio-temporal representativeness of observations, Atmos. Chem. Phys., 17, 9761–9780, https://doi.org/10.5194/acp-17-9761-2017, 2017.
Schwarz, J. P., Samset, B. H., Perring, A. E., Spackman, J. R., Gao, R. S., Stier, P., Schulz, M., Moore, F. L., Ray, E. A., and Fahey, D. W.: Global-scale seasonally resolved black carbon vertical profiles over the Pacific, Geophys. Res. Lett., 40, 5542–5547, https://doi.org/10.1002/2013GL057775, 2013.
Serreze, M. C. and Barry, R. G.: Processes and impacts of Arctic amplification: A research synthesis, Global Planet. Change, 77, 85–96, https://doi.org/10.1016/j.gloplacha.2011.03.004, 2011.
Sharma, S., Ishizawa, M., Chan, D., Lavoué, D., Andrews, E., Eleftheriadis, K., and Maksyutov, S.: 16-year simulation of Arctic black carbon: Transport, source contribution, and sensitivity analysis on deposition, J. Geophys. Res.-Atmos., 118, 943–964, https://doi.org/10.1029/2012JD017774, 2013.
Sharma, S., Barrie, L. A., Magnusson, E., Brattström, G., Leaitch, W. R., Steffen, A., and Landsberger, S.: A factor and trends analysis of multidecadal lower tropospheric observations of Arctic aerosol composition, black carbon, ozone, and mercury at Alert, Canada, J. Geophys. Res.-Atmos., 124, 14144–14161, https://doi.org/10.1029/2019JD030844, 2019.
Shen, Z., Ming, Y., Horowitz, L. W., Ramaswamy, V., and Lin, M.: On the seasonality of Arctic black carbon, J. Climate, 30, 4429–4441, https://doi.org/10.1175/JCLI-D-16-0580.1, 2017.
Shindell, D. T., Chin, M., Dentener, F., Doherty, R. M., Faluvegi, G., Fiore, A. M., Hess, P., Koch, D. M., MacKenzie, I. A., Sanderson, M. G., Schultz, M. G., Schulz, M., Stevenson, D. S., Teich, H., Textor, C., Wild, O., Bergmann, D. J., Bey, I., Bian, H., Cuvelier, C., Duncan, B. N., Folberth, G., Horowitz, L. W., Jonson, J., Kaminski, J. W., Marmer, E., Park, R., Pringle, K. J., Schroeder, S., Szopa, S., Takemura, T., Zeng, G., Keating, T. J., and Zuber, A.: A multi-model assessment of pollution transport to the Arctic, Atmos. Chem. Phys., 8, 5353–5372, https://doi.org/10.5194/acp-8-5353-2008, 2008.
Simmel, M. and Wurzler, S.: Condensation and activation in sectional cloud microphysical models, Atmos. Res., 80, 218–236, https://doi.org/10.1016/j.atmosres.2005.08.002, 2006.
Sinha, P. R., Kondo, Y., Koike, M., Ogren, J. A., Jefferson, A., Barrett, T. E., Sheesley, R. J., Ohata, S., Moteki, N., Coe, H., Liu, D., Irwin, M., Tunved, P., Quinn, P. K., and Zhao, Y.: Evaluation of ground-based black carbon measurements by filter-based photometers at two Arctic sites, J. Geophys. Res.-Atmos., 122, 3544–3572, https://doi.org/10.1002/2016JD025843, 2017.
Smith, C. J., Kramer, R. J., Myhre, G., Forster, P. M., Soden, B. J., Andrews, T., Boucher, O., Faluvegi, G., Fläschner, D., Hodnebrog, Ø., Kasoar, M., Kharin, V., Kirkevåg, A., Lamarque, J.-F., Mülmenstädt, J., Olivié, D., Richardson, T., Samset, B. H., Shindell, D., Stier, P., Takemura, T., Voulgarakis, A., and Watson-Parris, D.: Understanding rapid adjustments to diverse forcing agents, Geophys. Res. Lett., 45, 12023–12031, https://doi.org/10.1029/2018GL079826, 2018.
Sobhani, N., Kulkarni, S., and Carmichael, G. R.: Source sector and region contributions to black carbon and PM2.5 in the Arctic, Atmos. Chem. Phys., 18, 18123–18148, https://doi.org/10.5194/acp-18-18123-2018, 2018.
Stjern, C. W., Samset, B. H., Myhre, G., Forster, P. M., Hodnebrog, Ø., Andrews, T., Boucher, O., Faluvegi, G., Iverson, T., Kasoar, M., Kharin, V., Kirkevåg, A., Lamarque, J.-F., Olivié, D., Richardson, T., Shawki, D., Shindell, D., Smith, C. J., Takemura, T., and Voulgarakis, A.: Rapid adjustments cause weak surface temperature response to increased black carbon concentrations. J. Geophys. Res.-Atmos., 122, 11462–11481, https://doi.org/10.1002/2017JD027326, 2017.
Stohl, A.: Characteristics of atmospheric transport into the Arctic troposphere, J. Geophys. Res., 111, D11306, https://doi.org/10.1029/2005JD006888, 2006.
Tie, X., Brasseur, G., Emmons, L., Horowitz, L., and Kinnison, D.: Effects of aerosols on tropospheric oxidants: A global model study, J. Geophys. Res., 106, 22931–22964, https://doi.org/10.1029/2001JD900206, 2001.
van der Werf, G. R., Randerson, J. T., Giglio, L., van Leeuwen, T. T., Chen, Y., Rogers, B. M., Mu, M., van Marle, M. J. E., Morton, D. C., Collatz, G. J., Yokelson, R. J., and Kasibhatla, P. S.: Global fire emissions estimates during 1997–2016, Earth Syst. Sci. Data, 9, 697–720, https://doi.org/10.5194/essd-9-697-2017, 2017.
Wang, H., Rasch, P. L., Easter, R. C., Singh, B., Zhang, R., Ma, P.-L., Qian, Y., Ghan, S. J., and Beagley, N.: Using an explicit emission tagging method in global modeling of source-receptor relationships for black carbon in the Arctic: Variations, sources, and transport pathways, J. Geophys. Res.-Atmos., 119, 12888–12909, https://doi.org/10.1002/2014JD022297, 2014.
Wang, Q., Jacob, D. J., Fisher, J. A., Mao, J., Leibensperger, E. M., Carouge, C. C., Le Sager, P., Kondo, Y., Jimenez, J. L., Cubison, M. J., and Doherty, S. J.: Sources of carbonaceous aerosols and deposited black carbon in the Arctic in winter-spring: implications for radiative forcing, Atmos. Chem. Phys., 11, 12453–12473, https://doi.org/10.5194/acp-11-12453-2011, 2011.
Winiger, P., Andersson, A., Eckhardt, S., Stohl, A., Semiletov, I. P., Dudarev, O. V., Charkin, A., Shakhova, N., Klimont, Z., Heyes, C., and Gustafsson, Ö.: Siberian Arctic black carbon sources constrained by model and observation, P. Natl. Acad. Sci. USA, 114, E1054–E1061, https://doi.org/10.1073/pnas.1613401114, 2017.
Winiger, P., Barrett, T. E., Sheesley, R. J., Huang, L., Sharma, S., Barrie, L. A., Yttri, K. E., Evangeliou, N., Eckhardt, S., Stohl, A., Klimont, Z., Heyes, C., Semiletov, I. P., Dudarev, O. V., Charkin, A., Shakhova, N., Holmstrand, H., Andersson, A., and Gustafsson, Ö.: Source apportionment of circum-Arctic atmospheric black carbon from isotopes and modeling, Sci. Adv., 5, eaau8052, https://doi.org/10.1126/sciadv.aau8052, 2019.
Wofsy, S. C.: HIAPER Pole-to-Pole Observations (HIPPO): fine-grained, global-scale measurements of climatically important atmospheric gases and aerosols, Phil. Trans. R. Soc. A, 369, 2073–2086, https://doi.org/10.1098/rsta.2010.0313, 2011.
Xu, J.-W., Martin, R. V., Morrow, A., Sharma, S., Huang, L., Leaitch, W. R., Burkart, J., Schulz, H., Zanatta, M., Willis, M. D., Henze, D. K., Lee, C. J., Herber, A. B., and Abbatt, J. P. D.: Source attribution of Arctic black carbon constrained by aircraft and surface measurements, Atmos. Chem. Phys., 17, 11971–11989, https://doi.org/10.5194/acp-17-11971-2017, 2017.
Zender, C. S., Bian, H., and Newman, D.: Mineral Dust Entrainment and Deposition (DEAD) model: Description and 1990s dust climatology, J. Geophys. Res., 108, 4416, https://doi.org/10.1029/2002JD002775, 2003.
Zhao, N., Dong, X., Huang, K., Fu, J. S., Lund, M. T., Sudo, K., Henze, D., Kucsera, T., Lam, Y. F., Chin, M., and Tilmes, S.: Responses of Arctic black carbon and surface temperature to multi-region emission reductions: a Hemispheric Transport of Air Pollution Phase 2 (HTAP2) ensemble modeling study , Atmos. Chem. Phys., 21, 8637–8654, https://doi.org/10.5194/acp-21-8637-2021, 2021.
Zhu, C., Kanaya, Y., Takigawa, M., Ikeda, K., Tanimoto, H., Taketani, F., Miyakawa, T., Kobayashi, H., and Pisso, I.: FLEXPART v10.1 simulation of source contributions to Arctic black carbon, Atmos. Chem. Phys., 20, 1641–1656, https://doi.org/10.5194/acp-20-1641-2020, 2020.